le_temps: visualising phenology from public image databases
TRANSCRIPT
1
le_temps: Visualising Phenology from Public Image Databases
Tega Brain
Organisation: University of Technology, Sydney.
Brad Miller
Organisation: College of Fine Arts, University of New South Wales.
Topic(s): Resilient networks and emerging 'techno-ecological' art practices.
Keywords: phenology, database, data visualisation, media arts, big data, complex systems,
biology, images, information, networks
abstract
The last decade has seen an unprecedented increase in both the rate of digital image
production and human induced climate destabilisation. In response to both these
phenomena, this paper presents le_temps, a multi-channel installation artwork that aggregates
and visualizes collections of digital images depicting botanic phenological events in a
somatically engaging and interactive way. Phenology is the study of the timing of recurring
patterns and changes within the life-cycles of organisms. In the biological sciences, there is a
growing interest in observing changing phenological patterns as a way to study the impacts of
climate change. Using custom software, le_temps aggregates and visualises phenological
patterns by analysing the meta-data associated with publically available online images
thereby exploring these patterns within contemporary geo-informatic space. The work is a
visual study of temporal changes in a complex biological system living through the
Anthropocene and in our digital secretions.
introduction
This paper introduces the le_temps project, a creative collaboration between Australian artists
Tega Brain, Brad Miller and Adam Hinshaw. le_temps consists of custom software that
aggregates large collections of digital images from the Flickr® image repository which in itself
contains images from a multitude of different sources. The le_temps software searches Flickr®
for images tagged with the names of particular botanic species and arranges and visualises
these images according to their timestamp (the specific time and date that the image was
taken). As such, the project visually renders phenological patterns like flowering and budding
cycles of each species as derived from when the images returned by the Flickr® database
search were produced and their frequency over each month of the year. The project explores
digital imagery posted during the 10-year period from 2003-2012 and the aggregated imagery
is then presented within an interactive multi-channel video installation. Stills of the work are
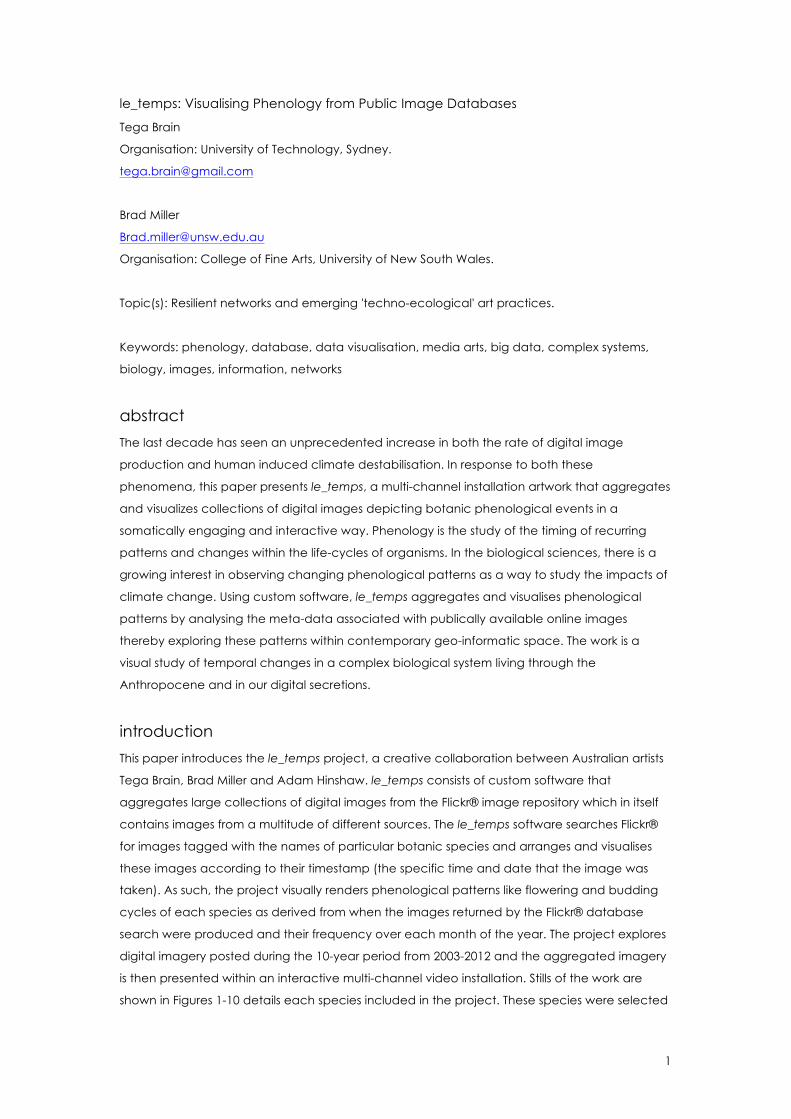
shown in Figures 1-10 details each species included in the project. These species were selected
2
from a list of indicator species identified by ClimateWatch researchers for their phenology
program (ClimateWatch, 2013). It also shows the quantity of results returned by the software for
each search that was carried out for launch of this project in March, 2013 at the
DAB Research Lab at the University of Technology (DAB LAB, 2013).
Table 1: Species name and number of returned images from search for images tagged with species name and Sydney.
Figures 1 - Screenshots of African Tulip Tree sequence in le_temps (2013). Image credit: Tega Brain.
Figures 2 - Screenshots of Bearded Heath sequence in le_temps (2013) Image credit: Tega Brain.
Figures 3 - Screenshots of Cow Slip Orchid sequence in le_temps (2013) Image credit: Tega Brain.
Figures 4 - Screenshots of FireWheel Tree sequence in le_temps (2013) Image credit: Tega Brain.
3
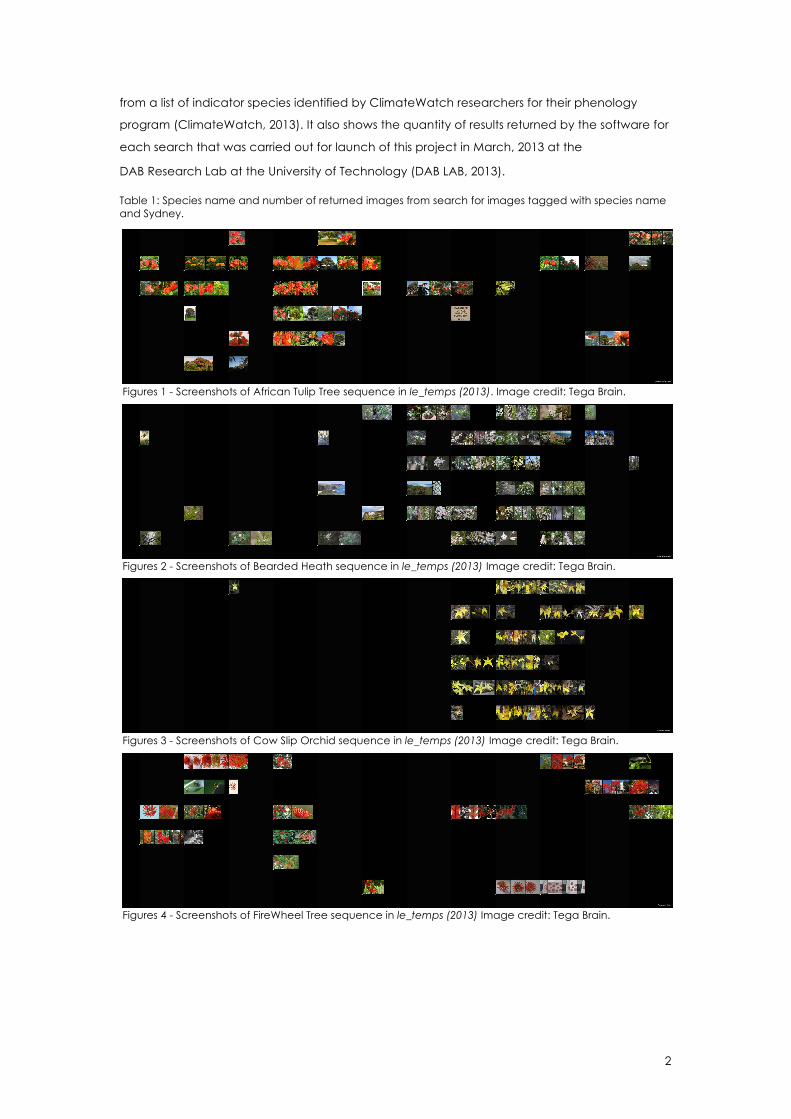
Figures 5 - Screenshots of Illawarra Flame Tree sequence in le_temps (2013) Image credit: Tega Brain.
Figures 6 - Screenshots of Gymea Lilly in le_temps (2013) Image credit: Tega Brain.
Figures 7 - Screenshots of Jacaranda sequence in le_temps (2013) Image credit: Tega Brain.
Figures 8 - Screenshots of Parrot Pea sequence in le_temps (2013) Image credit: Tega Brain.
Figures 9 - Screenshots of Silver Banksia sequence in le_temps (2013) Image credit: Tega Brain.
4
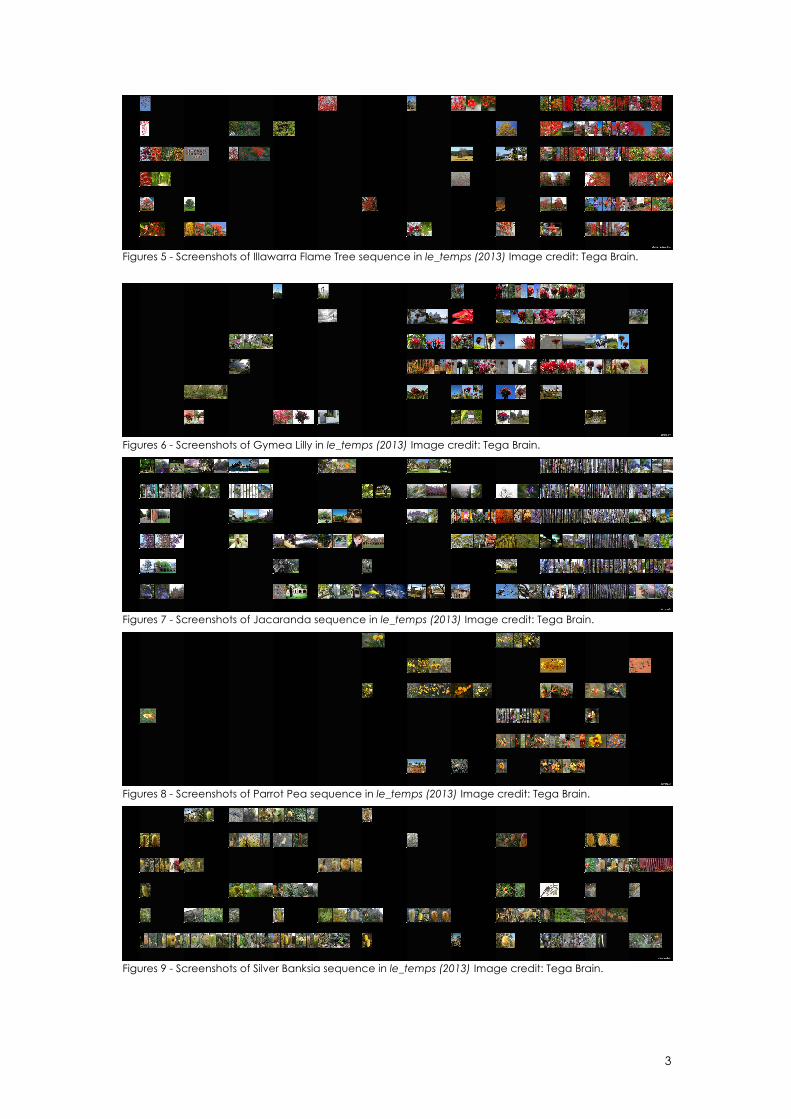
Figures 10 - Screenshots of Sturts Desert Pea sequence in le_temps (2013) Image credit: Tega Brain.
phenology
Phenology is an area of biology concerned with observing change. It is the study of the timing
of recurring life-cycle events, the biotic and abiotic drivers of these changes and the
interrelationships of the phases between species cycles. Within the scientific community, there
is a growing interest in the collection of phenology records to better understand how different
ecosystems are responding to conditions of human induced climate change (Tooke and Battey,
2010). How are shifting climatic conditions changing flowering and migratory patterns? How
quickly are these changes occurring? How do the changes in the life-cycle patterns of one
species impact that of another? These are all questions central to area that inextricably links
the temporal domain with the meteorological. The title of our project, le_temps, meaning both
‘the time’ and ‘the weather’ in the French language, references this link and serves as a
linguistic acknowledgment that our collective understanding of time is inextricably linked to
greater planetary conditions.
This paper describes the research process and creative intent underlying the production of the
le_temps project. It is a project that fits within the interdisciplinary field of data visualization, a
field encompassing art-design-computation-science and arguably philosophy (Bratton, 2012).
Its orientation across these multiple fields means that le_temps, is relatively untethered to the
criteria of one specific discipline and as a result operates with an open and exploratory
agenda. In acknowledgment of this apparent vagueness, this paper aims to contextualise the
project both in terms of its relationship to some relevant contemporary visualisation work
particularly that in the area of ‘Cultural Analytics’ (Manovich, 2008) and in terms of recent
trends in biology research that are being driven by imaging technologies including
developments in cybertaxonomy and a push to crowd source phenologic observations. Finally
we consider le_temps as a “geo-philosophical” project, a term used by theorist Benjamin
Bratton to point to the complex political and epistemological dimensions of this increasingly
widespread field of visual work (Bratton, 2012).
project background
During the research and development of this project, we investigated various image
collections from a range of different sources including those of the herbaria at the Sydney
Royal Botanic Gardens (Royal Botanic Gardens Sydney, 2013), the ClimateWatch crowd-
sourced image database (ClimateWatch, 2013), collections of the Atlas of Living Australia that
5
aggregates multiple databases (Atlas of Living Australia, 2013) as well as publicly available
image repositories like Flickr® (Flickr, 2013). The iteration of the work described here uses images
sourced from the Flickr® repository. These images are presented using the Interactive Media
Platform (IMP) (Bateman and Miller 2011) which is a software system developed as a
collaboration between Brad Miller, Ian Andrews and software developer Adam Hinshaw during
previous projects such as augment_me (2009) and later with Creative Producer Ian McArthur
on projects such as mediate_moments (2012)& #capillary (2013). The IMP includes software
tools to compose search query results (FlickrTool) and to present le_temps as a series of
interactive room sized projections. The IMP hardware consists of a video tracking system, audio
spatialiser and projection system.
The proliferation of cameras and mobile computation during the last decade, has facilitated
our collective enthusiasm for photographic documentation as well as providing the
technological means of capturing, storing and sharing these records of events and moments
of change. This enthusiasm is reflected in the growth of image sharing platforms like Flickr®,
Instagram®, Snapchat® and many others. Here we focus on Flickr® which, as one of the most
popular online platforms, has had roughly 40 million images uploaded to it every month since
2008 (Jefferies, 2013). In early 2013 Flickr® increased the free storage space available on each
account to 1 terabyte of data which is likely to continue to increase the platform’s use. The
le_temps project responds to these trends of increasing data storage and sharing in online
environments, asking what might be explored in these enormous and growing image
databases, collected with a multitude of agendas and showing innumerable views of the
world? By developing software to aggregate, analyse and present small slices of these
collections, this project is emblematic of the wider field of visualization that has evolved partly
in response to contemporary conditions of data abundance. As theorist Benjamin Bratton
observes, the job of data visualization “is to simplify, summarize and attempt to give some
narrative to stores of data that come at us too fast and too complex for unmediated
interpretation to handle” (Bratton, 2012).
le_temps and cultural analytics
le_temps is simultaneously a data visualisation and an interactive artwork. It relates to an area
of work that Lev Manovich refers to as ‘Cultural Analytics’, defined as the “large-scale
computational analysis and interactive visualization of cultural patterns” (Manovich, 2008).
While le_temps applies the same computational and visualization methods used in Cultural
Analytics work such as the production of spatial-temporal compositions based on image
timestamps or other image meta-data, it strays from the central focus of this field. Cultural
analytics aims to extend traditional enquiries of the humanities and investigate cultural
dynamics through analysis of networked digital content and data (Yamaoka, Manovich,
Douglass & Kuester, 2012) with the intent to uncover or discern patterns previously invisible or
unquantifiable. However the le_temps project is conceived with a deliberately wider
interdisciplinary focus and responds to practices of science. le_temps applies what are
pseudo-scientific methods, that of phenological observation and analysis, to a messy, user-
6
generated and disciplinarily-hybridized database. These methods are ‘pseudo-scientific’ as
although Flickr® does contain many images published from scientific sources, it is neither a
scientific database nor a specifically curated image repository as are many of the databases
used by Manovich and his Software studies group (Software Studies Initiative, 2013). For
example, the Software Studies group has carried out projects that analyze specific collections
such as all of the Time Magazine covers, all of the paintings by 20th century artists Piet
Mondrian and Mark Rothko or all 883 manga - Japanese-style comic book titles (Yamaoka,
2012). In contrast to this, the le_temps project points to both the possibilities and the
complexities of scientific observation and analysis within public digital space and draws
attention to the now well-discussed socio-cultural dimensions of practices of science (Kuhn,
1962, Latour, 1982, MacKenzie & Wajcman, 1985). By searching for data describing the
biological dynamics of particular botanic species in an unknown repository of documentation,
the project inevitably reveals characteristics of this repository, the mediums of representation it
structures and reveals aspects of the human relationship to each particular botanic species
included in the project.
The most discernable aspect of the human relationship to each of these botanic species
revealed here is what might be reflected by the number of images returned by each search as
detailed in Table 1. That the Jacaranda search returns most results, followed closely by the
Illawarra Flame Tree, indicates that they are either the most commonly occurring, frequently
photographed or most readily identified species in the Sydney area. Perhaps their common
occurrence on Flickr® is due to both of the ubiquity and their obvious, dramatic blooms. This is
in contrast to the Cow-Slip Orchid that returns only a small amount of results, indicating that this
species is either less commonly occurring in urban Sydney or less easily photographed and
identified.
le_temps engages user-defined methods for organising data via tagging. It is the image’s tags
that dictate the image’s selection in the work. This emerging user defined structuring of
knowledge is inconsistent as it based on individual preference and interpretation and therefore
provides a snapshot of cultural pointers. While these inconsistencies may play havoc with
scientific resolution, what Beaudoin calls “a problem of meaning”, they again stand to remind
us of the socio-cultural dimensions of knowledge production and are rich for exploitation in
creative work (Beaudoin, 2007).
The image collection aggregated by le_temps is primarily determined by how an uploader
decides to tag their images, a process which is based on what they deem as significant within
each image. The variety within the results returned by our software reflects a multitude of
decisions by the uploader regarding what they classify as background and foreground, as
subject and environment and as most significant and least significant within every image.
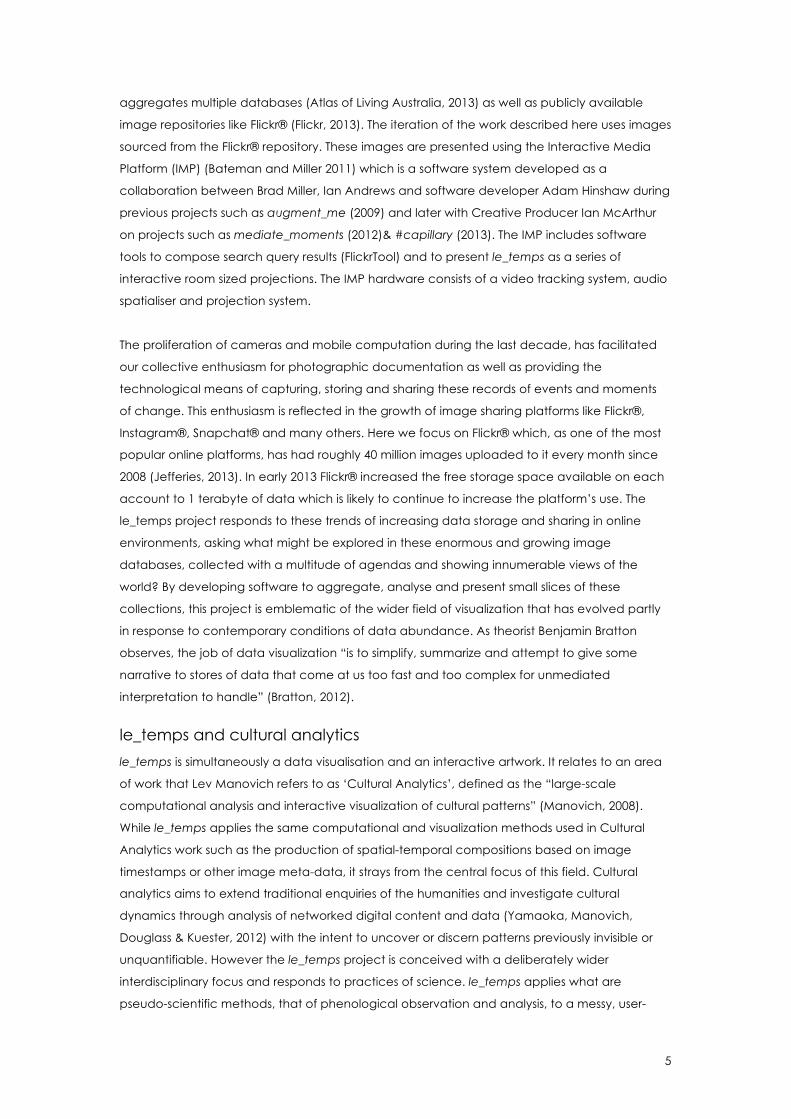
Despite limiting searches with species names, location and a date range, le_temps returns
photographs of cars, weddings, babies and graduations (Figure 13) in addition to much
botanic documentation. This might be because the background of the image contains an
7
obscured Jacaranda tree that the uploader has decided to tag or it might be because the
image has some other connection to the word Jacaranda like it being someone’s name or
used as a color descriptor.
Figure 11: Images returned in a search for Jacaranda. Image credit Alistair Wilkie Shabba Al: signage and
Vanessa Kauffmann ship wreck
le_temps as data visualisation
In this way, the work emphasises the imperfect nature of big datasets and demonstrates the
multitude of assumptions that are embedded within them. Many authors (Tufte, 1990, Bratton &
Jeremijenko, 2008, Drunker, 2011, Wright, 2007, Brain, 2013) have critiqued contemporary data
visualisation practices for their lack of criticality and engagement with the underlying process
of data collection, as well a lack of interrogation of the ideologies and assumptions bound up
in all processes of their production. Bratton frankly asks, “Does data intensive art-design
demand a different kind of peer-review? Does it resist it, does it instead stage that
transparency as a kind of seductive truth-affect?” Although he goes on to point out that the
criteria for assessing this field of work, that is part design, science, art and computation, remains
less defined than more traditional modes of academic enquiry, all of these authors draw
attention to the staged transparency of much visualisation work. These images simultaneously
reveal and conceal aspects of the complex system represented and give an apparent clarity
that can be misread for objectivity. As visualizations of the world increasingly shape our
collective understanding of it and as these images increase their world-making capacity, it
becomes increasingly important to engage with the conditions of their production (Bratton,
2012).
a response to developments in biological research
The application of networked digital imaging technologies to biological observation and
taxonomy is shifting traditional methods of species identification and observation. Specifically,
the use of citizen scientist networks to collect phenology records and the recent developments
in the area of cybertaxonomy (the use of computer vision for species identification), have
been areas of inspiration for the development of the le_temps project.
8
Since the turn of the century citizen science initiatives have proliferated across many fields of
science such as physics, biology and astronomy. Perhaps due to cuts to research funding, as
well as new opportunities availed by networked computation, many citizen science programs
have been established encouraging interested members of the public to contribute their time
and resources to large scale scientific endeavors. One of the earliest of these was the SETI
initiative run from UC Berkley and is software that enables users to dedicate their unused
personal computing power to search radio signal data for signs of extraterrestrial
communication. (seti@home, 2014)
Yet practices of documenting change in the natural world obviously have a much longer
history than those driven by networked computing. Phenology records have been maintained
by groups such as bird watchers and farmers for many centuries. The oldest written biological
record is the observation of the Cherry Blossom bloom in Kyoto, Japan, which contains data
stretching back to 705AD.(Arakawa, 1956) This bloom event is also celebrated with the Cherry
Blossom festival, an important event in Japanese society. Many other historic festivals respond
to phenological events such as the Tomatina festival in Valenica, Spain and the innumerable
Italian sagras traditionally held after the harvest of a particular locally grown fruit or vegetable.
The bloom of the Cherry Blossom is triggered by the onset of a run of warm days in early spring,
making flowering records such as this a valuable indicator of historic climate patterns.
(D’Odorico, 2013)
Presently, numerous citizen science projects exist globally that encourage interested people to
document phonological events in their local areas in the form of digital photography or geo-
located descriptions. This data is then uploaded to a central project database for analysis.
Projects such as ClimateWatch in Australia (ClimateWatch, 2013), Nature’s Calendar in the
United Kingdom (Nature’s Calander, 2013, PlantWatch in Canada, PlantWatch, 2013) and
Nature’s Notebook, USA National Phenology Network (National Phenology Network, 2013) are
all actively encouraging communities to document and upload observations in order to build
up records, improve understandings of local ecologies and the impacts of climate change.
At the time of developing the le_temps project, ClimateWatch Australia was in the process of
developing their smart-phone application to enable people to record phonological events on
their mobile devices. This application, which was launched in late 2012, can be downloaded
via links on their website (ClimateWatch, 2013). Although this iteration of le_temps does not
engage with the data collected from this program as the ClimateWatch database was very
small at the time of our project’s launch, this is indeed possible in the future. Furthermore, since
the launch of the le_temps project in February of 2013 at the DAB Research Gallery, University
of Technology, Sydney, citizen science initiatives such those of the USA Phenology Network
have also significantly advanced their software tools for analyzing and visualizing their growing
phenology records. In July 2013, the USA Phenology Network launched an online phenology
visualization tool allowing visitors to their website to generate diagrams of phenology patterns
for selected species based on records from their citizen science program.
9
Taxonomy is concerned with the categorization of species and by extension, with the
identification of new species. American taxonomist Quentin D. Wheeler observes, "after about
250 years of discovering and describing species, we will soon reach 2 million named species.
Our best estimate is that there are at least 8 to 10 million additional species awaiting discovery,
and that’s not counting the microbial world." (Wheeler, 2012) So despite our inhabitation of
what we often call ‘the information age’, ironically the vast majority of organisms composing
the earth’s biosphere remain unclassified. This, coupled with the knowledge that our civilization
is currently driving the greatest global extinction event since the age of the dinosaurs, has led
many researchers to suspect that for the first time in human history, current extinction rates
exceed rates of species discovery. (Wilson, 1992, Raven, 1997) This complex socio-technical
matter of affairs positions taxonomy, species identification and species observation as activities
of critical and far-reaching significance.
In response to Wheeler’s estimate of yet unclassified life forms, taxonomists are turning to digital
technologies and what is referred to as cyber-taxonomy. They hope to disrupt current
practices of taxonomic identification that involves logistical challenges like travel to remote
locations and bottlenecks where multiple researchers are required to corroborate results. In
light of this, digital technologies are being developed to digitise species collections and
herbariums around the world with the hope that this will enable species to be identified from
the digital record (Wheeler, et al., 2012). Currently specimens can be documented with 3-
dimensional photography (Piper, 2007) and using strategies like those used in facial recognition
software, scientists are attempting to develop species recognition software to identify traits
and eventually species (Gaston, O'Neill, 2004). It is hoped that this will reduce the human hours
required by the classification process and hasten the rate of identification. Given these
developments in the field of cyber taxonomy, publically collected image databases have
great potential to contribute additional perspectives to the databases collected for specific
scientific research such as within Botanic Gardens herbaria.
data visualization as a geo-philosophical practice
As the work runs, annual patterns and temporal cycles are revealed or notably absent for
different plant and as such le_temps explores cause and effect in a complex system that
encompasses both geographic and informatic dimensions. The work prompts questions around
how local ecosystems are adapting to changing climatic conditions, driven by our
technological activities. And conversely, how the trajectory of technological development is
changing our capacity to observe these changing conditions and to what effect? Rather than
attempting to answer these questions, patterns that emerge in the project’s visualisations
cannot be reduced to one underlying phenomena but rather reflect a complex ecology of
relationships connecting changing climactic conditions, biological response, the cultural value
associated with phenological events, the decisions made by photographers, the classification
of information, the design of algorithms within the le_temps software and so on.
10
In the design and presentation of this work we have deliberately made little attempt to simplify
the data or reduce the complexity of the resultant compositions into some coherent narrative.
This might have been done through use of interpretive graphics or some other types of
semantic markers. Yet the only labels included are the species names and the years
associated with each strip of images that fade up on the screen when motion is detected. As
such, any conclusions to be drawn from information embedded in the work are deliberately
left for the viewer to interpret and we hope that this at least partially enables the work to avoid
the “staged transparency” of which much data visualization has been accused (Bratton,
2012). Rather, in sharing the onus of interpretation with the viewer, we hope that the project
resonates with the processes under investigation here - practices of phenological observation
which in themselves, require the interpretation of biological informatic interfaces – buds,
flowers and leaves. A resonance exists between how to critically interpret phenological
variation – slow changes in biological dynamics, and how to interpret the dynamic systems
presented to us via increasingly ubiquitous digital informational interfaces – characteristically
showing population dynamics, transportation routes, use of resources or personal electricity
use. The resultant tension between these two acts of interpretation lies at the heart of this
project.
The act of reading the state of the ecosystems with which we are connected must be as old as
the human species itself. Yet as our ecology becomes extended to include interpretive
technologies reflexively reporting back on the state of the eco-systems of which they are now
a part, questions of how we read, interpret and subsequently determine our actions are
critical. In turn, how we chose to answer these questions in our daily lives, flows back to alter
the larger system. Although a recent flash in the pan of history, practices of information
visualization are potent for this world-making potential and which paradoxically means they will
continue to remain an imperfect and inevitably incomplete index upon which to chart our
course.
11
References
Atlas of Living Australia. (2013, October). Atlas of Living Australia website. Retrieved from http://www.ala.org.au/
Bateman P.J. and Miller B. (2011). augment_me: An algorithmic memory, absence and presence in the cloud. Conference proceeding ISEA (2011). Retrieved from https://isea2011.sabanciuniv.edu/paper/augmentme-algorithmic-memory-absence-and-presence-cloud Bratton, B. (2012). What We Do is Secrete: Paul Virilio, Planetarity, and Data Visualization. Retrieved from http://bratton.info/projects/texts/what-we-do-is-secrete/ ClimateWatch Australia. (2013, October). ClimateWatch App for iPhone/Android, ClimateWatch Australia website. Retrieved from http://www.climatewatch.org.au/mobile DAB LAB University of Technology, Sydney. (2013, October). UTS DAB LAB website. Retrieved from http://www.uts.edu.au/about/faculty-design-architecture-and-building/dab-lab/gallery
Flickr. (2013, October). Flickr website. Retrieved http://www.flickr.com/
Jefferies A. (2013) The man behind Flickr on making the service 'awesome again’. The Verge. 2013-03-20. (Retrieved 12/09/2013) Kuhn, T. (1962). The Structure of Scientific Revolutions, Chicago: University of Chicago Press. Latour, B. (1987). Science In Action: How to Follow Scientists and Engineers Through Society. Cambridge Mass.: Harvard University Press. MacKenzie, D.A. & Wajcman, J. (1985). The Social Shaping of Technology, Buckingham: Open University. Manovich, L. (2008). Cultural Analytics: Analysis and Visualization of Large Cultural Data Sets. Accessed at www.manovich.net/cultural_analytics.pdf (accessed 10 January 2011). Nature’s Calendar. (2013, September). Nature’s Calendar Website. Retrieved from http://www.naturescalendar.org.uk/ PlantWatch. (2013, September). PlantWatch Website. Retrieved from https://www.naturewatch.ca/english/plantwatch/ Raven, P.H., Ed., (1997) Nature and Human Society: The Quest for a Sustainable World. National Academy Press, Washington, DC. Royal Botanic Gardens Sydney. (2013, October). Herbaria Collection, Royal Botanic Gardens and Domains Trust Website. Retrieved from http://www.rbgsyd.nsw.gov.au/science/Herbarium_and_resources/nsw_herbarium/herbarium_collection Software Studies Initiative. (2013, October). Software Studies Initiative website. Retrieved from http://lab.softwarestudies.com/2007/05/about-software-studies-ucsd.html Tooke, F. and Battey N.H. (2010). Temperate flowering phenology. Journal of Experimental Botany (61.11), 2853–2862. Tufte, E. R. (1990), Envisioning Information. Cheshire, Connecticut: Graphics Press. USA National Phenology Network (2013, October). Nature’s Notebook, USA NPN National Phenology Network website. Retrieved from https://www.usanpn.org/

12
Wheeler, Quentin D. (2012), How the Web Can Help Identify Countless Undiscovered Species, Interview with Toomey, D. Yale Environment 360, Yale School of Forestry & Environmental Studies (Retrieved 3/10/2013) Wilson, E.O. (1992) The Diversity of Life. Norton, New York. Yamaoka, S. Manovich, L. Douglass, J. Kuester, F. (2012) Cultural Analytics in Large-Scale Visualization Environments