visualising antigen-specific t cells during
TRANSCRIPT
Visualising Antigen-Specific T Cells During
Primary & Persistent Infection with Epstein-Barr Virus
LINDA CHENG-CHOO TAN
WOLFSON COLLEGE, OXFORD
&
THE MRC HUMAN IMMUNOLOGY UNIT
INSTITUTE OF MOLECULAR MEDICINE
JOHN RADCLIFFE HOSPITAL
OXFORD
TRINITY TERM, 1999
A thesis submitted to the University of Oxford in partial fulfilment of the
requirements for the degree of Doctor of Philosophy.

To my parents, and to Andrew and Caroline;
thank you for everything.
TABLE OF CONTENTS
Abstract......................................................................................................... v
Acknowledgements. ..................................................................................... vi
Publications based on results in this thesis................................................ vii
Abbreviations. ..............................................................................................viii
Chapter 1 - General Introduction 1
1.1. Cell-Mediated Immunity................................................................. 2Peptide presentation by class I MHC molecules 2The class I antigen processing pathway 4The human T cell antigen receptor 7TCR recognition of peptide-MHC complexes 9
1.2. The Epstein-Barr Virus..................................................................14General aspects 14 Gene expression 14 CTL responses in EB V infection 15 Immune evasion 16
1.3. Rheumatoid Arthritis............. ................................................... 16
1.4. Aims of this Thesis.......................................................................... 18
Chapter 2 - Materials and Methods
2.1. General Cell Culture 19Tissue culture media Freezing of cell stocks
2.2. Donor Blood Samples 20Preparation of human PBMC from whole blood Preparation of human lymphocytes from synovial fluid Isolation of CD4+ or CD8+ T lymphocytes from PBMC Generation of human B lymphoblastoid cell lines Tissue typing of blood donors EBV serological testing
2.3. Bacterial Culture 22Recipes for bacterial brothAntibiotic selectionMaking bacterial glycerol stocks
2.4. Single Stranded Sequencing of T Cell Receptor (3-Chains ......... 24Extraction of mRNA from lymphocytesSynthesis of cDNAPoly G tailingPCR and purification of productsCloning of PCR products into Phagescript SK Ml 3 vectorPreparation of fresh competent E. coli for transformationsPreparation of single stranded templates for sequencingSequencing reactions
2.5. Double Stranded Sequencing of BV14 T Cell Receptors 30PCR reactionsLigations and transformations using the pGEM-T Easy kitPlasmid DNA miniprepsSequencing
2.6. Synthetic Peptides.......................................................................... 31
2.7. Limiting Dilution Analysis..... ..................... 32Preparation of mononuclear feeder cells Setting up assay cultures (Day 0) 51 Cr-release cytotoxicity assay (Day 14)
2.8. IFNy Enzyme Linked Immunospot (ELISpot) Assays.. 34
2.9. Synthesis of Class I MHC-Peptide Tetrameric Complexes....... 35Recombinant protein expression and inclusion body purification Refolding soluble class I MHC-peptide complexes Site-specific biotinylation of MHC-peptide complexes Preparation of fluorescent-labelled tetrameric complexes
2.10. Flow Cytometry 39Cell staining with directly-conjugated mAbs or tetrameric
complexesMulticolour cell staining with unconjugated mAbs Intracellular staining with the Ki67 marker FACS data acquisition & analysis
2.11. Antibodies and Sources.......... ....................................... 40Antibodies specific for human leukocyte cell surface
differentiation markersAnti-human TCR variable f> chain (BV) specific mAbs Other monoclonal antibodies
Chapter 3 - Molecular Analysis of Nucleotide Bias during VDJ recombination in T Lymphocyte p-Chains
Introduction..........................................................................................42
3.1. Sequencing the CDR3 regions of TCR (3 chains 45
3.2. Analysis of J gene segment usage 46
11
3.3. Analysis of nucleotide nibbling from TCRBV 3' termini incoding joints................................................................ 48
3.4. Evidence for P nucleotide addition 50
Discussion........................................................................ 50
Chapter 4 - CTL Responses in Primary EBV Infection
Introduction.......................................................................................... 53
4.1. Construction of tetrameric complexes and staining of controlsamples........................................................................................ 54
4.2. Frequency of circulating EBV-specific T cells during primaryEBV infection...................................................................56
4.3. Frequency of EBV-specific T cells in postconvalescent IMpatients.......................................................................................59
4.4. Phenotype of EBV-specific T cells during the primary T cellresponse................................................................................ 60
4.5. Phenotype of EBV-specific T cells in postconvalescentIM patients................................................................... 62
4.6. Sequence of TCRs involved in the B8/RAKFKQLL response....64
Discussion.............................................................................................. 65
Chapter 5 - Long Term Memory Response to EBV Infection in Healthy Seropositives
Introduction........................................................................................... 69
5.1. Measurement of T cell frequencies by LDA.................... ......... 71
5.2. Quantitation of T cell responses by ELISpot assay................ 72
5.3. Enumeration of antigen-specific T cells using MHC-peptidetetrameric complexes....................................................................74
5.4. Phenotypic analysis of EBV-specific CTL within peripheralblood from long term virus carriers........ ......................... 76
5.5. Comparison of results obtained using the three methods........ 79
Discussion.............................................................................................. 79
Chapter 6 - Enriched Populations of EBV-Specific CTL in
Rheumatoid Joints
Introduction.................... .................................................... 85
6.1. Enumeration of virus-specific T cells within synovial fluid and peripheral blood using HLA-peptide tetrameric complexes 86
in
6.2. Quantitation of EBV-specific T cells within synovial fluid and peripheral blood using an ELISpot assay for IFNy secretion 91
6.3. The phenotype of EBV-specific T lymphocytes withinperipheral blood and synovial fluid ................................. 92
6.4. Expression of chemokine receptors and integrins by CD8+T cells within peripheral blood and synovial fluid 96
6.5. Proliferation of lymphocytes within synovial fluid.. 98
Discussion....................................................................... 100
Chapter 7 - Concluding Discussion
Introduction....................................................................................... 104
7.1. The high frequencies of antigen-specific T cells inprimary EBV infection................................................. 105
7.2. Downregulation of the immune response followingprimary infection........................................................ 112
7.3. Memory responses to persistent EBV infection. ................. 114
7.4. Final considerations....................... ........ 116
Bibliography.................................. .............................................. ... 119
Appendix A. Amino acids and genetic codes....................................... 140
Appendix B. EBV-encoded CTL epitopes 141
Appendix C. Sequences of T cell receptor CDR3 regions......... ....... 142
IV

ABSTRACT
Visualising Antigen-Specific T Cells During Primary & PersistentInfection with Epstein-Barr Virus
Linda Cheng-Choo Tan D. Phil. Thesis
Wolfson College & MRC Human Immunology Unit, Oxford Trinity Term, 1999
Cytotoxic T lymphocytes play an important role in mediating host immune reactions
to viruses and other pathogens. Selective mechanisms operate during V(D)J
recombination to enhance the diversity of the T cell repertoire that is generated,
particularly in the CDR3 regions of the TCR, which mediate peptide recognition. The
influence of V gene 3' sequences on the composition of the CDR3 loop in TCR p chains
is analysed; in particular, A/T-rich coding termini are shown to be more susceptible to
exonuclease "nibbling" during recombination.
The recent development of peptide-MHC tetrameric complexes has enabled us to detect T
lymphocytes according to their antigen specificity. Their use in detection and
characterisation of EBV-specific CD8+ T cells during the primary acute phase of
infection is described here. In particular, CTL responses to EBV lytic cycle antigens have
only recently been reported and this study reveals unexpectedly high frequencies of
activated, circulating CD8+ T lymphocytes which are directed towards lytic cycle
epitopes, compared to well-characterised latent cycle antigens.
In a second cohort of healthy long term asymptomatic donors, the frequency of CD8 + T
cells recognising EBV lytic and latent cycle antigens was analysed by tetramer staining,
ELISpot assays and limiting dilution assays; the tetramers detected antigen-specific CD8+
T lymphocytes with greater efficiency than other methods. Lytic cycle antigen-specific T
lymphocytes were clearly detectable in all the asymptomatic donors, at higher
frequencies than those specific for latent antigens.
The final section of this thesis investigates the existence of enriched populations of EBV-
specific T lymphocytes found within synovial joint fluid of rheumatoid arthritis patients.
Although these cells do not appear to be directly involved in the initiation of disease,
their ability to secrete proinflammatory cytokines within joints probably contributes to
the maintenance of chronic inflammation in these patients.

ACKNOWLEDGEMENTS
Above all I owe many thanks to Prof. Andrew McMichael, who accepted me as his DPhil
student, and provided the funding that enabled me to work in his lab and attend
conferences. I am also grateful to Margaret Callan for her supervision and guidance
throughout the last few years, and for her invaluable help in completing my thesis. A
special mention goes to John Haurum, with whom I worked initially; he inspired me with
his Viking approach to laboratory research.
I have also been fortunate to collaborate with Prof. Alan Rickinson, Nicola Annels and
Nancy Gudgeon in Birmingham on the EBV work. They very generously provided me
with cell samples and CTL clones, and apart from that, they are really nice people to
know! Many others have contributed to the success of my project; in particular, I
acknowledge Ju for sorting me out on the FACS machine, Chris, Ben and Jess, who
freely handed out reagents for tetramer synthesis and taught me everything I know about
protein expression, and also Tim Rostron, who tissue-typed all my patient samples.
Labwork would not have been quite so memorable if not for the people. I really have to
thank the combined members of the McMichael, Bell and Townsend labs for being so
wonderful, rude, supportive, annoying and sociable at various time points. I especially
want to mention XX for dragging us out for drinks, Lisa for making lots of cake, Rachel
for silly Scottish songs and Ju & Tao for feeding me wonderful meals. Friends from
Wolfson College also deserve a mention here; Aphrodite, Laure-Helene, Aho and Mark
Pottle for keeping in touch always, and eight nameless men who risked their lives in a
boat with me at Christ Church Regatta 1997.
And where would I be without Christian and Amir and the House of St Gregory's, my
first inspirations for immunology and very large dinner parties? Not forgetting Audrey,
Michael Aidoo and the Laings; I am grateful to each for too many things. Lastly, my
most fervent thanks go to Nik, for spurring me on to the finish, and for patiently
arranging and rearranging holiday dates to suit the necessities of my thesis submission.
VI

PUBLICATIONS BASED ON RESULTS IN THIS THESIS
1 Direct visualization of antigen-specific CD8+ T cells during the primary immune
response to Epstein-Barr virus in vivo. MFC Callan, L Tan, N Annels, GS Ogg,
JDK Wilson, CA O'Callaghan, N Steven, AJ McMichael and AB Rickinson. Journal
of Experimental Medicine 1998, 187: 1395-1402.
2 A re-evaluation of the frequency of CDS T cells specific for EBV in healthy virus
carriers. LC Tan, N Gudgeon, NE Annels, P Hansasuta, CA O'Callaghan, S
Rowland-Jones, AJ McMichael, AB Rickinson and MFC Callan. The Journal of
Immunology 1999, 162: 1827-1835.
3 Visualising T cells specific for herpesvirus in patients with arthritis: a possible
role for virus-specific T cells in the pathogenesis of chronic inflammatory joint
disease. LC Tan, AG Mowat, C. Fazou, T Rostron, PR Dunbar, C. Tournay, F.
Romagne, M-A Peyrat, E Houssaint, M Bonneville, AB Rickinson, AJ McMichael and
MFC Callan. (manuscript submitted)
VI1
ABBREVIATIONS
AIDS, acquired immune deficiencysyndrome
amp, ampicillin APC, antigen-presenting cell ATP, adenosine triphosphate bp, base pairsBSA, bovine serum albumin B-LCL, human B lymphoblastoid cell line cDNA, complementary DNA CDR, complementarity-determining regions CMV, cytomegalovirus CTL, cytotoxic T lymphocyte D region, diversity region of T cell receptor
for antigenDEPC, diethyl pyrocarbonate DMSO, dimethylsulphoxide DNA, deoxyribonucleic acid dNTPs, mixture of deoxynucleoside triphos-
phates: dATP, dGTP, dCTP, and dTTP ddN, dideoxynucleoside triphosphates; ie.
ddATP, ddGTP, ddCTP & ddTTP DTT, dithiothreitol EBNA, Epstein-Barr nuclear antigen EBV, Epstein-Barr virus EDTA, ethylenediaminetetraacetic acid ELISPOT, enzyme-linked immunospot assay Fab, antigen-binding fragment FACS, fluorescence-activated cell sorter PCS, foetal calf serum FITC, fluorescein isothiocyanate Fmoc, 9-fluorenylmethoxycarbonyl FPLC, fast protein liquid chromatography GP, glycoproteinHIV, human immunodeficiency virus HLA, human histocompatibility leukocyte
antigens HPLC, high performance liquid
chromatography HSV, herpes simplex virus ICAM, intercellular adhesion molecule IFN, interferon (eg. IFNy) Ig, immunoglobulin IL, interleukin (eg. IL-2) IM, infectious mononucleosis IPTG, isopropyl-p-D-galactoside ITAM, immunoreceptor tyrosine-based
activation motif
J region, joining region of T cell receptor forantigen
LB, type of bacterial nutrient broth (alsoSOB & 2x77)
LCMV, lymphocytic choriomemngitis virus LDA, limiting dilution analysis LFA-1, leukocyte function-associated
antigen-1LMP, latent membrane protein LPS, lipopolysaccharide mAb, monoclonal antibody MES, 2-[N-morpholino]ethanesulphonic acid MHC, major histocompatibility complex mRNA, messenger RNA MW, molecular weight NP, nucleoprotein OD, optical densityPBMC, peripheral blood mononuclear cells PBS, phosphate-buffered saline PCR, polymerase chain reaction PE, phycoerythrin PHA, phytohaemagglutinin R, receptor (eg. IL-2R) RhA, rheumatoid arthritis RNA, ribonucleic acid RNase, ribonuclease SDS, sodium dodecyl sulphate SFMC, synovial fluid mononuclear cells SH, src-homology (eg. SH2) SOB, see LB TAP, transporter associated with antigen
processingTCR, T cell receptor for antigen TdT, terminal deoxynucleotidyl transferase TE, Tris-EDTA buffer tet, tetracycline Th cell, T helper cell (eg. Thl) TNF, tumour necrosis factor Tris, tris(hydroxymethyl)aminomethane U, unit V region, variable region of T cell receptor
for antigen VLA-4, very late antigen-4X-Gal, 5-bromo-4-chloro-3-indolyl-p-D-
galactoside 2-ME, 2-mercaptoethanol
Vlll
CHAPTER 1
General Introduction
Adaptive immunity is a specialised ability of vertebrates to protect themselves
against infectious agents. In contrast to the non-specific protection provided by
innate immunity, adaptive immune responses react to specific molecular determinants
through cell-bound or soluble antigen receptors. Furthermore, there is immunological
memory of previous encounters with a particular antigen, leading to enhanced responses
during subsequent exposure. Specific, adaptive immunity can be further classified into
humoral immunity, which involves the production of antibodies (immunoglobulins) by B
lymphocytes, and cell-mediated immunity, which involves interactions between T
lymphocytes and infected or malignant host cells. The T cell antigen receptor (TCR)
recognises short linear peptide fragments in conjunction with major histocompatibility
complex (MHC) molecules. Class I MHC molecules bind peptides derived from
endogenously synthesised or cytoplasmic proteins, presenting them on the cell surface to
T cells expressing the CDS co-receptor. Instead, class II MHC molecules bind peptides
derived from extracellular proteins, presenting them to T cells expressing CD4. CD8+
(cytotoxic) T lymphocytes are most crucial in mediating the host defence against
intracellular bacteria and viruses [reviewed in Yewdell & Bennink, 1992; Germain,
1994]. The following sections provide a description of cytotoxic T cell recognition of
antigen, as well as a general overview of Epstein-Barr virus and rheumatoid arthritis.
Chapter 1 - Introduction
1.1. Cell-Mediated Immunity
Peptide presentation by class I MHC molecules
MHC-restricted T cell recognition
Early work by Zinkernagel and Doherty [1974a & 1974b] first revealed that cytotoxic T
lymphocytes (CTL) can only recognise antigen in the context of self- or matched-class I
MHC molecules. Later Townsend et al and others demonstrated that CTL responses are
predominantly directed against short peptide fragments derived from cytoplasmic and
nuclear proteins [Bennink et al, 1982; Townsend & Skehel, 1982; Townsend et al, 1986;
Maryanski, 1986]. The ligands for cytotoxic T cell receptors are constitutively expressed
on the majority of nucleated cells. Furthermore, their expression is upregulated by CTL-
derived cytokines, such as IFNy [Nakamura et al, 1984]. Each class I MHC molecule is a
complex consisting of a 44kD heavy chain membrane protein non-covalently associated
with 12kD j32-microglobulin (p2m) and a short peptide around nine amino acids long. The
heavy chain is encoded by the highly polymorphic major histocompatibility gene
complex found on chromosome 6 in humans [Abbas et al, 1997], In each individual there
are three loci, HLA-A, -B and -C; however both maternal and paternal-derived alleles are
co-dominantly expressed, resulting in a maximum of six possible class I molecules.
Structure of the class I MHC molecule
The first X-ray crystal structure of a human class I MHC molecule, HLA-A2, provided a
tremendous boost to our understanding of MHC function [Bjorkman et al, 1987a &
1987b]. The three-dimensional structure revealed a peptide-binding site formed by the
membrane distal al and oc2 domains of the MHC heavy chain. These were arranged to
form two anti-parallel a-helices supported below by a 3-sheet floor, creating a central
groove 30A long, 11 A deep and 10 A wide. Additional structures later showed the
Chapter 1 - Introduction
extended conformation of the peptide, with the side chains of so-called anchor residues
buried within the corresponding specificity pockets (named A to F) lining the groove,
other peptide residues lay exposed on the surface of the molecule, where they might
interact with the T cell receptor. [Garrett el al, 1989, Madden el al, 1991 & 1992,
Fremont el al, 1992; Guo el al, 1992; Silver el al, 1992; Madden, 1995]. It is now clear
from all these studies that conserved non-polymorphic residues, especially those located
in the A and F pockets at either end of the groove interact with the peptide backbone to
ensure a common orientation of all bound peptides, as well as preferential binding of
peptides of eight to eleven amino acids in length. Polymorphic residues of the heavy
chain are concentrated in pockets B to F in the central portion of the peptide-binding
groove; these residues influence the shape and chemical characteristics of the specificity
pockets, imposing stringent binding requirements for amino acids at particular positions
along the peptide. As a result each MHC molecule binds a distinct set of peptides sharing
a common binding motif, but still is able to present a wide array of peptides to the T cell
receptor [reviewed in Elliott el al, 1993; Heemels & Ploegh, 1995].
Characterisation of peptides bound to class I MHC molecules
Several novel techniques were employed to analyse the peptides presented by MHC
molecules. Falk and Rotzschke used Edman degradation to sequence pools of peptides
eluted at low pH from large quantities of immunoaffinity-purified MHC molecules
[Rotzschke el al, 1990; Falk el al, 1991]. Since the anchor positions are consistently
occupied by one or a few chemically similar amino acids, this method enabled the
binding motifs of many class I MHC alleles to be determined [reviewed in Rammensee el
al, 1995]. Other groups were also able to sequence the individual peptides bound to MHC
molecules, utilising HPLC fractionation in combination with Edman sequencing
Chapter 1 - Introduction
[Jardetzky et al, 1991; Rudensky et al, 1991] or tandem mass spectrometry [Hunt et «/,
1986 & 1992]; the latter technique provides reliable sequence information from as little
as 300 fmol of peptide [Engelhard, 1994].
In addition to anchor residues, other peptide positions have been identified where there is
a less stringent amino acid preference, and which are categorised as secondary anchor
positions [Ruppert et al, 1993; Parker et al, 1994]. The knowledge of peptide motifs for a
variety of alleles has proven invaluable for the prediction and identification of CTL
epitopes within proteins of known sequence [Rotzschke et al, 1991; Pamer et al, 1992;
Rilletal, 1992].
The class I antigen processing pathway
Protein degradation in the cytosol
Degradation of the endogenous proteins by the cytosolic proteasomes provides the major
source of peptides for class I MHC molecules. Experiments have shown that the presence
of inhibitors of proteasome function results in retention of peptide-deprived class I MHC
molecules in the ER [Rock et al, 1994; Fenteany et al, 1995; Hughes et al, 1996].
Proteasomes are large multicatalytic proteases, consisting of a barrel-shaped 20S core
particle associated with additional regulatory subunits. Crystal structures have revealed
that the proteolytic active sites are located on the inner surface of the barrel, through
which protein substrates must feed in order to be degraded [Lowe et al, 1995; Groll et al,
1997]. Two subunits of the proteasome have been found to be encoded in the MHC
region [Brown et al, 1991; Glynne et al, 1991; Kelly et al, 1991; Matinez & Monaco,
1991; Ortiz-Navarrete et al, 1991]; exposure of cells to IFNy causes substitution of the
normal constitutive subunits with MHC-encoded LMP7, LMP2 and a third, non-MHC-
encoded subunit, LMP10 (MECL-1) [Belich et al, 1994; Nandi et al, 1996; Groettrup et
Chapter 1 - Introduction
al, 1996]. These proteins have been shown to alter the specificity of the proteasome,
upregulating preferential cleavage after basic or hydrophobic residues whilst inhibiting
cleavage after acidic residues [Driscoll et al, 1993, Gaczynska et al 1993 & 1994,
Eleuteri et al, 1997]. This activity has been postulated to increase the generation of
peptides suitable for binding MHC molecules, as these typically require hydrophobic C-
terminal anchor residues. IFNy has also been found to increase expression of the PA28
activator, which similarly appears to enhance the efficiency of the proteasome in
generating MHC ligands [Ma et al, 1992; Gray et al, 1994; Dick et al, 1996]. Additional
regulatory components are likely to play a role in antigen processing [Ma et al, 1994;
Deveraux et al, 1994; Hoffman & Rechsteiner, 1994].
Other proteases may also contribute peptides for presentation by class I MHC molecules,
so long as the appropriate binding motifs are present [Anderson et al, 1991]; however
these probably only constitute a minor source of ligands. It has been suggested that the
relative efficiency of epitope generation by proteasomes may influence the hierarchy of T
cell responses to different epitopes [Niedermann et al, 1995]. Furthermore, some proteins
derived from pathogens have been shown to contain sequences that prevent proteasome-
mediated degradation, thereby avoiding detection by cytotoxic T lymphocytes
[Levitskaya et al, 1995].
Peptide transport into the endoplasmic reticulum (ER)
The TAP (transporter associated with processing) transporter is a membrane-bound
heterodimer of TAP1 and TAP2 subunits and a member of the ATP-binding cassette
(ABC) family of membrane transporters. This complex facilitates peptide transport from
the cytosol into the ER in an ATP-dependent manner [Kelly et al, 1992; Townsend &
Trowsdale, 1993]. Studies on murine and human cell lines carrying mutations in their

Chapter 1 - Introduction
TAP genes have demonstrated that this peptide transporter is critical for antigen
presentation by class I MHC molecules on the cell surface [Salter & Cresswell, 1986,
Townsend et al, 1989; Cerundolo et al, 1990],
Human TAP molecules have been shown in transport assays to be fairly promiscuous,
apart from a preference for peptides with hydrophobic and basic C-termini [Androlewicz
& Cresswell, 1994; Momburg et al, 1994a; van Endert et al, 1995]. Peptides between
seven to twelve residues are most efficiently transported, although longer peptides are not
excluded [Androlewicz et al, 1993; Momburg et al, 1994b]. There is also some evidence
that transported peptides may be subject to further trimming in the ER by resident
peptidases, but these have yet to be fully characterised [Elliott et al, 1995].
Assembly of the class I MHC-peptide complex
Stable assembly of newly-synthesised class I molecules is closely associated with peptide
binding. In TAP deficient cell lines, empty class I molecules are retained in the ER and
do not traffick to the cell surface [Townsend et al, 1990; Elliott et al, 1991]. Evidence for
the involvement of chaperone molecules various stages to assist the formation of
correctly folded class I MHC-peptide complexes has come from immunoprecipitation
experiments done by several groups. The current model suggests that calnexin binds
newly synthesised class I heavy chains when they enter the ER [David et al, 1993;
Ortmann et al, 1994], but is exchanged for calreticulin upon formation of heavy chain-
(3 2 m dimers [Sadasivan et al, 1996]. Another protein, tapasin, mediates the association of
the class I-f^m-calreticulin complexes to TAP, where they may bind peptide ligands
[Sadasivan et al, 1996; Grandea et al, 1995; Ortmann et al, 1997]. Peptide binding
induces a conformational change that enhances the stability of the MHC complex and
Chapter 1 - Introduction
allows it to be transported from the ER through the Golgi apparatus to the plasma
membrane [Elliott etal, 1991].
The human T cell antigen receptor
The T cell receptor that interacts with MHC molecules is a disulphide-linked heterodimer
composed of two homologous transmembrane polypeptide chains (each about 40-60 kD
in size), designated a and p. Its basic framework structure closely resembles that of the
antigen-binding fragment (Fab) of an immunoglobulin molecule in having variable (Va
and Vp) and constant (Ca and Cp) domains (see below). The TCR is also non-covalently
associated with CD3, a membrane-bound signalling complex of non-polymorphic
polypeptides which includes 5, y, s, and £ chains [Abbas et al, 1997].
TCR genes and VDJ recombination
Similar to B lymphocyte immunoglobulin receptors, the TCR is assembled from a large
collection of gene segments by rearrangement of the germline sequence [Davis &
Bjorkman, 1988]. A functional a chain exon is produced by association of variable (V)
and joining (J) gene segments, whilst P chains include additional diversity (D) gene
segments between V and J. It is estimated that at least 42 AV gene segments and about
50 AJ segments are functionally expressed. Similarly p chains are encoded by
approximately 47 BV genes, 2 BD genes and 13 BJ genes [Arden et al, 1995; Toyonaga
et al, 1985; Davis & Bjorkman, 1988]. Combinatorial diversity arising from the
association of multiple gene segments contributes to the size of the potential T cell
repertoire.
Rearrangement of gene segments takes place during T cell maturation in the thymus, and
involves the RAG1 and RAG2 recombinases [Schatz et at, 1989; Oettinger et al, 1990].
7
Chapter 1 - Introduction
The process is directed by recombination signal sequences (RSS) flanking each gene
segment, consisting of a palindromic heptamer and an A/T-rich nonamer separated by
either a 12- or 23-bp spacer; recombination only takes place between two RSS of
different lengths [Hesse et al, 1989; reviewed in Lewis, 1994]. Double-strand breaks are
first introduced between the coding sequence and RSS. The resulting coding ends are
simultaneously sealed in a hairpin structure, whereas signal ends remain blunt and are
subsequently ligated to form a circular piece of extrachromosomal DNA. The two DNA
hairpin intermediates are then resolved to form a coding joint (junction of coding ends)
[van Gent et al, 1995; McBlane et al, 1995; Ramsden et al, 1996]. The joining of coding
ends is fairly imprecise; furthermore, addition of nontemplated or palindromic
nucleotides, as well as deletion of terminal nucleotides often takes place [Ferguson &
Thompson, 1993]. These mechanisms further contribute towards the generation of
diversity, particularly at the coding junctions of both a and |3 chains. It has been
estimated that the unselected immature T cell repertoire has the potential to contain up to
10 15 specificities [Davis & Bjorkman, 1988].
Structure of the afi TCR
The structure of the T cell receptor was long predicted to resemble that of an Ig Fab
fragment, from comparisons of their amino acid sequences. Thus by analogy, the TCR
antigen binding surface was proposed to consist of six hypervariable loops encoded by
both a and |3 chains, corresponding to the complementarity-determining regions (CDRs)
of antibodies [Chothia et al, 1988; Davis & Bjorkman, 1988; Claverie et al, 1989]. The
CDRl- and CDR2-equivalent hypervariable regions are contained entirely within the V
domains, and are generally less variable than their counterparts in Ig chains. However the
CDR3-equivalent region is encoded by V and J gene segments in the a chain, or V, D
8
Chapter 1 - Introduction
and J segments in the p chain, and therefore variablity of TCRs is even more
concentrated in the CDR3 loop than it is in antibody molecules. The model proposed by
Davis & Bjorkman in 1988 suggested that the CDR1 and CDR2 loops were mainly
responsible for contacting the side chains of the MHC a helices, whilst the CDR3 loops
mostly interacted with the bound peptide. The importance of the third CDRs in
determining peptide specificity was further demonstrated by the results of experiments
that probed TCR-MHC interactions [Engel & Hedrick, 1988; Jorgensen et al, 1992; Hong
etal, 1992; Sun etal, 1995; Sant'Angelo et al, 1996].
The crystal structures of the TCR (3 chain and Va domain were initially determined
separately [Bentley et al, 1995; Fields et al, 1995] and showed that they are indeed
composed of Ig-like variable and constant domains. Shortly after this, two structures of
an ap TCR heterodimer in complex with a class I MHC molecule bound to peptide were
solved by X-ray crystallography [Garcia et al, 1996; Gaboczi et al, 1996]. The results
confirmed that earlier predictions were largely correct, but also revealed important
variations between TCR and antibody structures that relate to their different modes of
antigen recognition.
TCR recognition of peptide-MHC complexes
The three dimensional structure of a T cell receptor complexed to peptide-MHC
answered at least one burning question for immunologists. All the crystal structures
analysed to date have revealed a uniform diagonal orientation of the TCR with respect to
MHC, with the a chain over the N-terminal half of the peptide and the p chain over the
C-terminal half. [Gaboczi et al, 1996; Garcia et al, 1996 & reviewed in 1999; Davis et al,
1998]. This conserved angle of approach is thought to be important for ensuring correct
Chapter 1 - Introduction
positioning of the coreceptor and signalling molecules. The a and (3 chain CDR3 loops
are located over the central portion of the peptide; in addition, both CDR1 loops are
positioned over the N-terminal and C-terminal peptide residues and may contact both
peptide and MHC. The CDR2 regions have exclusive contact with the a helices of the
MHC heavy chain and argue that residues in the tips of these loops have greatest
influence on MHC-restriction.
Another observation that has emerged from the TCR crystal structure is the poor shape
complementarity between peptide and the TCR recognition surface. This presumably
explains the characteristic low affinity and short half-lives of TCR binding to peptide-
MHC and may be a mechanism to facilitate the ability of the TCR to adapt to different
bound ligands. More highly antigenic peptides may have greater contact with the TCR,
increasing the half-life and thus bringing about different signalling outcomes.
From biological experiments, multimerisation and clustering appear to be integral aspects
of TCR signalling [Weiss & Littman, 1994; Germain, 1997; Reich et al, 1997]. In
contrast crystal structures to date show no evidence of oligomeric TCR/MHC assemblies.
It remains to be seen how these apparent differences will be reconciled. Additional
crystal structures must first be solved in order to allow generalisations to be made about
the structural basis of T cell recognition.
Activation-induced T cell effector functions
Activation of CD8+ T cells can result in diverse effects, including proliferation and
differentiation, T cell cytotoxicity, cytokine production and T cell antagonism [Marx,
1995]. Two independent mechanisms account for T cell-mediated cytotoxicity . The
major pathway involves the secretion of pore-forming perforin proteins. An alternative
pathway is mediated by the interaction of Fas ligand expressed on activated T cells with
10
Chapter 1 - Introduction
Fas on the surface of target cells [Kagi et al, 1996]. In addition, recent studies have
indicated that CD8+ cytotoxic T lymphocytes may be stimulated to differentiate into Tel
or Tc2 effector subsets, secreting distinct Thl-like (IL-2 and IFNy) or Th2-like (IL-4, IL-
5, IL-6 and IL-10) cytokine patterns [Sad et al, 1995; Maggi et al, 1994].
T cell activation requires signal transduction by the CD3 complex following engagement
of the TCR by its ligand. The members of the CD3 signalling complex contain multiple
activation motifs, known as immunoreceptor tyrosine-based activation motifs (ITAMs)
within their cytoplasmic tails, which become tyrosine-phosphorylated in response to TCR
antigen recognition [Romeo et at, 1992; Irving et <?/, 1993]. This initiates a cascade of
phosphorylation activity by other additional cytosolic tyrosine kinases, eventually
transducing the signal into the cell nucleus. [Weiss & Littman, 1994; Wange &
Samelson, 1996]
The quality of the transmitted signal and the resultant functional outcome appears to
depend on the biophysical properties which affect the binding affinity and kinetics of the
interaction between the TCR and the peptide-MHC complex. Antagonist and partial
agonist ligands for the TCR have been described which induce different patterns of T
cell-mediated signalling [Evavold et al, 1993; Madrenas et al, 1995; Sloan-Lancaster et
al, 1996]. In addition, the phenotypic state and expression of accessory molecules such as
costimulators (CD28 & CTLA-4) [Krummel & Allison, 1995], integrins (VLA-4, LFA-1
& CD2) [Hynes, 1992] and adhesion molecules (CD44, CD62L, etc.) [Haynes et al,
1989; Spertini et al, 1991] also play an important role in determining the response of a T
lymphocyte to stimuli. The presence of such molecules on antigen-primed cells results in
more rapid T cell responses to recall antigens.
11
Chapter 1 - Introduction
Selection of the T cell repertoire
TCR genes are first rearranged and expressed in the thymus during the earliest stages of
T-cell differentiation. TCR (3 chains are rearranged and transcribed prior to
rearrangement of the a chain. Expression of the (3 chain signals subsequent events in T
cell maturation. The processes of thymic selection must lead to the generation of T cells
that are self-MHC restricted and self tolerant [Robey & Fowlkes, 1994; Zuniga-Pflucker
& Lenardo, 1996]. Therefore thymocytes are selected to survive or be eliminated on the
basis of their TCR specificity for MHC and peptide antigens. The stages of thymocyte
maturation can be mapped according to levels of expression of their TCR and other
accessory molecules.
At the earliest so-called double negative stage, cells do not express either CD4 or CDS
molecules. Newly formed J3 chains are paired with surrogate pre-T a chains (pToc) and
expressed on thymocytes together with CD3 proteins. This results in allelic exclusion of
the second p chain and signals thymocytes to proliferate and express both CD4 and CDS
coreceptor molecules. The a chain subsequently rearranges and a(3 heterodimers are now
expressed at low levels on the cell surface. Cells at this double positive stage may
proceed towards one of three possible fates depending on their affinity (or avidity) for
peptide-MHC complexes expressed on thymic antigen presenting cells. Cells that fail to
recognise peptide-MHC complexes altogether will apoptose (death by neglect);
conversely cells with high affinity are negatively selected, and also undergo apoptosis.
Only cells that exhibit low affinity interactions with peptide-MHC are positively selected
and rescued from death. Positively selected cells eventually differentiate into single
positive (CD4+ or CD8+) TCRoof3hl T cells [Petrie et al, 1987; Ohashi et al, 1990; Sebza et
al, 1999].
12
Chapter 1 - Introduction
The TCR repertoire in normal individuals
Expression of variable chains on T lymphocytes has been studied using PCR methods and
TCR V chain-specific monoclonal antibodies [Posnett et al, 1996]. In cord blood or
young individuals TCR variable chain usage by T cells is generally consistent; with some
chains such as BV14 and BV17 being commonly found and others such as BV7S1 and
BV16 only rarely. However, some variations in repertoires do exist between different
individuals. In certain individuals, reduced expression of particular alleles can be
attributed to polymorphisms in the non-coding regions of the TCR V genes themselves
[Luyrink et al, 1993; Kay et al, 1994; Donahue et al, 1994; Posnett et al, 1994a; Bour et
al, 1999]. Further studies of twin pairs and HLA-identical or non-identical siblings from
large families have suggested that HLA genes may also influence the expressed repertoire
[Gulwani-Akolkar et al, 1991; Akolkar et al, 1993]. Thus the patterns of V-segment
frequencies are most similar between twins and HLA-identical siblings and most
dissimilar between totally mismatched siblings. In addition, it was shown that the
frequency of T cells expressing particular BV genes was frequently skewed towards
either CD4+ or CD8 + cells, arguing in these cases for their preferential selection by class I
or class IIMHC proteins during maturation in the thymus.
Although clonal and oligoclonal expansions of T cells are never present in cord blood,
they become frequently detectable in peripheral blood from normal individuals with
increasing age [Hingorani et al, 1993; Posnett et al, 1994b]. TCRBV expansions were
observed in both CD4+ and CD8+ populations and in particular, one study found that
more than half of the aged persons had clonal expansions within the BV3, BV14, BV16
and BV23 families [Schwab et al, 1997]. It is not clear whether these expansions
represent antigen-driven clonal populations that have persisted following clearance of
antigen, or whether they are continuously stimulated by persistent antigen. Analysis of
13

Chapter 1 - Introduction
the phenotype of the CD8 + cells reveals that they are often CD28" and CD57 [Morley et
al, 1995], which is thought to indicate that the cells are within a late differentiation
compartment.
1.2. The Epstein-Barr Virus
General aspects
Epstein-Barr virus (EBV) is a ubiquitous human y-herpes virus that productively infects
epithelial cells and establishes latency in B cells. Primary infection with EBV often
occurs during childhood and is usually asymptomatic. However, instances where primary
infection is delayed till adolescence or later [Rickinson & Kieff, 1996] can give rise to a
clinical disease known as acute infectious mononucleosis (IM), or glandular fever.
Following primary infection, EBV persists for life in a subset of B cells [Masucci &
Ernberg, 1994] and is associated with at least four malignancies: endemic Burkitt's
lymphoma, nasopharyngeal carcinoma, a proportion of Hodgkin's lymphomas and the
immunoblastic B-cell lymphomas seen in some immunocompromised individuals
[Epstein & Achong, 1986].
Gene expression
Primary EBV infection is takes place following oral transmission, in the oropharyngeal
epithelial cells [Sixbey et al, 1984]. Up to 70 lytic cycle genes may be expressed, divided
temporally into immediate early, early and late, which direct viral DNA synthesis and
replication [Kieff, 1996]. Newly synthesised infectious virions proceed to establish latent
infection in circulating mature B lymphocytes, with expression of eight latent proteins,
Epstein-Barr nuclear antigens (EBNA) 1, 2, 3A, 3B, 3C, leader protein (LP), latent
14
Chapter 1 - Introduction
membrane proteins (LMP) 1 and 2. This programme of gene expression, as seen in in
vitro transformed B-LCLs, drives the expansion of the latently-infected B cell pool
[Tierney et al, 1994]. Following primary infection, a life-long virus carrier state is
established whereby the virus is harboured within a subset of resting B cells and viral
gene expression is downregulated. Throughout life, intermittent reactivation of latently-
infected B cells into lytic cycle at mucosal sites probably underlies the low level shedding
of infectious virus detectable in throat washings of asymptomatic virus carriers
[Rickinson & Kieff, 1996].
CTL responses in EBV infection
Although there is a strong antibody response to EBV, T cells play the main role in
controlling both the primary and persistent phases of infection and in preventing the
development of immunoblastic B-cell lymphomas [Rickinson, 1986]. EBV-specific CTL
can be readily generated in vitro from peripheral blood of IM patients or healthy
seropositive donors, using autologous virus-transformed B-LCLs as stimulators [Murray
et al, 1992; Khanna et al, 1992; Steven et al, 1996]. A large number of CTL epitopes
have been mapped to virus proteins expressed during latency, and more recently also to
those expressed during the lytic life cycle, by assaying CTL clones against targets
expressing individual proteins from recombinant vaccinia vectors. The majority of
dominant CTL reactivities are directed towards the EBNA3A, 3B and 3C latent proteins,
with subdominant responses to LMP2, or less frequently EBNA2, EBNA-LP and LMP1.
CTL responses to EBNA1 are almost never detected [reviewed in Rickinson & Moss,
1997]. Responses to epitopes from immediate early and early lytic cycle proteins have
only recently been documented, most notably the HLA-B8 restricted BZLF1 peptide,
RAKFKQLL, and the HLA-A2 restricted BMLF1 peptide, GLCTLVAML [Steven et al,
15
Chapter 1 - Introduction
1997, Bogedain et al, 1995; Scotet et al, 1996]. These studies were initially hampered by
the fact that the B-LCLs traditionally used as stimulator cells do not normally undergo
active virus replication.
Immune evasion
Despite strong CTL responses capable of eliminating virus-infected cells, EBV continues
to persist indefinitely within its host. This is largely due to its successful strategy for
avoiding immune detection of the B cells that constitute the latent reservoir. Viral gene
expression in resting virus infected B cells (and Burkitt's lymphoma cells) is limited to
the EBNA1 protein, which is not recognised by CTL [Masucci & Ernberg, 1994]. This is
due to an internal glycine-alanine repeat within the protein sequence that has been shown
to protect it from proteasome degradation and consequently from CTL detection
[Levitskaya et al, 1995; Shapiro et al, 1998]. In other EBV-associated malignancies such
as nasopharyngeal carcinoma and Hodgkin's disease, limitation of viral gene expression
to EBNA1, LMP1 and LMP2 may also serve to avoid the brunt of CTL reactivities,
which are predominantly directed against EBNA3A, 3B and 3C.
1.3. Rheumatoid Arthritis
Rheumatoid arthritis is an autoimmune joint disease characterised by destruction of the
joint cartilage and inflammation of the synovium. Large numbers of activated
macrophages and CD4+ T lymphocytes may be found in rheumatoid synovial
membranes, as well as plasma cells, dendritic cells and activated fibroblasts [Janossy et
al, 1981; Klareskog et at, 1982]. The majority of these cells express abundant levels of
class II MHC and adhesion molecules, indicative of their activated state [Cush & Lip sky,
16

Chapter 1 - Introduction
1988; Morales-Ducret et a/, 1992; Johnson et #/, 1993]. In severe cases, well-formed
lymphoid follicles with germinal centres may also be present. The synovial joint fluid,
which normally contains few cells, also becomes infiltrated with neutrophils,
macrophages, T lymphocytes (mainly CDS*) and dendritic cells. In addition, patients
frequently have circulating IgM or IgG autoantibodies, usually reactive with the Fc
portion of their own IgG molecules [Posnett & Edinger, 1997]. However these so-called
rheumatoid factors do not appear to contribute to to the pathogenesis of the disease.
Numerous cytokines can be detected within synovial fluid, including IL-1, IL-8, TNF and
IFNy. These cytokines are probably produced by activated T cells and macrophages, and
are believed to stimulate synoviocytes to release hydrolytic enzymes, such as collagenase
and metalloproteinases, that mediate destruction of the cartilage, ligaments and tendons
of the joints. Clinical trials using anti-TNF antibody therapy have shown some success
[reviewed in Feldmann et al, 1996], verifying that this inflammatory cytokine promotes
disease progression.
The etiology of rheumatoid arthritis (RhA) is as yet unknown. However, susceptibility to
the disease is strongly linked to the presence of the class II MHC haplotype, HLA-DR4,
or other similar alleles that share an identical motif sequence at amino acids 70-74
(QKRAA) of the f> chain [Gregersen et al, 1987]. Such class II molecules may play a role
in shaping the TCR repertoire or in presentation of an inducing microbial or autoantigenic
peptide. This hypothesis would suggest that T cell recognition is important in the
pathogenesis of RhA.
There are several experimental models of arthritis. MRL/Ipr mice develop spontaneous
arthritis and have high serum levels of rheumatoid factors, but the mechanisms that
induce joint disease in this case are unknown [Hang et al, 1982; Theofilopoulos et al,
1983]. Immunisation of susceptible strains of mice and rats with type II collagen can
17
Chapter 1 - Introduction
produce a T cell-mediated arthritis. Furthermore, transfer of collagen-specific T cells to
unimmunised animals is sufficient to cause disease. However there is no convincing
evidence for collagen-specific autoimmunity in the human disease [Trentham et al, 1977
and 1978]. Experimental arthritis can also be brought about by immunisation with various
bacterial antigens, including mycobacterial and streptococcal cell wall proteins [Izui et al,
1979]. Once again, however, such diseases bear only a superficial resemblance to human
rheumatoid arthritis.
1.4. Aims of this Thesis
The first part of this thesis looks at diversity of the T cell receptor p chain CDR3 region
as a result of VDJ recombination. The possible influence of V gene 3' sequences on the
composition of the T cell repertoire is investigated. Secondly, the recent development of
peptide-MHC tetrameric complexes has enabled us to detect T lymphocytes according to
their antigen specificity. Their use in detecting EBV-specific CD8+ T cells is described
in the second part of this thesis, detailing a reassessment of the frequencies of antigen-
specific CD8+ T lymphocytes that arise in the course of primary infection with Epstein-
Barr virus, and continue to circulate in peripheral blood during long term viral
persistence. In addition, I have estimated frequencies of EBV-specific T cells in
asymptomatic donors by tetrameric staining, ELISpot assays and limiting dilution assays
and compared the relative values obtained using the different methods. Lastly, this work
focuses on CTL responses to latent versus lytic viral proteins, and examines the
frequency and phenotype of these cells during the different phases of infection, as well as
during chronic inflammatory disease.
18
CHAPTER 2
Materials and Methods
General laboratory reagents were purchased from Sigma, United States Biochemical
Corp., or BDH Merck Ltd, except where otherwise indicated.
2.1. General Cell Culture
Tissue culture media
Cells were grown at 37°C with 5% CO2 , in RPMI 1640 medium (Gibco BRL)
supplemented with 10% PCS (Globepharm Ltd, UK), 2 mM L-glutamine, 50 U/ml
penicillin and 50 u.g/ml streptomycin (RIO medium), unless otherwise stated. Cell lines
were regularly screened for mycoplasma infection.
Freezing of cell stocks
Cells were suspended in a small volume of ice-cold freezing mix (90% PCS, 10%
DMSO). 1-ml aliquots were frozen down in screwcap vials at -70°C using a Cryo J°C
freezing container (Nalgene). Typically, each aliquot contained several million cells.
Once frozen the cells were sometimes transferred to liquid nitrogen tanks for long-term
storage.
19
Chapter 2 - Materials A Methods
2.2. Donor Blood Samples
Preparation of human peripheral blood mononuclear cells from whole blood
Venous blood from donors was drawn into a syringe containing sodium heparin (>1
U/ml) as an anticoagulant. Every 15 ml of blood was diluted with an equal volume of
sterile, serum-free RPMI 1640 and layered over 10 ml of Lymphoprep (Nycomed
Pharma, Norway). PBMC were isolated by density gradient centrifugation at 340 x g for
30 min at room temperature, with no brake. The cloudy white interface layer, which
contained mononuclear cells, was drawn off and washed twice in serum-free RPMI 1640.
The cells were counted and either used immediately or frozen down.
Preparation of human lymphocytes from synovial fluid
Synovial fluid was aspirated from knee joints of arthritis patients. Lymphocytes were
isolated in exactly the same manner as for blood (see above). The collected cells were
either used fresh or frozen down.
Isolation of CD4+ or CD8+ T lymphocytes from PBMC
Dynabeads (Dynal, Norway) directly conjugated to either CD4 or CDS were used to
isolate the relevant T cell populations. These were first washed (using a Dynal Magnetic
Particle Concentrator) in ice-cold RIO medium to remove the sodium azide preservative,
and then resuspended in RIO supplemented with 10% human serum (hRlO). PBMC were
also washed twice in cold RIO and resuspended in hRlO.
In order to obtain CD4+ lymphocytes, the cells were first negatively selected with CD8-
conjugated Dynabeads, using 20-40 Dynabeads per expected positive cell (lymphocytes
make up roughly two-thirds of PBMC, and the ratio of CD4+ to CD8+ cells is about 2:1).
Dynabeads were incubated with the PBMC in 200 ul hRlO on ice for 30 min. After this 5
ml of hRlO was added gently and the supernatant collected. Cells in the supernatant were
20
Chapter 2 - Materials & Methods
washed once before proceeding to positive selection. This time CD4-conjugated, washed
Dynabeads (4 per expected positive cell) were added to the cells, in 200 ul hRlO total
volume, and left on ice for 30 min. Once again, 5 ml of hRlO was then added gently and
the Dynabead-attached CD4^ cells were retained.
A similar procedure was used to isolate CD8+ lymphocytes. Carrying out negative
selection followed by positive selection resulted in efficient removal of double negative
(CD4~CD8~) T cells and gave populations that were >95% pure.
Generation of human B lymphoblastoid cell lines
5-10 x 106 freshly isolated PBMC were incubated for 1 h in 1 ml of supernatant from the
marmoset EBV-producing cell line, B95.8. The cells were then diluted in RIO medium
containing 1 ng/ml cyclosporin A and left for 6-8 weeks until the B-LCL was established.
Thereafter the lines were maintained in RIO medium alone.
Tissue typing of blood donors
HLA types of some donors were previously identified by serology. This method involved
screening the donors PBMC with a panel of HLA haplotype-specific antibodies by
complement-mediated lysis.
Donors for whom no HLA type was known were tissue typed by PCR-SSP phototyping
[Bunce et at, 1995]. Genomic DNA was extracted from whole blood, PBMC or
neutrophil fractions (following Lymphoprep separation of mononuclear cells from whole
blood), using a Puregene DNA isolation kit (Gentra Systems, USA). 12.5-25 ng of DNA
was required for each sample. Sequence-specific primers (SSP) were used to detect all
known HLA-A, -B, -C, DRB1, DRB3, DRB4, DRB5 and DQB1 specificities in an allele-
specific or group-specific manner. Each DNA sample required 192 simultaneous PCR
reactions, carried out in 96-well V-bottom PCR plates (total reaction volume was 25
21

Chapter 2 - Materials & Methods
Cycling parameters were as follows:
96°C 60s 1 cycle
96°C 50s ]70°C 50s \ 5 cycles72°C 50s J
96°C 50s 165°C 50s \ 21 cycles72°C 50s J
96°C 50s ]55°C 50s \ 4 cycles72°C 90s J
Loading buffer was added directly to each well following the PCR and 10 ul of each
reaction was run on a 2% agarose gel. The resulting gel was photographed and the tissue
type determined by the presence or absence of appropriate-sized bands on the gel.
EBV serological testing
For each donor 5 ml of whole blood was left to stand at room temperature for several
hours until the blood was completely clotted. Clotted material was then spun out and the
serum collected. Samples were sent to the John Radcliffe Hospital Public Health
Laboratory's Virology Department to test for IgG antibodies against EBV.
2.3. Bacterial Culture
Recipes for bacterial broth
Bacterial nutrient broth was always made up with deionised water and autoclaved/C\
immediately. All Bacto media reagents were purchased from Difco Laboratories, USA
or Gibco BRL, UK.
Luria-Bertani /litre low salt LB /litre
10.0 g Bacto®-tryptone 10.0 g Bacto®-tryptone
5.0 g Bacto®-yeast extract 5.0 g Bacto®-yeast extract
10.0 g sodium chloride 5.0 g sodium chloride
22

Chapter 2 - Materials & Methods
2xYT /litre SOB /litre
16.0 g Bactox-tryptone 20.0 g Bactox-tryptone
10.0 g Bacto*-yeast extract 5.0 g Bacto^-yeast extract2.5 g sodium chloride 0.5 g sodium chloride
40 mM magnesium chloride (added afterautoclaving)
SOC /100ml
2.0 g Bacto®-tryptone
0.5 g Bacto®-yeast extract
10 mM sodium chloride
2.5 mM potassium chloride
20 mM magnesium chloride ] added after
20 mM glucose J autoclaving
(1?)Agar plates were made by adding 15.0 g Bacto agar per litre of media before
autoclaving. Molten agar was poured into 8 cm sterile disposable petri dishes. To make
soft topping agar, the amount of bactoagar added was halved (7.0 g bactoagar per litre).
Just before use this was melted in a microwave oven on defrost setting and then held in a
water bath at 45°C.
Antibiotic selection
Bacteria were cultured, where indicated, under antibiotic selection. Working
concentrations were as follows: tetracycline 12.5 ug/ml, chloramphenicol 100 ug/ml and
ampicillin 100 ug/ml. Stock solutions were filter-sterilised and added to media just before
use.
23
Chapter 2 - Materials & Methods
Making bacterial glycerol stocks
A 50% solution of glycerol in LB was made up and autoclaved. 700 ul of early log phase
bacterial culture was added to a clean tube containing 300 ul of the LB-glycerol mixture
and mixed thoroughly. Tubes were snap frozen on dry ice and stored at -70°C.
2.4. Single Stranded Sequencing of T Cell Receptor B-Chains
Extraction of mRNA from lymphocytes
Sources of mRNA were T cell clones, Dynabead-sorted CD4+/CD8+ T lymphocytes or
tetramer-sorted CD8+ T lymphocytes. Between 0.5-5 x 10⁶ cells were pelleted in a clean
RNase-free eppendorf tube. 1 ml of TRI Reagent™ (Sigma) was added and the cells lysed
by pipetting up and down. The tube was left at room temperature for 5 min, then 200 ul
of chloroform was added and the mixture vortexed. After a further incubation on ice for
15 min, the sample was centrifuged at 13,000 rpm for 15 min at 4°C. The upper aqueous
phase was transferred into a fresh eppendorf tube, carefully avoiding the DNA-containing
interface. The mRNA was precipitated in an equal volume (0.5 ml) of isopropanol and
washed twice in 70% ethanol. The resultant pellet was resuspended in DEPC-treated
water and the yield was calculated by spectrophotometry:
OD26o 1 = 40 pig/ml RNA or 50 fig/ml cDNA (dilulte 1 ul sample into 500 ul water)
Synthesis of cDNA
Approximately 5 ug of mRNA and 0.2 U of oligo dT primer (Collaborative Biomedical
Products, USA) were mixed in a total volume of 20 \JL\ DEPC-treated water. The sample
was heated to 70°C for 3 min and then allowed to cool on ice for another 3 min. The
cDNA synthesis reaction was carried out at 42°C for 60-90 min in a 40 ul reaction
24

Chapter 2 - Materials & Methods
mixture containing 20 U ribonuclease inhibitor (rRNasin®, Promega), 1 mM dNTPs
(MBI Fermentas, Lithuania), 25 mM Tris-hydrochloride, pH 8.3, 50 mM potassium
chloride, 12 mM DTT, 5 mM magnesium chloride and 30 U Avian Myeloblastosis Virus
reverse transcriptase (NBL Gene Sciences, UK). The cDNA product was precipitated in
one volume of 4M ammonium acetate and 6 volumes of ethanol, washed in 70% ethanol,
and finally stored in autoclaved distilled water at -20°C.
In the case of samples where anchored PCR was required, the samples were further
purified on Chroma Spin™ -100 disposable gel filtration columns (Clontech Laboratories,
Inc) prior to ethanol precipitation.
Poly G tailing (only for anchored PCR)
Terminal transferase (Boehringer Mannheim) was used to catalyze the addition of dGTP
nucleotides to the 3'OH end of cDNA strands. A 20 u.1 reaction mixture contained the
cDNA product, 5 uM dGTP, 0.75 mM cobalt chloride, 200 mM potassium cacodylate, 25
mM Tris-hydrochloride, pH 6.6, 0.25 mg/ml BSA and 25 U of terminal transferase
enzyme. After incubation for 5 min at 37°C, the tailed product was purified by
phenol/chloroform extraction (take upper phase) and used as a template for anchored
PCR
PCR and purification of products
A simultaneous "no DNA" control reaction was always included for all samples.
Furthermore, to avoid contamination, only dedicated reagents and Gilson pipettes were
used.
J3 chain V region-specific PCR was carried out using a 5' TCRBV region-specific primer
and a 3' TCRBC region-specific primer. Each primer also contained a restriction enzyme
25
Chapter 2 - Materials & Methods
site (Not I or Sal I) to facilitate later cloning steps. For anchored PCR the V region-
specific primer was replaced by a poly C primer (complementary to the incorporated poly
Gtail).
TCRBC-specific primer:
B-Sal CGT TTG TCG TCG ACC TGC TTC CCA TTC ACC
TCRBV-specific primers:
BV9S1 ATA AGA ATG CGG CCG CAA TAA GGA GCT CAT TAT AAA TGA AAC AG
BV16S1 ATA AGA ATG CGG CCG CCA TTT TGT GAA AGA GTC TAA ACA GGA T
BV7S1 ATA AGA ATG CGG CCG CGT TTG TCT ACA GCT ATG AGA AAC TCT
BV12S1 ATA AGA ATG CGG CCG CTA TGG TGT TAA AGA TAC TGA CAA AGG A
BV6S2 ATA AGA ATG CGG CCG CAT TTC CAG AAT GAA GCT CAA CTA GAC
Poly C primer
polyC-Not GCA TTC AGC TGC GGC CGC (C) 14
The total reaction volume was 50 u.1, containing no more than 0.5 ug of cDNA template,
1 |uM each of both primers (forward and reverse), 1.25U BIOTAQ™ DNA polymerase
(Bioline, UK), 2 mM magnesium chloride, 200 uM dNTPs, 16 mM ammonium sulphate,
67 mM Tris-hydrochloride, pH 8.8, 0.01% Tween-20.
Cycling parameters were as follows:
94°C 4 min 1 cycle
94°C 60s ]65°C 60s \ 5 cycles72°C 120s J
94°C 60s 158°C 60s \ 35 cycles72°C 120s J
5 fil of each sample was analysed on a 1% agarose gel and the successful reactions were
purified using the Wizard™ PCR Preps DNA Purification System (Promega).
26
Chapter 2 - Materials & Methods
Cloning of PCR products into Phagescript SK M13 vector
Purified PCR products were digested overnight at 37°C, in a total reaction volume of 50
ul, containing 10 U each of Notl and Sail (Boehringer Mannheim), 50 mM Tris-
hydrochloride, pH 7.5, 10 mM magnesium chloride, 1 mM DTT, 100 mM potassium
chloride, 0.01% BSA and 0.01% Triton X-100. 5ug of Phagescript SK M13 plasmid
(Stratagene) was similarly digested for 2 hours in a 20 ul reaction volume. Digested
products were run on a 1% low melting point-agarose gel. Bands of the appropriate size
were then excised and eluted from the agarose using the same Wizard™ kit detailed in
the previous section.
Each ligation reaction contained the insert DNA, 0.2 ug of linearised vector, 5 U of T4
DNA ligase (MBI Fermentas, Lithuania), 40 mM Tris-hydrochloride, pH 7.8, 10 mM
magnesium chloride, 10 mM DTT and 0.5 mM ATP in a 20 ul reaction volume. Ideally
the DNA insert to vector ratio was 3:1. Tubes were incubated overnight at 16°C. A "no
DNA" control was always included. In some cases, several ligations were performed for
each sample, containing different amounts of DNA, eg. 1 ul, 5 ul or 15 ul, in order to
produce an appropriate density of plaques following transformation into bacteria.
Preparation of fresh competent E. coli for transformations
An LB-tetracycline agar plate was streaked from a frozen bacterial glycerol stock of
XLl-Blue MRF (Stratagene) and left to grow at 37°C overnight. The following day a few
bacterial colonies were lifted from the plate and cultured in 50 ml of SOB to an optical
density of 0.3-0.4 at 550 nm. 45 ml of the culture was then transferred to an ice-cold 50
ml Falcon® tube, whilst the remaining bacterial culture was given fresh nutrient broth and
left at 37°C to continue growing. The chilled bacteria were pelleted in a bench-top
centrifuge and resuspended very gently in 15 ml transformation buffer (10 mM MES, pH
27

Chapter 2 - Materials & Methods
6.3, 45 mM manganese chloride, 10 mM calcium chloride, 100 mM potassium chloride, 3
mM hexamminecobalt chloride). The cells were left on ice for 10', then pelleted once
again and resuspended in 3.6 ml transformation buffer. The following were added at 10
minute intervals to the suspension, swirling gently to mix: 140 ul of top-grade DMSO,
followed by 140 ul 2.2 M DTT in 10 mM potassium acetate, then a further addition of
140 u.1 DMSO. Cells were thus rendered transformation competent, and used
immediately.
200 ul aliquots of competent cells were dispensed into chilled, sterile 15 ml
polypropylene tubes (Falcon® 2059, 17 mm x 100 mm, Becton Dickinson Labware)
containing 2-10 ul of ligated DNA product (amount of DNA did not exceed 10 ng) and
left on ice for 40 min. The cells were then heat-shocked for 2 min at 42°C and replaced
on ice. Meanwhile, a topping mixture was prepared containing 2 ml of XLl-Blue MRF
bacteria (from the remaining culture kept back earlier), 1 ml of 2% X-Gal and 0.5 ml of
2% IPTG, in 35 ml of molten (~ 40°C) SOB soft agar. Roughly 4 ml of this mixture was
added to each sample and poured immediately onto a small 2xYT agar plate. Once set,
the plates were inverted and incubated overnight at 37°C. Successful transformants which
contained DNA inserts formed clear plaques instead of blue ones.
Preparation of single stranded templates for sequencing
An overnight standing culture of XLl-Blue MRF bacteria was prepared in 5-10 ml 2xYT
broth. The following day the culture was diluted 1:100 with 2xYT broth and dispensed in
1.5 ml aliquots into universal tubes. Clear plaques were picked from the transformation
plates with white pipette tips and used to innoculate the medium in each universal tube.
These were left shaking at 37°C for 6 hours. The cultures were transferred to eppendorf
tubes in order to spin out the cells in a microfuge, keeping the supernatant. The single-
28

Chapter 2 - Materials & Methods
stranded DNA was then precipitated with 200 ul of 30% polyethylene glycol in 2.5 M
sodium chloride. The resultant DNA pellet was dissolved in 200 ul TE buffer, pH 8.0,
and subject to one round of phenol extraction followed by two rounds of chloroform
extraction. The purified DNA templates were then ethanol precipitated with 1/10 volume
of 3M sodium acetate and 6 volumes of 100% ethanol, washed in 70% ethanol, and
finally redissolved in 7 ul sterile distilled water.
Sequencing reactions
All sequencing reactions were performed using reagents from a T7 Sequenase™ version
2.0 DNA sequencing kit (USB), following the manufacturer's supplied protocol for
chain-termination sequencing. 0.5 pmol of M13 -20 primer (5' GTAAAACGACGGCC
AGT 3') was annealed to each DNA template by heating the mixture to 65°C for 2
minutes, in a 10 \\\ volume containing 40 mM Tris-hydrochloride, pH 7.5, 20 mM
magnesium chloride and 50 mM sodium chloride, and then allowing the tubes to cool
slowly on the bench. In the mean time, 2.5 ul of each termination mix (ddG, ddA, ddT
(fhand ddC) was dispensed into 96-well Falcon flexible assay plates; ie. four separate
reactions for every template sequenced. This plate was kept at 37°C in readiness for
termination reactions.
The specified radiolabelling mixture was prepared and 5.5 ul added to each DNA tube,
incorporating [a-35 S]dATP into each template in a 5 min reaction at room temperature.
The labelling reaction mixture was then divided between the four termination wells (3.5
ul per well), followed by a further incubation at 37°C for 5 min. All T7 DNA polymerase
activity was stopped by addition of 4 ul of stop solution to each well. The samples were
then separated by denaturing gel electrophoresis on 6% polyacrylamide gels and the
resultant products were visualised by autoradiography.
29
Chapter 2 - Materials & Methods
2.5. Double Stranded Sequencing of BV14 T Cell Receptors
cDNA was prepared from mRNA and purified in the same way as for single-stranded
sequencing. It was then used directly for PCR amplification.
PCR reactions
Primers to facilitate double-stranded sequencing were used. Otherwise all other
parameters remained unchanged from those detailed in the previous section.
C-region specific primer:
CTT CTG ATG GCT CAA ACA C
BV14-specific primer:
BV14 TCT CGA AAA GAG AAG AGG AAT
The reactions were analysed and purified as before.
Ligations and transformations using the pGEM-T Easy kit
Taq polymerase normally creates A-overhangs on the PCR products that enabled direct
blunt-ended ligation into the linearised pGEM-T Easy vector supplied with the kit
(Promega). 50 ng of linearised vector was mixed with a roughly equal molar quantity of
PCR product, 3 U of T4 DNA ligase, 30 mM Tris-hydrochloride, pH 7.8, 10 mM
magnesium chloride, 10 mM DTT and 5 mM ATP in a 10 ul reaction volume. Positive
(using control insert DNA supplied) and background control (no DNA) ligations were
also set up.
Ligation reactions were carried out at 4°C overnight, to optimise blunt-ended ligation.
The following day, 2 ul of each ligation reaction was incubated with 50 ul of freshly-
thawed, JM109 high efficiency competent E. coli, which were provided with the kit. Cells
were heat shocked for 45-50 s at 42°C, and then cultured in 1 ml SOC medium for 1.5 h,
at 37°C with shaking. Each transformation culture was plated on LB-ampicillin plates
30
Chapter 2 - Materials & Methods
which had been treated earlier with 100 ul of 0.1M IPTG and 20 ul of X-Gal to facilitate
blue/white selection. Successful transformations yielded white bacterial colonies.
Plasmid DNA minipreps
Bacterial colonies containing DNA inserts were picked and grown in 4 ml of LB-
ampicillin overnight with shaking at 37°C. Plasmid DNA was purified using a QIAprep
spin miniprep kit. Typical yield was 20 ug of DNA.
Sequencing
Automatic fluorescent sequencing was carried out by the Oxford University Biochemistry
Department DNA sequencing facility. 2.5 ul of miniprep product (approximately 1 jag
DNA) was used for each reaction. A TCRBC-specific primer was supplied (cbeta: TGT
GCA CCT CCT TCC CAT TCA CC) at 3.2 pmol/ul.
2.6. Synthetic Peptides
Peptides used in CTL assays, limiting dilution analyses and IFNy ELISpot assays (see
below) were synthesised at the laboratory in-house facility on an automated peptide
synthesiser (396 MPS, Advanced Chemtech) by conventional solid phase Fmoc
chemistry. These peptides were all analysed for purity by reverse phase HPLC. Stock
solutions were prepared in PBS at 1-5 mg/ml, sterile filtered with low protein-binding 0.2
um Millex-GV4 disposable microfilter units (Millipore) and stored in small aliquots at -
20°C.
For peptides containing tyrosine or tryptophan residues, the concentration of each stock
solution was determined by measuring their absorbance when diluted 1:50 in 6M
guanidine hydrochloride (Pierce). The molar concentration of peptide was calculated
31
Chapter 2 - Materials & Methods
from the extinction coefficients of tyrosine (ST>T = 1470) at 275.5 nm or tryptophan (eTrp =
5690) at 280 nm by applying the following formulae [Edelhoch, 1967]:
[Ctyrosine] = OD2 76 /
[Ctryptophan] = OD280 /
Concentrations of peptides that did not contain either tyrosine or tryptophan residues
were estimated from the peak area on the HPLC trace, compared with known standards.
Larger preparations of synthetic peptides, for use in making MHC-peptide tetrameric
complexes (see below), were obtained from either of two commercial suppliers, Alta
Bioscience, UK and Genosys Biotechnologies Inc., USA.
2.7. Limiting Dilution Analysis
Preparation of mononuclear feeder cells
This method was modified from one described by Steven et al [1996]. Three buffy coat
layers from different individuals were obtained from the Blood Transfusion Service
(Bristol, UK). Mononuclear cells were isolated as from whole blood, using Lymphoprep
density gradient centrifugation. The recovered cells were PHA-blasted (~5 M-g/ml final
concentration) for one hour in RIO, then washed thoroughly and pooled. Feeder cells
were y-irradiated before being added to assay cultures.
Setting up assay cultures (Day 0)
Freshly isolated donor PBMC were split to provide 5-10 x 105 cells as stimulator APCs
and 3.1 x 10⁶ as responders. Stimulator cells were peptide-pulsed (5 uM final) and PHA-
blasted for 1 h at 37°C, then washed and y-irradiated.
Responder cells were plated out in a range of dilutions, from 40,000 to 2,000 cells per
well in 96-well round bottom plates (24 replicates/input no.). In addition, 0.5-1 x 10⁴
32
Chapter 2 - Materials & Methods
stimulators and 5 x 10⁴ feeders were also added to each well in a total volume of 100 \JL\.
RIO medium supplemented with 10 U/ml Lymphocult-T (Biotest AG, Germany) and 25
U/ml rIL-2 (kind gift of Cetus Corp.) was used to sustain the cultures. 40 u,l of fresh
medium was added to each well every 3-4 days, to bring the total culture volume to 220
|j,l at the end of the 14-day period.
51 Cr-release cytotoxicity assay (Day 14)
Epitope-specific responder frequencies were assayed by measuring CTL-mediated
cytotoxicity against 51 Cr-labelled peptide-pulsed and unpulsed target cells. Autologous or
matched B-LCLs or autologous PHA blasts were used as targets in assays for EBV lytic
epitopes and T2 transfectant cells for latent EBV epitopes. The culture plates containing
the effector cells were first split two ways; one set each for peptide-pulsed or unpulsed
targets. Several million target cells were labelled with 150 u.Ci [ 51 Cr] sodium chromate in
100 ul of assay medium (RPMI with 5% PCS), at 37°C for 1 hour. Half of these were
additionally incubated with 5 u,g of the cognate peptide. Target cells were then washed 4
times to remove free chromium, and dispensed in 100 ul volumes into each assay well, at
3 x 10³ cells/well. Maximum and spontaneous release was calculated from two additional
sets of 24 target wells, incubated with only 100 ul of 5% Triton X-100 or medium,
respectively. The assay plates were incubated at 37°C for 4-5 hours, after which 20 ul of
the supernatant was removed from each well, and spotted onto filtermats (Wallac Oy,
Finland). 51 Cr was quantified using a 1205 Betaplate® liquid scintillation counter
(Wallac) and specific lysis calculated according to the following formula:
(experimental release - medium release)Specific lysis = ——————————————————————— x 100%
(maximum release - medium release)
33

Chapter 2 - Materials & Methods
For the purpose of statistical analysis, wells were scored as positive if specific lysis
exceeded 10%. The CTL precursor frequency was estimated, assuming Poisson
distribution and single hit kinetics [Taswell, 1981], using the method of maximum
likelihood [Fazekas de St. Groth, 1982] and j^ analysis to determine a linear regression
curve. Frequency values were estimated at which 37% of the wells were negative for
epitope recognition.
2.8. IFNY Enzyme Linked Immunospot (ELISpot) Assays
This method was originally described by Lalvani et al [1997]. 96-well plates backed with
polyvinylidene difluoride (Millipore) were pre-coated with 15u.g/ml of an IFNy specific
monoclonal antibody, 1-DIK (Mabtech, Sweden). Sample wells were then washed six
times with PBS and blocked with 200 ul of RIO medium. Freshly isolated PBMCs were
seeded in duplicate wells, usually at 2.5 x 10 5 , 1.25 x 10⁵ and 6.25 x 10⁴ cells/well, in the
presence of 2 uM peptide representing known minimal CTL epitopes. The plates were
left undisturbed, overnight at 37°C, 5% CO2 .
On the following day the cells were discarded and the wells washed as before. A second
biotin-conjugated anti-IFNy mAb, 7-B6-1 biotin (Mabtech), was added to the wells at 1
iig/ml, and the plates incubated for 3 hours at room temperature, followed by
streptavidin-conjugated alkaline phosphatase (Mabtech) for a further 2 hours. The sample
wells were washed throughly before proceeding with the colour development step.
A 30-minute reaction with 5-bromo-4-chloro-3-indolyl phosphate (BCIP) and nitroblue
tetrazolium (NBT) using an alkaline phosphatase conjugate substrate kit (Bio-Rad
Laboratories) resulted in the appearance of dark spots representing individual IFNy
producing CD8+ T cells. The colour development reaction was terminated by washing the
34

Chapter 2 - Materials & Methods
plates under running tap water. The spots were counted under a dissection microscope
after leaving the plates to dry.
The number of specific T cell responders was calculated after subtracting values obtained
from control wells that did not contain any peptide. Furthermore, results were not
considered significant unless they were at least twice that of negative control values and
greater than 10/106 cells.
2.9. Synthesis of Class I MHC-Peptide Tetrameric Complexes
Recombinant protein expression and inclusion body purification
This method was developed by Altman et al [1996]. HLA-A2 and HLA-B8 expression
constructs were made, encoding the extracellular domains of class I heavy chain protein,
and modified at the C-terminus to include a substrate sequence for BirA biotinylation.
were The constructs were cloned into the expression vector pGMT7 (a pET derivative)
[Studier et al, 1990], transformed into BL21(DE3)pLysS Escherichia coli cells
(Novagen) and used for expression of soluble HLA-A2 or HLA-B8 heavy chain protein.
Soluble {32m protein was produced in a similar fashion, form the vector pHNl-p2m.
(Transformed bacterial cells expressing HLA-A2 heavy chain protein were a gift from Dr
V. Cerundolo. Cells expressing HLA-B8 heavy chain or p2m proteins were generously
provided by Dr C. A. O'Callaghan.)
An LB-ampicillin/chloramphenicol plate was streaked from the relevant frozen glycerol
stock or freshly transformed bacteria and left to grow overnight at 37°C. A single
bacterial colony was picked with a sterile innoculating loop and resuspended in 10 ml of
low salt LB-amp in a clean flask. The culture was incubated with shaking (-240 rpm) at
37°C for 6-9 hours. This was then added to 500 ml of LB-amp and left standing
overnight. The following day the overnight bacterial culture was used to innoculate 6
35
Chapter 2 - Materials & Methods
litres of LB-amp. These were grown up to mid-log phase (OD6oo = 0.3-0.4) over 3-4
hours before protein expression was induced by addition of 0.5 ml of 1M IPTG to each
flask. The cultures were left for a further 5 h at 37°C with shaking, after which the cells
were harvested by centrifugation and the supernatant discarded.
The bacterial cell pellet was resuspended in ice-cold PBS and sonicated (XL series
sonicator; Misonix Inc., USA) in a small glass beaker on ice in order to lyse the cells and
release the protein inclusion bodies. Once the cells were completely lysed the inclusion
bodies were spun down in 35-ml polycarbonate tubes in a Beckman ultracentrifuge (J2
series) at 15,000 rpm for 10 min. The inclusion bodies were then washed three times in
chilled Triton wash buffer (0.5% Triton X-100, 50 mM Tris, pH 8.0, 100 mM sodium
chloride, 0.1% sodium azide and freshly added 2 mM DTT), using a hand-held glass
homogeniser to resuspend the pellet after each wash. This was followed by a final wash
in detergent-free wash buffer.
The resultant purified protein preparation was solubilised in 20-50 ml of 8M urea buffer,
containing 50 mM MES, pH 6.5, 0.1 mM EDTA and 1 mM DTT, and left on an end-over-
end rotator overnight at 4°C. Insoluble particles were removed by centrifugation before
the solubilised protein was dispensed in aliquots and stored at -70°C for future use. The
protein yield was determined using a Coomassie dye-binding protein assay reagent (Bio-
Rad Laboratories) and by comparison with known standards. The quality of expression
and purification was also verified by running samples on a 15% SDS-polyacrylamide gel.
Refolding soluble class I MHC-peptide complexes
A litre flask containing 500 ml of refolding buffer (100 mM Tris, pH 8.0, 400 mM L-
arginine hydrochloride, 2 mM EDTA, 5 mM reduced glutathione and 0.5 mM oxidised
glutathione) was freshly prepared and chilled, with stirring, at 4°C. The components of
36
Chapter 2 - Materials & Methods
the class I MHC protein complex were added in the following order: peptide, p2m, and
class I heavy chain. Approximately 10 mg of synthetic peptide, 25 mg of p2m and 30 mg
of heavy chain were required for each refold. Lyophilised peptide was dissolved in 0.5 ml
of DMSO and added directly to the refold buffer. The urea-solubilised fcm and heavy
chain proteins (prepared in the previous section) were thawed out and used immediately
to avoid oxidation of cysteine residues. These were injected with a syringe into the
refolding mixture through a #25 needle, as near as possible to the vigorously rotating
magnetic stir bar; this was to ensure rapid and efficient dilution. The amount of heavy
chain protein to be added was divided into several separate dilutions (eg. two or three
additions over 24 hours), which resulted in higher yields of folded complex. The mixture
was left continuously stirring at 4°C for 40-60 hours.
Site-specific biotinylation of MHC-peptide complexes
The refolding mixture by centrifuged and filtered to remove protein precipitates, then
concentrated down to less than 10 ml by ultrafiltration, using a large pressurised stirred
cell (Amicon, Millipore) and then Centripreps® (Amicon, Millipore) (MW cutoff:
10,000). The protein was then buffer-exchanged into BirA reaction buffer (20 mM Tris,
pH 7.5, 25 mM sodium chloride and 7.5 mM magnesium chloride), using disposable PD-
10 gel filtration columns (Pharmacia Biotech). Recombinant BirA enzyme (10 uM final
concentration, kind gift of Dr CA O'Callaghan) was added, in the presence of 10 mM
ATP, pH 7.0, and 0.5 mM biotin, to facilitate incorporation of biotin at the enzyme
recognition sequence on the C-terminus of the heavy chain protein. A selection of
protease inhibitors was also added to preserve the proteins: 0.2 mM PMSF, 2 |ig/ml
pepstatin and 2 |J,g/ml leupeptin. The reaction was left overnight at room temperature.
37

Chapter 2 - Materials & Methods
Folded, biotinylated MHC-peptide complexes were recovered by FPLC size-exclusion
gel filtration on a Superdex 75 column (Pharmacia Biotech), using 20 mM Tris, pH 8.0,
50 mM sodium chloride buffer. The protein was further purified by anion-exchange
chromatography using a BioCAD®"SPRINT™ perfusion chromatography system
(PerSeptive Biosystems Inc., USA) over a 0-500 mM sodium chloride gradient.
Biotinylation was verified by direct blotting of the purified protein onto a piece of
nitrocellulose membrane, using a commercial biotinylated antibody as a positive control.
The membrane was then stained with ExtrAvidin®-horseradish peroxidase (Sigma). The
presence of biotinylated protein on the membrane was detected using chemiluminescent
reagents supplied in an ECL kit (Amersham, UK).
Preparation of fluorescent-labelled tetrameric complexes
The amount of biotinylated protein was quantified using the same Bio-Rad protein assay
reagent as before. Phycoerythrin-labelled streptavidin (Sigma) was added in small doses,
always maintaining a fourfold molar excess of MHC protein (since streptavidin has four
biotin binding sites). The resultant tetrameric complexes could be stored for over a year
in light-shielded containers at 4 °C.
Table 2.1. List of MHC-peptide tetrameric complexes used
Name MHC molecule Peptide Epitope
A2/GLC HLA-A2 GLCTLVAML EBVBMLF1 280-288
A2/FluMa HLA-A2 GILGFVFTL Influenza matrix 58-66
Al 1/IVT6 HLA-A11 IVTDFSVIK EBV EBNA3B 416-424
B8/FLR HLA-B8 FLRGRAYGL EBVEBNA3 A 325-333
B8/RAK HLA-B8 RAKFKQLL EBVBZLF1 190-197
a gift ofDr V Cerundolo; b gift ofDr P Hansasuta
38

Chapter 2 - Materials & Methods
2.10. Flow Cvtometrv
Cell staining with directly-conjugated monoclonal antibodies or tetrameric
complexes
PBMC or SFMC (either fresh or thawed from frozen) were washed and resuspended in a
small volume of FACSwash (0.1% sodium azide, 0.16% BSA in PBS). Where required
the cells were blocked in 10% pooled human serum for 10-15 min on ice. They were then
divided into sample tubes containing at least 2 x 10⁵ cells each, although larger numbers
of cells were required for tetramer staining (up to 106 per sample). About 0.1-0.5 pig
(usually a couple of microlitres) of each mAb (or tetramer) directly conjugated to FITC,
PE or Tricolor was added to each sample, in 50 ul of FACSwash, and the samples
incubated for 30 min on ice, in the dark. The cells were then washed twice and fixed in
FACSfix (1% FCS, 2.5% formaldehyde in PBS).
Multicolour cell staining with unconjugated monoclonal antibodies
PBMC or SFMC were prepared as before and divided into sample tubes. Cells were first
resuspended with the primary unconjugated (mouse) antibody and incubated for 30 min
at 4°C. Samples were then washed and stained with a PE- or FITC-labelled secondary
(anti-mouse Ig) antibody. The samples were washed again and any directly-conjugated
antibodies or tetrameric complexes were added at this stage, in the presence of 1% serum
(mouse) matching the specificity of the secondary antibody. Cells were incubated as
before and then finally washed and fixed.
Intracellular staining with the Ki67 marker
Samples were first stained with any mAb specific for extracellular epitopes, as described
above. They were then washed in FACSwash and fixed in 4% paraformaldehyde for 20
min on ice. This was followed by two washes and resuspension in permeabilisation buffer
39
Chapter 2 - Materials & Methods
(0.1% saponin, 1% PCS, 0.1% sodium azide in PBS). FITC-conjugated Ki67 (DAKO,
Denmark) [Gerdes et al, 1984] was added to the samples, diluted in permeabilisation
buffer, and left for 30 minutes. The samples were washed twice again in permeabilisation
buffer, then in FACSwash and finally fixed in FACSfix.
FACS data acquisition & analysis
Samples were analysed on a Becton Dickinson FACScan instrument using CellQuest
software (Becton Dickinson). In all cases the lymphocyte population was gated by
forward and side angle scatter. Markers were set to allow analysis of the CD8hl (and
CD3 +) subset of T lymphocytes.
2.11. Antibodies and Sources
Antibodies specific for human leukocyte cell surface differentiation markers
FITC conjugated; anti-CD3 (UCHT1)
CD25 (Act-1)
CD28 (CD28.2)
CD38 (AT 13/5)
CD45RA(ALB11)CD45RO (UCHL1)
CD57 (Leu-7)CD62L (DREG-56)
CD69 (FN50)
HLA-DR, DQ, DP (CR3/43)
PE conjugated; anti-CD4(MT310)
CD 19 (HD37)
Tricolor conjugated; anti-CD4 (S3.5) Tricolor
DAKO
DAKO
Immunotech, France
DAKO
ImmunotechDAKO
Becton DickinsonPharMingen
DAKO
DAKO
DAKO
DAKO
Caltag Laboratories, USA
40
Chapter 2 - Materials & Methods
CDS (3B5) Tricolor
Unconjugated; anti-
CxCR3(49801.111)
CxCR4(12G5)
CCR2 (48607.121)
CCR3(LS637B11)
CCR5 (45549.Ill)
LFA-1 (aCDlla, DF1524)
VLA-4 (2B4)
integrin (ActI)
Caltag
R&D Systems, UK
R&D Systems
R&D Systems
gift of Leukosite
R&D Systems
Sigma
R&D Systems
gift of Leukosite
Anti-human TCR variable (3 chain (BV) specific mAbs
777/5 antibody panel formed part of the TCR monoclonal antibody workshop. [Posnett et
al, 1996]
BV1 (BL37.2)
BV2 (MPB2)
BV3 (JOVI-3)
BV5.2/5.3(1C1)
BV6.7 (QT145)
BV7.1 (3G5)
BV8 (JR2)
BV9(MKB1P2-10)
BV11 (C21)
BV12(S511)
Other monoclonal antibodies
Secondary antibodies:
rabbit anti-mouse Ig FITC
rabbit anti-mouse Ig PE
BV13.1 (H131)
BV13.2(H132)
BV13.6(JU74.3)
BV14(CAS1.1.3)
BV16(Tamayal.2)
BV17(E17.5)
BV18(BA62.6)
BV20(ELL1.4)
BV21.3 (IM1347)
BV22 (IMMU546)
DAKO
DAKO
Antibodies against MHC molecules:W6/32 (folded class IHLA specific) gift of Dr J Haurum [Parham & Brodsky, 1981]
BB7.2 (HLA-A2 specific) gift of Dr J Haurum [Barnstable et a/, 1978]
41
CHAPTER 3
Molecular Analysis of Nucleotide Bias during VDJ Recombination in T Lymphocyte (3 Chains
Recognition of antigen by ap T lymphocytes is mediated by interaction of the TCR
with foreign peptides bound to class I MHC. Structural alignments with
immunoglobulin (Ig) [Chothia et al, 1988] as well as recent TCR crystal structures
[Garcia et al, 1996; Garboczi et al, 1996] have indicated that the third complementarity-
determining (CDR3) loops play a major role in contacting the peptide antigen that lies
within the MHC antigen binding groove. This loop corresponds to the hyperviable region
of the TCR P chain due to the junctional diversity created during V(D)J recombination.
As a result, the events that influence variability in the CDR3 region have a profound
effect on the fine specificity of peptide recognition by T lymphocytes.
As with antibody immunoglobulin proteins, each functional T cell receptor is produced
by site-specific recombination of variable (V), joining (J) and constant (C) region gene
segments. T cell p chains also include additional diversity (D) gene segments.
[Tonegawa, 1983; Davis & Bjorkman, 1988]. During maturation of T cells in the thymus,
the TCR gene segments are rearranged in a defined order, resulting in the formation of
functional TCR a and p exons in which V, D, and J segments are in close proximity to
one another. This process of somatic rearrangement is a prerequisite to TCR gene
expression and is important for the generation of TCR diversity. Recombination signal
sequences, which consist of a palindromic heptamer and an A/T-rich nonamer, separated
42

Chapter 3 - VDJ Recombination in T Lymphocytes
by a spacer of 12 or 23 base pairs, direct the rearrangement process. A mature mRNA is
produced by splicing to bring V(D)J and C segments together and allows expression of
the a and (3 chain proteins.
Potential for diversity of the TCR is estimated to be greater than that for Ig, largely
because of greater potential for junctional diversity, particularly within the f> chain. A
striking concentration of sequence polymorphism is located in the CDR3 region, which is
responsible for contacting peptide antigen. In addition to combinatorial diversity created
from recombination of multiple genes, junctional diversity at coding junctions of VJ, VD
and DJ also contributes significantly to formation of the TCR repertoire. Imprecise
joining of V-DJ and V-J and translation of D region sequences in all three reading frames
is commonly found, in addition to frequent deletion and addition of nontemplated
nucleotides at coding junctions. Deletions are thought to result from exonuclease nibbling
of the free terminal nucleotides prior to ligation with adjacent gene segments. Random
addition of (N) nucleotides to free ends is associated with terminal deoxynucleotidyl
transferase (TdT) activity. It is also believed that insertion of non-random P (palindromic)
nucleotides occurs, which are inversely complementary to the coding ends from which
they are derived (see Figure 3.1.). Thus V(D)J recombination enables an extremely
diverse T cell repertoire to be generated. Estimates of the potential size of the unselected
immature T cell repertoire range from 10 10 to 10 15 specificities [Davis & Bjorkman,
1988].
43
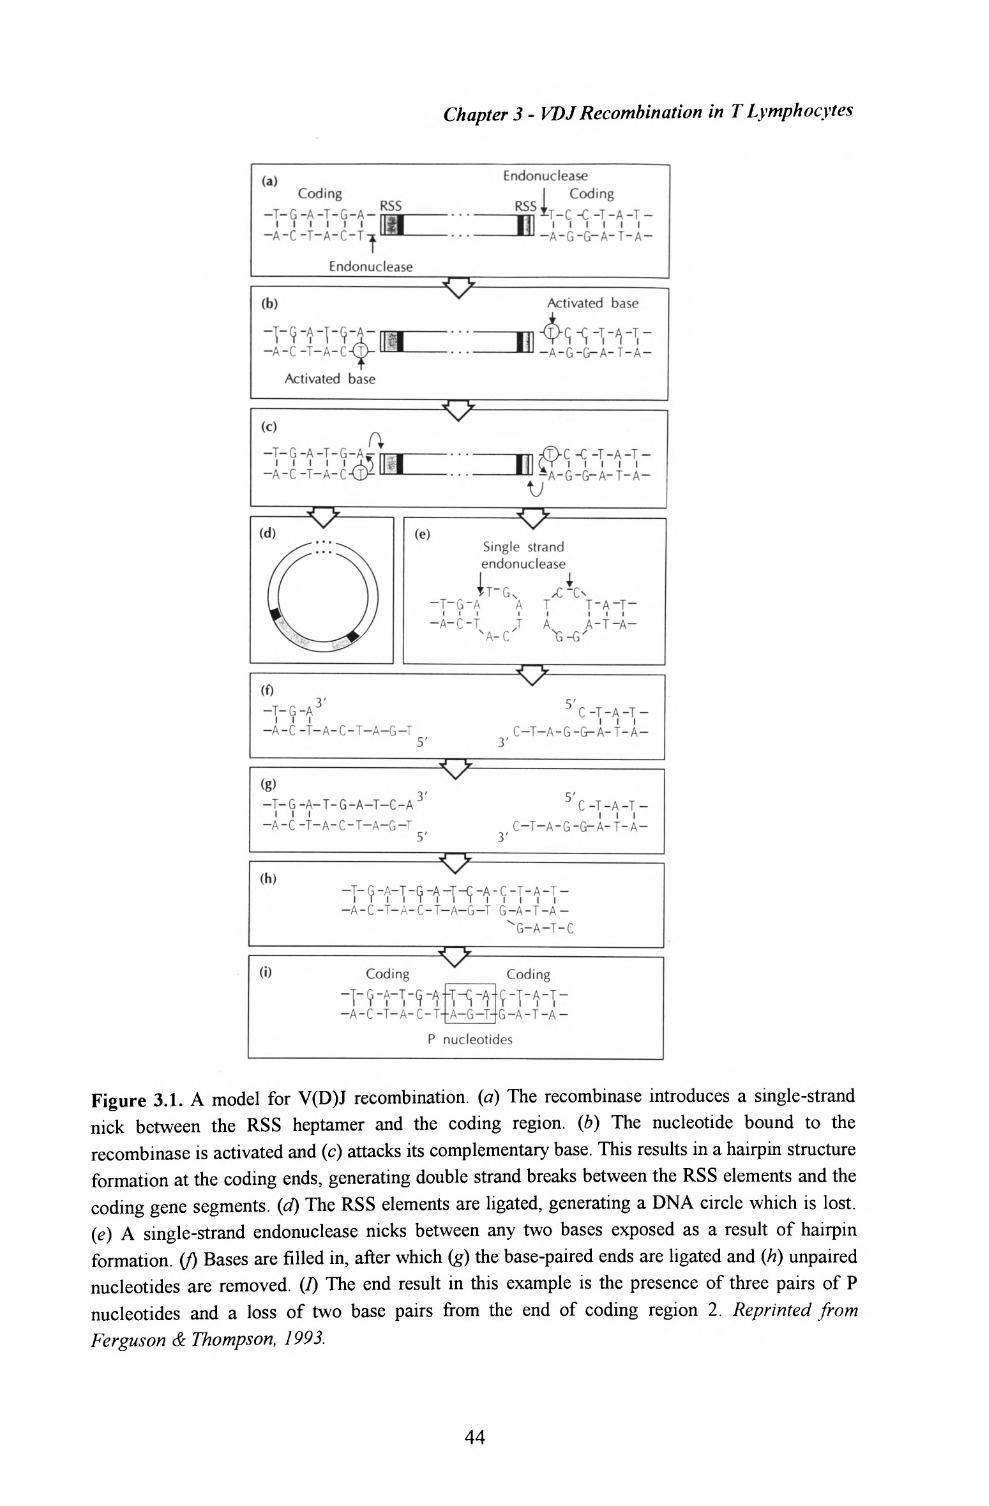
Chapters- VDJRecombination in TLymphocytes
/ »Coding
-T-G-A-T-G-A- i i i i i i-A-C-T-A-C-T-z
RSS
111
EndonucleaseI Coding
E C -C -T -A -T - i i i i i i-A-G-G-A-T-A-
Endonuclease
(b)^
-A-C-T-A-C-Cl
Activated base
Activated base
-A-G-G-A-T-A-
a—T-G-A-T-G-Ac- i i i i i-A-C-T-A-C s. ;(T>C-C-T-A-T-
£r i i i i i-A-G-G-A-T-A-
(e,Single strand endonuclease
TT- ~-T-G-A Aii< i
-A-C-T J -A-C
Ti
A
T-A-TillA-T-A
.T-G-A 3A-C-T-A-C-T-A-G-T 5' 3'
5 C-T-A-T C-T-A-G-G-A-T-A
T-G-A-T-G-A-T-C-A iiiA-C-T-A-C-T-A-G-T
,3
5' 3'
5 C-T-A-T illOT-A-G-G-A-T-A
-T-G-A-T-G-A-T-C-A-C-T-A-T- 1 T T 1 1 T 1 1 1 1 1-A-C-T-A-C-T-A-G-T G-A-T-A-
(i)
-A-C-T-A-C-T--A-G-T-'G-A-T-A-
P nucleotides
Figure 3.1. A model for V(D)J recombination, (a) The recombinase introduces a single-strand nick between the RSS heptamer and the coding region, (b) The nucleotide bound to the recombinase is activated and (c) attacks its complementary base. This results in a hairpin structure formation at the coding ends, generating double strand breaks between the RSS elements and the coding gene segments, (d) The RSS elements are ligated, generating a DNA circle which is lost. (e) A single-strand endonuclease nicks between any two bases exposed as a result of hairpin formation. (/) Bases are filled in, after which (g) the base-paired ends are ligated and (h) unpaired nucleotides are removed. (I) The end result in this example is the presence of three pairs of P nucleotides and a loss of two base pairs from the end of coding region 2. Reprinted from Ferguson & Thompson, 1993.
44

Chapter 3 - VDJ Recombination in T Lymphocytes
Individual TCRBV gene segments may influence the generation of diversity during VDJ
recombination. For example, through preferential selection of particular D or J gene
segments. Furthermore, in experiments with synthetic plasmid substrates, the sequence of
flanking coding regions has been shown to have some effect on differential processing of
recombination products [Boubnov et al, 1993]. This implies that a particular TCRBV
gene can impose restrictions on the potential diversity of the primary T cell repertoire and
has important repercussions on the fine specificity of peptide recognition.
The influence of TCRBV gene segment 3' terminal sequences on the creation of
junctional diversity has not been addressed in a normal unstimulated human repertoire. In
this study a large number of unique sequences were sequenced from a limited selection of
TCRBV segments that had different terminal sequences, in order to find evidence for
skewing of junctional diversity during CDR3 formation. I looked at bias in selection of
particular J regions by V genes, also extent of nucleotide deletion, and evidence for P
addition.
3.1. Sequencing the CDR3 regions of TCR p chains
Five representative TCRBV genes were selected in order to compare their influence on
the generation of junctional diversity during TCR VDJ recombination. These were
chosen on the basis of sequence variation and nucleotide base composition of the 3'
terminal nucleotides in their germline sequences, as shown in Table 3.1. The major
difference between each BV gene was in the last six nucleotides flanking the
recombination signal sequence. Furthermore, BV7S1 and BV6S3 were relatively G/C
rich in comparison to the other sequences.
45
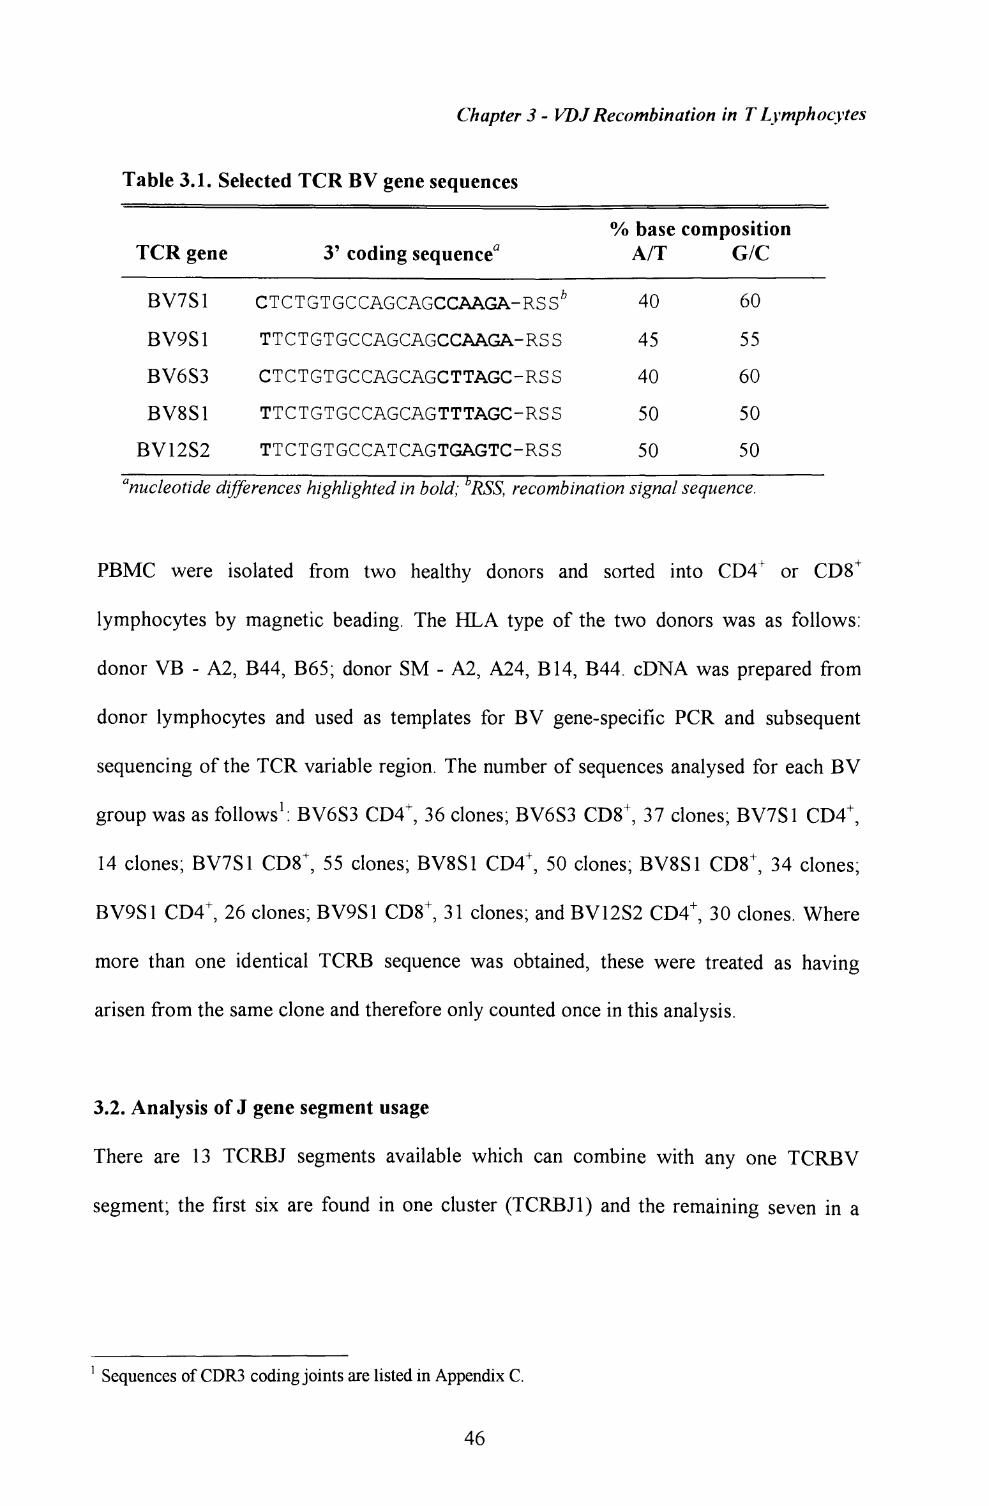
Chapter 3 - VDJ Recombination in T Lymphocytes
Table 3.1. Selected TCR BV gene sequences
TCR gene
BV7S1
BV9S1
BV6S3
BV8S1
BV12S2
3' coding sequence0
CTCTGTGCCAGCAGCCAAGA-RSS^
TTCTGTGCCAGCAGCCAAGA-RSS
CTCTGTGCCAGCAGCTTAGC-RSS
TTCTGTGCCAGCAGTTTAGC-RSS
TTCTGTGCCATCAGTGAGTC-RSS
% base compositionA/T G/C
40
45
40
50
50
60
55
60
50
50
anucleotide differences highlighted in bold; RSS, recombination signal sequence.
PBMC were isolated from two healthy donors and sorted into CD4+ or CD8+
lymphocytes by magnetic beading. The HLA type of the two donors was as follows:
donor VB - A2, B44, B65; donor SM - A2, A24, B14, B44. cDNA was prepared from
donor lymphocytes and used as templates for BV gene-specific PCR and subsequent
sequencing of the TCR variable region. The number of sequences analysed for each BV
group was as follows 1 : BV6S3 CD4+, 36 clones; BV6S3 CD8+ , 37 clones; BV7S1 CD4+ ,
14 clones; BV7S1 CD8+ , 55 clones; BV8S1 CD4+ , 50 clones; BV8S1 CD8+ , 34 clones;
BV9S1 CD4+ , 26 clones; BV9S1 CD8+ , 31 clones; and BV12S2 CD4+, 30 clones. Where
more than one identical TCRB sequence was obtained, these were treated as having
arisen from the same clone and therefore only counted once in this analysis.
3.2. Analysis of J gene segment usage
There are 13 TCRBJ segments available which can combine with any one TCRBV
segment; the first six are found in one cluster (TCRBJ1) and the remaining seven in a
Sequences of CDR3 coding joints are listed in Appendix C.
46

Chapter 3 - VDJ Recombination in T Lymphocytes
(a)20% -r
15% - <u 8*10%<A3
5%
0% ILJxiJLL1.1 1.2 1.3 1.4 1.5 1.6 2.1 22 2.3 2.4 2.5 2.6 2.7
TCRBJ genes
(e) 30%
20% -D)«
10%
0% Illlllll-l I1.1 1.2 1.3 1.4 1.5 1.6 2.1 2.2 2.3 2.4 2.5 2.6 2.7
TCRBJ genes
(b) 25% y
20%
0) 15%w" 10%
5%
0%
(f) 20%
111 •••II I •••I ^ I ™ I ^ I ™ I ^ I I ^ I ^ I ^ I
15%<u« w
5%
0% • •III I I -I ™ I ™ I ™ I1.1 1.2 1.3 1.4 1.5 1.6 2.1 2.2 2.3 2.4 2.5 2.6 2.7
TCRBJ genes1.1 1.2 1.3 1.4 1.5 1.6 2.1 2.2 2.3 2.4 2.5 2.6 2.7
TCRBJ genes
(c) 20% T
15% + 0)8*10% 4 v>3
5% +
0% -L»41.1 1.2 1.3 1.4 1.5 1.6 2.1 2.2 2.3 2.4 2.5 2.6 2.7
TCRBJ genes
(g) 30%
o 20%O)n(A3 10%
0% 1 I • I III1.1 1.2 1.3 1.4 1.5 1.6 2.1 2.2 2.3 2.4 2.5 2.6 2.7
TCRBJ genes
(d) 30% T
0) D) W (A
20% -
(h) 30% T
10% - I _
0% --U- 111<u 20% 'D)re(A3 10%
0% LJ 1 • II1.1 1.2 1.3 1.4 1.5 1.6 2.1 2.2 2.3 2.4 2.5 2.6 2.7
TCRBJ genes1.1 1.2 1.3 1.4 1.5 1.6 2.1 2.2 2.3 2.4 2.5 26 2.7
TCRBJ genes
Figure 3.2. Selection of TCRBJ gene segments in each group of TCRBV sequences, (d) overall usage, compared to (b) the CD4 population and (c) CDS population. Preferences are shown for individual groups of (d) BV6S3, (e) BV7S1, (/) BV8S1, (g) BV9S1 and (h) BV12S2 sequences.
47

Chapter 3 - VDJRecombination in T Lymphocytes
second cluster (TCRBJ2) [Toyonaga et al, 1985]. Segments from the TCRBJ2 cluster
were more commonly found in sequences overall (37.1% vs. 62.9%), and also in CD4-
(32.7% vs. 67.3%) or CDS-sorted (41.4% vs. 58.6%) populations. In addition, certain
individual J gene segments were more widely used than others. Thus 58.5% of all
sequences expressed BJ1S1, BJ1S2, BJ2S1 or BJ2S7, whilst BJ1S3, BJ1S4, BJ2S4 and
BJ2S6 occurred rarely (Fig 3.2.a). This bias in J segment usage was similarly maintained
in the CD4 population, but was less marked among the CDS sequences (Fig 3.2.b and c),
which also included common use of BJ2S3 and BJ2S5. There were some differences
within each group of TCRBV sequences. In particular, the preference for the BJ2 cluster
was reversed amongst BV7S1 sequences; instead almost 60% of sequences utilised BJ1
gene segments (Fig 3.2.e). Also, pairing of BV9S1 to BJ1S1 appeared to be
unfavourable, contrary to the general trend (Figure 3.2.g).
3.3. Analysis of nucleotide nibbling from TCRBV 3' termini in coding joints
During recombination nucleotides are often deleted or "nibbled" from coding ends by
exonucleases. Sequences were analysed to see whether the extent of nucleotide loss
differed significantly between TCRBV groups. Consistent with an earlier report [Callan
et al, 1995], the 3' germline-encoded nucleotides were found to be significantly well-
preserved in the coding joints of BV7S1 sequences (Willcoxon test, P < 0.001) compared
to other sequences. The mean value of terminal nucleotides lost was 2.2 nt in BV7S1
sequences; furthermore, in 31.9% of sequences the V segment remained intact after
recombination (Table 3.2.). BV9S1 sequences, which shared identical termini to BV7S1
were also relatively less nibbled, although this comparison was less significant (P =
0.052). By comparison, the other sequences showed greater amounts of nucleotide
deletion, as summarised in Table 3.2 and Figure 3.3. The highest number of nucleotides
48
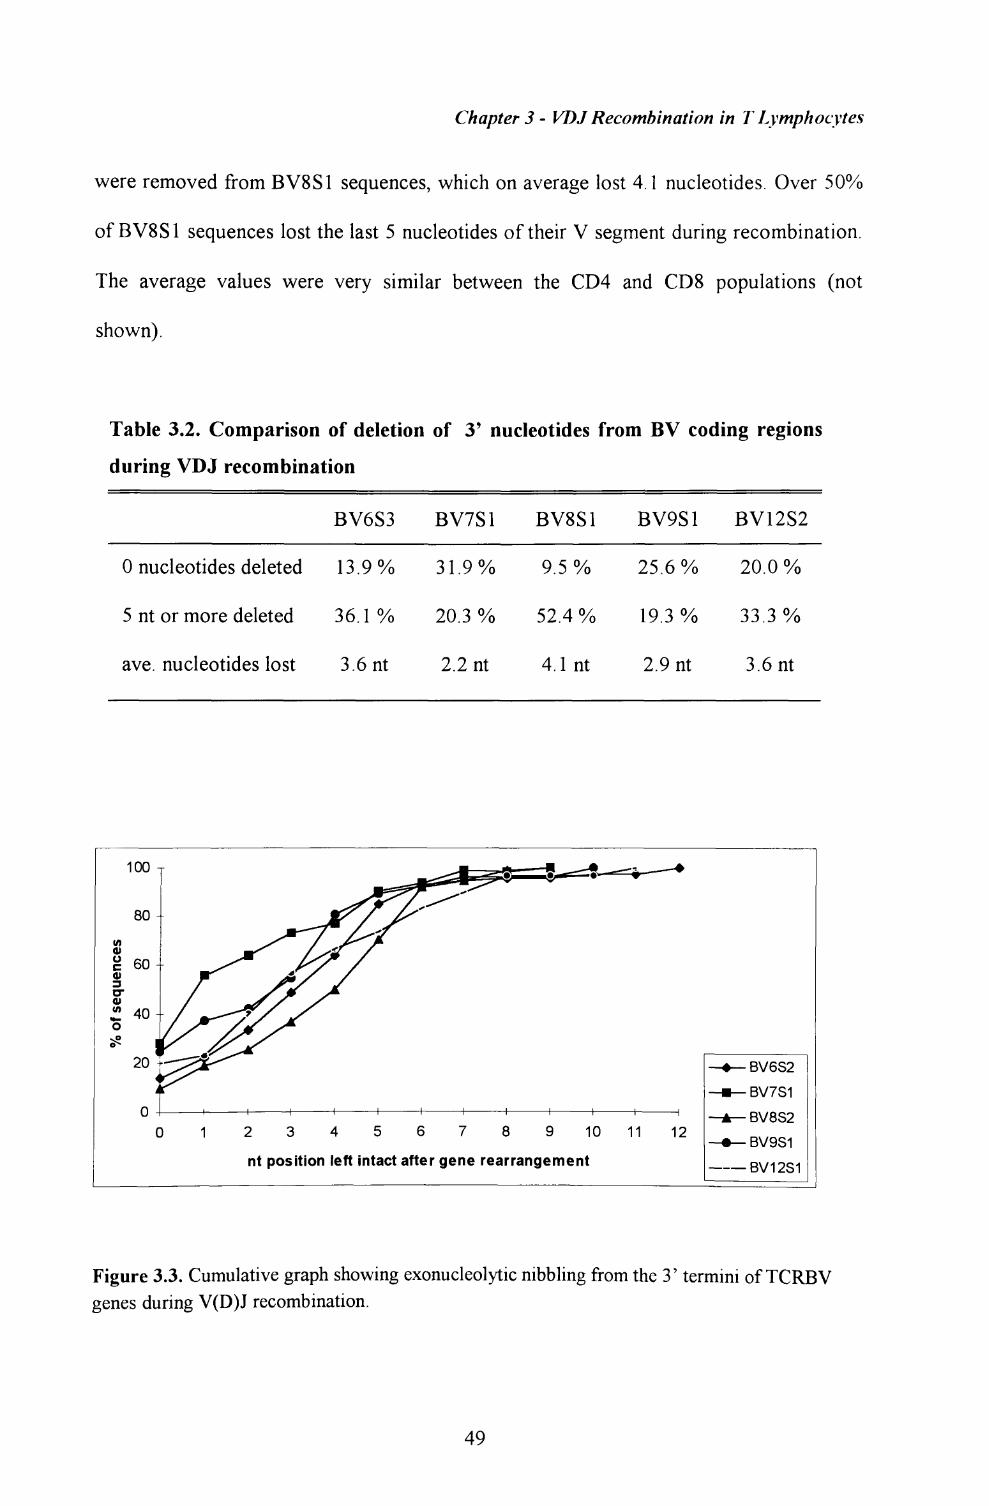
Chapter 3 - VDJ Recombination in T Lymphocytes
were removed from BV8S1 sequences, which on average lost 4.1 nucleotides. Over 50%
of BV8S1 sequences lost the last 5 nucleotides of their V segment during recombination.
The average values were very similar between the CD4 and CDS populations (not
shown).
Table 3.2. Comparison of deletion of 3' nucleotides from BV coding regions
during VDJ recombination
BV6S3 BV7S1 BV8S1 BV9S1 BV12S2
0 nucleotides deleted 13.9% 31.9% 9.5 % 25.6% 20.0%
5 nt or more deleted 36.1 % 20.3 % 52.4 % 19.3 % 33.3 %
ave. nucleotides lost 3.6 nt 2.2 nt 4.1nt 2.9 nt 3.6 nt
100
0 23456789 10 11
nt position left intact after gene rearrangement
12
-*— BV6S2-•— BV7S1-A— BV8S2-•— BV9S1-——BV12S1
Figure 3.3. Cumulative graph showing exonucleolytic nibbling from the 3' termini of TCRBV genes during V(D)J recombination.
49
Chapter 3 - VDJ Recombination in T Lymphocytes
3.4. Evidence for P nucleotide addition
Recombination of V, D and J segments is believed to proceed via a hairpin intermediate
structure [Lieber, 1991]. P nucleotide addition has been proposed to occur during the
resolution of intermediates, when a nick is introduced into only one strand of the hairpin
loop, resulting in a palindromic nucleotide sequence across the coding junction [Lafaille
et at, 1989]. Examples of P addition could only be observed where the coding nucleotides
were not nibbled back prior to junction formation. P nucleotides were identified in about
50% of junctions containing full length BV coding segments.
Discussion
The results of this study show that biased patterns of VDJ rearrangement exist in CDR3
regions belonging to different groups of a(3 TCR BV genes. These may be due to cellular
selection events or limitations of the rearrangement process, such as the accessibility of
DNA to bending and unwinding by recombinases, or the formation and resolution of
hairpin loops. In agreement with previous findings of Rosenberg et al [1992], there was a
marked preference for BJ2 segments over BJ1. It is possible that this was simply due to
the fact that pairing of a particular BV segment to a BD1-BJ1 unit does not exclude
subsequent rearrangement and pairing with a BD2-BJ2 unit. Therefore there are likely to
be twice as many receptors containing gene segments from the BJ2 cluster. Skewing of
the repertoire towards particular BJ gene segments may be attributed to the accessibility
of the DNA structure to recognition and binding by recombinases. Furthermore, the
minor inconsistencies between families and also between CD4 and CDS lymphocytes
indicate that some bias, at least, could be the result of selection events.
Earlier work using extrachromosomal recombination substrates revealed that coding ends
consisting of G/C homopolymers showed reduced nucleotide deletion [Boubnov et al,
50
Chapter 3 - VDJ Recombination in T Lymphocytes
1993]. Another study in mice reported a strong correlation between internal stretches of
A/T-rich sequence and high average nucleotide deletion [Nadel & Feeney, 1995] in Ig
and TCR repertoires. Similarly, non-random patterns of coding-end processing were
found in this study. In particular, coding ends of BV7S1 and BV9S1 sequences were
frequently preserved from exonuclease nibbling. A previous report had already
demonstrated that BV7S1 sequences were relatively resistent to nibbling [Callan et at,
1995]; the observation here of a similar effect in BV9S1 sequences, which carries
identical nucleotides in the last five positions, suggests that motifs in the 3' sequence may
be involved in directing the common presence of particular residues in the VDJ junction.
A/T base composition may also have contributed to levels of nucleotide deletion, as
BV7S1 and BV9S1 sequences contained relatively lower proportions of A/T bases (40%
and 45%, respectively). Although the nucleotide composition of the BV6S3 was no
different from BV7S1, these sequences still underwent higher average nucleotide
deletion. The presence of three consecutive pairs A.T nucleotides near the 3' terminus of
this gene segment could probably have been a contributing factor in this case, as the
weaker pairings in A.T stretches enable more efficient nibbling by exonucleases.
Likewise a stretch of four A.T nucleotide pairs in BV8S1 coding ends might have
accounted for the observation of greater nucleotide loss compared to the BV12S2 group,
although the nucleotide composition of both was identical.
Until recently it was thought that inserted nucleotides at coding junctions was essentially
the result of random addition by the TdT enzyme, being both variable in length and
unpredictable in sequence. Non-random addition of residues at coding junctions that are
inversely complementary to the adjoining full-length coding segment support the model
that resolution of hairpin intermediates occurs with the introduction of nick(s) in only one
of the two strands. It is not known whether hairpins are obligate intermediates that
51

Chapter 3 - VDJ Recombination in T Lymphocytes
occasionally give rise to P nucleotide inserts, or whether there are two pathways for
forming coding ends, only one of which generates hairpins. P nucleotides were detected
in about 50% of all sequences that retained intact coding ends. They were present in
every group of sequences, although it was not possible to compare their frequency
between BV groups as there were too few sequences.
Certain mutated versions of RAGl have been shown to be inhibited by coding sequence
variations that normally do not affect recombination with wild-type RAGl [Sadofsky et
a/, 1995], suggesting that RAG-1 may make direct contact with the DNA at the coding-
signal heptamer border. The influence of coding flank sequence on RAG-1 recognition of
recombination signals is a possible mechanism by which different BV gene sequences
can shape the primary T cell repertoire.
52

CHAPTER 4
CTL Responses in Primary EBV Infection
P rimary infection with virus can stimulate a vigorous cytotoxic T cell response, with
activation and proliferation of lymphocytes at the site of infection [Deckhut et al,
1993], within draining lymph nodes [McHeyzer-Williams et at, 1995], and sometimes
also within peripheral blood [Callan et al, 1996; Pantaleo et al, 1994]. The extent to
which these lymphocytes have been specifically activated by antigen or nonspecifically
activated, perhaps by cytokines (bystander activation) has long been a matter of debate.
In previous studies, measurement of CTL frequencies by LDA indicated that antigen-
specific responses consituted a minor fraction of the virus-activated CD8+ T cells. In
contrast later studies analysing TCR gene usage during acute viral infections reported the
predominance of clonal or oligoclonal CD8+ expansions, implying that the proportion of
T cells directly activated by antigen might be greater than originally suggested [Callan et
al, 1996; Pantaleo et al, 1994]. However such expansions were only found in some
individuals and their significance was unclear in the absence of more direct means of
identifying antigen-specific T cells in vivo.
The development of novel techniques for detecting antigen-specific T cells has enabled
us to address this apparent discrepancy. Two recent articles have reported that 50% to
70% of activated CD8+ T cells may be LCMV-specific, during primary infection in mice,
based on binding to peptide-MHC tetrameric complexes and single-cell analysis of IFNy
production [Murali-Krishna et al, 1998; Butz and Bevan, 1998]. In particular, Murali-
53
Chapter 4 - CTL in Primary EBVInfection
Krishna et al found that LDA underestimated the frequency of LCMV-specific cells by
20-100 fold. In this chapter I sought to reassess the frequency of antigen-specific cells
during primary infection with a naturally-occurring virus in humans, using peptide-MHC
tetramers to both quantify and characterise antigen-specific T cells directly. Primary EBV
infection in adolescence or young adulthood may be clinically manifest as acute
infectious mononucleosis (IM), a disease characterised by a striking expansion of CDS T
cells in peripheral blood. This highly immunogenic virus provides an ideal natural
situation in which to study the development of a primary CD8+ immune response in
humans. I constructed tetramers of MHC molecules complexed to defined EBV peptide
epitopes, and used these to identify directly and to characterise epitope-specific T cells
within the primary T cell response in EVI patients. In selected individuals it was possible
to study responses in the same patients between 6 and 37 months later, after
establishment of the long-term virus carrier state. This study focuses on responses to two
immunodominant epitopes from lytic cycle antigens (an HLA-A2 restricted epitope in
BMLF1 and an HLA-B8 restricted epitope in BZLF1), as these have been less well
characterised, and compares them to a well-known immunodominant epitope from an
EBV latent cycle protein (an HLA-B8 restricted epitope in EBNA3 A).
4.1. Construction of tetrameric complexes and staining of control samples
The class I MHC-peptide tetrameric complexes developed by Altman et al [1996] consist
of four biotinylated class I complexes associated with streptavidin. Each class I complex
is constructed by refolding a recombinant truncated version of the relevant heavy chain
protein (which incorporates a biotinylation substrate sequence tag at the C-terminus),
recombinant P2m and synthetic peptide representing a minimal CTL epitope. Complexes
are then biotinylated and purified before being combined with streptavidin in a four-fold
54

Chapter 4 - CTL in Primary EBVInfection
molar excess. Incorporation of streptavidin that has been conjugated to fluorochromes
enables such "tetramers" to be used as reagents in FACS analysis to detect antigen-
specific CD8+ T lymphocytes. Since streptavidin has a tetrahedral symmetry and the most
commonly used fluorochrome, phycoerythrin is quite large, ligand binding is probably
trimeric [Davis etal, 1998; McMichael & O'Callaghan, 1998].
(a) si
.o oO'
00
O 2 1
10* 103JO2
RAK tetramer PE
(b) 2
_O
800
8 s10 1 to3JO2
RAK tetramer PE
(c) -I
10
(d) -
10RAK tetramer PE RAK tetramer PE
Figure 4.1. Specificity of the HLA-B8/RAK tetrameric complex for HLA-B8 restricted, RAKFKQLL-specific T cells. Samples were double stained with the PE-conjugated B8/RAK tetrameric complex and Tricolor-conjugated anti-CD8. The tetrameric complex stained (a) an HLA-B8 restricted, RAKFKQLL-specific T cell clone, but did not stain (b) an HLA-B8 restricted, FLRGRAYGL-specific clone. The complex also did not stain CD8+ T cells in PBMC from (c) an HLA-B8 negative, EBV-seropositive individual or (d) an HLA-B8 positive but EBV- seronegative individual.
55
Chapter 4 - CTL in Primary EBVInfection
Three tetramers were constructed to analyse the frequency of circulating CDS' T cells
specific for two Epstein-Barr virus lytic cycle antigens, HLA-A2 restricted BMLF1
GLCTLVAML epitope, HLA-B8 restricted BZLF1 RAKFKQLL epitope, and one latent
cycle antigen, the HLA-B8 restricted EBNA3A FLRGRAYGL epitope, during primary
EBV infection. The specificity of these tetramers was first confirmed by staining control
samples. Thus, as shown in Figure 4.1., the HLA-B8/RAK tetramer stained an HLA-B8
restricted, RAKFKQLL-specific T cell clone (Fig 4.1.a), but did not stain an HLA-B8
restricted T cell clone specific for a different epitope (FLRGRAYGL; Fig 4.1.b).
Furthermore, the HLA-B8/RAK tetramer did not stain CD8+ T cells in peripheral blood
taken from HLA-B8 negative, EBV seropositive individuals (Fig 4.1.c) or from HLA-B8
positive, EBV seronegative individuals (Fig 4.1.d). The HLA-A2/GLC and HLA-B8/FLR
tetramers were also tested in a similar fashion, and their specificity was confirmed (data
not shown).
4.2. Frequency of circulating EBV-specific T cells during primary EBV infection
PBMC taken from 10 HLA-A2 positive individuals suffering from recent onset acute IM
were stained with the PE-conjugated A2/GLC tetrameric complex and Tricolor-
conjugated anti-CD8. In all HLA-A2 positive individuals, a population of CD8+ T cells
clearly stained with the A2/GLC tetrameric complex. The frequency of tetramer-reactive
T cells in PBMC ranged from 0.5-6.6% of the CD8+ T cells in blood in the 10 donors
with AIM (Table 4.1.). In 4 of the 10 donors, the frequency was >5%. Fig 4.2.a illustrates
the data obtained from patients IM83 and IM74, in whom 5.6% and 6.6% respectively, of
circulating CD8+ T cells stained with the HLA-A2/GLC complex.
56
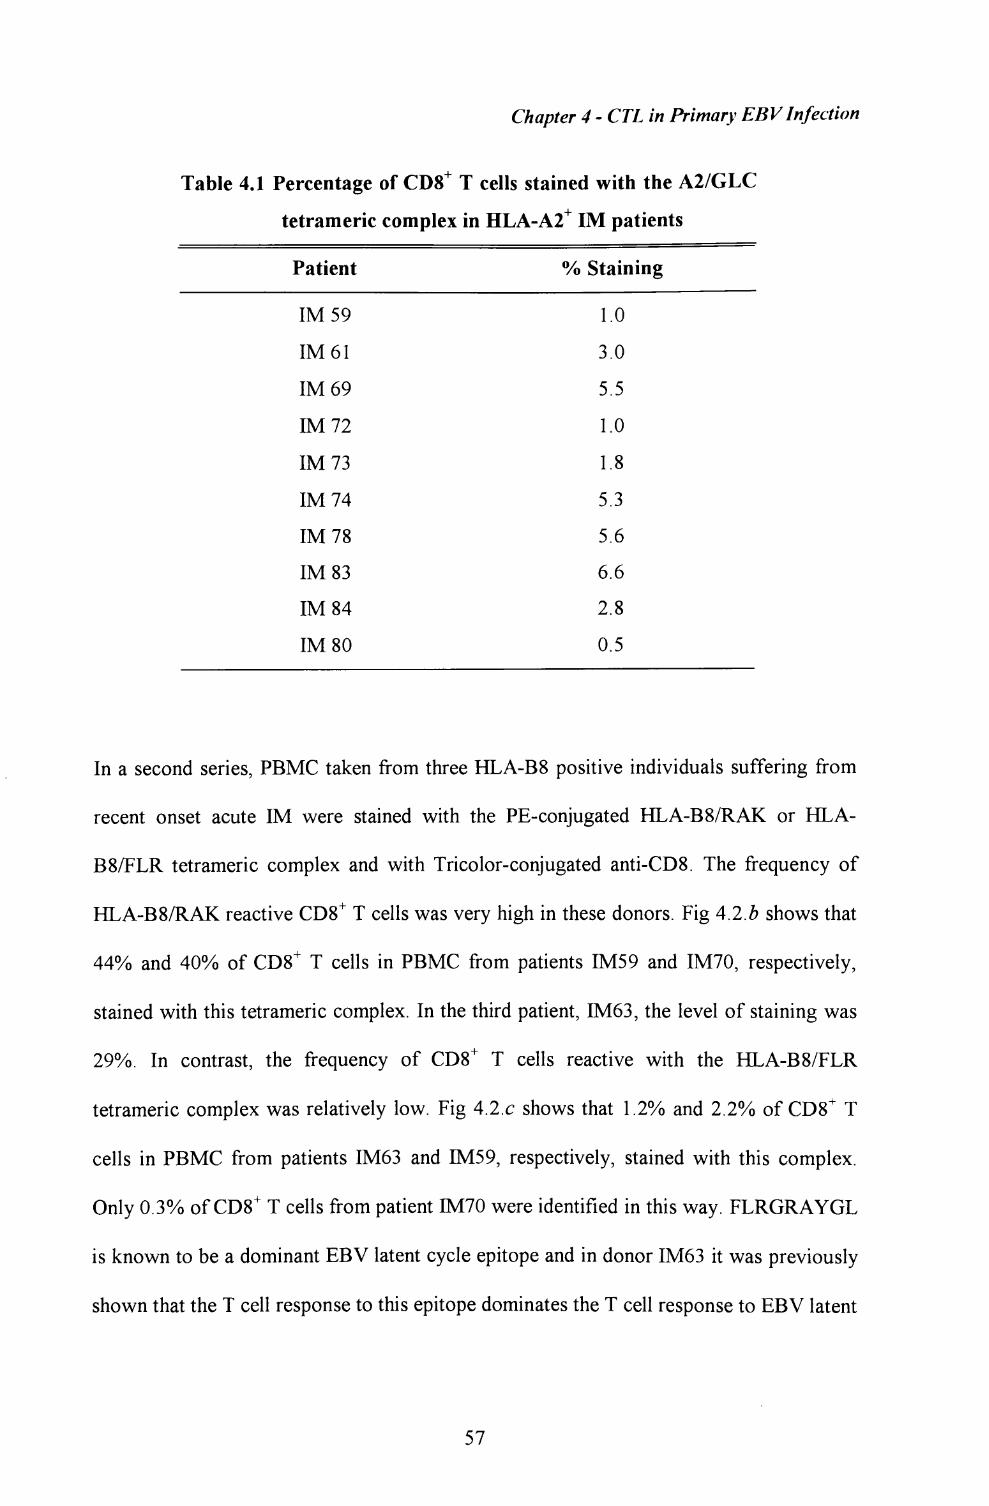
Chapter 4 - CTL in Primary EBVInfection
Table 4.1 Percentage of CD8+ T cells stained with the A2/GLC
tetrameric complex in HLA-A2+ IM patients
Patient
IM59
IM61
IM69
IM72
IM73
IM74
IM78
IM83
IM84
IM80
% Staining
1.0
3.0
5.5
1.0
1.8
5.3
5.6
6.6
2.8
0.5
In a second series, PBMC taken from three HLA-B8 positive individuals suffering from
recent onset acute IM were stained with the PE-conjugated HLA-B8/RAK or HLA-
B8/FLR tetrameric complex and with Tricolor-conjugated anti-CD8. The frequency of
HLA-B8/RAK reactive CD8+ T cells was very high in these donors. Fig 4.2.6 shows that
44% and 40% of CD8+ T cells in PBMC from patients IM59 and IM70, respectively,
stained with this tetrameric complex. In the third patient, IM63, the level of staining was
29%. In contrast, the frequency of CD8+ T cells reactive with the HLA-B8/FLR
tetrameric complex was relatively low. Fig 4.2.c shows that 1.2% and 2.2% of CD8+ T
cells in PBMC from patients IM63 and IM59, respectively, stained with this complex.
Only 0.3% of CD8+ T cells from patient IM70 were identified in this way. FLRGRAYGL
is known to be a dominant EBV latent cycle epitope and in donor IM63 it was previously
shown that the T cell response to this epitope dominates the T cell response to EBV latent
57

Chapter 4 - CTL in Primary EBVInfection
(a) Donor 83
1O 1 1O 1O3
A2/GLC tet PE
Donor 74
10 1 102 103
A2/GLC tet PE
(b) Donor 70 Donor 59
B8/RAK tet PE B8/RAK tet PE
(C)
«*>
Donor 63
IO 1 IO2
B8/FLR tet PE10
Donor 59
10B8/FLR tet PE
Figure 4.2. The frequency of CD8+ T cells specific for three EBV epitopes in patients with IM. (a) PBMC from HLA-A2+ donors, IM74 and IM83, stained with the A2/GLC tetrameric complex and Tricolor-conjugated anti-CDS. (b) PBMC from HLA-B8+ donors, IM70 and IM59, stained with the B8/RAK tetrameric complex and Tricolor-conjugated anti-CDS. (c) PBMC from HLA- B8+ donors, IM63 and IM59, were stained with the B8/FLR tetrameric complex and Tricolor- conjugated anti-CDS. In each case, the frequency of CD8+ T cells that stain with the relevant tetrameric complex is expressed as the percentage of total CD8+ cells.
58
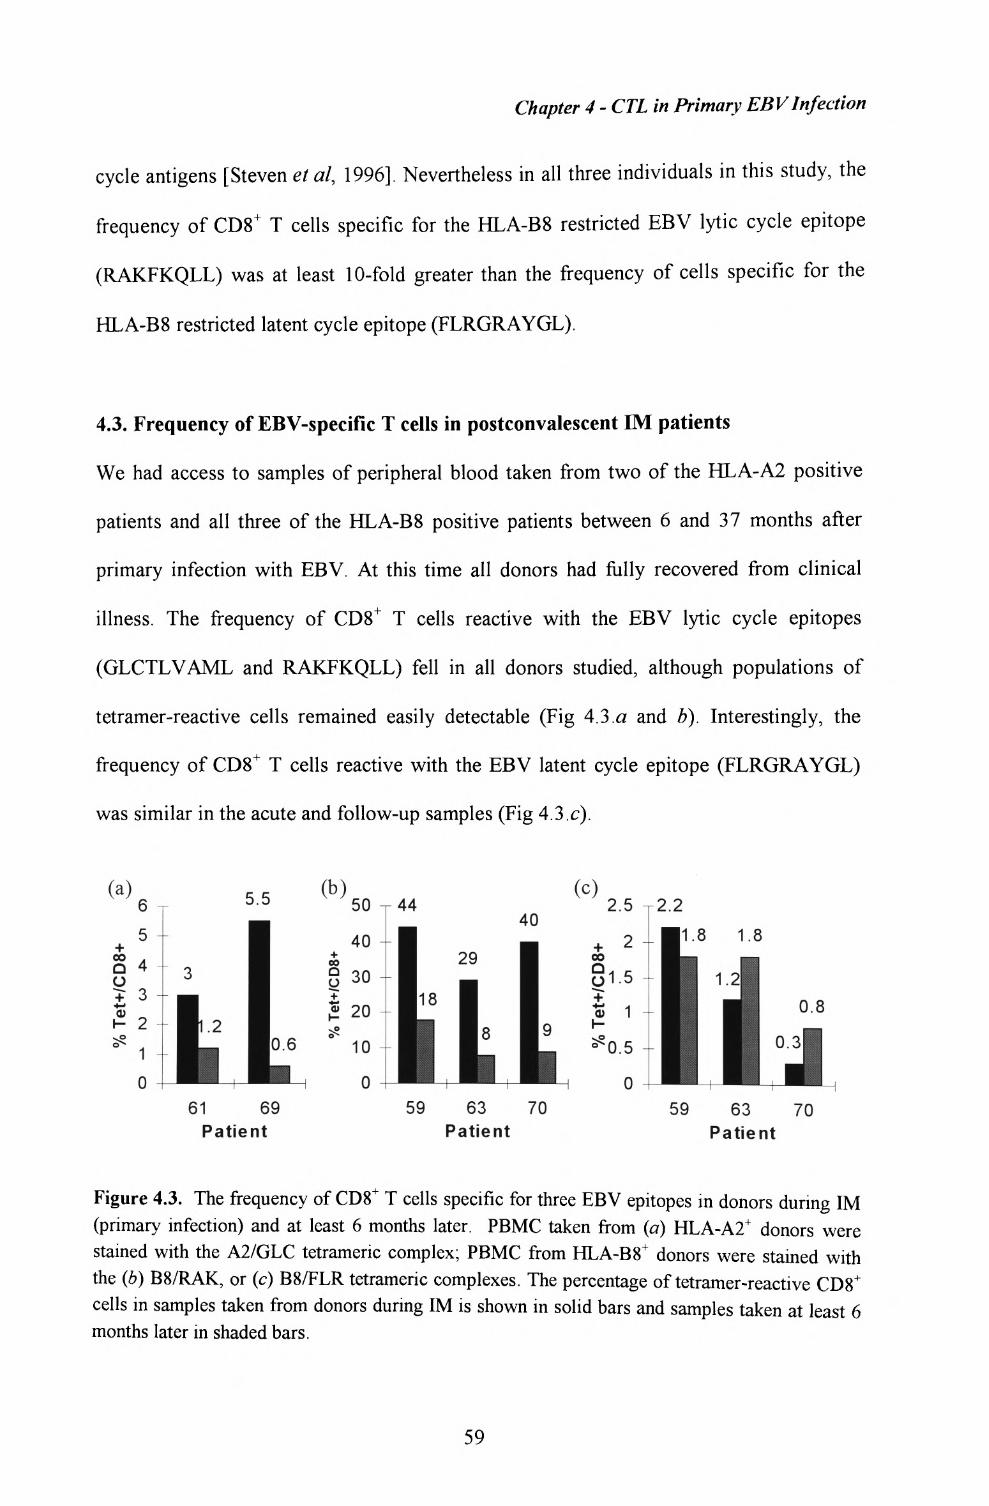
Chapter 4 - CTL in Primary EBV Infection
cycle antigens [Steven et al, 1996]. Nevertheless in all three individuals in this study, the
frequency of CD8+ T cells specific for the HLA-B8 restricted EBV lytic cycle epitope
(RAKFKQLL) was at least 10-fold greater than the frequency of cells specific for the
HLA-B8 restricted latent cycle epitope (FLRGRAYGL).
4.3. Frequency of EBV-specific T cells in postconvalescent IM patients
We had access to samples of peripheral blood taken from two of the HLA-A2 positive
patients and all three of the HLA-B8 positive patients between 6 and 37 months after
primary infection with EBV. At this time all donors had fully recovered from clinical
illness. The frequency of CD8+ T cells reactive with the EBV lytic cycle epitopes
(GLCTLVAML and RAKFKQLL) fell in all donors studied, although populations of
tetramer-reactive cells remained easily detectable (Fig 4.3.a and b). Interestingly, the
frequency of CD8+ T cells reactive with the EBV latent cycle epitope (FLRGRAYGL)
was similar in the acute and follow-up samples (Fig 4.3.c).
2.21.8 1.8
061 69
Patient59 63 70
Patient59 63 70
Patient
Figure 4.3. The frequency of CD8+ T cells specific for three EBV epitopes in donors during IM (primary infection) and at least 6 months later. PBMC taken from (a) HLA-A2+ donors were stained with the A2/GLC tetrameric complex; PBMC from HLA-B8+ donors were stained with the (b) B8/RAK, or (c) B8/FLR tetrameric complexes. The percentage of tetramer-reactive CD8+ cells in samples taken from donors during IM is shown in solid bars and samples taken at least 6 months later in shaded bars.
59
Chapter 4 - CTL in Primary EBVInfection
4.4. Phenotype of EBV-specific T cells during the primary T cell response
The phenotype of the tetramer-reactive cells was analysed in six IM patients using three-
colour FACS analysis. The results of such an analysis, in this case involving the HLA-
A2/GLC tetramer-reactive cells in patient IM73, are shown in Figure 4.4. The epitope-
specific cells had an activated/memory phenotype; thus the majority expressed the
activation markers HLA-DR (Fig 4.4.6), and CD38 ( Fig 4.4.c) [Jackson et al, 1990], but
showed down-regulation of the lymph node homing receptor CD62L (Fig 4A.d) [Spertini
et al, 1991], consistent with the finding that the molecule is downregulated after
lymphocyte activation. Note also that the majority of the tetramer-reactive cells expressed
the CD45RO isoform of CD45 and not the CD45RA isoform (Fig 4A.e and/) [Akbar et
al, 1988]; in this context, CD45RO has been proposed as a marker both for recently
activated and for "memory" T cells. CD28, the ligand for B7, is an important
costimulatory molecule that is normally expressed on the majority of CD4+ T cells, but
only -50% of CD8+ T cells [Kara et al, 1985]. This molecule was expressed on 48% of
the epitope-specific cells in patient IM73 (Fig 4A.g), whereas CD57 , which has been
postulated to be a marker of terminal T cell differentiation [D'Angeac et al, 1994], was
expressed on only 2% of that population (Fig 4A.h). Complete results of the phenotypic
analysis of the tetramer-reactive T cells taken from four HLA-A2 positive and two HLA-
B8 positive patients with acute IM are shown in Table 4.2. Although there was some
variation between patients, the tetramer-reactive cells were generally CD38+ , HLA-DR+ ,
CD45RO+ , CD45RA", levels of CD28 positivity were the most variable.
60

(a) 21
o
io 1 io2 io3 io4A2/GLC tet PE
(C)
<*> oo *"
•5 No o
100%
10CD38 fitc
(e)
S"
O CMO
85%
io2 io3 10CD45RO fitc
(g)_Oo cv.2 Oi_ *•I-§ "sO
48%
to1 IO 1 To2CD28 fitc
IO3 10'
Chapter 4 - CTL in Primary EBVInfection
(o) 2]
070 ~'O CSJ.y o-sI— ^m\-00 r^-Q 210 !
o •o-it
"
t
io .<
63%
.%AjJ^i." ••r;; '|»:> '
p, . . .. -^ ... — ! - -^
^' ift^ 1ftJ 1ft
HLA-DR fitc
OO-o ""!O N "•8 2'
s si0 ^ :
0-^11
"A -,^*SL
8%
" -
•*€'
i° io j io2 io3 ioCD62L fitc
10° IO 1 IO2 IO3CD45RA fitc
10
(h) c
o
CD57 fitc
Figure 4.4. Phenotypic analysis of antigen-specific CD8+ T cells in patient IM73 during acute IM. PBMC were stained with the PE-conjugated A2/GLC tetrameric complex, Tricolor- conjugated anti-CD8 and one of a panel of FITC-conjugated antibodies recognising surface glycoproteins. a shows staining of PBMC with the A2/GLC tetrameric complex on the x-axis and anti-CD8 on the y-axis. b-h are gated on CD8+ cells and show staining with the A2/GLC tetrameric complex on the y-axis and anti- (b) HLA-DR, (c) CD38, (d) CD62L, (e) CD45RO, (/) CD45RA, (g) CD28, (h) CD57 on the x-axis. The frequency of cells that stain with a particular phenotypic marker is expressed as the percentage of the tetramer-reactive cells.
61
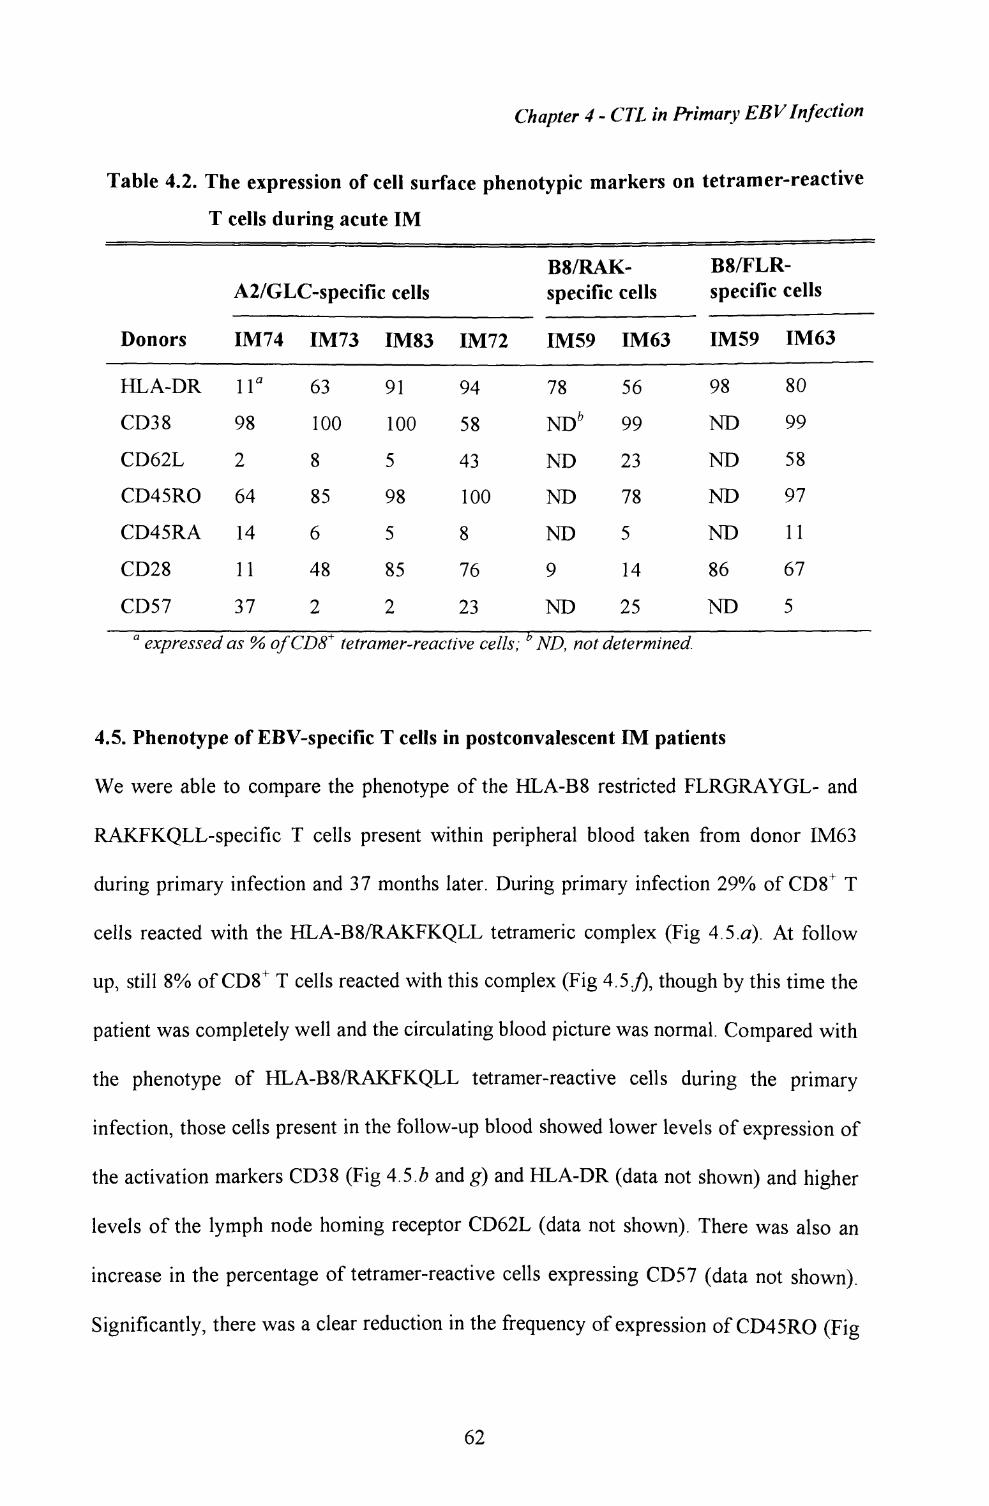
Chapter 4 - CTL in Primary EBVInfection
Table 4.2. The expression of cell surface phenotypic markers on tetramer-reactive
T cells during acute IM
A2/GLC-specific cells
Donors
HLA-DR
CD38
CD62L
CD45RO
CD45RA
CD28
CD57
IM7411°
98
2
64
14
11
37
IM73
63
100
8
85
6
48
2
IM83
91
100
5
98
5
85
2
IM72
94
58
43
100
8
76
23
B8/RAK- specific cells
IM59
78ND5
ND
ND
ND
9
ND
IM63
56
99
23
78
5
14
25
B8/FLR-specific cells
IM59
98NDNDNDND86
ND
IM63
80
99
58
97
11
67
5
a expressed as % ofCD8+ tetramer-reactive cells; ND, not determined.
4.5. Phenotype of EBV-specific T cells in postconvalescent IM patients
We were able to compare the phenotype of the HLA-B8 restricted FLRGRAYGL- and
RAKFKQLL-specific T cells present within peripheral blood taken from donor IM63
during primary infection and 37 months later. During primary infection 29% of CD8+ T
cells reacted with the HLA-B8/RAKFKQLL tetrameric complex (Fig 4.5.a). At follow
up, still 8% of CD8 + T cells reacted with this complex (Fig 4.5./), though by this time the
patient was completely well and the circulating blood picture was normal. Compared with
the phenotype of HLA-B8/RAKFKQLL tetramer-reactive cells during the primary
infection, those cells present in the follow-up blood showed lower levels of expression of
the activation markers CD38 (Fig 4.5.Z? and g) and HLA-DR (data not shown) and higher
levels of the lymph node homing receptor CD62L (data not shown). There was also an
increase in the percentage of tetramer-reactive cells expressing CD57 (data not shown).
Significantly, there was a clear reduction in the frequency of expression of CD45RO (Fig
62
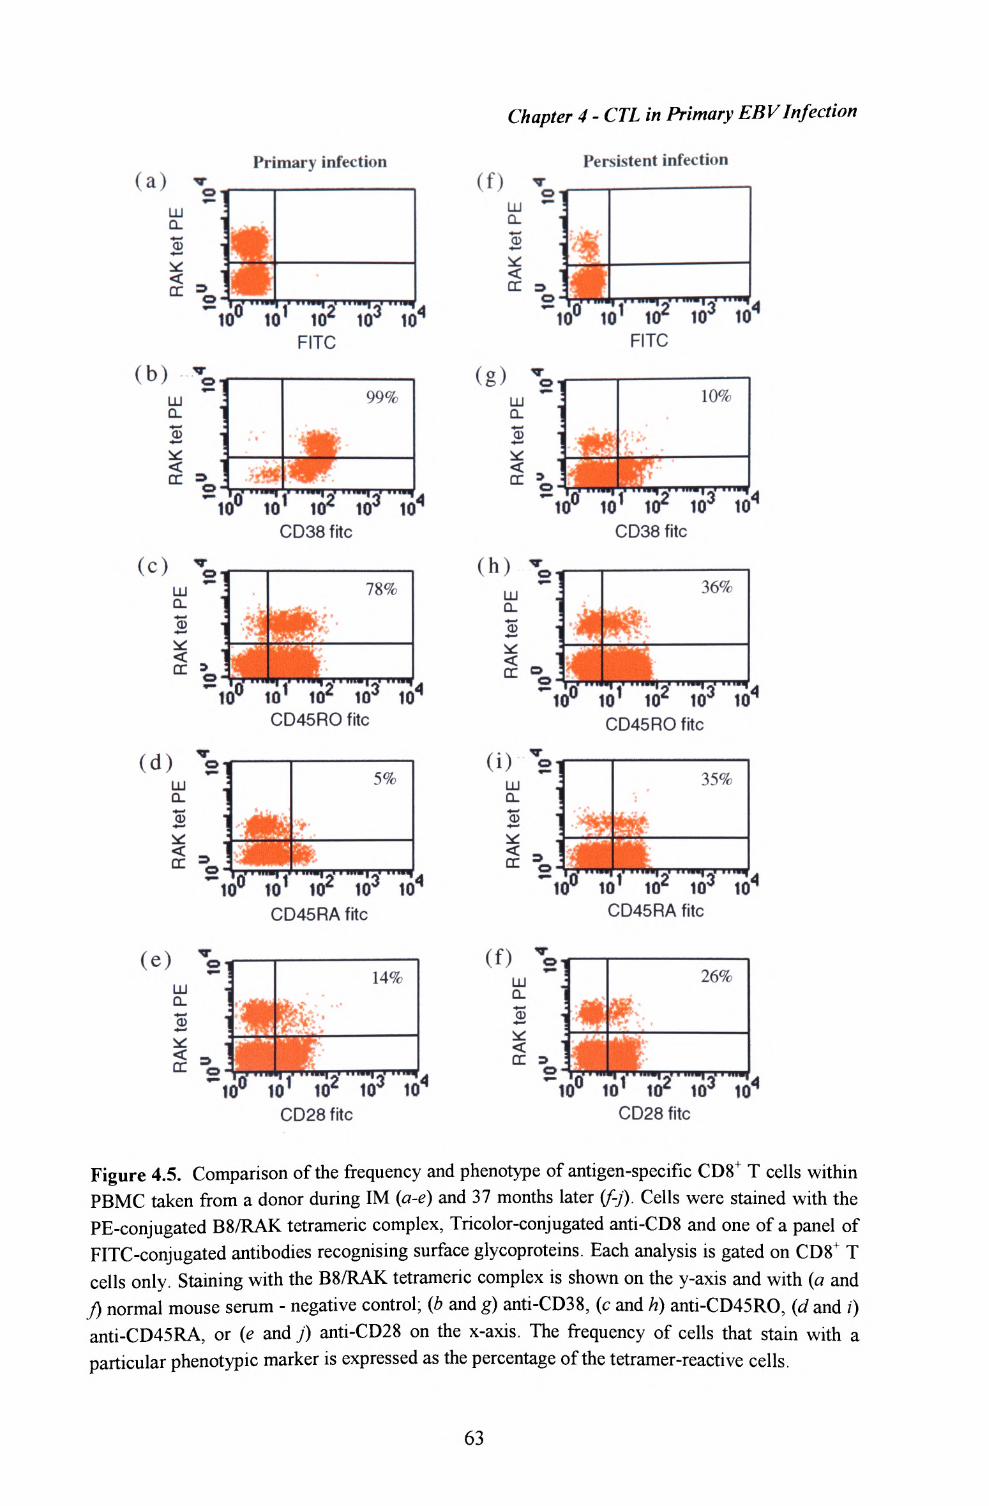
Chapter 4 - CTL in Primary EBVInfection
(a)Primary infection
LLJ CL•t—»
0)
~10° IO 1 IO2 IO3 IO4FITC
(b) ^LJJ D.
jJ , .v#
•**• 99%
o ioCD38 fitc
(C) *
10 1 102 103 104CD45RO fitc
(d) VLLJ CL
QC
.nBHIHR
5%
~IO° I0 1 102 103 IOCD45RA fitc
(e) VLLJ Q.
&*2=0
14%
JS Iff "——I |w "——lA' "——!*• "—1
10° IO 1 10Z 10^ 10CD28fitc
(f) Persistent infection
UJ Q.
. J IHJ1, . . ...-, . . .... t ff •• •" i
10" 10'
(g)LLJ Q.4W
0)
(h) *LLJ CL
0) *12=o
UJ CL0>
(0LJJ Q_
CC
FITC
10%
*~io° io 1 io2 io3 io4CD38 fitc
*"lO° 10' 1(CD45RO fitc
35%
10° IO 1 IO2 IO3CD45RA fitc
*-««o
26%
n * 1 ^^ y ~ *» 10U IO 1 102 IO3 10
CD28 fitc
Figure 4.5. Comparison of the frequency and phenotype of antigen-specific CD8+ T cells within PBMC taken from a donor during IM (a-e) and 37 months later (f-j). Cells were stained with the PE-conjugated B8/RAK tetrameric complex, Tricolor-conjugated anti-CD8 and one of a panel of FITC-conjugated antibodies recognising surface glycoproteins. Each analysis is gated on CD8+ T cells only. Staining with the B8/RAK tetrameric complex is shown on the y-axis and with (a and J) normal mouse serum - negative control; (b and g) anti-CD38, (c and h) anti-CD45RO, (d and z) anti-CD45RA, or (e and j) anti-CD28 on the x-axis. The frequency of cells that stain with a particular phenotypic marker is expressed as the percentage of the tetramer-reactive cells.
63

Chapter 4 - CTL in Primary EBVInfection
4.5.c and h) by the antigen-specific cells, and an increase in the frequency of expression
of CD45RA (Fig 4.5.rfand /). Analysis of the HLA-B8 restricted FLRGRAYGL-specific
T cells in the same patient showed a similar fall in the proportion of cells expression
CD38, HLA-DR and CD45RO and increase in the proportion of cells expressing CD62L,
CD57 and CD45RA over the 3 years since primary infection.
4.6. Sequence of TCRs involved in the B8/RAKFKQLL response
PBMC from patient IM59 were stained with the B8/RAK tetramer and reactive cells were
sorted by FACS. mRNA extracted from the B8/RAK-specific T cells was reverse
transcribed into cDNA and used for anchored PCR and sequencing of the CDR3 region in
the TCR |3 chains. The eleven resultant sequences obtained are listed below in Table 4.3.
Table 4.3. CDR3 regions of B8/RAKFKQLL-specific TCR 0 chains
BV segment CDR3 region BJ segment
BV7S1 TGC GCC AGC(x3) C A S
BV6S3 TGT GCC AGC(x2) GAS
BV9S1 TGT GCC AGC(Xl) C A S
BV9S1(xl)
BV3S1(xl)
TGT GCC AGC GAS
TGT GCC AGC GAS
BV21S3 TGT GCC AGC(Xl) GAS
BV13S6 TGT GCC AGC(Xl) GAS
BV5S1 TGT GCC AGC(Xl) GAS
GAA AGA CTA GCG GGA GAG GCA GAT ACG ERLAGEADT
AGC TTA GTA GGG AAG GGT ACT GAG S LVGKGTE
AGC CAA GAA CGG CAC AGG AAC ACT GAA S QERHRNTE
AGC CAG GAC GGA CAG ACT AAC TAT GGC S QDGQTNYG
AGT TTC GTA GTT AGC CCA GAT ACG SFVVSPDT
CAG TAT TTT BJ2S3Q Y F
CAG TTC TTC BJ2S1 OFF
GCT TTC TTT BJ1S1A F F
TAG ACC TTC BJ1S2Y T F
CAG TAT TTT BJ2S3Q Y F
AGC TTA GAA GGG GTA GCC GCT TTG GAT GAG CAG TTC TTC BJ2S1SLEGVAALDE QFF
AGT TAC TCG AGA GGA GGC GAA AAT TCA CCC CTC CAC TTT BJ1S6SYSRGGENSP LHF
AGC TTG GGA CAG GGT AGC TAC GAG SLGQGSYE
CAG TAC TCC BJ2S7 Q Y F
64
Chapter 4 - CTL in Primary EBV Infection
This revealed a relatively polyclonal response to this epitope, without any obvious
domination of a particular clonotype. However there were 3/11 sequences encoded by
BV7S1-BJ2S3 and 2/11 encoded by BV6S3-BJ2S1. In addition two sequences shared
BV9S1 but used different BJ chains. Similarly, another group has reported that the
B8/RAKFKQLL-specific response results in selection of a diverse TCR repertoire, during
both primary and persistent infection [Silins et al, 1997].
Discussion
This study looks at primary EBV infection in humans as the model in which to ask what
fraction of a primary virus-induced T cell response is actually made up of virus-specific
(as opposed to coincidentally activated bystander) cells. Earlier attempts to address this
question using two different approaches gave somewhat conflicting results. Cloning
experiments in vitro suggested that the frequency of T cells specific for a single EBV
epitope was no more than 1:100 [Steven et al, 1996], whereas a study of TCR usage
suggested that the frequency of antigen-specific cells might be as high as 1:3 [Callan et
a/, 1996]. In this study, I used peptide-MHC complexes to directly quantify and
characterise epitope-specific T cells during the primary and early persistent phases of
EBV infection. The tetrameric complexes, refolded with an HLA-A2 or HLA-B8
restricted EBV lytic cycle epitope, and an HLA-B8 restricted EBV latent cycle epitope,
were used to study circulating T cells in HLA-A2+ or HLA-B8+ IM donors.
A very high frequency of EBV epitope-specific T cells was present in peripheral blood in
such individuals. Thus, T cells reactive with the HLA-A2 restricted GLCTLVAML
peptide from the EBV lytic cycle antigen BMLF1 were detected in PBMC from all 10
HLA-A2+ IM donors tested, at levels between 0.5% and 6.6% of CD8+ T cells. Even
65
Chapter 4 - CTL in Primary EBV Infection
higher frequencies of T cells reactive with the HLA-B8 restricted RAKFKQLL peptide
from the EBV lytic cycle antigen BZLFl were observed in all three HLA-B8* donors
studied; in one individual, 44% of circulating CD8+ T cells reacted with the HLA-
B8/RAK tetrameric complex. This represents, in peripheral blood alone, a population of
-3x10 T cells. In these same three patients, the frequency of T cells specific for the
HLA-B8 restricted FLRGRAYGL peptide from the EBV latent protein EBNA3A was
lower. The relative immunodominance of the RAKFKQLL (BZLFl) epitope over the
FLRGRAYGL (EBNA3 A) epitope during the primary immune response to EBV in these
donors is consistent with the results of previously published functional studies [Steven et
al, 1996& 1997].
These numbers of EBV antigen-specific cells, measured directly using tetrameric MHC-
peptide complexes, are much greater than the previously reported precursor frequencies,
estimated using limiting dilution analysis, in a similar group of patients [Steven et al,
1996]. In donor 59, we can compare the frequency of FLRGRAYGL-specific CTLs
previously estimated by in vitro outgrowth in a limiting dilution assay (frequency of
1:358) with that estimated in this study by tetramer staining (frequency of 1:50). The
comparison shows that in vitro outgrowth underestimates the true magnitude of this latent
antigen-induced primary response by almost a factor of six.
In this cohort, there was some phenotypic heterogeneity within cell populations, both
within an individual patient and between patients, perhaps reflecting differences in the
duration of antigen exposure. However, certain common themes emerge. The majority of
tetramer-reactive cells had an activated/memory phenotype with high levels of expression
of CD38, HLA-DR and CD45RO; and relatively low levels of expression of CD62L and
CD45RA. By comparison, expression of CD28, the ligand for B7, was extremely
variable. In patients IM59 and IM63, it was possible to compare CD28 expression on the
66

Chapter 4 - CTL in Primary EBVInfection
relatively small population of HLA-B8/FLR tetramer reactive cells with that of the
greatly expanded population of HLA-B8/RAK tetramer-reactive cells. In both donors, the
proportion of the FLRGRAYGL-specific T cells expressing CD28 was much higher than
the proportion of the RAKFKQLL-specific T cells expressing this molecule. This would
be consistent with the idea that CD28 is expressed by naive T cells [Azuma et al, 1993]
and T cells in an early differentiation compartment, but that expression is lost after
multiple rounds of cell division in vivo. It has been suggested that CD57 expression may
also be a marker for late or terminal differentiation [D'Angeac et al, 1994]. Consistent
with this, analysis of the HLA-B8/RAK and HLA-B8/FLR tetramer-reactive cells in
donor IM59 showed that expression of CD57 was more frequent on the greatly expanded
population of HLA-B8 RAKFKQLL-specific cells.
Although the results clearly show that high numbers of activated, epitope-specific cells
are present in peripheral blood during the primary response to EBV, the role of these cells
in the control of EBV infection requires further study. A recent study has found that a
proportion of the activated T cells specific for one epitope, as detected by tetrameric
complexes in primary LCMV infection, are nonfunctional [Zajac et al, 1998]. It is
important to investigate whether all of these EBV-specific cells are able to kill target cells
and by what mechanisms of cytotoxicity.
Following recovery from IM, the numbers of epitope-specific T cells estimated by
staining with the HLA-peptide tetrameric complexes fell in most patients studied. Here it
is interesting to note that the highly expanded lytic cycle epitope-specific CTLs were
more heavily culled with transition to the virus-carrier state than the less expanded latent
cycle epitope-specific CTLs; this concept of heavier culling of the more abundant
components of the primary response was also suggested by the work with functional
assays [Steven et al, 1996]. Nevertheless, populations of both lytic cycle and latent cycle
67
Chapter 4 - CTL in Primary EBVInfection
epitope-specific CTLs were still detectable in all the individuals studied at up to 37
months after primary EBV infection. Comparison of the phenotype of the tetramer-
reactive T cells in samples of blood taken from donor IM63 during primary infection and
37 months later revealed interesting changes in cell surface marker expression. The
epitope-specific T cells in the follow-up samples were unexpectedly heterogenous with
respect to expression of markers of activation and differentiation. Most significantly,
CD45RA was expressed on a substantial subset of tetramer-reactive CD8 + T cells in the
follow-up samples, clearly showing that this CD45 isoform is not a specific marker for
"naive" T cells within the CD8+ population. This finding is consistent with the results of
a recently published functional study of the characteristics of a population of CD27"
CD8+ T cells that expressed CD45RA [Hamann et at, 1997].
In conclusion, this study demonstrates directly the magnitude of the specific primary T
cell response induced in vivo by a natural virus infection in humans. The results show that
massive expansion of activated epitope-specific CD8 + T cells can occur during the
primary immune response to EBV and that a population of epitope-specific CD8 + T cells
persists, in peripheral blood, at a relatively high frequency, for at least 3 years after
primary infection.
68
CHAPTER 5
The Long Term Memory Response To EBV Infection In Healthy Seropositives
The existence of T cell responses to EBV latent cycle proteins has long been
recognised from work on healthy virus carriers [Murray et al, 1992; Khanna et al,
1992]. Their ease of experimental detection in T cell memory owes much to the
availability of EBV-transformed lymphoblastoid cell lines, expressing the full range of
latent antigens, as a ready source of appropriate stimulator cells [Rickinson and Kieff,
1996]. Limiting dilution analysis suggests that the frequency of T cells specific for EBV
latent antigens is of the order of 20 to 100/106 PBMC in healthy virus carriers [Steven et
al, 1996].
T cell reactivities against EBV lytic cycle proteins are much less well characterised, to
some extent because the virus lytic cycle is more difficult to reproduce in vitro, and work
in this area has lagged behind parallel studies in a- and (3-herpes viral systems [Tigges et
al, 1992; Borysiewicz et al, 1988]. Recent studies have now identified CTL responses
directed against EBV immediate early and early lytic cycle proteins in IM patients
[Steven et al, 1997]. However relatively little is known about the importance of T cells
specific for lytic cycle epitopes in long term virus carriers. In this context, Bogedain et al
[1995] first demonstrated existence of CTL memory to an HLA-B8 restricted epitope,
RAKFKQLL, from the immediate early BZLF1 protein, and subsequently Elliott et al
[1997] used LDA to show that T cells reactive with the HLA-B8 restricted RAKFKQLL
69

Chapter 5 - Memory Response to EBV
epitope are also present in long term virus carriers at frequencies comparable to those of
T cells reactive with HLA-B8 restricted epitopes from EBV latent proteins.
However new evidence has suggested that LDA may underestimate T cell frequencies by
as much as 100-fold [Murali-Krishna et al, 1998] and hence novel methods of estimating
frequencies of antigen-specific T cells have been developed. These include assays to
detect IFNy release from epitope-specific CD8 + T cells following peptide stimulation
[Lalvani et a/, 1997] and the use of tetrameric MHC-peptide complexes to directly stain
T cells of the appropriate specificity [Altman et at, 1996]. Results obtained using these
techniques have led to a re-evaluation of the nature of both primary and memory
responses to viruses [Murali-Krishna et a/, 1998; Butz & Bevan, 1998; reviewed in
McMichael & O'Callaghan, 1998]. Together these studies indicate that the majority of
expanded, activated CD8 + T cells that arise during virus infections are indeed antigen-
specific. How long antigen-specific cells persist at these high levels remains to be
determined. Furthermore it is not known how the situation post-IM compares to that in
the majority of EBV carriers who experience clinically silent primary infection, mainly
during childhood, and then carry the virus for life.
This chapter describes a study of the frequency and specificity of EBV-reactive T cells in
eleven long term EBV carriers with no history of IM, as well as two individuals who
suffered IM 10 and 15 years ago (donors VN and RO respectively). Three different
methods were used to analyse T cell frequency: limiting dilution analysis, ELISpot assays
to detect IFNy release, and direct staining of antigen-specific T cells with MHC-peptide
tetrameric complexes. The main focus was on the responses to two immunodominant
epitopes from EBV lytic proteins BZLF1 (HLA-B8 restricted RAKFKQLL) and BMLF1
(HLA-A2 restricted GLCTLVAML), compared with responses to epitopes from EBV
latent proteins.
70

Chapter 5 - Memory Response to EBV
5.1. Measurement of T cell frequencies by LDA
Initially I used limiting dilution analysis to estimate the frequency of T cells reactive with
the two immunodominant lytic protein epitopes (RAKFKQLL and GLCTLVAML), in
eight EBV-seropositive individuals with one or both of the appropriate HLA restricting
alleles (HLA-B8 and HLA-A2). T cells reactive with these epitopes were detected in all
eight donors studied, and the data are summarised in the relevant section of Table 5.1.
The frequency of T cells specific for the HLA-B8 restricted BZLF1 epitope
(RAKFKQLL) ranged from 60-725/106 PBMC (donors CH, PA, CM and LU), while the
frequency of T cells specific for the HLA-A2 restricted BMLF1 epitope (GLCTLVAML)
ranged from 10-380/106 PBMC (donors LU, JS, VN, RO and LC).
For comparison, the frequency of T cells reactive with immunodominant epitopes from
EBV latent antigens was also evaluated in six of these eight donors, and in two additional
individuals (DM and PB). This involved the HLA-B8 restricted epitope, FLRGRAYGL
[Burrows et al, 1992], the HLA-B7 restricted epitope, RPPIFIRRL [Hill et al, 1995], and
the HLA-A11 restricted epitope, IVTDFSVIK [Gavioli et al, 1993]2 . The frequency of T
cells reactive with these epitopes ranged from undetectable levels to 240/106 PBMC in
our donors. The T cell response to another HLA-All-restricted epitope AVFDRKSDAK
is often subdominant, and consistent with this, low frequencies of T cells specific for this
epitope were detectable in the three HLA-All positive donors studied (CM, DM and
PB).
In all four HLA-B8 positive donors parallel LDAs showed that the response to the
immunodominant lytic protein epitope RAKFKQLL was stronger than the response to the
immunodominant latent protein epitope FLRGRAYGL.
See Appendix B for a listing of EBV-specific CTL epitopes.
71
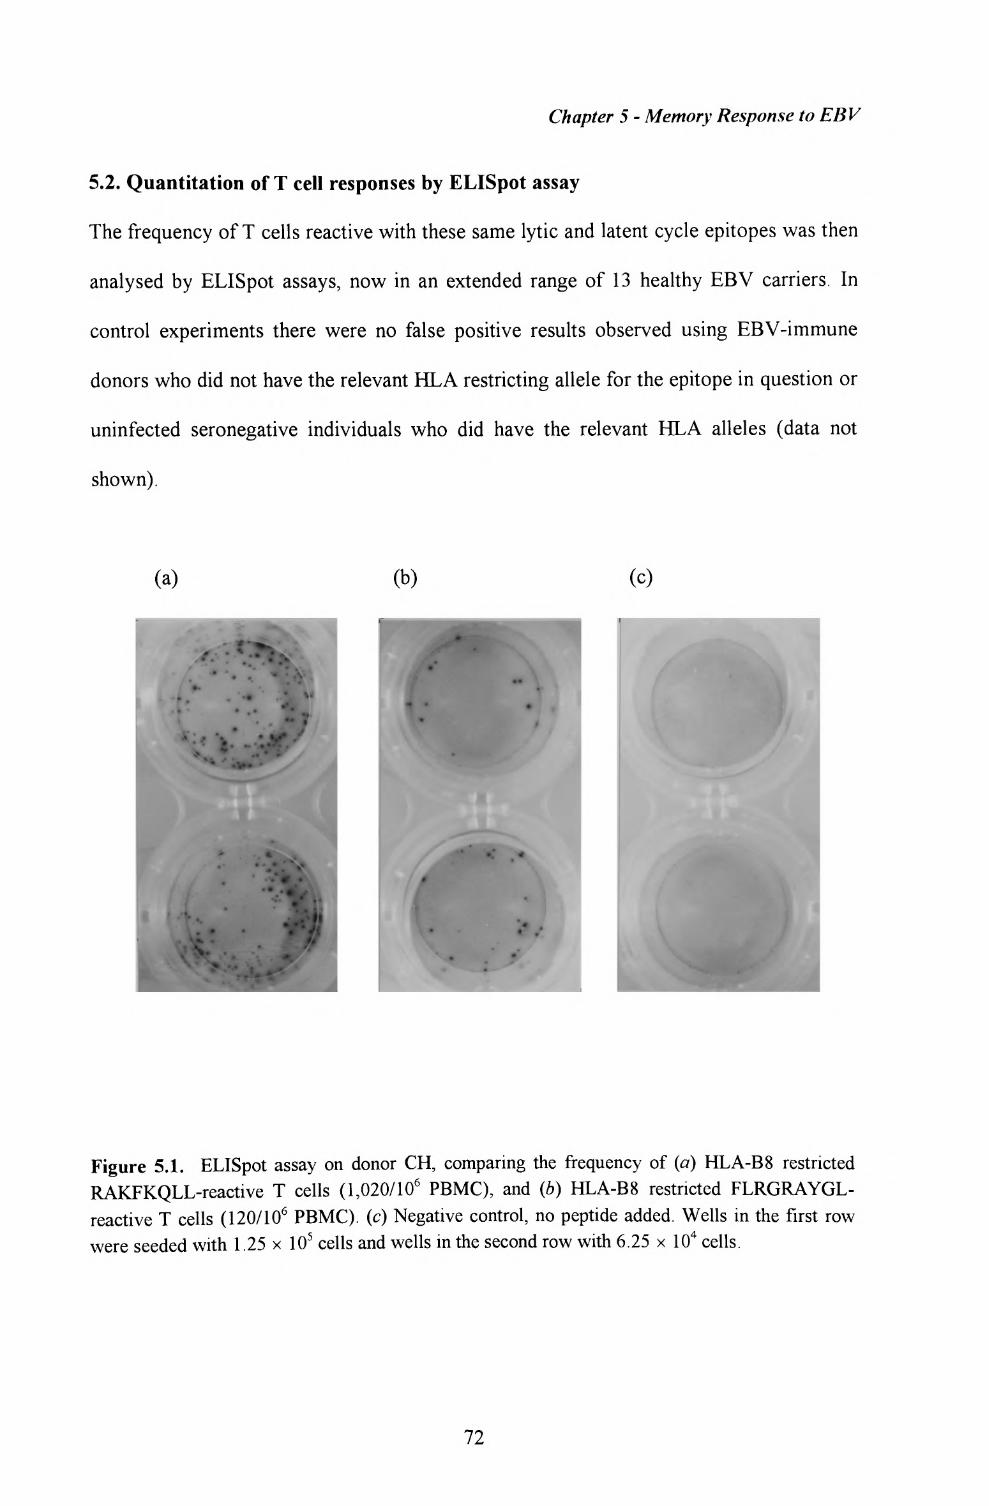
Chapter 5 - Memory Response to EBV
5.2. Quantitation of T cell responses by ELISpot assay
The frequency of T cells reactive with these same lytic and latent cycle epitopes was then
analysed by ELISpot assays, now in an extended range of 13 healthy EBV carriers. In
control experiments there were no false positive results observed using EBV-immune
donors who did not have the relevant HLA restricting allele for the epitope in question or
uninfected seronegative individuals who did have the relevant HLA alleles (data not
shown).
(a) (b) (c)
Figure 5.1. ELISpot assay on donor CH, comparing the frequency of (a) HLA-B8 restricted RAKFKQLL-reactive T cells (1,020/106 PBMC), and (b) HLA-B8 restricted FLRGRAYGL- reactive T cells (120/106 PBMC). (c) Negative control, no peptide added. Wells in the first row were seeded with 1.25 x 10⁵ cells and wells in the second row with 6.25 x 10⁴ cells.
72
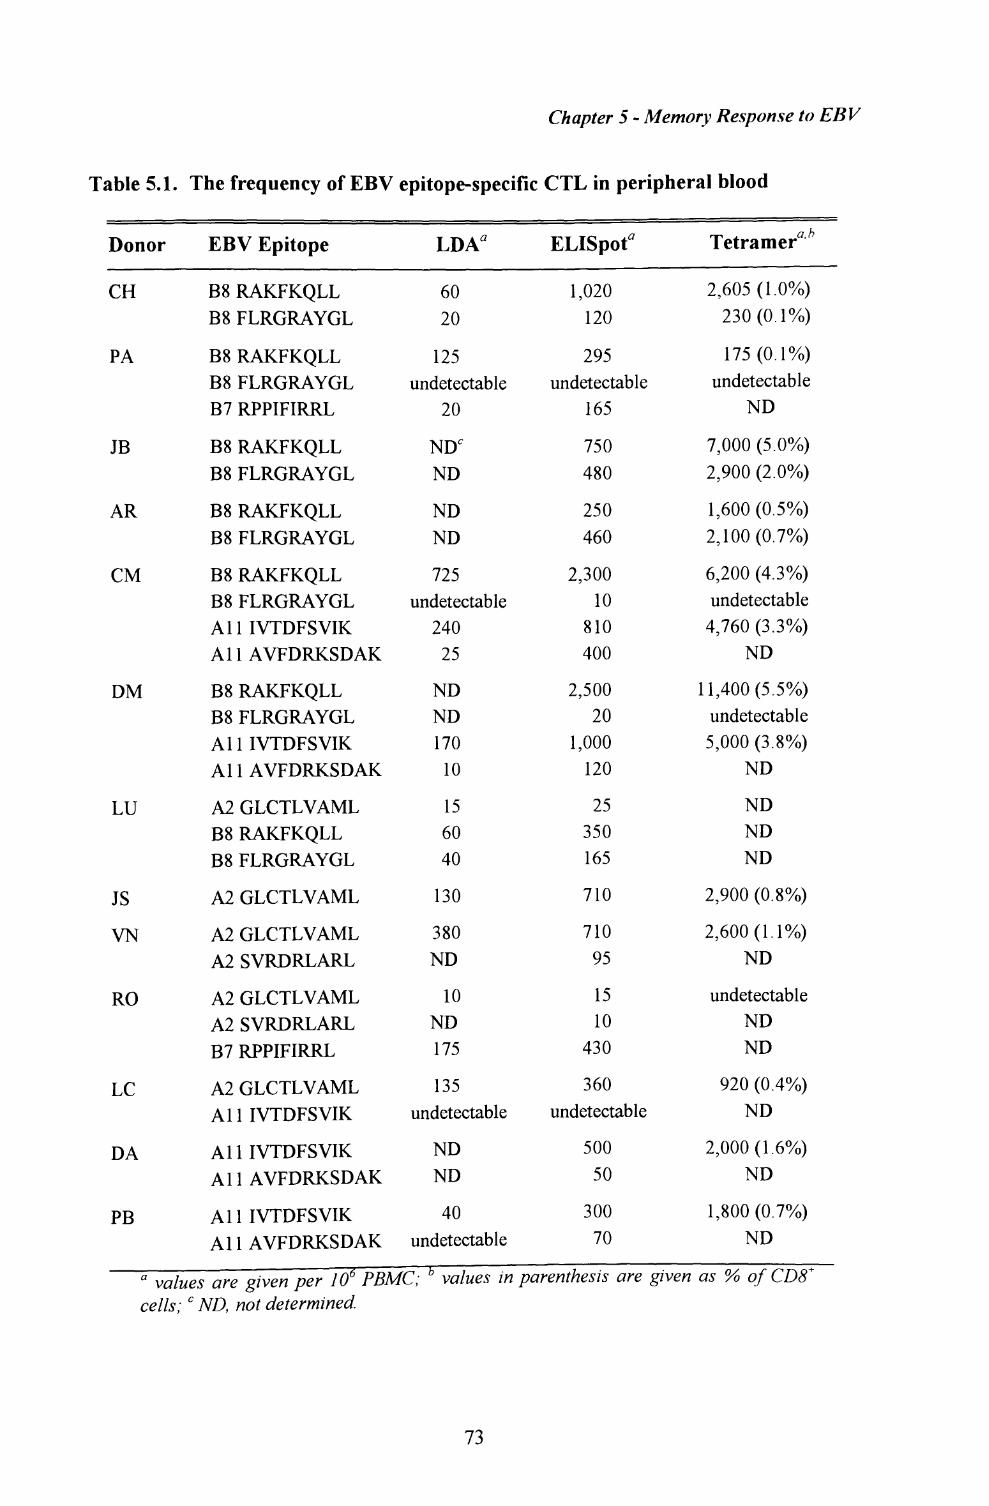
Chapter 5 - Memory Response to EBV
Table 5.1. The frequency of EBV epitope-specific CTL in peripheral blood
Donor
CH
PA
JB
AR
CM
DM
LU
JS
VN
RO
LC
DA
PB
EBV Epitope
B8 RAKFKQLLB8 FLRGRAYGL
B8 RAKFKQLLB8 FLRGRAYGLB7 RPPIFIRRL
B8 RAKFKQLLB8 FLRGRAYGL
B8 RAKFKQLLB8 FLRGRAYGL
B8 RAKFKQLLB8 FLRGRAYGLAll IVTDFSVIKAll AVFDRKSDAK
B8 RAKFKQLLB8 FLRGRAYGLAll IVTDFSVIKAll AVFDRKSDAK
A2 GLCTLVAMLB8 RAKFKQLLB8 FLRGRAYGL
A2 GLCTLVAML
A2 GLCTLVAMLA2 SVRDRLARL
A2 GLCTLVAMLA2 SVRDRLARLB7 RPPIFIRRL
A2 GLCTLVAMLAll IVTDFSVIK
All IVTDFSVIKAll AVFDRKSDAK
All IVTDFSVIKAll AVFDRKSDAK
LDA*
6020
125undetectable
20NDC
ND
NDND
725undetectable
24025
NDND170
10
156040
130
380ND
10ND175
135undetectable
NDND
40undetectable
— ~ — r ——— : ———————
ELISpof
1,020120
295undetectable
165
750480
250460
2,30010
810400
2,50020
1,000120
25350165
710
71095
1510
430
360undetectable
50050
30070
Tetramer0>
2,605(1.0%)230(0.1%)
175(0.1%)undetectable
ND
7,000 (5.0%)2,900 (2.0%)
1,600 (0.5%)2,100(0.7%)
6,200 (4.3%)undetectable4,760 (3.3%)
ND
11,400(5.5%)undetectable5,000 (3.8%)
ND
NDNDND
2,900 (0.8%)
2,600(1.1%)ND
undetectableNDND
920 (0.4%)ND
2,000(1.6%)ND
1,800 (0.7%)ND
a values are given per 10 PBMC; values in parenthesis are given as % of CDS' cells; ° ND, not determined.
73
Chapter 5 - Memory Response to EBV
As summarised in Table 5.1., ELISpot assays using lytic epitopes indicated that the
frequency of HLA-B8 restricted, RAKFKQLL-reactive T cells ranged from 250-
2,500/106 PBMC, and the frequency of HLA-A2 restricted, GLCTLVAML-reactive T
cells ranged from 15-710/106 PBMC. T cells reactive with dominant and subdominant
epitopes from the EBV latent proteins were also detected at frequencies up to 1,000/106
PBMC, with responses to the HLA-A11 restricted epitope IVTDFSVIK being
particularly strong. Most importantly, the estimates of T cell frequency using ELISpots
were higher than those obtained using LDAs, although the relative hierarchy of responses
in any one individual was not altered.
5.3. Enumeration of antigen-specific T cells using MHC-peptide tetrameric
complexes
Next I analysed the frequency of T cells specific for two lytic cycle epitopes
(RAKFKQLL and GLCTLVAML) and two latent epitopes (FLRGRAYGL and
IVTDFSVIK) using MHC-peptide tetrameric complexes. In all these experiments PBMC
were stained with PE-labelled tetrameric complexes in combination with Tricolor-
conjugated anti-CD8, and assayed by two-colour FACS analysis.
In eleven of the twelve individuals studied specific staining with one or more of the
relevant tetramers was clearly detectable (Table 5.1. and Figure 5.2.). Thus, using the
HLA-B8/RAK tetramer, epitope-specific T cells were detected in all six HLA-B8
positive individuals tested, and their frequencies were unusually high. Fig 5.2.a and 6,
show staining of PBMC from donor CM, in whom 6,200/106 PBMC (4.3% CD8 + T cells)
reacted with the HLA-B8/RAK tetramer, and from donor JB, in whom 7,000/106 PBMC
(5.0% CD8+ T cells ) reacted with this tetramer. A third HLA-B8 positive donor DM,
gave 11,400 reactive cells/106 PBMC with this reagent, equivalent to 5.5% CD8+ T cells
74
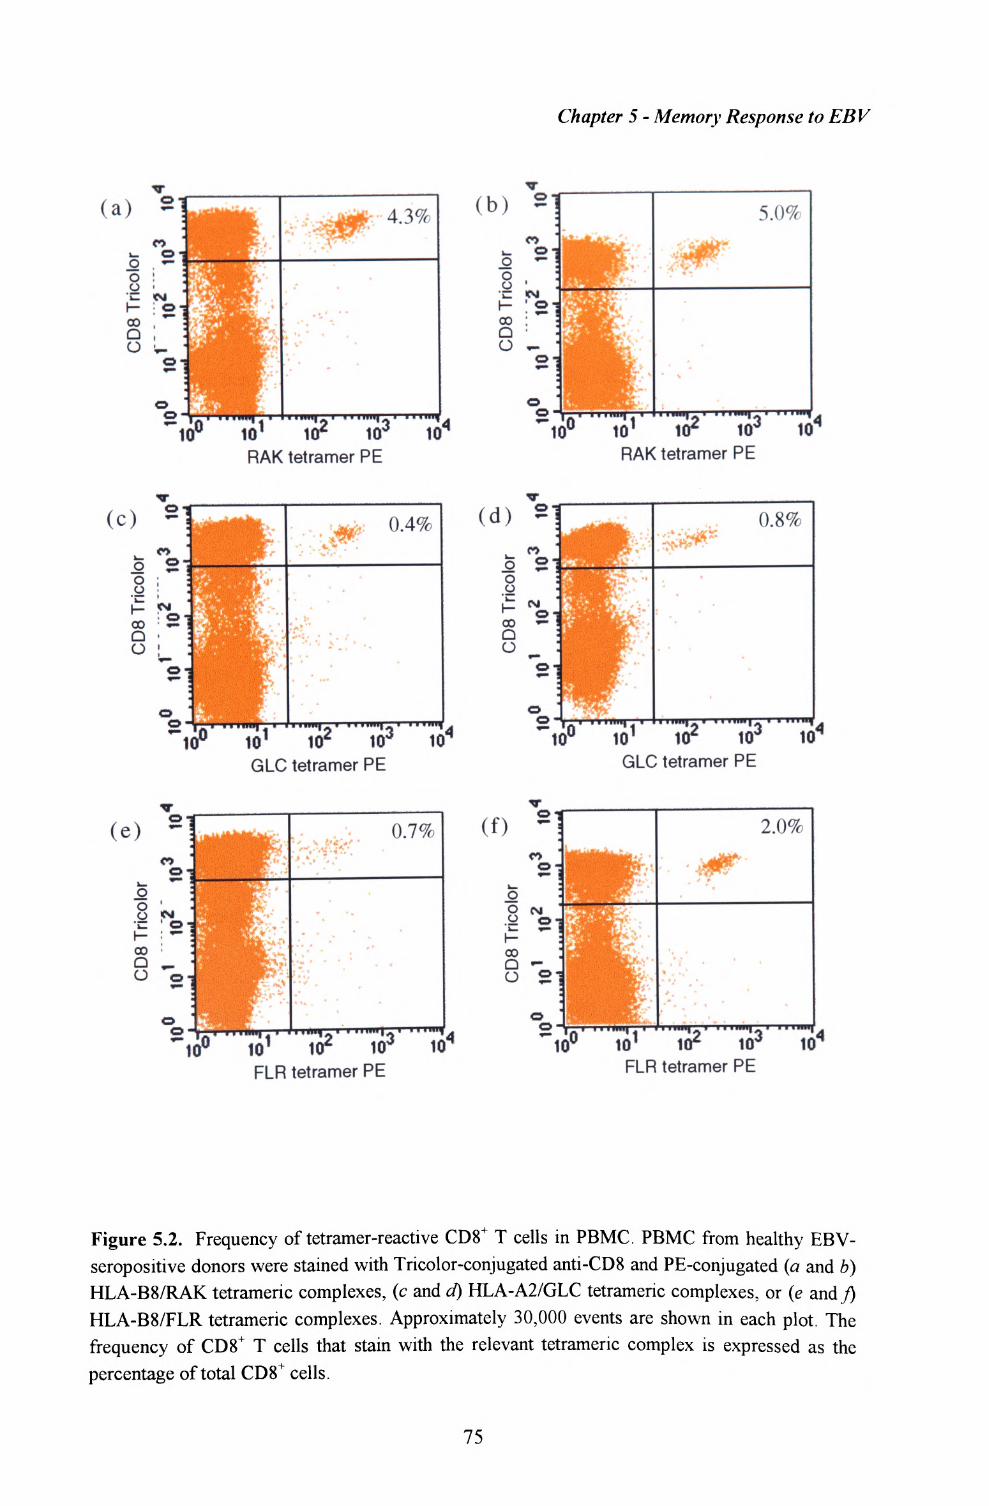
Chapter 5 - Memory Response to EBV
(a) 2 : 4.3%
RAK tetramer PE
(b) *<*> O
oo : O • O ~
o
10V,„., IO 1
5.0%
— , . — , NT 10J
RAK tetramer PE
(O S
- ^ """i 1 - • • •—12- Hr IO1 NT 10V
GLC tetramer PE
(d) S| 0.8%
.._, IO3
GLC tetramer PE
10'
(e) '
W f-» IIIIIM|.i llliHf-l t ••.... |-T^-» ""*lj
10° to1 id2 10* 10FLR tetramer PE
(f)
00
O 2'
O O-
2.0%
iS2FLR tetramer PE
io3 IO4
Figure 5.2. Frequency of tetramer-reactive CD8+ T cells in PBMC. PBMC from healthy EBV-
seropositive donors were stained with Tricolor-conjugated anti-CD8 and PE-conjugated (a and b) HLA-B8/RAK tetrameric complexes, (c and d) HLA-A2/GLC tetrameric complexes, or (e and /)
HLA-B8/FLR tetrameric complexes. Approximately 30,000 events are shown in each plot The
frequency of CD8+ T cells that stain with the relevant tetrameric complex is expressed as the percentage of total CD8+ cells.
75
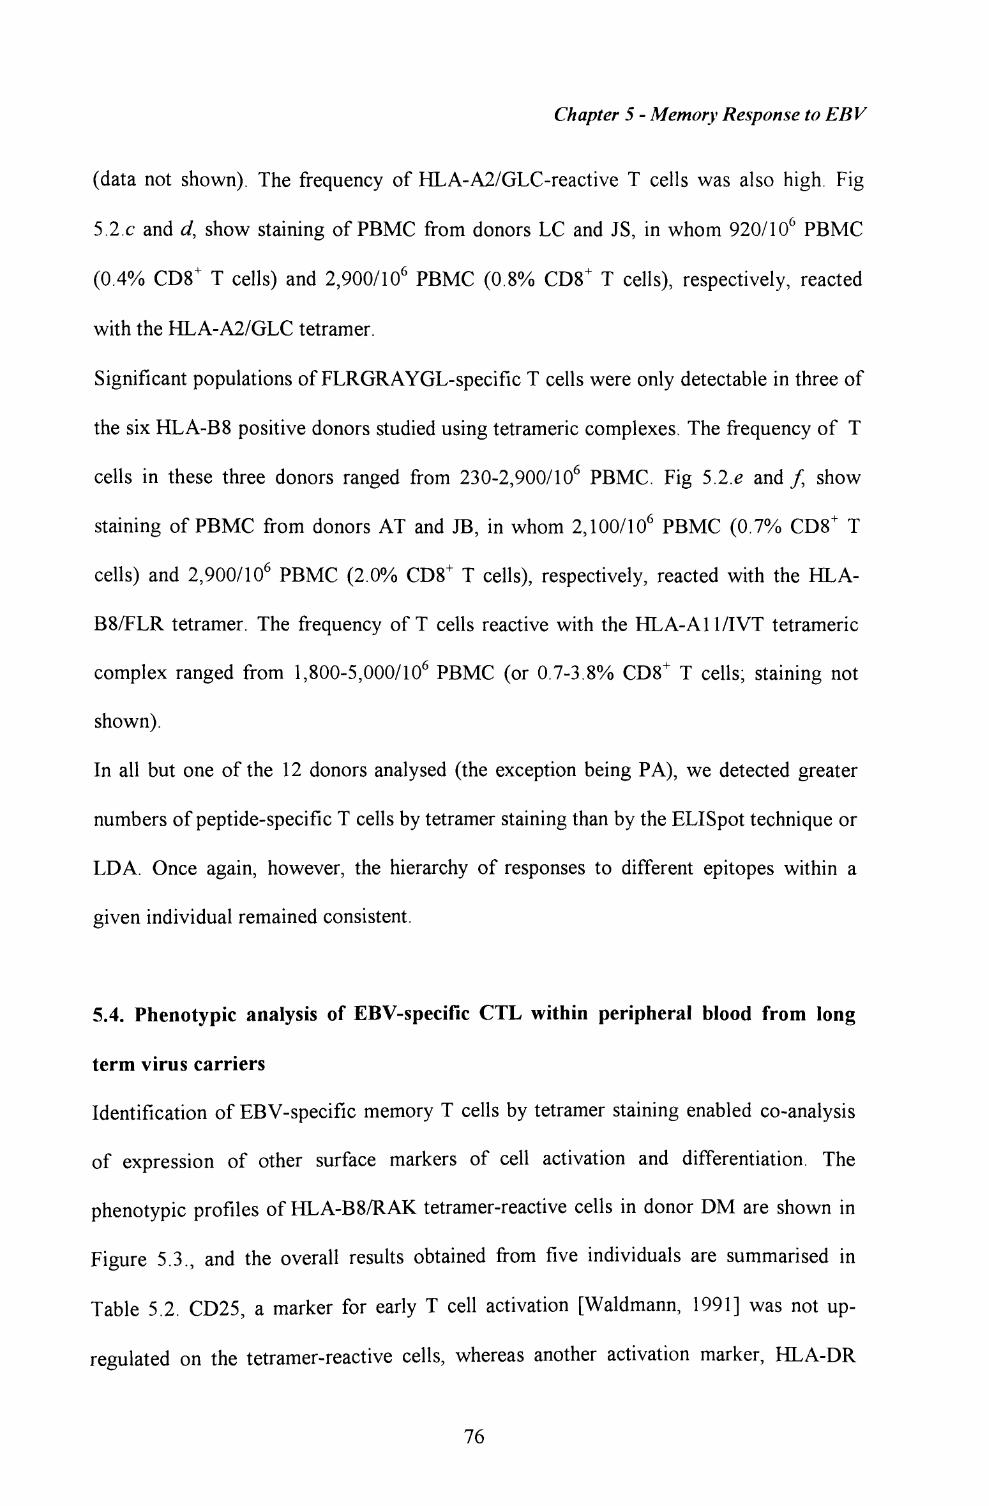
Chapter 5 - Memory Response to EBV
(data not shown). The frequency of HLA-A2/GLC-reactive T cells was also high. Fig
5.2.c and d, show staining of PBMC from donors LC and JS, in whom 920/106 PBMC
(0.4% CD8 + T cells) and 2,900/106 PBMC (0.8% CD8 + T cells), respectively, reacted
with the HLA-A2/GLC tetramer.
Significant populations of FLRGRAYGL-specific T cells were only detectable in three of
the six HLA-B8 positive donors studied using tetrameric complexes. The frequency of T
cells in these three donors ranged from 230-2,900/106 PBMC. Fig 5.2.e and / show
staining of PBMC from donors AT and JB, in whom 2,100/106 PBMC (0.7% CD8+ T
cells) and 2,900/106 PBMC (2.0% CD8+ T cells), respectively, reacted with the HLA-
B8/FLR tetramer. The frequency of T cells reactive with the HLA-A11/IVT tetrameric
complex ranged from 1,800-5,000/106 PBMC (or 0.7-3.8% CD8+ T cells; staining not
shown).
In all but one of the 12 donors analysed (the exception being PA), we detected greater
numbers of peptide-specific T cells by tetramer staining than by the ELISpot technique or
LDA. Once again, however, the hierarchy of responses to different epitopes within a
given individual remained consistent.
5.4. Phenotypic analysis of EBV-specific CTL within peripheral blood from long
term virus carriers
Identification of EBV-specific memory T cells by tetramer staining enabled co-analysis
of expression of other surface markers of cell activation and differentiation. The
phenotypic profiles of HLA-B8/RAK tetramer-reactive cells in donor DM are shown in
Figure 5.3., and the overall results obtained from five individuals are summarised in
Table 5.2. CD25, a marker for early T cell activation [Waldmann, 1991] was not up-
regulated on the tetramer-reactive cells, whereas another activation marker, HLA-DR
76
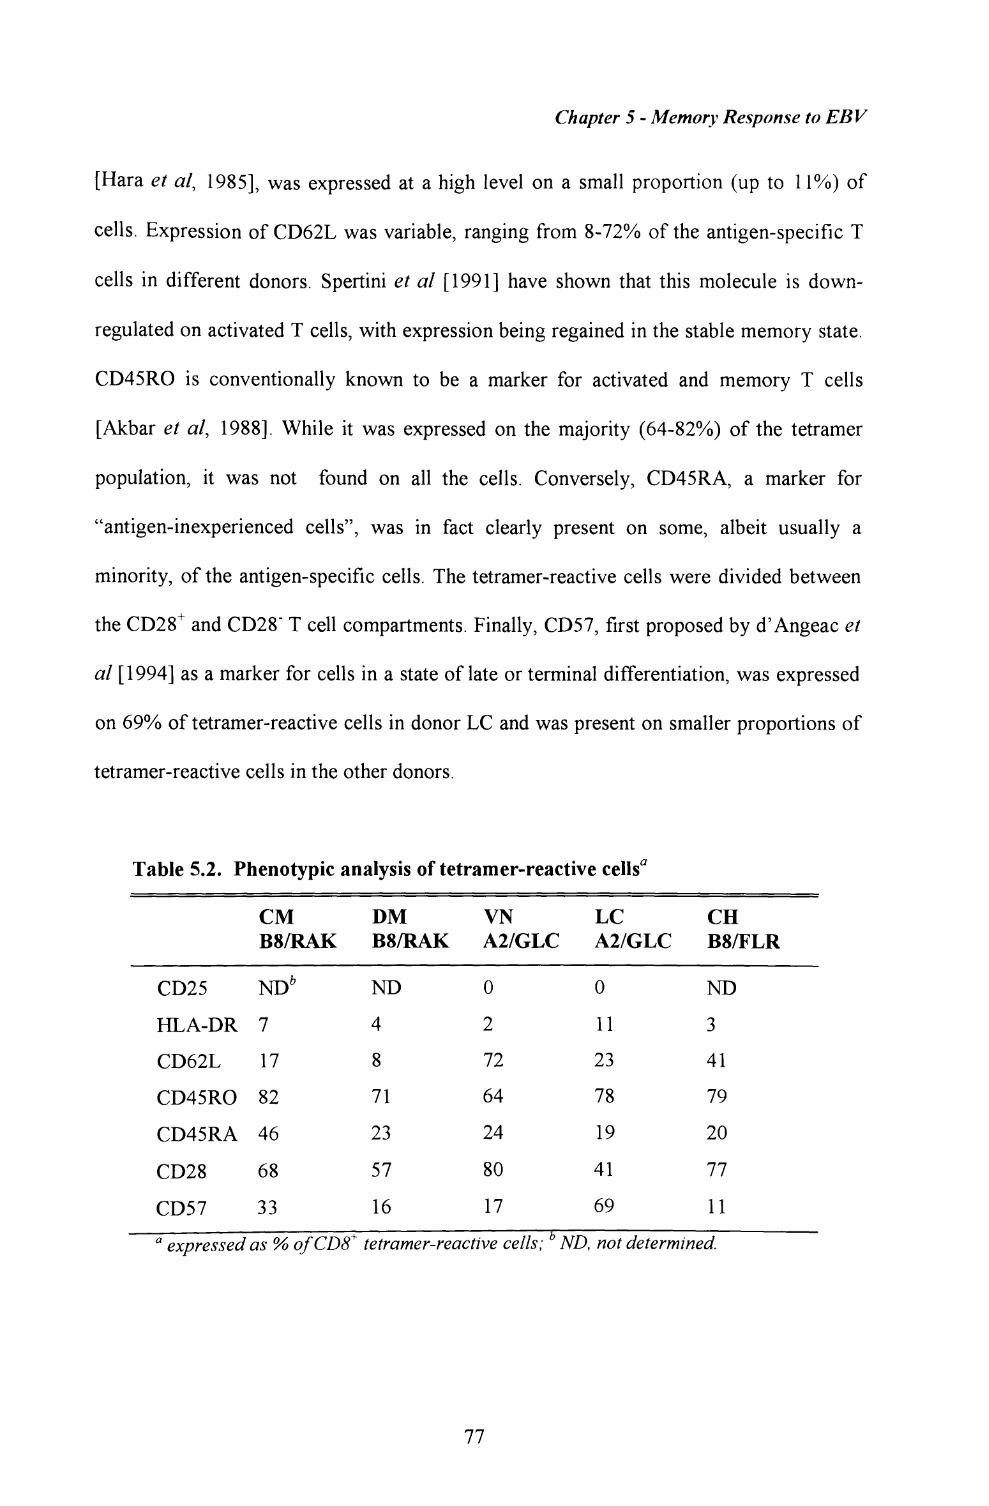
Chapter 5 - Memory Response to EBV
[Hara et al, 1985], was expressed at a high level on a small proportion (up to 11%) of
cells. Expression of CD62L was variable, ranging from 8-72% of the antigen-specific T
cells in different donors. Spertini et al [1991] have shown that this molecule is down-
regulated on activated T cells, with expression being regained in the stable memory state.
CD45RO is conventionally known to be a marker for activated and memory T cells
[Akbar et al, 1988]. While it was expressed on the majority (64-82%) of the tetramer
population, it was not found on all the cells. Conversely, CD45RA, a marker for
"antigen-inexperienced cells", was in fact clearly present on some, albeit usually a
minority, of the antigen-specific cells. The tetramer-reactive cells were divided between
the CD28+ and CD28" T cell compartments. Finally, CD57, first proposed by d' Angeac et
al [1994] as a marker for cells in a state of late or terminal differentiation, was expressed
on 69% of tetramer-reactive cells in donor LC and was present on smaller proportions of
tetramer-reactive cells in the other donors.
Table 5.2. Phenotypic analysis of tetramer-reactive cells0
CD25
HLA-DR
CD62L
CD45RO
CD45RA
CD28
CD57
CM B8/RAK
ND6
7
17
82
46
68
33
DM B8/RAK
ND
4
8
71
23
57
16
VN A2/GLC
0
2
72
64
24
80
17
LC A2/GLC
0
11
23
78
19
41
69
CH B8/FLR
ND
3
41
79
20
77
11
a expressed as % ofCD8+ tetramer-reactive cells; ND, not determined.
77
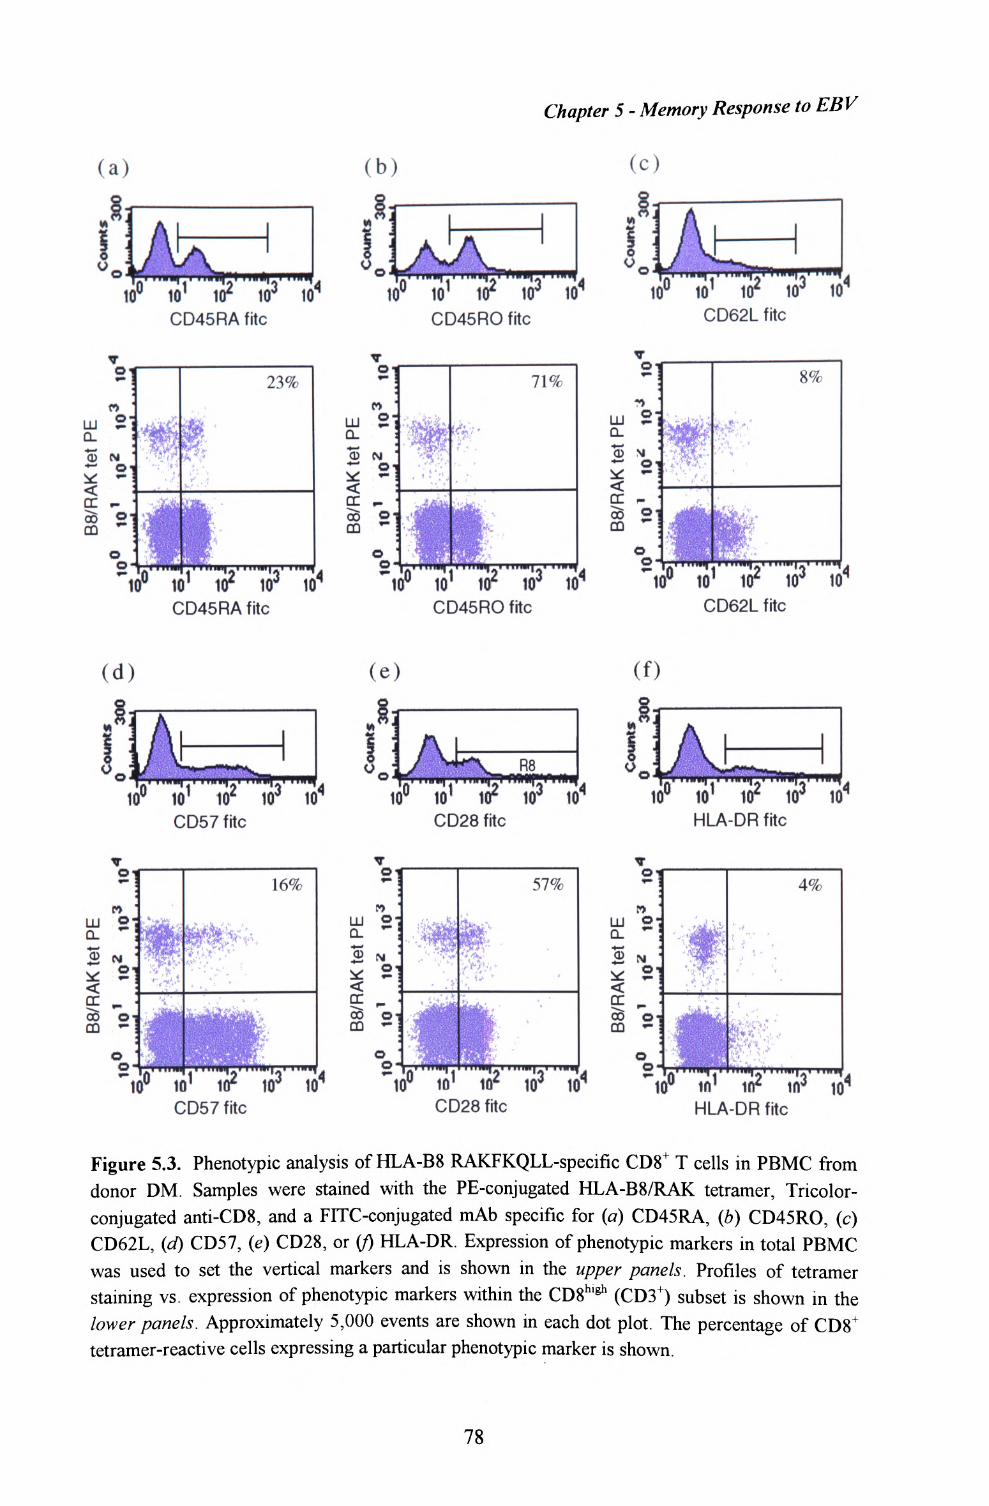
Chapter 5 - Memory Response to EBV
(a)
10 10 1 102 ID3CD45RA file
(b)
to"
vOi
uj 2
NO
CE ,.06 21CO «•
Oo
to 1 to2 to3CD45RO fitc
71%
,,,„-,,,„»,,,„,.,, ,,,»^ - |A""»1 ""-I*""-1*
10" 10' i(r to4 to* NT to 1 i<r to4CD45RA fitc
10"
CD45RO fitc
(c)
101
CD62L fitc
"10° to 1 to2 io3 io4CD62L fitc
(d)
10° 10CD57 fitc
CD57 fitc
(e)
.. •!».•!. ..»»,. ..r
to 1 ir to4CD28 fitc
Oi«~
wLU °"Q_ *"
^ 2"
o5 o-QQ *-
o0-
.-".'.» l*hj
. , ~ i V
,...u.,
57%
Hpt i •«
^W-' -?%'-*
''"'; '4 .'si • -''
. ...^ . . . ..^| , . ._^10" 10"
CD28 fitc
(0
I . - -«.'I . .. n »l .
10 1 10Z 103HLA-DR fitc
HLA-DR fitc
Figure 5.3. Phenotypic analysis of HLA-B8 RAKFKQLL-specific CD8+ T cells in PBMC from donor DM. Samples were stained with the PE-conjugated HLA-B8/RAK tetramer, Tricolor- conjugated anti-CD8, and a FITC-conjugated mAb specific for (a) CD45RA, (b) CD45RO, (c) CD62L, (d) CD57, (e) CD28, or (/) HLA-DR. Expression of phenotypic markers in total PBMC was used to set the vertical markers and is shown in the upper panels. Profiles of tetramer staining vs. expression of phenotypic markers within the CD8h'8h (CD3 +) subset is shown in the lower panels. Approximately 5,000 events are shown in each dot plot. The percentage of CD8+ tetramer-reactive cells expressing a particular phenotypic marker is shown.
78
Chapter 5 - Memory Response to EBV
5.5. Comparison of results obtained using the three methods
Estimates of T cell frequency varied substantially according to the method used, although
the hierarchy of dominance of the different responses was always similar. The lowest
frequencies were obtained from LDAs. By comparison ELISpot assays gave values that
were, on average, 5.3-fold higher than LDA values. Nevertheless there was a close
correlation between results obtained from ELISpot assays and those obtained from LDAs
(Fig 5.4.6; r = 0.88, p < 0.0001). The highest estimates of frequencies were obtained from
direct staining with tetrameric complexes. Thus the average values from tetramer staining
were 4.4-fold higher than those from ELISpots. The correlation between results obtained
from ELISpot assays and staining with tetrameric complexes was also good (Fig 5.4.a, r
= 0.86, p < 0.0001). However that between LDA results and staining with tetrameric
complexes was less close (Fig. 5.4.c; r = 0.69, p = 0.026).
Discussion
Historically, identification of antigen-specific T cells in humans has been accomplished
through indirect functional assays. This is largely due to the fact that individual TCRs
interact with peptide-MHC complexes with low affinity and fast off-rates [Matsui et al,
1994], making direct quantitation of antigen-specific T cells difficult. The traditional
LDA relies on the ability of cytotoxic precursor cells to survive, proliferate and express
cytolytic activity after two weeks in culture [reviewed in Tough & Sprent, 1998].
Activated CD8+ T cells prone to undergo apoptosis [Akbar et al, 1993] are therefore
unlikely to be detected in this assay. Furthermore, CD8+ T cells may not always have
cytolytic capacity, or they may be in a late differentiation compartment and consequently
79
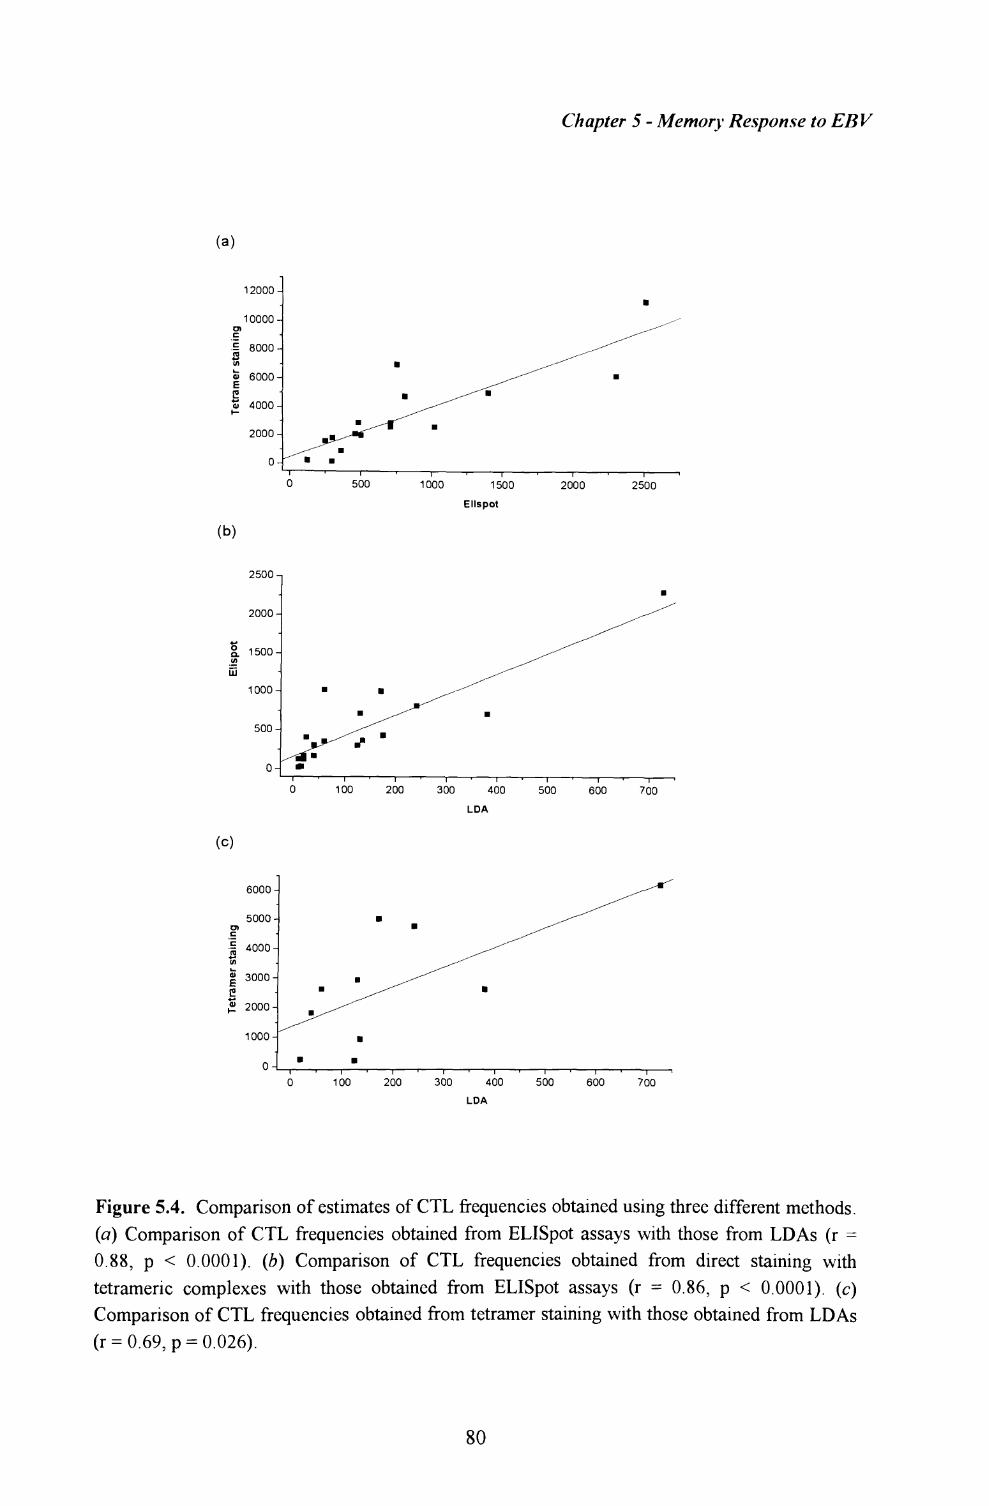
Chapter 5 - Memory Response to ERV
(a)
12000 -
10000 -
.E 8000- n
<u 6000 -
Eo> 4000 -
2000-
0-
(b)
2500-,
2000-
1. 1500-
1000-
500-
0-
(c)
6000-
5000-O)c £ 4000-1«
| 3000-
G,2 2000-
1000-
0-
500 1000 1500 2000 2500
Ellspot
100 200 300 400 500 600 700
LDA
100 200 300 400
LDA
500 600 700
Figure 5.4. Comparison of estimates of CTL frequencies obtained using three different methods. (a) Comparison of CTL frequencies obtained from ELISpot assays with those from LDAs (r = 0.88, p < 0.0001). (b) Comparison of CTL frequencies obtained from direct staining with tetramenc complexes with those obtained from ELISpot assays (r = 0.86, p < 0.0001). (c) Comparison of CTL frequencies obtained from tetramer staining with those obtained from LDAs (r = 0.69, p = 0.026).
80

Chapter 5 - Memory Response to EBV
lack adequate proliferative capacity. It is not surprising, therefore that this method
underestimates the actual frequency of antigen-specific cells. Likewise ELISpot assays
measure effector function (IFNy release) of antigen-specific T cells in response to antigen
stimulation. However with this approach there is no requirement for expansion or long-
term survival of the cells and it is not surprising that higher frequencies were obtained.
Nevertheless, not all cells that respond in an ELISpot assay are necessarily cytotoxic;
neither are all antigen-specific T cells capable of secreting IFNy upon peptide stimulation
[Maggi et al, 1994]. Direct staining with fluorochrome-labelled tetrameric complexes has
the advantage of detecting antigen-specific T cells according to their expression of a
specific TCR on the cell surface, and independent of their effector function or
proliferative potential. Following stimulation with antigen, however, TCRs may be down-
regulated [Viola & Lanzavecchia, 1996], and thus some acutely stimulated T cells may
not be detected using this method.
The differences in the estimates of T cells frequencies obtained using the three methods
and the imperfect correlation among these estimates suggests that the "memory pool" of
antigen-specific T cells within PBMC is functionally heterogenous. Double staining of T
cells with tetramers and antibodies against cell surface markers also showed evidence of
phenotypic heterogeneity within the epitope-specific population. Markers of activation,
memory and late differentiation, as well as costimulatory molecules were expressed on
variable proportions of EBV-specific CD8+ T cells within PBMC. While up-regulation of
both CD25 and HLA-DR is a feature of antigen-specific CD8+ T cells grown in vitro,
these were not features of the EBV tetramer-reactive cells stained immediately ex vivo.
Indeed, CD25 up-regulation was not detected, and HLA-DR was only expressed at high
levels on a minor subpopulation of the tetramer-reactive cells, suggesting that only a
small proportion of these cells had been recently activated in vivo. It is important to note,
81
Chapter 5 - Memory Response to EBV
however, that recently activated cells may have down-regulated their TCRs and not
reacted with the tetrameric complexes. Not all the tetramer reactive T cells were
CD45RObnght , the conventional marker for antigen-experienced cells. Conversely
CD45RA was expressed on a significant minority of the tetramer-reactive cells in many
donors studied; in this context it has recently been reported that a subpopulation of
CD45RA+ cells have high cytolytic activity and may be an important effector population
[Hamann et a/, 1997], This calls into question the validity of using these two markers to
distinguish antigen-primed and antigen-naive cells, at least within the CD8+ T cell
compartment [Akbar et al, 1988], Lastly up-regulation of CD57 and down-regulation of
CD28 seen on some of the antigen-specific cells may reflect recurrent restimulation and
perhaps terminal differentiation of subsets of CTL in vivo [Azuma et al, 1993]. It would
be interesting to investigate the functional properties of the phenotypically different
subpopulations of antigen-specific cells, especially in relation to IFNy release and in vitro
cloning assays.
T cell responses to the two lytic cycle protein epitopes were found in all the donors
expressing the appropriate HLA type. T cells specific for the HLA-B8 restricted
RAKFKQLL epitope from the lytic cycle protein BZLFl outnumbered those specific for
the HLA-B8 restricted FLRGRAYGL epitope from the EBV latent protein EBNA3A,
and accounted for up to 5.5% of the circulating CD8+ population. T cells reactive with
another epitope, GLCTLVAML, from the lytic protein BMLF1 were also easily
detectable in the memory of HLA-A2+ virus carriers. BZLFl is the first immediate early
protein to be expressed during lytic replication [Biggin et al, 1987] and initiates the
expression of early genes, to which group BMLF1 belongs [Kieff & Liebowitz, 1990].
BMLF1, in turn, functions as a rraws-activator of other lytic cycle genes [Lieberman et al,
1986]. T cell recognition of epitopes from these immediate early and early proteins
82
Chapter 5 - Memory Response to EBV
should enable effective elimination of virus-producing cells at an early stage, perhaps
before the formation and release of mature virions. Such T cells would, therefore, be
expected to control foci of virus replication within the oropharynx [Falk et al, 1997] as
well as regulate spontaneous reactivation from latency into lytic cycle, within infected B
cells generally [Rowe et al, 1992; Prang et al, 1997]. The control of EBV lytic infection
within B cells in peripheral blood may also have other advantages. EBV-transformed B
cells that have been induced into lytic cycle have been shown in vitro to have
superantigen-like activity and stimulate T cells expressing TCR BV13 chains [Sutkowski
et al, 1996]. Were this reproduced in vivo, persistent superantigenic stimulation of a
major subset of T cells could be detrimental to the host. In addition, the lytic cycle gene
BCRFl, expressed late in the lytic cycle, encodes an IL-10 homologue, which may be
involved in general suppression of T cell responses [Hsu et al, 1990].
T cells reactive with epitopes from EBV latent proteins were also easily detectable by
tetramer staining in this cohort of individuals; particularly strong responses to the HLA-
All restricted IVTDFSVIK epitope were noted in four of the five All + donors. It is
interesting that we were unable to detect a response to this epitope in the fifth donor, LC,
who is Asian, consistent with previous reports of a mutation in this epitope in EBV
isolates from South-East Asia [de Campos-Lima et al, 1993 & 1994]. The magnitude of
the latent antigen-specific response in long term virus carriers likewise reflects the fact
that the immune system is continually being challenged by EBV-infected B cells that are
reactivating in vivo from the resting state into virus-driven lymphoproliferation [Rowe et
al, 1992]. This recrudescence of EBV-driven lymphoproliferative lesions and their
control by EBV latent antigen-specific T cells appear to be central features of the healthy
carrier state. Thus, when T cell control is ablated by immunosuppresive therapy, there is a
significant incidence of lymphoproliferative disease, representing the opportunistic in
83
Chapter 5 - Memory Response to EHV
vivo outgrowth of latently infected cells [Ho et al, 1988]. Restoration of EBV latent
antigen-specific responses with CTL preparations is, in fact, sufficient to reverse this
otherwise fatal condition [Rooney et a/, 1995; Papadopoulos et al, 1994]. Therapies
aimed at boosting T cell responses to EBV antigens may also be useful in the
management of other EBV-associated malignancies, such as nasopharyngeal carcinomas
and Hodgkin's disease [Cochet et al, 1993; Brooks et al, 1992; Deacon et a/, 1993]. The
present methodologies, particularly ELISpot and tetramer assays, open up the possibility
of rapidly screening patients for their resident level of EB V-specific T cell immunity and
also of monitoring the frequency of T cells with the appropriate specificities in in vitro
reactivated populations destined for therapeutic use.
84
CHAPTER 6
Enriched Populations of EBV-Specific CTL in Synovial Fluid from Patients with Inflammatory Arthritis
An association between EBV and rheumatoid arthritis (RhA) was first proposed on
the basis of high titres of EBV-specific antibodies found in some patients with
rheumatoid arthritis [Catalano et al, 1979; Yao et al, 1986]. The observation that some of
the anti-EBV antibodies were cross-reactive with autoantigens such as collagen was put
forward as a further argument in support of the link [Baboonian et al, 1991]. However,
the importance of these findings in the pathophysiology of rheumatoid arthritis has never
been established. More recently, work published by Bonneville and colleagues has
reopened the debate about the importance of this virus in the aetiology of arthritis. David-
Ameline et al [1996] showed that a large proportion of T cell clones derived from
synovial fluid taken from one individual with rheumatoid arthritis, under polyclonal
activation conditions, recognised EBV-transformed lymphoblastoid cell lines in an HLA
restricted manner. Subsequent work revealed that these T cell clones recognised epitopes
from EBV lytic cycle proteins [Scotet et al, 1996]. Analysis of the TCR use of the EBV-
specific T cell clones and of the TCR repertoire of synovial fluid lymphocytes suggested
that the EBV-specific T cells were clonally expanded within the synovial fluid from this
donor [David-Ameline et al, 1996; Scotet etal, 1996]. In some other donors, short-term T
cell lines derived from synovial fluid lymphocytes, but not those derived from peripheral
blood lymphocytes, secreted low levels of TNF in response to stimulation with an EBV
85
Chapter 6 - EBVCTL in Rheumatoid Arthritis
antigen [Scotet et a/, 1996 & 1999]. These results suggest that EBV-specific T cells
might form a component of joint infiltrating lymphocytes in patients with RhA
CDS T cells dominate the lymphocyte population in synovial fluid from individuals with
chronic inflammatory arthritis. Whilst it is known that these CD8 + T cells are often
clonally or oligoclonally expanded, the specificity of the T cells and their relevance to the
pathogenesis of joint disease has remained unclear. In this study, I have used tetrameric
HLA-peptide complexes to investigate the T cell response to EBV and influenza in
individuals with inflammatory arthritis. The tetramers were complexed to peptide
epitopes from EBV latent and lytic proteins, and to an epitope from influenza A matrix
protein. Together with ELISpot assays for IFNy release, these were used to quantify and
characterise virus-specific T cells within paired samples of peripheral blood and synovial
fluid taken from patients with inflammatory arthritis.
6.1. Enumeration of virus-speciflc T cells within synovial fluid and peripheral blood
using HLA-peptide tetrameric complexes
HLA-peptide tetrameric complexes were used to analyse the frequency of CD8+ T cells
specific for two EBV lytic protein epitopes, the HLA-A2 restricted epitope
(GLCTLVAML) from BMLF1 [Steven et al, 1997; Scotet et a/, 1996] and the HLA-B8
restricted epitope (RAKFKQLL) from BZLF1 [Bogedain et al, 1995; Steven et al, 1997]
and for an EBV latent protein epitope, the HLA-B8 restricted epitope (FLRGRAYGL)
from EBNA3A [Burrows et al, 1992]. For comparison, the frequency of CD8+ T cells
specific for an immunodominant HLA-A2 restricted epitope (GILGFVFTL) from
influenza A matrix protein was also analysed [Morrison et al, 1992].
86
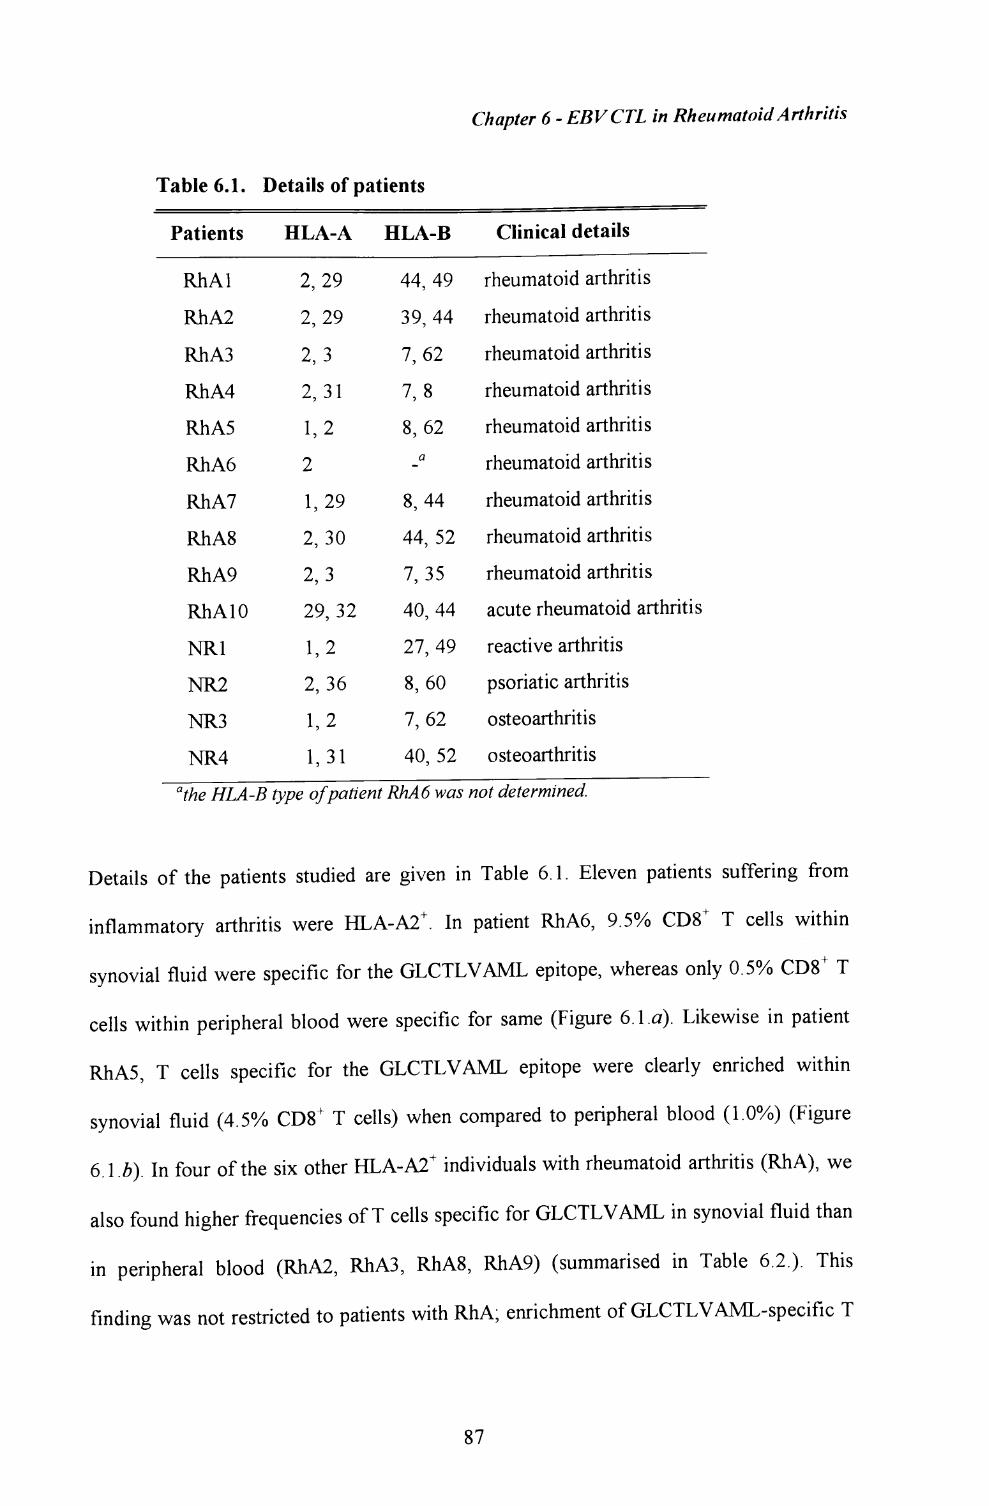
Chapter 6 - EBVCTL in Rheumatoid Arthritis
Table 6.1. Details of patients
Patients HLA-A HLA-B Clinical details
RhAl
RhA2
RhA3
RhA4
RhA5
RhA6
RhA7
RhA8
RhA9
RhAlO
NR1
NR2
NR3
NR4
2, 29 44, 49 rheumatoid arthritis
2, 29 39, 44 rheumatoid arthritis
2, 3 7,62 rheumatoid arthritis
2, 31 7, 8 rheumatoid arthritis
1,2 8,62 rheumatoid arthritis
2 -a rheumatoid arthritis
1,29 8,44 rheumatoid arthritis
2, 30 44, 52 rheumatoid arthritis
2, 3 7, 35 rheumatoid arthritis
29, 32 40, 44 acute rheumatoid arthritis
1,2 27,49 reactive arthritis
8, 60 psoriatic arthritis
osteoarthritis2,36
1,2
1,31
7,62
40, 52 osteoarthritis
9 the HLA-B type of patient RhA6 was not determined.
Details of the patients studied are given in Table 6.1. Eleven patients suffering from
inflammatory arthritis were HLA-A2+ . In patient RhA6, 9.5% CD8+ T cells within
synovial fluid were specific for the GLCTLVAML epitope, whereas only 0.5% CD8+ T
cells within peripheral blood were specific for same (Figure 6.1.a). Likewise in patient
RhA5, T cells specific for the GLCTLVAML epitope were clearly enriched within
synovial fluid (4.5% CD8+ T cells) when compared to peripheral blood (1.0%) (Figure
6.\.b). In four of the six other HLA-A2+ individuals with rheumatoid arthritis (RhA), we
also found higher frequencies of T cells specific for GLCTLVAML in synovial fluid than
in peripheral blood (RhA2, RhA3, RhA8, RhA9) (summarised in Table 6.2.). This
finding was not restricted to patients with RhA; enrichment of GLCTLVAML-specific T
87
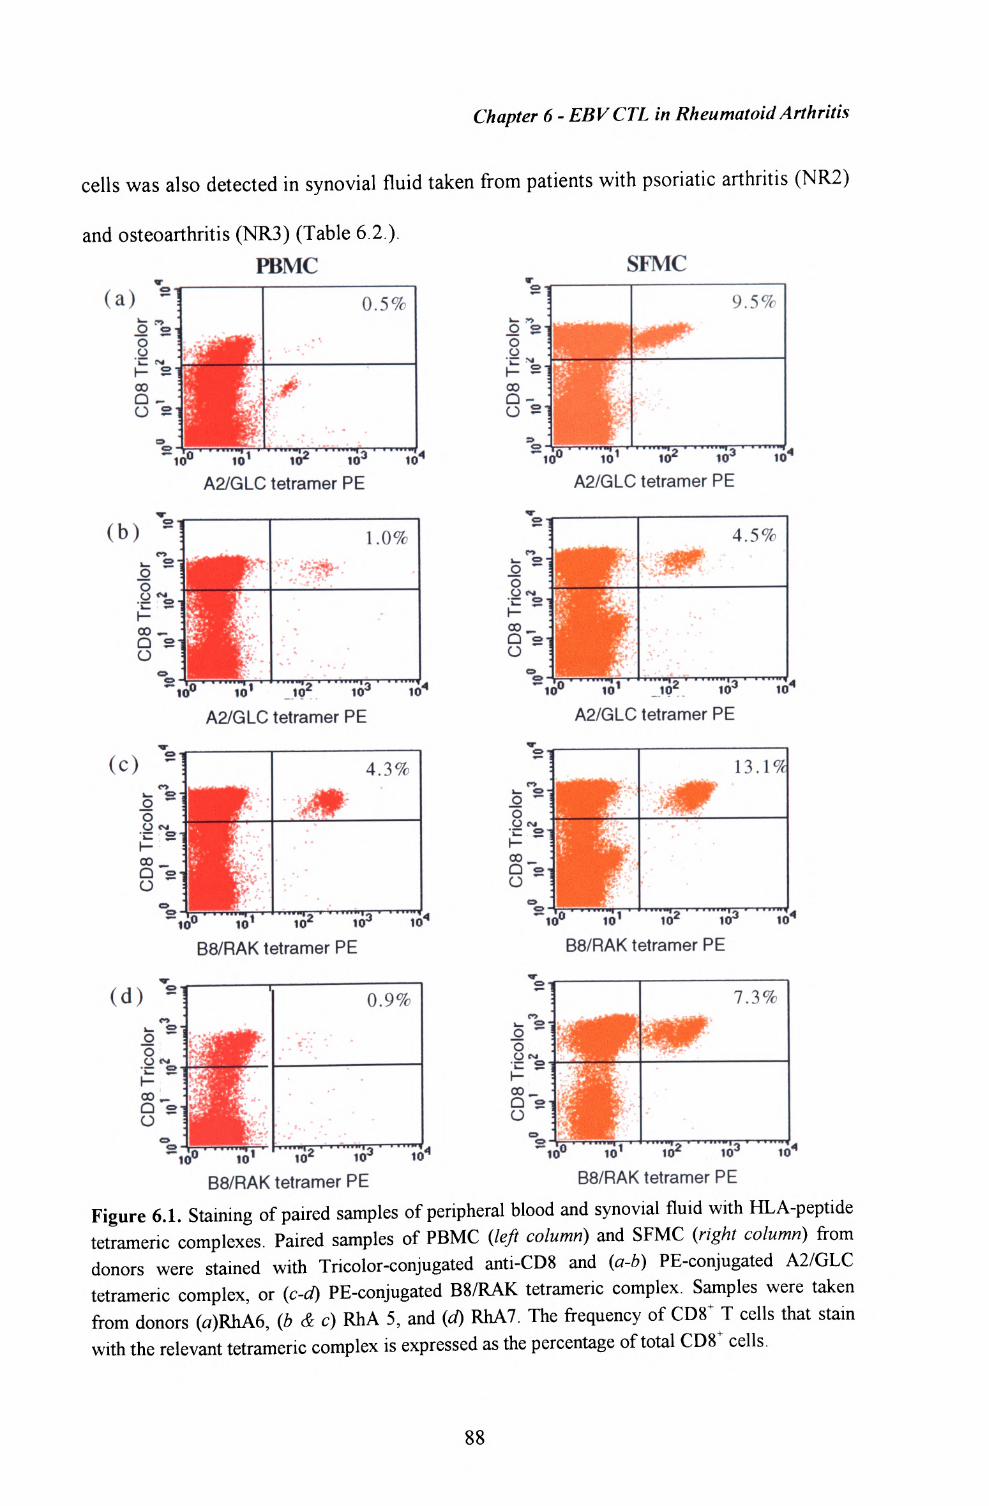
Chapter 6 - EBVCTL in Rheumatoid Arthritis
cells was also detected in synovial fluid taken from patients with psoriatic arthritis (NR2)
and osteoarthritis (NR3) (Table 6.2.).PBMC
(a) V
o o'»_ <••* I- S 00Q -O Si
0.5%
101 102 10*^"lO<
A2/GLC tetramer PE
(b) S
10° w 1
1.0%
io2A2/GLC tetramer PE
(c) s 4.3%
10" 10' 102 103
B8/RAK tetramer PE
(d) s 0.9%
10'
B8/RAK tetramer PE
SFMC
Oo •
00
9.5%
10' 103
A2/GLC tetramer PE
o•-Q s-j O
"10°
4.5%
10' 102 103 i4
A2/GLC tetramer PE
13.19?
10'"~i»102 103
B8/RAK tetramer PE
B8/RAK tetramer PE
Figure 6.1. Staining of paired samples of peripheral blood and synovial fluid with HLA-peptide tetrameric complexes. Paired samples of PBMC (left column) and SFMC (right column) from donors were stained with Tricolor-conjugated anti-CD8 and (a-b) PE-conjugated A2/GLC tetrameric complex, or (c-d) PE-conjugated B8/RAK tetrameric complex. Samples were taken from donors (a)RhA6, (b & c) RhA 5, and (d) RhA7. The frequency of CD8+ T cells that stain with the relevant tetrameric complex is expressed as the percentage of total CD8+ cells.

Chapter 6 - EBV CTL in Rheumatoid Arthritis
This cohort included four HLA-B8 + patients, three of whom suffered from RhA (RhA4, 5
and 7) and one from PsA (NR2). In patient RhA5, 13.1% CD8^ T cells within synovial
fluid reacted with the B8/RAKtetrameric complex compared with 4.3% within peripheral
blood (Fig 6.1.c). Similarly in patient RhA7, we found 7.3% CD8 + T cells were specific
for the RAKFKQLL epitope in synovial fluid compared with 0.9% CD8+ T cells within
the periphery (Fig 6.\.d). In the other two individuals, the frequencies of T cells specific
for the RAKFKQLL epitope were also higher in synovial fluid when compared with
peripheral blood, as summarised in Table 6.2.
Table 6.2. Frequency of CD8+ T cells which stain with the A2/GLC, A2/FluM,
B8/RAK and B8/FLR tetrameric complexes in peripheral blood and synovial fluid
Patient
RhAl
RhA2
RhA3
RhA4
RhA5
RhA6
RhA7
RhA8
RhA9
NR1
NR2
NR3
A2/GLC A2/FluM PBMC SFMC PBMC SFMC
undet." undet. \.6b 2.6
0.1
undet.
2.0 -d0.5
undet. undet.
1.0
0.5
N/A
0.1 1. 1.
0.6
0.7
0.4
0.1
4.5 undet. undet.
9.5
N/A
1 (L)e 0.2 0.2 3(R)
4.2 undet. undet.
0.2 0.4 0.4
1.0
2.3 0.3 0.3
B8/RAK B8/FLR PBMC SFMC PBMC SFMC
N/AC N/A
N/A N/A
N/A N/A0.8 6.8 undet. undet.
4.3 13.1 undet. 0.1
N/A N/A
0.9 7.3 0.5 0.4
N/A N/A
N/A N/A
N/A N/A
2.5 7.7 0.1 0.1
N/A N/A
aundet., undetectable; "expressed as %ofCD8+ tetramer-reactive T cells; cnot applicable, ie
samples from donors without the relevant HLA type; ddenotes not done; e (L) denotes left knee
& (R) denotes right knee.
89
Chapter 6 - EBVCTL in Rheumatoid Arthritis
T cells specific for the HLA-B8 restricted epitope (FLRGRAYGL) from the EBV latent
protein EBNA3A were either undetectable or only present at very low frequencies in
three of the four HLA-B8+ patients studied (Table 6.2.). This is consistent with the results
presented in Chapter 5, showing that the frequency of T cells specific for the
FLRGRAYGL epitope is usually lower than the frequency of T cells specific for the
RAKFKQLL epitope and is often below the threshold for detection by HLA-peptide
tetrameric complexes. In the fourth donor (RhA7) the frequency of FLRGRAYGL-
specific T cells was 0.5% CD8+ T cells in peripheral blood and 0.4% CD8 + T cells in
synovial fluid. Thus there was no evidence, using this technique, of enrichment of T cells
specific for this EBV latent epitope in synovial fluid.
A tetramer of HLA-A2 complexed to a peptide (GILGFVFTL) derived from the
influenza A matrix protein was synthesised to identify influenza-specific T cells in six
HLA-A2+ donors. Again, in keeping with previous reports [Dunbar et a/, 1998], T cells
specific for this epitope were present at very low or undetectable frequencies in the
majority of patients. In only one donor, RhAl, was any enrichment of influenza-specific
T cells detected in synovial fluid (Table 6.2.).
In general the frequencies of EBV and influenza reactive T cells within peripheral blood
of the patients studied were similar to those previously reported in healthy individuals
[Chapter 5; Dunbar et al, 1998], despite the use of immunosuppressive drugs.
90
Chapter 6 - EBV CTL in Rheumatoid Arthritis
6.2. Quantitation of EBV-specific T cells within synovial fluid and peripheral blood
using an ELISpot assay for IFNy secretion
ELISpot assays for IFNy secretion were used to confirm the synovial enrichment of T
cells specific for the two epitopes from the EBV lytic cycle proteins and to further
investigate frequencies of T cells specific for the FLRGRAYGL epitope from the EBV
latent protein and for the GILGFVFTL epitope from the influenza A matrix protein.
Estimates of the frequency of virus-specific T cells obtained with the ELISpot assay were
a mean of 19.9 and 20.1 fold lower than those obtained by tetramer staining in peripheral
blood and synovial fluid respectively. In the preceding chapter I showed that estimates of
the frequency of EBV-specific T cells obtained with the ELISpot assay in healthy control
individuals were a mean of 4.4 fold lower than those obtained by staining with tetrameric
complexes [Chapter 5]. Thus the ability of the EBV-specific T cells to secrete IFNy
appeared to be impaired in this patient group. Furthermore, the correlation between the
estimates of frequency obtained with ELISpot analysis and tetramer staining was poor,
suggesting inter-individual and inter-site differences in the functional capacity of the
antigen-specific cells. However the overall mean functional capacity of the T cells was
similar in synovial fluid and peripheral blood.
The frequency of T cells specific for the GLCTLVAML epitope and the RAKFKQLL
epitope from EBV lytic proteins, as estimated by the ELISpot assay, was higher in
synovial fluid than in peripheral blood in all the donors studied (summarised in Table
6.3.). Some enrichment of T cells specific for the EBV latent FLRGRAYGL epitope and
the influenza GILGFVFTL epitope was also detected, using this method (Table 6.3.).
However, the numbers of T cells specific for these two epitopes was always relatively
low, even in synovial fluid.
91
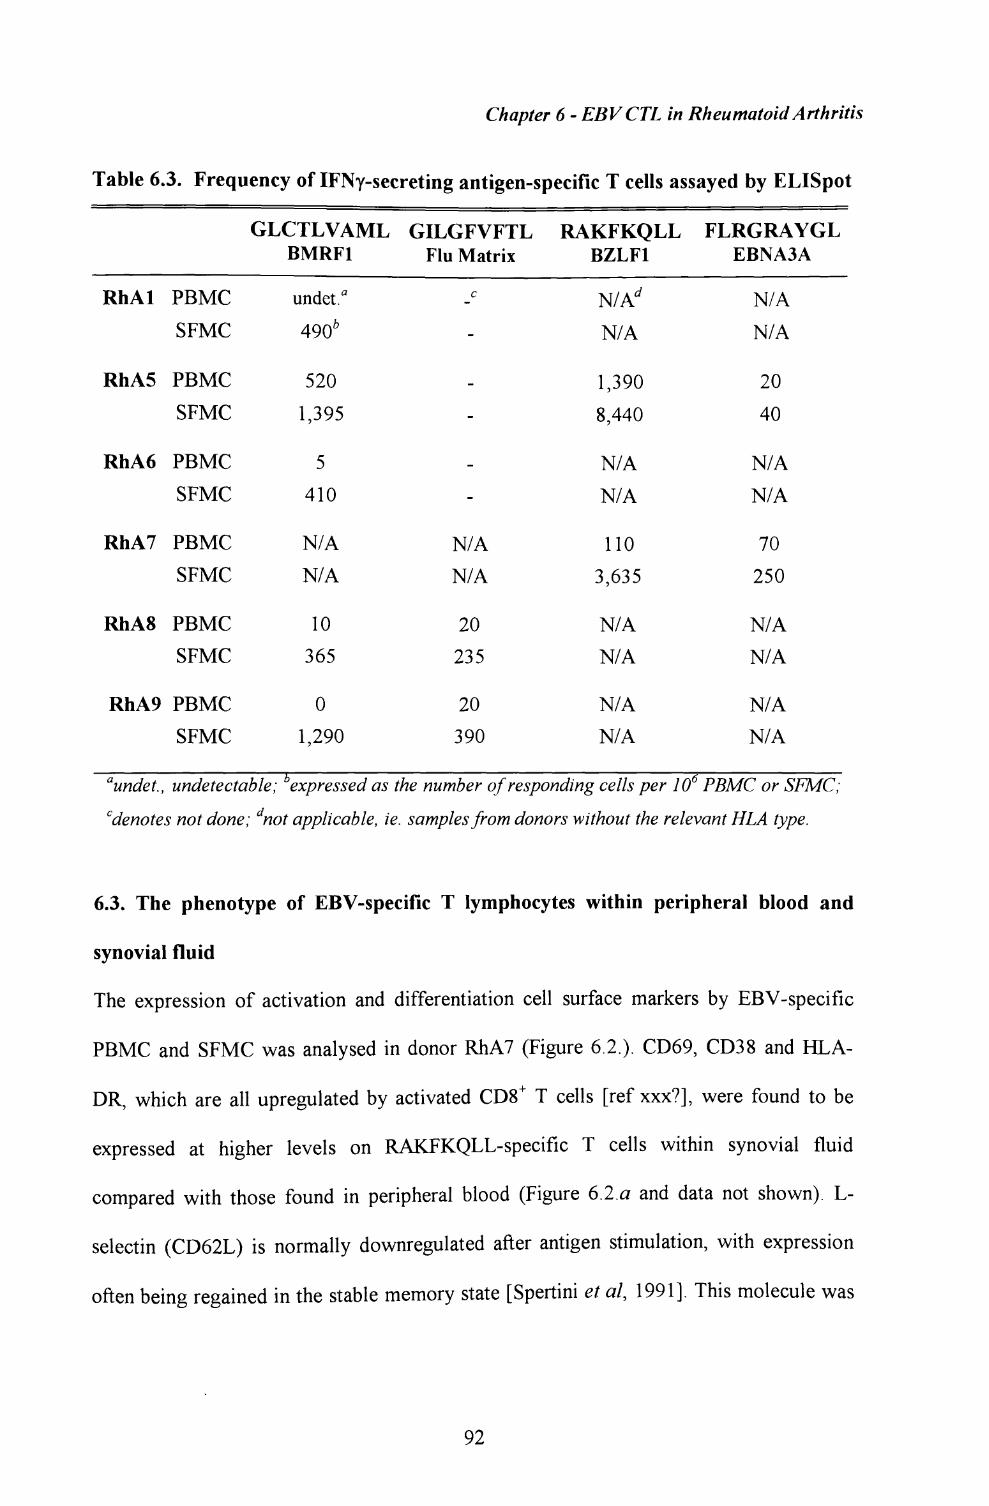
Chapter 6 - EBVCTL in Rheumatoid Arthritis
Table 6.3. Frequency of IFNy-secreting antigen-specific T cells assayed by ELISpot
GLCTLVAML GILGFVFTLBMRF1 Flu Matrix
RhAl
RhA5
RhA6
RhA7
RhA8
RhA9
PBMCSFMC
PBMCSFMC
PBMCSFMC
PBMCSFMC
PBMCSFMC
PBMCSFMC
undet."490*
5201,395
5410
N/A N/AN/A N/A
10 20365 235
0 201,290 390
RAKFKQLLBZLF1
N/A^
N/A
1,3908,440
N/AN/A
1103,635
N/AN/A
N/AN/A
FLRGRAYGL EBNA3A
N/AN/A
2040
N/AN/A
70250
N/AN/A
N/AN/A
aundet., undetectable; expressed as the number of responding cells per 10 PBMC or SFMC;
0 denotes not done', dnot applicable, ie. samples from donors without the relevant HLA type.
6.3. The phenotype of EBV-specific T lymphocytes within peripheral blood and
synovial fluid
The expression of activation and differentiation cell surface markers by EBV-specific
PBMC and SFMC was analysed in donor RhA7 (Figure 6.2.). CD69, CD38 and HLA-
DR, which are all upregulated by activated CD8+ T cells [ref xxx?], were found to be
expressed at higher levels on RAKFKQLL-specific T cells within synovial fluid
compared with those found in peripheral blood (Figure 6.2.0 and data not shown). L-
selectin (CD62L) is normally downregulated after antigen stimulation, with expression
often being regained in the stable memory state [Spertini et a/, 1991]. This molecule was
92
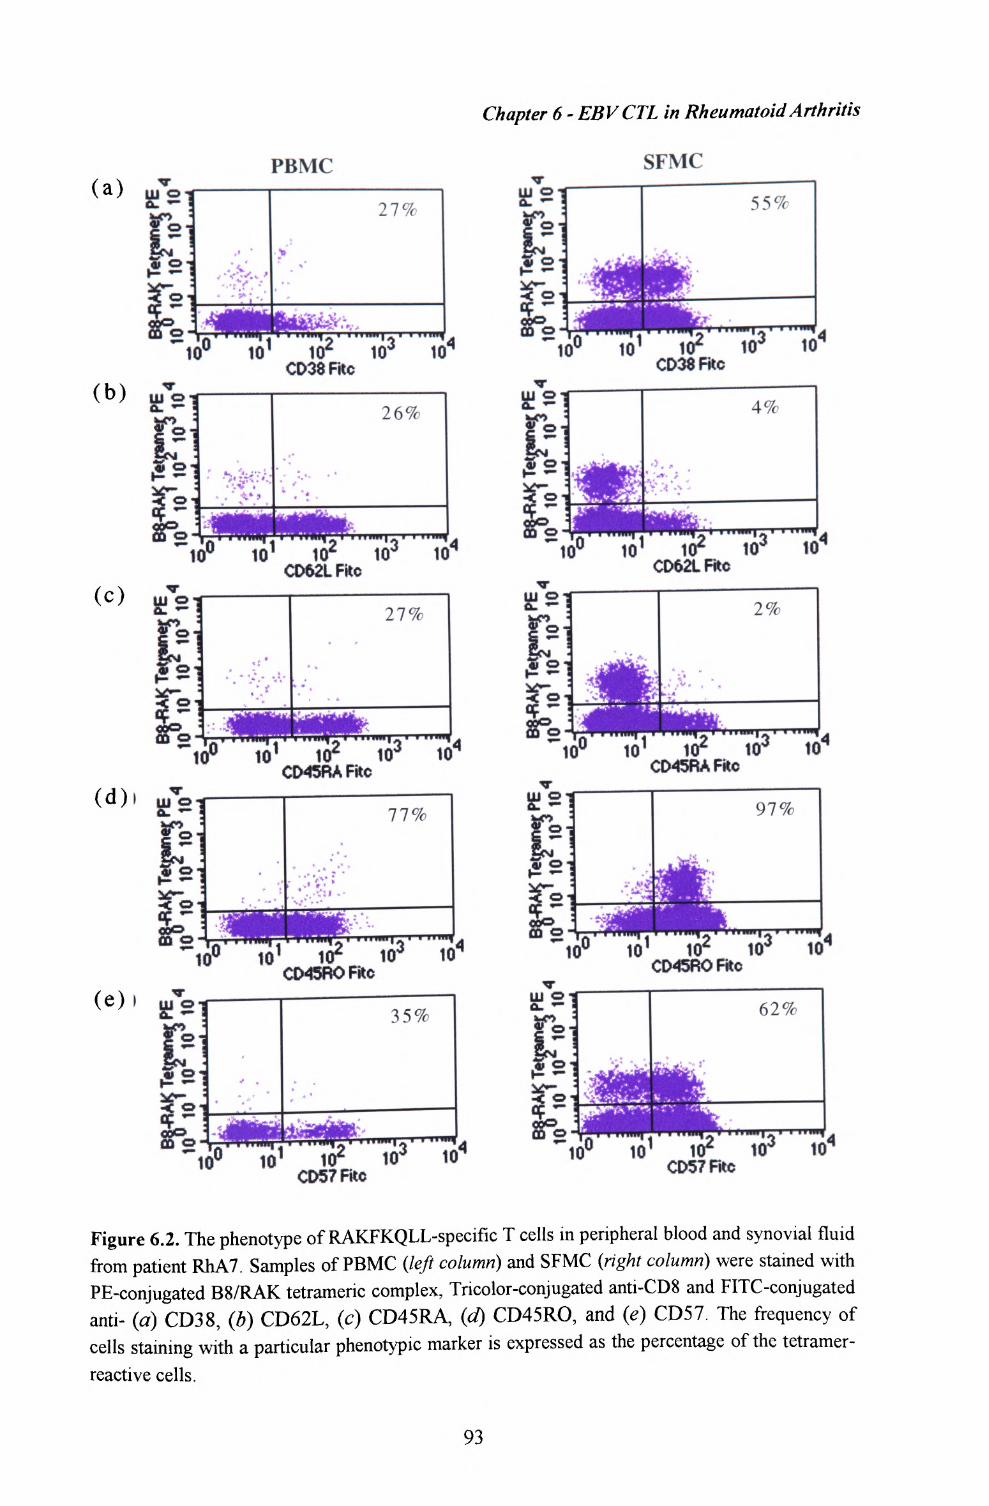
Chapter 6 - EBVCTL in Rheumatoid Arthritis
(a)PBMC
(d)
(e)
B*]g 2"8™ro 1ffl°o-
1
^ '
- V* * .
.^3S*^-
'n* "^"'H^o° to 1
^«l
""7J2-"
CD38FRC
27%
, . . ....^10^ 10
(b) „,»«
(c) j^o
10"
26%
' i, •*
^t 4 ' " *"*1 A ' ' ' ' "" I <S ' • " '™1 ^
to" to1 to* to** toqCD62LRo
to 1 to2 to*CMSRARtc
CD45ROFKCto
35%
| T » • • TW^ _
to1 to2CD57Rtc
to
SFMC
to 1 to2 to^ to'CD38R*c
*"to° to 1 to2 to3 to4CD62LFfcc
~"to° to 1 to2 to3CD45RORo
to 1 to2 to-CD57F«c
10
Figure 6.2. The phenotype of RAKFKQLL-specific T cells in peripheral blood and synovial fluid
from patient RhA7. Samples of PBMC (left column) and SFMC (right column) were stained with
PE-conjugated B8/RAK tetrameric complex, Tricolor-conjugated anti-CD8 and FITC-conjugated
anti- (a) CD38, (b) CD62L, (c) CD45RA, (d) CD45RO, and (e) CD57. The frequency of
cells staining with a particular phenotypic marker is expressed as the percentage of the tetramer-
reactive cells.
93
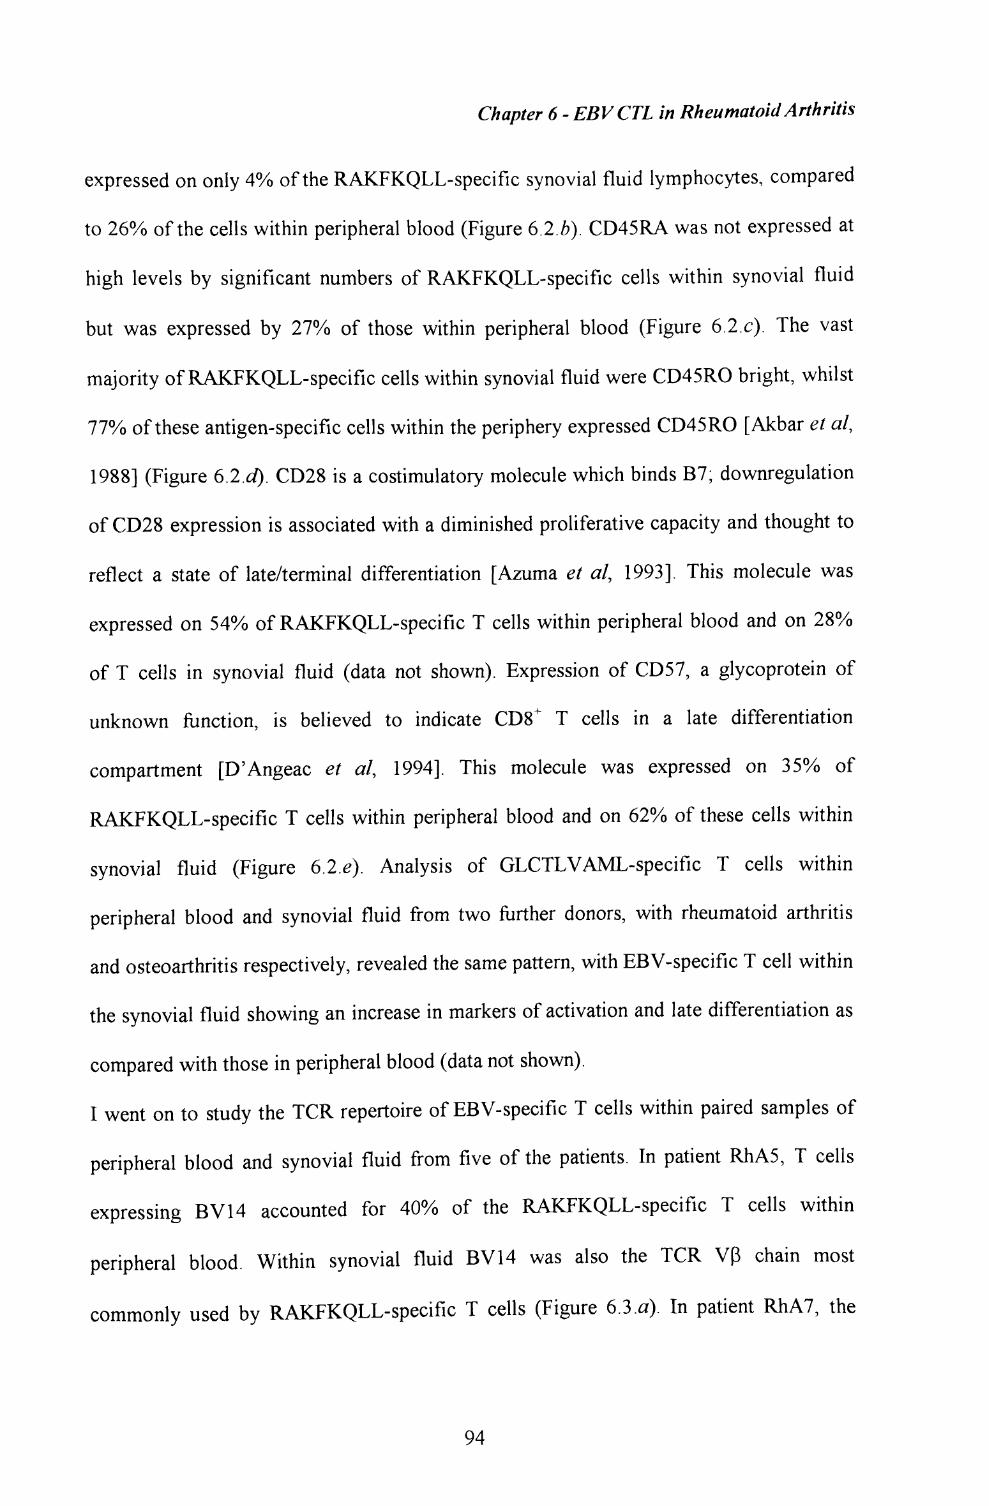
Chapter 6 - EBV CTL in Rheumatoid Arthritis
expressed on only 4% of the RAKFKQLL-specific synovial fluid lymphocytes, compared
to 26% of the cells within peripheral blood (Figure 6.2.6). CD45RA was not expressed at
high levels by significant numbers of RAKFKQLL-specific cells within synovial fluid
but was expressed by 27% of those within peripheral blood (Figure 6.2.c). The vast
majority of RAKFKQLL-specific cells within synovial fluid were CD45RO bright, whilst
77% of these antigen-specific cells within the periphery expressed CD45RO [Akbar et al,
1988] (Figure 6.2.d). CD28 is a costimulatory molecule which binds B7; downregulation
of CD28 expression is associated with a diminished proliferative capacity and thought to
reflect a state of late/terminal differentiation [Azuma et al, 1993]. This molecule was
expressed on 54% of RAKFKQLL-specific T cells within peripheral blood and on 28%
of T cells in synovial fluid (data not shown). Expression of CD57, a glycoprotein of
unknown function, is believed to indicate CD8+ T cells in a late differentiation
compartment [D'Angeac et al, 1994]. This molecule was expressed on 35% of
RAKFKQLL-specific T cells within peripheral blood and on 62% of these cells within
synovial fluid (Figure 6.2.e). Analysis of GLCTLVAML-specific T cells within
peripheral blood and synovial fluid from two further donors, with rheumatoid arthritis
and osteoarthritis respectively, revealed the same pattern, with EBV-specific T cell within
the synovial fluid showing an increase in markers of activation and late differentiation as
compared with those in peripheral blood (data not shown).
I went on to study the TCR repertoire of EBV-specific T cells within paired samples of
peripheral blood and synovial fluid from five of the patients. In patient RhA5, T cells
expressing BV14 accounted for 40% of the RAKFKQLL-specific T cells within
peripheral blood. Within synovial fluid BV14 was also the TCR Vp chain most
commonly used by RAKFKQLL-specific T cells (Figure 6.3.a). In patient RhA7, the
94
Chapter 6 - EBVCTL in Rheumatoid Arthritis
(a) 50
g 40 4-
30 -
oo00 20 4toQ£ 10 O
" 0
7.1 12 13.1 13.2 13.6 TCRBV chain
14 16 17 18 20 21.3
(b) 30
6.7 7.1 8 11 12 13.1 13.2 13.6 14 TCRBV chain
16 17 18 20 21.3 22
7.1 12 13.1 13.2 13.6 TCRBV chain
14 16 17 18 20 21.3
(d) 30 _</>tt» 25 -- ob 20 - o?5 15 +
S 10
I twniiiM |
3 5 6.7 7.1 8 11 12 13.1 13.2 13.6 14 TCRBV chain
16 17 18 20 21.3 22
Figure 6.3. The TCR repertoire of EBV-specific T cells in samples of peripheral blood and synovial fluid. Samples from donors (a) RhA5, (b) RhA7, (c) RhA6 and (d) RhA8 were stained with (a-b) PE-conjugated B8/RAK or (c-d) PE-conjugated A2/GLC tetramers, in addition Tricolor-conjugated anti-CD8 and a panel of mAb specific for TCR BV chains. The % frequency of CD8+ tetramer-reactive T cells expressing each TCR BV chain is shown for PBMC (light grey bars), SFMC (black bars); and only in (d) SFMC, left knee (stippled bars), SFMC, right knee (dark grey bars).
95
Chapter 6 - EBVCTL in Rheumatoid Arthritis
TCR repertoire of the synovial fluid RAKFKQLL-specific T cells was polyclonal with no
obviously dominant TCR use. Within peripheral blood however, preferential use of BV8
and BV14 by RAKFKQLL-specific T cells was noted (Figure 6.3.b). In patient RhA6
peripheral blood GLCTLVAML-specific T cells expressing BV13S1, BV18 and BV20
were most abundant, whilst the most common TCR Vp chain used by GLCTLVAML-
specific T cells in synovial fluid was BV7S1 (Figure 6.3. c). It was possible to compare
the TCR repertoire of GLCTLVAML-specific synovial fluid lymphocytes taken from
both the left and right knee joints in patient RhA8. The repertoires were generally similar
however certain TCR BV chains were only detected in one joint and not the other (Figure
6.3.d). These differences in the phenotype and TCR use of EBV-specific T cells within
synovial fluid versus peripheral blood could reflect preferential recruitment of
subpopulations of cells from the periphery and/or local stimulation and proliferation of
the T cells within the joint.
6.4. Expression of chemokine receptors and integrins by CD8+ T cells within
peripheral blood and synovial fluid
Chemokines and integrins play important roles in T cell trafficking [Lazarovits & Karsh,
1993; Sallusto et al, 1998; Qin et al, 1998; Bonecchi et al, 1998; Yokota et at, 1995;
Issekutz, 1992]. Expression of chemokine receptors CCR2, CCR3, CCR5, CXCR3 and
CXCR4 [Sallusto et al, 1998; Qin et a/, 1998, Bonecchi et al, 1998], and integrins aLp 2
(LFA1) [Yokota et al, 1995; Dustin & Springer, 1988], a4(3i (VLA4) [Issekutz, 1992],
a4p7 [Lazarovits & Karsh, 1993] on CD8+ T cells was investigated within paired samples
of peripheral blood and synovial fluid from five donors. Virtually all CD8+ T cells within
synovial fluid expressed LFA1 in the five donors studied. However, LFA1 was also
96
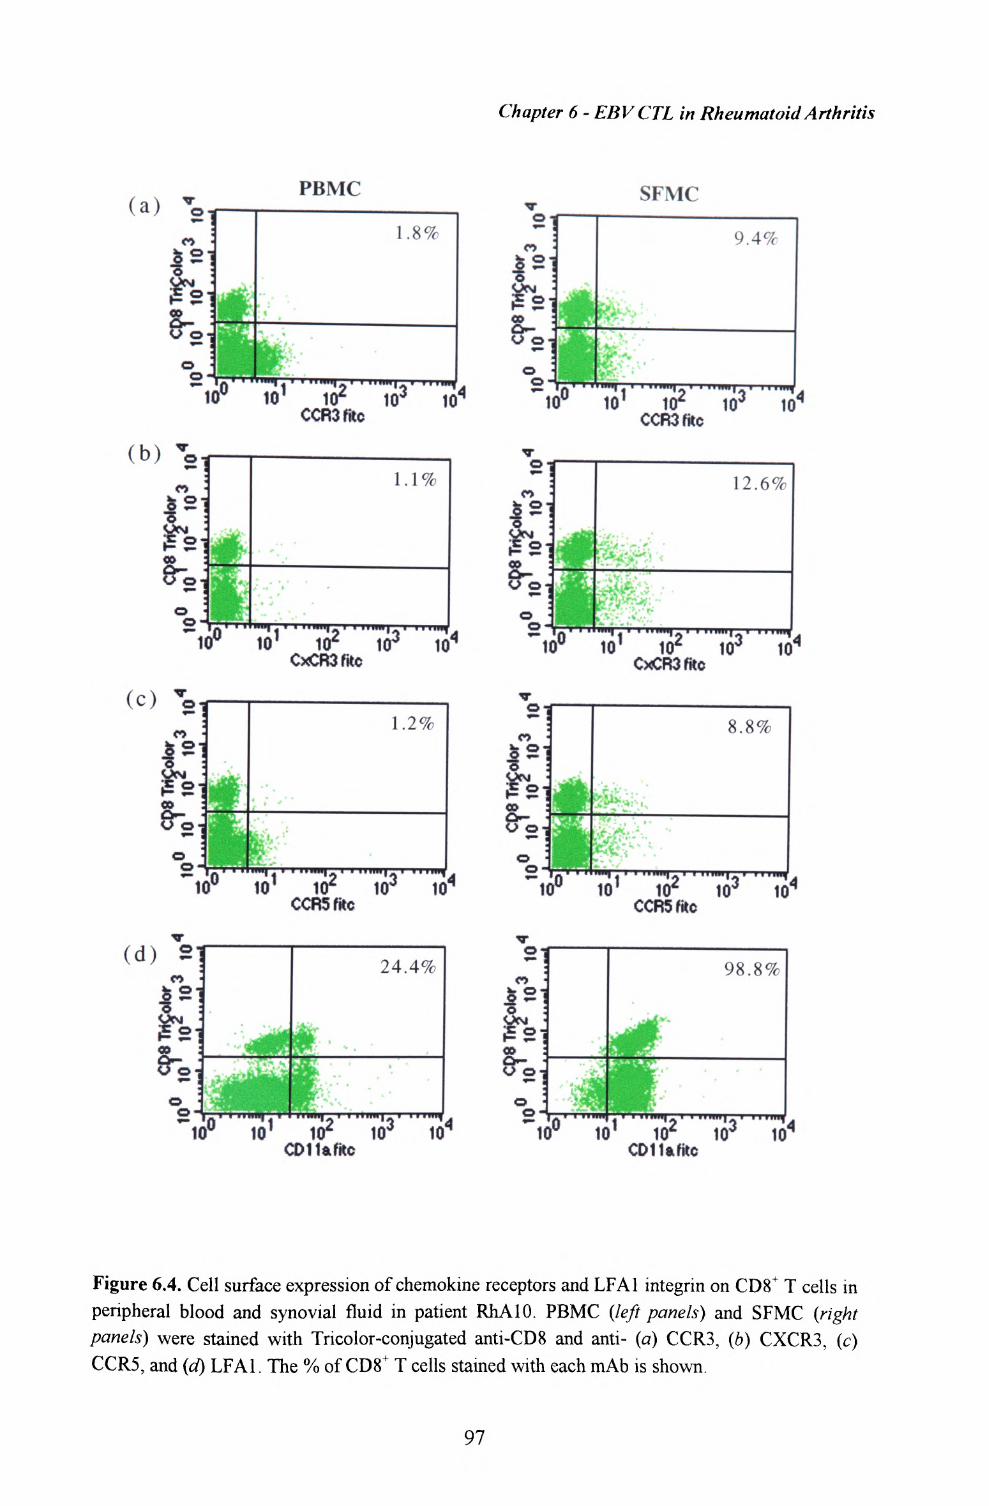
Chapter 6 - EBV CTL in Rheumatoid Arthritis
(a)PBMC
~ 1 ——— IJ> .
IO1 102 IO3 CCR3filc
IO
(b)
•*li?
1.1%
/ •*" * *• » *
* -»
0° H)' IO2 103 10
(C) 'o
nI 2rsO c
o-
(d) 2
CxCR3fkc
1.2%
IO 1 IO2 IO3 IO4 CCR5fkc
10' IO2 CDIIafitc
IO4
00o-
o o
10*
10*
SFMC
9.4<7c
o 1 li2CCRSfitc
io3 to'A
10' i?CxCR3fitc
.._, """I*- • "»>•!«• ...•»,.
10' i<r ioj 10*CCRSfitc
10 1 102 CDIIfttitc
Figure 6.4. Cell surface expression of chemokine receptors and LFA1 integrin on CD8+ T cells in peripheral blood and synovial fluid in patient RhAlO. PBMC (left panels) and SFMC (right panels) were stained with Tricolor-conjugated anti-CDS and anti- (a) CCR3, (6) CXCR3, (c) CCR5, and (d) LFA1. The % of CD8+ T cells stained with each mAb is shown.
97

Chapter 6 - EBVCTL in Rheumatoid Arthritis
expressed on the majority of CD8+ T cells within peripheral blood in three of the five
donors (Fig 6A.a; data not shown). Results from a donor RhAlO revealed greater than
two-fold enrichment for CD8+ T cells expressing CCR3, CXCR3 and CCR5 (Fig 6.4.6-
d). CD8+ T cells expressing CXCR3 were also enriched greater than two-fold within
synovial fluid from one other individual (data not shown). There were no clear
differences in levels of expression of CCR2, CXCR4, VLA4 or cqp? between peripheral
blood and synovial fluid CD8+ T cells in any of the donors studied. In three donors the
expression of the integrins and chemokine receptors on total CD8+ T cells was compared
to that on RAKFKQLL-specific T cells; the pattern of expression on the antigen-specific
cells closely reflected that found on the overall CD8 + T cell population. These results
suggest that selective recruitment of subpopulations of T cells based on the expression of
those integrins or chemokine receptors studied do not alone account for the demonstrated
enrichment of EBV-specific T cells within synovial fluid.
6.5. Proliferation of lymphocytes within synovial fluid
In order to find evidence of local proliferation of virus-specific T cells within synovial
fluid, paired samples of peripheral blood and synovial fluid from donors RhA7, RhA8
and RhA9 were stained with Ki67, an antibody specific for a cell proliferation-associated
nuclear protein [Schluter et at, 1993], to identify any proliferating T cells. Subpopulations
of CD8+ T cells within the synovial fluid from all these donors showed evidence of cell
cycling. In donor RhA7, 17% of RAKFKQLL-specific T cells within synovial fluid were
in cell cycle compared with 0% in peripheral blood (Figure 6.5.a). There was no evidence
of proliferation of the FLRGRAYGL-specific T cells in either synovial fluid or peripheral
blood from this donor (Figure 6.5.6). In donors RhA8 and 9, 11% and 0.7% respectively,
98
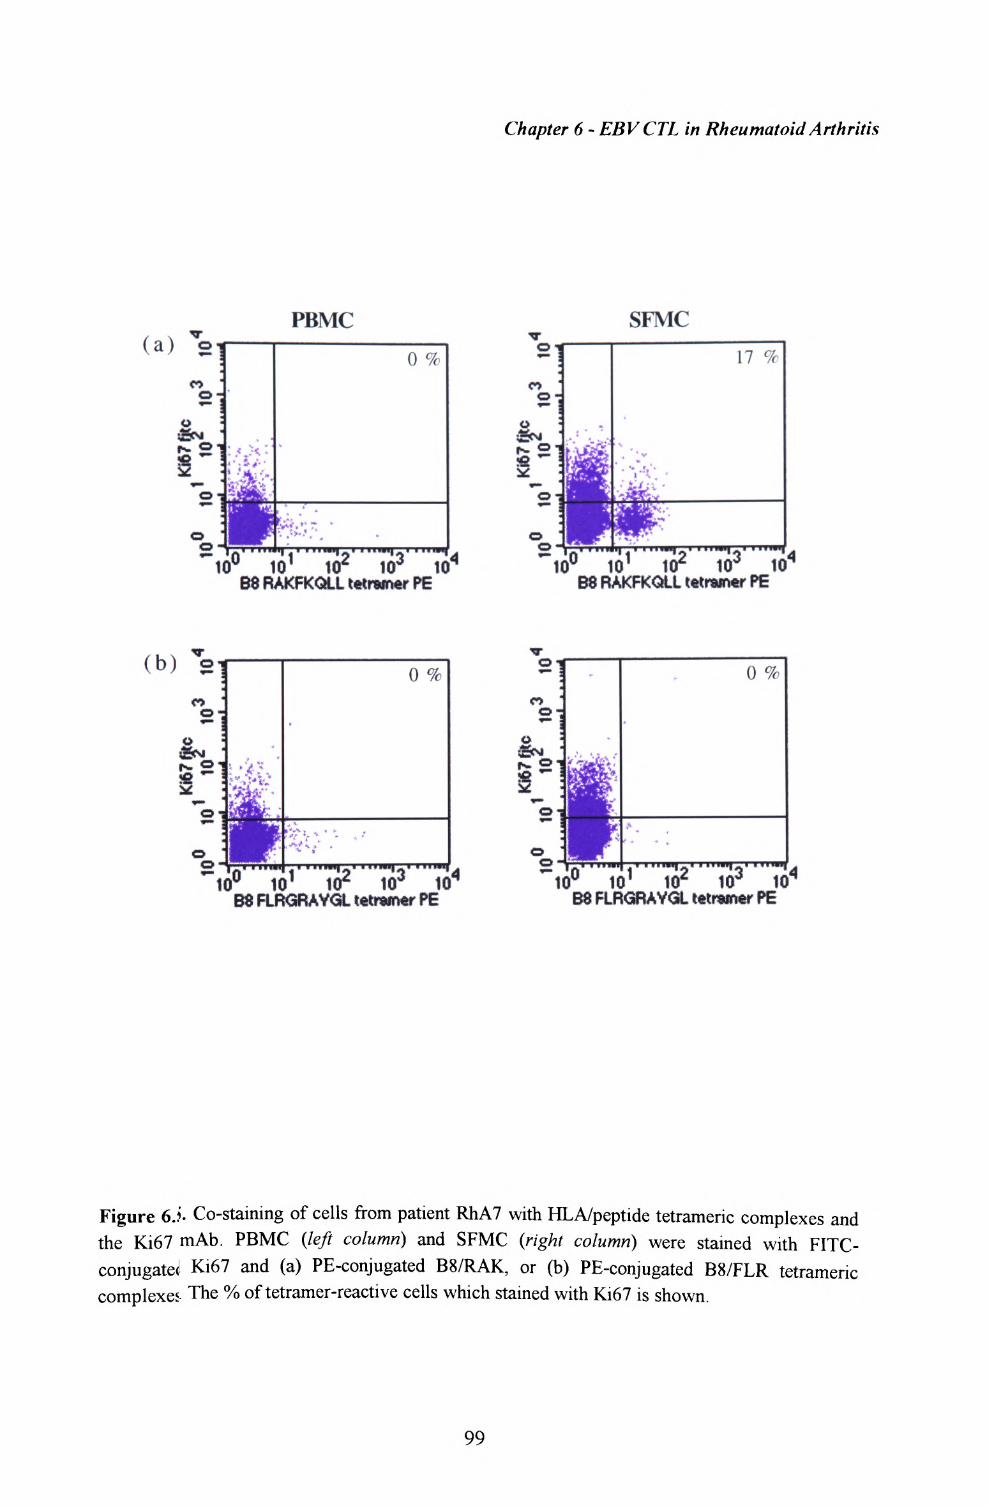
Chapter 6 - EBV CTL in Rheumatoid Arthritis
PBMC SFMC
o o-
P
0 %
*"lO° 10 1 102 IO3 IO4 B8 RAKFKOLL tetraner PE
""10° to2B8 RAKFKOLL tetramer PE
(b)o o
*~ ft 10°
0 %
ois. o
10' IO2 IO3 I04 B8 FLRGR AYGL tetramer PE
'X
o %
. ...„,_. ...™^_. ...„.,» iw 1 tO^ IO4 1<T B8 FLRGRA YGL tetramer PE
Figure 6.?. Co-staining of cells from patient RhA7 with HLA/peptide tetrameric complexes and the Ki67 mAb. PBMC (left column) and SFMC (right column) were stained with FITC- conjugatel Ki67 and (a) PE-conjugated B8/RAK, or (b) PE-conjugated B8/FLR tetrameric complexes- The % of tetramer-reactive cells which stained with Ki67 is shown.
99
Chapter 6 - EBVCTL in Rheumatoid Arthritis
of GLCTLVAML-specific T cells within synovial fluid were in cycle compared with 0%
in peripheral blood in both donors. Cycling of the GILGFVFTL-specific T cells in donor
RhA8 was not detectable.
Discussion
This study shows that virus-specific CD8 + T cells are enriched within synovial fluid from
individuals with inflammatory arthritis. In particular, CD8+ T cells specific for two
epitopes from EBV lytic cycle antigens (GLCTLVAML from BMLF1 and RAKFKQLL
from BZLF1) may be present at very high frequencies within the joints of EBV
seropositive patients. In donor RhA5, staining with tetrameric HLA-peptide complexes
showed that T cells specific for these two epitopes accounted for 17.6% of all CD8+ T
cells within synovial fluid (over 106 cells in a single joint aspirate). The findings
described were not specific for rheumatoid arthritis and similar results were obtained in a
patient with psoriatic arthritis (KR2) and in a patient with recurrent knee effusions
secondary to osteoarthritis (NR3). Enrichment of T cells specific for an epitope
(FLRGRAYGL) from the EBV latent protein EBNA3A (by ELISpot analysis) and of T
cells specific for an epitope (GILGFVFTL) from the influenza A matrix protein was also
detected, although the frequencies were relatively low in these cases.
Additional data concerning frequencies of cytomegalovirus (CMV)-specific T cells in a
separate group of rheumatoid arthritis patients was also provided by Marc Bonneville
[personal communication]. In particular, in one patient they found that up to 13% of
synovial fluid T lymphocytes reacted with a HLA-A2 tetrameric complex refolded with
the CMV tegument protein pp653 95-403 NLVPMVATV epitope, demonstrating that CD8+
T cells specific for other herpesvirus are also present within synovial fluid. Furthermore
100

Chapter 6 - EBVCTL in Rheumatoid Arthritis
the synovial lymphocytes were able to secrete TNF upon stimulation with the same
minimal CTL epitope.
Enrichment of virus-specific CDS" T cells within synovial fluid could reflect preferential
migration of these T cells from peripheral blood into the joint. T cell migration to sites of
inflammation is a carefully controlled process in which adhesion molecules and
chemokines play important roles [Sallusto et al, 1998; Qin et al, 1998; Cush et al, 1992;
Kohem et al, 1996; Borthwick et al, 1997]. In the patients studied, LFA1 was expressed
on variable numbers of CD8+ T cells within peripheral blood but was always found on
more than 94% of CD8+ T cells within synovial fluid, suggesting that the interaction
between LFA1 and ICAM plays a role in recruiting or retaining CD8+ T cells within
synovial fluid. However, expression of LFA1 on EBV-specific T cells within peripheral
blood reflected that of the overall CD8+ population and therefore selective recruitment of
LFA1 + T cells would not result in enrichment of EBV-specific T cells within the joint.
Furthermore there was no evidence to support the idea that recruitment of T cells
expressing other integrins or particular chemokine receptors accounted for the degree of
enrichment observed. It is possible that selective migration of subgroups of T cells on the
basis of expression of other molecules may be occurring and may help to explain the high
frequency of virus-specific T cells within the synovial fluid of patients with inflammatory
arthritis.
The results suggest that proliferation of T cells specific for the RAKFKQLL and
GLCTLVAML epitopes within the joint at least partially accounts for the high frequency
of these T cells within synovial fluid. The differences in the TCR repertoire of antigen-
specific T cells within peripheral blood and synovial fluid would be consistent with this
as would the increase in markers of activation and late differentiation seen on the antigen-
specific T cells within the joints. It is possible that the stimulus to proliferation might be
101
Chapter 6 - EBVCTL in Rheumatoid Arthritis
the relevant EBV antigen itself. Both B cells and T cells are recruited into inflamed joints
and in EBV seropositive individuals a subpopulation of these B cells would be latently
infected with EBV. One might therefore expect to find the virus within inflamed joints.
Whilst some early studies have found no evidence of EBV infections within joints
[Brousset et al, 1993], other reports describe detection of EBV DNA within the joints of
patients with rheumatoid arthritis [Zhang et al, 1993; Mousavi-Jazi et at, 1998] and one
study describes the use of in situ hybridisation to detect EBV-encoded small RNA1 and
LMP1 transcripts in synovial lining cells from rheumatoid arthritis patients [Takei et a/,
1997]. Furthermore Koide et al [1997] have derived a fibroblastoid cell line expressing
EBV proteins from the synovium of a patient with rheumatoid arthritis. Very recently
Edinger et al [1999] have reported detection of EBV DNA within synovia from 10/11
patients with RhA. This study also provides evidence of transcription of EBV EBER1
and BZLFl in samples of synovia from patients with RhA and OA. Thus expression of
BZLFl within the joint may be stimulating T cells specific for the HLA-B8 restricted
RAKFKQLL epitope from BZLFl. Transcription of BMLF1 has however not been
detected within synovia, suggesting that alternative mechanisms may be responsible for
driving the proliferation of CD8 + T cells specific for the HLA-A2 restricted epitope
(GLCTLVAML) from BMLF1. One possible alternative is that antigen-presenting cells
such as dendritic cells may take up EBV antigens and subsequently be recruited to joints
where they present epitopes from the EBV antigens by 'cross-presentation' [Albert et al,
1998]. A second possibility is that the virus-specific T cells are being stimulated by cross-
reactive self-antigens expressed within the joint. Further studies are required to
distinguish between these possibilities. Whatever the stimulus to proliferation, the
secretion of pro-inflammatory cytokines such as IFNy and TNF by these virus-specific T
cells is likely to contribute to synoviocyte activation and ongoing joint destruction.
102
Chapter 6 - EBVCTL in Rheumatoid Arthritis
It will be important to analyse synovial T cell responses to additional epitopes from EBV
and also to other viruses, particularly those which infect lymphocytes and can gain access
to inflamed joints. There is evidence to suggest that besides EBV and CMV [Mousavi-
Jazi et a/, 1998; Einsele et a/, 1992], parvovirus [Saal et a/, 1992] may be present within
synovial tissue. Stimulation of virus-specific T cells within synovial fluid, by virus within
the joint, by dendritic cells recruited to the joint and presenting viral epitopes or by cross-
reactive self epitopes may be a general phenomenon. These localised T cell responses
could be an important factor determining the severity and chronicity of inflammatory
arthritis.
103
CHAPTER 7
Concluding Discussion
Epstein-Barr virus is a genetically stable herpesvirus which persists for life as an
asymptomatic infection in the majority of the human population. Primary EBV
infection is associated with high levels of virus replication in the oropharynx and with
virus-driven proliferation of latently-infected B cells throughout the lymphoid system
[Rickinson & Kieff, 1996]. This elicits a vigorous cytotoxic T cell response from the host
which eventually controls the infection and continues to provide long-term immune
surveillance throughout the persistent phase of infection [Rickinson, 1986; Rickinson &
Moss, 1997]. This is most convincingly demonstrated in the frequent incidence of
lymphoproliferative disease in T cell-immunocompromised patients [Craig et al, 1993;
Yao et al, 1996]. The B cell immortalising capabilities of this virus are associated with at
least three human malignancies, Burkitt's lymphoma, nasopharyngeal carcinoma and
malignant lymphomas as seen in immunosuppressed individuals [Epstein & Achong,
1986]. However the development of these tumours is a very rare event, despite the potent
growth-transforming potential of the virus and its high spread in the human population
[Masucci & Ernberg, 1994].
Until recently it was not possible to directly identify T cells according to their antigen
specificity, due intrinsically to the low affinity and fast off-rates of their interactions with
peptide-MHC complexes [Matsui et al, 1991, Davis et al, 1998]. Antigen-specific T cells
could only be detected indirectly (and inefficiently), using functional assays such as
104
Chapter 7 - Concluding Discussion
LDA. The results from these assays led researchers to believe that only about 1% of the
activated CD8+ lymphocytes that arise during the acute phase of a viral infection are
antigen-specific [Doherty et al, 1992; Ahmed & Gray, 1996]. Fluorochrome-labelled
tetrameric complexes of class I MHC-peptide molecules have now been developed by
Altman et al [1996], which bind to their relevant cognate TCR with greater avidity and
thus enable their detection by FACS analysis. The use of tetramers has enabled us to
directly visualise populations of antigen-specific T cells in ex vivo samples, regardless of
their function. Consequently, several studies have since revealed that the majority of
expanded, activated CD8+ lymphocytes do not result from bystander activation, as
previously believed, but rather direct stimulation by antigen. The use of MHC-peptide
tetrameric complexes has introduced new possibilities for assessing the nature of primary
and memory responses to virus infection.
7.1. The high frequencies of antigen-specific T cells in primary EBV infection
As described in Chapter 4, staining of PBMC from individuals with acute infectious
mononucleosis using MHC-peptide tetrameric complexes revealed clear populations of
CD8+ T cells recognising EBV lytic and latent protein CTL epitopes. A very high
frequency of EBV-specific T cells recognised the two EBV lytic cycle peptides in this
study (up to 6.6% of CD8+ T cells for A2/GLCTLVAML and up to 44% for
B8/RAKFKQLL), whilst the frequency of T cells recognising the latent cycle peptide,
B8/FLR was relatively low (up to 2.2% of CD8+ T cells).
Similarly high frequencies of antigen-specific cells have been demonstrated recently in
some other systems. By tracking the proliferation of adoptively-transferred transgenic
GP33.4 i-specific CD8+ T cells in B6 mice infected with LCMV, Butz and Bevan [1998]
105
Chapter 7 - Concluding Discussion
showed that at least half of the activated cells were antigen-specific at the peak of
primary infection. Furthermore, about 10% of spleen cells secreted IFNy in response to
each of the two dominant Derestricted peptide epitopes, GP33.4 i and NP396-404, in ELISpot
assays. Another study showed that at the peak of the LCMV primary response, 40% of
CD8+ T cells reacted with a Db/GP33.4 i MHC-peptide tetrameric complex [Gallimore et
a/, 1998a]. By using tetramer binding and assays for IFNy-production at single-cell level,
a third group calculated that 50-70% of activated CD8+ T cells were LCMV-specific at
peak of primary response in BALB/c and C57B/6 mice [Murali-Krishna et al, 1998].
Here, T cells specific for an Ld/NPn 8.i 26 tetramer accounted for 56% of CD8 + spleen cells
taken from BALB/c mice at peak of primary LCMV infection. Likewise primary
influenza pneumonia in mice generated fairly high frequencies (>15%) of CD8 + T cells
within bronchial alveolar lavage that were recognised by a Db/NP366-3?4 tetramer [Flynn et
al, 1998]. In contrast, when mice were primed intravenously with Listeria
monocytogenes, less than 2% in total of CD8 + splenocytes were specific for the four
major epitopes, as assessed by staining with Kd tetramers, with the immunodominant
response to the LLO91-99 epitope constituting about 1.4% [Busch et al, 1998]. Together
these results indicate that high frequencies of antigen-specific T cells appear to be a
common phenomenon in virus infections, but this may not necessarily be the case with
other pathogens.
A common theme that emerges throughout these different studies is that dominant CTL
responses tend to be highly focused towards one or a few epitopes, whilst other epitopes
induce only weak responses. In this respect, the unexpectedly high frequencies of CD8+ T
lymphocytes specific for two recently characterised EBV lytic cycle epitopes are notable.
The B8-restricted BZLF1 lytic cycle peptide, RAKFKQLL, induced the largest responses
in the IM patients studied here and appears to be the dominant response in all HLA-B8+
106
Chapter 7 - Concluding Discussion
IM patients studied to date [Dr M Callan, unpublished observations]. Although
previously shown to be a dominant latent epitope, the HLA-B8 restricted EBNA3A
FLRGRAYGL epitope consistently elicited weaker responses. The relatively high
frequencies of A2/GLCTLVAML-reactive cells were also surprising since this allele does
not present any dominant reactivities within EBV latent proteins.
CTL responses to EBV latent proteins are well-characterised and a great number of
individual epitopes have been defined. The vast majority of these epitopes map to the
EBNA3A, 3B and 3C proteins and only a small number of epitopes, if any, derive from
the remaining five latent proteins [Murray et al, 1992; Khanna et al, 1992; Steven et al,
1996; reviewed in Rickinson & Moss, 1997]. Such marked immunodominance is evident
even during acute primary infection, and is not seen in other human viral systems; in
influenza and HIV1 infection, for instance, memory CTL responses tend to be diversified
across a wider range of the available target proteins [Gotch et al, 1987; Parker & Gould,
1996; Nixon & McMichael 1991]. This biased distribution of epitopes does not appear to
be simply due to differences in the levels of expression of different latent proteins, but
have been suggested to be due to differences in the levels of peptide representation at the
cell surface, as discussed later.
Immunodominance was not greatly apparent at the level of the antigen receptors
expressed by the T cells responding to the B8/RAKFKQLL epitope in IM59, although
restricted TCR usage has been well documented for other EBV epitopes [Callan et al,
1998] and in other acute infections [MacDonald et al, 1993; Pantaleo et al, 1994]. More
recently Ahmed and co-workers have used both immunoscope analysis and co-staining
with tetrameric complexes and TCRBV-specific antibodies to show that the CD8+ T cell
response to the dominant LCMV epitope in BALB/c mice, NPn 8-i26, is restricted to TCRs
expressing BV10, BV8S1 and BV8S2 [Sourdive et al, 1998].
107
Chapter 7 - Concluding Discussion
The factors that influence immunodominance of particular epitopes or T cell receptors
during an immune response may reflect limitations of the antigen presentation pathway,
particularly factors which affect antigen density on the surface of antigen presenting cells,
or the characteristics and diversity of the naive T cell repertoire. A major determinant of
T cell recognition is the binding affinity of a potential epitope for class I MHC molecules,
and the stability of the resultant complex. In this context, Sette and colleagues have
shown a positive correlation between peptide affinity and immunogenicity; the findings
indicate that the majority of peptides recognised by CD8+ T cells bind to their respective
class I molecules with a minimum threshold affinity (Kd < 500 nM) [Sette et al, 1994a
and 1994b]. The efficiency with which peptides may be generated by antigen processing
machinery [Villanueva et al, 1994; Vijh et al, 1998] and also the stability of peptide-
MHC complexes contribute to the relative abundance of a particular epitope on the cell
suface of APCs [Busch & Pamer, 1998]. In support of this, the fine specificity of
proteasome degradation [Niedermann et al, 1995; Ossendorp et al, 1996], TAP binding
[Neisig et al, 1995; van Endert et al, 1995], and molecular chaperone proteins [Suto &
Srivastava, 1995; Nieland et al, 1996] have been shown capable of exerting potential
effects on peptide generation. One study on LCMV infection of C57BL/6 mice has found
that the magnitude of the CTL response generated does indeed depend on the abundance
of each epitope on infected cells [Gallimore et al, 1998b]. On the other hand, Pamer et al
[1997] have reported that the immunodominant CD8+ response in L. monocytogenes
infection is directed against LLO91-99 which is the least abundant epitope presented on the
cell surface. This apparent contradiction was resolved by the finding that Kd/LLO9 i.99
complexes are relatively stable compared to the most abundant, but subdominant epitope,
p60449.457 [Busch & Pamer, 1998].
108
Chapter 7 - Concluding Discussion
Qualitative differences in responding CD8^ T cell clones can also, presumably, affect
selection to dominance. Some T cells may interact more favourably with antigen, thereby
increasing the speed at which they proliferate upon activation [Yewdell & Bennink,
1999]. T cells recognising subdominant epitopes may be further disadvantaged due to
rapid clearance of virus infected cells by T cells recognising the dominant epitope, such
that subdominant epitopes are expressed at suboptimal levels for CTL activation. This is
the seen in LCMV infection of H-2d mice, where it appears that rapid clearance of virus
by the dominant Ld-restricted NPng.i 26 CD8+ T cell responses reduces the antigen load to
a point below the threshold for stimulation of GP283-291 -specific responses. Alternatively
the magnitude of the T cell response may simply reflect the number of precursors
available at the time of infection [Murali-Krishna, 1998]. The importance of these
mechanisms in vivo have not been fully explored.
Preferential expansion and domination of a particular response may be dependent on the
nature of the resting T cell repertoire. Each individual T cell repertoire is shaped by
positive and negative selection and tolerance to self antigens. It is possible to imagine that
the TCR repertoire may be intrinsically biased towards certain immunodominant
determinants, due to expression of distinct self antigens or TCR genes [Daly et al, 1995].
This has been demonstrated in H-2d mice infected with mutant LCMV lacking the
dominant NPng-126 epitope, or in transgenic mice expressing NP in the thymus infected
with wildtype virus. Both experiments result in the subdominant GP283-291 epitope
becoming dominant [Weidt et al, 1998; von Herrath et al, 1994]. The potential of
negative selection for influencing immunodominance can also be seen in EBV infection.
In most HLA-B8 individuals, CD8+ T cells responding to the dominant B8-restricted
EBNA3A32 5-333 epitope express a highly conserved TCR, which are alloreactive to HLA-
B*4402. However, individuals who are both B8+ and B*4402+ still respond to
109
Chapter 7 - Concluding Discussion
EBNA3A32 5-333, although the response is less vigorous and is mediated by alternative
non-alloreactive CD8+ T cells [Burrows et al, 1994 & 1995].
The hierarchy of immunodominance in CTL responses to EBV latent protein epitopes has
been well-documented in Caucasian donors to EBV type 1 virus isolates. However, less is
known about immunodominant responses to type 2 isolates, where sequence variations in
EBNA3 A, 3B and 3C have been shown to result in loss of recognition of many of the
type 1 immunodominant epitopes [Moss et a/, 1988; Kerr et a/, 1996]. Furthermore CTL
responses to lytic cycle epitopes have only recently been identified and the
immunodominance of these antigens is still poorly defined. Thus far the apparent
dominance of lytic protein reactivities over latent ones has been striking. The magnitude
of responses to the BZLF1 RAKFKQLL and BMLF1 GLCTLVAML epitopes suggests
that direct CTL control over active virus replicative lesions is of crucial importance in
containment of primary infection as well as in long term maintainence of the
asymptomatic phase. Expression of the BZLF1 gene alone in latently infected
lymphocytes is sufficient to disrupt latency and trigger the full viral lytic cycle [Grogan et
al, 1987]. This protein contains two regions that are homologous to c-fos and mediates
the switch from latency to virus replication by activating the transcription of other
immediate early and early genes [Flemington & Speck, 1990; Lieberman, 1986]. These
include other transactivators (such as BMLF1) as well as genes encoding proteins
involved in viral DNA replication [Kieff, 1996]. T cell recognition of early lytic genes is
probably desirable for limiting the spread of virus at an early stage in the life cycle before
production of virus particles. In addition, lytic genes encode a number of proteins with
immunomodulatory functions; BHRF1 encodes a viral homologue of bcl-2 [Pearson et al,
1987], whilst BCRF1 encodes a viral homologue of IL-10 [Hsu et al, 1990]. These
proteins may function in various ways to suppress T cell responses or enhance the
110
Chapter 7 - Concluding Discussion
colonisation of mature B lymphocytes [Stuart et at, 1995; Suzuki et al, 1995; Spriggs,
1996]. Finally, it is also likely that some early proteins in EBV are involved in evasion
strategies to avoid detection by CTL, as has been shown in other herpesviruses such as
CMV and HSV [Spriggs, 1996].
In this cohort of IM patients (Chapter 4), the phenotype of the tetramer reactive cells was
generally homogenous and indicative of recent activation. The majority of EBV-specific
CD8+ T cells identified in the different patients expressed high levels of CD38, HLA-DR
and CD45RO, and low levels of CD62L and CD45RA. In addition, a greater proportion
of HLA-B8 restricted RAKFKQLL-specific CD8+ T cells appeared to have lost CD28
expression and gained CD57 expression, compared to HLA-B8 FLRGRAYGL-specific
cells, correlating to their being more highly expanded. Although the results of this study
clearly demonstrate high frequencies of activated EBV-specific T cells, their functional
capacity was not addressed. It has been shown that the vast majority of activated,
expanded CD8+ T cells that arise during the course of a primary virus infection are
destined to die apoptosis [Ahmed & Gray, 1996; Zinkernagel et a/, 1996]. Therefore it is
not clear that all these expanded cells retain the ability to kill target cells and if so, by
what mechanisms of cytotoxicity. Analysis of FasL and perforin expression on tetramer-
reactive cells might yield interesting information about their functional capacity, as
would the analysis of cytokine secretion profiles. There is evidence that CD8+ T cells
may be subdivided into either Tel or Tc2 according to their secretion of either Thl-like
or Th-2-like cytokine profiles [Sad et al, 1995], The opportunity to analyse patterns of
cytokine secretion in tetramer-positive cell populations may provide further evidence and
characterisation of these subgroups.
Ill

Chapter 7 - Concluding Discussion
7.2. Downregulation of the immune response following primary infection
It has often been shown that primary virus infections induce initial activation and
expansion of antigen-specific effector T cell populations followed by contraction and
establishment of a T cell memory compartment [Gessner et a/, 1989; Uehara et al, 1992;
Doherty et al, 1992; Murali-Krishna et at, 1998]. Accordingly, analysis of peripheral
blood samples taken six to 37 months following recovery from acute IM showed
significant culling of the earlier dramatic expansions of CD8+ T cells; nevertheless
populations of EBV-specific T cells were still easily detectable by tetramer staining.
Additionally, the hierarchy of immunodominance displayed during primary infection was
maintained in postconvalescent samples. Interestingly, the relative frequency of CD8+ T
cells recognising the EBNA FLRGRAYGL epitope, which had originally shown only
modest expansion, was closely maintained between acute disease and the early memory
phase. This would seem to support a model in which clones that undergo large
expansions (eg. BZLF1 RAKFKQLL-specific CD8+ T cells) are more drastically culled
than small ones, such as the EBNA3 A FLRGRAYGL-specific cells. In contrast, the study
by Murali-Krishna et al [1998] showed that the number of NPn 8-i26- and GP2g3-29i-
specific CD8+ T cells present in the memory pool of LCMV-immune BALB/c mice was
determined exclusively by the original burst size. Thus, 5% of the activated cells
recognising each epitope survived to enter the memory pool, regardless of the fact that
CD8+ T cells recognising NPn 8-i26 were 20 times more abundant than those recognising
G?283-29i during the primary response. However an earlier study of CD8+ T cell responses
to EBV latent proteins also demonstrated that the differences in relative frequencies of
CTL to immunodominant versus subdominant epitopes were less marked in memory than
during the primary response [Steven et al, 1996].
112
Chapter 7 - Concluding Discussion
The rapid contraction of the T cell response following primary infection is due to
homeostatic controls that serve to maintain the size and diversity of the T cell pool.
Activation-induced cell death (AICD), may be mediated by active mechanisms involving
the interaction of FasL and other death cytokines with members of the TNF death
receptor family, which includes Fas [Nagata & Goldstein, 1995]. Evidence for the
importance of the Fas-FasL system in the regulation of T cell survival following antigen
stimulation is seen in Ipr (Fas') and gld (FasL") mutant mice, where accumulation of
activated lymphocytes enhances the incidence of autoimmune disease. Fas is
constitutively expressed on mature T cells; however expression is up-regulated upon
antigen stimulation [Lenardo et al, 1999]. T cell activation by antigen also induces FasL
expression on cytotoxic T cells, making them highly susceptible to Fas-mediated
apoptosis [Zheng et al, 1998]. Since FasL can be cleaved from the cell surface by
metalloproteinases, it is likely that T lymphocytes have the ability for self-killing
[Brunner^a/, 1995].
Death of activated CD8+ T lymphocytes may also be mediated by withdrawal of IL-2 or
lymphokines [Lenardo, 1991]. Activation of T cells in response to antigen induces
production of IL-2 and its high affinity receptor, leading to T cell proliferation and further
IL-2 production [Waldmann, 1991]. Antigen clearance at the end of an immune response
results in down regulation of IL-2 production, causing rapid apoptosis of cycling T cells
[Duke & Cohen, 1986; Lenardo, 1999].
It is not clear which factors determine the survival of a subset of T cells and their
differentiation into memory cells. Cells expressing bcl-2 or other members of the bcl-2
family are able to avoid apoptosis and this may be a possible mechanism for enabling
some T cells to survive into memory [Chao et al, 1995]. Additional members of the TNF
and TNF receptor families have recently been discovered, including a soluble TNF-like
113

Chapter 7 - Concluding Discussion
receptor that appears to be expressed by activated T lymphocytes. It has been proposed
that binding of FasL and other related death cytokines to this soluble "decoy" receptor
may be a novel mechanism by which cells may avoid undergoing apoptosis [Pan et al,
1997]. Analysis of the expression of death-inducing or death-rescuing molecules, or
experiments with blocking antibodies may help to clarify this issue.
7.3. Memory responses to persistent EBV infection
The second group of patients studied here (Chapter 5) were EBV seropositive but had
either no history of clinical disease (and probably underwent asymptomatic
seroconversion during childhood) or had suffered acute IM over a decade ago. Therefore
it was surprising that in these individuals, significant frequencies of EB V-specific T cells
were still clearly detectable in peripheral blood, by staining with peptide-MHC tetrameric
complexes. In addition, the frequencies of CD8+ T cells recognising two
immunodominant lytic protein epitopes (A2/GLCTLVAML and B8/RAKFKQLL) were
fairly high (up to 5.5% of total CD8+ T lymphocytes in one donor). The frequency of
CD8+ T cells recognising the All-restricted immunodominant EBNA3B4 i6-424 epitope,
though lower than the former, were also substantial, representing up to 3.8% of total
CD8+ T cells in one donor. Contrary to what was seen during primary infection, the
memory pool appeared to be functionally heterogenous, as evidenced by differential
expression of phenotypic markers on the EB V-specific cells, as well as variations in the
responses to functional assays. Studies with mono-specific TCR-transgenic CD4 and
CDS cells have previously provided evidence for the existence of different functional
subsets: effector cells, which are capable of rapid cytotoxic activity and memory cells,
which require antigen stimulation for activation [Zinkernagel et al, 1996]. However in
114
Chapter 7 - Concluding Discussion
humans it has generally been difficult to distinguish these two subsets on the basis of
expression of cell surface markers alone. Furthermore at least two recent studies have
highlighted that some of the antigen-specific T cells detectable using tetramers may be
have diminished functional capacity. Gallimore et al [1998a] demonstrated that chronic
infection of mice with a high dose of a rapidly replicating strain of LCMV resulted in
premature induction of the CD8+ effector population which exhibited reduced
cytotoxicity and cytokine production. Similarly, Zajac et al [1998] showed that persistent
LCMV infection in mice produced high levels of activated CD8+ T cells that were
reactive with Db/GP33-4i tetrameric complexes, and appeared to be activated (CD69hl ,
CD44 \ CD62 °), but did not elicit any antiviral effector functions. This effect was
exacerbated in CD4 knockout mice, implying a requirement for CD4 help in maintaining
effective CDS-mediated control of persistent infections. The dependence of CD8+
cytotoxic responses on CD4+ T cell help has been shown in murine models of chronic
viral infections [Battegay et al, 1994; Cardin et al, 1996] while in humans, the declining
levels of CD4+ T cells are correlated with the loss of HIV-specific CD8+ T cell responses
during progression to AIDS [Rosenberg et al, 1997], In light of these findings it is
important that future experiments establish whether the large populations of EBV-
specific tetramer-reactive cells demonstrated here are wholly functional. Chronic
infection with a persistent, systemic virus such as EBV may lead to conditions that favour
the induction of CD8+ T cell unresponsiveness, as T cells become increasingly sensitive
to the regulatory mechanisms that down-regulate excessive and potentially self-reactive
activated T lymphocytes.
115
Chapter 7 - Concluding Discussion
7.4. Final Considerations
The detection of potent CTL responses to lytic cycle antigens in memory strongly
suggests that EBV replicative lesions continue to arise throughout life and are subject to
direct CTL control in vivo. Thus the fall in oropharyngeal virus shedding that occurs with
primary infection in IM is very probably brought about by the emerging lytic antigen-
specific CTL response. Likewise chronic EBV replication in epithelial cells of the
tongue, giving rise to the characteristic lesions of oral hairy leukoplakia, are often
observed in immunocompromised AIDS patients. CTL control over latent B lymphocyte
infection is also important for maintaining the balance between host and pathogen in the
prevention of immunoblastic lymphomas and other malignancies.
The ability of EBV-associated malignancies to flourish despite such potent and
comprehensive CTL responses is intriguing. Part of this success is due to the fact that
malignant cells in Burkitt's lymphoma, nasopharyngeal carcinoma and Hodgkin's disease
only express a small range of latent proteins, and more importantly, these proteins are not
the major targets of cell-mediated EBV-specific responses. The EBNA1 protein is
expressed in all EBV-associated malignancies and is required for maintenance of the
episomal viral genome in latently infected cells [Yates et at, 1984]. However this
essential protein is protected from the antigen processing pathway, by means of an
internal glycine-alanine repeat sequence [Levitskaya et al, 1995; Shapiro et a/, 1998].
Another protein, LMP1, is also expressed in nasopharyngeal carcinoma and Hodgkin's
disease but again, is rarely recognised by CTL. Furthermore LMP1 has been shown to
induce upregulation of bcl-2, which enhances the survival of latently infected B
lymphocytes and presumably contributes to the resistance of malignant cells to immune
clearance [Masucci & Ernberg, 1994]. As a consequence, a number of efforts to develop
effective vaccines have concentrated on inducing effective responses to LMP2, which is
116
Chapter 7 - Concluding Discussion
also expressed in nasopharyngeal carcinoma and Hodgkin's disease, and is the only
protein that elicits reasonable levels of CTL recognition [Rickinson & Moss, 1997].
Furthermore, in comparison to the EBNA3 proteins, LMP2 sequences are relatively
conserved between both virus types [Lee et al, 1993]. Interestingly, nasopharyngeal
carcinoma occurs widely in Southeast Asia, where epitope-loss mutant virus isolates have
been found. Specific mutations involving anchor residues of immunodominant All-
restricted epitopes have been shown to abrogate binding to class I MHC and CTL
recognition [de Campos-Lima, 1993 & 1994]. It is tempting to speculate that loss of these
reactivities may contribute to the high incidence of nasopharyngeal carcinoma that is
observed there.
Persistent viruses that elicit prolonged and vigorous immune responses have often been
implicated in the pathogenesis of autoimmune disease, and EBV is no exception. High
frequencies of antigen-specific circulating CD8+ T lymphocytes that accompany
persistent infection with EBV can significantly influence the balance of reactivities
within the circulating CD8+ T cell pool. This highlights the immunopathologies that
might arise if the virus-induced response were to include reactivities either potentially
cross-reactive with self antigens or cross-reactive with an allo-HLA antigen present on
grafted tissue. Evidence that EBV plays a direct role in the pathogenesis of rheumatoid
arthritis remains controversial. Nevertheless their elevated presence and ability to secrete
pro-inflammatory cytokines within affected joints may have important implications in
long term maintenance of chronic joint disease. The results in Chapter 6 indicate that at
least some EBV-specific T cells are activated to proliferate within arthritic joints. This
may be due to the presence of EBV-infected B lymphocytes that are also recruited into
the synovium in the course of inflammation, and which may present viral antigens to
CD8+ T lymphocytes. Alternatively cross-presentation by dendritic cells or stimulation by
117
Chapter 7 - Concluding Discussion
cross-reactive self-antigens may be responsible for T cell activation. The involvement of
such mechanisms are not mutually exclusive. T lymphocytes specific for other persistent
viruses have also been found in the joints of patients with arthritis. Future experiments
may uncover general mechanisms by which such T cells contribute to the disease process.
Epstein-Barr virus remains a paradigm for the study of immune responses to virus
infection in humans, since it is so widespread and causes a clearly defined primary
illness. Its successful strategies for survival within the host emphasise the evolution of a
finely-tuned balance between virus and host. Our understanding of its adaptation to life
within the immune system is essential for design of prophylactic vaccines for IM and
therapeutic vaccines for associated malignancies. It is hoped that novel techniques for
detecting CD8+ T cells will not only provide the tools to further characterise immune
responses to this virus, but also facilitate monitoring of responses to various treatment
modalities.
118
BIBLIOGRAPHY
Abbas AK, Lichtman AH and Pober JS. (1997) Antigen recognition and lymphocyte activation. In Cellular and Molecular Immunology. 3rd Ed. B.S. Saunders Company, Philadelphia p 35- 246.
Ahmed R and Gray D. (1996) Immunological memory and protective immunity: understanding their relation. Science. 272: 54-60.
Akbar AN, Borthwick N, Salmon M, Gombert W, Bofill M, Shamsadeen N, Pilling D, Pert S, Grundy JE and Janossy G. (1993) The significance of low Bcl-2 expression by CD45RO T cells in normal individuals and patients with acute viral infections. The role of apoptosis in T cell memory. J. Exp. Med. 178: 427-438.
Akbar AN, Terry L, Timms A, Beverley PCL and Janossy G. (1988) Loss of CD45R and gam of UCHL1 reactivity is a feature of primed T cells. J. Immunol. 140: 2171-2178.
Akolkar PN, Gulwani-Akolkar B, Pergolizzi R, Bigler RD and Silver J. (1993) Influence of HLA genes on T cell receptor V segment frequencies and expression levels in peripheral blood lymphocytes. J. Immunol. 150: 2761-2773.
Albert M, Sauter B and Bhardwaj N. (1998) Dendritic cells acquire antigen from apoptotic cells and induce class I restricted-CTLs. Nature. 392: 86-89.
Altman JD, Moss PAH, Goulder PJR, Barouch DH, McHeyzer-Williams MG, Bell JI, McMichael AJ and Davis MM. (1996) Phenotypic analysis of antigen specific T lymphocytes. Science. 274: 94-96.
Anderson K, Cresswell P, Gammon M, Herrnes J, Williamson A and Zweerink H. (1991) Endogenously synthesised peptide with an endoplasmic reticulum signal sequence sensitizes antigen processing mutant cells to class I-restricted cell-mediated lysis. J. Exp. Med. 174: 489- 492.
Androlewicz MJ and Cresswell P. (1994) Human transporters associated with antigen processing possess a promiscuous peptide-binding site. Immunity. 1: 7-14
Androlewicz MJ, Anderson KS and Cresswell P. (1993) Evidence that transporters associated with antigen processing translocate a major histocompatibility complex class I-bmding peptide into the endoplasmic reticulum in an ATP-dependent manner. Proc. Nat'1. Acad. Sci. USA. 90: 9130-9134.
Arden B, Clark SP, Kabelitz D and Mak TW. (1995) Human T-cell receptor variable gene segment families. Immunogenetics. 42: 455-500.
Azuma M, Phillips JH and Lanier LL. (1993) CD28- T lymphocytes. Antigemc and functional properties. J. Immunol. 150: 1147-1159.
119
Bibliography
Baboonian C, Venables PJ, Williams DG, Williams RO and Maini RN. (1991) Cross-reaction of antibodies to a glycme/alanme repeat sequence of Epstem-Barr virus nuclear antigen-1 with collagen, cytokeratm, and actm. Ann. Rheum. Dis. 50: 772-775.
Barnstable CJ, Bodmer WF, Brown G, Galfre G, Milstein C, Williams AF and Ziegler A. (1978) Production of monoclonal antibodies to group A erythrocytes, HLA and other human cell surface antigens - new tools for genetic analysis. Cell. 14: 9-20.
Belich MP, Glynne RJ, Senger G, Sheer D and Trowsdale J. (1994) Proteasome components with reciprocal expression to that of the MHC-encoded LMP proteins. Curr. Biol. 4: 769-776.
Bennmk JR, Yewdell JW and Gerhard W. (1982) A viral polymerase involved in recognition of influenza virus-infected cells by a cytotoxic T cell clone. Nature. 296: 75-76.
Bentley GA, Boulot G, Karjalainen K, Mariuzza RA. (1995) Crystal structure of the p chain of a T cell antigen receptor. Science. 267: 1984-1987.
Biggin M, Bodescot M, Perricaudet M and Farrell P. (1987) Epstein-Barr virus gene expression in P3-HRl-superinfected Raji cells. J. Virol. 61: 3120-3132.
Bjorkman PJ, Saper MA, Samraoui B, Bennett WS, Strominger JL and Wiley DC. (1987a) Structure of the human class I histocompatibility antigen, HLA-A2. Nature. 329: 506-512.
Bjorkman PJ, Saper MA, Samraoui B, Bennett WS, Strominger JL and Wiley DC. (1987b) The foreign antigen binding site and T cell recognition regions of class I histocompatibility antigens. Nature. 329:512-518.
Bogedain C, Wolf H, Modrow S, Stuber G and Jilg W. (1995) Specific cytotoxic T lymphocytes recognize the immediate-early transactivator Zta of Epstein-Barr virus. J. Virol. 69: 4872-4879.
Bonecchi R, Bianchi G, Bordignon PP, D'Ambrosio D, Lang R, Borsatti A, Sozzani S, Allavena P, Gray PA, Mantovani A and Sinigaglia F. (1998) Differential expression of chemokine receptors and chemotactic responsiveness of type 1 T helper cells (This) and Th2s. J. Exp. Med. 187: 129-134.
Borthwick NJ, Akbar AN, MacCormac LP, Lowdell M, Craigen JL, Hassan I, Grundy JE, Salmon M and Yong KL. (1997) Selective migration of highly differentiated primed T cells, defined by low expression of CD45RB, across human umbilical vein endothelial cells: effects of viral infection on transmigration. Immunology. 90: 272-280.
Borysiewicz LK, Hickling JK, Graham S, Sinclair J, Cranage MP, Smith GL and Sissons JGP. (1988) Human cytomegalovirus-specific cytotoxic T cells. Relative frequency of stage-specific CTL recognizing the 72-kD immediate early protein and glycoprotein B expressed by recombinant vaccinia viruses. J. Exp. Med. 168: 919-931.
Boubnov NV, Wills ZP and Weaver DT. (1993) V(D)J recombination coding junction formation without DNA homology: processing of coding termini. Mol. Cell. Biol. 13: 6957-6968.
Bour H, Michielin 0, Bousso P, Cerottini J-C and MacDonald HR. (1999) Dramatic influence of Vp gene polymorphism on an antigen-specific CD8+ T cell response in vivo. J. Immunol 162: 4647-4656.
120
Bibliography
Brooks L, Yao QY, Rickinson AB and Young LS. (1992) Epstein-Barr virus latent gene transcription in nasopharyngeal carcinoma cells: coexpression of EBNA1. LMP1. and LMP2 transcripts. J. Virol. 66: 2689-2697.
Brousset P, Caulier M, Cantagrel A, Dromer C, Mazieres B and Delsol G. (1993) Absence of Epstein-Barr virus carrying cells in synovial membranes and subcutaneous nodules of patients with rheumatoid arthritis. Ann. Rheum. Dis. 52: 608-609.
Brown MG, Dnscoll J and Monaco JJ. (1991) Structural and serological similarity of MHC- linked LMP and proteasome (multicatalytic protemase) complexes. Nature. 353: 355-357.
Brunner T, Mogil RJ, LaFace D, Yoo NJ, Mahboubi A, Echevern F, Martin SJ, Force WR, Lynch DH, Ware CF and Green DR. (1995) Cell-autonomous Fas (CD95)/Fas-ligand interaction mediates activation-induced apoptosis in T-cell hybridomas. Nature. 373: 441-444.
Bunce M, O'Neil CM, Barnardo MC, Krausa P, Browning MJ, Moms PJ and Welsh KI. (1995) Phototypmg: comprehensive DNA typing for HLA-A, B, C, DRB1, DRB3, DRB4, DRB5 & DQB1 by PCR with 144 primer mixes utilising sequence-specific primers (PCR-SSP). Tissue Antigens. 46: 355-367.
Burrows SR, Rodda SJ, Suhrbier A, Geysen HM and Moss DJ. (1992) The specificity of recognition of a cytotoxic T lymphocyte epitope. Eur. J. Immunol. 22: 191-195.
Burrows SR, Khanna R, Burrows JM and Moss DJ. (1994) An alloresponse in humans is dominated by cutotoxic T lymphocytes (CTL) corss-reactive with a single Epstein-Barr virus CTL epitope: implications for graft-versus-host disease. J. Exp. Med 179: 1155-1161.
Burrows SR, Silins SL, Moss DJ, Khanna R, Misko IS and Argaet VP. (1995) T cell receptor repertoire for a viral epitope in humans is diversified by tolerance to a background major histocompatibility complex antigen. J. Exp. Med. 182: 1703-1715.
Busch DH and Pamer EG. (1998) MHC class I/peptide stability, implications for immunodominance, in vitro proliferation, and diversity of responding CTL. J. Immunol. 160: 4441-4448.
Busch DH, Pilip IM, Vijh, S, Pamer EG. (1998) Coordinate regulation of complex T cell populations responding to bacterial infection. Immunity. 8: 353-362.
Butz EA and Bevan MJ. (1998) Massive expansion of antigen-specific CD8+ T cells during an acute virus infection. Immunity. 8:167-175.
Callan MFC, Annels N, Steven N, Tan L, Wilson J, McMichael AJ and Rickinson AB. (1998) T cell selection during the evolution of CD8+ T cell memory in vivo. Eur. J. Immunol. 28: 4382- 4390.
Callan MFC, Reyburn HT, Bowness P, Rowland-Jones S, Bell JI and McMichael AJ. (1995) Selection of T cell receptor variable gene-encoded ammo acids on the third binding site loop: a factor influencing variable chain selection in a T cell response. Eur. J. Immunol. 25: 1529-1534.
Callan MFC, Steven N, Krausa P, Wilson JDK, Moss PAH, Gillespie G, Bell JI and McMichael AJ. (1996) Large clonal expansions of CD8+ T cells in acute infectious mononucleosis. Nat. Med. 2: 906-911.
121

Bibliography
Cardin RD, Brooks JW, Sarawar SW and Doherty PC. (1996) Progressive loss of CD8+ T cell- mediated control of a y-herpesvirus in the absence of CD4+ T cells. J. Exp. Med. 184: 863-871
Catalano MA, Carson DA, Slovin SF, Richman DD and Vaughan JH. (1979) Antibodies to Epstein-Barr virus-determined antigens in normal subjects and in patients with seropositive rheumatoid arthritis. Proc. Natl. Acad. Sci. USA. 76: 5825-5828.
Cerundolo V, Alexander J, Anderson K, Lamb C, Cresswell P, McMichael A, Gotch F and Townsend A. (1990) Presentation of viral antigen controlled by a gene in the major histocompatibility complex. Nature. 345: 449-452.
Chao DT, Lmette GP, Boise LH, White LS, Thompson CB, Korsmeyer SJ. (1995) Bel-XL and Bcl-2 repress a common pathway of cell death. J. Exp. Med. 182: 821-828.
Chothia C, Boswell DR and Lesk AM. (1988) The outline structure of the T cell ap receptor. EMBOJ. 7:3745-3755.
Claverie JM, Prochnicka-Chalufour A and Bougueleret L. (1989) Implications of a Fab-like structure for the T-cell receptor. Immunol. Today. 10:10-14.
Cochet C, Martel-Renoir D, Grunewald V, Bosq J, Cochet G, Schwaab G, Bernaudin JF and Joab I. (1993) Expression of the Epstein-Barr virus immediate early gene, BZLF1, in nasopharyngeal carcinoma tumor cells. Virology. 197: 358-365.
Craig FE, Gulley ML and Banks PM (1993) Posttransplantation lymphoproliferative disorders. Am. J. Clin. Pathol 99: 265-276.
Cush JJ and Lipsky PE. (1988) Phenotypic analysis of synovial tissue and peripheral blood lymphocytes isolated from patients with rheumatoid arthritis. Arthritis. Rheum. 31. 1230-1238.
Cush JJ, Pietschmann P, Oppenheimer-Marks N, Lipsky PE. (1992) The intrinsic migratory capacity of memory T cells contributes to their accumulation in rheumatoid synovium. Arthritis. Rheum. 35: 1434-1444.
D'Angeac AD, Monier S, Pilling D 5 Travaglio-Encinoza A, Reme T and Salmon M. (1994) CD57+ T lymphocytes are derived from CD57" precursors by differentiation occurring in late immune responses. Eur. J. Immunol. 24: 1503-1511.
Daly K, Nguyen P, Woodland DL and Blackman MA. (1995) Immunodominance of major histocompatibility complex class I-restricted influenza virus epitopes can be influenced by the T- cell receptor repertoire. J. Immunol. 69: 7416-7422.
David V, Hochstenbach F, Rajagopalan S and Brenner MB. (1993) Interaction with newly synthesized and retained proteins in the endoplasmic reticulum suggests a chaperone function for human integral membrane protein IP90 (calnexin). J. Biol. Chem. 268: 9585-9592.
David-Ameline J, Lim A, Davodeau F, Peyrat MA, Berthelot JM, Semana G, Pannetier C, Gaschet J, Vie H, Even J and Bonneville M. (1996) Selection of T cells reactive against autologous B lymphoblastoid cells during chronic rheumatoid arthritis. J. Immunol. 157: 4697- 4706.
Davis MM and Bjorkman PJ. (1988) T-cell antigen receptor genes and T cell recognition. Nature. 334: 395-402.
122
Bibliography
Davis MM, Boniface JJ, Reich Z, Lyons D, Hampl J, Arden B and Chien Y-H. (1998) Ligand recognition by ap T cell receptors. Annu. Rev. Immunol. 16: 523-544.
de Campos-Lima P-0, Gavioli R, Zhang Q-J, Wallace LE, Dolcetti R, Rowe M, Rickmson AB and Masucci MG. (1993) HLA-A1 lepitope loss isolates of Epstein-Barr virus from a highly Al f population. Science. 260: 98-100.
de Campos-Lima PO, Levitsky V, Brooks J, Lee SP, Hu LF, Rickinson AB and Masucci MG. (1994) T cell responses and virus evolution: loss of HLA Al 1-restricted CTL epitopes in Epstem- Barr virus isolates from highly Al 1-positive populations by selective mutation of anchor residues. J. Exp. Med. 179:1297-1305.
Deacon EM, Pallesen G, Niedobitek G, Crocker J, Brooks L, Rickmson AB and Young LS. (1993) Epstein-Barr virus and Hodgkin's disease: transcriptional analysis of virus latency in the malignant cells. J. Exp. Med. 177: 339-349.
Deckhut AM, Allan W, McMickle A, Eichelberger M, Blackman MA, Doherty PC and Woodland DL. (1993) Prominent usage of V beta 8.3 T cells in the H-2Db-restncted response to an influenza A virus necleoprotein epitope. J. Immunol. 151: 2658-2666.
Deveraux Q, Ustrell V, Pickart C and Rechsteiner M. (1994) A 26S protease subunit that binds ubiquitin conjugates. J. Biol. Chem. 269: 7059-7061.
Dick TP, Ruppert T, Groettrup M, Kloetzel PM, Kuehn L, Koszmowski UH, Stevanovic S, Schild H and Rammensee H-G. (1996) Coordinated dual cleavages induced by the proteasome regulator PA28 lead to dominant MHC ligands. Cell. 86: 253-262.
Doherty PC, Allan W, Eichelberger M and Carding SR. (1992) Roles of alpha beta and gamma delta T cell subsets in viral immunity. Annu. Rev. Immunol. 10: 123-151.
Donahue JP, Ricalton NS, Behrendt CE, Rittershaus C, Calaman S, Marrack P, Kappler JW and Kotzin BL. (1994) Genetic analysis of low V beta 3 expression in humans. J. Exp. Med. 179: 1701-1706.
Driscoll J, Brown MG, Finley D and Monaco JJ. (1993) MHC-linked LMP gene products specifically alter peptidase activities of the proteasome. Nature. 365: 262-264.
Duke RC and Cohen JJ (1986) IL-2 addiction: withdrawal of growth factor activates a suicide program in dependent T cells. Lymphokine Res. 5: 289-299.
Dunbar PR, Ogg GS, Chen J, Rust N, van der Bruggen P and Cerundolo V. (1998) Direct isolation, phenotyping and cloning of low-frequency antigen-specific cytotoxic T lymphocytes from peripheral blood. Curr. Biol. 8: 413-416.
Dustin ML and Springer TA. (1988) Lymphocyte function-associated antigen-1 (LFA-1) interaction with intercellular adhesion molecule-1 (ICAM-1) is one of at least three mechanisms for lymphocyte adhesion to cultured endothelial cells. J. Cell. Biol 107: 321-331.
Edelhoch, H. (1967) Spectroscopic determination of tryptophan and tyrosine in proteins. Biochemistry. 6: 1948-1954.
Edinger JW, Bonneville M, Scotet E, Houssaint E, Schumacher HR and Posnett DN. (1999) EBV gene expression not altered in rheumatoid synovia despite the presence of EBV antigen-specific T cell clones. J. Immunol 162: 3694-3701.
123

Bibliography
Emsele H, Steidle M, Muller CA, Fritz P, Zacher J, Schmidt H and Saal JG. (1992)
Demonstration of cytomegalovirus (CMV) DNA and anti-CMV response in the synovial
membranes and serum of patients with rheumatoid arthritis. J. Rheumatol. 19: 677-681.
Eleuten AM, Kohanski RA, Cardozo C and Orlowski M. (1997) Bovine spleen multicatalytic
protemase complex (proteasome). Replacement of X, Y and Z subumts by LMP7, LMP2 and
MECL1 and changes in properties and specificity. J. Biol. Chem. 272: 11824-11831.
Elliott SL, Pye SJ, Schmidt C, Cross SM, Silins SL and Misko IS. (1997) Dominant cytotoxic T
lymphocyte response to the immediate-early tram -activator protein, BZLF1, in persistent type A or B Epstein-Barr virus infection. J. Infect. Dis. 176: 1068-1072.
Elliott T, CerundoloV, Elvin J and Townsend A. (1991) Peptide-induced conformational change
of the class I heavy chain. Nature. 351: 402-406.
Elliott T, Smith M, Driscoll P and McMichael A. (1993) Peptide selection by class I molecules of
the major histocompatibility complex. Curr. Biol. 3: 854-866.
Elliott T, Willis A, Cerundolo V and Townsend A. (1995) Processing of major histocompatibility
class I-restricted antigens in the endoplasmic reticulum. J. Exp. Med. 181: 1481-1491.
Engel I and Hedrick SM. (1988) Site-directed mutations in the VDJ junctional region of a T cell
receptor p chain cause changes in antigenic peptide recognition. Cell. 54: 473-484.
EngelhardVH. (1994) Structure of peptides associated with class I and class II MHC molecules.
Annu. Rev. Immunol 12: 181-207.
Epstein MA and Achong BG. (1986) Introductory considerations. In The Epstein-Barr virus:
recent advances. MA Epstein, BG Achong, eds. William Heinemann Medical Books, London, p.
1-11.
Evavold BD, Sloan-Lancaster J and Alien PM. (1993) Tickling the TCR. selective T cell
functions stimulated by altered peptide ligands. Immunol. Today. 14: 602-609.
Falk K, Rotzschke O, Stevanovic S, Jung G and Rammensee H-G. (1991) Allele-specific motifs
revealed by sequencing of self-peptides eluted from MHC molecules. Nature. 351. 290-296.
Falk KI, Zou JZ, Lucht E, Linde A and Ernberg I. (1997) Direct identification by PCR of EBV
types and variants in clinical samples. J. Med. Virol. 51: 355-363.
Fazekas de St. Groth S. (1982) The evaluation of limiting dilution assays. J. Immunol. Methods.
49: Rl 1-23.
Feldmann M, Brennan FM and Maini RN. (1996) Role of cytokmes in rheumatoid arthritis. Annu.
Rev. Immunol 14: 397-440.
Fenteany G, Standaert RF, Lane WS, Choi S, Corey EJ and Schreiber SL. (1995) Inhibition of
proteasome activities and subunit-specific amino-terminal threonine modification by lactacystin.
Science. 268:726-731.
Ferguson SE and Thompson CB. (1993) A new break in V(D)J recombination. Curr. Biol. 3. SI-
53.
124
Bibliography
Fields BA, Ober B, Malchiodi EL, Lebedeva MI, Braden BC, Ysern X, Kirn JK, Shao X. Ward ES and Manuzza RA. (1995) Crystal structure of the Va domain of a T cell antigen receptor. Science. 270: 1821-1824.
Flemington E and Speck SH. (1990) Autoregulation of Epstem-Barr virus putative lytic switch gene BZLF1. J. Virol 64: 1227-1232.
Flynn KJ, Belz, GT, Altman JD, Ahmed R, Woodland DL and Doherty PC. (1998) Virus-specific CD8+ T cells in primary and secondary influenza pneumonia. Immunity. 8: 683-691.
Fremont DH, Matsumura M, Stura EA, Petersen PA and Wilson IA. (1992) Crystal structures of two viral peptides in complex with murine MHC class I H-2Kb . Science. 257: 919-927.
Gaczynska M, Rock KL and Goldberg AL. (1993) Gamma-mterferon and expression of MHC genes regulate peptide hydrolysis by proteasomes. Nature. 365: 264-267.
Gaczynska M, Rock KL, Spies T and Goldberg AL. (1994) Peptidase activities of proteasomes are differentially regulated by the major histocompatibility complex-encoded genes for LMP2 and LMP7. Proc. Nat'1 Acad. Sci. USA. 91: 9213-9217.
Gallimore, A, Glithero A, Godkin A, Tissot AC, Pluckthun A, Elliott T, Hengartner H and Zinkernagel R. (1998a) Induction and exhaustion of lymphocytic choriomeningitis virus-specific cytotoxic T lymphocytes visualized using soluble tetrameric major histocompatibility complex class I-peptide complexes. J. Exp. Med. 187: 1383-1393.
Gallimore A, Dumrese T, Hengartner H, Zinkernagel RM and Rammensee H-G. (1998b) Protective immunity does not correlate with the hierarchy of virus-specific cytotoxic T cell responses to naturally processed peptides. J. Exp. Med. 187: 1647-1657.
Garboczi DN, Ghosh P, Utz U, Fan QR, Biddison WE and Wiley DC. (1996) Structure of the complex between human T-cell receptor, viral peptide and HLA-A2. Nature. 384: 134-141.
Garcia KC, Degano M, Stanfield RL, Brunmark A, Jackson MR, Peterson PA, Teyton L and Wilson IA. (1996) An ap T cell receptor structure at 2.5 A and its orientation in the TCR-MHC complex. Science. 274: 209-219.
Garcia KC, Teyton L and Wilson IA. (1999) Structural basis of T cell recognition. Annu. Rev. Immunol 17: 369-397.
Garrett TPJ, Saper MA, Bjorkman PJ Strominger JL and Wiley DC. (1989) Specificity pockets for the side chains of peptide antigens in HLA-Aw68. Nature. 342: 692-696.
Gavioli R, Kurilla MG, de Campos-Lima PO, Wallace LE, Dolcetti R, Murray RJ, Rickinson AB and Masucci MG. (1993) Multiple HLA-A11-restricted cytotoxic T-lymphocyte epitopes of different immunogenicities in the Epstein-Barr virus-encoded nuclear antigen 4. J. Virol. 67: 1572-1578.
Gerdes J, Lemke H, Baisch H, Wacker HH, Schwab U and Stem H. (1984) Cell cycle analysis of a cell proliferation-associated human nuclear antigen defined by the monoclonal antibody Ki67. J. Immunol 133: 1710-1715.
Germam R. (1993) Seeing double. Curr. Biol. 3: 586-589.
125
Bibliography
Germam RN. (1994) MHC-dependent antigen processing and peptide presentation: providing ligands for T lymphocyte activation. Cell. 76: 287-299.
Gessner A, Moskophidis D and Lehmann-Grube F. (1989) Enumeration of single IFN-gamma- producing cells in mice during viral and bacterial infection. J. Immunol. 142: 1293-1298.
Glynne R, Powis SH, Beck S, Kelly A, Kerr L-A and Trowsdale J. (1991) A proteasome-related gene between the two ABC transporter loci in the class II region of the human MHC. Nature. 353:357-360.
Gotch F, McMichael A, Smith G and Moss B. (1987) Identification of viral molecules recognized by influenza-specific human cytotoxic T lymphocytes. J. Exp. Med. 165: 408-416.
Grandea AG, Androlewicz MJ, Athwal RS, Geraghty DE and Spies T. (1995) Dependence of peptide binding by MHC class I molecules on their interaction with TAP. Science. 270: 105-108.
Gray CW, Slaughter CA, and DeMartino GN. (1994) PA28 activator protein forms regulatory caps on proteasome stacked rings. J. Mol. Biol. 236: 7-15.
Gregersen PK, Silver J and Winchester RJ. (1987) The shared epitope hypothesis: an approach to understanding the molecular genetics of susceptibility to rheumatoid arthritis. Arthritis. Rheum. 30: 1205-1213.
Groettrup M, Kraft R, Kostka S, Standera S, Stohwasser R and Kloetzel PM. (1996) A third interferon y-induced subunit exchange in the 20S proteasome. Eur. J. Immunol. 26: 863-869.
Grogan E, Jenson H, Countryman J, Heston L, Gradoville L and Miller G. (1987) Transfection of a rearranged viral DNA fragment, Wzhet, stably converts latent Epstein-Barr virus infection to productive infection in lymphoid cells. Proc. Nat'1 Acad. Sci. USA. 84. 1332-1336.
Groll M, Ditzel L, Lowe J, Stock D, Bochtler M, Bartunik HD and Huber R. (1997) Structure of 20S proteasome from yeast at 2.4 A resolution. Nature. 386: 463-471.
Gulwani-Akolkar B, Posnett DN, Janson CH, Grunewald J, Wigzell H, Akolkar P, Gregersen PK and Silver J. (1991) T cell receptor V-segment frequencies in peripheral blood T cells correlate with human leukocyte antigen type. J. Exp. Med. 174: 1139-1146.
Guo H-C, Jardetzky TS, Garrett TPJ, Lane WS, Strominger JL and Wiley DC. (1992) Different length peptides bind to HLA-Aw68 similarly at their ends but bulge out in the middle. Nature. 360: 364-366.
Hamann D, Baars PA, Rep MHG, Hooibrink B, Kerkhof-Garde SR, Klein MR and van Lier RAW. (1997) Phenotypic and functional separation of memory and effector human CD8+ T cells. J. Exp. Med. 186: 1407-1418.
Hang L, Theofilopoulos AN and Dixon FJ. (1982) A spontaneous rheumatoid arthritis-like disease in MRL/1 mice. J. Exp. Med. 155: 1690-1701.
Hara T, Fu SM and Hansen JA. (1985) Human T cell activation. II. A new activation pathway used by a major T cell population via a disulfide-bonded dimer of a 44 kilodalton polypeptide (9.3 antigen). J. Exp. Med. 161: 1513-1524.
HaynesBF, Telen MJ, Hale LP and Denning SM. (1989) CD44 - a molecule involved in leukocyte adherence and T-cell activation. Immunol. Today. 10: 423-428.
126
Bibliography
Heemels MT and Ploegh H. (1995) Generation, translocation and presentation of MHC class I- restncted peptides. Annu. Rev. Biochem. 64: 463-491.
Hesse JE, Lieber MR, Mizuuchi K and Gellert M. (1989) V(D)J recombination: a functional definition of the joining signals. Genes Dev. 3: 1053-1061.
Hill A, Worth A, Elliott T, Rowland-Jones S, Brooks J, Rickinson A and McMichael A. (1995) Characterization of two Epstein-Barr virus epitopes restricted by HLA-B7. Eur. J. Immunol. 25: 18-24.
Hill AVS, Elvin J, Willis AC, Aidoo M, Allsopp SEM, Gotch FM, Gao XM, Takiguchi M, Greenwood BM, Townsend ARM, McMichael AJ and Whittle HC. (1992) Molecular analysis of the association of HLA-B53 and resistance to severe malaria. Nature. 360: 434-439.
Hingoram R, Choi IH, Alkolkar P, Gulwani-Alkolkar B, Pergolizzi R, Silver J and Gregersen PK. (1993) Clonal predominance of T cell receptors within the CD8+ CD45RO+ subset in normal human subjects. J. Immunol. 151: 5762-5769.
Ho M, Jaffe R, Miller G, Breimg MK, Dummer JS, Makowka L, Atchison RW, Karrer F, Nalesnik MA and Starzl TE. (1988) The frequency of Epstem-Barr virus infection and associated lymphoproliferative disease after transplantation and its manifestations in children. Transplantation. 45: 719-727'.
Hoffman L and Rechsteiner M. (1994) Activation of the multicatalytic protease. The US regulator and 20S ATPase complexes contain distinct 30-kilodalton subunits. J. Biol. Chem. 269: 16890-16895.
Hong SC, Chelouche A, Lin RH, Shaywitz D, Braunstein NS, Glimcher L and Janeway CA Jr. (1992) An MHC interaction site maps to the ammo-terminal half of the T cell receptor a chain variable domain. Cell. 69: 999-1009.
Hsu D-H, de Waal Malefyt R, Fiorentino DF, Dang M-N, Vieira P, de Vries J, Spits H, Mosmann TR and Moore KW. (1990) Expression of interleukin-10 activity by Epstein-Barr virus protein BCRF1. Science. 250: 830-832.
Hughes EA, Ortmann B, Surman M and Cresswell P. (1996) The protease inhibitor, N-acetyl-L- leucyl-L-leucyl-L-norleucinal, decreases the pool of major histocompatibility complex class I- binding peptides and inhibits peptide trimming in the endoplasmic reticulum. J. Exp. Med. 183: 1569-1578.
Hunt DF, Yates JR, Shabanowitz J, Winston S and Hauer CR. (1986) Protein sequencing by tandem mass spectrometry. Proc. Nat'1. Acad. Sci. USA. 83: 6233-6237.
Hunt DF, Henderson RA, Shabanowitz J, Sakaguchi K, Michel H, Sevilir N, Cox AL, Appella E and Engelhard VH. (1992) Characterization of peptides bound to the class I MHC molecule HLA- A2.1 by mass spectrometry. Science. 255: 1261-1263.
Hynes RO. (1992) Integrins: versatility, modulation and signalling in cell adhesion. Cell. 69: 11-25.
Irving BA, Chan AC and Weiss A. (1993) Functional characterization of a signal transducing motif present in the T cell antigen receptor £ chain. J. Exp. Med. Ill: 1093-1103.
127

Bibliography
Issekutz TB. (1992) Lymphocyte homing to sites of inflammation. Curr. Opin. Immunol. 4 287- 293.
Izui S, Eisenberg RA and Dixon FJ. (1979) IgM rheumatoid factors in mice injected with bacterial lipopolysacchandes. J. Immunol. 122: 2096-2102.
Jackson DG and Bell JI. (1990) Isolation of a cDNA encoding the human CD38 (T10) molecule, a cell surface glycoprotein with an unusual discontinuous pattern of expression during lymphocyte differentiation. J. Immunol. 144: 2811-2815.
Janossy G, Panayi G, Duke 0, Bofill M, Poulter LW and Goldstem G. (1981) Rheumatoid arthritis: a disease of T lymphocyte/macrophage immunoregulation. Lancet, ii: 839-842.
Jardetzky TS, Lane WS, Robinson RA, Madden DR and Wiley DC. (1991) Identification of self peptides bound to purified HLA-B27. Nature. 353: 326-329.
Johnson BA, Haines GK, Harlow LA and Koch AE. (1993) Adhesion molecule expression in human synovial tissue. Arthritis. Rheum. 36: 137-146.
Jorgensen JL, Esser U, Fazekas de St Groth B, Reay PA and Davis MM. (1992) Mapping T-cell receptor-peptide contacts by variant peptide immunization of single-chain transgenics. Nature. 355: 224-230.
Kagi D, Ledermann B, Burki K, Zinkernagel RM and Hengartner H. (1996) Molecular mechanisms of lymphocyte-mediated cytotoxicity and their role in immunological protection and pathogenesis in vivo. Annu. Rev. Immunol. 14: 207-232.
Kay RA, Snowden N, Hajeer AH, Boylston AW and Oilier WE. (1994) Genetic control of the human VJM3.2 T cell repertoire: importance of allelic variation outside the coding regions of the TCRBV13S2 gene. Eur. J. Immunol. 24: 2863-2867.
Kelly A, Powis SH, Glynne R, Radley E, Beck S and Trowsdale J. (1991) Second proteasome- related gene in the human MHC class II region. Nature. 353: 667-678.
Kelly A, Powis SH, Kerr LA, Mockridge I, Elliott T, Bastin J, Uchanska-Ziegler B, Ziegler A, Trowsdale J and Townsend A. (1992) Assembly and function of the two ABC transporter proteins encoded in the human major histocompatibility complex. Nature. 355: 641-644.
Kerr BM, Kienzle N, Burrows JM, Cross S, Silins SL, Buck M, Benson EM, Coupar B, Moss DJ and Sculley TB. (1996) Identification of type B-specific and cross-reactive cytotoxic T- lymphocyte responses to Epstein-Barr virus. J. Virol. 70: 8858-8864.
Khanna R, Burrows SR, Kurilla MG, Jacob, CA, Misko IS, Sculley TB, Kieff E and Moss DJ. (1992) Localisation of Epstein-Barr virus cytotoxic T cell epitopes using recombinant vaccinia: implications for vaccine development. J. Exp. Med. 176: 169-178.
Kieff E and Liebowitz D. (1990) Epstein-Barr virus and its replication. In Virology, 2nd Ed. BN Fields, DM Knipe, eds. Raven Press, New York. p. 1889-1920.
Kieff E. (1996) Epstein-Barr virus and its replication. In Virology, 3rd Ed BN Fields, DM Knipe, PM Howley, eds. Lippincott-Raven, Philadelphia, p. 2343-2396.
128
Bibliography
Klareskog L, Forsum U, Scheynius A, Kabelitz D and Wigzell H. (1982) Evidence in support of a self-perpetuating HLA-DR dependent delayed-type cell reaction in rheumatoid arthritis. Proc. Nat'1. Acad. Sci. USA. 72: 3632-3636.
Kohem CL, Brezmschek RI, Wisbey H, Tortorella C, Lipsky PE and Oppenheimer-Marks N (1996) Enrichment of differentiated CD45RBdim, C27" memory T cells in the peripheral blood, synovial fluid, and synovial tissue of patients with rheumatoid arthritis. Arthritis. Rheum. 39: 844-854.
Koide J, Takada K, Sugmra M, Sekme H, Ito T, Saito K, Mon S, Takeuchi T, Uchida S and Abe T. (1997) Spontaneous establishment of an Epstem-Barr virus-infected fibroblast line from the synovial tissue of a rheumatoid arthritis patient. J. Virol. 71: 2478-2481.
Krummel MF and Allison JP. (1995) CD28 and CTLA-4 have opposing effects on the response of T cells to stimulation. J. Exp. Med. 182: 459-465.
Lafaille JJ, DeCloux A, Bonneville M, Takagaki Y and Tonegawa S. (1989) Junctional sequences of T cell receptor y5 genes, implications for y5 T cell lineages and for a novel intermediate of V- (D)-J joining. Cell. 59: 859-870.
Lalvam A, Brookes, R, Hambleton S, Bntton WJ, Hill AVS and McMichael AJ. (1997) Rapid effector function in CD8+ memory T cells. J. Exp. Med. 186: 859-865.
Lazarovits A and Karsh J. (1993) Differential expression in rheumatoid synovmm and synovial fluid of alpha 4 beta 7 integrin. A novel receptor for fibronectin and vascular cell adhesion molecule-l.J Immunol. 151: 6482-6489.
Lee SP, Thomas WA, Murray RJ, Khanim F, Kaur S, Young LS, Rowe M, Kurilla M and Rickinson AB. (1993) HLA A2.1-restricted cytotoxic T cells recognizing a range of Epstein-Barr virus isolates through a defined epitope in latent membrane protein LMP2. J. Virol. 67: 7428- 7435.
Lenardo M, Chan FK, Hornung F, McFarland H, Siegel R, Wang J and Zheng L. (1999) Mature T lymphocyte apoptosis: immune regulation in a dynamic and unpredictable antigenic environment. Annu. Rev. Immunol. 17: 221-253.
Lenardo MJ. (1991) Interleukin-2 programs mouse ap T lymphocytes for apoptosis. Nature. 353: 858-861.
Levitskaya J, Coram M, Levitsky V, Imreh S, Steigerwald-Mullen PM, Klein G, Kurilla MG and Masucci MG. (1995) Inhibition of antigen processing by the internal repeat region of the Epstem- Barr virus nuclear antigen-1. Nature. 375: 685-688.
Lewis SM. (1994) The mechanism of V(D)J joining: lessons from molecular, immunological and comparative analyses. Adv. Immunol. 56: 27-150.
Lieber MR. (1991) Site-specific recombination in the immune system. FASEB. J. 5: 2934-2944.
Lieberman PM, O'Hare P, Hayward GS and Hayward SD. (1986) Promiscuous trans activation of gene expression by an Epstem-Barr virus-encoded early nuclear protein. J. Virol. 60: 140-148.
Lowe J, Stock D, Jap B, Zwickl P, Baumeister W and Huber R. (1995) Crystal structure of the 20S proteasome from the archeon T. acidophilum at 3.4 a resolution. Science. 268: 533-539.
129
Bibliography
Luyrink L, Gabriel CA, Thompson SF, Grom AA, Maksymowych WP, Choi E and Glass DN. (1993) Reduced expression of a human Vp6.1 T cell receptor allele. Proc. Not 7. Acad. Sci. USA. 90: 4369-4373.
Ma CP, Slaughter CA and DeMartino GN. (1992) Identification, purification and characterization of a protein activator (PA28) of the 20S proteasome (micropam). J. Biol. Chem. 267: 10515- 10523.
Ma C-P, Vu JH, Proske RJ, Slaughter CA and DeMartino GN. (1994) Identification, purification and characterization of a high molecular weight, ATP-dependent activator (PA700) of the 20S proteasome. J. Biol. Chem. 269: 3539-3547.
MacDonald HR, Casanova JL, Maryanski JL and Cerottim JC. (1993) Oligoclonal expansion of major histocompatibility complex class I-restricted cytolytic T lymphocytes during a primary immune response in vivo, direct monitoring by flow cytometry and polymerase chain reaction. J. Exp. Med. Ill: 1487-1492.
Madden DR, Gorga JC, Strominger JL and Wiley DC. (1991) The structure of HLA-B27 reveals nonamer self-peptides bound in an extended conformation. Nature. 353: 321-325.
Madden DR, Gorga JC, Strominger JL and Wiley DC. (1992) The three dimensional structure of HLA-B27 at 2.1 A resolution suggests a general mechanism for tight peptide binding to MHC. Cell. 70: 1035-1048.
Madden DR. (1995) The three-dimensional structure of peptide-MHC complexes. Annu. Rev. Immunol. 13: 587-622.
Madrenas J, Wange EL, Wang JL, Isakov N, Samelson LE and Germain RN. (1995) ^ phosphorylation without ZAP-70 activation induced by TCR antagonists or partial agonists. Science. 267:515-518.
Maggi E, Giudizi MG, Biagiotti R, Annunziato F, Manetti R, Piccinni M-P, Parronchi P, Sampognaro S, Giannarini L, Zuccati G and Romagnani S. (1994) Th2-like CD8+ T cells showing B cell helper function and reduced cytolytic activity in human immunodeficiency virus type 1 infection. J. Exp. Med. 180: 489-495.
Martinez CK and Monaco JJ. (1991) Homology of proteasome subunits to a major histocompatibility complex-linked LMP gene. Nature. 353: 664-667.
Marx J. (1995) The T cell receptor begins to reveal its many facets. Science. 267: 45-46.
Maryanski JL, Pala P, Corradin G, Jordan BR and Cerottini JC. (1986) H-2 restricted cytolytic T cells specific for HLA can recognise a synthetic HLA peptide. Nature. 324: 578-579.
Masucci MG and Ernberg I. (1994) Epstein-Barr virus: adaptation to a life within the immune system. Trends. Microbiol. 2: 125-130.
Matloubian M, Concepcion RJ and Ahmed R. (1994) CD4+ T cells are required to sustain CD8+ cytotoxic T-cell responses during chronic viral infection. J. Virol. 68: 8056-8063.
Matsui K, Boniface JJ, Stefner P, Reay PA and Davis MM. (1994) Kinetics of T-cell receptor binding to peptide/I-Ek complexes: correlation of the dissociation rate with T-cell responsiveness. Proc. Natl. Acad. Sci USA. 91: 12862-12866.
130

Bibliography
McBlane JF, van Gent DC, Ramsden DA, Romeo C, Cuomo CA. Gellert M and Oettmger MA (1995) Cleavage at a V(D)J recombination signal requires only RAG1 and RAG2 proteins and occurs in two steps. Cell. 83: 387-395.
McHeyzer-Williams MG and Davis MM. (1995) Antigen-specific development of primary and memory T cells in vivo. Science. 268:106-111.
McMichael AJ and O'Callaghan CA. (1998) Anew look at T cells. J. Exp. Meet. 187: 1367-1371.
Meier JT and Lewis SM. (1993) P nucleotides in V(D)J recombination: a fine-structure analysis.Mol. Cell. Biol 13: 1078-1092.Momburg F, Roelse J, Howard JC, Butcher GW, Hammerlmg GJ and Neefjes JJ. (1994a)Selectivity of MHC-encoded peptide transporters from human, mouse and rat. Nature. 367: 648-651.
Momburg F, Roelse J, Hammerlmg GJ and Neefjes JJ. (1994b) Peptide size selection by the major histocompatibility complex-encoded peptide transporter. J. Exp. Med. 179: 1613-1623.
Morales-Ducret J, Wayner E, Elices MJ, Alvaro-Garcia JM, Zvaifler NJ and Firestem GS. (1992) Alpha4/betal integrin (VLA-4) ligands in arthritis: vascular cell adhesion molecule-1 expression in synovium and on fibroblast-like synoviocytes. J. Immunol 149: 1424-1431.
Morley JK, Batliwalla FM, Hingoram R and Gregersen PK. (1995) Oligoclonal CD8+ T cells are preferentially expanded in the CD57+ subset. J. Immunol. 154: 6182-6190.
Morrison J, Elvin J, Latron F, Gotch F, Moots R, Strominger JL and McMichael A. (1992) Identification of the nonamer peptide from influenza A matrix protein and the role of pockets of HLA A2 in its recognistion by cytotoxic T lymphocytes. Eur. J. Immunol. 22: 903-907.
Moss DJ, Misko IS, Burrows SR, Burman K, McCarthy R and Sculley TB. (1988) Cytotoxic T cell clones discriminate between A and B tupe Epstein-Barr virus transformants. Nature. 331: 719-721.
Mousavi-Jazi M, Bostrom L, Lovmark C, Linde A, Brytting M and Sundqvist M. (1998) Infrequent detection of cytomegalovirus and Epstein-Barr virus DNA in synovial membranes of patients with rheumatoid arthritis. J. Rheumatol 25: 623-628.
Murali-Krishna K, Altman JD, Suresh M, Sourdive DJD, Zajac AJ, Miller JD, Slansky J and Ahmed R. (1998) Counting antigen-specific CDS T cells: a reevaluation of bystander activation during viral infection. Immunity. 8:177-187.
Murray RJ, Kunlla MG, Brooks JM, Thomas WA, Rowe M, Kieff E and Rickinson AB. (1992) Identification of target antigens for the human cytotoxic T cell response to Epstein-Barr virus (EBV): implications for the immune control of EBV-positive malignancies. J. Exp. Med. 176: 157-168.
Nadel B and Feeney AJ. (1995) Influence of coding-end sequence on coding-end processing in V(D)J recombination. J. Immunol 155: 4322-4329.
Nagata S and Golstem P. (1995) The Fas death factor. Science. 267: 1449-1456.
Nakamura M, Manser T, Pearson GD, Daley MJ and Gefter ML. (1984) Effect of IFN-gamma on the immune response in vivo and on gene expression in vitro. Nature. 307: 381-382.
131
Bibliography
Nandi D, Jiang H, Monaco JJ. (1996) Identification of MECL-1 (LMP-10) as the third IFN- gamma-mducible proteasome subunit. J. Immunol. 156: 2361-2364.
Neisig A, Roelse J, Sijts AJ, Ossendorp F, Feltkamp MC, Kast WM, Melief CJ and Neefjcs JJ (1995) Major differences in transporter associated with antigen presentation (TAP)-dependent translocation of MHC class I-presentable peptides and the effect of flanking sequences. J. Immunol. 154: 1273-1279.
Niedermann G, Butz S, Ihlenfeldt HG, Grimm R, Lucchian M, Hoschutzky H, Jung G, Maier B and Eichmann K. (1995) Contribution of proteasome-mediated proteolysis to the hierarchy of epitopes presented by major histocompatibility complex class I molecules. Immunity. 2: 289-299.
Nieland TJ, Tan MC, Monne van Muijen M, Komng F, Kruisbeek AM, van Bleek GM. (1996) Isolation of an immunodominant viral peptide that is endogenously bound to the stress protein gp96/grp94. Proc. Nat'1 Acad. Sci. USA. 93: 6135-6139.
Nixon DF and McMichael AJ. (1991) Cytotoxic T-cell recognition of HIV proteins and peptides. AIDS. 5: 1049-1059.
Oettmger MA, Schatz DG, Gorka C and Baltimore D. (1990) RAG-1 and RAG-2, adjacent genes that synergistically activate V(D)J recombination. Science. 248: 1517-1523.
Ohashi PS, Pircher H, Burki K, Zinkernagel RM and Hengartner H. (1990) Distinct sequence of negative or positive selection implied by thymocyte T-cell receptor densities. Nature. 346: 861- 863.
Ortiz-Navarrete V, Seelig A, Gernold M, Frentzel S, Kloetzel PM and Hammerling GJ. (1991) Subunit of the '20S' proteasome (multicatalytic proteinase) encoded by the major histocompatibility complex. Nature. 353. 662-664.
Ortmann B, Androlewicz M and Cresswell P. (1994) MHC class I/p2-microglobulin complexes associate with TAP transporters before peptide binding. Nature. 368: 864-867.
Ortmann B, Copeman J, Lehner PJ, Sadasivan B, Herbert JA, Grandea AG, Riddell SR, Tampe R, Spies T, Trowsdale J and Cresswell P. (1997) A critical role for tapasin in the assembly and function of multimeric MHC class I-TAP complexes. Science. Til: 1306-1309.
Ossendorp F, Eggers M, Neisig A, Ruppert T, Groettrup M, Sijts A, Mengede E, Kloetzel PM, Neefjes J, Koszinowski U and Melief C. (1996) A single residue exchange within a viral CTL epitope alters proteasome-mediated degradation resulting in lack of antigen presentation. Immunity. 5: 115-124.
Pamer EG, Harty JT, Bevan MJ. (1992) Precise prediction of a dominant class I MHC-restricted epitope of Listeria monocytogenes. Nature. 353: 852-855.
Pamer EG, Sijts AJAM, Villanueva MS, Busch DH and Vijh S. (1997) MHC class I antigen processing of Listeria monocytogenes proteins: implications for dominant and subdommant CTL responses. Immunol. Rev. 158: 129-136.
Pan G, Ni J, Wei YF, Yu G, Gentz R and Dixit VM. (1997) An antagonist decoy receptor and a death domain-containing receptor for TRAIL. Science. 277: 815-818.
132
Bibliography
Pantaleo B, Demarest JF, Soudeyns H, Groziosi C, Denis F, Adelsberger JW, Borros P, Saag MS. Shaw GM, Sekaly RP and Fauci AS. (1994) Major expansions of CDS' T cells with a predominant Vp usage during the primary immune response to HIV. Nature. 370: 463-467
Papadopoulos EB, Ladanyi M, Emmanuel D, Mackmnon S, Boulad F, Carabasi MR Castro- Malaspma H, Childs BH, Gillio AP, Small TN, et al. (1994) Infusions of donor Ieukoc\tes to treat Epstem-Barr virus-associated lymphoproliferative disorders after allogeneic bone marrow transplantation. N. Engl. J. Med. 330: 1185-1191.
Parham P and Brodsky FM. (1981) Partial purification and some properties of BB7.2. A cytotoxic monoclonal antibody with specificity for HLA-A2 and a variant of HLA-A28. Hum. Immunol. 3: 277-299.
Parker CD and Gould KG. (1996) Influenza A virus: a model for viral antigen presentation to cytotoxic T lymphocytes. Semin. Virol. 7: 61-73.
Parker KC, Bednarek MA and Coligan JE. (1994) Scheme for ranking potential HLA-A2 binding peptides based on independent binding of individual peptide side-chains. J. Immunol. 152: 163- 175.
Pearson GR, Luka K, Petti L, Sample J, Birkenbach M, Braun D and Kieff E. (1987) Identification of an Epstein-Barr virus early gene encoding a second component of the restricted early antigen complex. Virology. 160: 151-161.
Petrie HT, Hugo P, Scollay R and Shortman K. (1990) Lineage relationships and developmental kinetics of immature thymocytes: CD3, CD4 and CD8 acquisition in vivo and in vitro. J. Exp. Med 172: 1583-1588.
Posnett DN, Vissinga CS, Pambuccian C, Wei S, Robinson MA, Kotsyu D and Concannon P. (1994a) Level of human TCRBV3S1 (Vbeta3) expression correlates with allelic polymorphism in the spacer region of the recombination signal sequence. J. Exp. Med 179: 1707-1711.
Posnett DM, Sinha R, Kabak S and Russo C. (1994b) Clonal populations of T cells in normal elderly human: the T cell equivalent to "benign monoclonal gammapathy". J. Exp. Med 179. 609-618.
Posnett DN, Romagne F, Necker A, Kotzin BL and Sekaly RP. (1996) First human TCR monoclonal antibody workshop. The Immunologist. 4:5-8.
Posnett DN and Edinger J. (1997) When do microbes stimulate rheumatoid factor? J. Exp. Med. 185: 1721-1723.
Prang NS, Hornef MW, Jager M, Wagner HJ, Wolf H and Schwarzmann FM. (1997) Lytic replication of Epstein-Barr virus in the peripheral blood: analysis of viral gene expression in B lymphocytes during infectious mononucleosis and in the normal carrier state. Blood. 89: 1665- 1677.
Qm S, Rottman JB, Myers P, Kassam N, Weinblatt M, Loetscher M, Koch AE, Moser B and Mackay CR. (1998) The chemokine receptors CXCR3 and CCR5 mark subsets of T cells associated with certain inflammatory reactions. J. Clin. Invest. 101: 746-754.
Rammensee H-G, Friede T and Stevanovic S. (1995) MHC ligands and peptide motifs, first \istmg.Immunogenetics. 41: 178-228.
133
Bibliography
Ramsden RA, McBIane JF, van Gent DC and Gellert M. (1996) Distinct DNA sequence and structure requirements for the two steps of V(D)J recombination signal cleavage. LIMBO J. 15: 3197-3206.
Reich Z, Boniface JJ, Lyons DS, Borochov N, Wachtel EJ and Davis MM. (1997) Ligand- specific oligomenzation of T-cell receptor molecules. Nature. 387: 617-620.
Rickinson AB and Kieff E. (1996) Epstem-Barr virus. In Virology, 3rd Ed. BN Fields, DM Kmpe, PM Howley, eds. Lippincott-Raven, Philadelphia, p. 2397-2446.
Rickinson AB and Moss DJ. (1997) Human cytotoxic T lymphocyte responses to Epstem-Barr virus infection.
Rickinson AB. (1986) Cellular immunological responses to the virus infection. In The Epstein- Barr virus: recent advances. MA Epstein, BG Achong, eds. William Heinemann Medical Books, London, p. 75-125.
Robey E and Fowlkes BJ. (1994) Selective events in T cell development. Annu. Rev. Immunol. 12: 675-705.
Rock KL, Gramm C, Rothstein L, Clark K, Stein R, Dick L, Hwang D and Goldberg AL. (1994) Inhibitors of the proteasome block the degradation of most cell proteins and the generation of peptides presented on MHC class I molecules. Cell. 78: 761-71.
Romeo C, Amiot M and Seed B. (1992) Sequence requirements for induction of cytolysis by the T cell antigen/Fc receptor £ chain. Cell. 68: 889-897.
Rooney CM, Smith CA, Ng CY, Loftin S, Li C, Krance RA, Brenner MK and Heslop HE. (1995) Use of gene-modified virus-specific T lymphocytes to control Epstein-Barr virus-related lymphoproliferation. Lancet. 345: 9-13.
Rosenberg ES, Billingsley JM, Caliendo AM, Boswell SL, Sax PE, Kalams SA and Walker BD. (1997) Vigorous HIV-l-specific CD4+ T cell responses associated with control of viremia. Science. 278: 1447-1450.
Rosenberg WM, Moss PA and Bell JI. (1992) Variation in human T cell receptor Vp and Jp repertoire: analysis using anchor polymerase chain reaction. Eur. J. Immunol. 22: 541-549.
Rotzschke O, Falk K, Deres K, Schild H, Norda M, Metzger J, Jung G and Rammensee H-G. (1990) Isolation and analysis of naturally processed viral peptides as recognized by cytotoxic T cells. Nature. 348: 252-254.
Rotzschke 0, Falk K, Stevanovic S, Jung G, Walden P and Rammensee H-G. (1991) Exact prediction of a natural T cell epitope. Eur. J. Immunol. 21: 2891-2894.
Rowe M, Lear AL, Croom-Carter D, Davies AH and Rickinson AB. (1992) Three pathways of Epstein-Barr virus gene activation from EBNA-1-positive latency in B lymphocytes. J. Virol. 66: 122-131.
Rudensky AY, Preston-Hurlburt P, Hong SC, Barlow A and Janeway CA Jr. (1991) Sequence analysis of peptides bound to MHC class II molecules. Nature. 353: 622-627.
Ruppert J, Sidney J, Celis E, Kubo RT, Grey HM and Sette A. (1993) Prominent role of secondary anchor residues in peptides binding to HLA-A2.1 molecules. Cell. 74: 929-937.
134
Bibliography
Saal JG, Steidle M, Einsele H, Muller CA, Fritz P and Zacher J. (1992) Persistence of B19 parvovirus in synovial membranes of patients with rheumatoid arthritis. Rheumatol. Int. 12: 147- 151.
Sad S, Marcotte R and Mosmann TR. (1995) Cytokine-mduced differentiation of precursor mouse CD8+ T cells into cytotoxic CD8+ T cells secreting Thl or Th2 cytokmes. Immunity. 2: 271-279.
Sadasivan B, Lehner PJ, Ortmann B, Spies T and Cresswell P. (1996) Roles for calreticulm and a novel glycoprotein, tapasin, in the interaction of MHC class I molecules with TAP. Immunity. 5: 103-114.
Sadofsky MJ, Hesse JE, van Gent DC and Gellert M. (1995) RAG-1 mutations that affect the target specificity of V(D)J recombination: a possible direct role of RAG-1 in site recognition. Genes Dev. 9: 2193-2199.
Sallusto F, Lenig D, Mackay CR and Lanzavecchia A. (1998) Flexible programs of chemokine receptor expression on human polarized T helper 1 and 2 lymphocytes. J. Exp. Med. 187: 875- 883.
Salter RD and Cresswell P. (1986) Impaired assembly and transport of HLA-A and -B antigens in a mutant TxB cell hybrid. EMBO J. 5: 943-949.
Sant'Angelo DB, Waterbury G, Preston-Hurlburt P, Yoon ST, Medzhitov R, Hong SC and Janeway CA Jr. (1996) The specificity and orientation of a TCR to its peptide-MHC class II ligands. Immunity. 4: 367-476.
Schatz DG, Oettinger MA and Baltimore D. (1989) The V(D)J recombination activating gene, RAG-1. Cell. 59: 1035-1048.
Schluter C, Duchrow M, Wohlenberg C, Becker MH, Key G, Flad HD and Gerdes J. (1993) The cell proliferation-associated antigen of antibody Ki-67: a very large, ubiquitous nuclear protein with numerous repeated elements, representing a new kind of cell cycle-maintaining proteins. J. Cell.Biol 123:513-522.
Schwab R, Szabo P, Manavalan JS, Weksler ME, Posnett DN, Pannetier C, Kounlsky P and Even J. (1997) Expanded CD4+ and CD8+ T cell clones in elderly humans. J. Immunol. 158: 4493- 4499.
Scotet E, David-Ameline J, Peyrat M-A, Moreau-Aubry A, Pinczon D, Lim A, Even J, Semana G, Berthelot J-M, Breathnach R, Bonneville M and Houssaint E. (1996) T cell response to Epstein-Barr virus transactivators in chronic rheumatoid arthritis. J. Exp. Med. 184: 1791-1800.
Scotet E, Peyrat M-A, Saulqum X, Retiere C, Couedel C, Davodeau F, Dulphy N, Toubert A, Bignon JD, Lim A, Vie H, Hallet MM, Liblau R, Weber M, Berthelot J-M, Houssaint E and Bonneville M. (1999) Frequent enrichment for CDS T cells reactive against common herpes viruses in chronic inflammatory lesions: towards a reassessment of the physiopathological significance of T cell clonal expansions found in autoimmune inflammatory processes. Eur. J. Immunol. 29: 973-985.
Sebzda E, Mariathasan S, Ohteki T, Jones R, Bachmann MF and Ohashi PS. (1999) Selection of the T cell repertoire. Annu. Rev. Immunol. 17: 829-874.
135
Bibliography
Sette A, Sidney J, del Guercio M-F, Southwood S, Ruppert J, Dahlberg. C, Grey HM and Kubo RT. (1994) Peptide binding to the most frequent HLA-A class I alleles measured by quantitative molecular binding assays. Mol Immunol. 31: 813-822.
Sette A, Vitiello A, Reherman B, Fowler P, Nayersma R, Kast WM, Melief CJ, OseroffC, Yuan L, Ruppert J, Sidney J, Del Guercio MF, Southwood S, Kubo RT, Chestnut RW, Grey HM and Chisari FV. (1994) The relationship between class I binding affinity and immunogemcity of potential cytotoxic T cell epitopes. J. Immunol. 153: 5586-5592.
Shapiro A, Imreh M, Leonchiks A, Imreh S and Masucci MG. (1998) A minimal glycine-alanme repeat prevents the interaction of ubiquitinated IicBa with the proteasome: a new mechanism for selective inhibition of proteolysis. Nat. Med. 4: 939-944.
Silins SL, Cross SM, Elliott SL, Pye SJ, Burrows JM, Moss DJ and Misko IS. (1997) Selection of a diverse TCR repertoire in response to an Epstein-Barr virus-encoded transactivator protein BZLF1 by CD8+ cytotoxic T lymphocytes during primary and persistent infection. Int. Immunol. 9: 1745-1755.
Silver, NL, Guo H-C, Strominger JL and Wiley DC. (1992) Atomic structure of a human MHC molecule presenting an influenza virus peptide. Nature. 360: 367-369.
Sixbey JW, Nedrud JG, Raab-Traub N, Hanes RA and Pagano JS. (1984) Epstein-Barr virus replication in oropharyngeal epithelial cells. TV. Engl. J. Med. 310: 1225-1230.
Sloan-Lancaster J, Steinberg TH and Alien PM. (1996) Selective activation of the calcium signalling pathway by altered peptide ligands. J. Exp. Med. 184: 1525-1530.
Sourdive DID, Murali-Krishna K, Altman JD, Zajac AJ, Whitmore JK, Pannetier C, Kourilsky P, Evavold B, Sette A and Ahmed R. (1998) Conserved T cell receptor repertoire in primary and memory CD8 T cell responses to an acute viral infection. J. Exp. Med. 188: 71-82.
Spertini O, Luscinskas FW, Kansas GS, Munro JM, Griffin JD, Gimbrone MA, Jr. and Tedder TF. (1991) Leukocyte adhesion molecule-1 (LAM-1, L-selectin) interacts with an inducible endothelial cell ligand to support leukocyte adhesion. J. Immunol. 147: 2565-2573.
Spriggs MK. (1996) One step ahead of the game: viral immunomodulatory molecules. Annu. Rev. Immunol. 14: 101-130.
Steven NM, Leese AM, Annels NE, Lee SP and Rickinson AB. (1996) Epitope focusing in the primary cytotoxic T cell response to Epstein-Barr virus and its relationship to T cell memory. J. Exp. Med. 184: 1801-1813.
Steven NM, Annels NE, Kumar A, Leese AM, Kurilla MG and Rickinson AB. (1997) Immediate early and early lytic cycle proteins are frequent targets of the Epstein-Barr virus-induced cytotoxic T cell response. J. Exp. Med. 185: 1605-1617.
Stuart AD, Stewart JP, Arrand JR and Mackett M. (1995) The Epstein-Barr virus encoded cytokine viral interleukin-10 enhances transformation of human B lymphocytes. Oncogene. 11:1711-1719.
Studier FW, Rosenberg AH, Dunn JJ and Dubendorff JW. (1990) Use of T7 RNA polymerase to direct expression of cloned genes. Methods. Enzymol. 185: 60-89.
136
Bibliography
Sun R, Shepherd SE, Geier SS, Thompson CT, Sheil JM and Nathenson SG. (1995) Evidence that the antigen receptors of cytotoxic T lymphocytes interact with a common recognition pattern on the H-2Kb molecule. Immunity. 3: 573-382.
Sutkowski N, Palkama T, Ciurli C, Sekaly R-P, Thorley-Lawson DA and Huber BT. (1996) An Epstein-Barr virus-associated superantigen. J. Exp. Med. 184: 971-980.
Suto R and Srivastava PK. (1995) A mechanism for the specific immunogemcity of heat shock protein-chaperoned peptides. Science. 269: 1585-1588.
Suzuki T, Tahara H, Narula S, Moore KW, Robbms RD and Lotze MT. (1995) Viral interleukin 10 (IL-10), the human herpesvirus 4 cellular IL-10 homologue, induces local anergy to allogeneic and syngeneic tumours. J. Exp. Med. 182: 477-486.
Takei M, Mitamura K, Fujiwara S, Horie T, Ryu J, Osaka S, Yoshmo S and Sawada S. (1997) Detection of Epstein-Barr virus-encoded small RNA 1 and latent membrane protein 1 in synovial lining cells from rheumatoid arthritis patients. Int. Immunol. 9: 739-743.
Theofilopoulos AN, Balderas RS, Hang L and Dixon FJ. (1983) Monoclonal IgM rheumatoid factors derived from athritic MRL/Mp-lpr/lpr mice. J. Exp. Med. 158: 901-919.
Tierney RJ, Steven N, Young LS, Rickinson AB (1994) Epstein-Barr virus latency in blood mononuclear cells: analysis of viral gene transcription during primary infection and in the carrier state. J. Immunol. 68: 7374-7385.
Tigges MA, Koelle D, Hartog K, Sekulovich RE, Corey L and Burke RL. (1992) Human CD8+ herpes simplex virus-specific T lymphocyte clones recognise diverse virion protein antigens. J. Virol. 66: 1622-1634.
Tonegawa S. (1983) Somatic generation of antibody diversity. Nature. 302: 575-581.
Tough DF and Sprent J. (1998) Anti-viral immunity: spotting virus-specific T cells. Curr. Biol. 8: 498-501.
Townsend AR and Skehel JJ. (1982) Influenza A specific cytotoxic T-cell clones that do not recognise viral glycoproteins. Nature. 300: 655-657.
Townsend AR, Rothbard J, Gotch FM, Bahadur G, Wraith D and McMichael AJ. (1986) The epitopes of influenza nucleoprotein recognized by cytotoxic T lymphocytes can be defined with short synthetic peptides. Cell. 44: 959-968.
Townsend A, Ohlen C, Bastin J, Ljunggren H-G, Foster L and Karre K. (1989) Association of class I major histocompatibihty heavy and light chains induced by viral peptides. Nature. 340: 443-448.
Townsend A, Elliott T, Cerundolo V, Foster L, Barber B and Tse A. (1990) Assembly of MHC class I molecules analyzed in vitro. Cell. 62: 285-295.
Townsend A and Trowsdale J. (1993) The transporters associated with antigen presentation. Semin. Cell. Biol. 4:53-61.
Toyonaga B, Yoshikai Y, Vadasz V, Chin B and Mak TW. (1985) Organisation and sequences of the diversity, joining and constant region genes of the human T-cell receptor p chain. Proc. Nat 7. Acad Sci. USA. 82: 8624-8628.
137
Bibliography
Trentham DE, Townes AS and Kang AH. (1977) Autoimmumty to type II collagen, an experimental model of arthritis. J. Exp. Med. 146: 857-868.
Trentham DE, Dynesius RA and David JR. (1978) Passive transfer by cells of type II collagen- induced arthritis in rats. J. Clin. Invest. 62: 359-366.
Uehara T, Miyawaki T, Ohta K, Tamaru Y, Yokoi T, Nakamura S and Tamguchi N. (1992) Apoptotic cell death of primed CD45RO+ T lymphocytes in Epstem-Barr virus-induced infectious mononucleosis. Blood. 80: 452-458.
van Endert PM, Riganelli D, Greco G, Fleischhauer K, Sidney J, Sette A and Bach J-F. (1995) The peptide-binding motif for the human transporter associated with antigen processing. J. Exp. Med. 182: 1883-1895.
van Gent DC, McBlane JF, Ramsden DA, Sadofsky MJ, Hesse JE and Gellert M. (1995) Initiation of V(D)J recombination in a cell-free system. Cell. 81: 925-934.
Vijh S, Pilip IM and Pamer EG. (1998) Effect of antigen-processing efficiency on in vivo T cell response magnitudes. J. Immunol 160: 3971-3977.
Villanueva MS, Fischer P, Feen K and Pamer EG. (1994) Efficiency of MHC class I antigen processing: a quantitative analysis. Immunity. 1: 479-489.
Viola A and Lanzavecchia A. (1996) T cell activation determined by T cell receptor number and tunable thresholds. Science. 273: 104-106.
von Herrath MG, Dockter J, Nerenberg M, Gairin JE and Oldstone MB. (1994) Thymic selection and adaptability of cytotoxic T lymphocyte responses in transgenic mice expressing a viral protein in the thymus. J. Exp. Med. 180: 1901-1910.
Waldmann TA. (1991) The interleukin-2 receptor. J. Biol. Chem. 266: 2681-2684.
Wange RL and Samelson LE. (1996) Complex complexes: signalling at the TCR. Immunity. 5: 197-205.
Weidt G, Utermohlen O, Heukeshoven J, Lehmann-Grube F and Deppert W. (1998) Relationship among immunodominance of single CD8+ T cell epitopes, virus load, and kinetics of primary antiviral CTL response. J. Immunol 160: 2923-2931.
Weiss A and Littman DR. (1994) Signal transduction by lymphocyte antigen receptors. Cell 76: 263-274.
Yao QY, Rickinson AB, Gaston JS and Epstein MA. (1986) Disturbance of the Epstem-Barr virus-host balance in rheumatoid arthritis patients: a quantitative study. Clin. Exp. Immunol 64: 302-310.
Yao QY, Tierney RJ, Croom-Carter D, Dukers D, Cooper GM, Ellis CJ, Rowe M and Rickinson AB. (1996) Frequency of multiple Epstein-Barr virus infections from T-cell- immunocompromised individuals. J. Virol 70: 4884-94.
Yates J, Warren N, Reisman D and Sugden B. (1984) A cw-acting element from the Epstem-Barr viral genome that permits stable replication of recombinant plasmids in latently-infected cells. Proc. Nat'1 Acad. Sci. USA. 81: 3806-3810.
138
Bibliography
Yewdell JW and Bennmk JR. (1992) Cell biology of antigen processing and presentation to major histocompatibility complex class I molecule-restricted T lymphocytes. Adv. Immunol. 52: 1-123.
Yewdell JW and Bennink JR. (1999) Immunodominance in major histocompatibility complex class I-restricted T lymphocyte responses. Annu. Rev. Immunol. 17: 51-88.
Yokota A, Murata N, Saiki 0, Shimizu M, Springer TA and Kishimoto T. (1995) High avidity state of leukocyte function-associated antigen-1 on rheumatoid synovial fluid T lymphocytes. J. Immunol. 155:4118-4124.
Zajac AJ, Blattman JN, Murali-Krishna K, Sourdive DJD, Suresh M, Altman JD and Ahmed R. (1998) Viral immune evasion due to persistence of activated T cells without effector function. J. Exp.Med. 188:2205-2213.
Zhang L, Nikkari S, Skurnik M, Ziegler T, Luukkainen R, Mottonen T and Toivanen P. (1993) Detection of herpesviruses by polymerase chain reaction in lymphocytes from patients with rheumatoid arthritis. Arthritis. Rheum. 36: 1080-1086.
Zheng L, Trageser CL, Willerford DM and Lenardo MJ. (1998) T cell growth cytokines cause the superinduction of molecules mediating antigen-induced T lymphocyte death. J. Immunol. 160: 763-769.
Zinkernagel RM and Doherty PC. (1974a) Restriction of in vitro T cell-mediated cytotoxicity in lymphocytic choriomeningitis within a syngeneic or semiallogeneic system. Nature. 248: 701- 702.
Zinkernagel RM and Doherty PC. (1974b) Immunological surveillance against altered self components by sensitised T lymphocytes in lymphocytic choriomeningitis. Nature. 251: 547-548.
Zinkernagel RM, Bachmann MF, Kundig TM, Oehen S, Pircher H and Hengartner H. (1996) On immunological memory. Annu. Rev. Immunol. 14: 333-357.
Zuniga-Pflucker JC and Lenardo M. (1996) Regulation of thymocyte development from immature progenitors. Curr. Opin. Immunol. 8: 215-224.
139
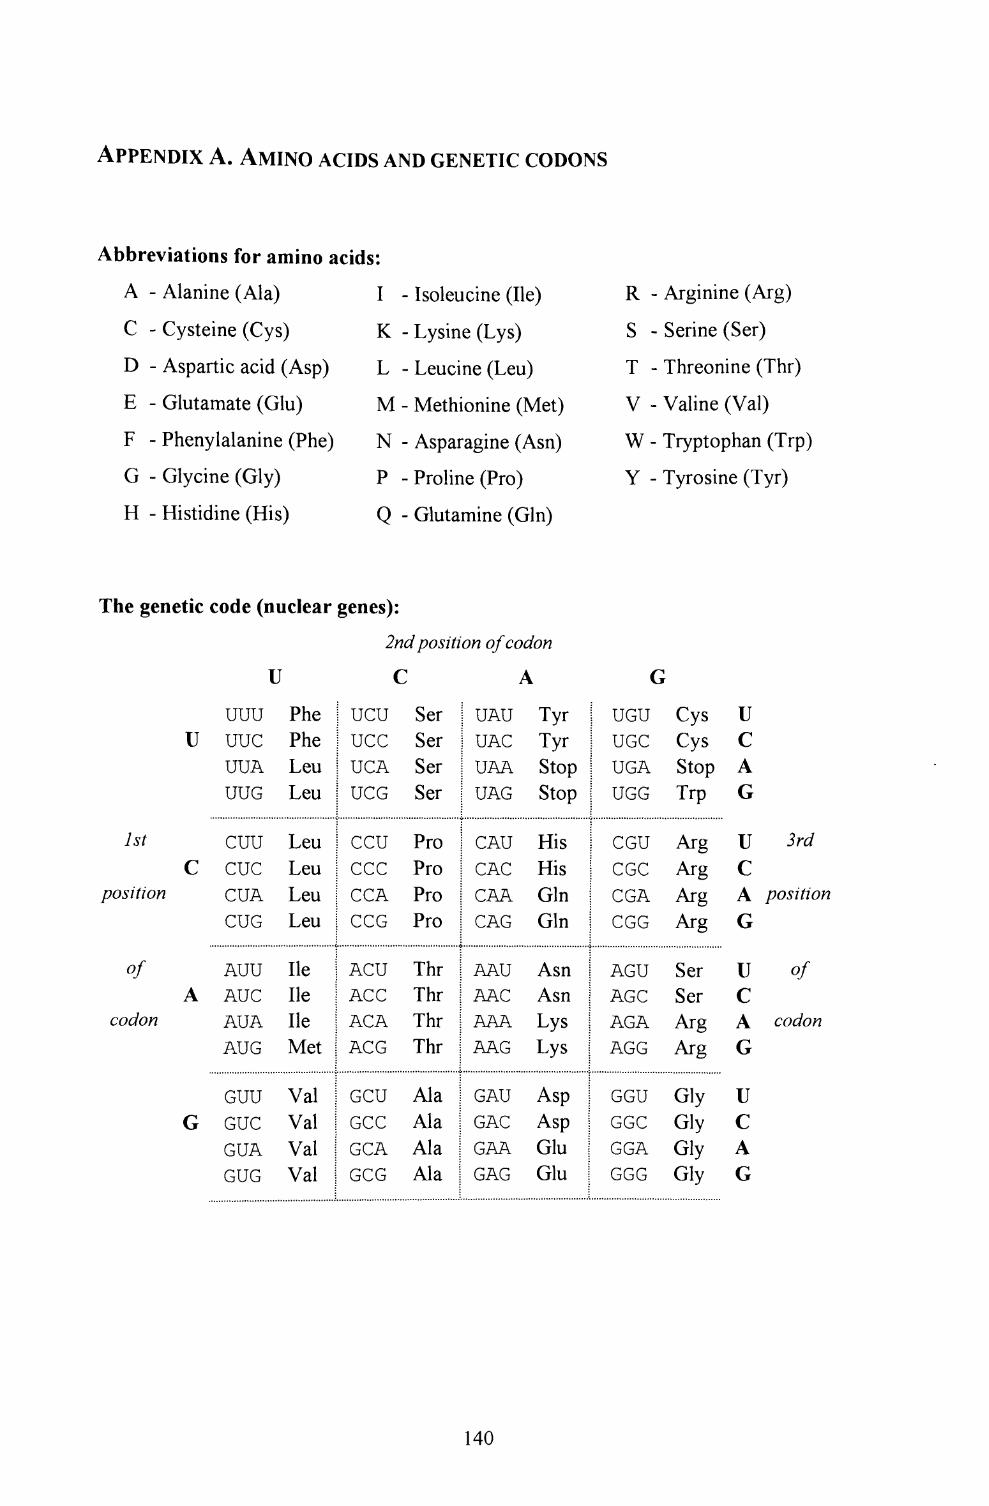
APPENDIX A. AMINO ACIDS AND GENETIC CODONS
Abbreviations for amino acids:
A - Alanine (Ala) I
C - Cysteine (Cys) K
D - Aspartic acid (Asp) L
E - Glutamate (Glu) M
F - Phenylalanine (Phe) N
G - Glycine (Gly) P
H - Histidine (His) Q
Isoleucine (He)
Lysine (Lys)
Leucine (Leu)
Methionine (Met)
Asparagine (Asn)
Proline (Pro)
Glutamine (Gin)
R - Arginine (Arg)
S - Serine (Ser)
T - Threonine (Thr)
V - Valine (Val)
W - Tryptophan (Trp)
Y - Tyro sine (Tyr)
The genetic code (nuclear genes):2nd position ofcodon
U C A
U
1stC
position
ofA
codon
G
uuuuucUUAUUG
CUUcueCUACUG
AUUAUCAUAAUG
GUUGUCGUAGUG
PhePheLeuLeu
LeuLeuLeuLeu
HeHeHeMet
ValValValVal
[ ucu1 ucc[ UCAI UCG
| ecuI ccc1 CCA| CCG
[ ACUI ACCI ACA| ACG
[ GCUI GCC[ GCA[ GCG
SerSerSerSer
ProProProPro
ThrThrThrThr
AlaAlaAlaAla
| UAU| UAC| UAA1 UAG
| CAU| CAC1 CAA| GAG
1 AAU| AACI AAA1 AAG
1 GAU| GAC! GAA1 GAG
Tyr [Tyr 1Stop |Stop !
His |His IGin 1Gin |
Asn IAsn !Lys !Lys |
Asp 1Asp !Glu |Glu |
UGUUGCUGAUGG
CGUCGCCGACGG
AGUAGCAGAAGG
GGUGGCGGAGGG
CysCysStopTrp
ArgArgArgArg
SerSerArgArg
GlyGlyGlyGly
UCAG
UCAG
UCAG
UCAG
3rd
position
of
codon
140
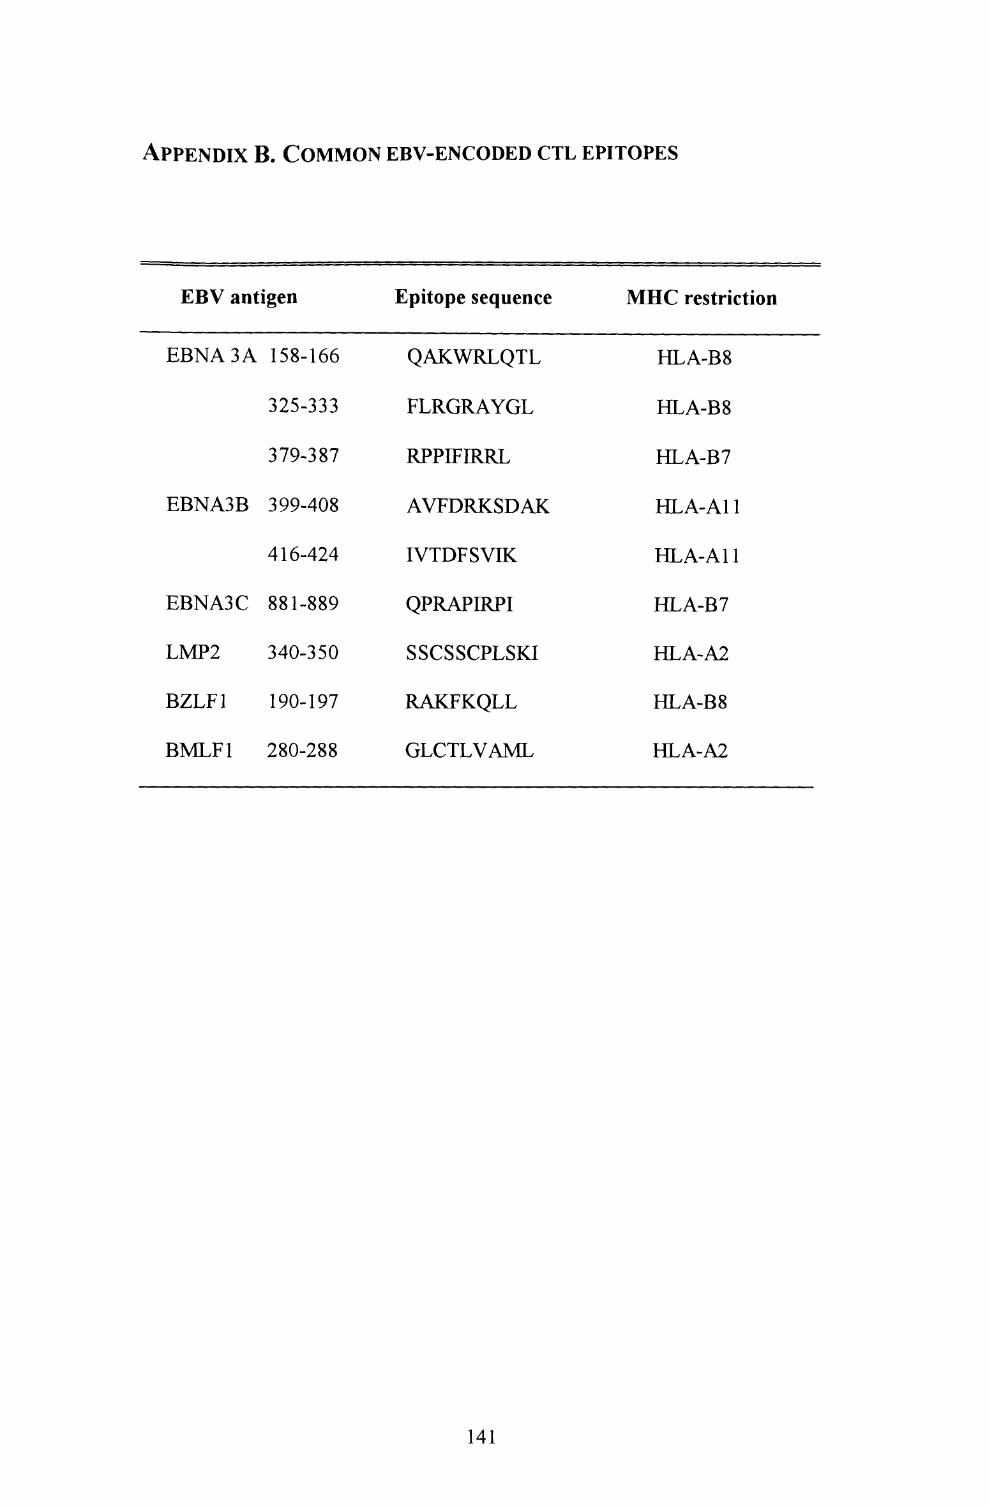
APPENDIX B. COMMON EBV-ENCODED CTL EPITOPES
EBV antigen Epitope sequence MHC restriction
EBNA3A 158-166
325-333
379-387
EBNA3B 399-408
416-424
EBNA3C 881-889
LMP2 340-350
BZLF1 190-197
BMLF1 280-288
QAKWRLQTL
FLRGRAYGL
RPPIFIRRL
AVFDRKSDAK
IVTDFSVIK
QPRAPERPI
SSCSSCPLSKI
RAKFKQLL
GLCTLVAML
HLA-B8
HLA-B8
HLA-B7
HLA-A11
HLA-A11
HLA-B7
HLA-A2
HLA-B8
HLA-A2
141
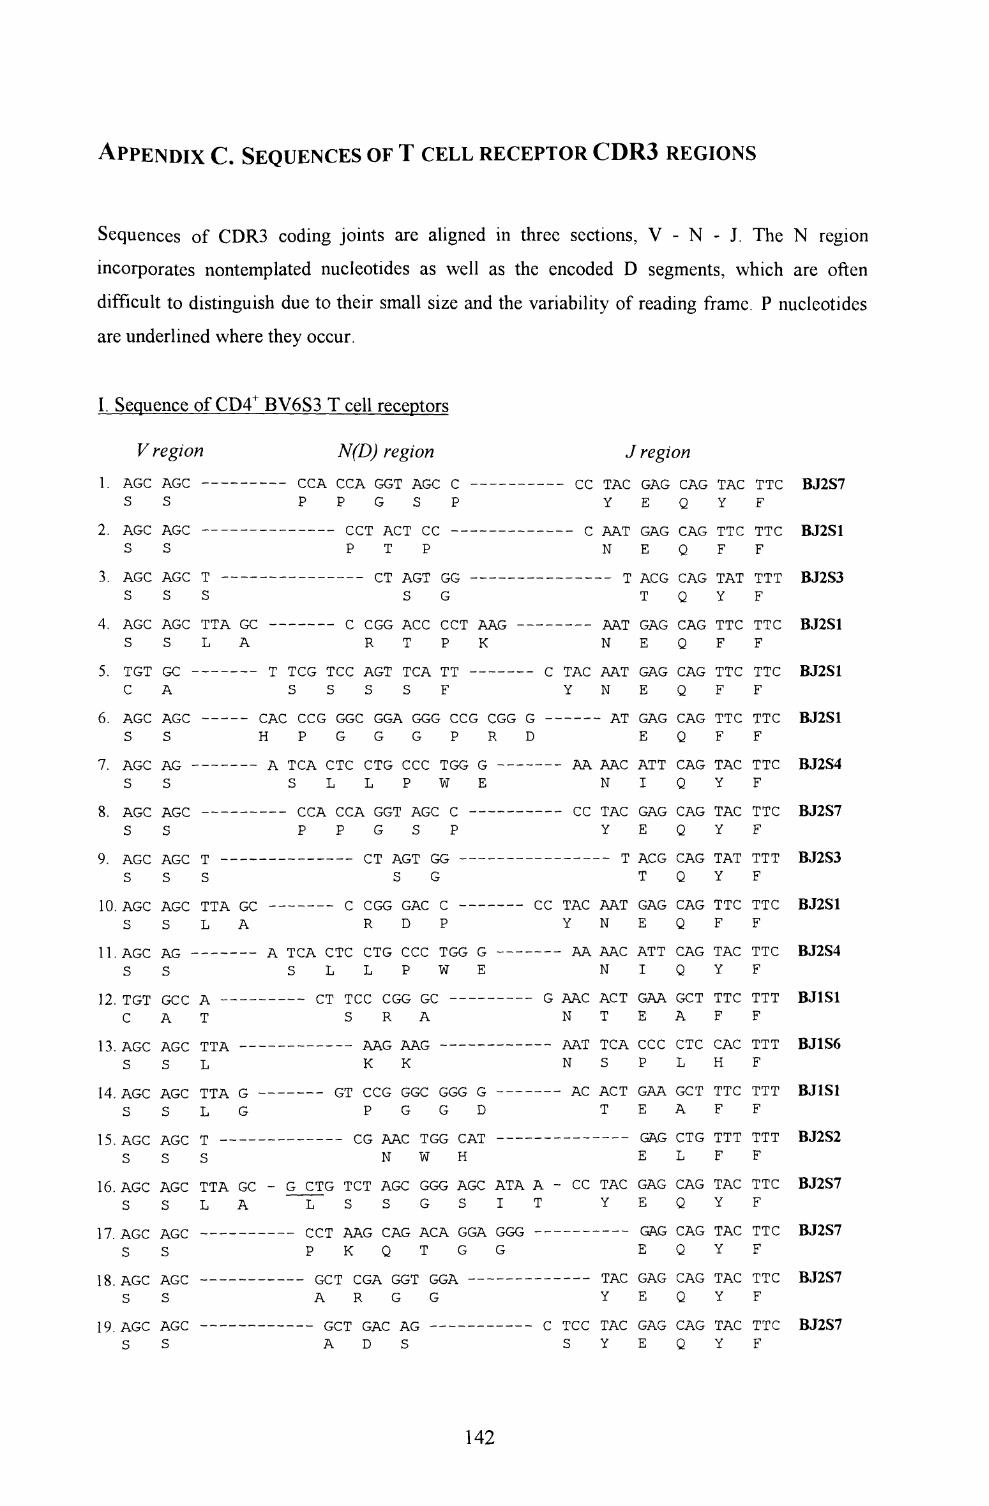
APPENDIX C. SEQUENCES OF T CELL RECEPTOR CDR3 REGIONS
Sequences of CDR3 coding joints are aligned in three sections, V - N - J. The N region
incorporates nontemplated nucleotides as well as the encoded D segments, which are often
difficult to distinguish due to their small size and the variability of reading frame. P nucleotides
are underlined where they occur.
I. Sequence of CD4+ BV6S3 T cell receptors
V region N(D) region J region1. AGC AGC ——— ——— - CCA CCA GGT AGC C
S S P P G S P
2. AGC AGC ——————— ——— — CCT ACT CC ———————-- S S P T P
3. AGC AGC T ——— ——— —————— CT AGT GG ——— —— -
S S S S G
4. AGC AGC TTA GC ————— C CGG ACC CCT AAG —- SSLA RTPK
5. TGT GC —————— T TCG TCC AGT TCA TT —————- C A S S S S F
6. AGC AGC ———— CAC CCG GGC GGA GGG CCG CGG G SS HPGGGPRD
7. AGC AG ————— A TCA CTC CTG CCC TGG G ----- SS SLLPWE
8. AGC AGC ———————— CCA CCA GGT AGC C ————— —
S S P P G S P
9. AGC AGC T — ————— ————— CT AGT GG —————— —
S S S S G
CC TAG GAG CAG TAC Y E Q Y
- C AAT GAG CAG TTC N E Q F
C TAC Y
AA
CC
— T ACG CAG TAT T Q Y
AAT GAG CAG TTC N E Q F
AAT GAG CAG TTC N E Q F
- AT GAG CAG TTC E Q F
AAC ATT CAG TAC N I Q Y
TAC GAG CAG TAC Y E Q Y
10. AGC AGC TTA GC SSLA
C CGG GAC C R D P
CC TAC Y
11. AGC AG - ——— — A TCA CTC CTG CCC TGG G SS SLLPWE
AA
12. TGT GCC A ———————— CT TCC CGG GC CAT S R A
G AAC N
13. AGC AGC TTA — SSL
14. AGC AGC TTA G S S L G
AAG AAG K K
AAT N
GT CCG GGC GGG G —————— AC P G G D
-- T ACG CAG TAT T Q Y
AAT GAG CAG TTC N E Q F
AAC ATT CAG TAC N I Q Y
ACT GAA GCT TTC T E A F
TCA CCC CTC CAC S P L H
ACT GAA GCT TTC T E A F
15. AGC AGC T S S S
CG AAC TGG CAT N W H
16. AGC AGC TTA GC - G CTG TCT AGC GGG AGC ATA A - CC SSLA LSSGSIT
——- GAG CTG TTT ELF
TAC GAG CAG TAC Y E Q Y
17. AGC AGC ————————— CCT AAG CAG ACA GGA GGGK Q
18. AGC AGC S S
19. AGC AGC S S
GCT CGA GGT GGA A R G G
GCT GAC AG ADS
C TCC S
-—— GAG CAG TACE Q Y
TAC GAG CAG TACY E Q Y
TAC GAG CAG TACY E Q Y
TTCF
TTCF
TTTF
TTCF
TTCF
TTCF
TTCF
TTCF
TTTF
TTCF
TTCF
TTTF
TTTF
TTTF
TTTF
TTCF
TTCF
TTCF
TTCF
BJ2S7
BJ2S1
BJ2S3
BJ2S1
BJ2S1
BJ2S1
BJ2S4
BJ2S7
BJ2S3
BJ2S1
BJ2S4
BJ1S1
BJ1S6
BJ1S1
BJ2S2
BJ2S7
BJ2S7
BJ2S7
BJ2S7
142
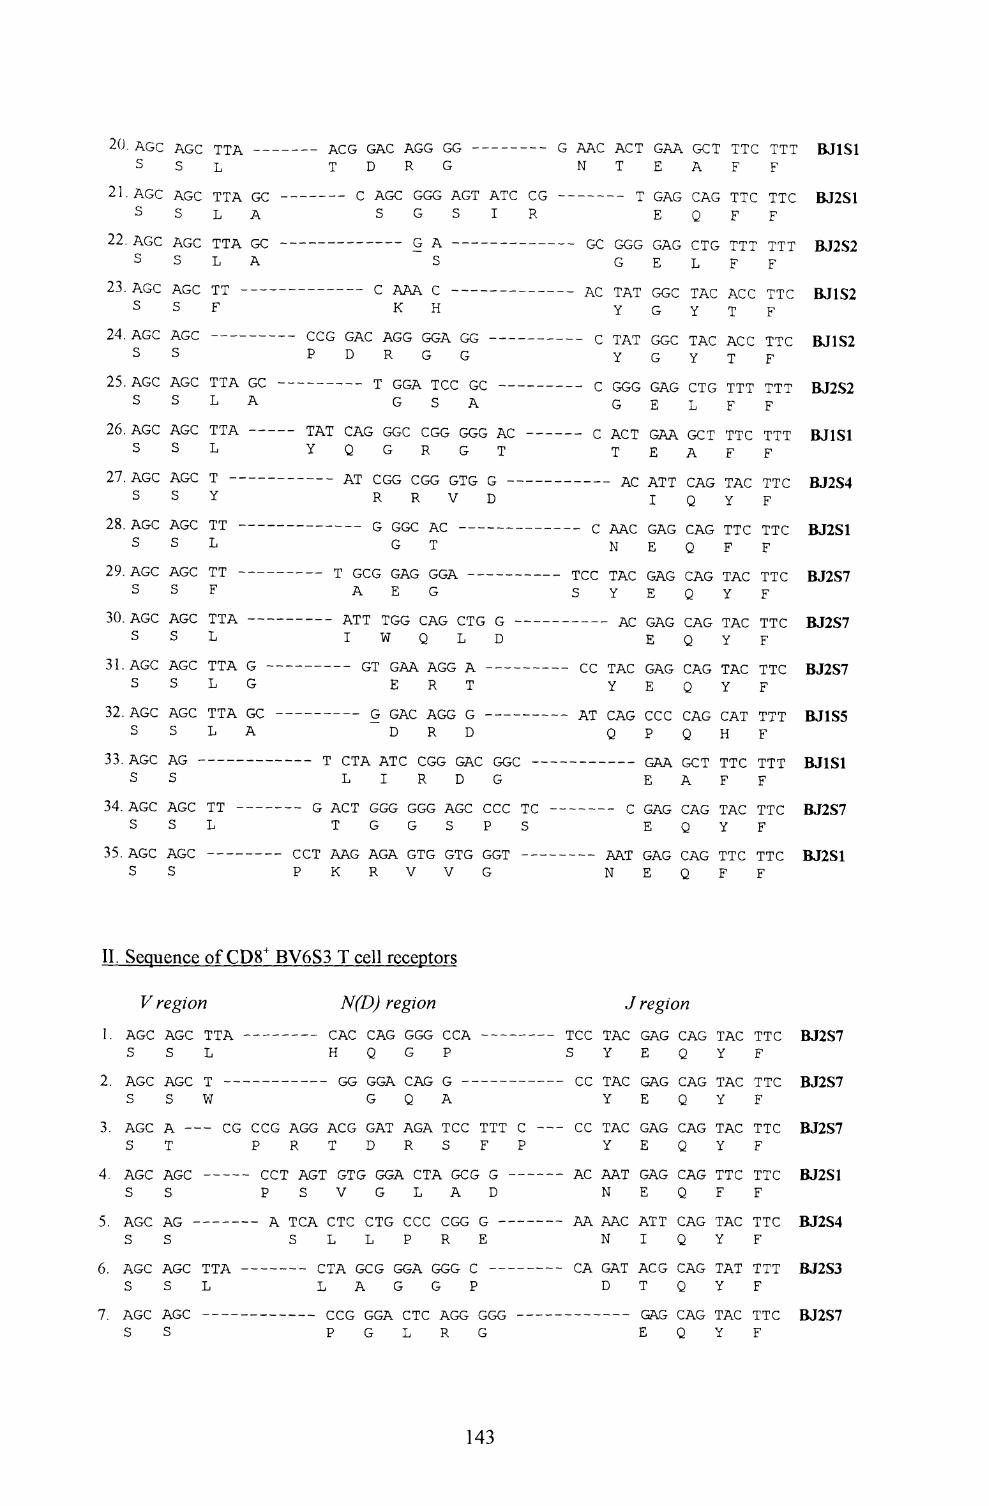
21.
22.
23.
24.
25.
26.
27.
28.
29.
30.
31.
32.
33.
34.
35.
/-VijU
S
AGCS
AGCS
AGCS
AGCS
AGCS
AGCS
AGCS
AGCS
AGCS
AGCS
AGCS
AGCS
AGCS
AGCS
AGCS
AGCS
AGCS
AGCS
AGCS
AGCS
AGCS
AGCS
AGCS
AGCS
AGCS
AGCS
AGCS
AGCS
AG -S
AGCS
AGCS
TTA — -L
TTA GC •L A
TTA GC -L A
TT ——— -F
TTA GC -L A
TTAJ. -L.r\
L
T ———— -Ymrp 1 1 — — — — -
L
TT ——— -F
TTAX I.M.
L
TTA CL Lf\ vj
L G
TTA GC -L A
TT - — —L
---- ACLr LrAL. J\^^J ^J^ U ^rt.UT D R G N
C 7\ /—i*-1 f^f^T* 7\ r^T1 7\ T^f* f"~" f"~*AGC GGG AG1 A1C CG —————S G S I R
(Z T\ /-/•"
S
P AAA P ftp
K H/"** f~* f~* /""* 7\ /~* 7\ /"* /""* /"*/""• 7\ /"*/"• *— *CCG GAC AGG GGA GG ---------- cP D R G G
T f~* f~* 7\ T1 f~* f~* /*""• /""* f~*GGA ICC GC --------- CG S A
rn7\TI C* 7\ f~" f r" r* r* f~* f~* r~T"r* T\O r*1A1 CAG GGC CGG GGG AC —————— QY Q G R G T
Al CGG CGG GIG G ———————————
R R V D
- ——————— G GGC AC ————— ———— — CG T
- ——— T GCG GAG GGA —— ——— --- TCCAEG S
TV rp ryi T1 /""" f~* (~* 7\ /""* (~* TI f-> *— •Al 1 1 GG CAG C1G G —————_—-I W Q L D
/^*Tl /"• 7\ 'A "A /"•/"« T\ s~* s-*GI GAA AGG A -__ QQE R T
G f~* T\ f~* 7\f~*f~' f~* 7\ T1QjAC ACoCa (j AlD R D
T /Tp T\ Tvrp/^ (~* C* r* /"•'A/"* r~* r~" r*C1A A1C CGG GAC GGCL I R D G
G "A (^ T1 f~* f~* f~* f~* f~* f~* 7\ /"•/"" t~* f~* f~* TI (~*AC1 GGG GGG AGC CCC TC ------T G G S P S
• CCT AAG AGA GTG GTG GGTP K R V V G
J-V^ 1
T
-- T
GGGG
TATY
TATY
GGGG
ACTT
- AC
AACN
TACY
- AC
TACY
CAGQ
AATN
ij^-HE
GAGE
GAGE
GGCG
GGCG
GAGE
GAAE
ATTI
GAGE
GAGE
GAGE
GAGE
CCCP
GAAE
GAGE
GAGE
. <0\- 1
A
CAGQ
CTGL
TACY
TACY
CTGL
GCTA
CAGQ
CAGQ
CAGQ
CAGQ
CAGQ
CAGQ
GCTA
CAGQ
CAGQ
i j. >- 111F
TTCF
TTTF
ACCT
ACCT
TTTF
TTCF
TACY
TTCF
TACY
TACY
TACY
CATH
TTCF
TACY
TTCF
F
TTCF
TTTF
TTCF
TTCF
TTTF
TTTF
TTCF
TTCF
TTCF
TTCF
TTCF
TTTF
TTTF
TTCF
TTCF
DU131
BJ2S1
BJ2S2
BJ1S2
BJ1S2
BJ2S2
BJ1S1
BJ2S4
BJ2S1
BJ2S7
BJ2S7
BJ2S7
BJ1S5
BJ1S1
BJ2S7
BJ2S1
II. Sequence of CD8+ BV6S3 T cell receptors
F region region1. AGC AGC TTA SSL
2. AGC AGC T — S S W
CAC CAGH Q G P
- GG GGA CAG G G Q A
J regionTAC GAG CAG
3 Y E Q Y
CC TAC GAG CAG Y E Q Y
TTC F
3. AGC A —— CG CCG AGG ACG GAT AGA TCC TTT C —— CC TAC GAG CAG TAC TTCR D R
4. AGC AGC ——— CCT AGT GTG GGA CTA SS PSVGLA
5. AGC AG —————— A TCA S S S L
D
R
6. AGC AGC TTA SSL
CTA GCG GGA GGG C L A G G P
AGC AGC S S
CCG P G
CTCL R
Q
AC AAT GAG CAG TTC TTC N E Q F F
AA AAC ATT CAG TAC TTC N I Q Y F
CA GAT ACG CAG TAT 11 j. D T Q Y F
GAG CAG TAC TTC E Q Y F
BJ2S7
BJ2S7
BJ2S7
BJ2S4
BJ2S7
143
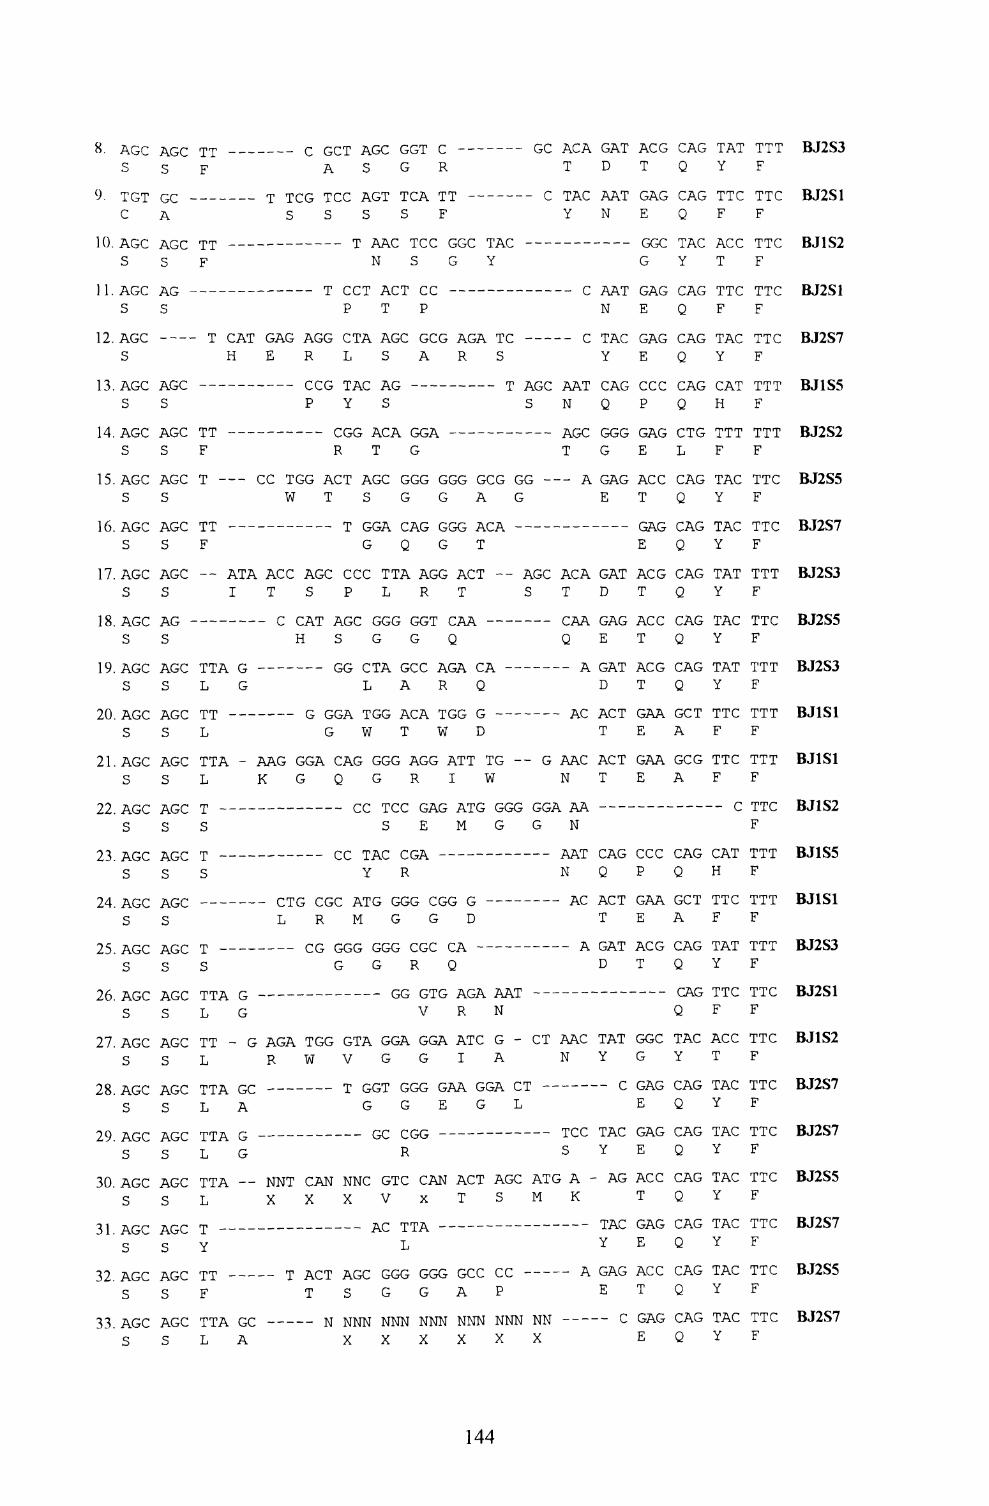
8. AGC AGC TT - —
S S F
Q T r* T1 r~ r*J • Hjl GC ------- C A
10 APP Apr* T>Tivy. /\Vj^ /\LrL 11 — — —
S S F
11. AGC AG - -----S S
12. AGC — — T CAT S H
13. AGC AGC ——— —S S
M 7\ /" C* T^C^C* rprp. AGC AGC 11 --- S S F
15. AGC AGC T —— S S
1 f\ ~I\CT* AfT1 TT1
C /~* /""• rp 7\ /" /"• /" T1 f PP 7\r^7\
A S G R T
T TTT' TPP 2\r*T TPA TT P TAP
S S S S F Y
J. rYrv— 1 ^ VJ^T^ 1 .H\^
N S G Y
i ^ <— i y-io -L o ^ FTP
GAG AGG CTA AGC GCG AGA TC —— -- C E R L S A R S
^^ *J -L.rv_ s\\j 1 /\VjU >\M.l
P Y S S N
—————— CGG ACA GGA ——— —————— AGC R T G T
CC TGG ACT AGC GGG GGG GCG GG - — A W T S G G A G
rp /—/^7\ r* 7\ r- r-*r-'f-* -A*-«7\1 U . /AXjU KJ\- Li. L UU.O. ^.rtU Ij-ljVj t\^t\
S S F G Q G T
17. AGC AGC -- ATA ACC AGC CCC TTA AGG ACT -- AGC ACA SS ITSPLRT ST
IS APP AP f~* /"* TV rp TV rT* rr* r* r*r*rn <-*-r\ -r\ /~*-n T\1 CJ . 2 \\-3 \*f £ \\J
S S
19. AGC AGC TTA G S S L G
90 Ar;r AGP TTi*\j . f\\j\^ f\.\j\^ j. i. SSL
21. AGC AGC TTA - SSL
7? AGC AGP T4*4* . f^.\J\^ fVJ\*> J_
S S S
/j. ACjU ACjL 1 S S S
24 AGP AGC^- "t. -rVVjV*^ 2-\\J\^
S S
^--/. /"V-JTx^ ^-V^Jw J-
S S S
26. AGC AGC TTA G S S L G
27. AGC AGC TT - G SSL
28. AGC AGC TTA GC S S L A
29. AGC AGC TTA G S S L G
30. AGC AGC TTA — SSL
31. AGC AGC T — — S S Y
32. AGC AGC TT —— S S F
33. AGC AGC TTA GC S S L A
>- >^^-V.X ^-IU<- mjU OVTi l-^U-i. O/V-i.
H S G G Q Q GG TTA Grr Ar;A TA A\J\J \s- X^i. \J\*-\^ f\\Jf\. W^V ^V
L A R Q
G f~t f~'~T\ rp/"/™1 7\ ^" 7\ TI/-'X-< /-• 7\ /"*
G W T W D
AAG GGA CAG GGG AGG ATT TG — G AAC KGQGRIW N
/~* /** rp/^*/™* f~* 7\ S~* 7\ T1/~* f~* /~* /~* f~* S~* T\ 7\ 71--------- CC ICC GAG ATG GGG GGA AA S E M G G N
\^\^ J..TTA-* V^vj-rt. /AM.X
Y R N
/-rp/-» rT*r* TVrpP PPP PPP P 7\ PL 1 Cj LLaL Al Cj UijCj ULrb- (j A^
L R M G G D
r* r* err* r^rr1 rt r~rt r*7\ 7\
G G R Q
PP PTP 7\P& AAT— — — Lro- (j 1 Vj /\lj/V /\/\l
V R N
AGA TGG GTA GGA GGA ATC G - CT AAC RWVGGIA N
GG1 GGG GAA. ijio-A Ul G G E G L
r*r* r* r* r* TPP
R S
NNT CAN NNC GTC CAN ACT AGC ATG A - XXXVxTSMK
.rv^ 1 1 r\
L
-- T ACT AGC GGG GGG GCC CC ———— A T S G G A P
———— N NNN NNN NNN NNN NNN NN ---- X X X X X X
GAT ACG CAG TAT TTT BJ2S3D T Q Y F
AAT GAG CAG TTC TTC BJ2S1N E Q F F
GG<_ IAC ALL TIL tSJldZG Y T F
AAT GAG CAG TTC TTC BJ2S1N E Q F F
TAC GAG CAG TAC TTC BJ2S7Y E Q Y F
CAG CCC CAG CAT TTT BJ1S5Q P Q H F
GGG GAG CTG TTT TTT BJ2S2G E L F F
GAG ACC CAG TAC TTC BJ2S5E T Q Y F
CoACj LAO 1 AL 1 1 L I>Jxi3 /E Q Y F
GAT ACG CAG TAT TTT BJ2S3D T Q Y F
GAG ACC CAG TAC TTC BJ2S5E T Q Y F
GAT ACG CAG TAT TTT BJ2S3D T Q Y F
ACT GAA GCT TTC TTT BJ1S1T E A F F
ACT GAA GCG TTC TTT BJ1S1T E A F F
/-* rPTT1 R T1 Q9U i 1 L, Del 1 OZ
F
CAG CCC CAG CAT TTT BJ1S5Q P Q H F
ACT GAA GCT TTC TTT BJ1S1T E A F F
GAT ACG CAG TAT TTT BJ2S3D T Q Y F
PAP TTP TTP R T9^1
Q F F
TAT GGC TAC ACC TTC BJ1S2Y G Y T F
P PAP PAP TAP TTP R T9Q17
E Q Y F
TAC GAG CAG TAC TTC BJ2S7Y E Q Y F
AG ACC CAG TAC TTC BJ2S5T Q Y F
TAC GAG CAG TAC TTC BJ2S7Y E Q Y F
GAG ACC CAG TAC TTC BJ2S5E T Q Y F
- C GAG CAG TAC TTC BJ2S7E Q Y F
144
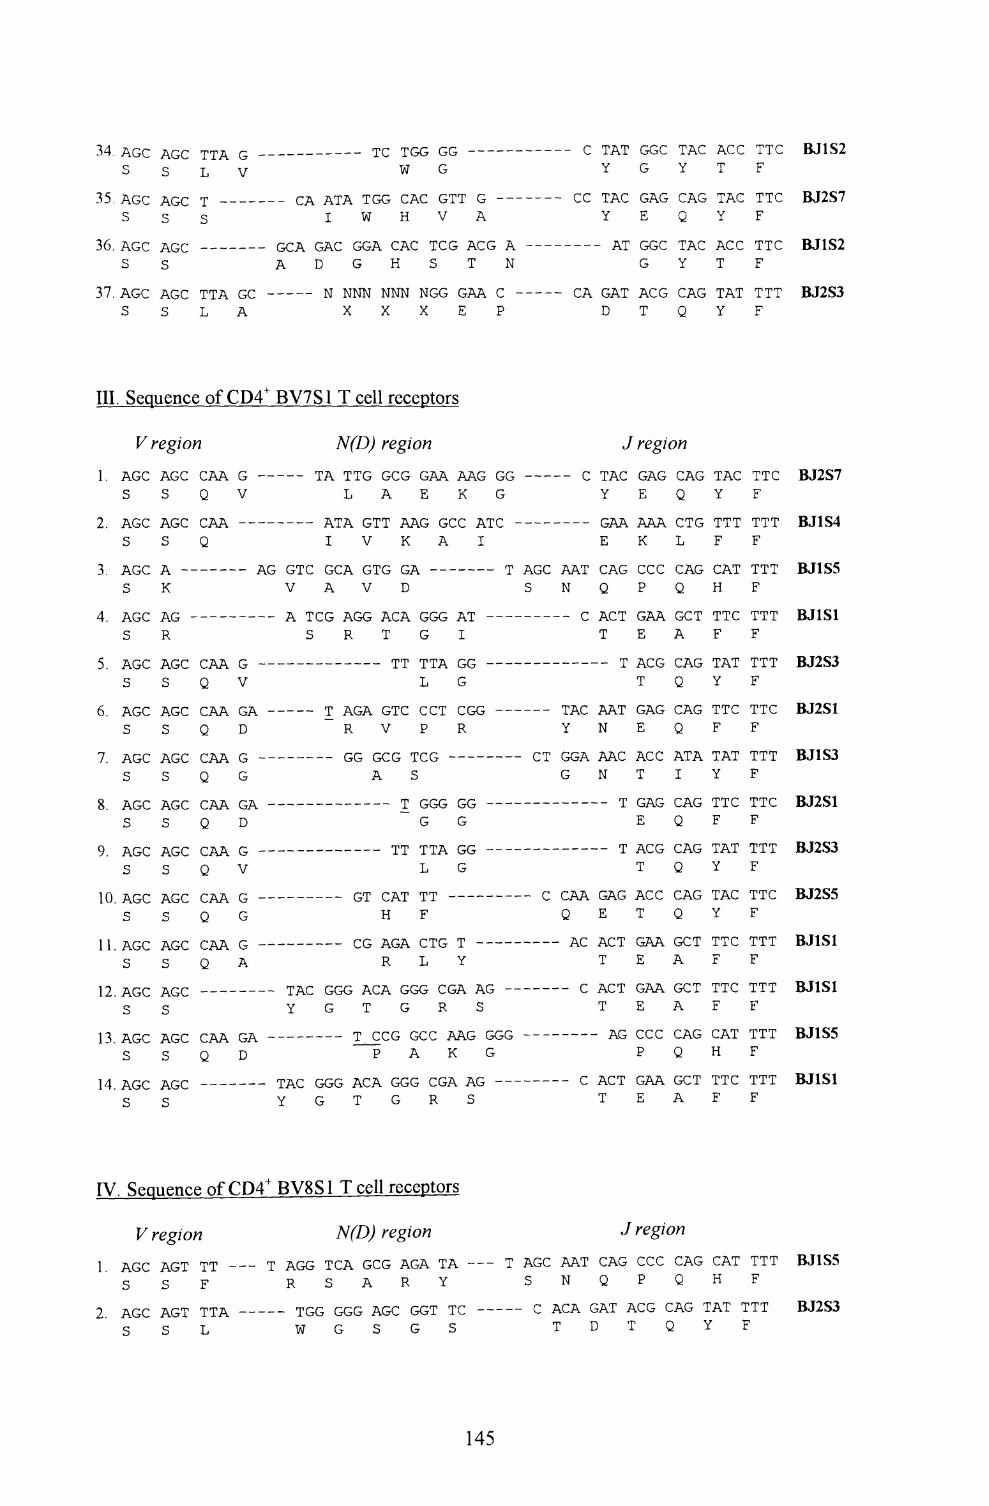
-s-r. -nu-c A^c TTA G --
s S L V
35. AGC AGC T
s s s36. AGC AGC
s s~s ' . * iv_J\_, ^"VVJV^, J. J, .tt. VJV- .
S S L A
III. Sequence of CD4+
V region1. AGC AGC CAA G --
S S Q V
---------- J. („ 1 IjO l>jUr
W G
/*•* TV TV T1 A T m/™ C* 7\C* C* TT r~*
I W H V A
GCA GAC GGA CAC TCG ACG A A D G H S T N
N NNN NNN NGG GAA r -J.H AilAYJ.il A 1 J. 1 A •« AH V_l \_( VJZ M i. \~r
X X X E P
BV7S1 T cell receptors
N(D) region- —— TA TTG GCG GAA AAG GG
L A E K G
2. AGC AGC CAA t\j.*\ 00. x s\tv& io\,^ AIL. - SSQ IVKAI
3. AGC A —————— AG GTC GCA GTG GA —————— T
S K V A V D
4 TACT* TAf TV Tirr- TV r*/" TV r1 T\ r-/-*/— -nm.ttAj^ .ttAJ
S R
-^ . -rVJ^ /T.VJV_, V^^Vrt. O
S S Q V
.ttAJV-* xT\J\^ x^^Vtt. OxA.
S S Q D
S S Q G
8. AGC AGC CAA GA -S S Q D
.ttXTw -/"iVjVrf \^.ttJ-V ^J
S S Q V
10. AGC AGC CAA G --
S S Q G
S S Q A
S S 11 AGP Ar;r TAA GA1 ~j . -rt\jv^ .r^vj^ ^.r^rv vj^x
S S Q D
14. AGC AGC — — —— S S
r-v -L v^vj .ttAova ^-v^^-i IO-VJTVJ ^-11
S R T G I
X A X -L./T. VJVJ
L G
T 7\ /^ 7\ f~" rPf* r^/^T1 C* f~" f~*
R V P Rf~* f~* CT^C* TTif**
A S
T /""* f~* f~" f~* /"•GGG GG G G
mm mrpTV r^r^
L G
VjJ. Vw-iT.J. J. J.
H F
L-o- A.o-/\ U Itj 1
R L Y
TAC GGG ACA GGG CGA AG — Y G T G R S
T /*"1 c1 r" rr^r* ATXf' (~u~l f~t
P A K G
rp7\/-i f~*f~*f~* A f~* 7\ (^C'C* (~* C" 7\ 7\ P*
Y G T G R S
U X/\l Vj^J^ XVA^_ M.UU 11^ £KJiOw
Y G Y T F
PT^ T7\P* P*7\P" f T\ (^ T7\P* T'T'P' 12 TOf
Y E Q Y F7\rp r-i f^ (-* rpTi,-^ ~T* C* f~< rprp/~i Q T 1 f*AI GGL 1AL ALL TTC DJld^
G Y T F
LA GA1 ALG LAG 1A1 111 DJZlSjD T Q Y F
J region----- C TAC GAG CAG TAC TTC BJ2S7
Y E Q Y F
- ——— —— GAA AAA CTG TTT TTT BJ1S4E K L F F
AGC AAT CAG CCC CAG CAT TTT BJ1S5S N Q P Q H F
.MX- 1 \jf\r\ ov-. 1 1 J. L, _L J_ X 1XJ i. d i.
T E A F F
ALG LAG 1A1 11 T DJZbJT Q Y F
Y N E Q F F
CT GGA AAC ACC ATA TAT TTT BJ1S3G N T I Y F
T GAG CAG TTC TTC BJ2S1E Q F F
-L .tt.Wvj ^—.ttXJ J.^T.X -L -L -L JJ«J^k7*J
T Q Y F
C /^7\7\ f~*7{ f~" 7\ f C* t~*7\ f~* T'TVP1 T'T1 /^' U T^ C
Q E T Q Y F
-t\\^ ^vv^ x \jt\r\. *jw x x x ^ xxx MJ*J x o l
T E A F F
^ r^\* X O^~WA ww X X X v^ XXX X9«J A tj A
T E A F F7\/-* r* r* r* f7\f~* r'T^'T* T'T'T1 I2T1C^
P Q H F
f 7APT PTATA fZPT TTP TTT HT1 Q1
T E A F F
IV. Sequence of CD4+ BV8S1 T cell receptors
V region N(D) region J region
1. AGC AGT TT - S S F
2. AGC AGT TTA SSL
T AGG TCA GCG AGA TA R S A R Y
TGG GGG AGC GGT TC W G S G S
T AGC AAT CAG CCC CAG CAT TTT S N Q P Q H F
C ACA GAT ACG CAG TAT TTT T D T Q Y F
BJ1S5
BJ2S3
145
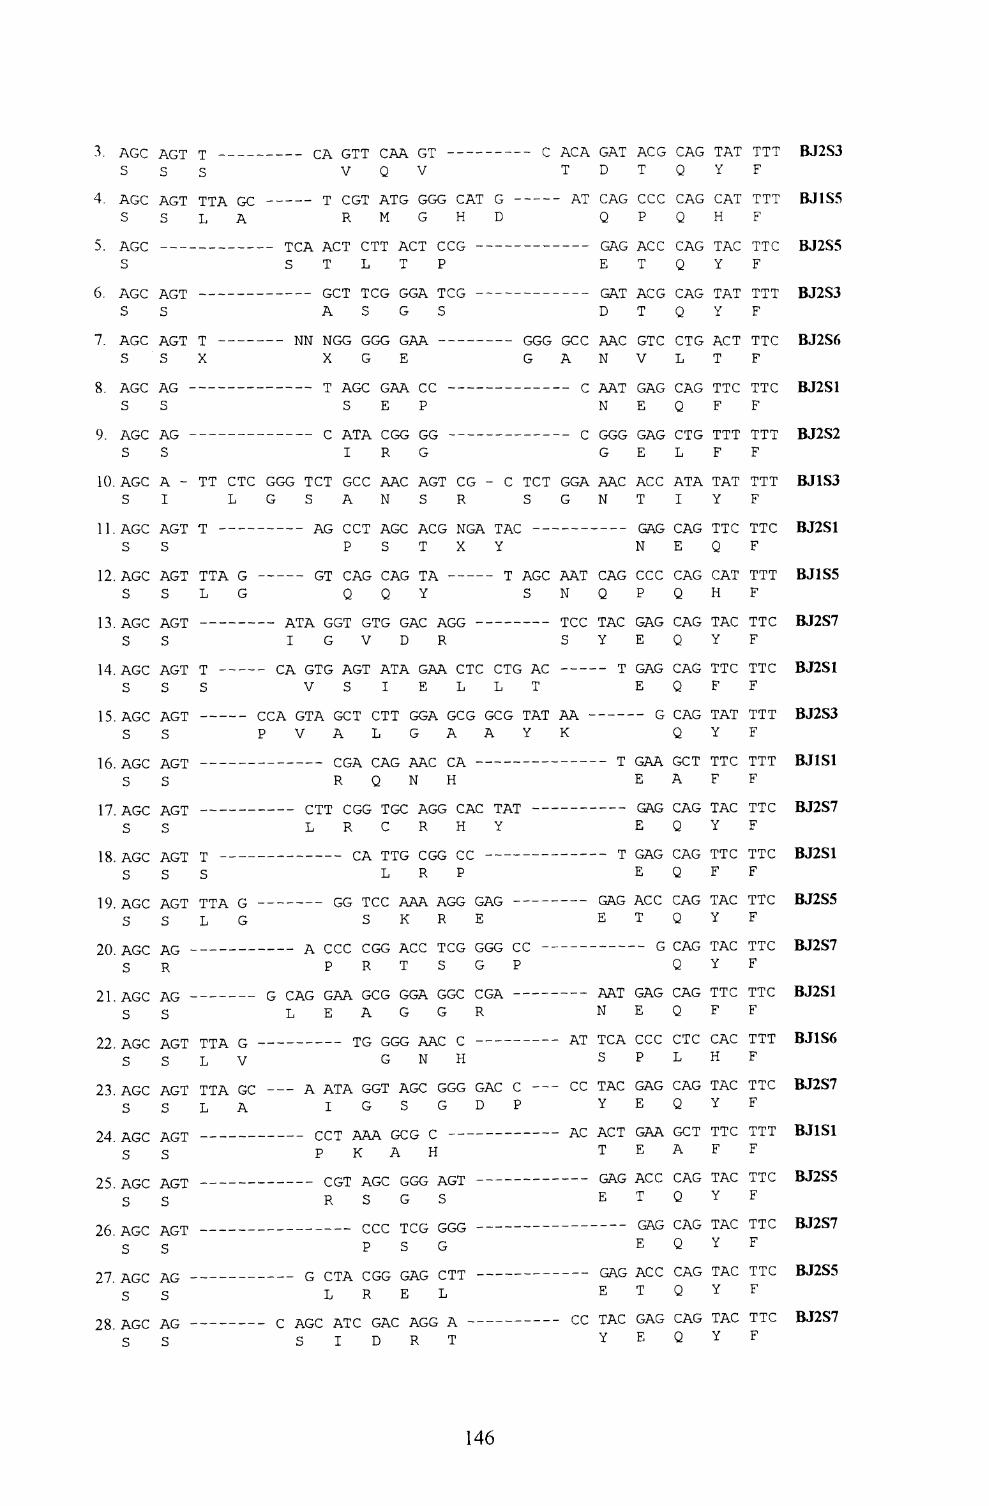
3. AGC AGTS S
4. AGC AGTS S
TTA GC L A
CA GTT CAA GT -----
V Q V
- T CGT ATG GGG CAT R M G H
C ACA GAT ACG CAG TAT TTT T D T Q Y F
G D
AT CAG CCC CAG CAT TTT Q P Q H F
5. AGC ——- S
6. AGC AGT S S
7. AGC AGT S S
8. AGC AG - S S
9. AGC AG - S S
10. AGC A - S I
11. AGC AGT S S
12. AGC AGT S S
13. AGC AGT S S
14. AGC AGT S S
15. AGC AGT S S
16. AGC AGT S S
17. AGC AGT S S
18. AGC AGT S S
19. AGC AGTS S
20. AGC AG - S R
21. AGC AG - S S
22. AGC AGT S S
23. AGC AGT S S
24. AGC AGT S S
25. AGC AGT S S
26. AGC AGT S S
TCA ACT CTT ACT CCG S T L T P
GCT TCG GGA TCG A S G S
T X
NN NGG GGG GAA X G E
- — ----- GAG ACC CAG TAC TTCE T Q Y F
- — ----- GAT ACG CAG TAT TTTD T Q Y F
GGG GCC AAC GTC CTG ACT TTCG A N V L T F
T AGC GAA CC SEP
C ATA CGG GG I R G
C AAT GAG CAG TTC TTC N E Q F F
C GGG GAG CTG TTT TTT G E L F F
TT CTC GGG TCT GCC AAC AGT CG - C TCT GGA AAC ACC ATA TAT TTT LGSANSR SGNTIYF
AG CCT AGC ACG NGA TAC P S T X Y N Q
TTA G ———— GT CAG CAG TA —- L G Q Q Y
——————— ATA GGT GTG GAC AGG I G V D R
T AGC AAT CAG CCC CAG CAT TTT S N Q P Q H F
TCC TAC GAG CAG TAC TTC S Y E Q Y F
T ——— CA GTG AGT ATA GAA CTC CTG AC --- S VSIELLT
———— CCA GTA GCT CTT GGA GCG GCG TAT AA PVALGAAYK
T GAG CAG TTC TTC E Q F F
-— CGA CAG AAC CA —— — - R Q N H
CTT CGG TGC AGG CAC TAT L R C R H Y
-—— G CAG TAT TTT Q Y F
T GAA GCT TTC TTT E A F F
T ——-
S
TTA G L G
-- CA TTG CGG CC —- L R P
GG TCC AAA AGG GAG S K R E
A CCC CGG ACC TCG GGG CC P R T S G P
——— GAG CAG TAC TTC E Q Y F
-- T GAG CAG TTC TTC E Q F F
GAG ACC CAG TAC TTC E T Q Y F
G CAG GAA GCG GGA GGC CGA L E A G G R
TTA G —- L V
TTA GC -- L A
TG GGG AAC C G N H
A ATA GGT AGC GGG GAC C I G S G D P
CCT AAA GCG C —— P K A H
- CGT AGC GGG AGT R S G S
-- — ———— G CAG TAC TTC Q Y F
—— AAT GAG CAG TTC TTC N E Q F F
AT TCA CCC CTC CAC TTT S P L H F
CC TAC GAG CAG TAC TTC Y E Q Y F
AC ACT GAA GCT TTC TTT T E A F F
GAG ACC CAG TAC TTC E T Q Y F
27. AGC AG S S
28. AGC AG S S
-——————— CCC TCG GGG P S G
-— G CTA CGG GAG CTT L R E L
C AGC ATC GAC AGG A - S I D R T
.—____ GAG CAG TAC TTC E Q Y F
--- GAG ACC CAG TAC TTC E T Q Y F
CC TAC GAG CAG TAC TTC Y E Q Y F
BJ2S3
BJ1S5
BJ2S5
BJ2S3
BJ2S6
BJ2S1
BJ2S2
BJ1S3
BJ2S1
BJ1S5
BJ2S7
BJ2S1
BJ2S3
BJ1S1
BJ2S7
BJ2S1
BJ2S5
BJ2S7
BJ2S1
BJ1S6
BJ2S7
BJ1S1
BJ2S5
BJ2S7
BJ2S5
BJ2S7
146
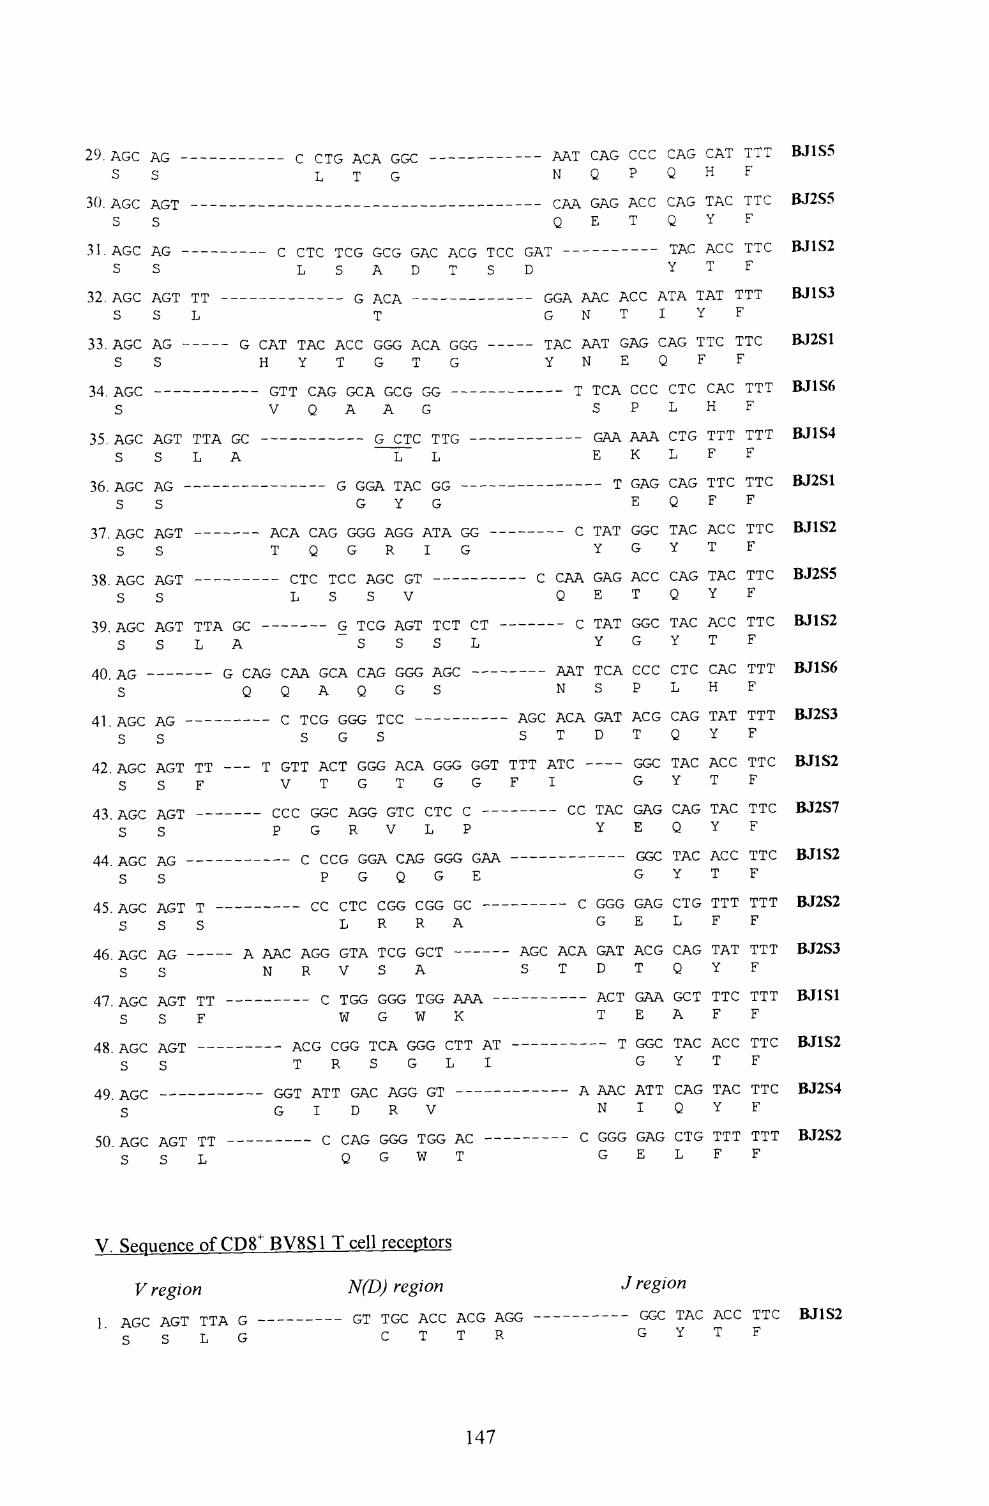
29. AGC AG ————————— c CTG ACA GGC - -------- —— AAT CAG CCC CAG CAT TTT BJ1S5
S S LTG NQPQHF
30. AGC AGT -- ——— ————————————————————————————— CAA GAG ACC CAG TAC TTC BJ2S5
S S QETQYF
31. AGC AG -——————— c CTC TCG GCG GAC ACG TCC GAT -- ——— ——— TAC ACC TTC BJ1S2
ss LSADTSD YTF
32. AGC AGT TT ———————————— G ACA ———————————— GGA AAC ACC ATA TAT TTT BJ1S3
SSL T GNTIYF
33. AGC AG - — — G CAT TAC ACC GGG ACA GGG ---— TAC AAT GAG CAG TTC TTC BJ2S1
SS HYTGTG YNEQFF
34. AGC ————————— GTT CAG GCA GCG GG ------- —— -- T TCA CCC CTC CAC TTT BJ1S6
S VQAAG SPLHF
35. AGC AGT TTA GC - ————— ——— G CTC TTG - ——————— —— GAA AAA CTG TTT TTT BJ1S4
SSLA LL EKLFF
36. AGC AG —————————————— G GGA TAC GG —————————————— T GAG CAG TTC TTC BJ2S1
SS GYG EQFF
37. AGC AGT —————— ACA CAG GGG AGG ATA GG - ————— - C TAT GGC TAC ACC TTC BJ1S2
SS TQGRIG YGYTF
38. AGC AGT ———————— CTC TCC AGC GT ————————— C CAA GAG ACC CAG TAC TTC BJ2S5
SS LSSV QETQYF
39. AGC AGT TTA GC —————— G TCG AGT TCT CT —————— C TAT GGC TAC ACC TTC BJ1S2
SSLA SSSL YGYTF
40. AG —————— G CAG CAA GCA CAG GGG AGC ——————— AAT TCA CCC CTC CAC TTT BJ1S6
S QQAQGS NSPLHF
41. AGC AG ———————— C TCG GGG TCC ————————— AGC ACA GAT ACG CAG TAT TTT BJ2S3
SS SGS STDTQYF
42. AGC AGT TT —— T GTT ACT GGG ACA GGG GGT TTT ATC ——— GGC TAC ACC TTC BJ1S2
SSF VTGTGGFI GYTF
43. AGC AGT —————— CCC GGC AGG GTC CTC C ——————— CC TAC GAG CAG TAC TTC BJ2S7
SS PGRVLP YEQYF
44. AGC AG —————————— C CCG GGA CAG GGG GAA ——————————— GGC TAC ACC TTC BJ1S2
SS PGQGE GYTF
45. AGC AGT T ———————— CC CTC CGG CGG GC ———————— C GGG GAG CTG TTT TTT BJ2S2
SSS LRRA GELFF
46. AGC AG ———— A AAC AGG GTA TCG GCT ————— AGC ACA GAT ACG CAG TAT TTT BJ2S3
SS NRVSA STDTQYF
47. AGC AGT TT ———————— C TGG GGG TGG AAA ————————— ACT GAA GCT TTC TTT BJ1S1
SSF WGWK TEAFF
48. AGC AGT ———————— ACG CGG TCA GGG CTT AT ————————— T GGC TAC ACC TTC BJ1S2
SS TRSGLI GYTF
49. AGC —————————— GGT ATT GAC AGG GT ——————————— A AAC ATT CAG TAC TTC BJ2S4
S GIDRV NIQYF
50. AGC AGT TT ———————— C CAG GGG TGG AC ———————— C GGG GAG CTG TTT TTT BJ2S2
SSL QGWT GELFF
V. Sequence of CD8+ BV8S1 T cell receptors
V region N(D) region J region
\. AGC AGT TTA G ——————— GT TGC ACC ACG AGG ———————— GGC TAC ACC TTC BJ1S2
SSLG CTTR GYTF
147
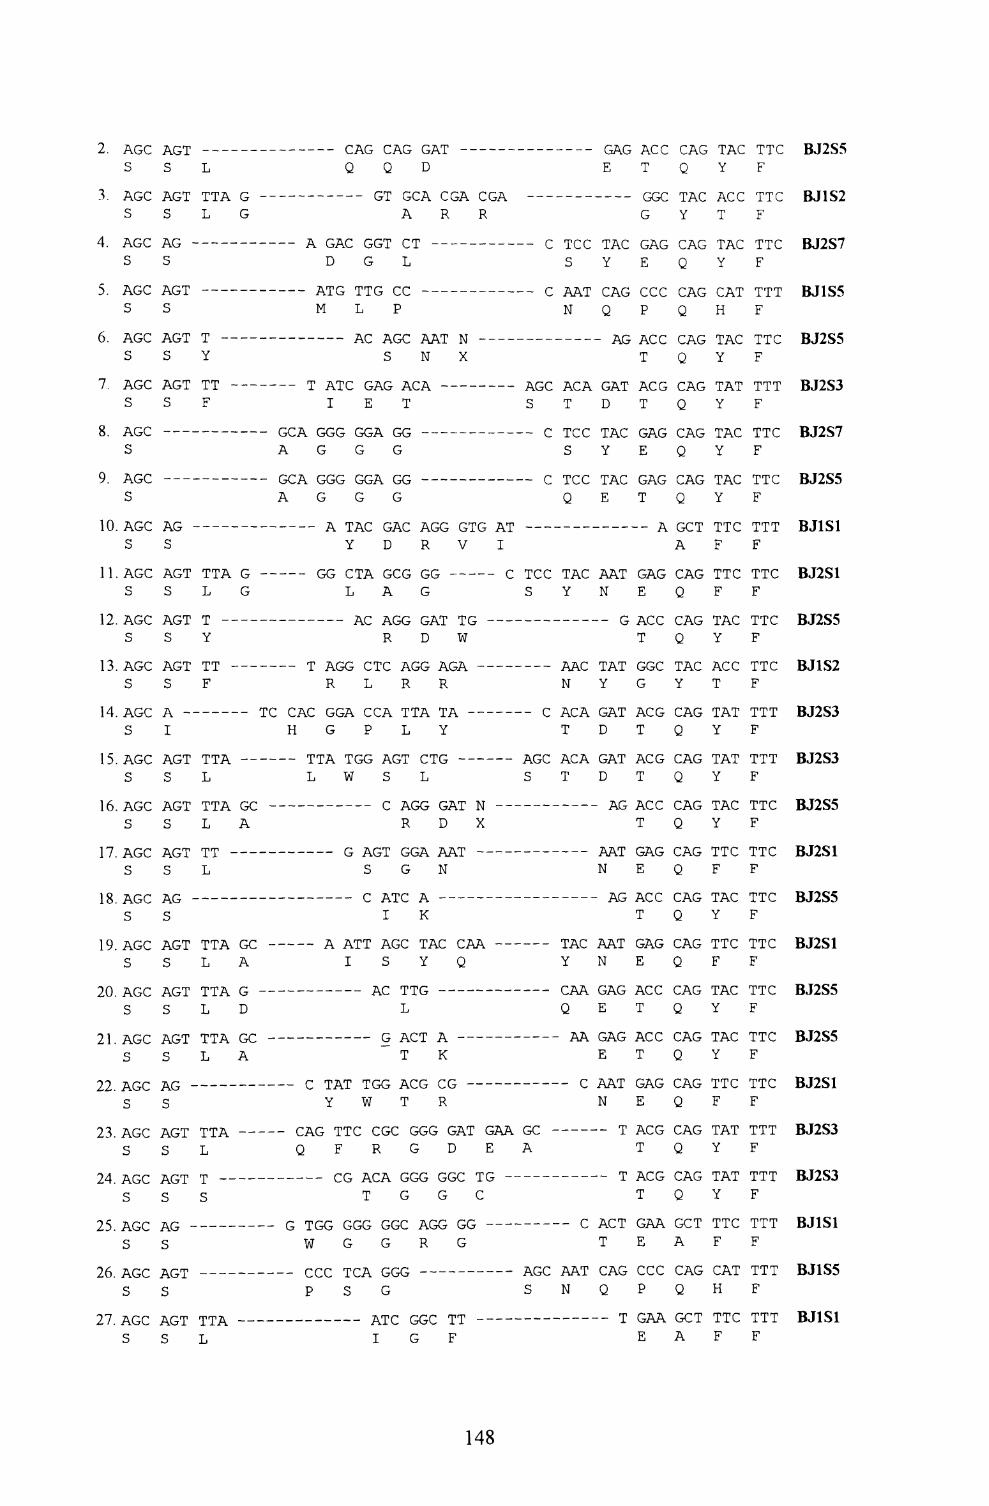
2. AGC AGT S S
3. AGC AGT S S
4. AGC AG - S S
5. AGC AGT S S
6. AGC AGT S S
7. AGC AGT S S
8. AGC ——- S
9. AGC ——- S
10. AGC AG - S S
11. AGC AGT S S
12. AGC AGT S S
13. AGC AGT S S
14. AGC A -- S I
15. AGC AGT S S
16. AGC AGT S S
17. AGC AGT S S
18. AGC AG - S S
19. AGC AGT S S
20. AGC AGT S S
21. AGC AGT S S
22. AGC AG - S S
23. AGC AGT S S
24. AGC AGT S S
25. AGC AG - S S
26. AGC AGT S S
27. AGC AGT S S
CAG CAG GAT Q Q D T Q Y
TTA G L G
GT GCA CGA CGA A R R
A GAC GGT CT D G L
- ATG TTG CC - M L P
---------- GGC TAC ACC TTC
G Y T F
C TCC TAC GAG CAG TAC TTC S Y E Q Y F
C AAT CAG CCC CAG CAT TTT N Q P Q H F
T - Y
TT F
AC AGC AAT N S N X
T ATC GAG ACA I E T
- —— —— — AG ACC CAG TAC TTCT Q Y F
AGC ACA GAT ACG CAG TAT TTTS T D T Q Y F
GCA GGG GGA GG A G G G
GCA GGG GGA GG A G G G
C TCC TAC GAG CAG TAC TTC S Y E Q Y F
C TCC TAC GAG CAG TAC TTC Q E T Q Y F
A TAC GAC AGG GTG AT Y D R V I
A GCT TTC TTT A F F
TTA G L G
GG CTA GCG GG LAG
C TCC TAC AAT GAG CAG TTC TTC S Y N E Q F F
T ———- Y
TT ——- F
-——— AC AGG GAT TG R D W
T AGG CTC AGG AGA - R L R R
TC CAC GGA CCA TTA TA H G P L Y
TTA —- L
TTA GC L A
TTA TGG AGT CTG L W S L
- ———— --— G ACC CAG TAC TTC T Q Y F
---- AAC TAT GGC TAC ACC TTC N Y G Y T F
-- C ACA GAT ACG CAG TAT TTT T D T Q Y F
AGC ACA GAT ACG CAG TAT TTT S T D T Q Y F
C AGG GAT N R D X
TT L
G AGT GGA AAT S G N
TTA GC L A
TTA G -
L D
TTA GC L A
——— C ATC A - ——— - I K
A ATT AGC TAC CAA I S Y Q
AC TTG -- L
- G ACT A T K
- —— - AG ACC CAG TAC TTC T Q Y F
-—— AAT GAG CAG TTC TTC N E Q F F
-——— AG ACC CAG TAC TTC T Q Y F
TAC AAT GAG CAG TTC TTC Y N E Q F F
CAA GAG ACC CAG TAC TTC Q E T Q Y F
- AA GAG ACC CAG TAC TTC E T Q Y F
TTA L
- C TAT TGG ACG CG ———————- Y W T R
CAG TTC CGC GGG GAT GAA GC Q F R G D E A
C AAT GAG CAG TTC TTC N E Q F F
CG ACA GGG GGC TG T G G C
G TGG GGG GGC AGG GG W G G R G
CCC TCA GGG P S G
——— T ACG CAG TAT TTT T Q Y F
-———————— T ACG CAG TAT TTT T Q Y F
-——— C ACT GAA GCT TTC TTT T E A F F
AGC AAT CAG CCC CAG CAT TTT S N Q P Q H F
TTA L
ATC GGC TT IGF
T GAA GCT TTC TTT E A F F
BJ2S5
BJ1S2
BJ2S7
BJ1S5
BJ2S5
BJ2S3
BJ2S7
BJ2S5
BJ1S1
BJ2S1
BJ2S5
BJ1S2
BJ2S3
BJ2S3
BJ2S5
BJ2S1
BJ2S5
BJ2S1
BJ2S5
BJ2S5
BJ2S1
BJ2S3
BJ2S3
BJ1S1
BJ1S5
BJ1S1
148
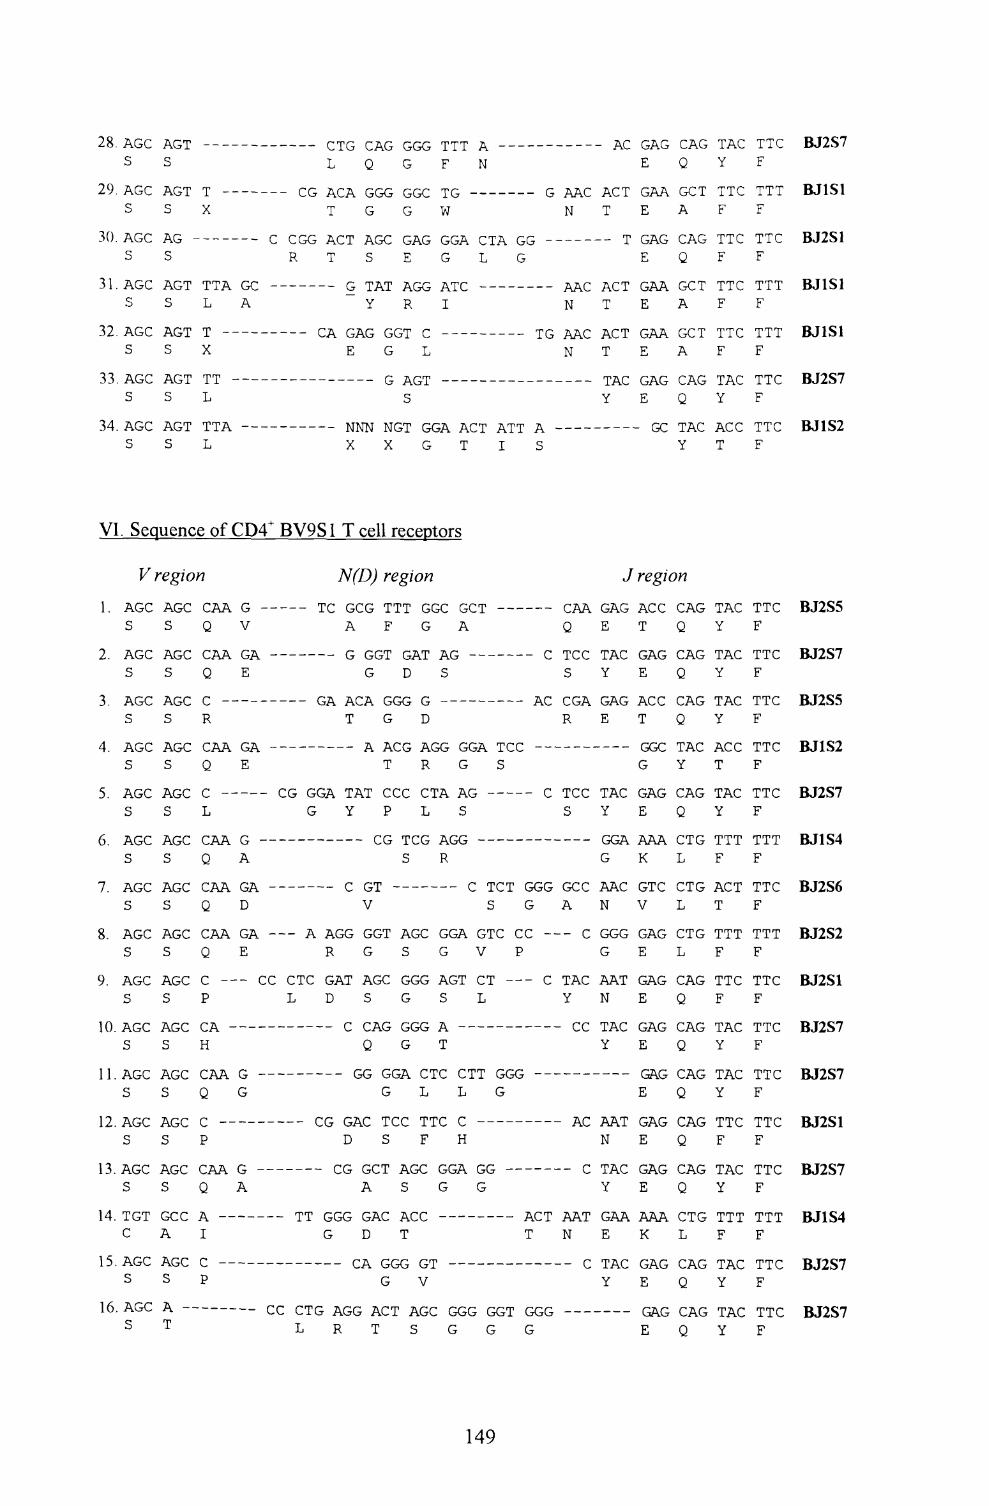
AC GAG CAG TAC TTC E Q Y F
28. AGC AGT --————————— CTG CAG GGG TTT A —————----S S L Q G F N
29. AGC AGT T ----—— CG ACA GGG GGC TG —————— G AAC ACT GAA GCT TTC TTT SSX TGGW NTEAFF
30. AGC AG --- — — S S
31. AGC AGT TTA GC S S L A
32. AGC AGT T ———- SSX
C CGG ACT AGC GAG GGA CTA GGR T S E G L G
G TAT AGG ATC Y R I
CA GAG GGT C E G L
----- T GAG CAG TTC TTC E Q F F
--- AAC ACT GAA GCT TTC TTT NTEAFF
TG AAC ACT GAA GCT TTC TTT NTEAFF
33. AGC AGT TT - SSL
34. AGC AGT TTA SSL
-—— G AGT ——---------S
NNN NGT GGA ACT ATT A X X G T I S
TAC GAG CAG TAC TTC Y E Q Y F
BJ2S7
BJ1S1
BJ2S1
BJ1S1
BJ1S1
BJ2S7
BJ1S2Y
VI. Sequence of CD4+ BV9S1 T cell receptors
V region N(D) region J region1. AGC AGC CAA G -
S S Q V
2. AGC AGC CAA GA S S Q E
TC GCG TTT GGC GCT A F G A
G GGT GAT AG G D S
3. AGC AGC C --S S R
4. AGC AGC CAAS S Q
GA ACA GGG G T G D
AC
CAA GAG ACC CAG TAC TTC Q E T Q Y F
TCC TAC GAG CAG TAC TTC S Y E Q Y F
CGA GAG ACC CAG TAC TTC R E T Q Y F
GA E
A ACG AGG GGA TCC T R G S
5. AGC AGC C -- SSL
6. AGC AGC CAA S S Q
7. AGC AGC CAA S S Q
8. AGC AGC CAA S S Q
9. AGC AGC C -- S S P
CG GGA TAT CCC CTA AG G Y P L S
G - A
GA D
CG TCG AGG S R
C GT V
C TCT GGG S G
GA —— A AGG GGT AGC GGA GTC CC -E R G S G V P
- CC CTC GAT AGC GGG AGT CT —— CL D S G S L
10. AGC AGC CA -S S H
11. AGC AGC CAAS S Q
G G
C CAG GGG A ——————- Q G T
- GG GGA CTC CTT GGG G L L G
TAC ACC TTC G Y T F
TCC TAC GAG CAG TAC TTC S Y E Q Y F
-—— GGA AAA CTG TTT TTT G K L F F
GCC AAC GTC CTG ACT TTC A N V L T F
-- C GGG GAG CTG TTT TTT G E L F F
TAC AAT GAG CAG TTC TTC Y N E Q F F
- CC TAC GAG CAG TAC TTC Y E Q Y F
12. AGC AGC C — S S P
13. AGC AGC CAA S S Q
14. TGT GCC A — C A I
CG GAC TCC TTC C -- D S F H
—————— AC
G A
CG GCT AGC GGA GG A S G G
GGG GAC ACC G D T
ACT T
AAT N
15. AGC AGC C S S P
16. AGC A S T
-——————— CA GGG GT ——————————- G V
CC CTG AGG ACT AGC GGG GGT GGG L R T S G G G
-—— GAG CAG TAC TTC E Q Y F
AAT GAG CAG TTC TTC N E Q F F
TAC GAG CAG TAC TTC Y E Q Y F
GAA AAA CTG TTT TTT E K L F F
TAC GAG CAG TAC TTC Y E Q Y F
BJ2S5
BJ2S7
BJ2S5
BJ1S2
BJ2S7
BJ1S4
BJ2S6
BJ2S2
BJ2S1
BJ2S7
BJ2S7
BJ2S1
BJ2S7
BJ1S4
BJ2S7
BJ2S7Q
149
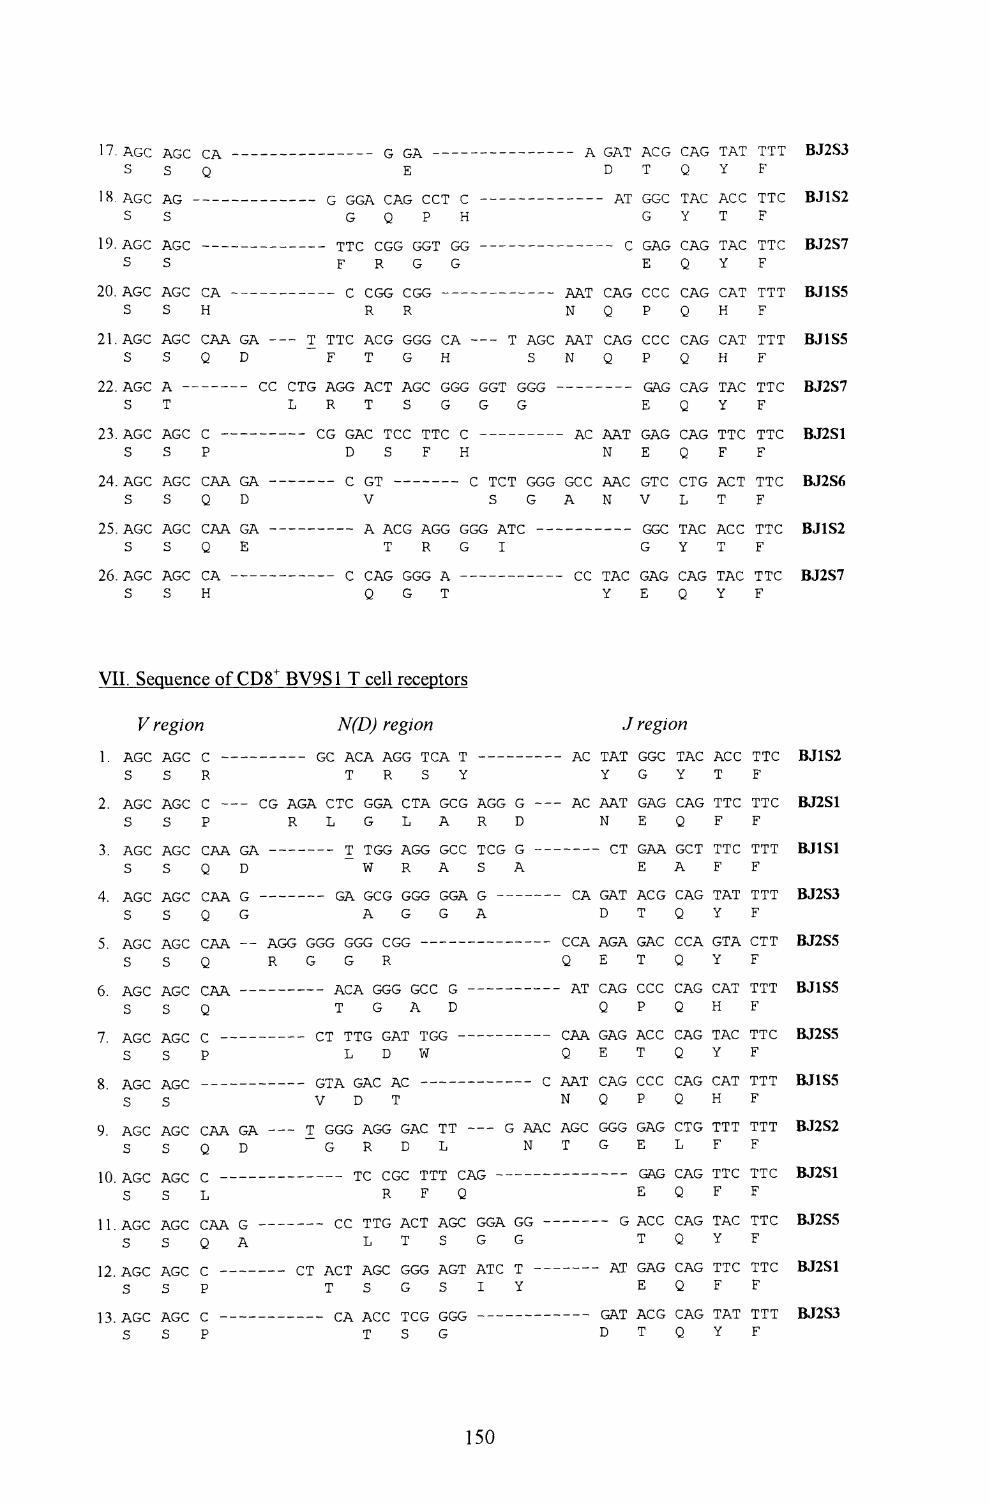
17. AGC AGC CA ———— -S S Q
18. AGC AGS S
1 9 Af^r TAPPs s
20. AGC AGC CAS S H
21. AGC AGC CAA GA -- S S Q D
22. AGC A —————— CC S T
1 "5 7\f~T* TV /T* r1
S S P
94 AGP AGP PAA GA^." . f\\y\^ r\\j\*, \^f\r\. \jf\
S S Q D
?S Af^r AC^r PAA fA
s s Q E26. AGC AGC CA —— ——
S S H
VII. Sequence of CD8+
V region1 7A fT* TV/T* (~*1 . .HAjL, A<crO L*
S S R
2. AGC AGC C —— CG S S P
-J . f\^j\^ f\\j\^ \— r\f\ VJXT.
S S Q D
" . ^T.VJV-' J~\\J\^ \~rf\f\ \J
S S Q G
5. AGC AGC CAA — AG S S Q R
6. AGC AGC CAA S S Q
7 AGP AGP P/ . -rt\jw ^AVJ ( — \*
S S P
Ao-L, AVjL,
s s9. AGC AGC CAA GA —
S S Q D
10. AGC AGC C — —— — SSL
1 1 . jrt\j^ ,rv*j^ {^J-\t\ *cr
S S Q A
1 9 AGP AGP PJ. ^L- . J^\\J\~f J \\J\*- \~r
S S P
13. AGC AGC C — — — - S S P
- ———— — — G GA -------------E
G<~T'T\ r"* TV f /T'T1 r*LrCjrA L ALi L L 1 L
G Q P H
mm/-" r*r*r* CT'T' rLT*
F R G G
C f /—/" ^ ~'/*~'
R R
-- T TTC ACG GGG CA — - T AGC F T G H S
CTG AGG ACT AGC GGG GGT GGG L R T S G G G
D S F H
^7 -L L, 1 L. 1 l^jLr
V S G
•rtA— • \J .TT.VJVJ kJlOVT J~\. J. \^
T R G I
C (~* 7\ ^~" ^" f~* f~* 7\LAG GGG A - ---- Q G T
BV9S IT cell receptors
N(D) regionf~T< 7\ C* 7\ 7\ /"/""• rp^*^ T1GL ALA AGG 1CA 1
T R S Y
AGA CTC GGA CTA GCG AGG G — - R L G L A R D
T rp/-*/-* "nff*1 f~* C* C* rP(~*f~* f~*
W R A S A/""" 7\ /"^ /"* /~* /"* /"*•/"* /"* /"• 7\ ^~*• — - — - GA GCG GGG GGA G -------
A G G A
'/••* /•"•• f~* /~* f~* f* /"" /"•* f~*/~trG GGG GGG CGG --------------
G G R
7vr*7\ cr*r* rur* c* c1ALA LrkjVa LjLU (j T G A D
^rp mrp^ r^ 7\ T1 Tr*^
L D W
GTA GAP AP CO J. iT. OxT.^ ,rt\^ *^
V D T
- T GGG AGG GAC TT —— G AAC G R D L N
TC ^+^*^* •"PT1 '!"1 f~* 7\ f~* —
R F Q(T* TTp/*^ TV/^T1 TV (rN ^~* f~*f~*T\ f~" (~* —
L T S G G
^ 1 /\L- X /\O^ O-ljvj J-\.Vj 1 /\ 1 ^_, _L
T S G S I Y
LA ALL 1 LL- GGG T S G
A /— 71 rp 7\ (~< (-" (~* ~t\ f~~ T^ 7\ T1 rP rP rT Rf7^"^
D T Q Y F
7\rri /— /—• /-• ^7\r^ TVr^f"1 T^T1 ^ TJ ¥ 1 C"7----- AT GGC I AC ACL IIL DJ1.JZG Y T F
C f~~r\f~' /-• 7\ f~- m 7\ f~< TTp/^ U¥*^CTGAG LAG 1AL 11L i>JZo/E Q Y F
AAT CAG CCC CAG CAT TTT BJ1S5N Q P Q H F
AAT CAG CCC CAG CAT TTT BJ1S5N Q P Q H F
——————— GAG CAG TAC TTC BJ2S7E Q Y F
/\V— >irVl \jf\\j v-.rt.o' 1 1 k^ 1 J. ^ Dvl^i31
N E Q F F
GCC AAC GTC CTG ACT TTC BJ2S6A N V L T F
GGL 1AL ALL IIL oJl^ZG Y T F
CL I AO CjACj OACr 1 AC 1 TO t>JZ!S /Y E Q Y F
J regionf*\* J. iT. J. O^*J\^ J. f*i\^ f\\^ \^ J. J. \^ W«J A kj Ai
Y G Y T F
- AC AAT GAG CAG TTC TTC BJ2S1N E Q F F
\^ 1 \js\f\ krL- X J. 1 L- 1 J. 1 D«J I ij J.
E A F F
r^ T\ f~* TV T1 TV /""* /~* ^~* TV /^* ly TV n^ T1 TI T1 i? TO 0 1- LA GAT ALG LAG TAT TT1 rfJzJ>JD T Q Y F
CCA AGA GAC CCA GTA CTT BJ2S5Q E T Q Y F
- AT CAG CCC CAG CAT TTT BJ1S5Q P Q H F
CAA GAG ACC CAG TAC TTC BJ2S5Q E T Q Y F
AAT CAG CCC CAG CAT TTT BJ1S5N Q P Q H F
AGC GGG GAG CTG TTT TTT BJ2S2T G E L F F
f~<~j\f~ ' (""TVr"1 rnT1 /™1 TTf"" U T^d
E Q F F
(~* ~T\C* C* P'TVf" rPTV^* rP rP^~l H TOC^
T Q Y F
7\rp /"^ TV r" C*7\ f~* T"!1 ^ T'T1 /^ U TO C 1
E Q F F
/-•7\rp 7\l~* f^ (~* 7\ /~" TTVrT1 rP rTlrP 12 T^ C 1---- GAI ALG LAG IAI III nJZ^JD T Q Y F
150
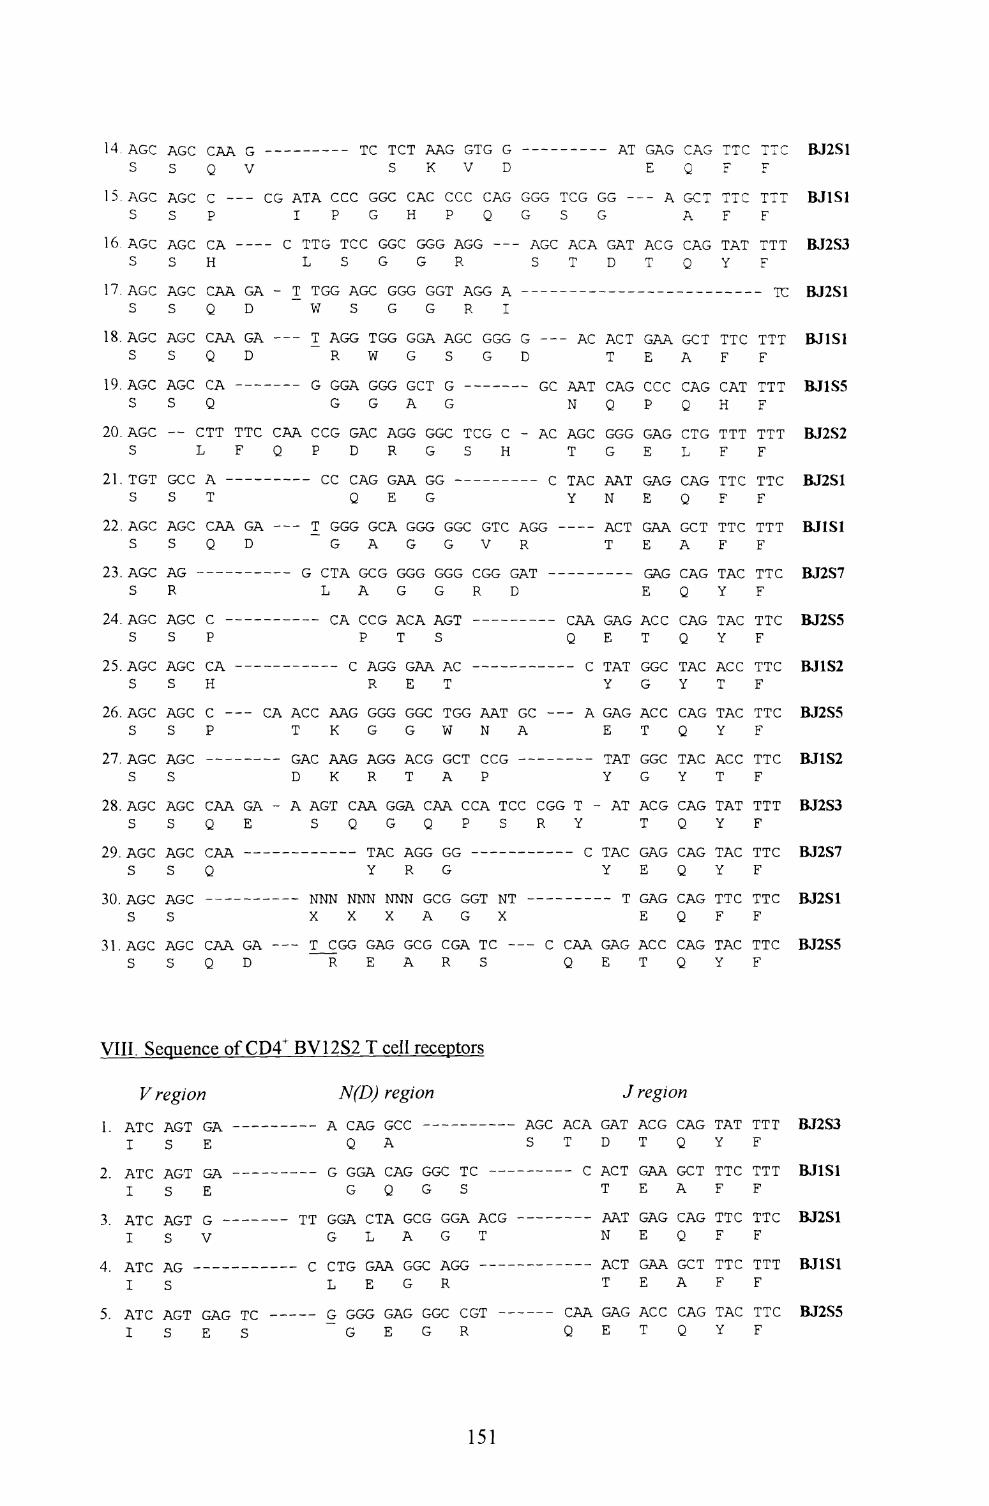
15.
16.
17.
18.
19.
20.
21.
22.
23.
24.
25.
26.
27.
28.
29.
•jn
rt.^7^
S
AGCS
AGCS
APPS
AGCS
A ripr\\J\^
S
AGCST1 r'T1I GIS
AGCS
AP,p.rt\j* —S
AGCS
AGP-rt.wV^
S
AGCS
ALr^
S
AGCS
AGCS
•Afr1
AtjL.S
AGCS
AGCS
APPS
AGCS
AGCS
--
GC-CS
AGCS
AGR
AGCS
A rip^VVJV^
S
AGCS
Ao^S
AGCS
Afipf\\j\^S7\m~
UAA
Q
C —P
CA -H
PAA
Q
CAAQ
PAv^^V
Q
CTT TL F
Ar\T
CAAQ
C --PPA -•w.rt.H
C --P
CAAQ
PAAw.f^rt.Q
(j ------- _n_ l u 1 /\ttXj Vj HJ ^
V S K V D
- CG ATA CCC GGC CAC CCC CAG GGG TCGIPGHPQGS
— - C TTG TCC GGC GGG AGG — - AGC ACAL S G G R S T
f~* 7\ T1 *"P f~* (^ "A C" (~* (~* /""" f~" /"* f" T^ 7\ f~" /*"" 7\Cj/Y "~ 1 1 OO /\LrC o-tsj<j o-Lr 1 AWjr A — — — — — — — —
D ~ W S G G R I
GA —— T AGG TGG GGA AGC GGG G —— ACD R W G S G D
— ——— G GGA GGG GCT G —————— GC AATG G A G N
TC CAA CCG GAC AGG GGC TCG C - AC AGCQPDRGSH T
—————— CC CAG GAA GG ———————— C TACQ E G Y
GA —— T GGG GCA GGG GGC GTC AGG —— -D G A G G V R
G C1A GCG GGG GGG CGG GATL A G G R D
— ——— — CA CCG ACA AGT ————— —— CAAP T S Q
v- f\\J\J O"/A/\ /\\- L*.
RET
- CA ACC AAG GGG GGC TGG AAT GC —— AT K G G W N Ar-ar aar anp arr rr-T rrrtjAk^ AAlj Avjvr AU (j Cjt^ 1 ^ v^ O-D K R T A P
GA - A AGT CAA GGA CAA CCA TCC CGG T -E SQGQPSRY
1AO AoO vjo OY R G
•M"MAT M~NTNT \TNTNT rTT" r(~"T MT
M.1
GG -G
. GATD
ACTT
PAP, ^ — f^jQ
GGGG
AAT f\f\ ±N
ACTT
_ _ __
GAGE
TATX f^. X
Y
GAGE
TATX-rt-i.
Y
- AT
TAPX.rt.\^
Y
T
lj.rt\j
E
-- A
ACGT
GAAE
PPPW v^ w
P
GAGE
GAGE
GAAE
GAGE
ACCT
VJVJV^
G
ACCT
CjTVJ^
G
ACGT
GAGE
nan
^.rt.L?
Q
GCTA
CAGQ
GCTA
CAGQ
CTGL
CAGQ
GCTA
CAGQ
CAGQ
TAPX jH\\^
Y
CAGQ
TAPX VT.V—
Y
CAGQ
CAGQ
ran
in-"
TTCF
TATY
TTCF
CATH
TTTF
TTCF
TTCF
TAP x^v\^Y
TACY
APP.TV--* \—
T
TACY
At— OT
TATY
TAPX^Vw
Y
TTP
i 1 ^
p
TTTF
TTTF
- TP
TTTF
TTTF
TTTF
TTCF
TTTF
TTCF
TTCF
TTCF
TTCF
TTPX X V--
F
TTTF
TTPX X V_-
F
TTl™
DUZJ1
BJ1S1
BJ2S3
RI?<v1
BJ1S1
BJ Io5
BJ2S2
IvIZol
BJ1S1
KJzo/
BJ2S5
_ T1 ^_ty*J 1 d^r
BJ2S5
_ T1 __ixi io^
BJ2S3
RT7Q7IXJ^d /
nr>ciQ F F
31. AGC S
S XXXAGX E
AGC CAA GA —— T CGG GAG GCG CGA TC —— C CAA GAG ACC CAG TAC TTC BJ2S5D R E A R
VIII. Sequence of CD4+ BV12S2 T cell receptors
V region N(D) region
1. ATC AGT GA —————-
I S E
2. ATC AGT GA —————-
I S E
3. ATC AGT G —————— I S V
4. ATC AG —————————- I S
5. ATC AGT GAG TC —- I S E S
-— A CAG GCC —————————
Q A
-— G GGA CAG GGC TC —- G Q G S
TT GGA CTA GCG GGA ACG G L A G T
• C CTG GAA GGC AGG -- L E G R
— G GGG GAG GGC CGT~ G E G R
J region
AGC ACA GAT ACG CAG TAT TTT S T D T Q Y F
BJ2S3
-- C ACT GAA GCT TTC TTT BJ1S1T E A F F
-—— AAT GAG CAG TTC TTC BJ2S1N E Q F F
-—— ACT GAA GCT TTC TTT BJ1S1T E A F F
CAA GAG ACC CAG TAC TTC BJ2S5Q E T Q Y F
151
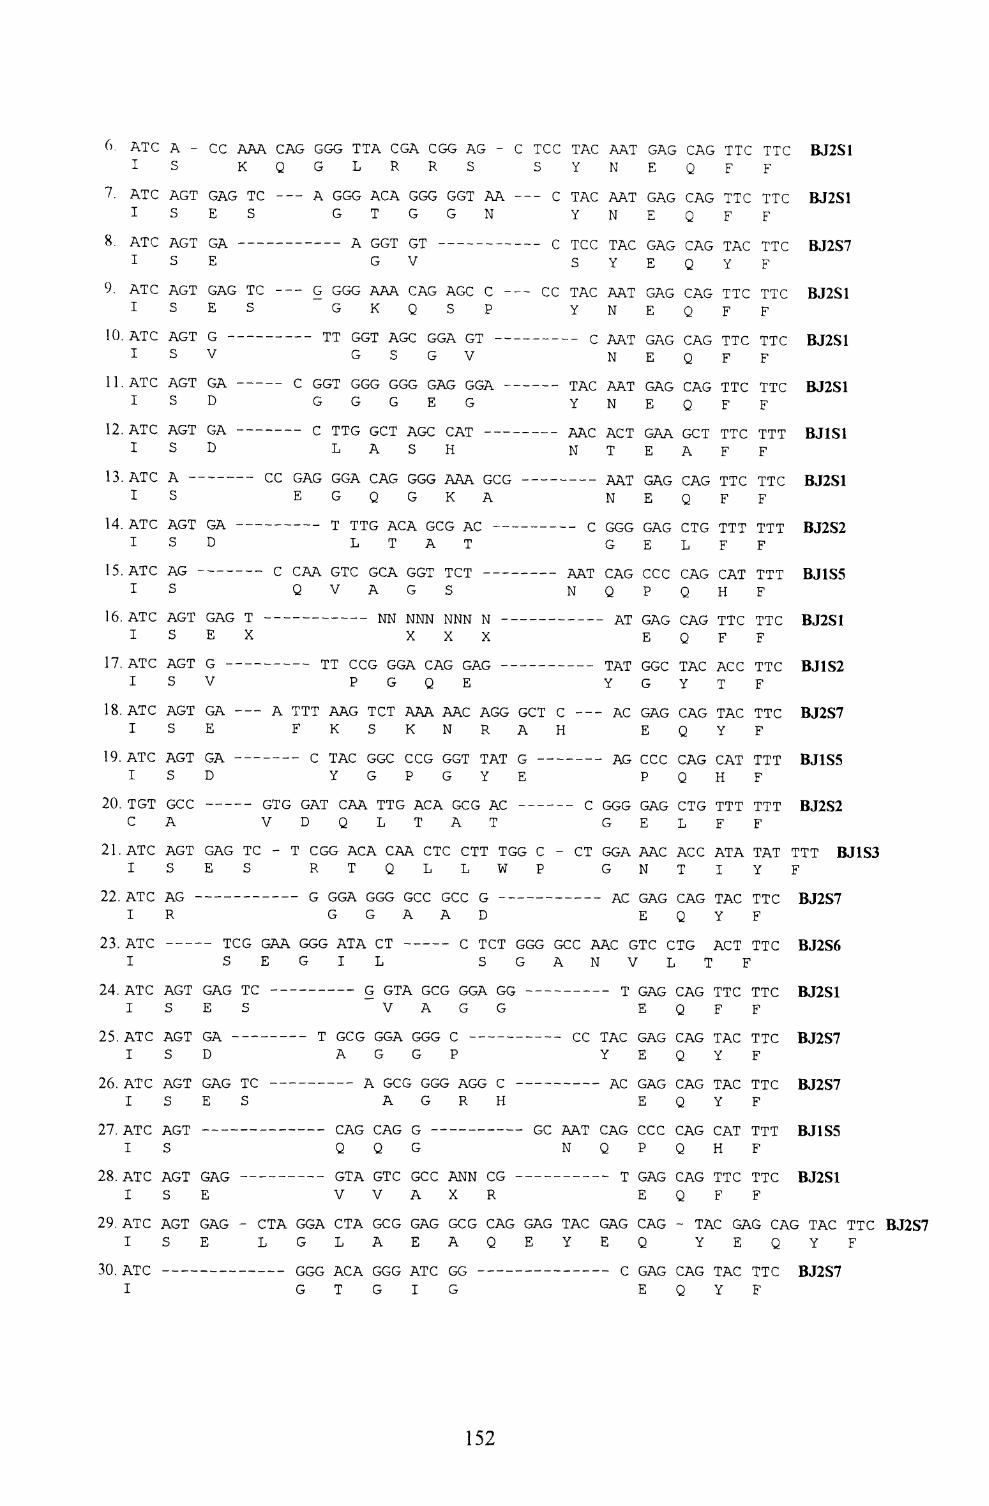
6. ATCI
7. ATC I
8. ATCI
9. ATC I
10. ATCI
11. ATCI
12. ATCI
13. ATCI
14. ATCI
15. ATCI
16. ATCI
17. ATCI
18. ATCI
19. ATCI
20. TGT C
21. ATCI
22. ATC I
23. ATCI
24. ATC I
25. ATCI
26. ATCI
27. ATCI
28. ATCI
29. ATCI
30. ATCI
A - CC AAA CAG GGG TTA CGA CGG AG - C TCC TAC AAT GAG CAG TTC TTC S KQGLRRS SYNEQFF
AGT GAG TC --- A GGG ACA GGG GGT AA --- C TAC AAT GAG CAG TTC TTC SES GTGGN YNEQFF
AGT GA S E
A GGT GT G V
C TCC TAC GAG CAG TAC TTC S Y E Q Y F
AGT GAG TC -— G GGG AAA CAG AGC C -— CC TAC AAT GAG CAG TTC TTC SES GKQSP YNEQFFAGT G -
S V
AGT GA S D
AGT GA S D
TT GGT AGC GGA GT --———--- C AAT GAG CAG TTC TTC GSGV NEQFF
C GGT GGG GGG GAG GGA G G G E G
TAC AAT GAG CAG TTC TTC YNEQFF
A ———-
S
AGT GA S D
-——— C TTG GCT AGC CAT - ————— - AAC ACT GAA GCT TTC TTT LASH NTEAFF
CC GAG GGA CAG GGG AAA GCG ——————— AAT GAG CAG TTC TTC EGQGKA NEQFF
AG - — —— - S
AGT GAG T SEX
._——— T TTG ACA GCG AC L T A T
C CAA GTC GCA GGT TCT - Q V A G S
-- C GGG GAG CTG TTT TTTG E L F F
AAT CAG CCC CAG CAT TTTN Q P Q H F
AGT G S V
-———— NN NNN NNN N XXX
TT CCG GGA CAG GAG P G Q E
- AT GAG CAG TTC TTC E Q F F
TAT GGC TAC ACC TTC Y G Y T F
AGT GA —— A TTT AAG TCT AAA AAC AGG GCT C -— AC GAG CAG TAC TTC SE FKSKNRAH EQYF
AGT GA S D
C TAC GGC CCG GGT TAT G Y G P G Y E
GCC —— A
AGT GAG TC SES
GTG GAT CAA TTG ACA GCG AC V D Q L T A T
-— AG CCC CAG CAT TTT P Q H F
C GGG GAG CTG TTT TTT G E L F F
BJ2S1
BJ2S1
BJ2S7
BJ2S1
BJ2S1
BJ2S1
BJ1S1
BJ2S1
BJ2S2
BJ1S5
BJ2S1
BJ1S2
BJ2S7
BJ1S5
BJ2S2
T CGG ACA CAA CTC CTT TGG C - CT GGA AAC ACC ATA TAT TTT BJ1S3 RTQLLWP GNTIYF
AG R
G GGA GGG GCC GCC G G G A A D
AC GAG CAG TAC TTC EQYF
TCG GAA GGG ATA CT S E G I L
C TCT GGG GCC AAC GTC CTG ACT TTC SGANVLTF
AGT GAG TC SES
G GTA GCG GGA GG V A G G
AGT GA ——- S D
AGT GAG TC SES
T GCG GGA GGG C A G G P
-——— T GAG CAG TTC TTC E Q F F
CC TAC GAG CAG TAC TTC Y E Q Y F
A GCG GGG AGG C A G R H
AGT —-- S
AGT GAG S E
CAG CAG G — —————— Q Q G
GTA GTC GCC ANN CG V V A X R
-—————— AC GAG CAG TAC TTC EQYF
GC AAT CAG CCC CAG CAT TTT N Q P Q H F
T GAG CAG TTC TTC E Q F F
BJ2S7
BJ2S6
BJ2S1
BJ2S7
BJ2S7
BJ1S5
BJ2S1
AGT GAG - CTA GGA CTA GCG GAG GCG CAG GAG TAC GAG CAG - TAC GAG CAG TAC TTC BJ2S7 SE LGLAEAQEYEQ YEQYF
GGG ACA GGG ATC GG G T G I G
C GAG CAG TAC TTC EQYF
BJ2S7
152