earthwise aware's biodiversity and phenology report
TRANSCRIPT
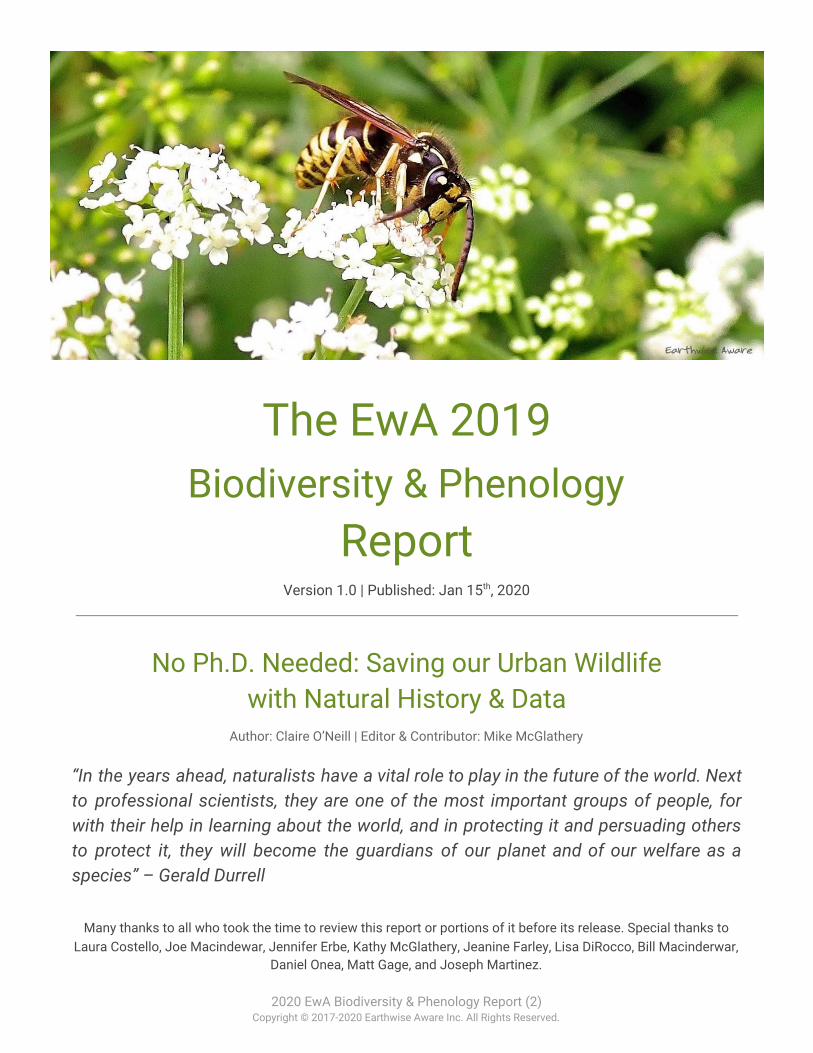
The EwA 2019 Biodiversity & Phenology
Report Version 1.0 | Published: Jan 15th, 2020
No Ph.D. Needed: Saving our Urban Wildlife with Natural History & Data
Author: Claire O’Neill | Editor & Contributor: Mike McGlathery
“In the years ahead, naturalists have a vital role to play in the future of the world. Next to professional scientists, they are one of the most important groups of people, for with their help in learning about the world, and in protecting it and persuading others to protect it, they will become the guardians of our planet and of our welfare as a species” – Gerald Durrell
Many thanks to all who took the time to review this report or portions of it before its release. Special thanks to Laura Costello, Joe Macindewar, Jennifer Erbe, Kathy McGlathery, Jeanine Farley, Lisa DiRocco, Bill Macinderwar,
Daniel Onea, Matt Gage, and Joseph Martinez.
2020 EwA Biodiversity & Phenology Report (2) Copyright © 2017-2020 Earthwise Aware Inc. All Rights Reserved.
Abstract Earthwise Aware (EwA) runs a field naturalist citizen (a.k.a. community) science program that
advances biodiversity and climate research while promoting ecological ethics and the democratization
of science.
EwA’s citizen science model is one of science by the people, benefiting both People and Nature. Where
we live in Massachusetts, our communities get a chance to experience what this means first-hand with
our EwA Naturalist program. Our projects cover different species groups and habitats, and fill
biodiversity and phenology data gaps. Our citizen science projects promote a form of scientific
contribution and experiential learning that is system-based, with an emphasis on the interactions
between species, habitats, and their function in several critical urban locations. They reveal a
continuous natural history of the places that we observe.
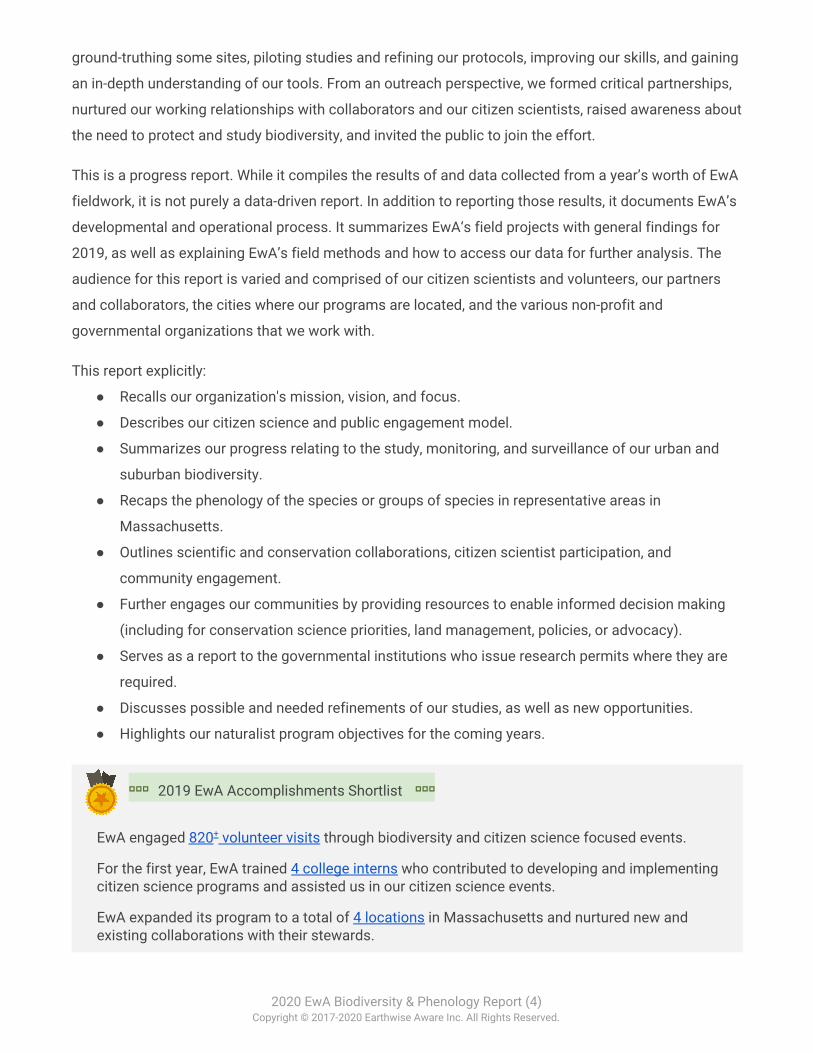
For us, citizen science is also about collaborating with experts, as well as working with the
organizations that protect these parks and reservations or have an interest in promoting conservation.
We are lucky to count as our collaborators and partners
the Friends of the Fells, the Massachusetts Department of
Conservation and Recreation, the Cambridge Water
Department, Mass Audubon Habitat, and local community
centers, including the Somerville Growing Center, who love
and support the EwA programs.
Our main and most exhaustive system-centered program
happens in the Middlesex Fells Reservation (Medford,
Winchester, Stoneham, Melrose, and Malden). This year
we expanded our study sites to include sites where we
focus on arthropod occurrence and abundance (the Fresh Pond Reservoir in Cambridge, Habitat in
Belmont and the Somerville Community Growing Center in Somerville) in collaboration with the
organizations that manage them. Doing so, we can build trends across time and location, and shed
some light on changes in and differences between these habitats.
EwA’s 2019 objectives focused on establishing and refining the procedures of our studies. Our
activities were mainly descriptive and included establishing a baseline for all our studies and locations,
2020 EwA Biodiversity & Phenology Report (3) Copyright © 2017-2020 Earthwise Aware Inc. All Rights Reserved.
ground-truthing some sites, piloting studies and refining our protocols, improving our skills, and gaining
an in-depth understanding of our tools. From an outreach perspective, we formed critical partnerships,
nurtured our working relationships with collaborators and our citizen scientists, raised awareness about
the need to protect and study biodiversity, and invited the public to join the effort.
This is a progress report. While it compiles the results of and data collected from a year’s worth of EwA
fieldwork, it is not purely a data-driven report. In addition to reporting those results, it documents EwA’s
developmental and operational process. It summarizes EwA‘s field projects with general findings for
2019, as well as explaining EwA’s field methods and how to access our data for further analysis. The
audience for this report is varied and comprised of our citizen scientists and volunteers, our partners
and collaborators, the cities where our programs are located, and the various non-profit and
governmental organizations that we work with.
This report explicitly:
● Recalls our organization's mission, vision, and focus.
● Describes our citizen science and public engagement model.
● Summarizes our progress relating to the study, monitoring, and surveillance of our urban and
suburban biodiversity.
● Recaps the phenology of the species or groups of species in representative areas in
Massachusetts.
● Outlines scientific and conservation collaborations, citizen scientist participation, and
community engagement.
● Further engages our communities by providing resources to enable informed decision making
(including for conservation science priorities, land management, policies, or advocacy).
● Serves as a report to the governmental institutions who issue research permits where they are
required.
● Discusses possible and needed refinements of our studies, as well as new opportunities.
● Highlights our naturalist program objectives for the coming years.
⬞⬞⬞ 2019 EwA Accomplishments Shortlist ⬞⬞⬞
EwA engaged 820+ volunteer visits through biodiversity and citizen science focused events.
For the first year, EwA trained 4 college interns who contributed to developing and implementing citizen science programs and assisted us in our citizen science events.
EwA expanded its program to a total of 4 locations in Massachusetts and nurtured new and existing collaborations with their stewards.
2020 EwA Biodiversity & Phenology Report (4) Copyright © 2017-2020 Earthwise Aware Inc. All Rights Reserved.
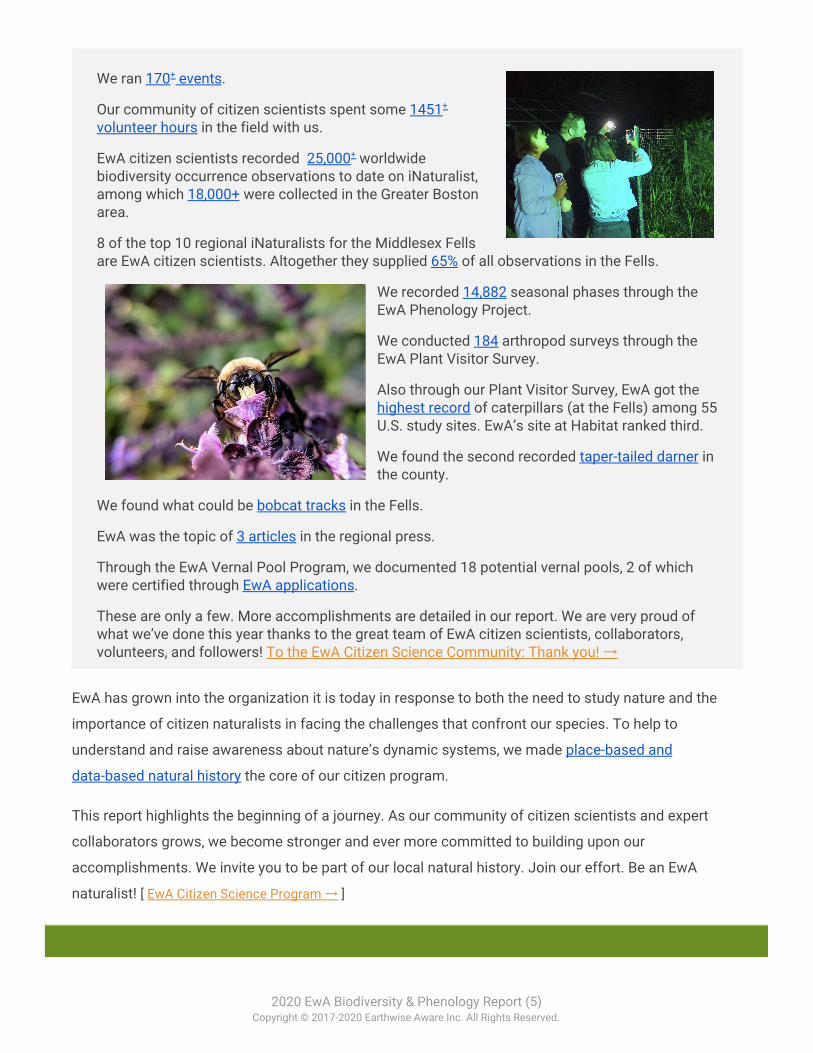
We ran 170+ events.
Our community of citizen scientists spent some 1451+ volunteer hours in the field with us.
EwA citizen scientists recorded 25,000+ worldwide biodiversity occurrence observations to date on iNaturalist, among which 18,000+ were collected in the Greater Boston area.
8 of the top 10 regional iNaturalists for the Middlesex Fells are EwA citizen scientists. Altogether they supplied 65% of all observations in the Fells.
We recorded 14,882 seasonal phases through the EwA Phenology Project.
We conducted 184 arthropod surveys through the EwA Plant Visitor Survey.
Also through our Plant Visitor Survey, EwA got the highest record of caterpillars (at the Fells) among 55 U.S. study sites. EwA’s site at Habitat ranked third.
We found the second recorded taper-tailed darner in the county.
We found what could be bobcat tracks in the Fells.
EwA was the topic of 3 articles in the regional press.
Through the EwA Vernal Pool Program, we documented 18 potential vernal pools, 2 of which were certified through EwA applications.
These are only a few. More accomplishments are detailed in our report. We are very proud of what we’ve done this year thanks to the great team of EwA citizen scientists, collaborators, volunteers, and followers! To the EwA Citizen Science Community: Thank you! →
EwA has grown into the organization it is today in response to both the need to study nature and the
importance of citizen naturalists in facing the challenges that confront our species. To help to
understand and raise awareness about nature’s dynamic systems, we made place-based and
data-based natural history the core of our citizen program.
This report highlights the beginning of a journey. As our community of citizen scientists and expert
collaborators grows, we become stronger and ever more committed to building upon our
accomplishments. We invite you to be part of our local natural history. Join our effort. Be an EwA
naturalist! [ EwA Citizen Science Program → ]
2020 EwA Biodiversity & Phenology Report (5) Copyright © 2017-2020 Earthwise Aware Inc. All Rights Reserved.
Contents The general structure of the EwA Annual Biodiversity & Phenology Report reflects our various studies in
the region, presented in this report as modules. We start with a description of our Citizen Science
model, followed by a summary of our public engagement. This is followed by 5 modules, each going
into the details of the program’s particular topic of study, its methods, and the findings at a unit level. A
section aggregates and integrates the results as well ang issues, research questions, and further
opportunities, including possible improvements to the overall program, its modules and their respective
protocols. We conclude the report with a reflection on the year and a look forward. We also detail the
sites where we run our studies. A final section covers data privacy, usage and access.
No Ph.D. Needed: Saving our Urban Wildlife with Natural History & Data 2
Abstract 3
Contents 6
About EwA 10 Our Mission 10 What We Do 10 Our Vision 10
EwA Citizen Science: Co-Creative Conservation in Action 11 EwA Citizen Science Model 12 EwA Science Projects at a Glance 13 EwA Citizen Science Long-term Goals 13
Scientific goals 13 Societal goals 14
About Citizen Science Credibility & its Potential 15
Community Engagement 17
Module: Biodiversity Occurrence & Distribution 18 What, Where and When—Filling Species Data Gaps 20 Year Objectives 20 Field Methods 21 Results 21
Local Biodiversity Mapping & Unique Findings 23 Global Biodiversity Occurrence–Special Mentions 27
2020 EwA Biodiversity & Phenology Report (6) Copyright © 2017-2020 Earthwise Aware Inc. All Rights Reserved.
Next? Raising Biodiversity Data Quality Standards 28
Improving the Quality of Visual Records 28 Encouraging iNaturalist to Ease Scientific Recording 29 Strengthening EwA Species Occurrence (iNat) Documentation Protocol 30
Module: Phenology—Timing of Events on Flora & Fauna 31 Tracking the Most Sensitive Indicators of Climate Change Effects 33 Year Objectives 34 Field Methods 34 Results 35
Phenology Monitoring Activities & Phenophase Observation Quantity 36 EwA Plant Phenology Data Summary 38 Weather Data Summary 41
Heat Accumulation at Location 42 This Spring Comparison to “Normal” 43
Lessons Learned 44 Next? Consolidate, Add, Pair & Communicate 46
Module: Terrestrial Arthropod Abundance & Composition 48 Revealing Trends in Insect Populations—Helping our Pollinators 49 Year Objectives 51 Field Methods 52 Results 52
General Arthropod Composition per Location 54 Arthropod CC Tree Surveys per Location 56
Arthropod Occurrence on CC Survey Trees per Location 57 Arthropod Occurrence & Abundance across Sites 58 Arthropod Composition Across Sites 59
Lessons Learned 61 Next? Keep Adding, Recording & Refining… 62
Module: Vernal Pool Habitat Documentation & Certification 63 Protecting At-risk Species & Habitats 64
Program Conservation Impact 65 Program Scientific Impact 66
Year Objectives 67 Methods & Tools 67 Results 69
EwA VP Documentation Activity & Records 70 Difficulties & Lessons Learned 71
Next? Certification cont’d, Vegetation Indicator Assessment, etc. 72
Module: Local & International Bioblitzes 73 Recording Species & Raising Awareness 73
2020 EwA Biodiversity & Phenology Report (7) Copyright © 2017-2020 Earthwise Aware Inc. All Rights Reserved.
Year Objectives 74 Field Methods 74 EwA Main BioBlitzes and Results 74
The 2019 City Nature Challenge 74 The Great Walden Bioblitz 76
Next? 2020 City Nature Challenge & More... 77
Integrated Results & Discussion 78 Sites Setup, Protocols Refinement, Baseline Data & First Trends 78 Lessons Learned (General) and Recommendations 79
Think ‘System’—Systems Thinking in Action 79 Avoiding Manual Recording When Possible 79 Challenge Protocol & Data Quality 80
Conclusion: Moving from Description to Inference – Empowering our Communities 80 The Importance of Modern ‘Data-based’ Natural History 81
EwA Study Sites: Geographical & Ecological Description 82 Middlesex Fells Reservation 82
EwA Fells Study Sites 83 Fresh Pond Reservoir (Cambridge, MA) 84
EwA Fresh Pond Study Sites 84 Habitat Wildlife Sanctuary (Belmont, MA) 85
EwA Habitat Study Sites 85 Somerville Growing Community Center (Somerville, MA) 86
EwA Growing Center Study Sites 86
Projects Data Platforms, Access, Impact & Visualization 87 About iNaturalist: Mapping Species Occurrence 88
What is iNaturalist? 88 Data – Access & Visualization 89
About Caterpillars Count: Recording Arthropod Abundance & Composition 89 What is Caterpillars Count? 89 Data – Access & Visualization 90
About Nature’s Notebook: Recording Timing of Seasonal Events on Flora & Fauna 91 What is Nature’s Notebook? 91 Data – Access & Visualization 91
All Other Data 92
To EwA’s Citizen Science Community: Thank you! 93
References & Further Reading 94 EwA Outlines, Guides, Protocols, Tools and Logs 94
EwA Program Outlines 94 EwA Guides & Protocols 94 EwA Citizen Science Presentations 94
2020 EwA Biodiversity & Phenology Report (8) Copyright © 2017-2020 Earthwise Aware Inc. All Rights Reserved.
EwA Refs & Tools 94 EwA Logs & Detailed Reports 95
Biodiversity, Conservation & Citizen Science Literature/Resources 96 Citizen Science 96 Climate & Biodiversity 96 Data & Statistics 97
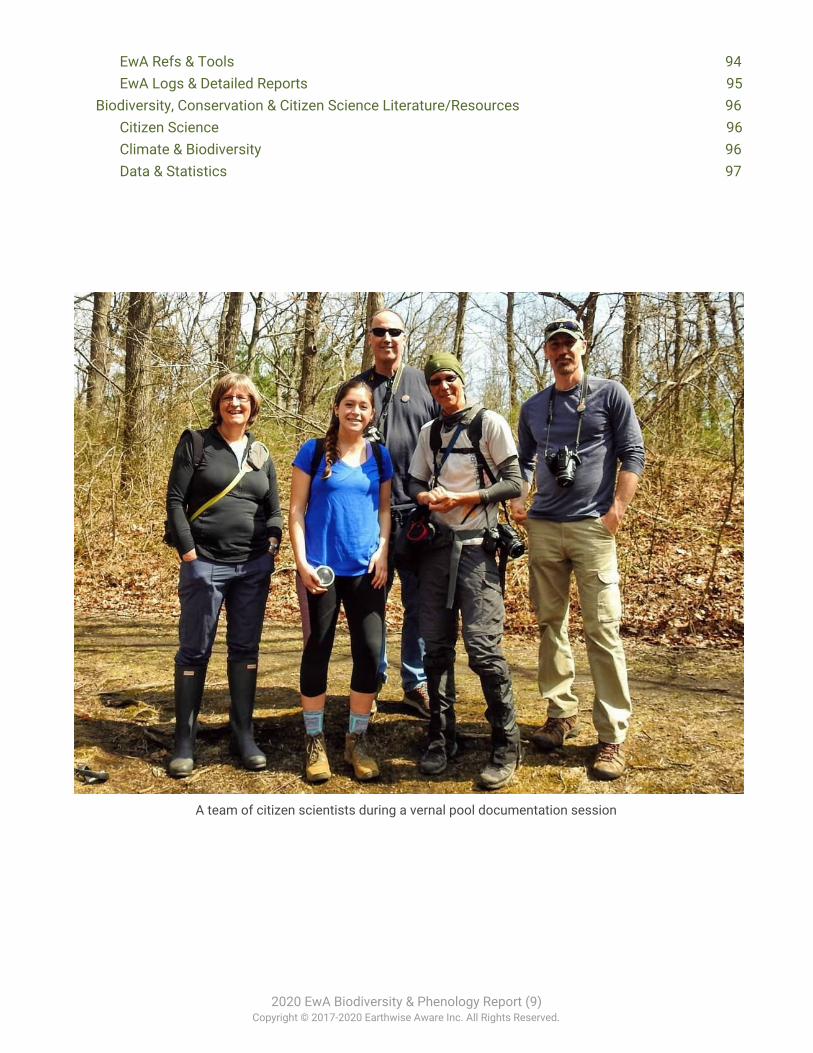
A team of citizen scientists during a vernal pool documentation session
2020 EwA Biodiversity & Phenology Report (9) Copyright © 2017-2020 Earthwise Aware Inc. All Rights Reserved.

About EwA
Our Mission “Empowering individuals, communities, and organizations to make Earthwise choices.”
What We Do
» Reconcile Environmental Attitude, Science & Behavior
» Cultivate Practical Ecology Literacy, Ethics & Leadership
» Connect People with Nature via Direct Experiences and Co-creative Citizen Science
Earthwise Aware focuses on the understanding, documentation, and protection of biodiversity. EwA is
dedicated to bringing biodiversity, climate sciences, ecological ethics and environmental leadership to
the heart of communities and organizations.
To achieve this EwA reconciles attitude, science & behavior, and gets us back in sync with the
Ecological reality we live in. Our tools are ecological guides and etiquettes, activities that foster
connecting with Nature, and a citizen science program that advances Biodiversity and Climate research
while promoting ecological ethics and the democratization of science.
Our Vision
“Altogether ecologically & ethically engaged everywhere–all the time”
Our vision is that of a world where we are ecologically and ethically active wherever we are, whatever
we do and whoever we are —a tourist, a visitor, a conservation or ecology scientist, expert or leader, a
volunteer, or simply an eco-minded citizen.
2020 EwA Biodiversity & Phenology Report (10) Copyright © 2017-2020 Earthwise Aware Inc. All Rights Reserved.
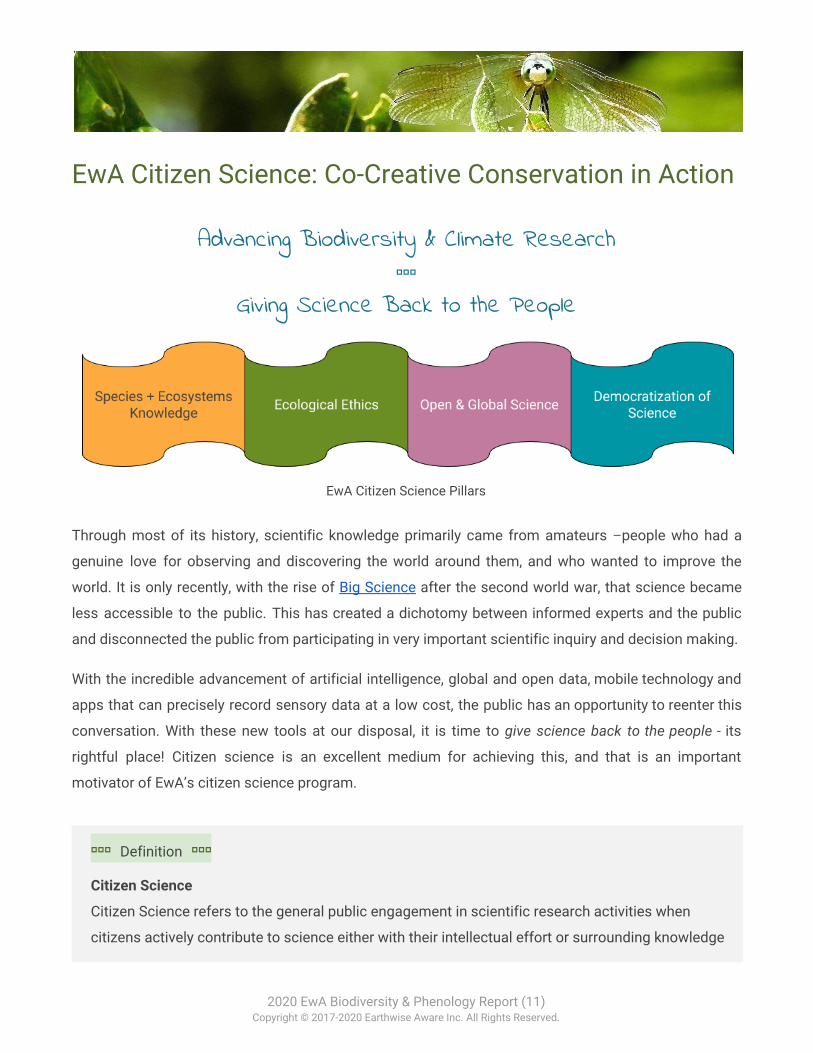
EwA Citizen Science: Co-Creative Conservation in Action
Advancing Biodiversity & Climate Research ⬞⬞⬞
Giving Science Back to the People
EwA Citizen Science Pillars
Through most of its history, scientific knowledge primarily came from amateurs –people who had a
genuine love for observing and discovering the world around them, and who wanted to improve the
world. It is only recently, with the rise of Big Science after the second world war, that science became
less accessible to the public. This has created a dichotomy between informed experts and the public
and disconnected the public from participating in very important scientific inquiry and decision making.
With the incredible advancement of artificial intelligence, global and open data, mobile technology and
apps that can precisely record sensory data at a low cost, the public has an opportunity to reenter this
conversation. With these new tools at our disposal, it is time to give science back to the people - its
rightful place! Citizen science is an excellent medium for achieving this, and that is an important
motivator of EwA’s citizen science program.
⬞⬞⬞ Definition ⬞⬞⬞
Citizen Science
Citizen Science refers to the general public engagement in scientific research activities when
citizens actively contribute to science either with their intellectual effort or surrounding knowledge
2020 EwA Biodiversity & Phenology Report (11) Copyright © 2017-2020 Earthwise Aware Inc. All Rights Reserved.
or with their tools and resources. Participants provide experimental data and facilities for
researchers, raise new questions and co-create a new scientific culture.
While adding value, volunteers acquire new learning and skills, and deeper understanding of the
scientific work in an appealing way. As a result of this open, networked and trans-disciplinary
scenario, science-society-policy interactions are improved. This leads to more democratic
research and evidence-informed decision making.
Ref → A Green paper on Citizen Science: Towards a Society of Empowered Citizens and Enhanced Research by the European Commission (2014) Open Science
Open Science is the movement to make scientific research (including publications, data, physical
samples, and software) and its dissemination accessible to all levels of an inquiring society,
amateur or professional.
In short, Open Science is “Open Source, Open Data, Open Access, Open Notebook”, which are just
shorthand for four fundamental goals:
● Transparency in experimental methodology, observation, and collection of data.
● Public availability and reusability of scientific data.
● Public accessibility and transparency of scientific communication.
● Using web-based tools to facilitate scientific collaboration.
Our founder is a statistician and data scientist and has been involved in conservation for the past 30
years as a scientist, expert, and practitioner, as a pro-bono scientist and as a citizen scientist. Her
experience led her to a desire to expand in this domain, and advocate for something that she has seen
as being critical from the start: the democratization of science.
EwA Citizen Science Model
EwA’s citizen science model is one of science by the people, benefiting both People and Nature. Where
we live in Massachusetts, our communities get a chance to experience what this means first-hand with
our EwA Naturalist program. Our projects cover different species groups and habitats, and fill
biodiversity and phenology data gaps. Our citizen science projects promote a form of scientific
contribution and experiential learning that is system-based, with an emphasis on the interactions
2020 EwA Biodiversity & Phenology Report (12) Copyright © 2017-2020 Earthwise Aware Inc. All Rights Reserved.
between species, habitats, and their function in several critical urban locations. They reveal a
continuous natural history of the places that we observe.
For us, citizen science is also about collaborating with experts, as well as working with the
organizations that protect these parks and reservations or have an interest in promoting conservation.
We are lucky to count as our collaborators and partners the Friends of the Fells, the Massachusetts
Department of Conservation and Recreation, the Cambridge Water Department, Mass Audubon Habitat,
and local community centers, including the Somerville Growing Center, who love and support the EwA
programs.
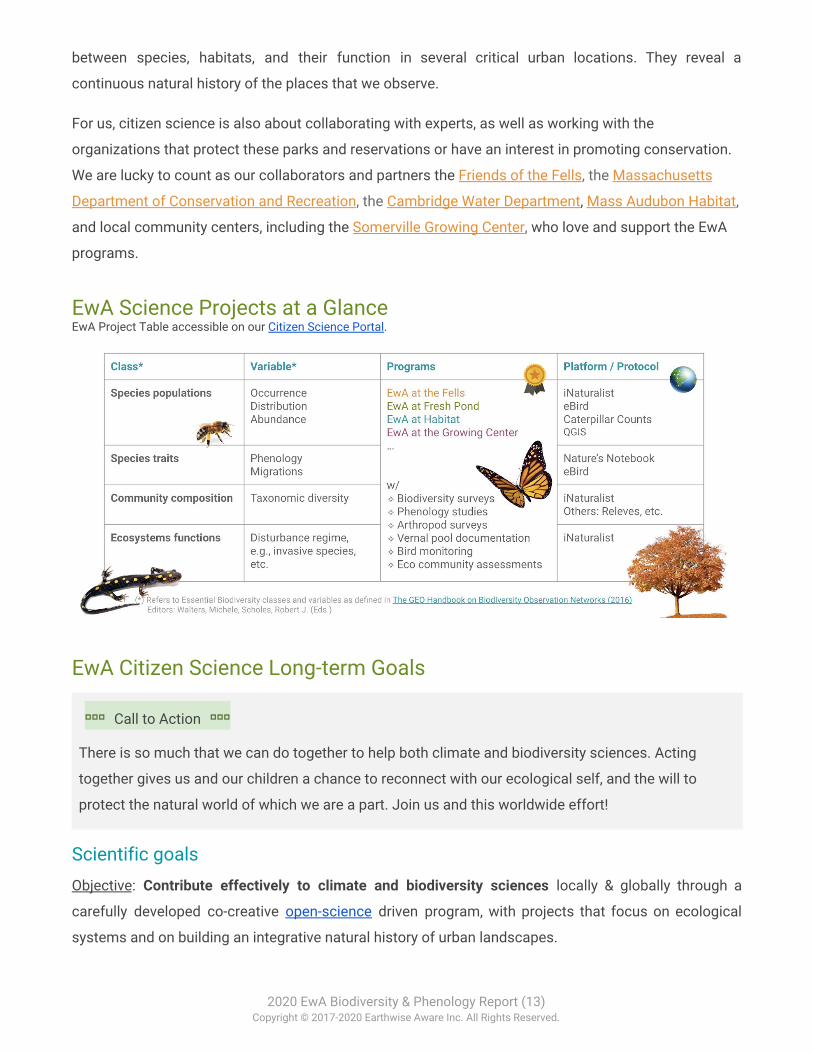
EwA Science Projects at a Glance EwA Project Table accessible on our Citizen Science Portal.
EwA Citizen Science Long-term Goals
⬞⬞⬞ Call to Action ⬞⬞⬞
There is so much that we can do together to help both climate and biodiversity sciences. Acting
together gives us and our children a chance to reconnect with our ecological self, and the will to
protect the natural world of which we are a part. Join us and this worldwide effort!
Scientific goals Objective: Contribute effectively to climate and biodiversity sciences locally & globally through a
carefully developed co-creative open-science driven program, with projects that focus on ecological
systems and on building an integrative natural history of urban landscapes.
2020 EwA Biodiversity & Phenology Report (13) Copyright © 2017-2020 Earthwise Aware Inc. All Rights Reserved.
Our vision is for our citizen scientists to contribute to all phases of the scientific process as they may
want: from performing literature review, raising investigation questions, proposing new hypotheses,
designing the study, collecting the data using global and open data networks, analyzing and interpreting
the data, refining the whole scientific process, communicating to partners, communities of interests
and governmental organizations, and publishing in special interest platforms and scientific peer-review
journals.
At a high level, citizen biodiversity studies such as those conducted at EwA help answer important
climate and biodiversity focused questions such as (non-exhaustive list):
● Climate change. How is the resilience of ecosystems to climate change affected by human
activities and interventions?
● Climate change (cont’d). How will climate change, together with other environmental stressors,
alter the distribution and prevalence of diseases of wild species?
● Climate change (cont’d). What are the potential effects of feedbacks between climate change
and ecosystem dynamics (e.g., drought, forest dieback, etc.) on the effectiveness of policy
measures to sequester carbon and protect biodiversity?
● Protected areas. How effective are different types of protected areas in conserving biodiversity
and providing ecosystem services?
● Terrestrial ecosystems. What are the contributions of urban nature reserves and other green
amenity spaces, such as green spaces, urban parks, and reservations, to biodiversity
conservation, and how can these be enhanced?
● Species management. What is the relative effectiveness of different methods for facilitating the
movement of a species among disjunct patches of its habitat?
● Species management (cont’d). How can we best manage diseases that have the potential to
move among wild species, domestic species, and people?
● Societal context and changes. What are the impacts of increasing human dissociation from
nature on the conservation of biodiversity?
For the specific scientific contributions of each of our studies, please consult the corresponding
module.
Societal goals
1. Reduce the ecological knowledge deficit (also known as ecological science illiteracy) of our
local communities. This includes understanding how our urban wildlife copes with rapid Climate
changes in densely developed areas. This will help to appreciate our urban wildlife, and
2020 EwA Biodiversity & Phenology Report (14) Copyright © 2017-2020 Earthwise Aware Inc. All Rights Reserved.
potentially to efficiently fight its current threats and misuses (e.g., invasive species, litter, pet
waste, harmful rogue/illegal trails in parks).
2. Empower our communities, providing them with tools to support a form of activism that is
science/knowledge/fact-based leading to more resilient and durable actions and solutions.
3. Leverage the power of place in citizen science for enabling effective conservation decision
making, and enable our community to push for policies that represent true ecological priorities
and the true needs and desires of our communities..
About Citizen Science Credibility & its Potential
Creating a rigorous citizen science program is key to data quality and science. The way to design and
implement a good citizen science study and program is to follow the scientific methodology. In other
words, Citizen science is science —as it should be. Poor process, poor data, poor standards is not a
byproduct of citizen science, it is simply ‘poor science’. Poor science (academic and not) fails from a
poorly designed experiment, poor data collection, poor interpretation and inference, poor process and
protocol, and is far more common than one may think. Scrutinize ecological studies from a statistical
stance, and one quickly realizes those common pitfalls include failure to explore the data; use of
arbitrary thresholds; incorrect assumption of independence of observations; the presence of
confounding factors; incomplete model diagnostics, etc. (Steel, 2013).
⬞⬞⬞ More About Quality ⬞⬞⬞ The success of citizen science in producing important and unique data is attracting interest from
scientists and resource managers. Citizen science programs desire to meet the same standards of
credibility as academic science, regardless of how their work context differs (such as training and
managing significant numbers of come-and-go volunteers and with limited resources). To achieve
this, serious citizen science programs use credibility-building strategies.
For instance, at EwA we apply strategies throughout the lifetime of any of our projects. These
include (non-exhaustively): project information sessions; field training; maintenance training;
community lectures and citizen science seminars; use of technological aids; data collection as
groups (for process feedback and challenging); open fieldwork logs; data cross-validation with
experts; data cleaning; open data analysis; annual reporting.
2020 EwA Biodiversity & Phenology Report (15) Copyright © 2017-2020 Earthwise Aware Inc. All Rights Reserved.
More: Strategies Employed by Citizen Science Programs to Increase the Credibility of Their Data. Freitag, A.,
Meyer, R. and Whiteman, L., 2016. Citizen Science: Theory and Practice, 1(1), p.2. DOI: 10.5334/cstp.6
EwA uses standardized protocols and global, open databases for recording data. We work as a team.
We enlist the help of experts and scientists when needed, and we also challenge and help those experts
and scientists to refine their protocol, analyses, and reports. This enables working with datasets that
are comparable. It also allows for the analysis and use of global data recorded by other organizations.
We make our process accessible and transparent. In other words, we make our data count.
Citizen science has the potential to challenge poor science. This novel, collaborative approach can
expose confusing, non-rigorous science, and improve antiquated practices no matter who’s done the
research (academic or public). That is how we see and do science at EwA.
⬞⬞⬞ More about Citizen Science ⬞⬞⬞
Alan Irwin: The Citizenship of Science
In the late 20th century, historians and sociologists of science increasingly understood that
science is embedded in the fabric of society. Consequently, some aspects of science are shaped
by major threads in that fabric. For example, institutional forces (such as military and corporate
interests) may dominate scientific agendas, instead of the agendas representing the needs and
desires of broader publics. One can see this in the way that interests of the pharmaceutical
industry drive much research on cures for cancer, even though some public interest groups
suggest that we need more research on the environmental causes of cancer. Irwin’s work—in a
1995 book titled Citizen Science—addressed the varied social pressures shaping science by
seeking to reclaim two dimensions of the relationship of citizens with science:
1. Science should address the needs and concerns of citizens, and seek to meet those needs.
2. The process of producing reliable knowledge could be developed and enacted by citizens
themselves. People bring into science such things as local contextual knowledge and
real-world geographic, political, and moral constraints generated outside of formal scientific
institutions.
Source → The Rightful Place of Science: Citizen Science by Darlene Cavalier (2016)
2020 EwA Biodiversity & Phenology Report (16) Copyright © 2017-2020 Earthwise Aware Inc. All Rights Reserved.
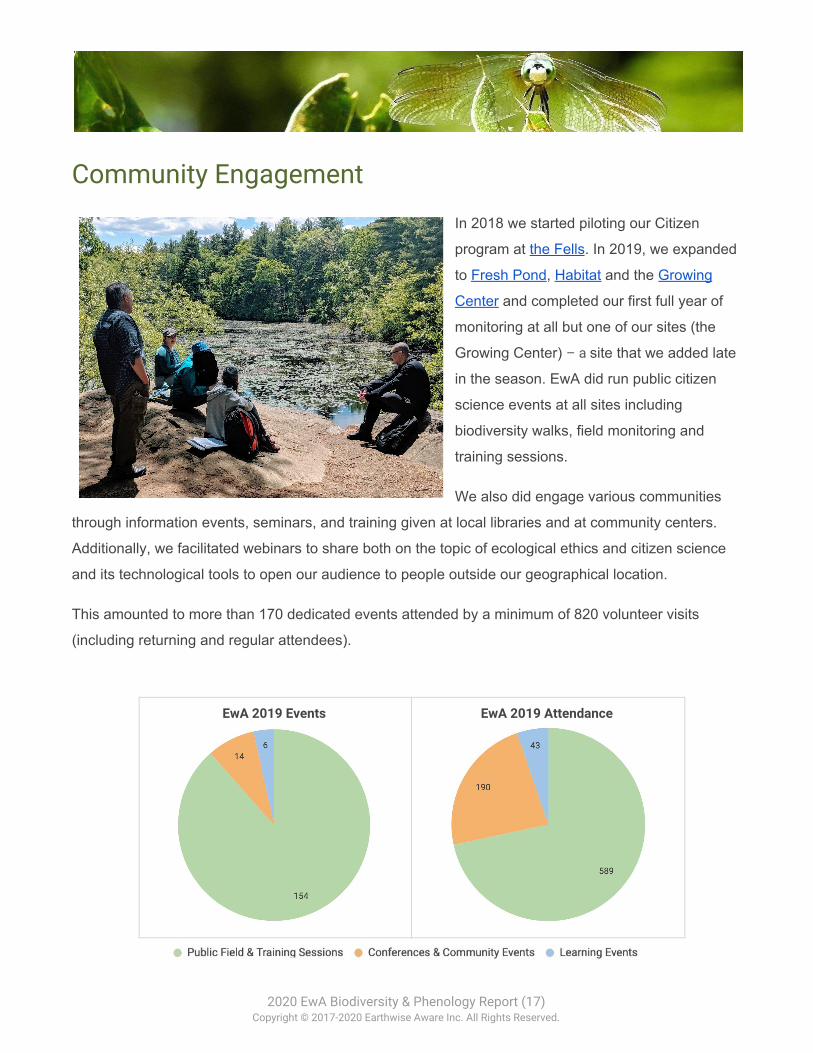
Community Engagement
In 2018 we started piloting our Citizen
program at the Fells. In 2019, we expanded
to Fresh Pond, Habitat and the Growing
Center and completed our first full year of
monitoring at all but one of our sites (the
Growing Center) – a site that we added late
in the season. EwA did run public citizen
science events at all sites including
biodiversity walks, field monitoring and
training sessions.
We also did engage various communities
through information events, seminars, and training given at local libraries and at community centers.
Additionally, we facilitated webinars to share both on the topic of ecological ethics and citizen science
and its technological tools to open our audience to people outside our geographical location.
This amounted to more than 170 dedicated events attended by a minimum of 820 volunteer visits
(including returning and regular attendees).
EwA 2019 Events
EwA 2019 Attendance
2020 EwA Biodiversity & Phenology Report (17) Copyright © 2017-2020 Earthwise Aware Inc. All Rights Reserved.
Module: Biodiversity Occurrence & Distribution
Biodiversity touches every aspect of our lives. It is the fabric of Life. Its rapid loss is happening on a
global scale. Biodiversity Loss is the most important story that most people have never heard about.
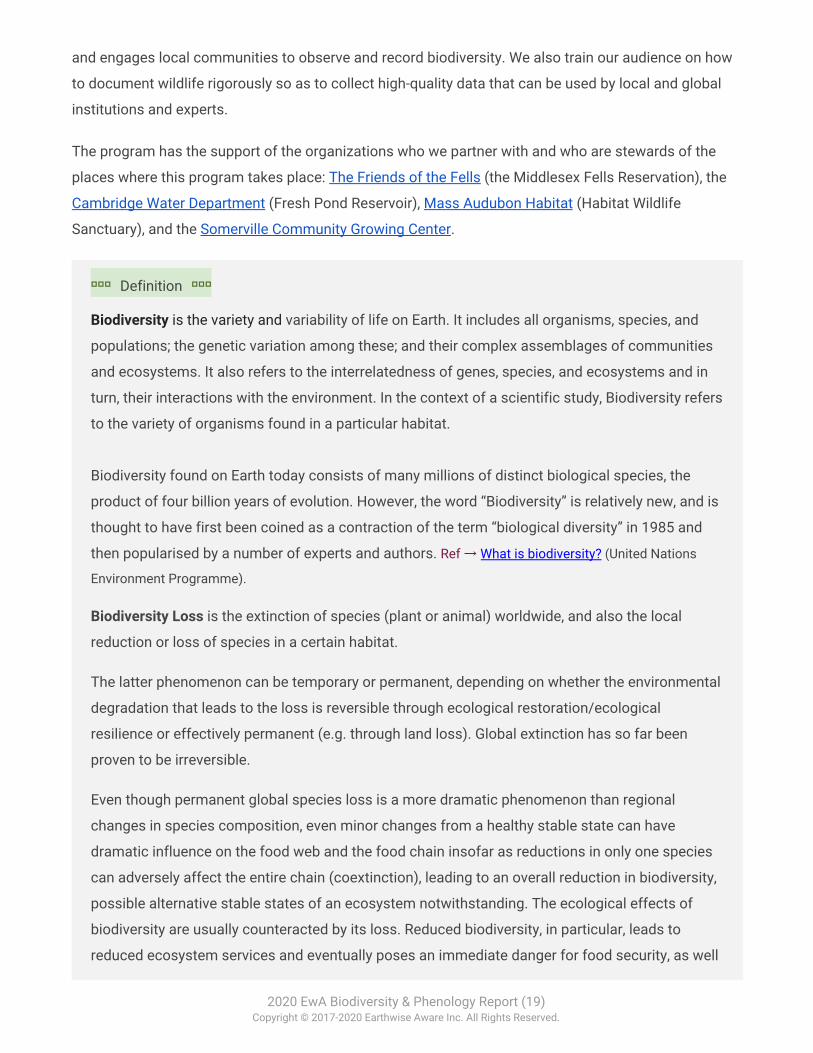
The Living Planet Index (LPI) is a
measure of the state of global
biological diversity based on population
trends of vertebrate species from
around the world. In 2018, the LPI
revealed an overall decline of 60% in
the population sizes of vertebrates
between 1970 and 2014 (see the graph
on the right) – in other words, an
average drop of well over half in less than 50 years.
The scale of the global loss of biodiversity now amounts to a full-fledged non-human species extinction
crisis (a.k.a. Anthropocene extinction), a process that could wipe out a million species of plants and
animals from our planet in the next few decades. About 15,000 scientific studies support this terrifying
conclusion as it can be read in the assessment report produced by the independent UN
Intergovernmental Science-Policy Platform for Biodiversity and Ecosystem Services (IPBES).
Given that experts worldwide consider this to be as big a crisis as Climate Change, it is puzzling that public
awareness is so low. Scientists have raised the alarm decades ago, but for some reason, it only just
reached the public this year.
Worldwide initiatives to record what and where species occur have multiplied. EwA joined this effort
and is a member of various Biodiversity networks including the iNaturalist community (which platform
we use to record our observations) and GEO BON, the Global Earth Observation Biodiversity-focused
network.
Biodiversity mapping has been an explicit component of EwA’s citizen science program since 2018.
EwA systematically observes species across taxa and geographic scales. EwA’s main effort is local
2020 EwA Biodiversity & Phenology Report (18) Copyright © 2017-2020 Earthwise Aware Inc. All Rights Reserved.
and engages local communities to observe and record biodiversity. We also train our audience on how
to document wildlife rigorously so as to collect high-quality data that can be used by local and global
institutions and experts.
The program has the support of the organizations who we partner with and who are stewards of the
places where this program takes place: The Friends of the Fells (the Middlesex Fells Reservation), the
Cambridge Water Department (Fresh Pond Reservoir), Mass Audubon Habitat (Habitat Wildlife
Sanctuary), and the Somerville Community Growing Center.
⬞⬞⬞ Definition ⬞⬞⬞
Biodiversity is the variety and variability of life on Earth. It includes all organisms, species, and
populations; the genetic variation among these; and their complex assemblages of communities
and ecosystems. It also refers to the interrelatedness of genes, species, and ecosystems and in
turn, their interactions with the environment. In the context of a scientific study, Biodiversity refers
to the variety of organisms found in a particular habitat.
Biodiversity found on Earth today consists of many millions of distinct biological species, the
product of four billion years of evolution. However, the word “Biodiversity” is relatively new, and is
thought to have first been coined as a contraction of the term “biological diversity” in 1985 and
then popularised by a number of experts and authors. Ref → What is biodiversity? (United Nations
Environment Programme).
Biodiversity Loss is the extinction of species (plant or animal) worldwide, and also the local
reduction or loss of species in a certain habitat.
The latter phenomenon can be temporary or permanent, depending on whether the environmental
degradation that leads to the loss is reversible through ecological restoration/ecological
resilience or effectively permanent (e.g. through land loss). Global extinction has so far been
proven to be irreversible.
Even though permanent global species loss is a more dramatic phenomenon than regional
changes in species composition, even minor changes from a healthy stable state can have
dramatic influence on the food web and the food chain insofar as reductions in only one species
can adversely affect the entire chain (coextinction), leading to an overall reduction in biodiversity,
possible alternative stable states of an ecosystem notwithstanding. The ecological effects of
biodiversity are usually counteracted by its loss. Reduced biodiversity, in particular, leads to
reduced ecosystem services and eventually poses an immediate danger for food security, as well
2020 EwA Biodiversity & Phenology Report (19) Copyright © 2017-2020 Earthwise Aware Inc. All Rights Reserved.
as for humankind. Ref → Biodiversity Loss (Wiki) | Biodiversity Loss and Its Impact on Humanity. Cardinale,
Bradley; et al. (2012) in Nature. 486 (7401): 59–67.
What, Where and When—Filling Species Data Gaps
Biodiversity is being lost at an unprecedented rate, and monitoring is crucial for understanding the
causal drivers and assessing solutions.
EwA is responding to the international data mobilization call to action for monitoring biodiversity and
filling numerous data gaps. Many of those gaps have been concisely identified and explained in The
GEO Handbook on Biodiversity Observation Networks (2018), and raise the need to monitor biological
mechanisms including species demography and dispersal, species interactions, all of which rely on the
observation and mapping of those species.
Closer to home, this effort helps us understand the biodiversity composition/structure of the areas that
we are studying. In turn, this empowers communities to better protect their local wildlife and natural
habitats.
Globally our data also contribute to open science, supplying information to the international biodiversity
inventory (GBIF) through our contribution to the iNaturalist platform.
Year Objectives
EwA’s 2019 objectives included both establishing and refining procedures. Many of these goals are
procedural methods for establishing a field site. These goals were:
● Choose additional sites. Establish new study locations in our regions, the central sites being
located in the Fells.
● Collaborations. For an impactful program and for recruiting citizen scientists this also means
nurturing good collaborations with the organizations who are the stewards of the locations
where we work.
● Biodiversity baselines and guides. Establish a baseline of the common taxa at the sites and
start to develop site biodiversity guides.
● Data collection & maintenance. Continue gathering and maintaining collection data.
● Data quality. Increase data quality throughout the year by improving the quality of our visual
records when possible.
● Protocol iteration. Refine our protocol and its methods and start facilitating structured and
semistructured surveys.
2020 EwA Biodiversity & Phenology Report (20) Copyright © 2017-2020 Earthwise Aware Inc. All Rights Reserved.
Field Methods
During the active season (spring and summer), record weekly biodiversity occurrence at all locations
following the protocol in place for the type of survey (taxa-focused or general).
EwA Biodiversity monitoring happens in the following contexts:
❏ Systematic transect photo surveys and area searches following a rigorous protocol as in the
case of our Arthropod study (detailed in § Module: Terrestrial Arthropod Abundance &
Composition)
❏ Systematic transect species order count surveys following a rigorous protocol as in the case of
our Arthropod study (detailed in § Module: Terrestrial Arthropod Abundance & Composition)
❏ Semistructured and Opportunistic surveys. Semistructured surveys ask for the logging of
additional pieces of information such as effort, number of observers, duration, weather,
temperature, etc. Opportunistic surveys only ask for the upload of the visual records with its
metadata (date, time, location). Opportunistic surveys are important in that they are easier to
run, and have the potential to engage the public at a much higher level than strict/rigorous
surveys. With the advancements of modern statistics and analytics, they are becoming a
reliable resource to get relevant coarse information about biodiversity occurrence, composition,
and dynamics.
❏ Bioblitz events following bioblitz-specific protocols (detailed in § Module: Local & International
Bioblitzes)
Data collections happen both in teams during our fieldwork sessions and individually (as we encourage
our citizen scientists to observe whenever they have a chance).
The main EwA biodiversity mapping recording platform is iNaturalist (See § Species Occurrence:
iNaturalist).
Results
We have accomplished a lot and performed beyond our own expectations. This year on iNaturalist
alone we added some 17,207 observations of over 2,090 species across taxa from 118 citizen
scientists, compared to 4,911 observations from 26 observers of over 1,406 species in 2018. This
represents a 250% increase in the number of EwA records.
2020 EwA Biodiversity & Phenology Report (21) Copyright © 2017-2020 Earthwise Aware Inc. All Rights Reserved.
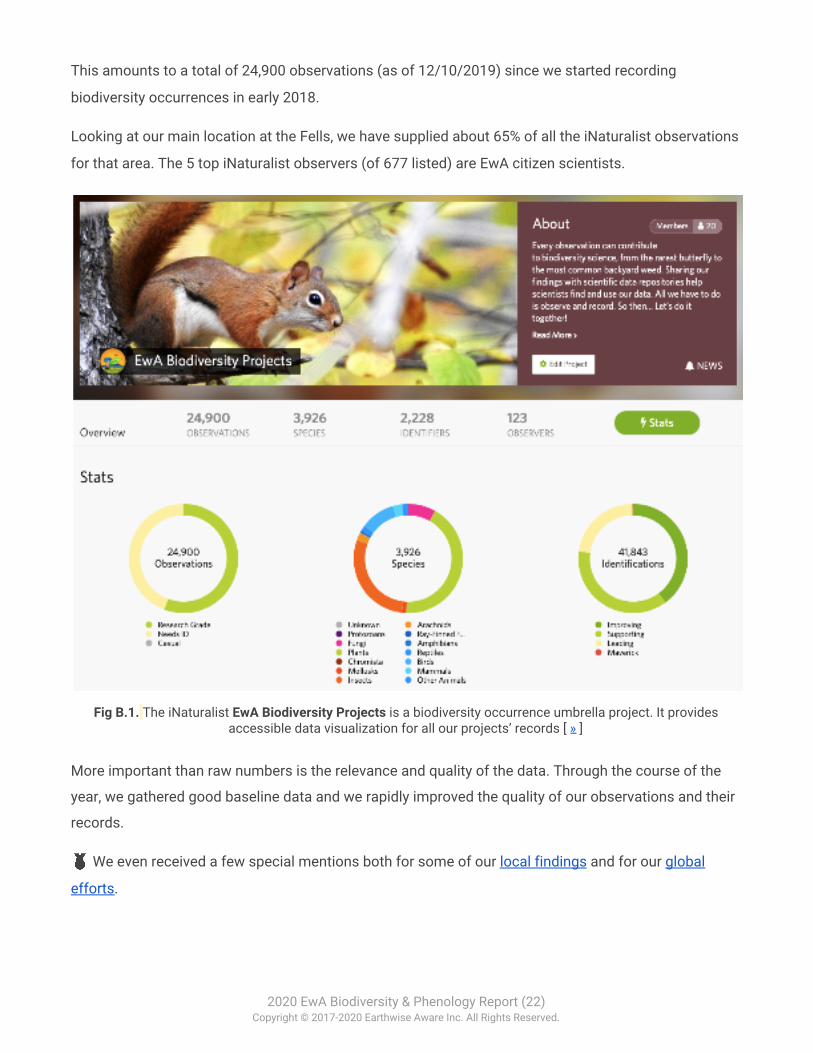
This amounts to a total of 24,900 observations (as of 12/10/2019) since we started recording
biodiversity occurrences in early 2018.
Looking at our main location at the Fells, we have supplied about 65% of all the iNaturalist observations
for that area. The 5 top iNaturalist observers (of 677 listed) are EwA citizen scientists.
Fig B.1. The iNaturalist EwA Biodiversity Projects is a biodiversity occurrence umbrella project. It provides accessible data visualization for all our projects’ records [ » ]
More important than raw numbers is the relevance and quality of the data. Through the course of the
year, we gathered good baseline data and we rapidly improved the quality of our observations and their
records.
🥇 We even received a few special mentions both for some of our local findings and for our global
efforts.
2020 EwA Biodiversity & Phenology Report (22) Copyright © 2017-2020 Earthwise Aware Inc. All Rights Reserved.
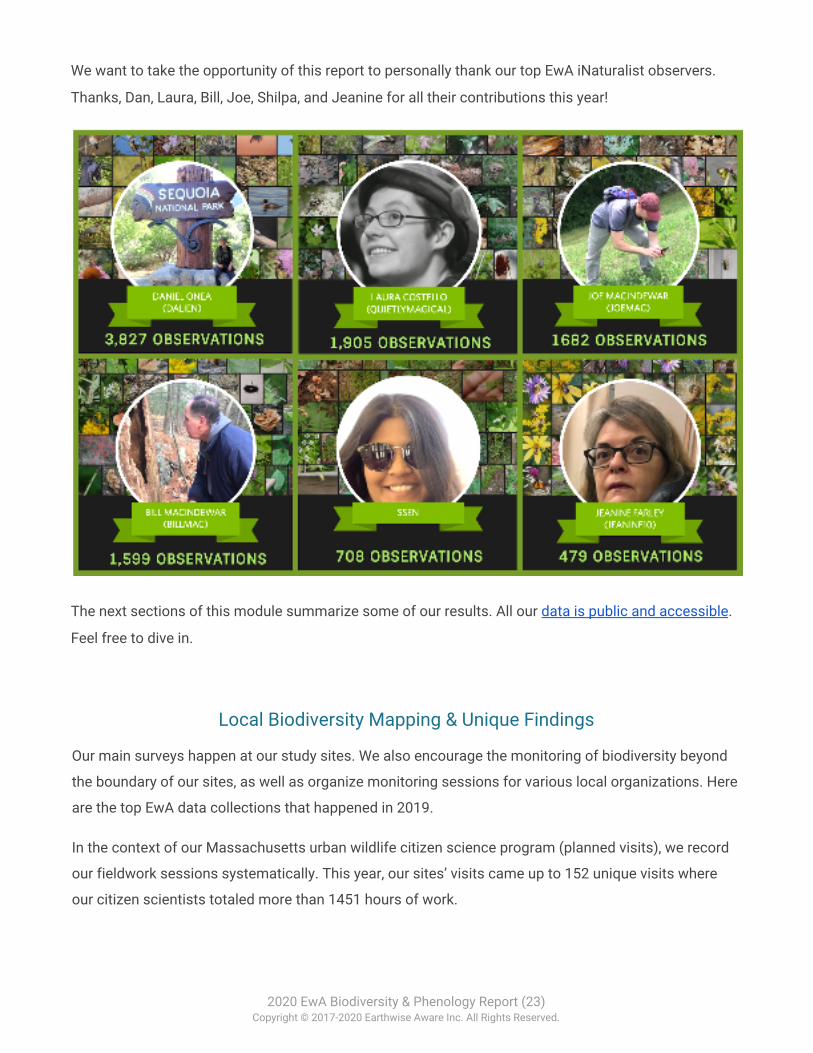
We want to take the opportunity of this report to personally thank our top EwA iNaturalist observers.
Thanks, Dan, Laura, Bill, Joe, Shilpa, and Jeanine for all their contributions this year!
The next sections of this module summarize some of our results. All our data is public and accessible.
Feel free to dive in.
Local Biodiversity Mapping & Unique Findings
Our main surveys happen at our study sites. We also encourage the monitoring of biodiversity beyond
the boundary of our sites, as well as organize monitoring sessions for various local organizations. Here
are the top EwA data collections that happened in 2019.
In the context of our Massachusetts urban wildlife citizen science program (planned visits), we record
our fieldwork sessions systematically. This year, our sites’ visits came up to 152 unique visits where
our citizen scientists totaled more than 1451 hours of work.
2020 EwA Biodiversity & Phenology Report (23) Copyright © 2017-2020 Earthwise Aware Inc. All Rights Reserved.
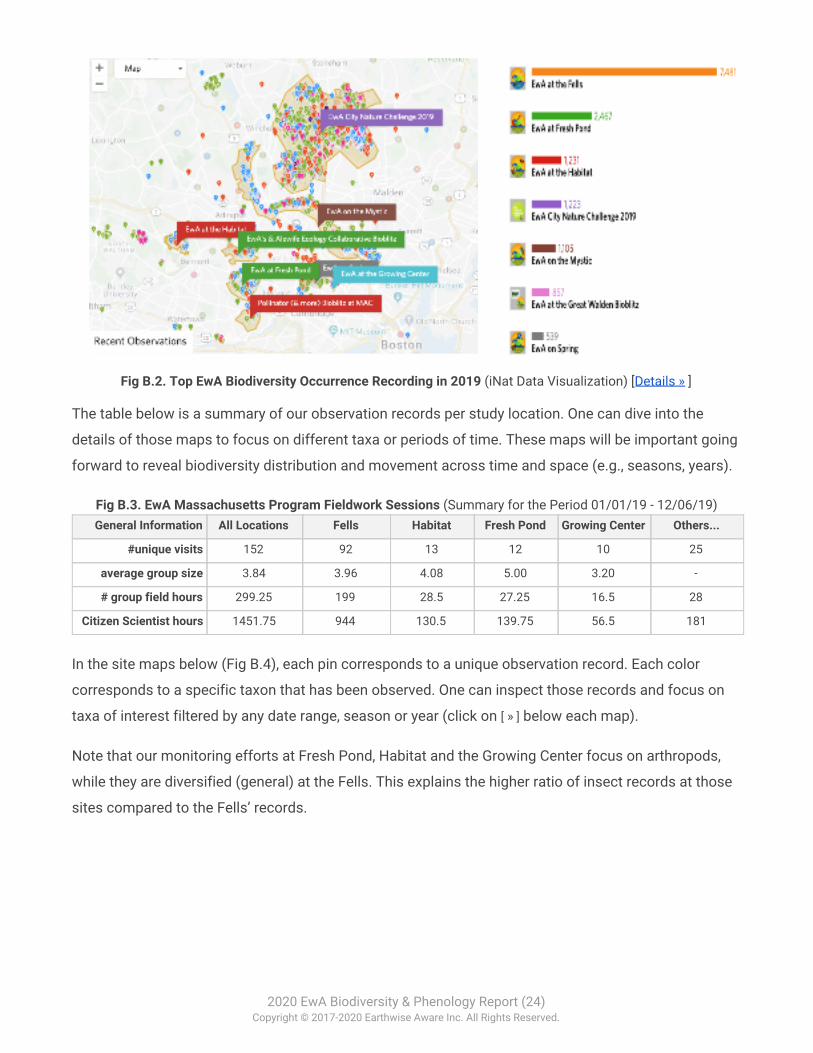
Fig B.2. Top EwA Biodiversity Occurrence Recording in 2019 (iNat Data Visualization) [Details » ]
The table below is a summary of our observation records per study location. One can dive into the
details of those maps to focus on different taxa or periods of time. These maps will be important going
forward to reveal biodiversity distribution and movement across time and space (e.g., seasons, years).
Fig B.3. EwA Massachusetts Program Fieldwork Sessions (Summary for the Period 01/01/19 - 12/06/19) General Information All Locations Fells Habitat Fresh Pond Growing Center Others...
#unique visits 152 92 13 12 10 25
average group size 3.84 3.96 4.08 5.00 3.20 -
# group field hours 299.25 199 28.5 27.25 16.5 28
Citizen Scientist hours 1451.75 944 130.5 139.75 56.5 181
In the site maps below (Fig B.4), each pin corresponds to a unique observation record. Each color
corresponds to a specific taxon that has been observed. One can inspect those records and focus on
taxa of interest filtered by any date range, season or year (click on [ » ] below each map).
Note that our monitoring efforts at Fresh Pond, Habitat and the Growing Center focus on arthropods,
while they are diversified (general) at the Fells. This explains the higher ratio of insect records at those
sites compared to the Fells’ records.
2020 EwA Biodiversity & Phenology Report (24) Copyright © 2017-2020 Earthwise Aware Inc. All Rights Reserved.
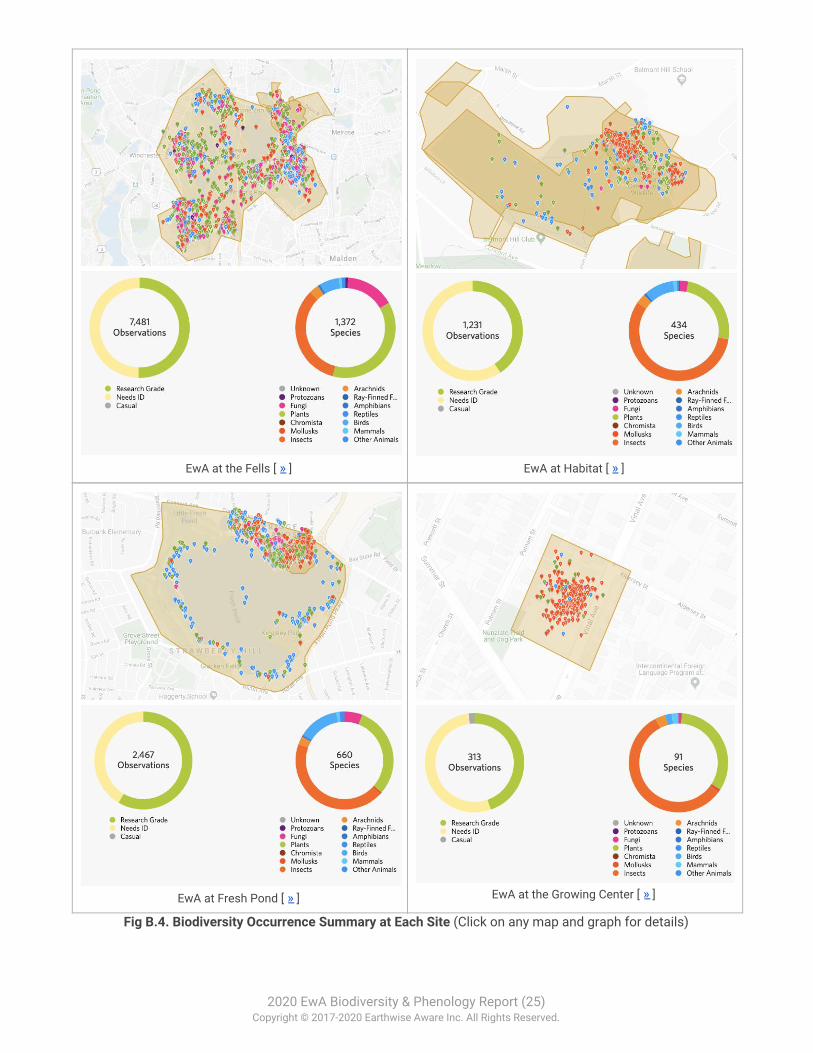
EwA at the Fells [ » ] EwA at Habitat [ » ]
EwA at Fresh Pond [ » ] EwA at the Growing Center [ » ]
Fig B.4. Biodiversity Occurrence Summary at Each Site (Click on any map and graph for details)
2020 EwA Biodiversity & Phenology Report (25) Copyright © 2017-2020 Earthwise Aware Inc. All Rights Reserved.
This is the first complete year of data, so we won’t spend too much effort over-analyzing this data as it
can be only be considered baseline data. This is a multi-year effort, and the next years are going to be
interesting as we start analyzing data across time and space (starting possibly next year).
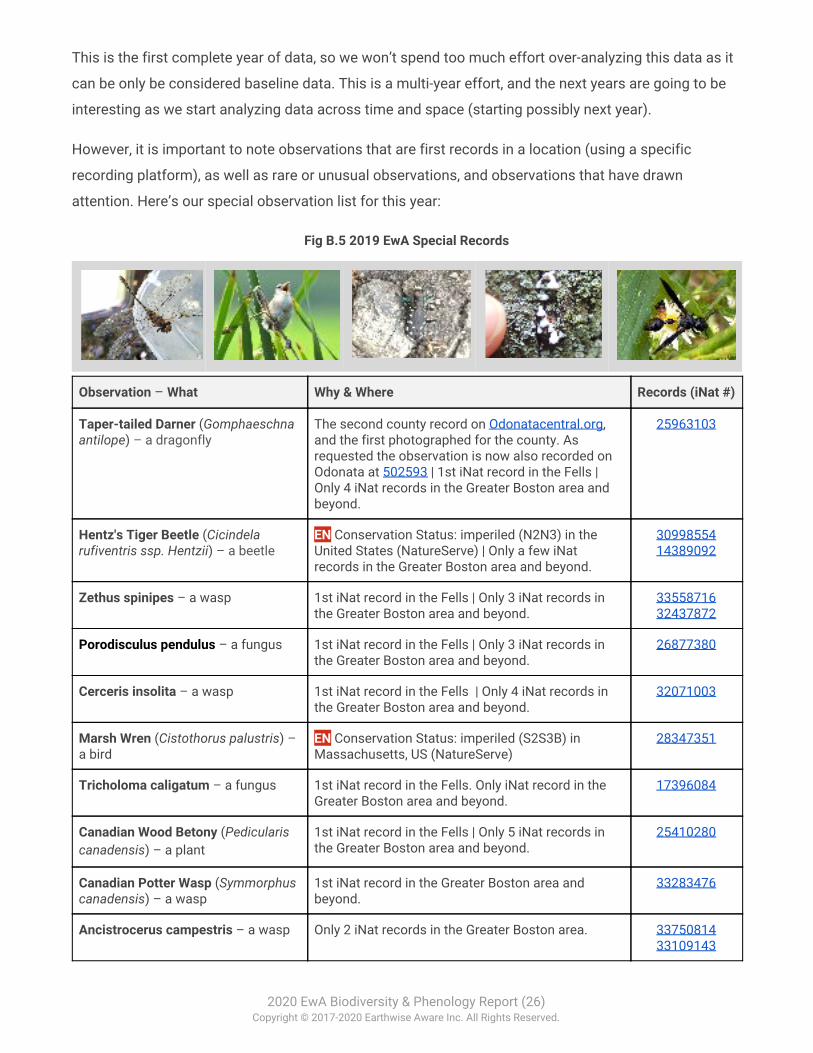
However, it is important to note observations that are first records in a location (using a specific
recording platform), as well as rare or unusual observations, and observations that have drawn
attention. Here’s our special observation list for this year:
Fig B.5 2019 EwA Special Records
Observation – What Why & Where Records (iNat #)
Taper-tailed Darner (Gomphaeschna antilope) – a dragonfly
The second county record on Odonatacentral.org, and the first photographed for the county. As requested the observation is now also recorded on Odonata at 502593 | 1st iNat record in the Fells | Only 4 iNat records in the Greater Boston area and beyond.
25963103
Hentz's Tiger Beetle (Cicindela rufiventris ssp. Hentzii) – a beetle
EN Conservation Status: imperiled (N2N3) in the United States (NatureServe) | Only a few iNat records in the Greater Boston area and beyond.
30998554 14389092
Zethus spinipes – a wasp 1st iNat record in the Fells | Only 3 iNat records in the Greater Boston area and beyond.
33558716 32437872
Porodisculus pendulus – a fungus 1st iNat record in the Fells | Only 3 iNat records in the Greater Boston area and beyond.
26877380
Cerceris insolita – a wasp 1st iNat record in the Fells | Only 4 iNat records in the Greater Boston area and beyond.
32071003
Marsh Wren (Cistothorus palustris) – a bird
EN Conservation Status: imperiled (S2S3B) in Massachusetts, US (NatureServe)
28347351
Tricholoma caligatum – a fungus 1st iNat record in the Fells. Only iNat record in the Greater Boston area and beyond.
17396084
Canadian Wood Betony (Pedicularis canadensis) – a plant
1st iNat record in the Fells | Only 5 iNat records in the Greater Boston area and beyond.
25410280
Canadian Potter Wasp (Symmorphus canadensis) – a wasp
1st iNat record in the Greater Boston area and beyond.
33283476
Ancistrocerus campestris – a wasp Only 2 iNat records in the Greater Boston area. 33750814 33109143
2020 EwA Biodiversity & Phenology Report (26) Copyright © 2017-2020 Earthwise Aware Inc. All Rights Reserved.
Catskill Potter Wasp (Ancistrocerus catskill) – a wasp
Only iNat record in the Greater Boston area. 32069810
Bobcat (*) (Lynx rufus) – a small cat Only iNat record in the area. 36829030
This list includes only confirmed Massachusetts iNaturalist sightings (as of 12/21/19). Thanks to Daniel Onea, Joe MacIndewar, Bill MacIndewar, Mike McGlathery and Claire O’Neill for spotting and recording those special observations | (*) The bobcat identification is currently being challenged. All biodiversity records are also contributing to local guides that our citizen scientists are working on.
We are in the process of developing a series of guides of common species per location. Here’s the
current list of EwA guides for the Fells:
🌱 EwA Guide to the Plants of the Fells
🦆 EwA Guide to the Birds of the Fells
🐿 EwA Guide to the Mammals of the Fells
🐞 EwA Guide to the Insects & Spiders of the Fells
🐍 EwA Guide to the Reptiles & Amphibians of the Fells
🍄 EwA Guide to the Fungi and Lichens of the Fells
⛔ EwA Guide to the Invasive Species of the Fells
⚠ EwA Guide to the Endangered Species of the Fells
We also intend to develop similar guides for Fresh Pond, Habitat and the Growing Center, or leverage
tools good enough that achieve the same.
At this time, we are also evaluating the functionality of iNaturalist place-specific species checklists
which might fulfill our needs and free some of our resources.
● Fells Checklist
● Fresh Pond Checklist
● Growing Center Checklist
● Habitat Checklist
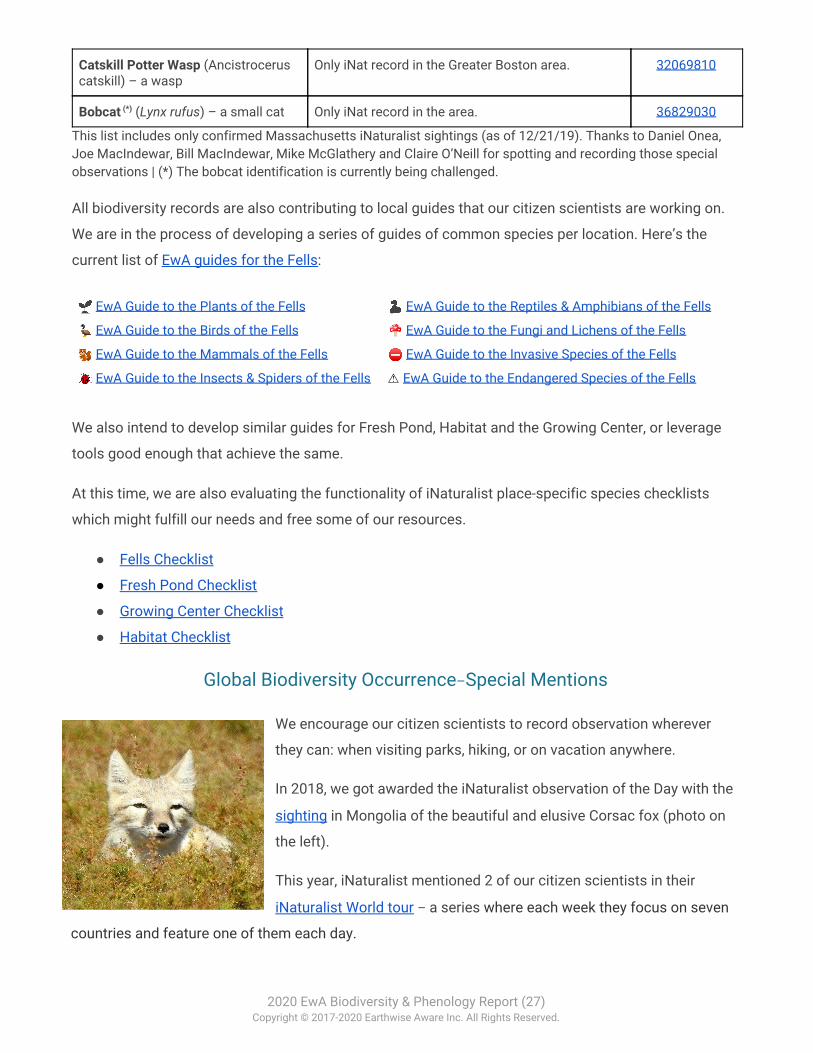
Global Biodiversity Occurrence–Special Mentions
We encourage our citizen scientists to record observation wherever
they can: when visiting parks, hiking, or on vacation anywhere.
In 2018, we got awarded the iNaturalist observation of the Day with the
sighting in Mongolia of the beautiful and elusive Corsac fox (photo on
the left).
This year, iNaturalist mentioned 2 of our citizen scientists in their
iNaturalist World tour – a series where each week they focus on seven
countries and feature one of them each day.
2020 EwA Biodiversity & Phenology Report (27) Copyright © 2017-2020 Earthwise Aware Inc. All Rights Reserved.
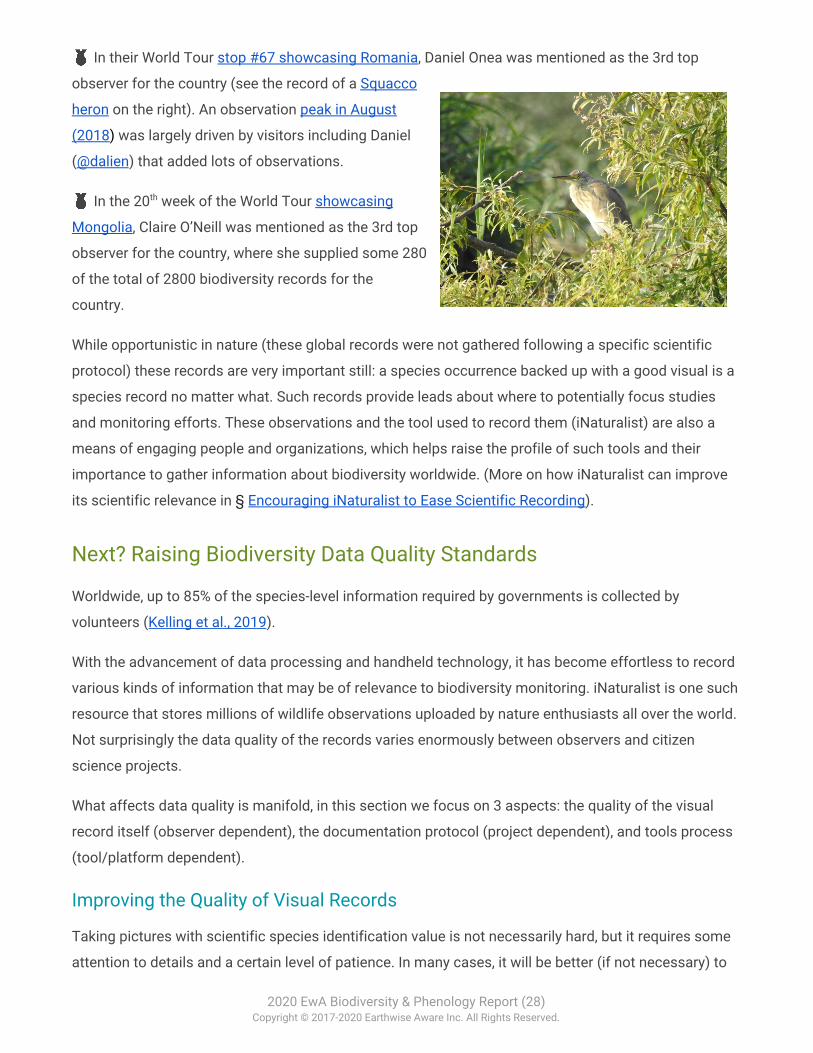
🥇 In their World Tour stop #67 showcasing Romania, Daniel Onea was mentioned as the 3rd top
observer for the country (see the record of a Squacco
heron on the right). An observation peak in August
(2018) was largely driven by visitors including Daniel
(@dalien) that added lots of observations.
🥇 In the 20th week of the World Tour showcasing
Mongolia, Claire O’Neill was mentioned as the 3rd top
observer for the country, where she supplied some 280
of the total of 2800 biodiversity records for the
country.
While opportunistic in nature (these global records were not gathered following a specific scientific
protocol) these records are very important still: a species occurrence backed up with a good visual is a
species record no matter what. Such records provide leads about where to potentially focus studies
and monitoring efforts. These observations and the tool used to record them (iNaturalist) are also a
means of engaging people and organizations, which helps raise the profile of such tools and their
importance to gather information about biodiversity worldwide. (More on how iNaturalist can improve
its scientific relevance in § Encouraging iNaturalist to Ease Scientific Recording).
Next? Raising Biodiversity Data Quality Standards
Worldwide, up to 85% of the species-level information required by governments is collected by
volunteers (Kelling et al., 2019).
With the advancement of data processing and handheld technology, it has become effortless to record
various kinds of information that may be of relevance to biodiversity monitoring. iNaturalist is one such
resource that stores millions of wildlife observations uploaded by nature enthusiasts all over the world.
Not surprisingly the data quality of the records varies enormously between observers and citizen
science projects.
What affects data quality is manifold, in this section we focus on 3 aspects: the quality of the visual
record itself (observer dependent), the documentation protocol (project dependent), and tools process
(tool/platform dependent).
Improving the Quality of Visual Records
Taking pictures with scientific species identification value is not necessarily hard, but it requires some
attention to details and a certain level of patience. In many cases, it will be better (if not necessary) to
2020 EwA Biodiversity & Phenology Report (28) Copyright © 2017-2020 Earthwise Aware Inc. All Rights Reserved.
record a set of pictures to catch different angles. This will ease the identification process which may
rely on particular traits depending on the species.
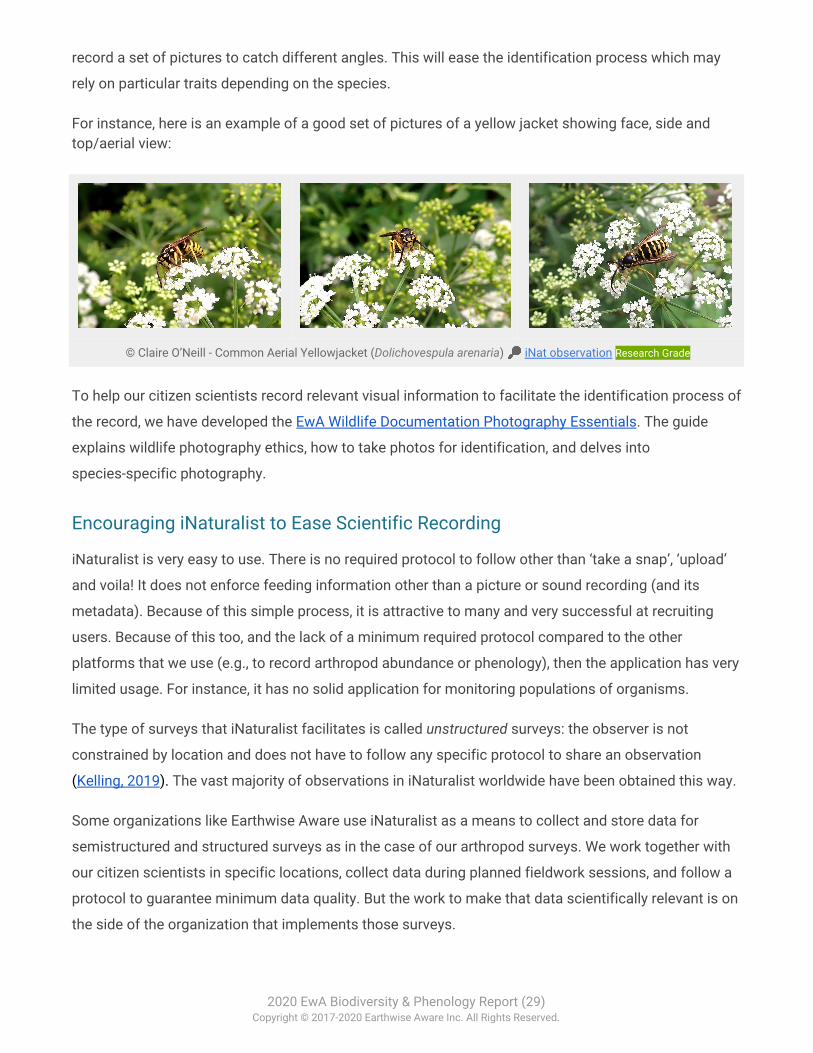
For instance, here is an example of a good set of pictures of a yellow jacket showing face, side and top/aerial view:
© Claire O’Neill - Common Aerial Yellowjacket (Dolichovespula arenaria) 🔎 iNat observation Research Grade
To help our citizen scientists record relevant visual information to facilitate the identification process of
the record, we have developed the EwA Wildlife Documentation Photography Essentials. The guide
explains wildlife photography ethics, how to take photos for identification, and delves into
species-specific photography.
Encouraging iNaturalist to Ease Scientific Recording
iNaturalist is very easy to use. There is no required protocol to follow other than ‘take a snap’, ‘upload’
and voila! It does not enforce feeding information other than a picture or sound recording (and its
metadata). Because of this simple process, it is attractive to many and very successful at recruiting
users. Because of this too, and the lack of a minimum required protocol compared to the other
platforms that we use (e.g., to record arthropod abundance or phenology), then the application has very
limited usage. For instance, it has no solid application for monitoring populations of organisms.
The type of surveys that iNaturalist facilitates is called unstructured surveys: the observer is not
constrained by location and does not have to follow any specific protocol to share an observation
(Kelling, 2019). The vast majority of observations in iNaturalist worldwide have been obtained this way.
Some organizations like Earthwise Aware use iNaturalist as a means to collect and store data for
semistructured and structured surveys as in the case of our arthropod surveys. We work together with
our citizen scientists in specific locations, collect data during planned fieldwork sessions, and follow a
protocol to guarantee minimum data quality. But the work to make that data scientifically relevant is on
the side of the organization that implements those surveys.
2020 EwA Biodiversity & Phenology Report (29) Copyright © 2017-2020 Earthwise Aware Inc. All Rights Reserved.
On the iNaturalist end, to be more scientifically relevant would require that its tool include the recording
of information that accounts for variation and bias in the data collection as part of the recording
process. There is an iNaturalist community of observers and we will seek the support of that
community (and our peers within it) to encourage iNaturalist in this direction.
Strengthening EwA Species Occurrence (iNat) Documentation Protocol
Despite the current limitations of iNaturalist such as the lack of a default mechanism (or mode) to
require specific survey information (for scientific application), we think that it is a good global platform
with great potentials.
The platform is relatively new (a decade old) and progress happens very rapidly in the domain of big
and open data. We also have heard that improving science relevance of the platform is of interest to
iNaturalist.
Until that happens, we can do some things to improve record documentation from our end as well. We
plan, for instance, to establish a list of observation related fields for our citizen scientists to fill when
bulk-uploading field session records.
Example of such fields include:
● Effort: duration of the survey.
● Number of observers.
● Type of survey: incidental vs. opportunistic vs. area or transect search.
● Weather, temperature and wind speed.
● Count of individuals for that species observation if not recorded in another observation.
● Disturbance factor: recording ‘foot and paw’ traffic that may be affecting the survey.
● Associated with: e.g., plant association for birds, arthropods, etc.
● Associated with (interaction): for capturing direct species interactions, etc.
Although it cannot be reinforced on data entry, quality-wise it is still a step in the right direction.
We will pilot the use of this list looking for a set of observation fields that increases data quality while
not adding too much extra recording time for our citizen scientists. We will then formalize and share
our protocol.
2020 EwA Biodiversity & Phenology Report (30) Copyright © 2017-2020 Earthwise Aware Inc. All Rights Reserved.
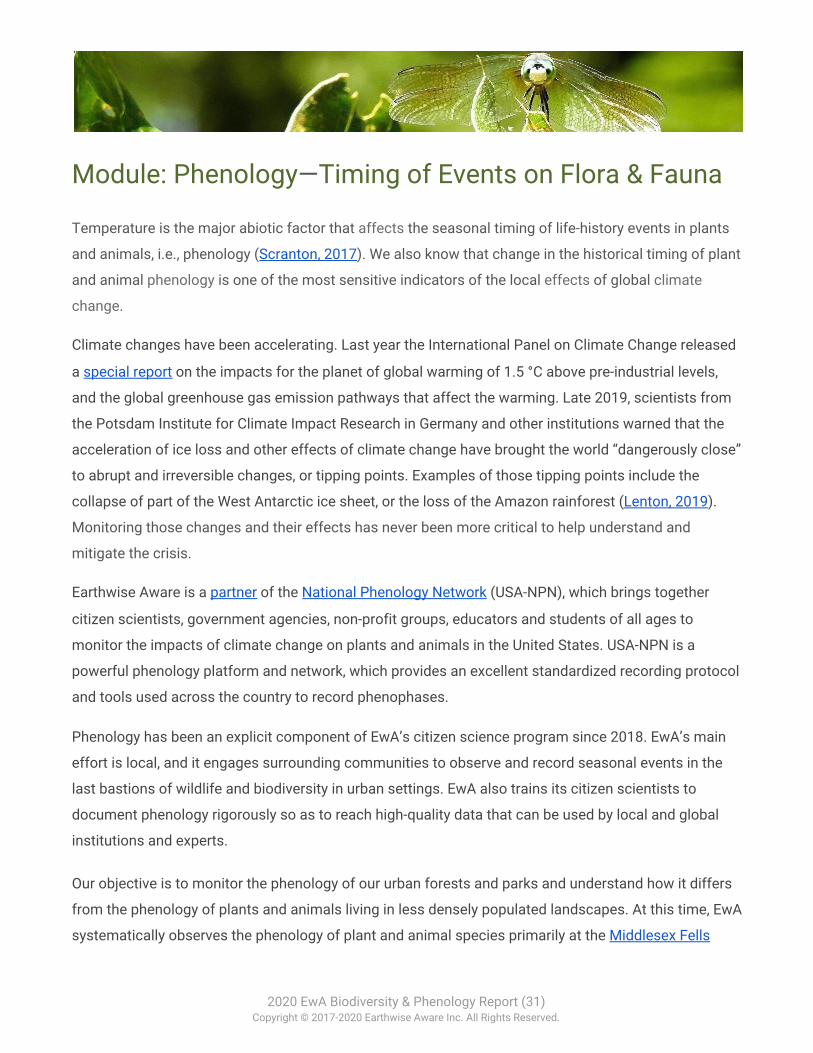
Module: Phenology—Timing of Events on Flora & Fauna
Temperature is the major abiotic factor that affects the seasonal timing of life-history events in plants
and animals, i.e., phenology (Scranton, 2017). We also know that change in the historical timing of plant
and animal phenology is one of the most sensitive indicators of the local effects of global climate
change.
Climate changes have been accelerating. Last year the International Panel on Climate Change released
a special report on the impacts for the planet of global warming of 1.5 °C above pre-industrial levels,
and the global greenhouse gas emission pathways that affect the warming. Late 2019, scientists from
the Potsdam Institute for Climate Impact Research in Germany and other institutions warned that the
acceleration of ice loss and other effects of climate change have brought the world “dangerously close”
to abrupt and irreversible changes, or tipping points. Examples of those tipping points include the
collapse of part of the West Antarctic ice sheet, or the loss of the Amazon rainforest (Lenton, 2019).
Monitoring those changes and their effects has never been more critical to help understand and
mitigate the crisis.
Earthwise Aware is a partner of the National Phenology Network (USA-NPN), which brings together
citizen scientists, government agencies, non-profit groups, educators and students of all ages to
monitor the impacts of climate change on plants and animals in the United States. USA-NPN is a
powerful phenology platform and network, which provides an excellent standardized recording protocol
and tools used across the country to record phenophases.
Phenology has been an explicit component of EwA’s citizen science program since 2018. EwA’s main
effort is local, and it engages surrounding communities to observe and record seasonal events in the
last bastions of wildlife and biodiversity in urban settings. EwA also trains its citizen scientists to
document phenology rigorously so as to reach high-quality data that can be used by local and global
institutions and experts.
Our objective is to monitor the phenology of our urban forests and parks and understand how it differs
from the phenology of plants and animals living in less densely populated landscapes. At this time, EwA
systematically observes the phenology of plant and animal species primarily at the Middlesex Fells
2020 EwA Biodiversity & Phenology Report (31) Copyright © 2017-2020 Earthwise Aware Inc. All Rights Reserved.
where it has the support of our partner, The Friends of the Fells, a steward of the reservation. We intend
to add the study of phenology at all EwA’s other sites.
We also have an auxiliary urban study site (in Somerville, MA), where we track seasonal events and
calibrate our studies.
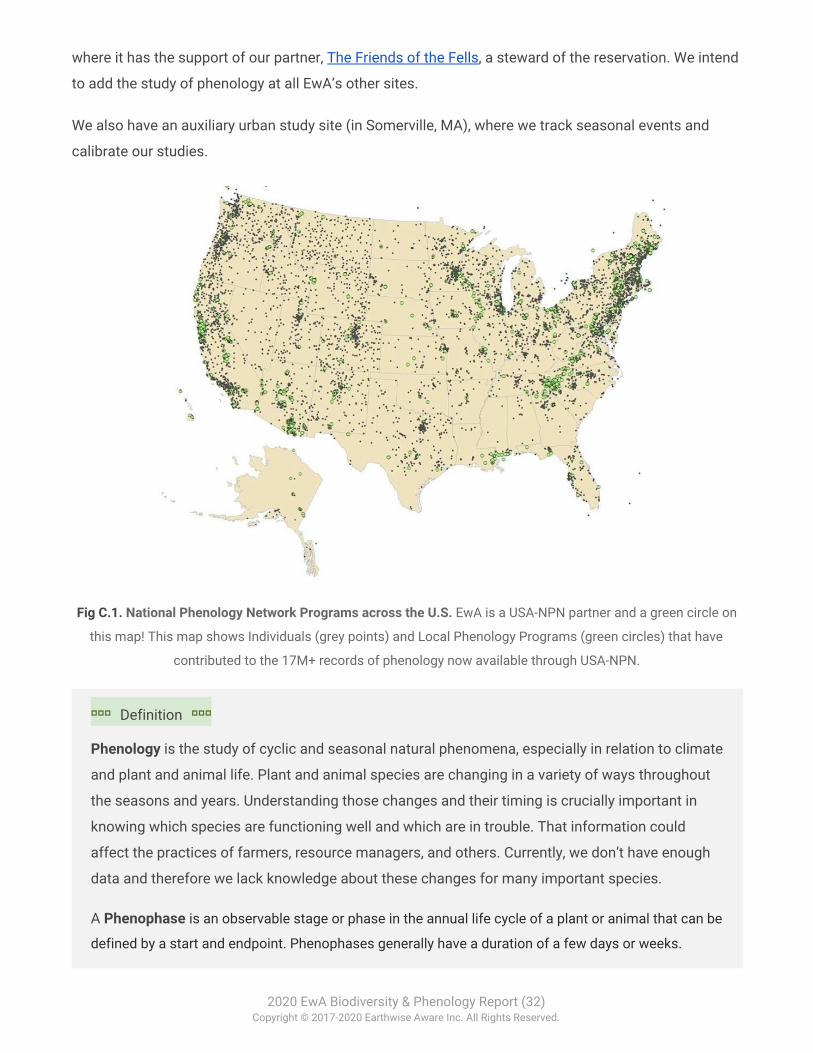
Fig C.1. National Phenology Network Programs across the U.S. EwA is a USA-NPN partner and a green circle on
this map! This map shows Individuals (grey points) and Local Phenology Programs (green circles) that have
contributed to the 17M+ records of phenology now available through USA-NPN.
⬞⬞⬞ Definition ⬞⬞⬞
Phenology is the study of cyclic and seasonal natural phenomena, especially in relation to climate
and plant and animal life. Plant and animal species are changing in a variety of ways throughout
the seasons and years. Understanding those changes and their timing is crucially important in
knowing which species are functioning well and which are in trouble. That information could
affect the practices of farmers, resource managers, and others. Currently, we don’t have enough
data and therefore we lack knowledge about these changes for many important species.
A Phenophase is an observable stage or phase in the annual life cycle of a plant or animal that can be
defined by a start and endpoint. Phenophases generally have a duration of a few days or weeks.
2020 EwA Biodiversity & Phenology Report (32) Copyright © 2017-2020 Earthwise Aware Inc. All Rights Reserved.

Examples include the period over which newly emerging leaves are visible or the period over which
open flowers are present on a plant. (USA-NPN definition)
Tracking the Most Sensitive Indicators of Climate Change Effects
Climate scientists have found that change in the historical timing of plant and animal phenology is one
of the most sensitive indicators of the local effects of global climate change.
⬞⬞⬞ The Importance of Phenology ⬞⬞⬞ Source: Why Phenology? (USA-NPN)
Phenology is a key component of life on earth. Many birds time their nesting so that eggs hatch
when insects are available to feed nestlings. Likewise, insect emergence is often synchronized with
leaf out in host plants. For people, earlier flowering means earlier allergies. Farmers and gardeners
need to know the schedule of plant and insect development to decide when to apply fertilizers and
pesticides and when to plant to avoid frosts. Phenology influences the abundance and distribution
of organisms, ecosystem services, food webs, and global cycles of water and carbon. In turn,
phenology may be altered by changes in temperature and precipitation.
Changes in phenological events like flowering and animal migration are among the most sensitive
biological responses to climate change. Across the world, many springtime events are occurring
earlier—and fall events happening later—than they did in the past. However, not all species are
changing at the same rate or direction, leading to mismatches. How plants and animals respond
can help us predict whether their populations will grow or shrink –making phenology a “leading
indicator” of climate change impacts.
Critical Applications of Phenology Include:
● Management of invasive species and forest pests
● Predictions of human health-related events, such as allergies and mosquito season
● Optimization of when to plant, fertilize, and harvest crops
● Understanding the timing of ecosystem processes, such as carbon cycling
● Assessment of the vulnerability of species, populations, and ecological communities to
ongoing climate change
The USA-NPN was established in part to assemble long-term phenology datasets for a broad array
of species across the United States. Scientists use observational data in the National Phenology
2020 EwA Biodiversity & Phenology Report (33) Copyright © 2017-2020 Earthwise Aware Inc. All Rights Reserved.
Database and models, such as the Spring Indices, to understand how responsive species and
phenological phases are to changes in climate across time and space. This information can be
used to determine the extent to which species, populations, and communities are vulnerable to
ongoing and projected future changes in climate.
Ⓘ Learn more about phenological research > explore USA-NPN’s highlighted peer-reviewed publications
Year Objectives
EwA 2019 objectives included both establishing and refining procedures. Many of these goals were
procedural methods for establishing a field site. These goals were:
● Consolidate our phenology sites.
● Recruitment. Recruit site-focused citizen scientists and interns.
● Data collection. Complete a full year of monitoring (2018 was a pilot year that we started at the
end of spring and therefore did not cover a full cycle).
● Data maintenance. Work on data validation and cleanup earlier in the process.
● Data quality. Increase data quality throughout the year by improving phenophase identification.
Start working at species-specific phenophase sheets to help our citizen scientists in the field.
● Protocol refinement. Start adding new specimens of species that we already monitor to
account for variations within our own records.
● Protocol iteration. Refine our protocol and its methods, start working at an online help.
● Impact statement and Local Phenology Leader year report. USA-NPN-specific annual
deliverables.
Field Methods
Throughout the year record the phenology of the monitored species at regular intervals:
● Monthly throughout the winter.
● Weekly in the active seasons (spring and fall).
● Every other week otherwise.
Our main phenology sites are at the Fells at this time.
To collect data, we apply the standardized phenology monitoring methods as established by USA-NPN
(Denny, 2014). Its phenology protocol provides scientifically-vetted observation guidelines, developed
for over 1000 species, to ensure data quality, relevance and usage.
2020 EwA Biodiversity & Phenology Report (34) Copyright © 2017-2020 Earthwise Aware Inc. All Rights Reserved.
Data collections happen in teams as much as possible so as to increase data quality through
collaborative fieldwork sessions, and observations are recorded on the open-access USA-NPN Nature’s
Notebook recording platform.
We provide a description of our sites (and its targeted species), of our data collection methods and
data visualization tools to our citizen scientists. We plan to have a final version of our field protocol
online in 2020.
Results
We reached our 2019 goals. 🥇 We surpassed our goals by having one of our
leaders earn a Local Phenology Leader Certification from USA-NPN. A future
EwA goal is to foster (and fund) other EwA leaders to acquire such certification.
At the Fells, we cover 4 sites: 2 sites around Long Pond (Winchester) [GPS] and 2
sites close to Bellevue Pond (Medford) [GPS]. We also have a few pilot sites in
other locations of the Fells. We have one calibration site in Somerville, a site which we use to guide the
scheduling of our field sessions.
We record the phenology of 49 specimens of 21 plant species, which are mostly deciduous trees, a few
shrubs, and forbs. We also record one species of arthropods in the context of the USA-NPN Eastern
Tent Caterpillar Pest Control Campaign, whose data is used to monitor and study the effect of the tent
caterpillar invasion (Bradley, 2019). This year, we also piloted the recording of the phenology of 23
species of birds that we intend to add formally to our Fells study in 2020.
Some of the species we follow are typical, well-studied species, and used to calibrate studies for the
region. Others are rare for the location or special, as in the case of the fairly mature American Chestnut,
whose species is functionally extinct. The full list of the species of plants and animals that we monitor
is accessible per EwA site on Nature’s Notebook.
Through the course of the year, we gathered baseline data and rapidly improved the quality of our
records. We focus this phenology progress report on the plant phenology.
Note that our first few years cannot show relevant site-specific phenology trends yet, as it takes a few
years to build those. However, our data is aggregated with other USA-NPN partners operating in the
same region, such as the Arnold Arboretum Tree Spotter program. When aggregated, our data
contributes to phenology data that can be and is used by the science organizations using the USA-NPN
data.
2020 EwA Biodiversity & Phenology Report (35) Copyright © 2017-2020 Earthwise Aware Inc. All Rights Reserved.
Hereafter is a visual summary of our first-year findings.
Phenology Monitoring Activities & Phenophase Observation Quantity
Our Fells sites are easy to access and located within 10 minutes of hiking from a nearby parking lot. We
go in the field as teams, and depending on the experience level in the team, we might split into 2 groups
to cover our sites more efficiently. Note that during phenology sessions, we also record biodiversity
occurrence and arthropod abundance, which supply data to EwA’s other studies (also detailed in this
report).
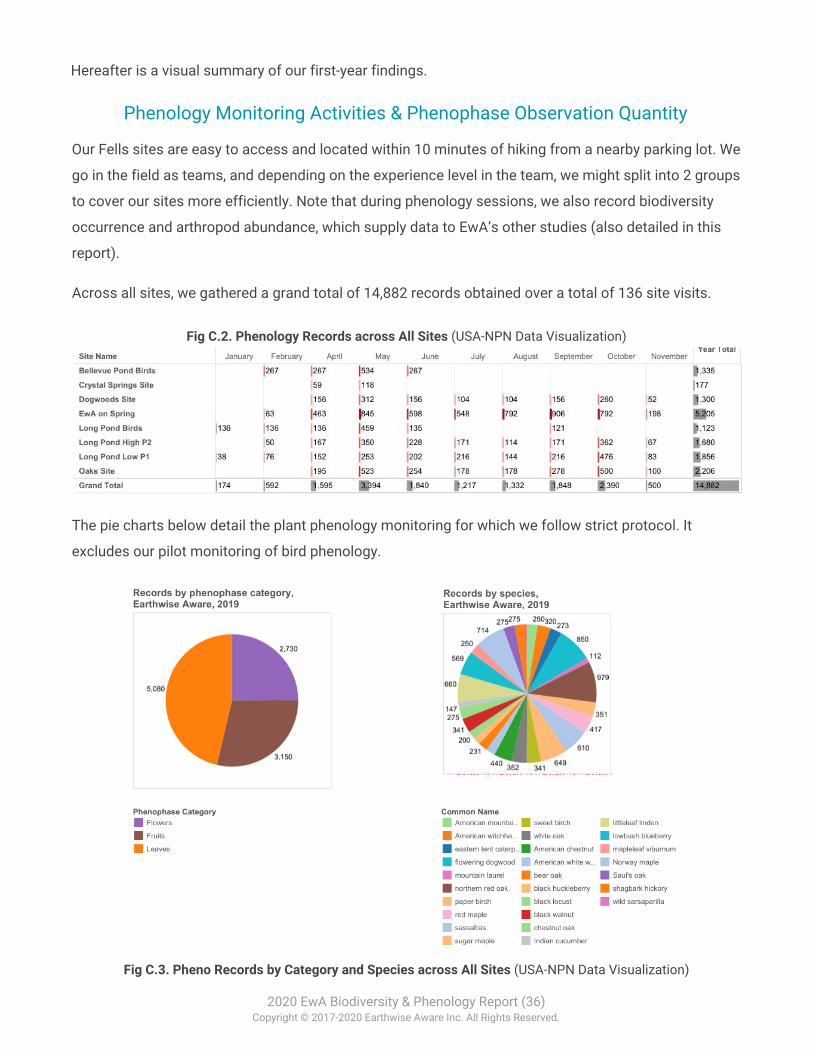
Across all sites, we gathered a grand total of 14,882 records obtained over a total of 136 site visits.
Fig C.2. Phenology Records across All Sites (USA-NPN Data Visualization)
The pie charts below detail the plant phenology monitoring for which we follow strict protocol. It
excludes our pilot monitoring of bird phenology.
Fig C.3. Pheno Records by Category and Species across All Sites (USA-NPN Data Visualization)
2020 EwA Biodiversity & Phenology Report (36) Copyright © 2017-2020 Earthwise Aware Inc. All Rights Reserved.
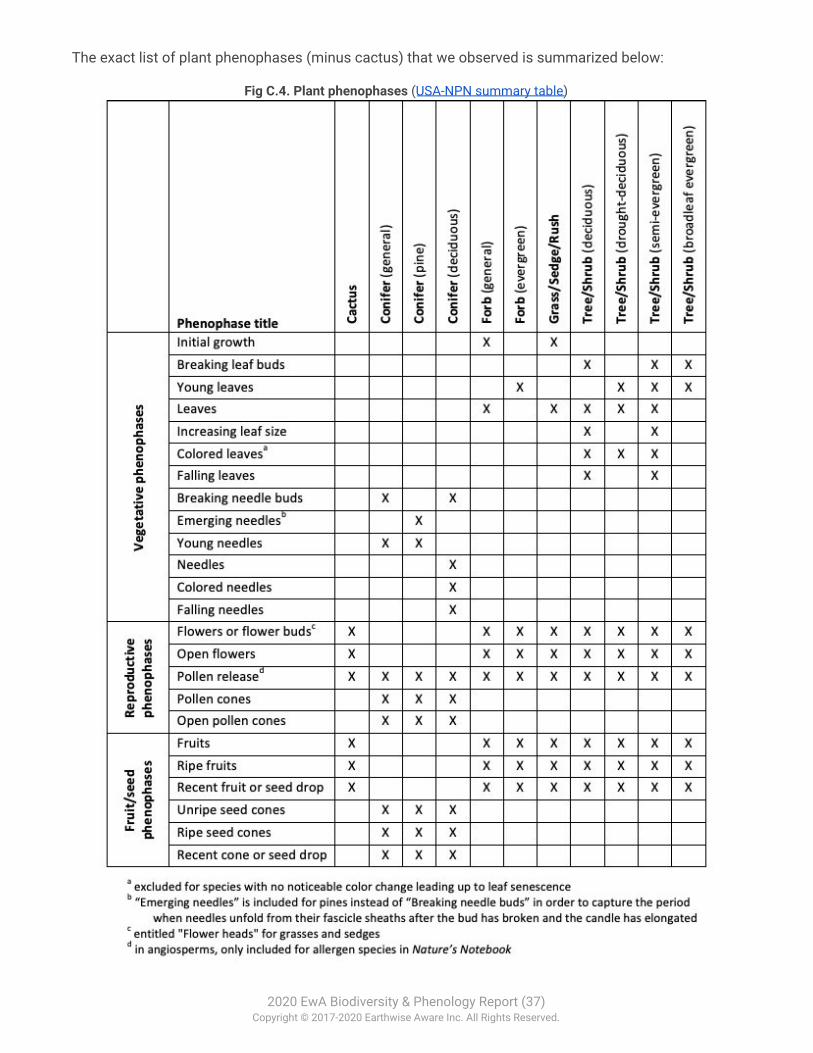
The exact list of plant phenophases (minus cactus) that we observed is summarized below:
Fig C.4. Plant phenophases (USA-NPN summary table)
2020 EwA Biodiversity & Phenology Report (37) Copyright © 2017-2020 Earthwise Aware Inc. All Rights Reserved.
The exact definition of the phenophases for each of the monitored species is conveniently accessible
to observers directly from Nature’s Notebook recording app.
EwA Plant Phenology Data Summary
The intent of this report phenology module is not to detail all the 2019 records, but to highlight
progress. Next year, we will have accumulated enough data to start elaborating and comparing records
between our own sites and local partner sites, as well as across the region.
EwA 2019 data is fully accessible on the USA-NPN visualization portal focused on EwA data.
From there one can:
❏ Access the EwA phenology calendar.
❏ Visualize annual patterns of the timing and magnitude of phenological activity, based on the
proportion of “yes” records, animal abundances per hour and other metrics.
❏ Visualize plots of geographic or climatic variables against estimated onset date for individual
plants or animal species.
❏ Compare against USA-NPN phenology maps, including Accumulated Growing Degree Days
(important indicator as spring phenophases, for instance, happen when enough warmth has
accumulated) and Spring Index models (mathematical models which predict the start of spring).
This year was dedicated to completing a first full year of phenophase recording to establish site
baselines.
First, we wanted to understand the phenological calendar and activity patterns of our sites and
compare them with those of the Arnold Arboretum Tree Spotter program, another local and established
USA-NPN partner who has larger data sets as the result of running a plant phenology program for a few
years already. This comparison is important for identifying phenological differences between our sites
and more importantly to understand the potential source for those differences (EwA data quality, urban
conditions, etc.)
There are few differences to acknowledge between the 2 programs. The locations and characteristics
of the sites are distinct in that:
● The Arboretum is located in a densely urban area. Its trees are actively nurtured. The Arboretum
phenology routes are easy to access.
● In comparison, most of our citizen scientists have to drive to EwA’s study location then hike a
little before reaching the sites. The trees have a rougher life (e.g., they are in a setting where
visitors' behavior is difficult to monitor).
2020 EwA Biodiversity & Phenology Report (38) Copyright © 2017-2020 Earthwise Aware Inc. All Rights Reserved.
Additionally, the Tree Spotter (TS) program has a few more years of practice and data. The spotters
likely record most of the phenophases as individuals (rather than in scheduled group sessions). In
comparison, EwA phenology program is a year and a half old. EwA citizen scientists are still learning
and they operate in groups (this increases learning pace and data quality). Finally, to ensure that a
minimum of data is recorded at regular time intervals, the EwA recording events are scheduled. Very
few citizen scientists go on their own yet.
EwA does not monitor the same tree species as the Arboretum does, but we identified 2 species
common to both programs: the Red maple and the American witch-hazel.
The Red maple (Acer rubrum) is a common American tree species of Forest edges, forests, woodlands,
meadows and fields, shores of rivers or lakes, swamps, and wetland margins. It is is one of the most
widely distributed trees in eastern North America. It is also a well-monitored tree nationally, and since
good datasets exist, it is a ‘good’ tree to have on a monitoring site as a calibration species. It is also a
genuinely interesting tree to monitor, as its range is shifting North with climate change. Red maple is
one of the first trees to flower in early spring. Specific flowering dates are largely dependent on weather
conditions, latitude, and elevation. Flowers generally appear several weeks before vegetative buds. Bud
break may be affected by soil factors. Fruit matures in spring before leaf development is complete.
The American witch-hazel (Hamamelis virginiana) is a small, spreading tree or shrub found on a variety
of sites but is most abundant in woods containing a moderate amount of moisture. The species occurs
throughout the northeastern and southeastern United States. The flowers of American witch-hazel open
in September and October and the fruit ripens the next fall. Shortly after ripening, the capsules burst
open, discharging their seed.
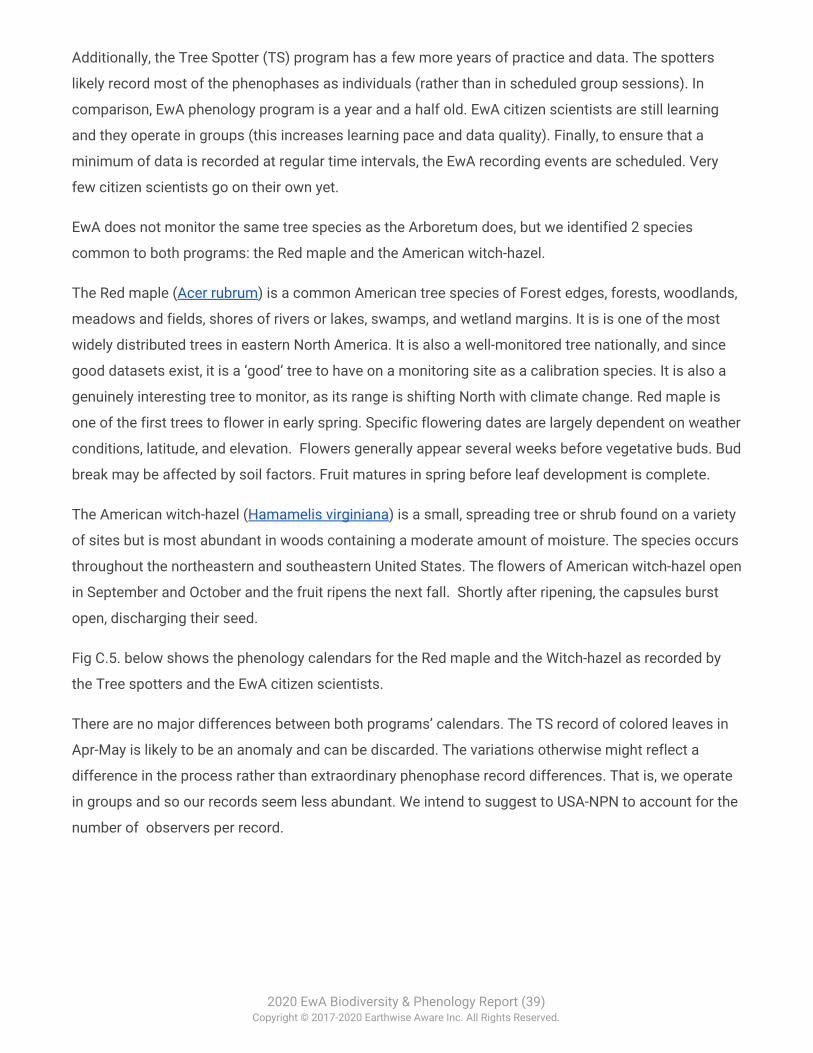
Fig C.5. below shows the phenology calendars for the Red maple and the Witch-hazel as recorded by
the Tree spotters and the EwA citizen scientists.
There are no major differences between both programs’ calendars. The TS record of colored leaves in
Apr-May is likely to be an anomaly and can be discarded. The variations otherwise might reflect a
difference in the process rather than extraordinary phenophase record differences. That is, we operate
in groups and so our records seem less abundant. We intend to suggest to USA-NPN to account for the
number of observers per record.
2020 EwA Biodiversity & Phenology Report (39) Copyright © 2017-2020 Earthwise Aware Inc. All Rights Reserved.
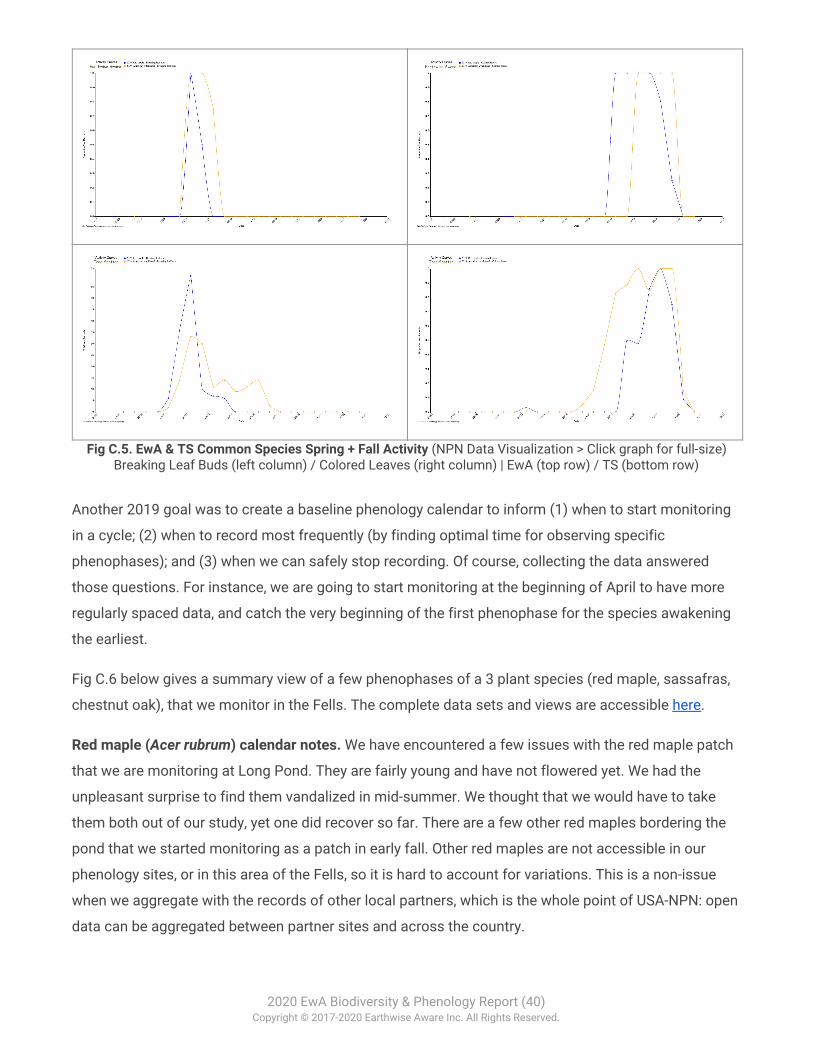
Fig C.5. EwA & TS Common Species Spring + Fall Activity (NPN Data Visualization > Click graph for full-size) Breaking Leaf Buds (left column) / Colored Leaves (right column) | EwA (top row) / TS (bottom row)
Another 2019 goal was to create a baseline phenology calendar to inform (1) when to start monitoring
in a cycle; (2) when to record most frequently (by finding optimal time for observing specific
phenophases); and (3) when we can safely stop recording. Of course, collecting the data answered
those questions. For instance, we are going to start monitoring at the beginning of April to have more
regularly spaced data, and catch the very beginning of the first phenophase for the species awakening
the earliest.
Fig C.6 below gives a summary view of a few phenophases of a 3 plant species (red maple, sassafras,
chestnut oak), that we monitor in the Fells. The complete data sets and views are accessible here.
Red maple (Acer rubrum) calendar notes. We have encountered a few issues with the red maple patch
that we are monitoring at Long Pond. They are fairly young and have not flowered yet. We had the
unpleasant surprise to find them vandalized in mid-summer. We thought that we would have to take
them both out of our study, yet one did recover so far. There are a few other red maples bordering the
pond that we started monitoring as a patch in early fall. Other red maples are not accessible in our
phenology sites, or in this area of the Fells, so it is hard to account for variations. This is a non-issue
when we aggregate with the records of other local partners, which is the whole point of USA-NPN: open
data can be aggregated between partner sites and across the country.
2020 EwA Biodiversity & Phenology Report (40) Copyright © 2017-2020 Earthwise Aware Inc. All Rights Reserved.
Fig C.6. Fells’ Phenophases Calendar for Red maple, Sassafras and Chestnut oak Species (USA-NPN Data
Visualization > Click graph for full-size graph) | The graph illustrates annual timing of phenophase activity for the selected species/phenophase combinations. The horizontal bars represent phenological activity for 2019. The
colored bars represent the observed presence of the phenophase.
Sassafras (Sassafras albidum) calendar notes. Note the record of flowers for the Sassafras in
February. Depending upon latitude, sassafras flowers from March to May. This record is a data
collection error that we chose to not clean yet so that is why it is still showing in our data. We discuss
the importance of checking and cleaning data early in the process in the § Verify & Clean Project Data
Right Away.
Chestnut oak (Quercus montana) calendar notes. There is a good patch of chestnut oaks that we
monitor alongside a Saul's Oak (Quercus × saulii), which is a hybrid between the white oak and chestnut
oak. The chestnut oaks did not bear much fruit this year. We also want to note that monitoring fruit
drop is hard in the forest, because fruit is picked up by animals or can be hidden in the leaf litter.
For a detailed calendar of all the species that EwA monitors, go to the EwA-specific USA-NPN map,
click on the graph icon on the left panel, choose the Calendar option, and pick the year and species of
interest, then generate the graph.
Weather Data Summary
This is the first year that we collected data through a full cycle. So, we cannot compare the
phenophases with previous records. As we keep monitoring, we will soon start comparing across years.
2020 EwA Biodiversity & Phenology Report (41) Copyright © 2017-2020 Earthwise Aware Inc. All Rights Reserved.
This year, however, we can highlight what USA-NPN observed for our region. Our data is integrated in
the overall computation.
Heat Accumulation at Location
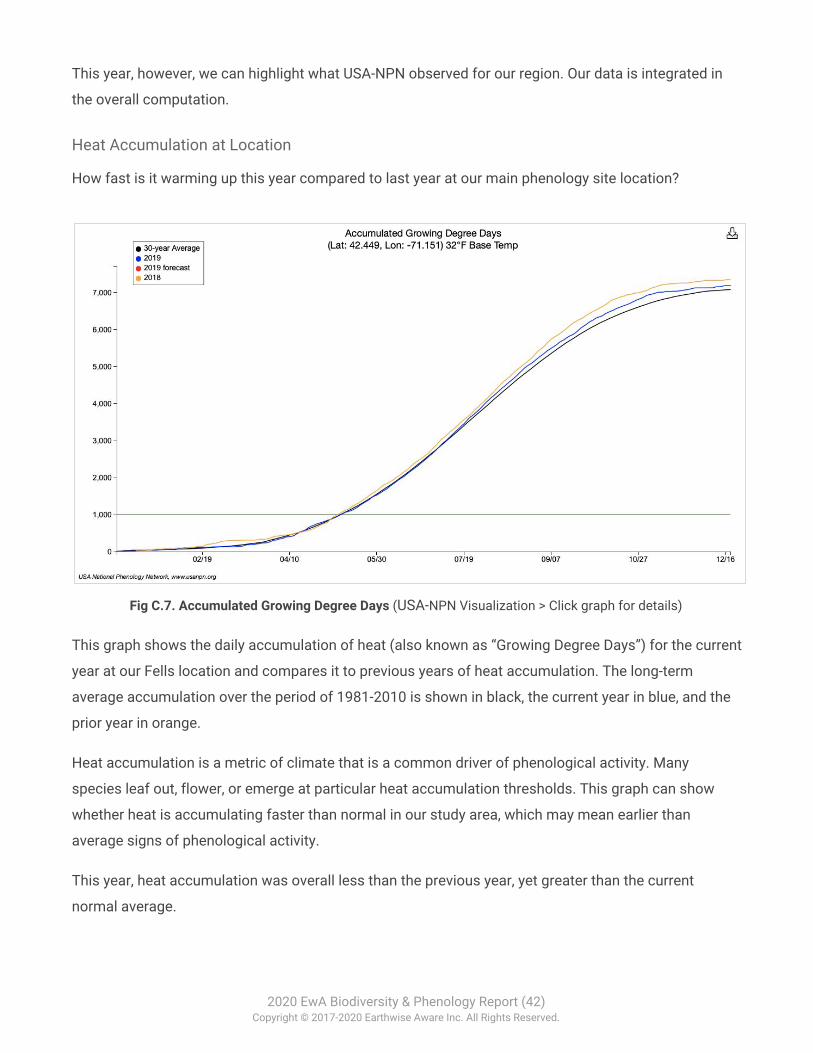
How fast is it warming up this year compared to last year at our main phenology site location?
Fig C.7. Accumulated Growing Degree Days (USA-NPN Visualization > Click graph for details)
This graph shows the daily accumulation of heat (also known as “Growing Degree Days”) for the current
year at our Fells location and compares it to previous years of heat accumulation. The long-term
average accumulation over the period of 1981-2010 is shown in black, the current year in blue, and the
prior year in orange.
Heat accumulation is a metric of climate that is a common driver of phenological activity. Many
species leaf out, flower, or emerge at particular heat accumulation thresholds. This graph can show
whether heat is accumulating faster than normal in our study area, which may mean earlier than
average signs of phenological activity.
This year, heat accumulation was overall less than the previous year, yet greater than the current
normal average.
2020 EwA Biodiversity & Phenology Report (42) Copyright © 2017-2020 Earthwise Aware Inc. All Rights Reserved.

This Spring Comparison to “Normal”
The USA-NPN map below shows their Spring Status analysis. We look at how the timing of spring
phenophases was affected, that is, how this spring compared to what would be considered an average
spring.
USA-NPN usually looks at Spring Indices to answer this.
Fig C.8. 2019 USA-NPN Spring Leaf Index Anomaly (Click on map for details)
The map shows where spring leaf-out arrived earlier or later this year compared to the long-term
average, based on the period from 1981-2010. The map is built upon an integrative model that predicts
the start of spring called the Spring Indices. Locations that are red are earlier than the average start of
spring leaf-out and locations that are blue are later than the average date. Early spring leaf-out may
result in a greater risk of frost damage to plants that begin leafing out or flowering before final winter
frost events.
NPN reports that spring leaf-out was 1-2 weeks late in parts of the Northeast. At our location this year, it does not appear that there were great differences, if any, compared to long term averages.
2020 EwA Biodiversity & Phenology Report (43) Copyright © 2017-2020 Earthwise Aware Inc. All Rights Reserved.
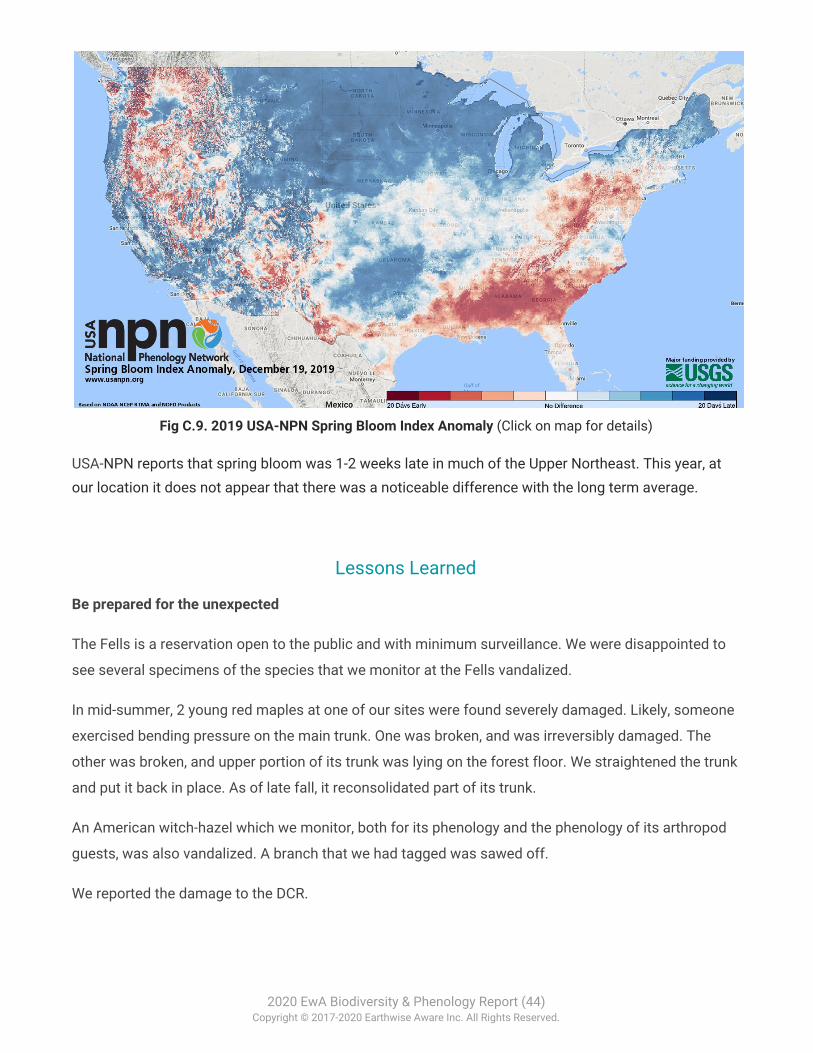
Fig C.9. 2019 USA-NPN Spring Bloom Index Anomaly (Click on map for details)
USA-NPN reports that spring bloom was 1-2 weeks late in much of the Upper Northeast. This year, at our location it does not appear that there was a noticeable difference with the long term average.
Lessons Learned
Be prepared for the unexpected
The Fells is a reservation open to the public and with minimum surveillance. We were disappointed to
see several specimens of the species that we monitor at the Fells vandalized.
In mid-summer, 2 young red maples at one of our sites were found severely damaged. Likely, someone
exercised bending pressure on the main trunk. One was broken, and was irreversibly damaged. The
other was broken, and upper portion of its trunk was lying on the forest floor. We straightened the trunk
and put it back in place. As of late fall, it reconsolidated part of its trunk.
An American witch-hazel which we monitor, both for its phenology and the phenology of its arthropod
guests, was also vandalized. A branch that we had tagged was sawed off.
We reported the damage to the DCR.
2020 EwA Biodiversity & Phenology Report (44) Copyright © 2017-2020 Earthwise Aware Inc. All Rights Reserved.
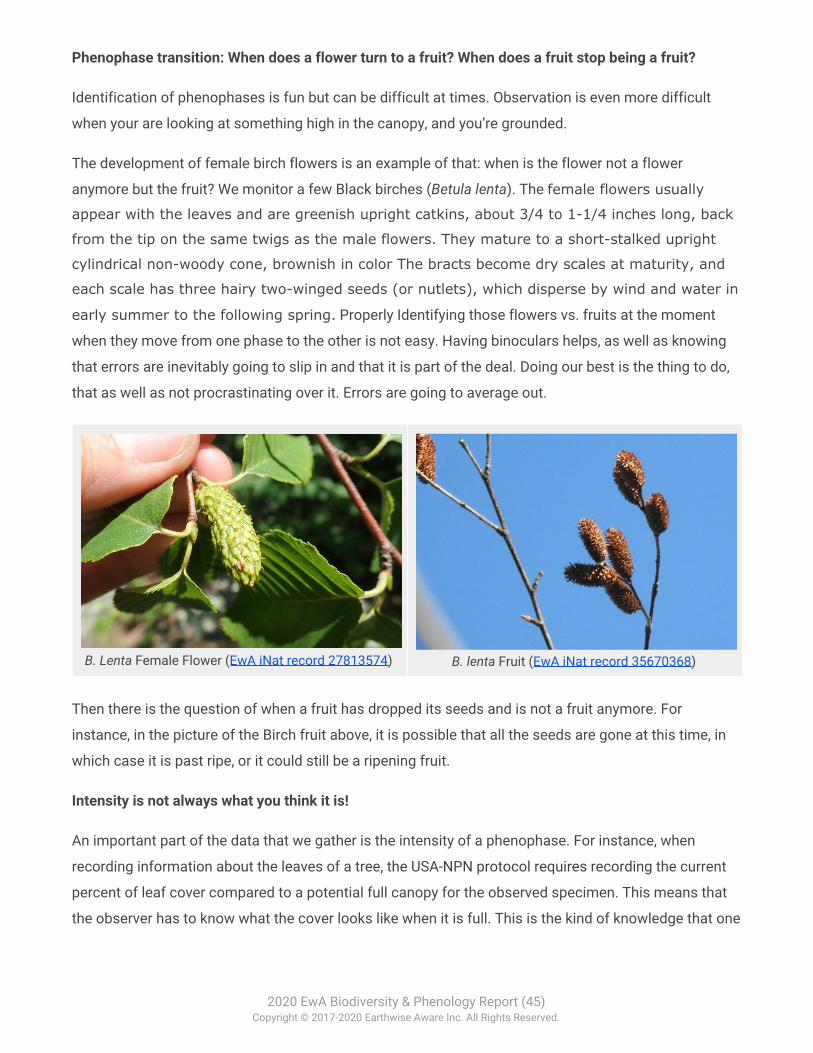
Phenophase transition: When does a flower turn to a fruit? When does a fruit stop being a fruit?
Identification of phenophases is fun but can be difficult at times. Observation is even more difficult
when your are looking at something high in the canopy, and you’re grounded.
The development of female birch flowers is an example of that: when is the flower not a flower
anymore but the fruit? We monitor a few Black birches (Betula lenta). The female flowers usually
appear with the leaves and are greenish upright catkins, about 3/4 to 1-1/4 inches long, back
from the tip on the same twigs as the male flowers. They mature to a short-stalked upright
cylindrical non-woody cone, brownish in color The bracts become dry scales at maturity, and
each scale has three hairy two-winged seeds (or nutlets), which disperse by wind and water in
early summer to the following spring. Properly Identifying those flowers vs. fruits at the moment
when they move from one phase to the other is not easy. Having binoculars helps, as well as knowing
that errors are inevitably going to slip in and that it is part of the deal. Doing our best is the thing to do,
that as well as not procrastinating over it. Errors are going to average out.
B. Lenta Female Flower (EwA iNat record 27813574)
B. lenta Fruit (EwA iNat record 35670368)
Then there is the question of when a fruit has dropped its seeds and is not a fruit anymore. For
instance, in the picture of the Birch fruit above, it is possible that all the seeds are gone at this time, in
which case it is past ripe, or it could still be a ripening fruit.
Intensity is not always what you think it is!
An important part of the data that we gather is the intensity of a phenophase. For instance, when
recording information about the leaves of a tree, the USA-NPN protocol requires recording the current
percent of leaf cover compared to a potential full canopy for the observed specimen. This means that
the observer has to know what the cover looks like when it is full. This is the kind of knowledge that one
2020 EwA Biodiversity & Phenology Report (45) Copyright © 2017-2020 Earthwise Aware Inc. All Rights Reserved.
gains after a full year of monitoring. This also means that the first year of monitoring is indeed a
calibration year.
How to determine the intensity of a phenophase is very important. It is easy to assume and to make
mistakes. We made such a mistake this year in identifying the intensity of the ‘colored leaves’
phenophase. We wrongly assumed that the intensity was referring to the percent of colored leaves
w.r.t. the remaining canopy. We were wrong: the protocol calls for judging the percent of colored leaves
w.r.t. a full canopy, even if at the moment of the observation the canopy was not full anymore. This
means that for the period of fall where the canopy was decreasing, we reported wrong intensities. We
caught this mistake late in the season and we could not go back to correct the data (we could not
remember what were the canopy size at time of surveys). This is a mistake that could have been
avoided if we had not ‘assumed’ its definition, but rather diligently looked at the intensity criteria as we
did for all other intensities. On the good side: we made that mistake on our first full cycle of recording,
and that is better than finding it 5 years down the road.
Next? Consolidate, Add, Pair & Communicate
This year, we also scouted out our sites for arthropod and avian residents or regulars. Next year, we will
include systematic monitoring of the presence and activities of a few species known to use the sites.
By doing so, we will be able to reveal activity patterns between species and inform our other citizen
science studies.
It is unclear whether other local USA-NPN partners currently monitor animal phenology. If not, we will
definitely encourage groups to join the effort.
We also realized that USA-NPN does not record the number of observers per survey. There is a
difference quality-wise between an individual record and a record by a group of observers. Most of our
records are group records. Other platforms such as eBird (for monitoring birds) have as part of their
protocol to record the number of observers who produce the record. We think it is an important data
point to reflect in the statistics, and we will encourage USA-NPN to include the recording of the number
of observers in their protocol.
We will develop our sites further and add species that we requested to be part of the USA-NPN species
database (and now granted). These species are the Nuphar variegata (Long Pond site), Clethra alnifolia
(Long Pond site) and Betula populifolia (Somerville calibration site).
We will update our site description and finalize (for publication) our phenology protocol.
2020 EwA Biodiversity & Phenology Report (46) Copyright © 2017-2020 Earthwise Aware Inc. All Rights Reserved.
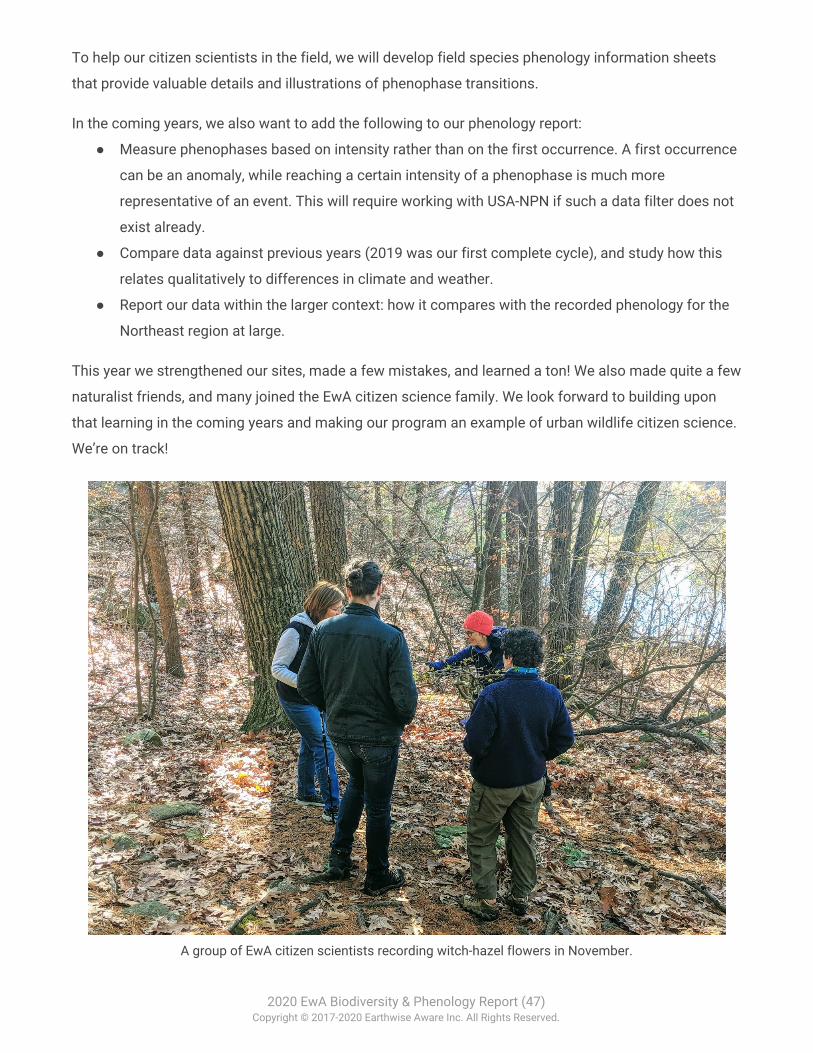
To help our citizen scientists in the field, we will develop field species phenology information sheets
that provide valuable details and illustrations of phenophase transitions.
In the coming years, we also want to add the following to our phenology report:
● Measure phenophases based on intensity rather than on the first occurrence. A first occurrence
can be an anomaly, while reaching a certain intensity of a phenophase is much more
representative of an event. This will require working with USA-NPN if such a data filter does not
exist already.
● Compare data against previous years (2019 was our first complete cycle), and study how this
relates qualitatively to differences in climate and weather.
● Report our data within the larger context: how it compares with the recorded phenology for the
Northeast region at large.
This year we strengthened our sites, made a few mistakes, and learned a ton! We also made quite a few
naturalist friends, and many joined the EwA citizen science family. We look forward to building upon
that learning in the coming years and making our program an example of urban wildlife citizen science.
We’re on track!
A group of EwA citizen scientists recording witch-hazel flowers in November.
2020 EwA Biodiversity & Phenology Report (47) Copyright © 2017-2020 Earthwise Aware Inc. All Rights Reserved.
Module: Terrestrial Arthropod Abundance & Composition
We now know arthropod populations (i.e., insects and relatives) are declining rapidly throughout the
world (Hance, 2019). Arthropods are a very poorly studied group of species. As a consequence, there
are abysmal data gaps preventing us from fully understanding the implications of that decline and how
to best act to stop it efficiently or react appropriately to the ecological changes it brings.
With this crisis in mind, this year EwA started the EwA Plant Visitor Survey –an urban wildlife study of
our terrestrial arthropods at 4 different urban locations. This effort directly helps local and global
entomologists.
Our primary goal is to gain scientific knowledge about the composition and abundance of terrestrial
arthropods and their interactions with urban landscapes. Ultimately, we want to contribute to a kind of
knowledge locally and globally that enables informed decisions and leads to better protection of
arthropod diversity and abundance.
The program has the support of the organizations with whom we partner and who are stewards of the
places where this program takes place: The Friends of the Fells (the Middlesex Fells Reservation), the
Cambridge Water Department (Fresh Pond Reservoir), Mass Audubon Habitat (Habitat Wildlife
Sanctuary), and the Somerville Community Growing Center. We are thankful for the help and support of
local entomologists Amy Mertl (Lesley Univ.) and Teá Kesting-Handly (UMass Boston).
⬞⬞⬞ Definitions ⬞⬞⬞
(Terrestrial) Arthropods (insects and their relatives, such as spiders, scorpions, and mites) are the
most successful and diverse form of multicellular life on Earth. They have unique roles in nature, and
are exceedingly important to the maintenance and functioning of healthy and productive ecosystems,
as phytophages, pollinators, parasites, predators, and detritivores.
Entomofauna. The insects of an environment or region
Species Composition (*). A list of the different organisms co-occurring at a particular place or in a
sample is the most fundamental characterization of a community. For example, a backyard might
2020 EwA Biodiversity & Phenology Report (48) Copyright © 2017-2020 Earthwise Aware Inc. All Rights Reserved.
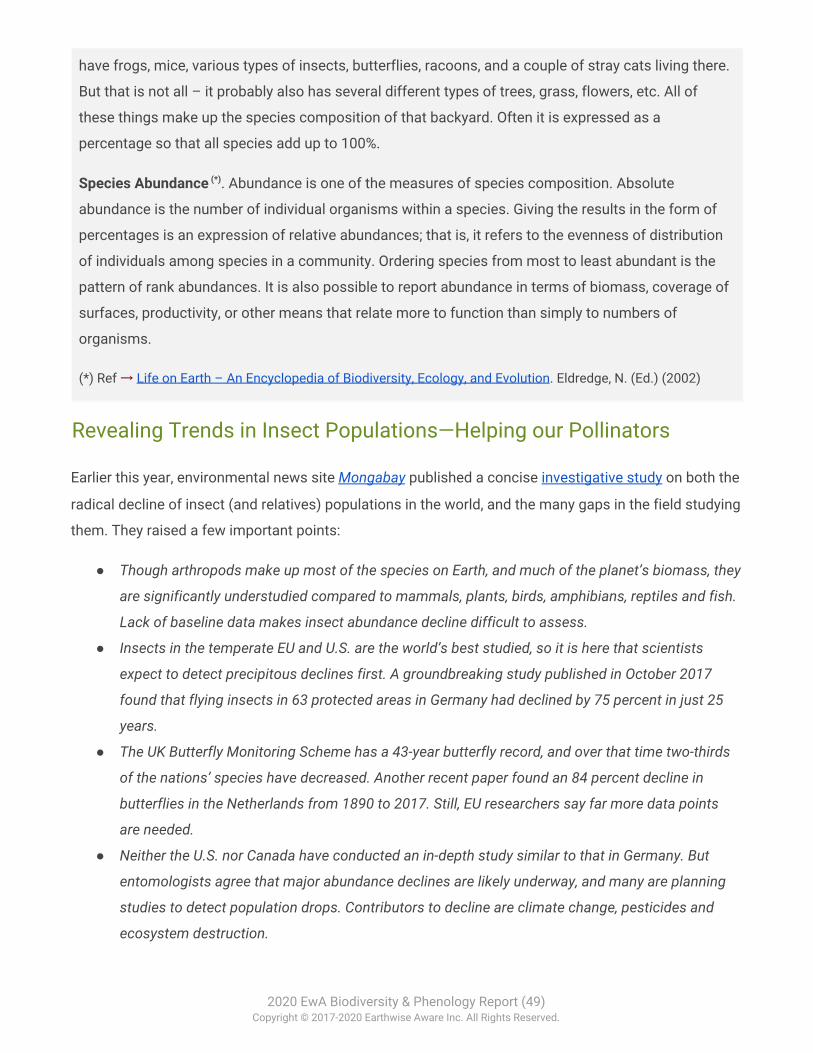
have frogs, mice, various types of insects, butterflies, racoons, and a couple of stray cats living there.
But that is not all – it probably also has several different types of trees, grass, flowers, etc. All of
these things make up the species composition of that backyard. Often it is expressed as a
percentage so that all species add up to 100%.
Species Abundance (*). Abundance is one of the measures of species composition. Absolute
abundance is the number of individual organisms within a species. Giving the results in the form of
percentages is an expression of relative abundances; that is, it refers to the evenness of distribution
of individuals among species in a community. Ordering species from most to least abundant is the
pattern of rank abundances. It is also possible to report abundance in terms of biomass, coverage of
surfaces, productivity, or other means that relate more to function than simply to numbers of
organisms.
(*) Ref → Life on Earth – An Encyclopedia of Biodiversity, Ecology, and Evolution. Eldredge, N. (Ed.) (2002)
Revealing Trends in Insect Populations—Helping our Pollinators
Earlier this year, environmental news site Mongabay published a concise investigative study on both the
radical decline of insect (and relatives) populations in the world, and the many gaps in the field studying
them. They raised a few important points:
● Though arthropods make up most of the species on Earth, and much of the planet’s biomass, they
are significantly understudied compared to mammals, plants, birds, amphibians, reptiles and fish.
Lack of baseline data makes insect abundance decline difficult to assess.
● Insects in the temperate EU and U.S. are the world’s best studied, so it is here that scientists
expect to detect precipitous declines first. A groundbreaking study published in October 2017
found that flying insects in 63 protected areas in Germany had declined by 75 percent in just 25
years.
● The UK Butterfly Monitoring Scheme has a 43-year butterfly record, and over that time two-thirds
of the nations’ species have decreased. Another recent paper found an 84 percent decline in
butterflies in the Netherlands from 1890 to 2017. Still, EU researchers say far more data points
are needed.
● Neither the U.S. nor Canada have conducted an in-depth study similar to that in Germany. But
entomologists agree that major abundance declines are likely underway, and many are planning
studies to detect population drops. Contributors to decline are climate change, pesticides and
ecosystem destruction.
2020 EwA Biodiversity & Phenology Report (49) Copyright © 2017-2020 Earthwise Aware Inc. All Rights Reserved.
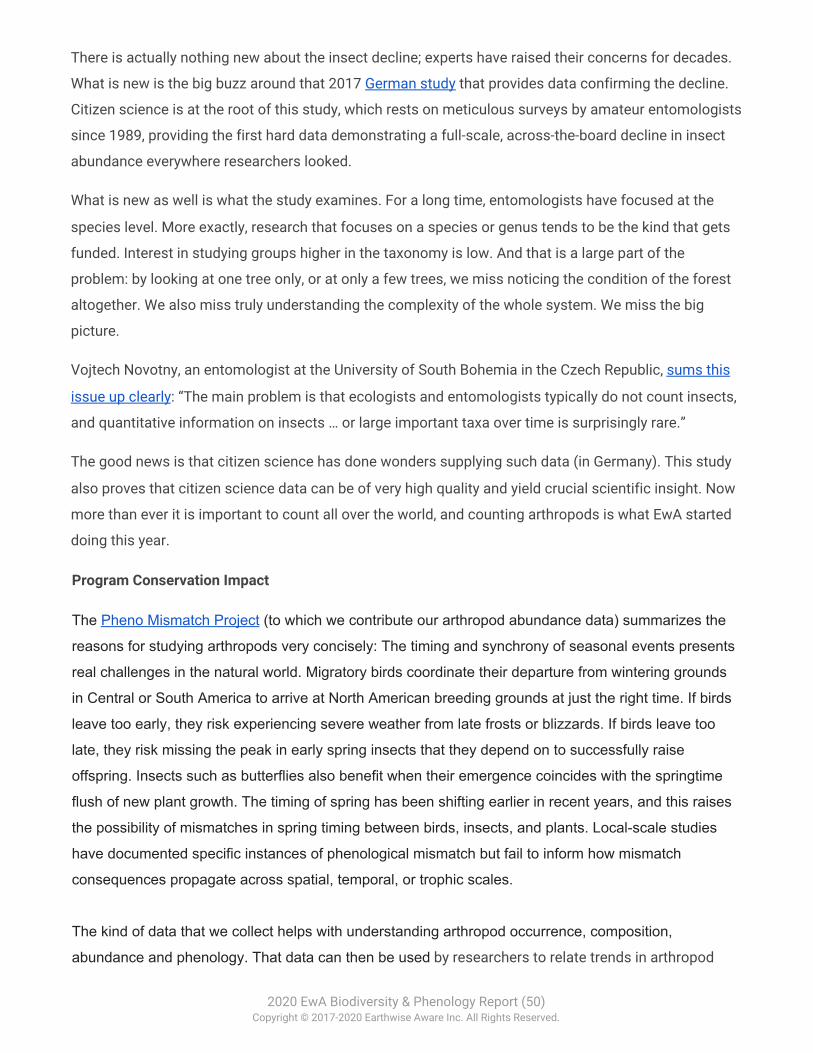
There is actually nothing new about the insect decline; experts have raised their concerns for decades.
What is new is the big buzz around that 2017 German study that provides data confirming the decline.
Citizen science is at the root of this study, which rests on meticulous surveys by amateur entomologists
since 1989, providing the first hard data demonstrating a full-scale, across-the-board decline in insect
abundance everywhere researchers looked.
What is new as well is what the study examines. For a long time, entomologists have focused at the
species level. More exactly, research that focuses on a species or genus tends to be the kind that gets
funded. Interest in studying groups higher in the taxonomy is low. And that is a large part of the
problem: by looking at one tree only, or at only a few trees, we miss noticing the condition of the forest
altogether. We also miss truly understanding the complexity of the whole system. We miss the big
picture.
Vojtech Novotny, an entomologist at the University of South Bohemia in the Czech Republic, sums this
issue up clearly: “The main problem is that ecologists and entomologists typically do not count insects,
and quantitative information on insects … or large important taxa over time is surprisingly rare.”
The good news is that citizen science has done wonders supplying such data (in Germany). This study
also proves that citizen science data can be of very high quality and yield crucial scientific insight. Now
more than ever it is important to count all over the world, and counting arthropods is what EwA started
doing this year.
Program Conservation Impact
The Pheno Mismatch Project (to which we contribute our arthropod abundance data) summarizes the
reasons for studying arthropods very concisely: The timing and synchrony of seasonal events presents
real challenges in the natural world. Migratory birds coordinate their departure from wintering grounds
in Central or South America to arrive at North American breeding grounds at just the right time. If birds
leave too early, they risk experiencing severe weather from late frosts or blizzards. If birds leave too
late, they risk missing the peak in early spring insects that they depend on to successfully raise
offspring. Insects such as butterflies also benefit when their emergence coincides with the springtime
flush of new plant growth. The timing of spring has been shifting earlier in recent years, and this raises
the possibility of mismatches in spring timing between birds, insects, and plants. Local-scale studies
have documented specific instances of phenological mismatch but fail to inform how mismatch
consequences propagate across spatial, temporal, or trophic scales.
The kind of data that we collect helps with understanding arthropod occurrence, composition,
abundance and phenology. That data can then be used by researchers to relate trends in arthropod
2020 EwA Biodiversity & Phenology Report (50) Copyright © 2017-2020 Earthwise Aware Inc. All Rights Reserved.
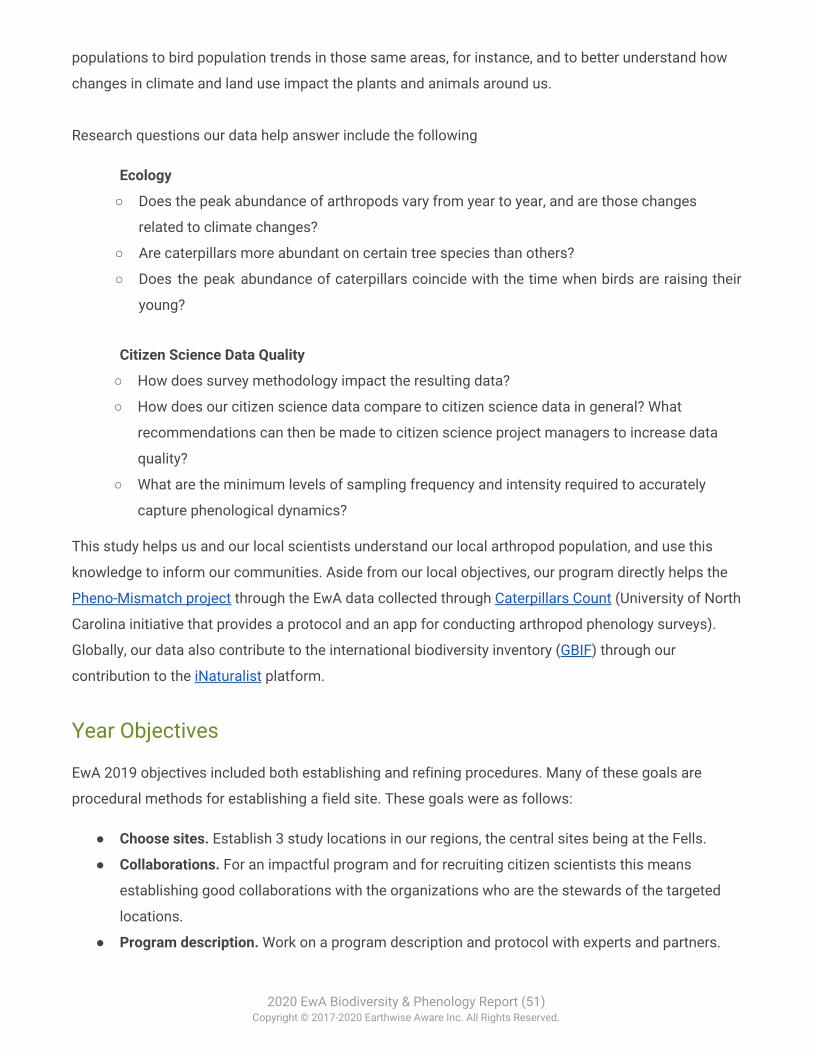
populations to bird population trends in those same areas, for instance, and to better understand how
changes in climate and land use impact the plants and animals around us.
Research questions our data help answer include the following
Ecology
○ Does the peak abundance of arthropods vary from year to year, and are those changes
related to climate changes?
○ Are caterpillars more abundant on certain tree species than others?
○ Does the peak abundance of caterpillars coincide with the time when birds are raising their
young?
Citizen Science Data Quality
○ How does survey methodology impact the resulting data?
○ How does our citizen science data compare to citizen science data in general? What
recommendations can then be made to citizen science project managers to increase data
quality?
○ What are the minimum levels of sampling frequency and intensity required to accurately
capture phenological dynamics?
This study helps us and our local scientists understand our local arthropod population, and use this
knowledge to inform our communities. Aside from our local objectives, our program directly helps the
Pheno-Mismatch project through the EwA data collected through Caterpillars Count (University of North
Carolina initiative that provides a protocol and an app for conducting arthropod phenology surveys).
Globally, our data also contribute to the international biodiversity inventory (GBIF) through our
contribution to the iNaturalist platform.
Year Objectives
EwA 2019 objectives included both establishing and refining procedures. Many of these goals are
procedural methods for establishing a field site. These goals were as follows:
● Choose sites. Establish 3 study locations in our regions, the central sites being at the Fells.
● Collaborations. For an impactful program and for recruiting citizen scientists this means
establishing good collaborations with the organizations who are the stewards of the targeted
locations.
● Program description. Work on a program description and protocol with experts and partners.
2020 EwA Biodiversity & Phenology Report (51) Copyright © 2017-2020 Earthwise Aware Inc. All Rights Reserved.
● Sites setup. Set up the study sites at partner locations.
● Baseline flora. Establish a baseline description of the flora at the sites.
● Data collection & maintenance. Start gathering and maintaining collection data.
● Data quality. Increase data quality throughout the year by improving spotting and identification
skills, refining herbivory estimation, and recording species association.
● Protocol iteration. Refine our protocol and its methods.
Field Methods
After accomplishing our procedural goals, we were able to implement our field methods. During the
active season (spring and summer), we recorded biweekly arthropod occurrence, composition,
abundance and phenology at all locations. We use 2 main study protocols providing us with a more
complete view of the sites’ entomofauna:
● Photo Survey (a.k.a. iNat Survey): the survey focuses on general arthropod occurrences via area
searches along trail transects (and recording the data on iNaturalist).
● Count Method (a.k.a. CC Survey): the survey focuses on recording abundance and phenology of
arthropods on marked trees (using the Caterpillars Count protocol linked above).
Data collection happens in teams as much as possible so as to increase data quality through fieldwork
sessions.
For more details, see our EwA Plant Visitor Survey Protocol, which includes site descriptions, data
collection methods and visualization tools, which is publicly accessible here.
Results
We performed beyond our own expectations and exceeded our goals, adding a 4th location, the
Somerville Growing Center, to our list.
Explicitly, the 4 locations for our arthropod study are:
● The Fells: Long Pond area and the MWRA reservoir meadow (meadow that we will formally add
to our protocol in 2020).
● The Lusitania meadow at the Fresh Pond Reservoir.
● The lower and upper meadows at Habitat.
● The Somerville Community Growing Center as a whole.
For further details see The EwA Plant Visitor Survey’s Site Specific Protocols.
2020 EwA Biodiversity & Phenology Report (52) Copyright © 2017-2020 Earthwise Aware Inc. All Rights Reserved.
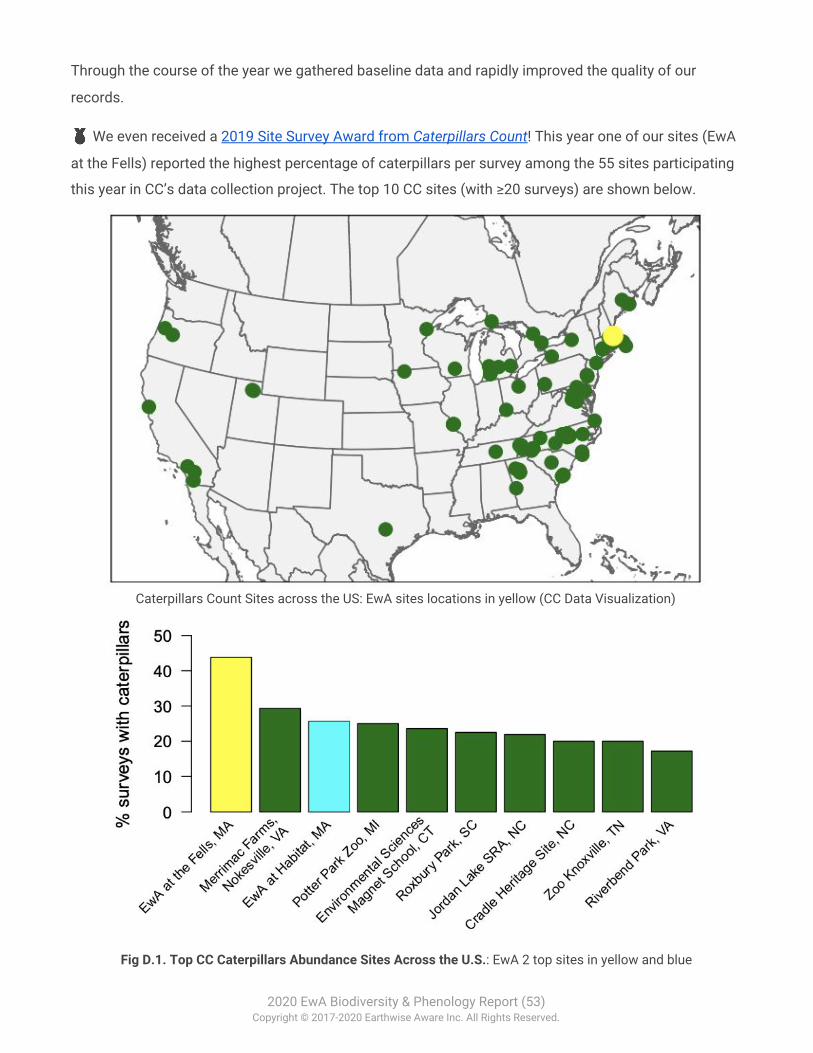
Through the course of the year we gathered baseline data and rapidly improved the quality of our
records.
🥇 We even received a 2019 Site Survey Award from Caterpillars Count! This year one of our sites (EwA
at the Fells) reported the highest percentage of caterpillars per survey among the 55 sites participating
this year in CC’s data collection project. The top 10 CC sites (with ≥20 surveys) are shown below.
Caterpillars Count Sites across the US: EwA sites locations in yellow (CC Data Visualization)
Fig D.1. Top CC Caterpillars Abundance Sites Across the U.S.: EwA 2 top sites in yellow and blue
2020 EwA Biodiversity & Phenology Report (53) Copyright © 2017-2020 Earthwise Aware Inc. All Rights Reserved.
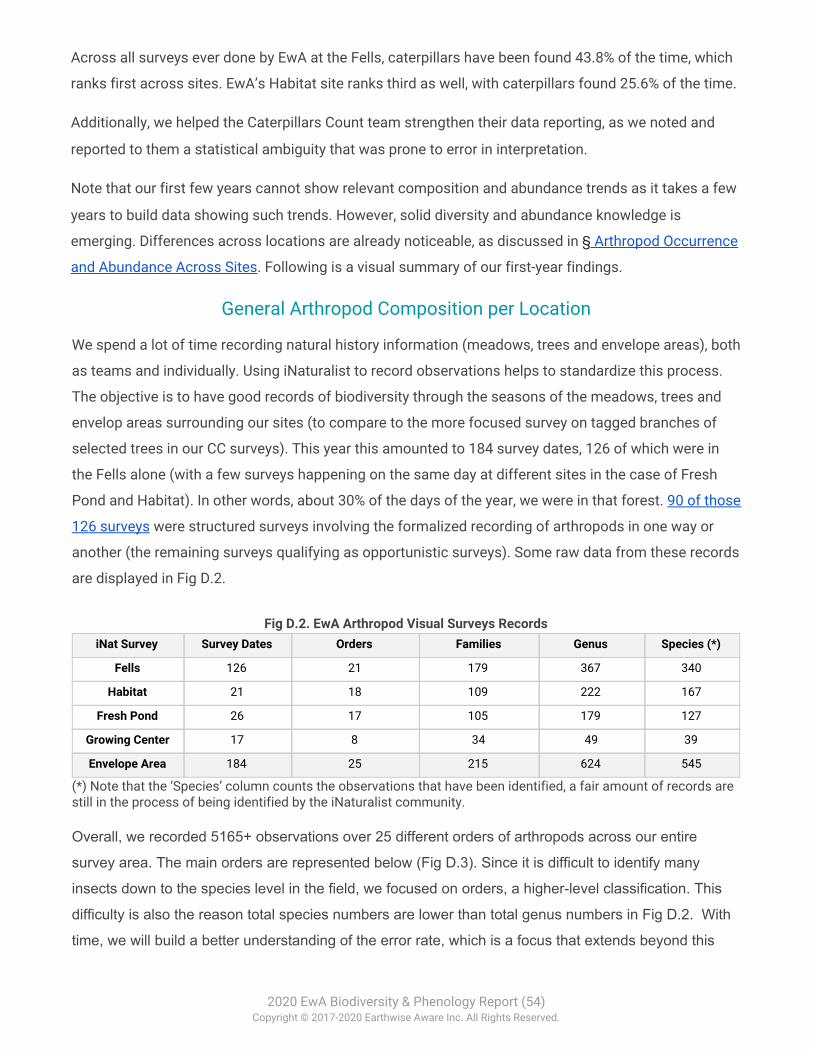
Across all surveys ever done by EwA at the Fells, caterpillars have been found 43.8% of the time, which
ranks first across sites. EwA’s Habitat site ranks third as well, with caterpillars found 25.6% of the time.
Additionally, we helped the Caterpillars Count team strengthen their data reporting, as we noted and
reported to them a statistical ambiguity that was prone to error in interpretation.
Note that our first few years cannot show relevant composition and abundance trends as it takes a few
years to build data showing such trends. However, solid diversity and abundance knowledge is
emerging. Differences across locations are already noticeable, as discussed in § Arthropod Occurrence
and Abundance Across Sites. Following is a visual summary of our first-year findings.
General Arthropod Composition per Location
We spend a lot of time recording natural history information (meadows, trees and envelope areas), both
as teams and individually. Using iNaturalist to record observations helps to standardize this process.
The objective is to have good records of biodiversity through the seasons of the meadows, trees and
envelop areas surrounding our sites (to compare to the more focused survey on tagged branches of
selected trees in our CC surveys). This year this amounted to 184 survey dates, 126 of which were in
the Fells alone (with a few surveys happening on the same day at different sites in the case of Fresh
Pond and Habitat). In other words, about 30% of the days of the year, we were in that forest. 90 of those
126 surveys were structured surveys involving the formalized recording of arthropods in one way or
another (the remaining surveys qualifying as opportunistic surveys). Some raw data from these records
are displayed in Fig D.2.
Fig D.2. EwA Arthropod Visual Surveys Records
iNat Survey Survey Dates Orders Families Genus Species (*)
Fells 126 21 179 367 340
Habitat 21 18 109 222 167
Fresh Pond 26 17 105 179 127
Growing Center 17 8 34 49 39
Envelope Area 184 25 215 624 545
(*) Note that the ‘Species’ column counts the observations that have been identified, a fair amount of records are still in the process of being identified by the iNaturalist community. Overall, we recorded 5165+ observations over 25 different orders of arthropods across our entire
survey area. The main orders are represented below (Fig D.3). Since it is difficult to identify many
insects down to the species level in the field, we focused on orders, a higher-level classification. This
difficulty is also the reason total species numbers are lower than total genus numbers in Fig D.2. With
time, we will build a better understanding of the error rate, which is a focus that extends beyond this
2020 EwA Biodiversity & Phenology Report (54) Copyright © 2017-2020 Earthwise Aware Inc. All Rights Reserved.
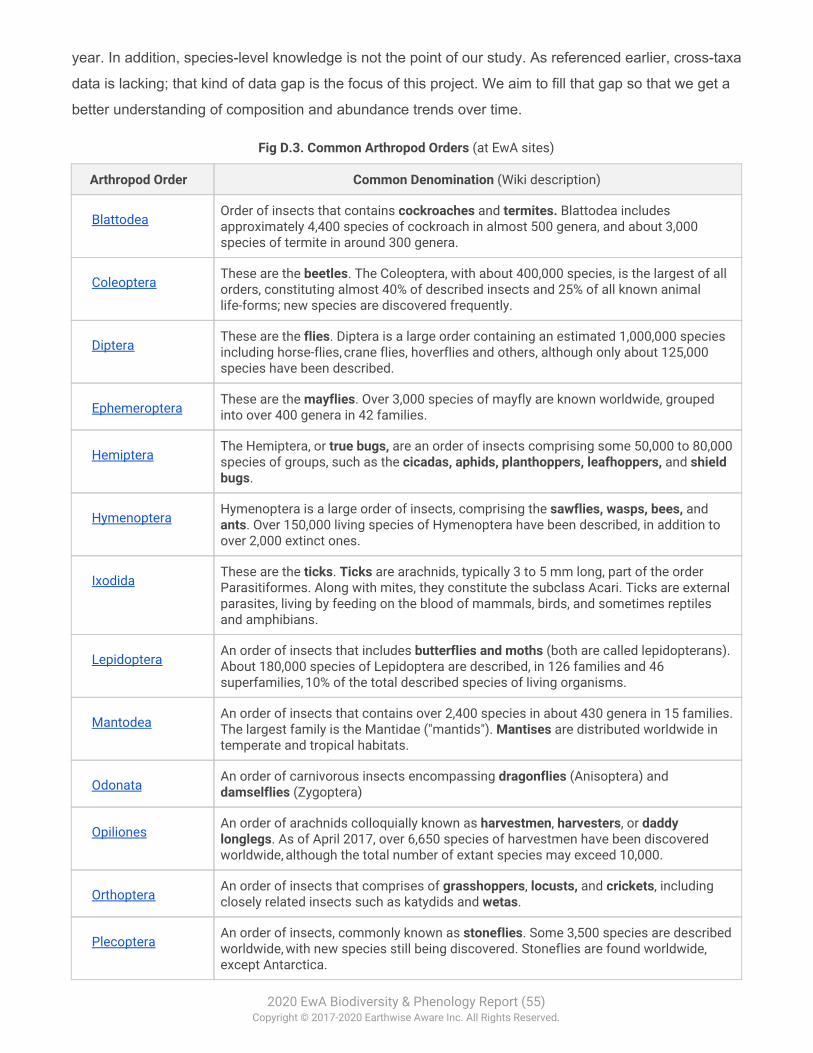
year. In addition, species-level knowledge is not the point of our study. As referenced earlier, cross-taxa
data is lacking; that kind of data gap is the focus of this project. We aim to fill that gap so that we get a
better understanding of composition and abundance trends over time.
Fig D.3. Common Arthropod Orders (at EwA sites)
Arthropod Order Common Denomination (Wiki description)
Blattodea Order of insects that contains cockroaches and termites. Blattodea includes approximately 4,400 species of cockroach in almost 500 genera, and about 3,000 species of termite in around 300 genera.
Coleoptera These are the beetles. The Coleoptera, with about 400,000 species, is the largest of all orders, constituting almost 40% of described insects and 25% of all known animal life-forms; new species are discovered frequently.
Diptera These are the flies. Diptera is a large order containing an estimated 1,000,000 species including horse-flies, crane flies, hoverflies and others, although only about 125,000 species have been described.
Ephemeroptera These are the mayflies. Over 3,000 species of mayfly are known worldwide, grouped into over 400 genera in 42 families.
Hemiptera The Hemiptera, or true bugs, are an order of insects comprising some 50,000 to 80,000 species of groups, such as the cicadas, aphids, planthoppers, leafhoppers, and shield bugs.
Hymenoptera Hymenoptera is a large order of insects, comprising the sawflies, wasps, bees, and ants. Over 150,000 living species of Hymenoptera have been described, in addition to over 2,000 extinct ones.
Ixodida These are the ticks. Ticks are arachnids, typically 3 to 5 mm long, part of the order Parasitiformes. Along with mites, they constitute the subclass Acari. Ticks are external parasites, living by feeding on the blood of mammals, birds, and sometimes reptiles and amphibians.
Lepidoptera An order of insects that includes butterflies and moths (both are called lepidopterans). About 180,000 species of Lepidoptera are described, in 126 families and 46 superfamilies, 10% of the total described species of living organisms.
Mantodea An order of insects that contains over 2,400 species in about 430 genera in 15 families. The largest family is the Mantidae ("mantids"). Mantises are distributed worldwide in temperate and tropical habitats.
Odonata An order of carnivorous insects encompassing dragonflies (Anisoptera) and damselflies (Zygoptera)
Opiliones An order of arachnids colloquially known as harvestmen, harvesters, or daddy longlegs. As of April 2017, over 6,650 species of harvestmen have been discovered worldwide, although the total number of extant species may exceed 10,000.
Orthoptera An order of insects that comprises of grasshoppers, locusts, and crickets, including closely related insects such as katydids and wetas.
Plecoptera An order of insects, commonly known as stoneflies. Some 3,500 species are described worldwide, with new species still being discovered. Stoneflies are found worldwide, except Antarctica.
2020 EwA Biodiversity & Phenology Report (55) Copyright © 2017-2020 Earthwise Aware Inc. All Rights Reserved.
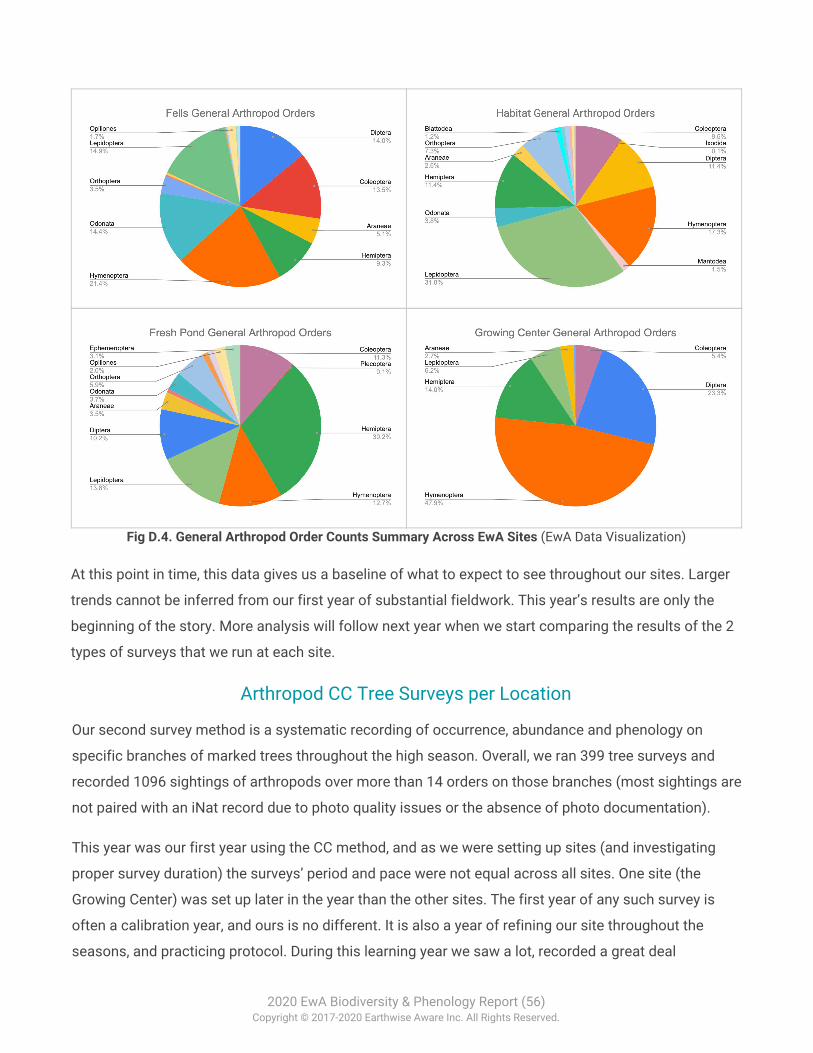
Fig D.4. General Arthropod Order Counts Summary Across EwA Sites (EwA Data Visualization)
At this point in time, this data gives us a baseline of what to expect to see throughout our sites. Larger
trends cannot be inferred from our first year of substantial fieldwork. This year’s results are only the
beginning of the story. More analysis will follow next year when we start comparing the results of the 2
types of surveys that we run at each site.
Arthropod CC Tree Surveys per Location
Our second survey method is a systematic recording of occurrence, abundance and phenology on
specific branches of marked trees throughout the high season. Overall, we ran 399 tree surveys and
recorded 1096 sightings of arthropods over more than 14 orders on those branches (most sightings are
not paired with an iNat record due to photo quality issues or the absence of photo documentation).
This year was our first year using the CC method, and as we were setting up sites (and investigating
proper survey duration) the surveys’ period and pace were not equal across all sites. One site (the
Growing Center) was set up later in the year than the other sites. The first year of any such survey is
often a calibration year, and ours is no different. It is also a year of refining our site throughout the
seasons, and practicing protocol. During this learning year we saw a lot, recorded a great deal
2020 EwA Biodiversity & Phenology Report (56) Copyright © 2017-2020 Earthwise Aware Inc. All Rights Reserved.
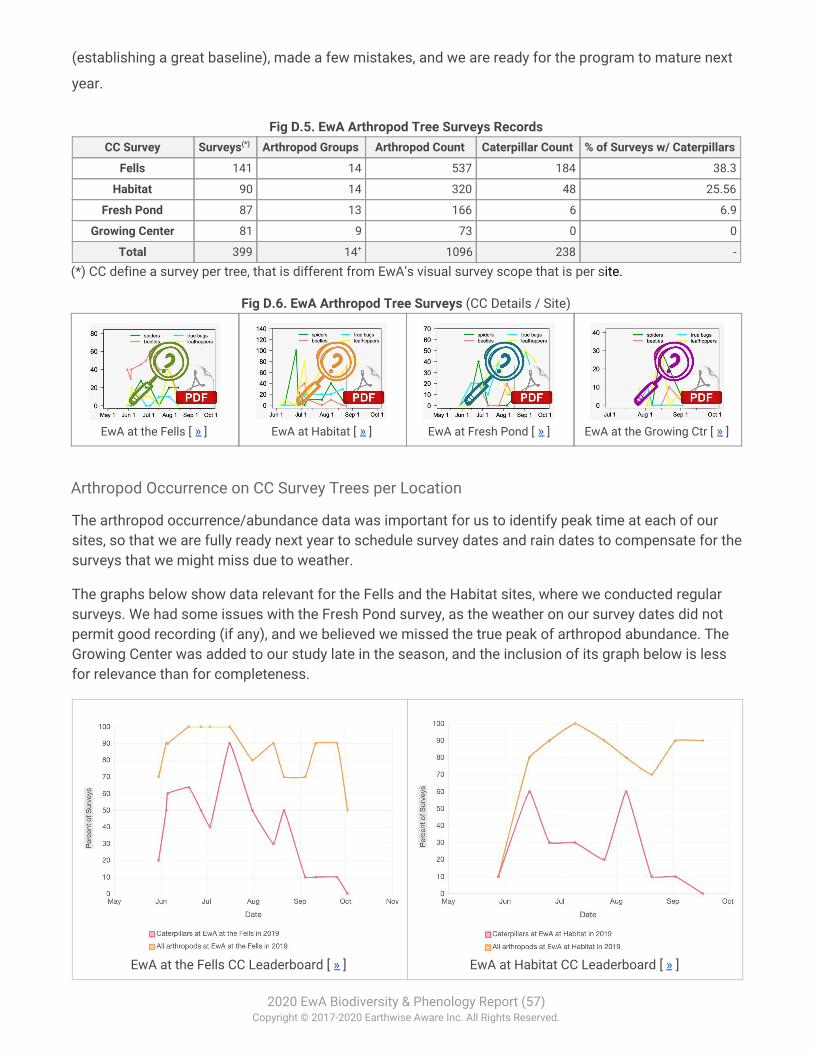
(establishing a great baseline), made a few mistakes, and we are ready for the program to mature next
year.
Fig D.5. EwA Arthropod Tree Surveys Records
CC Survey Surveys(*) Arthropod Groups Arthropod Count Caterpillar Count % of Surveys w/ Caterpillars
Fells 141 14 537 184 38.3
Habitat 90 14 320 48 25.56
Fresh Pond 87 13 166 6 6.9
Growing Center 81 9 73 0 0
Total 399 14+ 1096 238 -
(*) CC define a survey per tree, that is different from EwA’s visual survey scope that is per site.
Fig D.6. EwA Arthropod Tree Surveys (CC Details / Site)
EwA at the Fells [ » ]
EwA at Habitat [ » ]
EwA at Fresh Pond [ » ]
EwA at the Growing Ctr [ » ]
Arthropod Occurrence on CC Survey Trees per Location
The arthropod occurrence/abundance data was important for us to identify peak time at each of our sites, so that we are fully ready next year to schedule survey dates and rain dates to compensate for the surveys that we might miss due to weather.
The graphs below show data relevant for the Fells and the Habitat sites, where we conducted regular surveys. We had some issues with the Fresh Pond survey, as the weather on our survey dates did not permit good recording (if any), and we believed we missed the true peak of arthropod abundance. The Growing Center was added to our study late in the season, and the inclusion of its graph below is less for relevance than for completeness.
EwA at the Fells CC Leaderboard [ » ]
EwA at Habitat CC Leaderboard [ » ]
2020 EwA Biodiversity & Phenology Report (57) Copyright © 2017-2020 Earthwise Aware Inc. All Rights Reserved.
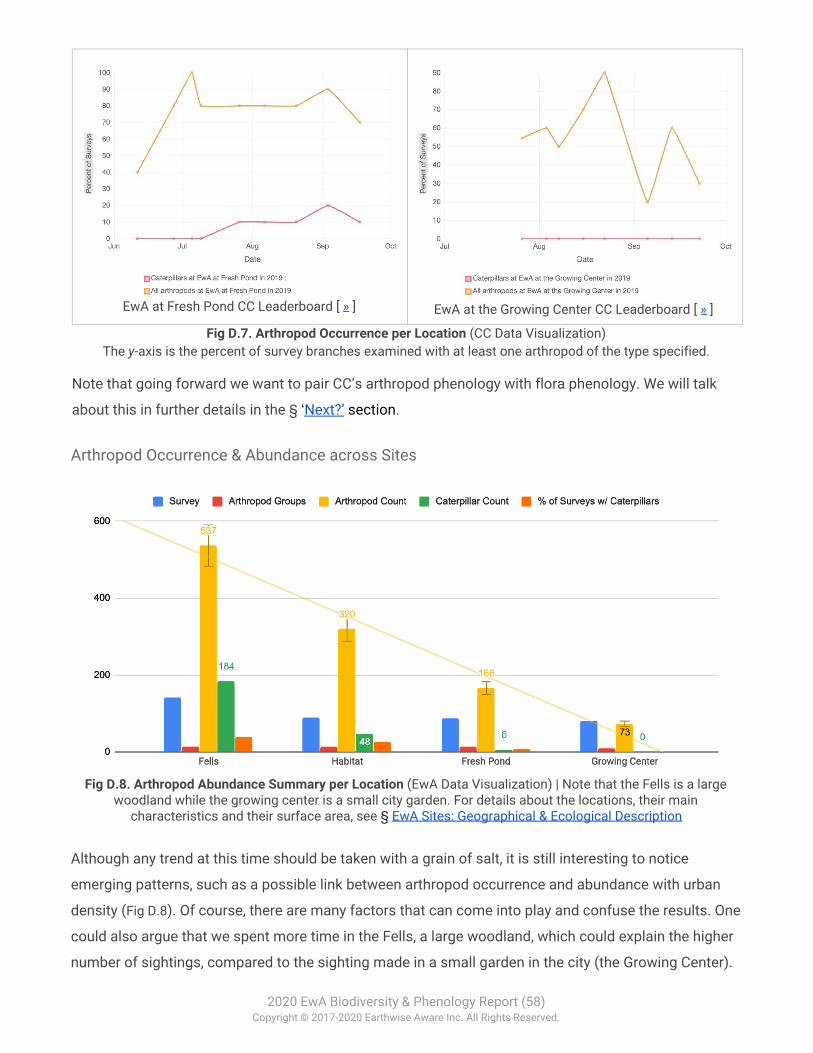
EwA at Fresh Pond CC Leaderboard [ » ]
EwA at the Growing Center CC Leaderboard [ » ]
Fig D.7. Arthropod Occurrence per Location (CC Data Visualization) The y-axis is the percent of survey branches examined with at least one arthropod of the type specified.
Note that going forward we want to pair CC’s arthropod phenology with flora phenology. We will talk
about this in further details in the § ‘Next?’ section.
Arthropod Occurrence & Abundance across Sites
Fig D.8. Arthropod Abundance Summary per Location (EwA Data Visualization) | Note that the Fells is a large
woodland while the growing center is a small city garden. For details about the locations, their main characteristics and their surface area, see § EwA Sites: Geographical & Ecological Description
Although any trend at this time should be taken with a grain of salt, it is still interesting to notice
emerging patterns, such as a possible link between arthropod occurrence and abundance with urban
density (Fig D.8). Of course, there are many factors that can come into play and confuse the results. One
could also argue that we spent more time in the Fells, a large woodland, which could explain the higher
number of sightings, compared to the sighting made in a small garden in the city (the Growing Center).
2020 EwA Biodiversity & Phenology Report (58) Copyright © 2017-2020 Earthwise Aware Inc. All Rights Reserved.
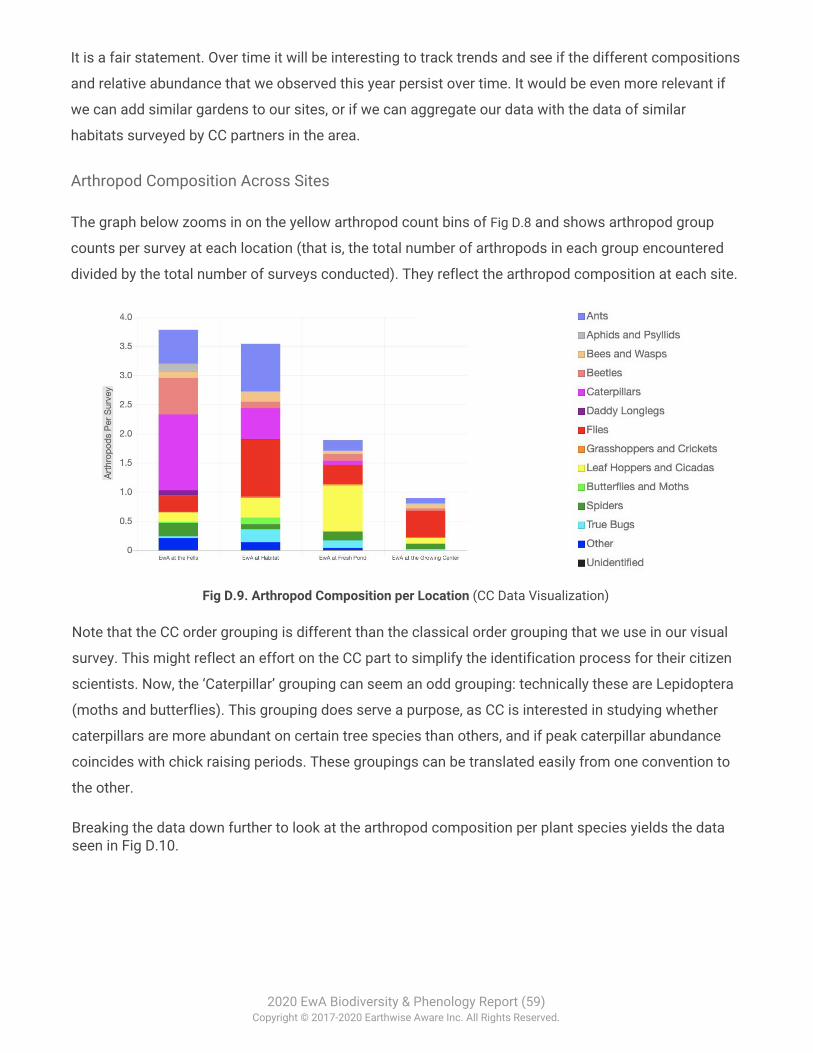
It is a fair statement. Over time it will be interesting to track trends and see if the different compositions
and relative abundance that we observed this year persist over time. It would be even more relevant if
we can add similar gardens to our sites, or if we can aggregate our data with the data of similar
habitats surveyed by CC partners in the area.
Arthropod Composition Across Sites
The graph below zooms in on the yellow arthropod count bins of Fig D.8 and shows arthropod group
counts per survey at each location (that is, the total number of arthropods in each group encountered
divided by the total number of surveys conducted). They reflect the arthropod composition at each site.
Fig D.9. Arthropod Composition per Location (CC Data Visualization)
Note that the CC order grouping is different than the classical order grouping that we use in our visual
survey. This might reflect an effort on the CC part to simplify the identification process for their citizen
scientists. Now, the ‘Caterpillar’ grouping can seem an odd grouping: technically these are Lepidoptera
(moths and butterflies). This grouping does serve a purpose, as CC is interested in studying whether
caterpillars are more abundant on certain tree species than others, and if peak caterpillar abundance
coincides with chick raising periods. These groupings can be translated easily from one convention to
the other.
Breaking the data down further to look at the arthropod composition per plant species yields the data seen in Fig D.10.
2020 EwA Biodiversity & Phenology Report (59) Copyright © 2017-2020 Earthwise Aware Inc. All Rights Reserved.
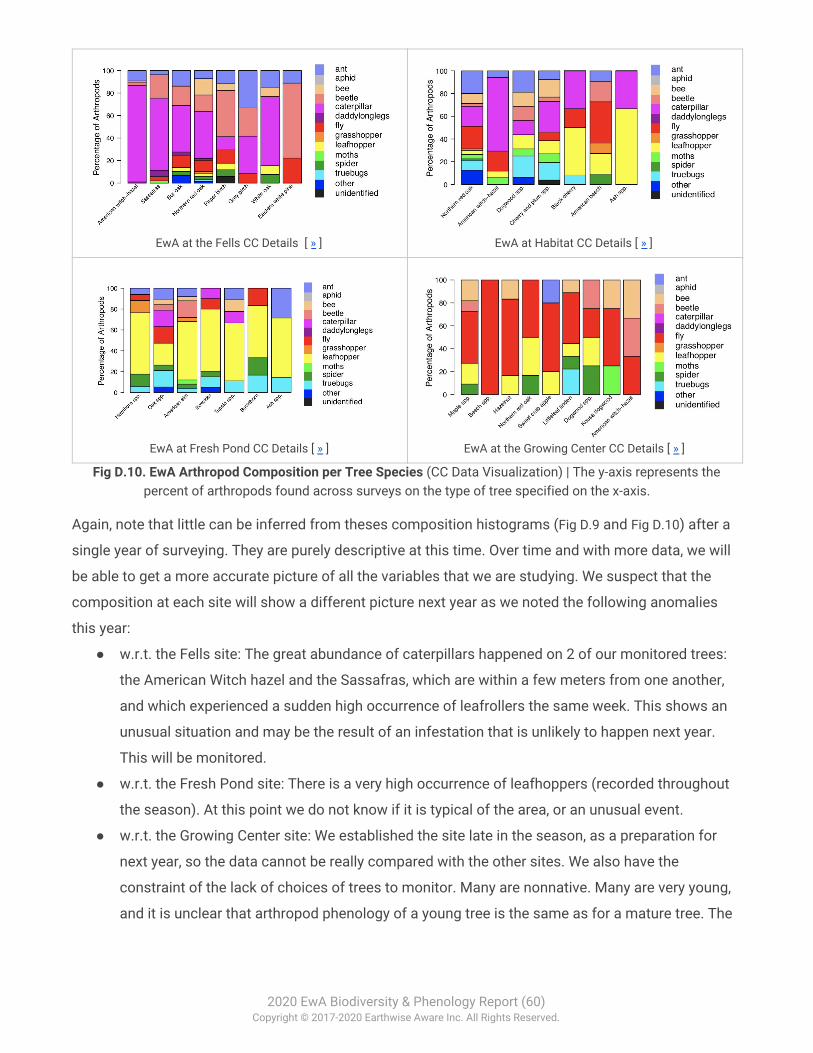
EwA at the Fells CC Details [ » ]
EwA at Habitat CC Details [ » ]
EwA at Fresh Pond CC Details [ » ] EwA at the Growing Center CC Details [ » ]
Fig D.10. EwA Arthropod Composition per Tree Species (CC Data Visualization) | The y-axis represents the percent of arthropods found across surveys on the type of tree specified on the x-axis.
Again, note that little can be inferred from theses composition histograms (Fig D.9 and Fig D.10) after a
single year of surveying. They are purely descriptive at this time. Over time and with more data, we will
be able to get a more accurate picture of all the variables that we are studying. We suspect that the
composition at each site will show a different picture next year as we noted the following anomalies
this year:
● w.r.t. the Fells site: The great abundance of caterpillars happened on 2 of our monitored trees:
the American Witch hazel and the Sassafras, which are within a few meters from one another,
and which experienced a sudden high occurrence of leafrollers the same week. This shows an
unusual situation and may be the result of an infestation that is unlikely to happen next year.
This will be monitored.
● w.r.t. the Fresh Pond site: There is a very high occurrence of leafhoppers (recorded throughout
the season). At this point we do not know if it is typical of the area, or an unusual event.
● w.r.t. the Growing Center site: We established the site late in the season, as a preparation for
next year, so the data cannot be really compared with the other sites. We also have the
constraint of the lack of choices of trees to monitor. Many are nonnative. Many are very young,
and it is unclear that arthropod phenology of a young tree is the same as for a mature tree. The
2020 EwA Biodiversity & Phenology Report (60) Copyright © 2017-2020 Earthwise Aware Inc. All Rights Reserved.
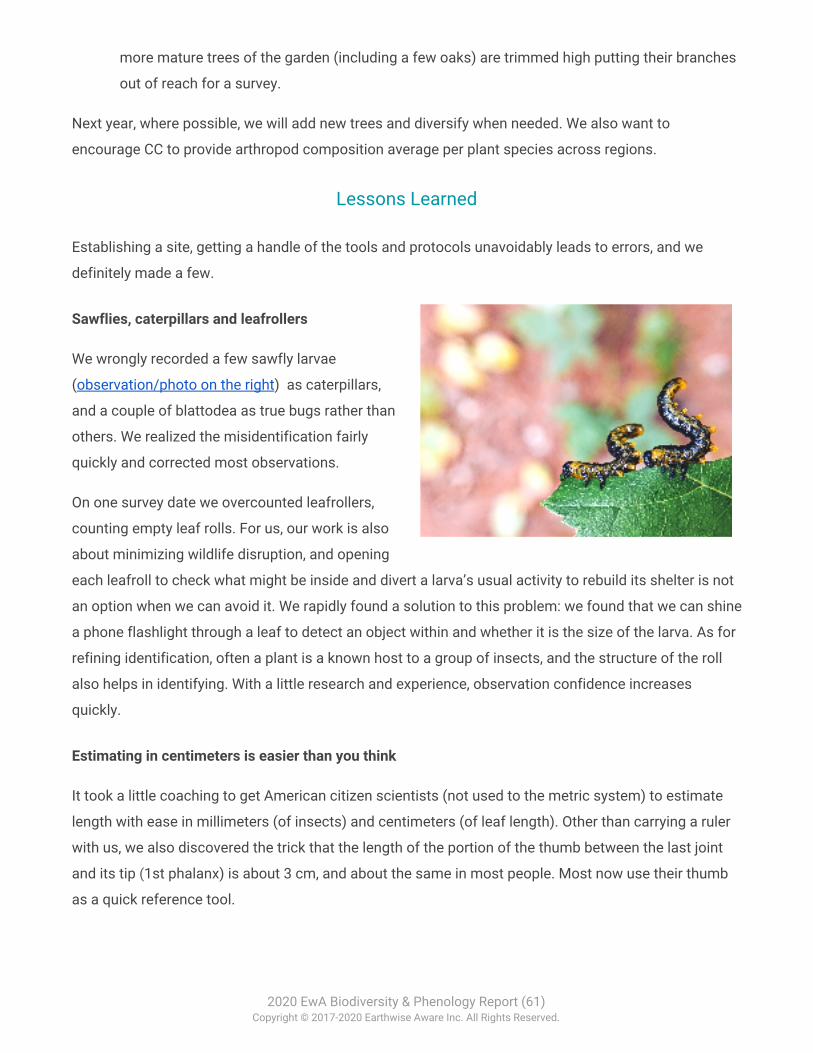
more mature trees of the garden (including a few oaks) are trimmed high putting their branches
out of reach for a survey.
Next year, where possible, we will add new trees and diversify when needed. We also want to
encourage CC to provide arthropod composition average per plant species across regions.
Lessons Learned Establishing a site, getting a handle of the tools and protocols unavoidably leads to errors, and we
definitely made a few.
Sawflies, caterpillars and leafrollers We wrongly recorded a few sawfly larvae
(observation/photo on the right) as caterpillars,
and a couple of blattodea as true bugs rather than
others. We realized the misidentification fairly
quickly and corrected most observations.
On one survey date we overcounted leafrollers,
counting empty leaf rolls. For us, our work is also
about minimizing wildlife disruption, and opening
each leafroll to check what might be inside and divert a larva’s usual activity to rebuild its shelter is not
an option when we can avoid it. We rapidly found a solution to this problem: we found that we can shine
a phone flashlight through a leaf to detect an object within and whether it is the size of the larva. As for
refining identification, often a plant is a known host to a group of insects, and the structure of the roll
also helps in identifying. With a little research and experience, observation confidence increases
quickly.
Estimating in centimeters is easier than you think It took a little coaching to get American citizen scientists (not used to the metric system) to estimate
length with ease in millimeters (of insects) and centimeters (of leaf length). Other than carrying a ruler
with us, we also discovered the trick that the length of the portion of the thumb between the last joint
and its tip (1st phalanx) is about 3 cm, and about the same in most people. Most now use their thumb
as a quick reference tool.
2020 EwA Biodiversity & Phenology Report (61) Copyright © 2017-2020 Earthwise Aware Inc. All Rights Reserved.
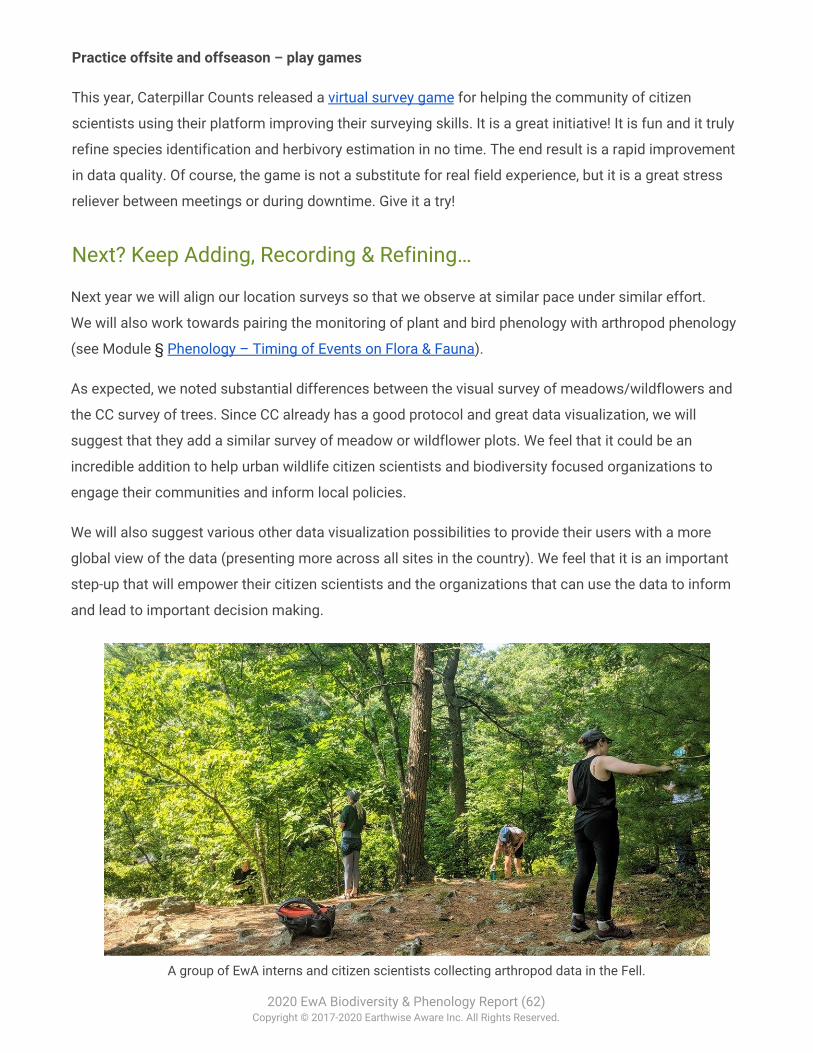
Practice offsite and offseason – play games This year, Caterpillar Counts released a virtual survey game for helping the community of citizen
scientists using their platform improving their surveying skills. It is a great initiative! It is fun and it truly
refine species identification and herbivory estimation in no time. The end result is a rapid improvement
in data quality. Of course, the game is not a substitute for real field experience, but it is a great stress
reliever between meetings or during downtime. Give it a try!
Next? Keep Adding, Recording & Refining…
Next year we will align our location surveys so that we observe at similar pace under similar effort.
We will also work towards pairing the monitoring of plant and bird phenology with arthropod phenology
(see Module § Phenology – Timing of Events on Flora & Fauna).
As expected, we noted substantial differences between the visual survey of meadows/wildflowers and
the CC survey of trees. Since CC already has a good protocol and great data visualization, we will
suggest that they add a similar survey of meadow or wildflower plots. We feel that it could be an
incredible addition to help urban wildlife citizen scientists and biodiversity focused organizations to
engage their communities and inform local policies.
We will also suggest various other data visualization possibilities to provide their users with a more
global view of the data (presenting more across all sites in the country). We feel that it is an important
step-up that will empower their citizen scientists and the organizations that can use the data to inform
and lead to important decision making.
A group of EwA interns and citizen scientists collecting arthropod data in the Fell.
2020 EwA Biodiversity & Phenology Report (62) Copyright © 2017-2020 Earthwise Aware Inc. All Rights Reserved.
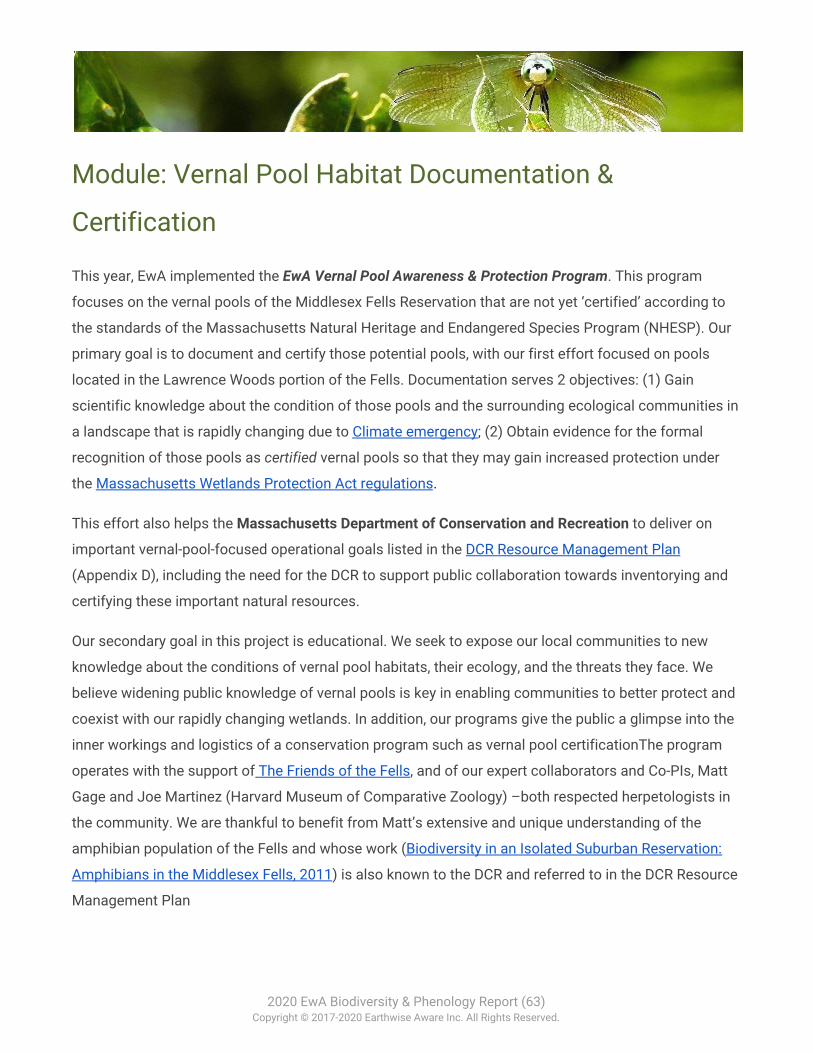
Module: Vernal Pool Habitat Documentation &
Certification
This year, EwA implemented the EwA Vernal Pool Awareness & Protection Program. This program
focuses on the vernal pools of the Middlesex Fells Reservation that are not yet ‘certified’ according to
the standards of the Massachusetts Natural Heritage and Endangered Species Program (NHESP). Our
primary goal is to document and certify those potential pools, with our first effort focused on pools
located in the Lawrence Woods portion of the Fells. Documentation serves 2 objectives: (1) Gain
scientific knowledge about the condition of those pools and the surrounding ecological communities in
a landscape that is rapidly changing due to Climate emergency; (2) Obtain evidence for the formal
recognition of those pools as certified vernal pools so that they may gain increased protection under
the Massachusetts Wetlands Protection Act regulations.
This effort also helps the Massachusetts Department of Conservation and Recreation to deliver on
important vernal-pool-focused operational goals listed in the DCR Resource Management Plan
(Appendix D), including the need for the DCR to support public collaboration towards inventorying and
certifying these important natural resources.
Our secondary goal in this project is educational. We seek to expose our local communities to new
knowledge about the conditions of vernal pool habitats, their ecology, and the threats they face. We
believe widening public knowledge of vernal pools is key in enabling communities to better protect and
coexist with our rapidly changing wetlands. In addition, our programs give the public a glimpse into the
inner workings and logistics of a conservation program such as vernal pool certificationThe program
operates with the support of The Friends of the Fells, and of our expert collaborators and Co-PIs, Matt
Gage and Joe Martinez (Harvard Museum of Comparative Zoology) –both respected herpetologists in
the community. We are thankful to benefit from Matt’s extensive and unique understanding of the
amphibian population of the Fells and whose work (Biodiversity in an Isolated Suburban Reservation:
Amphibians in the Middlesex Fells, 2011) is also known to the DCR and referred to in the DCR Resource
Management Plan
2020 EwA Biodiversity & Phenology Report (63) Copyright © 2017-2020 Earthwise Aware Inc. All Rights Reserved.
⬞⬞⬞ Definitions ⬞⬞⬞
Vernal Pool. Vernal pools are aquatic resource basins that typically go dry in most years and may
contain inlets or outlets, typically of intermittent flow. Vernal pools range in both size and depth
depending upon landscape position and parent material(s). Pools usually support one or more
indicator species, including: wood frog, spotted salamander, blue-spotted salamander, marbled
salamander, Jefferson’s salamander, and fairy shrimp; however, they should preclude sustainable
populations of predatory fish.
Ref → New England District Vernal Pool Rapid Assessment Method.
Vernal Pool Certification (Massachusetts). This is a procedure by which one can document the
presence of a vernal pool in Massachusetts. It relies on the survey of possible vernal pools and
documentation of certain biological and physical evidence of vernal pool habitat. The documentation
material is submitted to the Massachusetts Division of Fisheries & Wildlife's Natural Heritage &
Endangered Species Program (NHESP). The NHESP then reviews the documentation and makes a
determination whether the wetland basin in question meets the biological and physical criteria
necessary for status as a "Certified Vernal Pool.” When a vernal pool has been certified, it can be
protected under the Wetlands Protection Act.
Ref → Mass.gov Vernal Pool Certification.
Protecting At-risk Species & Habitats
Vernal pools are an important indicator of the health and changing conditions of our wetlands, and are
critical habitats for many amphibians. 40% of amphibians are endangered worldwide, and amphibians
are one of the current extinction event’s most threatened taxa. The Middlesex Fells Reservation is
managed by the Massachusetts Department of Conservation and Recreation (DCR) and home to about
126 vernal pools known to NHESP (54 certified + 72 candidates), making this reservation critical to the
local preservation of wetland habitat and the species dependant upon it. Additionally, the pools that
EwA is focusing on are located in BioMap2 Core Habitat areas, which are defined as specific areas
necessary to promote the long-term persistence of Species of Conservation Concern, exemplary natural
communities, and intact ecosystems. Species of Conservation Concern refers to those listed under the
Massachusetts Endangered Species Act as well as additional species identified in the State Wildlife
Action Plan. (see also Biomap2 Core Habitat Species Species of Conservation Concern).
The reservation is a public space, heavily utilized by the communities surrounding it. The primary
human activities in the reservation are recreation-focused. Those activities include hiking, dog walking,
2020 EwA Biodiversity & Phenology Report (64) Copyright © 2017-2020 Earthwise Aware Inc. All Rights Reserved.

mountain biking, etc. When park rules are observed, these activities are relatively benign. However, as is
true in many public spaces, those rules are regularly overlooked. As a result, the reservation is suffering
in various ways from over-use, repeated violations of critical regulations, and overall public negligence.
At present, the Fells is overrun by rogue trails facilitating the spread of harmful invasive species. Dog
leash rules are largely ignored resulting in dogs swimming in and potentially contaminating ponds and
pools (e.g., from parasites that are harmless to our
domesticated companions but harmful to our forest
inhabitants). The trails are regularly littered with bags of
dog excrement. While conservation may be personally
important to many visitors of the Fells, it is often not the
first priority of their visits, and the surrounding habitat
suffers as a result. Vernal pools are especially
vulnerable to this, as basins that can collect
contaminants.
At EwA, we are dedicated to bringing biodiversity
conservation science into the Fells and to increase
ecological knowledge in our communities. We believe
that greater awareness of the ecology of our cherished habitats can result in more responsible public
recreation. We have teamed up with professionals Matthew Gage (herpetologist), Joseph Martinez
(herpetologist) and Shilpa Sen (wetland ecologist) to succeed in this mission. The intended impact of
our work is it that together with our communities we can better protect our Urban forest, as well as help
the DCR fulfill its responsibility as steward of the park’s wildlife.
Program Conservation Impact
The Fells candidate pools are interspersed among certified pools. The documentation and certification
of the candidate vernal pools will help close species migration gaps between non-certified and certified
pools, therefore directly improving the conservation of wetland species and specifically of the species
of the Fells.
The program also directly helps the Massachusetts Department of Recreation and Conservation to
deliver on important vernal-pool-focused operational goals listed in the DCR Resource Management
Plan (Appendix D). Some DCR goals include:
● Supporting vernal pool certification. Vernal pools are one of many interesting and important
natural resources that DCR seeks to protect and promote, so DCR should support public
2020 EwA Biodiversity & Phenology Report (65) Copyright © 2017-2020 Earthwise Aware Inc. All Rights Reserved.
collaboration and permit organizations to work with volunteers to inventory and certify these
resources.
● Managing trails in the vicinity of vernal pools. Trails that go through or are eroding into vernal
pools should be closed or rerouted.
● Monitoring heavily used trails for impacts. Trails with deep ruts (> 6 inches) within 50 feet of a
vernal pool should be considered for closure or re-location away from the pool. Closed trail
segments should be restored to a non-compacted and rutted state. Vernal pool amphibians may
lay eggs in the ruts, which are likely to dry out before the eggs hatch or larvae develop enough to
leave the water; therefore, ruts may have a negative impact on the local population of vernal
pool species. In addition, some amphibian species can get stuck in ruts and follow them for
long distances away from key habitat areas.
By exhaustively documenting pool habitats, EwA provides actionable information to the DCR to help
meeting its conservation objectives.
Program Scientific Impact
● The kind of data that we record contributes to expanding assessments of amphibian
populations and their movements (seasonal and dispersal) in different landscape settings from
local-to regional-scale (EPA, 2002).
● The data also provides regional species-specific information on tolerances and adaptability to
specific disturbances. More information is needed on the tolerances and adaptability of each
species to specific environmental factors so that their presence/absence or abundance in
wetlands can be interpreted more reliably (EPA, 2002).
● The U.S. is a risk zone with respect to the expected arrival of a deadly fungus, Bsal
(Batrachochytrium salamandrivorans), the salamander-eating fungus. It has been reported that if
Bsal is a perfect pathogen, then the U.S. might be the perfect host country. The U.S. has the
highest diversity of salamanders in the world, and more than half of them may be susceptible to
chytridiomycosis. This Citizen project in particular by focusing its efforts on vernal pools is a
perfect citizen surveillance tool for reporting any suspicious specimen to the NHESP.
2020 EwA Biodiversity & Phenology Report (66) Copyright © 2017-2020 Earthwise Aware Inc. All Rights Reserved.
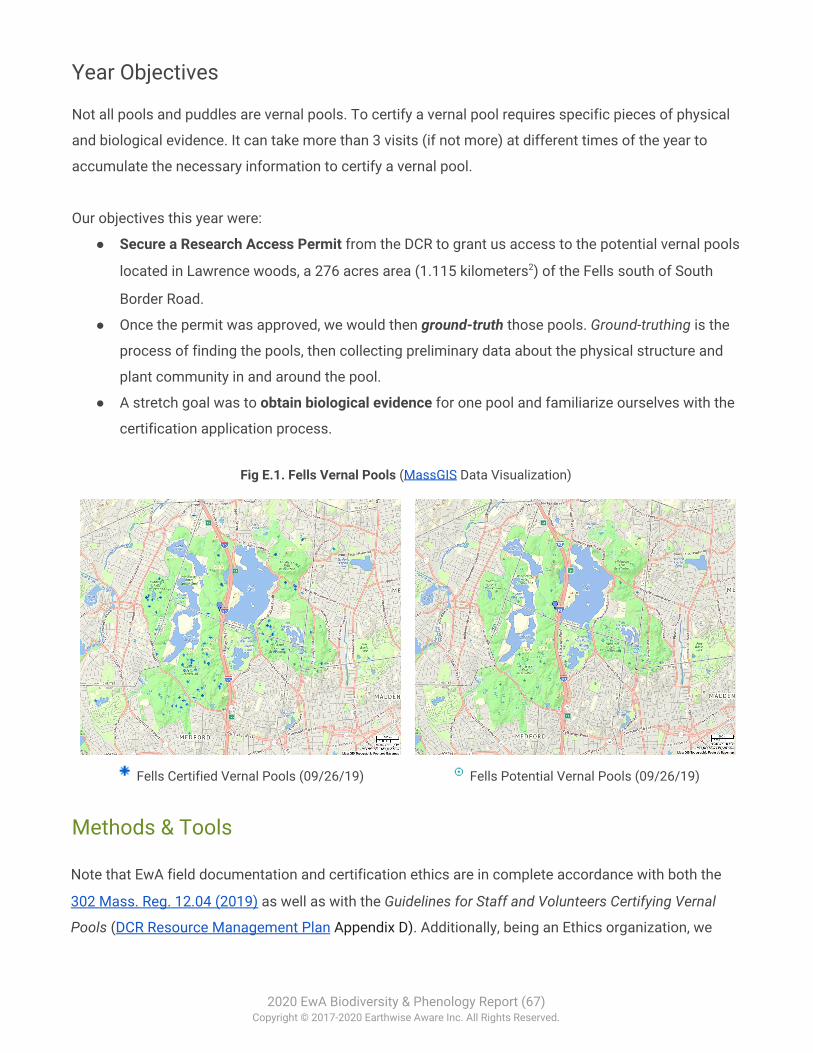
Year Objectives
Not all pools and puddles are vernal pools. To certify a vernal pool requires specific pieces of physical
and biological evidence. It can take more than 3 visits (if not more) at different times of the year to
accumulate the necessary information to certify a vernal pool.
Our objectives this year were:
● Secure a Research Access Permit from the DCR to grant us access to the potential vernal pools
located in Lawrence woods, a 276 acres area (1.115 kilometers2) of the Fells south of South
Border Road.
● Once the permit was approved, we would then ground-truth those pools. Ground-truthing is the
process of finding the pools, then collecting preliminary data about the physical structure and
plant community in and around the pool.
● A stretch goal was to obtain biological evidence for one pool and familiarize ourselves with the
certification application process.
Fig E.1. Fells Vernal Pools (MassGIS Data Visualization)
Fells Certified Vernal Pools (09/26/19) Fells Potential Vernal Pools (09/26/19)
Methods & Tools
Note that EwA field documentation and certification ethics are in complete accordance with both the
302 Mass. Reg. 12.04 (2019) as well as with the Guidelines for Staff and Volunteers Certifying Vernal
Pools (DCR Resource Management Plan Appendix D). Additionally, being an Ethics organization, we
2020 EwA Biodiversity & Phenology Report (67) Copyright © 2017-2020 Earthwise Aware Inc. All Rights Reserved.
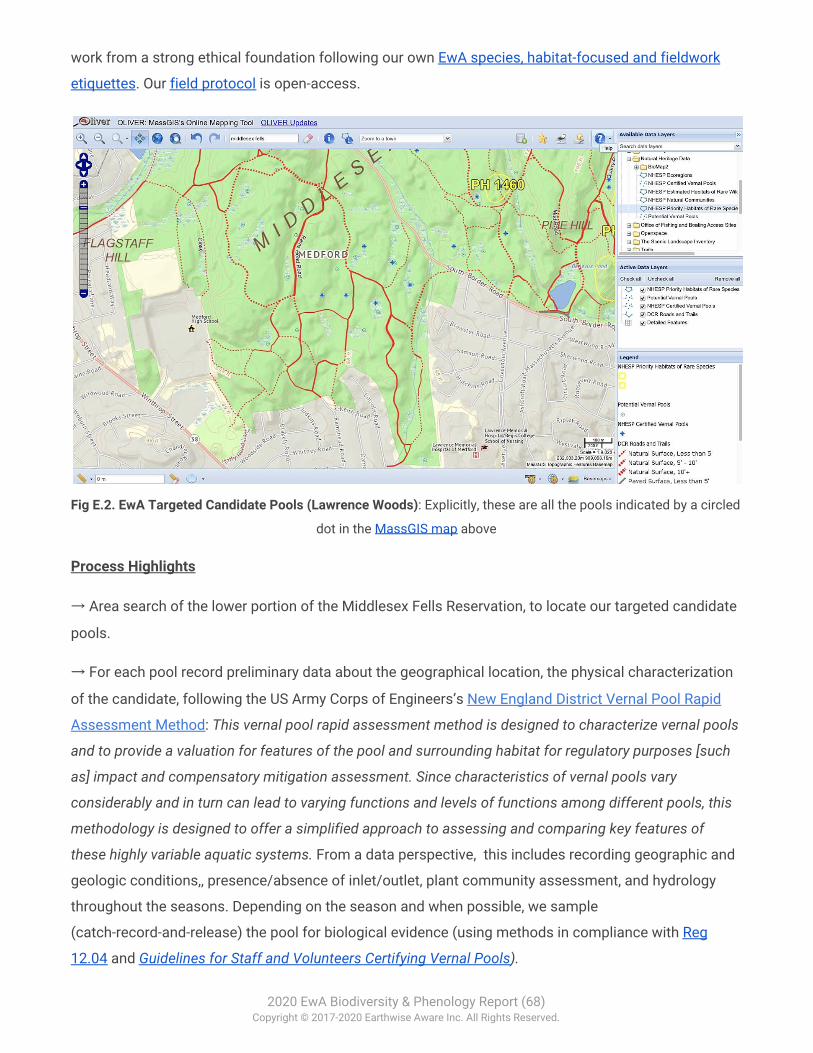
work from a strong ethical foundation following our own EwA species, habitat-focused and fieldwork
etiquettes. Our field protocol is open-access.
Fig E.2. EwA Targeted Candidate Pools (Lawrence Woods): Explicitly, these are all the pools indicated by a circled
dot in the MassGIS map above
Process Highlights
→ Area search of the lower portion of the Middlesex Fells Reservation, to locate our targeted candidate
pools.
→ For each pool record preliminary data about the geographical location, the physical characterization
of the candidate, following the US Army Corps of Engineers’s New England District Vernal Pool Rapid
Assessment Method: This vernal pool rapid assessment method is designed to characterize vernal pools
and to provide a valuation for features of the pool and surrounding habitat for regulatory purposes [such
as] impact and compensatory mitigation assessment. Since characteristics of vernal pools vary
considerably and in turn can lead to varying functions and levels of functions among different pools, this
methodology is designed to offer a simplified approach to assessing and comparing key features of
these highly variable aquatic systems. From a data perspective, this includes recording geographic and
geologic conditions,, presence/absence of inlet/outlet, plant community assessment, and hydrology
throughout the seasons. Depending on the season and when possible, we sample
(catch-record-and-release) the pool for biological evidence (using methods in compliance with Reg
12.04 and Guidelines for Staff and Volunteers Certifying Vernal Pools).
2020 EwA Biodiversity & Phenology Report (68) Copyright © 2017-2020 Earthwise Aware Inc. All Rights Reserved.
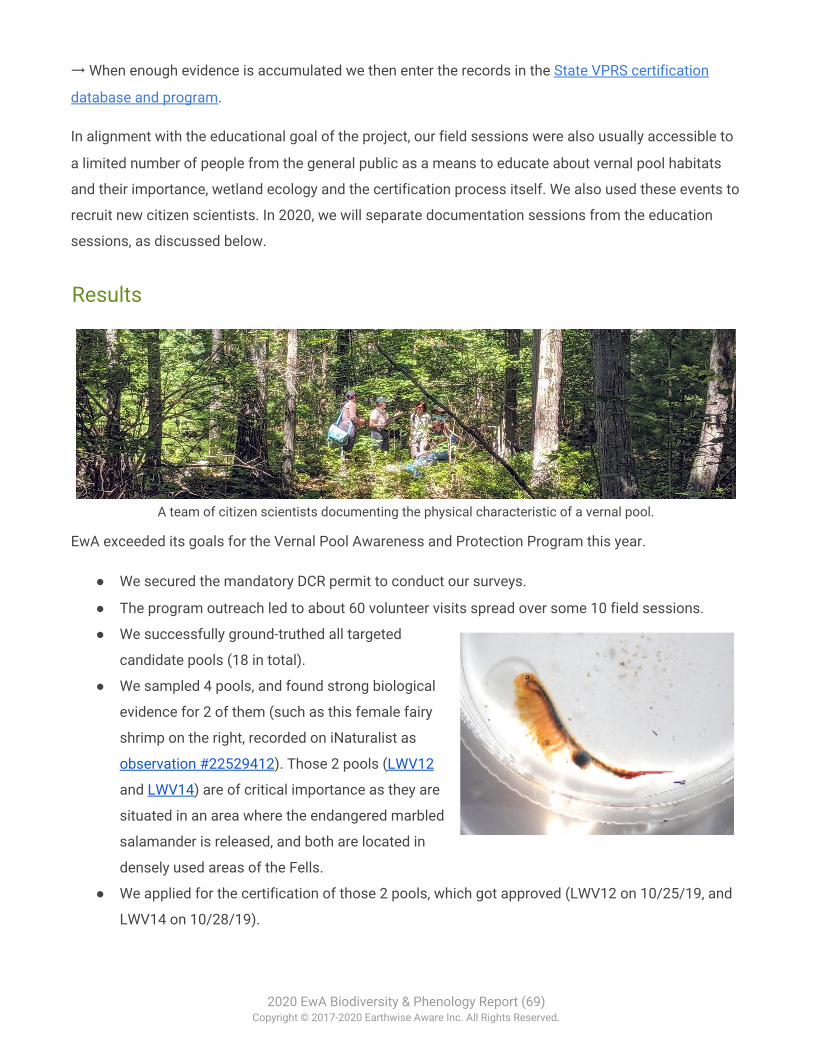
→ When enough evidence is accumulated we then enter the records in the State VPRS certification
database and program.
In alignment with the educational goal of the project, our field sessions were also usually accessible to
a limited number of people from the general public as a means to educate about vernal pool habitats
and their importance, wetland ecology and the certification process itself. We also used these events to
recruit new citizen scientists. In 2020, we will separate documentation sessions from the education
sessions, as discussed below.
Results
A team of citizen scientists documenting the physical characteristic of a vernal pool.
EwA exceeded its goals for the Vernal Pool Awareness and Protection Program this year.
● We secured the mandatory DCR permit to conduct our surveys.
● The program outreach led to about 60 volunteer visits spread over some 10 field sessions.
● We successfully ground-truthed all targeted
candidate pools (18 in total).
● We sampled 4 pools, and found strong biological
evidence for 2 of them (such as this female fairy
shrimp on the right, recorded on iNaturalist as
observation #22529412). Those 2 pools (LWV12
and LWV14) are of critical importance as they are
situated in an area where the endangered marbled
salamander is released, and both are located in
densely used areas of the Fells.
● We applied for the certification of those 2 pools, which got approved (LWV12 on 10/25/19, and
LWV14 on 10/28/19).
2020 EwA Biodiversity & Phenology Report (69) Copyright © 2017-2020 Earthwise Aware Inc. All Rights Reserved.
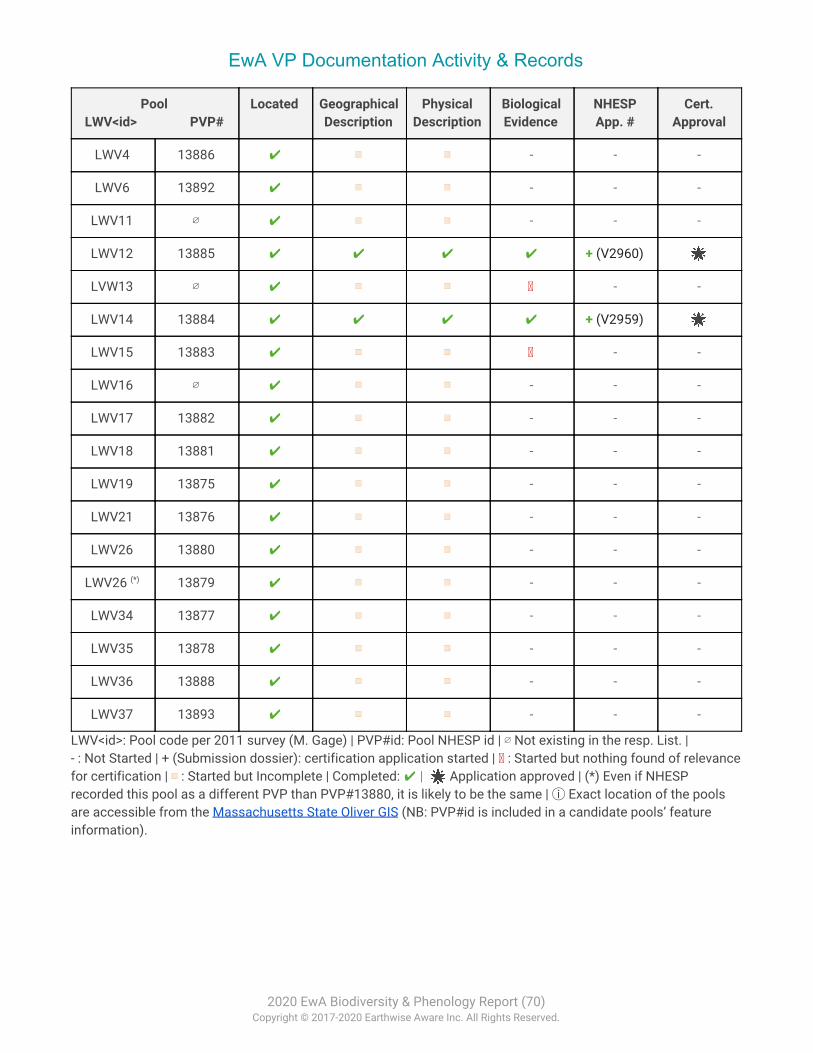
EwA VP Documentation Activity & Records
Pool LWV<id> PVP#
Located Geographical Description
Physical Description
Biological Evidence
NHESP App. #
Cert. Approval
LWV4 13886 ✔ ▥ ▥ - - -
LWV6 13892 ✔ ▥ ▥ - - -
LWV11 ∅ ✔ ▥ ▥ - - -
LWV12 13885 ✔ ✔ ✔ ✔ + (V2960) 🌟
LVW13 ∅ ✔ ▥ ▥ - -
LWV14 13884 ✔ ✔ ✔ ✔ + (V2959) 🌟
LWV15 13883 ✔ ▥ ▥ - -
LWV16 ∅ ✔ ▥ ▥ - - -
LWV17 13882 ✔ ▥ ▥ - - -
LWV18 13881 ✔ ▥ ▥ - - -
LWV19 13875 ✔ ▥ ▥ - - -
LWV21 13876 ✔ ▥ ▥ - - -
LWV26 13880 ✔ ▥ ▥ - - -
LWV26 (*) 13879 ✔ ▥ ▥ - - -
LWV34 13877 ✔ ▥ ▥ - - -
LWV35 13878 ✔ ▥ ▥ - - -
LWV36 13888 ✔ ▥ ▥ - - -
LWV37 13893 ✔ ▥ ▥ - - -
LWV<id>: Pool code per 2011 survey (M. Gage) | PVP#id: Pool NHESP id | ∅ Not existing in the resp. List. | - : Not Started | + (Submission dossier): certification application started | : Started but nothing found of relevance for certification | ▥ : Started but Incomplete | Completed: ✔ | 🌟 Application approved | (*) Even if NHESP recorded this pool as a different PVP than PVP#13880, it is likely to be the same | ⓘ Exact location of the pools are accessible from the Massachusetts State Oliver GIS (NB: PVP#id is included in a candidate pools’ feature information).
2020 EwA Biodiversity & Phenology Report (70) Copyright © 2017-2020 Earthwise Aware Inc. All Rights Reserved.

Difficulties & Lessons Learned
Separating Pool Documentation & Information Session
The ephemeral nature of vernal pools makes surveying for biological evidence a time-sensitive issue. In
2019, our window was relatively small; by July, most pools were dry, halting our search for many vernal
pool species. Having our documentation sessions open to the public provided a valuable educational
opportunity, but made the actual certification process less time-efficient. While public attendance was
limited in size, frequent educational interludes slowed the sampling and surveying process significantly.
Next year, we plan to separate public events from in-pool documentation and to make survey sessions
more focused. Dedicated pool documentation sessions will be separated from casual interpretative
events to show and inform the public about wetlands. We believe the creation of distinct events will
allow us to pursue both our educational and certification goals in a more fruitful manner.
DCR Permit & Partner Collaboration
Since the DCR manages the Fells, our documentation and certification program involved close
collaboration with said organization. As noted in the § Program Conservation Impact section, the DCR’s
stated operational goals in the Fells include supporting the inventory and certification of vernal pools,
as well as their sustained conservation. We appreciate our opportunity to work with the DCR in the
pursuit of these shared goals.
The permit we obtained from the DCR required a DCR representative to be present at all documentation
sessions, and all DCR staff who joined us during these sessions were valuable collaborators. However,
the DCR was at times unresponsive in organizing staff attendance of our scheduled events, which
forced us to cancel at the last minute on a few occasions. Unfortunately, it has been difficult and
time-consuming to work with the DCR schedule and under the permit’s constraints that it granted to
EwA.
To simplify the permit process going forward we proposed to Casey Dungan (the DCR ACEC &
Environmental Stewardship Assistant who is our current point of contact for this permit) to separate
documentation/certification field sessions from the educational sessions, as mentioned above. At the
beginning of 2020, we will renew/apply for a DCR research permit for the documentation/certification
sessions, where our expert staff and collaborators would undertake the effort of certifying potential
pools in the Fells without public participation.
Teaching our communities how to document and appreciate a pool with a minimal impact on its
inhabitants is one of our many objectives. Nothing is more efficient to achieve this than live sessions,
2020 EwA Biodiversity & Phenology Report (71) Copyright © 2017-2020 Earthwise Aware Inc. All Rights Reserved.
with experts in a pool, showing ‘how to pool’ to an audience. Since we have had difficulty reliably
scheduling such events in collaboration with the DCR, we must consider alternatives in the pursuit of
this goal. In an effort to further our vernal pool awareness outreach, we are considering vernal pool
specific educational events at other partner locations that offer the possibility for us to run sessions
that are meaningful for the public and designed for optimal educational impact.
Next? Certification cont’d, Vegetation Indicator Assessment, etc.
Besides renewing a DCR permit for 2020, and working at a successful collaboration with the DCR, we
intend to keep documenting and certifying the currently targeted candidate vernal pools.
Next year, we will also have a more complete process for describing pool plant communities. We wish
to establish an online recording tool and database (that we would be glad to share with any institution
interested in mainstreaming the recording of pool characteristics).
We want to refine our implementation of the Vernal Pool Rapid Assessment Method and include a
stronger means of evaluating plant communities. We are investigating several methods for this, which
include the Releve method (as described in the Delineating Bordering Vegetated Wetlands Under the
Massachusetts Wetlands Protection Act) or the Vegetation indicator method (used by the USDA
Nation’s Forest Census). We are also seeking a method that is more commonly used in the
wider/international community so as to make our data relevant at a global scale. This will enable full
and systematic descriptions and summary graphs of plant communities to be accessible publicly. Our
goal is to establish a strong database for the monitoring of changing conditions of those pools in a
rapidly changing landscape due to the accelerating effect of the climate emergency and the wildlife
crisis (a.k.a. global biodiversity loss).
The first year of our Vernal Pool Awareness & Protection Program was fruitful, and we look forward to
its continued growth. This year, we exceeded our goals of obtaining a DCR Research Access Permit and
ground-truthing pools, and even succeeded in certifying two pools. In 2020, we will work to further
develop this program, with an eye toward increasing both our certification capacity and the educational
impact of our events.
2020 EwA Biodiversity & Phenology Report (72) Copyright © 2017-2020 Earthwise Aware Inc. All Rights Reserved.
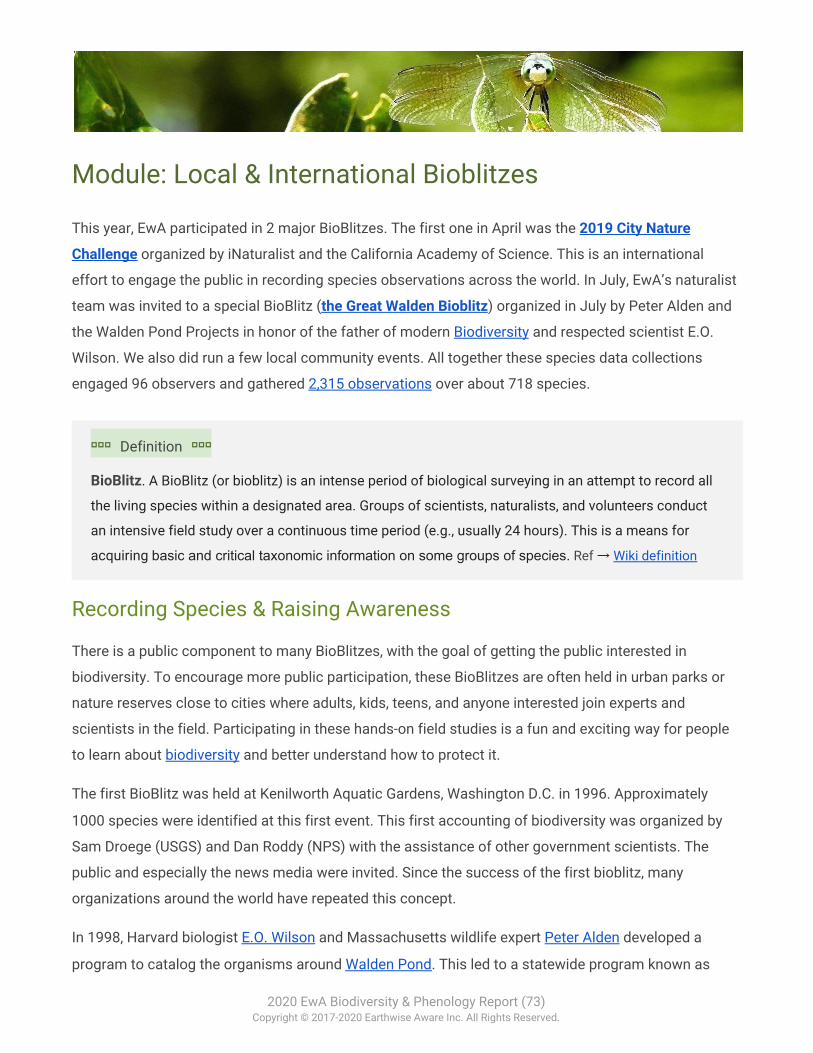
Module: Local & International Bioblitzes
This year, EwA participated in 2 major BioBlitzes. The first one in April was the 2019 City Nature
Challenge organized by iNaturalist and the California Academy of Science. This is an international
effort to engage the public in recording species observations across the world. In July, EwA’s naturalist
team was invited to a special BioBlitz (the Great Walden Bioblitz) organized in July by Peter Alden and
the Walden Pond Projects in honor of the father of modern Biodiversity and respected scientist E.O.
Wilson. We also did run a few local community events. All together these species data collections
engaged 96 observers and gathered 2,315 observations over about 718 species.
⬞⬞⬞ Definition ⬞⬞⬞
BioBlitz. A BioBlitz (or bioblitz) is an intense period of biological surveying in an attempt to record all
the living species within a designated area. Groups of scientists, naturalists, and volunteers conduct
an intensive field study over a continuous time period (e.g., usually 24 hours). This is a means for
acquiring basic and critical taxonomic information on some groups of species. Ref → Wiki definition
Recording Species & Raising Awareness
There is a public component to many BioBlitzes, with the goal of getting the public interested in
biodiversity. To encourage more public participation, these BioBlitzes are often held in urban parks or
nature reserves close to cities where adults, kids, teens, and anyone interested join experts and
scientists in the field. Participating in these hands-on field studies is a fun and exciting way for people
to learn about biodiversity and better understand how to protect it.
The first BioBlitz was held at Kenilworth Aquatic Gardens, Washington D.C. in 1996. Approximately
1000 species were identified at this first event. This first accounting of biodiversity was organized by
Sam Droege (USGS) and Dan Roddy (NPS) with the assistance of other government scientists. The
public and especially the news media were invited. Since the success of the first bioblitz, many
organizations around the world have repeated this concept.
In 1998, Harvard biologist E.O. Wilson and Massachusetts wildlife expert Peter Alden developed a
program to catalog the organisms around Walden Pond. This led to a statewide program known as
2020 EwA Biodiversity & Phenology Report (73) Copyright © 2017-2020 Earthwise Aware Inc. All Rights Reserved.
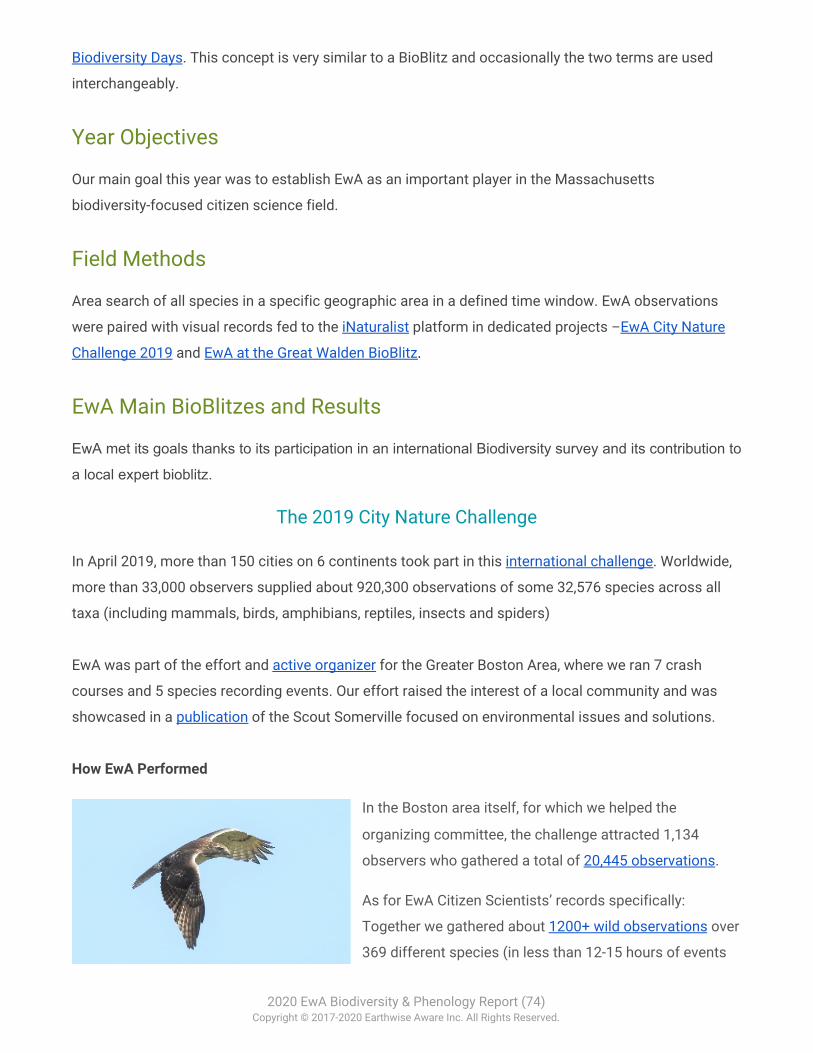
Biodiversity Days. This concept is very similar to a BioBlitz and occasionally the two terms are used
interchangeably.
Year Objectives
Our main goal this year was to establish EwA as an important player in the Massachusetts
biodiversity-focused citizen science field.
Field Methods
Area search of all species in a specific geographic area in a defined time window. EwA observations
were paired with visual records fed to the iNaturalist platform in dedicated projects –EwA City Nature
Challenge 2019 and EwA at the Great Walden BioBlitz.
EwA Main BioBlitzes and Results
EwA met its goals thanks to its participation in an international Biodiversity survey and its contribution to
a local expert bioblitz.
The 2019 City Nature Challenge
In April 2019, more than 150 cities on 6 continents took part in this international challenge. Worldwide,
more than 33,000 observers supplied about 920,300 observations of some 32,576 species across all
taxa (including mammals, birds, amphibians, reptiles, insects and spiders)
EwA was part of the effort and active organizer for the Greater Boston Area, where we ran 7 crash
courses and 5 species recording events. Our effort raised the interest of a local community and was
showcased in a publication of the Scout Somerville focused on environmental issues and solutions.
How EwA Performed
In the Boston area itself, for which we helped the
organizing committee, the challenge attracted 1,134
observers who gathered a total of 20,445 observations.
As for EwA Citizen Scientists’ records specifically:
Together we gathered about 1200+ wild observations over
369 different species (in less than 12-15 hours of events
2020 EwA Biodiversity & Phenology Report (74) Copyright © 2017-2020 Earthwise Aware Inc. All Rights Reserved.
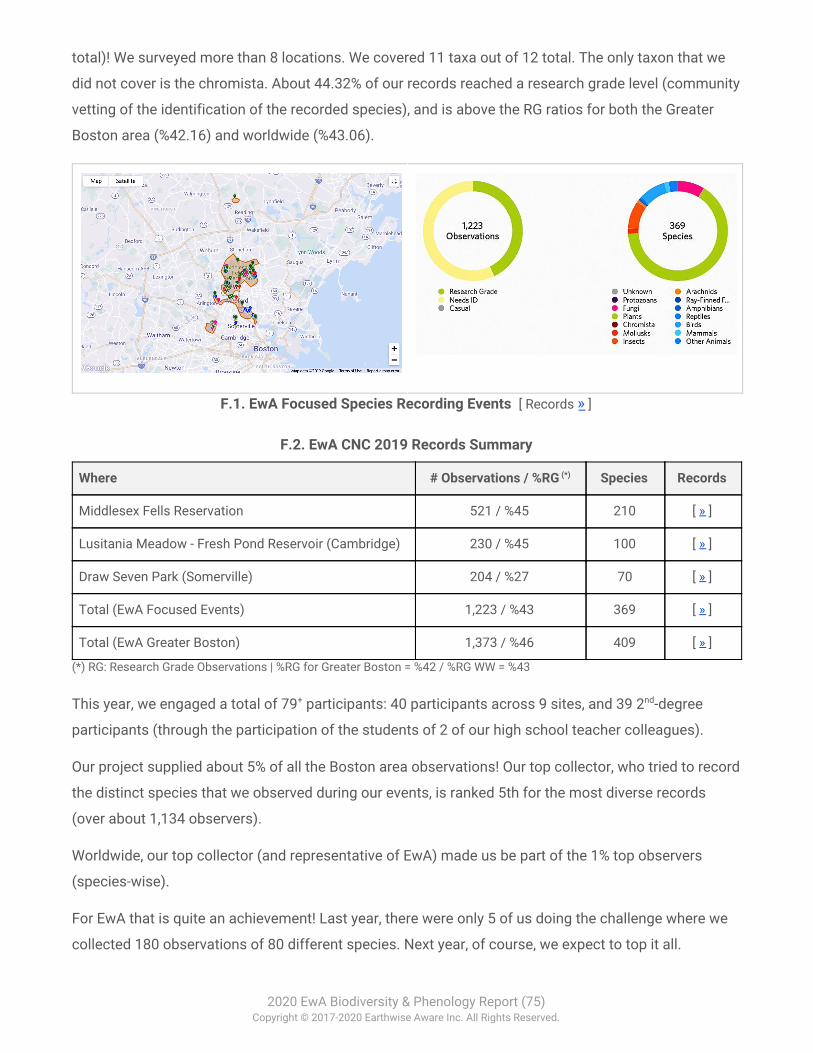
total)! We surveyed more than 8 locations. We covered 11 taxa out of 12 total. The only taxon that we
did not cover is the chromista. About 44.32% of our records reached a research grade level (community
vetting of the identification of the recorded species), and is above the RG ratios for both the Greater
Boston area (%42.16) and worldwide (%43.06).
F.1. EwA Focused Species Recording Events [ Records » ]
F.2. EwA CNC 2019 Records Summary
Where # Observations / %RG (*) Species Records
Middlesex Fells Reservation 521 / %45 210 [ » ]
Lusitania Meadow - Fresh Pond Reservoir (Cambridge) 230 / %45 100 [ » ]
Draw Seven Park (Somerville) 204 / %27 70 [ » ]
Total (EwA Focused Events) 1,223 / %43 369 [ » ]
Total (EwA Greater Boston) 1,373 / %46 409 [ » ]
(*) RG: Research Grade Observations | %RG for Greater Boston = %42 / %RG WW = %43
This year, we engaged a total of 79+ participants: 40 participants across 9 sites, and 39 2nd-degree
participants (through the participation of the students of 2 of our high school teacher colleagues).
Our project supplied about 5% of all the Boston area observations! Our top collector, who tried to record
the distinct species that we observed during our events, is ranked 5th for the most diverse records
(over about 1,134 observers).
Worldwide, our top collector (and representative of EwA) made us be part of the 1% top observers
(species-wise).
For EwA that is quite an achievement! Last year, there were only 5 of us doing the challenge where we
collected 180 observations of 80 different species. Next year, of course, we expect to top it all.
2020 EwA Biodiversity & Phenology Report (75) Copyright © 2017-2020 Earthwise Aware Inc. All Rights Reserved.
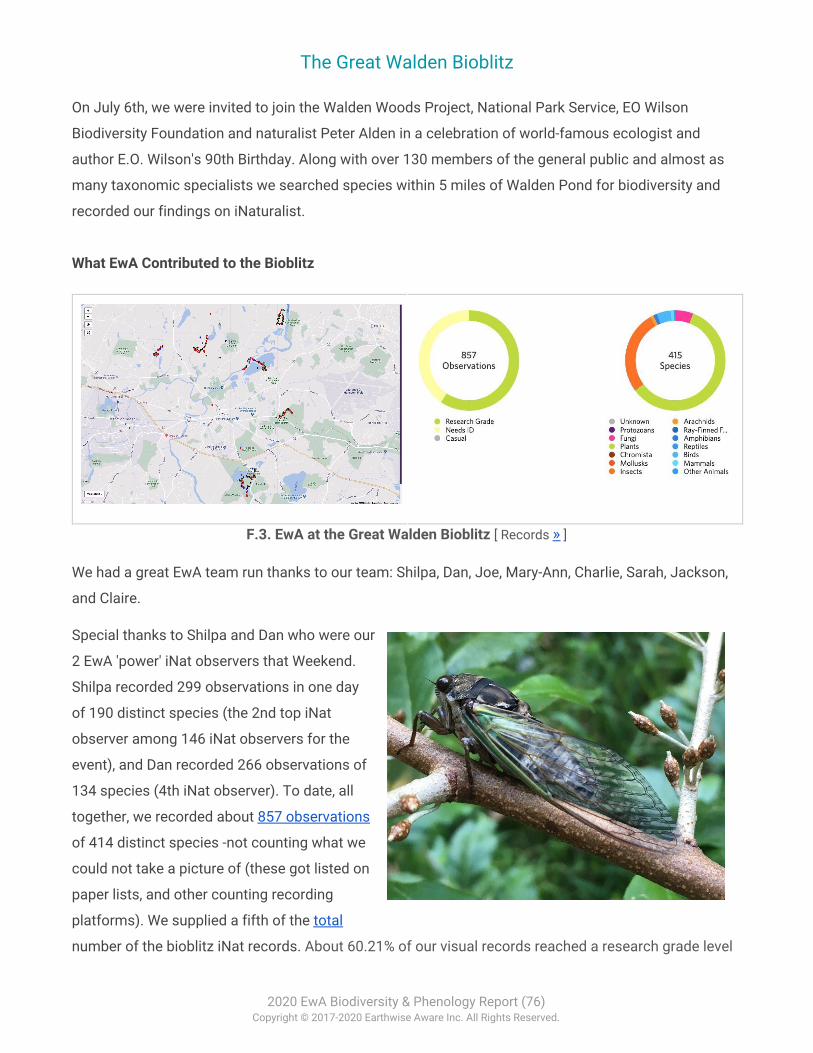
The Great Walden Bioblitz
On July 6th, we were invited to join the Walden Woods Project, National Park Service, EO Wilson
Biodiversity Foundation and naturalist Peter Alden in a celebration of world-famous ecologist and
author E.O. Wilson's 90th Birthday. Along with over 130 members of the general public and almost as
many taxonomic specialists we searched species within 5 miles of Walden Pond for biodiversity and
recorded our findings on iNaturalist.
What EwA Contributed to the Bioblitz
F.3. EwA at the Great Walden Bioblitz [ Records » ]
We had a great EwA team run thanks to our team: Shilpa, Dan, Joe, Mary-Ann, Charlie, Sarah, Jackson,
and Claire.
Special thanks to Shilpa and Dan who were our
2 EwA 'power' iNat observers that Weekend.
Shilpa recorded 299 observations in one day
of 190 distinct species (the 2nd top iNat
observer among 146 iNat observers for the
event), and Dan recorded 266 observations of
134 species (4th iNat observer). To date, all
together, we recorded about 857 observations
of 414 distinct species -not counting what we
could not take a picture of (these got listed on
paper lists, and other counting recording
platforms). We supplied a fifth of the total
number of the bioblitz iNat records. About 60.21% of our visual records reached a research grade level
2020 EwA Biodiversity & Phenology Report (76) Copyright © 2017-2020 Earthwise Aware Inc. All Rights Reserved.
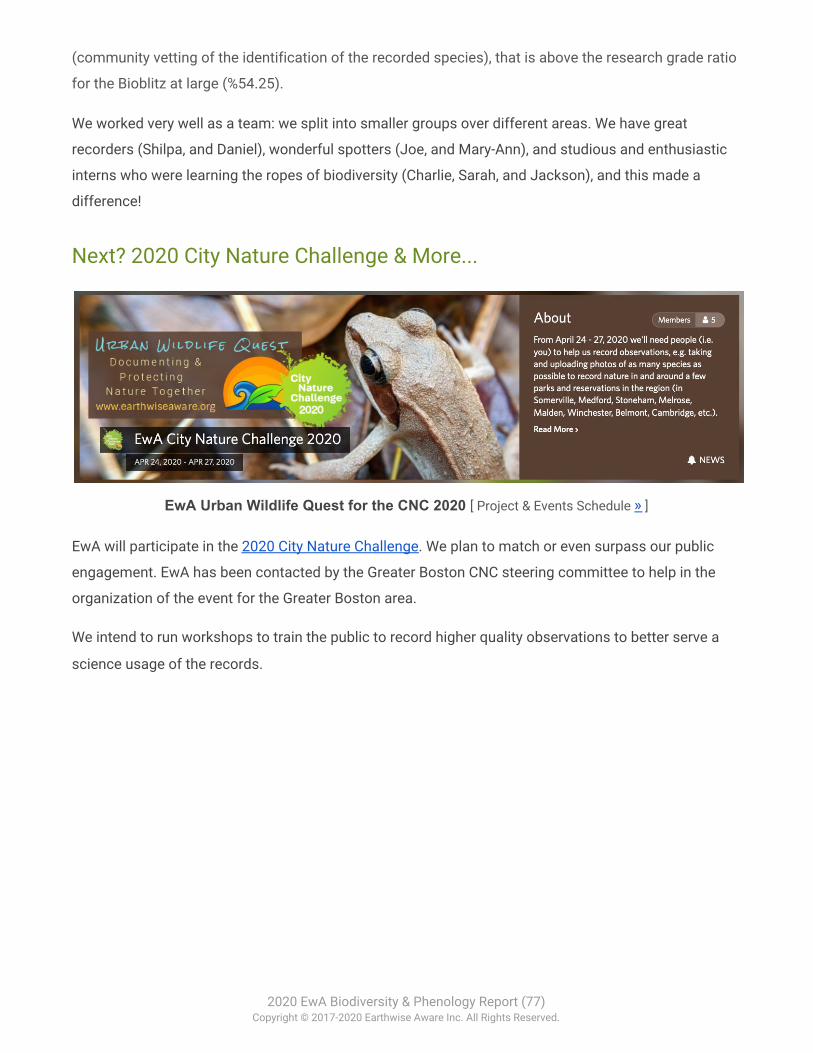
(community vetting of the identification of the recorded species), that is above the research grade ratio
for the Bioblitz at large (%54.25).
We worked very well as a team: we split into smaller groups over different areas. We have great
recorders (Shilpa, and Daniel), wonderful spotters (Joe, and Mary-Ann), and studious and enthusiastic
interns who were learning the ropes of biodiversity (Charlie, Sarah, and Jackson), and this made a
difference!
Next? 2020 City Nature Challenge & More...
EwA Urban Wildlife Quest for the CNC 2020 [ Project & Events Schedule » ]
EwA will participate in the 2020 City Nature Challenge. We plan to match or even surpass our public
engagement. EwA has been contacted by the Greater Boston CNC steering committee to help in the
organization of the event for the Greater Boston area.
We intend to run workshops to train the public to record higher quality observations to better serve a
science usage of the records.
2020 EwA Biodiversity & Phenology Report (77) Copyright © 2017-2020 Earthwise Aware Inc. All Rights Reserved.
Integrated Results & Discussion
Sites Setup, Protocols Refinement, Baseline Data & First Trends
2018’s effort was dedicated to our pilot project (in the Fells) and tested the feasibility and viability of
the EwA citizen science program.
2019 was dedicated to:
- Continuing to establish baseline data for our phenology sites.
- Continuing to gather baseline biodiversity data.
- Setting up new study sites and gathering first data for the arthropod and vernal pools.
- Strengthening our protocols, methods, and skills.
- Working on a first annual report to become the base of our reports for the years to come.
As detailed in all the modules, we reached all our goals and more.
From an integration standpoint, looking for trends in the first years of a Natural history program is
neither sound nor relevant. In the natural world, it takes a few natural cycles before one can understand
the base of a system and how it changes over time. We are into our first cycle and a half for our
phenology and general biodiversity occurrence, and in our first cycle for arthropod and vernal pool
habitats studies. The program needs a good additional full cycle to start producing relevant biodiversity
statistics and ecological trends, which we will start focusing on in 2020.
This being said we produced a lot of interesting baseline data, some even special as in the case of our
special species sightings, and the interesting patterns in our arthropod occurrence and abundance data
across our urban sites. Please refer to the ‘Results’ section of each of the EwA our modules for details:
● Module: Biodiversity Occurence & Distribution > Results
● Module: Phenology – Timing of Events on Fauna & Flora > Results
● Module: Terrestrial Arthropod Abundance & Composition > Results
● Module: Vernal Pool Habitat Documentation & Certification > Results
2020 EwA Biodiversity & Phenology Report (78) Copyright © 2017-2020 Earthwise Aware Inc. All Rights Reserved.
Lessons Learned (General) and Recommendations
Each module in this report lists study-specific lessons learned. We list below additional general recommendations.
Think ‘System’—Systems Thinking in Action
When you evaluate a candidate study site, think hard about how it will fulfill your program now and in
the future. If you don’t do that, you might end up with a site that is a singularity point in your study and
that is not relevant in the big picture.
Here are a few important considerations:
● Is that site representative enough (of the local habitats and ecological conditions)?
● Is it accessible enough so that you can guarantee regular recordings? If it takes too much effort
to get there, then it is likely that the site will not be visited.
● Is it in a location that is away enough from too much human disturbance? If not, you might
experience damage as in the case of the few species that got vandalized, or you might have
difficulties gathering data as wildlife has tolerance for disturbance.
● Does your site suits one or several of your studies? Having a site that can fulfill several studies
increase the interest of the public and ease the data collection for our citizen scientists.
Avoiding Manual Recording When Possible
A few of us are data people, so it was clear from the beginning that an important goal is to reduce the
taking of manual notes as much as possible. Why is that? Simple. Nothing is more prone to errors than
manual recording: poor hand-writing (unreadable for those who transfer scribe the data), incomplete
notes that make no sense when revisited weeks, months or even years later cripple data quality. Often
those spreadsheets remain actually in a drawer somewhere, and those hard to read are left out. This
reflects a poor scientific method and leads to poor data quality (if even usable). Those issues are much
more common than you think in the science world.
The advance of smartphone and tablet technology is a game-changer. There is no good reason
anymore to not have a digital form out there to help scientists, and their citizen scientists and
para-ecologists to gather data in a structured way. The next step is to make sure that the data itself is
open and follow national, even international standards and is accessible not just to your local interest
groups but to scientists nationally and globally. Anything less is becoming questionable (from a
science and ethical perspective).
2020 EwA Biodiversity & Phenology Report (79) Copyright © 2017-2020 Earthwise Aware Inc. All Rights Reserved.
A few times people have asked how we accommodate our citizen scientists who are not tech-savvy.
Our answer is that we show that we care about them. We build their skills - we train them - we pair them
with a citizen scientist who records with a phone or a tablet. We share our tablet and we show them
how to do it. These are critical skills to have these days for anybody and that alone amounts to show
inclusiveness. This is part of the act of giving science back to the people.
Challenge Protocol & Data Quality
Inspect and clean the data right after a field session! It eliminates data lag and miss. It reduces the
number of errors introduced when moving data from unclear transcripts to the study database. It also
gives the chance to catch identification and estimation error early and ask for clarification (to the
citizen scientists who recorded that observation) right away before the memory of the record is gone.
Thrive for quality. When it comes to nature system studies, the variation in the quality of the collected
data is a challenge (whether this data is collected by experts or by trained citizen scientists). We intend
to increase data quality further by providing more training and classes to our communities about how
to document biodiversity and phenology, how to verify the data, as well as how to question study
protocol.
Conclusion: Moving from Description to Inference – Empowering our Communities We conclude with the big picture for the EwA naturalist program and we remind our audience of our
overall goal for the years to come.
The first couple of years of a naturalist program such as EwA’s are usually focused on scouting study
locations, establishing sites, setting up study procedures, testing methods, gathering baseline data, and
analyzing results and the quality of the output so as to modify, or adjust, or both.
We are a year and a half into our program, and we have accomplished all of the above. We are now
ready to start our second complete year of recording.
The next couple of years at EwA will continue to unearth the foundation of the ecological narrative of
our urban landscapes. Nature is telling us its stories and guiding us about what to do and not do, we’re
here to listen to those stories and share them.
Concretely, this means that we will strengthen all our sites and deepen our relationship with our many
partners and collaborators. We will continue to gather baseline ecological knowledge so that we have a
2020 EwA Biodiversity & Phenology Report (80) Copyright © 2017-2020 Earthwise Aware Inc. All Rights Reserved.
good foundation for revealing important discoveries and trends. We will refine our protocols so as to
unify as much as possible our methods and our different databases.
As our community of citizen scientists and expert collaborators grows, we are stronger and ever more
committed to building upon our accomplishments. Soon, as our projects gather data regularly
throughout the years, we will be able to report/infer patterns and trends for our local urban wildlife
across taxa and time.
We also keep growing partnerships throughout the region so that other organizations and communities
join the effort. This regional effort needs to favor standardized methods so that we can aggregate our
data together. Doing so, we will all be in a position where we can empower the people and our
communities to influence decision-makers to act according to climate and ecological priorities.
The Importance of Modern ‘Data-based’ Natural History
“In the years ahead, naturalists have a vital role to play in the future of the world. Next to professional
scientists, they are one of the most important groups of people, for with their help in learning about the
world, and in protecting it and persuading others to protect it, they will become the guardians of our
planet and of our welfare as a species” - Gerald Durrell
This report began with this quote from Gerald Durrel, a famous naturalist, who through his eloquent
nature writing inspired many of us at EwA. Some 30 years after he communicated the importance and
the role of naturalists in responding to the current crisis, we attended an event led by another inspiring
figure: E.O.Wilson. At the occasion of his 90th birthday celebration Bioblitz, Dr. Wilson also raised the
urgency to study nature systems so that we learn how to protect and restore the very much wounded
fabric of Life.
EwA has grown into the organization it is today in response to both the need to study nature and the
importance of naturalists in facing the challenges that confront our species. This report highlights the
beginning of a journey. As our community of citizen scientists and expert collaborators grows, we
become stronger and ever more committed to building upon our accomplishments. We invite you to be
part of our local natural history. Join our effort. Be an EwA naturalist! [ EwA Citizen Science Program → ]
2020 EwA Biodiversity & Phenology Report (81) Copyright © 2017-2020 Earthwise Aware Inc. All Rights Reserved.
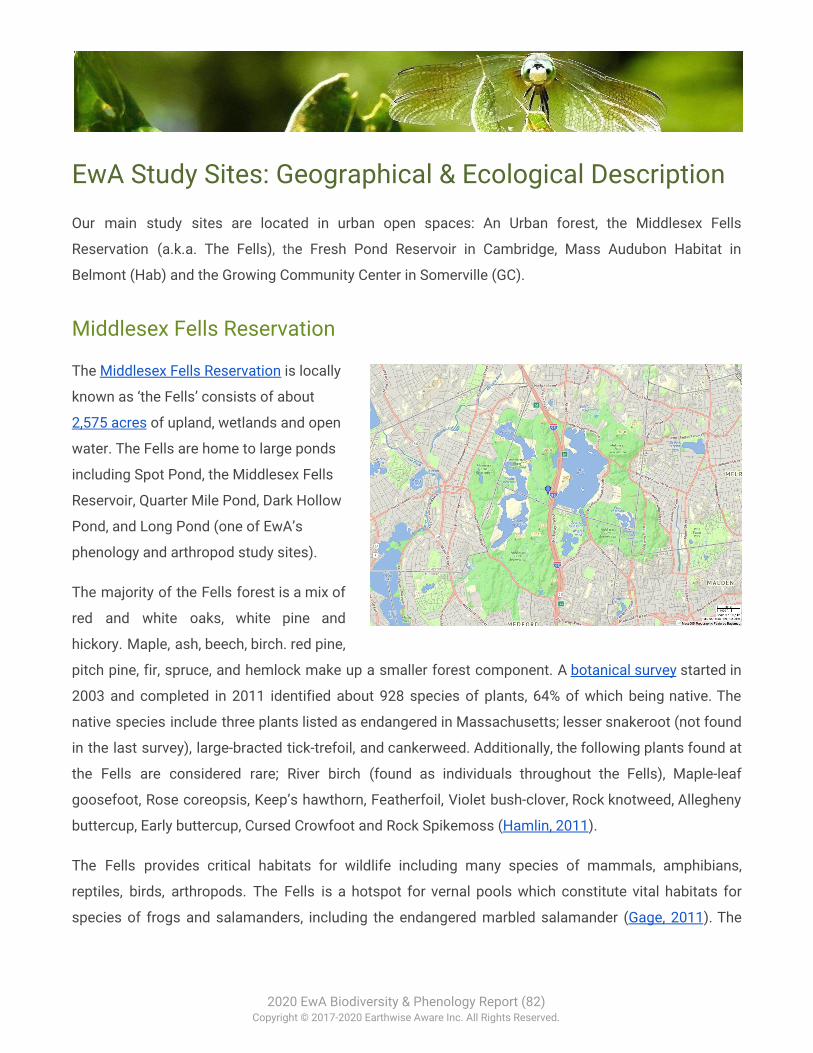
EwA Study Sites: Geographical & Ecological Description
Our main study sites are located in urban open spaces: An Urban forest, the Middlesex Fells
Reservation (a.k.a. The Fells), the Fresh Pond Reservoir in Cambridge, Mass Audubon Habitat in
Belmont (Hab) and the Growing Community Center in Somerville (GC).
Middlesex Fells Reservation
The Middlesex Fells Reservation is locally
known as ‘the Fells’ consists of about
2,575 acres of upland, wetlands and open
water. The Fells are home to large ponds
including Spot Pond, the Middlesex Fells
Reservoir, Quarter Mile Pond, Dark Hollow
Pond, and Long Pond (one of EwA’s
phenology and arthropod study sites).
The majority of the Fells forest is a mix of
red and white oaks, white pine and
hickory. Maple, ash, beech, birch. red pine,
pitch pine, fir, spruce, and hemlock make up a smaller forest component. A botanical survey started in
2003 and completed in 2011 identified about 928 species of plants, 64% of which being native. The
native species include three plants listed as endangered in Massachusetts; lesser snakeroot (not found
in the last survey), large-bracted tick-trefoil, and cankerweed. Additionally, the following plants found at
the Fells are considered rare; River birch (found as individuals throughout the Fells), Maple-leaf
goosefoot, Rose coreopsis, Keep’s hawthorn, Featherfoil, Violet bush-clover, Rock knotweed, Allegheny
buttercup, Early buttercup, Cursed Crowfoot and Rock Spikemoss (Hamlin, 2011).
The Fells provides critical habitats for wildlife including many species of mammals, amphibians,
reptiles, birds, arthropods. The Fells is a hotspot for vernal pools which constitute vital habitats for
species of frogs and salamanders, including the endangered marbled salamander (Gage, 2011). The
2020 EwA Biodiversity & Phenology Report (82) Copyright © 2017-2020 Earthwise Aware Inc. All Rights Reserved.
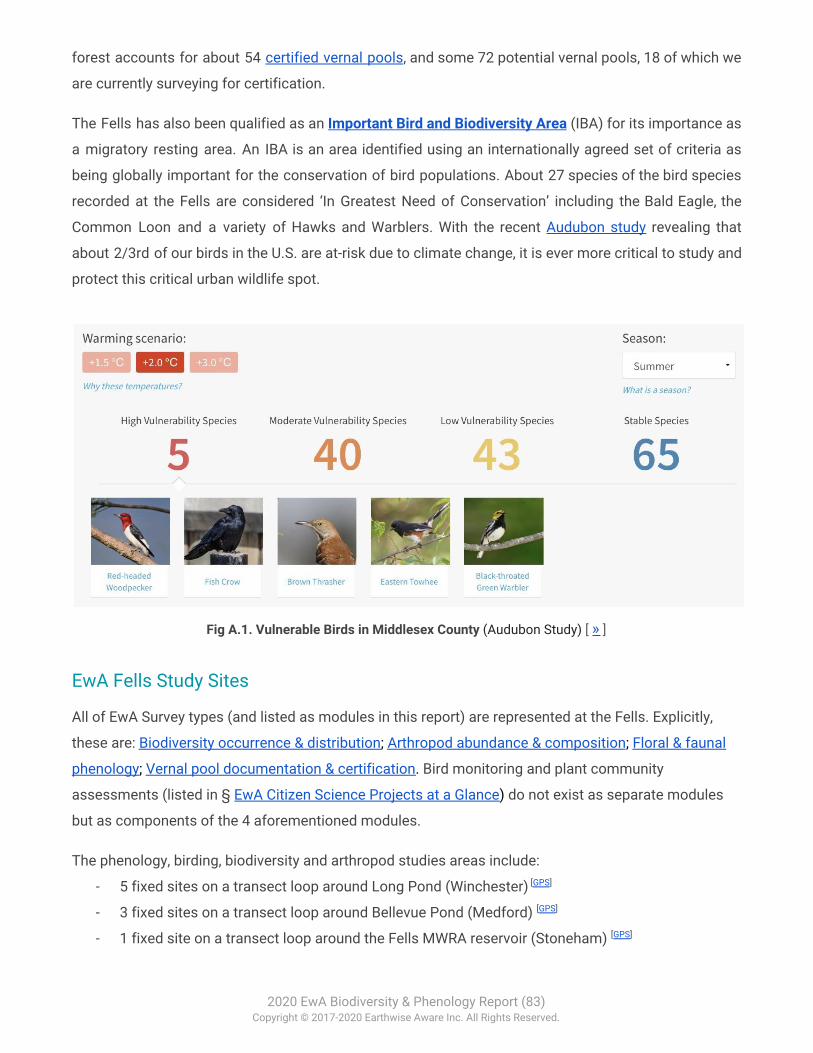
forest accounts for about 54 certified vernal pools, and some 72 potential vernal pools, 18 of which we
are currently surveying for certification.
The Fells has also been qualified as an Important Bird and Biodiversity Area (IBA) for its importance as
a migratory resting area. An IBA is an area identified using an internationally agreed set of criteria as
being globally important for the conservation of bird populations. About 27 species of the bird species
recorded at the Fells are considered ‘In Greatest Need of Conservation’ including the Bald Eagle, the
Common Loon and a variety of Hawks and Warblers. With the recent Audubon study revealing that
about 2/3rd of our birds in the U.S. are at-risk due to climate change, it is ever more critical to study and
protect this critical urban wildlife spot.
Fig A.1. Vulnerable Birds in Middlesex County (Audubon Study) [ » ]
EwA Fells Study Sites
All of EwA Survey types (and listed as modules in this report) are represented at the Fells. Explicitly,
these are: Biodiversity occurrence & distribution; Arthropod abundance & composition; Floral & faunal
phenology; Vernal pool documentation & certification. Bird monitoring and plant community
assessments (listed in § EwA Citizen Science Projects at a Glance) do not exist as separate modules
but as components of the 4 aforementioned modules.
The phenology, birding, biodiversity and arthropod studies areas include:
- 5 fixed sites on a transect loop around Long Pond (Winchester) [GPS]
- 3 fixed sites on a transect loop around Bellevue Pond (Medford) [GPS]
- 1 fixed site on a transect loop around the Fells MWRA reservoir (Stoneham) [GPS]
2020 EwA Biodiversity & Phenology Report (83) Copyright © 2017-2020 Earthwise Aware Inc. All Rights Reserved.
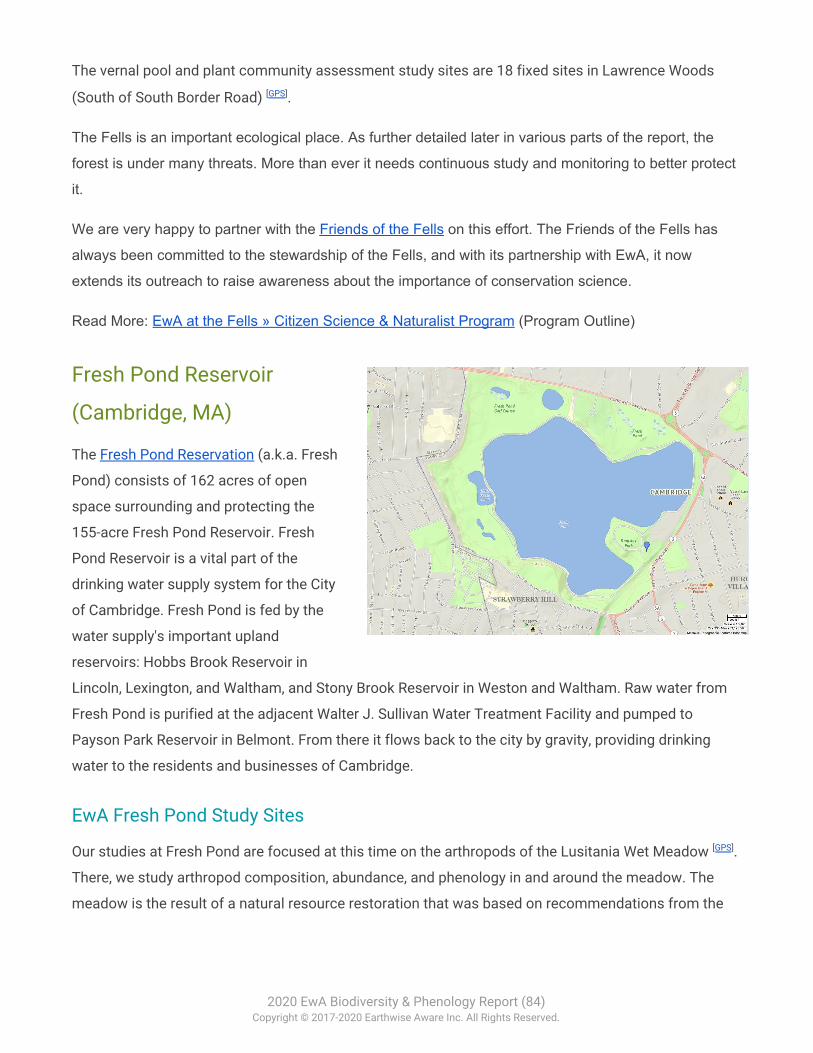
The vernal pool and plant community assessment study sites are 18 fixed sites in Lawrence Woods
(South of South Border Road) [GPS].
The Fells is an important ecological place. As further detailed later in various parts of the report, the
forest is under many threats. More than ever it needs continuous study and monitoring to better protect
it.
We are very happy to partner with the Friends of the Fells on this effort. The Friends of the Fells has
always been committed to the stewardship of the Fells, and with its partnership with EwA, it now
extends its outreach to raise awareness about the importance of conservation science.
Read More: EwA at the Fells » Citizen Science & Naturalist Program (Program Outline)
Fresh Pond Reservoir
(Cambridge, MA)
The Fresh Pond Reservation (a.k.a. Fresh
Pond) consists of 162 acres of open
space surrounding and protecting the
155-acre Fresh Pond Reservoir. Fresh
Pond Reservoir is a vital part of the
drinking water supply system for the City
of Cambridge. Fresh Pond is fed by the
water supply's important upland
reservoirs: Hobbs Brook Reservoir in
Lincoln, Lexington, and Waltham, and Stony Brook Reservoir in Weston and Waltham. Raw water from
Fresh Pond is purified at the adjacent Walter J. Sullivan Water Treatment Facility and pumped to
Payson Park Reservoir in Belmont. From there it flows back to the city by gravity, providing drinking
water to the residents and businesses of Cambridge.
EwA Fresh Pond Study Sites
Our studies at Fresh Pond are focused at this time on the arthropods of the Lusitania Wet Meadow [GPS].
There, we study arthropod composition, abundance, and phenology in and around the meadow. The
meadow is the result of a natural resource restoration that was based on recommendations from the
2020 EwA Biodiversity & Phenology Report (84) Copyright © 2017-2020 Earthwise Aware Inc. All Rights Reserved.
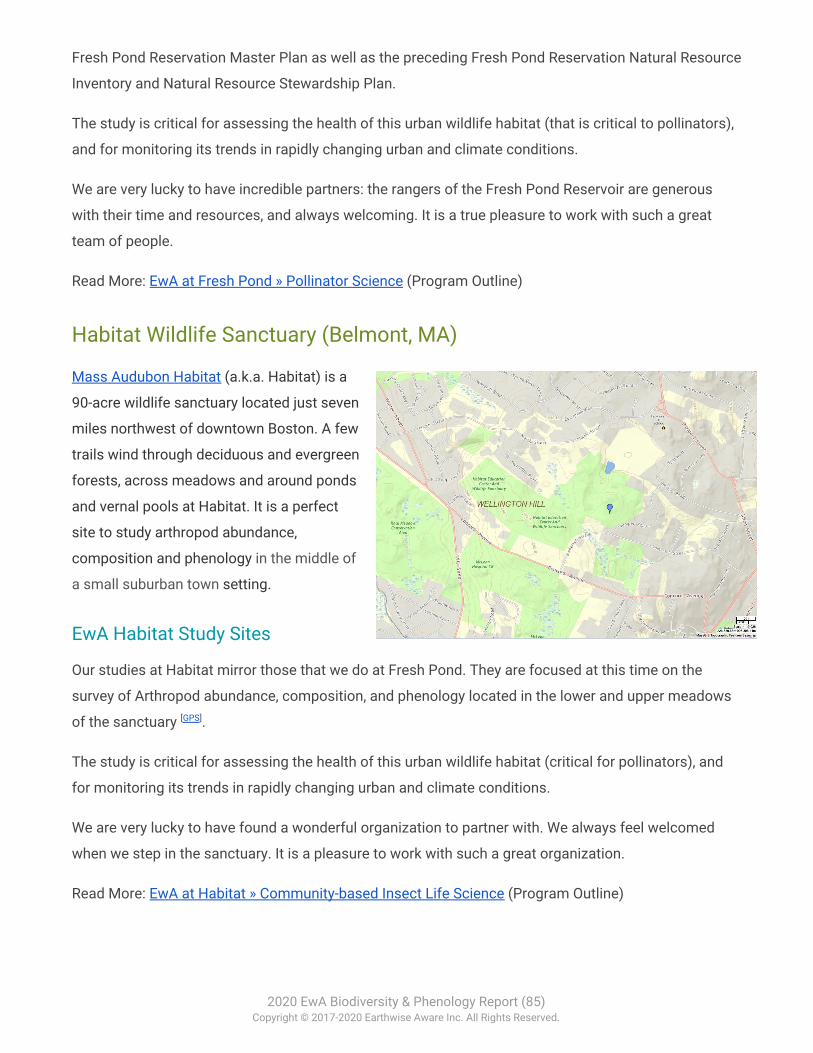
Fresh Pond Reservation Master Plan as well as the preceding Fresh Pond Reservation Natural Resource
Inventory and Natural Resource Stewardship Plan.
The study is critical for assessing the health of this urban wildlife habitat (that is critical to pollinators),
and for monitoring its trends in rapidly changing urban and climate conditions.
We are very lucky to have incredible partners: the rangers of the Fresh Pond Reservoir are generous
with their time and resources, and always welcoming. It is a true pleasure to work with such a great
team of people.
Read More: EwA at Fresh Pond » Pollinator Science (Program Outline)
Habitat Wildlife Sanctuary (Belmont, MA)
Mass Audubon Habitat (a.k.a. Habitat) is a
90-acre wildlife sanctuary located just seven
miles northwest of downtown Boston. A few
trails wind through deciduous and evergreen
forests, across meadows and around ponds
and vernal pools at Habitat. It is a perfect
site to study arthropod abundance,
composition and phenology in the middle of
a small suburban town setting.
EwA Habitat Study Sites
Our studies at Habitat mirror those that we do at Fresh Pond. They are focused at this time on the
survey of Arthropod abundance, composition, and phenology located in the lower and upper meadows
of the sanctuary [GPS].
The study is critical for assessing the health of this urban wildlife habitat (critical for pollinators), and
for monitoring its trends in rapidly changing urban and climate conditions.
We are very lucky to have found a wonderful organization to partner with. We always feel welcomed
when we step in the sanctuary. It is a pleasure to work with such a great organization.
Read More: EwA at Habitat » Community-based Insect Life Science (Program Outline)
2020 EwA Biodiversity & Phenology Report (85) Copyright © 2017-2020 Earthwise Aware Inc. All Rights Reserved.
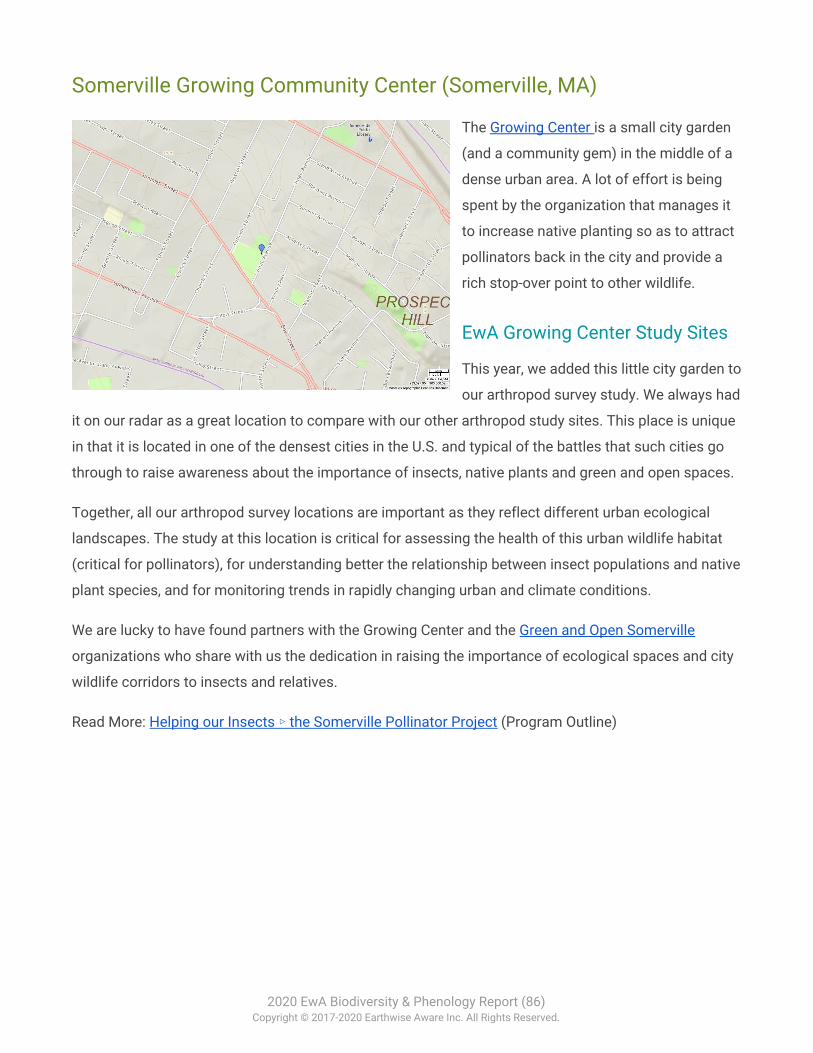
Somerville Growing Community Center (Somerville, MA)
The Growing Center is a small city garden
(and a community gem) in the middle of a
dense urban area. A lot of effort is being
spent by the organization that manages it
to increase native planting so as to attract
pollinators back in the city and provide a
rich stop-over point to other wildlife.
EwA Growing Center Study Sites
This year, we added this little city garden to
our arthropod survey study. We always had
it on our radar as a great location to compare with our other arthropod study sites. This place is unique
in that it is located in one of the densest cities in the U.S. and typical of the battles that such cities go
through to raise awareness about the importance of insects, native plants and green and open spaces.
Together, all our arthropod survey locations are important as they reflect different urban ecological
landscapes. The study at this location is critical for assessing the health of this urban wildlife habitat
(critical for pollinators), for understanding better the relationship between insect populations and native
plant species, and for monitoring trends in rapidly changing urban and climate conditions.
We are lucky to have found partners with the Growing Center and the Green and Open Somerville
organizations who share with us the dedication in raising the importance of ecological spaces and city
wildlife corridors to insects and relatives.
Read More: Helping our Insects ▹ the Somerville Pollinator Project (Program Outline)
2020 EwA Biodiversity & Phenology Report (86) Copyright © 2017-2020 Earthwise Aware Inc. All Rights Reserved.
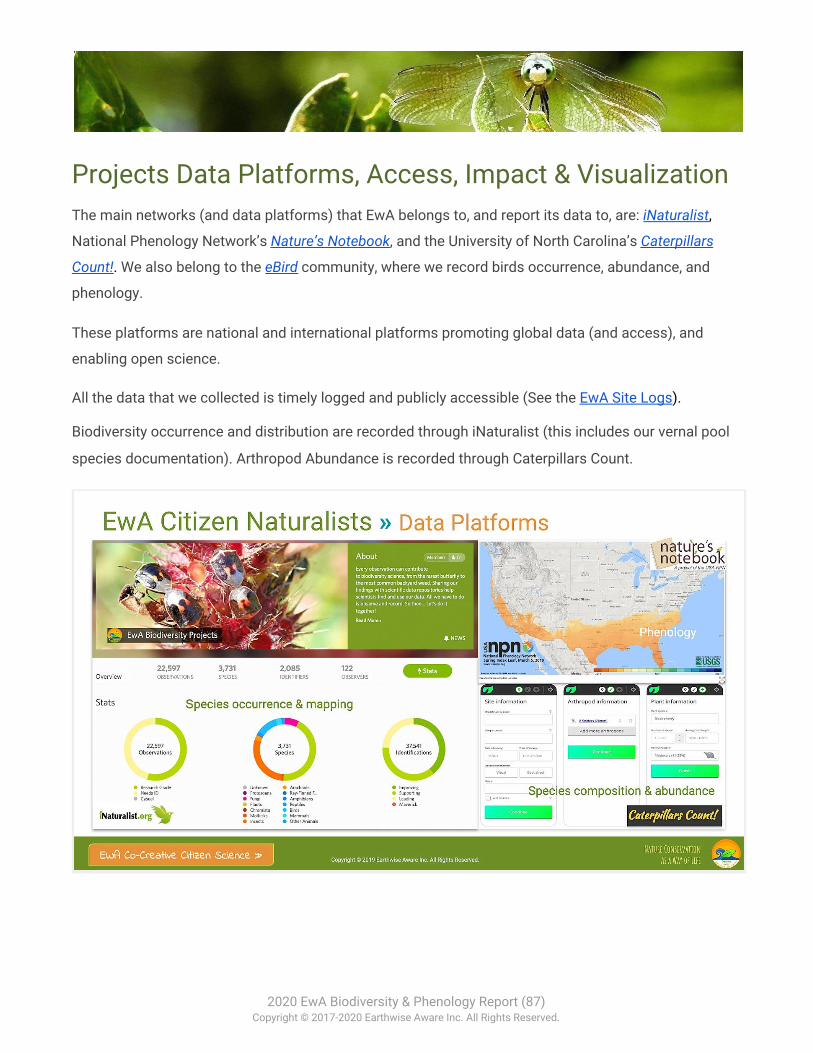
Projects Data Platforms, Access, Impact & Visualization The main networks (and data platforms) that EwA belongs to, and report its data to, are: iNaturalist,
National Phenology Network’s Nature’s Notebook, and the University of North Carolina’s Caterpillars
Count!. We also belong to the eBird community, where we record birds occurrence, abundance, and
phenology.
These platforms are national and international platforms promoting global data (and access), and
enabling open science.
All the data that we collected is timely logged and publicly accessible (See the EwA Site Logs).
Biodiversity occurrence and distribution are recorded through iNaturalist (this includes our vernal pool
species documentation). Arthropod Abundance is recorded through Caterpillars Count.
2020 EwA Biodiversity & Phenology Report (87) Copyright © 2017-2020 Earthwise Aware Inc. All Rights Reserved.
About iNaturalist: Mapping Species Occurrence
What is iNaturalist? Excerpt from: Strategies Employed by Citizen Science Programs to Increase the Credibility of Their Data. Freitag,
A., Meyer, R. and Whiteman, L., 2016. Citizen Science: Theory and Practice, 1(1), p.2. DOI: 10.5334/cstp.6
“iNaturalist, based at the California Academy of Sciences, relies upon broad participation from a wide
variety of people to create a global database of biodiversity observations. Through its web- and
app-based platform, anyone can sign up, take a picture of any organism, and report it, regardless of
expertise. Most contributions come from smartphones, whose photos automate and standardize
location and time records. Users can also set up projects within iNaturalist, asking additional questions
about observations such as weather conditions or animal behavior.
iNaturalist uses five strategies to demonstrate credibility: ranking system, technological aids, validated
observations, publication, and management use. The large number of observations cultivated through a
large volunteer base tease out the signal from the noise and data can be compared from different
volunteers at the same location. Verification also happens through discussion of observations among
users. When no designated expert is available to definitively identify an observation, consensus among
at least two-thirds of identifiers can elevate an observation to “research grade.” All such data are
published to the Global Biodiversity Information Facility (GBIF), from which researchers around the
world frequently download data for biodiversity analyses.
Observational data is where much of ecological science begins, and volunteers gain skills through
participation. The leaders of iNaturalist are open about the limitations of opportunistic observations
submitted by users but maintain their importance in global ecology. Volunteers are encouraged to be
honest about their capabilities – i.e, to report observations as unknown rather than guessing at
identifications. In addition, the social nature of the platform allows users with more expertise to lend
credibility to the data by identifying unknown observations and verifying others. Developers are
currently working on features that will support additional kinds of data collection such as transects or
effort reporting.
Because iNaturalist relies on a large number of volunteers distributed throughout the world, checks on
credibility are loaded at the end of the data-collection process. Rather than ensuring that all
observations are accurate, the system works to identify high quality data from within the larger pool of
contributions. This means that many observations will never be used. However, it also means that
anyone with access to the requisite technology can participate regardless of prior knowledge, and that
anyone can take advantage of the educational opportunities that iNaturalist provides through access to
2020 EwA Biodiversity & Phenology Report (88) Copyright © 2017-2020 Earthwise Aware Inc. All Rights Reserved.
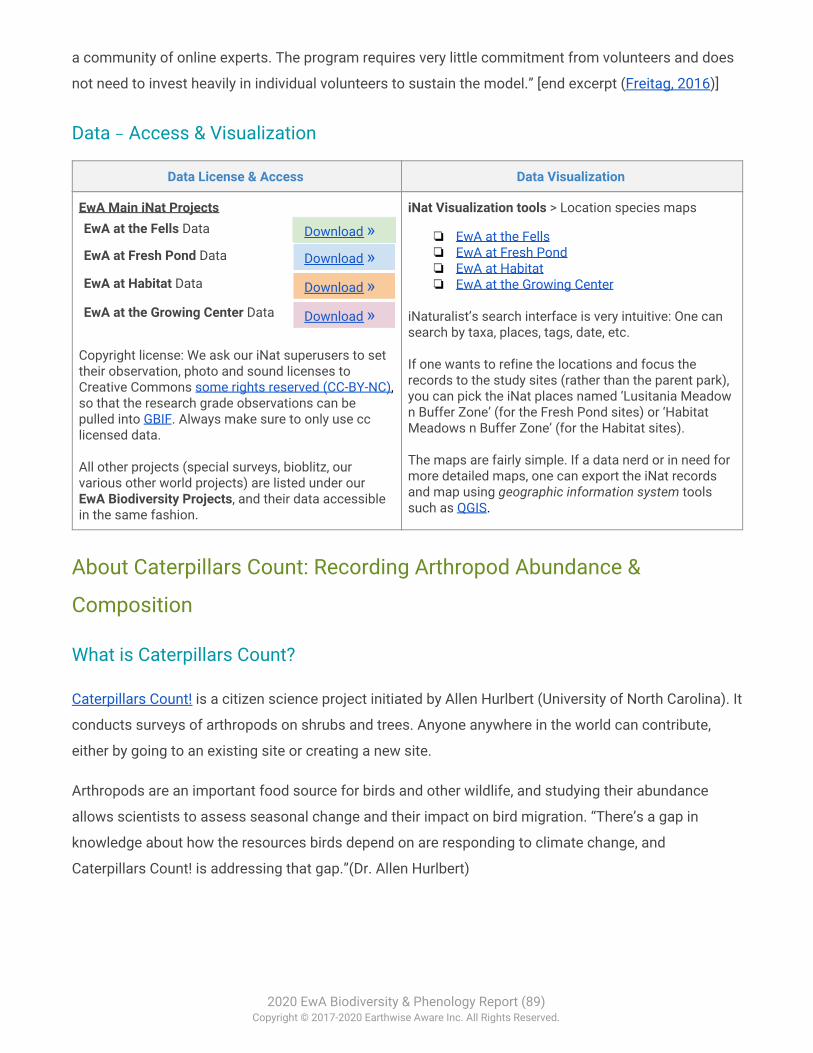
a community of online experts. The program requires very little commitment from volunteers and does
not need to invest heavily in individual volunteers to sustain the model.” [end excerpt (Freitag, 2016)]
Data – Access & Visualization
Data License & Access Data Visualization
EwA Main iNat Projects EwA at the Fells Data Download »
EwA at Fresh Pond Data Download »
EwA at Habitat Data Download »
EwA at the Growing Center Data Download »
Copyright license: We ask our iNat superusers to set their observation, photo and sound licenses to Creative Commons some rights reserved (CC-BY-NC), so that the research grade observations can be pulled into GBIF. Always make sure to only use cc licensed data. All other projects (special surveys, bioblitz, our various other world projects) are listed under our EwA Biodiversity Projects, and their data accessible in the same fashion.
iNat Visualization tools > Location species maps
❏ EwA at the Fells ❏ EwA at Fresh Pond ❏ EwA at Habitat ❏ EwA at the Growing Center
iNaturalist’s search interface is very intuitive: One can search by taxa, places, tags, date, etc. If one wants to refine the locations and focus the records to the study sites (rather than the parent park), you can pick the iNat places named ‘Lusitania Meadow n Buffer Zone’ (for the Fresh Pond sites) or ‘Habitat Meadows n Buffer Zone’ (for the Habitat sites). The maps are fairly simple. If a data nerd or in need for more detailed maps, one can export the iNat records and map using geographic information system tools such as QGIS.
About Caterpillars Count: Recording Arthropod Abundance &
Composition
What is Caterpillars Count?
Caterpillars Count! is a citizen science project initiated by Allen Hurlbert (University of North Carolina). It
conducts surveys of arthropods on shrubs and trees. Anyone anywhere in the world can contribute,
either by going to an existing site or creating a new site.
Arthropods are an important food source for birds and other wildlife, and studying their abundance
allows scientists to assess seasonal change and their impact on bird migration. “There’s a gap in
knowledge about how the resources birds depend on are responding to climate change, and
Caterpillars Count! is addressing that gap.”(Dr. Allen Hurlbert)
2020 EwA Biodiversity & Phenology Report (89) Copyright © 2017-2020 Earthwise Aware Inc. All Rights Reserved.
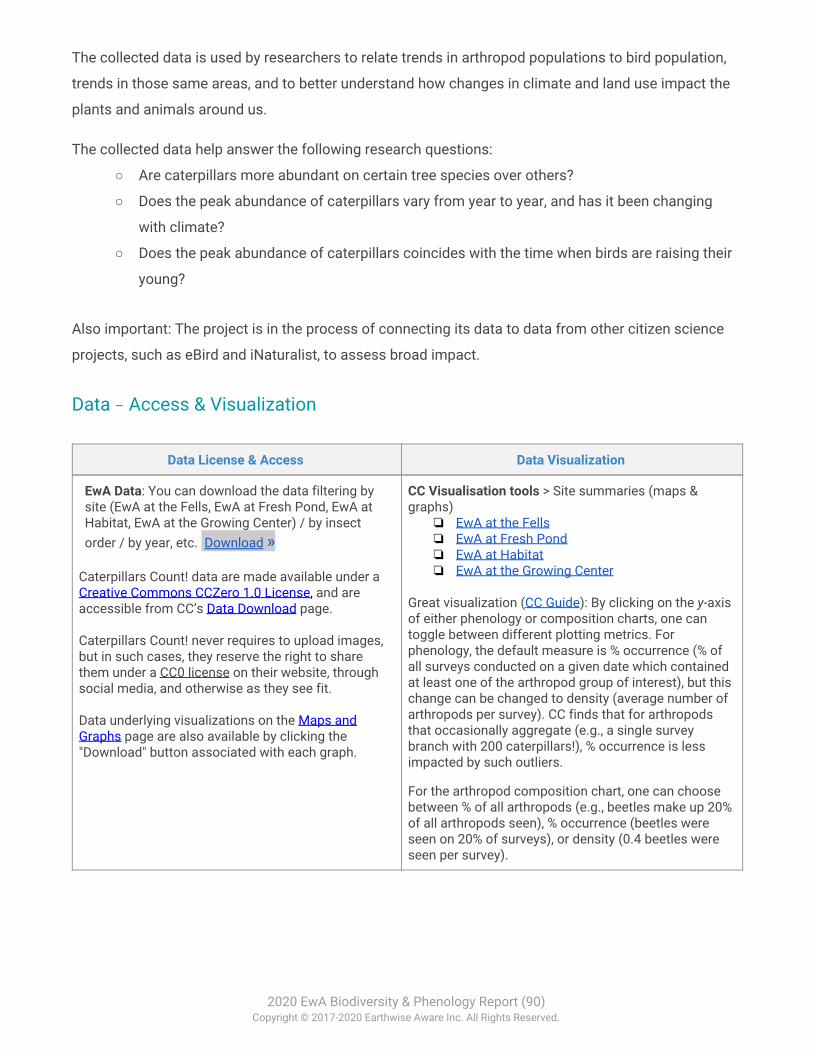
The collected data is used by researchers to relate trends in arthropod populations to bird population,
trends in those same areas, and to better understand how changes in climate and land use impact the
plants and animals around us.
The collected data help answer the following research questions:
○ Are caterpillars more abundant on certain tree species over others?
○ Does the peak abundance of caterpillars vary from year to year, and has it been changing
with climate?
○ Does the peak abundance of caterpillars coincides with the time when birds are raising their
young?
Also important: The project is in the process of connecting its data to data from other citizen science
projects, such as eBird and iNaturalist, to assess broad impact.
Data – Access & Visualization
Data License & Access Data Visualization
EwA Data: You can download the data filtering by site (EwA at the Fells, EwA at Fresh Pond, EwA at Habitat, EwA at the Growing Center) / by insect order / by year, etc. Download »
Caterpillars Count! data are made available under a Creative Commons CCZero 1.0 License, and are accessible from CC’s Data Download page. Caterpillars Count! never requires to upload images, but in such cases, they reserve the right to share them under a CC0 license on their website, through social media, and otherwise as they see fit. Data underlying visualizations on the Maps and Graphs page are also available by clicking the "Download" button associated with each graph.
CC Visualisation tools > Site summaries (maps & graphs) ❏ EwA at the Fells ❏ EwA at Fresh Pond ❏ EwA at Habitat ❏ EwA at the Growing Center
Great visualization (CC Guide): By clicking on the y-axis of either phenology or composition charts, one can toggle between different plotting metrics. For phenology, the default measure is % occurrence (% of all surveys conducted on a given date which contained at least one of the arthropod group of interest), but this change can be changed to density (average number of arthropods per survey). CC finds that for arthropods that occasionally aggregate (e.g., a single survey branch with 200 caterpillars!), % occurrence is less impacted by such outliers.
For the arthropod composition chart, one can choose between % of all arthropods (e.g., beetles make up 20% of all arthropods seen), % occurrence (beetles were seen on 20% of surveys), or density (0.4 beetles were seen per survey).
2020 EwA Biodiversity & Phenology Report (90) Copyright © 2017-2020 Earthwise Aware Inc. All Rights Reserved.
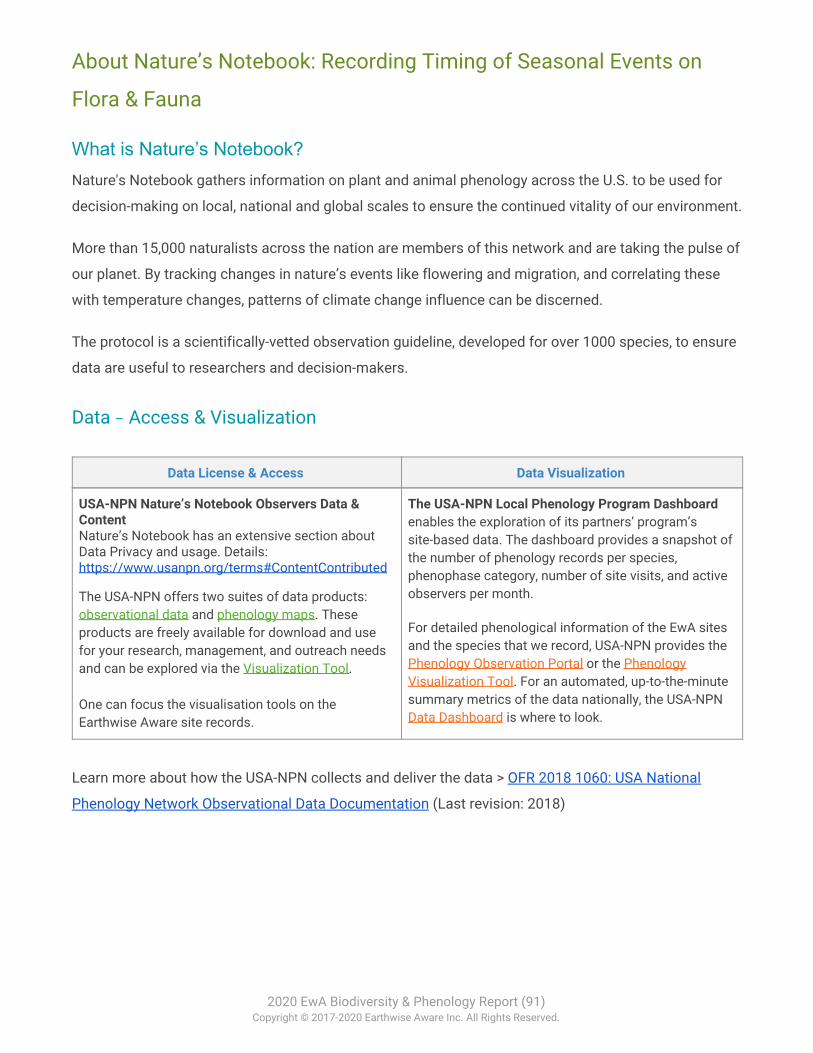
About Nature’s Notebook: Recording Timing of Seasonal Events on
Flora & Fauna
What is Nature’s Notebook? Nature's Notebook gathers information on plant and animal phenology across the U.S. to be used for
decision-making on local, national and global scales to ensure the continued vitality of our environment.
More than 15,000 naturalists across the nation are members of this network and are taking the pulse of
our planet. By tracking changes in nature’s events like flowering and migration, and correlating these
with temperature changes, patterns of climate change influence can be discerned.
The protocol is a scientifically-vetted observation guideline, developed for over 1000 species, to ensure
data are useful to researchers and decision-makers.
Data – Access & Visualization
Data License & Access Data Visualization
USA-NPN Nature’s Notebook Observers Data & Content Nature’s Notebook has an extensive section about Data Privacy and usage. Details: https://www.usanpn.org/terms#ContentContributed
The USA-NPN offers two suites of data products: observational data and phenology maps. These products are freely available for download and use for your research, management, and outreach needs and can be explored via the Visualization Tool. One can focus the visualisation tools on the Earthwise Aware site records.
The USA-NPN Local Phenology Program Dashboard enables the exploration of its partners’ program’s site-based data. The dashboard provides a snapshot of the number of phenology records per species, phenophase category, number of site visits, and active observers per month.
For detailed phenological information of the EwA sites and the species that we record, USA-NPN provides the Phenology Observation Portal or the Phenology Visualization Tool. For an automated, up-to-the-minute summary metrics of the data nationally, the USA-NPN Data Dashboard is where to look.
Learn more about how the USA-NPN collects and deliver the data > OFR 2018 1060: USA National
Phenology Network Observational Data Documentation (Last revision: 2018)
2020 EwA Biodiversity & Phenology Report (91) Copyright © 2017-2020 Earthwise Aware Inc. All Rights Reserved.
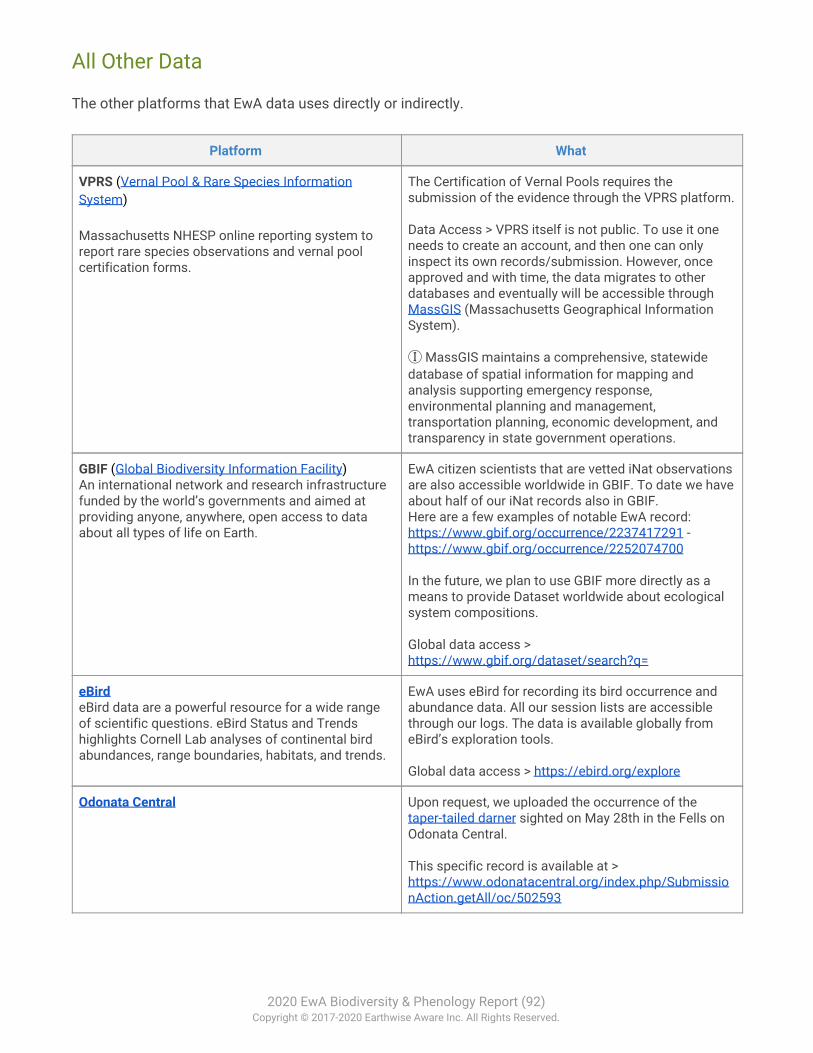
All Other Data
The other platforms that EwA data uses directly or indirectly.
Platform What
VPRS (Vernal Pool & Rare Species Information System) Massachusetts NHESP online reporting system to report rare species observations and vernal pool certification forms.
The Certification of Vernal Pools requires the submission of the evidence through the VPRS platform. Data Access > VPRS itself is not public. To use it one needs to create an account, and then one can only inspect its own records/submission. However, once approved and with time, the data migrates to other databases and eventually will be accessible through MassGIS (Massachusetts Geographical Information System). Ⓘ MassGIS maintains a comprehensive, statewide database of spatial information for mapping and analysis supporting emergency response, environmental planning and management, transportation planning, economic development, and transparency in state government operations.
GBIF (Global Biodiversity Information Facility) An international network and research infrastructure funded by the world’s governments and aimed at providing anyone, anywhere, open access to data about all types of life on Earth.
EwA citizen scientists that are vetted iNat observations are also accessible worldwide in GBIF. To date we have about half of our iNat records also in GBIF. Here are a few examples of notable EwA record: https://www.gbif.org/occurrence/2237417291 - https://www.gbif.org/occurrence/2252074700 In the future, we plan to use GBIF more directly as a means to provide Dataset worldwide about ecological system compositions. Global data access > https://www.gbif.org/dataset/search?q=
eBird eBird data are a powerful resource for a wide range of scientific questions. eBird Status and Trends highlights Cornell Lab analyses of continental bird abundances, range boundaries, habitats, and trends.
EwA uses eBird for recording its bird occurrence and abundance data. All our session lists are accessible through our logs. The data is available globally from eBird’s exploration tools. Global data access > https://ebird.org/explore
Odonata Central Upon request, we uploaded the occurrence of the taper-tailed darner sighted on May 28th in the Fells on Odonata Central. This specific record is available at > https://www.odonatacentral.org/index.php/SubmissionAction.getAll/oc/502593
2020 EwA Biodiversity & Phenology Report (92) Copyright © 2017-2020 Earthwise Aware Inc. All Rights Reserved.
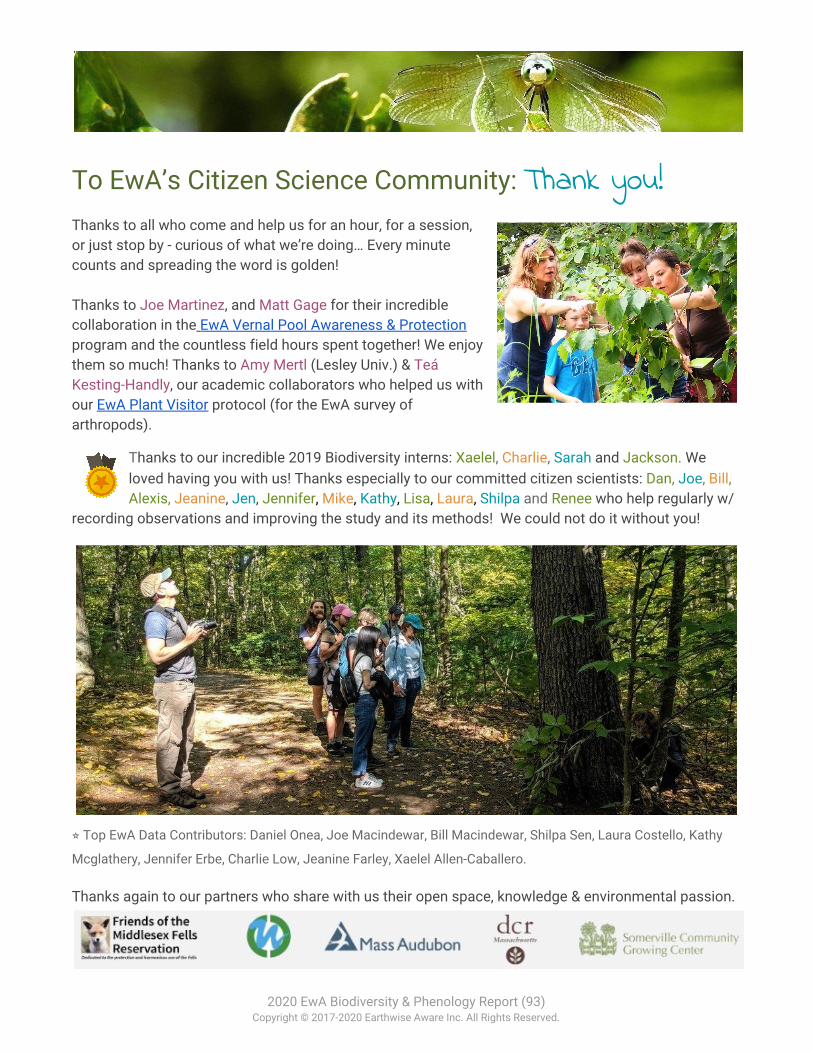
To EwA’s Citizen Science Community: Thank you! Thanks to all who come and help us for an hour, for a session, or just stop by - curious of what we’re doing… Every minute counts and spreading the word is golden! Thanks to Joe Martinez, and Matt Gage for their incredible collaboration in the EwA Vernal Pool Awareness & Protection program and the countless field hours spent together! We enjoy them so much! Thanks to Amy Mertl (Lesley Univ.) & Teá Kesting-Handly, our academic collaborators who helped us with our EwA Plant Visitor protocol (for the EwA survey of arthropods).
Thanks to our incredible 2019 Biodiversity interns: Xaelel, Charlie, Sarah and Jackson. We loved having you with us! Thanks especially to our committed citizen scientists: Dan, Joe, Bill, Alexis, Jeanine, Jen, Jennifer, Mike, Kathy, Lisa, Laura, Shilpa and Renee who help regularly w/
recording observations and improving the study and its methods! We could not do it without you!
⭐ Top EwA Data Contributors: Daniel Onea, Joe Macindewar, Bill Macindewar, Shilpa Sen, Laura Costello, Kathy
Mcglathery, Jennifer Erbe, Charlie Low, Jeanine Farley, Xaelel Allen-Caballero.
Thanks again to our partners who share with us their open space, knowledge & environmental passion.
2020 EwA Biodiversity & Phenology Report (93) Copyright © 2017-2020 Earthwise Aware Inc. All Rights Reserved.
References & Further Reading EwA Outlines, Guides, Protocols, Tools and Logs
EwA Program Outlines
EwA Citizen Science: Co-Creative Conservation in Action (Site Program Page) EwA at the Fells » Citizen Science & Naturalist Program
EwA at Fresh Pond » Pollinator Science
EwA at Habitat » Community-based Insect Life Science
Helping our Insects ▹ the Somerville Pollinator Project
EwA Guides & Protocols
EwA Conservation Fieldwork Essentials EwA Casual Herping Rules (Amphibians & Reptiles)
EwA Wetland Rules
EwA Birding Rules
EwA Guide to Ethical Wildlife Watching & Photography (General Guide)
EwA Wildlife Documentation Photography Essentials
EwA Plant Visitor Survey Protocol
EwA Vernal Pool Awareness & Protection Protocol
EwA Citizen Science Presentations
Revealing the Natural History of our Urban Wildlife
No Ph.D. Needed: Saving Arthropods with Citizen Science
No Ph.D. Needed: Saving the Planet with Citizen Science (Course)
EwA Refs & Tools Predicting Phenological Shifts in a Changing Climate. Scranton, K et. Amarasekare, P. In PNAS (2017) 114 (50) 13212-13217; DOI: 10.1073/pnas.1711221114
2020 EwA Biodiversity & Phenology Report (94) Copyright © 2017-2020 Earthwise Aware Inc. All Rights Reserved.
Standardized Phenology Monitoring Methods to Track Plant and Animal Activity for Science and Resource Management Applications. Denny, E.G. et al. In Int J Biometeorol (2014) 58:591–601 DOI 10.1007/s00484-014-0789-5
Plant and Animal Phenophase Definitions. Denny, E.G. (2013) — Supplement to: International Journal of Biometeorology Standardized phenology monitoring methods to track plant and animal activity for science and resource management applications. How a Tree’s Life can Change an Ecosystem: Plant Phenology, Gypsy Moths, and Heat Accumulation. Bradley, K (2019)
Massachusetts Endangered Species Act
NHESP Biomap 2 — BioMap2 is designed to guide strategic biodiversity conservation in Massachusetts over the next decade by focusing land protection and stewardship on the areas that are most critical for ensuring the long-term persistence of rare and other native species and their habitats, exemplary natural communities, and a diversity of ecosystems. BioMap2 is also designed to include the habitats and species of conservation concern identified in the State Wildlife Action Plan.
New England District Vernal Pool Rapid Assessment Method. US Army Corps of Engineers (2019).
Vernal Pool Certification in Massachusetts (Vernal Pool Association Guide) 302 Mass. Reg. 12.04 (2019). Code of Massachusetts Regulations - Section 12.04 - Rules of Conduct on DCR Properties - Generally.
Delineating Bordering Vegetated Wetlands Under the Massachusetts Wetlands Protection Act - A Handbook. Produced by the Massachusetts Department of Environmental Protection Division of Wetlands and Waterways (1995)
Resource Management Plan - Middlesex Fells Planning Unit (Including Middlesex Fells Reservation) + Appendices. Massachusetts Department of Conservation and Recreation Bureau of Planning and Resource Protection (2012).
Application of Relevé Method for Vegetation Community Assessment and Management. Frances Reese, M.S. (2006)
Vegetation Indicator. USDA Forest Service R&D Forest Inventory and Analysis / The Nation’s Forest Census.
EwA Data Tools. See § Projects Data Platforms, Access, Impact & Visualization
EwA Logs & Detailed Reports
EwA at the Fells Fieldwork Recaps
EwA at the Fells Arthropod Tree Surveys (CC Summary)
EwA at Fresh Pond Fieldwork Recaps
EwA at Fresh Pond Arthropod Tree Surveys (CC Summary)
EwA at Habitat Fieldwork Recaps
EwA at Habitat Arthropod Tree Surveys (CC Summary)
2020 EwA Biodiversity & Phenology Report (95) Copyright © 2017-2020 Earthwise Aware Inc. All Rights Reserved.
EwA at the Growing Center Fieldwork Recaps
EwA at the Growing Center Arthropod Tree Surveys (CC Summary)
Biodiversity, Conservation & Citizen Science Literature/Resources
Citizen Science
Human Impact: Our Relationship with Climate, the Environment, and Biodiversity. Keyles, S. (Ed.) (2019)
The Rightful Place of Science: Citizen Science. Darlene Cavalier (2016)
A Green paper on Citizen Science: Towards a Society of Empowered Citizens and Enhanced Research. European Commission (2014)
Citizen Science Isn’t Just About Collecting Data - Nonscientists should take part in discussions about research priorities and more. Jason Lloyd (2016) Using Semistructured Surveys to Improve Citizen Science Data for Monitoring Biodiversity. Kelling, S. & al. (2019) in BioScience, Volume 69, Issue 3, March 2019, Pages 170–179, DOI: 10.1093/biosci/biz010
Climate & Biodiversity
What is biodiversity? United Nations Environment Programme
Biodiversity Loss and Its Impact on Humanity. Cardinale, Bradley; et al. (2012) in Nature. 486 (7401): 59–67.
Why You Should Care About the Current Wave of Mass Extinctions (Commentary). Serra, G (2019) in Mongabay
One Hundred Questions of Importance to the Conservation of Global Biological Diversity. Sutherland, W.J. et al. (2009) DOI: 10.1111/j.1523-1739.2009.01212.x
Living Planet Report 2018—Biennial report, produced in collaboration with the Zoological Society of London, uses the global LPI as a measure of the health of 16,704 populations of 4,005 species.
Summary for Policymakers of the Global Assessment Report on Biodiversity and Ecosystem Services. Díaz, S. & al. IPBES Report (2019)
Data Mobilization and Capacity Building Essential for Addressing Global Biodiversity Crisis. GBIF (2019)
The GEO Handbook on Biodiversity Observation Networks. Walters, M. and Scholes, R. J. Editors (2018)
Life on Earth – An Encyclopedia of Biodiversity, Ecology, and Evolution. Eldredge, N. (Ed.) (2002)
IPCC Special Report : Global Warming of 1.5 ºC (2018) — An IPCC special report on the impacts of global warming of 1.5 °C above pre-industrial levels and related global greenhouse gas emission pathways, in the context of strengthening the global response to the threat of climate change, sustainable development, and efforts to eradicate poverty.
Climate Tipping Points — Too Risky to Bet Against. (2019) Lenton, T.M. et al. in Nature 575, 592-595 (2019) DOI: 10.1038/d41586-019-03595-0
2020 EwA Biodiversity & Phenology Report (96) Copyright © 2017-2020 Earthwise Aware Inc. All Rights Reserved.
Why Phenology? USA National Phenology Network
Where Are All The Insects Gone. Vogel, G. in AAAS (2017)
The Great Insect Dying: A Global Look at a Deepening Crisis. Hance, J. in Mongabay (June 2019)
Diverse Effects of Degree of Urbanisation and Forest Size on Species Richness and Functional Diversity of Plants, and Ground Surface-active Ants and Spiders. Melliger, R.L. & al. (2018) DOI: 10.1371/journal.pone.0199245
OFR 2018 1060: USA National Phenology Network Observational Data Documentation. Alyssa Rosemartin, Ellen G. Denny, Katharine L. Gerst, R. Lee Marsh, Erin E. Posthumus, Theresa M. Crimmins, and Jake F. Weltzin Open-File Report 2018–1060. U.S. Department of the Interior - U.S. Geological Survey (2018)
Changes In the Vascular Flora of the Middlesex Fells Reservation, Middlesex County, Massachusetts, from 1895 To 2011. Bryan T. Hamlin, Walter T. Kittredge, Donald P. Lubin, Elizabeth Barton Wright (2012) in Rhodora, 114(959):229-308. DOI: 10.3119/11-02
Biodiversity in an Isolated Suburban Reservation: Amphibians in the Middlesex Fells. Gage, M.W. University of Massachusetts Boston (2011) Survival by Degrees: 389 Bird Species on the Brink (Audubon, Oct 2019) ‘Death By a Thousand Holes’: Scientists Race to Avert a Salamander Crisis. Jones, B. (2018)
Methods for Evaluating Wetland Condition - #12 Using Amphibians in Bioassessments of Wetlands. EPA (2002). Office of Water, U.S. Environmental Protection Agency, Washington, DC. EPA-822-R-02-022
Data & Statistics
Applied Statistics in Ecology: Common Pitfalls and Simple Solutions. E.A. Steel, M.C. Kennedy, P.G. Cunningham, J.S. Stanovick (2013). DOI: 10.1890/ES13-00160.1
Strategies Employed by Citizen Science Programs to Increase the Credibility of Their Data. Freitag, A., Meyer, R. and Whiteman, L. (2016). In Citizen Science: Theory and Practice, 1(1), p.2. DOI: 10.5334/cstp.6
2020 EwA Biodiversity & Phenology Report (97) Copyright © 2017-2020 Earthwise Aware Inc. All Rights Reserved.

Advancing Biodiversity and Climate Research Giving Science Back to the People
Contact Us Earthwise Aware, Inc. www.earthwiseaware.org 50 Spring Street Somerville, MA 02143 - U.S.A. ☏ +1 (617) 684-5204 ✉ [email protected]
2020 EwA Biodiversity & Phenology Report (98) Copyright © 2017-2020 Earthwise Aware Inc. All Rights Reserved.