ecological biodiversity
TRANSCRIPT
2 2
3 3
4 4
5 5
7
8
9
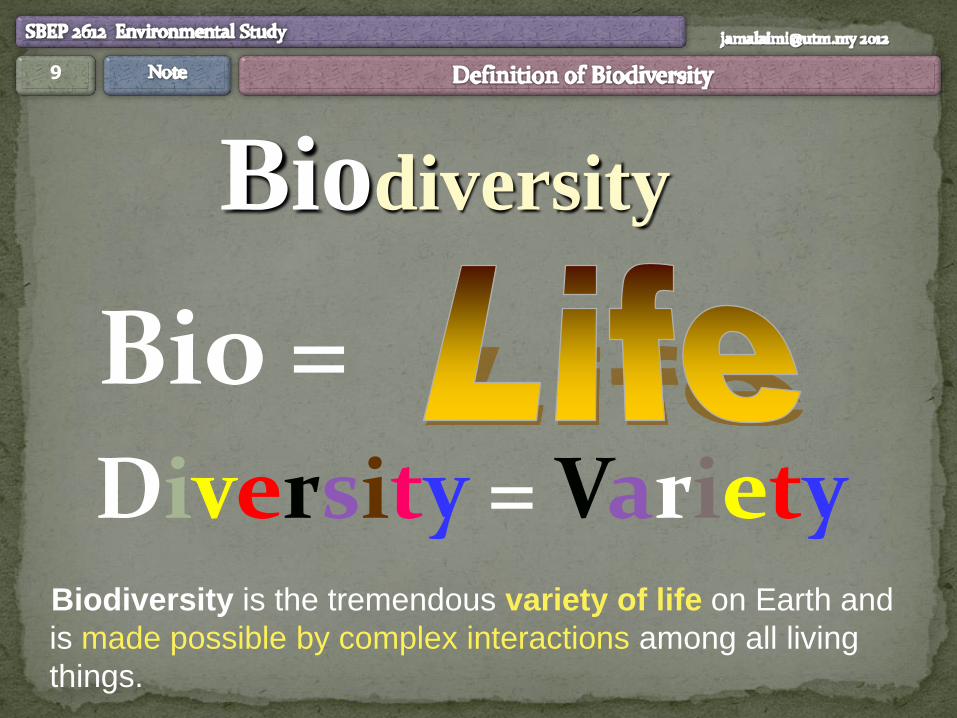
Bio =
Biodiversity
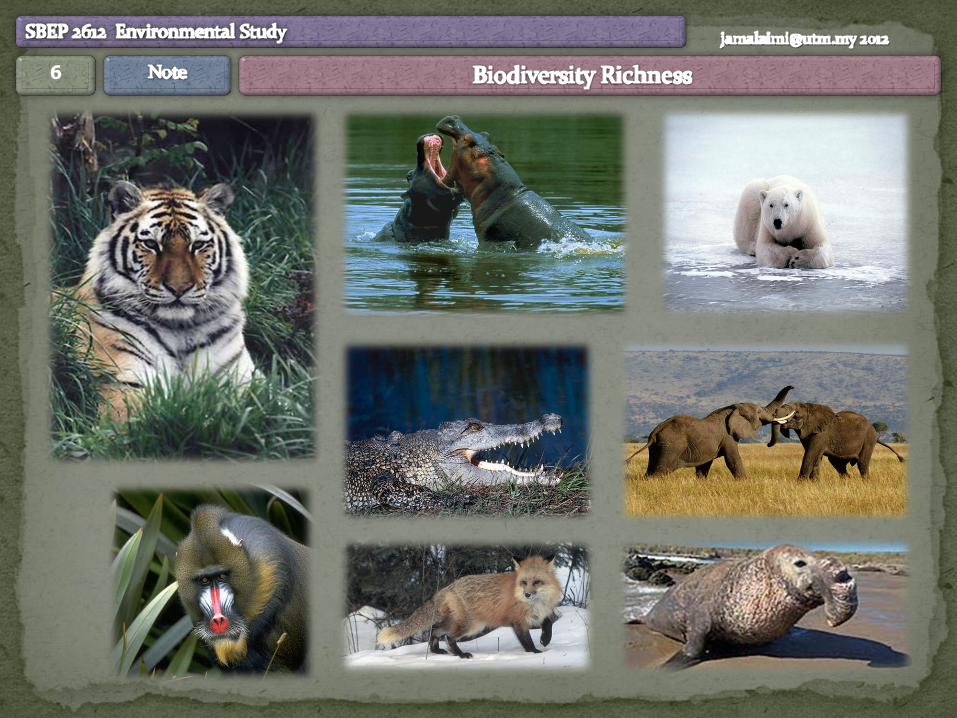
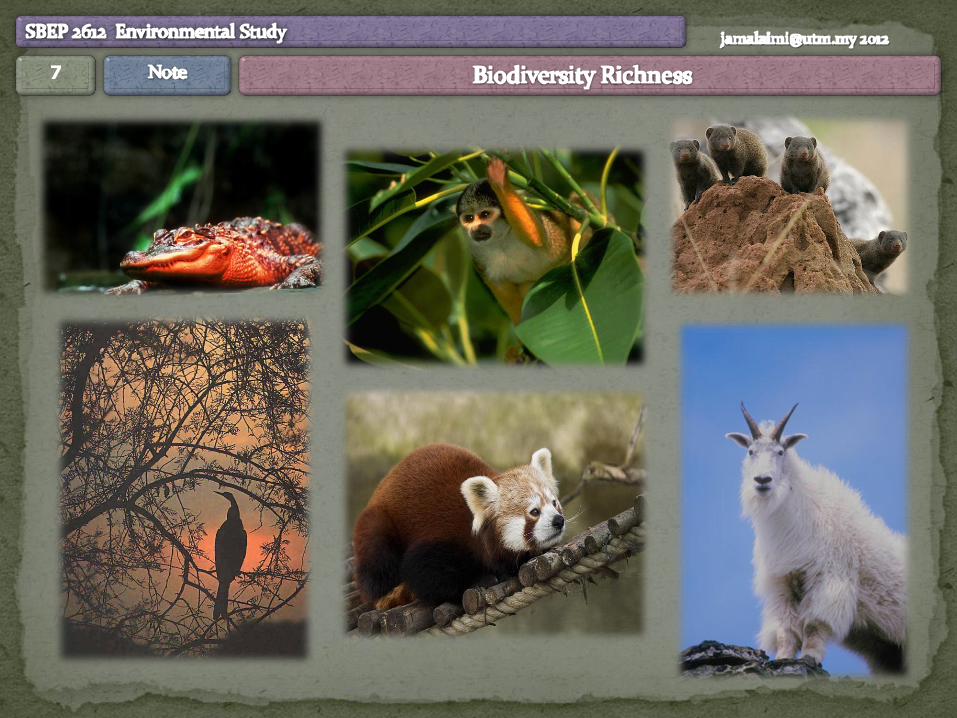
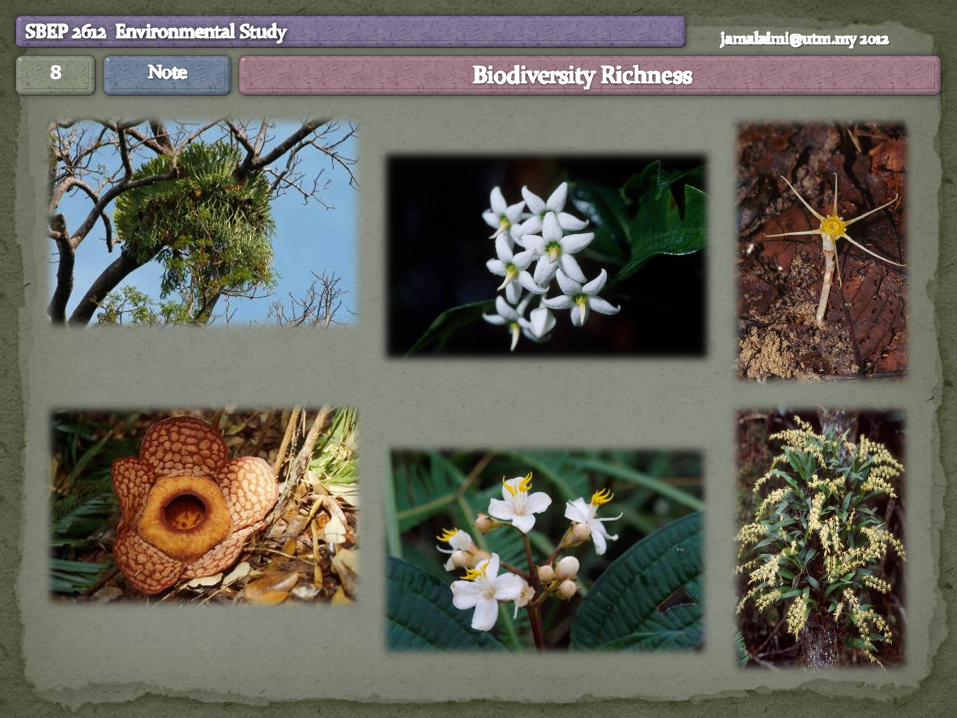
Diversity = Variety Biodiversity is the tremendous variety of life on Earth and
is made possible by complex interactions among all living
things.

10
A B

11
A B

12
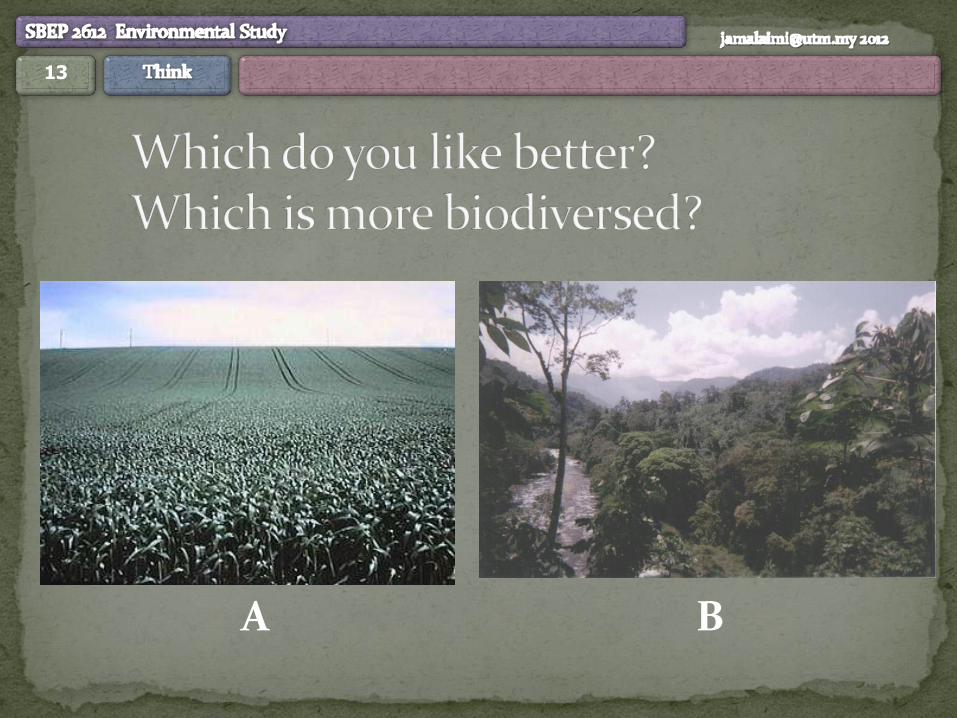
Which do you like better?
A B
13
A B
14
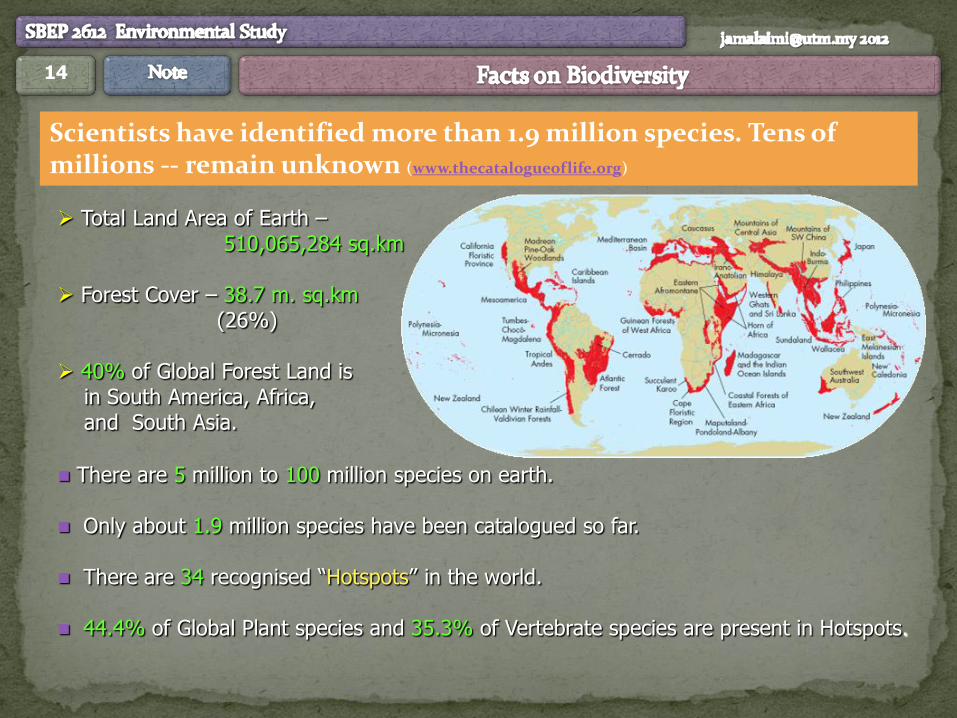
Scientists have identified more than 1.9 million species. Tens of millions -- remain unknown (www.thecatalogueoflife.org)
Total Land Area of Earth – 510,065,284 sq.km Forest Cover – 38.7 m. sq.km (26%) 40% of Global Forest Land is in South America, Africa, and South Asia.
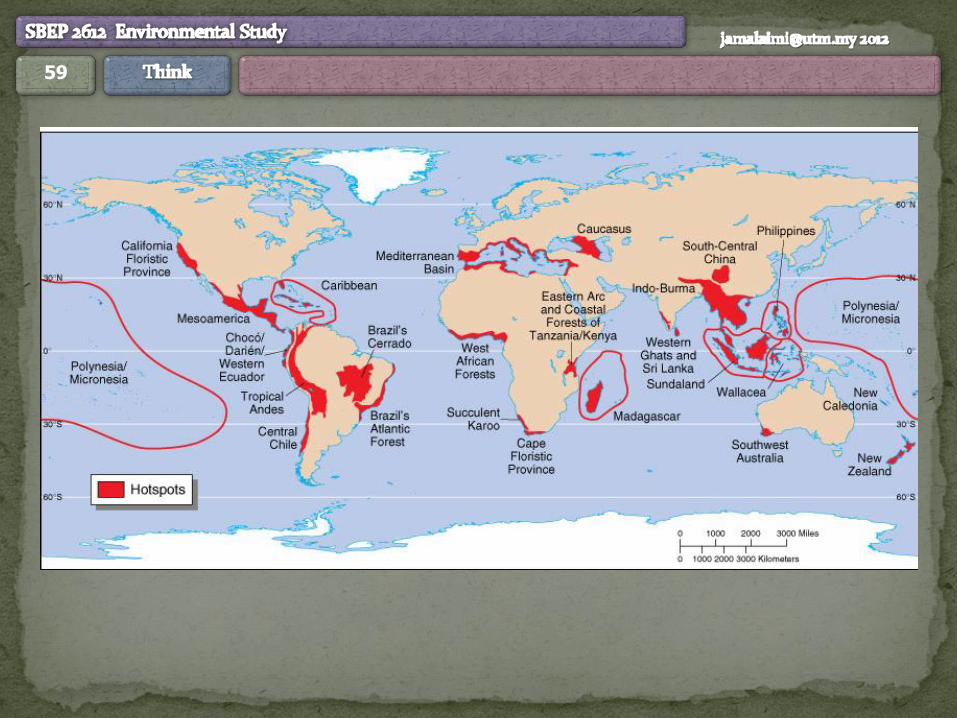
There are 5 million to 100 million species on earth. Only about 1.9 million species have been catalogued so far. There are 34 recognised “Hotspots” in the world. 44.4% of Global Plant species and 35.3% of Vertebrate species are present in Hotspots.
15
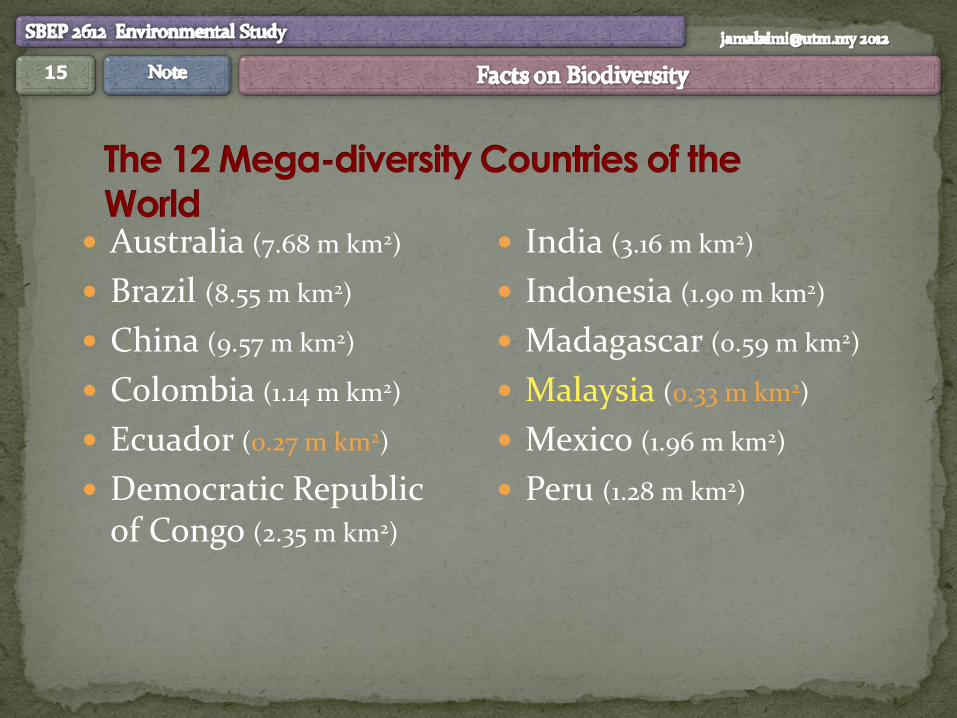
Australia (7.68 m km2)
Brazil (8.55 m km2)
China (9.57 m km2)
Colombia (1.14 m km2)
Ecuador (0.27 m km2)
Democratic Republic of Congo (2.35 m km2)
India (3.16 m km2)
Indonesia (1.90 m km2)
Madagascar (0.59 m km2)
Malaysia (0.33 m km2)
Mexico (1.96 m km2)
Peru (1.28 m km2)
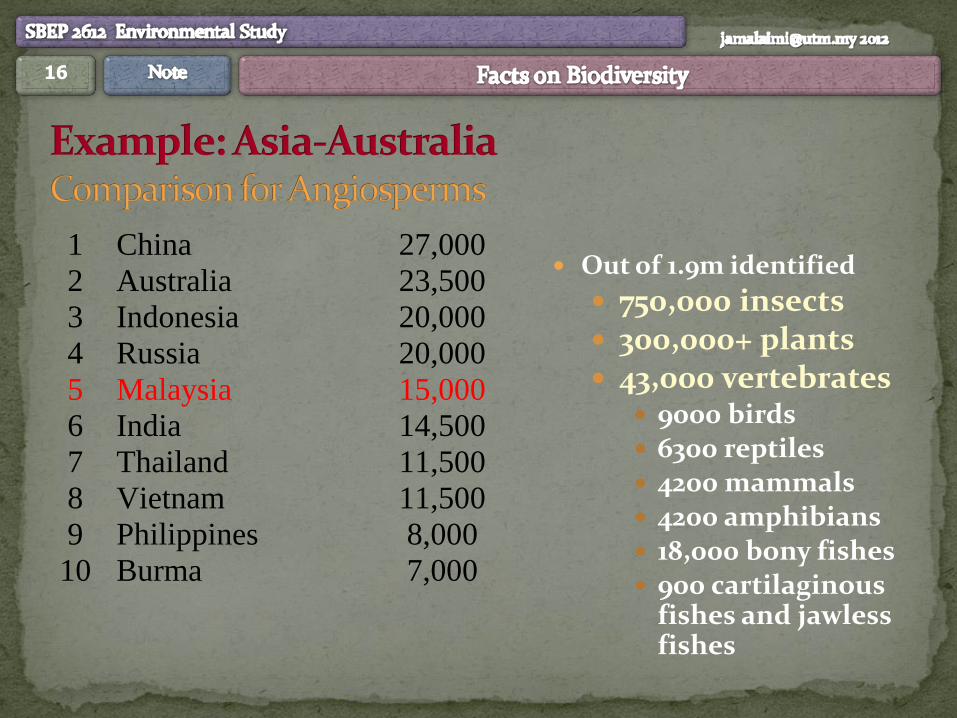
16
1 China 27,000
2 Australia 23,500
3 Indonesia 20,000
4 Russia 20,000
5 Malaysia 15,000
6 India 14,500
7 Thailand 11,500
8 Vietnam 11,500
9 Philippines 8,000
10 Burma 7,000
Out of 1.9m identified
750,000 insects 300,000+ plants 43,000 vertebrates
9000 birds 6300 reptiles 4200 mammals 4200 amphibians 18,000 bony fishes 900 cartilaginous
fishes and jawless fishes

17
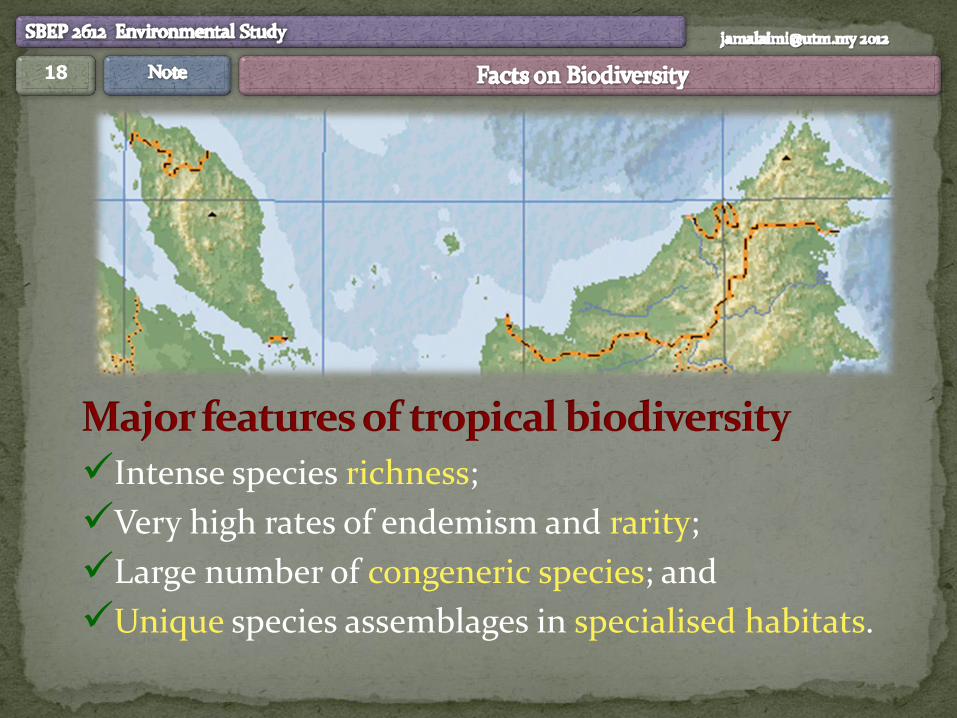
18
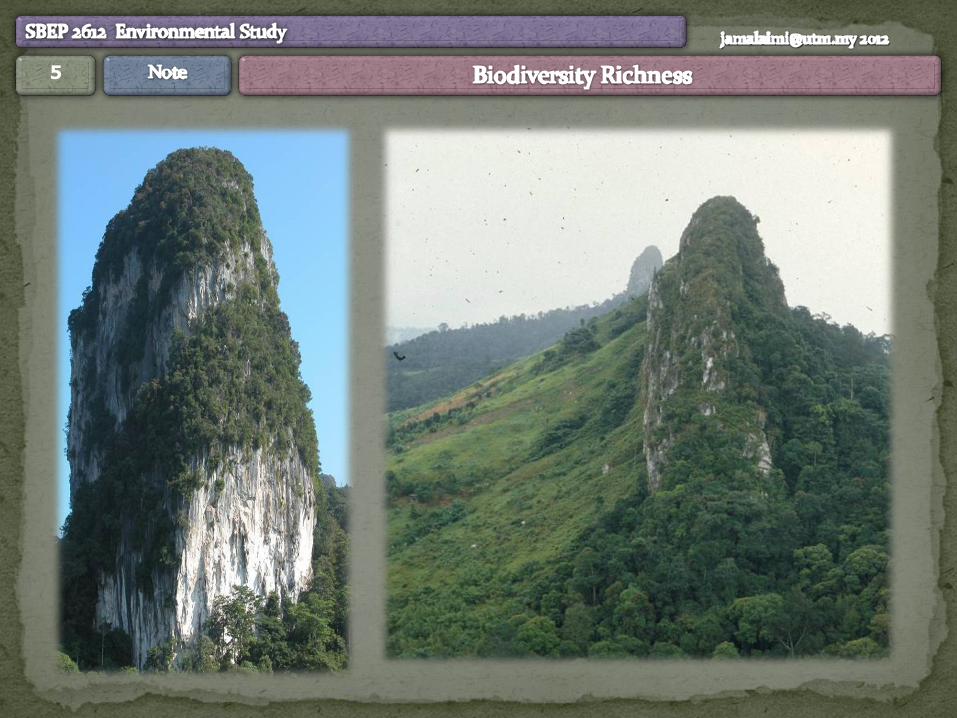
Intense species richness;
Very high rates of endemism and rarity;
Large number of congeneric species; and
Unique species assemblages in specialised habitats.
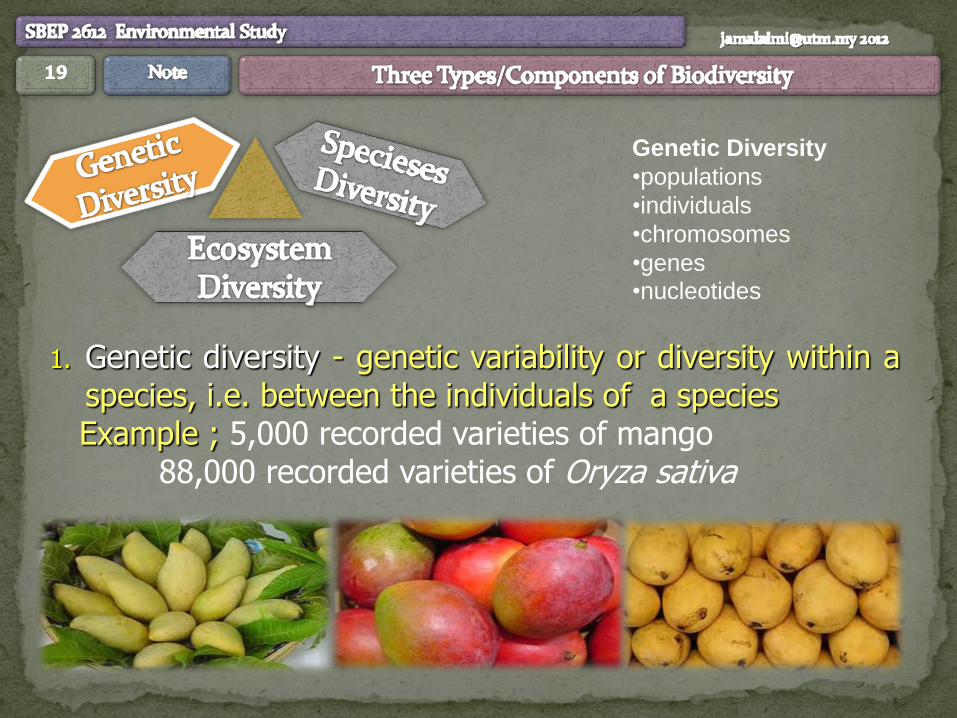
19
1. Genetic diversity - genetic variability or diversity within a species, i.e. between the individuals of a species
Example ; 5,000 recorded varieties of mango 88,000 recorded varieties of Oryza sativa
Genetic Diversity
•populations
•individuals
•chromosomes
•genes
•nucleotides
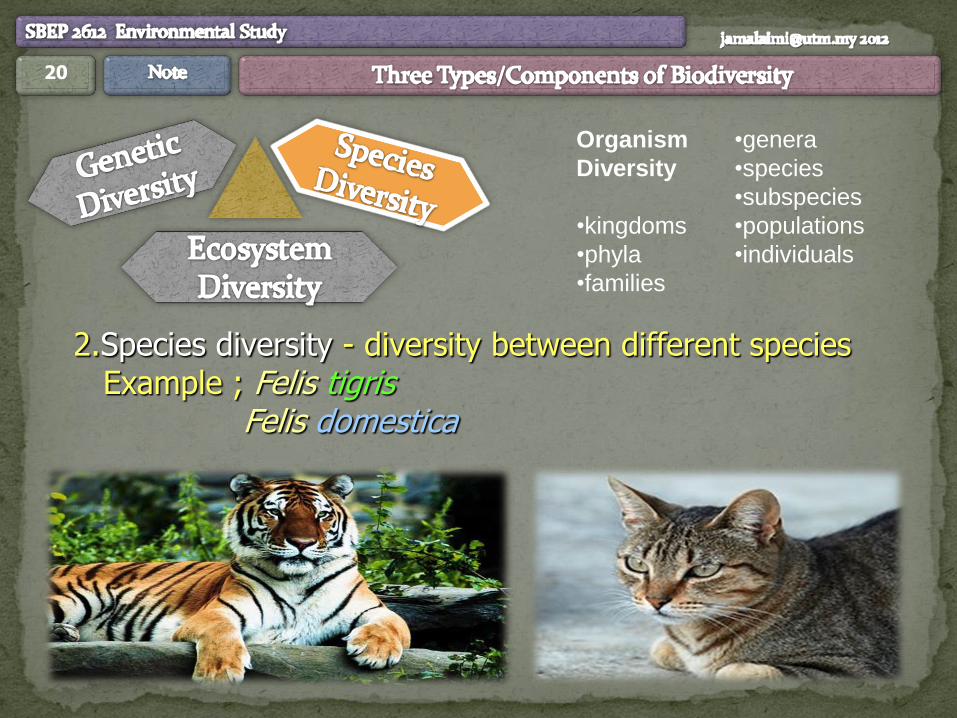
20
2.Species diversity - diversity between different species Example ; Felis tigris Felis domestica
Organism
Diversity
•kingdoms
•phyla
•families
•genera
•species
•subspecies
•populations
•individuals
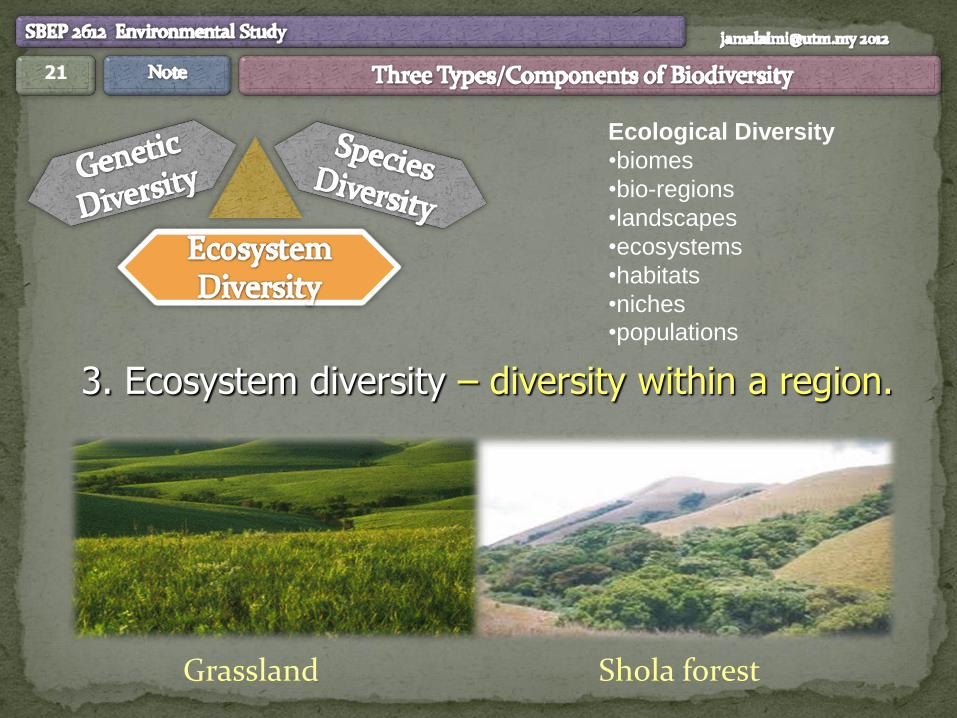
21
3. Ecosystem diversity – diversity within a region.
Grassland Shola forest
Ecological Diversity
•biomes
•bio-regions
•landscapes
•ecosystems
•habitats
•niches
•populations
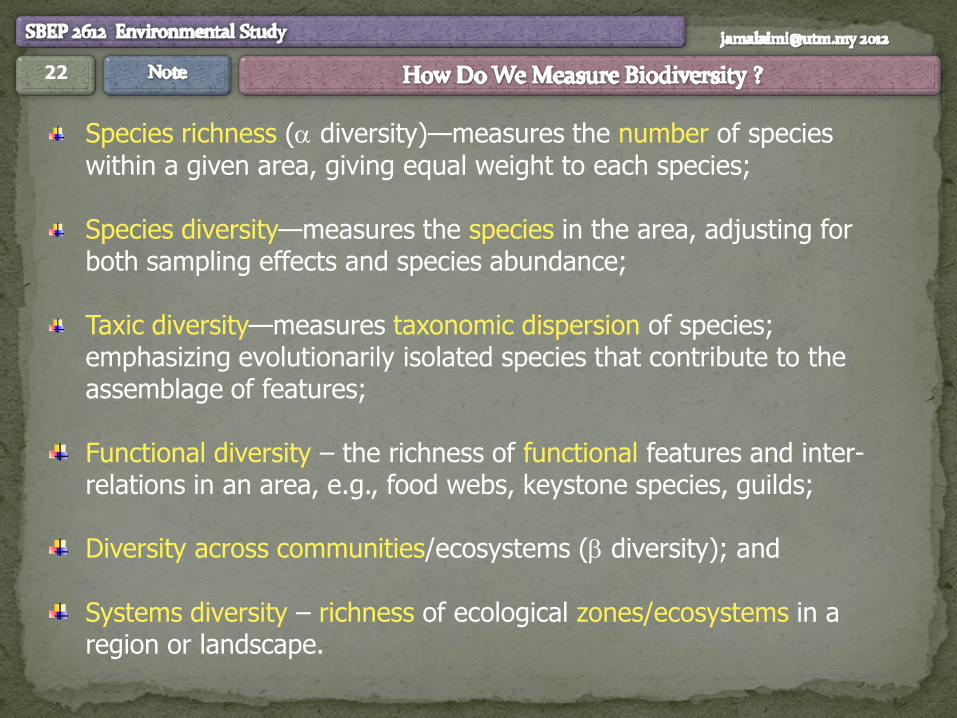
22
Species richness ( diversity)—measures the number of species within a given area, giving equal weight to each species; Species diversity—measures the species in the area, adjusting for both sampling effects and species abundance; Taxic diversity—measures taxonomic dispersion of species; emphasizing evolutionarily isolated species that contribute to the assemblage of features; Functional diversity – the richness of functional features and inter-relations in an area, e.g., food webs, keystone species, guilds; Diversity across communities/ecosystems ( diversity); and Systems diversity – richness of ecological zones/ecosystems in a region or landscape.

23
(1977)
(1969)
(1990)
(1700)
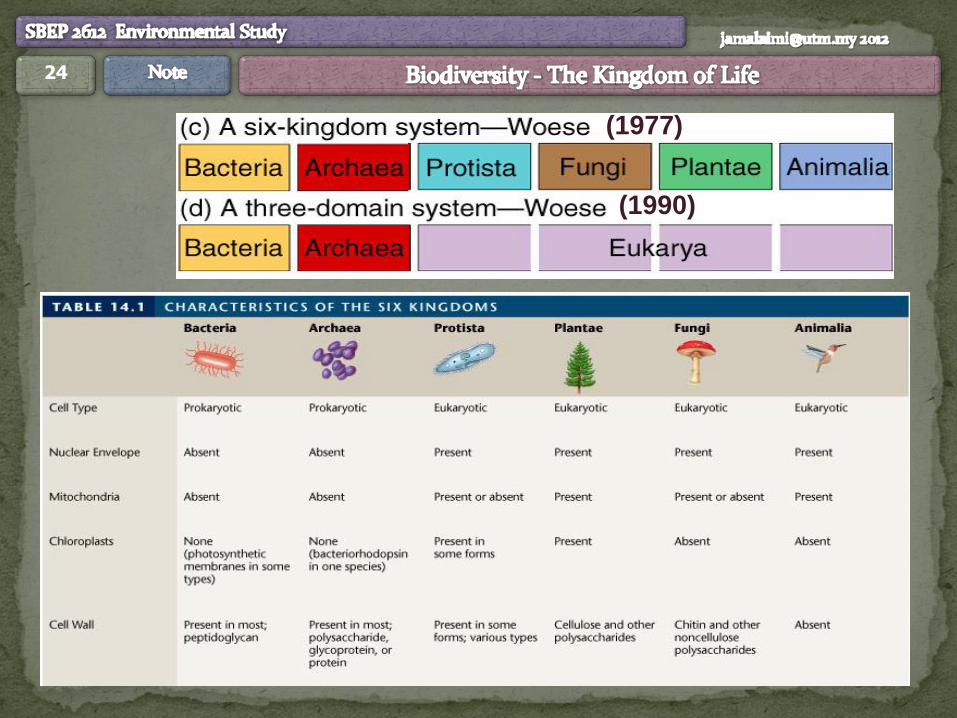
24
(1977)
(1990)
25
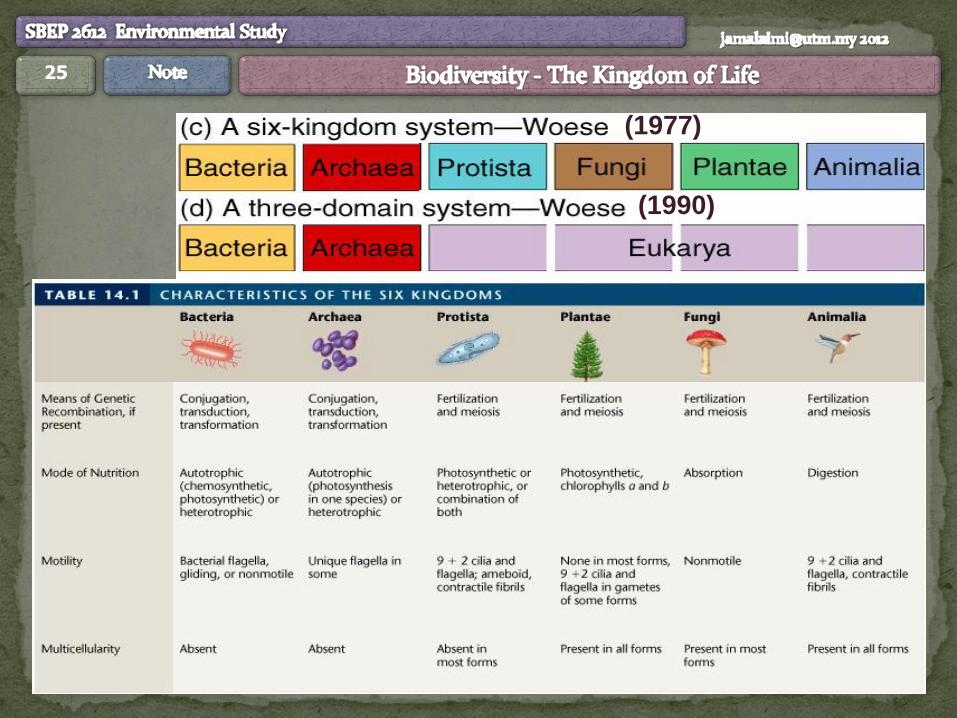
(1977)
(1990)
26
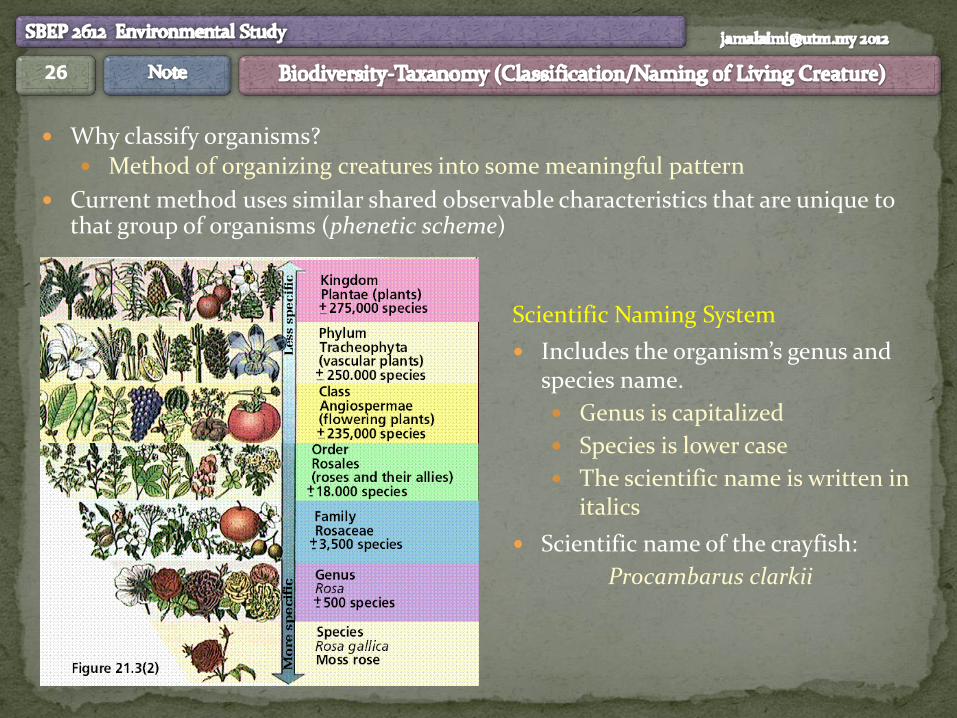
Why classify organisms? Method of organizing creatures into some meaningful pattern
Current method uses similar shared observable characteristics that are unique to that group of organisms (phenetic scheme)
Scientific Naming System
Includes the organism’s genus and species name.
Genus is capitalized
Species is lower case
The scientific name is written in italics
Scientific name of the crayfish:
Procambarus clarkii
27
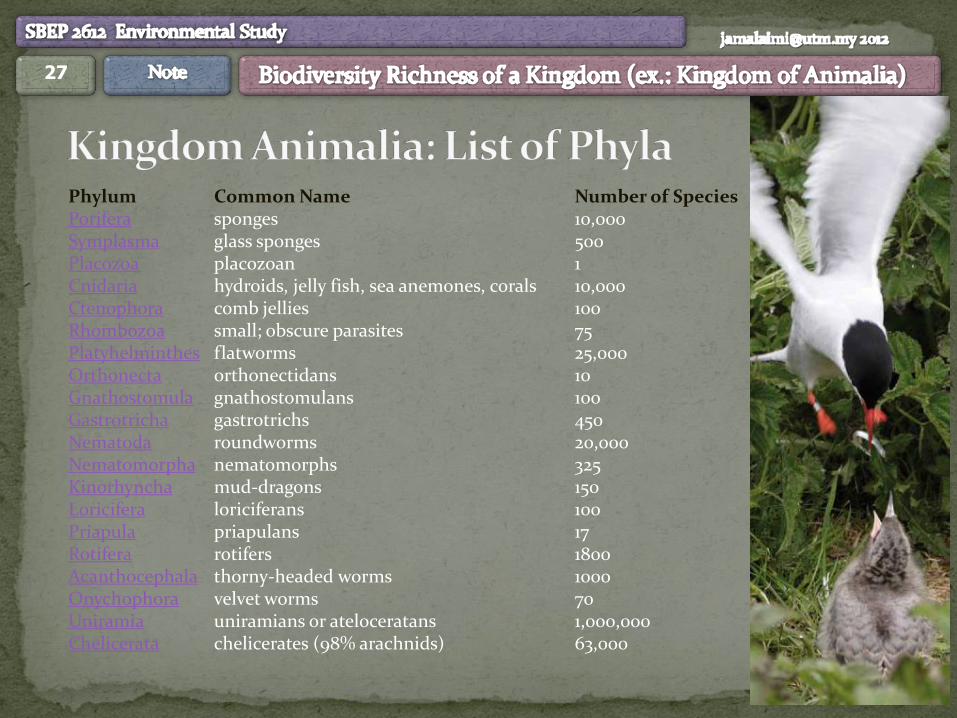
Phylum Common Name Number of Species Porifera sponges 10,000 Symplasma glass sponges 500 Placozoa placozoan 1 Cnidaria hydroids, jelly fish, sea anemones, corals 10,000 Ctenophora comb jellies 100 Rhombozoa small; obscure parasites 75 Platyhelminthes flatworms 25,000 Orthonecta orthonectidans 10 Gnathostomula gnathostomulans 100 Gastrotricha gastrotrichs 450 Nematoda roundworms 20,000 Nematomorpha nematomorphs 325 Kinorhyncha mud-dragons 150 Loricifera loriciferans 100 Priapula priapulans 17 Rotifera rotifers 1800 Acanthocephala thorny-headed worms 1000 Onychophora velvet worms 70 Uniramia uniramians or ateloceratans 1,000,000 Chelicerata chelicerates (98% arachnids) 63,000
28
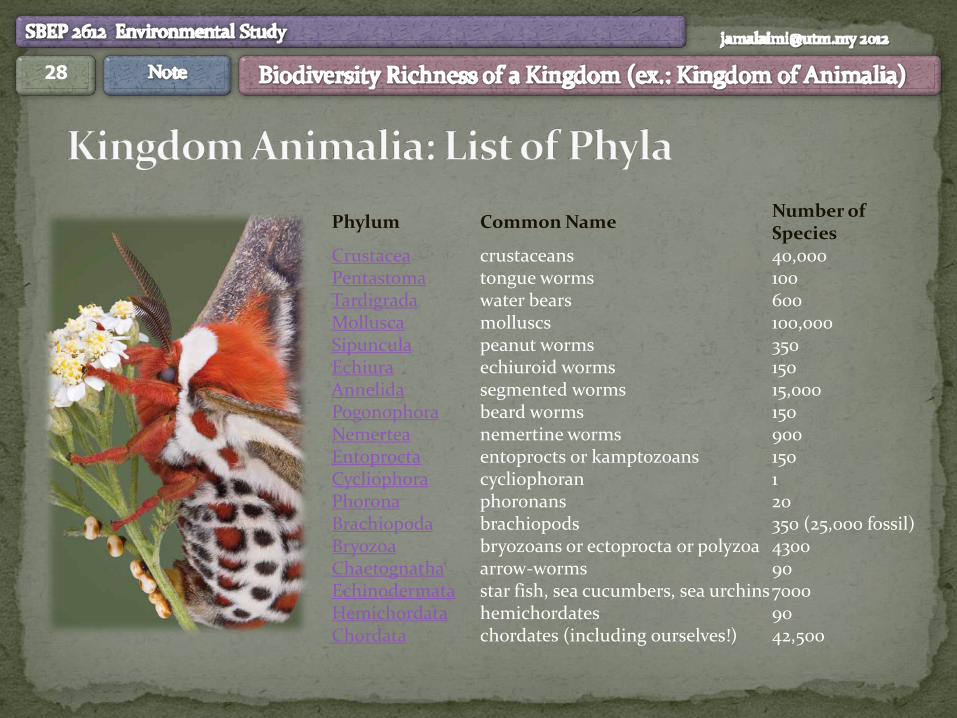
Phylum Common Name Number of Species
Crustacea crustaceans 40,000 Pentastoma tongue worms 100 Tardigrada water bears 600 Mollusca molluscs 100,000 Sipuncula peanut worms 350 Echiura echiuroid worms 150 Annelida segmented worms 15,000 Pogonophora beard worms 150 Nemertea nemertine worms 900 Entoprocta entoprocts or kamptozoans 150 Cycliophora cycliophoran 1 Phorona phoronans 20 Brachiopoda brachiopods 350 (25,000 fossil) Bryozoa bryozoans or ectoprocta or polyzoa 4300 Chaetognatha arrow-worms 90 Echinodermata star fish, sea cucumbers, sea urchins 7000 Hemichordata hemichordates 90 Chordata chordates (including ourselves!) 42,500
29
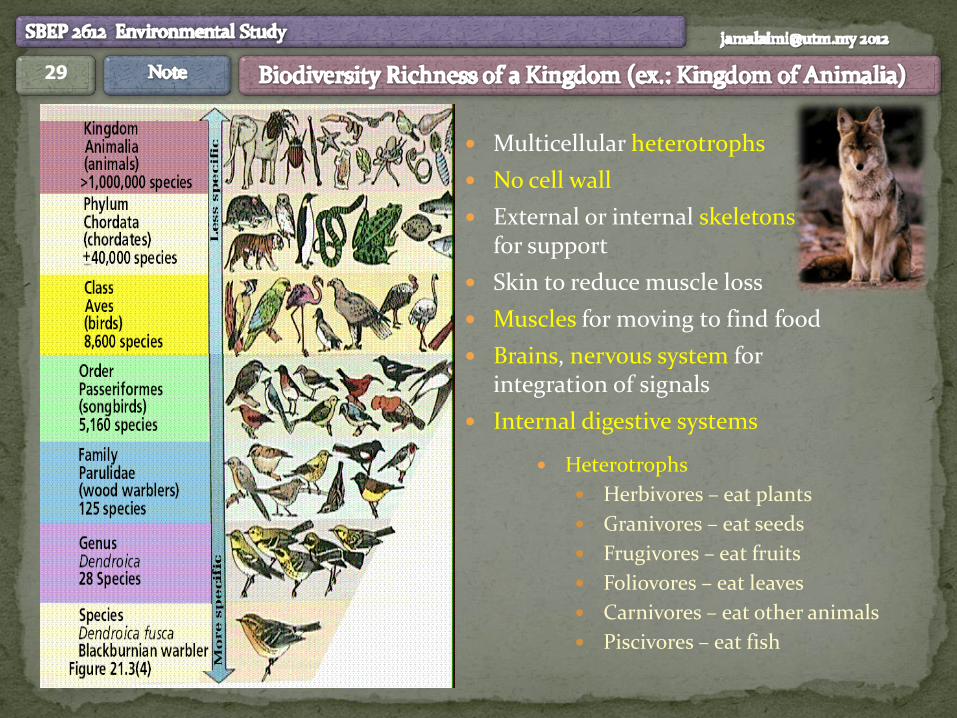
Multicellular heterotrophs
No cell wall
External or internal skeletons for support
Skin to reduce muscle loss
Muscles for moving to find food
Brains, nervous system for integration of signals
Internal digestive systems
Heterotrophs
Herbivores – eat plants
Granivores – eat seeds
Frugivores – eat fruits
Foliovores – eat leaves
Carnivores – eat other animals
Piscivores – eat fish
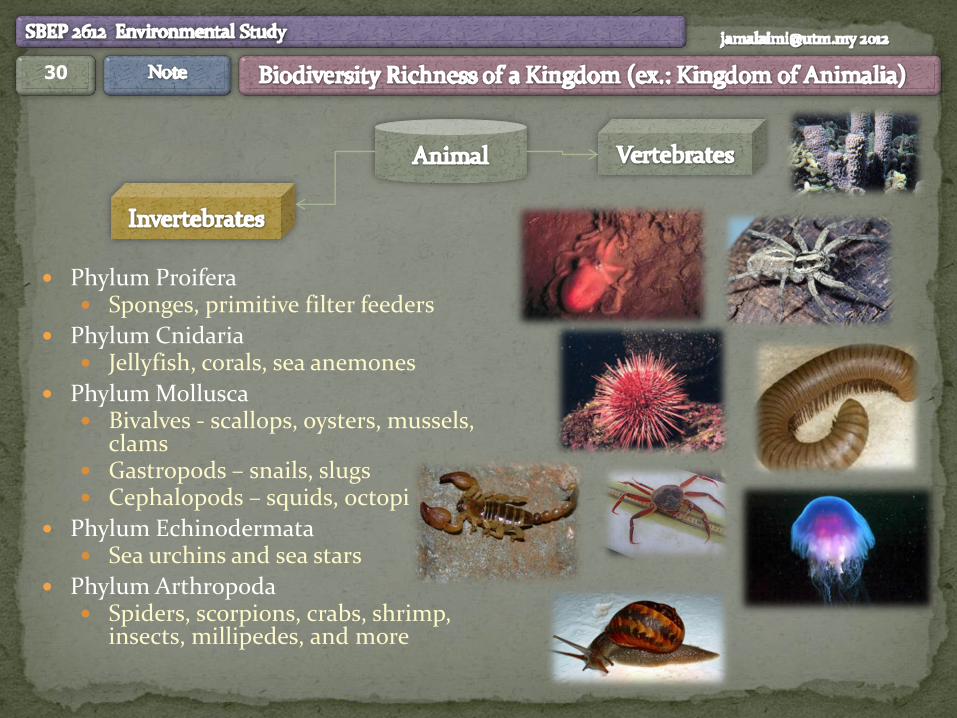
30
Phylum Proifera Sponges, primitive filter feeders
Phylum Cnidaria Jellyfish, corals, sea anemones
Phylum Mollusca Bivalves - scallops, oysters, mussels,
clams Gastropods – snails, slugs Cephalopods – squids, octopi
Phylum Echinodermata Sea urchins and sea stars
Phylum Arthropoda Spiders, scorpions, crabs, shrimp,
insects, millipedes, and more
31
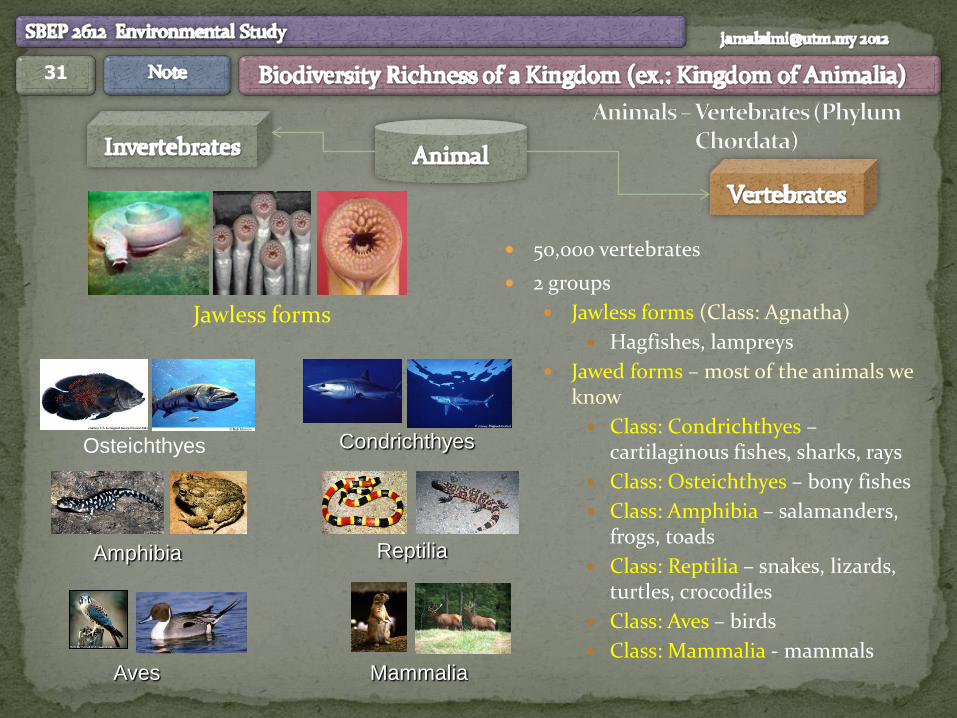
50,000 vertebrates
2 groups
Jawless forms (Class: Agnatha)
Hagfishes, lampreys
Jawed forms – most of the animals we know
Class: Condrichthyes – cartilaginous fishes, sharks, rays
Class: Osteichthyes – bony fishes
Class: Amphibia – salamanders, frogs, toads
Class: Reptilia – snakes, lizards, turtles, crocodiles
Class: Aves – birds
Class: Mammalia - mammals
Jawless forms
Osteichthyes Condrichthyes
Amphibia Reptilia
Aves
Mammalia
32
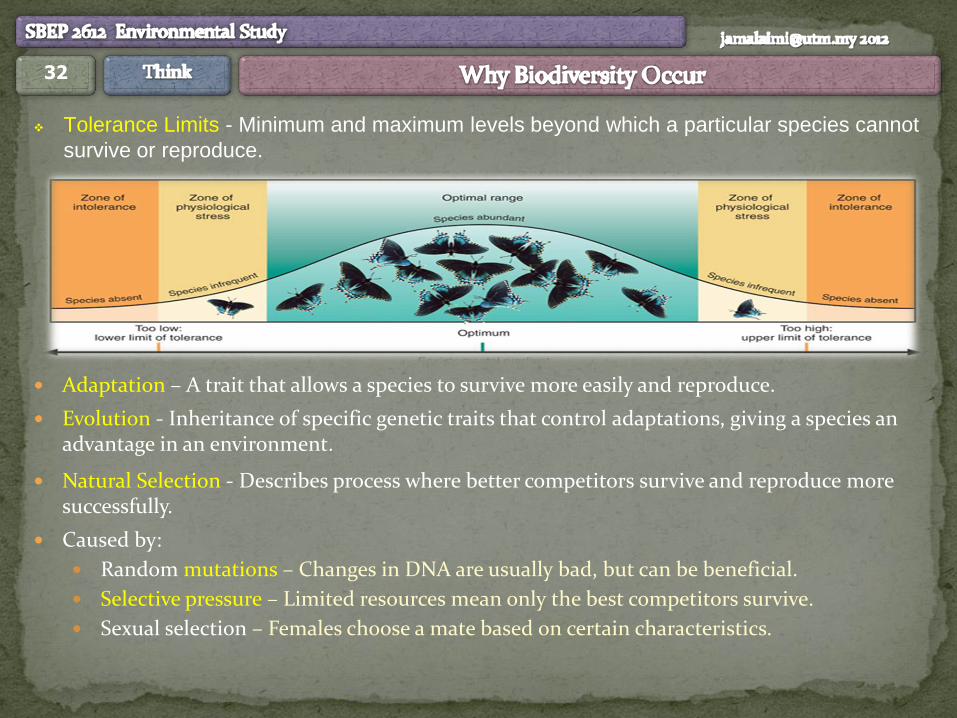
Tolerance Limits - Minimum and maximum levels beyond which a particular species cannot
survive or reproduce.
Adaptation – A trait that allows a species to survive more easily and reproduce.
Evolution - Inheritance of specific genetic traits that control adaptations, giving a species an advantage in an environment.
Natural Selection - Describes process where better competitors survive and reproduce more successfully.
Caused by:
Random mutations – Changes in DNA are usually bad, but can be beneficial.
Selective pressure – Limited resources mean only the best competitors survive.
Sexual selection – Females choose a mate based on certain characteristics.
33
Adaptation Evolution Natural Selection - Caused by:
Random mutations Selective pressure Sexual selection.
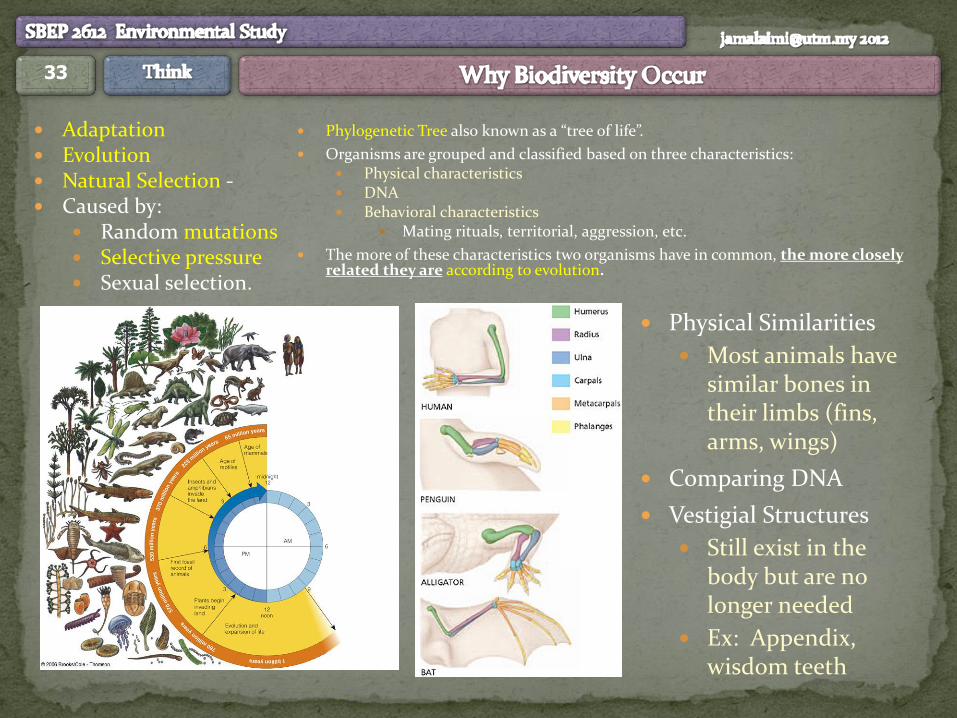
Physical Similarities
Most animals have similar bones in their limbs (fins, arms, wings)
Comparing DNA
Vestigial Structures
Still exist in the body but are no longer needed
Ex: Appendix, wisdom teeth
Phylogenetic Tree also known as a “tree of life”.
Organisms are grouped and classified based on three characteristics: Physical characteristics DNA Behavioral characteristics
Mating rituals, territorial, aggression, etc.
The more of these characteristics two organisms have in common, the more closely related they are according to evolution.
34
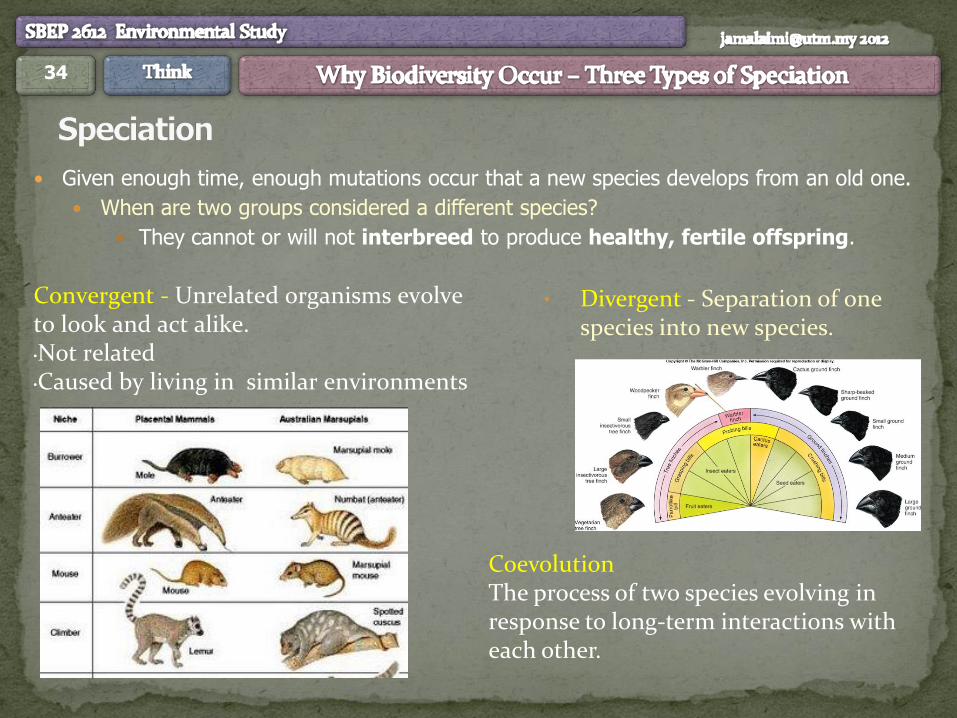
Given enough time, enough mutations occur that a new species develops from an old one.
When are two groups considered a different species?
They cannot or will not interbreed to produce healthy, fertile offspring.
• Divergent - Separation of one species into new species.
Convergent - Unrelated organisms evolve to look and act alike. •Not related •Caused by living in similar environments
Coevolution The process of two species evolving in response to long-term interactions with each other.
35
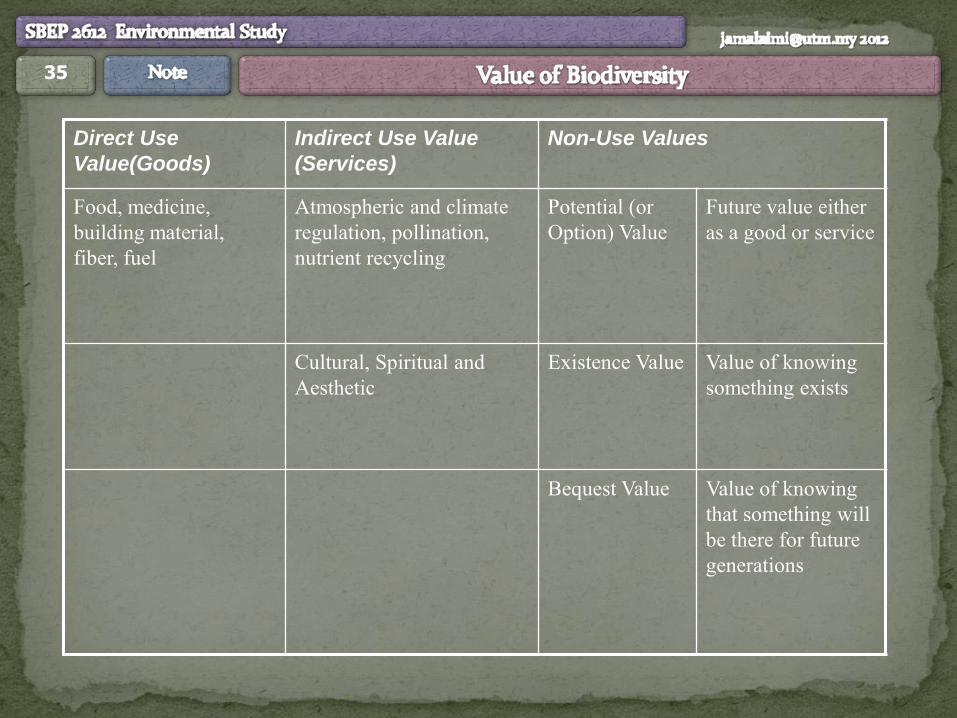
Direct Use
Value(Goods)
Indirect Use Value
(Services)
Non-Use Values
Food, medicine,
building material,
fiber, fuel
Atmospheric and climate
regulation, pollination,
nutrient recycling
Potential (or
Option) Value
Future value either
as a good or service
Cultural, Spiritual and
Aesthetic
Existence Value
Value of knowing
something exists
Bequest Value
Value of knowing
that something will
be there for future
generations
36
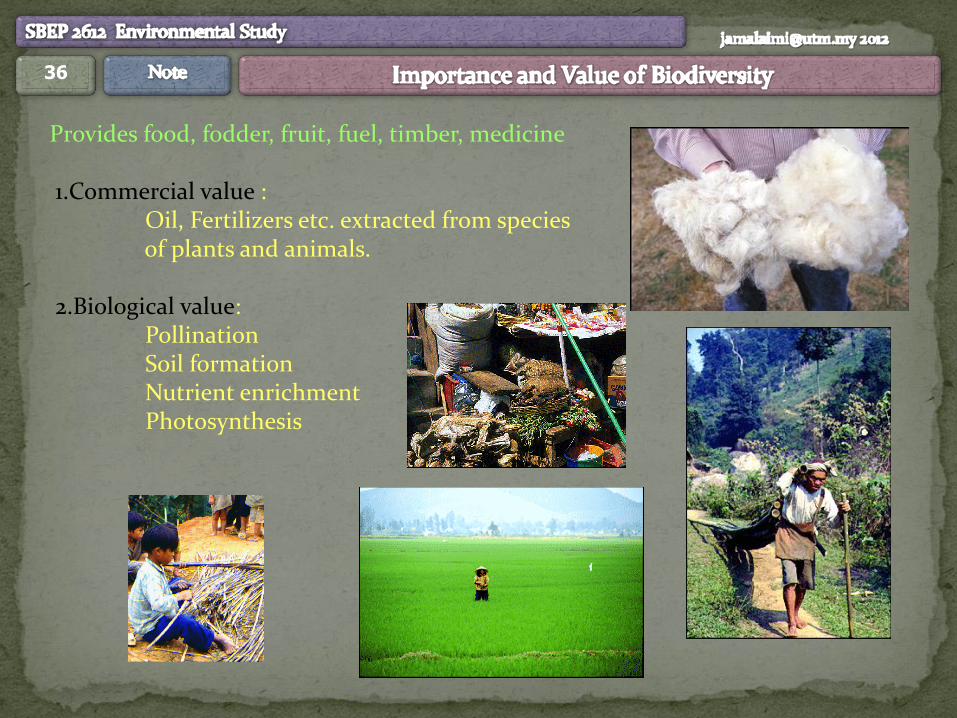
Provides food, fodder, fruit, fuel, timber, medicine 1.Commercial value : Oil, Fertilizers etc. extracted from species of plants and animals. 2.Biological value: Pollination Soil formation Nutrient enrichment Photosynthesis
37
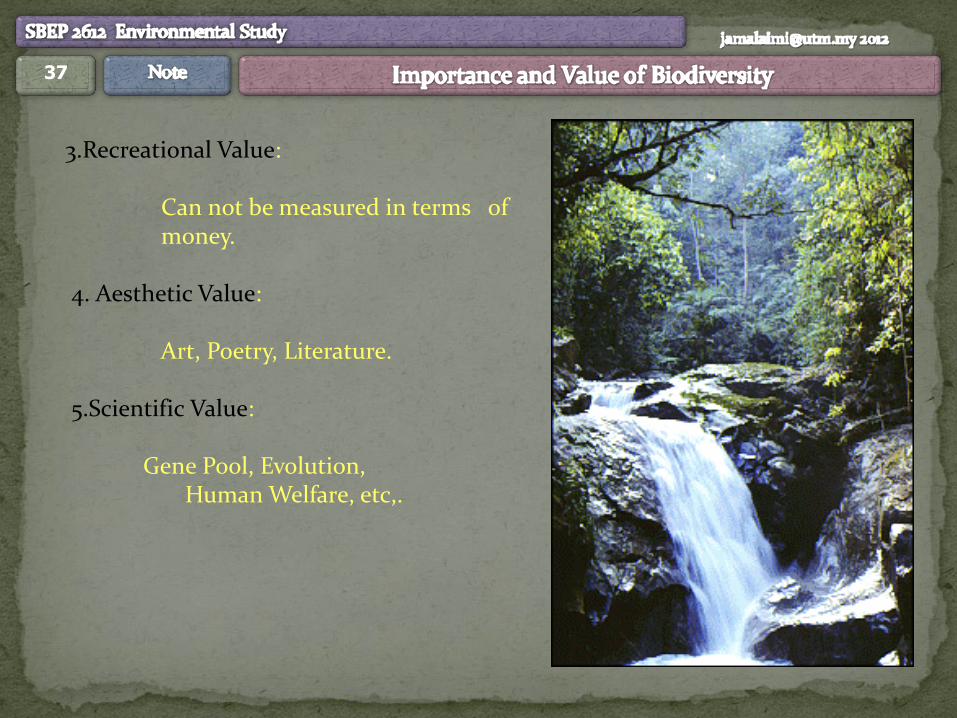
3.Recreational Value: Can not be measured in terms of money. 4. Aesthetic Value: Art, Poetry, Literature. 5.Scientific Value: Gene Pool, Evolution, Human Welfare, etc,.
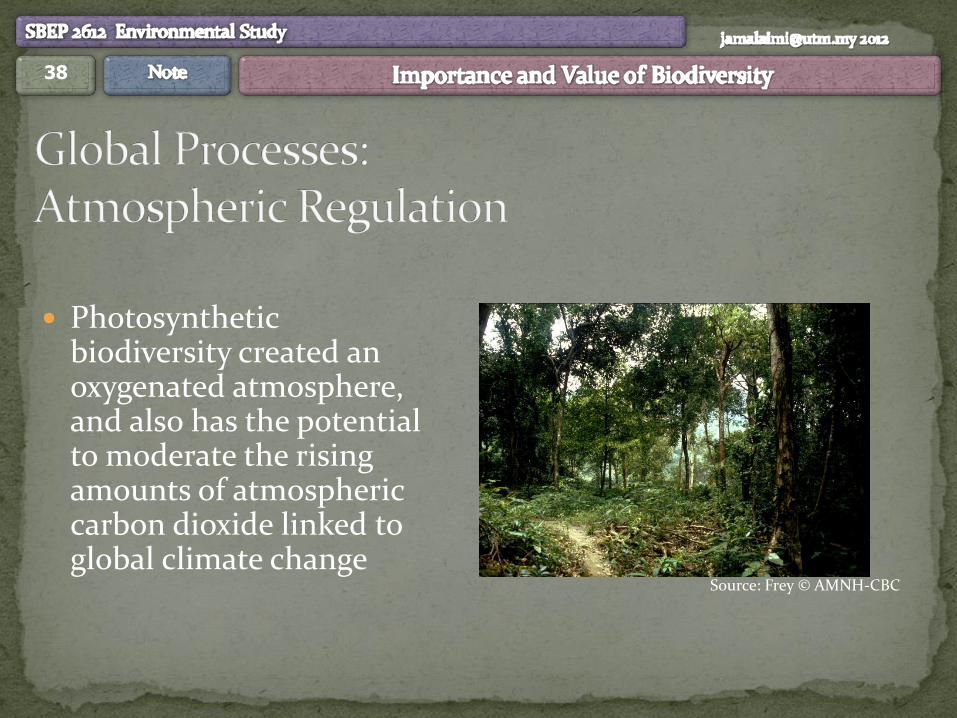
38
Photosynthetic biodiversity created an oxygenated atmosphere, and also has the potential to moderate the rising amounts of atmospheric carbon dioxide linked to global climate change
Source: Frey © AMNH-CBC
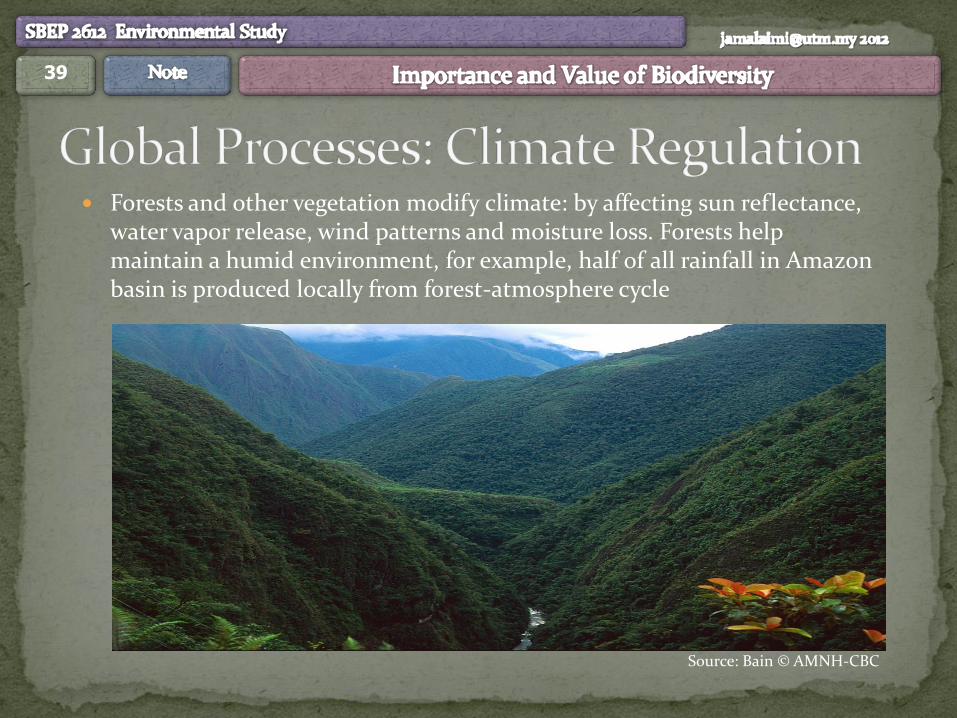
39
Forests and other vegetation modify climate: by affecting sun reflectance, water vapor release, wind patterns and moisture loss. Forests help maintain a humid environment, for example, half of all rainfall in Amazon basin is produced locally from forest-atmosphere cycle
Source: Bain © AMNH-CBC
40
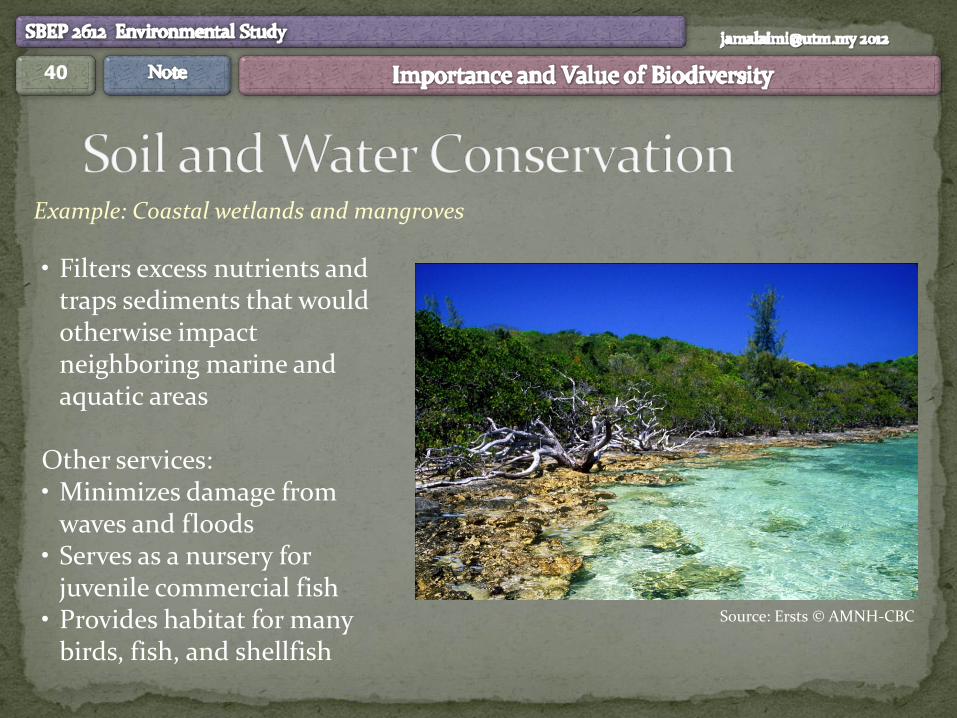
• Filters excess nutrients and traps sediments that would otherwise impact neighboring marine and aquatic areas
Other services: • Minimizes damage from
waves and floods • Serves as a nursery for
juvenile commercial fish • Provides habitat for many
birds, fish, and shellfish
Source: Ersts © AMNH-CBC
Example: Coastal wetlands and mangroves
41
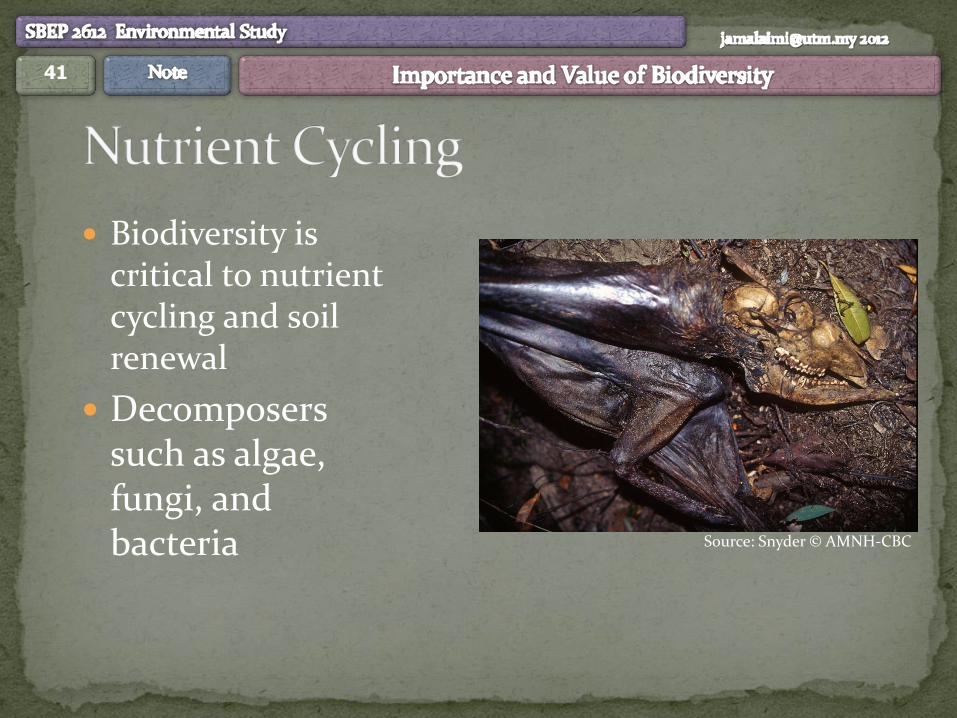
Biodiversity is critical to nutrient cycling and soil renewal
Decomposers such as algae, fungi, and bacteria
Source: Snyder © AMNH-CBC
42
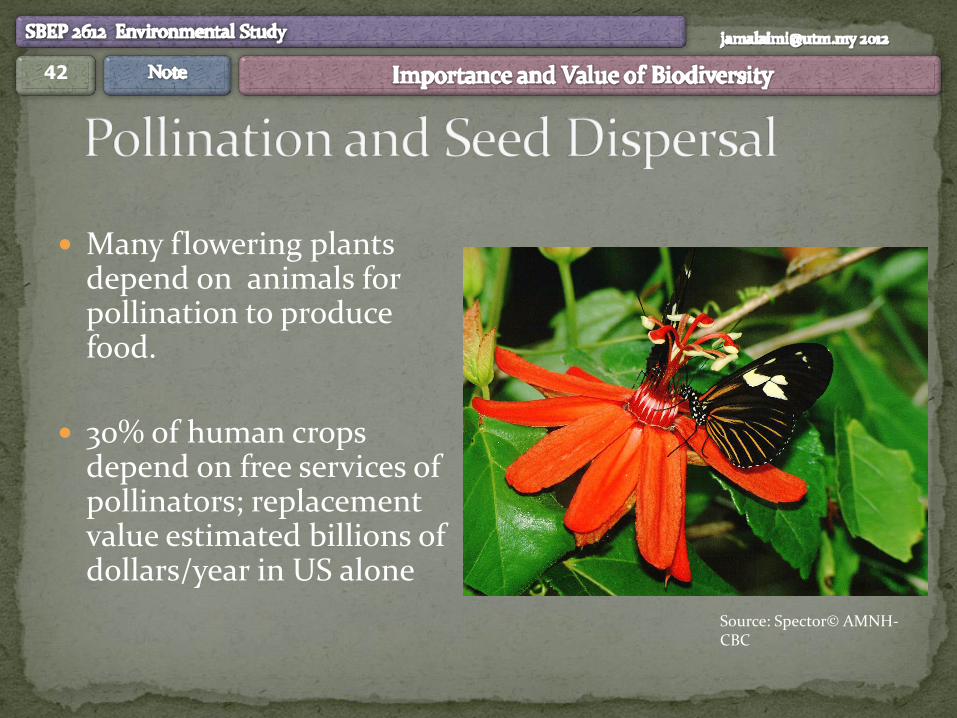
Many flowering plants depend on animals for pollination to produce food.
30% of human crops depend on free services of pollinators; replacement value estimated billions of dollars/year in US alone
Source: Spector© AMNH-CBC
43
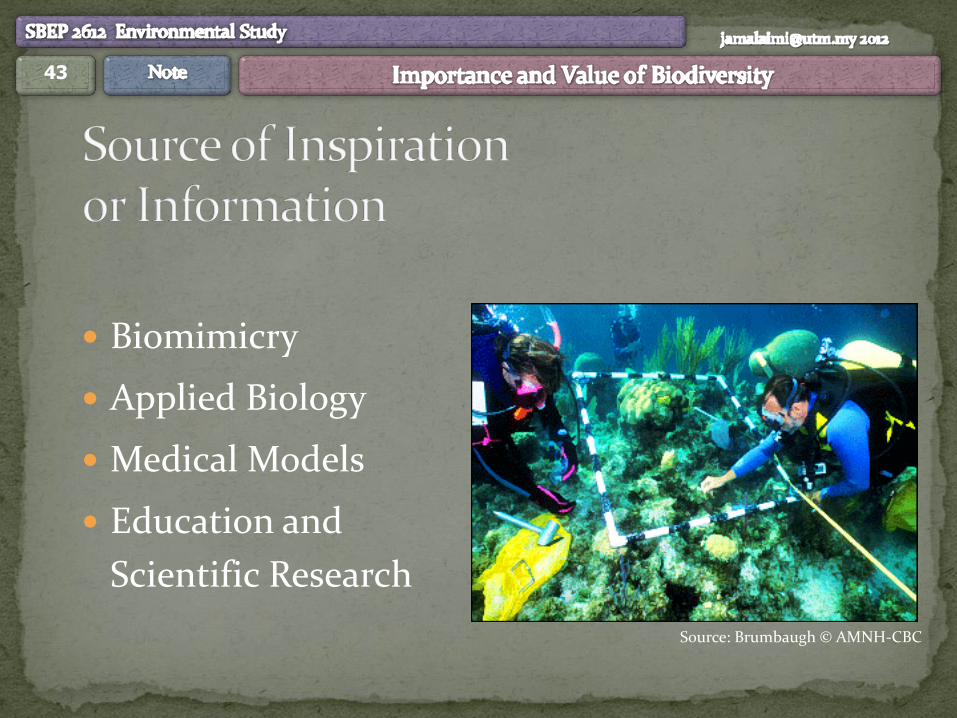
Biomimicry
Applied Biology
Medical Models
Education and
Scientific Research
Source: Brumbaugh © AMNH-CBC
44
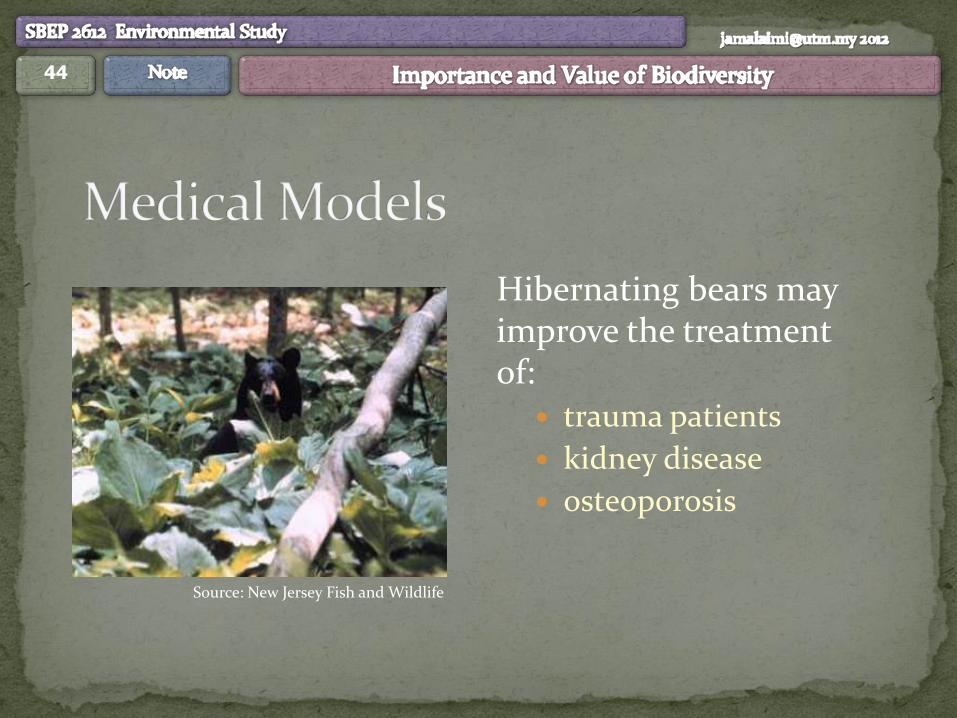
Hibernating bears may improve the treatment of:
trauma patients
kidney disease
osteoporosis
Source: New Jersey Fish and Wildlife
45
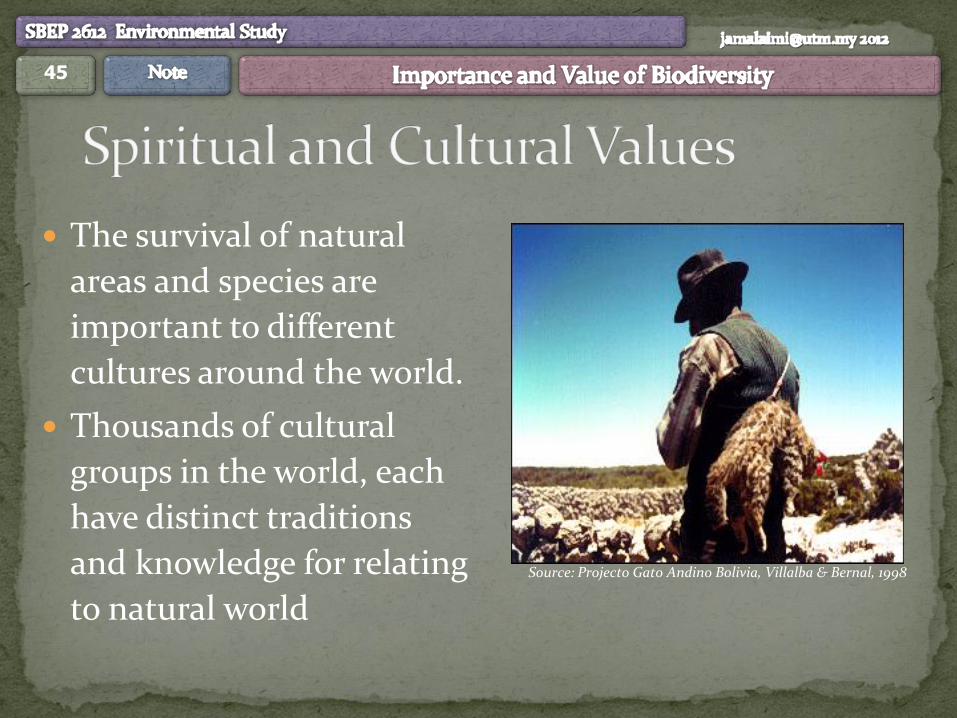
The survival of natural
areas and species are
important to different
cultures around the world.
Thousands of cultural
groups in the world, each
have distinct traditions
and knowledge for relating
to natural world Source: Projecto Gato Andino Bolivia, Villalba & Bernal, 1998
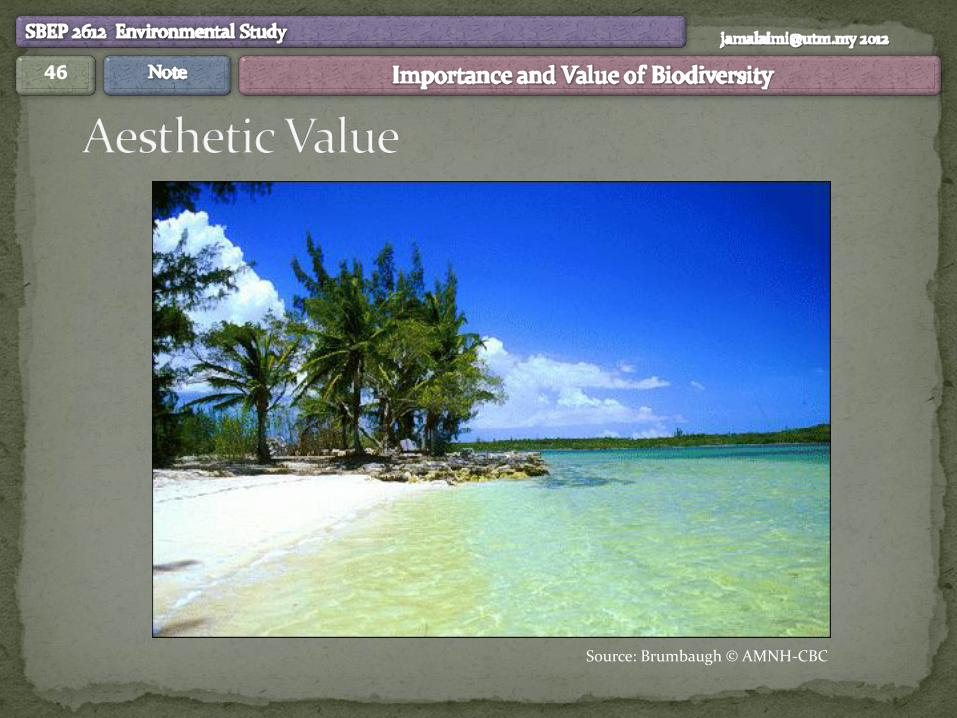
46
Source: Brumbaugh © AMNH-CBC
47
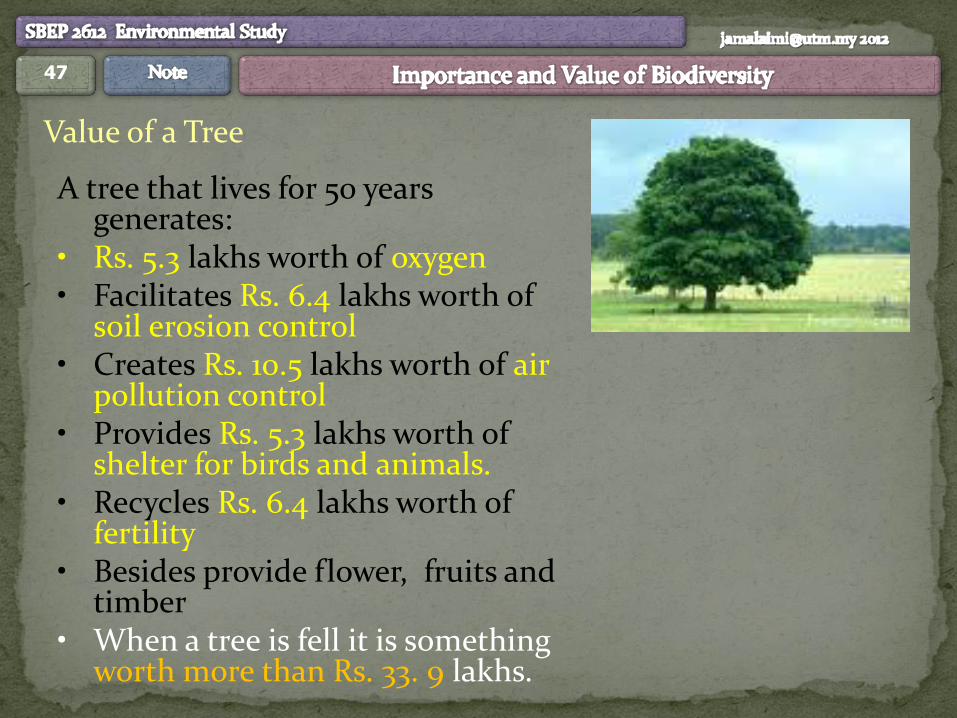
Value of a Tree
A tree that lives for 50 years generates:
• Rs. 5.3 lakhs worth of oxygen • Facilitates Rs. 6.4 lakhs worth of
soil erosion control • Creates Rs. 10.5 lakhs worth of air
pollution control • Provides Rs. 5.3 lakhs worth of
shelter for birds and animals. • Recycles Rs. 6.4 lakhs worth of
fertility • Besides provide flower, fruits and
timber • When a tree is fell it is something
worth more than Rs. 33. 9 lakhs.
48
49
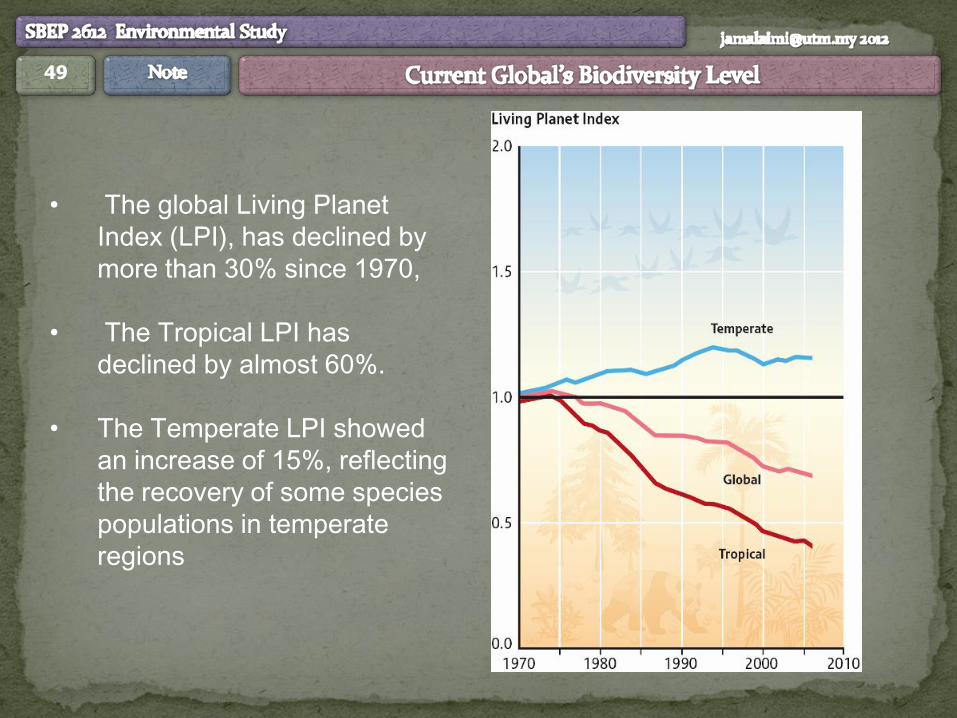
• The global Living Planet
Index (LPI), has declined by
more than 30% since 1970,
• The Tropical LPI has
declined by almost 60%.
• The Temperate LPI showed
an increase of 15%, reflecting
the recovery of some species
populations in temperate
regions

50
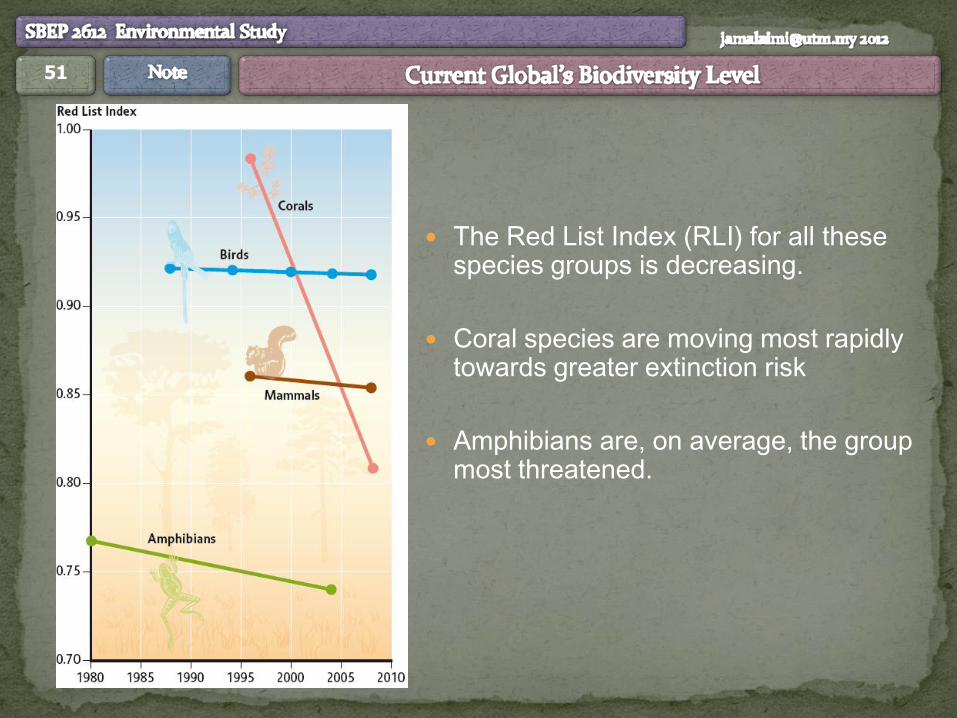
The Red List Index (RLI) for all these species groups is decreasing.
Coral species are moving most rapidly towards greater extinction risk
Amphibians are, on average, the group most threatened.
51
The Red List Index (RLI) for all these species groups is decreasing.
Coral species are moving most rapidly towards greater extinction risk
Amphibians are, on average, the group most threatened.
52
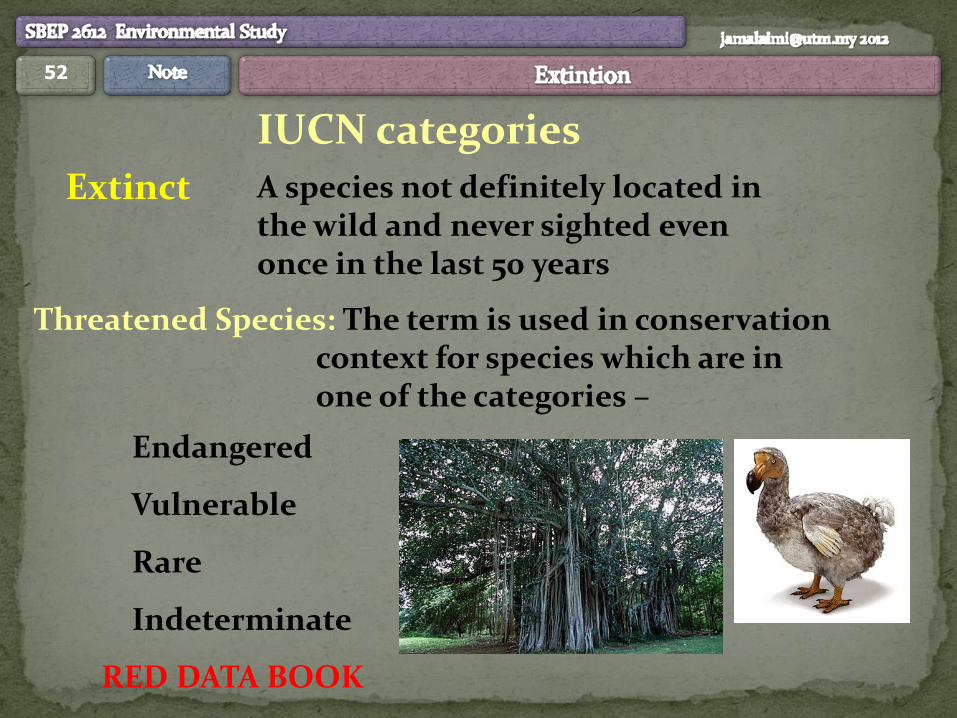
Threatened Species: The term is used in conservation context for species which are in one of the categories –
Endangered
Vulnerable
Rare
Indeterminate
RED DATA BOOK
IUCN categories
Extinct A species not definitely located in the wild and never sighted even once in the last 50 years
53
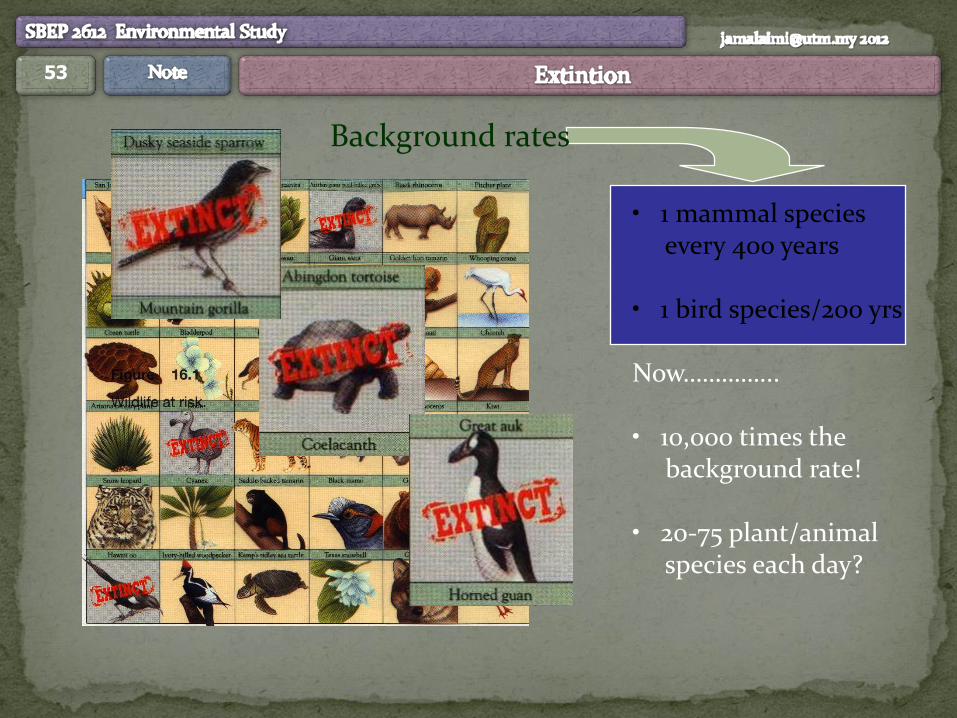
• 1 mammal species every 400 years • 1 bird species/200 yrs
Now…………...
• 10,000 times the background rate! • 20-75 plant/animal species each day?
Background rates
54
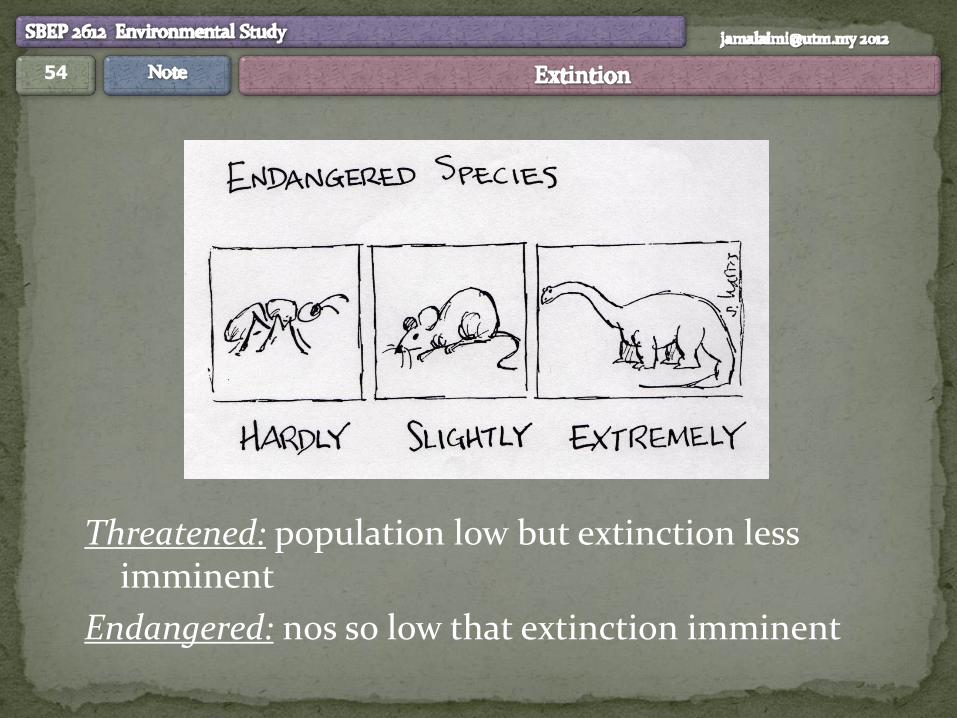
Threatened: population low but extinction less imminent
Endangered: nos so low that extinction imminent
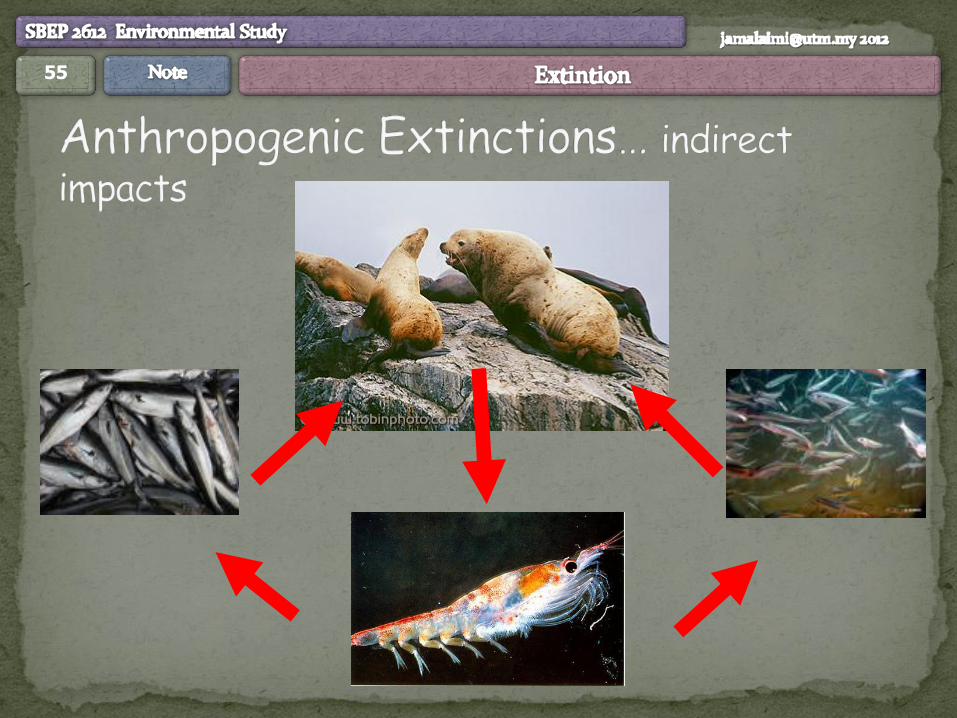
55
56
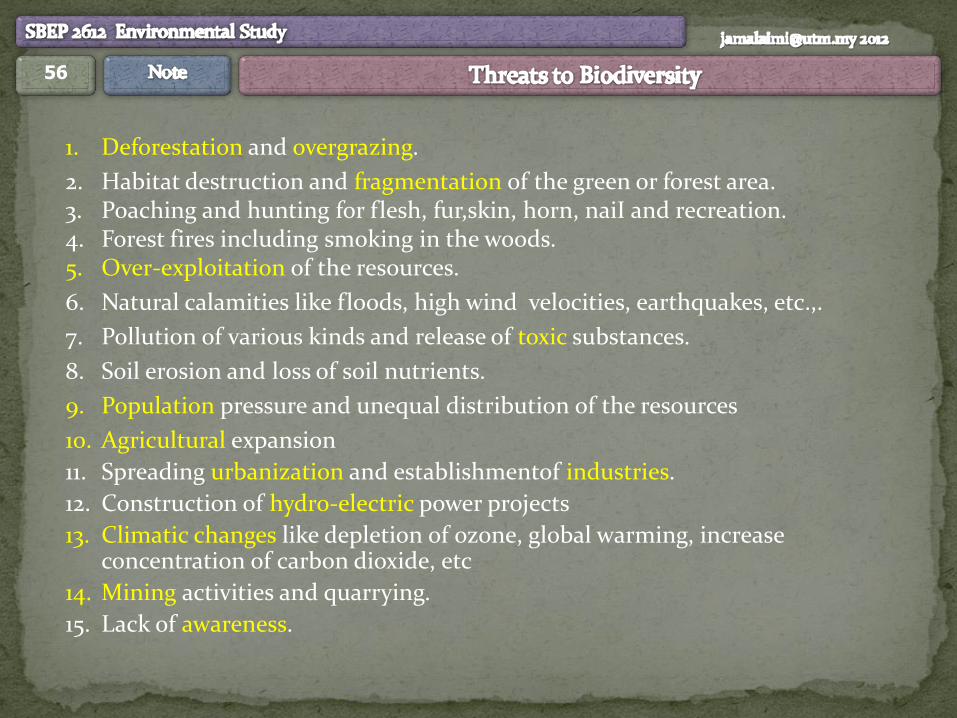
1. Deforestation and overgrazing.
2. Habitat destruction and fragmentation of the green or forest area. 3. Poaching and hunting for flesh, fur,skin, horn, naiI and recreation. 4. Forest fires including smoking in the woods. 5. Over-exploitation of the resources.
6. Natural calamities like floods, high wind velocities, earthquakes, etc.,.
7. Pollution of various kinds and release of toxic substances.
8. Soil erosion and loss of soil nutrients.
9. Population pressure and unequal distribution of the resources
10. Agricultural expansion
11. Spreading urbanization and establishmentof industries.
12. Construction of hydro-electric power projects
13. Climatic changes like depletion of ozone, global warming, increase concentration of carbon dioxide, etc
14. Mining activities and quarrying.
15. Lack of awareness.
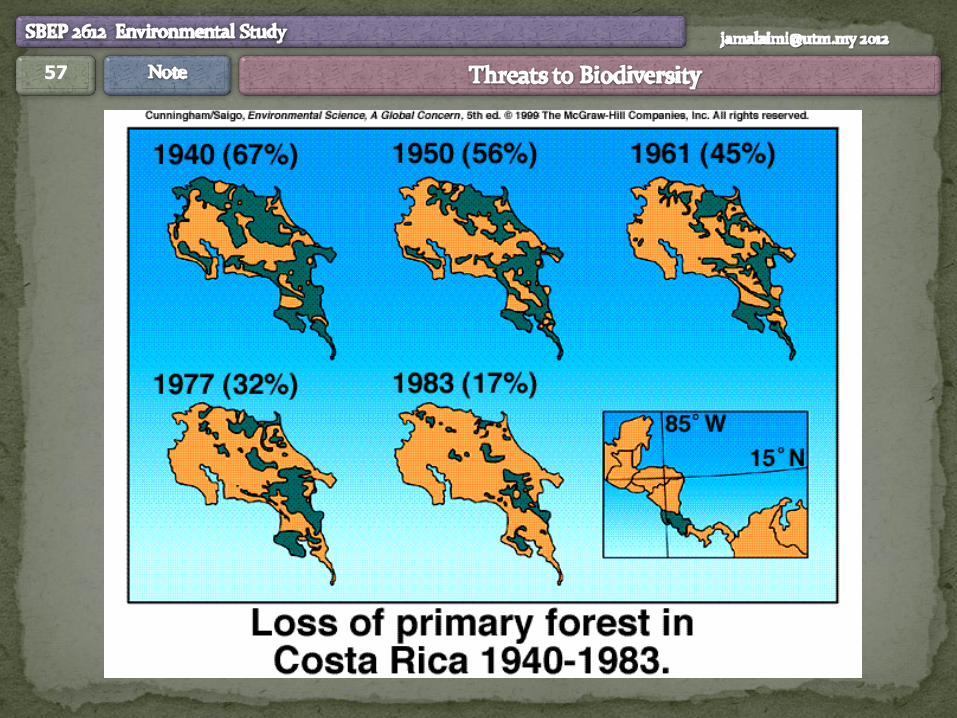
57
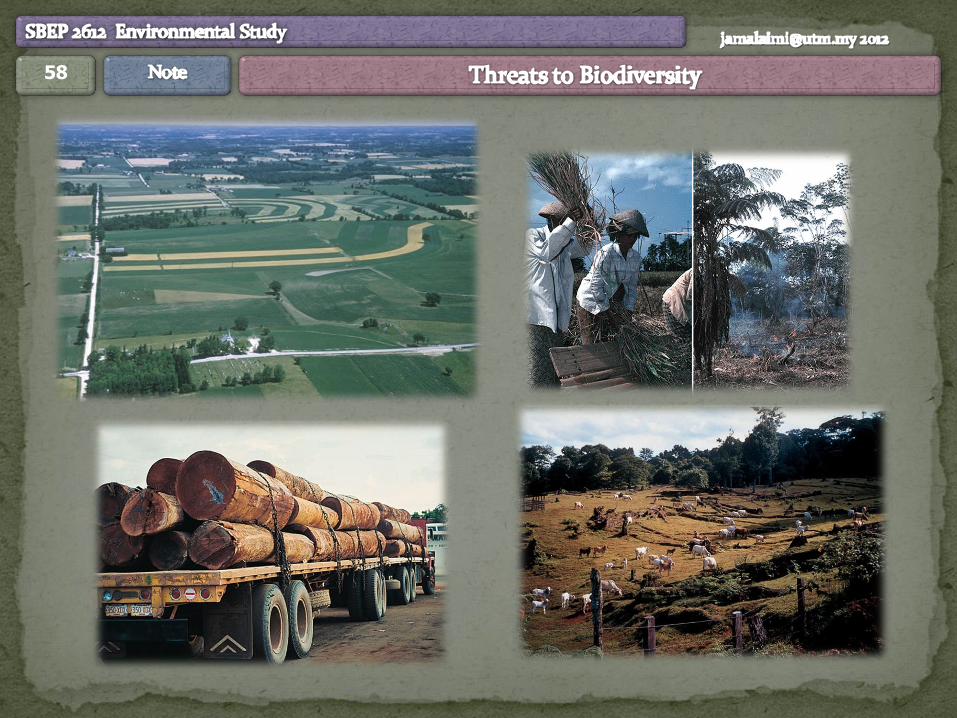
58
59
60
61
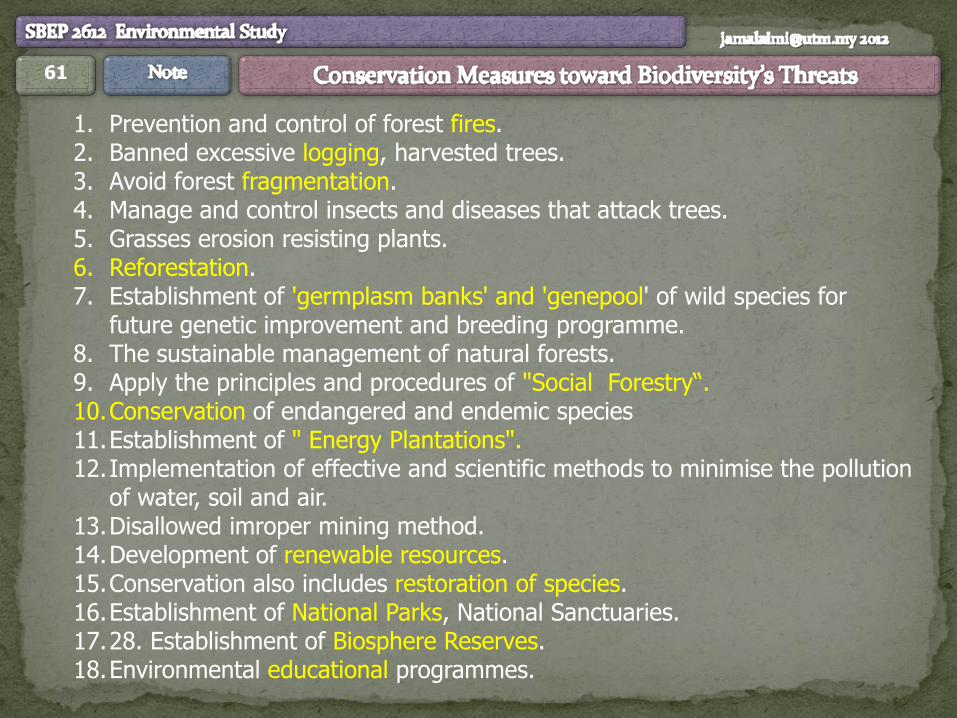
1. Prevention and control of forest fires. 2. Banned excessive logging, harvested trees. 3. Avoid forest fragmentation. 4. Manage and control insects and diseases that attack trees. 5. Grasses erosion resisting plants. 6. Reforestation. 7. Establishment of 'germplasm banks' and 'genepool' of wild species for
future genetic improvement and breeding programme. 8. The sustainable management of natural forests. 9. Apply the principles and procedures of "Social Forestry“. 10.Conservation of endangered and endemic species 11.Establishment of " Energy Plantations". 12.Implementation of effective and scientific methods to minimise the pollution
of water, soil and air. 13.Disallowed imroper mining method. 14.Development of renewable resources. 15.Conservation also includes restoration of species. 16.Establishment of National Parks, National Sanctuaries. 17.28. Establishment of Biosphere Reserves. 18.Environmental educational programmes.
62
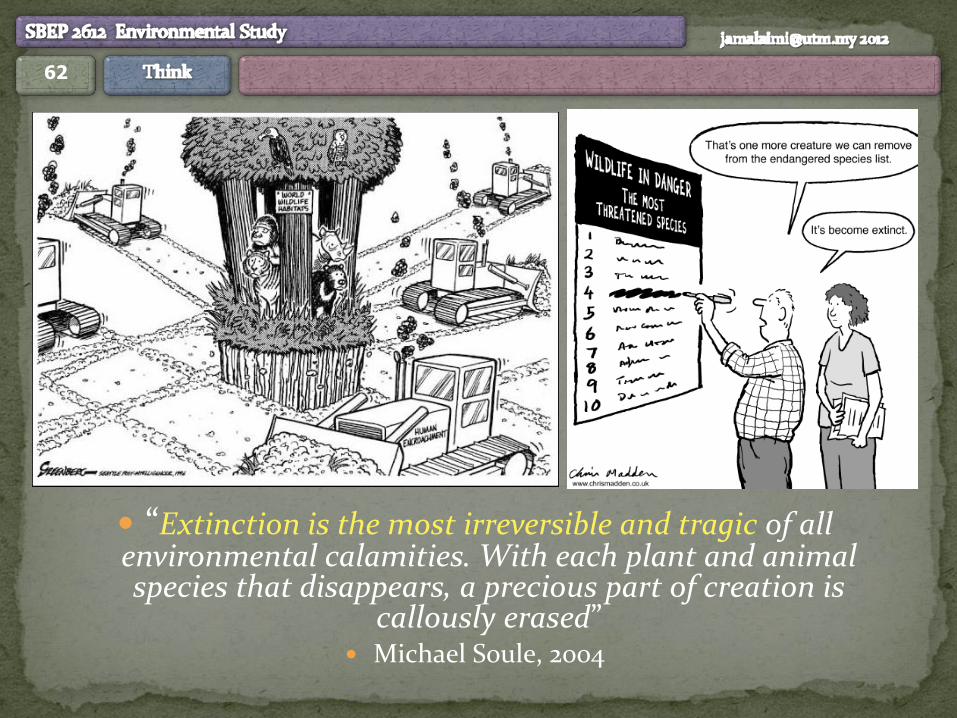
“Extinction is the most irreversible and tragic of all environmental calamities. With each plant and animal species that disappears, a precious part of creation is
callously erased” Michael Soule, 2004
63 63
thank you Q & A