the maximum ice age (wu¨rmian, last ice age, lgm
TRANSCRIPT
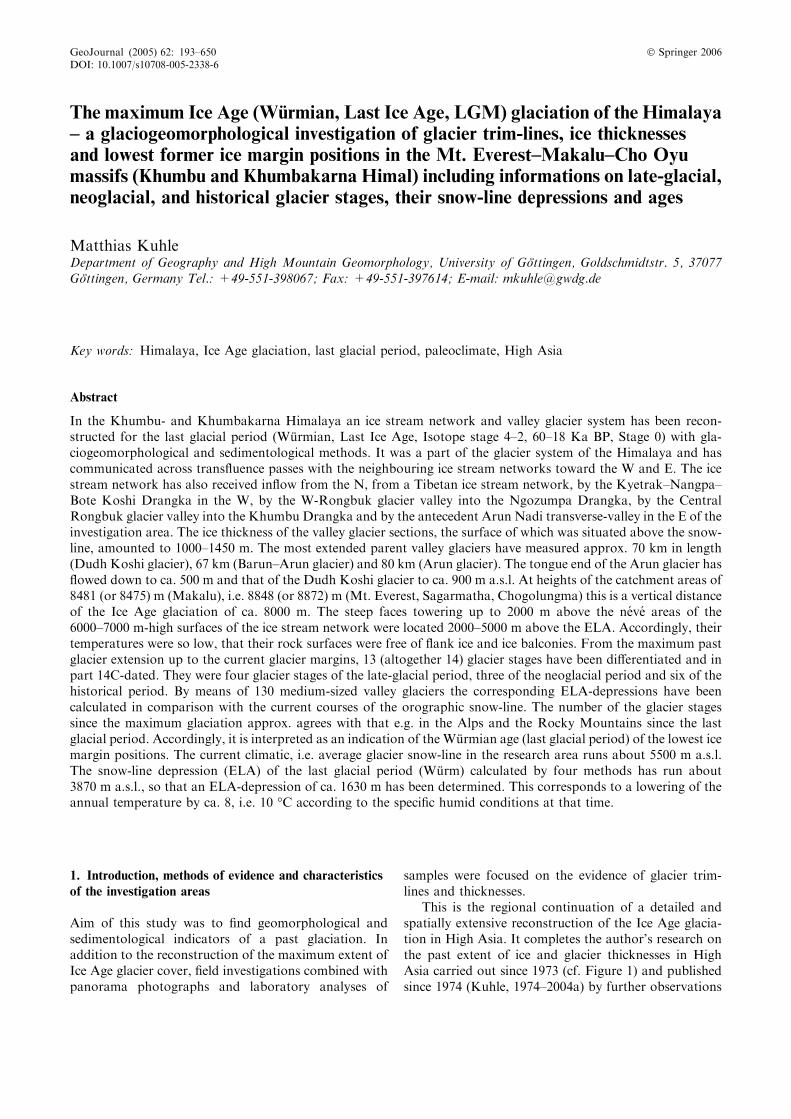
The maximum Ice Age (Wurmian, Last Ice Age, LGM) glaciation of the Himalaya– a glaciogeomorphological investigation of glacier trim-lines, ice thicknessesand lowest former ice margin positions in the Mt. Everest–Makalu–Cho Oyumassifs (Khumbu and Khumbakarna Himal) including informations on late-glacial,neoglacial, and historical glacier stages, their snow-line depressions and ages
Matthias KuhleDepartment of Geography and High Mountain Geomorphology, University of Gottingen, Goldschmidtstr. 5, 37077Gottingen, Germany Tel.: +49-551-398067; Fax: +49-551-397614; E-mail: [email protected]
Key words: Himalaya, Ice Age glaciation, last glacial period, paleoclimate, High Asia
Abstract
In the Khumbu- and Khumbakarna Himalaya an ice stream network and valley glacier system has been recon-structed for the last glacial period (Wurmian, Last Ice Age, Isotope stage 4–2, 60–18 Ka BP, Stage 0) with gla-ciogeomorphological and sedimentological methods. It was a part of the glacier system of the Himalaya and hascommunicated across transfluence passes with the neighbouring ice stream networks toward the W and E. The icestream network has also received inflow from the N, from a Tibetan ice stream network, by the Kyetrak–Nangpa–Bote Koshi Drangka in the W, by the W-Rongbuk glacier valley into the Ngozumpa Drangka, by the CentralRongbuk glacier valley into the Khumbu Drangka and by the antecedent Arun Nadi transverse-valley in the E of theinvestigation area. The ice thickness of the valley glacier sections, the surface of which was situated above the snow-line, amounted to 1000–1450 m. The most extended parent valley glaciers have measured approx. 70 km in length(Dudh Koshi glacier), 67 km (Barun–Arun glacier) and 80 km (Arun glacier). The tongue end of the Arun glacier hasflowed down to ca. 500 m and that of the Dudh Koshi glacier to ca. 900 m a.s.l. At heights of the catchment areas of8481 (or 8475) m (Makalu), i.e. 8848 (or 8872) m (Mt. Everest, Sagarmatha, Chogolungma) this is a vertical distanceof the Ice Age glaciation of ca. 8000 m. The steep faces towering up to 2000 m above the neve areas of the6000–7000 m-high surfaces of the ice stream network were located 2000–5000 m above the ELA. Accordingly, theirtemperatures were so low, that their rock surfaces were free of flank ice and ice balconies. From the maximum pastglacier extension up to the current glacier margins, 13 (altogether 14) glacier stages have been differentiated and inpart 14C-dated. They were four glacier stages of the late-glacial period, three of the neoglacial period and six of thehistorical period. By means of 130 medium-sized valley glaciers the corresponding ELA-depressions have beencalculated in comparison with the current courses of the orographic snow-line. The number of the glacier stagessince the maximum glaciation approx. agrees with that e.g. in the Alps and the Rocky Mountains since the lastglacial period. Accordingly, it is interpreted as an indication of the Wurmian age (last glacial period) of the lowest icemargin positions. The current climatic, i.e. average glacier snow-line in the research area runs about 5500 m a.s.l.The snow-line depression (ELA) of the last glacial period (Wurm) calculated by four methods has run about3870 m a.s.l., so that an ELA-depression of ca. 1630 m has been determined. This corresponds to a lowering of theannual temperature by ca. 8, i.e. 10 �C according to the specific humid conditions at that time.
1. Introduction, methods of evidence and characteristics
of the investigation areas
Aim of this study was to find geomorphological andsedimentological indicators of a past glaciation. Inaddition to the reconstruction of the maximum extent ofIce Age glacier cover, field investigations combined withpanorama photographs and laboratory analyses of
samples were focused on the evidence of glacier trim-lines and thicknesses.
This is the regional continuation of a detailed andspatially extensive reconstruction of the Ice Age glacia-tion in High Asia. It completes the author’s research onthe past extent of ice and glacier thicknesses in HighAsia carried out since 1973 (cf. Figure 1) and publishedsince 1974 (Kuhle, 1974–2004a) by further observations
GeoJournal (2005) 62: 193–650 � Springer 2006DOI: 10.1007/s10708-005-2338-6
in areas which have already been studied earlier orwhich have not yet been visited (Figure 1, Nos. 4 and20).
1.1. Methods
The geomorphological and Quaternary-geologicalmethods applied in the field and laboratory have alreadybeen discussed in detail in the papers on empirical IceAge research and the glaciation history of High Asia(Kuhle and Wang Wenjing, 1988; Kuhle and XuDaoming, 1991; Kuhle, 1994, 1997a, 1999a, 2001a)published in the GeoJournal series ‘‘Tibet and High Asia– results of investigations into high mountain geomor-phology, paleo-glaciology and climatology of the Pleis-tocene (Ice Age Research)’’ and ‘‘Glaciogeomorphologyand prehistoric glaciation in the Karakorum andHimalaya’’ Volumes I (1988), II (1991), III (1994), IV(1997a), V (1999a) and VI (2001a). Accordingly, thesescientifically common methods are only introduced herein general: Glaciogeomorphologic observations in theresearch area (Figure 2, No. 1) have been mapped.Locations of typologically unambiguous individual
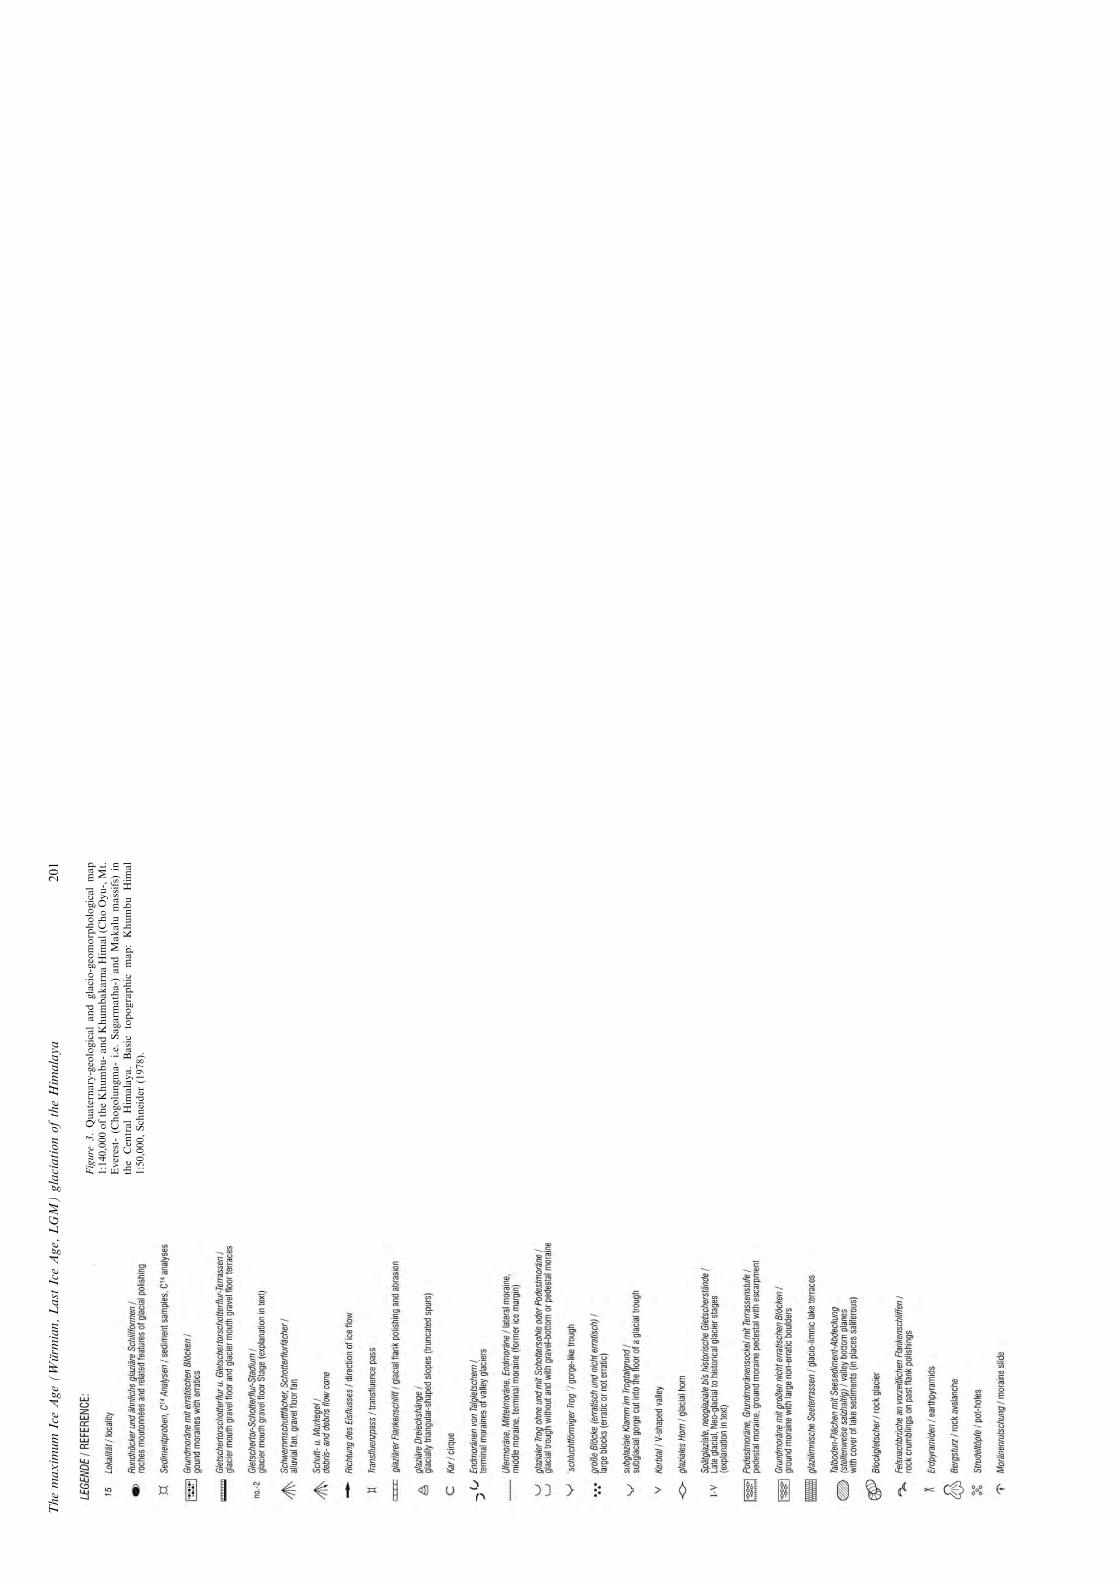
phenomena, i.e. glacier indicators, have been recordedwith the help of 39 signatures (Figures 3, 11 and 19). Thecatalogue of signatures applied has especially beendeveloped by the author for the base map 1:1 million(ONC H-9, 1978 and 1:50,000 Khumbu Himal Schnei-der, 1978). The locations of sediment samples, fromwhich only a selection could be taken in considerationfor this paper, has also been marked. All type localitiesare presented in Figures 3 and 11. They concern areas inwhich the arrangement of the position of the indicatorsprovides unambiguous evidence of the Ice Age glaciercover. References to them are given in the text, in thephotographs, photo-panoramas, tables and in thefigures. In addition to the large-scale mappings and therecording of type localities – which do not only occur onthe valley floors but partly also on remote slopes andmountain flanks – 34 geomorphologic profiles(Figures 7–10, 12–16, 20–36, 46, 52–57, 59), mainly val-ley cross-profiles distributed over the entire investigationarea, have been recorded (Figures 3 and 4). These profilesare meant to give an impression of the three-dimensionalproof-system based on the arrangement of the positions,so that they complete the glaciogemorphologic map
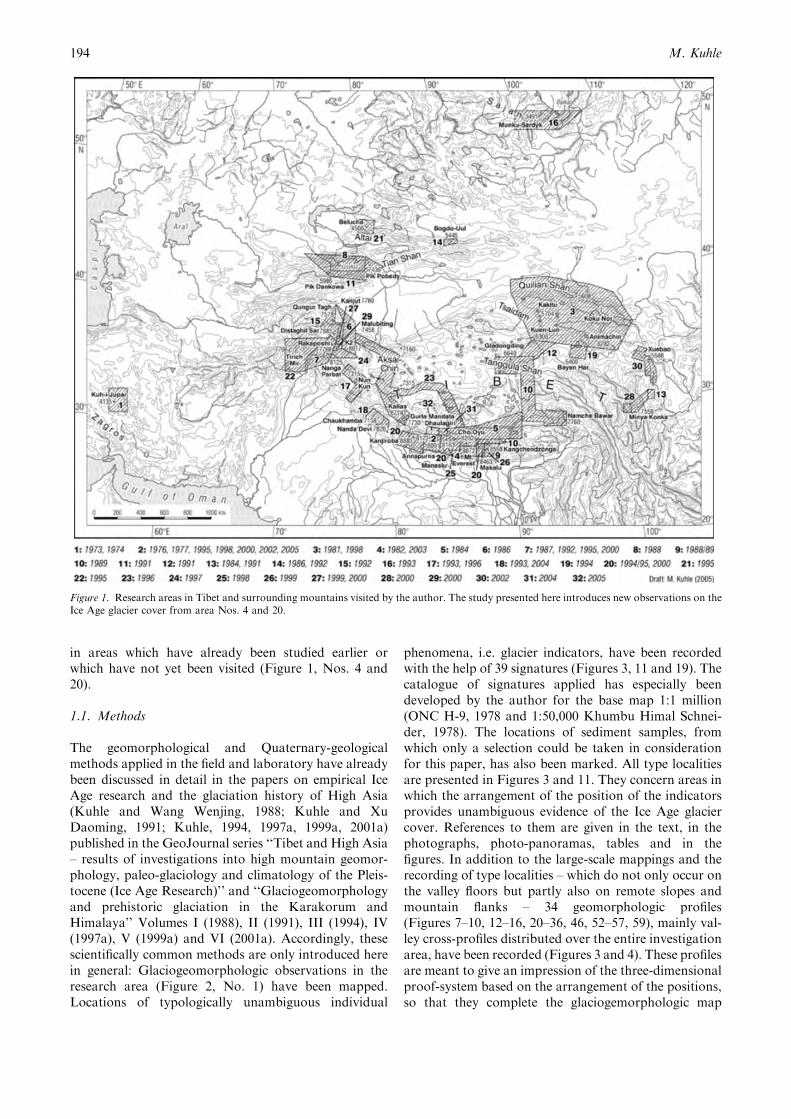
Figure 1. Research areas in Tibet and surrounding mountains visited by the author. The study presented here introduces new observations on theIce Age glacier cover from area Nos. 4 and 20.
M. Kuhle194
Themaxim
um
IceAge(Wurm
ian,Last
IceAge,
LGM)glaciationoftheHim
alaya
195
196
M.Kuhle
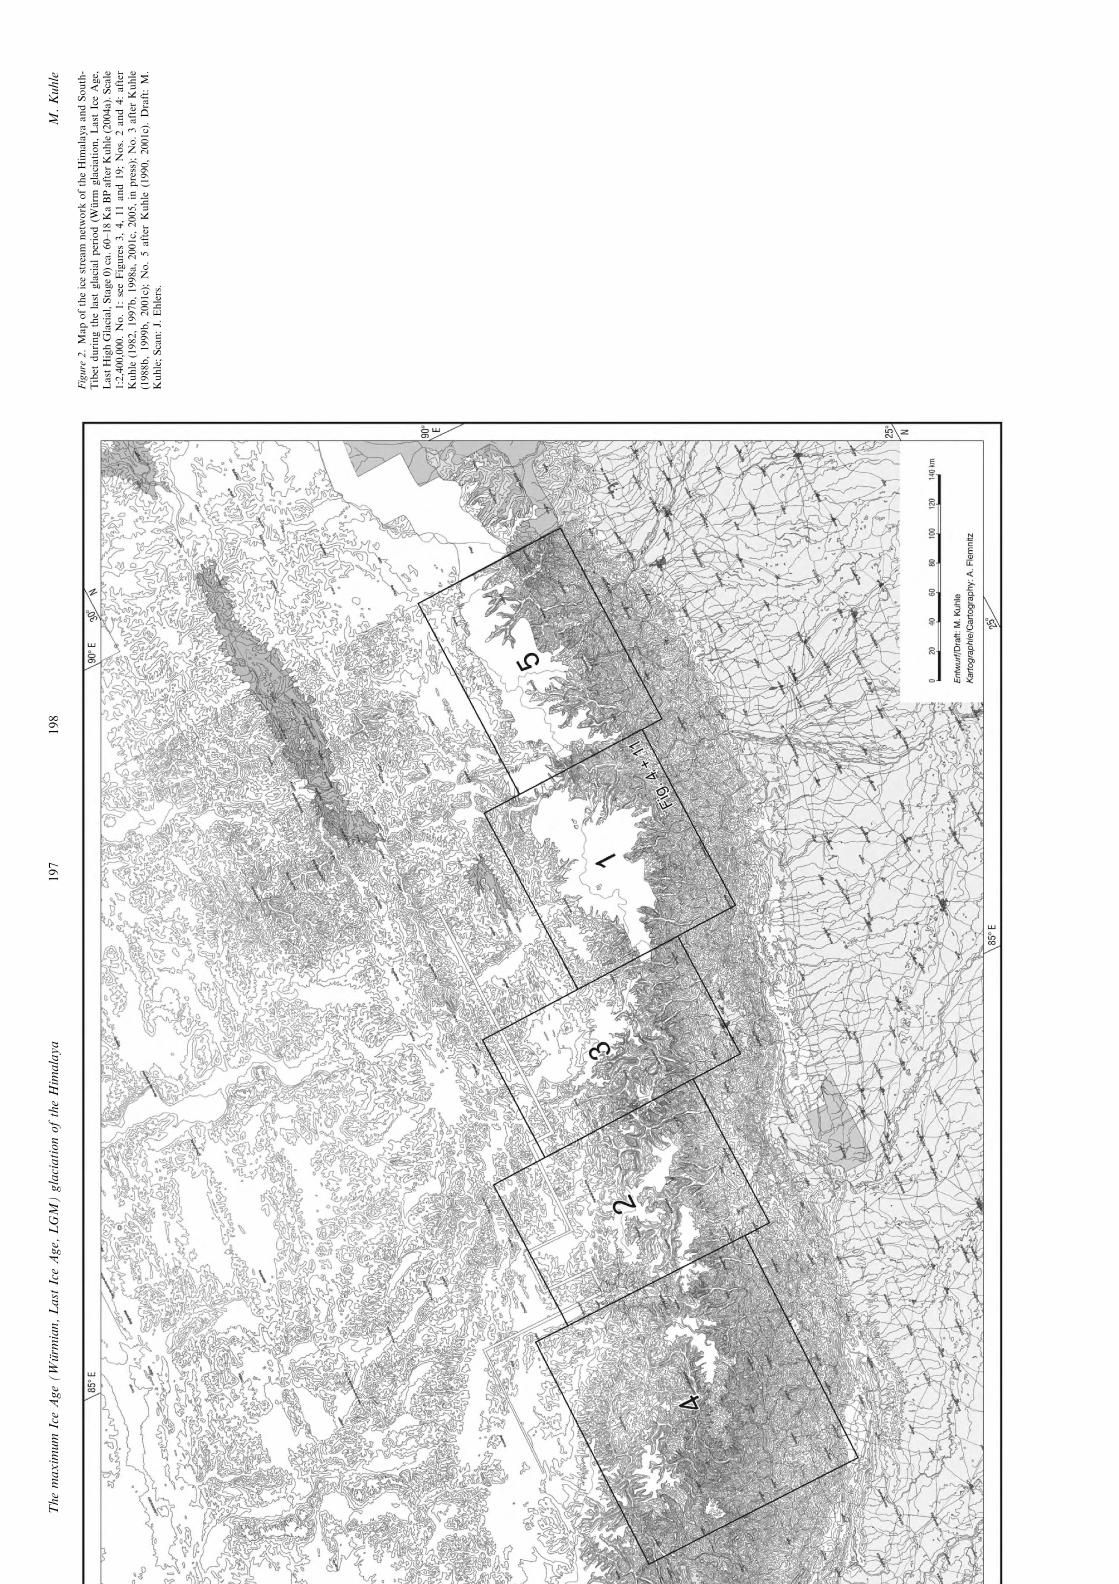
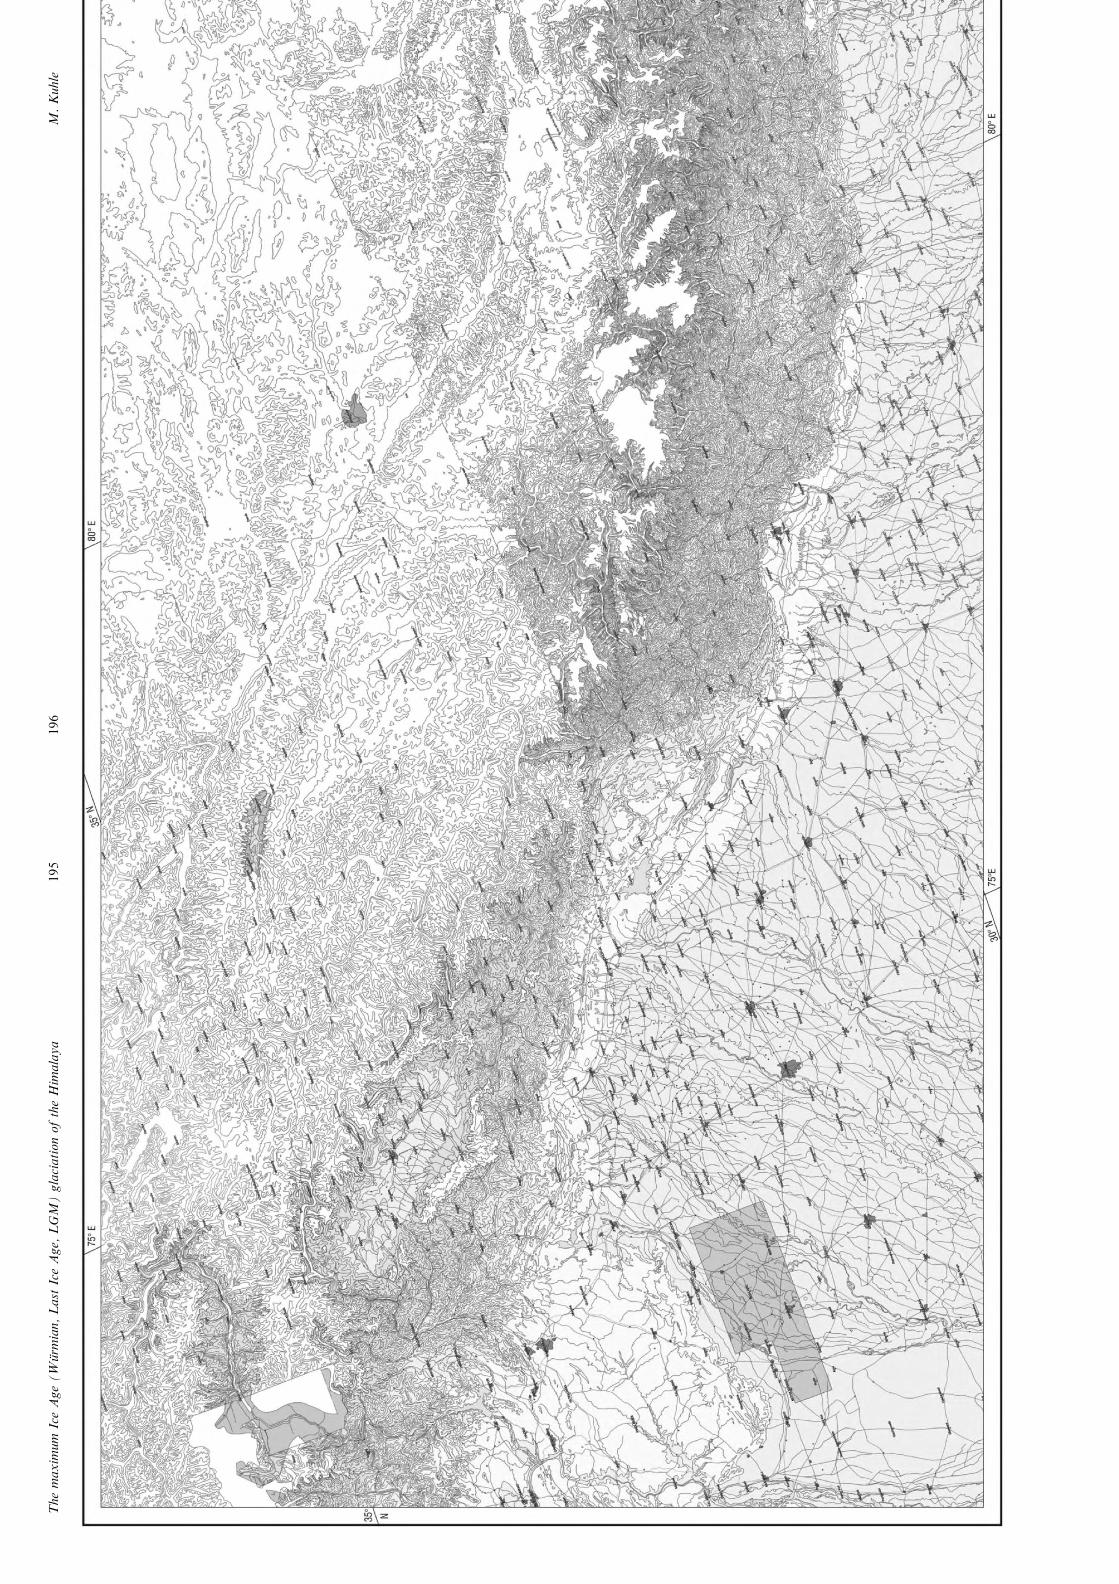
Figure
2.Mapoftheicestream
network
oftheHim
alayaandSouth-
Tibet
duringthelast
glacialperiod(W
urm
glaciation,Last
IceAge,
LastHighGlacial,Stage0)ca.60–18KaBPafter
Kuhle(2004a).Scale
1:2,400,000.No.1:seeFigures3,4,11and19;Nos.
2and4:after
Kuhle
(1982,1997b,1998a,2001c,
2005,in
press);No.3after
Kuhle
(1988b,1999b,2001c);No.5after
Kuhle
(1990,2001c).Draft:M.
Kuhle;Scan:J.
Ehlers.
Themaxim
um
IceAge(Wurm
ian,Last
IceAge,
LGM)glaciationoftheHim
alaya
197
198
M.Kuhle
Themaxim
um
IceAge(Wurm
ian,Last
IceAge,
LGM)glaciationoftheHim
alaya
199
200
M.Kuhle
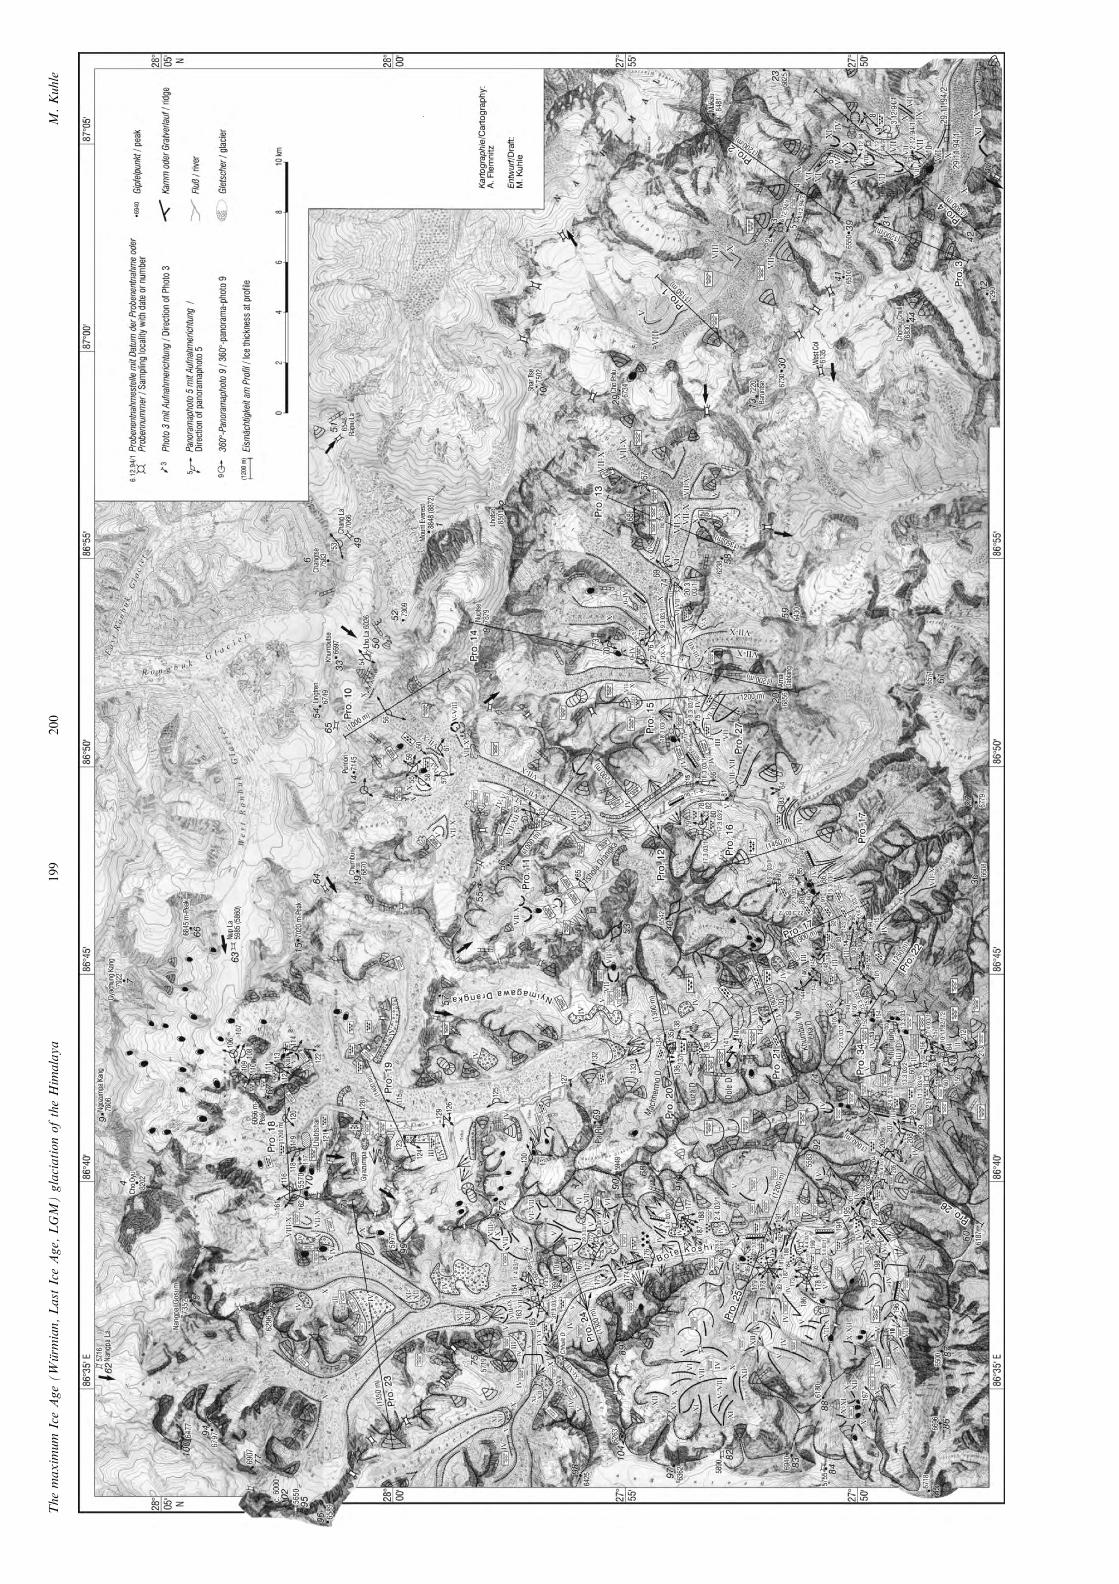
Figure
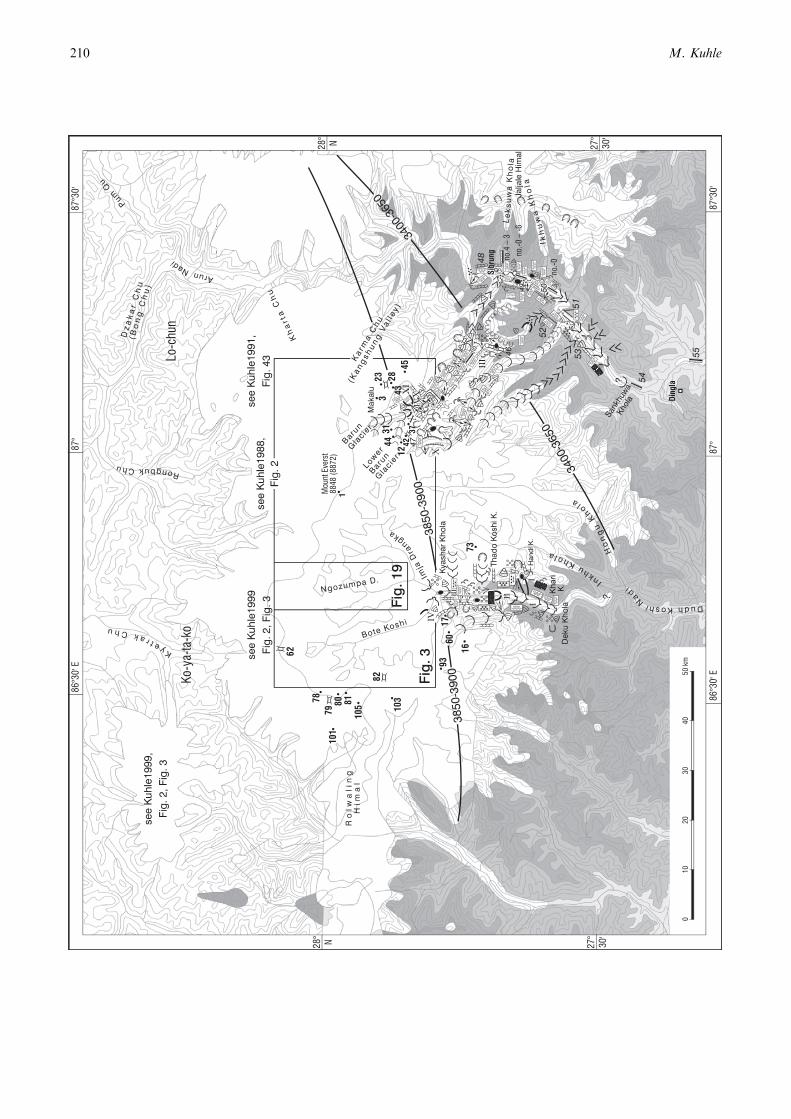
3.Quaternary-geologicaland
glacio-geomorphological
map
1:140,000oftheKhumbu-andKhumbakarnaHim
al(C
hoOyu-,Mt.
Everest-
(Chogolungma-i.e.
Sagarm
atha-)
andMakalu
massifs)
inthe
CentralHim
alaya.Basic
topographic
map:Khumbu
Him
al
1:50,000,Schneider
(1978).
Themaxim
um
IceAge(Wurm
ian,Last
IceAge,
LGM)glaciationoftheHim
alaya
201
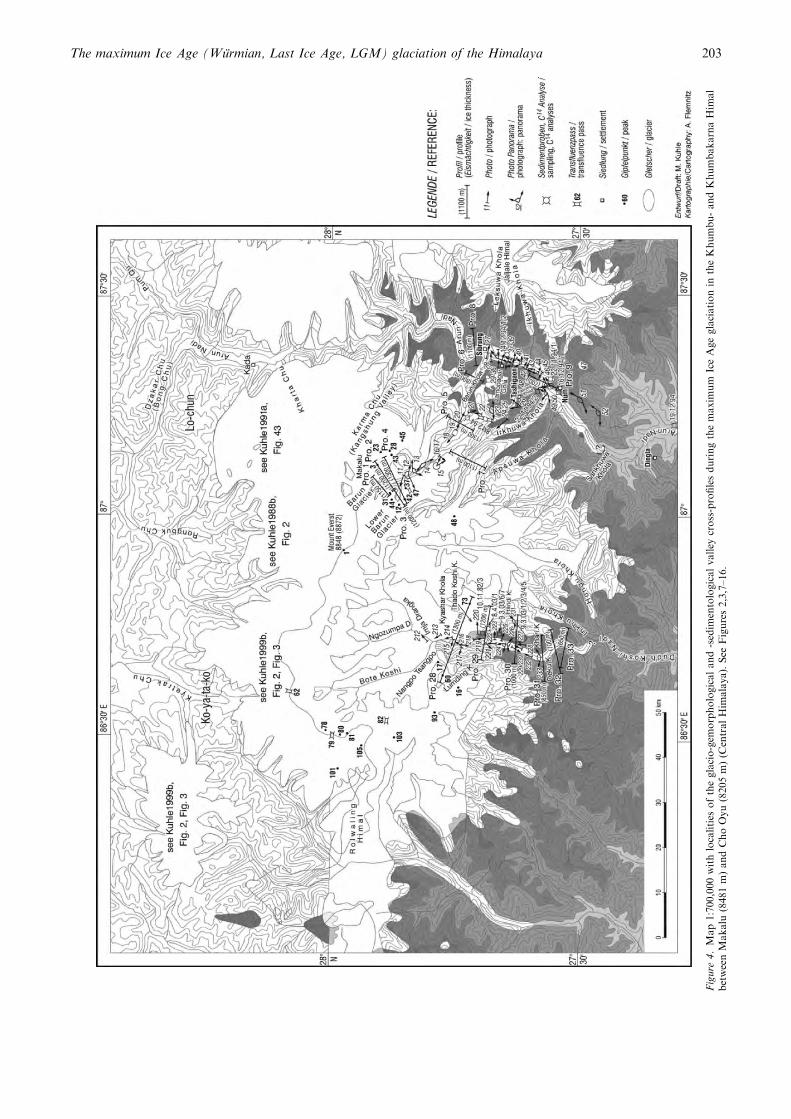
Figure
4.Map1:700,000withlocalities
oftheglacio-gem
orphologicaland-sedim
entologicalvalley
cross-profilesduringthemaxim
um
IceAgeglaciationin
theKhumbu-andKhumbakarnaHim
al
betweenMakalu
(8481m)andChoOyu(8205m)(C
entralHim
alaya).See
Figures2,3,7–16.
The maximum Ice Age (Wurmian, Last Ice Age, LGM) glaciation of the Himalaya 203
(Figure 3, 11 and 19). Especially the indicators of thepast-glacier thickness can be inferred from these profiles.All indicators marked in the maps and profiles have beendocumented on the spot by photographs and photo-panoramas (Figures 3 and 4) in a medium-sized format.All these photos are analogue photos, so that in contrastto digital photos – the content and validity of which canbe changed without having any possibility of checking –the authenticity of the photos in the field is verifiable bynegative films and prints.
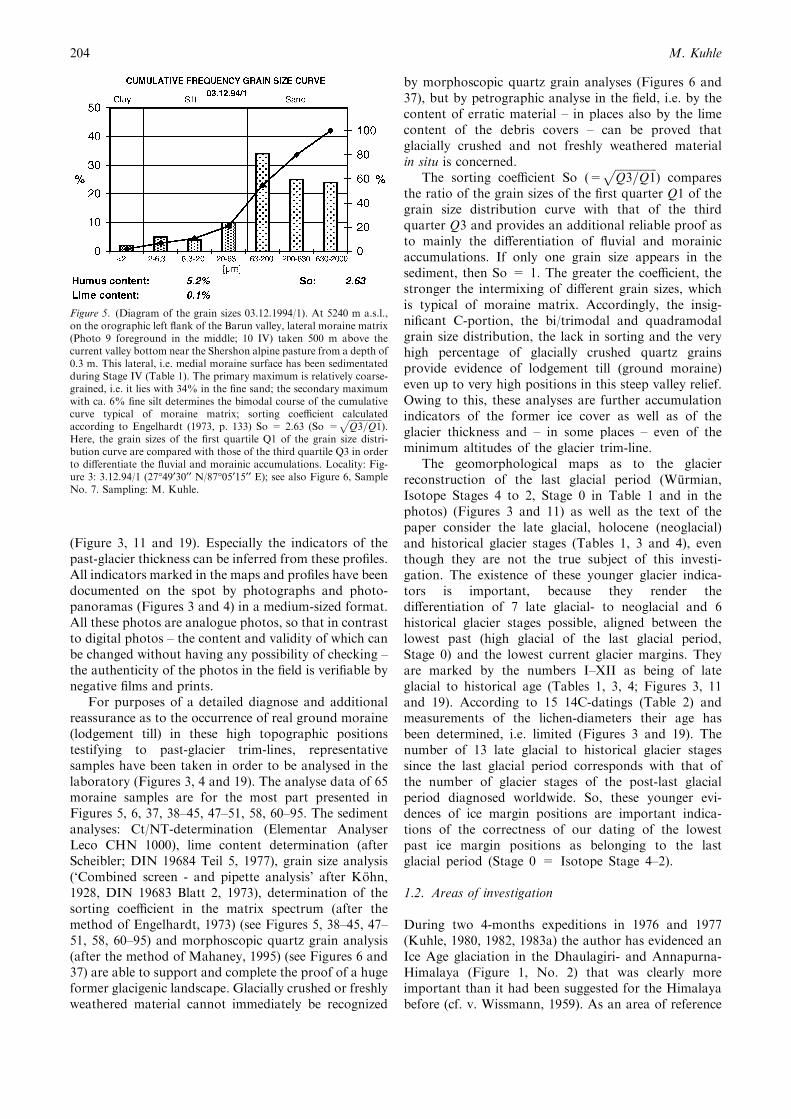
For purposes of a detailed diagnose and additionalreassurance as to the occurrence of real ground moraine(lodgement till) in these high topographic positionstestifying to past-glacier trim-lines, representativesamples have been taken in order to be analysed in thelaboratory (Figures 3, 4 and 19). The analyse data of 65moraine samples are for the most part presented inFigures 5, 6, 37, 38–45, 47–51, 58, 60–95. The sedimentanalyses: Ct/NT-determination (Elementar AnalyserLeco CHN 1000), lime content determination (afterScheibler; DIN 19684 Teil 5, 1977), grain size analysis(‘Combined screen - and pipette analysis’ after Kohn,1928, DIN 19683 Blatt 2, 1973), determination of thesorting coefficient in the matrix spectrum (after themethod of Engelhardt, 1973) (see Figures 5, 38–45, 47–51, 58, 60–95) and morphoscopic quartz grain analysis(after the method of Mahaney, 1995) (see Figures 6 and37) are able to support and complete the proof of a hugeformer glacigenic landscape. Glacially crushed or freshlyweathered material cannot immediately be recognized
by morphoscopic quartz grain analyses (Figures 6 and37), but by petrographic analyse in the field, i.e. by thecontent of erratic material – in places also by the limecontent of the debris covers – can be proved thatglacially crushed and not freshly weathered materialin situ is concerned.
The sorting coefficient So (=ffiffiffiffiffiffiffiffiffiffiffiffiffiffiffiQ3=Q1
p) compares
the ratio of the grain sizes of the first quarter Q1 of thegrain size distribution curve with that of the thirdquarter Q3 and provides an additional reliable proof asto mainly the differentiation of fluvial and morainicaccumulations. If only one grain size appears in thesediment, then So = 1. The greater the coefficient, thestronger the intermixing of different grain sizes, whichis typical of moraine matrix. Accordingly, the insig-nificant C-portion, the bi/trimodal and quadramodalgrain size distribution, the lack in sorting and the veryhigh percentage of glacially crushed quartz grainsprovide evidence of lodgement till (ground moraine)even up to very high positions in this steep valley relief.Owing to this, these analyses are further accumulationindicators of the former ice cover as well as of theglacier thickness and – in some places – even of theminimum altitudes of the glacier trim-line.
The geomorphological maps as to the glacierreconstruction of the last glacial period (Wurmian,Isotope Stages 4 to 2, Stage 0 in Table 1 and in thephotos) (Figures 3 and 11) as well as the text of thepaper consider the late glacial, holocene (neoglacial)and historical glacier stages (Tables 1, 3 and 4), eventhough they are not the true subject of this investi-gation. The existence of these younger glacier indica-tors is important, because they render thedifferentiation of 7 late glacial- to neoglacial and 6historical glacier stages possible, aligned between thelowest past (high glacial of the last glacial period,Stage 0) and the lowest current glacier margins. Theyare marked by the numbers I–XII as being of lateglacial to historical age (Tables 1, 3, 4; Figures 3, 11and 19). According to 15 14C-datings (Table 2) andmeasurements of the lichen-diameters their age hasbeen determined, i.e. limited (Figures 3 and 19). Thenumber of 13 late glacial to historical glacier stagessince the last glacial period corresponds with that ofthe number of glacier stages of the post-last glacialperiod diagnosed worldwide. So, these younger evi-dences of ice margin positions are important indica-tions of the correctness of our dating of the lowestpast ice margin positions as belonging to the lastglacial period (Stage 0 = Isotope Stage 4–2).
1.2. Areas of investigation
During two 4-months expeditions in 1976 and 1977(Kuhle, 1980, 1982, 1983a) the author has evidenced anIce Age glaciation in the Dhaulagiri- and Annapurna-Himalaya (Figure 1, No. 2) that was clearly moreimportant than it had been suggested for the Himalayabefore (cf. v. Wissmann, 1959). As an area of reference
Figure 5. (Diagram of the grain sizes 03.12.1994/1). At 5240 m a.s.l.,on the orographic left flank of the Barun valley, lateral moraine matrix(Photo 9 foreground in the middle; 10 IV) taken 500 m above thecurrent valley bottom near the Shershon alpine pasture from a depth of0.3 m. This lateral, i.e. medial moraine surface has been sedimentatedduring Stage IV (Table 1). The primary maximum is relatively coarse-grained, i.e. it lies with 34% in the fine sand; the secondary maximumwith ca. 6% fine silt determines the bimodal course of the cumulativecurve typical of moraine matrix; sorting coefficient calculatedaccording to Engelhardt (1973, p. 133) So = 2.63 (So =
ffiffiffiffiffiffiffiffiffiffiffiffiffiffiffiQ3=Q1
p).
Here, the grain sizes of the first quartile Q1 of the grain size distri-bution curve are compared with those of the third quartile Q3 in orderto differentiate the fluvial and morainic accumulations. Locality: Fig-ure 3: 3.12.94/1 (27�49¢30¢¢ N/87�05¢15¢¢ E); see also Figure 6, SampleNo. 7. Sampling: M. Kuhle.
M. Kuhle204
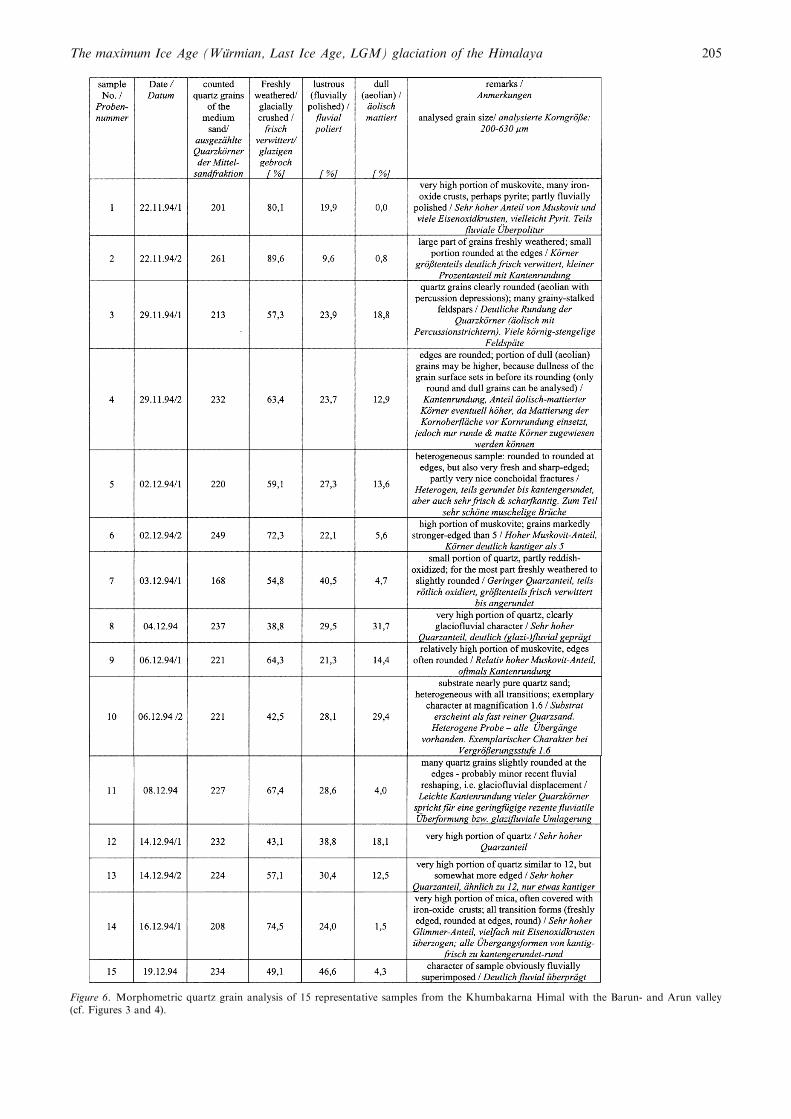
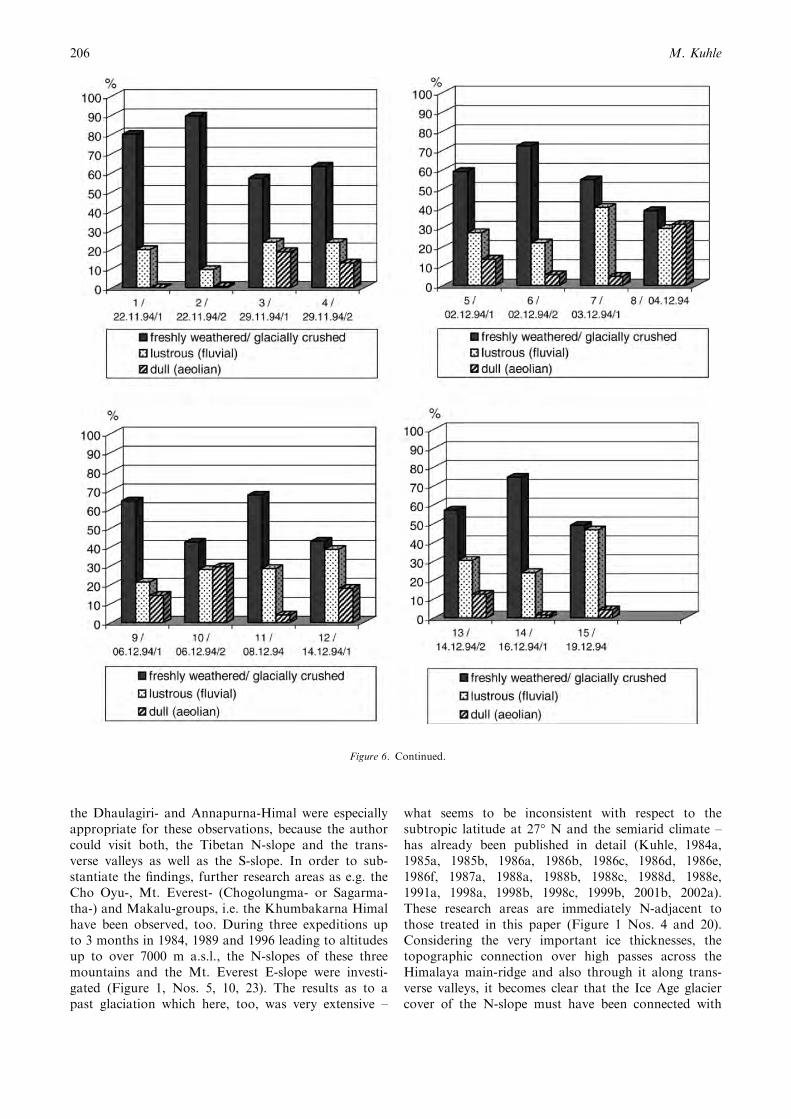
Figure 6. Morphometric quartz grain analysis of 15 representative samples from the Khumbakarna Himal with the Barun- and Arun valley(cf. Figures 3 and 4).
The maximum Ice Age (Wurmian, Last Ice Age, LGM) glaciation of the Himalaya 205
the Dhaulagiri- and Annapurna-Himal were especiallyappropriate for these observations, because the authorcould visit both, the Tibetan N-slope and the trans-verse valleys as well as the S-slope. In order to sub-stantiate the findings, further research areas as e.g. theCho Oyu-, Mt. Everest- (Chogolungma- or Sagarma-tha-) and Makalu-groups, i.e. the Khumbakarna Himalhave been observed, too. During three expeditions upto 3 months in 1984, 1989 and 1996 leading to altitudesup to over 7000 m a.s.l., the N-slopes of these threemountains and the Mt. Everest E-slope were investi-gated (Figure 1, Nos. 5, 10, 23). The results as to apast glaciation which here, too, was very extensive –
what seems to be inconsistent with respect to thesubtropic latitude at 27� N and the semiarid climate –has already been published in detail (Kuhle, 1984a,1985a, 1985b, 1986a, 1986b, 1986c, 1986d, 1986e,1986f, 1987a, 1988a, 1988b, 1988c, 1988d, 1988e,1991a, 1998a, 1998b, 1998c, 1999b, 2001b, 2002a).These research areas are immediately N-adjacent tothose treated in this paper (Figure 1 Nos. 4 and 20).Considering the very important ice thicknesses, thetopographic connection over high passes across theHimalaya main-ridge and also through it along trans-verse valleys, it becomes clear that the Ice Age glaciercover of the N-slope must have been connected with
Figure 6. Continued.
M. Kuhle206
that of the S-slope and that the heights of the glaciertrim-lines were communicating. Accordingly, the IceAge valley glaciers reconstructed here, formed theoutlet glaciers of the ice cover north of the Himalayamain-ridge and in S-Tibet (cf. Kuhle, 1988b, 1998b,1998c, 1999b, 2001b, 2002a). In the research area underdiscussion, situated S of the main-ridge, the outletglaciers from Tibet as well as the valley glaciers flowingdown from the S-flanks of the Himalaya mountains,have developed the lowest Ice Age glacier margins andtongue ends in High- i.e. South-Asia. They reacheddown to less than 1000 m a.s.l. and, correspondingly,into a climate which was completely different and eventhen relatively warm-humid. The lowest glacierterminals of the Nanda Devi- and Kamet-group, of theDhaulagiri-, Annapurna- and Manaslu-group, ofthe Langtang- and Rolwaling-group but also of theKangchendzonga Himalaya flowed down just as low(cf. Kuhle, 1980–2001c; Konig, 1999).
How far the outlet glacier has flowed down the Arunvalley from S-Tibet and how substantial the glacierinflow from the Barun- and Iswa Khola (Chamlangvalley) (Makalu S-side; Figure 1, No. 20) might havebeen, is treated in the first section based on data of a1-month expedition in 1994. For the reconstruction ofthe maximum Ice Age glacier filling and cover of thismountain area the determination of the then ice thick-nesses and trim-lines in these valleys is absolutely nec-essary. On the data base of two research expeditions in
1982 and 2003 over a period of all together 4.5 monthsthese questions will be treated with regard to theKhumbu area, the upper catchment area of the DudhKoshi Nadi (Cho Oyu- and Everest-S-slope; Figure 1,No. 4).
2. The highest former trim-lines and glacier thicknesses
in the Makalu- and Chamlang-Himalaya- (Khumbakarna
Himal-) S-slopes and the lowest glacier terminus
in the Arun valley
2.1. The Ice Age Barun glacier
The two source branches of the Barun valley belong tothe catchment area of the present and past Barunglacier: the northern Barun glacier valley leading downfrom Cho Polu (6734 m, Photo 1 and Figure 3, No. 29)and Shar Tse (or Peak 38; 7502 m; Photo 1 and Figure 3,No. 10) and the southern lower Barun glacier valleycoming down from the Baruntse SE-satellite (6730 m;Figure 3, No. 30) and the 6830 m peak (Photo 11 andFigure 3, No. 44) (Figure 9). Both the valleys join in thevalley chamber of the Shershon alpine pasture at4700 m a.s.l. (Photo 9 next toh). The current E-exposedlower Barun glacier reaches somewhat farther down, i.e.to 4600 m a.s.l. (aneroid measurement 4400 m a.s.l.),that is up to the Mera (Sedua) alpine pasture (Photo 12).It is the lowest present-day ice stream in the Barunvalley.
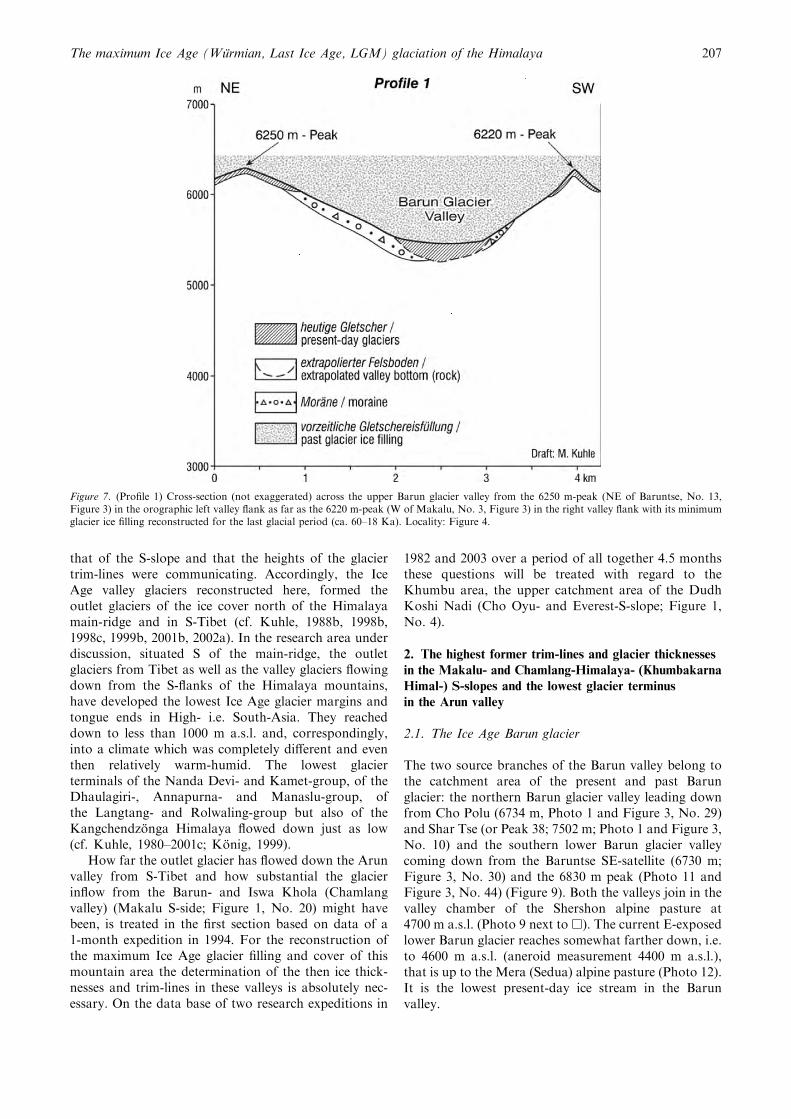
Figure 7. (Profile 1) Cross-section (not exaggerated) across the upper Barun glacier valley from the 6250 m-peak (NE of Baruntse, No. 13,Figure 3) in the orographic left valley flank as far as the 6220 m-peak (W of Makalu, No. 3, Figure 3) in the right valley flank with its minimumglacier ice filling reconstructed for the last glacial period (ca. 60–18 Ka). Locality: Figure 4.
The maximum Ice Age (Wurmian, Last Ice Age, LGM) glaciation of the Himalaya 207
On the orographic left flank of the northern Barunvalley the highest past ground moraine remnants reachan altitude of 5800 m a.s.l. (Photo 1, two n; Figure 3 onthe left of No. 3). They have been remoulded by thehistoric to current S- to SW-exposed hanging glaciersand their meltwaters, but have primarily been depositedby the Ice Age Barun main glacier. Glacigenic flankabrasions in a longitudinal direction of the valley haveeven been evidenced up to ca. 6200 m a.s.l. in this oro-graphic left-hand flank (Photo 1 the two ˙ on the right);5 the right ˙; 6˙; 7˙ on the left; 8˙ below Nos. 1–3;9 second to fourth ˙ from the right). Their upper polishlines mark the High Glacial trim-line (Photo 1: 0 – – –;5 – – – white; 6 – – – white on the left; 8 … white; 9 – – –on the left and right below No. 3).
The abrasions are modified by gullies of avalanchesand rock falls (Photo 1�; Figure 3 half-left below No.3), the development of which is forced by the present-day hanging glaciation above and the increasing frostweathering due to infiltrating glacier meltwater. Thesehave led to crumblings of the polishing and abrasionfaces. But the three modern, altogether 5.5 km-widehanging glaciers on the 3500 m-high Makalu S-flank(Photos 6 and 7 below No. 3) have also undercut the
Barun valley flanks rounded by the Ice Age valleyglacier. They have dispersed them into rock pillars andglacigenic triangle-shaped faces (Figure 3 below and upto the left below No. 3) (Photo 5, on the right and leftbelow No. 3; 8 the three ˙ from the right), so that theyhave reshaped the Ice Age flank polishing at a rightangle. A corresponding occurrence of post- i.e. inter-glacial glacigenic reshaping of the High Glacial work ofthe parent glacier through altogether nine right tributaryglaciers can be observed on the orographic right side ofthe Barun valley flank (Photo 3 e.g. tributary glacierh above and on the right below No. 39). In addition,glacigenically rounded triangle-shaped slopes lying inbetween (Figure 3 on the right of No. 29, half-rightabove Nos. 13, 30, 41 and 39) are evidence of the IceAge flank abrasion (Photo 1, the three ˙ from the left;Photo 2, below the trim-line ... on the left and ˙; Photo3˙; Photo 4˙; Photo 5, the two ˙ from the left). Nat-urally, on these polished mountain spurs or triangle-shaped slopes it has only been formed or preserved up tothe uppermost sharpening, that means up to an altitudeof ca. 6220 m (Photo 2 trim-line ... on the left). There arealso triangle-shaped slopes bearing the characteristics ofroches moutonnees (Photo 2˙). Here, the polyglacial-
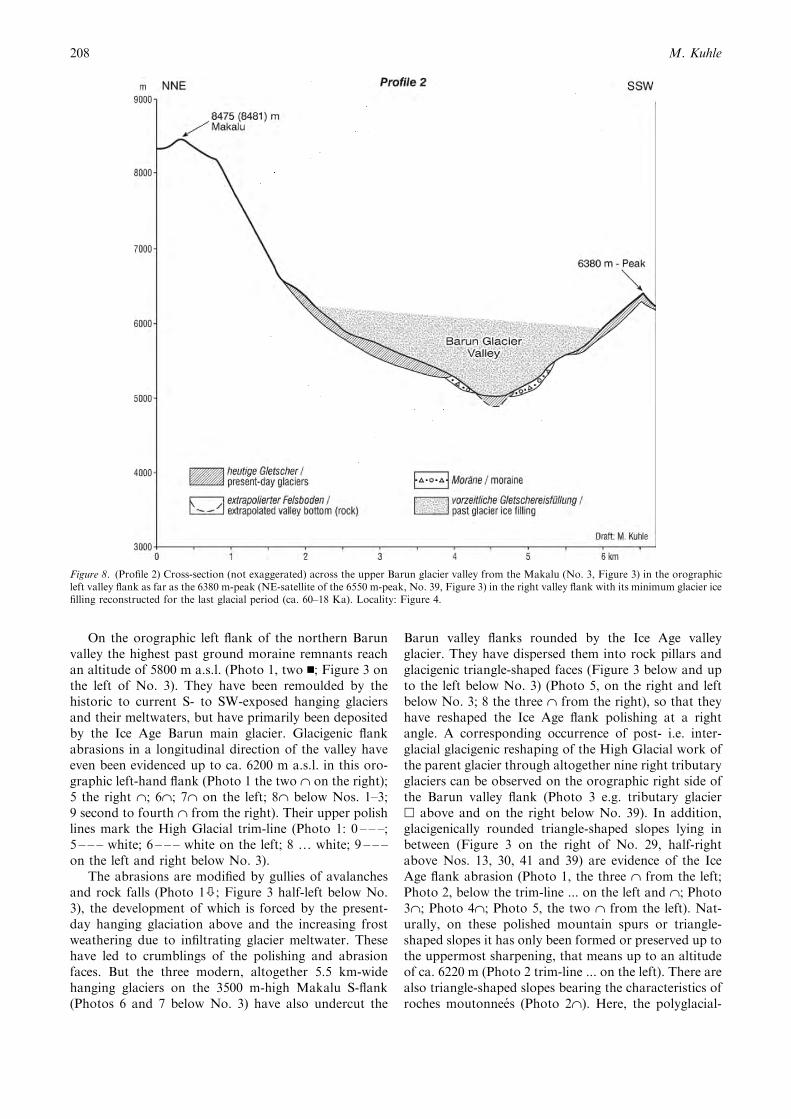
Figure 8. (Profile 2) Cross-section (not exaggerated) across the upper Barun glacier valley from the Makalu (No. 3, Figure 3) in the orographicleft valley flank as far as the 6380 m-peak (NE-satellite of the 6550 m-peak, No. 39, Figure 3) in the right valley flank with its minimum glacier icefilling reconstructed for the last glacial period (ca. 60–18 Ka). Locality: Figure 4.
M. Kuhle208
classic forms of valley flanks are concerned (Davis,1912: 417 – Figure 149 between G and C; 453 – Figure175 between P, M and G; 454 – Figure 176 from T andB to C; 459 – Figures 178 and 179; Kuhle, 1991b)typical of high mountains heavily glaciated at glacialtimes and still glaciated interglacially. On theseorographic right triangle-shaped slopes flank polishingsand High Glacial abrasion surfaces are preserved only ata small-scale (Photo 4 ˙). Mostly they have been late- to
postglacially reshaped by crumblings, local erosion ofmeltwater and denudation by rock fall (,; Photo 2below of *** on the left). In many places surfaces ofblock debris typical of postglacial frost weathering(Photo 3 above ˙; 5 above ˙ on the very right) knownfrom the mountainous Scandinavian past inland iceareas, have been developed. The slope-faces, whichbecome broader and flatter toward the slope foot, arecovered with ground moraines the thickness of which
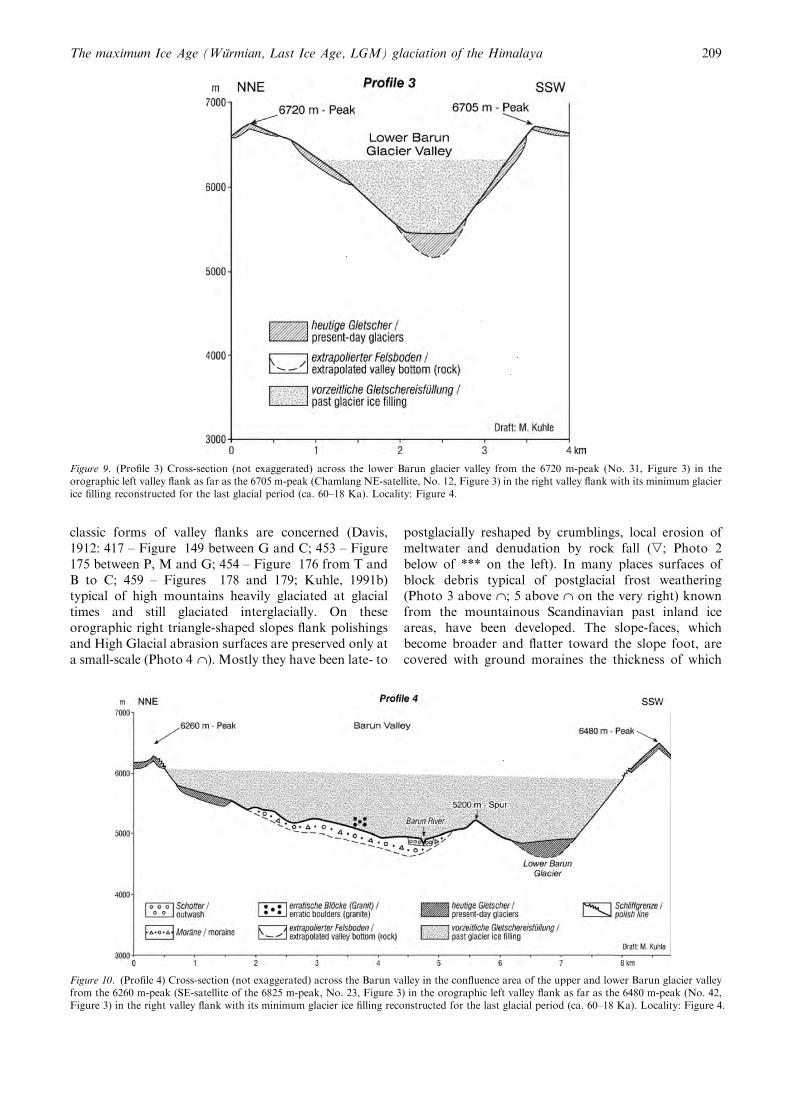
Figure 9. (Profile 3) Cross-section (not exaggerated) across the lower Barun glacier valley from the 6720 m-peak (No. 31, Figure 3) in theorographic left valley flank as far as the 6705 m-peak (Chamlang NE-satellite, No. 12, Figure 3) in the right valley flank with its minimum glacierice filling reconstructed for the last glacial period (ca. 60–18 Ka). Locality: Figure 4.
Figure 10. (Profile 4) Cross-section (not exaggerated) across the Barun valley in the confluence area of the upper and lower Barun glacier valleyfrom the 6260 m-peak (SE-satellite of the 6825 m-peak, No. 23, Figure 3) in the orographic left valley flank as far as the 6480 m-peak (No. 42,Figure 3) in the right valley flank with its minimum glacier ice filling reconstructed for the last glacial period (ca. 60–18 Ka). Locality: Figure 4.
The maximum Ice Age (Wurmian, Last Ice Age, LGM) glaciation of the Himalaya 209
M. Kuhle210
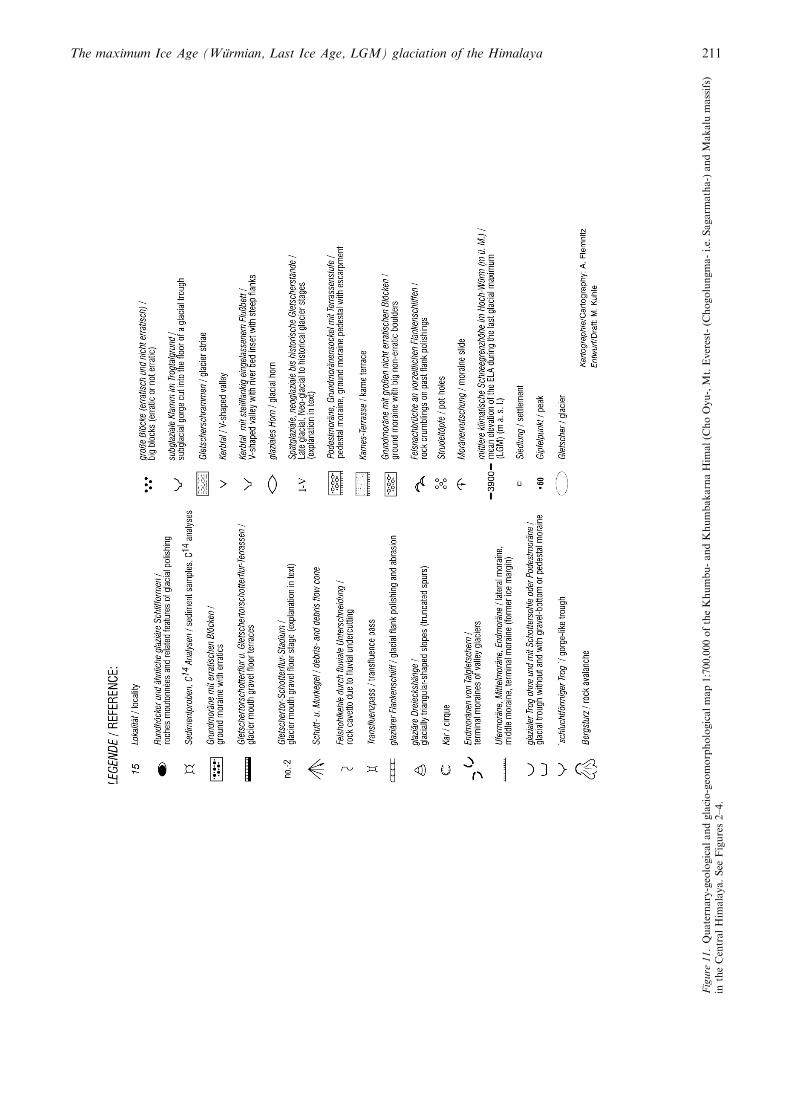
Figure
11.Quaternary-geologicalandglacio-geomorphologicalmap1:700,000oftheKhumbu-andKhumbakarnaHim
al(C
hoOyu-,Mt.Everest-(C
hogolungma-i.e.Sagarm
atha-)andMakalu
massifs)
intheCentralHim
alaya.See
Figures2–4.
The maximum Ice Age (Wurmian, Last Ice Age, LGM) glaciation of the Himalaya 211
increases in a downward direction (Photo 2 n small onthe left; Photo 3 n small; Photo 4 n; Figure 7). Since themelting down of the Barun parent glacier, rills of melt-water erosion, fluvial redepositions (Photo 4 below andon the right of n white) and angular rock boulders (s)deriving from wall-crumblings (,), which took placeafter the deglaciation of the upper slopes, are to beobserved besides moraine boulders. Neoglacial andhistorical up to contemporary (Stage V–XII, see Table1) lateral moraine ledges have been attached to thesecovers of ground moraine by the Barun glacier(Figure 3; Photos 1–6). The orographic right lateralmoraine of the Stages VII–X partly forms a clear-cutcrest. The fine material matrix ( £2000 lm) of the
moraine preserved in situ at 5150 m a.s.l. (sample6.12.94/2, locality see Figure 3; right margin of Photo 5,foreground) shows a primary grain size maximum in thefine sand and a secondary one in the clay. 57.5% of themorphoscopically analysed quartz grains of the samplehave already been reshaped fluvially and eolianly(Figure 6 No. 10). A comparative sample, taken fromthe surface moraine of the current Barun glacier at5200 m a.s.l. (sample 6.12.94/1, locality see Figure 3;Photo 3 foreground) shows – at the same petrographiccatchment area – a much higher proportion of musco-vite grains, which have not yet been washed out, and notquite 36% quartz grains reworked fluvially and eolianly(Figure 6, No. 9). At a corresponding geological catch-
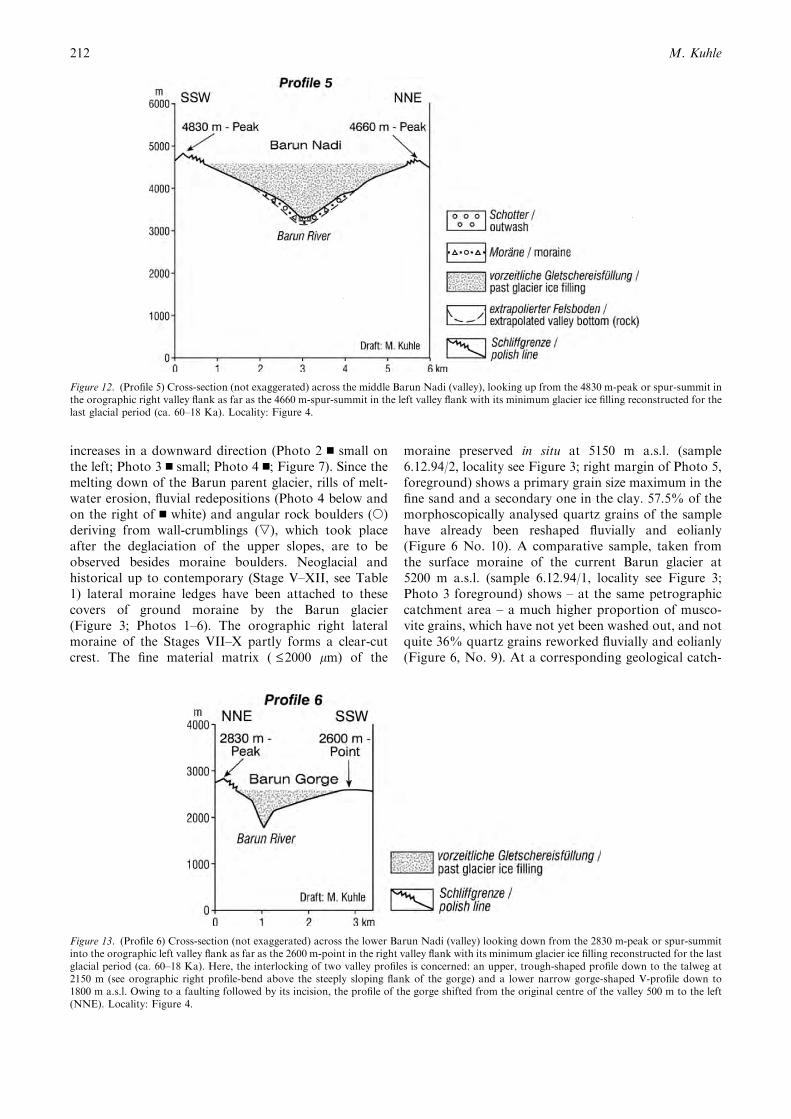
Figure 12. (Profile 5) Cross-section (not exaggerated) across the middle Barun Nadi (valley), looking up from the 4830 m-peak or spur-summit inthe orographic right valley flank as far as the 4660 m-spur-summit in the left valley flank with its minimum glacier ice filling reconstructed for thelast glacial period (ca. 60–18 Ka). Locality: Figure 4.
Figure 13. (Profile 6) Cross-section (not exaggerated) across the lower Barun Nadi (valley) looking down from the 2830 m-peak or spur-summitinto the orographic left valley flank as far as the 2600 m-point in the right valley flank with its minimum glacier ice filling reconstructed for the lastglacial period (ca. 60–18 Ka). Here, the interlocking of two valley profiles is concerned: an upper, trough-shaped profile down to the talweg at2150 m (see orographic right profile-bend above the steeply sloping flank of the gorge) and a lower narrow gorge-shaped V-profile down to1800 m a.s.l. Owing to a faulting followed by its incision, the profile of the gorge shifted from the original centre of the valley 500 m to the left(NNE). Locality: Figure 4.
M. Kuhle212
ment area these samples provide an appropriate base ofcomparison for the down-valley past Late- to Last HighGlacial moraines from which samples have been taken.Kalvoda (1992) describes and documents bedrocks ofthe upper catchment area in the upper Barun Nadi,which turn up again in the samples taken from thesemoraines. So, for instance, he introduces the Mioceneleucocratic granite intrusions in the lower high intensityinjection zone of the Makalu Formation above
6250 m a.s.l. in the south-western face of the Makaluas being biotite-muscovite granite and originallyPrecambrian paragneisses (ibid.: 96–97, Plate IX/1/2–XI), from which the light granite boulders and dark-banded gneiss boulders, as well as the light and darkmica grains and the morphoscopically analysed quartzgrains, originate.
Here, also the glacial-historical reconstructions haveto be stated, which Kalvoda (1979a, b) was the first to
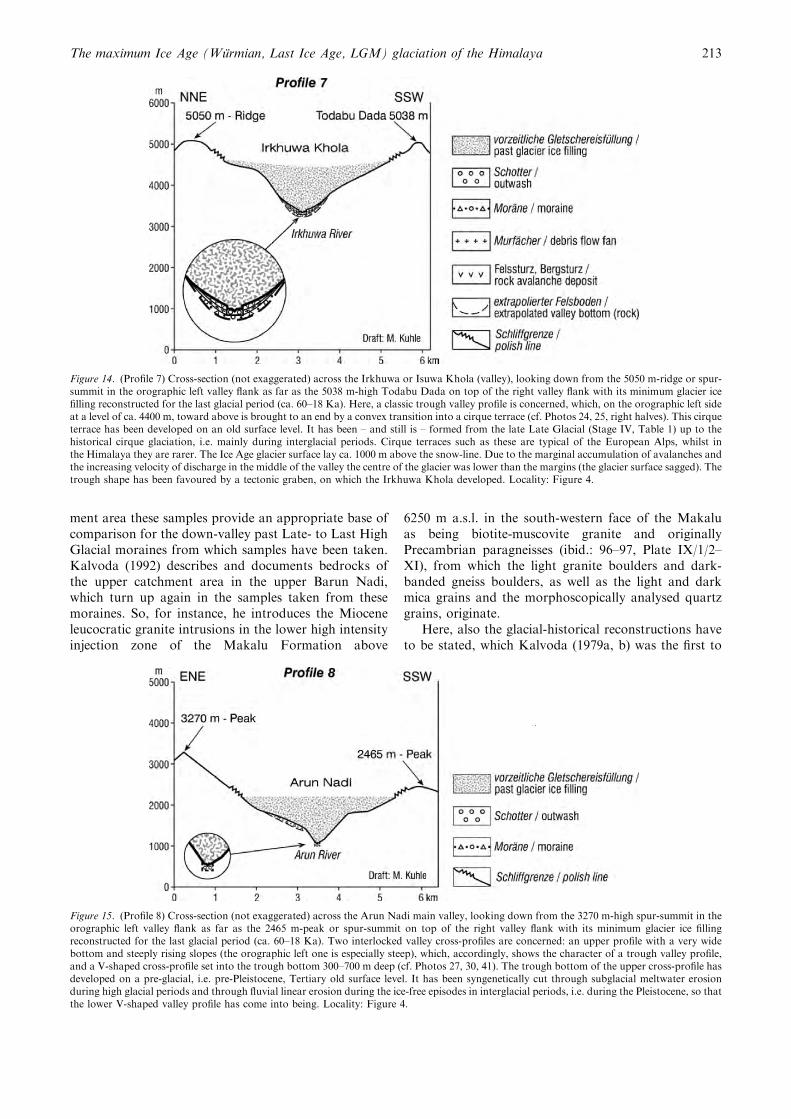
Figure 14. (Profile 7) Cross-section (not exaggerated) across the Irkhuwa or Isuwa Khola (valley), looking down from the 5050 m-ridge or spur-summit in the orographic left valley flank as far as the 5038 m-high Todabu Dada on top of the right valley flank with its minimum glacier icefilling reconstructed for the last glacial period (ca. 60–18 Ka). Here, a classic trough valley profile is concerned, which, on the orographic left sideat a level of ca. 4400 m, toward above is brought to an end by a convex transition into a cirque terrace (cf. Photos 24, 25, right halves). This cirqueterrace has been developed on an old surface level. It has been – and still is – formed from the late Late Glacial (Stage IV, Table 1) up to thehistorical cirque glaciation, i.e. mainly during interglacial periods. Cirque terraces such as these are typical of the European Alps, whilst inthe Himalaya they are rarer. The Ice Age glacier surface lay ca. 1000 m above the snow-line. Due to the marginal accumulation of avalanches andthe increasing velocity of discharge in the middle of the valley the centre of the glacier was lower than the margins (the glacier surface sagged). Thetrough shape has been favoured by a tectonic graben, on which the Irkhuwa Khola developed. Locality: Figure 4.
Figure 15. (Profile 8) Cross-section (not exaggerated) across the Arun Nadi main valley, looking down from the 3270 m-high spur-summit in theorographic left valley flank as far as the 2465 m-peak or spur-summit on top of the right valley flank with its minimum glacier ice fillingreconstructed for the last glacial period (ca. 60–18 Ka). Two interlocked valley cross-profiles are concerned: an upper profile with a very widebottom and steeply rising slopes (the orographic left one is especially steep), which, accordingly, shows the character of a trough valley profile,and a V-shaped cross-profile set into the trough bottom 300–700 m deep (cf. Photos 27, 30, 41). The trough bottom of the upper cross-profile hasdeveloped on a pre-glacial, i.e. pre-Pleistocene, Tertiary old surface level. It has been syngenetically cut through subglacial meltwater erosionduring high glacial periods and through fluvial linear erosion during the ice-free episodes in interglacial periods, i.e. during the Pleistocene, so thatthe lower V-shaped valley profile has come into being. Locality: Figure 4.
The maximum Ice Age (Wurmian, Last Ice Age, LGM) glaciation of the Himalaya 213
carry out in the upper Barun Nadi on both sides of theBarun glacier and in its forefield. However, Kalvoda’sresults, which do not concern the maximum past glaci-ation, cannot be discussed here with the appropriateaccuracy, because my study is focused on the maximumHigh Glacial glaciation. In this respect a future paper isplanned, which will be especially concentrated on theHolocene and historic glacier stages in the CentralHimalaya and the Arun Nadi. The author has foundmany local confirmations of Kalvoda’s investigations(ibid.) and comparable approaches to moraines. How-ever, besides the observation of the maximum past icefilling of the valley, which Kalvoda did not consider, theauthor’s renewed walking of the upper Arun Nadi hasbrought about a major difference as to the estimated ageof the moraines. So, the author dates the striking,100–120 m-high lateral moraine ledge on the orographicleft side of the Barun glacier (Photo 1: VIII) as belongingto the historical Glacier Stage VIII (cf. Table 1) and thusas being only ca. 300–400 years old. Kalvoda (1992:80–81, Plate VI/1) however, classifies it as belonging tothe Holocene. This difference in dating, from whichconclusions can also be drawn with regard to the age ofthe older, i.e. younger generations of moraine ledgesabove and below, has led to the author’s compressed agemodel in contrast to Kalvoda’s extended one.
2.1.1. Insertion concerning the reconstruction of the LateGlacial, neoglacial and historical morainic- and glaciallandscape in the upper Barun NadiDue to its classification according to the common rela-tive age scheme of Himalaya glaciers (Kuhle, 1982), theattached moraine of Stage X is considered as belongingto the glacier advance of the Little Ice Age from ca.1820–1900 (cf. Table 1). By its corresponding level on across-profile of the Barun valley it can be diagnosed inmany places on both valley sides (Photos 1–3, 5, 6: X).
Its geomorphologically fresh character confirms this agedating. The tongue basin of the Barun glacier pertinentto Stage X, is filled with a lake, interrupted by the frontmoraine of Stage IX (advance in 1920; see Table 1)(Photo 7).
According to their geomorphological state of pres-ervation, the lateral moraine ledges attached to the valleyflanks along the upper Barun Nadi can generally beclassified as belonging to three groups, which clearlydiffer: (1) the historical moraines of Stages XI–VII(Photos 1–3 and 5–12); (2) the neoglacial moraines ofStages ¢VII–V (Photos 1–3, 6–10, 13, 14) and (3) the LateGlacial moraines, here only represented by the morainesof Stage IV [Photos 7–10 and 15 of Stages IV–I (Table 1;Figure 3)]. The lateral moraines of Stages III–I and thoseof the High Glacial maximum glaciation during the lastglacial period (Stage 0=Wurm=last High Glacialmaximum; Table 1) have no longer been developed inthis valley section. The causative factor is that the glaciersurface lay far above the corresponding snow-line andonly ground moraines have been deposited, but no lat-eral moraines. Only 20 km down-valley ground mor-aines of Stage III can be distinguished (Photo 19;Figure 11 above No. 46). The nearly complete sequenceof lateral moraine remnants up to their lower end andbending into a terminal- or front moraine is preservedbetween the end of the current Barun- and Lower Barunglacier from the historical Stage X up to the neoglacialStage V as far down as ca. 4000 m (Photos 8–10; 12–14;Figures 3 and 11). Further down-valley no terminalmoraines are to be diagnosed. The natural cause of this isthe younger glaciofluvial and fluvial erosion by the Ba-run river in the narrow receptacle of the Barun Nadi.
The glaciofluvial modification of even the youngestterminal moraines, which geomorphologically are stillunambiguously preserved, is proved by sample 4.12.94,taken from the terminal moraine of Stage X (Photo 7, X;
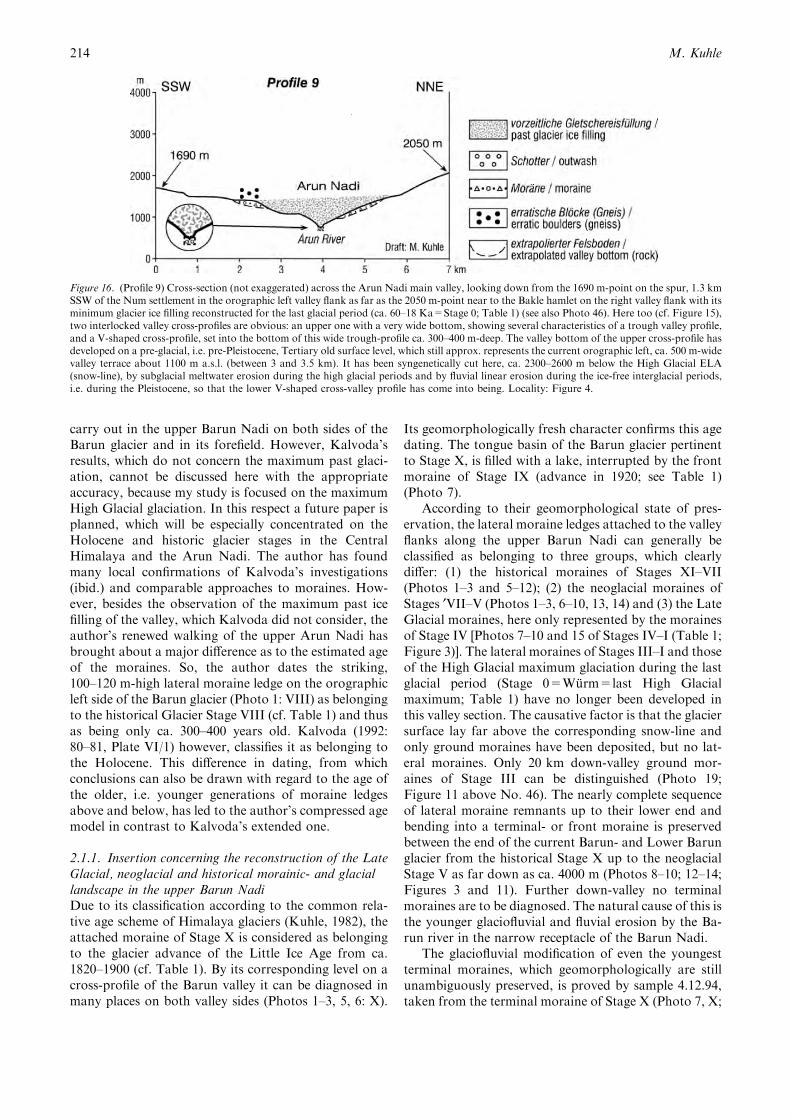
Figure 16. (Profile 9) Cross-section (not exaggerated) across the Arun Nadi main valley, looking down from the 1690 m-point on the spur, 1.3 kmSSW of the Num settlement in the orographic left valley flank as far as the 2050 m-point near to the Bakle hamlet on the right valley flank with itsminimum glacier ice filling reconstructed for the last glacial period (ca. 60–18 Ka=Stage 0; Table 1) (see also Photo 46). Here too (cf. Figure 15),two interlocked valley cross-profiles are obvious: an upper one with a very wide bottom, showing several characteristics of a trough valley profile,and a V-shaped cross-profile, set into the bottom of this wide trough-profile ca. 300–400 m-deep. The valley bottom of the upper cross-profile hasdeveloped on a pre-glacial, i.e. pre-Pleistocene, Tertiary old surface level, which still approx. represents the current orographic left, ca. 500 m-widevalley terrace about 1100 m a.s.l. (between 3 and 3.5 km). It has been syngenetically cut here, ca. 2300–2600 m below the High Glacial ELA(snow-line), by subglacial meltwater erosion during the high glacial periods and by fluvial linear erosion during the ice-free interglacial periods,i.e. during the Pleistocene, so that the lower V-shaped cross-valley profile has come into being. Locality: Figure 4.
M. Kuhle214
locality: Figure 3). During the 200 years between ca.1800 and 2000, which at most have been available, theseepage of glacier meltwater was able fluvially to polishnot quite 30% of the quartz grains (Figure 6, No. 8).Somewhat more than 30% even grew dull through theconstantly blowing glacier wind.
Much more unambiguously glacigenic, however, isthe matrix of the ground moraine terrace of the13,000 years older Stage IV (sample 3.12.94/1; locality:Figure 3; Photo 9). This is shown by more than 50%glacially crushed quartz grains (Figure 6, No. 7). Buthere, too, a fluvial modification becomes obvious: (1)(morphoscopically) by not quite 30% polished quartz
grains and (2) (granulometrically) by the small clayportion of only 3% (Figure 5). The bimodal course ofthe curve characteristic of moraines is still preserved, butthe insignificant sorting coefficient (So) of 2.63 likewiseshows the secondary fluvial modification. However, thesubstantial thickness of this accumulation, in the matrixof which erratic boulders are embedded, as well as itsgreat height of 500 m above the valley bottom of theBarun Nadi (Figure 10 Pro 4; Photos 8–10, IV),unequivocally evidences its morainic character.
During historical times up to the present day theglacier tongue of the 6825 m-peak S-glacier (Photo 9below No. 23) has been adjusted to the moraine terrace
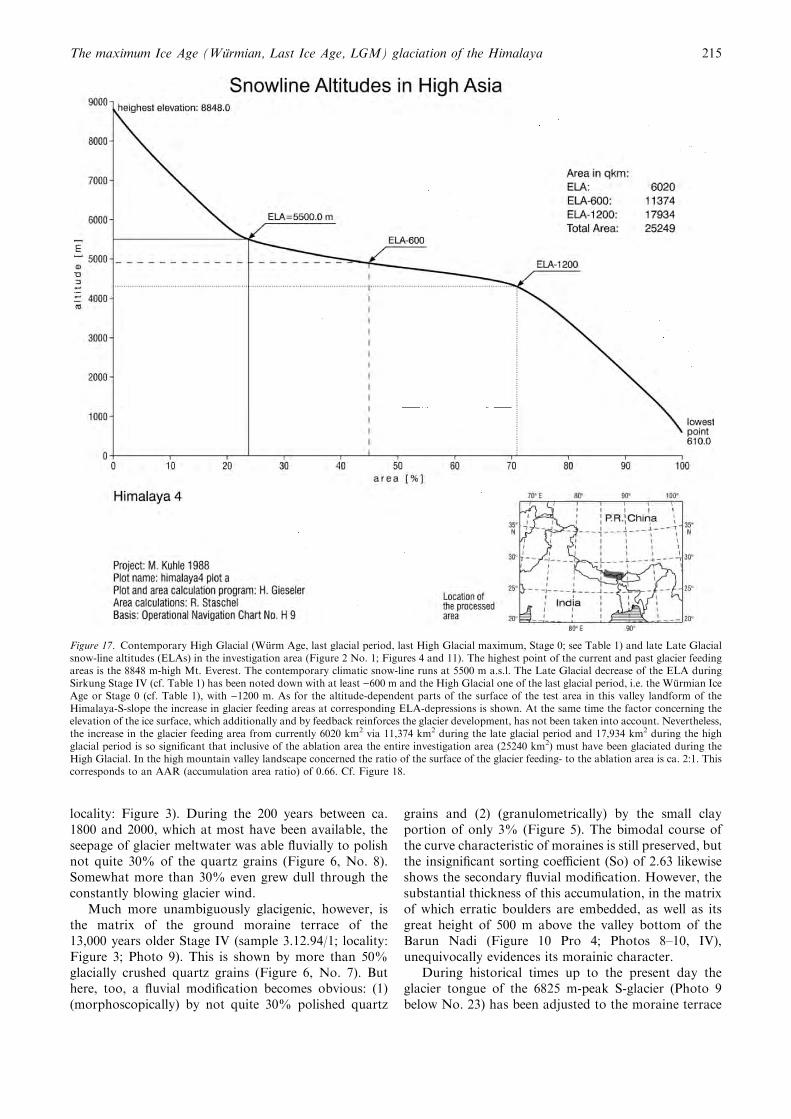
Figure 17. Contemporary High Glacial (Wurm Age, last glacial period, last High Glacial maximum, Stage 0; see Table 1) and late Late Glacialsnow-line altitudes (ELAs) in the investigation area (Figure 2 No. 1; Figures 4 and 11). The highest point of the current and past glacier feedingareas is the 8848 m-high Mt. Everest. The contemporary climatic snow-line runs at 5500 m a.s.l. The Late Glacial decrease of the ELA duringSirkung Stage IV (cf. Table 1) has been noted down with at least )600 m and the High Glacial one of the last glacial period, i.e. the Wurmian IceAge or Stage 0 (cf. Table 1), with )1200 m. As for the altitude-dependent parts of the surface of the test area in this valley landform of theHimalaya-S-slope the increase in glacier feeding areas at corresponding ELA-depressions is shown. At the same time the factor concerning theelevation of the ice surface, which additionally and by feedback reinforces the glacier development, has not been taken into account. Nevertheless,the increase in the glacier feeding area from currently 6020 km2 via 11,374 km2 during the late glacial period and 17,934 km2 during the highglacial period is so significant that inclusive of the ablation area the entire investigation area (25240 km2) must have been glaciated during theHigh Glacial. In the high mountain valley landscape concerned the ratio of the surface of the glacier feeding- to the ablation area is ca. 2:1. Thiscorresponds to an AAR (accumulation area ratio) of 0.66. Cf. Figure 18.
The maximum Ice Age (Wurmian, Last Ice Age, LGM) glaciation of the Himalaya 215
of the Late Glacial Stage IV (Photo 9 VII, IX, X on thevery right; Figure 10) and, accordingly, has contributedto its development into a pedestal moraine by itssignificantly greater extension during this stage. Thislarge Late Glacial pedestal moraine terrace in the middleof the upper Barun Nadi (Figure 3 near viewpoints 8and 9) has also been built-up at the same time by theBarun glacier tongue, because the glacier tongues, todayseparated, have coalesced. This is inevitably deduciblefrom the corresponding ELA-depression of ca. 700 m.Thus, during that time the Barun Glacier tongue flowed400–500 m higher. Accumulations of pedestal morainesbelow the ice such as this are typical of Late GlacialHimalaya glaciers (Kuhle, 1983a: 125–128). The reasonfor this is that the submoraine masses under the ice,accumulated during the high glacial period with anincreasing snow-line, are no longer transported away.The position of the Late Glacial ice becomes higher,because the submoraine becomes thicker. During the
High Glacial (Stage 0; Table 1) the at least 200–300 m-thick masses of the pedestal moraine, which during theLate Glacial increased and in the meantime thawed andbecame devoid of ice, have been occupied by the ice ofthe Barun glacier and the 6825 m-peak S-glacier. Thepedestal moraine cannot have existed in the HighGlacial, because the intensity of the ground scouring ofthe much thicker glacier, dependent on the high pres-sure, has prevented its accumulation. At that time thevalley chamber discussed here, lay under a ca. 1400 m-thick ice (Figure 10), so that it was a marked area ofglacial erosion. During the further, still more intensiveglacier shrinkage, the tongue of the Barun main valleyglacier, which had become very narrow after the LateGlacial, has cut up to 300–500 m deep below the surfacelevel of the pedestal moraine terrace (Photo 10, IVbelow No. 23; Photo 8 cf. IV with V and VIII; Figure 3cf. on the left of viewpoint 8 IV with VIII). This erosivedeepening during the Holocene glacier shrinkage was
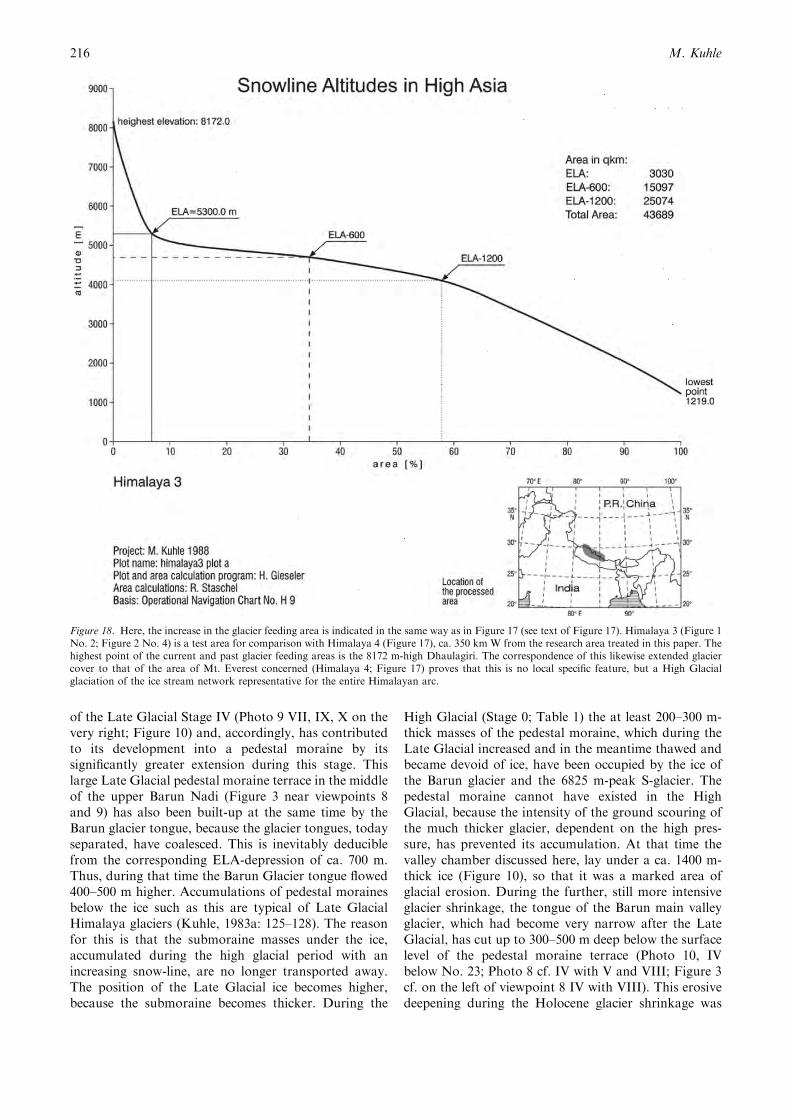
Figure 18. Here, the increase in the glacier feeding area is indicated in the same way as in Figure 17 (see text of Figure 17). Himalaya 3 (Figure 1No. 2; Figure 2 No. 4) is a test area for comparison with Himalaya 4 (Figure 17), ca. 350 km W from the research area treated in this paper. Thehighest point of the current and past glacier feeding areas is the 8172 m-high Dhaulagiri. The correspondence of this likewise extended glaciercover to that of the area of Mt. Everest concerned (Himalaya 4; Figure 17) proves that this is no local specific feature, but a High Glacialglaciation of the ice stream network representative for the entire Himalayan arc.
M. Kuhle216
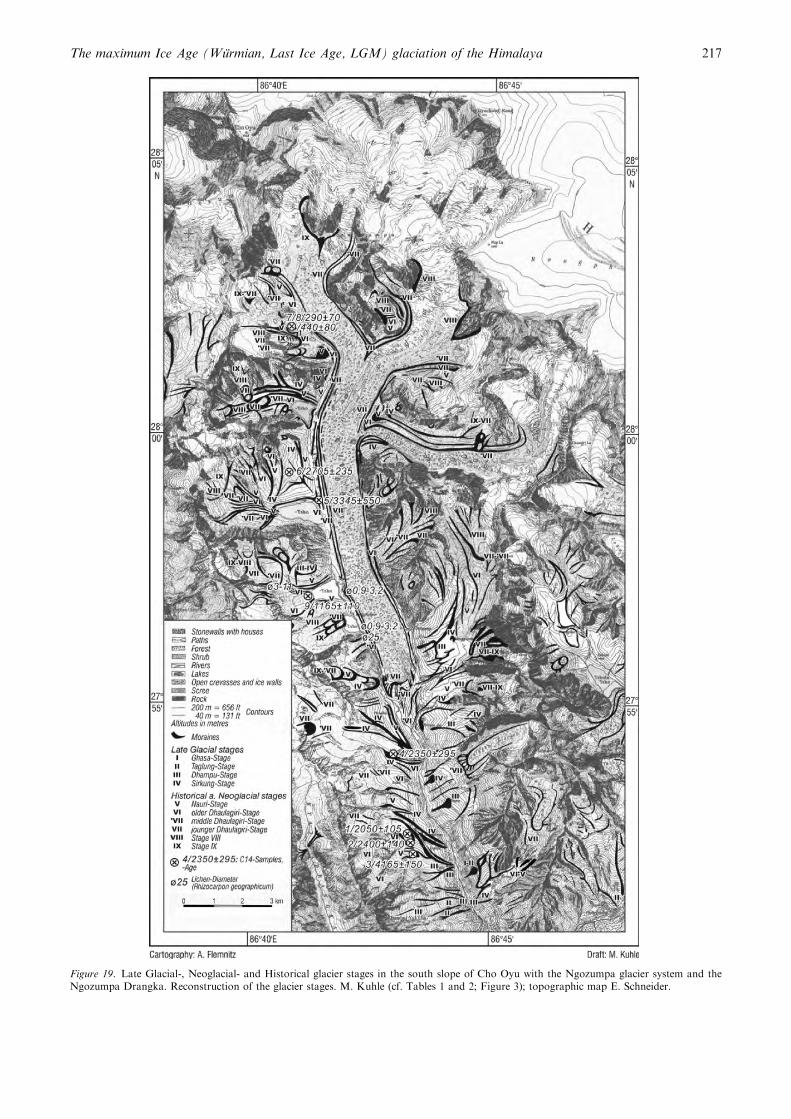
Figure 19. Late Glacial-, Neoglacial- and Historical glacier stages in the south slope of Cho Oyu with the Ngozumpa glacier system and theNgozumpa Drangka. Reconstruction of the glacier stages. M. Kuhle (cf. Tables 1 and 2; Figure 3); topographic map E. Schneider.
The maximum Ice Age (Wurmian, Last Ice Age, LGM) glaciation of the Himalaya 217
due to a progressive subglacial meltwater erosion, owingto the concentration of meltwater in only one subglacialtalweg, linked with the shrinkage of ice.
The geomorphological chronology of the neoglacial(Stages V–¢VII) and historical (Stages VII–XI) end- andlateral-moraine sequence is obligatory. The completesequence is shown in Figure 3 and Photos 1–11. Forcomparison with the older moraines, four representativesamples of historical moraines have been chosen. Theydescribe the fine material matrix of Stages VII and X inlateral- and end-moraines (localities: Figures 3:29.11.94/1/2 and 2.12.94/1/2). The morphoscopic quartzgrain analyses show 57–71% of glacially crushed grainsand less than 25% of fluvially polished (lustrous) grains.At most 18% of the quartz grains contained are eolianlytreated (dull).
2.1.2. Geomorphological indicators as to late Late Gla-cial snow-line altitudes, i.e. snow-line depressions, and thechronology of the deglaciation of the Barun Nadi as wellas the current lower limit of permafrostA cirque with a flat, moraine-filled bottom and a steepback slope is situated in a W-exposition in the root
region (proximal region) of the podest moraine of theLate Glacial Stage IV referred to above (Photo 7 d;Figure 3 above viewpoint 8). A block glacier, which isstill active today, i.e. an unambiguous indicator of per-mafrost, flows together with the material of the pastmoraine of the cirque glacier down to 4900 m a.s.l.(Photo 7,; Figure 3 on the left above viewpoint 8).Accordingly, the permafrost limit lies below ca.5000 m a.s.l. (cf. Kuhle 1978a; 1985c). At the level of thecirque floor about 5400 m, that is to say at ca. half theheight of the corresponding past cirque glacier, thesnow-line of this cirque glacier was situated. This glacierand the cirque can only have been developed after theLate Glacial melting-down of the Barun glacier surfacebelow the level of the pedestal moraine of Stage IV(2.1.1.) about 5400 m a.s.l. The current orographicsnow-line lies about 5900 m a.s.l., so that a snow-linedepression of 500 m can be calculated. This snow-linedepression is less than 700 m, which value has beendetermined for the somewhat older Late Glacial StageIV (Sirkung-Stage; cf. Table 1) in the Central Himalaya(Kuhle, 1982: 150–168). Owing to this, the geomor-phologically documented chronology of the ELA-depressions of 500 m and more (ca. 700) metres, in
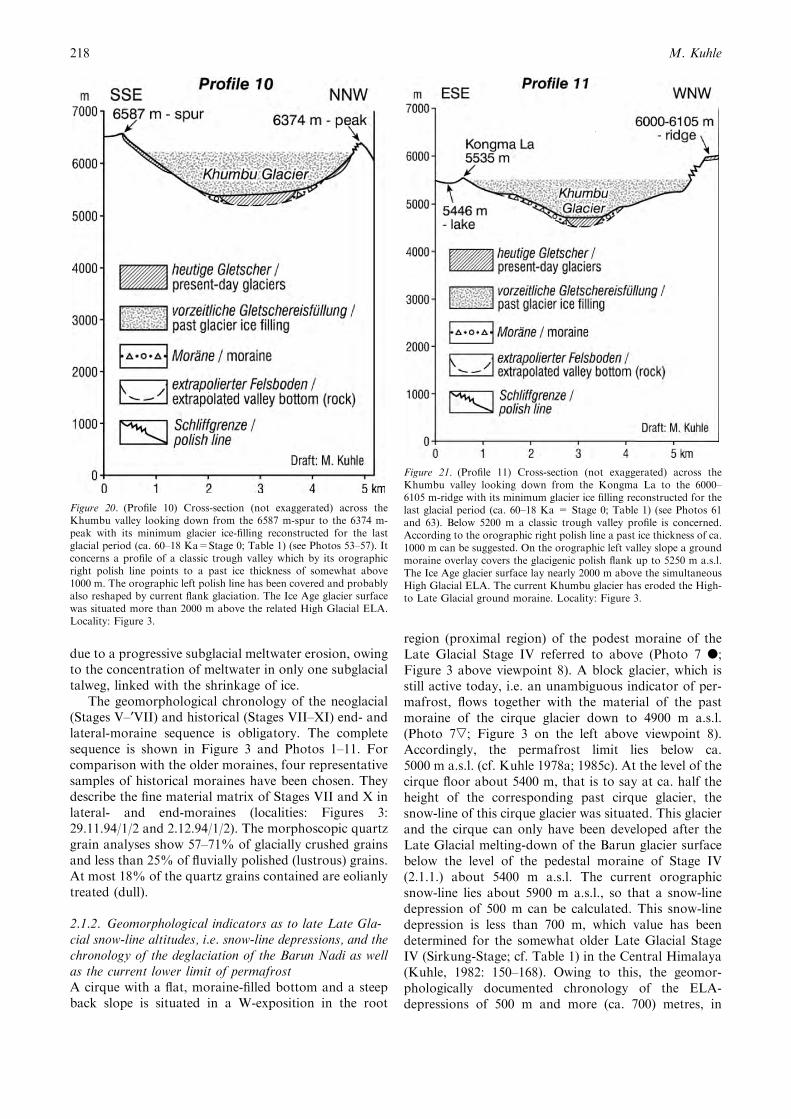
Figure 20. (Profile 10) Cross-section (not exaggerated) across theKhumbu valley looking down from the 6587 m-spur to the 6374 m-peak with its minimum glacier ice-filling reconstructed for the lastglacial period (ca. 60–18 Ka=Stage 0; Table 1) (see Photos 53–57). Itconcerns a profile of a classic trough valley which by its orographicright polish line points to a past ice thickness of somewhat above1000 m. The orographic left polish line has been covered and probablyalso reshaped by current flank glaciation. The Ice Age glacier surfacewas situated more than 2000 m above the related High Glacial ELA.Locality: Figure 3.
Figure 21. (Profile 11) Cross-section (not exaggerated) across theKhumbu valley looking down from the Kongma La to the 6000–6105 m-ridge with its minimum glacier ice filling reconstructed for thelast glacial period (ca. 60–18 Ka = Stage 0; Table 1) (see Photos 61and 63). Below 5200 m a classic trough valley profile is concerned.According to the orographic right polish line a past ice thickness of ca.1000 m can be suggested. On the orographic left valley slope a groundmoraine overlay covers the glacigenic polish flank up to 5250 m a.s.l.The Ice Age glacier surface lay nearly 2000 m above the simultaneousHigh Glacial ELA. The current Khumbu glacier has eroded the High-to Late Glacial ground moraine. Locality: Figure 3.
M. Kuhle218
comparison with the already investigated mountain-massifs of the Central Himalaya, points to the chrono-logical classification of the cirque glacier as belonging tothe ending late Late Glacial. The large pedestal morainein the Barun Nadi (2.1.1.) has to be classified as being ofthe somewhat older late Late Glacial Stage IV. Due toabsolute moraine datings (14C), which the author hascarried out in the immediately W-adjacent KhumbuHimalaya (Kuhle, 1986g, 1987b), he has classified thesame ELA-depressions as belonging to ages older than13,500–13,000 YBP for Stage IV and somewhat (prob-ably several centuries) younger for an ELA-depressionof only 500 m (Table 1).
Summarizing Sections 2.1.1. and 2.1.2 it has to bestressed, that the late glacial coverage of the valleybottoms and the sections near to them by debris ofpedestal moraines, which has taken place in manyHimalaya valleys from the High Glacial Stage 0onwards (last glacial period), i.e. since the deglaciation,can be evidenced here, too (Photos 8 and 9). Afterwardsa subglacial fluvial cutting into these ground morainestook place, combined with their partial evacuation.Then the neoglacial (Holocene) and comparativelyminor but thick historical moraines and flat glaciofluvialgravel fields (sanders) (Figure 10; Photos 7 and 10) havebeen inserted into these valley cross-profiles, developedtoward the ending Late Glacial. A renewed burying of
the valley bottoms also through lateral- and dumped-moraines, accompanied by the historical glaciershrinkage, currently takes place in the higher valleychambers (Photos 1–6; Figure 7 and 8).
2.1.3. Continuation of the reconstruction of the maximumLast Glacial Barun glacier and its trim-line from the valleyheads of the Barun- and Lower Barun glacier valley up tothe confluence of these two valley source branches betweenthe Shershon- (Photos 9 and 10) and the Mera alpinepasture (Photo 12) (Figure 11 between Nos. 37 and 43)Obviously, even the late Late Glacial ice level of StageIV lay clearly above 5400 m a.s.l., i.e. the level of thepedestal moraine overflowed by this glacier stage(Section 2.1.1). This is evidenced by round-polishedmetamorphite ridges (Photo 7 ˙ on the right) coveredby ground moraine (n small on the right).
Ground moraine remnants situated very high up thevalley flanks above the moraine levels of Stage IV testifyto older, higher glacier trim-lines. They are sporadicallypreserved in the valley chambers above Shershon (Photo4 n white; 6 n black and white on the right above; 7 n
white, small; 11 n black on the left above). The highestpast glacier trim-lines, which, accordingly, are classifiedas High Glacial (last glacial period, Wurmian, Stage 0;see Table 1) (Photos 1–11: – – –; ****, ___, ...), can bediagnosed by geomorphologically preserved upper limits
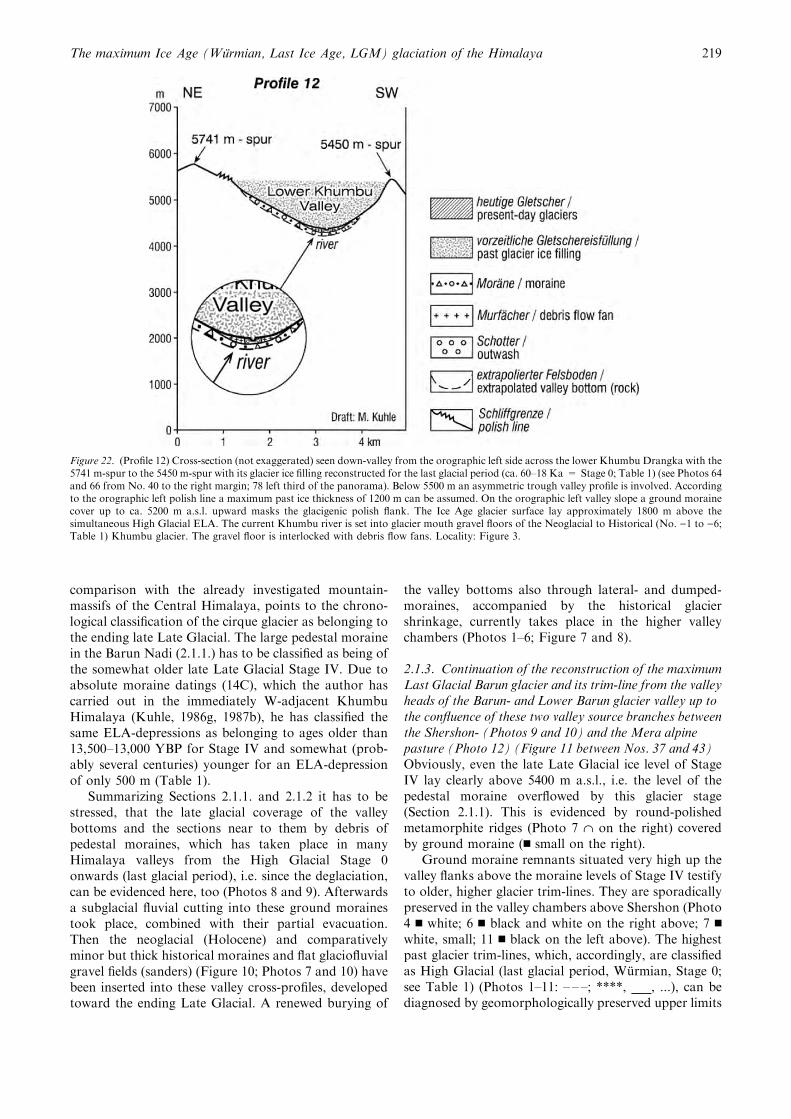
Figure 22. (Profile 12) Cross-section (not exaggerated) seen down-valley from the orographic left side across the lower Khumbu Drangka with the5741 m-spur to the 5450 m-spur with its glacier ice filling reconstructed for the last glacial period (ca. 60–18 Ka = Stage 0; Table 1) (see Photos 64and 66 from No. 40 to the right margin; 78 left third of the panorama). Below 5500 m an asymmetric trough valley profile is involved. Accordingto the orographic left polish line a maximum past ice thickness of 1200 m can be assumed. On the orographic left valley slope a ground morainecover up to ca. 5200 m a.s.l. upward masks the glacigenic polish flank. The Ice Age glacier surface lay approximately 1800 m above thesimultaneous High Glacial ELA. The current Khumbu river is set into glacier mouth gravel floors of the Neoglacial to Historical (No. )1 to )6;Table 1) Khumbu glacier. The gravel floor is interlocked with debris flow fans. Locality: Figure 3.
The maximum Ice Age (Wurmian, Last Ice Age, LGM) glaciation of the Himalaya 219
of polishing and abrasion on the rock slopes of thevalley flanks through rock roundings, which towardabove break-off linearly (Photos 1–11: ˙; Figure 3 onthe left below and directly below No. 3; above and onthe right of No. 39; on the right of No. 31; between No.31 and 12; on the right of No. 42), by scoured truncatedspurs and glacigenic triangle-shaped slopes (Photo 9…;Figure 3 on the right of Nos. 29, 13, 30; from left to rightbelow No. 3; between Nos. 12, 44 and 31; on the right ofNo. 42). In places the upper limit of wall foot pedestals –so far they are not dependent on the changing of rockresistance – is also a hard indicator of the highest trim-line. Wall foot pedestals, which occur at many places inthe formerly glaciated Himalaya, are rounded rockflattenings, on the upper margins of which the valleyflank steepens like a wall (Kuhle, 1982: 53; 1983a:
132–134). Here, in an upward direction, the cleft-con-trolled back shifting of the wall sets in, forced by sub-aerial processes like frost weathering, rock fall and wallglaciation with denudation by avalanches (Photos 6, 7above – – – black; 8–10 above – – – on the right belowNo. 3; 9 above ____ on the left below Nos. 31, 37). Thiskind of development of a steep wall, which significantlysets in inan upward direction, is especially pronounced,because during the entire Pleistocene it has never beeninterrupted by an Ice Age glacier filling of the valleys upto its level. Owing to this, it is a special indicator of thehighest past glacier trim-line.
At other flank localities the upper past polish line isverifiable at places, where wall ravines become abruptlynarrower from above to below (Photo 11 cf. wall ravineon the left below No. 44 above and below of ...), that isbelow the polish line, where their development hasstarted after the lowering of the glacier level during theLate Glacial deglaciation.
The altitudes of the glacier surfaces suggested incorrespondence with the reconstructed past glacier trim-lines reach 6200–6300 m a.s.l., i.e. a maximum of6450 m a.s.l. (Figure 7) in the source area of the BarunNadi (Photos 1, 2, 8, 9 – – –, **** and ___). Accordingly,the transfluence passes at 6070–6275 m leading into theN-adjacent Kangchung Nadi (Khola) or Karma Chu(Figure 3 between Nos. 10 and 3; Figure 4) have beenoverflowed by ca. 230- to 30-m thick ice masses. Theauthor’s investigations in 1989, carried out on the otherside of the transfluence passes, in the Karma Chu, haveled to the same result (Kuhle, 1991a: 204–210; 225–229).There it is said about the Last Glacial Karma glacier:The Karma glacier ‘‘communicated with the S-Tibetanice stream network, which was linked to the Kharta(Kadar) valley in the N. The ice had a considerableinflux from the flanks of the high peaks mentionedabove. At the same time, however, it was limited by thedirect overflow of ice into the Himalayan south-slope.The Barun valley (ibid. Figure 43, No. 60) drained thisice overflow steeply down to the S, thus keeping the icethickness there on the low side. The 6107 (or 6070) m-high transfluence E of the Pethangtse (ibid. Photos 104,No. 0y; 102 No. 0x) was overflowed as well as the6177 (or 6130) m-high ridge W of Pethangtse (ibid.Photo 105x right of No. 0), though both these icetransfluences are likely to have had thicknesses of atmost 100–150 m’’ (ibid.: 210). The ice transfluenceacross the 6220-m high pass between Cho Polu (No. 29)and Shar Tse (Peak 38) (No. 10) from or into the W-adjacent Imja Khola had a thickness of just 100 m(Photo 1 – – –), as also that across the southern 6190 m-transfluence pass between Cho Polu and Baruntse (No.13) (corresponding ice level see Photo 2 ****) (Figure 3between Nos. 10 and 13). Three further ca. 6100 m-hightransfluence passes, connected to the Barun Nadi on theorographic right side, which have mediated to the W-adjacent Lower Barun glacier branch, have been over-flowed by an at most 30–100 m-thick ice (Figure 3between Nos. 30 and 41; related ice level see Photos 4
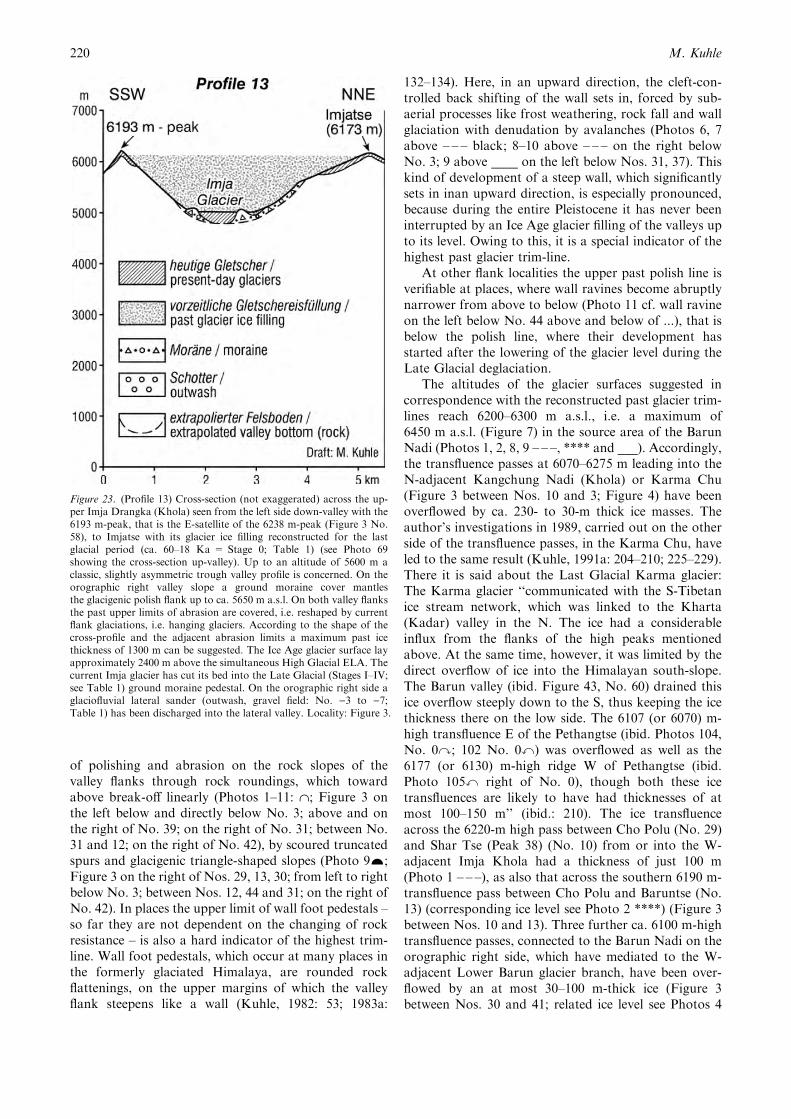
Figure 23. (Profile 13) Cross-section (not exaggerated) across the up-per Imja Drangka (Khola) seen from the left side down-valley with the6193 m-peak, that is the E-satellite of the 6238 m-peak (Figure 3 No.58), to Imjatse with its glacier ice filling reconstructed for the lastglacial period (ca. 60–18 Ka = Stage 0; Table 1) (see Photo 69showing the cross-section up-valley). Up to an altitude of 5600 m aclassic, slightly asymmetric trough valley profile is concerned. On theorographic right valley slope a ground moraine cover mantlesthe glacigenic polish flank up to ca. 5650 m a.s.l. On both valley flanksthe past upper limits of abrasion are covered, i.e. reshaped by currentflank glaciations, i.e. hanging glaciers. According to the shape of thecross-profile and the adjacent abrasion limits a maximum past icethickness of 1300 m can be suggested. The Ice Age glacier surface layapproximately 2400 m above the simultaneous High Glacial ELA. Thecurrent Imja glacier has cut its bed into the Late Glacial (Stages I–IV;see Table 1) ground moraine pedestal. On the orographic right side aglaciofluvial lateral sander (outwash, gravel field: No. )3 to )7;Table 1) has been discharged into the lateral valley. Locality: Figure 3.
M. Kuhle220
and 5 ____; Figure 8). In the direction of the approxi-mately 15 km-wide valley chamber above the Shershonalpine pasture the altitude of the highest past glaciertrim-line decreases to ca. 6000 m a.s.l. (Figure 10 leftthird of the profile; Photo 9 ____ below Nos. 23 and 43).This is due to the ca. 5770 m-high transfluence passacross which the upper ca. 230 m of the Barun glacier iceflowed steeply down into an orographic right side valleyof the E-neighbouring, ca. 4000 m lower Arun Nadi(Figure 11 between Nos. 23 and 28; Photo 9).
The level of the Ice Age Lower Barun glacierreached – similarly to that of the upper Barun glacier –an altitude of 6400 m. Up to the confluence with theChamlang glacier branch (Figure 3) it lost ca. 200 m inheight (Photo 11 ...); then the level ran nearly hori-zontally over ca. 1.5 km up to the valley exit (Figure 9;Photos 8, 9, 10: – – –, i.e. ____ below No. 12). In thearea of the connected junction, i.e. confluence step,down to the main valley, where an ice fall is presentlysituated (Photo 11), the Ice Age glacier trim-line of theLower Barun glacier decreased to ca. 5900 m a.s.l. andthus to the joint level with the Barun main glacier(Figure 10; Photos 8 and 9:____ on the left below No.31). The level in the source basin of the Lower Barunglacier is controlled by the ice overflow of the 6135 m-
high West Col transfluence pass (Figure 3 below No.30), so that the ice surface is lower than it otherwisewould have been accumulated. Thus, at the ice level ofca. 6400 m a.s.l. (see above), the thickness of theoverflowing glacier ice, which discharged into theHunku Drangka (Khola) (height of the valley bottom5200 m), was ca. 270 m. The three further transfluencepasses, which had a joint ice level with the upper Barunglacier branch, have already been mentioned. As forthe ice level in the confluence area of the two sourcebranches of the Barun valley (Figure 10 right half ofthe profile), the past ice transfluence between the BarunKhola and Irkhuwa Khola, the Iswa La (Figure 3 and11 No. 47; Photos 9 and 10 No. 47), is important.Here, the highest trim-line runs from ca. 5900 m (seeabove) down to 5850–5800 m a.s.l. along the N-flankof the Iswa Peak (or Peak 6) (Photo 9 ____ on the leftbelow No. 37), so that in relation to that 5340 m-highpass a 510–560 m-high ice overflow into the neigh-bouring valley could have occurred. However, the HighGlacial glacier level of the Irkhuwa (Isuwa) Khola withits height of 5300 m has held against it (Photo 24), sothat a steep and at the same time very fast and thusmass-effective discharge cannot have taken place fromthe Barun- into the Irkhuwa Khola.
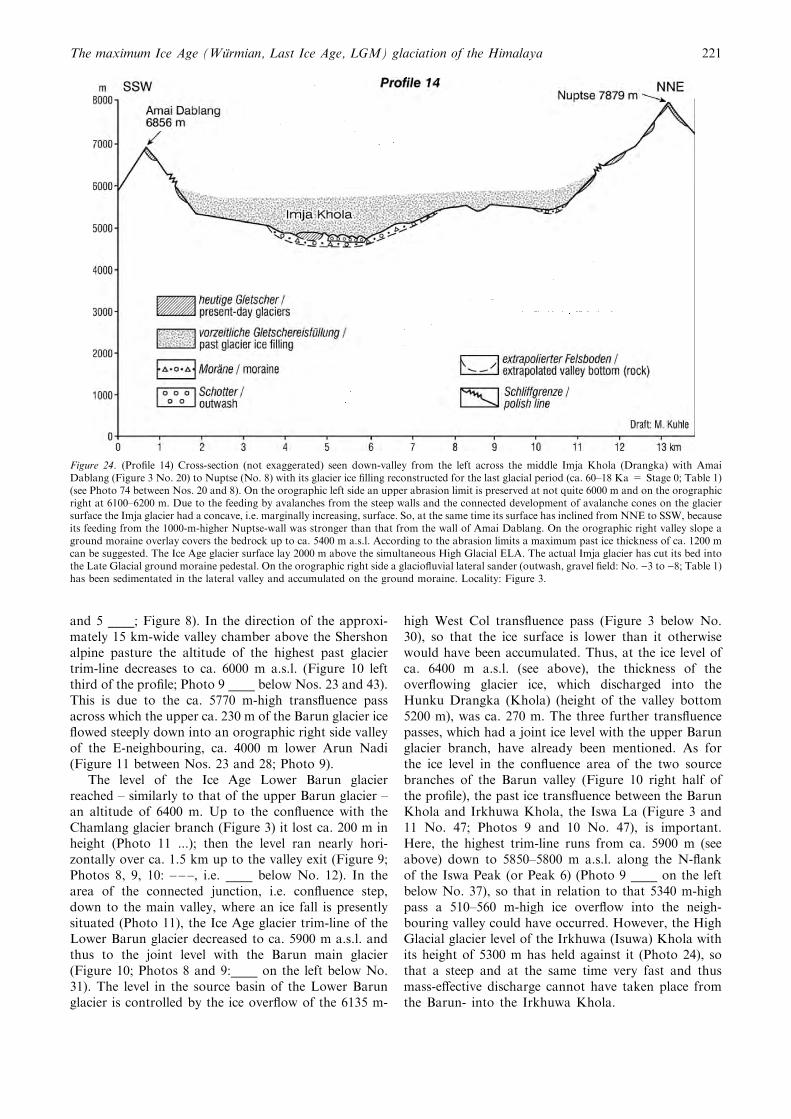
Figure 24. (Profile 14) Cross-section (not exaggerated) seen down-valley from the left across the middle Imja Khola (Drangka) with AmaiDablang (Figure 3 No. 20) to Nuptse (No. 8) with its glacier ice filling reconstructed for the last glacial period (ca. 60–18 Ka = Stage 0; Table 1)(see Photo 74 between Nos. 20 and 8). On the orographic left side an upper abrasion limit is preserved at not quite 6000 m and on the orographicright at 6100–6200 m. Due to the feeding by avalanches from the steep walls and the connected development of avalanche cones on the glaciersurface the Imja glacier had a concave, i.e. marginally increasing, surface. So, at the same time its surface has inclined from NNE to SSW, becauseits feeding from the 1000-m-higher Nuptse-wall was stronger than that from the wall of Amai Dablang. On the orographic right valley slope aground moraine overlay covers the bedrock up to ca. 5400 m a.s.l. According to the abrasion limits a maximum past ice thickness of ca. 1200 mcan be suggested. The Ice Age glacier surface lay 2000 m above the simultaneous High Glacial ELA. The actual Imja glacier has cut its bed intothe Late Glacial ground moraine pedestal. On the orographic right side a glaciofluvial lateral sander (outwash, gravel field: No. )3 to )8; Table 1)has been sedimentated in the lateral valley and accumulated on the ground moraine. Locality: Figure 3.
The maximum Ice Age (Wurmian, Last Ice Age, LGM) glaciation of the Himalaya 221
In comparison with all transfluence passes, the mostsubstantial loss in ice masses has been caused by thetransfluence pass toward the E (Figure 11 between Nos.23 and 28; Photo 9 ), down the steep slope into theArun Nadi (see above), because – due to the relief – noabutment could develop there. Despite that, the over-flowing ice was 230 m-thick. This is evidenced by thepolished rock head (… on the left below No. 28) and canbe explained by the insignificant viscosity of very coldice a good 2000 m above the snow-line.
In the confluence area of the two source branches ofthe Barun Nadi (Photos 10 and 11), the upper and thelower Barun Nadi, the sequence of the decreasingheights of the glacier levels from the High Glacial con-fluence of the two glacier surfaces (____, – – –, ...)reaching up to 1300 m above the rock bottom of thevalleys, up to the lateral- and end moraines of the twothin glacier tongues, which during the neoglacial (¢VII)to historical time (VII–X; cf. Table 1) were separated,and finally up to the current glacier margins, can becompletely followed (Figure 3 between Nos. 23, 31 and47). The ground moraine areas of the interlocking pastice margins, which become younger and younger, arepartly covered by gravel fields (sander) of the corre-sponding younger glacier mouth gravel floors (e.g.
Photo 10 h )4; Figure 3 No. )4). In this confluence areathe transition from the High- to Late Glacial features(Stage 0–III; see Table 1) marked by glacial erosion- ordenudation forms as e.g. flank polishings (Photos 10 and11: ˙), to the late Late Glacial accumulation forms, i.e.moraines (Stages IV–X) and gravel fields on the samevalley cross-profiles is also well recognizable by small-scale ground moraine remnants on the polished rocks onthe slopes (Photo 11 n). In the valley cross-profilesfurther down, the moraines are becoming older andolder, because the valley chambers down from the Meraalpine pasture are currently no longer glaciated (seebelow Section 2.1.4). Therefore, in the downwarddirection the past glacigenic store of forms is increas-ingly better preserved, because the number of glacieradvances and their destructive work wanes.
The reconstruction of the ice levels of the uppervalley chambers of the Barun Nadi with regard to theirmaximum ice thicknesses can be summarized into fourexemplary data: in the Barun glacier valley the icethicknesses amounted to ca. 1200 m (Figures 7 and 8)during the Last Ice Age, in the Lower Barun glaciervalley to ca. 1150 m (Figure 9) and in the confluencearea of the two source branches of the Barun valley toca. 1300 m (Figure 10).
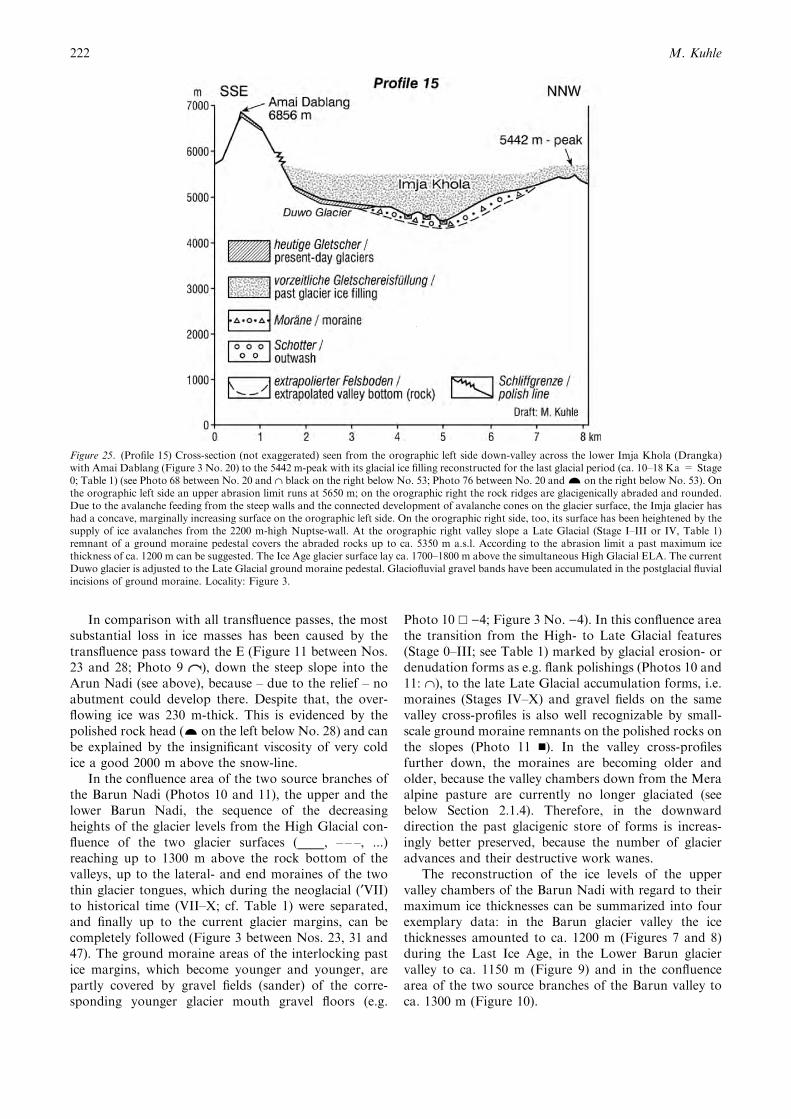
Figure 25. (Profile 15) Cross-section (not exaggerated) seen from the orographic left side down-valley across the lower Imja Khola (Drangka)with Amai Dablang (Figure 3 No. 20) to the 5442 m-peak with its glacial ice filling reconstructed for the last glacial period (ca. 10–18 Ka = Stage0; Table 1) (see Photo 68 between No. 20 and ˙ black on the right below No. 53; Photo 76 between No. 20 and… on the right below No. 53). Onthe orographic left side an upper abrasion limit runs at 5650 m; on the orographic right the rock ridges are glacigenically abraded and rounded.Due to the avalanche feeding from the steep walls and the connected development of avalanche cones on the glacier surface, the Imja glacier hashad a concave, marginally increasing surface on the orographic left side. On the orographic right side, too, its surface has been heightened by thesupply of ice avalanches from the 2200 m-high Nuptse-wall. At the orographic right valley slope a Late Glacial (Stage I–III or IV, Table 1)remnant of a ground moraine pedestal covers the abraded rocks up to ca. 5350 m a.s.l. According to the abrasion limit a past maximum icethickness of ca. 1200 m can be suggested. The Ice Age glacier surface lay ca. 1700–1800 m above the simultaneous High Glacial ELA. The currentDuwo glacier is adjusted to the Late Glacial ground moraine pedestal. Glaciofluvial gravel bands have been accumulated in the postglacial fluvialincisions of ground moraine. Locality: Figure 3.
M. Kuhle222
2.1.4. Reconstruction of the maximum Last Glacial Ba-run glacier and its trim-line in the valley chamber betweenthe Mera Kharka (Photo 12, Figure 4) and YangriKharka (Photo 17, Figure 4; Figure 11 on the left belowNo. 45) alpine pastures with references as to the youngerglacier historyThe last stage during which the Upper and Lower Barunglacier have joined was the neoglacial Stage V (Table 1).They flowed together with a thickness of over 100 mnear the Shershon alpine pasture. This is evidenced byca. 190 m-high lateral moraines of this stage on theorographic right side in the upper Barun Nadi (Figure 3,Photo 8: V). During Stage VI the two glacier tongueswere perhaps even just in ice contact. In any case, thetongue of the Lower Barun glacier still reaches farbeyond the confluence area, i.e. nearly down to theMera Kharka alpine pasture (Figure 3, Sedua) (Photos 9and 10: h on the right of X; Photo 12, X on the left).During the oldest neoglacial Stage V the joint glaciertongue, i.e. the tongue of the Barun main glacier, flowed
down to ca. 4000 m a.s.l. past the Mera Kharka alpinepasture. This is proved by ca. 100 m-high, end-moraine-like lateral moraine ramps with relatively flat (17–27�-inclined) outer slopes (Photos 13 and 14: V; Figure 11 Von the left below No. 45). On these moraine slopes at thelevel of the timberline rhododendron copse alreadygrows in the climax stage. This merely proves that thesemoraines are older than the oldest historical Stages VIIIor VII and, accordingly, belong to the neoglacial period(Holocene) (cf. Table 1). The classification as belongingto the oldest stage of the neoglacial period (Holocene)(Stage V) has been relatively dated by seven younger icemargin positions, evidenced up to the current glaciertongue up-valley (cf. Sections 2.1.1, 2.1.2 and 2.1.3).
Down the Barun Nadi no further neoglacial and LateGlacial lowest terminal positions of glacier tongues havebeen preserved by remnants of end moraines, i.e. lateralmoraines close to end moraines. The lowest remnant ofground moraine, which, due to its pedestal moraine(Figure 11 on the left below No. 45) can unambiguouslybe classified, is situated above the Yangri Kharka valleychamber between 3750 and 3900 m a.s.l. It belongs toStage IV (Photos 15, IV).
Today up to 4 km-long glaciers still flow downfrom the S-exposed walls and slopes of the ChamlanHimal toward the Mera Kharka alpine pasture. Thelargest one is the Yaupa (Peak 28) S-glacier, fed bythe ca. 6645 or 6112 m-high Peak 43, the ca. 6750 or6432 m-high Yaupa-peak (Photo 12 No. 28), the6166 m-high Yaupa-middle peak and the 6422 m-highYaupa E-peak. At the end of the 1994 ‘budget-year’its tongue end reached down to 4590 m (above XI), sothat a current orographic snow-line (ELA) about5300 m a.s.l. can be established (orogr. ELA= medium height of the crest fringe of the glacierfeeding area minus lowest height of the glacier tongueend divided by 2 plus lowest height of the glaciertongue end, i.e., orogr. ELA=6000)4600/2=700;700+4600=5300).
Since Stages IV–V, after the Barun main glacier hadretreated from the orographic left flank of the BarunNadi, the Yaupa-S-glacier had enough room to push apedestal moraine into the main valley (Figure 11 on theleft below No. 43; Photo 12 n below and on the right ofNo. 28) and to create an alluvial debris- and debris flowfan (n). In the meantime the centre of the pedestalmoraine, i.e. the ground moraine pedestal upon whichthe glacier advanced during a neoglacial stage (StagesVI–¢VII), has been excavated by the historical advancesand modified by the attachment of lateral- and end-moraines. X (below No. 28) marks the attached endmoraine ramp of the Little Ice Age. Despite an increaseof the snow-line by 10–20 m (cf. Table 1, XI), the tongueof the Yaupa-S-glacier, which due to these attachmentsand abutments by moraine grew smaller and smaller,reached down just as far or even somewhat further(Photo 12, XI) during the stage about 1920–1950.
Much older, i.e. Late Glacial, ground moraineremnants are preserved in an immediately contiguous
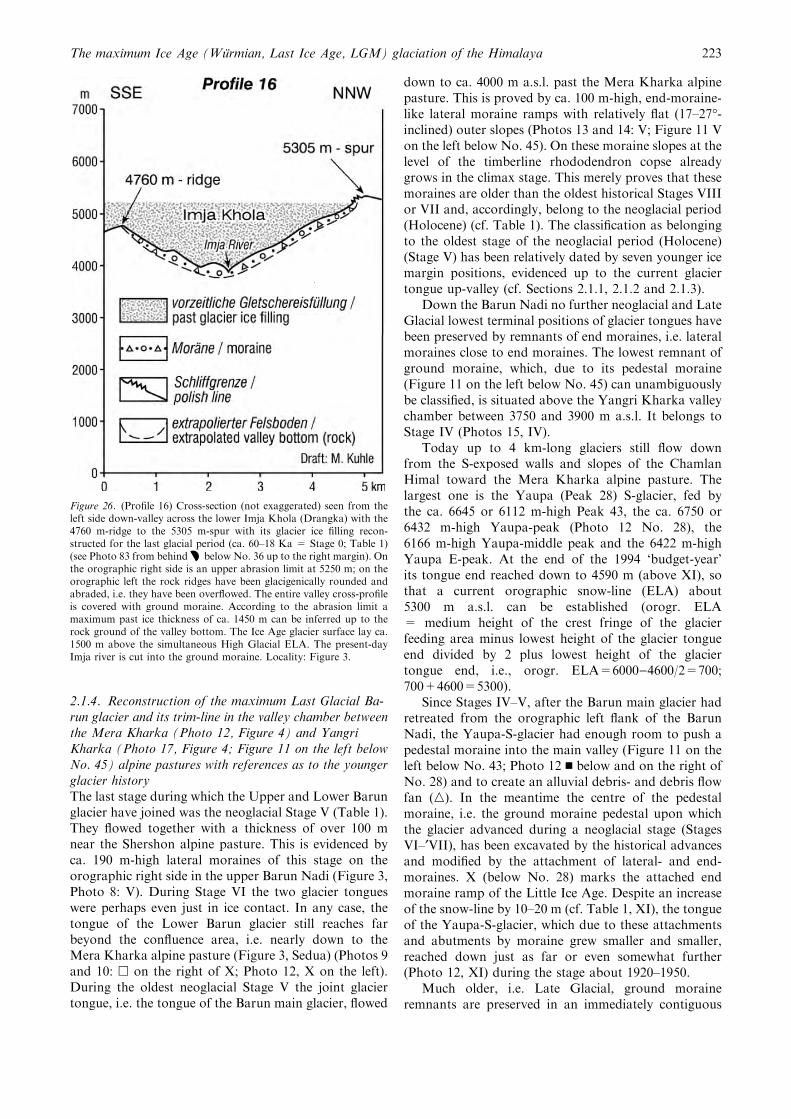
Figure 26. (Profile 16) Cross-section (not exaggerated) seen from theleft side down-valley across the lower Imja Khola (Drangka) with the4760 m-ridge to the 5305 m-spur with its glacier ice filling recon-structed for the last glacial period (ca. 60–18 Ka = Stage 0; Table 1)(see Photo 83 from behind
…
below No. 36 up to the right margin). Onthe orographic right side is an upper abrasion limit at 5250 m; on theorographic left the rock ridges have been glacigenically rounded andabraded, i.e. they have been overflowed. The entire valley cross-profileis covered with ground moraine. According to the abrasion limit amaximum past ice thickness of ca. 1450 m can be inferred up to therock ground of the valley bottom. The Ice Age glacier surface lay ca.1500 m above the simultaneous High Glacial ELA. The present-dayImja river is cut into the ground moraine. Locality: Figure 3.
The maximum Ice Age (Wurmian, Last Ice Age, LGM) glaciation of the Himalaya 223
spur position up to ca. 5000 m a.s.l. (n on the left belowNo. 43; Figure 11 on the left of No. 43). However, in thisvalley chamber the glacigenically worn-down forms(Figure 11 on the left below up to below No. 43) reacheven higher up, 800 m at a maximum (Photo 12…), butthe Late Glacial (Stages IV–I) abrasion forms and flankpolishings can no longer be clearly separated from theHigh Glacial (Stage 0) ones, at least not in all places.Correspondingly, the Ice Age glacier trim-line (– – – onthe left) is verifiable at 5800 m and, above high-hangingside valleys, even at 5900 m (– – – on the right).
With regard to the form analysis of the massive-crystalline rocks such as the outcropping gneisses here,one has to bear in mind that – due to their compara-tively substantial masses – the rock crumblings, whichhave taken place since the deglaciation, have broughtabout significant reshapings of the glacigenically roun-ded wall forms, so that the roundings are no longerpreserved generally, but only sporadically. This can alsobe observed indirectly by the fresh angular particles ofthe debris masses below the walls (m; Photo 14 n).However, not all of the crumblings are angular-cubic(Photo 15 )). They also occur in plate-like forms assurface-concordant exfoliations (Photo 13 .). The lattermight be mixed up with glacigenic smoothings, but amistake like this can be excluded with the help ofrounded rock edges enclosing the pre-glacially or sub-glacially broken out rock faces. On the other hand,
especially unambiguously formed postglacial crum-blings, which have taken place after the deglaciation,render the geomorphological evidence of a formerglacial abrasion as objectivization of a Holocene tocurrent – but not glacigenic – reshaping possible. Here,smooth round curves (Photo 13 ˙ white; 14 ˙ white, lefthalf) are sometimes cut off, i.e. bended or broken andinterrupted by break-offs in size up to that of a towerblock (� on the left).
In some places the reshaping of High Glacialpolishings through Late Glacial polishings, resultingfrom a change of the direction of ice flow, is verifi-able. So, for instance, the Barun glacier with itsimportant ice thickness during the High Glacial (Stage0, Table 1), has polished back the ‘riegel’-like rockpillars (Photo 12 second and third… from the right;13 the two… from the left; 15 the two black ˙ belowNo. 45). In the Late Glacial (Stages I–IV) they havebeen polished and sharpened at right-angles to it bythe hanging glaciers of the orographic left hangingvalleys and the cirque terrace down from the ChamlanHimal (Photo 13 fi ). Similar conditions occurred inthe orographic right flank, where the rock pillar(Photo 13 ˙ white), polished by the Arun parentglacier into a bulging form, has been sharpened into aglacial horn by Late Glacial hanging glaciers (seenfrom a top-view perspective) (Photo 14 ˙ white, lefthalf; Figure 11 on the right below No. 37).
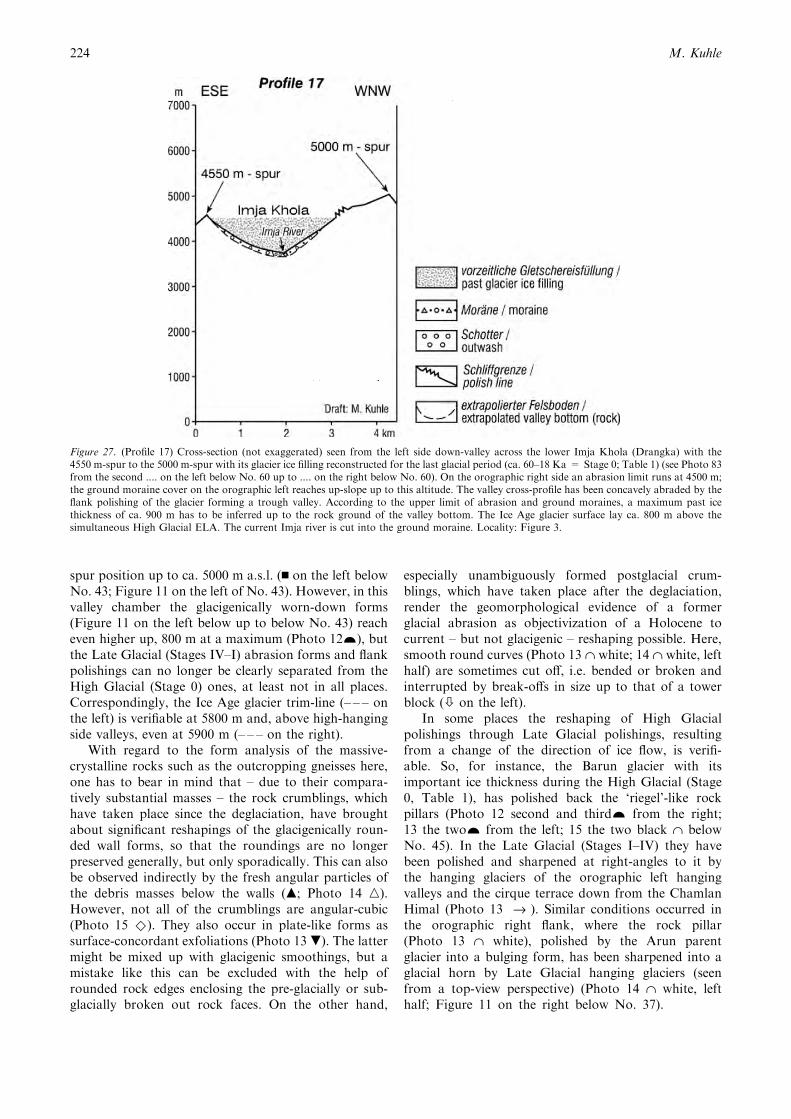
Figure 27. (Profile 17) Cross-section (not exaggerated) seen from the left side down-valley across the lower Imja Khola (Drangka) with the4550 m-spur to the 5000 m-spur with its glacier ice filling reconstructed for the last glacial period (ca. 60–18 Ka = Stage 0; Table 1) (see Photo 83from the second .... on the left below No. 60 up to .... on the right below No. 60). On the orographic right side an abrasion limit runs at 4500 m;the ground moraine cover on the orographic left reaches up-slope up to this altitude. The valley cross-profile has been concavely abraded by theflank polishing of the glacier forming a trough valley. According to the upper limit of abrasion and ground moraines, a maximum past icethickness of ca. 900 m has to be inferred up to the rock ground of the valley bottom. The Ice Age glacier surface lay ca. 800 m above thesimultaneous High Glacial ELA. The current Imja river is cut into the ground moraine. Locality: Figure 3.
M. Kuhle224
Besides the high-lying moraine remnant on theorographic left above Mera Kharka (Photo 12 n on theleft below No. 43), which has already been mentioned,two further early Late Glacial to High Glacial(Stages III–0, Table 1) deposits of ground moraines areto be observed as far down as Yangri Kharka(Figure 11 on the left below Nos. 43 and 45): one onthe bulging protrusion of the orographic right glacialhorn at 480–560 m (at 4480–4560 m a.s.l.) above thevalley bottom (Photo 14 n white above) and the otheron the orographic left side of the concave trough valleyflank as far as the upper half of the slope (Photo 15 thetwo n below - - - 0). At the same time this valley flanksection shows a glacigenic triangle-shaped face. Addi-tionally, on the orographic right side down the valley,
in the geomorphological shadow of the glacial horn(Photo 14 n on the left), ground moraine remnants,reshaped by a slight burying and fluvial undercutting,tower above the valley bottom, which has beenreworked from the neoglacial period up to the present(Stages V–XII, Table 1). Similar mantlings of groundmoraine are preserved 4–5 km down-valley on theorographic left above and down-valley from YangriKharka (Photo 15 n on the right; Figure 11 below No.45).
The entire valley section discussed here shows troughvalley cross-profiles (Figure 11 below Nos. 43 and 45).The valley bottom has been heaped up box-like bypedestal moraines and/or glaciofluvial gravel covers andmudflow fans (Photos 12–15). The largest alluvial
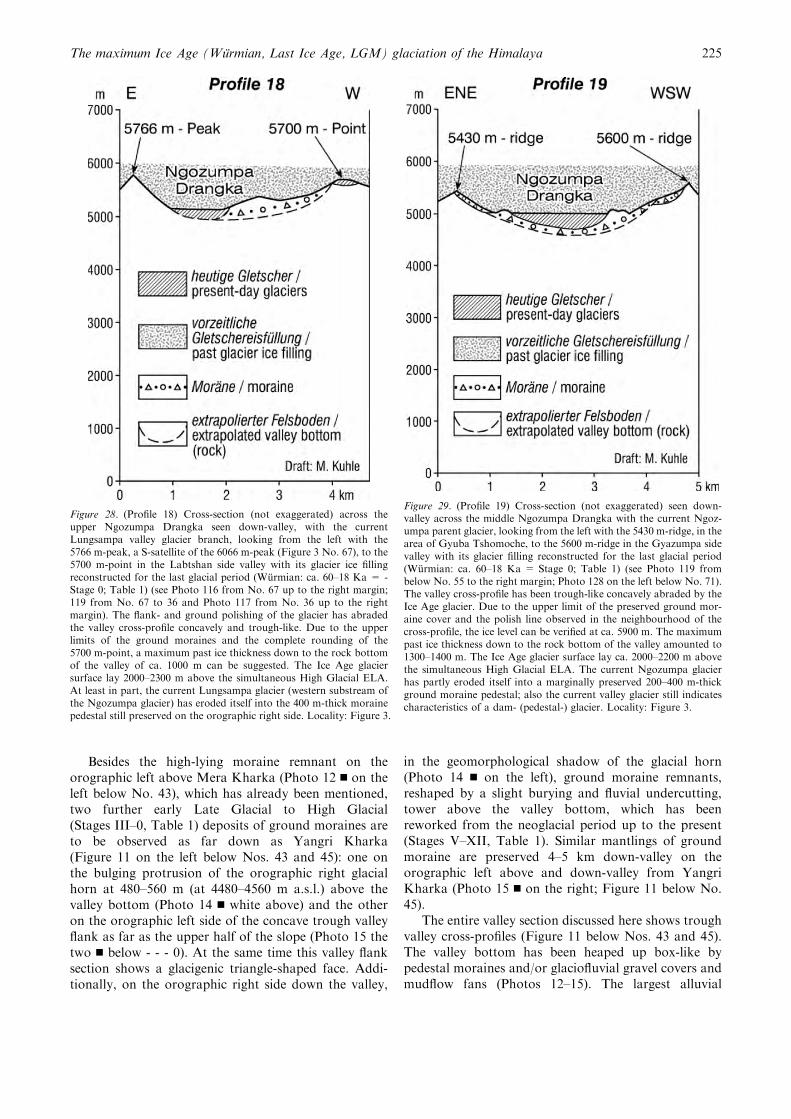
Figure 28. (Profile 18) Cross-section (not exaggerated) across theupper Ngozumpa Drangka seen down-valley, with the currentLungsampa valley glacier branch, looking from the left with the5766 m-peak, a S-satellite of the 6066 m-peak (Figure 3 No. 67), to the5700 m-point in the Labtshan side valley with its glacier ice fillingreconstructed for the last glacial period (Wurmian: ca. 60–18 Ka = -Stage 0; Table 1) (see Photo 116 from No. 67 up to the right margin;119 from No. 67 to 36 and Photo 117 from No. 36 up to the rightmargin). The flank- and ground polishing of the glacier has abradedthe valley cross-profile concavely and trough-like. Due to the upperlimits of the ground moraines and the complete rounding of the5700 m-point, a maximum past ice thickness down to the rock bottomof the valley of ca. 1000 m can be suggested. The Ice Age glaciersurface lay 2000–2300 m above the simultaneous High Glacial ELA.At least in part, the current Lungsampa glacier (western substream ofthe Ngozumpa glacier) has eroded itself into the 400 m-thick morainepedestal still preserved on the orographic right side. Locality: Figure 3.
Figure 29. (Profile 19) Cross-section (not exaggerated) seen down-valley across the middle Ngozumpa Drangka with the current Ngoz-umpa parent glacier, looking from the left with the 5430 m-ridge, in thearea of Gyuba Tshomoche, to the 5600 m-ridge in the Gyazumpa sidevalley with its glacier filling reconstructed for the last glacial period(Wurmian: ca. 60–18 Ka = Stage 0; Table 1) (see Photo 119 frombelow No. 55 to the right margin; Photo 128 on the left below No. 71).The valley cross-profile has been trough-like concavely abraded by theIce Age glacier. Due to the upper limit of the preserved ground mor-aine cover and the polish line observed in the neighbourhood of thecross-profile, the ice level can be verified at ca. 5900 m. The maximumpast ice thickness down to the rock bottom of the valley amounted to1300–1400 m. The Ice Age glacier surface lay ca. 2000–2200 m abovethe simultaneous High Glacial ELA. The current Ngozumpa glacierhas partly eroded itself into a marginally preserved 200–400 m-thickground moraine pedestal; also the current valley glacier still indicatescharacteristics of a dam- (pedestal-) glacier. Locality: Figure 3.
The maximum Ice Age (Wurmian, Last Ice Age, LGM) glaciation of the Himalaya 225
debris- and mudflow fans, which mostly occur in acombined, i.e. polygenetic form, are situated in theconfluence area of high valleys, which were still glaciatedfrom the neoglacial period up to the present (Photos12–14: n large or , large; Figure 11 below Nos. 43 and45). Exemplary for this are the two hanging troughswhich join the valley chamber of Yangri Kharka nearlyparallel and very close to each other from the oro-graphic right side (Photo 15). They show a 6164 m-highcatchment area (or 6185 m, ENE-flank of Peak 7, S-satellite of Iswa Peak No. 37) (Photo 15 and below– – – on the left) and are separated by a ‘riegel’ (on theright of ). Their respective confluence steps between4300 and 4000 m are in part glaciofluvially cut (n large)showing ca. 200–280 m-high roundings formed like
roches moutonnees (˙ white below – – – on the left andcentre; Figure 11 on the right below No. 37).
On the orographic right side opposite the YangriKharka alpine pasture (Photo 15 fi ; see Figure 4;Figure 11 far below No. 45) well preserved glacierstriations are to be observed in the outcropping gneissrock (Photos 16 and 17). These striations 150 m abovethe current talweg in the gravel- and ground morainematerial needed for their development a Barun glacierthickness of at least 200–250 m, provided that the thenice stream lay approximately on the rock ground of thevalley. However, if it should have flowed on a groundmoraine pedestal – and this can be assumed because ofits late Late Glacial age – a less thick ice of e.g. only100 m would have been enough to let the glacierpolishing reach the level of striations. The youngestpossible age to classify the striations is Stage IV, becausein comparison with the current glaciation which with the
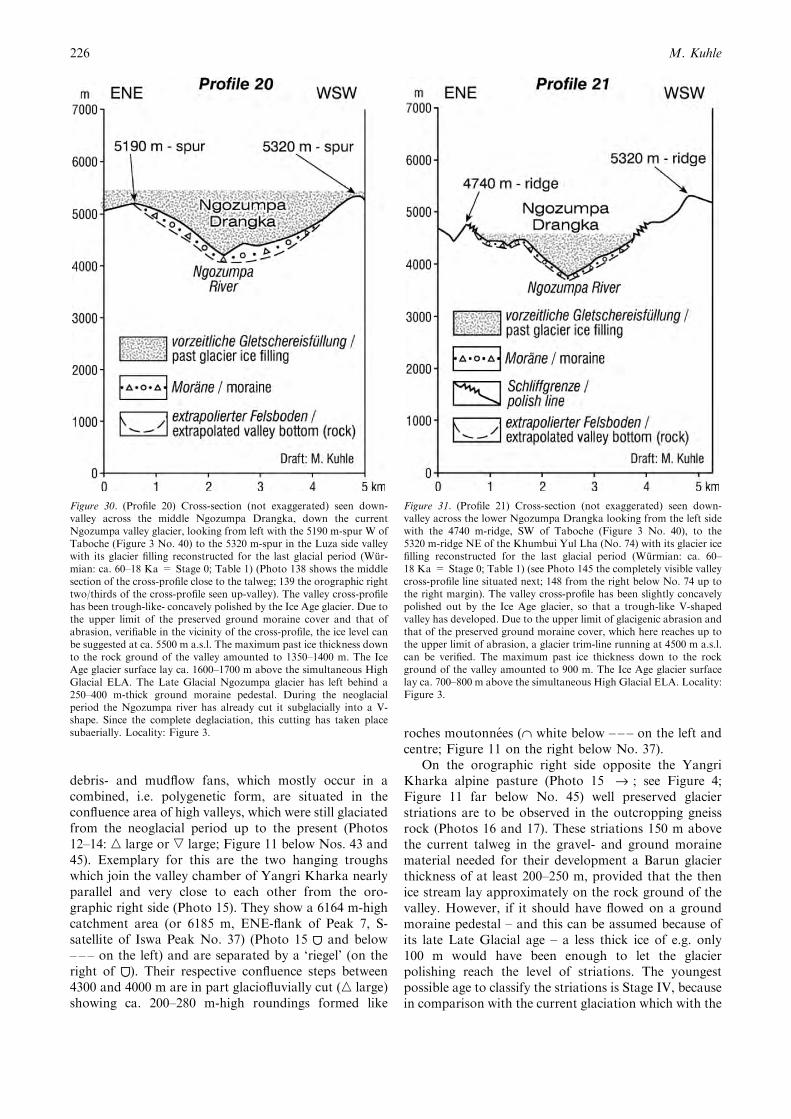
Figure 30. (Profile 20) Cross-section (not exaggerated) seen down-valley across the middle Ngozumpa Drangka, down the currentNgozumpa valley glacier, looking from left with the 5190 m-spur W ofTaboche (Figure 3 No. 40) to the 5320 m-spur in the Luza side valleywith its glacier filling reconstructed for the last glacial period (Wur-mian: ca. 60–18 Ka = Stage 0; Table 1) (Photo 138 shows the middlesection of the cross-profile close to the talweg; 139 the orographic righttwo/thirds of the cross-profile seen up-valley). The valley cross-profilehas been trough-like- concavely polished by the Ice Age glacier. Due tothe upper limit of the preserved ground moraine cover and that ofabrasion, verifiable in the vicinity of the cross-profile, the ice level canbe suggested at ca. 5500 m a.s.l. The maximum past ice thickness downto the rock ground of the valley amounted to 1350–1400 m. The IceAge glacier surface lay ca. 1600–1700 m above the simultaneous HighGlacial ELA. The Late Glacial Ngozumpa glacier has left behind a250–400 m-thick ground moraine pedestal. During the neoglacialperiod the Ngozumpa river has already cut it subglacially into a V-shape. Since the complete deglaciation, this cutting has taken placesubaerially. Locality: Figure 3.
Figure 31. (Profile 21) Cross-section (not exaggerated) seen down-valley across the lower Ngozumpa Drangka looking from the left sidewith the 4740 m-ridge, SW of Taboche (Figure 3 No. 40), to the5320 m-ridge NE of the Khumbui Yul Lha (No. 74) with its glacier icefilling reconstructed for the last glacial period (Wurmian: ca. 60–18 Ka = Stage 0; Table 1) (see Photo 145 the completely visible valleycross-profile line situated next; 148 from the right below No. 74 up tothe right margin). The valley cross-profile has been slightly concavelypolished out by the Ice Age glacier, so that a trough-like V-shapedvalley has developed. Due to the upper limit of glacigenic abrasion andthat of the preserved ground moraine cover, which here reaches up tothe upper limit of abrasion, a glacier trim-line running at 4500 m a.s.l.can be verified. The maximum past ice thickness down to the rockground of the valley amounted to 900 m. The Ice Age glacier surfacelay ca. 700–800 m above the simultaneous High Glacial ELA. Locality:Figure 3.
M. Kuhle226
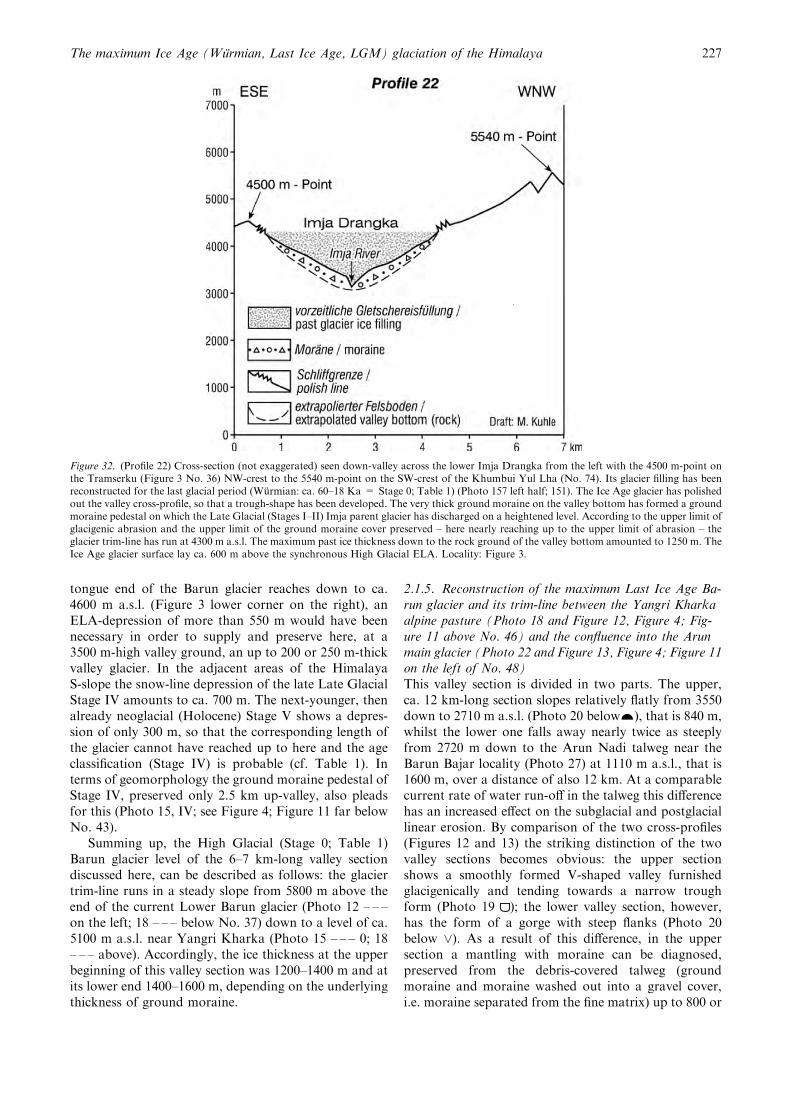
tongue end of the Barun glacier reaches down to ca.4600 m a.s.l. (Figure 3 lower corner on the right), anELA-depression of more than 550 m would have beennecessary in order to supply and preserve here, at a3500 m-high valley ground, an up to 200 or 250 m-thickvalley glacier. In the adjacent areas of the HimalayaS-slope the snow-line depression of the late Late GlacialStage IV amounts to ca. 700 m. The next-younger, thenalready neoglacial (Holocene) Stage V shows a depres-sion of only 300 m, so that the corresponding length ofthe glacier cannot have reached up to here and the ageclassification (Stage IV) is probable (cf. Table 1). Interms of geomorphology the ground moraine pedestal ofStage IV, preserved only 2.5 km up-valley, also pleadsfor this (Photo 15, IV; see Figure 4; Figure 11 far belowNo. 43).
Summing up, the High Glacial (Stage 0; Table 1)Barun glacier level of the 6–7 km-long valley sectiondiscussed here, can be described as follows: the glaciertrim-line runs in a steady slope from 5800 m above theend of the current Lower Barun glacier (Photo 12 – – –on the left; 18 – – – below No. 37) down to a level of ca.5100 m a.s.l. near Yangri Kharka (Photo 15 – – – 0; 18– – – above). Accordingly, the ice thickness at the upperbeginning of this valley section was 1200–1400 m and atits lower end 1400–1600 m, depending on the underlyingthickness of ground moraine.
2.1.5. Reconstruction of the maximum Last Ice Age Ba-run glacier and its trim-line between the Yangri Kharkaalpine pasture (Photo 18 and Figure 12, Figure 4; Fig-ure 11 above No. 46) and the confluence into the Arunmain glacier (Photo 22 and Figure 13, Figure 4; Figure 11on the left of No. 48)This valley section is divided in two parts. The upper,ca. 12 km-long section slopes relatively flatly from 3550down to 2710 m a.s.l. (Photo 20 below…), that is 840 m,whilst the lower one falls away nearly twice as steeplyfrom 2720 m down to the Arun Nadi talweg near theBarun Bajar locality (Photo 27) at 1110 m a.s.l., that is1600 m, over a distance of also 12 km. At a comparablecurrent rate of water run-off in the talweg this differencehas an increased effect on the subglacial and postglaciallinear erosion. By comparison of the two cross-profiles(Figures 12 and 13) the striking distinction of the twovalley sections becomes obvious: the upper sectionshows a smoothly formed V-shaped valley furnishedglacigenically and tending towards a narrow troughform (Photo 19 ); the lower valley section, however,has the form of a gorge with steep flanks (Photo 20below _). As a result of this difference, in the uppersection a mantling with moraine can be diagnosed,preserved from the debris-covered talweg (groundmoraine and moraine washed out into a gravel cover,i.e. moraine separated from the fine matrix) up to 800 or
Figure 32. (Profile 22) Cross-section (not exaggerated) seen down-valley across the lower Imja Drangka from the left with the 4500 m-point onthe Tramserku (Figure 3 No. 36) NW-crest to the 5540 m-point on the SW-crest of the Khumbui Yul Lha (No. 74). Its glacier filling has beenreconstructed for the last glacial period (Wurmian: ca. 60–18 Ka = Stage 0; Table 1) (Photo 157 left half; 151). The Ice Age glacier has polishedout the valley cross-profile, so that a trough-shape has been developed. The very thick ground moraine on the valley bottom has formed a groundmoraine pedestal on which the Late Glacial (Stages I–II) Imja parent glacier has discharged on a heightened level. According to the upper limit ofglacigenic abrasion and the upper limit of the ground moraine cover preserved – here nearly reaching up to the upper limit of abrasion – theglacier trim-line has run at 4300 m a.s.l. The maximum past ice thickness down to the rock ground of the valley bottom amounted to 1250 m. TheIce Age glacier surface lay ca. 600 m above the synchronous High Glacial ELA. Locality: Figure 3.
The maximum Ice Age (Wurmian, Last Ice Age, LGM) glaciation of the Himalaya 227
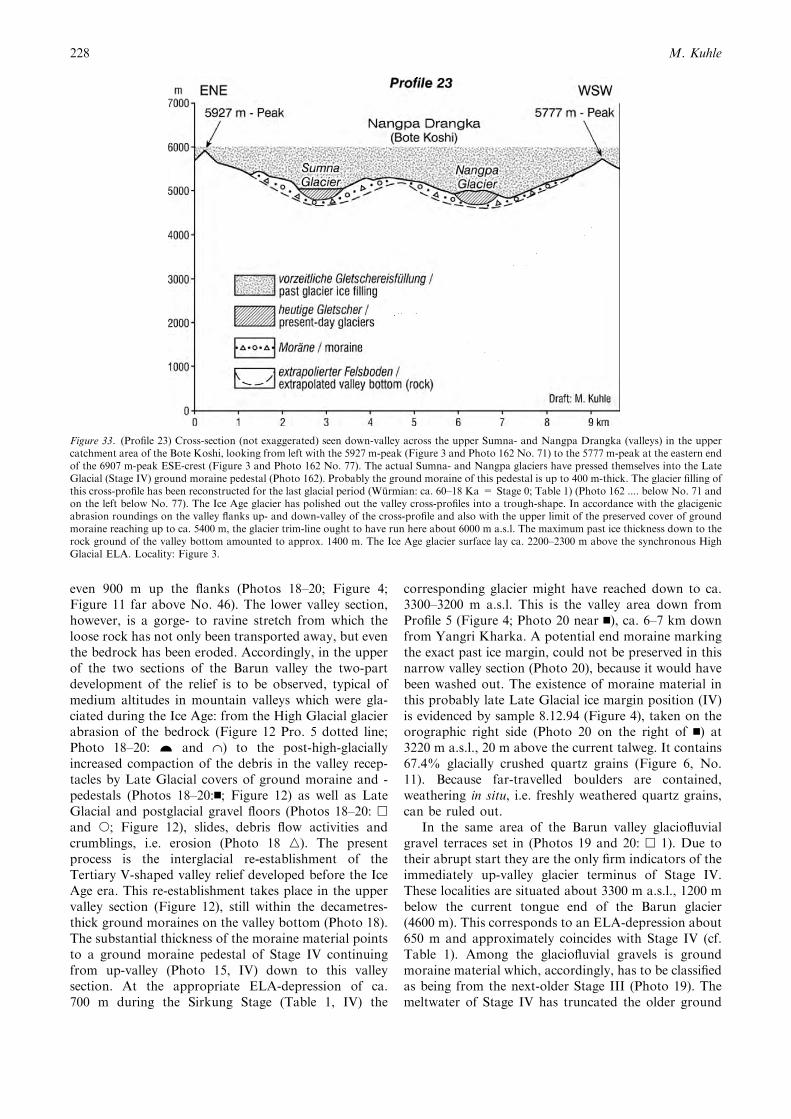
even 900 m up the flanks (Photos 18–20; Figure 4;Figure 11 far above No. 46). The lower valley section,however, is a gorge- to ravine stretch from which theloose rock has not only been transported away, but eventhe bedrock has been eroded. Accordingly, in the upperof the two sections of the Barun valley the two-partdevelopment of the relief is to be observed, typical ofmedium altitudes in mountain valleys which were gla-ciated during the Ice Age: from the High Glacial glacierabrasion of the bedrock (Figure 12 Pro. 5 dotted line;Photo 18–20: … and ˙) to the post-high-glaciallyincreased compaction of the debris in the valley recep-tacles by Late Glacial covers of ground moraine and -pedestals (Photos 18–20:n; Figure 12) as well as LateGlacial and postglacial gravel floors (Photos 18–20: hand s; Figure 12), slides, debris flow activities andcrumblings, i.e. erosion (Photo 18 n). The presentprocess is the interglacial re-establishment of theTertiary V-shaped valley relief developed before the IceAge era. This re-establishment takes place in the uppervalley section (Figure 12), still within the decametres-thick ground moraines on the valley bottom (Photo 18).The substantial thickness of the moraine material pointsto a ground moraine pedestal of Stage IV continuingfrom up-valley (Photo 15, IV) down to this valleysection. At the appropriate ELA-depression of ca.700 m during the Sirkung Stage (Table 1, IV) the
corresponding glacier might have reached down to ca.3300–3200 m a.s.l. This is the valley area down fromProfile 5 (Figure 4; Photo 20 near n), ca. 6–7 km downfrom Yangri Kharka. A potential end moraine markingthe exact past ice margin, could not be preserved in thisnarrow valley section (Photo 20), because it would havebeen washed out. The existence of moraine material inthis probably late Late Glacial ice margin position (IV)is evidenced by sample 8.12.94 (Figure 4), taken on theorographic right side (Photo 20 on the right of n) at3220 m a.s.l., 20 m above the current talweg. It contains67.4% glacially crushed quartz grains (Figure 6, No.11). Because far-travelled boulders are contained,weathering in situ, i.e. freshly weathered quartz grains,can be ruled out.
In the same area of the Barun valley glaciofluvialgravel terraces set in (Photos 19 and 20: h 1). Due totheir abrupt start they are the only firm indicators of theimmediately up-valley glacier terminus of Stage IV.These localities are situated about 3300 m a.s.l., 1200 mbelow the current tongue end of the Barun glacier(4600 m). This corresponds to an ELA-depression about650 m and approximately coincides with Stage IV (cf.Table 1). Among the glaciofluvial gravels is groundmoraine material which, accordingly, has to be classifiedas being from the next-older Stage III (Photo 19). Themeltwater of Stage IV has truncated the older ground
Figure 33. (Profile 23) Cross-section (not exaggerated) seen down-valley across the upper Sumna- and Nangpa Drangka (valleys) in the uppercatchment area of the Bote Koshi, looking from left with the 5927 m-peak (Figure 3 and Photo 162 No. 71) to the 5777 m-peak at the eastern endof the 6907 m-peak ESE-crest (Figure 3 and Photo 162 No. 77). The actual Sumna- and Nangpa glaciers have pressed themselves into the LateGlacial (Stage IV) ground moraine pedestal (Photo 162). Probably the ground moraine of this pedestal is up to 400 m-thick. The glacier filling ofthis cross-profile has been reconstructed for the last glacial period (Wurmian: ca. 60–18 Ka = Stage 0; Table 1) (Photo 162 .... below No. 71 andon the left below No. 77). The Ice Age glacier has polished out the valley cross-profiles into a trough-shape. In accordance with the glacigenicabrasion roundings on the valley flanks up- and down-valley of the cross-profile and also with the upper limit of the preserved cover of groundmoraine reaching up to ca. 5400 m, the glacier trim-line ought to have run here about 6000 m a.s.l. The maximum past ice thickness down to therock ground of the valley bottom amounted to approx. 1400 m. The Ice Age glacier surface lay ca. 2200–2300 m above the synchronous HighGlacial ELA. Locality: Figure 3.
M. Kuhle228
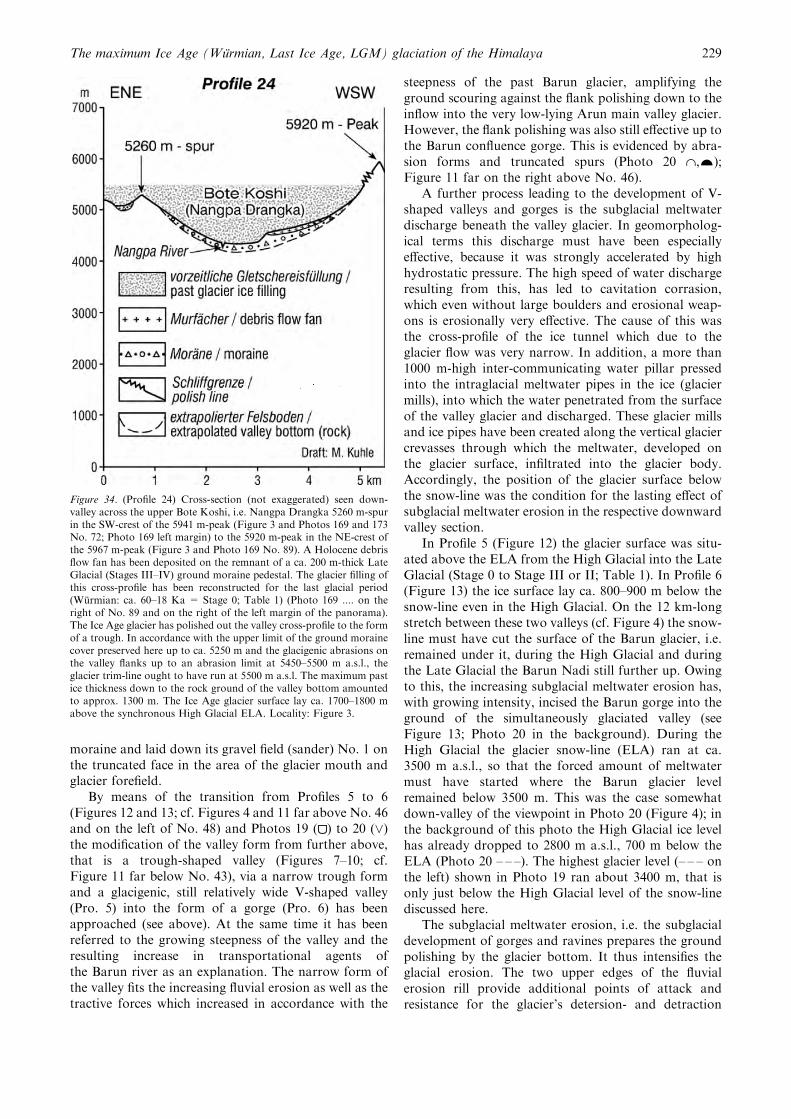
moraine and laid down its gravel field (sander) No. 1 onthe truncated face in the area of the glacier mouth andglacier forefield.
By means of the transition from Profiles 5 to 6(Figures 12 and 13; cf. Figures 4 and 11 far above No. 46and on the left of No. 48) and Photos 19 ( ) to 20 (_)the modification of the valley form from further above,that is a trough-shaped valley (Figures 7–10; cf.Figure 11 far below No. 43), via a narrow trough formand a glacigenic, still relatively wide V-shaped valley(Pro. 5) into the form of a gorge (Pro. 6) has beenapproached (see above). At the same time it has beenreferred to the growing steepness of the valley and theresulting increase in transportational agents ofthe Barun river as an explanation. The narrow form ofthe valley fits the increasing fluvial erosion as well as thetractive forces which increased in accordance with the
steepness of the past Barun glacier, amplifying theground scouring against the flank polishing down to theinflow into the very low-lying Arun main valley glacier.However, the flank polishing was also still effective up tothe Barun confluence gorge. This is evidenced by abra-sion forms and truncated spurs (Photo 20 ˙,…);Figure 11 far on the right above No. 46).
A further process leading to the development of V-shaped valleys and gorges is the subglacial meltwaterdischarge beneath the valley glacier. In geomorpholog-ical terms this discharge must have been especiallyeffective, because it was strongly accelerated by highhydrostatic pressure. The high speed of water dischargeresulting from this, has led to cavitation corrasion,which even without large boulders and erosional weap-ons is erosionally very effective. The cause of this wasthe cross-profile of the ice tunnel which due to theglacier flow was very narrow. In addition, a more than1000 m-high inter-communicating water pillar pressedinto the intraglacial meltwater pipes in the ice (glaciermills), into which the water penetrated from the surfaceof the valley glacier and discharged. These glacier millsand ice pipes have been created along the vertical glaciercrevasses through which the meltwater, developed onthe glacier surface, infiltrated into the glacier body.Accordingly, the position of the glacier surface belowthe snow-line was the condition for the lasting effect ofsubglacial meltwater erosion in the respective downwardvalley section.
In Profile 5 (Figure 12) the glacier surface was situ-ated above the ELA from the High Glacial into the LateGlacial (Stage 0 to Stage III or II; Table 1). In Profile 6(Figure 13) the ice surface lay ca. 800–900 m below thesnow-line even in the High Glacial. On the 12 km-longstretch between these two valleys (cf. Figure 4) the snow-line must have cut the surface of the Barun glacier, i.e.remained under it, during the High Glacial and duringthe Late Glacial the Barun Nadi still further up. Owingto this, the increasing subglacial meltwater erosion has,with growing intensity, incised the Barun gorge into theground of the simultaneously glaciated valley (seeFigure 13; Photo 20 in the background). During theHigh Glacial the glacier snow-line (ELA) ran at ca.3500 m a.s.l., so that the forced amount of meltwatermust have started where the Barun glacier levelremained below 3500 m. This was the case somewhatdown-valley of the viewpoint in Photo 20 (Figure 4); inthe background of this photo the High Glacial ice levelhas already dropped to 2800 m a.s.l., 700 m below theELA (Photo 20 – – –). The highest glacier level (– – – onthe left) shown in Photo 19 ran about 3400 m, that isonly just below the High Glacial level of the snow-linediscussed here.
The subglacial meltwater erosion, i.e. the subglacialdevelopment of gorges and ravines prepares the groundpolishing by the glacier bottom. It thus intensifies theglacial erosion. The two upper edges of the fluvialerosion rill provide additional points of attack andresistance for the glacier’s detersion- and detraction
Figure 34. (Profile 24) Cross-section (not exaggerated) seen down-valley across the upper Bote Koshi, i.e. Nangpa Drangka 5260 m-spurin the SW-crest of the 5941 m-peak (Figure 3 and Photos 169 and 173No. 72; Photo 169 left margin) to the 5920 m-peak in the NE-crest ofthe 5967 m-peak (Figure 3 and Photo 169 No. 89). A Holocene debrisflow fan has been deposited on the remnant of a ca. 200 m-thick LateGlacial (Stages III–IV) ground moraine pedestal. The glacier filling ofthis cross-profile has been reconstructed for the last glacial period(Wurmian: ca. 60–18 Ka = Stage 0; Table 1) (Photo 169 .... on theright of No. 89 and on the right of the left margin of the panorama).The Ice Age glacier has polished out the valley cross-profile to the formof a trough. In accordance with the upper limit of the ground morainecover preserved here up to ca. 5250 m and the glacigenic abrasions onthe valley flanks up to an abrasion limit at 5450–5500 m a.s.l., theglacier trim-line ought to have run at 5500 m a.s.l. The maximum pastice thickness down to the rock ground of the valley bottom amountedto approx. 1300 m. The Ice Age glacier surface lay ca. 1700–1800 mabove the synchronous High Glacial ELA. Locality: Figure 3.
The maximum Ice Age (Wurmian, Last Ice Age, LGM) glaciation of the Himalaya 229
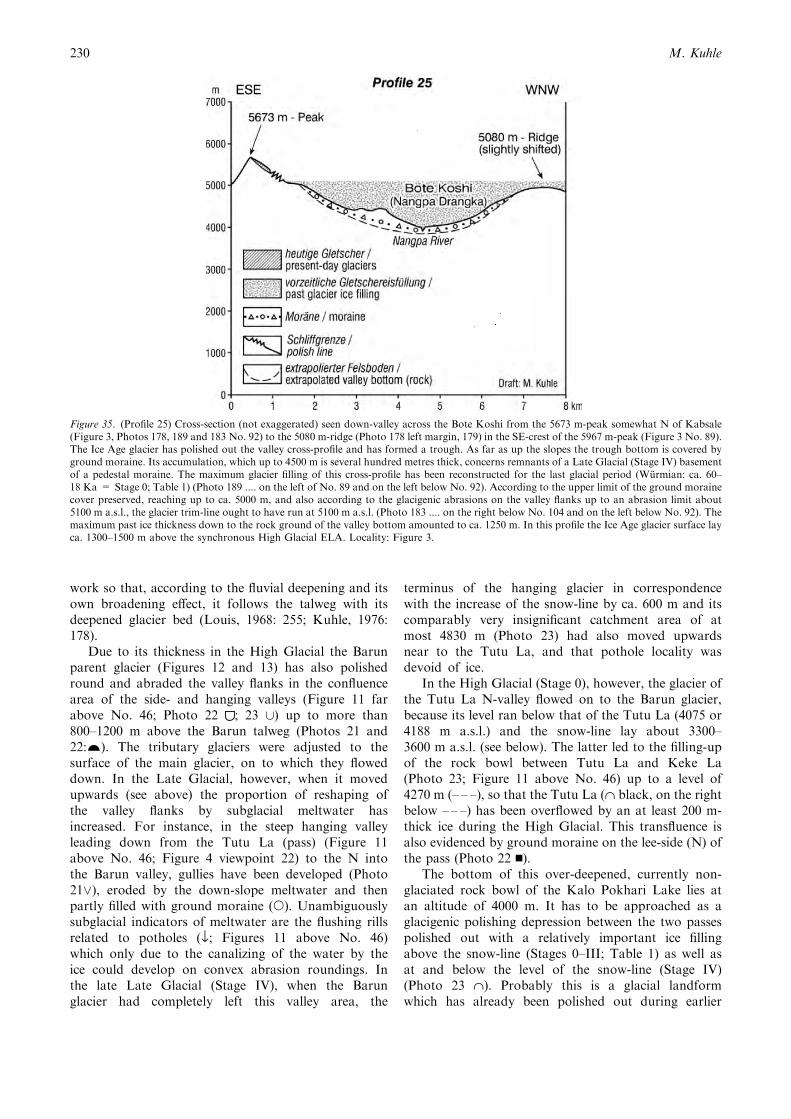
work so that, according to the fluvial deepening and itsown broadening effect, it follows the talweg with itsdeepened glacier bed (Louis, 1968: 255; Kuhle, 1976:178).
Due to its thickness in the High Glacial the Barunparent glacier (Figures 12 and 13) has also polishedround and abraded the valley flanks in the confluencearea of the side- and hanging valleys (Figure 11 farabove No. 46; Photo 22 ; 23 [) up to more than800–1200 m above the Barun talweg (Photos 21 and22:…). The tributary glaciers were adjusted to thesurface of the main glacier, on to which they floweddown. In the Late Glacial, however, when it movedupwards (see above) the proportion of reshaping ofthe valley flanks by subglacial meltwater hasincreased. For instance, in the steep hanging valleyleading down from the Tutu La (pass) (Figure 11above No. 46; Figure 4 viewpoint 22) to the N intothe Barun valley, gullies have been developed (Photo21_), eroded by the down-slope meltwater and thenpartly filled with ground moraine (s). Unambiguouslysubglacial indicators of meltwater are the flushing rillsrelated to potholes (fl; Figures 11 above No. 46)which only due to the canalizing of the water by theice could develop on convex abrasion roundings. Inthe late Late Glacial (Stage IV), when the Barunglacier had completely left this valley area, the
terminus of the hanging glacier in correspondencewith the increase of the snow-line by ca. 600 m and itscomparably very insignificant catchment area of atmost 4830 m (Photo 23) had also moved upwardsnear to the Tutu La, and that pothole locality wasdevoid of ice.
In the High Glacial (Stage 0), however, the glacier ofthe Tutu La N-valley flowed on to the Barun glacier,because its level ran below that of the Tutu La (4075 or4188 m a.s.l.) and the snow-line lay about 3300–3600 m a.s.l. (see below). The latter led to the filling-upof the rock bowl between Tutu La and Keke La(Photo 23; Figure 11 above No. 46) up to a level of4270 m (– – –), so that the Tutu La (˙ black, on the rightbelow – – –) has been overflowed by an at least 200 m-thick ice during the High Glacial. This transfluence isalso evidenced by ground moraine on the lee-side (N) ofthe pass (Photo 22 n).
The bottom of this over-deepened, currently non-glaciated rock bowl of the Kalo Pokhari Lake lies atan altitude of 4000 m. It has to be approached as aglacigenic polishing depression between the two passespolished out with a relatively important ice fillingabove the snow-line (Stages 0–III; Table 1) as well asat and below the level of the snow-line (Stage IV)(Photo 23 ˙). Probably this is a glacial landformwhich has already been polished out during earlier
Figure 35. (Profile 25) Cross-section (not exaggerated) seen down-valley across the Bote Koshi from the 5673 m-peak somewhat N of Kabsale(Figure 3, Photos 178, 189 and 183 No. 92) to the 5080 m-ridge (Photo 178 left margin, 179) in the SE-crest of the 5967 m-peak (Figure 3 No. 89).The Ice Age glacier has polished out the valley cross-profile and has formed a trough. As far as up the slopes the trough bottom is covered byground moraine. Its accumulation, which up to 4500 m is several hundred metres thick, concerns remnants of a Late Glacial (Stage IV) basementof a pedestal moraine. The maximum glacier filling of this cross-profile has been reconstructed for the last glacial period (Wurmian: ca. 60–18 Ka = Stage 0; Table 1) (Photo 189 .... on the left of No. 89 and on the left below No. 92). According to the upper limit of the ground morainecover preserved, reaching up to ca. 5000 m, and also according to the glacigenic abrasions on the valley flanks up to an abrasion limit about5100 m a.s.l., the glacier trim-line ought to have run at 5100 m a.s.l. (Photo 183 .... on the right below No. 104 and on the left below No. 92). Themaximum past ice thickness down to the rock ground of the valley bottom amounted to ca. 1250 m. In this profile the Ice Age glacier surface layca. 1300–1500 m above the synchronous High Glacial ELA. Locality: Figure 3.
M. Kuhle230
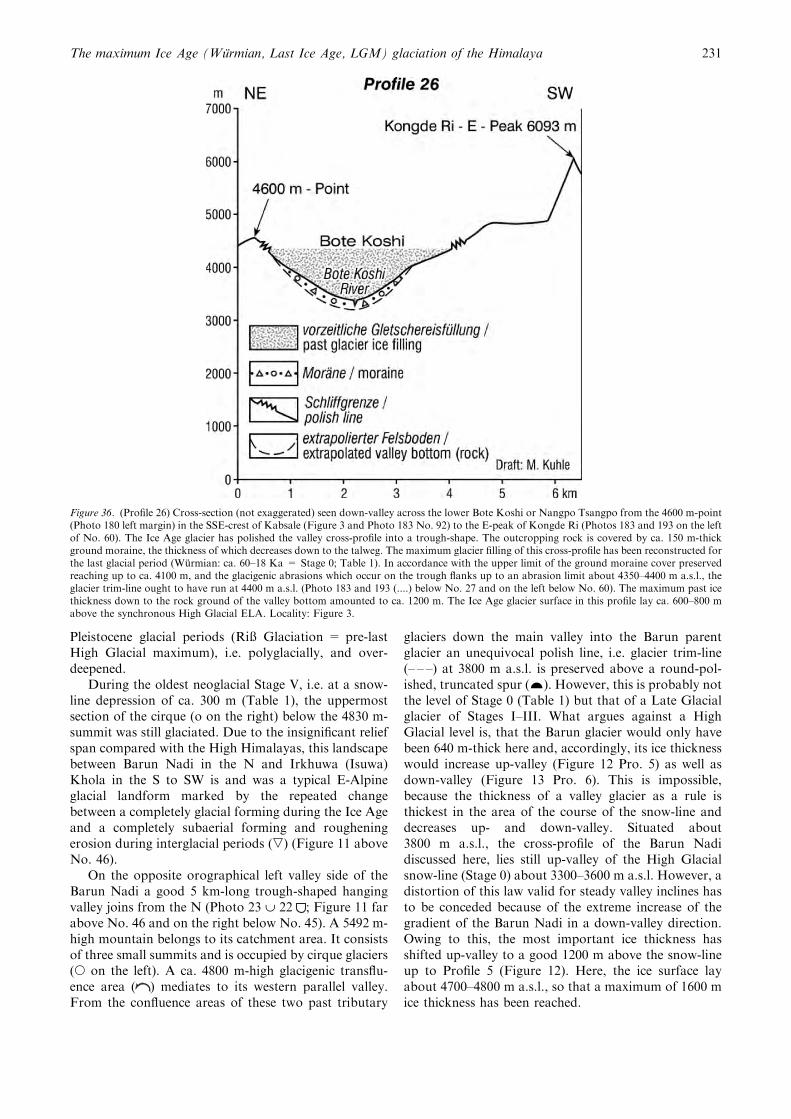
Pleistocene glacial periods (Riß Glaciation = pre-lastHigh Glacial maximum), i.e. polyglacially, and over-deepened.
During the oldest neoglacial Stage V, i.e. at a snow-line depression of ca. 300 m (Table 1), the uppermostsection of the cirque (o on the right) below the 4830 m-summit was still glaciated. Due to the insignificant reliefspan compared with the High Himalayas, this landscapebetween Barun Nadi in the N and Irkhuwa (Isuwa)Khola in the S to SW is and was a typical E-Alpineglacial landform marked by the repeated changebetween a completely glacial forming during the Ice Ageand a completely subaerial forming and rougheningerosion during interglacial periods (,) (Figure 11 aboveNo. 46).
On the opposite orographical left valley side of theBarun Nadi a good 5 km-long trough-shaped hangingvalley joins from the N (Photo 23 ¨ 22 ; Figure 11 farabove No. 46 and on the right below No. 45). A 5492 m-high mountain belongs to its catchment area. It consistsof three small summits and is occupied by cirque glaciers(s on the left). A ca. 4800 m-high glacigenic transflu-ence area ( ) mediates to its western parallel valley.From the confluence areas of these two past tributary
glaciers down the main valley into the Barun parentglacier an unequivocal polish line, i.e. glacier trim-line(– – –) at 3800 m a.s.l. is preserved above a round-pol-ished, truncated spur (…). However, this is probably notthe level of Stage 0 (Table 1) but that of a Late Glacialglacier of Stages I–III. What argues against a HighGlacial level is, that the Barun glacier would only havebeen 640 m-thick here and, accordingly, its ice thicknesswould increase up-valley (Figure 12 Pro. 5) as well asdown-valley (Figure 13 Pro. 6). This is impossible,because the thickness of a valley glacier as a rule isthickest in the area of the course of the snow-line anddecreases up- and down-valley. Situated about3800 m a.s.l., the cross-profile of the Barun Nadidiscussed here, lies still up-valley of the High Glacialsnow-line (Stage 0) about 3300–3600 m a.s.l. However, adistortion of this law valid for steady valley inclines hasto be conceded because of the extreme increase of thegradient of the Barun Nadi in a down-valley direction.Owing to this, the most important ice thickness hasshifted up-valley to a good 1200 m above the snow-lineup to Profile 5 (Figure 12). Here, the ice surface layabout 4700–4800 m a.s.l., so that a maximum of 1600 mice thickness has been reached.
Figure 36. (Profile 26) Cross-section (not exaggerated) seen down-valley across the lower Bote Koshi or Nangpo Tsangpo from the 4600 m-point(Photo 180 left margin) in the SSE-crest of Kabsale (Figure 3 and Photo 183 No. 92) to the E-peak of Kongde Ri (Photos 183 and 193 on the leftof No. 60). The Ice Age glacier has polished the valley cross-profile into a trough-shape. The outcropping rock is covered by ca. 150 m-thickground moraine, the thickness of which decreases down to the talweg. The maximum glacier filling of this cross-profile has been reconstructed forthe last glacial period (Wurmian: ca. 60–18 Ka = Stage 0; Table 1). In accordance with the upper limit of the ground moraine cover preservedreaching up to ca. 4100 m, and the glacigenic abrasions which occur on the trough flanks up to an abrasion limit about 4350–4400 m a.s.l., theglacier trim-line ought to have run at 4400 m a.s.l. (Photo 183 and 193 (....) below No. 27 and on the left below No. 60). The maximum past icethickness down to the rock ground of the valley bottom amounted to ca. 1200 m. The Ice Age glacier surface in this profile lay ca. 600–800 mabove the synchronous High Glacial ELA. Locality: Figure 3.
The maximum Ice Age (Wurmian, Last Ice Age, LGM) glaciation of the Himalaya 231
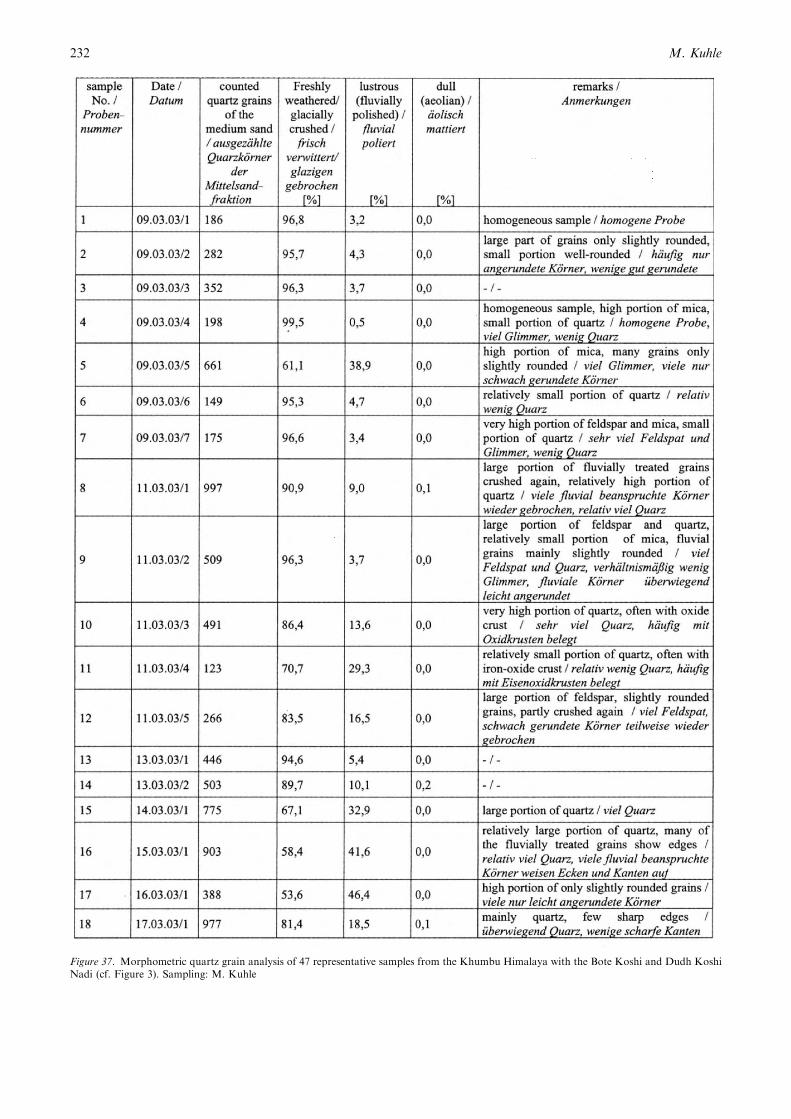
Figure 37. Morphometric quartz grain analysis of 47 representative samples from the Khumbu Himalaya with the Bote Koshi and Dudh KoshiNadi (cf. Figure 3). Sampling: M. Kuhle
M. Kuhle232
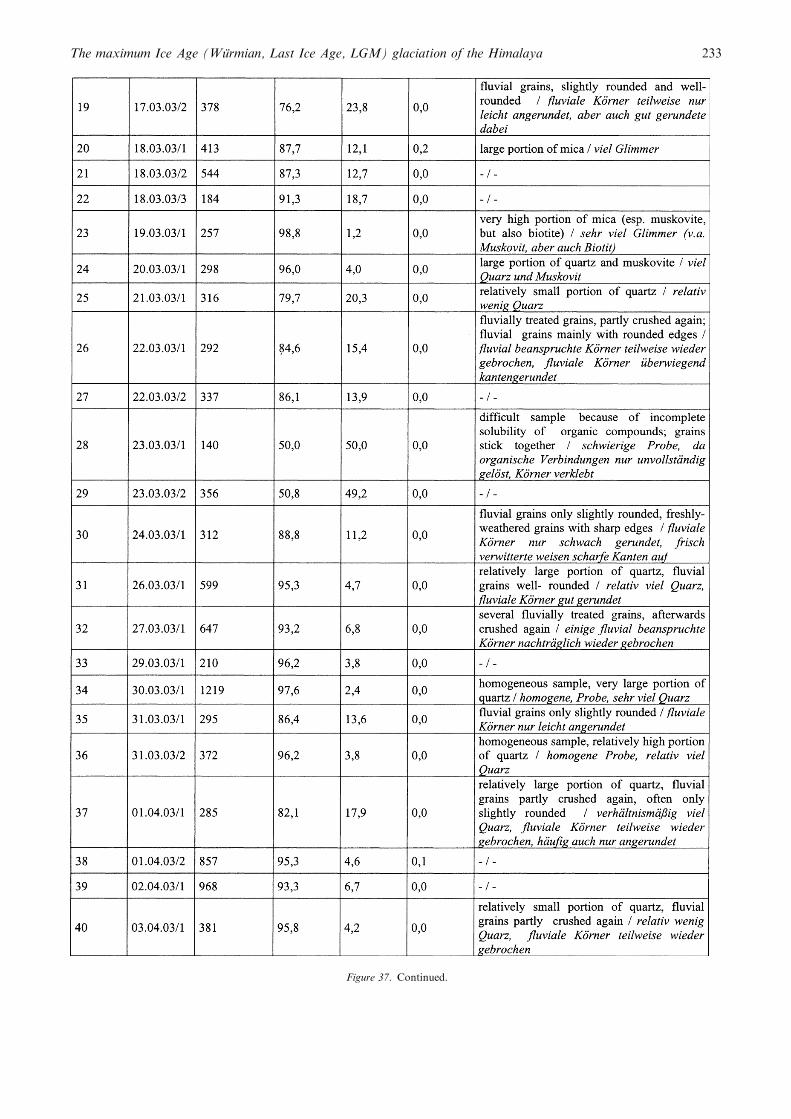
Figure 37. Continued.
The maximum Ice Age (Wurmian, Last Ice Age, LGM) glaciation of the Himalaya 233
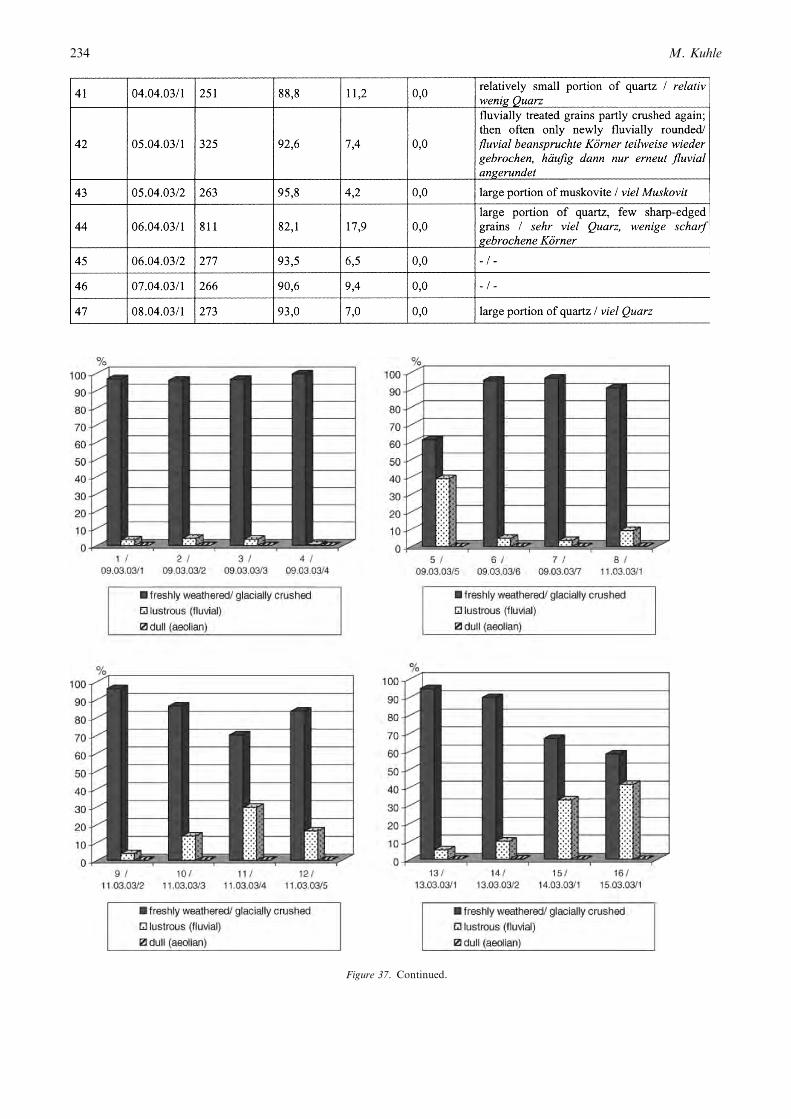
Figure 37. Continued.
M. Kuhle234
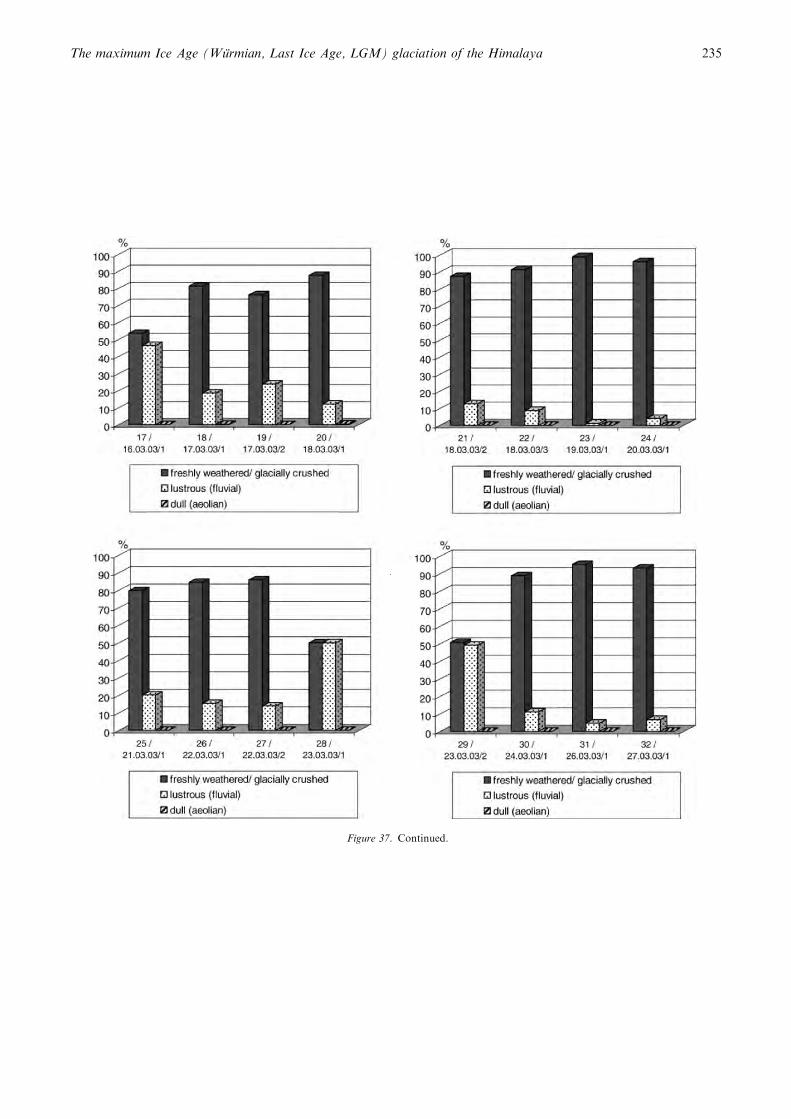
Figure 37. Continued.
The maximum Ice Age (Wurmian, Last Ice Age, LGM) glaciation of the Himalaya 235
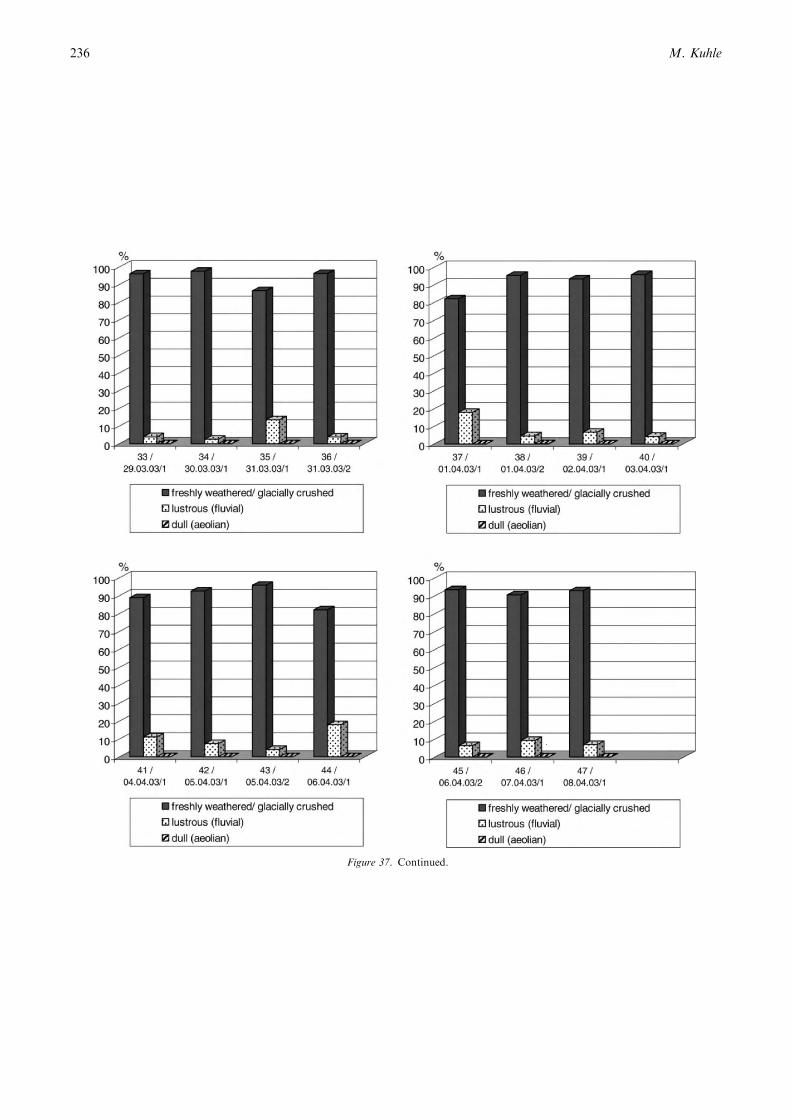
Figure 37. Continued.
M. Kuhle236
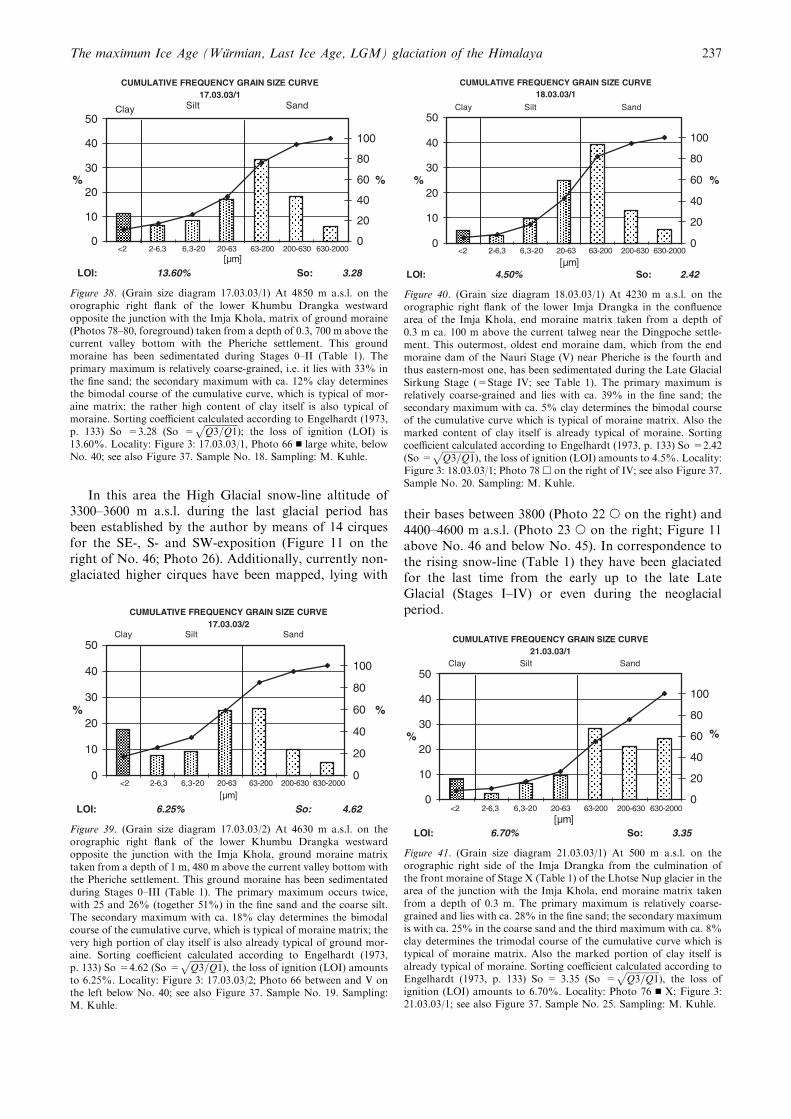
In this area the High Glacial snow-line altitude of3300–3600 m a.s.l. during the last glacial period hasbeen established by the author by means of 14 cirquesfor the SE-, S- and SW-exposition (Figure 11 on theright of No. 46; Photo 26). Additionally, currently non-glaciated higher cirques have been mapped, lying with
their bases between 3800 (Photo 22 s on the right) and4400–4600 m a.s.l. (Photo 23 s on the right; Figure 11above No. 46 and below No. 45). In correspondence tothe rising snow-line (Table 1) they have been glaciatedfor the last time from the early up to the late LateGlacial (Stages I–IV) or even during the neoglacialperiod.
LOI: 13.60% So: 3.28
CUMULATIVE FREQUENCY GRAIN SIZE CURVE17.03.03/1
0
10
20
30
40
50
<2 2-6,3 6,3-20 20-63 63-200 200-630 630-2000[µm]
%
0
20
40
60
80
100
Clay Silt Sand
%
Figure 38. (Grain size diagram 17.03.03/1) At 4850 m a.s.l. on theorographic right flank of the lower Khumbu Drangka westwardopposite the junction with the Imja Khola, matrix of ground moraine(Photos 78–80, foreground) taken from a depth of 0.3, 700 m above thecurrent valley bottom with the Pheriche settlement. This groundmoraine has been sedimentated during Stages 0–II (Table 1). Theprimary maximum is relatively coarse-grained, i.e. it lies with 33% inthe fine sand; the secondary maximum with ca. 12% clay determinesthe bimodal course of the cumulative curve, which is typical of mor-aine matrix; the rather high content of clay itself is also typical ofmoraine. Sorting coefficient calculated according to Engelhardt (1973,p. 133) So =3.28 (So =
ffiffiffiffiffiffiffiffiffiffiffiffiffiffiffiQ3=Q1
p); the loss of ignition (LOI) is
13.60%. Locality: Figure 3: 17.03.03/1, Photo 66 n large white, belowNo. 40; see also Figure 37. Sample No. 18. Sampling: M. Kuhle.
LOI: 6.25% So: 4.62
CUMULATIVE FREQUENCY GRAIN SIZE CURVE17.03.03/2
0
10
20
30
40
50
<2 2-6,3 6,3-20 20-63 63-200 200-630 630-2000
[µm]
%
0
20
40
60
80
100
Clay Silt Sand
%
Figure 39. (Grain size diagram 17.03.03/2) At 4630 m a.s.l. on theorographic right flank of the lower Khumbu Drangka westwardopposite the junction with the Imja Khola, ground moraine matrixtaken from a depth of 1 m, 480 m above the current valley bottom withthe Pheriche settlement. This ground moraine has been sedimentatedduring Stages 0–III (Table 1). The primary maximum occurs twice,with 25 and 26% (together 51%) in the fine sand and the coarse silt.The secondary maximum with ca. 18% clay determines the bimodalcourse of the cumulative curve, which is typical of moraine matrix; thevery high portion of clay itself is also already typical of ground mor-aine. Sorting coefficient calculated according to Engelhardt (1973,p. 133) So =4.62 (So =
ffiffiffiffiffiffiffiffiffiffiffiffiffiffiffiQ3=Q1
p), the loss of ignition (LOI) amounts
to 6.25%. Locality: Figure 3: 17.03.03/2; Photo 66 between and V onthe left below No. 40; see also Figure 37. Sample No. 19. Sampling:M. Kuhle.
LOI: 4.50% So: 2.42
CUMULATIVE FREQUENCY GRAIN SIZE CURVE18.03.03/1
0
10
20
30
40
50
<2 2-6,3 6,3-20 20-63 63-200 200-630 630-2000
[µm]
%
0
20
40
60
80
100
Clay Silt Sand
%
Figure 40. (Grain size diagram 18.03.03/1) At 4230 m a.s.l. on theorographic right flank of the lower Imja Drangka in the confluencearea of the Imja Khola, end moraine matrix taken from a depth of0.3 m ca. 100 m above the current talweg near the Dingpoche settle-ment. This outermost, oldest end moraine dam, which from the endmoraine dam of the Nauri Stage (V) near Pheriche is the fourth andthus eastern-most one, has been sedimentated during the Late GlacialSirkung Stage (=Stage IV; see Table 1). The primary maximum isrelatively coarse-grained and lies with ca. 39% in the fine sand; thesecondary maximum with ca. 5% clay determines the bimodal courseof the cumulative curve which is typical of moraine matrix. Also themarked content of clay itself is already typical of moraine. Sortingcoefficient calculated according to Engelhardt (1973, p. 133) So =2.42(So =
ffiffiffiffiffiffiffiffiffiffiffiffiffiffiffiQ3=Q1
p), the loss of ignition (LOI) amounts to 4.5%. Locality:
Figure 3: 18.03.03/1; Photo 78 h on the right of IV; see also Figure 37.Sample No. 20. Sampling: M. Kuhle.
LOI: 6.70% So: 3.35
CUMULATIVE FREQUENCY GRAIN SIZE CURVE21.03.03/1
0
10
20
30
40
50
<2 2-6,3 6,3-20 20-63 63-200 200-630 630-2000
[µm]
%
0
20
40
60
80
100
Clay Silt Sand
%
Figure 41. (Grain size diagram 21.03.03/1) At 500 m a.s.l. on theorographic right side of the Imja Drangka from the culmination ofthe front moraine of Stage X (Table 1) of the Lhotse Nup glacier in thearea of the junction with the Imja Khola, end moraine matrix takenfrom a depth of 0.3 m. The primary maximum is relatively coarse-grained and lies with ca. 28% in the fine sand; the secondary maximumis with ca. 25% in the coarse sand and the third maximum with ca. 8%clay determines the trimodal course of the cumulative curve which istypical of moraine matrix. Also the marked portion of clay itself isalready typical of moraine. Sorting coefficient calculated according toEngelhardt (1973, p. 133) So = 3.35 (So =
ffiffiffiffiffiffiffiffiffiffiffiffiffiffiffiQ3=Q1
p), the loss of
ignition (LOI) amounts to 6.70%. Locality: Photo 76 n X; Figure 3:21.03.03/1; see also Figure 37. Sample No. 25. Sampling: M. Kuhle.
The maximum Ice Age (Wurmian, Last Ice Age, LGM) glaciation of the Himalaya 237
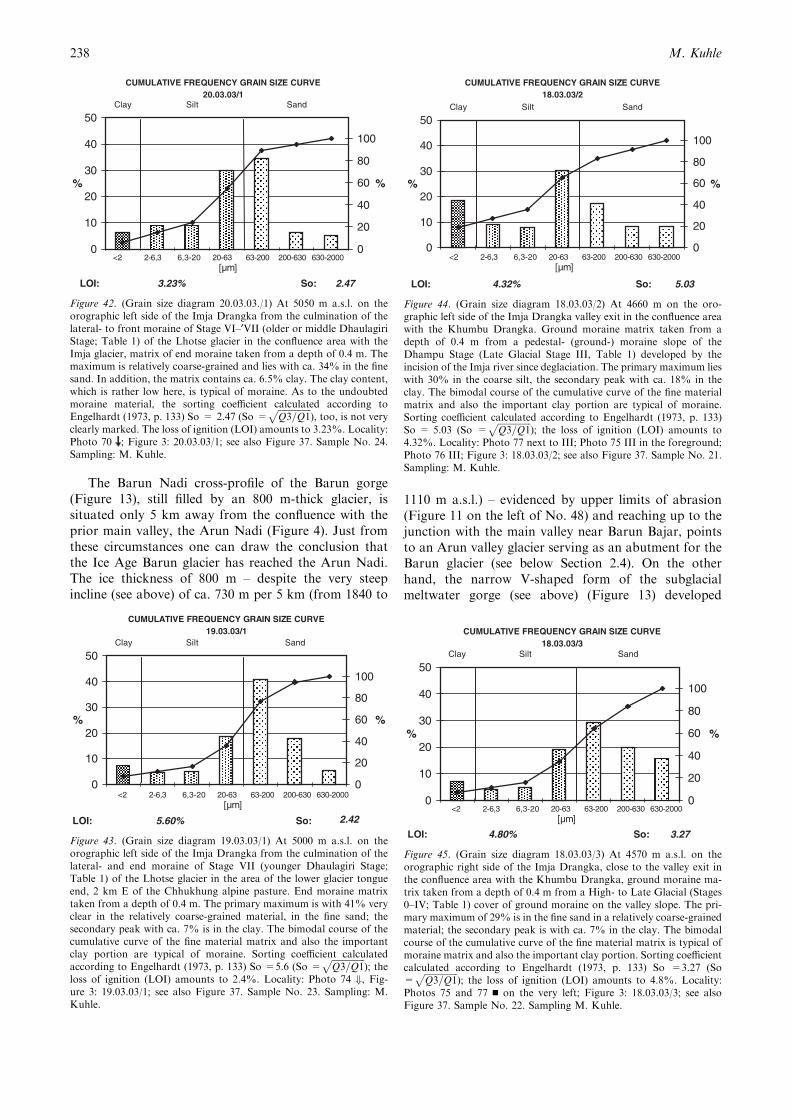
The Barun Nadi cross-profile of the Barun gorge(Figure 13), still filled by an 800 m-thick glacier, issituated only 5 km away from the confluence with theprior main valley, the Arun Nadi (Figure 4). Just fromthese circumstances one can draw the conclusion thatthe Ice Age Barun glacier has reached the Arun Nadi.The ice thickness of 800 m – despite the very steepincline (see above) of ca. 730 m per 5 km (from 1840 to
1110 m a.s.l.) – evidenced by upper limits of abrasion(Figure 11 on the left of No. 48) and reaching up to thejunction with the main valley near Barun Bajar, pointsto an Arun valley glacier serving as an abutment for theBarun glacier (see below Section 2.4). On the otherhand, the narrow V-shaped form of the subglacialmeltwater gorge (see above) (Figure 13) developed
LOI: 3.23% So: 2.47
CUMULATIVE FREQUENCY GRAIN SIZE CURVE20.03.03/1
0
10
20
30
40
50
%
0
20
40
60
80
100
Clay Silt Sand
%
<2 2-6,3 6,3-20 20-63 63-200 200-630 630-2000[µm]
Figure 42. (Grain size diagram 20.03.03./1) At 5050 m a.s.l. on theorographic left side of the Imja Drangka from the culmination of thelateral- to front moraine of Stage VI–¢VII (older or middle DhaulagiriStage; Table 1) of the Lhotse glacier in the confluence area with theImja glacier, matrix of end moraine taken from a depth of 0.4 m. Themaximum is relatively coarse-grained and lies with ca. 34% in the finesand. In addition, the matrix contains ca. 6.5% clay. The clay content,which is rather low here, is typical of moraine. As to the undoubtedmoraine material, the sorting coefficient calculated according toEngelhardt (1973, p. 133) So = 2.47 (So =
ffiffiffiffiffiffiffiffiffiffiffiffiffiffiffiQ3=Q1
p), too, is not very
clearly marked. The loss of ignition (LOI) amounts to 3.23%. Locality:Photo 70 ; Figure 3: 20.03.03/1; see also Figure 37. Sample No. 24.Sampling: M. Kuhle.
LOI: 5.60% So: 2.42
CUMULATIVE FREQUENCY GRAIN SIZE CURVE19.03.03/1
0
10
20
30
40
50
%
0
20
40
60
80
100
Clay Silt Sand
%
<2 2-6,3 6,3-20 20-63 63-200 200-630 630-2000[µm]
Figure 43. (Grain size diagram 19.03.03/1) At 5000 m a.s.l. on theorographic left side of the Imja Drangka from the culmination of thelateral- and end moraine of Stage VII (younger Dhaulagiri Stage;Table 1) of the Lhotse glacier in the area of the lower glacier tongueend, 2 km E of the Chhukhung alpine pasture. End moraine matrixtaken from a depth of 0.4 m. The primary maximum is with 41% veryclear in the relatively coarse-grained material, in the fine sand; thesecondary peak with ca. 7% is in the clay. The bimodal course of thecumulative curve of the fine material matrix and also the importantclay portion are typical of moraine. Sorting coefficient calculatedaccording to Engelhardt (1973, p. 133) So =5.6 (So =
ffiffiffiffiffiffiffiffiffiffiffiffiffiffiffiQ3=Q1
p); the
loss of ignition (LOI) amounts to 2.4%. Locality: Photo 74 +, Fig-ure 3: 19.03.03/1; see also Figure 37. Sample No. 23. Sampling: M.Kuhle.
LOI: 4.32% So: 5.03
CUMULATIVE FREQUENCY GRAIN SIZE CURVE18.03.03/2
0
10
20
30
40
50
%
0
20
40
60
80
100
Clay Silt Sand
%
<2 2-6,3 6,3-20 20-63 63-200 200-630 630-2000[µm]
Figure 44. (Grain size diagram 18.03.03/2) At 4660 m on the oro-graphic left side of the Imja Drangka valley exit in the confluence areawith the Khumbu Drangka. Ground moraine matrix taken from adepth of 0.4 m from a pedestal- (ground-) moraine slope of theDhampu Stage (Late Glacial Stage III, Table 1) developed by theincision of the Imja river since deglaciation. The primary maximum lieswith 30% in the coarse silt, the secondary peak with ca. 18% in theclay. The bimodal course of the cumulative curve of the fine materialmatrix and also the important clay portion are typical of moraine.Sorting coefficient calculated according to Engelhardt (1973, p. 133)So = 5.03 (So =
ffiffiffiffiffiffiffiffiffiffiffiffiffiffiffiQ3=Q1
p); the loss of ignition (LOI) amounts to
4.32%. Locality: Photo 77 next to III; Photo 75 III in the foreground;Photo 76 III; Figure 3: 18.03.03/2; see also Figure 37. Sample No. 21.Sampling: M. Kuhle.
LOI: 4.80% So: 3.27
CUMULATIVE FREQUENCY GRAIN SIZE CURVE18.03.03/3
0
10
20
30
40
50
%
0
20
40
60
80
100
Clay Silt Sand
%
<2 2-6,3 6,3-20 20-63 63-200 200-630 630-2000[µm]
Figure 45. (Grain size diagram 18.03.03/3) At 4570 m a.s.l. on theorographic right side of the Imja Drangka, close to the valley exit inthe confluence area with the Khumbu Drangka, ground moraine ma-trix taken from a depth of 0.4 m from a High- to Late Glacial (Stages0–IV; Table 1) cover of ground moraine on the valley slope. The pri-mary maximum of 29% is in the fine sand in a relatively coarse-grainedmaterial; the secondary peak is with ca. 7% in the clay. The bimodalcourse of the cumulative curve of the fine material matrix is typical ofmoraine matrix and also the important clay portion. Sorting coefficientcalculated according to Engelhardt (1973, p. 133) So =3.27 (So=
ffiffiffiffiffiffiffiffiffiffiffiffiffiffiffiQ3=Q1
p); the loss of ignition (LOI) amounts to 4.8%. Locality:
Photos 75 and 77 n on the very left; Figure 3: 18.03.03/3; see alsoFigure 37. Sample No. 22. Sampling M. Kuhle.
M. Kuhle238
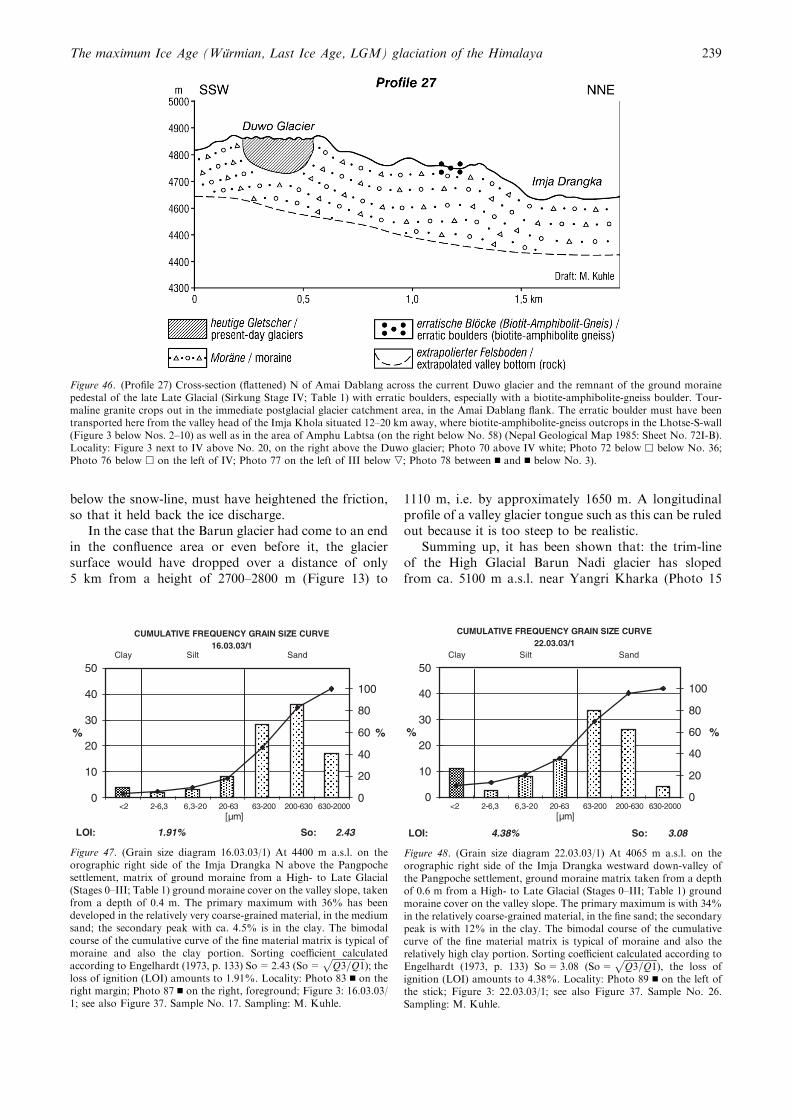
below the snow-line, must have heightened the friction,so that it held back the ice discharge.
In the case that the Barun glacier had come to an endin the confluence area or even before it, the glaciersurface would have dropped over a distance of only5 km from a height of 2700–2800 m (Figure 13) to
1110 m, i.e. by approximately 1650 m. A longitudinalprofile of a valley glacier tongue such as this can be ruledout because it is too steep to be realistic.
Summing up, it has been shown that: the trim-lineof the High Glacial Barun Nadi glacier has slopedfrom ca. 5100 m a.s.l. near Yangri Kharka (Photo 15
Figure 46. (Profile 27) Cross-section (flattened) N of Amai Dablang across the current Duwo glacier and the remnant of the ground morainepedestal of the late Late Glacial (Sirkung Stage IV; Table 1) with erratic boulders, especially with a biotite-amphibolite-gneiss boulder. Tour-maline granite crops out in the immediate postglacial glacier catchment area, in the Amai Dablang flank. The erratic boulder must have beentransported here from the valley head of the Imja Khola situated 12–20 km away, where biotite-amphibolite-gneiss outcrops in the Lhotse-S-wall(Figure 3 below Nos. 2–10) as well as in the area of Amphu Labtsa (on the right below No. 58) (Nepal Geological Map 1985: Sheet No. 72I-B).Locality: Figure 3 next to IV above No. 20, on the right above the Duwo glacier; Photo 70 above IV white; Photo 72 below h below No. 36;Photo 76 below h on the left of IV; Photo 77 on the left of III below ,; Photo 78 between n and n below No. 3).
LOI: 1.91% So: 2.43
CUMULATIVE FREQUENCY GRAIN SIZE CURVE16.03.03/1
0
10
20
30
40
50
%
0
20
40
60
80
100
Clay Silt Sand
%
<2 2-6,3 6,3-20 20-63 63-200 200-630 630-2000[µm]
Figure 47. (Grain size diagram 16.03.03/1) At 4400 m a.s.l. on theorographic right side of the Imja Drangka N above the Pangpochesettlement, matrix of ground moraine from a High- to Late Glacial(Stages 0–III; Table 1) ground moraine cover on the valley slope, takenfrom a depth of 0.4 m. The primary maximum with 36% has beendeveloped in the relatively very coarse-grained material, in the mediumsand; the secondary peak with ca. 4.5% is in the clay. The bimodalcourse of the cumulative curve of the fine material matrix is typical ofmoraine and also the clay portion. Sorting coefficient calculatedaccording to Engelhardt (1973, p. 133) So=2.43 (So=
ffiffiffiffiffiffiffiffiffiffiffiffiffiffiffiQ3=Q1
p); the
loss of ignition (LOI) amounts to 1.91%. Locality: Photo 83 n on theright margin; Photo 87 n on the right, foreground; Figure 3: 16.03.03/1; see also Figure 37. Sample No. 17. Sampling: M. Kuhle.
LOI: 4.38% So: 3.08
CUMULATIVE FREQUENCY GRAIN SIZE CURVE22.03.03/1
0
10
20
30
40
50
%
0
20
40
60
80
100
Clay Silt Sand
%
<2 2-6,3 6,3-20 20-63 63-200 200-630 630-2000[µm]
Figure 48. (Grain size diagram 22.03.03/1) At 4065 m a.s.l. on theorographic right side of the Imja Drangka westward down-valley ofthe Pangpoche settlement, ground moraine matrix taken from a depthof 0.6 m from a High- to Late Glacial (Stages 0–III; Table 1) groundmoraine cover on the valley slope. The primary maximum is with 34%in the relatively coarse-grained material, in the fine sand; the secondarypeak is with 12% in the clay. The bimodal course of the cumulativecurve of the fine material matrix is typical of moraine and also therelatively high clay portion. Sorting coefficient calculated according toEngelhardt (1973, p. 133) So=3.08 (So=
ffiffiffiffiffiffiffiffiffiffiffiffiffiffiffiQ3=Q1
p), the loss of
ignition (LOI) amounts to 4.38%. Locality: Photo 89 n on the left ofthe stick; Figure 3: 22.03.03/1; see also Figure 37. Sample No. 26.Sampling: M. Kuhle.
The maximum Ice Age (Wurmian, Last Ice Age, LGM) glaciation of the Himalaya 239
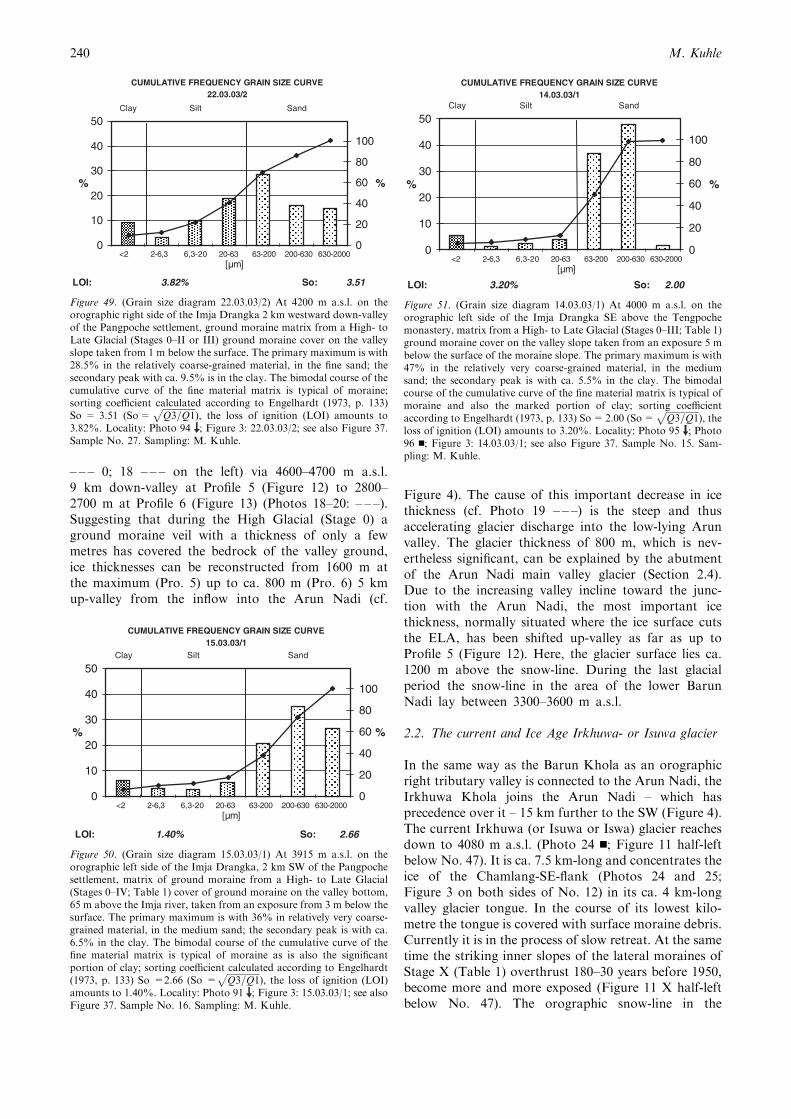
– – – 0; 18 – – – on the left) via 4600–4700 m a.s.l.9 km down-valley at Profile 5 (Figure 12) to 2800–2700 m at Profile 6 (Figure 13) (Photos 18–20: – – –).Suggesting that during the High Glacial (Stage 0) aground moraine veil with a thickness of only a fewmetres has covered the bedrock of the valley ground,ice thicknesses can be reconstructed from 1600 m atthe maximum (Pro. 5) up to ca. 800 m (Pro. 6) 5 kmup-valley from the inflow into the Arun Nadi (cf.
Figure 4). The cause of this important decrease in icethickness (cf. Photo 19 – – –) is the steep and thusaccelerating glacier discharge into the low-lying Arunvalley. The glacier thickness of 800 m, which is nev-ertheless significant, can be explained by the abutmentof the Arun Nadi main valley glacier (Section 2.4).Due to the increasing valley incline toward the junc-tion with the Arun Nadi, the most important icethickness, normally situated where the ice surface cutsthe ELA, has been shifted up-valley as far as up toProfile 5 (Figure 12). Here, the glacier surface lies ca.1200 m above the snow-line. During the last glacialperiod the snow-line in the area of the lower BarunNadi lay between 3300–3600 m a.s.l.
2.2. The current and Ice Age Irkhuwa- or Isuwa glacier
In the same way as the Barun Khola as an orographicright tributary valley is connected to the Arun Nadi, theIrkhuwa Khola joins the Arun Nadi – which hasprecedence over it – 15 km further to the SW (Figure 4).The current Irkhuwa (or Isuwa or Iswa) glacier reachesdown to 4080 m a.s.l. (Photo 24 n; Figure 11 half-leftbelow No. 47). It is ca. 7.5 km-long and concentrates theice of the Chamlang-SE-flank (Photos 24 and 25;Figure 3 on both sides of No. 12) in its ca. 4 km-longvalley glacier tongue. In the course of its lowest kilo-metre the tongue is covered with surface moraine debris.Currently it is in the process of slow retreat. At the sametime the striking inner slopes of the lateral moraines ofStage X (Table 1) overthrust 180–30 years before 1950,become more and more exposed (Figure 11 X half-leftbelow No. 47). The orographic snow-line in the
LOI: 3.82% So: 3.51
CUMULATIVE FREQUENCY GRAIN SIZE CURVE22.03.03/2
0
10
20
30
40
50
%
0
20
40
60
80
100
Clay Silt Sand
%
<2 2-6,3 6,3-20 20-63 63-200 200-630 630-2000[µm]
Figure 49. (Grain size diagram 22.03.03/2) At 4200 m a.s.l. on theorographic right side of the Imja Drangka 2 km westward down-valleyof the Pangpoche settlement, ground moraine matrix from a High- toLate Glacial (Stages 0–II or III) ground moraine cover on the valleyslope taken from 1 m below the surface. The primary maximum is with28.5% in the relatively coarse-grained material, in the fine sand; thesecondary peak with ca. 9.5% is in the clay. The bimodal course of thecumulative curve of the fine material matrix is typical of moraine;sorting coefficient calculated according to Engelhardt (1973, p. 133)So = 3.51 (So=
ffiffiffiffiffiffiffiffiffiffiffiffiffiffiffiQ3=Q1
p), the loss of ignition (LOI) amounts to
3.82%. Locality: Photo 94 ; Figure 3: 22.03.03/2; see also Figure 37.Sample No. 27. Sampling: M. Kuhle.
LOI: 1.40% So: 2.66
CUMULATIVE FREQUENCY GRAIN SIZE CURVE15.03.03/1
0
10
20
30
40
50
%
0
20
40
60
80
100
Clay Silt Sand
%
<2 2-6,3 6,3-20 20-63 63-200 200-630 630-2000[µm]
Figure 50. (Grain size diagram 15.03.03/1) At 3915 m a.s.l. on theorographic left side of the Imja Drangka, 2 km SW of the Pangpochesettlement, matrix of ground moraine from a High- to Late Glacial(Stages 0–IV; Table 1) cover of ground moraine on the valley bottom,65 m above the Imja river, taken from an exposure from 3 m below thesurface. The primary maximum is with 36% in relatively very coarse-grained material, in the medium sand; the secondary peak is with ca.6.5% in the clay. The bimodal course of the cumulative curve of thefine material matrix is typical of moraine as is also the significantportion of clay; sorting coefficient calculated according to Engelhardt(1973, p. 133) So =2.66 (So =
ffiffiffiffiffiffiffiffiffiffiffiffiffiffiffiQ3=Q1
p), the loss of ignition (LOI)
amounts to 1.40%. Locality: Photo 91 ; Figure 3: 15.03.03/1; see alsoFigure 37. Sample No. 16. Sampling: M. Kuhle.
LOI: 3.20% So: 2.00
CUMULATIVE FREQUENCY GRAIN SIZE CURVE14.03.03/1
0
10
20
30
40
50
%
0
20
40
60
80
100
Clay Silt Sand
%
<2 2-6,3 6,3-20 20-63 63-200 200-630 630-2000[µm]
Figure 51. (Grain size diagram 14.03.03/1) At 4000 m a.s.l. on theorographic left side of the Imja Drangka SE above the Tengpochemonastery, matrix from a High- to Late Glacial (Stages 0–III; Table 1)ground moraine cover on the valley slope taken from an exposure 5 mbelow the surface of the moraine slope. The primary maximum is with47% in the relatively very coarse-grained material, in the mediumsand; the secondary peak is with ca. 5.5% in the clay. The bimodalcourse of the cumulative curve of the fine material matrix is typical ofmoraine and also the marked portion of clay; sorting coefficientaccording to Engelhardt (1973, p. 133) So=2.00 (So=
ffiffiffiffiffiffiffiffiffiffiffiffiffiffiffiQ3=Q1
p), the
loss of ignition (LOI) amounts to 3.20%. Locality: Photo 95 ; Photo96 n; Figure 3: 14.03.03/1; see also Figure 37. Sample No. 15. Sam-pling: M. Kuhle.
M. Kuhle240
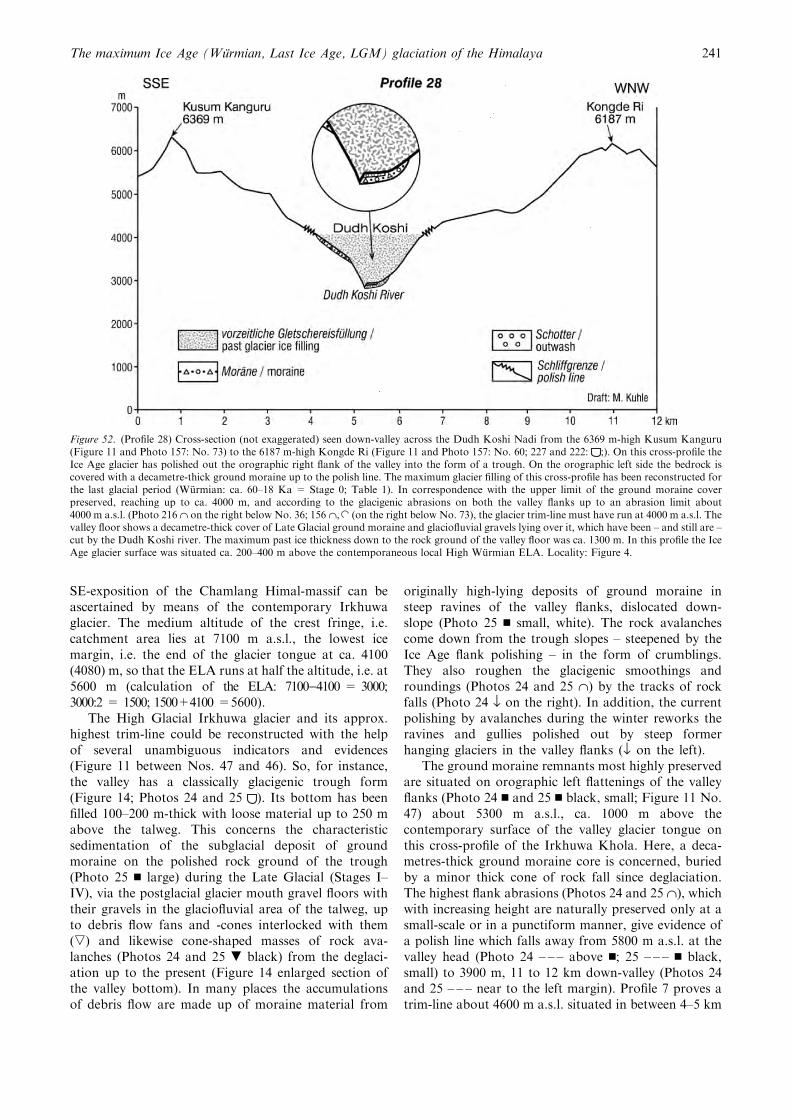
SE-exposition of the Chamlang Himal-massif can beascertained by means of the contemporary Irkhuwaglacier. The medium altitude of the crest fringe, i.e.catchment area lies at 7100 m a.s.l., the lowest icemargin, i.e. the end of the glacier tongue at ca. 4100(4080) m, so that the ELA runs at half the altitude, i.e. at5600 m (calculation of the ELA: 7100)4100 = 3000;3000:2 = 1500; 1500+4100 =5600).
The High Glacial Irkhuwa glacier and its approx.highest trim-line could be reconstructed with the helpof several unambiguous indicators and evidences(Figure 11 between Nos. 47 and 46). So, for instance,the valley has a classically glacigenic trough form(Figure 14; Photos 24 and 25 ). Its bottom has beenfilled 100–200 m-thick with loose material up to 250 mabove the talweg. This concerns the characteristicsedimentation of the subglacial deposit of groundmoraine on the polished rock ground of the trough(Photo 25 n large) during the Late Glacial (Stages I–IV), via the postglacial glacier mouth gravel floors withtheir gravels in the glaciofluvial area of the talweg, upto debris flow fans and -cones interlocked with them(,) and likewise cone-shaped masses of rock ava-lanches (Photos 24 and 25 . black) from the deglaci-ation up to the present (Figure 14 enlarged section ofthe valley bottom). In many places the accumulationsof debris flow are made up of moraine material from
originally high-lying deposits of ground moraine insteep ravines of the valley flanks, dislocated down-slope (Photo 25 n small, white). The rock avalanchescome down from the trough slopes – steepened by theIce Age flank polishing – in the form of crumblings.They also roughen the glacigenic smoothings androundings (Photos 24 and 25 ˙) by the tracks of rockfalls (Photo 24 fl on the right). In addition, the currentpolishing by avalanches during the winter reworks theravines and gullies polished out by steep formerhanging glaciers in the valley flanks (fl on the left).
The ground moraine remnants most highly preservedare situated on orographic left flattenings of the valleyflanks (Photo 24 n and 25 n black, small; Figure 11 No.47) about 5300 m a.s.l., ca. 1000 m above thecontemporary surface of the valley glacier tongue onthis cross-profile of the Irkhuwa Khola. Here, a deca-metres-thick ground moraine core is concerned, buriedby a minor thick cone of rock fall since deglaciation.The highest flank abrasions (Photos 24 and 25 ˙), whichwith increasing height are naturally preserved only at asmall-scale or in a punctiform manner, give evidence ofa polish line which falls away from 5800 m a.s.l. at thevalley head (Photo 24 – – – above n; 25 – – – n black,small) to 3900 m, 11 to 12 km down-valley (Photos 24and 25 – – – near to the left margin). Profile 7 proves atrim-line about 4600 m a.s.l. situated in between 4–5 km
Figure 52. (Profile 28) Cross-section (not exaggerated) seen down-valley across the Dudh Koshi Nadi from the 6369 m-high Kusum Kanguru(Figure 11 and Photo 157: No. 73) to the 6187 m-high Kongde Ri (Figure 11 and Photo 157: No. 60; 227 and 222: ;). On this cross-profile theIce Age glacier has polished out the orographic right flank of the valley into the form of a trough. On the orographic left side the bedrock iscovered with a decametre-thick ground moraine up to the polish line. The maximum glacier filling of this cross-profile has been reconstructed forthe last glacial period (Wurmian: ca. 60–18 Ka = Stage 0; Table 1). In correspondence with the upper limit of the ground moraine coverpreserved, reaching up to ca. 4000 m, and according to the glacigenic abrasions on both the valley flanks up to an abrasion limit about4000 m a.s.l. (Photo 216 ˙ on the right below No. 36; 156 ˙, ˙ (on the right below No. 73), the glacier trim-line must have run at 4000 m a.s.l. Thevalley floor shows a decametre-thick cover of Late Glacial ground moraine and glaciofluvial gravels lying over it, which have been – and still are –cut by the Dudh Koshi river. The maximum past ice thickness down to the rock ground of the valley floor was ca. 1300 m. In this profile the IceAge glacier surface was situated ca. 200–400 m above the contemporaneous local High Wurmian ELA. Locality: Figure 4.
The maximum Ice Age (Wurmian, Last Ice Age, LGM) glaciation of the Himalaya 241
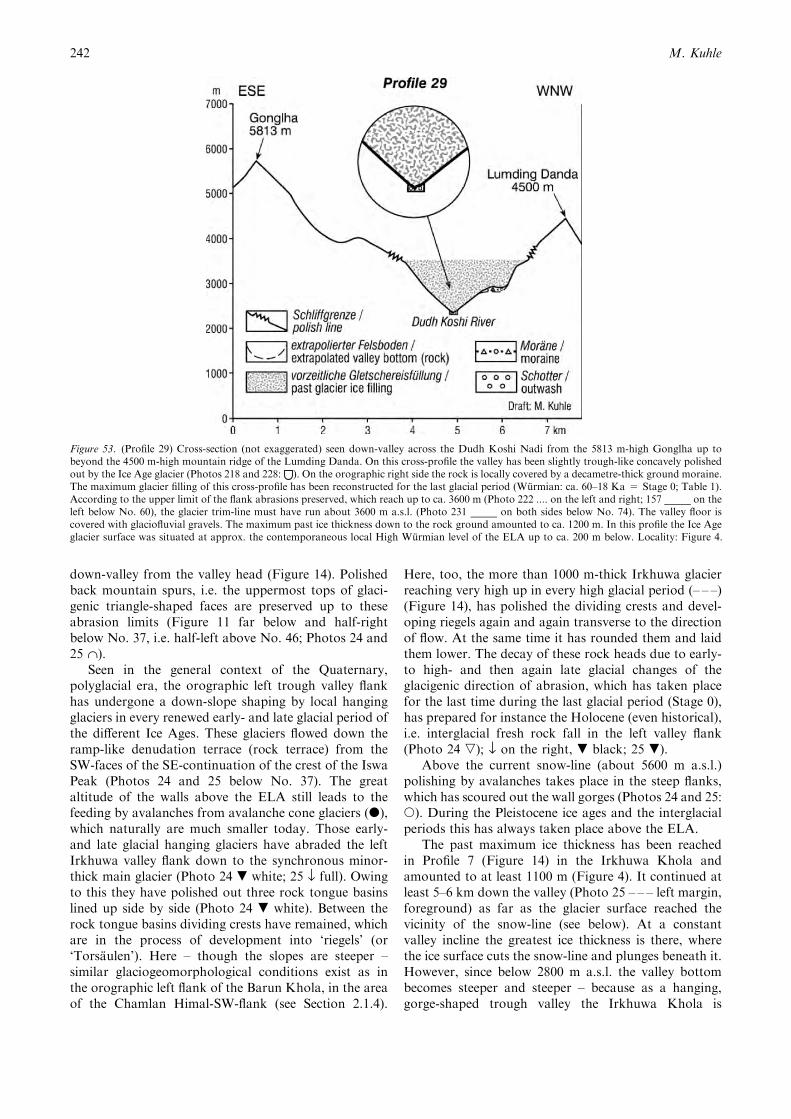
down-valley from the valley head (Figure 14). Polishedback mountain spurs, i.e. the uppermost tops of glaci-genic triangle-shaped faces are preserved up to theseabrasion limits (Figure 11 far below and half-rightbelow No. 37, i.e. half-left above No. 46; Photos 24 and25 ˙).
Seen in the general context of the Quaternary,polyglacial era, the orographic left trough valley flankhas undergone a down-slope shaping by local hangingglaciers in every renewed early- and late glacial period ofthe different Ice Ages. These glaciers flowed down theramp-like denudation terrace (rock terrace) from theSW-faces of the SE-continuation of the crest of the IswaPeak (Photos 24 and 25 below No. 37). The greataltitude of the walls above the ELA still leads to thefeeding by avalanches from avalanche cone glaciers (d),which naturally are much smaller today. Those early-and late glacial hanging glaciers have abraded the leftIrkhuwa valley flank down to the synchronous minor-thick main glacier (Photo 24 . white; 25 fl full). Owingto this they have polished out three rock tongue basinslined up side by side (Photo 24 . white). Between therock tongue basins dividing crests have remained, whichare in the process of development into ‘riegels’ (or‘Torsaulen’). Here – though the slopes are steeper –similar glaciogeomorphological conditions exist as inthe orographic left flank of the Barun Khola, in the areaof the Chamlan Himal-SW-flank (see Section 2.1.4).
Here, too, the more than 1000 m-thick Irkhuwa glacierreaching very high up in every high glacial period (– – –)(Figure 14), has polished the dividing crests and devel-oping riegels again and again transverse to the directionof flow. At the same time it has rounded them and laidthem lower. The decay of these rock heads due to early-to high- and then again late glacial changes of theglacigenic direction of abrasion, which has taken placefor the last time during the last glacial period (Stage 0),has prepared for instance the Holocene (even historical),i.e. interglacial fresh rock fall in the left valley flank(Photo 24 ,); fl on the right, . black; 25 .).
Above the current snow-line (about 5600 m a.s.l.)polishing by avalanches takes place in the steep flanks,which has scoured out the wall gorges (Photos 24 and 25:s). During the Pleistocene ice ages and the interglacialperiods this has always taken place above the ELA.
The past maximum ice thickness has been reachedin Profile 7 (Figure 14) in the Irkhuwa Khola andamounted to at least 1100 m (Figure 4). It continued atleast 5–6 km down the valley (Photo 25 – – – left margin,foreground) as far as the glacier surface reached thevicinity of the snow-line (see below). At a constantvalley incline the greatest ice thickness is there, wherethe ice surface cuts the snow-line and plunges beneath it.However, since below 2800 m a.s.l. the valley bottombecomes steeper and steeper – because as a hanging,gorge-shaped trough valley the Irkhuwa Khola is
Figure 53. (Profile 29) Cross-section (not exaggerated) seen down-valley across the Dudh Koshi Nadi from the 5813 m-high Gonglha up tobeyond the 4500 m-high mountain ridge of the Lumding Danda. On this cross-profile the valley has been slightly trough-like concavely polishedout by the Ice Age glacier (Photos 218 and 228: ). On the orographic right side the rock is locally covered by a decametre-thick ground moraine.The maximum glacier filling of this cross-profile has been reconstructed for the last glacial period (Wurmian: ca. 60–18 Ka = Stage 0; Table 1).According to the upper limit of the flank abrasions preserved, which reach up to ca. 3600 m (Photo 222 .... on the left and right; 157 _____ on theleft below No. 60), the glacier trim-line must have run about 3600 m a.s.l. (Photo 231 _____ on both sides below No. 74). The valley floor iscovered with glaciofluvial gravels. The maximum past ice thickness down to the rock ground amounted to ca. 1200 m. In this profile the Ice Ageglacier surface was situated at approx. the contemporaneous local High Wurmian level of the ELA up to ca. 200 m below. Locality: Figure 4.
M. Kuhle242
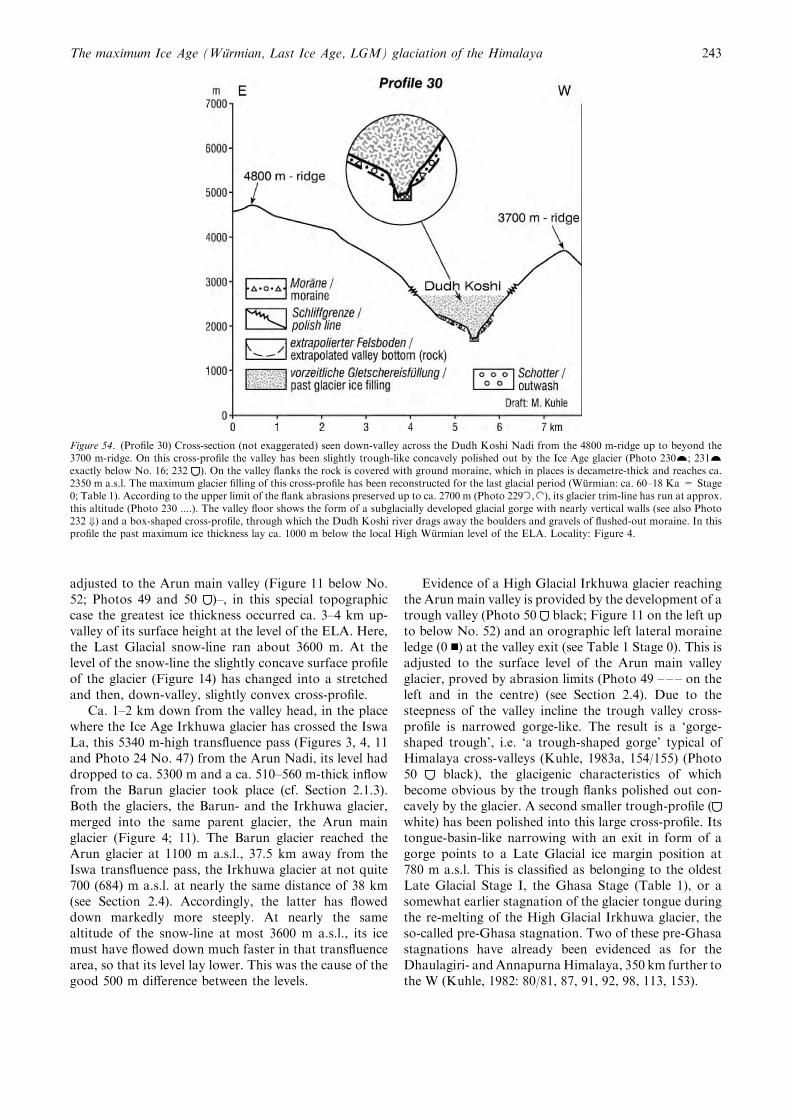
adjusted to the Arun main valley (Figure 11 below No.52; Photos 49 and 50 )–, in this special topographiccase the greatest ice thickness occurred ca. 3–4 km up-valley of its surface height at the level of the ELA. Here,the Last Glacial snow-line ran about 3600 m. At thelevel of the snow-line the slightly concave surface profileof the glacier (Figure 14) has changed into a stretchedand then, down-valley, slightly convex cross-profile.
Ca. 1–2 km down from the valley head, in the placewhere the Ice Age Irkhuwa glacier has crossed the IswaLa, this 5340 m-high transfluence pass (Figures 3, 4, 11and Photo 24 No. 47) from the Arun Nadi, its level haddropped to ca. 5300 m and a ca. 510–560 m-thick inflowfrom the Barun glacier took place (cf. Section 2.1.3).Both the glaciers, the Barun- and the Irkhuwa glacier,merged into the same parent glacier, the Arun mainglacier (Figure 4; 11). The Barun glacier reached theArun glacier at 1100 m a.s.l., 37.5 km away from theIswa transfluence pass, the Irkhuwa glacier at not quite700 (684) m a.s.l. at nearly the same distance of 38 km(see Section 2.4). Accordingly, the latter has floweddown markedly more steeply. At nearly the samealtitude of the snow-line at most 3600 m a.s.l., its icemust have flowed down much faster in that transfluencearea, so that its level lay lower. This was the cause of thegood 500 m difference between the levels.
Evidence of a High Glacial Irkhuwa glacier reachingthe Arun main valley is provided by the development of atrough valley (Photo 50 black; Figure 11 on the left upto below No. 52) and an orographic left lateral moraineledge (0 n) at the valley exit (see Table 1 Stage 0). This isadjusted to the surface level of the Arun main valleyglacier, proved by abrasion limits (Photo 49 – – – on theleft and in the centre) (see Section 2.4). Due to thesteepness of the valley incline the trough valley cross-profile is narrowed gorge-like. The result is a ‘gorge-shaped trough’, i.e. ‘a trough-shaped gorge’ typical ofHimalaya cross-valleys (Kuhle, 1983a, 154/155) (Photo50 black), the glacigenic characteristics of whichbecome obvious by the trough flanks polished out con-cavely by the glacier. A second smaller trough-profile (white) has been polished into this large cross-profile. Itstongue-basin-like narrowing with an exit in form of agorge points to a Late Glacial ice margin position at780 m a.s.l. This is classified as belonging to the oldestLate Glacial Stage I, the Ghasa Stage (Table 1), or asomewhat earlier stagnation of the glacier tongue duringthe re-melting of the High Glacial Irkhuwa glacier, theso-called pre-Ghasa stagnation. Two of these pre-Ghasastagnations have already been evidenced as for theDhaulagiri- andAnnapurnaHimalaya, 350 km further tothe W (Kuhle, 1982: 80/81, 87, 91, 92, 98, 113, 153).
Figure 54. (Profile 30) Cross-section (not exaggerated) seen down-valley across the Dudh Koshi Nadi from the 4800 m-ridge up to beyond the3700 m-ridge. On this cross-profile the valley has been slightly trough-like concavely polished out by the Ice Age glacier (Photo 230…; 231…exactly below No. 16; 232 ). On the valley flanks the rock is covered with ground moraine, which in places is decametre-thick and reaches ca.2350 m a.s.l. The maximum glacier filling of this cross-profile has been reconstructed for the last glacial period (Wurmian: ca. 60–18 Ka = Stage0; Table 1). According to the upper limit of the flank abrasions preserved up to ca. 2700 m (Photo 229
˙
, ˙), its glacier trim-line has run at approx.this altitude (Photo 230 ....). The valley floor shows the form of a subglacially developed glacial gorge with nearly vertical walls (see also Photo232 +) and a box-shaped cross-profile, through which the Dudh Koshi river drags away the boulders and gravels of flushed-out moraine. In thisprofile the past maximum ice thickness lay ca. 1000 m below the local High Wurmian level of the ELA. Locality: Figure 4.
The maximum Ice Age (Wurmian, Last Ice Age, LGM) glaciation of the Himalaya 243
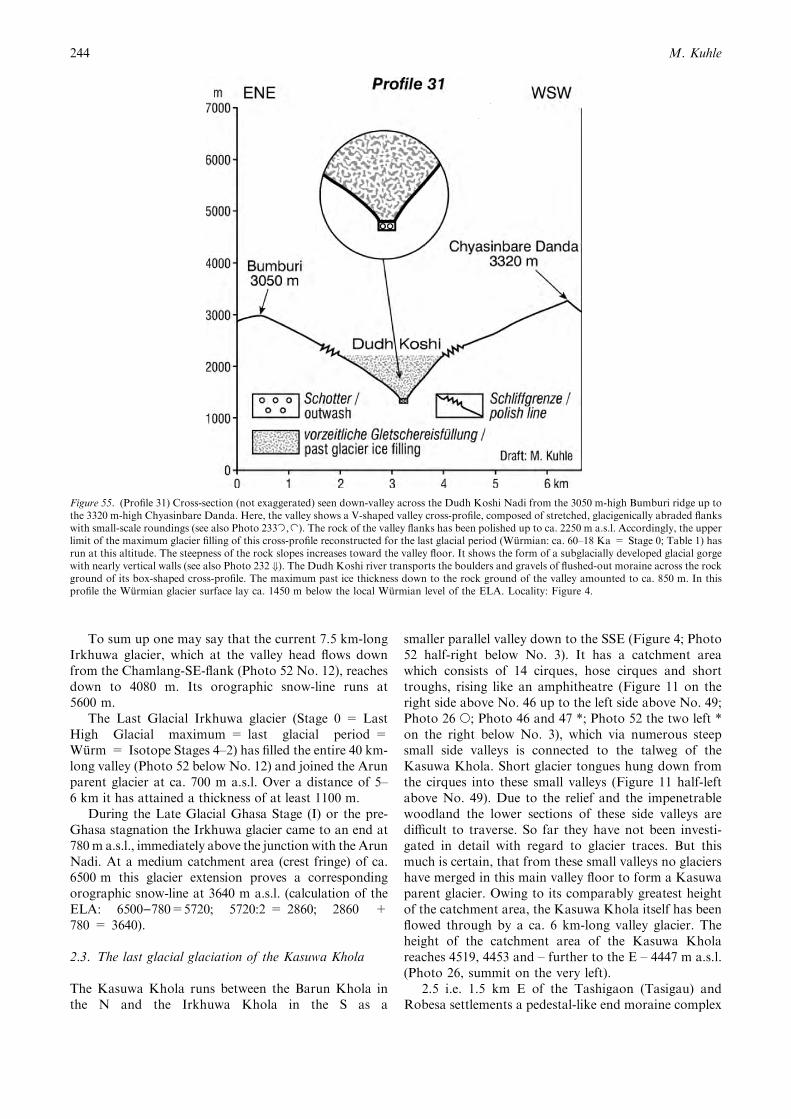
To sum up one may say that the current 7.5 km-longIrkhuwa glacier, which at the valley head flows downfrom the Chamlang-SE-flank (Photo 52 No. 12), reachesdown to 4080 m. Its orographic snow-line runs at5600 m.
The Last Glacial Irkhuwa glacier (Stage 0 = LastHigh Glacial maximum = last glacial period =Wurm = Isotope Stages 4–2) has filled the entire 40 km-long valley (Photo 52 below No. 12) and joined the Arunparent glacier at ca. 700 m a.s.l. Over a distance of 5–6 km it has attained a thickness of at least 1100 m.
During the Late Glacial Ghasa Stage (I) or the pre-Ghasa stagnation the Irkhuwa glacier came to an end at780m a.s.l., immediately above the junction with the ArunNadi. At a medium catchment area (crest fringe) of ca.6500 m this glacier extension proves a correspondingorographic snow-line at 3640 m a.s.l. (calculation of theELA: 6500)780=5720; 5720:2 = 2860; 2860 +780 = 3640).
2.3. The last glacial glaciation of the Kasuwa Khola
The Kasuwa Khola runs between the Barun Khola inthe N and the Irkhuwa Khola in the S as a
smaller parallel valley down to the SSE (Figure 4; Photo52 half-right below No. 3). It has a catchment areawhich consists of 14 cirques, hose cirques and shorttroughs, rising like an amphitheatre (Figure 11 on theright side above No. 46 up to the left side above No. 49;Photo 26 s; Photo 46 and 47 *; Photo 52 the two left *on the right below No. 3), which via numerous steepsmall side valleys is connected to the talweg of theKasuwa Khola. Short glacier tongues hung down fromthe cirques into these small valleys (Figure 11 half-leftabove No. 49). Due to the relief and the impenetrablewoodland the lower sections of these side valleys aredifficult to traverse. So far they have not been investi-gated in detail with regard to glacier traces. But thismuch is certain, that from these small valleys no glaciershave merged in this main valley floor to form a Kasuwaparent glacier. Owing to its comparably greatest heightof the catchment area, the Kasuwa Khola itself has beenflowed through by a ca. 6 km-long valley glacier. Theheight of the catchment area of the Kasuwa Kholareaches 4519, 4453 and – further to the E – 4447 m a.s.l.(Photo 26, summit on the very left).
2.5 i.e. 1.5 km E of the Tashigaon (Tasigau) andRobesa settlements a pedestal-like end moraine complex
Figure 55. (Profile 31) Cross-section (not exaggerated) seen down-valley across the Dudh Koshi Nadi from the 3050 m-high Bumburi ridge up tothe 3320 m-high Chyasinbare Danda. Here, the valley shows a V-shaped valley cross-profile, composed of stretched, glacigenically abraded flankswith small-scale roundings (see also Photo 233
˙
, ˙). The rock of the valley flanks has been polished up to ca. 2250 m a.s.l. Accordingly, the upperlimit of the maximum glacier filling of this cross-profile reconstructed for the last glacial period (Wurmian: ca. 60–18 Ka = Stage 0; Table 1) hasrun at this altitude. The steepness of the rock slopes increases toward the valley floor. It shows the form of a subglacially developed glacial gorgewith nearly vertical walls (see also Photo 232 +). The Dudh Koshi river transports the boulders and gravels of flushed-out moraine across the rockground of its box-shaped cross-profile. The maximum past ice thickness down to the rock ground of the valley amounted to ca. 850 m. In thisprofile the Wurmian glacier surface lay ca. 1450 m below the local Wurmian level of the ELA. Locality: Figure 4.
M. Kuhle244
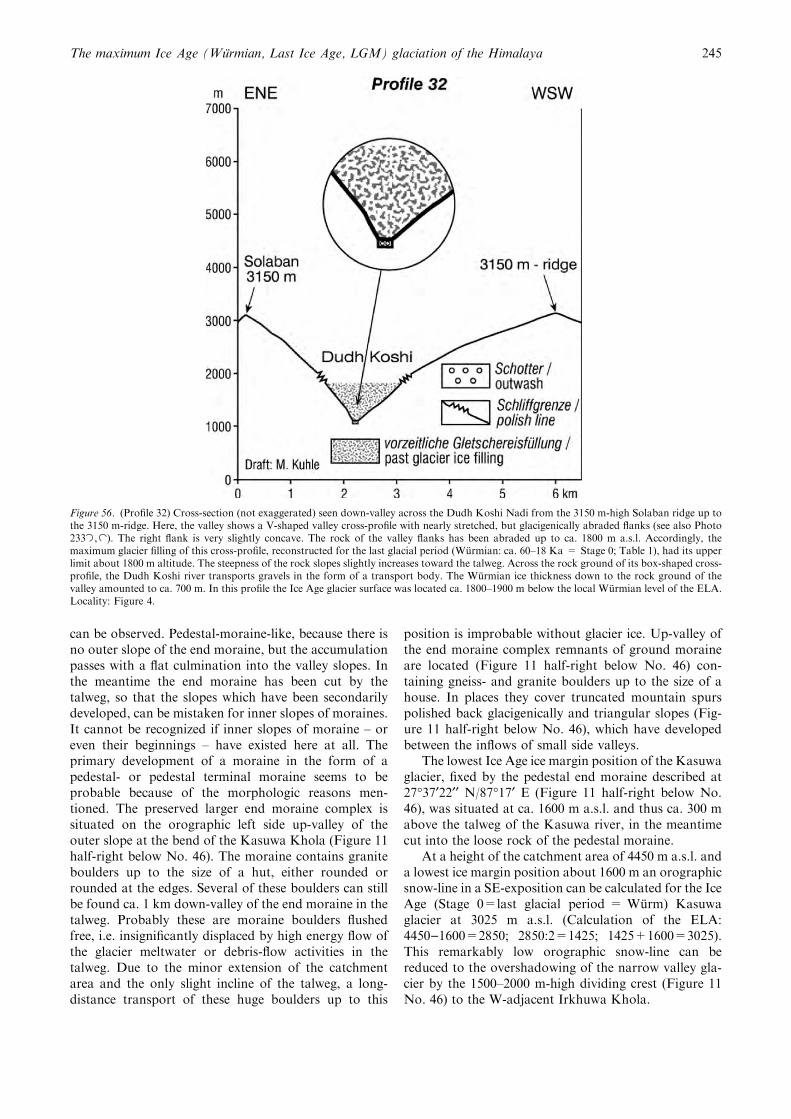
can be observed. Pedestal-moraine-like, because there isno outer slope of the end moraine, but the accumulationpasses with a flat culmination into the valley slopes. Inthe meantime the end moraine has been cut by thetalweg, so that the slopes which have been secondarilydeveloped, can be mistaken for inner slopes of moraines.It cannot be recognized if inner slopes of moraine – oreven their beginnings – have existed here at all. Theprimary development of a moraine in the form of apedestal- or pedestal terminal moraine seems to beprobable because of the morphologic reasons men-tioned. The preserved larger end moraine complex issituated on the orographic left side up-valley of theouter slope at the bend of the Kasuwa Khola (Figure 11half-right below No. 46). The moraine contains graniteboulders up to the size of a hut, either rounded orrounded at the edges. Several of these boulders can stillbe found ca. 1 km down-valley of the end moraine in thetalweg. Probably these are moraine boulders flushedfree, i.e. insignificantly displaced by high energy flow ofthe glacier meltwater or debris-flow activities in thetalweg. Due to the minor extension of the catchmentarea and the only slight incline of the talweg, a long-distance transport of these huge boulders up to this
position is improbable without glacier ice. Up-valley ofthe end moraine complex remnants of ground moraineare located (Figure 11 half-right below No. 46) con-taining gneiss- and granite boulders up to the size of ahouse. In places they cover truncated mountain spurspolished back glacigenically and triangular slopes (Fig-ure 11 half-right below No. 46), which have developedbetween the inflows of small side valleys.
The lowest Ice Age ice margin position of the Kasuwaglacier, fixed by the pedestal end moraine described at27�37¢22¢¢ N/87�17¢ E (Figure 11 half-right below No.46), was situated at ca. 1600 m a.s.l. and thus ca. 300 mabove the talweg of the Kasuwa river, in the meantimecut into the loose rock of the pedestal moraine.
At a height of the catchment area of 4450 m a.s.l. anda lowest ice margin position about 1600 m an orographicsnow-line in a SE-exposition can be calculated for the IceAge (Stage 0=last glacial period = Wurm) Kasuwaglacier at 3025 m a.s.l. (Calculation of the ELA:4450)1600=2850; 2850:2=1425; 1425+1600=3025).This remarkably low orographic snow-line can bereduced to the overshadowing of the narrow valley gla-cier by the 1500–2000 m-high dividing crest (Figure 11No. 46) to the W-adjacent Irkhuwa Khola.
Figure 56. (Profile 32) Cross-section (not exaggerated) seen down-valley across the Dudh Koshi Nadi from the 3150 m-high Solaban ridge up tothe 3150 m-ridge. Here, the valley shows a V-shaped valley cross-profile with nearly stretched, but glacigenically abraded flanks (see also Photo233
˙
, ˙). The right flank is very slightly concave. The rock of the valley flanks has been abraded up to ca. 1800 m a.s.l. Accordingly, themaximum glacier filling of this cross-profile, reconstructed for the last glacial period (Wurmian: ca. 60–18 Ka = Stage 0; Table 1), had its upperlimit about 1800 m altitude. The steepness of the rock slopes slightly increases toward the talweg. Across the rock ground of its box-shaped cross-profile, the Dudh Koshi river transports gravels in the form of a transport body. The Wurmian ice thickness down to the rock ground of thevalley amounted to ca. 700 m. In this profile the Ice Age glacier surface was located ca. 1800–1900 m below the local Wurmian level of the ELA.Locality: Figure 4.
The maximum Ice Age (Wurmian, Last Ice Age, LGM) glaciation of the Himalaya 245
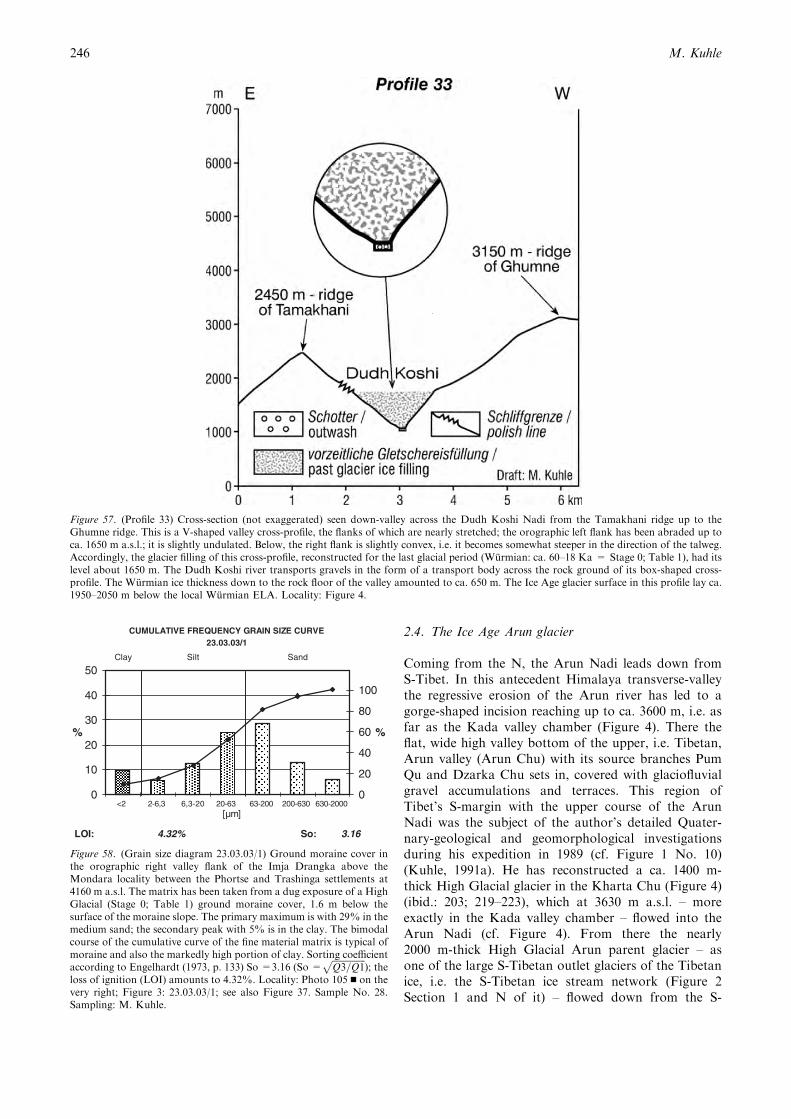
2.4. The Ice Age Arun glacier
Coming from the N, the Arun Nadi leads down fromS-Tibet. In this antecedent Himalaya transverse-valleythe regressive erosion of the Arun river has led to agorge-shaped incision reaching up to ca. 3600 m, i.e. asfar as the Kada valley chamber (Figure 4). There theflat, wide high valley bottom of the upper, i.e. Tibetan,Arun valley (Arun Chu) with its source branches PumQu and Dzarka Chu sets in, covered with glaciofluvialgravel accumulations and terraces. This region ofTibet’s S-margin with the upper course of the ArunNadi was the subject of the author’s detailed Quater-nary-geological and geomorphological investigationsduring his expedition in 1989 (cf. Figure 1 No. 10)(Kuhle, 1991a). He has reconstructed a ca. 1400 m-thick High Glacial glacier in the Kharta Chu (Figure 4)(ibid.: 203; 219–223), which at 3630 m a.s.l. – moreexactly in the Kada valley chamber – flowed into theArun Nadi (cf. Figure 4). From there the nearly2000 m-thick High Glacial Arun parent glacier – asone of the large S-Tibetan outlet glaciers of the Tibetanice, i.e. the S-Tibetan ice stream network (Figure 2Section 1 and N of it) – flowed down from the S-
Figure 57. (Profile 33) Cross-section (not exaggerated) seen down-valley across the Dudh Koshi Nadi from the Tamakhani ridge up to theGhumne ridge. This is a V-shaped valley cross-profile, the flanks of which are nearly stretched; the orographic left flank has been abraded up toca. 1650 m a.s.l.; it is slightly undulated. Below, the right flank is slightly convex, i.e. it becomes somewhat steeper in the direction of the talweg.Accordingly, the glacier filling of this cross-profile, reconstructed for the last glacial period (Wurmian: ca. 60–18 Ka = Stage 0; Table 1), had itslevel about 1650 m. The Dudh Koshi river transports gravels in the form of a transport body across the rock ground of its box-shaped cross-profile. The Wurmian ice thickness down to the rock floor of the valley amounted to ca. 650 m. The Ice Age glacier surface in this profile lay ca.1950–2050 m below the local Wurmian ELA. Locality: Figure 4.
LOI: 4.32% So: 3.16
CUMULATIVE FREQUENCY GRAIN SIZE CURVE23.03.03/1
0
10
20
30
40
50
%
0
20
40
60
80
100
Clay Silt Sand
%
<2 2-6,3 6,3-20 20-63 63-200 200-630 630-2000[µm]
Figure 58. (Grain size diagram 23.03.03/1) Ground moraine cover inthe orographic right valley flank of the Imja Drangka above theMondara locality between the Phortse and Trashinga settlements at4160 m a.s.l. The matrix has been taken from a dug exposure of a HighGlacial (Stage 0; Table 1) ground moraine cover, 1.6 m below thesurface of the moraine slope. The primary maximum is with 29% in themedium sand; the secondary peak with 5% is in the clay. The bimodalcourse of the cumulative curve of the fine material matrix is typical ofmoraine and also the markedly high portion of clay. Sorting coefficientaccording to Engelhardt (1973, p. 133) So =3.16 (So =
ffiffiffiffiffiffiffiffiffiffiffiffiffiffiffiQ3=Q1
p); the
loss of ignition (LOI) amounts to 4.32%. Locality: Photo 105 n on thevery right; Figure 3: 23.03.03/1; see also Figure 37. Sample No. 28.Sampling: M. Kuhle.
M. Kuhle246
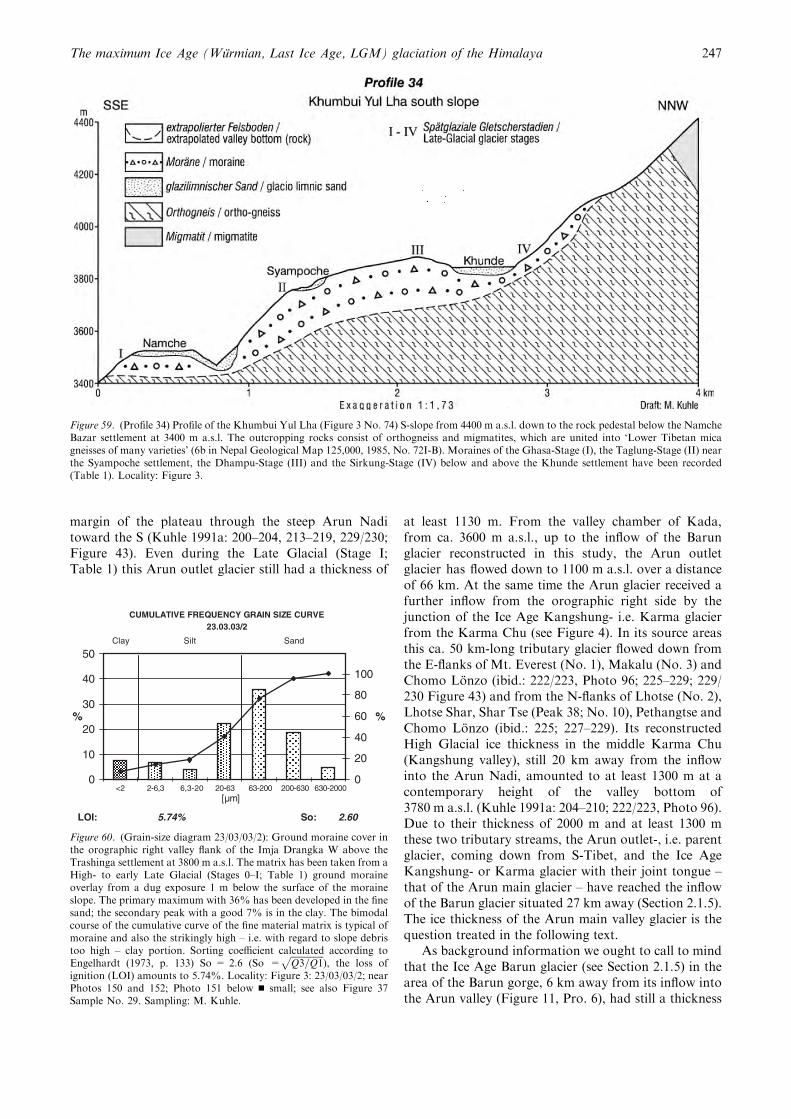
margin of the plateau through the steep Arun Naditoward the S (Kuhle 1991a: 200–204, 213–219, 229/230;Figure 43). Even during the Late Glacial (Stage I;Table 1) this Arun outlet glacier still had a thickness of
at least 1130 m. From the valley chamber of Kada,from ca. 3600 m a.s.l., up to the inflow of the Barunglacier reconstructed in this study, the Arun outletglacier has flowed down to 1100 m a.s.l. over a distanceof 66 km. At the same time the Arun glacier received afurther inflow from the orographic right side by thejunction of the Ice Age Kangshung- i.e. Karma glacierfrom the Karma Chu (see Figure 4). In its source areasthis ca. 50 km-long tributary glacier flowed down fromthe E-flanks of Mt. Everest (No. 1), Makalu (No. 3) andChomo Lonzo (ibid.: 222/223, Photo 96; 225–229; 229/230 Figure 43) and from the N-flanks of Lhotse (No. 2),Lhotse Shar, Shar Tse (Peak 38; No. 10), Pethangtse andChomo Lonzo (ibid.: 225; 227–229). Its reconstructedHigh Glacial ice thickness in the middle Karma Chu(Kangshung valley), still 20 km away from the inflowinto the Arun Nadi, amounted to at least 1300 m at acontemporary height of the valley bottom of3780 m a.s.l. (Kuhle 1991a: 204–210; 222/223, Photo 96).Due to their thickness of 2000 m and at least 1300 mthese two tributary streams, the Arun outlet-, i.e. parentglacier, coming down from S-Tibet, and the Ice AgeKangshung- or Karma glacier with their joint tongue –that of the Arun main glacier – have reached the inflowof the Barun glacier situated 27 km away (Section 2.1.5).The ice thickness of the Arun main valley glacier is thequestion treated in the following text.
As background information we ought to call to mindthat the Ice Age Barun glacier (see Section 2.1.5) in thearea of the Barun gorge, 6 km away from its inflow intothe Arun valley (Figure 11, Pro. 6), had still a thickness
Figure 59. (Profile 34) Profile of the Khumbui Yul Lha (Figure 3 No. 74) S-slope from 4400 m a.s.l. down to the rock pedestal below the NamcheBazar settlement at 3400 m a.s.l. The outcropping rocks consist of orthogneiss and migmatites, which are united into ‘Lower Tibetan micagneisses of many varieties’ (6b in Nepal Geological Map 125,000, 1985, No. 72I-B). Moraines of the Ghasa-Stage (I), the Taglung-Stage (II) nearthe Syampoche settlement, the Dhampu-Stage (III) and the Sirkung-Stage (IV) below and above the Khunde settlement have been recorded(Table 1). Locality: Figure 3.
LOI: 5.74% So: 2.60
CUMULATIVE FREQUENCY GRAIN SIZE CURVE23.03.03/2
0
10
20
30
40
50
%
0
20
40
60
80
100
Clay Silt Sand
%
<2 2-6,3 6,3-20 20-63 63-200 200-630 630-2000[µm]
Figure 60. (Grain-size diagram 23/03/03/2): Ground moraine cover inthe orographic right valley flank of the Imja Drangka W above theTrashinga settlement at 3800 m a.s.l. The matrix has been taken from aHigh- to early Late Glacial (Stages 0–I; Table 1) ground moraineoverlay from a dug exposure 1 m below the surface of the moraineslope. The primary maximum with 36% has been developed in the finesand; the secondary peak with a good 7% is in the clay. The bimodalcourse of the cumulative curve of the fine material matrix is typical ofmoraine and also the strikingly high – i.e. with regard to slope debristoo high – clay portion. Sorting coefficient calculated according toEngelhardt (1973, p. 133) So = 2.6 (So =
ffiffiffiffiffiffiffiffiffiffiffiffiffiffiffiQ3=Q1
p), the loss of
ignition (LOI) amounts to 5.74%. Locality: Figure 3: 23/03/03/2; nearPhotos 150 and 152; Photo 151 below n small; see also Figure 37Sample No. 29. Sampling: M. Kuhle.
The maximum Ice Age (Wurmian, Last Ice Age, LGM) glaciation of the Himalaya 247
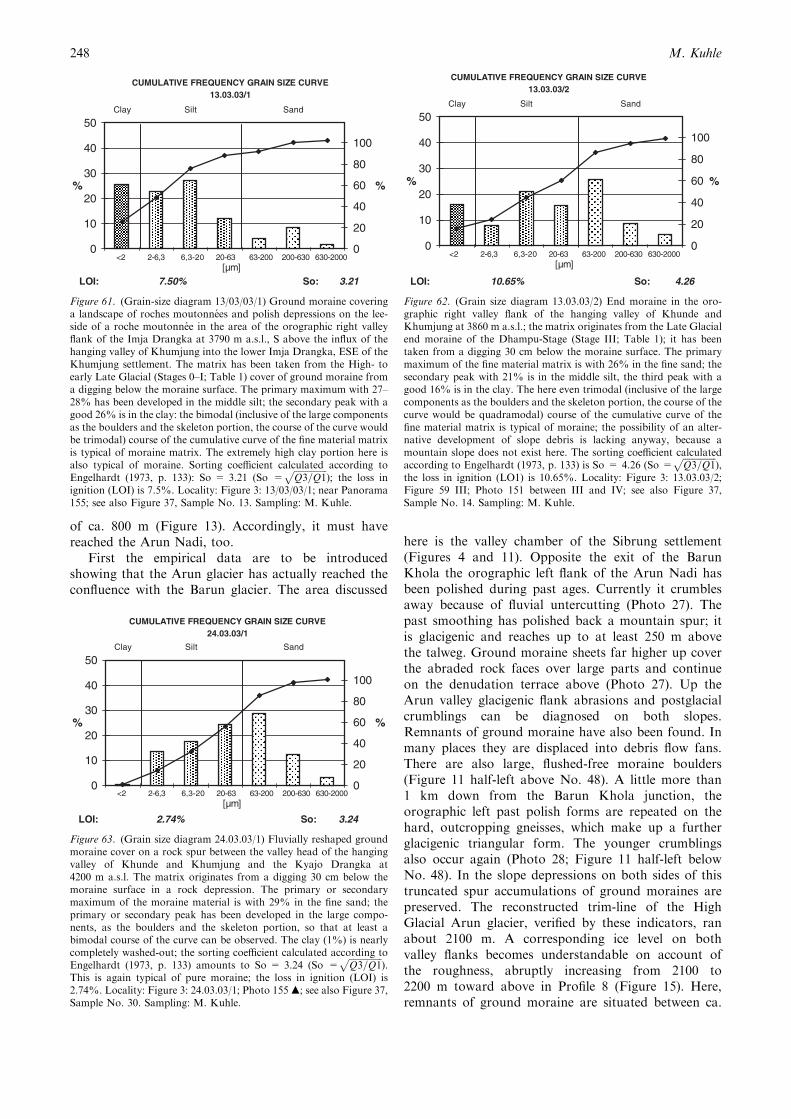
of ca. 800 m (Figure 13). Accordingly, it must havereached the Arun Nadi, too.
First the empirical data are to be introducedshowing that the Arun glacier has actually reached theconfluence with the Barun glacier. The area discussed
here is the valley chamber of the Sibrung settlement(Figures 4 and 11). Opposite the exit of the BarunKhola the orographic left flank of the Arun Nadi hasbeen polished during past ages. Currently it crumblesaway because of fluvial untercutting (Photo 27). Thepast smoothing has polished back a mountain spur; itis glacigenic and reaches up to at least 250 m abovethe talweg. Ground moraine sheets far higher up coverthe abraded rock faces over large parts and continueon the denudation terrace above (Photo 27). Up theArun valley glacigenic flank abrasions and postglacialcrumblings can be diagnosed on both slopes.Remnants of ground moraine have also been found. Inmany places they are displaced into debris flow fans.There are also large, flushed-free moraine boulders(Figure 11 half-left above No. 48). A little more than1 km down from the Barun Khola junction, theorographic left past polish forms are repeated on thehard, outcropping gneisses, which make up a furtherglacigenic triangular form. The younger crumblingsalso occur again (Photo 28; Figure 11 half-left belowNo. 48). In the slope depressions on both sides of thistruncated spur accumulations of ground moraines arepreserved. The reconstructed trim-line of the HighGlacial Arun glacier, verified by these indicators, ranabout 2100 m. A corresponding ice level on bothvalley flanks becomes understandable on account ofthe roughness, abruptly increasing from 2100 to2200 m toward above in Profile 8 (Figure 15). Here,remnants of ground moraine are situated between ca.
LOI: 7.50% So: 3.21
CUMULATIVE FREQUENCY GRAIN SIZE CURVE13.03.03/1
0
10
20
30
40
50
%
0
20
40
60
80
100
Clay Silt Sand
%
<2 2-6,3 6,3-20 20-63 63-200 200-630 630-2000[µm]
Figure 61. (Grain-size diagram 13/03/03/1) Ground moraine coveringa landscape of roches moutonnees and polish depressions on the lee-side of a roche moutonnee in the area of the orographic right valleyflank of the Imja Drangka at 3790 m a.s.l., S above the influx of thehanging valley of Khumjung into the lower Imja Drangka, ESE of theKhumjung settlement. The matrix has been taken from the High- toearly Late Glacial (Stages 0–I; Table 1) cover of ground moraine froma digging below the moraine surface. The primary maximum with 27–28% has been developed in the middle silt; the secondary peak with agood 26% is in the clay: the bimodal (inclusive of the large componentsas the boulders and the skeleton portion, the course of the curve wouldbe trimodal) course of the cumulative curve of the fine material matrixis typical of moraine matrix. The extremely high clay portion here isalso typical of moraine. Sorting coefficient calculated according toEngelhardt (1973, p. 133): So = 3.21 (So =
ffiffiffiffiffiffiffiffiffiffiffiffiffiffiffiQ3=Q1
p); the loss in
ignition (LOI) is 7.5%. Locality: Figure 3: 13/03/03/1; near Panorama155; see also Figure 37, Sample No. 13. Sampling: M. Kuhle.
LOI: 10.65% So: 4.26
CUMULATIVE FREQUENCY GRAIN SIZE CURVE13.03.03/2
0
10
20
30
40
50
%
0
20
40
60
80
100
Clay Silt Sand
%
<2 2-6,3 6,3-20 20-63 63-200 200-630 630-2000[µm]
Figure 62. (Grain size diagram 13.03.03/2) End moraine in the oro-graphic right valley flank of the hanging valley of Khunde andKhumjung at 3860 m a.s.l.; the matrix originates from the Late Glacialend moraine of the Dhampu-Stage (Stage III; Table 1); it has beentaken from a digging 30 cm below the moraine surface. The primarymaximum of the fine material matrix is with 26% in the fine sand; thesecondary peak with 21% is in the middle silt, the third peak with agood 16% is in the clay. The here even trimodal (inclusive of the largecomponents as the boulders and the skeleton portion, the course of thecurve would be quadramodal) course of the cumulative curve of thefine material matrix is typical of moraine; the possibility of an alter-native development of slope debris is lacking anyway, because amountain slope does not exist here. The sorting coefficient calculatedaccording to Engelhardt (1973, p. 133) is So = 4.26 (So =
ffiffiffiffiffiffiffiffiffiffiffiffiffiffiffiQ3=Q1
p),
the loss in ignition (LO1) is 10.65%. Locality: Figure 3: 13.03.03/2;Figure 59 III; Photo 151 between III and IV; see also Figure 37,Sample No. 14. Sampling: M. Kuhle.
LOI: 2.74% So: 3.24
CUMULATIVE FREQUENCY GRAIN SIZE CURVE24.03.03/1
0
10
20
30
40
50
%
0
20
40
60
80
100
Clay Silt Sand
%
<2 2-6,3 6,3-20 20-63 63-200 200-630 630-2000[µm]
Figure 63. (Grain size diagram 24.03.03/1) Fluvially reshaped groundmoraine cover on a rock spur between the valley head of the hangingvalley of Khunde and Khumjung and the Kyajo Drangka at4200 m a.s.l. The matrix originates from a digging 30 cm below themoraine surface in a rock depression. The primary or secondarymaximum of the moraine material is with 29% in the fine sand; theprimary or secondary peak has been developed in the large compo-nents, as the boulders and the skeleton portion, so that at least abimodal course of the curve can be observed. The clay (1%) is nearlycompletely washed-out; the sorting coefficient calculated according toEngelhardt (1973, p. 133) amounts to So = 3.24 (So =
ffiffiffiffiffiffiffiffiffiffiffiffiffiffiffiQ3=Q1
p).
This is again typical of pure moraine; the loss in ignition (LOI) is2.74%. Locality: Figure 3: 24.03.03/1; Photo 155m; see also Figure 37,Sample No. 30. Sampling: M. Kuhle.
M. Kuhle248
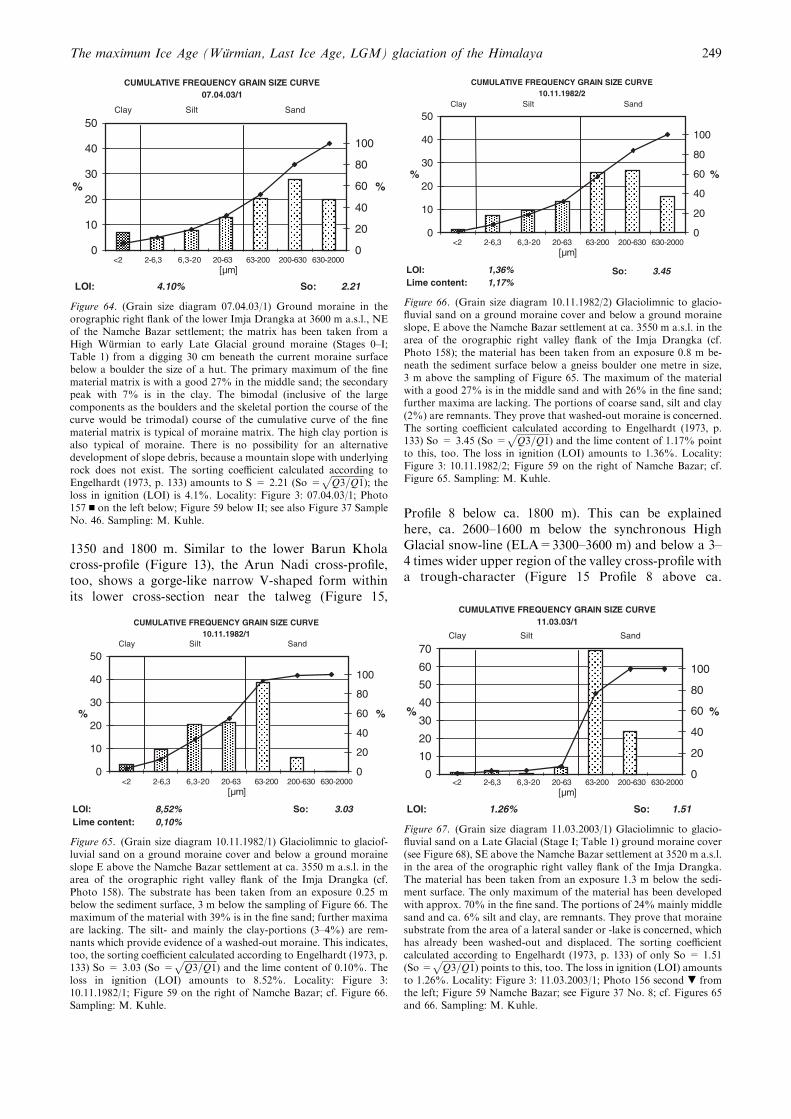
1350 and 1800 m. Similar to the lower Barun Kholacross-profile (Figure 13), the Arun Nadi cross-profile,too, shows a gorge-like narrow V-shaped form withinits lower cross-section near the talweg (Figure 15,
Profile 8 below ca. 1800 m). This can be explainedhere, ca. 2600–1600 m below the synchronous HighGlacial snow-line (ELA=3300–3600 m) and below a 3–4 times wider upper region of the valley cross-profile witha trough-character (Figure 15 Profile 8 above ca.
LOI: 4.10% So: 2.21
CUMULATIVE FREQUENCY GRAIN SIZE CURVE07.04.03/1
0
10
20
30
40
50
%
0
20
40
60
80
100
Clay Silt Sand
%
<2 2-6,3 6,3-20 20-63 63-200 200-630 630-2000[µm]
Figure 64. (Grain size diagram 07.04.03/1) Ground moraine in theorographic right flank of the lower Imja Drangka at 3600 m a.s.l., NEof the Namche Bazar settlement; the matrix has been taken from aHigh Wurmian to early Late Glacial ground moraine (Stages 0–I;Table 1) from a digging 30 cm beneath the current moraine surfacebelow a boulder the size of a hut. The primary maximum of the finematerial matrix is with a good 27% in the middle sand; the secondarypeak with 7% is in the clay. The bimodal (inclusive of the largecomponents as the boulders and the skeletal portion the course of thecurve would be trimodal) course of the cumulative curve of the finematerial matrix is typical of moraine matrix. The high clay portion isalso typical of moraine. There is no possibility for an alternativedevelopment of slope debris, because a mountain slope with underlyingrock does not exist. The sorting coefficient calculated according toEngelhardt (1973, p. 133) amounts to S = 2.21 (So =
ffiffiffiffiffiffiffiffiffiffiffiffiffiffiffiQ3=Q1
p); the
loss in ignition (LOI) is 4.1%. Locality: Figure 3: 07.04.03/1; Photo157 n on the left below; Figure 59 below II; see also Figure 37 SampleNo. 46. Sampling: M. Kuhle.
LOI: 8,52% So: 3.03Lime content: 0,10%
CUMULATIVE FREQUENCY GRAIN SIZE CURVE10.11.1982/1
0
10
20
30
40
50
%
0
20
40
60
80
100
Clay Silt Sand
%
<2 2-6,3 6,3-20 20-63 63-200 200-630 630-2000[µm]
Figure 65. (Grain size diagram 10.11.1982/1) Glaciolimnic to glaciof-luvial sand on a ground moraine cover and below a ground moraineslope E above the Namche Bazar settlement at ca. 3550 m a.s.l. in thearea of the orographic right valley flank of the Imja Drangka (cf.Photo 158). The substrate has been taken from an exposure 0.25 mbelow the sediment surface, 3 m below the sampling of Figure 66. Themaximum of the material with 39% is in the fine sand; further maximaare lacking. The silt- and mainly the clay-portions (3–4%) are rem-nants which provide evidence of a washed-out moraine. This indicates,too, the sorting coefficient calculated according to Engelhardt (1973, p.133) So = 3.03 (So =
ffiffiffiffiffiffiffiffiffiffiffiffiffiffiffiQ3=Q1
p) and the lime content of 0.10%. The
loss in ignition (LOI) amounts to 8.52%. Locality: Figure 3:10.11.1982/1; Figure 59 on the right of Namche Bazar; cf. Figure 66.Sampling: M. Kuhle.
LOI: 1,36% So: 3.45Lime content: 1,17%
CUMULATIVE FREQUENCY GRAIN SIZE CURVE 10.11.1982/2
0
10
20
30
40
50
%
0
20
40
60
80
100
Clay Silt Sand
%
<2 2-6,3 6,3-20 20-63 63-200 200-630 630-2000[µm]
Figure 66. (Grain size diagram 10.11.1982/2) Glaciolimnic to glacio-fluvial sand on a ground moraine cover and below a ground moraineslope, E above the Namche Bazar settlement at ca. 3550 m a.s.l. in thearea of the orographic right valley flank of the Imja Drangka (cf.Photo 158); the material has been taken from an exposure 0.8 m be-neath the sediment surface below a gneiss boulder one metre in size,3 m above the sampling of Figure 65. The maximum of the materialwith a good 27% is in the middle sand and with 26% in the fine sand;further maxima are lacking. The portions of coarse sand, silt and clay(2%) are remnants. They prove that washed-out moraine is concerned.The sorting coefficient calculated according to Engelhardt (1973, p.133) So = 3.45 (So =
ffiffiffiffiffiffiffiffiffiffiffiffiffiffiffiQ3=Q1
p) and the lime content of 1.17% point
to this, too. The loss in ignition (LOI) amounts to 1.36%. Locality:Figure 3: 10.11.1982/2; Figure 59 on the right of Namche Bazar; cf.Figure 65. Sampling: M. Kuhle.
LOI: 1.26% So: 1.51
CUMULATIVE FREQUENCY GRAIN SIZE CURVE11.03.03/1
0
10
20
30
40
50
60
70
%
0
20
40
60
80
100
Clay Silt Sand
%
<2 2-6,3 6,3-20 20-63 63-200 200-630 630-2000[µm]
Figure 67. (Grain size diagram 11.03.2003/1) Glaciolimnic to glacio-fluvial sand on a Late Glacial (Stage I; Table 1) ground moraine cover(see Figure 68), SE above the Namche Bazar settlement at 3520 m a.s.l.in the area of the orographic right valley flank of the Imja Drangka.The material has been taken from an exposure 1.3 m below the sedi-ment surface. The only maximum of the material has been developedwith approx. 70% in the fine sand. The portions of 24% mainly middlesand and ca. 6% silt and clay, are remnants. They prove that morainesubstrate from the area of a lateral sander or -lake is concerned, whichhas already been washed-out and displaced. The sorting coefficientcalculated according to Engelhardt (1973, p. 133) of only So = 1.51(So =
ffiffiffiffiffiffiffiffiffiffiffiffiffiffiffiQ3=Q1
p) points to this, too. The loss in ignition (LOI) amounts
to 1.26%. Locality: Figure 3: 11.03.2003/1; Photo 156 second . fromthe left; Figure 59 Namche Bazar; see Figure 37 No. 8; cf. Figures 65and 66. Sampling: M. Kuhle.
The maximum Ice Age (Wurmian, Last Ice Age, LGM) glaciation of the Himalaya 249
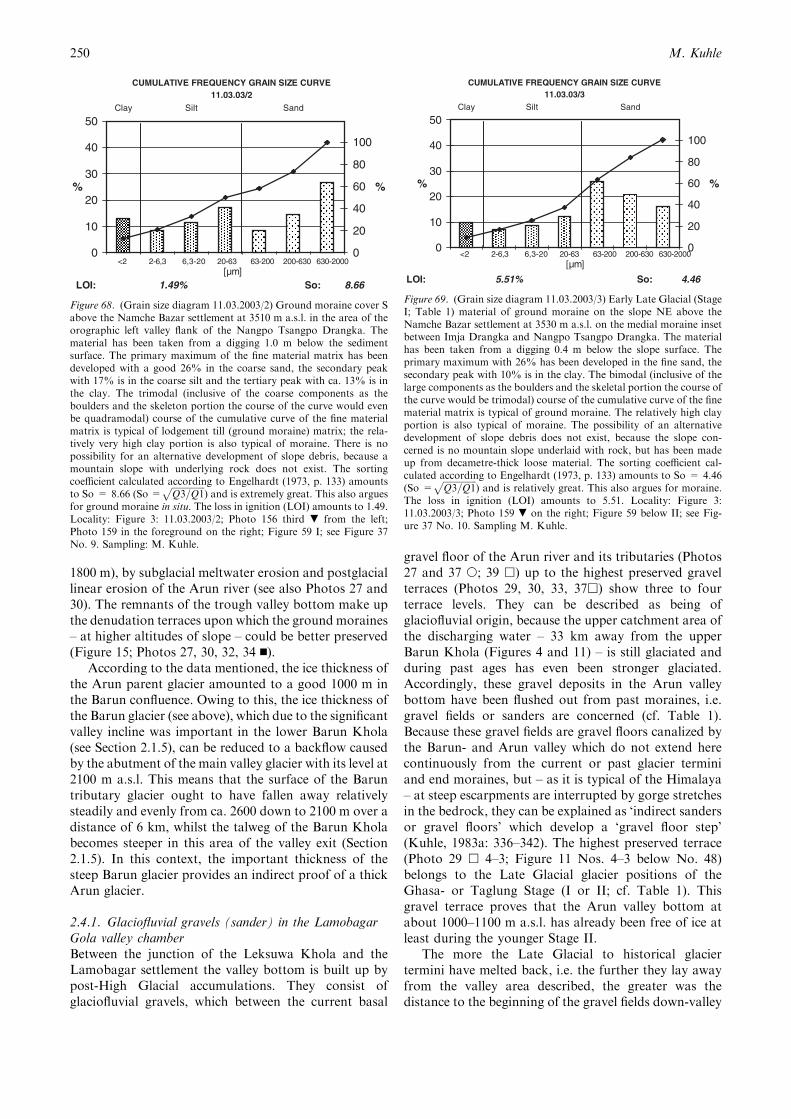
1800 m), by subglacial meltwater erosion and postglaciallinear erosion of the Arun river (see also Photos 27 and30). The remnants of the trough valley bottom make upthe denudation terraces upon which the ground moraines– at higher altitudes of slope – could be better preserved(Figure 15; Photos 27, 30, 32, 34 n).
According to the data mentioned, the ice thickness ofthe Arun parent glacier amounted to a good 1000 m inthe Barun confluence. Owing to this, the ice thickness ofthe Barun glacier (see above), which due to the significantvalley incline was important in the lower Barun Khola(see Section 2.1.5), can be reduced to a backflow causedby the abutment of the main valley glacier with its level at2100 m a.s.l. This means that the surface of the Baruntributary glacier ought to have fallen away relativelysteadily and evenly from ca. 2600 down to 2100 m over adistance of 6 km, whilst the talweg of the Barun Kholabecomes steeper in this area of the valley exit (Section2.1.5). In this context, the important thickness of thesteep Barun glacier provides an indirect proof of a thickArun glacier.
2.4.1. Glaciofluvial gravels (sander) in the LamobagarGola valley chamberBetween the junction of the Leksuwa Khola and theLamobagar settlement the valley bottom is built up bypost-High Glacial accumulations. They consist ofglaciofluvial gravels, which between the current basal
gravel floor of the Arun river and its tributaries (Photos27 and 37 s; 39 h) up to the highest preserved gravelterraces (Photos 29, 30, 33, 37h) show three to fourterrace levels. They can be described as being ofglaciofluvial origin, because the upper catchment area ofthe discharging water – 33 km away from the upperBarun Khola (Figures 4 and 11) – is still glaciated andduring past ages has even been stronger glaciated.Accordingly, these gravel deposits in the Arun valleybottom have been flushed out from past moraines, i.e.gravel fields or sanders are concerned (cf. Table 1).Because these gravel fields are gravel floors canalized bythe Barun- and Arun valley which do not extend herecontinuously from the current or past glacier terminiand end moraines, but – as it is typical of the Himalaya– at steep escarpments are interrupted by gorge stretchesin the bedrock, they can be explained as ‘indirect sandersor gravel floors’ which develop a ‘gravel floor step’(Kuhle, 1983a: 336–342). The highest preserved terrace(Photo 29 h 4–3; Figure 11 Nos. 4–3 below No. 48)belongs to the Late Glacial glacier positions of theGhasa- or Taglung Stage (I or II; cf. Table 1). Thisgravel terrace proves that the Arun valley bottom atabout 1000–1100 m a.s.l. has already been free of ice atleast during the younger Stage II.
The more the Late Glacial to historical glaciertermini have melted back, i.e. the further they lay awayfrom the valley area described, the greater was thedistance to the beginning of the gravel fields down-valley
LOI: 1.49% So: 8.66
CUMULATIVE FREQUENCY GRAIN SIZE CURVE11.03.03/2
0
10
20
30
40
50
%
0
20
40
60
80
100
Clay Silt Sand
%
<2 2-6,3 6,3-20 20-63 63-200 200-630 630-2000[µm]
Figure 68. (Grain size diagram 11.03.2003/2) Ground moraine cover Sabove the Namche Bazar settlement at 3510 m a.s.l. in the area of theorographic left valley flank of the Nangpo Tsangpo Drangka. Thematerial has been taken from a digging 1.0 m below the sedimentsurface. The primary maximum of the fine material matrix has beendeveloped with a good 26% in the coarse sand, the secondary peakwith 17% is in the coarse silt and the tertiary peak with ca. 13% is inthe clay. The trimodal (inclusive of the coarse components as theboulders and the skeleton portion the course of the curve would evenbe quadramodal) course of the cumulative curve of the fine materialmatrix is typical of lodgement till (ground moraine) matrix; the rela-tively very high clay portion is also typical of moraine. There is nopossibility for an alternative development of slope debris, because amountain slope with underlying rock does not exist. The sortingcoefficient calculated according to Engelhardt (1973, p. 133) amountsto So = 8.66 (So =
ffiffiffiffiffiffiffiffiffiffiffiffiffiffiffiQ3=Q1
p) and is extremely great. This also argues
for ground moraine in situ. The loss in ignition (LOI) amounts to 1.49.Locality: Figure 3: 11.03.2003/2; Photo 156 third . from the left;Photo 159 in the foreground on the right; Figure 59 I; see Figure 37No. 9. Sampling: M. Kuhle.
LOI: 5.51% So: 4.46
CUMULATIVE FREQUENCY GRAIN SIZE CURVE11.03.03/3
0
10
20
30
40
50
%
0
20
40
60
80
100
Clay Silt Sand
%
<2 2-6,3 6,3-20 20-63 63-200 200-630 630-2000[µm]
Figure 69. (Grain size diagram 11.03.2003/3) Early Late Glacial (StageI; Table 1) material of ground moraine on the slope NE above theNamche Bazar settlement at 3530 m a.s.l. on the medial moraine insetbetween Imja Drangka and Nangpo Tsangpo Drangka. The materialhas been taken from a digging 0.4 m below the slope surface. Theprimary maximum with 26% has been developed in the fine sand, thesecondary peak with 10% is in the clay. The bimodal (inclusive of thelarge components as the boulders and the skeletal portion the course ofthe curve would be trimodal) course of the cumulative curve of the finematerial matrix is typical of ground moraine. The relatively high clayportion is also typical of moraine. The possibility of an alternativedevelopment of slope debris does not exist, because the slope con-cerned is no mountain slope underlaid with rock, but has been madeup from decametre-thick loose material. The sorting coefficient cal-culated according to Engelhardt (1973, p. 133) amounts to So = 4.46(So =
ffiffiffiffiffiffiffiffiffiffiffiffiffiffiffiQ3=Q1
p) and is relatively great. This also argues for moraine.
The loss in ignition (LOI) amounts to 5.51. Locality: Figure 3:11.03.2003/3; Photo 159 . on the right; Figure 59 below II; see Fig-ure 37 No. 10. Sampling M. Kuhle.
M. Kuhle250
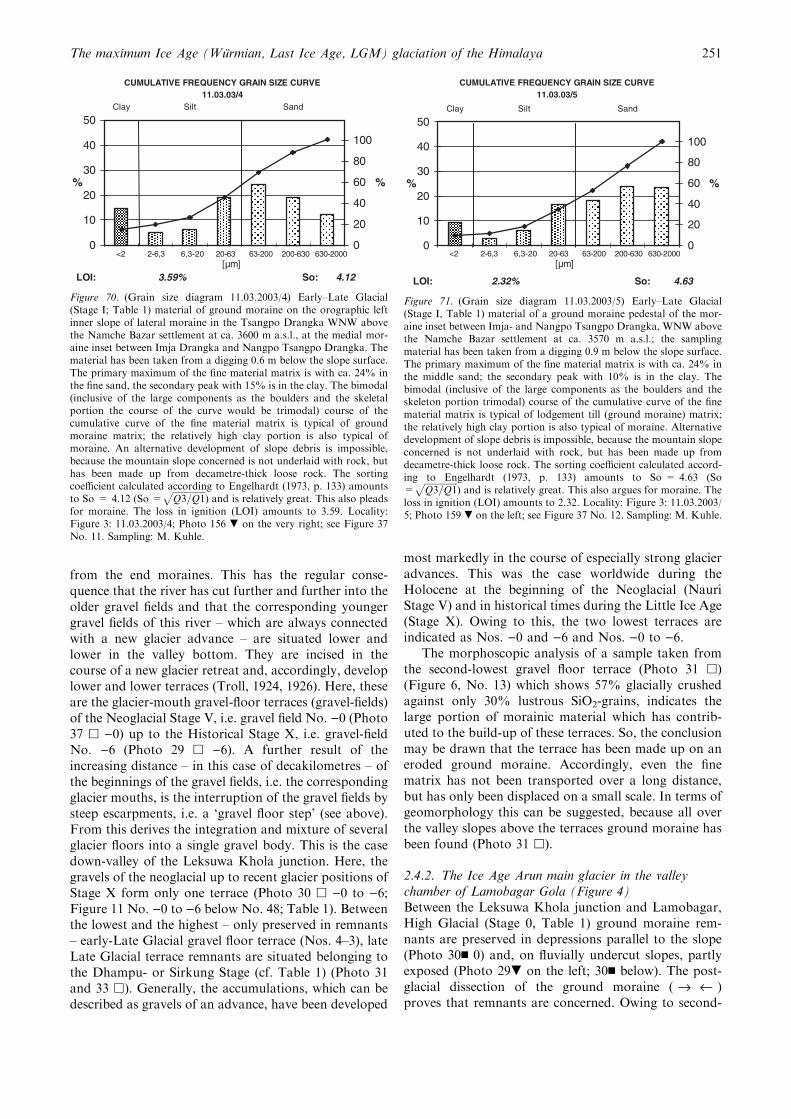
from the end moraines. This has the regular conse-quence that the river has cut further and further into theolder gravel fields and that the corresponding youngergravel fields of this river – which are always connectedwith a new glacier advance – are situated lower andlower in the valley bottom. They are incised in thecourse of a new glacier retreat and, accordingly, developlower and lower terraces (Troll, 1924, 1926). Here, theseare the glacier-mouth gravel-floor terraces (gravel-fields)of the Neoglacial Stage V, i.e. gravel field No. )0 (Photo37 h )0) up to the Historical Stage X, i.e. gravel-fieldNo. )6 (Photo 29 h )6). A further result of theincreasing distance – in this case of decakilometres – ofthe beginnings of the gravel fields, i.e. the correspondingglacier mouths, is the interruption of the gravel fields bysteep escarpments, i.e. a ‘gravel floor step’ (see above).From this derives the integration and mixture of severalglacier floors into a single gravel body. This is the casedown-valley of the Leksuwa Khola junction. Here, thegravels of the neoglacial up to recent glacier positions ofStage X form only one terrace (Photo 30 h )0 to )6;Figure 11 No. )0 to )6 below No. 48; Table 1). Betweenthe lowest and the highest – only preserved in remnants– early-Late Glacial gravel floor terrace (Nos. 4–3), lateLate Glacial terrace remnants are situated belonging tothe Dhampu- or Sirkung Stage (cf. Table 1) (Photo 31and 33 h). Generally, the accumulations, which can bedescribed as gravels of an advance, have been developed
most markedly in the course of especially strong glacieradvances. This was the case worldwide during theHolocene at the beginning of the Neoglacial (NauriStage V) and in historical times during the Little Ice Age(Stage X). Owing to this, the two lowest terraces areindicated as Nos. )0 and )6 and Nos. )0 to )6.
The morphoscopic analysis of a sample taken fromthe second-lowest gravel floor terrace (Photo 31 h)(Figure 6, No. 13) which shows 57% glacially crushedagainst only 30% lustrous SiO2-grains, indicates thelarge portion of morainic material which has contrib-uted to the build-up of these terraces. So, the conclusionmay be drawn that the terrace has been made up on aneroded ground moraine. Accordingly, even the finematrix has not been transported over a long distance,but has only been displaced on a small scale. In terms ofgeomorphology this can be suggested, because all overthe valley slopes above the terraces ground moraine hasbeen found (Photo 31 h).
2.4.2. The Ice Age Arun main glacier in the valleychamber of Lamobagar Gola (Figure 4)Between the Leksuwa Khola junction and Lamobagar,High Glacial (Stage 0, Table 1) ground moraine rem-nants are preserved in depressions parallel to the slope(Photo 30n 0) and, on fluvially undercut slopes, partlyexposed (Photo 29. on the left; 30n below). The post-glacial dissection of the ground moraine ( fi ‹ )proves that remnants are concerned. Owing to second-
LOI: 3.59% So: 4.12
CUMULATIVE FREQUENCY GRAIN SIZE CURVE11.03.03/4
0
10
20
30
40
50
%
0
20
40
60
80
100
Clay Silt Sand
%
<2 2-6,3 6,3-20 20-63 63-200 200-630 630-2000[µm]
Figure 70. (Grain size diagram 11.03.2003/4) Early–Late Glacial(Stage I; Table 1) material of ground moraine on the orographic leftinner slope of lateral moraine in the Tsangpo Drangka WNW abovethe Namche Bazar settlement at ca. 3600 m a.s.l., at the medial mor-aine inset between Imja Drangka and Nangpo Tsangpo Drangka. Thematerial has been taken from a digging 0.6 m below the slope surface.The primary maximum of the fine material matrix is with ca. 24% inthe fine sand, the secondary peak with 15% is in the clay. The bimodal(inclusive of the large components as the boulders and the skeletalportion the course of the curve would be trimodal) course of thecumulative curve of the fine material matrix is typical of groundmoraine matrix; the relatively high clay portion is also typical ofmoraine. An alternative development of slope debris is impossible,because the mountain slope concerned is not underlaid with rock, buthas been made up from decametre-thick loose rock. The sortingcoefficient calculated according to Engelhardt (1973, p. 133) amountsto So = 4.12 (So =
ffiffiffiffiffiffiffiffiffiffiffiffiffiffiffiQ3=Q1
p) and is relatively great. This also pleads
for moraine. The loss in ignition (LOI) amounts to 3.59. Locality:Figure 3: 11.03.2003/4; Photo 156 . on the very right; see Figure 37No. 11. Sampling: M. Kuhle.
LOI: 2.32% So: 4.63
CUMULATIVE FREQUENCY GRAIN SIZE CURVE11.03.03/5
0
10
20
30
40
50
%
0
20
40
60
80
100
Clay Silt Sand
%
<2 2-6,3 6,3-20 20-63 63-200 200-630 630-2000[µm]
Figure 71. (Grain size diagram 11.03.2003/5) Early–Late Glacial(Stage I, Table 1) material of a ground moraine pedestal of the mor-aine inset between Imja- and Nangpo Tsangpo Drangka, WNW abovethe Namche Bazar settlement at ca. 3570 m a.s.l.; the samplingmaterial has been taken from a digging 0.9 m below the slope surface.The primary maximum of the fine material matrix is with ca. 24% inthe middle sand; the secondary peak with 10% is in the clay. Thebimodal (inclusive of the large components as the boulders and theskeleton portion trimodal) course of the cumulative curve of the finematerial matrix is typical of lodgement till (ground moraine) matrix;the relatively high clay portion is also typical of moraine. Alternativedevelopment of slope debris is impossible, because the mountain slopeconcerned is not underlaid with rock, but has been made up fromdecametre-thick loose rock. The sorting coefficient calculated accord-ing to Engelhardt (1973, p. 133) amounts to So = 4.63 (So=
ffiffiffiffiffiffiffiffiffiffiffiffiffiffiffiQ3=Q1
p) and is relatively great. This also argues for moraine. The
loss in ignition (LOI) amounts to 2.32. Locality: Figure 3: 11.03.2003/5; Photo 159 . on the left; see Figure 37 No. 12. Sampling: M. Kuhle.
The maximum Ice Age (Wurmian, Last Ice Age, LGM) glaciation of the Himalaya 251
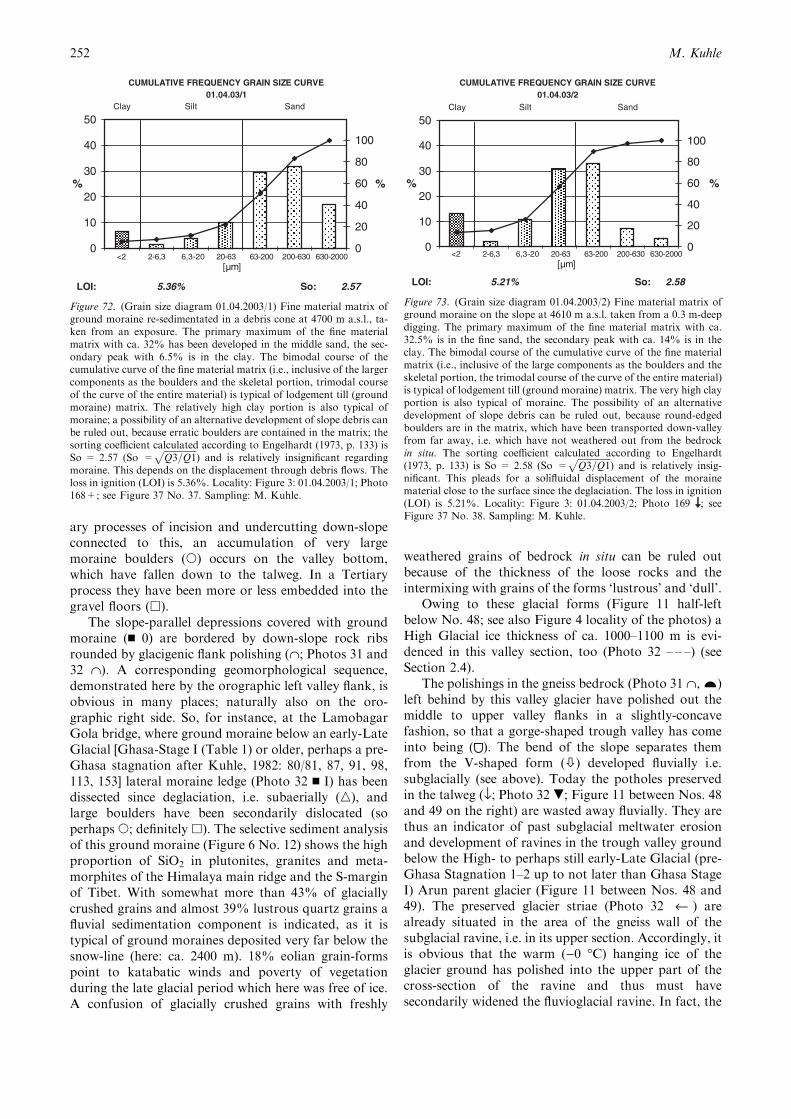
ary processes of incision and undercutting down-slopeconnected to this, an accumulation of very largemoraine boulders (s) occurs on the valley bottom,which have fallen down to the talweg. In a Tertiaryprocess they have been more or less embedded into thegravel floors (h).
The slope-parallel depressions covered with groundmoraine (n 0) are bordered by down-slope rock ribsrounded by glacigenic flank polishing (˙; Photos 31 and32 ˙). A corresponding geomorphological sequence,demonstrated here by the orographic left valley flank, isobvious in many places; naturally also on the oro-graphic right side. So, for instance, at the LamobagarGola bridge, where ground moraine below an early-LateGlacial [Ghasa-Stage I (Table 1) or older, perhaps a pre-Ghasa stagnation after Kuhle, 1982: 80/81, 87, 91, 98,113, 153] lateral moraine ledge (Photo 32 n I) has beendissected since deglaciation, i.e. subaerially (n), andlarge boulders have been secondarily dislocated (soperhaps s; definitely h). The selective sediment analysisof this ground moraine (Figure 6 No. 12) shows the highproportion of SiO2 in plutonites, granites and meta-morphites of the Himalaya main ridge and the S-marginof Tibet. With somewhat more than 43% of glaciallycrushed grains and almost 39% lustrous quartz grains afluvial sedimentation component is indicated, as it istypical of ground moraines deposited very far below thesnow-line (here: ca. 2400 m). 18% eolian grain-formspoint to katabatic winds and poverty of vegetationduring the late glacial period which here was free of ice.A confusion of glacially crushed grains with freshly
weathered grains of bedrock in situ can be ruled outbecause of the thickness of the loose rocks and theintermixing with grains of the forms ‘lustrous’ and ‘dull’.
Owing to these glacial forms (Figure 11 half-leftbelow No. 48; see also Figure 4 locality of the photos) aHigh Glacial ice thickness of ca. 1000–1100 m is evi-denced in this valley section, too (Photo 32 – – –) (seeSection 2.4).
The polishings in the gneiss bedrock (Photo 31 ˙,…)left behind by this valley glacier have polished out themiddle to upper valley flanks in a slightly-concavefashion, so that a gorge-shaped trough valley has comeinto being ( ). The bend of the slope separates themfrom the V-shaped form (�) developed fluvially i.e.subglacially (see above). Today the potholes preservedin the talweg (fl; Photo 32 .; Figure 11 between Nos. 48and 49 on the right) are wasted away fluvially. They arethus an indicator of past subglacial meltwater erosionand development of ravines in the trough valley groundbelow the High- to perhaps still early-Late Glacial (pre-Ghasa Stagnation 1–2 up to not later than Ghasa StageI) Arun parent glacier (Figure 11 between Nos. 48 and49). The preserved glacier striae (Photo 32 ‹ ) arealready situated in the area of the gneiss wall of thesubglacial ravine, i.e. in its upper section. Accordingly, itis obvious that the warm ()0 �C) hanging ice of theglacier ground has polished into the upper part of thecross-section of the ravine and thus must havesecondarily widened the fluvioglacial ravine. In fact, the
LOI: 5.36% So: 2.57
CUMULATIVE FREQUENCY GRAIN SIZE CURVE01.04.03/1
0
10
20
30
40
50
%
0
20
40
60
80
100
Clay Silt Sand
%
<2 2-6,3 6,3-20 20-63 63-200 200-630 630-2000[µm]
Figure 72. (Grain size diagram 01.04.2003/1) Fine material matrix ofground moraine re-sedimentated in a debris cone at 4700 m a.s.l., ta-ken from an exposure. The primary maximum of the fine materialmatrix with ca. 32% has been developed in the middle sand, the sec-ondary peak with 6.5% is in the clay. The bimodal course of thecumulative curve of the fine material matrix (i.e., inclusive of the largercomponents as the boulders and the skeletal portion, trimodal courseof the curve of the entire material) is typical of lodgement till (groundmoraine) matrix. The relatively high clay portion is also typical ofmoraine; a possibility of an alternative development of slope debris canbe ruled out, because erratic boulders are contained in the matrix; thesorting coefficient calculated according to Engelhardt (1973, p. 133) isSo = 2.57 (So =
ffiffiffiffiffiffiffiffiffiffiffiffiffiffiffiQ3=Q1
p) and is relatively insignificant regarding
moraine. This depends on the displacement through debris flows. Theloss in ignition (LOI) is 5.36%. Locality: Figure 3: 01.04.2003/1; Photo168+; see Figure 37 No. 37. Sampling: M. Kuhle.
LOI: 5.21% So: 2.58
CUMULATIVE FREQUENCY GRAIN SIZE CURVE01.04.03/2
0
10
20
30
40
50
%
0
20
40
60
80
100
Clay Silt Sand
%
<2 2-6,3 6,3-20 20-63 63-200 200-630 630-2000[µm]
Figure 73. (Grain size diagram 01.04.2003/2) Fine material matrix ofground moraine on the slope at 4610 m a.s.l. taken from a 0.3 m-deepdigging. The primary maximum of the fine material matrix with ca.32.5% is in the fine sand, the secondary peak with ca. 14% is in theclay. The bimodal course of the cumulative curve of the fine materialmatrix (i.e., inclusive of the large components as the boulders and theskeletal portion, the trimodal course of the curve of the entire material)is typical of lodgement till (ground moraine) matrix. The very high clayportion is also typical of moraine. The possibility of an alternativedevelopment of slope debris can be ruled out, because round-edgedboulders are in the matrix, which have been transported down-valleyfrom far away, i.e. which have not weathered out from the bedrockin situ. The sorting coefficient calculated according to Engelhardt(1973, p. 133) is So = 2.58 (So =
ffiffiffiffiffiffiffiffiffiffiffiffiffiffiffiQ3=Q1
p) and is relatively insig-
nificant. This pleads for a solifluidal displacement of the morainematerial close to the surface since the deglaciation. The loss in ignition(LOI) is 5.21%. Locality: Figure 3: 01.04.2003/2; Photo 169 ; seeFigure 37 No. 38. Sampling: M. Kuhle.
M. Kuhle252
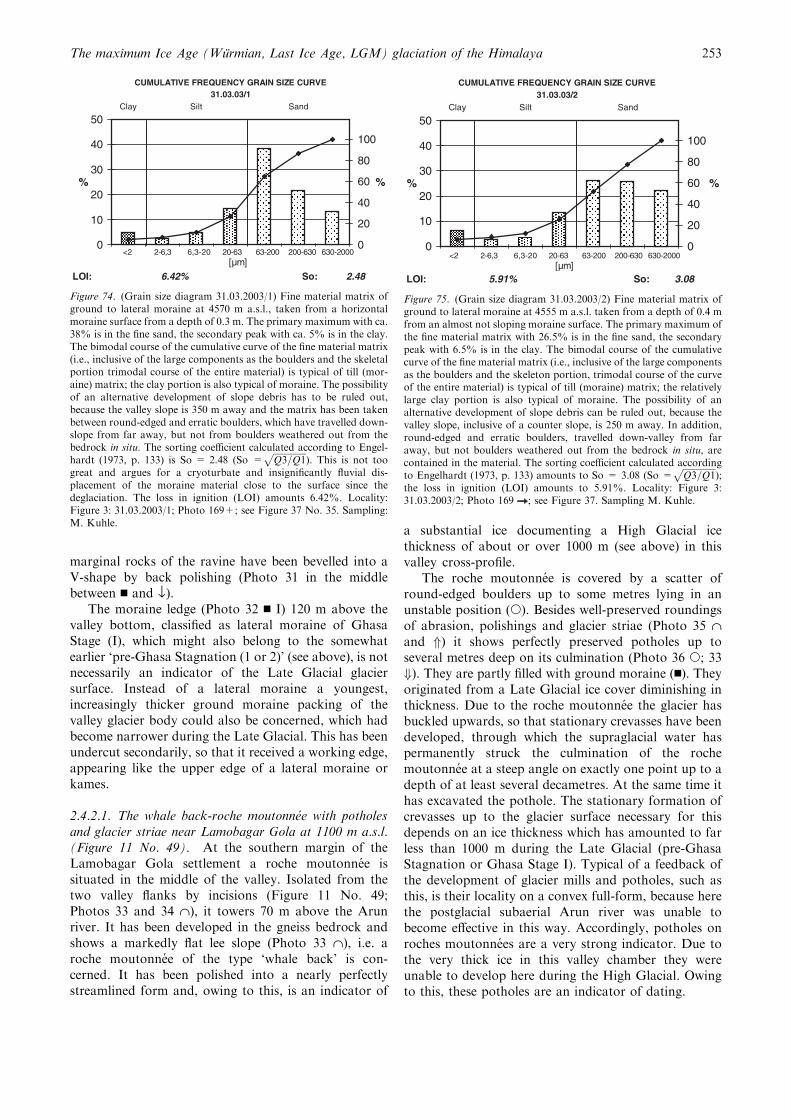
marginal rocks of the ravine have been bevelled into aV-shape by back polishing (Photo 31 in the middlebetween n and fl).
The moraine ledge (Photo 32 n I) 120 m above thevalley bottom, classified as lateral moraine of GhasaStage (I), which might also belong to the somewhatearlier ‘pre-Ghasa Stagnation (1 or 2)’ (see above), is notnecessarily an indicator of the Late Glacial glaciersurface. Instead of a lateral moraine a youngest,increasingly thicker ground moraine packing of thevalley glacier body could also be concerned, which hadbecome narrower during the Late Glacial. This has beenundercut secondarily, so that it received a working edge,appearing like the upper edge of a lateral moraine orkames.
2.4.2.1. The whale back-roche moutonnee with potholesand glacier striae near Lamobagar Gola at 1100 m a.s.l.(Figure 11 No. 49). At the southern margin of theLamobagar Gola settlement a roche moutonnee issituated in the middle of the valley. Isolated from thetwo valley flanks by incisions (Figure 11 No. 49;Photos 33 and 34 ˙), it towers 70 m above the Arunriver. It has been developed in the gneiss bedrock andshows a markedly flat lee slope (Photo 33 ˙), i.e. aroche moutonnee of the type ‘whale back’ is con-cerned. It has been polished into a nearly perfectlystreamlined form and, owing to this, is an indicator of
a substantial ice documenting a High Glacial icethickness of about or over 1000 m (see above) in thisvalley cross-profile.
The roche moutonnee is covered by a scatter ofround-edged boulders up to some metres lying in anunstable position (s). Besides well-preserved roundingsof abrasion, polishings and glacier striae (Photo 35 ˙and *) it shows perfectly preserved potholes up toseveral metres deep on its culmination (Photo 36 s; 33+). They are partly filled with ground moraine (n). Theyoriginated from a Late Glacial ice cover diminishing inthickness. Due to the roche moutonnee the glacier hasbuckled upwards, so that stationary crevasses have beendeveloped, through which the supraglacial water haspermanently struck the culmination of the rochemoutonnee at a steep angle on exactly one point up to adepth of at least several decametres. At the same time ithas excavated the pothole. The stationary formation ofcrevasses up to the glacier surface necessary for thisdepends on an ice thickness which has amounted to farless than 1000 m during the Late Glacial (pre-GhasaStagnation or Ghasa Stage I). Typical of a feedback ofthe development of glacier mills and potholes, such asthis, is their locality on a convex full-form, because herethe postglacial subaerial Arun river was unable tobecome effective in this way. Accordingly, potholes onroches moutonnees are a very strong indicator. Due tothe very thick ice in this valley chamber they wereunable to develop here during the High Glacial. Owingto this, these potholes are an indicator of dating.
LOI: 5.91% So: 3.08
CUMULATIVE FREQUENCY GRAIN SIZE CURVE31.03.03/2
0
10
20
30
40
50
%
0
20
40
60
80
100
Clay Silt Sand
%
<2 2-6,3 6,3-20 20-63 63-200 200-630 630-2000[µm]
Figure 75. (Grain size diagram 31.03.2003/2) Fine material matrix ofground to lateral moraine at 4555 m a.s.l. taken from a depth of 0.4 mfrom an almost not sloping moraine surface. The primary maximum ofthe fine material matrix with 26.5% is in the fine sand, the secondarypeak with 6.5% is in the clay. The bimodal course of the cumulativecurve of the fine material matrix (i.e., inclusive of the large componentsas the boulders and the skeleton portion, trimodal course of the curveof the entire material) is typical of till (moraine) matrix; the relativelylarge clay portion is also typical of moraine. The possibility of analternative development of slope debris can be ruled out, because thevalley slope, inclusive of a counter slope, is 250 m away. In addition,round-edged and erratic boulders, travelled down-valley from faraway, but not boulders weathered out from the bedrock in situ, arecontained in the material. The sorting coefficient calculated accordingto Engelhardt (1973, p. 133) amounts to So = 3.08 (So =
ffiffiffiffiffiffiffiffiffiffiffiffiffiffiffiQ3=Q1
p);
the loss in ignition (LOI) amounts to 5.91%. Locality: Figure 3:31.03.2003/2; Photo 169 ; see Figure 37. Sampling M. Kuhle.
LOI: 6.42% So: 2.48
CUMULATIVE FREQUENCY GRAIN SIZE CURVE31.03.03/1
0
10
20
30
40
50
%
0
20
40
60
80
100
Clay Silt Sand
%
<2 2-6,3 6,3-20 20-63 63-200 200-630 630-2000[µm]
Figure 74. (Grain size diagram 31.03.2003/1) Fine material matrix ofground to lateral moraine at 4570 m a.s.l., taken from a horizontalmoraine surface from a depth of 0.3 m. The primary maximum with ca.38% is in the fine sand, the secondary peak with ca. 5% is in the clay.The bimodal course of the cumulative curve of the fine material matrix(i.e., inclusive of the large components as the boulders and the skeletalportion trimodal course of the entire material) is typical of till (mor-aine) matrix; the clay portion is also typical of moraine. The possibilityof an alternative development of slope debris has to be ruled out,because the valley slope is 350 m away and the matrix has been takenbetween round-edged and erratic boulders, which have travelled down-slope from far away, but not from boulders weathered out from thebedrock in situ. The sorting coefficient calculated according to Engel-hardt (1973, p. 133) is So = 2.48 (So =
ffiffiffiffiffiffiffiffiffiffiffiffiffiffiffiQ3=Q1
p). This is not too
great and argues for a cryoturbate and insignificantly fluvial dis-placement of the moraine material close to the surface since thedeglaciation. The loss in ignition (LOI) amounts 6.42%. Locality:Figure 3: 31.03.2003/1; Photo 169+; see Figure 37 No. 35. Sampling:M. Kuhle.
The maximum Ice Age (Wurmian, Last Ice Age, LGM) glaciation of the Himalaya 253
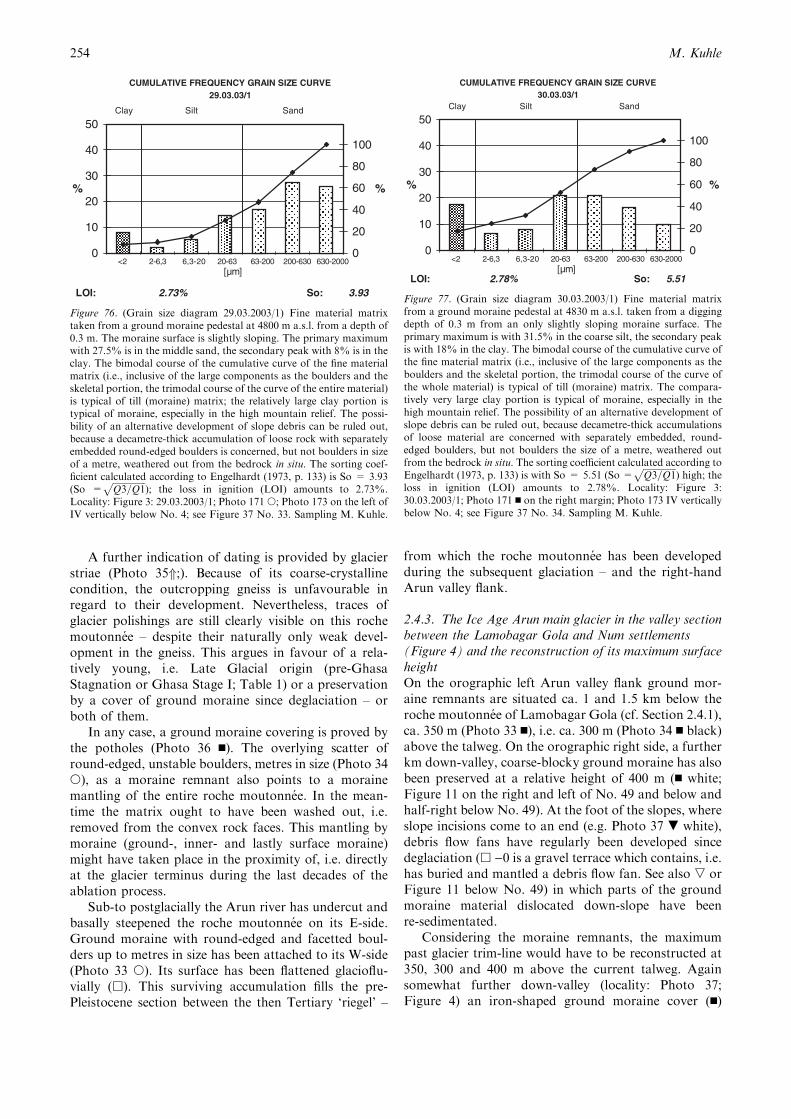
A further indication of dating is provided by glacierstriae (Photo 35*;). Because of its coarse-crystallinecondition, the outcropping gneiss is unfavourable inregard to their development. Nevertheless, traces ofglacier polishings are still clearly visible on this rochemoutonnee – despite their naturally only weak devel-opment in the gneiss. This argues in favour of a rela-tively young, i.e. Late Glacial origin (pre-GhasaStagnation or Ghasa Stage I; Table 1) or a preservationby a cover of ground moraine since deglaciation – orboth of them.
In any case, a ground moraine covering is proved bythe potholes (Photo 36 n). The overlying scatter ofround-edged, unstable boulders, metres in size (Photo 34s), as a moraine remnant also points to a morainemantling of the entire roche moutonnee. In the mean-time the matrix ought to have been washed out, i.e.removed from the convex rock faces. This mantling bymoraine (ground-, inner- and lastly surface moraine)might have taken place in the proximity of, i.e. directlyat the glacier terminus during the last decades of theablation process.
Sub-to postglacially the Arun river has undercut andbasally steepened the roche moutonnee on its E-side.Ground moraine with round-edged and facetted boul-ders up to metres in size has been attached to its W-side(Photo 33 s). Its surface has been flattened glacioflu-vially (h). This surviving accumulation fills the pre-Pleistocene section between the then Tertiary ‘riegel’ –
from which the roche moutonnee has been developedduring the subsequent glaciation – and the right-handArun valley flank.
2.4.3. The Ice Age Arun main glacier in the valley sectionbetween the Lamobagar Gola and Num settlements(Figure 4) and the reconstruction of its maximum surfaceheightOn the orographic left Arun valley flank ground mor-aine remnants are situated ca. 1 and 1.5 km below theroche moutonnee of Lamobagar Gola (cf. Section 2.4.1),ca. 350 m (Photo 33 n), i.e. ca. 300 m (Photo 34 n black)above the talweg. On the orographic right side, a furtherkm down-valley, coarse-blocky ground moraine has alsobeen preserved at a relative height of 400 m (n white;Figure 11 on the right and left of No. 49 and below andhalf-right below No. 49). At the foot of the slopes, whereslope incisions come to an end (e.g. Photo 37 . white),debris flow fans have regularly been developed sincedeglaciation (h )0 is a gravel terrace which contains, i.e.has buried and mantled a debris flow fan. See also , orFigure 11 below No. 49) in which parts of the groundmoraine material dislocated down-slope have beenre-sedimentated.
Considering the moraine remnants, the maximumpast glacier trim-line would have to be reconstructed at350, 300 and 400 m above the current talweg. Againsomewhat further down-valley (locality: Photo 37;Figure 4) an iron-shaped ground moraine cover (n)
LOI: 2.73% So: 3.93
CUMULATIVE FREQUENCY GRAIN SIZE CURVE29.03.03/1
0
10
20
30
40
50
%
0
20
40
60
80
100
Clay Silt Sand
%
<2 2-6,3 6,3-20 20-63 63-200 200-630 630-2000[µm]
Figure 76. (Grain size diagram 29.03.2003/1) Fine material matrixtaken from a ground moraine pedestal at 4800 m a.s.l. from a depth of0.3 m. The moraine surface is slightly sloping. The primary maximumwith 27.5% is in the middle sand, the secondary peak with 8% is in theclay. The bimodal course of the cumulative curve of the fine materialmatrix (i.e., inclusive of the large components as the boulders and theskeletal portion, the trimodal course of the curve of the entire material)is typical of till (moraine) matrix; the relatively large clay portion istypical of moraine, especially in the high mountain relief. The possi-bility of an alternative development of slope debris can be ruled out,because a decametre-thick accumulation of loose rock with separatelyembedded round-edged boulders is concerned, but not boulders in sizeof a metre, weathered out from the bedrock in situ. The sorting coef-ficient calculated according to Engelhardt (1973, p. 133) is So = 3.93(So =
ffiffiffiffiffiffiffiffiffiffiffiffiffiffiffiQ3=Q1
p); the loss in ignition (LOI) amounts to 2.73%.
Locality: Figure 3: 29.03.2003/1; Photo 171 s; Photo 173 on the left ofIV vertically below No. 4; see Figure 37 No. 33. Sampling M. Kuhle.
LOI: 2.78% So: 5.51
CUMULATIVE FREQUENCY GRAIN SIZE CURVE30.03.03/1
0
10
20
30
40
50
%
0
20
40
60
80
100
Clay Silt Sand
%
<2 2-6,3 6,3-20 20-63 63-200 200-630 630-2000[µm]
Figure 77. (Grain size diagram 30.03.2003/1) Fine material matrixfrom a ground moraine pedestal at 4830 m a.s.l. taken from a diggingdepth of 0.3 m from an only slightly sloping moraine surface. Theprimary maximum is with 31.5% in the coarse silt, the secondary peakis with 18% in the clay. The bimodal course of the cumulative curve ofthe fine material matrix (i.e., inclusive of the large components as theboulders and the skeletal portion, the trimodal course of the curve ofthe whole material) is typical of till (moraine) matrix. The compara-tively very large clay portion is typical of moraine, especially in thehigh mountain relief. The possibility of an alternative development ofslope debris can be ruled out, because decametre-thick accumulationsof loose material are concerned with separately embedded, round-edged boulders, but not boulders the size of a metre, weathered outfrom the bedrock in situ. The sorting coefficient calculated according toEngelhardt (1973, p. 133) is with So = 5.51 (So =
ffiffiffiffiffiffiffiffiffiffiffiffiffiffiffiQ3=Q1
p) high; the
loss in ignition (LOI) amounts to 2.78%. Locality: Figure 3:30.03.2003/1; Photo 171 n on the right margin; Photo 173 IV verticallybelow No. 4; see Figure 37 No. 34. Sampling M. Kuhle.
M. Kuhle254
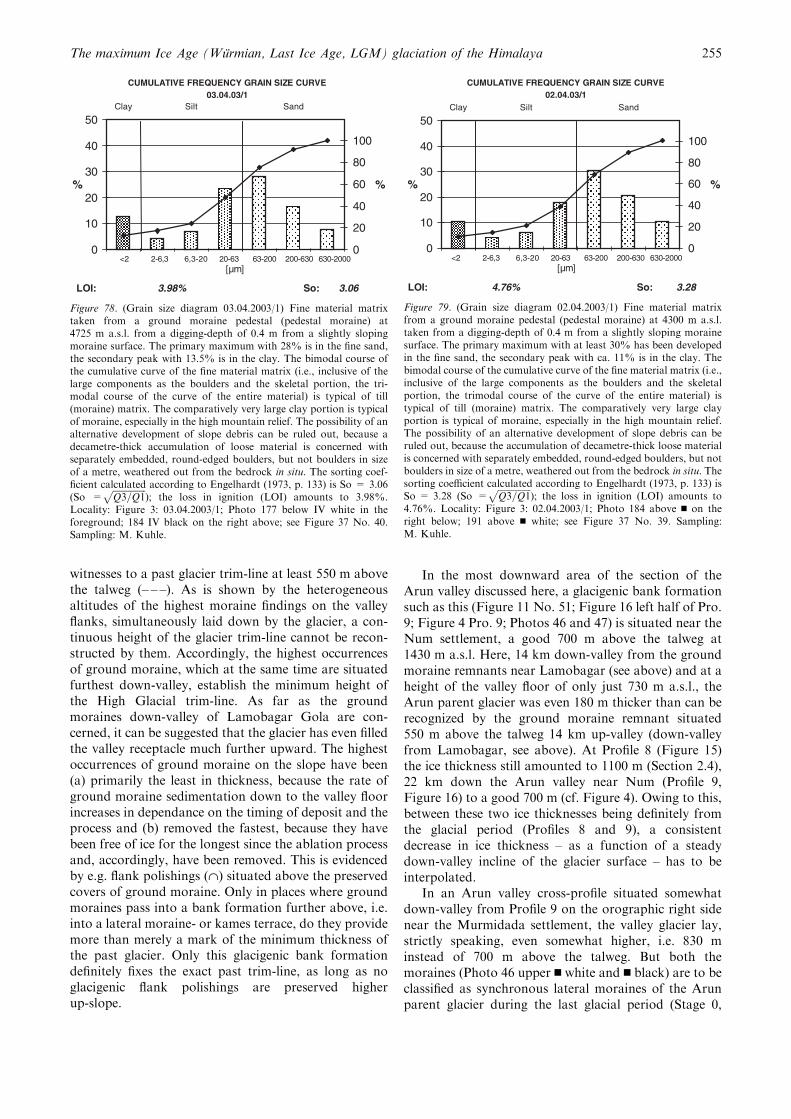
witnesses to a past glacier trim-line at least 550 m abovethe talweg (– – –). As is shown by the heterogeneousaltitudes of the highest moraine findings on the valleyflanks, simultaneously laid down by the glacier, a con-tinuous height of the glacier trim-line cannot be recon-structed by them. Accordingly, the highest occurrencesof ground moraine, which at the same time are situatedfurthest down-valley, establish the minimum height ofthe High Glacial trim-line. As far as the groundmoraines down-valley of Lamobagar Gola are con-cerned, it can be suggested that the glacier has even filledthe valley receptacle much further upward. The highestoccurrences of ground moraine on the slope have been(a) primarily the least in thickness, because the rate ofground moraine sedimentation down to the valley floorincreases in dependance on the timing of deposit and theprocess and (b) removed the fastest, because they havebeen free of ice for the longest since the ablation processand, accordingly, have been removed. This is evidencedby e.g. flank polishings (˙) situated above the preservedcovers of ground moraine. Only in places where groundmoraines pass into a bank formation further above, i.e.into a lateral moraine- or kames terrace, do they providemore than merely a mark of the minimum thickness ofthe past glacier. Only this glacigenic bank formationdefinitely fixes the exact past trim-line, as long as noglacigenic flank polishings are preserved higherup-slope.
In the most downward area of the section of theArun valley discussed here, a glacigenic bank formationsuch as this (Figure 11 No. 51; Figure 16 left half of Pro.9; Figure 4 Pro. 9; Photos 46 and 47) is situated near theNum settlement, a good 700 m above the talweg at1430 m a.s.l. Here, 14 km down-valley from the groundmoraine remnants near Lamobagar (see above) and at aheight of the valley floor of only just 730 m a.s.l., theArun parent glacier was even 180 m thicker than can berecognized by the ground moraine remnant situated550 m above the talweg 14 km up-valley (down-valleyfrom Lamobagar, see above). At Profile 8 (Figure 15)the ice thickness still amounted to 1100 m (Section 2.4),22 km down the Arun valley near Num (Profile 9,Figure 16) to a good 700 m (cf. Figure 4). Owing to this,between these two ice thicknesses being definitely fromthe glacial period (Profiles 8 and 9), a consistentdecrease in ice thickness – as a function of a steadydown-valley incline of the glacier surface – has to beinterpolated.
In an Arun valley cross-profile situated somewhatdown-valley from Profile 9 on the orographic right sidenear the Murmidada settlement, the valley glacier lay,strictly speaking, even somewhat higher, i.e. 830 minstead of 700 m above the talweg. But both themoraines (Photo 46 upper n white and n black) are to beclassified as synchronous lateral moraines of the Arunparent glacier during the last glacial period (Stage 0,
LOI: 3.98% So: 3.06
CUMULATIVE FREQUENCY GRAIN SIZE CURVE03.04.03/1
0
10
20
30
40
50
%
0
20
40
60
80
100
Clay Silt Sand
%
<2 2-6,3 6,3-20 20-63 63-200 200-630 630-2000[µm]
Figure 78. (Grain size diagram 03.04.2003/1) Fine material matrixtaken from a ground moraine pedestal (pedestal moraine) at4725 m a.s.l. from a digging-depth of 0.4 m from a slightly slopingmoraine surface. The primary maximum with 28% is in the fine sand,the secondary peak with 13.5% is in the clay. The bimodal course ofthe cumulative curve of the fine material matrix (i.e., inclusive of thelarge components as the boulders and the skeletal portion, the tri-modal course of the curve of the entire material) is typical of till(moraine) matrix. The comparatively very large clay portion is typicalof moraine, especially in the high mountain relief. The possibility of analternative development of slope debris can be ruled out, because adecametre-thick accumulation of loose material is concerned withseparately embedded, round-edged boulders, but not boulders in sizeof a metre, weathered out from the bedrock in situ. The sorting coef-ficient calculated according to Engelhardt (1973, p. 133) is So = 3.06(So =
ffiffiffiffiffiffiffiffiffiffiffiffiffiffiffiQ3=Q1
p); the loss in ignition (LOI) amounts to 3.98%.
Locality: Figure 3: 03.04.2003/1; Photo 177 below IV white in theforeground; 184 IV black on the right above; see Figure 37 No. 40.Sampling: M. Kuhle.
LOI: 4.76% So: 3.28
CUMULATIVE FREQUENCY GRAIN SIZE CURVE02.04.03/1
0
10
20
30
40
50
%
0
20
40
60
80
100
Clay Silt Sand
%
<2 2-6,3 6,3-20 20-63 63-200 200-630 630-2000[µm]
Figure 79. (Grain size diagram 02.04.2003/1) Fine material matrixfrom a ground moraine pedestal (pedestal moraine) at 4300 m a.s.l.taken from a digging-depth of 0.4 m from a slightly sloping morainesurface. The primary maximum with at least 30% has been developedin the fine sand, the secondary peak with ca. 11% is in the clay. Thebimodal course of the cumulative curve of the fine material matrix (i.e.,inclusive of the large components as the boulders and the skeletalportion, the trimodal course of the curve of the entire material) istypical of till (moraine) matrix. The comparatively very large clayportion is typical of moraine, especially in the high mountain relief.The possibility of an alternative development of slope debris can beruled out, because the accumulation of decametre-thick loose materialis concerned with separately embedded, round-edged boulders, but notboulders in size of a metre, weathered out from the bedrock in situ. Thesorting coefficient calculated according to Engelhardt (1973, p. 133) isSo = 3.28 (So =
ffiffiffiffiffiffiffiffiffiffiffiffiffiffiffiQ3=Q1
p); the loss in ignition (LOI) amounts to
4.76%. Locality: Figure 3: 02.04.2003/1; Photo 184 above n on theright below; 191 above n white; see Figure 37 No. 39. Sampling:M. Kuhle.
The maximum Ice Age (Wurmian, Last Ice Age, LGM) glaciation of the Himalaya 255
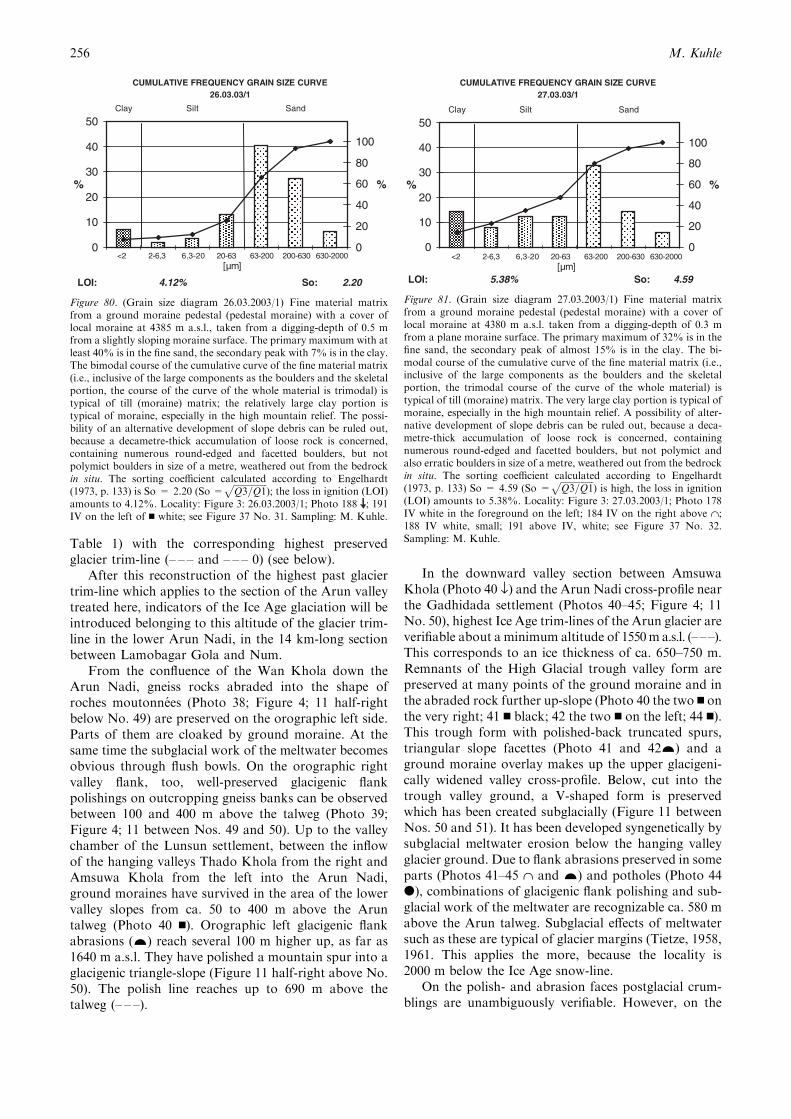
Table 1) with the corresponding highest preservedglacier trim-line (– – – and – – – 0) (see below).
After this reconstruction of the highest past glaciertrim-line which applies to the section of the Arun valleytreated here, indicators of the Ice Age glaciation will beintroduced belonging to this altitude of the glacier trim-line in the lower Arun Nadi, in the 14 km-long sectionbetween Lamobagar Gola and Num.
From the confluence of the Wan Khola down theArun Nadi, gneiss rocks abraded into the shape ofroches moutonnees (Photo 38; Figure 4; 11 half-rightbelow No. 49) are preserved on the orographic left side.Parts of them are cloaked by ground moraine. At thesame time the subglacial work of the meltwater becomesobvious through flush bowls. On the orographic rightvalley flank, too, well-preserved glacigenic flankpolishings on outcropping gneiss banks can be observedbetween 100 and 400 m above the talweg (Photo 39;Figure 4; 11 between Nos. 49 and 50). Up to the valleychamber of the Lunsun settlement, between the inflowof the hanging valleys Thado Khola from the right andAmsuwa Khola from the left into the Arun Nadi,ground moraines have survived in the area of the lowervalley slopes from ca. 50 to 400 m above the Aruntalweg (Photo 40 n). Orographic left glacigenic flankabrasions (…) reach several 100 m higher up, as far as1640 m a.s.l. They have polished a mountain spur into aglacigenic triangle-slope (Figure 11 half-right above No.50). The polish line reaches up to 690 m above thetalweg (– – –).
In the downward valley section between AmsuwaKhola (Photo 40 fl) and the Arun Nadi cross-profile nearthe Gadhidada settlement (Photos 40–45; Figure 4; 11No. 50), highest Ice Age trim-lines of the Arun glacier areverifiable about a minimum altitude of 1550m a.s.l. (–––).This corresponds to an ice thickness of ca. 650–750 m.Remnants of the High Glacial trough valley form arepreserved at many points of the ground moraine and inthe abraded rock further up-slope (Photo 40 the two n onthe very right; 41 n black; 42 the two n on the left; 44 n).This trough form with polished-back truncated spurs,triangular slope facettes (Photo 41 and 42…) and aground moraine overlay makes up the upper glacigeni-cally widened valley cross-profile. Below, cut into thetrough valley ground, a V-shaped form is preservedwhich has been created subglacially (Figure 11 betweenNos. 50 and 51). It has been developed syngenetically bysubglacial meltwater erosion below the hanging valleyglacier ground. Due to flank abrasions preserved in someparts (Photos 41–45 ˙ and …) and potholes (Photo 44d), combinations of glacigenic flank polishing and sub-glacial work of the meltwater are recognizable ca. 580 mabove the Arun talweg. Subglacial effects of meltwatersuch as these are typical of glacier margins (Tietze, 1958,1961. This applies the more, because the locality is2000 m below the Ice Age snow-line.
On the polish- and abrasion faces postglacial crum-blings are unambiguously verifiable. However, on the
LOI: 5.38% So: 4.59
CUMULATIVE FREQUENCY GRAIN SIZE CURVE27.03.03/1
0
10
20
30
40
50
%
0
20
40
60
80
100
Clay Silt Sand
%
<2 2-6,3 6,3-20 20-63 63-200 200-630 630-2000[µm]
Figure 81. (Grain size diagram 27.03.2003/1) Fine material matrixfrom a ground moraine pedestal (pedestal moraine) with a cover oflocal moraine at 4380 m a.s.l. taken from a digging-depth of 0.3 mfrom a plane moraine surface. The primary maximum of 32% is in thefine sand, the secondary peak of almost 15% is in the clay. The bi-modal course of the cumulative curve of the fine material matrix (i.e.,inclusive of the large components as the boulders and the skeletalportion, the trimodal course of the curve of the whole material) istypical of till (moraine) matrix. The very large clay portion is typical ofmoraine, especially in the high mountain relief. A possibility of alter-native development of slope debris can be ruled out, because a deca-metre-thick accumulation of loose rock is concerned, containingnumerous round-edged and facetted boulders, but not polymict andalso erratic boulders in size of a metre, weathered out from the bedrockin situ. The sorting coefficient calculated according to Engelhardt(1973, p. 133) So = 4.59 (So =
ffiffiffiffiffiffiffiffiffiffiffiffiffiffiffiQ3=Q1
p) is high, the loss in ignition
(LOI) amounts to 5.38%. Locality: Figure 3: 27.03.2003/1; Photo 178IV white in the foreground on the left; 184 IV on the right above ˙;188 IV white, small; 191 above IV, white; see Figure 37 No. 32.Sampling: M. Kuhle.
LOI: 4.12% So: 2.20
CUMULATIVE FREQUENCY GRAIN SIZE CURVE26.03.03/1
0
10
20
30
40
50
%
0
20
40
60
80
100
Clay Silt Sand
%
<2 2-6,3 6,3-20 20-63 63-200 200-630 630-2000[µm]
Figure 80. (Grain size diagram 26.03.2003/1) Fine material matrixfrom a ground moraine pedestal (pedestal moraine) with a cover oflocal moraine at 4385 m a.s.l., taken from a digging-depth of 0.5 mfrom a slightly sloping moraine surface. The primary maximum with atleast 40% is in the fine sand, the secondary peak with 7% is in the clay.The bimodal course of the cumulative curve of the fine material matrix(i.e., inclusive of the large components as the boulders and the skeletalportion, the course of the curve of the whole material is trimodal) istypical of till (moraine) matrix; the relatively large clay portion istypical of moraine, especially in the high mountain relief. The possi-bility of an alternative development of slope debris can be ruled out,because a decametre-thick accumulation of loose rock is concerned,containing numerous round-edged and facetted boulders, but notpolymict boulders in size of a metre, weathered out from the bedrockin situ. The sorting coefficient calculated according to Engelhardt(1973, p. 133) is So = 2.20 (So =
ffiffiffiffiffiffiffiffiffiffiffiffiffiffiffiQ3=Q1
p); the loss in ignition (LOI)
amounts to 4.12%. Locality: Figure 3: 26.03.2003/1; Photo 188 ; 191IV on the left of n white; see Figure 37 No. 31. Sampling: M. Kuhle.
M. Kuhle256
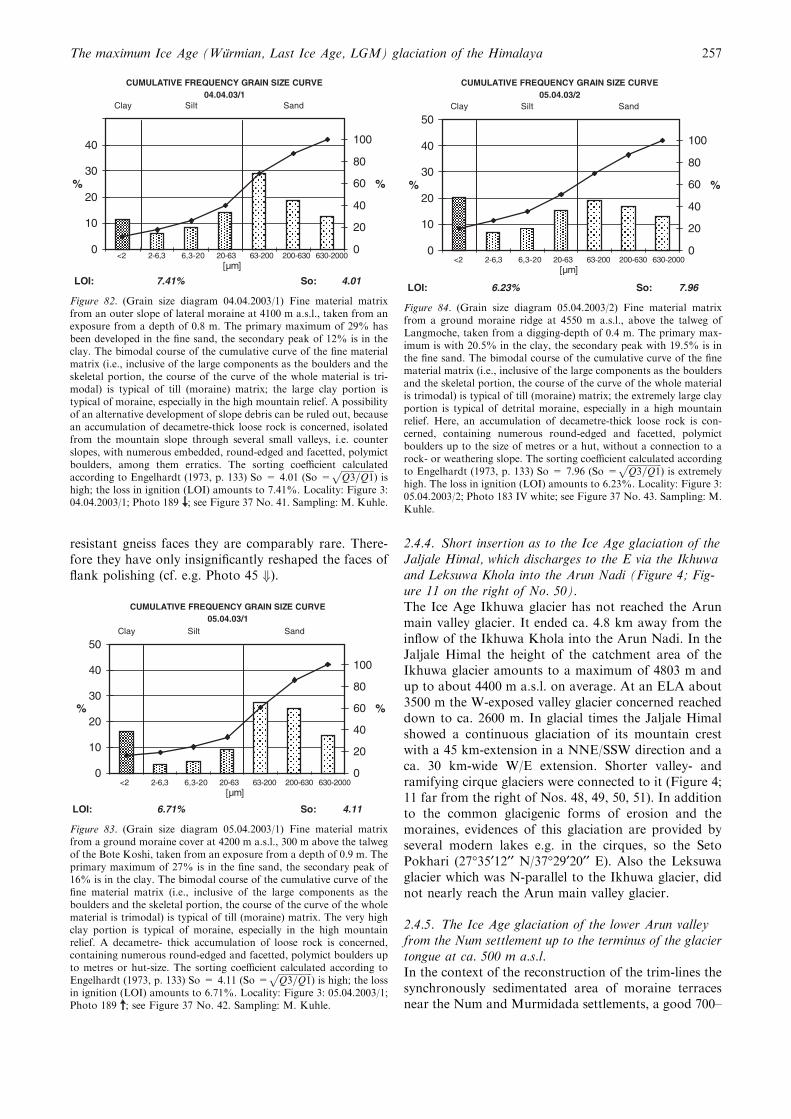
resistant gneiss faces they are comparably rare. There-fore they have only insignificantly reshaped the faces offlank polishing (cf. e.g. Photo 45 +).
2.4.4. Short insertion as to the Ice Age glaciation of theJaljale Himal, which discharges to the E via the Ikhuwaand Leksuwa Khola into the Arun Nadi (Figure 4; Fig-ure 11 on the right of No. 50).The Ice Age Ikhuwa glacier has not reached the Arunmain valley glacier. It ended ca. 4.8 km away from theinflow of the Ikhuwa Khola into the Arun Nadi. In theJaljale Himal the height of the catchment area of theIkhuwa glacier amounts to a maximum of 4803 m andup to about 4400 m a.s.l. on average. At an ELA about3500 m the W-exposed valley glacier concerned reacheddown to ca. 2600 m. In glacial times the Jaljale Himalshowed a continuous glaciation of its mountain crestwith a 45 km-extension in a NNE/SSW direction and aca. 30 km-wide W/E extension. Shorter valley- andramifying cirque glaciers were connected to it (Figure 4;11 far from the right of Nos. 48, 49, 50, 51). In additionto the common glacigenic forms of erosion and themoraines, evidences of this glaciation are provided byseveral modern lakes e.g. in the cirques, so the SetoPokhari (27�35¢12¢¢ N/37�29¢20¢¢ E). Also the Leksuwaglacier which was N-parallel to the Ikhuwa glacier, didnot nearly reach the Arun main valley glacier.
2.4.5. The Ice Age glaciation of the lower Arun valleyfrom the Num settlement up to the terminus of the glaciertongue at ca. 500 m a.s.l.In the context of the reconstruction of the trim-lines thesynchronously sedimentated area of moraine terracesnear the Num and Murmidada settlements, a good 700–
LOI: 7.41% So: 4.01
CUMULATIVE FREQUENCY GRAIN SIZE CURVE04.04.03/1
0
10
20
30
40
%
0
20
40
60
80
100
Clay Silt Sand
%
<2 2-6,3 6,3-20 20-63 63-200 200-630 630-2000[µm]
Figure 82. (Grain size diagram 04.04.2003/1) Fine material matrixfrom an outer slope of lateral moraine at 4100 m a.s.l., taken from anexposure from a depth of 0.8 m. The primary maximum of 29% hasbeen developed in the fine sand, the secondary peak of 12% is in theclay. The bimodal course of the cumulative curve of the fine materialmatrix (i.e., inclusive of the large components as the boulders and theskeletal portion, the course of the curve of the whole material is tri-modal) is typical of till (moraine) matrix; the large clay portion istypical of moraine, especially in the high mountain relief. A possibilityof an alternative development of slope debris can be ruled out, becausean accumulation of decametre-thick loose rock is concerned, isolatedfrom the mountain slope through several small valleys, i.e. counterslopes, with numerous embedded, round-edged and facetted, polymictboulders, among them erratics. The sorting coefficient calculatedaccording to Engelhardt (1973, p. 133) So = 4.01 (So =
ffiffiffiffiffiffiffiffiffiffiffiffiffiffiffiQ3=Q1
p) is
high; the loss in ignition (LOI) amounts to 7.41%. Locality: Figure 3:04.04.2003/1; Photo 189 ; see Figure 37 No. 41. Sampling: M. Kuhle.
LOI: 6.71% So: 4.11
CUMULATIVE FREQUENCY GRAIN SIZE CURVE05.04.03/1
0
10
20
30
40
50
%
0
20
40
60
80
100
Clay Silt Sand
%
<2 2-6,3 6,3-20 20-63 63-200 200-630 630-2000[µm]
Figure 83. (Grain size diagram 05.04.2003/1) Fine material matrixfrom a ground moraine cover at 4200 m a.s.l., 300 m above the talwegof the Bote Koshi, taken from an exposure from a depth of 0.9 m. Theprimary maximum of 27% is in the fine sand, the secondary peak of16% is in the clay. The bimodal course of the cumulative curve of thefine material matrix (i.e., inclusive of the large components as theboulders and the skeletal portion, the course of the curve of the wholematerial is trimodal) is typical of till (moraine) matrix. The very highclay portion is typical of moraine, especially in the high mountainrelief. A decametre- thick accumulation of loose rock is concerned,containing numerous round-edged and facetted, polymict boulders upto metres or hut-size. The sorting coefficient calculated according toEngelhardt (1973, p. 133) So = 4.11 (So =
ffiffiffiffiffiffiffiffiffiffiffiffiffiffiffiQ3=Q1
p) is high; the loss
in ignition (LOI) amounts to 6.71%. Locality: Figure 3: 05.04.2003/1;Photo 189 ; see Figure 37 No. 42. Sampling: M. Kuhle.
LOI: 6.23% So: 7.96
CUMULATIVE FREQUENCY GRAIN SIZE CURVE05.04.03/2
0
10
20
30
40
50
%
0
20
40
60
80
100
Clay Silt Sand
%
<2 2-6,3 6,3-20 20-63 63-200 200-630 630-2000[µm]
Figure 84. (Grain size diagram 05.04.2003/2) Fine material matrixfrom a ground moraine ridge at 4550 m a.s.l., above the talweg ofLangmoche, taken from a digging-depth of 0.4 m. The primary max-imum is with 20.5% in the clay, the secondary peak with 19.5% is inthe fine sand. The bimodal course of the cumulative curve of the finematerial matrix (i.e., inclusive of the large components as the bouldersand the skeletal portion, the course of the curve of the whole materialis trimodal) is typical of till (moraine) matrix; the extremely large clayportion is typical of detrital moraine, especially in a high mountainrelief. Here, an accumulation of decametre-thick loose rock is con-cerned, containing numerous round-edged and facetted, polymictboulders up to the size of metres or a hut, without a connection to arock- or weathering slope. The sorting coefficient calculated accordingto Engelhardt (1973, p. 133) So = 7.96 (So =
ffiffiffiffiffiffiffiffiffiffiffiffiffiffiffiQ3=Q1
p) is extremely
high. The loss in ignition (LOI) amounts to 6.23%. Locality: Figure 3:05.04.2003/2; Photo 183 IV white; see Figure 37 No. 43. Sampling: M.Kuhle.
The maximum Ice Age (Wurmian, Last Ice Age, LGM) glaciation of the Himalaya 257
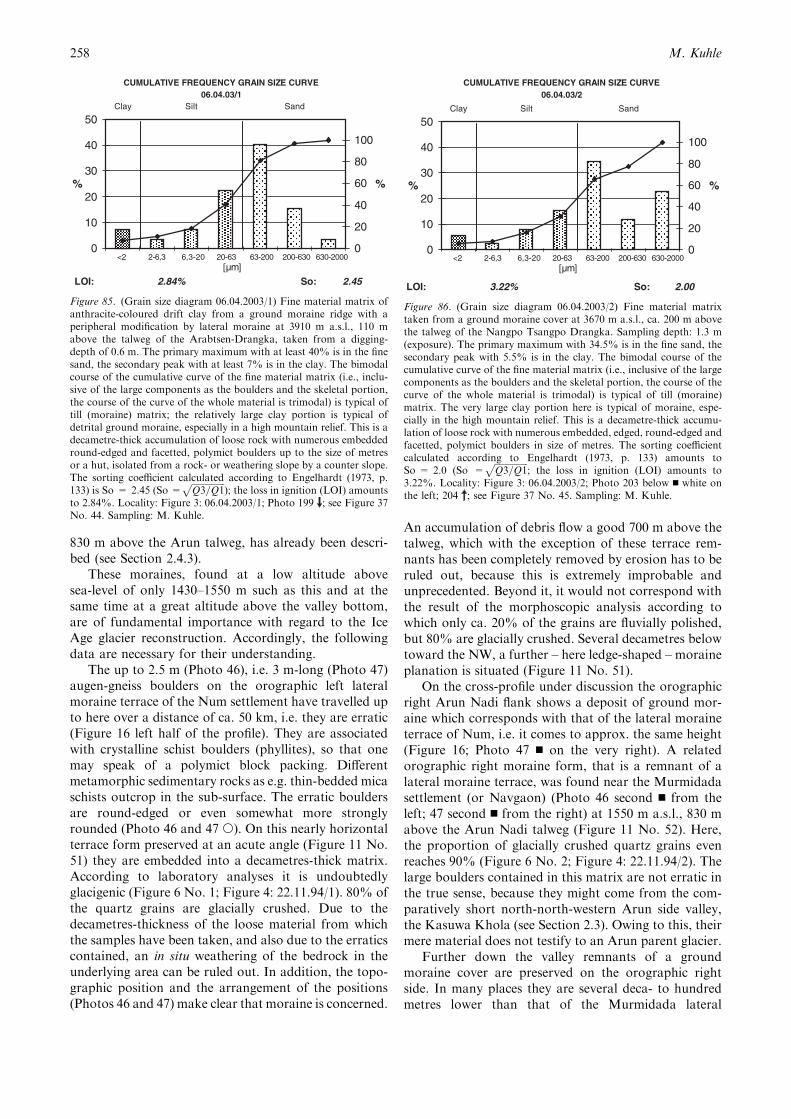
830 m above the Arun talweg, has already been descri-bed (see Section 2.4.3).
These moraines, found at a low altitude abovesea-level of only 1430–1550 m such as this and at thesame time at a great altitude above the valley bottom,are of fundamental importance with regard to the IceAge glacier reconstruction. Accordingly, the followingdata are necessary for their understanding.
The up to 2.5 m (Photo 46), i.e. 3 m-long (Photo 47)augen-gneiss boulders on the orographic left lateralmoraine terrace of the Num settlement have travelled upto here over a distance of ca. 50 km, i.e. they are erratic(Figure 16 left half of the profile). They are associatedwith crystalline schist boulders (phyllites), so that onemay speak of a polymict block packing. Differentmetamorphic sedimentary rocks as e.g. thin-bedded micaschists outcrop in the sub-surface. The erratic bouldersare round-edged or even somewhat more stronglyrounded (Photo 46 and 47 s). On this nearly horizontalterrace form preserved at an acute angle (Figure 11 No.51) they are embedded into a decametres-thick matrix.According to laboratory analyses it is undoubtedlyglacigenic (Figure 6 No. 1; Figure 4: 22.11.94/1). 80% ofthe quartz grains are glacially crushed. Due to thedecametres-thickness of the loose material from whichthe samples have been taken, and also due to the erraticscontained, an in situ weathering of the bedrock in theunderlying area can be ruled out. In addition, the topo-graphic position and the arrangement of the positions(Photos 46 and 47) make clear that moraine is concerned.
An accumulation of debris flow a good 700 m above thetalweg, which with the exception of these terrace rem-nants has been completely removed by erosion has to beruled out, because this is extremely improbable andunprecedented. Beyond it, it would not correspond withthe result of the morphoscopic analysis according towhich only ca. 20% of the grains are fluvially polished,but 80% are glacially crushed. Several decametres belowtoward the NW, a further – here ledge-shaped – moraineplanation is situated (Figure 11 No. 51).
On the cross-profile under discussion the orographicright Arun Nadi flank shows a deposit of ground mor-aine which corresponds with that of the lateral moraineterrace of Num, i.e. it comes to approx. the same height(Figure 16; Photo 47 n on the very right). A relatedorographic right moraine form, that is a remnant of alateral moraine terrace, was found near the Murmidadasettlement (or Navgaon) (Photo 46 second n from theleft; 47 second n from the right) at 1550 m a.s.l., 830 mabove the Arun Nadi talweg (Figure 11 No. 52). Here,the proportion of glacially crushed quartz grains evenreaches 90% (Figure 6 No. 2; Figure 4: 22.11.94/2). Thelarge boulders contained in this matrix are not erratic inthe true sense, because they might come from the com-paratively short north-north-western Arun side valley,the Kasuwa Khola (see Section 2.3). Owing to this, theirmere material does not testify to an Arun parent glacier.
Further down the valley remnants of a groundmoraine cover are preserved on the orographic rightside. In many places they are several deca- to hundredmetres lower than that of the Murmidada lateral
LOI: 3.22% So: 2.00
CUMULATIVE FREQUENCY GRAIN SIZE CURVE06.04.03/2
0
10
20
30
40
50
%
0
20
40
60
80
100
Clay Silt Sand
%
<2 2-6,3 6,3-20 20-63 63-200 200-630 630-2000[µm]
Figure 86. (Grain size diagram 06.04.2003/2) Fine material matrixtaken from a ground moraine cover at 3670 m a.s.l., ca. 200 m abovethe talweg of the Nangpo Tsangpo Drangka. Sampling depth: 1.3 m(exposure). The primary maximum with 34.5% is in the fine sand, thesecondary peak with 5.5% is in the clay. The bimodal course of thecumulative curve of the fine material matrix (i.e., inclusive of the largecomponents as the boulders and the skeletal portion, the course of thecurve of the whole material is trimodal) is typical of till (moraine)matrix. The very large clay portion here is typical of moraine, espe-cially in the high mountain relief. This is a decametre-thick accumu-lation of loose rock with numerous embedded, edged, round-edged andfacetted, polymict boulders in size of metres. The sorting coefficientcalculated according to Engelhardt (1973, p. 133) amounts toSo = 2.0 (So =
ffiffiffiffiffiffiffiffiffiffiffiffiffiffiffiQ3=Q1
p; the loss in ignition (LOI) amounts to
3.22%. Locality: Figure 3: 06.04.2003/2; Photo 203 below n white onthe left; 204 ; see Figure 37 No. 45. Sampling: M. Kuhle.
LOI: 2.84% So: 2.45
CUMULATIVE FREQUENCY GRAIN SIZE CURVE06.04.03/1
0
10
20
30
40
50
%
0
20
40
60
80
100
Clay Silt Sand
%
<2 2-6,3 6,3-20 20-63 63-200 200-630 630-2000[µm]
Figure 85. (Grain size diagram 06.04.2003/1) Fine material matrix ofanthracite-coloured drift clay from a ground moraine ridge with aperipheral modification by lateral moraine at 3910 m a.s.l., 110 mabove the talweg of the Arabtsen-Drangka, taken from a digging-depth of 0.6 m. The primary maximum with at least 40% is in the finesand, the secondary peak with at least 7% is in the clay. The bimodalcourse of the cumulative curve of the fine material matrix (i.e., inclu-sive of the large components as the boulders and the skeletal portion,the course of the curve of the whole material is trimodal) is typical oftill (moraine) matrix; the relatively large clay portion is typical ofdetrital ground moraine, especially in a high mountain relief. This is adecametre-thick accumulation of loose rock with numerous embeddedround-edged and facetted, polymict boulders up to the size of metresor a hut, isolated from a rock- or weathering slope by a counter slope.The sorting coefficient calculated according to Engelhardt (1973, p.133) is So = 2.45 (So =
ffiffiffiffiffiffiffiffiffiffiffiffiffiffiffiQ3=Q1
p); the loss in ignition (LOI) amounts
to 2.84%. Locality: Figure 3: 06.04.2003/1; Photo 199 ; see Figure 37No. 44. Sampling: M. Kuhle.
M. Kuhle258
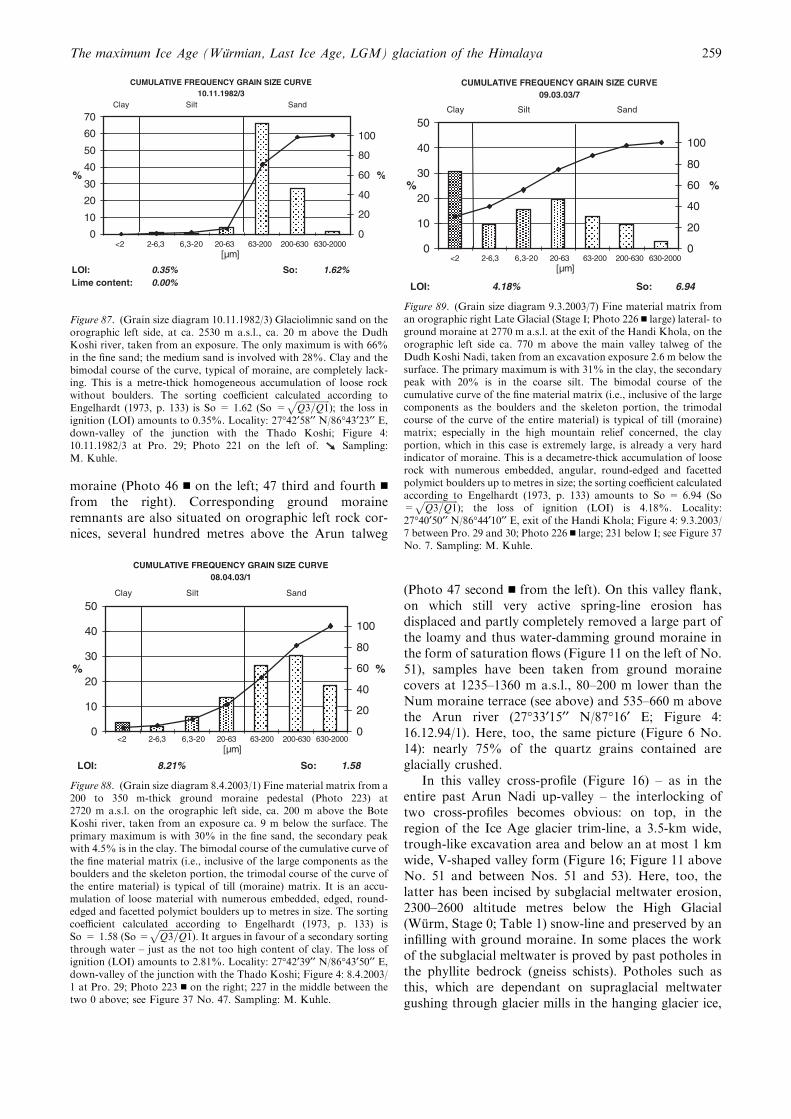
moraine (Photo 46 n on the left; 47 third and fourth n
from the right). Corresponding ground moraineremnants are also situated on orographic left rock cor-nices, several hundred metres above the Arun talweg
(Photo 47 second n from the left). On this valley flank,on which still very active spring-line erosion hasdisplaced and partly completely removed a large part ofthe loamy and thus water-damming ground moraine inthe form of saturation flows (Figure 11 on the left of No.51), samples have been taken from ground morainecovers at 1235–1360 m a.s.l., 80–200 m lower than theNum moraine terrace (see above) and 535–660 m abovethe Arun river (27�33¢15¢¢ N/87�16¢ E; Figure 4:16.12.94/1). Here, too, the same picture (Figure 6 No.14): nearly 75% of the quartz grains contained areglacially crushed.
In this valley cross-profile (Figure 16) – as in theentire past Arun Nadi up-valley – the interlocking oftwo cross-profiles becomes obvious: on top, in theregion of the Ice Age glacier trim-line, a 3.5-km wide,trough-like excavation area and below an at most 1 kmwide, V-shaped valley form (Figure 16; Figure 11 aboveNo. 51 and between Nos. 51 and 53). Here, too, thelatter has been incised by subglacial meltwater erosion,2300–2600 altitude metres below the High Glacial(Wurm, Stage 0; Table 1) snow-line and preserved by aninfilling with ground moraine. In some places the workof the subglacial meltwater is proved by past potholes inthe phyllite bedrock (gneiss schists). Potholes such asthis, which are dependant on supraglacial meltwatergushing through glacier mills in the hanging glacier ice,
LOI: 0.35% So: 1.62%Lime content: 0.00%
Clay
CUMULATIVE FREQUENCY GRAIN SIZE CURVE10.11.1982/3
0
10
20
30
40
50
60
70
%
0
20
40
60
80
100
Clay Silt Sand
%
<2 2-6,3 6,3-20 20-63 63-200 200-630 630-2000[µm]
Figure 87. (Grain size diagram 10.11.1982/3) Glaciolimnic sand on theorographic left side, at ca. 2530 m a.s.l., ca. 20 m above the DudhKoshi river, taken from an exposure. The only maximum is with 66%in the fine sand; the medium sand is involved with 28%. Clay and thebimodal course of the curve, typical of moraine, are completely lack-ing. This is a metre-thick homogeneous accumulation of loose rockwithout boulders. The sorting coefficient calculated according toEngelhardt (1973, p. 133) is So = 1.62 (So =
ffiffiffiffiffiffiffiffiffiffiffiffiffiffiffiQ3=Q1
p); the loss in
ignition (LOI) amounts to 0.35%. Locality: 27�42¢58¢¢ N/86�43¢23¢¢ E,down-valley of the junction with the Thado Koshi; Figure 4:10.11.1982/3 at Pro. 29; Photo 221 on the left of. Sampling:M. Kuhle.
LOI: 8.21% So: 1.58
CUMULATIVE FREQUENCY GRAIN SIZE CURVE08.04.03/1
0
10
20
30
40
50
%
0
20
40
60
80
100
Clay Silt Sand
%
<2 2-6,3 6,3-20 20-63 63-200 200-630 630-2000[µm]
Figure 88. (Grain size diagram 8.4.2003/1) Fine material matrix from a200 to 350 m-thick ground moraine pedestal (Photo 223) at2720 m a.s.l. on the orographic left side, ca. 200 m above the BoteKoshi river, taken from an exposure ca. 9 m below the surface. Theprimary maximum is with 30% in the fine sand, the secondary peakwith 4.5% is in the clay. The bimodal course of the cumulative curve ofthe fine material matrix (i.e., inclusive of the large components as theboulders and the skeleton portion, the trimodal course of the curve ofthe entire material) is typical of till (moraine) matrix. It is an accu-mulation of loose material with numerous embedded, edged, round-edged and facetted polymict boulders up to metres in size. The sortingcoefficient calculated according to Engelhardt (1973, p. 133) isSo = 1.58 (So =
ffiffiffiffiffiffiffiffiffiffiffiffiffiffiffiQ3=Q1
p). It argues in favour of a secondary sorting
through water – just as the not too high content of clay. The loss ofignition (LOI) amounts to 2.81%. Locality: 27�42¢39¢¢ N/86�43¢50¢¢ E,down-valley of the junction with the Thado Koshi; Figure 4: 8.4.2003/1 at Pro. 29; Photo 223 n on the right; 227 in the middle between thetwo 0 above; see Figure 37 No. 47. Sampling: M. Kuhle.
LOI: 4.18% So: 6.94
CUMULATIVE FREQUENCY GRAIN SIZE CURVE09.03.03/7
0
10
20
30
40
50
%
0
20
40
60
80
100
Clay Silt Sand
%
<2 2-6,3 6,3-20 20-63 63-200 200-630 630-2000[µm]
Figure 89. (Grain size diagram 9.3.2003/7) Fine material matrix froman orographic right Late Glacial (Stage I; Photo 226 n large) lateral- toground moraine at 2770 m a.s.l. at the exit of the Handi Khola, on theorographic left side ca. 770 m above the main valley talweg of theDudh Koshi Nadi, taken from an excavation exposure 2.6 m below thesurface. The primary maximum is with 31% in the clay, the secondarypeak with 20% is in the coarse silt. The bimodal course of thecumulative curve of the fine material matrix (i.e., inclusive of the largecomponents as the boulders and the skeleton portion, the trimodalcourse of the curve of the entire material) is typical of till (moraine)matrix; especially in the high mountain relief concerned, the clayportion, which in this case is extremely large, is already a very hardindicator of moraine. This is a decametre-thick accumulation of looserock with numerous embedded, angular, round-edged and facettedpolymict boulders up to metres in size; the sorting coefficient calculatedaccording to Engelhardt (1973, p. 133) amounts to So = 6.94 (So=
ffiffiffiffiffiffiffiffiffiffiffiffiffiffiffiQ3=Q1
p); the loss of ignition (LOI) is 4.18%. Locality:
27�40¢50¢¢ N/86�44¢10¢¢ E, exit of the Handi Khola; Figure 4: 9.3.2003/7 between Pro. 29 and 30; Photo 226 n large; 231 below I; see Figure 37No. 7. Sampling: M. Kuhle.
The maximum Ice Age (Wurmian, Last Ice Age, LGM) glaciation of the Himalaya 259
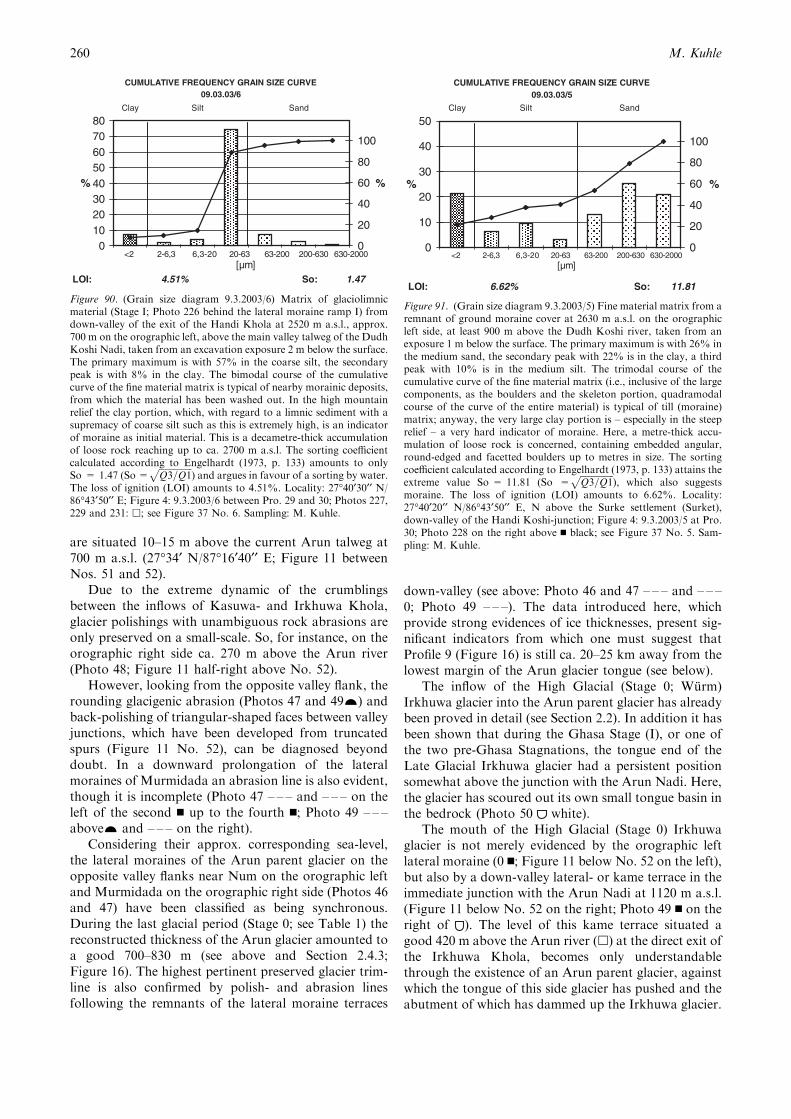
are situated 10–15 m above the current Arun talweg at700 m a.s.l. (27�34¢ N/87�16¢40¢¢ E; Figure 11 betweenNos. 51 and 52).
Due to the extreme dynamic of the crumblingsbetween the inflows of Kasuwa- and Irkhuwa Khola,glacier polishings with unambiguous rock abrasions areonly preserved on a small-scale. So, for instance, on theorographic right side ca. 270 m above the Arun river(Photo 48; Figure 11 half-right above No. 52).
However, looking from the opposite valley flank, therounding glacigenic abrasion (Photos 47 and 49…) andback-polishing of triangular-shaped faces between valleyjunctions, which have been developed from truncatedspurs (Figure 11 No. 52), can be diagnosed beyonddoubt. In a downward prolongation of the lateralmoraines of Murmidada an abrasion line is also evident,though it is incomplete (Photo 47 – – – and – – – on theleft of the second n up to the fourth n; Photo 49 – – –above… and – – – on the right).
Considering their approx. corresponding sea-level,the lateral moraines of the Arun parent glacier on theopposite valley flanks near Num on the orographic leftand Murmidada on the orographic right side (Photos 46and 47) have been classified as being synchronous.During the last glacial period (Stage 0; see Table 1) thereconstructed thickness of the Arun glacier amounted toa good 700–830 m (see above and Section 2.4.3;Figure 16). The highest pertinent preserved glacier trim-line is also confirmed by polish- and abrasion linesfollowing the remnants of the lateral moraine terraces
down-valley (see above: Photo 46 and 47 – – – and – – –0; Photo 49 – – –). The data introduced here, whichprovide strong evidences of ice thicknesses, present sig-nificant indicators from which one must suggest thatProfile 9 (Figure 16) is still ca. 20–25 km away from thelowest margin of the Arun glacier tongue (see below).
The inflow of the High Glacial (Stage 0; Wurm)Irkhuwa glacier into the Arun parent glacier has alreadybeen proved in detail (see Section 2.2). In addition it hasbeen shown that during the Ghasa Stage (I), or one ofthe two pre-Ghasa Stagnations, the tongue end of theLate Glacial Irkhuwa glacier had a persistent positionsomewhat above the junction with the Arun Nadi. Here,the glacier has scoured out its own small tongue basin inthe bedrock (Photo 50 white).
The mouth of the High Glacial (Stage 0) Irkhuwaglacier is not merely evidenced by the orographic leftlateral moraine (0 n; Figure 11 below No. 52 on the left),but also by a down-valley lateral- or kame terrace in theimmediate junction with the Arun Nadi at 1120 m a.s.l.(Figure 11 below No. 52 on the right; Photo 49 n on theright of ). The level of this kame terrace situated agood 420 m above the Arun river (h) at the direct exit ofthe Irkhuwa Khola, becomes only understandablethrough the existence of an Arun parent glacier, againstwhich the tongue of this side glacier has pushed and theabutment of which has dammed up the Irkhuwa glacier.
LOI: 4.51% So: 1.47
CUMULATIVE FREQUENCY GRAIN SIZE CURVE09.03.03/6
01020304050607080
%
0
20
40
60
80
100
Clay Silt Sand
%
<2 2-6,3 6,3-20 20-63 63-200 200-630 630-2000[µm]
Figure 90. (Grain size diagram 9.3.2003/6) Matrix of glaciolimnicmaterial (Stage I; Photo 226 behind the lateral moraine ramp I) fromdown-valley of the exit of the Handi Khola at 2520 m a.s.l., approx.700 m on the orographic left, above the main valley talweg of the DudhKoshi Nadi, taken from an excavation exposure 2 m below the surface.The primary maximum is with 57% in the coarse silt, the secondarypeak is with 8% in the clay. The bimodal course of the cumulativecurve of the fine material matrix is typical of nearby morainic deposits,from which the material has been washed out. In the high mountainrelief the clay portion, which, with regard to a limnic sediment with asupremacy of coarse silt such as this is extremely high, is an indicatorof moraine as initial material. This is a decametre-thick accumulationof loose rock reaching up to ca. 2700 m a.s.l. The sorting coefficientcalculated according to Engelhardt (1973, p. 133) amounts to onlySo = 1.47 (So =
ffiffiffiffiffiffiffiffiffiffiffiffiffiffiffiQ3=Q1
p) and argues in favour of a sorting by water.
The loss of ignition (LOI) amounts to 4.51%. Locality: 27�40¢30¢¢ N/86�43¢50¢¢ E; Figure 4: 9.3.2003/6 between Pro. 29 and 30; Photos 227,229 and 231: h; see Figure 37 No. 6. Sampling: M. Kuhle.
LOI: 6.62% So: 11.81
CUMULATIVE FREQUENCY GRAIN SIZE CURVE09.03.03/5
0
10
20
30
40
50
%
0
20
40
60
80
100
Clay Silt Sand
%
<2 2-6,3 6,3-20 20-63 63-200 200-630 630-2000[µm]
Figure 91. (Grain size diagram 9.3.2003/5) Fine material matrix from aremnant of ground moraine cover at 2630 m a.s.l. on the orographicleft side, at least 900 m above the Dudh Koshi river, taken from anexposure 1 m below the surface. The primary maximum is with 26% inthe medium sand, the secondary peak with 22% is in the clay, a thirdpeak with 10% is in the medium silt. The trimodal course of thecumulative curve of the fine material matrix (i.e., inclusive of the largecomponents, as the boulders and the skeleton portion, quadramodalcourse of the curve of the entire material) is typical of till (moraine)matrix; anyway, the very large clay portion is – especially in the steeprelief – a very hard indicator of moraine. Here, a metre-thick accu-mulation of loose rock is concerned, containing embedded angular,round-edged and facetted boulders up to metres in size. The sortingcoefficient calculated according to Engelhardt (1973, p. 133) attains theextreme value So = 11.81 (So =
ffiffiffiffiffiffiffiffiffiffiffiffiffiffiffiQ3=Q1
p), which also suggests
moraine. The loss of ignition (LOI) amounts to 6.62%. Locality:27�40¢20¢¢ N/86�43¢50¢¢ E, N above the Surke settlement (Surket),down-valley of the Handi Koshi-junction; Figure 4: 9.3.2003/5 at Pro.30; Photo 228 on the right above n black; see Figure 37 No. 5. Sam-pling: M. Kuhle.
M. Kuhle260
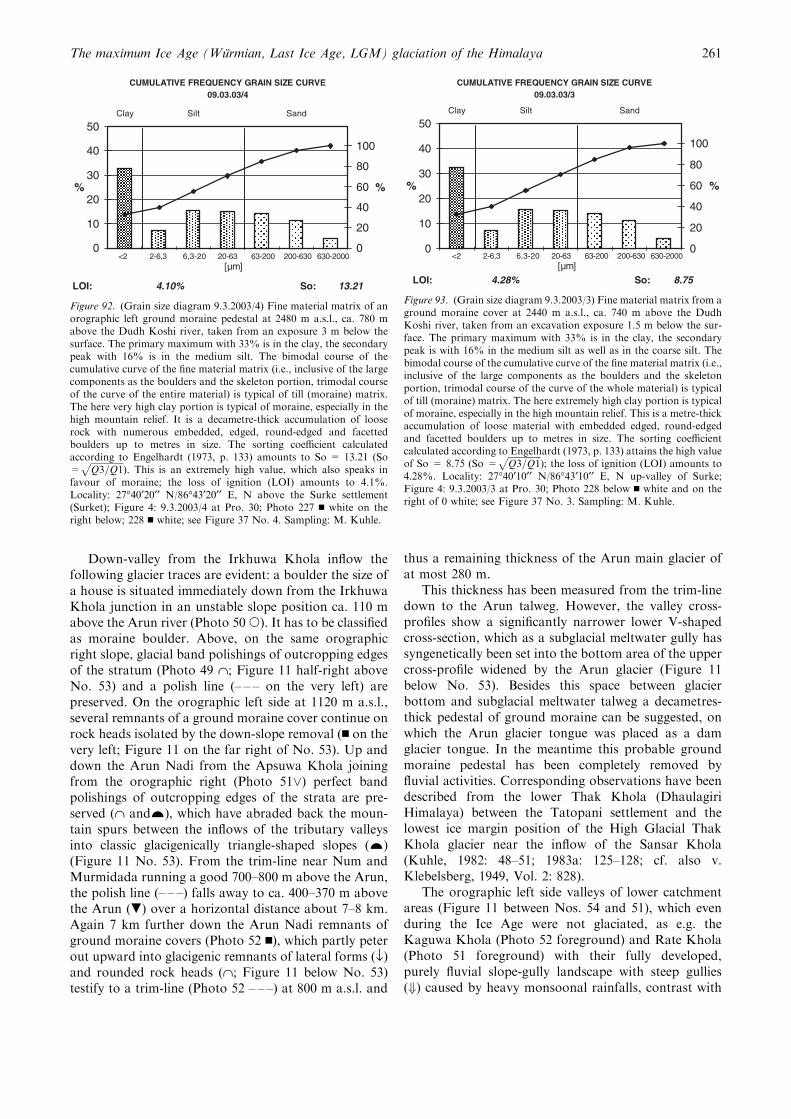
Down-valley from the Irkhuwa Khola inflow thefollowing glacier traces are evident: a boulder the size ofa house is situated immediately down from the IrkhuwaKhola junction in an unstable slope position ca. 110 mabove the Arun river (Photo 50s). It has to be classifiedas moraine boulder. Above, on the same orographicright slope, glacial band polishings of outcropping edgesof the stratum (Photo 49 ˙; Figure 11 half-right aboveNo. 53) and a polish line (– – – on the very left) arepreserved. On the orographic left side at 1120 m a.s.l.,several remnants of a ground moraine cover continue onrock heads isolated by the down-slope removal (n on thevery left; Figure 11 on the far right of No. 53). Up anddown the Arun Nadi from the Apsuwa Khola joiningfrom the orographic right (Photo 51_) perfect bandpolishings of outcropping edges of the strata are pre-served (˙ and…), which have abraded back the moun-tain spurs between the inflows of the tributary valleysinto classic glacigenically triangle-shaped slopes (…)(Figure 11 No. 53). From the trim-line near Num andMurmidada running a good 700–800 m above the Arun,the polish line (– – –) falls away to ca. 400–370 m abovethe Arun (.) over a horizontal distance about 7–8 km.Again 7 km further down the Arun Nadi remnants ofground moraine covers (Photo 52 n), which partly peterout upward into glacigenic remnants of lateral forms (fl)and rounded rock heads (˙; Figure 11 below No. 53)testify to a trim-line (Photo 52 – – –) at 800 m a.s.l. and
thus a remaining thickness of the Arun main glacier ofat most 280 m.
This thickness has been measured from the trim-linedown to the Arun talweg. However, the valley cross-profiles show a significantly narrower lower V-shapedcross-section, which as a subglacial meltwater gully hassyngenetically been set into the bottom area of the uppercross-profile widened by the Arun glacier (Figure 11below No. 53). Besides this space between glacierbottom and subglacial meltwater talweg a decametres-thick pedestal of ground moraine can be suggested, onwhich the Arun glacier tongue was placed as a damglacier tongue. In the meantime this probable groundmoraine pedestal has been completely removed byfluvial activities. Corresponding observations have beendescribed from the lower Thak Khola (DhaulagiriHimalaya) between the Tatopani settlement and thelowest ice margin position of the High Glacial ThakKhola glacier near the inflow of the Sansar Khola(Kuhle, 1982: 48–51; 1983a: 125–128; cf. also v.Klebelsberg, 1949, Vol. 2: 828).
The orographic left side valleys of lower catchmentareas (Figure 11 between Nos. 54 and 51), which evenduring the Ice Age were not glaciated, as e.g. theKaguwa Khola (Photo 52 foreground) and Rate Khola(Photo 51 foreground) with their fully developed,purely fluvial slope-gully landscape with steep gullies(+) caused by heavy monsoonal rainfalls, contrast with
LOI: 4.10% So: 13.21
CUMULATIVE FREQUENCY GRAIN SIZE CURVE09.03.03/4
0
10
20
30
40
50
%
0
20
40
60
80
100
Clay Silt Sand
%
<2 2-6,3 6,3-20 20-63 63-200 200-630 630-2000[µm]
Figure 92. (Grain size diagram 9.3.2003/4) Fine material matrix of anorographic left ground moraine pedestal at 2480 m a.s.l., ca. 780 mabove the Dudh Koshi river, taken from an exposure 3 m below thesurface. The primary maximum with 33% is in the clay, the secondarypeak with 16% is in the medium silt. The bimodal course of thecumulative curve of the fine material matrix (i.e., inclusive of the largecomponents as the boulders and the skeleton portion, trimodal courseof the curve of the entire material) is typical of till (moraine) matrix.The here very high clay portion is typical of moraine, especially in thehigh mountain relief. It is a decametre-thick accumulation of looserock with numerous embedded, edged, round-edged and facettedboulders up to metres in size. The sorting coefficient calculatedaccording to Engelhardt (1973, p. 133) amounts to So = 13.21 (So=
ffiffiffiffiffiffiffiffiffiffiffiffiffiffiffiQ3=Q1
p). This is an extremely high value, which also speaks in
favour of moraine; the loss of ignition (LOI) amounts to 4.1%.Locality: 27�40¢20¢¢ N/86�43¢20¢¢ E, N above the Surke settlement(Surket); Figure 4: 9.3.2003/4 at Pro. 30; Photo 227 n white on theright below; 228 n white; see Figure 37 No. 4. Sampling: M. Kuhle.
LOI: 4.28% So: 8.75
CUMULATIVE FREQUENCY GRAIN SIZE CURVE09.03.03/3
0
10
20
30
40
50
%
0
20
40
60
80
100
Clay Silt Sand
%
<2 2-6,3 6,3-20 20-63 63-200 200-630 630-2000[µm]
Figure 93. (Grain size diagram 9.3.2003/3) Fine material matrix from aground moraine cover at 2440 m a.s.l., ca. 740 m above the DudhKoshi river, taken from an excavation exposure 1.5 m below the sur-face. The primary maximum with 33% is in the clay, the secondarypeak is with 16% in the medium silt as well as in the coarse silt. Thebimodal course of the cumulative curve of the fine material matrix (i.e.,inclusive of the large components as the boulders and the skeletonportion, trimodal course of the curve of the whole material) is typicalof till (moraine) matrix. The here extremely high clay portion is typicalof moraine, especially in the high mountain relief. This is a metre-thickaccumulation of loose material with embedded edged, round-edgedand facetted boulders up to metres in size. The sorting coefficientcalculated according to Engelhardt (1973, p. 133) attains the high valueof So = 8.75 (So =
ffiffiffiffiffiffiffiffiffiffiffiffiffiffiffiQ3=Q1
p); the loss of ignition (LOI) amounts to
4.28%. Locality: 27�40¢10¢¢ N/86�43¢10¢¢ E, N up-valley of Surke;Figure 4: 9.3.2003/3 at Pro. 30; Photo 228 below n white and on theright of 0 white; see Figure 37 No. 3. Sampling: M. Kuhle.
The maximum Ice Age (Wurmian, Last Ice Age, LGM) glaciation of the Himalaya 261
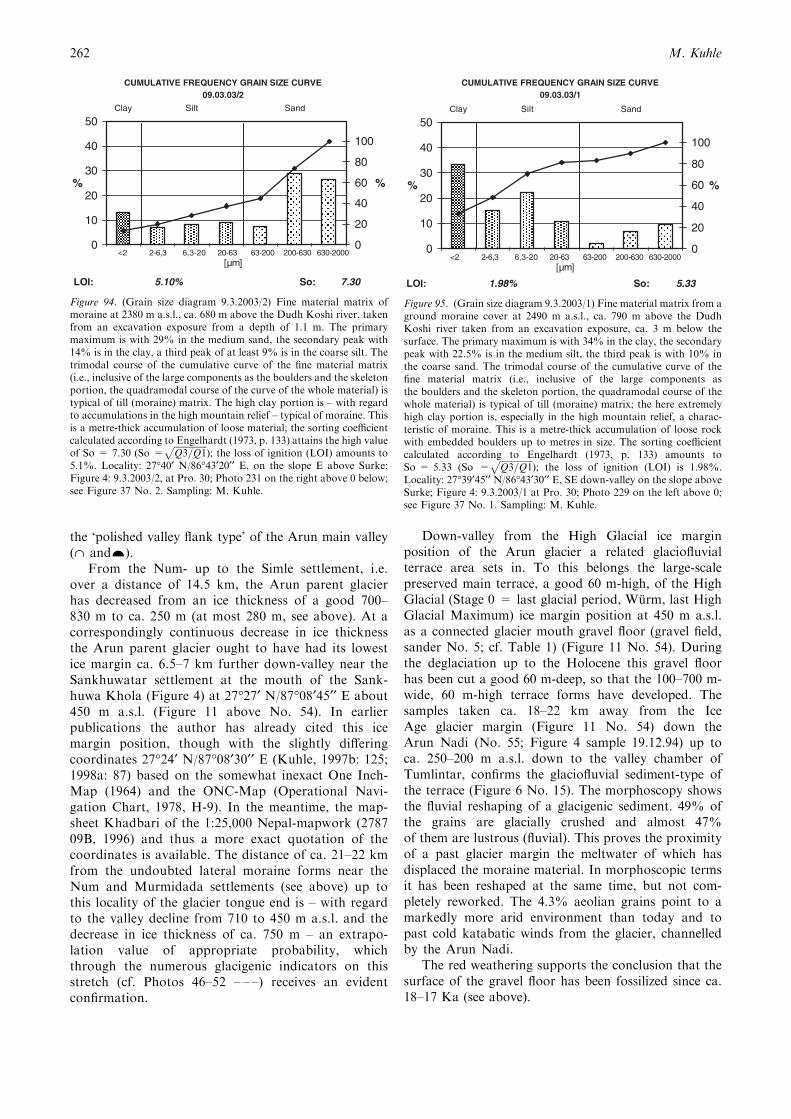
the ‘polished valley flank type’ of the Arun main valley(˙ and…).
From the Num- up to the Simle settlement, i.e.over a distance of 14.5 km, the Arun parent glacierhas decreased from an ice thickness of a good 700–830 m to ca. 250 m (at most 280 m, see above). At acorrespondingly continuous decrease in ice thicknessthe Arun parent glacier ought to have had its lowestice margin ca. 6.5–7 km further down-valley near theSankhuwatar settlement at the mouth of the Sank-huwa Khola (Figure 4) at 27�27¢ N/87�08¢45¢¢ E about450 m a.s.l. (Figure 11 above No. 54). In earlierpublications the author has already cited this icemargin position, though with the slightly differingcoordinates 27�24¢ N/87�08¢30¢¢ E (Kuhle, 1997b: 125;1998a: 87) based on the somewhat inexact One Inch-Map (1964) and the ONC-Map (Operational Navi-gation Chart, 1978, H-9). In the meantime, the map-sheet Khadbari of the 1:25,000 Nepal-mapwork (278709B, 1996) and thus a more exact quotation of thecoordinates is available. The distance of ca. 21–22 kmfrom the undoubted lateral moraine forms near theNum and Murmidada settlements (see above) up tothis locality of the glacier tongue end is – with regardto the valley decline from 710 to 450 m a.s.l. and thedecrease in ice thickness of ca. 750 m – an extrapo-lation value of appropriate probability, whichthrough the numerous glacigenic indicators on thisstretch (cf. Photos 46–52 – – –) receives an evidentconfirmation.
Down-valley from the High Glacial ice marginposition of the Arun glacier a related glaciofluvialterrace area sets in. To this belongs the large-scalepreserved main terrace, a good 60 m-high, of the HighGlacial (Stage 0 = last glacial period, Wurm, last HighGlacial Maximum) ice margin position at 450 m a.s.l.as a connected glacier mouth gravel floor (gravel field,sander No. 5; cf. Table 1) (Figure 11 No. 54). Duringthe deglaciation up to the Holocene this gravel floorhas been cut a good 60 m-deep, so that the 100–700 m-wide, 60 m-high terrace forms have developed. Thesamples taken ca. 18–22 km away from the IceAge glacier margin (Figure 11 No. 54) down theArun Nadi (No. 55; Figure 4 sample 19.12.94) up toca. 250–200 m a.s.l. down to the valley chamber ofTumlintar, confirms the glaciofluvial sediment-type ofthe terrace (Figure 6 No. 15). The morphoscopy showsthe fluvial reshaping of a glacigenic sediment. 49% ofthe grains are glacially crushed and almost 47%of them are lustrous (fluvial). This proves the proximityof a past glacier margin the meltwater of which hasdisplaced the moraine material. In morphoscopic termsit has been reshaped at the same time, but not com-pletely reworked. The 4.3% aeolian grains point to amarkedly more arid environment than today and topast cold katabatic winds from the glacier, channelledby the Arun Nadi.
The red weathering supports the conclusion that thesurface of the gravel floor has been fossilized since ca.18–17 Ka (see above).
LOI: 5.10% So: 7.30
CUMULATIVE FREQUENCY GRAIN SIZE CURVE09.03.03/2
0
10
20
30
40
50
%
0
20
40
60
80
100
Clay Silt Sand
%
<2 2-6,3 6,3-20 20-63 63-200 200-630 630-2000[µm]
Figure 94. (Grain size diagram 9.3.2003/2) Fine material matrix ofmoraine at 2380 m a.s.l., ca. 680 m above the Dudh Koshi river, takenfrom an excavation exposure from a depth of 1.1 m. The primarymaximum is with 29% in the medium sand, the secondary peak with14% is in the clay, a third peak of at least 9% is in the coarse silt. Thetrimodal course of the cumulative curve of the fine material matrix(i.e., inclusive of the large components as the boulders and the skeletonportion, the quadramodal course of the curve of the whole material) istypical of till (moraine) matrix. The high clay portion is – with regardto accumulations in the high mountain relief – typical of moraine. Thisis a metre-thick accumulation of loose material; the sorting coefficientcalculated according to Engelhardt (1973, p. 133) attains the high valueof So = 7.30 (So =
ffiffiffiffiffiffiffiffiffiffiffiffiffiffiffiQ3=Q1
p); the loss of ignition (LOI) amounts to
5.1%. Locality: 27�40¢ N/86�43¢20¢¢ E, on the slope E above Surke;Figure 4: 9.3.2003/2, at Pro. 30; Photo 231 on the right above 0 below;see Figure 37 No. 2. Sampling: M. Kuhle.
LOI: 1.98% So: 5.33
CUMULATIVE FREQUENCY GRAIN SIZE CURVE 09.03.03/1
0
10
20
30
40
50
%
0
20
40
60
80
100
Clay Silt Sand
%
<2 2-6,3 6,3-20 20-63 63-200 200-630 630-2000[µm]
Figure 95. (Grain size diagram 9.3.2003/1) Fine material matrix from aground moraine cover at 2490 m a.s.l., ca. 790 m above the DudhKoshi river taken from an excavation exposure, ca. 3 m below thesurface. The primary maximum is with 34% in the clay, the secondarypeak with 22.5% is in the medium silt, the third peak is with 10% inthe coarse sand. The trimodal course of the cumulative curve of thefine material matrix (i.e., inclusive of the large components asthe boulders and the skeleton portion, the quadramodal course of thewhole material) is typical of till (moraine) matrix; the here extremelyhigh clay portion is, especially in the high mountain relief, a charac-teristic of moraine. This is a metre-thick accumulation of loose rockwith embedded boulders up to metres in size. The sorting coefficientcalculated according to Engelhardt (1973, p. 133) amounts toSo = 5.33 (So =
ffiffiffiffiffiffiffiffiffiffiffiffiffiffiffiQ3=Q1
p); the loss of ignition (LOI) is 1.98%.
Locality: 27�39¢45¢¢ N/86�43¢30¢¢ E, SE down-valley on the slope aboveSurke; Figure 4: 9.3.2003/1 at Pro. 30; Photo 229 on the left above 0;see Figure 37 No. 1. Sampling: M. Kuhle.
M. Kuhle262
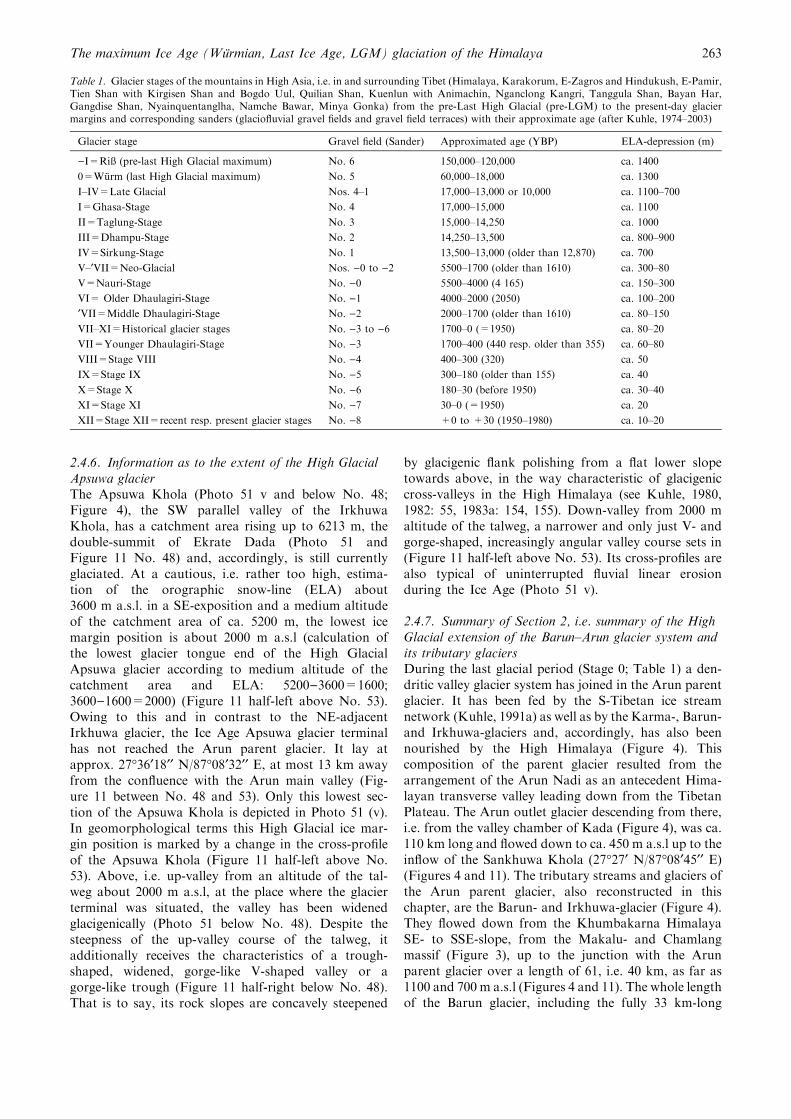
2.4.6. Information as to the extent of the High GlacialApsuwa glacierThe Apsuwa Khola (Photo 51 v and below No. 48;Figure 4), the SW parallel valley of the IrkhuwaKhola, has a catchment area rising up to 6213 m, thedouble-summit of Ekrate Dada (Photo 51 andFigure 11 No. 48) and, accordingly, is still currentlyglaciated. At a cautious, i.e. rather too high, estima-tion of the orographic snow-line (ELA) about3600 m a.s.l. in a SE-exposition and a medium altitudeof the catchment area of ca. 5200 m, the lowest icemargin position is about 2000 m a.s.l (calculation ofthe lowest glacier tongue end of the High GlacialApsuwa glacier according to medium altitude of thecatchment area and ELA: 5200)3600=1600;3600)1600=2000) (Figure 11 half-left above No. 53).Owing to this and in contrast to the NE-adjacentIrkhuwa glacier, the Ice Age Apsuwa glacier terminalhas not reached the Arun parent glacier. It lay atapprox. 27�36¢18¢¢ N/87�08¢32¢¢ E, at most 13 km awayfrom the confluence with the Arun main valley (Fig-ure 11 between No. 48 and 53). Only this lowest sec-tion of the Apsuwa Khola is depicted in Photo 51 (v).In geomorphological terms this High Glacial ice mar-gin position is marked by a change in the cross-profileof the Apsuwa Khola (Figure 11 half-left above No.53). Above, i.e. up-valley from an altitude of the tal-weg about 2000 m a.s.l, at the place where the glacierterminal was situated, the valley has been widenedglacigenically (Photo 51 below No. 48). Despite thesteepness of the up-valley course of the talweg, itadditionally receives the characteristics of a trough-shaped, widened, gorge-like V-shaped valley or agorge-like trough (Figure 11 half-right below No. 48).That is to say, its rock slopes are concavely steepened
by glacigenic flank polishing from a flat lower slopetowards above, in the way characteristic of glacigeniccross-valleys in the High Himalaya (see Kuhle, 1980,1982: 55, 1983a: 154, 155). Down-valley from 2000 maltitude of the talweg, a narrower and only just V- andgorge-shaped, increasingly angular valley course sets in(Figure 11 half-left above No. 53). Its cross-profiles arealso typical of uninterrupted fluvial linear erosionduring the Ice Age (Photo 51 v).
2.4.7. Summary of Section 2, i.e. summary of the HighGlacial extension of the Barun–Arun glacier system andits tributary glaciersDuring the last glacial period (Stage 0; Table 1) a den-dritic valley glacier system has joined in the Arun parentglacier. It has been fed by the S-Tibetan ice streamnetwork (Kuhle, 1991a) as well as by the Karma-, Barun-and Irkhuwa-glaciers and, accordingly, has also beennourished by the High Himalaya (Figure 4). Thiscomposition of the parent glacier resulted from thearrangement of the Arun Nadi as an antecedent Hima-layan transverse valley leading down from the TibetanPlateau. The Arun outlet glacier descending from there,i.e. from the valley chamber of Kada (Figure 4), was ca.110 km long and flowed down to ca. 450 m a.s.l up to theinflow of the Sankhuwa Khola (27�27¢ N/87�08¢45¢¢ E)(Figures 4 and 11). The tributary streams and glaciers ofthe Arun parent glacier, also reconstructed in thischapter, are the Barun- and Irkhuwa-glacier (Figure 4).They flowed down from the Khumbakarna HimalayaSE- to SSE-slope, from the Makalu- and Chamlangmassif (Figure 3), up to the junction with the Arunparent glacier over a length of 61, i.e. 40 km, as far as1100 and 700 m a.s.l (Figures 4 and 11). The whole lengthof the Barun glacier, including the fully 33 km-long
Table 1. Glacier stages of the mountains in High Asia, i.e. in and surrounding Tibet (Himalaya, Karakorum, E-Zagros and Hindukush, E-Pamir,Tien Shan with Kirgisen Shan and Bogdo Uul, Quilian Shan, Kuenlun with Animachin, Nganclong Kangri, Tanggula Shan, Bayan Har,Gangdise Shan, Nyainquentanglha, Namche Bawar, Minya Gonka) from the pre-Last High Glacial (pre-LGM) to the present-day glaciermargins and corresponding sanders (glaciofluvial gravel fields and gravel field terraces) with their approximate age (after Kuhle, 1974–2003)
Glacier stage Gravel field (Sander) Approximated age (YBP) ELA-depression (m)
)I=Riß (pre-last High Glacial maximum) No. 6 150,000–120,000 ca. 1400
0=Wurm (last High Glacial maximum) No. 5 60,000–18,000 ca. 1300
I–IV=Late Glacial Nos. 4–1 17,000–13,000 or 10,000 ca. 1100–700
I=Ghasa-Stage No. 4 17,000–15,000 ca. 1100
II=Taglung-Stage No. 3 15,000–14,250 ca. 1000
III=Dhampu-Stage No. 2 14,250–13,500 ca. 800–900
IV=Sirkung-Stage No. 1 13,500–13,000 (older than 12,870) ca. 700
V–¢VII=Neo-Glacial Nos. )0 to )2 5500–1700 (older than 1610) ca. 300–80
V=Nauri-Stage No. )0 5500–4000 (4 165) ca. 150–300
VI= Older Dhaulagiri-Stage No. )1 4000–2000 (2050) ca. 100–200
¢VII=Middle Dhaulagiri-Stage No. )2 2000–1700 (older than 1610) ca. 80–150
VII–XI=Historical glacier stages No. )3 to )6 1700–0 (=1950) ca. 80–20
VII=Younger Dhaulagiri-Stage No. )3 1700–400 (440 resp. older than 355) ca. 60–80
VIII=Stage VIII No. )4 400–300 (320) ca. 50
IX=Stage IX No. )5 300–180 (older than 155) ca. 40
X=Stage X No. )6 180–30 (before 1950) ca. 30–40
XI=Stage XI No. )7 30–0 (=1950) ca. 20
XII=Stage XII=recent resp. present glacier stages No. )8 +0 to +30 (1950–1980) ca. 10–20
The maximum Ice Age (Wurmian, Last Ice Age, LGM) glaciation of the Himalaya 263
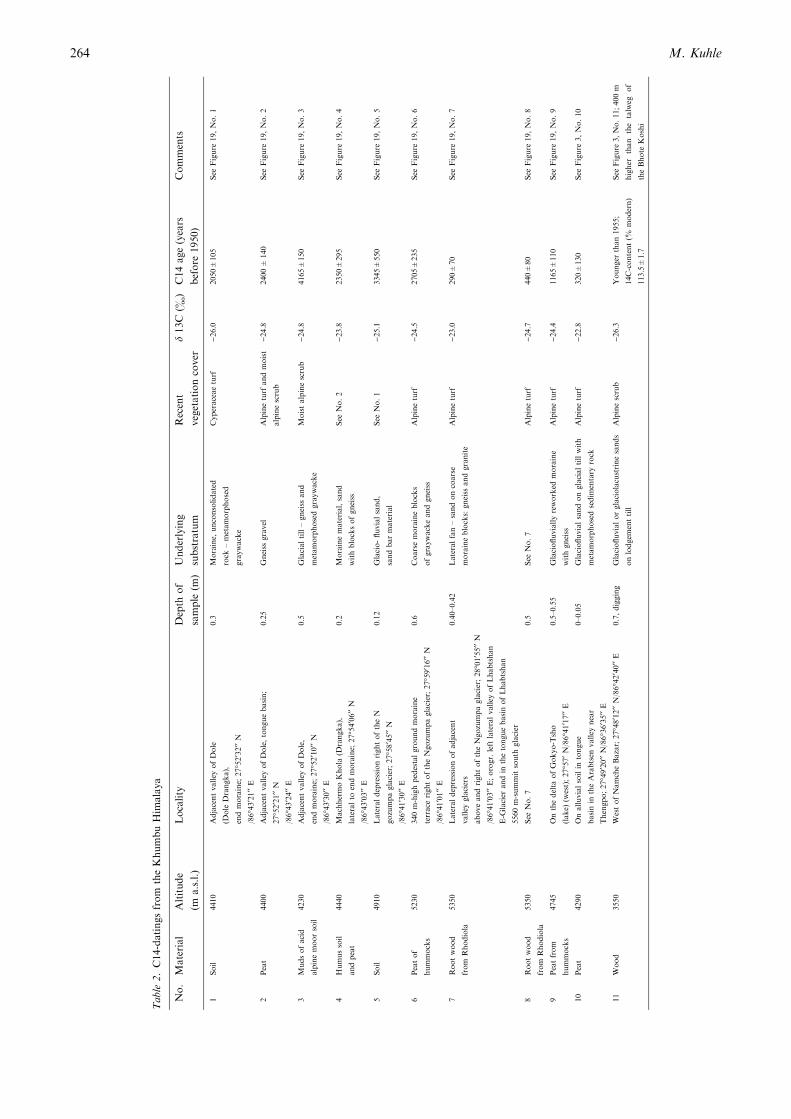
Table
2.C14-datingsfrom
theKhumbuHim
alaya
No.
Material
Altitude
(ma.s.l.)
Locality
Depth
of
sample
(m)
Underlying
substratum
Recent
vegetationcover
d13C
(&)
C14age(years
before
1950)
Comments
1Soil
4410
Adjacentvalley
ofDole
(Dole
Drangka),
endmoraine;
27�52¢32¢¢N
/86�43¢21¢¢E
0.3
Moraine,
unconsolidated
rock
–metamorphosed
graywacke
Cyperaceaeturf
)26.0
2050±105
See
Figure
19,No.1
2Peat
4400
Adjacentvalley
ofDole,tonguebasin;
27�52¢21¢¢N
/86�43¢24¢¢E
0.25
Gneiss
gravel
Alpineturf
andmoist
alpinescrub
)24.8
2400±
140
See
Figure
19,No.2
3Mudsofacid
alpinemoorsoil
4230
Adjacentvalley
ofDole,
endmoraine;
27�52¢10¢¢N
/86�43¢30¢¢E
0.5
Glacialtill–gneiss
and
metamorphosedgraywacke
Moistalpinescrub
)24.8
4165±150
See
Figure
19,No.3
4Humussoil
andpeat
4440
MachhermoKhola
(Drangka),
lateralto
endmoraine;
27�54¢06¢¢N
/86�43¢03¢¢E
0.2
Morainematerial,sand
withblocksofgneiss
See
No.2
)23.8
2350±295
See
Figure
19,No.4
5Soil
4910
LateraldepressionrightoftheN
gozumpaglacier;27�58¢45¢¢N
/86�41¢30¢¢E
0.12
Glacio-fluvialsand,
sandbarmaterial
See
No.1
)25.1
3345±550
See
Figure
19,No.5
6Peatof
hummocks
5230
340m-highpedestalgroundmoraine
terrace
rightoftheNgozumpaglacier;27�59¢16¢¢N
/86�41¢01¢¢E
0.6
Coarsemoraineblocks
ofgraywackeandgneiss
Alpineturf
)24.5
2705±235
See
Figure
19,No.6
7Rootwood
from
Rhodiola
5350
Lateraldepressionofadjacent
valley
glaciers
aboveandrightoftheNgozumpaglacier;28�01¢55¢¢N
/86�41¢03¢¢E;orogr.leftlateralvalley
ofLhabtshan
E-G
lacier
andin
thetonguebasinofLhabtshan
5560
m-summitsouth
glacier
0.40–0.42
Lateralfan–sandoncoarse
moraineblocks:gneiss
andgranite
Alpineturf
)23.0
290±70
See
Figure
19,No.7
8Rootwood
from
Rhodiola
5350
See
No.7
0.5
See
No.7
Alpineturf
)24.7
440±80
See
Figure
19,No.8
9Peatfrom
hummocks
4745
Onthedelta
ofGokyo-Tsho
(lake)
(west);27�57¢N
/86�41¢17¢¢E
0.5–0.55
Glaciofluviallyreworked
moraine
withgneiss
Alpineturf
)24.4
1165±110
See
Figure
19,No.9
10
Peat
4290
Onalluvialsoilin
tongue
basinin
theArabtsen
valley
near
Thengpo;27�49¢20¢¢N/86�36¢35¢¢E
0–0.05
Glaciofluvialsandonglacialtillwith
metamorphosedsedim
entary
rock
Alpineturf
)22.8
320±130
See
Figure
3,No.10
11
Wood
3550
WestofNamcheBazar;27�48¢12¢¢N/86�42¢40¢¢E
0.7,digging
Glaciofluvialorglaciolacustrinesands
onlodgem
enttill
Alpinescrub
)26.3
Younger
than1955;
14C-content(%
modern)
113.5±1.7
See
Figure
3,No.11;400m
higher
than
the
talweg
of
theBhote
Koshi
M. Kuhle264
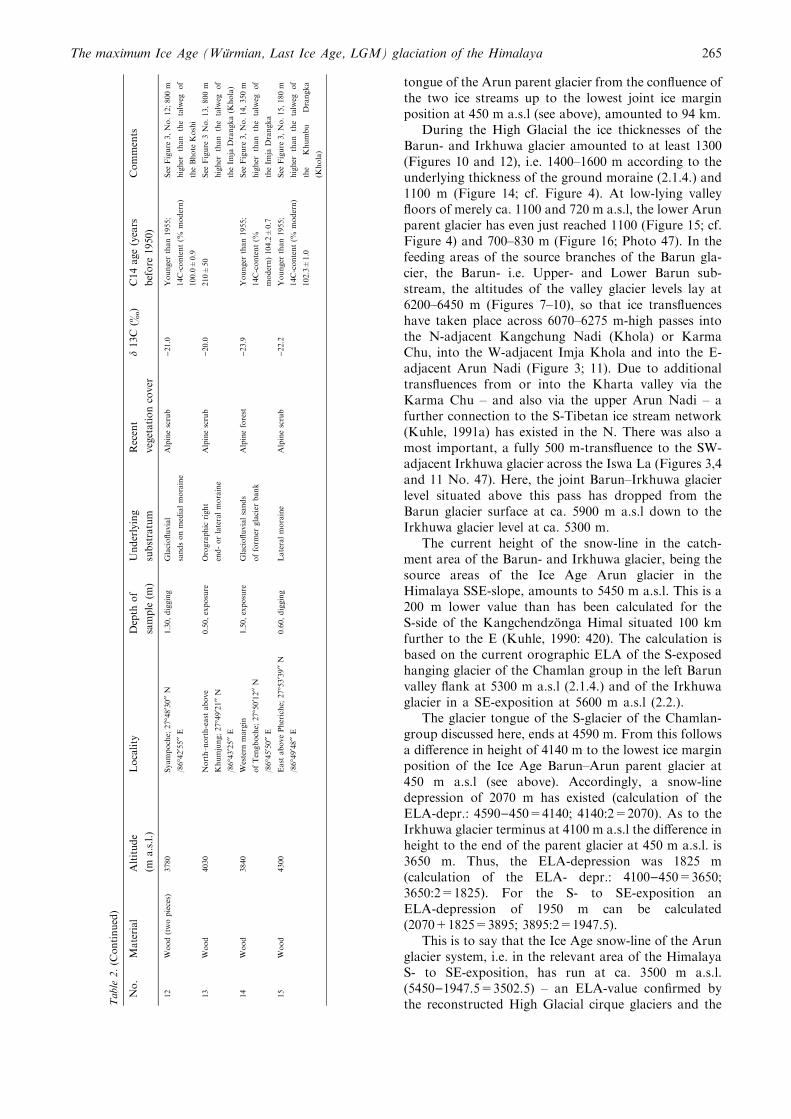
tongue of the Arun parent glacier from the confluence ofthe two ice streams up to the lowest joint ice marginposition at 450 m a.s.l (see above), amounted to 94 km.
During the High Glacial the ice thicknesses of theBarun- and Irkhuwa glacier amounted to at least 1300(Figures 10 and 12), i.e. 1400–1600 m according to theunderlying thickness of the ground moraine (2.1.4.) and1100 m (Figure 14; cf. Figure 4). At low-lying valleyfloors of merely ca. 1100 and 720 m a.s.l, the lower Arunparent glacier has even just reached 1100 (Figure 15; cf.Figure 4) and 700–830 m (Figure 16; Photo 47). In thefeeding areas of the source branches of the Barun gla-cier, the Barun- i.e. Upper- and Lower Barun sub-stream, the altitudes of the valley glacier levels lay at6200–6450 m (Figures 7–10), so that ice transfluenceshave taken place across 6070–6275 m-high passes intothe N-adjacent Kangchung Nadi (Khola) or KarmaChu, into the W-adjacent Imja Khola and into the E-adjacent Arun Nadi (Figure 3; 11). Due to additionaltransfluences from or into the Kharta valley via theKarma Chu – and also via the upper Arun Nadi – afurther connection to the S-Tibetan ice stream network(Kuhle, 1991a) has existed in the N. There was also amost important, a fully 500 m-transfluence to the SW-adjacent Irkhuwa glacier across the Iswa La (Figures 3,4and 11 No. 47). Here, the joint Barun–Irkhuwa glacierlevel situated above this pass has dropped from theBarun glacier surface at ca. 5900 m a.s.l down to theIrkhuwa glacier level at ca. 5300 m.
The current height of the snow-line in the catch-ment area of the Barun- and Irkhuwa glacier, being thesource areas of the Ice Age Arun glacier in theHimalaya SSE-slope, amounts to 5450 m a.s.l. This is a200 m lower value than has been calculated for theS-side of the Kangchendzonga Himal situated 100 kmfurther to the E (Kuhle, 1990: 420). The calculation isbased on the current orographic ELA of the S-exposedhanging glacier of the Chamlan group in the left Barunvalley flank at 5300 m a.s.l (2.1.4.) and of the Irkhuwaglacier in a SE-exposition at 5600 m a.s.l (2.2.).
The glacier tongue of the S-glacier of the Chamlan-group discussed here, ends at 4590 m. From this followsa difference in height of 4140 m to the lowest ice marginposition of the Ice Age Barun–Arun parent glacier at450 m a.s.l (see above). Accordingly, a snow-linedepression of 2070 m has existed (calculation of theELA-depr.: 4590)450=4140; 4140:2=2070). As to theIrkhuwa glacier terminus at 4100 m a.s.l the difference inheight to the end of the parent glacier at 450 m a.s.l. is3650 m. Thus, the ELA-depression was 1825 m(calculation of the ELA- depr.: 4100)450=3650;3650:2=1825). For the S- to SE-exposition anELA-depression of 1950 m can be calculated(2070+1825=3895; 3895:2=1947.5).
This is to say that the Ice Age snow-line of the Arunglacier system, i.e. in the relevant area of the HimalayaS- to SE-exposition, has run at ca. 3500 m a.s.l.(5450)1947.5=3502.5) – an ELA-value confirmed bythe reconstructed High Glacial cirque glaciers and theT
able
2.(C
ontinued)
No.
Material
Altitude
(ma.s.l.)
Locality
Depth
of
sample
(m)
Underlying
substratum
Recent
vegetationcover
d13C
(&)
C14age(years
before
1950)
Comments
12
Wood(twopieces)
3780
Syampoche;
27�48¢30¢¢N
/86�42¢55¢¢E
1.30,digging
Glaciofluvial
sandsonmedialmoraine
Alpinescrub
)21.0
Younger
than1955;
14C-content(%
modern)
100.0±0.9
See
Figure
3,No.12;800m
higher
than
the
talweg
of
theBhote
Koshi
13
Wood
4030
North–north-east
above
Khumjung;27�49¢21¢¢N
/86�43¢25¢¢E
0.50,exposure
Orographic
right
end-orlateralmoraine
Alpinescrub
)20.0
210±50
See
Figure
3No.13,800m
higher
than
the
talweg
of
theIm
jaDrangka(K
hola)
14
Wood
3840
Western
margin
ofTengboche;
27�50¢12¢¢N
/86�45¢50¢¢E
1.50,exposure
Glaciofluvialsands
ofform
erglacier
bank
Alpineforest
)23.9
Younger
than1955;
14C-content(%
modern)104.2±0.7
See
Figure
3,No.14,350m
higher
than
the
talweg
of
theIm
jaDrangka
15
Wood
4300
East
abovePheriche;
27�53¢39¢¢N
/86�49¢48¢¢E
0.60,digging
Lateralmoraine
Alpinescrub
)22.2
Younger
than1955;
14C-content(%
modern)
102.3±1.0
See
Figure
3,No.15,180m
higher
than
the
talweg
of
the
Khumbu
Drangka
(Khola)
The maximum Ice Age (Wurmian, Last Ice Age, LGM) glaciation of the Himalaya 265