no time to waste - s.c. schools waste study - scdhec
TRANSCRIPT
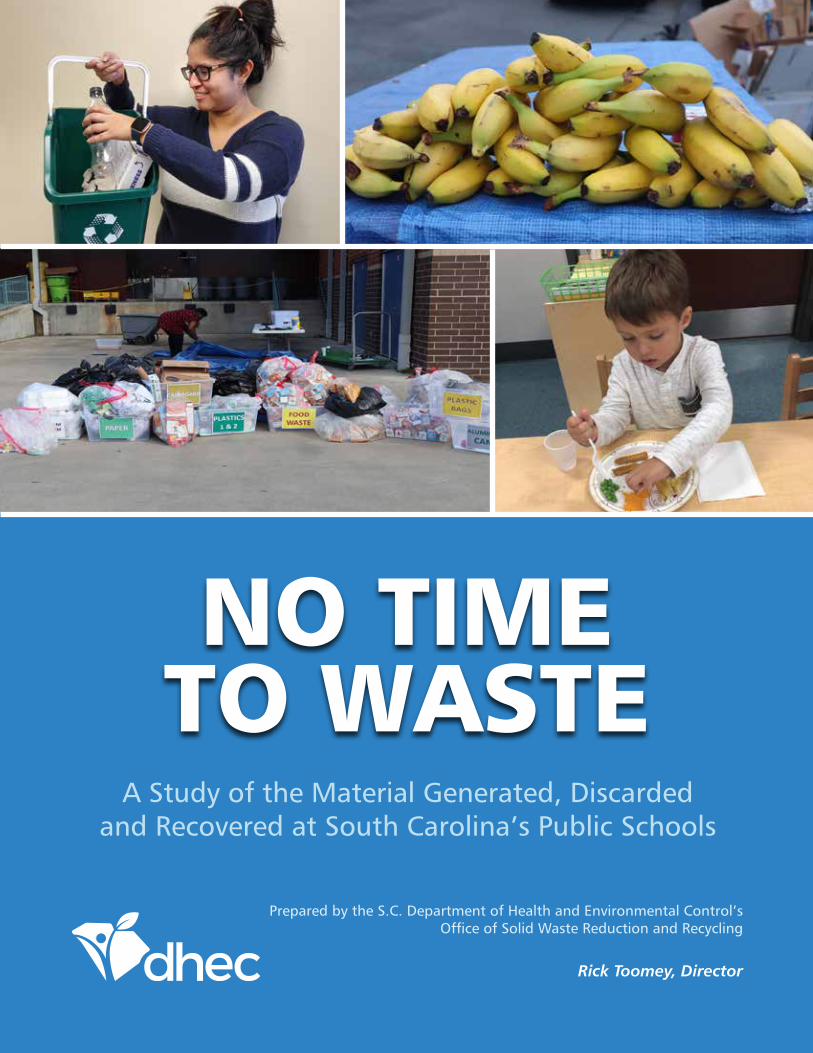
A Study of the Material Generated, Discarded and Recovered at South Carolina’s Public Schools
NO TIME TO WASTE
Prepared by the S.C. Department of Health and Environmental Control’s Office of Solid Waste Reduction and Recycling
Rick Toomey, Director
NO TIME TO WASTE 1
IntroductionHow much waste is created by a school? How much of it could be prevented? Recycled? Composted?
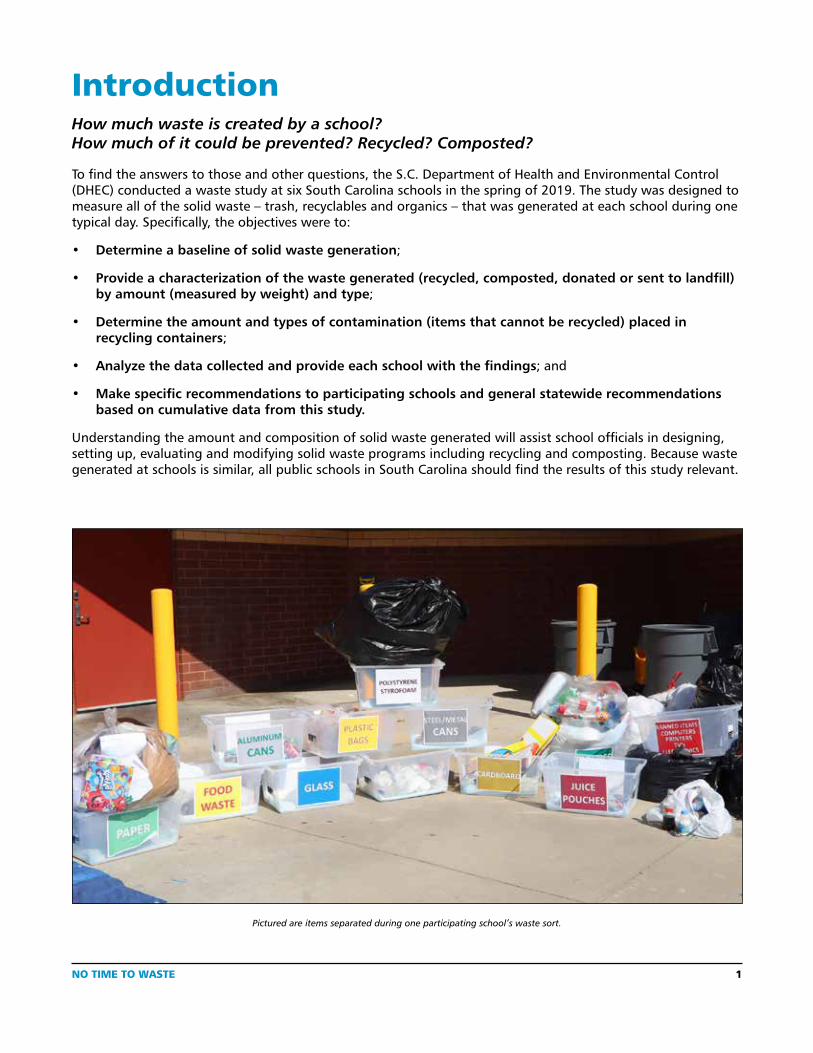
To find the answers to those and other questions, the S.C. Department of Health and Environmental Control (DHEC) conducted a waste study at six South Carolina schools in the spring of 2019. The study was designed to measure all of the solid waste – trash, recyclables and organics – that was generated at each school during one typical day. Specifically, the objectives were to:
• Determine a baseline of solid waste generation;
• Provide a characterization of the waste generated (recycled, composted, donated or sent to landfill) by amount (measured by weight) and type;
• Determine the amount and types of contamination (items that cannot be recycled) placed in recycling containers;
• Analyze the data collected and provide each school with the findings; and
• Make specific recommendations to participating schools and general statewide recommendations based on cumulative data from this study.
Understanding the amount and composition of solid waste generated will assist school officials in designing, setting up, evaluating and modifying solid waste programs including recycling and composting. Because waste generated at schools is similar, all public schools in South Carolina should find the results of this study relevant.
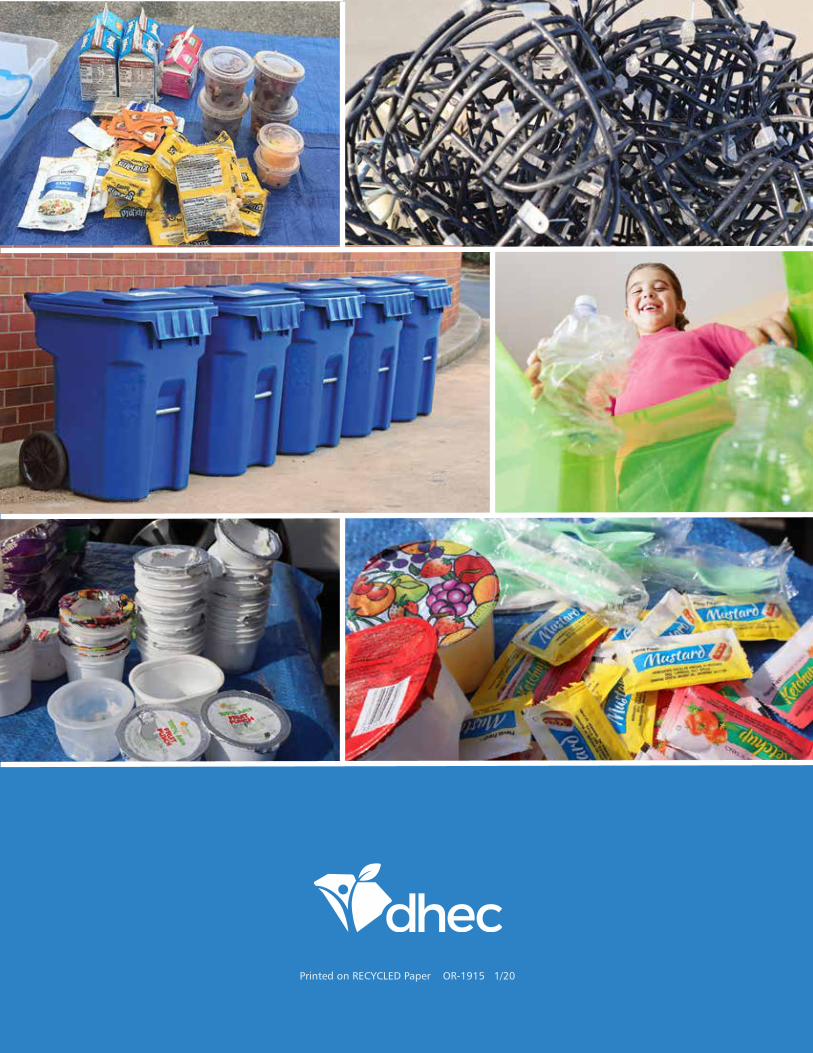
Pictured are items separated during one participating school’s waste sort.
2 NO TIME TO WASTE
Acknowledgements“No Time to Waste: A Study of the Material Generated, Discarded and Recovered at South Carolina Public Schools” is published by DHEC’s Office of Solid Waste Reduction and Recycling1 (Office).
PROJECT MANAGERS .........................................................................................Amanda Edwards and Angie Perry
WRITERS ..................................................................................................... Richard Chesley and Amanda Edwards
DATA COLLECTION AND ANALYSIS ............................................................................................... Stephanie Busch
LAYOUT/GRAPHICS .......................................................................................................................... Gregg Glymph
CONTRIBUTORS ................................................................................. Tonza Thomas, Adah Gorton and Alex Miller
Waste Study Sorting Staff
DHEC OTHER PARTNERS
Richard Chesley Angie Perry Tonza Thomas (S.C. Department of Education)
Amanda Edwards Kris Abell Leslie Rodgers (Atlas Organics)
Gregg Glymph Janice Allen Jane Harris (Smart Recycling US)
Adah Gorton Mary Margaret Mendenhall Charles Shutt (Dorchester County)
Alex Miller Lori Nolte Volunteers from each participating school
Special ThanksDHEC would like to thank the students, faculty and administration at the schools that volunteered to participate for their time and insight, and:
• The S.C. Department of Education and staff for their assistance in selecting the schools to ensure a comprehensive overview of the state;
• Local solid waste professionals and recycling coordinators for volunteering to sort material and provide information on local recycling markets; and
• Atlas Organics and Smart Recycling US for providing food waste collection containers, assisting with the waste sorts and composting the organics collected in the sorts.
NO TIME TO WASTE 3
Table of ContentsWhy this study? ................... 4
Executive Summary ............. 5
Methodology ...................... 6
Material Sorting Categories ........................... 7
Field Methodology .............. 8
Study Results ....................... 9
Statewide Recommendations ............ 10
Appendix ........................... 15
School Profile No. 1 ........... 16
School Profile No. 2 ........... 18
School Profile No. 3 ........... 20
School Profile No. 4 ........... 22
School Profile No. 5 ........... 24
School Profile No. 6 ........... 26
About the OfficeThe Office can help schools set up, expand and improve recycling and composting programs through grant funding, technical assistance, curriculum lessons and more.
Take Action SCTake Action SC is based on “Action for a Cleaner Tomorrow” (“Action”)21 – the award-winning, interdisciplinary, activity-based curriculum supplement that provides an introduction to solid waste, recycling and composting to kindergarten through eighth-grade students.
“Action” was developed by teachers and the Office in conjunction with the S.C. Department of Education in 1993. The lessons are correlated to South Carolina’s science standards and include state-specific information when possible.
The curriculum supplement is available to teachers at no cost who attend a two-hour workshop. Classroom presentations also are available at no cost for fifth-grade, seventh-grade and high school students.
To schedule a teacher workshop or classroom presentation, please visit www.takeactionsc.org or call 1-800-768-7348.
Don’t Waste Food SCDon’t Waste Food SC (DWFSC) – managed by the Office – is a collaborative outreach campaign that brings together ambassadors from the public and private sectors dedicated to sharing knowledge, coordinating resources and working together to reduce food waste in South Carolina.
The goals of the campaign are to:
• Increase the awareness of the economic, environmental and social impacts of wasted food;
• Inspire individuals, communities, restaurants, schools and others to take action;
• Reduce food waste through prevention, donation and composting; and
• Cut food waste in half in South Carolina by 2030.
DWFSC provides:
• Outreach/education material;
• Community presentations;
• Best management practices;
• Technical assistance; and
• Networking opportunities.
For more information or to get involved, visit www.scdhec.gov/dwfsc or email [email protected].
4 NO TIME TO WASTE
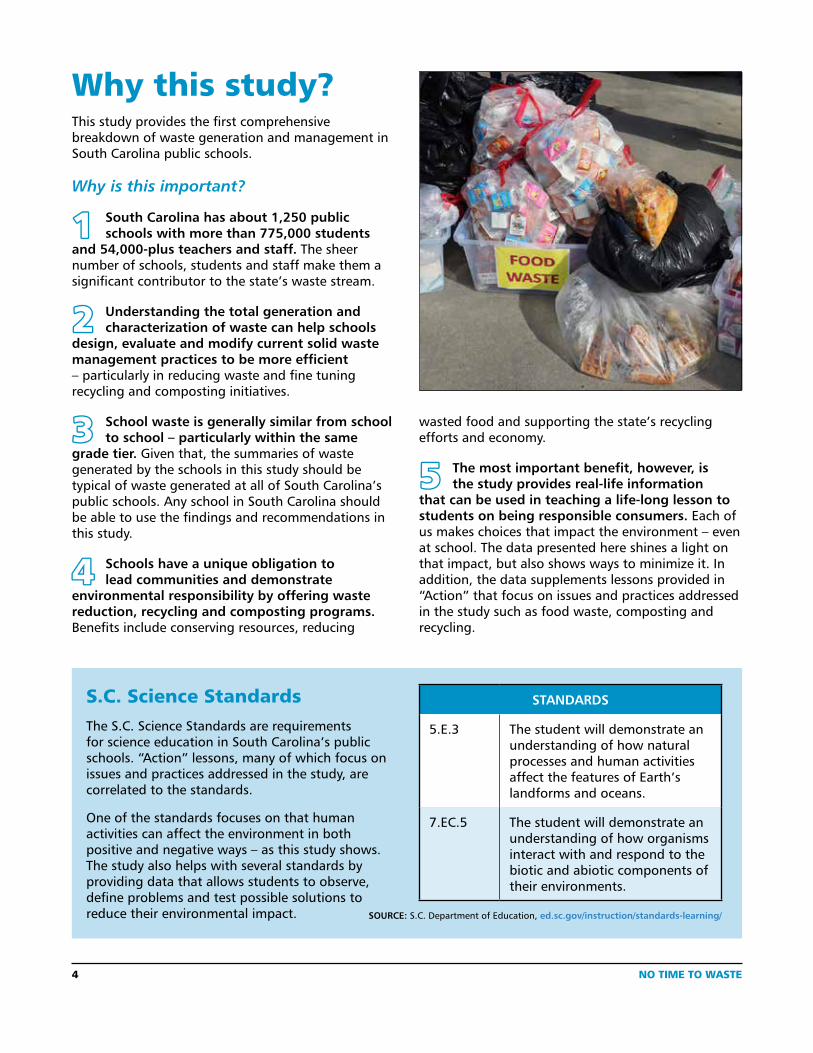
Why this study?This study provides the first comprehensive breakdown of waste generation and management in South Carolina public schools.
Why is this important?
11 South Carolina has about 1,250 public schools with more than 775,000 students
and 54,000-plus teachers and staff. The sheer number of schools, students and staff make them a significant contributor to the state’s waste stream.
22 Understanding the total generation and characterization of waste can help schools
design, evaluate and modify current solid waste management practices to be more efficient – particularly in reducing waste and fine tuning recycling and composting initiatives.
33 School waste is generally similar from school to school – particularly within the same
grade tier. Given that, the summaries of waste generated by the schools in this study should be typical of waste generated at all of South Carolina’s public schools. Any school in South Carolina should be able to use the findings and recommendations in this study.
44 Schools have a unique obligation to lead communities and demonstrate
environmental responsibility by offering waste reduction, recycling and composting programs. Benefits include conserving resources, reducing
S.C. Science Standards
The S.C. Science Standards are requirements for science education in South Carolina’s public schools. “Action” lessons, many of which focus on issues and practices addressed in the study, are correlated to the standards.
One of the standards focuses on that human activities can affect the environment in both positive and negative ways – as this study shows. The study also helps with several standards by providing data that allows students to observe, define problems and test possible solutions to reduce their environmental impact.
wasted food and supporting the state’s recycling efforts and economy.
55 The most important benefit, however, is the study provides real-life information
that can be used in teaching a life-long lesson to students on being responsible consumers. Each of us makes choices that impact the environment – even at school. The data presented here shines a light on that impact, but also shows ways to minimize it. In addition, the data supplements lessons provided in “Action” that focus on issues and practices addressed in the study such as food waste, composting and recycling.
STANDARDS
5.E.3 The student will demonstrate an understanding of how natural processes and human activities affect the features of Earth’s landforms and oceans.
7.EC.5 The student will demonstrate an understanding of how organisms interact with and respond to the biotic and abiotic components of their environments.
SOURCE: S.C. Department of Education, ed.sc.gov/instruction/standards-learning/
NO TIME TO WASTE 5
Executive Summary
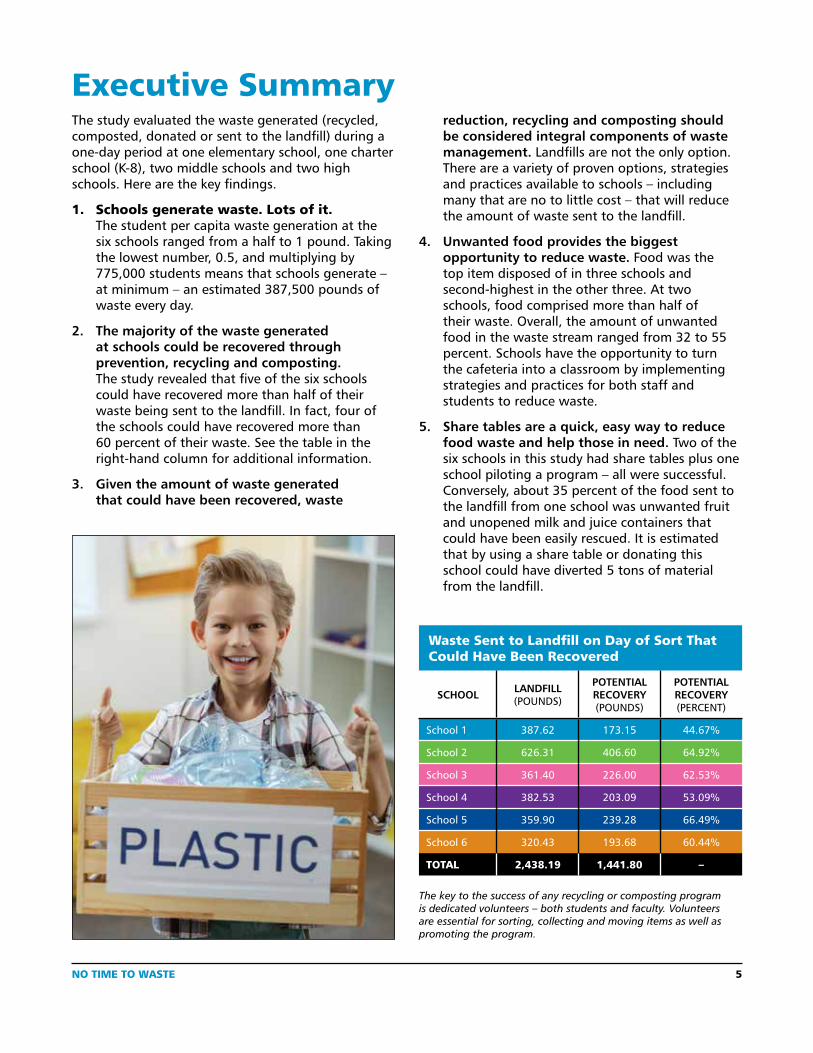
The key to the success of any recycling or composting program is dedicated volunteers – both students and faculty. Volunteers are essential for sorting, collecting and moving items as well as promoting the program.
The study evaluated the waste generated (recycled, composted, donated or sent to the landfill) during a one-day period at one elementary school, one charter school (K-8), two middle schools and two high schools. Here are the key findings.
1. Schools generate waste. Lots of it. The student per capita waste generation at the six schools ranged from a half to 1 pound. Taking the lowest number, 0.5, and multiplying by 775,000 students means that schools generate – at minimum – an estimated 387,500 pounds of waste every day.
2. The majority of the waste generated at schools could be recovered through prevention, recycling and composting. The study revealed that five of the six schools could have recovered more than half of their waste being sent to the landfill. In fact, four of the schools could have recovered more than 60 percent of their waste. See the table in the right-hand column for additional information.
3. Given the amount of waste generated that could have been recovered, waste
reduction, recycling and composting should be considered integral components of waste management. Landfills are not the only option. There are a variety of proven options, strategies and practices available to schools – including many that are no to little cost – that will reduce the amount of waste sent to the landfill.
4. Unwanted food provides the biggest opportunity to reduce waste. Food was the top item disposed of in three schools and second-highest in the other three. At two schools, food comprised more than half of their waste. Overall, the amount of unwanted food in the waste stream ranged from 32 to 55 percent. Schools have the opportunity to turn the cafeteria into a classroom by implementing strategies and practices for both staff and students to reduce waste.
5. Share tables are a quick, easy way to reduce food waste and help those in need. Two of the six schools in this study had share tables plus one school piloting a program – all were successful. Conversely, about 35 percent of the food sent to the landfill from one school was unwanted fruit and unopened milk and juice containers that could have been easily rescued. It is estimated that by using a share table or donating this school could have diverted 5 tons of material from the landfill.
Waste Sent to Landfill on Day of Sort That Could Have Been Recovered
SCHOOL LANDFILL (POUNDS)
POTENTIAL RECOVERY (POUNDS)
POTENTIAL RECOVERY (PERCENT)
School 1 387.62 173.15 44.67%
School 2 626.31 406.60 64.92%
School 3 361.40 226.00 62.53%
School 4 382.53 203.09 53.09%
School 5 359.90 239.28 66.49%
School 6 320.43 193.68 60.44%
TOTAL 2,438.19 1,441.80 –
6 NO TIME TO WASTE
Waste Sampling ProtocolThere are numerous methods and protocols to collect data. Each has advantages and disadvantages. The goal when deciding a waste study sampling protocol is to ensure that the waste that is sorted is representative of the population from which it is drawn.
The methodology chosen for this study is the census method. In this approach, all of the waste generated at a small number of schools was measured.
MethodologyThis study’s methodology was developed to:
• Collect all of the waste and recovered material generated on one day at each of the six subject schools;
• Sort all of the material into 15 categories and weigh each category separately; and
• Record the amount of each of the categories.
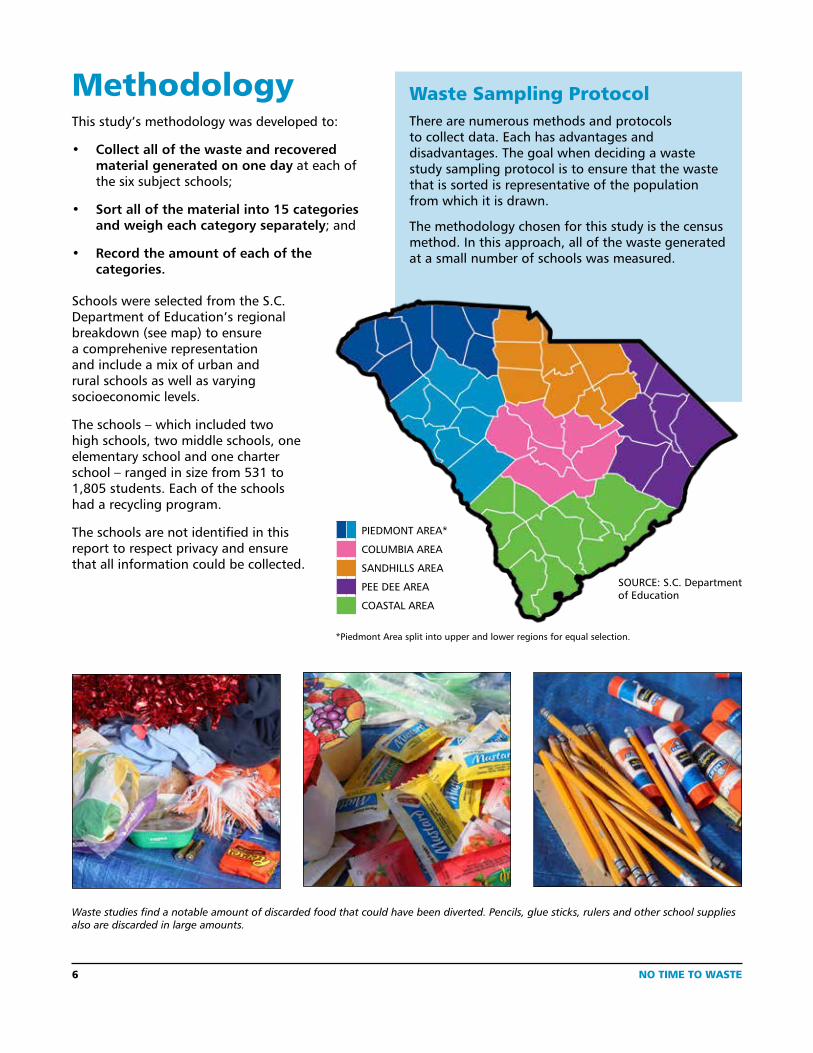
Waste studies find a notable amount of discarded food that could have been diverted. Pencils, glue sticks, rulers and other school supplies also are discarded in large amounts.
PIEDMONT AREA*
COLUMBIA AREA
SANDHILLS AREA
PEE DEE AREA
COASTAL AREA
*Piedmont Area split into upper and lower regions for equal selection.
Schools were selected from the S.C. Department of Education’s regional breakdown (see map) to ensure a comprehenive representation and include a mix of urban and rural schools as well as varying socioeconomic levels.
The schools – which included two high schools, two middle schools, one elementary school and one charter school – ranged in size from 531 to 1,805 students. Each of the schools had a recycling program.
The schools are not identified in this report to respect privacy and ensure that all information could be collected.
SOURCE: S.C. Department of Education
NO TIME TO WASTE 7
Material Sorting CategoriesThe categories selected focus on material that schools commonly recycle, compost or send to the landfill.
Any material generated in nursing clinics, labs, restrooms or on-site construction was weighed, but not sorted.
1. Aluminum cans
2. Steel Cans (e.g., soup, fruit, vegetables)
3. Cardboard/Paperboard
4. Non-Recyclable Paper (compostable) [e.g, paper towels, napkins, paper cups and plates (non-coated), pizza boxes]
5. Milk Cartons (empty)
6. Paper (e.g., white office paper, magazines, newspapers, envelopes, folders, sticky notes, mail)
7. Food Waste
8. Glass
9. Plastic #1 and #2 (i.e., bottles with necks)
10. Polystyrene (e.g., cups, plates, bowls, to-go containers, trays)
11. Plastic Bags
12. Juice Pouches
13. Electronics
14. General Trash (e.g., disposable utensils, chip bags, candy or granola bar wrappers, empty condiment packets, straws)
15. Plastic (other) (e.g., plastic 3-7, zipper-type storage bags, frozen food bags, wrap)
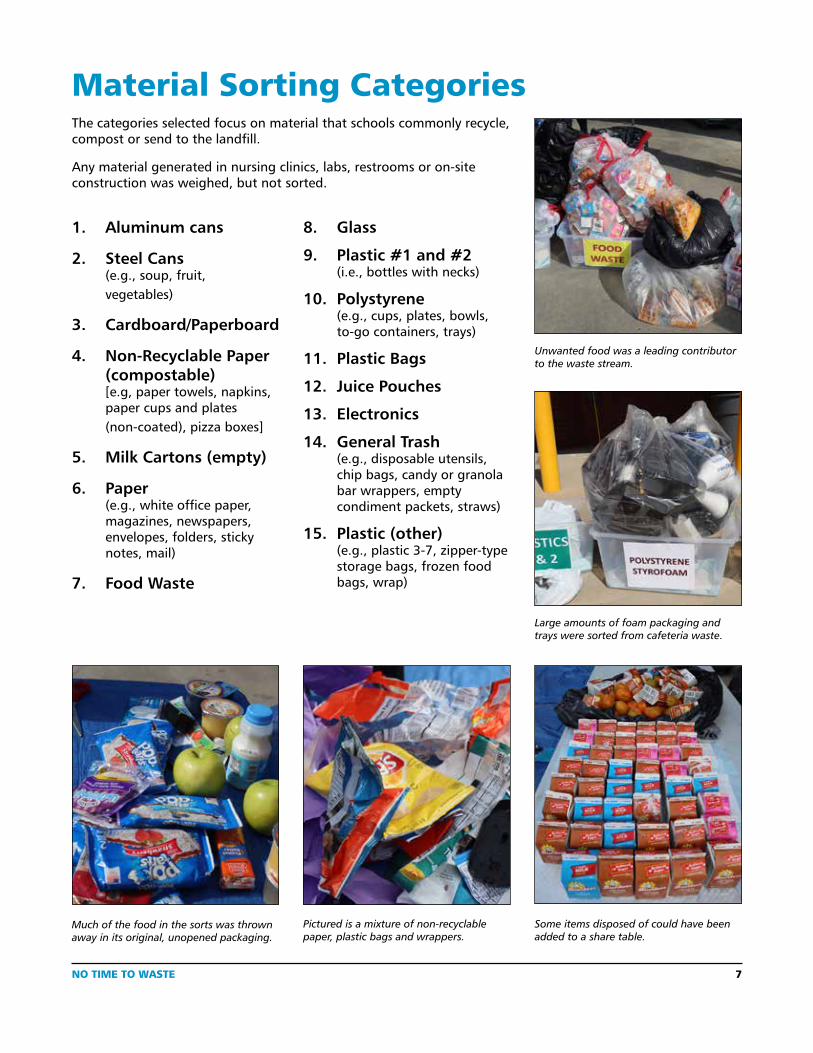
Pictured is a mixture of non-recyclable paper, plastic bags and wrappers.
Much of the food in the sorts was thrown away in its original, unopened packaging.
Some items disposed of could have been added to a share table.
Large amounts of foam packaging and trays were sorted from cafeteria waste.
Unwanted food was a leading contributor to the waste stream.
8 NO TIME TO WASTE
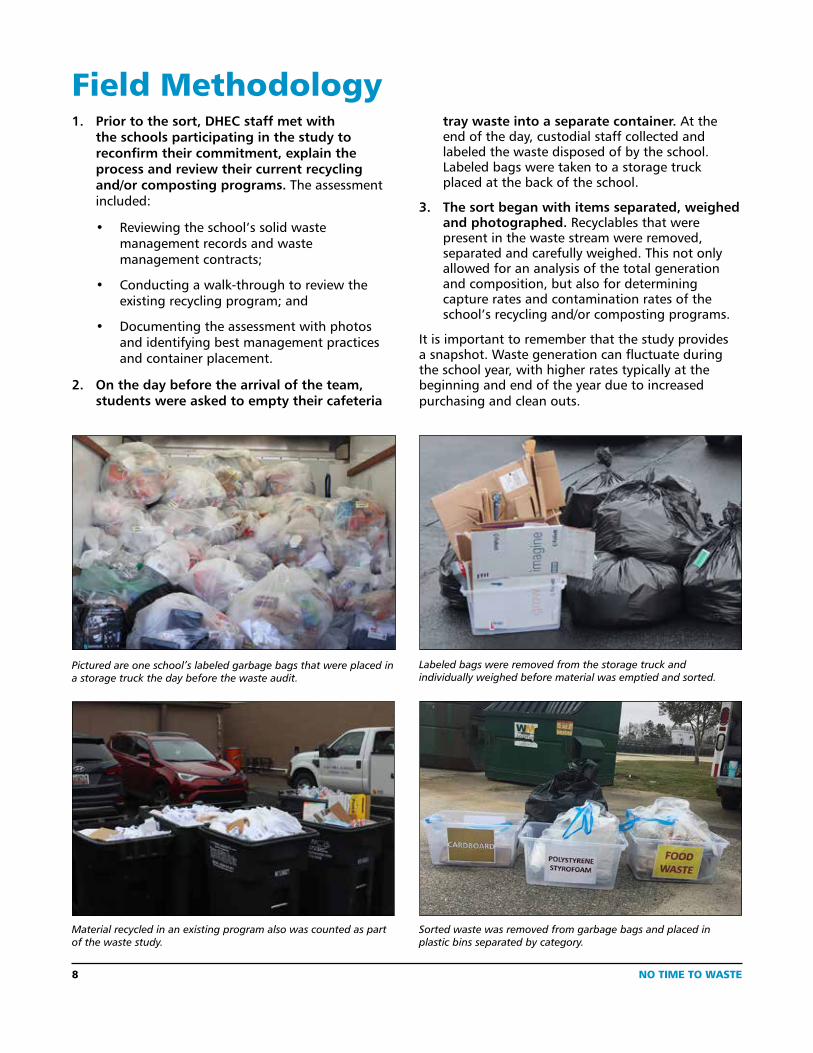
Field Methodology 1. Prior to the sort, DHEC staff met with
the schools participating in the study to reconfirm their commitment, explain the process and review their current recycling and/or composting programs. The assessment included:
• Reviewing the school’s solid waste management records and waste management contracts;
• Conducting a walk-through to review the existing recycling program; and
• Documenting the assessment with photos and identifying best management practices and container placement.
2. On the day before the arrival of the team, students were asked to empty their cafeteria
tray waste into a separate container. At the end of the day, custodial staff collected and labeled the waste disposed of by the school. Labeled bags were taken to a storage truck placed at the back of the school.
3. The sort began with items separated, weighed and photographed. Recyclables that were present in the waste stream were removed, separated and carefully weighed. This not only allowed for an analysis of the total generation and composition, but also for determining capture rates and contamination rates of the school’s recycling and/or composting programs.
It is important to remember that the study provides a snapshot. Waste generation can fluctuate during the school year, with higher rates typically at the beginning and end of the year due to increased purchasing and clean outs.
Pictured are one school’s labeled garbage bags that were placed in a storage truck the day before the waste audit.
Labeled bags were removed from the storage truck and individually weighed before material was emptied and sorted.
Sorted waste was removed from garbage bags and placed in plastic bins separated by category.
Material recycled in an existing program also was counted as part of the waste study.
NO TIME TO WASTE 9
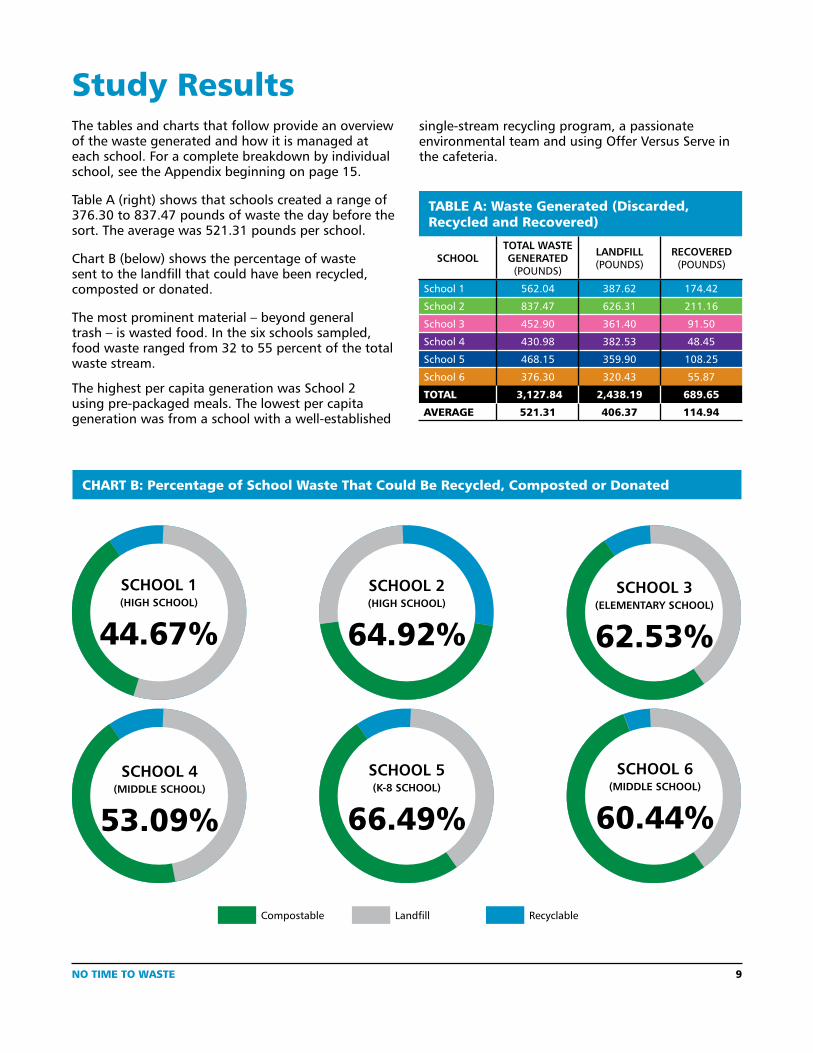
Study ResultsThe tables and charts that follow provide an overview of the waste generated and how it is managed at each school. For a complete breakdown by individual school, see the Appendix beginning on page 15.
Table A (right) shows that schools created a range of 376.30 to 837.47 pounds of waste the day before the sort. The average was 521.31 pounds per school.
Chart B (below) shows the percentage of waste sent to the landfill that could have been recycled, composted or donated.
The most prominent material – beyond general trash – is wasted food. In the six schools sampled, food waste ranged from 32 to 55 percent of the total waste stream.
The highest per capita generation was School 2 using pre-packaged meals. The lowest per capita generation was from a school with a well-established
TABLE A: Waste Generated (Discarded, Recycled and Recovered)
SCHOOLTOTAL WASTE GENERATED
(POUNDS)
LANDFILL (POUNDS)
RECOVERED (POUNDS)
School 1 562.04 387.62 174.42
School 2 837.47 626.31 211.16
School 3 452.90 361.40 91.50
School 4 430.98 382.53 48.45
School 5 468.15 359.90 108.25
School 6 376.30 320.43 55.87
TOTAL 3,127.84 2,438.19 689.65
AVERAGE 521.31 406.37 114.94
single-stream recycling program, a passionate environmental team and using Offer Versus Serve in the cafeteria.
SCHOOL 3 (ELEMENTARY SCHOOL)
62.53%
SCHOOL 5 (K-8 SCHOOL)
66.49%
SCHOOL 4 (MIDDLE SCHOOL)
53.09%
SCHOOL 6 (MIDDLE SCHOOL)
60.44%
SCHOOL 2 (HIGH SCHOOL)
64.92%
SCHOOL 1 (HIGH SCHOOL)
44.67%
CHART B: Percentage of School Waste That Could Be Recycled, Composted or Donated
Compostable Landfill Recyclable
10 NO TIME TO WASTE
This study – based on the walk-throughs, interviews and data collection/analysis from the waste sorts – identifies opportunities at each of the six schools to implement practices that will reduce waste going to the landfill. The following recommendations are based on the cumulative summary of the key findings and can be applied to almost any school. Specific recommendations with supporting data for each of the six participating schools are found in the Appendix beginning on page 15. The recommendations focus on:
1. Reducing food waste;
2. Composting organics;
3. Updating recycling programs;
4. Implementing waste reduction initiatives; and
Reduce wasted food.The cafeteria presents the biggest opportunity for overall waste reduction with one-third to about half of each school’s waste stream being unwanted food.
Here are recommendations to consider.
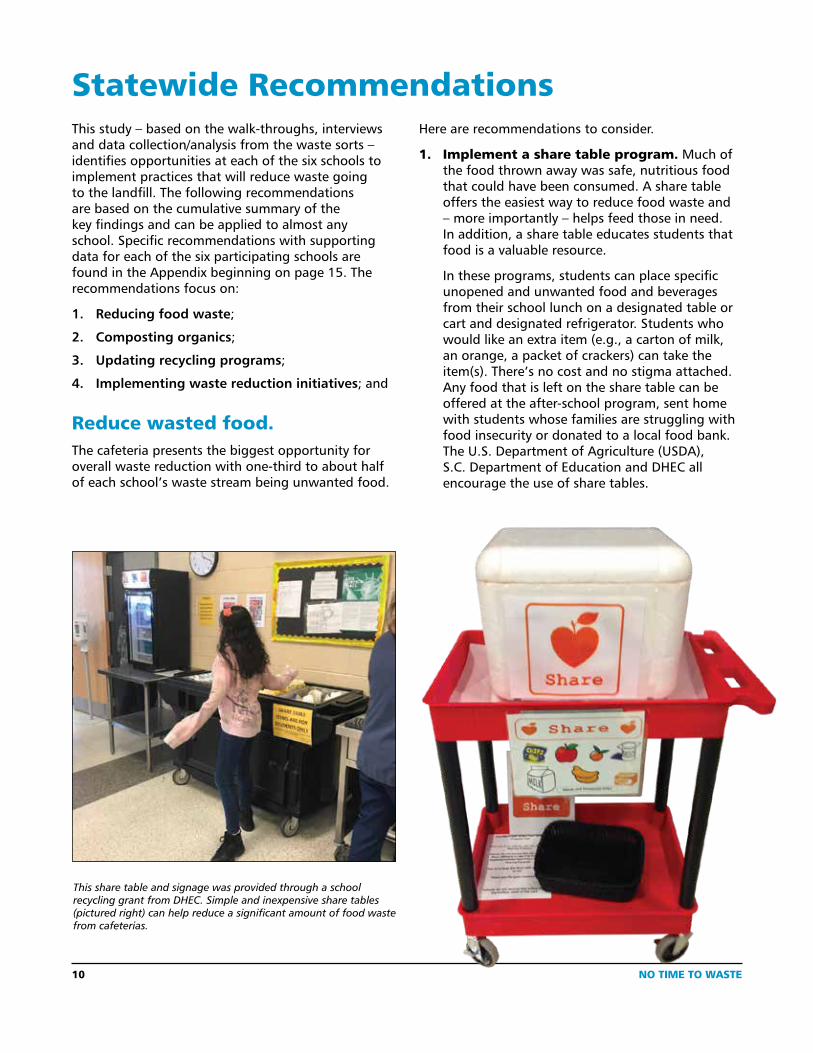
1. Implement a share table program. Much of the food thrown away was safe, nutritious food that could have been consumed. A share table offers the easiest way to reduce food waste and – more importantly – helps feed those in need. In addition, a share table educates students that food is a valuable resource.
In these programs, students can place specific unopened and unwanted food and beverages from their school lunch on a designated table or cart and designated refrigerator. Students who would like an extra item (e.g., a carton of milk, an orange, a packet of crackers) can take the item(s). There’s no cost and no stigma attached. Any food that is left on the share table can be offered at the after-school program, sent home with students whose families are struggling with food insecurity or donated to a local food bank. The U.S. Department of Agriculture (USDA), S.C. Department of Education and DHEC all encourage the use of share tables.
This share table and signage was provided through a school recycling grant from DHEC. Simple and inexpensive share tables (pictured right) can help reduce a significant amount of food waste from cafeterias.
Statewide Recommendations
NO TIME TO WASTE 11
There are basic steps to follow in setting up this initiative.
• Create a team (e.g., cafeteria staff, administration, teachers, students) to secure support and carefully plan.
• Education and training are essential to ensure success. Provide a training program for cafeteria staff as well as students and faculty. The program should address compliance with federal, state and local laws, and a list of acceptable items (e.g., granola bars, bananas, oranges, milk) as well as those items not allowed (e.g., unwrapped apples).
• Promote the program.
• Post signage at the table that includes pictures of what is accepted and not accepted. Place the table with easy access for students.
• DHEC and the S.C. Department of Education offer guidance documents on standard procedures for share tables.2, 4 The USDA also provides information on the use of share tables.3
2. Implement Offer Versus Serve. Offer Versus Serve (OVS) is a lunchroom strategy that allows students to decline some food items and select others they intend to eat. This initiative reduces food waste and costs as well as encourages the consumption of nutritious food. The USDA, DHEC and the S.C. Department of Education encourage and support OVS. The USDA and the S.C. Department of Education provide guidance on OVS.5, 22
3. Join the Smarter Lunchrooms Movement.8 This program contains 60 simple, no-cost or low-cost strategies that lunchrooms can use to increase participation, improve consumption of healthy food and reduce food waste.
4. Consider recess before lunch. Studies have shown that having recess before lunch – play then eat – is a successful strategy to reduce food waste and increase the consumption of nutritious food. The strategy also improves the lunchroom “atmosphere” since students are not rushing to get outside. It also improves classroom behavior after lunch and behavior overall. One study in Washington6 showed a decrease in food waste from 40.1 to 27.2 percent when recess was moved prior to lunch. Another study by Brigham Young University revealed that students consume more fruits and vegetables (0.16 serving per child or 54 percent increase) when they eat following recess.7 The USDA recommends holding recess before lunch and extending the lunch period as two key ways to reduce food waste in schools.
5. Consider increasing the amount of time students have to eat lunch. Extending lunch periods from 20 to 30 minutes may reduce plate waste by nearly one-third.
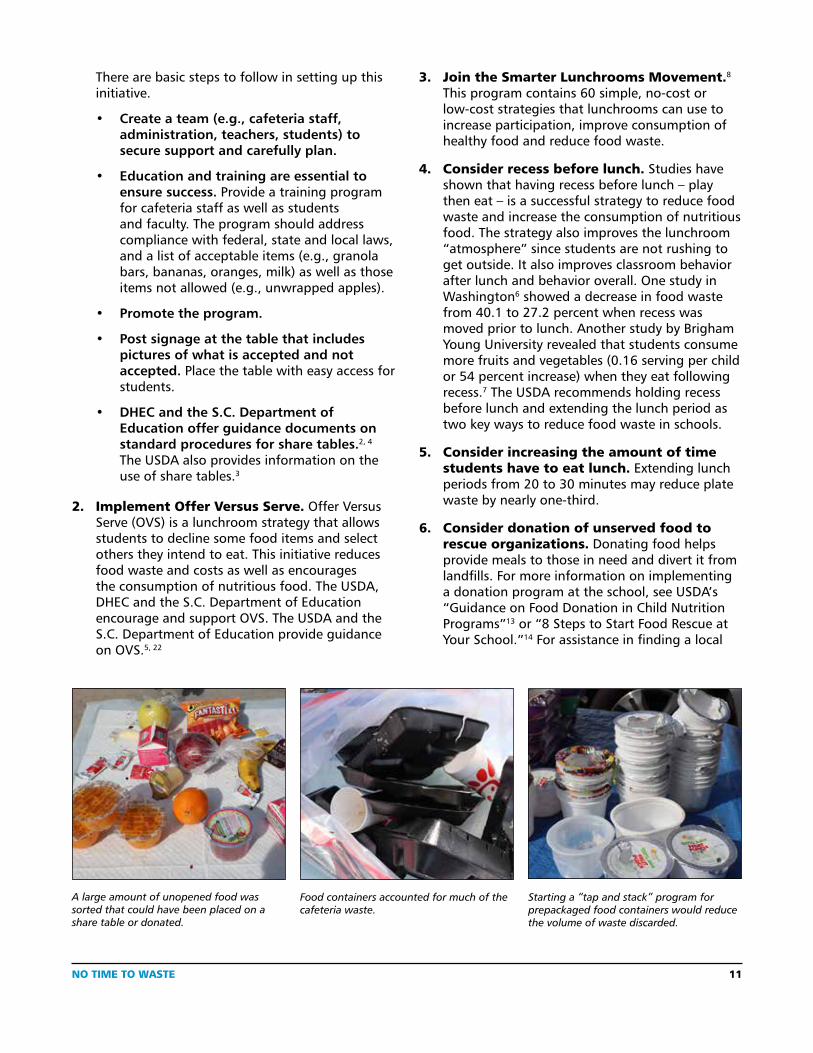
6. Consider donation of unserved food to rescue organizations. Donating food helps provide meals to those in need and divert it from landfills. For more information on implementing a donation program at the school, see USDA’s “Guidance on Food Donation in Child Nutrition Programs”13 or “8 Steps to Start Food Rescue at Your School.”14 For assistance in finding a local
Food containers accounted for much of the cafeteria waste.
A large amount of unopened food was sorted that could have been placed on a share table or donated.
Starting a “tap and stack” program for prepackaged food containers would reduce the volume of waste discarded.
12 NO TIME TO WASTE
food bank, visit Feeding America.15 “Food Rescue” (below) illustrates one of the participating school’s success in giving back and addressing food insecurity in their community.
There are additional practices and strategies to reduce the overall waste generated in school cafeterias listed under the “Implement waste reduction initiatives” in this section.
Compost organics.Diverting unwanted food from the landfill gives schools a significant opportunity to reduce their waste stream and turn that waste into a valuable product.
• Consider working with a commercial composting vendor. These companies
significantly increase the amount of food items and compostable paper that can be collected from schools.
• For tips on finding a hauler and steps on how to set up a school-wide composting program, see “Composting: A Guide for South Carolina Schools.”16
Update recycling programs.Walkthroughs of the schools revealed some extremely successful recycling programs. One of the participating schools in the study, for example, recycled more than 17.5 tons of material (through April 2019) – equivalent to 19.5 pounds per student.
Opportunities exist, however, to increase recovery of recyclables.
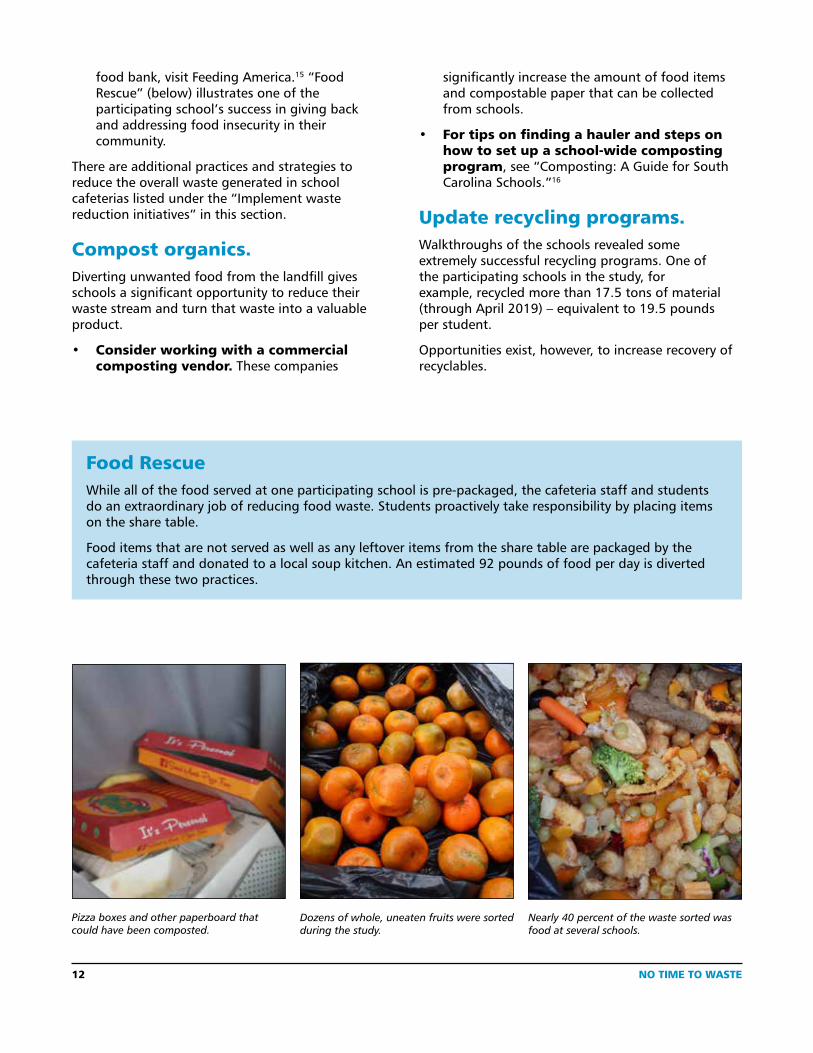
Pizza boxes and other paperboard that could have been composted.
Dozens of whole, uneaten fruits were sorted during the study.
Nearly 40 percent of the waste sorted was food at several schools.
Food RescueWhile all of the food served at one participating school is pre-packaged, the cafeteria staff and students do an extraordinary job of reducing food waste. Students proactively take responsibility by placing items on the share table.
Food items that are not served as well as any leftover items from the share table are packaged by the cafeteria staff and donated to a local soup kitchen. An estimated 92 pounds of food per day is diverted through these two practices.
NO TIME TO WASTE 13
The following recommendations focus on education, signage and containers.
1. Offer on-going education. The key to a successful recycling program is on-going education.
• Create and implement an education/outreach program and training for students, teachers, administration, custodial and cafeteria staff.
• Remember that while each school recycling program is unique, enthusiastic and passionate students play an integral role in collecting material, reducing contamination and in promoting and educating other students about the program.
2. Refresh signage. Update and add additional recycling signage in public spaces and classrooms to increase awareness of the recycling program, boost recovery rate, and decrease contamination with emphasis on eliminating bottles with liquid, food wrappers, paper ream packaging, and paper towels. Signage should include text and images of acceptable items and contaminants. Translate all educational materials into languages spoken at the school.
3. Use similar containers and determine the best locations for placement.
• Successful programs offer recycling in each classroom as well as common areas with containers prominently placed for easy access to recycling.
• Place the containers near the source of generation such as the cafeteria or vending banks to increase recovery of plastic bottles. Grants to purchase containers are available through DHEC.17
• To clearly “brand” the program, reduce contamination and improve collection, move to consistent containers (i.e., same color, size).
• “Twin the bin” by placing trash containers next to all recycling stations to help reduce contamination. Smaller-sized trash containers help reinforce the message that the trash should be a smaller percent than material recycled. Grants are available for purchasing bins through DHEC.17
4. Know your contract. Meet with vendors or the school district’s contact for the waste management – especially when a change in contract or vendor occurs. Know what can be recycled, the level of contamination allowed, data collected (if any) and any educational material or signage that they could provide for the school. Also determine if the material must be sorted or can go into one container.
5. Work with the county recycling coordinator. The county’s recycling coordinator can be a valuable resource for schools. The county may be able to assist the school by accepting a commodity for recycling, finding a market and sharing contacts. Several schools in the study added milk cartons as well as fats, oil and grease through the county’s program.
6. Track and promote your success. Sharing results encourages students and faculty to increase participation and results in higher recovery rate.
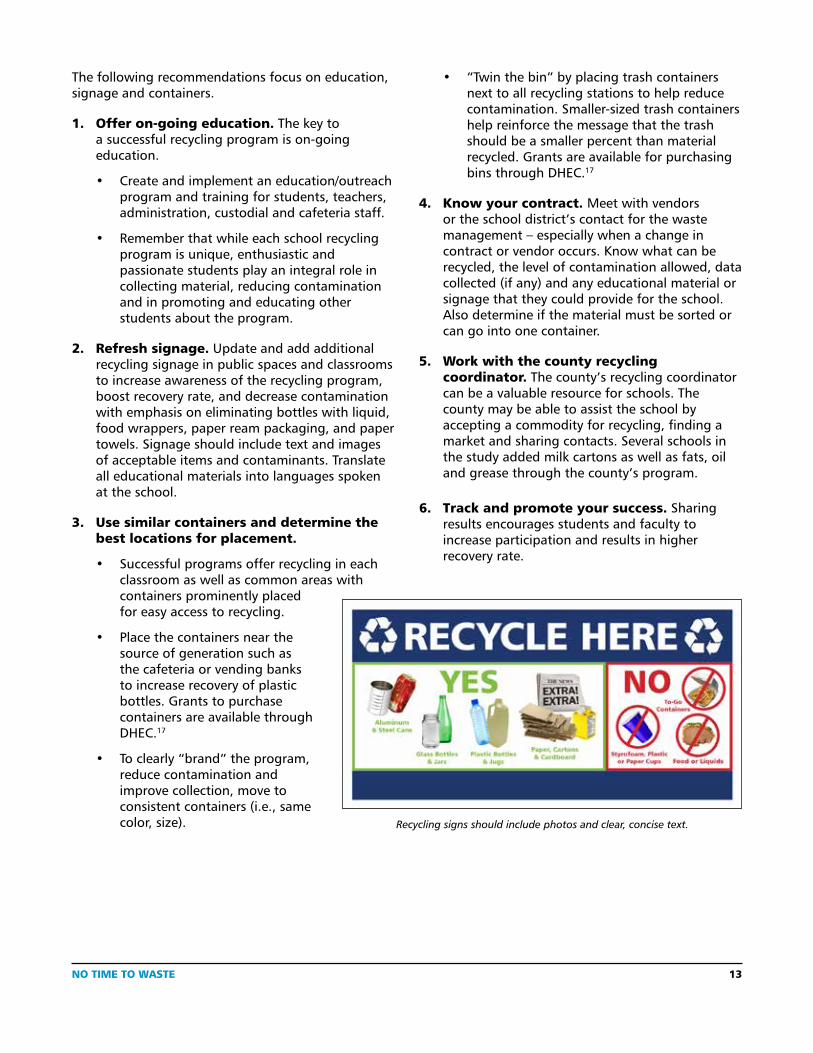
Recycling signs should include photos and clear, concise text.
14 NO TIME TO WASTE
Implement waste reduction initiatives.1. Implement a “tap and stack” program for
disposable food trays. “Tap and stack” is a practice where students tap uneaten food from their polystyrene lunch trays into a specific waste container and then stack the trays. By stacking versus tossing the containers into the trash, one South Carolina school reported reducing the volume of waste almost 50 percent. Here are some publications that offer assistance:
• “Reducing Wasted Food & Packaging: A Guide for Food Services and Restaurants;”10
• The USDA provides tips for reducing food waste at school;11 and
• Participate in the DWFSC campaign.12
2. Eliminate single-serve condiments. Buy and serve in bulk dispensers. If bulk condiment dispensers can’t be purchased, provide condiments packets only upon request.
3. Consider a waste-free lunch. Encourage teachers and students to bring a waste-free lunch (e.g., choose a reusable bag, utensils and bottle) snack or hold a waste free lunch day to raise awareness of the amount of packaging and food waste is created from packed lunches. The U.S. Environmental Protection Agency (EPA) offers tips and educational items.9
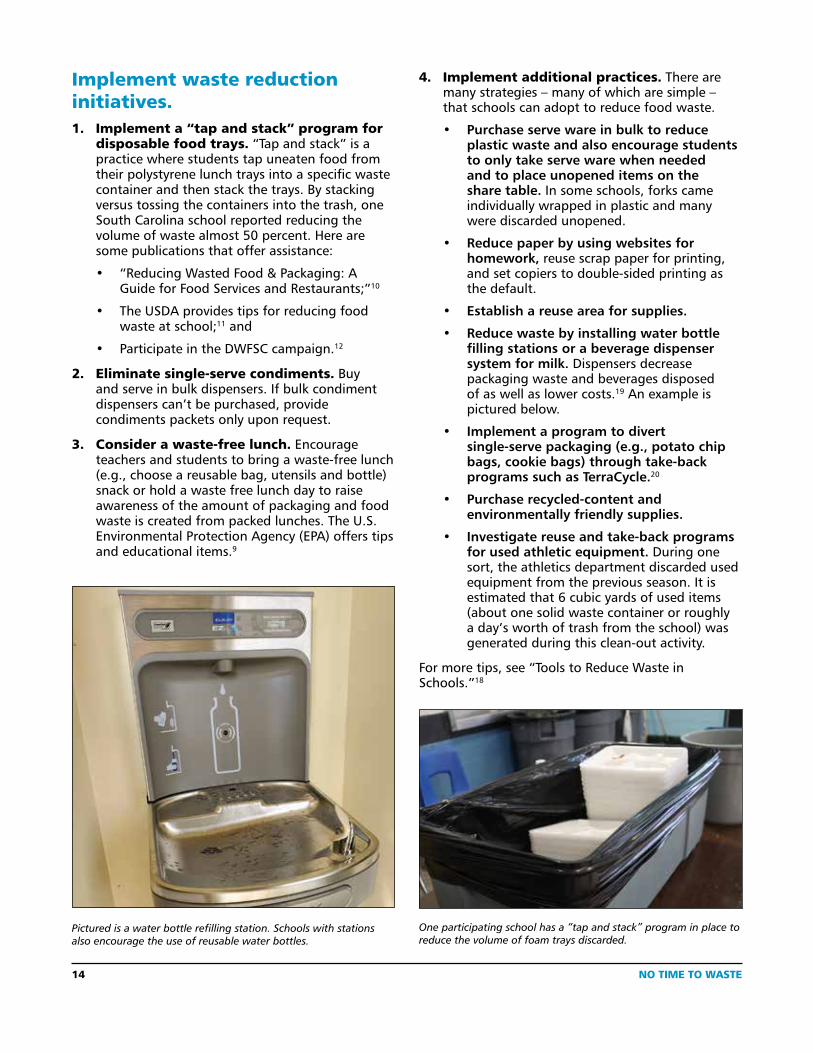
Pictured is a water bottle refilling station. Schools with stations also encourage the use of reusable water bottles.
One participating school has a “tap and stack” program in place to reduce the volume of foam trays discarded.
4. Implement additional practices. There are many strategies – many of which are simple – that schools can adopt to reduce food waste.
• Purchase serve ware in bulk to reduce plastic waste and also encourage students to only take serve ware when needed and to place unopened items on the share table. In some schools, forks came individually wrapped in plastic and many were discarded unopened.
• Reduce paper by using websites for homework, reuse scrap paper for printing, and set copiers to double-sided printing as the default.
• Establish a reuse area for supplies.
• Reduce waste by installing water bottle filling stations or a beverage dispenser system for milk. Dispensers decrease packaging waste and beverages disposed of as well as lower costs.19 An example is pictured below.
• Implement a program to divert single-serve packaging (e.g., potato chip bags, cookie bags) through take-back programs such as TerraCycle.20
• Purchase recycled-content and environmentally friendly supplies.
• Investigate reuse and take-back programs for used athletic equipment. During one sort, the athletics department discarded used equipment from the previous season. It is estimated that 6 cubic yards of used items (about one solid waste container or roughly a day’s worth of trash from the school) was generated during this clean-out activity.
For more tips, see “Tools to Reduce Waste in Schools.”18
NO TIME TO WASTE 15
AppendixThis section provides profiles of each school that participated in the study. The profiles include:
• A brief summary of the school’s recycling program;
• The composition of the school’s entire solid waste stream (recycled, composted, donated or sent to the landfill) by weight and commodity;
• An analysis of the potential amount of material that could be recovered from the waste currently disposed of; and
• Specific recommendations to expand or improve the program.
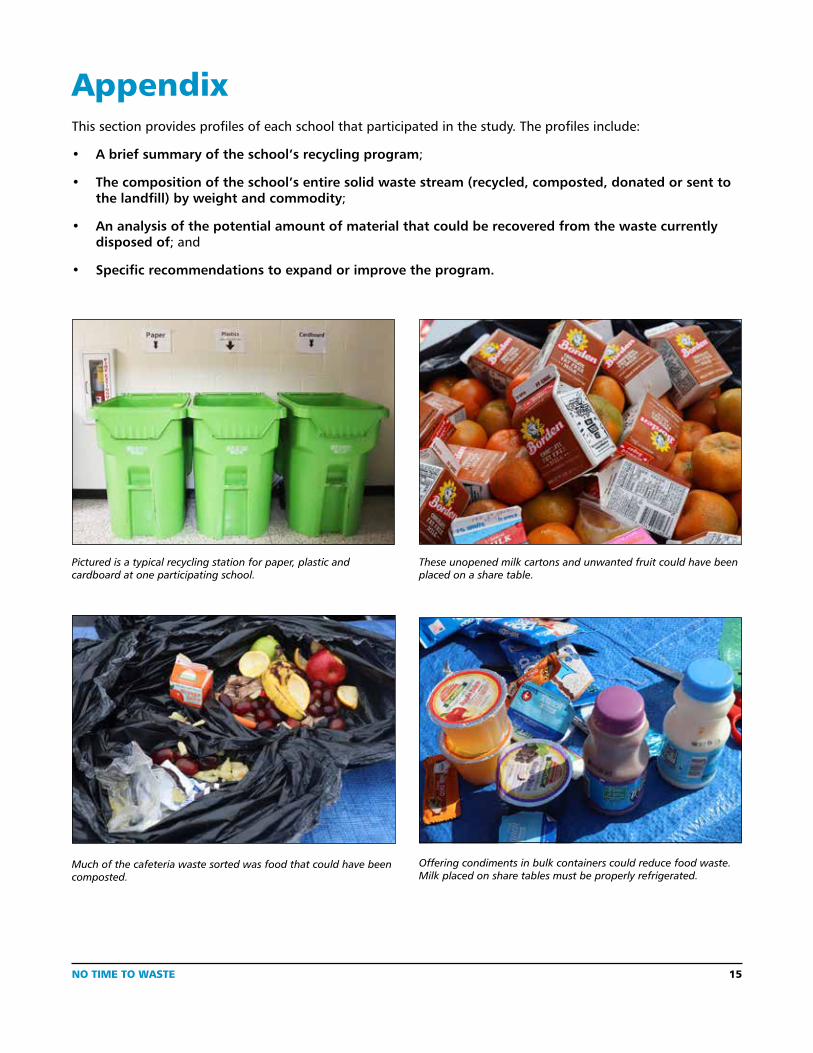
Much of the cafeteria waste sorted was food that could have been composted.
Offering condiments in bulk containers could reduce food waste. Milk placed on share tables must be properly refrigerated.
These unopened milk cartons and unwanted fruit could have been placed on a share table.
Pictured is a typical recycling station for paper, plastic and cardboard at one participating school.

16 NO TIME TO WASTE
School Profile No. 1TABLE 1.1: Data
Grades 9-12
Number of Students 819
Region Lower Piedmont Area
Date of sort March 14, 2019
SUMMARY
The school began its recycling program in 1999 courtesy of a DHEC grant. Today the program is fully integrated into the school with students playing a critical role in collecting material, reducing contamination and promoting recycling.
Cardboard, paper and plastic bottles are recycled. The school also recycles cooking oil. Each week, student volunteers, led by a Student Support Services teacher, collect paper while Environmental Club members collect plastic bottles from containers located in classrooms and high-traffic areas. The material is taken to recycling containers on campus provided by the county. The Junior Reserve Officers Training Corps (JROTC) also collects plastic bottles at football games. In addition, staff members and students collect and break down cardboard and move it to a designated storage area where it is picked up by a non-profit organization.
Less than 2 percent contamination was identified during the waste sort.
TABLE 1.2: Quick Glance
Waste generated 562.04 pounds
Top item sent to landfill General Trash
Top recycled Cardboard
Amount sent to landfill 387.62 pounds (68.97 percent)
Amount recycled 174.42 pounds (31.03 percent)
Potential recovery from the waste stream
173.15 pounds (44.67 percent) could have been diverted for recycling, composting or donation.
Note(s) About 55 percent of the material disposed of is from the cafeteria.
Chart 1.3 shows the percentage of material currently sent to the landfill that could have been recycled or composted.
Table 1.4 details the composition and total amount of waste generated at the school for the one-day study.
RECOMMENDATIONS
Of all of the waste sent to the landfill from this school, 44.67 percent could have been diverted for recycling or composting. The environmental benefits of preventing and reducing waste are significant. The economic benefits will vary. Most of the economic benefits would be a direct result of preventing food waste through OVS and other Smarter Lunchroom reduction strategies. The educational benefits – using the cafeteria as a classroom – will last a lifetime.
� Reduce wasted food. Unwanted food accounts for 32.00 percent of the total solid waste generated at the school.
• Start a share table program.
• Join the Smarter Lunchrooms Movement.
� Compost organics.
• Work with a commercial composting program. There are operations in the area that could provide services and assistance for this initiative. During the one-day sort, students were asked to empty their lunch tray waste into a separate container. Without prior education, students diverted 99.4
RECYCLABLE 8.55%
CHART 1.3: How Waste Could Be Managed
LANDFILL
55.33%COMPOSTABLE
36.12%
Figure 1.3 represents the percentage of material currently being sent to the landfill that is recoverable through the existing recycling program or available to be diverted to composting operations.
NO TIME TO WASTE 17
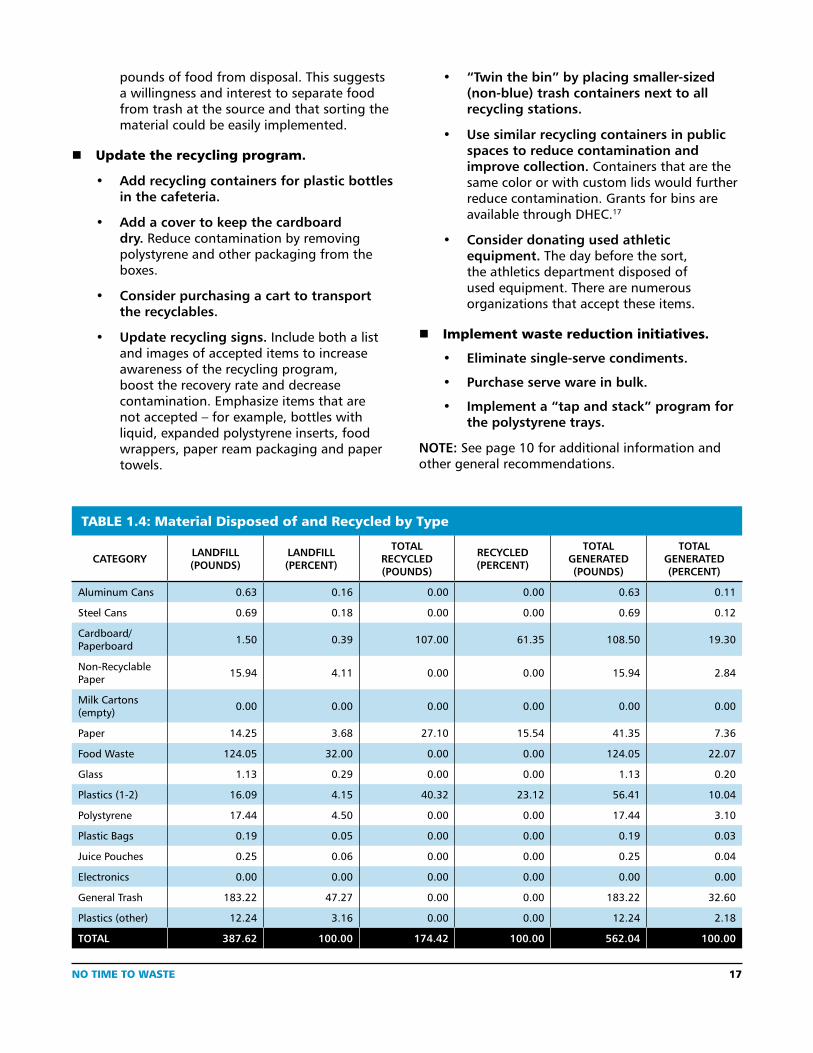
TABLE 1.4: Material Disposed of and Recycled by Type
CATEGORY LANDFILL (POUNDS)
LANDFILL (PERCENT)
TOTAL RECYCLED (POUNDS)
RECYCLED(PERCENT)
TOTAL GENERATED (POUNDS)
TOTAL GENERATED(PERCENT)
Aluminum Cans 0.63 0.16 0.00 0.00 0.63 0.11
Steel Cans 0.69 0.18 0.00 0.00 0.69 0.12
Cardboard/Paperboard 1.50 0.39 107.00 61.35 108.50 19.30
Non-Recyclable Paper 15.94 4.11 0.00 0.00 15.94 2.84
Milk Cartons (empty) 0.00 0.00 0.00 0.00 0.00 0.00
Paper 14.25 3.68 27.10 15.54 41.35 7.36
Food Waste 124.05 32.00 0.00 0.00 124.05 22.07
Glass 1.13 0.29 0.00 0.00 1.13 0.20
Plastics (1-2) 16.09 4.15 40.32 23.12 56.41 10.04
Polystyrene 17.44 4.50 0.00 0.00 17.44 3.10
Plastic Bags 0.19 0.05 0.00 0.00 0.19 0.03
Juice Pouches 0.25 0.06 0.00 0.00 0.25 0.04
Electronics 0.00 0.00 0.00 0.00 0.00 0.00
General Trash 183.22 47.27 0.00 0.00 183.22 32.60
Plastics (other) 12.24 3.16 0.00 0.00 12.24 2.18
TOTAL 387.62 100.00 174.42 100.00 562.04 100.00
pounds of food from disposal. This suggests a willingness and interest to separate food from trash at the source and that sorting the material could be easily implemented.
� Update the recycling program.
• Add recycling containers for plastic bottles in the cafeteria.
• Add a cover to keep the cardboard dry. Reduce contamination by removing polystyrene and other packaging from the boxes.
• Consider purchasing a cart to transport the recyclables.
• Update recycling signs. Include both a list and images of accepted items to increase awareness of the recycling program, boost the recovery rate and decrease contamination. Emphasize items that are not accepted – for example, bottles with liquid, expanded polystyrene inserts, food wrappers, paper ream packaging and paper towels.
• “Twin the bin” by placing smaller-sized (non-blue) trash containers next to all recycling stations.
• Use similar recycling containers in public spaces to reduce contamination and improve collection. Containers that are the same color or with custom lids would further reduce contamination. Grants for bins are available through DHEC.17
• Consider donating used athletic equipment. The day before the sort, the athletics department disposed of used equipment. There are numerous organizations that accept these items.
� Implement waste reduction initiatives.
• Eliminate single-serve condiments.
• Purchase serve ware in bulk.
• Implement a “tap and stack” program for the polystyrene trays.
NOTE: See page 10 for additional information and other general recommendations.
18 NO TIME TO WASTE
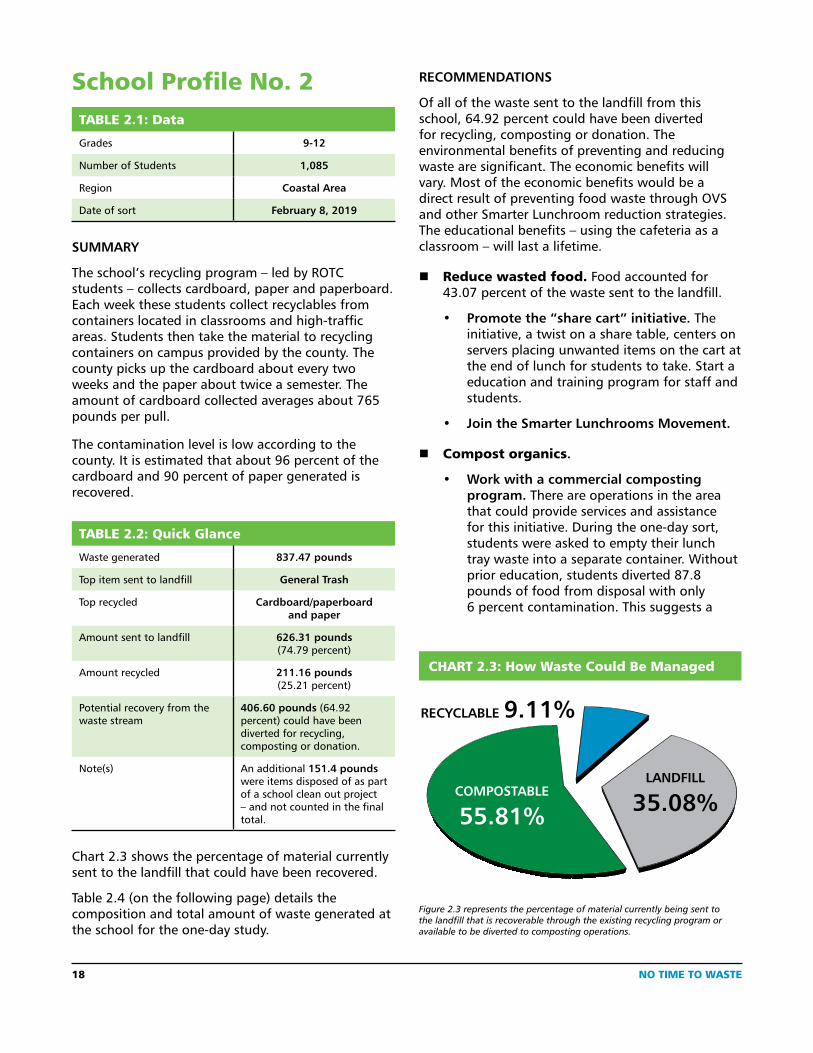
School Profile No. 2TABLE 2.1: Data
Grades 9-12
Number of Students 1,085
Region Coastal Area
Date of sort February 8, 2019
SUMMARY
The school’s recycling program – led by ROTC students – collects cardboard, paper and paperboard. Each week these students collect recyclables from containers located in classrooms and high-traffic areas. Students then take the material to recycling containers on campus provided by the county. The county picks up the cardboard about every two weeks and the paper about twice a semester. The amount of cardboard collected averages about 765 pounds per pull.
The contamination level is low according to the county. It is estimated that about 96 percent of the cardboard and 90 percent of paper generated is recovered.
TABLE 2.2: Quick Glance
Waste generated 837.47 pounds
Top item sent to landfill General Trash
Top recycled Cardboard/paperboard and paper
Amount sent to landfill 626.31 pounds (74.79 percent)
Amount recycled 211.16 pounds (25.21 percent)
Potential recovery from the waste stream
406.60 pounds (64.92 percent) could have been diverted for recycling, composting or donation.
Note(s) An additional 151.4 pounds were items disposed of as part of a school clean out project – and not counted in the final total.
Chart 2.3 shows the percentage of material currently sent to the landfill that could have been recovered.
Table 2.4 (on the following page) details the composition and total amount of waste generated at the school for the one-day study.
RECOMMENDATIONS
Of all of the waste sent to the landfill from this school, 64.92 percent could have been diverted for recycling, composting or donation. The environmental benefits of preventing and reducing waste are significant. The economic benefits will vary. Most of the economic benefits would be a direct result of preventing food waste through OVS and other Smarter Lunchroom reduction strategies. The educational benefits – using the cafeteria as a classroom – will last a lifetime.
� Reduce wasted food. Food accounted for 43.07 percent of the waste sent to the landfill.
• Promote the “share cart” initiative. The initiative, a twist on a share table, centers on servers placing unwanted items on the cart at the end of lunch for students to take. Start a education and training program for staff and students.
• Join the Smarter Lunchrooms Movement.
� Compost organics.
• Work with a commercial composting program. There are operations in the area that could provide services and assistance for this initiative. During the one-day sort, students were asked to empty their lunch tray waste into a separate container. Without prior education, students diverted 87.8 pounds of food from disposal with only 6 percent contamination. This suggests a
RECYCLABLE 9.11%
CHART 2.3: How Waste Could Be Managed
LANDFILL
35.08%COMPOSTABLE
55.81%
Figure 2.3 represents the percentage of material currently being sent to the landfill that is recoverable through the existing recycling program or available to be diverted to composting operations.
NO TIME TO WASTE 19
program for students to separate food waste from other waste could be implemented.
• Support further implementation of the Culinary Arts’ program’s composting initiative to enhance the school garden.
� Update the recycling program.
• Meet with the recycling vendor or the school district’s contact for the contract to review any changes that may impact the current recycling program. Discuss the list of recyclables, level of contamination allowed, types of material considered contaminants, types of data collected and any educational material or signs provided to the school. Also determine if the material must be sorted or can go into one container.
• Add PET (#1 plastic bottle) recycling. With a new recycling vendor, the school has a good opportunity to expand the program to include PET. If added, place containers in the vending area, cafeteria, media center, front entrance and outside bathrooms to collect the bottles.
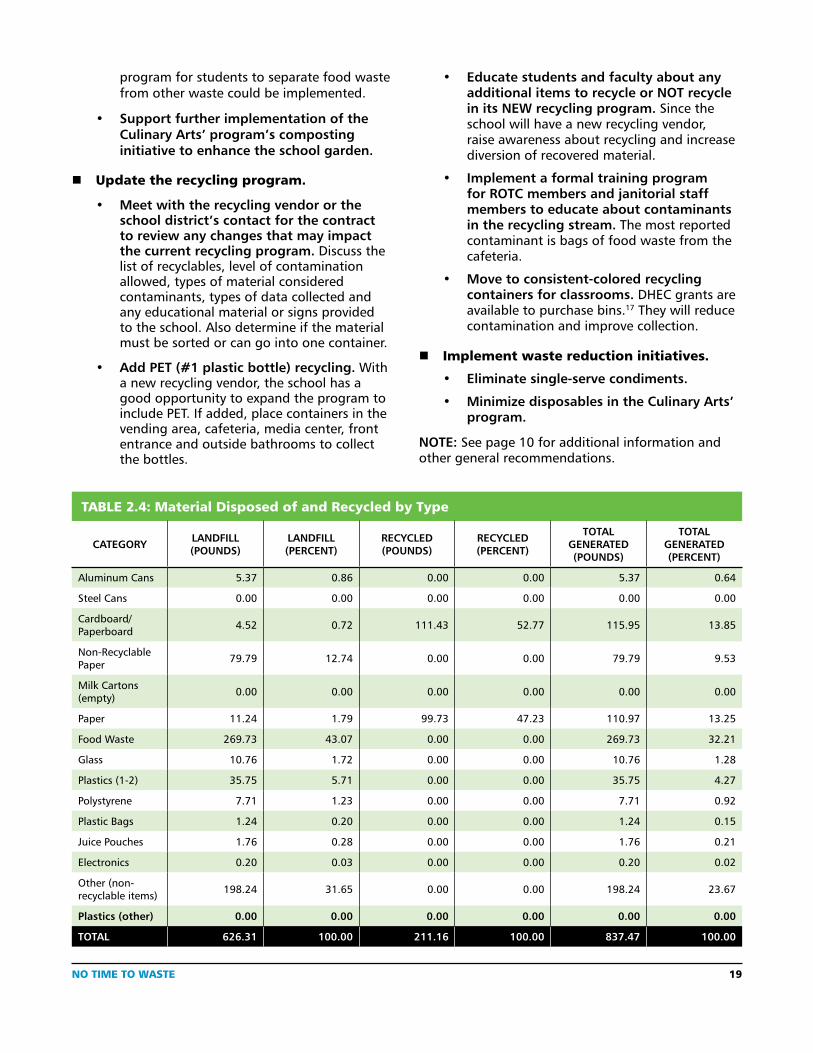
TABLE 2.4: Material Disposed of and Recycled by Type
CATEGORY LANDFILL (POUNDS)
LANDFILL(PERCENT)
RECYCLED (POUNDS)
RECYCLED(PERCENT)
TOTAL GENERATED (POUNDS)
TOTAL GENERATED(PERCENT)
Aluminum Cans 5.37 0.86 0.00 0.00 5.37 0.64
Steel Cans 0.00 0.00 0.00 0.00 0.00 0.00
Cardboard/Paperboard 4.52 0.72 111.43 52.77 115.95 13.85
Non-Recyclable Paper 79.79 12.74 0.00 0.00 79.79 9.53
Milk Cartons (empty) 0.00 0.00 0.00 0.00 0.00 0.00
Paper 11.24 1.79 99.73 47.23 110.97 13.25
Food Waste 269.73 43.07 0.00 0.00 269.73 32.21
Glass 10.76 1.72 0.00 0.00 10.76 1.28
Plastics (1-2) 35.75 5.71 0.00 0.00 35.75 4.27
Polystyrene 7.71 1.23 0.00 0.00 7.71 0.92
Plastic Bags 1.24 0.20 0.00 0.00 1.24 0.15
Juice Pouches 1.76 0.28 0.00 0.00 1.76 0.21
Electronics 0.20 0.03 0.00 0.00 0.20 0.02
Other (non-recyclable items) 198.24 31.65 0.00 0.00 198.24 23.67
Plastics (other) 0.00 0.00 0.00 0.00 0.00 0.00
TOTAL 626.31 100.00 211.16 100.00 837.47 100.00
• Educate students and faculty about any additional items to recycle or NOT recycle in its NEW recycling program. Since the school will have a new recycling vendor, raise awareness about recycling and increase diversion of recovered material.
• Implement a formal training program for ROTC members and janitorial staff members to educate about contaminants in the recycling stream. The most reported contaminant is bags of food waste from the cafeteria.
• Move to consistent-colored recycling containers for classrooms. DHEC grants are available to purchase bins.17 They will reduce contamination and improve collection.
� Implement waste reduction initiatives.
• Eliminate single-serve condiments.
• Minimize disposables in the Culinary Arts’ program.
NOTE: See page 10 for additional information and other general recommendations.
20 NO TIME TO WASTE
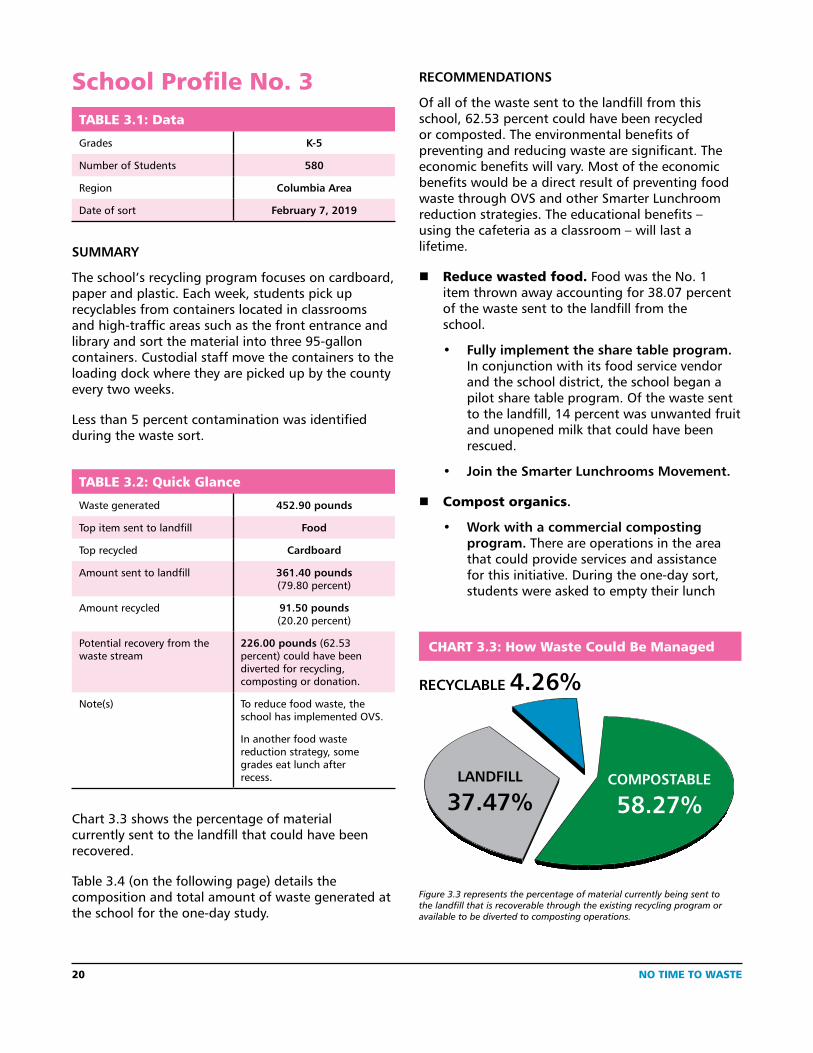
School Profile No. 3TABLE 3.1: Data
Grades K-5
Number of Students 580
Region Columbia Area
Date of sort February 7, 2019
SUMMARY
The school’s recycling program focuses on cardboard, paper and plastic. Each week, students pick up recyclables from containers located in classrooms and high-traffic areas such as the front entrance and library and sort the material into three 95-gallon containers. Custodial staff move the containers to the loading dock where they are picked up by the county every two weeks.
Less than 5 percent contamination was identified during the waste sort.
TABLE 3.2: Quick Glance
Waste generated 452.90 pounds
Top item sent to landfill Food
Top recycled Cardboard
Amount sent to landfill 361.40 pounds (79.80 percent)
Amount recycled 91.50 pounds (20.20 percent)
Potential recovery from the waste stream
226.00 pounds (62.53 percent) could have been diverted for recycling, composting or donation.
Note(s) To reduce food waste, the school has implemented OVS.
In another food waste reduction strategy, some grades eat lunch after recess.
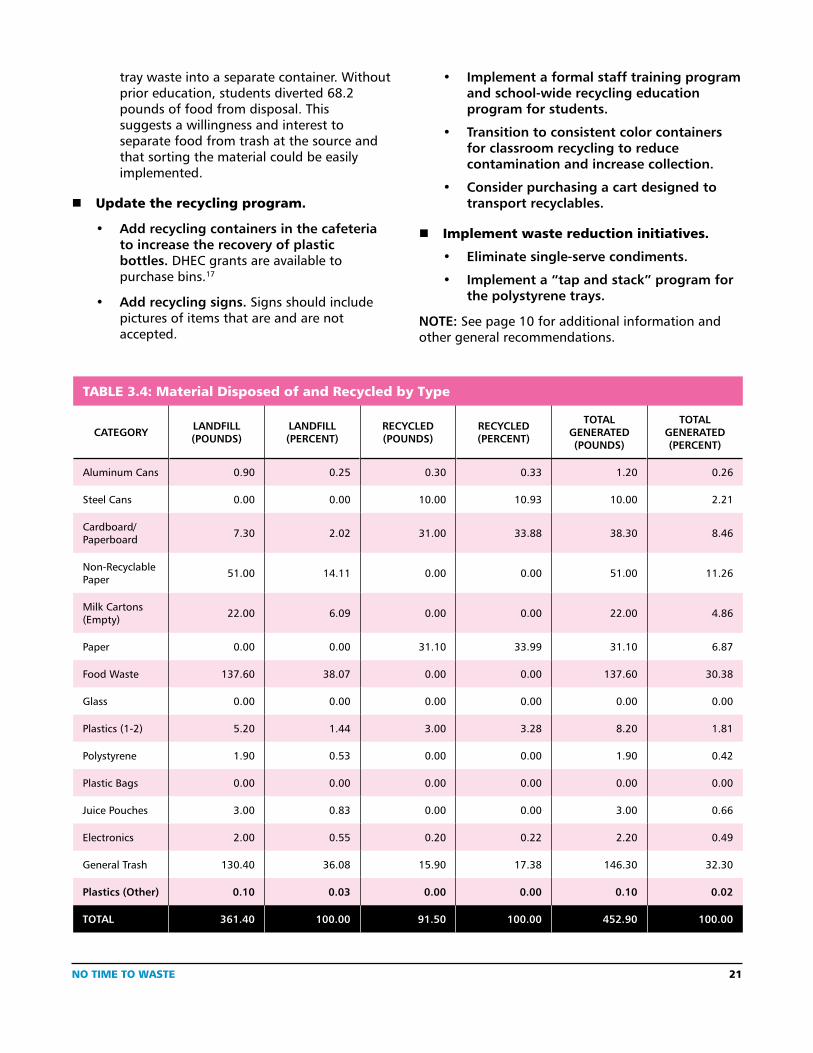
Chart 3.3 shows the percentage of material currently sent to the landfill that could have been recovered.
Table 3.4 (on the following page) details the composition and total amount of waste generated at the school for the one-day study.
RECOMMENDATIONS
Of all of the waste sent to the landfill from this school, 62.53 percent could have been recycled or composted. The environmental benefits of preventing and reducing waste are significant. The economic benefits will vary. Most of the economic benefits would be a direct result of preventing food waste through OVS and other Smarter Lunchroom reduction strategies. The educational benefits – using the cafeteria as a classroom – will last a lifetime.
� Reduce wasted food. Food was the No. 1 item thrown away accounting for 38.07 percent of the waste sent to the landfill from the school.
• Fully implement the share table program. In conjunction with its food service vendor and the school district, the school began a pilot share table program. Of the waste sent to the landfill, 14 percent was unwanted fruit and unopened milk that could have been rescued.
• Join the Smarter Lunchrooms Movement.
� Compost organics.
• Work with a commercial composting program. There are operations in the area that could provide services and assistance for this initiative. During the one-day sort, students were asked to empty their lunch
CHART 3.3: How Waste Could Be Managed
RECYCLABLE 4.26%
LANDFILL
37.47%COMPOSTABLE
58.27%
Figure 3.3 represents the percentage of material currently being sent to the landfill that is recoverable through the existing recycling program or available to be diverted to composting operations.
NO TIME TO WASTE 21
tray waste into a separate container. Without prior education, students diverted 68.2 pounds of food from disposal. This suggests a willingness and interest to separate food from trash at the source and that sorting the material could be easily implemented.
� Update the recycling program.
• Add recycling containers in the cafeteria to increase the recovery of plastic bottles. DHEC grants are available to purchase bins.17
• Add recycling signs. Signs should include pictures of items that are and are not accepted.
• Implement a formal staff training program and school-wide recycling education program for students.
• Transition to consistent color containers for classroom recycling to reduce contamination and increase collection.
• Consider purchasing a cart designed to transport recyclables.
� Implement waste reduction initiatives.
• Eliminate single-serve condiments.
• Implement a “tap and stack” program for the polystyrene trays.
NOTE: See page 10 for additional information and other general recommendations.
TABLE 3.4: Material Disposed of and Recycled by Type
CATEGORY LANDFILL (POUNDS)
LANDFILL(PERCENT)
RECYCLED (POUNDS)
RECYCLED(PERCENT)
TOTAL GENERATED (POUNDS)
TOTAL GENERATED(PERCENT)
Aluminum Cans 0.90 0.25 0.30 0.33 1.20 0.26
Steel Cans 0.00 0.00 10.00 10.93 10.00 2.21
Cardboard/Paperboard 7.30 2.02 31.00 33.88 38.30 8.46
Non-Recyclable Paper 51.00 14.11 0.00 0.00 51.00 11.26
Milk Cartons (Empty) 22.00 6.09 0.00 0.00 22.00 4.86
Paper 0.00 0.00 31.10 33.99 31.10 6.87
Food Waste 137.60 38.07 0.00 0.00 137.60 30.38
Glass 0.00 0.00 0.00 0.00 0.00 0.00
Plastics (1-2) 5.20 1.44 3.00 3.28 8.20 1.81
Polystyrene 1.90 0.53 0.00 0.00 1.90 0.42
Plastic Bags 0.00 0.00 0.00 0.00 0.00 0.00
Juice Pouches 3.00 0.83 0.00 0.00 3.00 0.66
Electronics 2.00 0.55 0.20 0.22 2.20 0.49
General Trash 130.40 36.08 15.90 17.38 146.30 32.30
Plastics (Other) 0.10 0.03 0.00 0.00 0.10 0.02
TOTAL 361.40 100.00 91.50 100.00 452.90 100.00
22 NO TIME TO WASTE
School Profile No. 4TABLE 4.1: Data
Grades 7-8
Number of Students 828
Region Pee Dee Area
Date of sort March 20, 2019
SUMMARY
The school has a single-stream recycling program that collects separated items including aluminum cans, plastic bottles and paper as well as cardboard.
Environmental club students collect commingled recyclables from containers placed in classrooms as well as the media center, common areas and high-traffic areas. The material is placed in 95-gallon containers and picked up by a private vendor every two weeks.
The contamination level is less than 5 percent.
TABLE 4.2: Quick Glance
Waste generated 430.99 pounds
Top item sent to landfill General Trash
Top recycled Cardboard
Amount sent to landfill 382.53 pounds (88.76 percent)
Amount recycled 48.45 pounds (11.24 percent)
Potential recovery from the waste stream
203.09 pounds (53.09 percent) could have been diverted for recycling, composting or donation.
Note(s) The school recycled 572.40 pounds of text books during the week of the sort. The text books were not counted as part of the day’s waste generation.
The school has implemented OVS to reduce food waste.
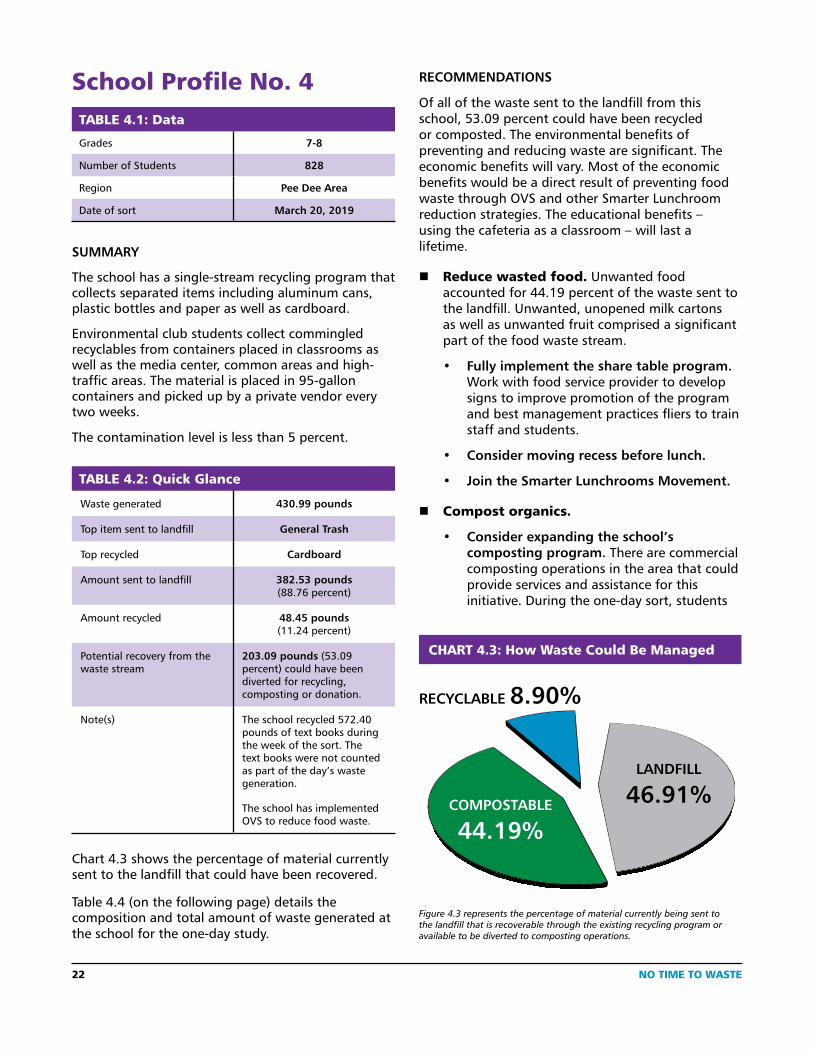
Chart 4.3 shows the percentage of material currently sent to the landfill that could have been recovered.
Table 4.4 (on the following page) details the composition and total amount of waste generated at the school for the one-day study.
RECOMMENDATIONS
Of all of the waste sent to the landfill from this school, 53.09 percent could have been recycled or composted. The environmental benefits of preventing and reducing waste are significant. The economic benefits will vary. Most of the economic benefits would be a direct result of preventing food waste through OVS and other Smarter Lunchroom reduction strategies. The educational benefits – using the cafeteria as a classroom – will last a lifetime.
� Reduce wasted food. Unwanted food accounted for 44.19 percent of the waste sent to the landfill. Unwanted, unopened milk cartons as well as unwanted fruit comprised a significant part of the food waste stream.
• Fully implement the share table program.Work with food service provider to develop signs to improve promotion of the program and best management practices fliers to train staff and students.
• Consider moving recess before lunch.
• Join the Smarter Lunchrooms Movement.
� Compost organics.
• Consider expanding the school’s composting program. There are commercial composting operations in the area that could provide services and assistance for this initiative. During the one-day sort, students
CHART 4.3: How Waste Could Be Managed
RECYCLABLE 8.90%
LANDFILL
46.91%COMPOSTABLE
44.19%
Figure 4.3 represents the percentage of material currently being sent to the landfill that is recoverable through the existing recycling program or available to be diverted to composting operations.
NO TIME TO WASTE 23
were asked to empty their lunch tray waste into a separate container. Without prior education, students showed a willingness and interest to separate food from trash at the source and that sorting the material could be easily implemented.
� Update Recycling Program
• Add recycling containers in the cafeteria to increase the recovery of plastic bottles. DHEC grants are available to purchase bins.17
• Recycle empty milk cartons. Cartons are accepted by the school’s current recycling vendor.
• Develop educational material for the program to raise awareness about items
that are not recycled at the school (e.g., plastic film, plastic bags). Add recycling signs in public spaces and on all containers. Communication decreases contamination in recycling bins and reduces the sorting time required by environmental club members. Education should focus on paper and plastic bottles since these are the two most commonly recyclable items being sent to the landfill.
� Implement waste reduction initiatives.
• Implement a “tap and stack” program for the polystyrene trays.
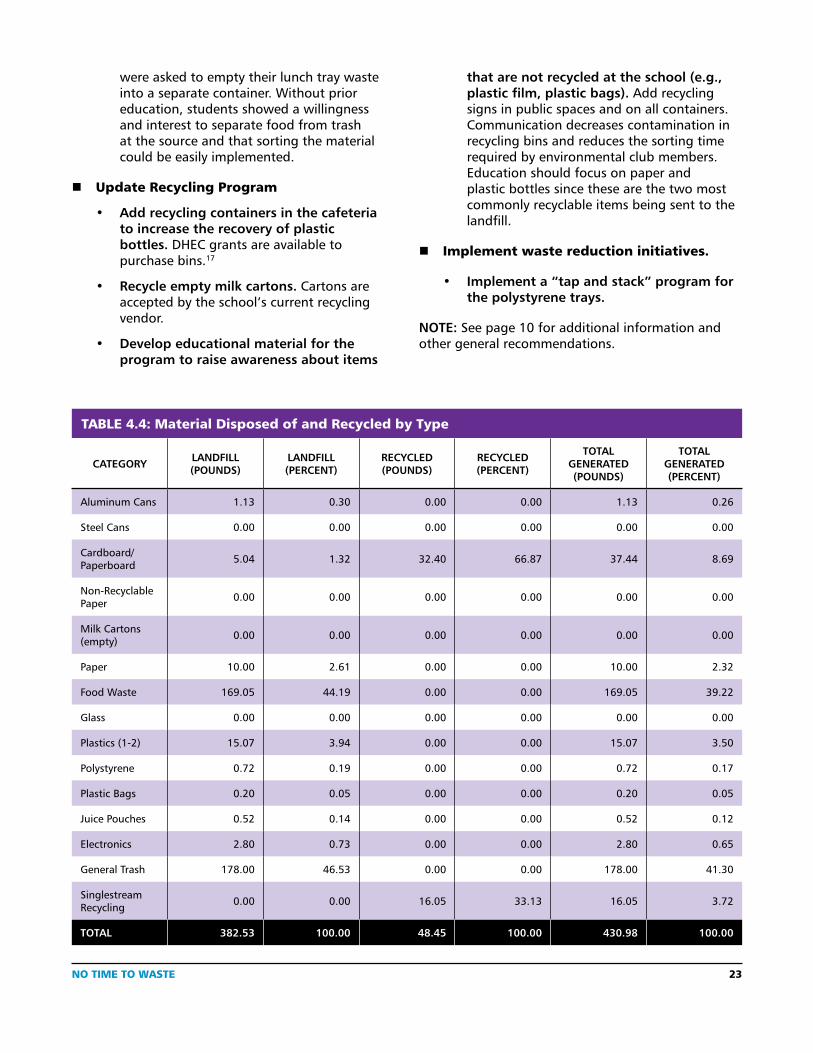
NOTE: See page 10 for additional information and other general recommendations.
TABLE 4.4: Material Disposed of and Recycled by Type
CATEGORY LANDFILL (POUNDS)
LANDFILL(PERCENT)
RECYCLED (POUNDS)
RECYCLED(PERCENT)
TOTAL GENERATED (POUNDS)
TOTAL GENERATED(PERCENT)
Aluminum Cans 1.13 0.30 0.00 0.00 1.13 0.26
Steel Cans 0.00 0.00 0.00 0.00 0.00 0.00
Cardboard/Paperboard 5.04 1.32 32.40 66.87 37.44 8.69
Non-Recyclable Paper 0.00 0.00 0.00 0.00 0.00 0.00
Milk Cartons (empty) 0.00 0.00 0.00 0.00 0.00 0.00
Paper 10.00 2.61 0.00 0.00 10.00 2.32
Food Waste 169.05 44.19 0.00 0.00 169.05 39.22
Glass 0.00 0.00 0.00 0.00 0.00 0.00
Plastics (1-2) 15.07 3.94 0.00 0.00 15.07 3.50
Polystyrene 0.72 0.19 0.00 0.00 0.72 0.17
Plastic Bags 0.20 0.05 0.00 0.00 0.20 0.05
Juice Pouches 0.52 0.14 0.00 0.00 0.52 0.12
Electronics 2.80 0.73 0.00 0.00 2.80 0.65
General Trash 178.00 46.53 0.00 0.00 178.00 41.30
Singlestream Recycling 0.00 0.00 16.05 33.13 16.05 3.72
TOTAL 382.53 100.00 48.45 100.00 430.98 100.00
24 NO TIME TO WASTE
School Profile No. 5TABLE 5.1: DataGrades K-8
Number of Students 531
Region Upper Piedmont Area
Date of sort March 13, 2019
SUMMARY
The school collects only cardboard in its recycling program, but is looking for ways to improve and expand this effort. While all of the food served is pre-packaged, waste is reduced by using share tables. Items left on the share table and/or items not served are given to a non-profit.
The school estimates that it diverts about 92 pounds of food every day through the share table and donation. In addition, the school installed a water bottle refilling station saving an estimated 37,000-plus plastic bottles (at the time of this study).
TABLE 5.2: Quick Glance
Waste generated 468.15 pounds
Top item sent to landfill Food
Top recycled Cardboard
Top recovered Food
Amount sent to landfill 359.90 pounds (76.88 percent)
Amount recycled 15.81 pounds (3.38 percent)
Food recovered 92.44 pounds (19.75 percent)
Potential recovery from the waste stream
239.28 pounds (66.49 percent) could have been diverted for recycling, composting or donation.
Note(s) More than 300 pre-packaged food items were given to a local non-profit. The school estimates that about 8 tons of food is donated every year.
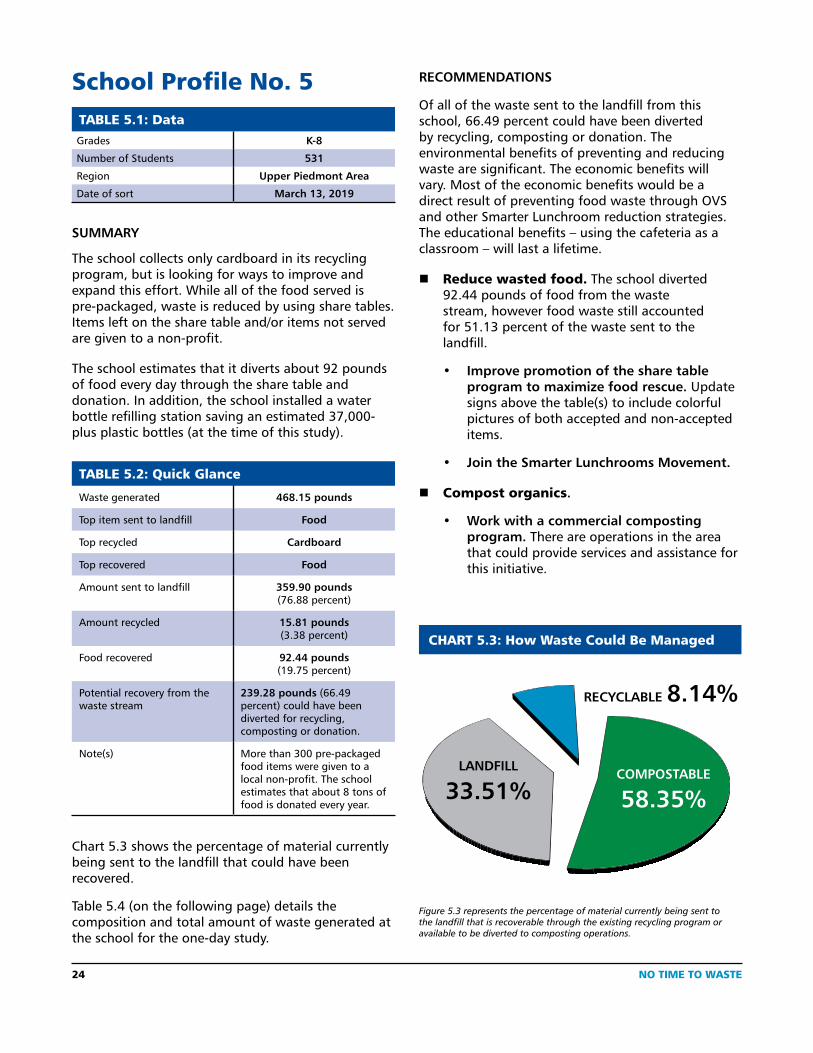
Chart 5.3 shows the percentage of material currently being sent to the landfill that could have been recovered.
Table 5.4 (on the following page) details the composition and total amount of waste generated at the school for the one-day study.
RECOMMENDATIONS
Of all of the waste sent to the landfill from this school, 66.49 percent could have been diverted by recycling, composting or donation. The environmental benefits of preventing and reducing waste are significant. The economic benefits will vary. Most of the economic benefits would be a direct result of preventing food waste through OVS and other Smarter Lunchroom reduction strategies. The educational benefits – using the cafeteria as a classroom – will last a lifetime.
� Reduce wasted food. The school diverted 92.44 pounds of food from the waste stream, however food waste still accounted for 51.13 percent of the waste sent to the landfill.
• Improve promotion of the share table program to maximize food rescue. Update signs above the table(s) to include colorful pictures of both accepted and non-accepted items.
• Join the Smarter Lunchrooms Movement.
� Compost organics.
• Work with a commercial composting program. There are operations in the area that could provide services and assistance for this initiative.
RECYCLABLE 8.14%
LANDFILL
33.51%COMPOSTABLE
58.35%
CHART 5.3: How Waste Could Be Managed
Figure 5.3 represents the percentage of material currently being sent to the landfill that is recoverable through the existing recycling program or available to be diverted to composting operations.
NO TIME TO WASTE 25
� Update recycling program.
• Start a recycling program to include aluminum cans, paper, plastic bottles and steel cans. Meet with county recycling coordinator for assistance.
• Purchase containers for classroom and public space recycling. DHEC grants are available for purchasing bins.17
• Create signs for all containers. Include pictures of accepted items for each container and include text in multiple languages.
• Start a school-wide recycling education program to raise awareness. Promote the program during announcements and work with the art program to produce posters showing recyclable items, bin locations and common contaminants (e.g., pre-packaged food containers).
� Implement waste reduction initiatives.
• Establish reuse area for school supplies. The waste sort identified items such as pencils and glue sticks.
• Set copiers to double-sided printing as the default and buy environmentally friendly, recycled-content supplies.
• Implement a “tap and stack” program for the polystyrene trays.
• Consider a program to divert single-serve packaging (e.g., potato chip bags, cookie bags) through take-back programs such as TerraCycle.
NOTE: See page 10 for additional information and other general recommendations.
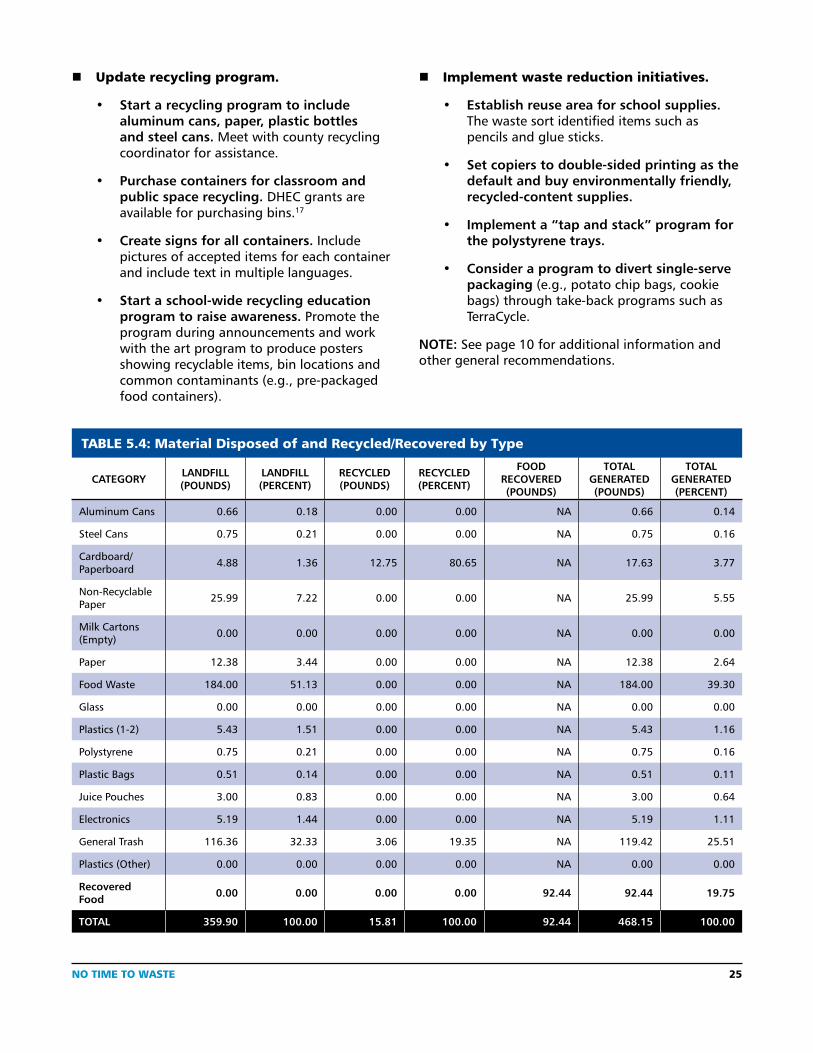
TABLE 5.4: Material Disposed of and Recycled/Recovered by Type
CATEGORY LANDFILL (POUNDS)
LANDFILL(PERCENT)
RECYCLED (POUNDS)
RECYCLED(PERCENT)
FOOD RECOVERED (POUNDS)
TOTAL GENERATED (POUNDS)
TOTAL GENERATED(PERCENT)
Aluminum Cans 0.66 0.18 0.00 0.00 NA 0.66 0.14
Steel Cans 0.75 0.21 0.00 0.00 NA 0.75 0.16
Cardboard/Paperboard 4.88 1.36 12.75 80.65 NA 17.63 3.77
Non-Recyclable Paper 25.99 7.22 0.00 0.00 NA 25.99 5.55
Milk Cartons (Empty) 0.00 0.00 0.00 0.00 NA 0.00 0.00
Paper 12.38 3.44 0.00 0.00 NA 12.38 2.64
Food Waste 184.00 51.13 0.00 0.00 NA 184.00 39.30
Glass 0.00 0.00 0.00 0.00 NA 0.00 0.00
Plastics (1-2) 5.43 1.51 0.00 0.00 NA 5.43 1.16
Polystyrene 0.75 0.21 0.00 0.00 NA 0.75 0.16
Plastic Bags 0.51 0.14 0.00 0.00 NA 0.51 0.11
Juice Pouches 3.00 0.83 0.00 0.00 NA 3.00 0.64
Electronics 5.19 1.44 0.00 0.00 NA 5.19 1.11
General Trash 116.36 32.33 3.06 19.35 NA 119.42 25.51
Plastics (Other) 0.00 0.00 0.00 0.00 NA 0.00 0.00
Recovered Food 0.00 0.00 0.00 0.00 92.44 92.44 19.75
TOTAL 359.90 100.00 15.81 100.00 92.44 468.15 100.00
26 NO TIME TO WASTE
School Profile No. 6TABLE 6.1: Data
Grades 7-8
Number of Students 628
Region Sandhill Area
Date of sort March 1, 2019
SUMMARY
The recycling program accepts aluminum cans, cardboard, paper, plastic bottles and steel cans. Classrooms and common areas have recycling containers. Each week a team of students led by a teacher collects the recovered material from each of the locations, sorts and places it into 95-gallon containers.
The county picks up the recovered material twice a week at no charge.
The recycling stream has less than 3 percent contamination.
TABLE 6.2: Quick Glance
Waste generated 376.30 pounds
Top item sent to landfill Food
Top recycled Paper
Amount sent to landfill 320.43 pounds (85.15 percent)
Amount recycled 55.87 pounds (14.85 percent)
Potential recovery from the waste stream
193.68 pounds (60.44 percent) could have been diverted for recycling, composting or donation.
Note(s) To reduce food waste, the school has implemented OVS. To reduce food waste from the cafeteria, the school has a “tap and stack” program for the polystyrene trays. Outreach material also is offered in Spanish.
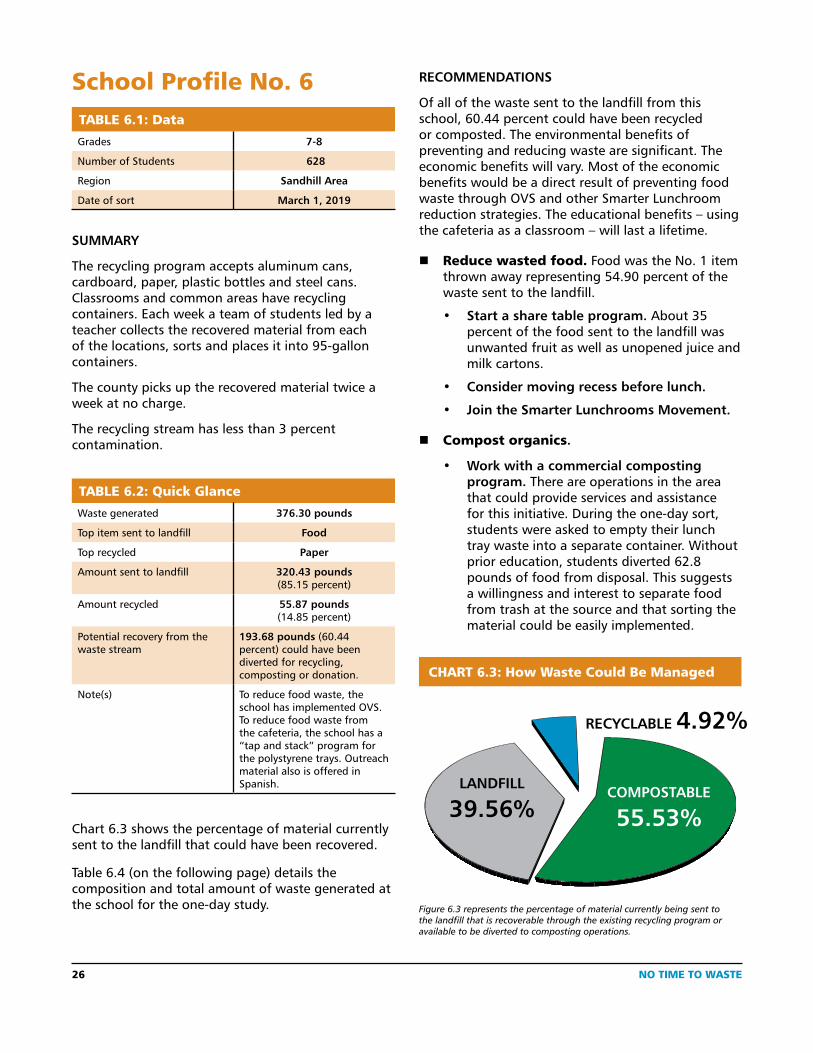
Chart 6.3 shows the percentage of material currently sent to the landfill that could have been recovered.
Table 6.4 (on the following page) details the composition and total amount of waste generated at the school for the one-day study.
RECOMMENDATIONS
Of all of the waste sent to the landfill from this school, 60.44 percent could have been recycled or composted. The environmental benefits of preventing and reducing waste are significant. The economic benefits will vary. Most of the economic benefits would be a direct result of preventing food waste through OVS and other Smarter Lunchroom reduction strategies. The educational benefits – using the cafeteria as a classroom – will last a lifetime.
� Reduce wasted food. Food was the No. 1 item thrown away representing 54.90 percent of the waste sent to the landfill.
• Start a share table program. About 35 percent of the food sent to the landfill was unwanted fruit as well as unopened juice and milk cartons.
• Consider moving recess before lunch.
• Join the Smarter Lunchrooms Movement.
� Compost organics.
• Work with a commercial composting program. There are operations in the area that could provide services and assistance for this initiative. During the one-day sort, students were asked to empty their lunch tray waste into a separate container. Without prior education, students diverted 62.8 pounds of food from disposal. This suggests a willingness and interest to separate food from trash at the source and that sorting the material could be easily implemented.
CHART 6.3: How Waste Could Be Managed
RECYCLABLE 4.92%
LANDFILL
39.56%COMPOSTABLE
55.53%
Figure 6.3 represents the percentage of material currently being sent to the landfill that is recoverable through the existing recycling program or available to be diverted to composting operations.
NO TIME TO WASTE 27
� Update the recycling program.
• Update and add recycling signs in public spaces and classrooms. They will increase awareness of the recycling program, boost recovery rate and decrease contamination. Focus on eliminating bottles with liquid, food wrappers, paper ream packaging and paper towels. Free recycling signs listing accepted items are available as a PDF from the county.
• Update the Spanish version of recycling signs at main cafeteria recycling stations. Signs should include pictures of accepted items and text for each container. Include words such as “recycle” to show the purpose for the containers and text that stresses reducing contamination.
• Place smaller-sized (non-blue) trash containers next to all recycling stations. Trash containers will reduce contamination. Smaller-sized containers reinforce the message that the amount of trash should be a smaller than material recycled.
• Consider recycling fats, oils and grease (FOG) from the cafeteria.
• Purchase a cart designed to transport recycling for environmental club members. A wheeled cart that can be pushed would make collection easier, decrease the number of trips (hauling time) and increase the amount of material taken per trip.
• Use consistent-looking recycling containers for classrooms and public spaces. They will reduce contamination and improve collection. Containers with custom lids for public spaces also would reduce contamination. DHEC grants are available for purchasing bins.17
� Implement waste reduction initiatives.
• Eliminate single-serve condiments. The waste sort revealed a high number of unopened individual packets in the trash.
NOTE: See page 10 for additional information and other general recommendations.
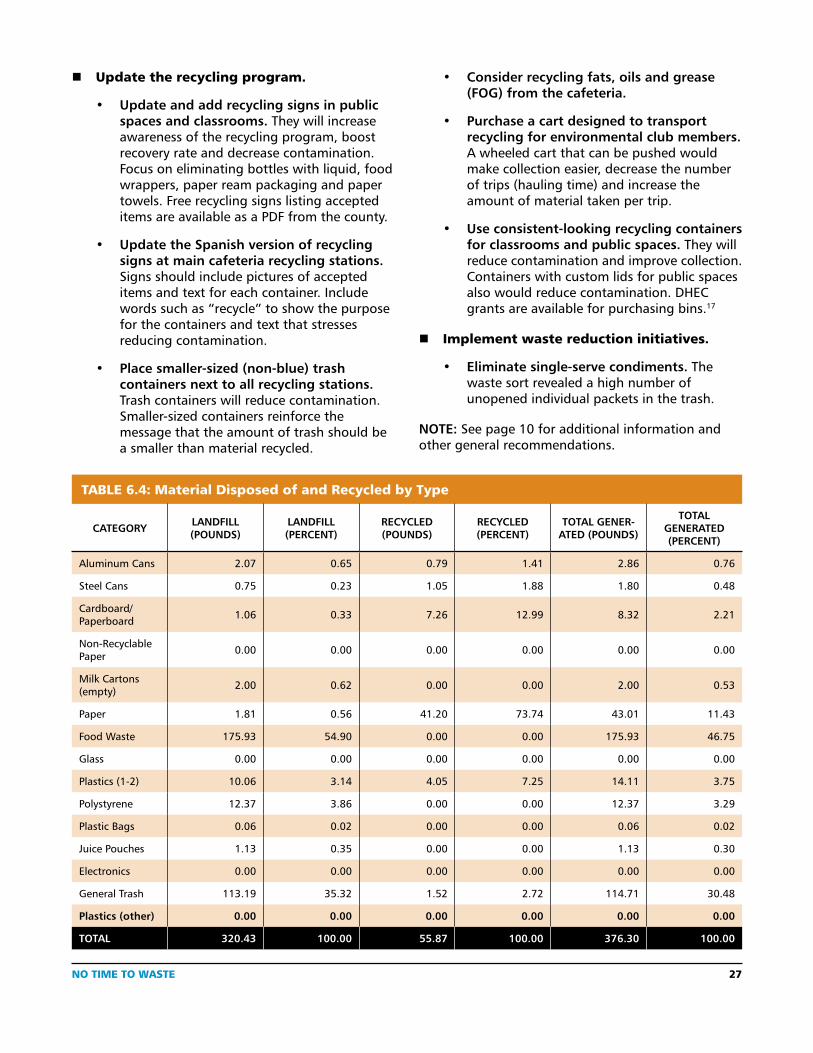
TABLE 6.4: Material Disposed of and Recycled by Type
CATEGORY LANDFILL (POUNDS)
LANDFILL(PERCENT)
RECYCLED (POUNDS)
RECYCLED(PERCENT)
TOTAL GENER-ATED (POUNDS)
TOTAL GENERATED(PERCENT)
Aluminum Cans 2.07 0.65 0.79 1.41 2.86 0.76
Steel Cans 0.75 0.23 1.05 1.88 1.80 0.48
Cardboard/Paperboard 1.06 0.33 7.26 12.99 8.32 2.21
Non-Recyclable Paper 0.00 0.00 0.00 0.00 0.00 0.00
Milk Cartons (empty) 2.00 0.62 0.00 0.00 2.00 0.53
Paper 1.81 0.56 41.20 73.74 43.01 11.43
Food Waste 175.93 54.90 0.00 0.00 175.93 46.75
Glass 0.00 0.00 0.00 0.00 0.00 0.00
Plastics (1-2) 10.06 3.14 4.05 7.25 14.11 3.75
Polystyrene 12.37 3.86 0.00 0.00 12.37 3.29
Plastic Bags 0.06 0.02 0.00 0.00 0.06 0.02
Juice Pouches 1.13 0.35 0.00 0.00 1.13 0.30
Electronics 0.00 0.00 0.00 0.00 0.00 0.00
General Trash 113.19 35.32 1.52 2.72 114.71 30.48
Plastics (other) 0.00 0.00 0.00 0.00 0.00 0.00
TOTAL 320.43 100.00 55.87 100.00 376.30 100.00
28 NO TIME TO WASTE
Key Works Cited1. DHEC’s Office of Solid Waste Reduction and Recycling, www.scdhec.gov/recycle
2. “Reducing Food Waste: A Guide for South Carolina Schools” (DHEC), www.scdhec.gov/sites/default/files/Library/OR-1522.pdf
3. Guidance document on Share Tables (USDA), https://fns-prod.azureedge.net/sites/default/files/cn/SP41_CACFP13_SFSP15_2016os.pdf
4. “Don’t Waste Food SC Share Table Guidance Document” (DHEC), www.scdhec.gov/dwfsc
5. Guidance document on Offer Versus Serve (USDA), www.fns.usda.gov/updated-offer-vs-serve-guidance-nslp-and-sbp-beginning-sy2015-16
6. “Lunch Time at School: How Much Is Enough? An Assessment of School Lunch Seat-Time in Seattle Public Schools.” (University Washington School of Public Health, Nutritional Sciences Program), https://depts.washington.edu/nutr/wordpress/wp-content/uploads/2015/07/Time-For-Lunch-FINAL_NUTR531-winter2015-1.pdf
7. “Lunch, Recess and Nutrition: Responding to Time Incentives in the Cafeteria.” (Brigham Young University and Cornell University), www.sciencedirect.com/science/article/pii/S0091743514004599
8. Smarter Lunchrooms Program, www.smarterlunchrooms.org
9. Waste-free Lunch Tips (EPA), www.epa.gov/students/pack-waste-free-lunch
10. Food Waste Reduction Tips (EPA), www.epa.gov/foodrecovery/reducing_wasted_food_pkg_ tool.pdf
11. Reducing Food Waste at School (USDA), www.usda.gov/oce/foodwaste/webinars/K-12/Tips_Resources_for_Schools.pdf
12. Don’t Waste Food SC campaign (DHEC), www.scdhec.gov/dwfsc
13. “Guidance on Food Donation in Child Nutrition Programs” (USDA), www.fns.usda.gov/cacfp-05-2012-guidance-food-donation-program-child-nutrition-programs
14. “8 Steps to Start Food Rescue at Your School,” www.foodrescue.net
15. Assistance in finding a local food bank, www.feedingamerica.org
16. “Composting: A Guide for South Carolina Schools” (DHEC), www.scdhec.gov/compost
17. School recycling grants (DHEC), www.scdhec.gov/k12recyclinggrant
18. “Tools to Reduce Waste in Schools” (EPA), www.epa.gov
19. “Milk Dispensers Trim Waste at Canby Schools.” (Jennifer Anderson), https://pamplinmedia.com/sl/381308-267235-milk-dispensers-trim-waste-at-canby-schools
20. Terracycle, www.terracycle.com
21. “Action for a cleaner tomorrow: A South Carolina Environmental Curriculum Supplement” (DHEC), www.scdhec.gov/environment/recycling-waste-reduction/recycling-school/action-cleaner-tomorrow-k-12
22. Offer Versus Serve for Breakfast and Lunch (S.C. Department of Education), www.youtube.com/watch?v=GUQz-nQ-vE and www.youtube.com/watch?v=kQshUFybOAA&t=10s
Printed on RECYCLED Paper OR-1915 1/20