new approach in cod fractionation methods - mdpi
TRANSCRIPT
water
Article
New Approach in COD Fractionation Methods
Ewelina Płuciennik-Koropczuk * and Sylwia Myszograj
Faculty of Civil Engineering, Architecture and Environmental Engineering, Institute of EnvironmentalEngineering, University of Zielona Góra, 15 Prof. Z. Szafrana St, 65-516 Zielona Góra, Poland* Correspondence: [email protected]; Tel.: +48-68-3282574
Received: 17 June 2019; Accepted: 16 July 2019; Published: 17 July 2019�����������������
Abstract: Conventional quality parameters such as Chemical Oxygen Demand (COD) or BiochemicalOxygen Demand (BOD) give information about the quantity of organic matter present in wastewater,but do not give a clear indication of the biodegradability of the pollutants flowing in the WWTP.Detailed knowledge can be obtained by dividing the total COD into fractions. Fractionation andbalancing of COD can be determined in various ways and with varying accuracy. Good wastewatercharacteristics are obtained on the basis of COD fractionation in accordance with ATV-A 131 guidelines,especially when the wastewater characteristics are in high compliance with the assumptions of themethod. The article proposes a modification of the ATV-A131 method that increases the accuracy ofdetermining the COD fraction. In order to reduce errors in the calculation of COD fractions, the valueof fraction XS was calculated on the basis of the biochemical degradation rate determined in studies(k) for raw wastewater, whereas the SI fraction was calculated from the difference between SCOD andBODTot of filtered treated wastewater. BODTot of the treated wastewater was calculated taking intoaccount the rate of biochemical degradation determined in the studies (k) for treated wastewater. Theshares of individual COD fractions in raw wastewater calculated on the basis of the standard andmodified procedure differed by approx. 10% in the case of suspension fractions. Modification of themethodology to determine the COD of the treated wastewater SS fraction significantly influenced thecontents of all fractions in treated wastewater.
Keywords: COD fractions; biodegradability; wastewater characterization; municipal wastewater
1. Introduction
The basis for the design and optimization of biological treatment processes is a properly preparedbalance of pollutants in raw wastewater. The effectiveness of these processes is determined bythe content of biodegradable substances, which are a source of energy or a building materialfor microorganisms. The easily decomposable substances contained in the waste water includecarbohydrates and proteins that are already metabolised as a result of catalytic and enzymatic reactionsduring transport through the wastewater system, which results in mainly the hydrolysis productsof these compounds, i.e., amino acids and fatty acids, reaching the wastewater treatment plant. Thedistribution of slowly biodegradable waste, on the other hand, requires the presence of bacteria witha long generation time, the development of which is not possible using technologies used for easilydecomposable substances [1–3]. The content of organic compounds in wastewater can be expressedindirectly as Total Organic Carbon (TOC) based on the amount of carbon dioxide produced duringcombustion [3,4]:
Corg + O2temp,catalyst→ CO2 (1)
Another method is determining the content of organic compounds based on total oxygen demand(TOD). Determining TOD relies on the oxidation of organic substances at 950 ◦C in the presence of acatalyst. Under these conditions, decompose organic substances non-oxidized in the COD method.
Water 2019, 11, 1484; doi:10.3390/w11071484 www.mdpi.com/journal/water
Water 2019, 11, 1484 2 of 12
Therefore, the value of TOD is higher than that of COD. Meanwhile, the ultraviolet absorbance (UV250
nm) is a measure of the content only of organic compounds that absorb UV radiation, e.g., phenol,surface-active substances. A dependence was determined between COD and UV250 represented by theformula Equation (2). [3]:
COD = 45.2 · UV250 + 13.6 (2)
The standard characteristic of wastewater in this area is usually based on the values of indicatorssuch as Biochemical Oxygen Demand (BOD) and Chemical Oxygen Demand (COD).
Biochemical Oxygen Demand is a measure of the amount of biodegradable organic matter anddetermines the amount of oxygen needed for bacteria to oxidize biochemically degradable organiccompounds under aerobic conditions, without access to light, at a temperature 20 ◦C [5,6]. Thebiochemical decomposition of organic compounds takes place in two phases: oxidation of carboncompounds and oxidation of nitrogen compounds. The kinetics of the first phase of BOD distributioncan be described by the 1st order reaction:
BODt = BODTot · (1 − e−k · t) (3)
where:
BODt—biochemical oxygen demand after time t,k—coefficient of the rate of kinetic reaction,BODTot—total oxygen demand for the 1st phase of decomposition.
The course of oxygen consumption depends on many factors, among others on the type andconcentration of organic substances, the amount and activity of microorganisms, the content of biogeniccompounds, temperature, pH, and alkalinity, which affects the value of the k coefficient, which in rawwastewater can range from 0.07 to 0.8 d−1 [7].
In turn, the COD determination means an equivalent amount of oxygen taken from the oxidant(in mg O2 dm−3) needed to oxidize organic compounds and certain inorganic compounds to simplemineral forms [6,8]. The analytical method for determining COD can be schematically represented as:
CxHyOz + oxidizerH2SO4+catalyst+temperature
→ CO2 + H2O + organiccompounds (4)
The efficiency of this reaction depends on: type of organic compounds, oxidizer and catalystused, temperature, and heating time. The highest oxidation state of organic compounds is obtainedusing potassium dichromate in a strongly acidic environment and in the presence of iron salt as acatalyst. The presence of a catalyst is necessary for high concentrations of ammonia, organic amines ornitrogenous organic compounds. The catalyst for the oxidation reaction of alcohols and acids is AgSO4.The COD index gives a good representation of the total organic content in wastewater. However, itshould be remembered that numerous organic compounds are not determined under the conditions ofthis test, e.g., some aromatic (benzene, pyridine) and aliphatic (n-hexane, n-heptane) hydrocarbons.During the determination, it is possible to lose volatile organic compounds before they are oxidized.COD is a summary measure of the content of organic compounds in wastewater both subject to andnot subject to biochemical degradation, but does not allow separate determination [9–11].
Although the processes of biochemical and chemical oxidation have a separate character, in anumber of cases, especially for a given type of wastewater, there is a specific correlation between CODand BOD5, which allows to initially estimate the biodegradability of pollutants. Wastewater can beconsidered susceptible to biodegradation if 1.5 < COD/BOD5 < 2.5. A high value of the COD/BOD5
ratio (>2.5) indicates a slow decomposition and a high content of organic substances that are hardlydecomposable or biologically indecomposable, which may be caused by a large proportion of industrialwastewater in municipal wastewater. In turn, the value of COD/BOD5 < 2.0 indicates a significantcontent of biologically degradable contaminants [5,12,13] (Table 1).
Water 2019, 11, 1484 3 of 12
Table 1. Biodegradability of organic compounds [12,13].
COD/ BOD5 Value decrease COD, [%] Assessment of Susceptibility toBiochemical Biodegradation
<2.0 >90 easily biodegradable2.0–2.5 50–90 Biodegradable2.5–5.0 10–50 slowly biodegradable>5.0 <10 resistant to biodegradation
Significant dependencies can be determined for wastewater which contains only substancesundergoing biochemical oxidation and that are quantitatively oxidizable by chemical means. Apart frombiologically easily biodegradable compounds, non-degradable, slowly degradable, or biodegradablecompounds that are not oxidizable under the conditions of the dichromate method (e.g., pyridine andits derivatives) are present, this interpretation of results only has an illustrative dimension, and thepractical evaluation of the composition wastewater is often misleading.
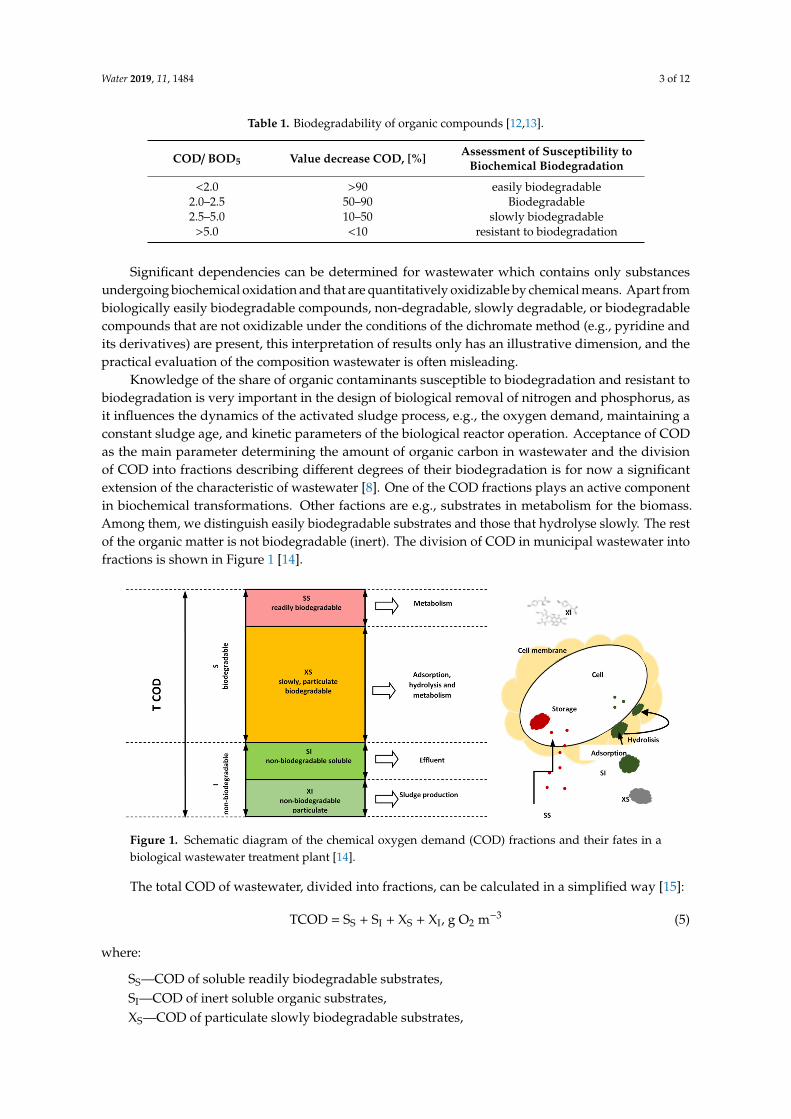
Knowledge of the share of organic contaminants susceptible to biodegradation and resistant tobiodegradation is very important in the design of biological removal of nitrogen and phosphorus, asit influences the dynamics of the activated sludge process, e.g., the oxygen demand, maintaining aconstant sludge age, and kinetic parameters of the biological reactor operation. Acceptance of CODas the main parameter determining the amount of organic carbon in wastewater and the divisionof COD into fractions describing different degrees of their biodegradation is for now a significantextension of the characteristic of wastewater [8]. One of the COD fractions plays an active componentin biochemical transformations. Other factions are e.g., substrates in metabolism for the biomass.Among them, we distinguish easily biodegradable substrates and those that hydrolyse slowly. The restof the organic matter is not biodegradable (inert). The division of COD in municipal wastewater intofractions is shown in Figure 1 [14].
Water 2019, 11, x FOR PEER REVIEW 3 of 11
decomposable or biologically indecomposable, which may be caused by a large proportion of industrial wastewater in municipal wastewater. In turn, the value of COD/BOD5 < 2.0 indicates a significant content of biologically degradable contaminants [5,12,13] (Table 1).
Table 1. Biodegradability of organic compounds [12,13].
COD/ BOD5 Value decrease COD, [%] Assessment of susceptibility to biochemical biodegradation
<2.0 >90 easily biodegradable 2.0–2.5 50–90 Biodegradable 2.5–5.0 10–50 slowly biodegradable
>5.0 <10 resistant to biodegradation Significant dependencies can be determined for wastewater which contains only substances
undergoing biochemical oxidation and that are quantitatively oxidizable by chemical means. Apart from biologically easily biodegradable compounds, non-degradable, slowly degradable, or biodegradable compounds that are not oxidizable under the conditions of the dichromate method (e.g., pyridine and its derivatives) are present, this interpretation of results only has an illustrative dimension, and the practical evaluation of the composition wastewater is often misleading.
Knowledge of the share of organic contaminants susceptible to biodegradation and resistant to biodegradation is very important in the design of biological removal of nitrogen and phosphorus, as it influences the dynamics of the activated sludge process, e.g., the oxygen demand, maintaining a constant sludge age, and kinetic parameters of the biological reactor operation. Acceptance of COD as the main parameter determining the amount of organic carbon in wastewater and the division of COD into fractions describing different degrees of their biodegradation is for now a significant extension of the characteristic of wastewater [8]. One of the COD fractions plays an active component in biochemical transformations. Other factions are e.g., substrates in metabolism for the biomass. Among them, we distinguish easily biodegradable substrates and those that hydrolyse slowly. The rest of the organic matter is not biodegradable (inert). The division of COD in municipal wastewater into fractions is shown in Figure 1 [14].
Figure 1. Schematic diagram of the chemical oxygen demand (COD) fractions and their fates in a biological wastewater treatment plant [14].
The total COD of wastewater, divided into fractions, can be calculated in a simplified way [15]: TCOD = SS + SI + XS + XI, g O2 m−3 (5)
where: SS—COD of soluble readily biodegradable substrates,
Figure 1. Schematic diagram of the chemical oxygen demand (COD) fractions and their fates in abiological wastewater treatment plant [14].
The total COD of wastewater, divided into fractions, can be calculated in a simplified way [15]:
TCOD = SS + SI + XS + XI, g O2 m−3 (5)
where:
SS—COD of soluble readily biodegradable substrates,SI—COD of inert soluble organic substrates,XS—COD of particulate slowly biodegradable substrates,
Water 2019, 11, 1484 4 of 12
XI—COD of inert particulate organic substrates,
and in detail [10]:
TCOD= SLKT SF+ SI + XS +CX + XH + XI, g O2 m−3 (6)
where:
SLKT—COD of volatile fatty acids,SF—COD of fermentable organic substrates,CX—COD of slowly biodegradable colloidal substrates,XH—COD of heterotrophic biomass fraction.
The COD fractionation method is not devoid of errors. The share of fractions can be determined invarious methods and with varying accuracy. Some of the fractions cannot be determined directly [16].SS fraction can be determined by filtration through a 0.1 or 0.45 µm filter, combining coagulationwith Zn(OH)2 and filtration through a 0.45 µm filter, based on tests of the oxygen uptake rate of theactivated sludge, or most often with the use of BOD5 measurements [1,17,18]. In the case of fraction SI,only physico-chemical methods are known [16]. The fraction of inert particulate organic substrates (XI)can be determined on the basis of the mass balance of the sludge in the system, taking into accountactive sludge, degradation products, and accumulation of fraction XI in the sludge accumulated in thesecondary wastewater settling tank and lost with effluent [17] or by the direct weight method [19].Concentration of fraction XS can be determined on the basis of the amount of oxygen used for thedistribution of activated sludge, determined on the basis of batch or continuous tests.
The methods of determination of biodegradable fractions [1,17–19] described in the literaturerequire a long time to obtain a result and additional analytical procedures deviating from standarddeterminations carried out in raw wastewater.
In the commonly used methodology for determining fractions according to ATV-A 131 [20], thefraction of particulate slowly biodegradable substrates XS is defined as the difference of total BOD,calculated on the basis of BOD5 raw unfiltered wastewater and the rate of biochemical degradationand the immediately decomposed dissolved fraction on the basis of the assumed kinetic value of thedecomposition rate k. The share of industrial or transported wastewater in a municipal wastewatersystem affects the rate of biochemical degradation of organic pollutants [21]. Therefore, the calculationof the COD fraction based on the assumed, and not determined for a given wastewater value of thecoefficient of biochemical degradation rate k = 0.1 d−1 may be miscalculated.
Table 2 presents literary data on the share of individual COD fractions in municipal wastewaterdepending on the share of industrial wastewater.
The data comparison in Table 2 shows that the share of COD fraction in municipal wastewater isnot constant and changes, sometimes considerably, and the proportion between individual factions issignificantly affected by the share of industrial wastewater in them.
As describes above, fractionation and balancing of COD can be determined in various ways andwith varying accuracy. In practice, good wastewater characteristics are obtained on the basis of CODfractionation in accordance with ATV-A 131 guidelines, especially when the wastewater characteristicsare in high compliance with the assumptions of the method. The article proposes a modification of theATV-A131 method that increases the accuracy of determining the COD fraction.
The conducted research tries to delve into the understanding of the different fractions of organicmatter in wastewater, regarding its biodegradability. To use practical tests with a wider range oforganic matter composition is required to be able to adopt the modified methodology. The results canbe ground for further scientific discussion on this topic.
Water 2019, 11, 1484 5 of 12
Table 2. Share of COD fraction in municipal raw wastewater and municipal wastewater with asignificant share of industrial wastewater.
COD fractions, %SS SI XS XI
Municipal wastewater
10–20 7–11 53–60 7–15 Kappeler, Gujer, 1992 [19]9.0 4.0 77.0 10.0 Sozen, 1998 [22]
50.0–61.7 2.2–6.0 22.0–34.4 8.0–16.2 Płuciennik-Koropczuk,Myszograj, 2017 [23]
20–25 8–10 60–65 5–7 Ekama, 1986 [15]24–32 8–11 43–49 11–20 Henze, 2002 [17]
Municipal wastewater with a significant share of industrial wastewater
Textile industry wastewater25.0 14.0 59.0 2.0 Baban et al. 2004 [24]
Dairy industry wastewater (10%)38.8 2.3 45.5 14.8 Struk-Sokołowska, 2015 [25]
Baking industry wastewater (10%)38.8 1.0 44.2 15.2 Struk-Sokołowska, 2017 [26]
Oil processing wastewater29.2 9.9 37.4 23.5 Chiavola 2014 [27]
Paper industry wastewater (25%)4.2 39.5 43.1 13.2 Choi 2017 [14]
2. Aims and Methodology of the Study
The aim of the research was to determine the share in municipal wastewater, raw and treated,of waste resistant and susceptible to biodegradation on the basis of COD fraction determined inaccordance with standard and modified assumptions.
The methodology for determining the COD fraction has been included in the ATV-A131guidelines [20]. Guideline ATV-DVWK A131P The dimensioning of single-stage sewage treatment plantswith activated sludge, developed by the German Association of Engineers and Technicians of WastewaterTreatment, is widely used in design practice and at the stage of optimization and modeling of thewastewater treatment process. It allows to describe processes based on wider than basic characteristicsof raw wastewater. According to which, the determination of the SS, SI, XS and XI fraction is based onthe determination of COD and BOD5 in samples of filtered (0.45 µm) and unfiltered raw and treatedwastewater, where:
• The COD of inert soluble organic substrates SI is defined as COD in treated filtered wastewater.• The COD of soluble readily biodegradable substrates SS is calculated from the difference in the
concentration of dissolved organic pollutants SCOD determined in raw filtered wastewater andfraction SI: SS = SCOD − SI.
• The COD of particulate slowly biodegradable substrates XS is defined as the difference of totalBOD, calculated on the basis of BOD5 raw unfiltered wastewater and the rate of biochemicaldegradation and the easily decomposed dissolved fraction: XS = (BOD5 / k1) − SS.
• The fraction of inert particulate organic substrates XI is determined from the dependence:XI = XCOD − XS where XCOD is the total COD of organic suspensions.
• The total COD of wastewater is the sum of all fractions: TCOD= SI + SS + XS + XI.
According to the methodology ATV-131, the value of fraction XS is calculated on the basis of theconstant rate of biochemical degradation k = 0.1 d−1, for which BODTot =BOD5 / 0.6. The calculationalso assumes that the fraction SI corresponds to the COD value in filtered treated wastewater. Thisassumption is reflected in the calculation of the SS fraction because it is calculated based on thedifference SCOD − SI, which in treated wastewater is equal to zero in each case.
Water 2019, 11, 1484 6 of 12
In order to reduce errors in the calculation of COD fractions resulting from the simplificationsused in the ATV-131 methodology, the value of fraction XS in the modified method was calculated onthe basis of the biochemical degradation rate determined in studies (k) for raw wastewater, whereas theSI fraction was calculated from the difference between SCOD and BODTot of filtered treated wastewater.BODTot of the treated wastewater was calculated taking into account the rate of biochemical degradationdetermined in the studies (k) for treated wastewater.
To determine the dissolved fraction, the method of filtering the wastewater samples through the0.45 µm filter was assumed.
Samples of wastewater for testing were collected from a mechanical–biological wastewatertreatment plant with an average daily flow of 3450 m3 d−1 (approx. 27,000 P.E.), working in thetechnology of low-load activated sludge. Wastewater is supplied to the wastewater treatment plant bysanitary sewerage and transported by septic tankers.
3. Results
The characteristics of organic pollutants in raw and treated wastewater are presented in Table 3.During the tests carried out on the raw and treated wastewater samples, high variability of indicatorsexpressing the content of organic pollutants was not noted. In raw wastewater, the average valueswere: COD = 1164 ± 157 mg O2 dm−3, BOD5 = 641 ± 84 mg O2 dm−3, and TOC = 267 ± 93 mg O2
dm−3. The average efficiency of removal of organic substances was 94.6 ± 1.5% for COD, 97.8 ± 0.7%for BOD5, and 94.5 ± 1.8% for TOC.
Table 3. Characterization of organic waste in raw and treated wastewater.
WastewaterSample Range COD mg O2 dm−3 BOD5 mg O2 dm−3 TOC mg C dm−3
rawminimum 1000 548 182.7maximum 1340 738 451.3
average 1164 ± 157 641 ± 84 267 ± 93
treatedminimum 40 7.7 5.7maximum 98 24 22.1.
average 62 ± 22 14 ± 6 14 ± 5
Values of the COD/BOD5 quotient for raw wastewater were from 1.8 to 2.0, which at the efficiencyof COD removal above 90% classifies organic contaminants contained in wastewater entering thetreatment plant as easily biodegradable (Table 1).
The value of the quotient (COD/BOD5 = 3.6–6.2) calculated for treated wastewater indicates thatthe compounds were slowly biodegradable (COD/BOD5 = 3.6–5) or non-biodegradable (COD/BOD5 >
5–6.2). Estimated on the basis of changes in the COD/BOD5 value, susceptibility to biodegradability ofwastewater has been extended by the COD fraction values expressing susceptible and biodegradablefractions, taking into account the presence of contaminants (dissolved, undissolved).
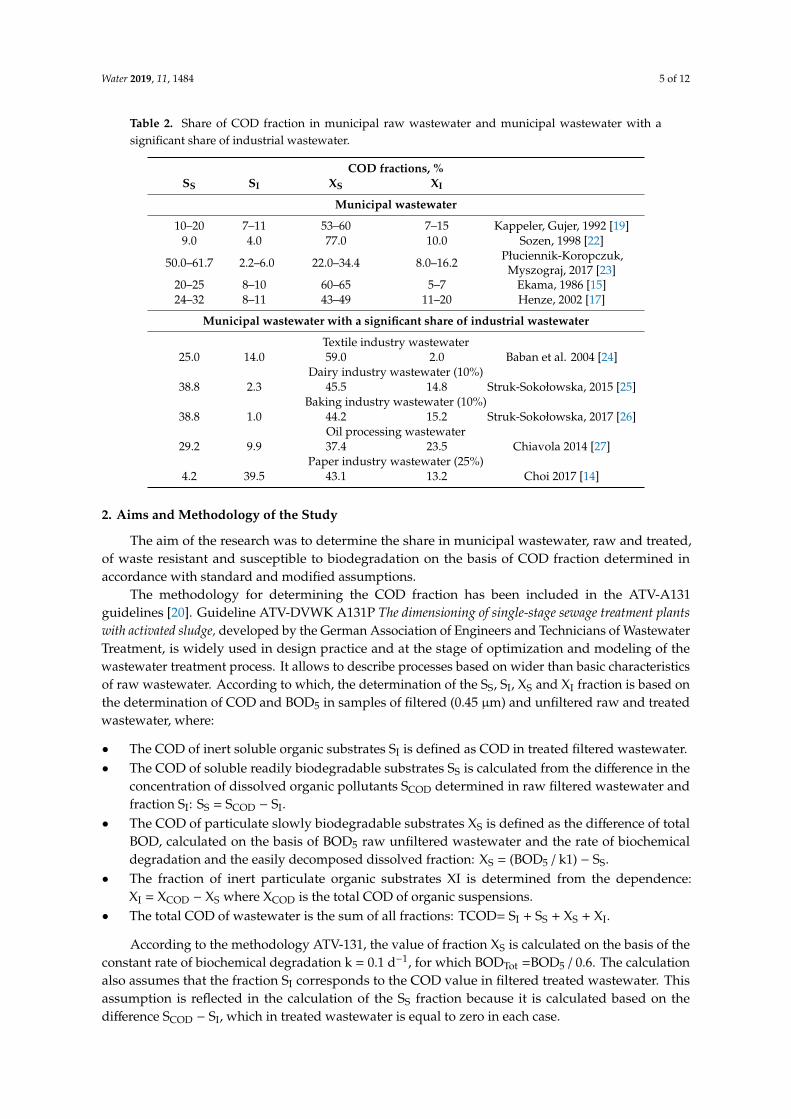
The separation of the fractions into dissolved and undissolved was performed by filtration througha 0.45 µm. filter. In order to control the degree of fraction separation, the particle sizes were determinedbefore and after the filtration process. The distribution of particle sizes in samples of non-filteredwastewater and after filtration is shown in Figure 2.
Water 2019, 11, 1484 7 of 12
Water 2019, 11, x FOR PEER REVIEW 6 of 11
To determine the dissolved fraction, the method of filtering the wastewater samples through the 0.45 μm filter was assumed.
Samples of wastewater for testing were collected from a mechanical–biological wastewater treatment plant with an average daily flow of 3450 m3 d−1 (approx. 27,000 P.E.), working in the technology of low-load activated sludge. Wastewater is supplied to the wastewater treatment plant by sanitary sewerage and transported by septic tankers.
3. Results
The characteristics of organic pollutants in raw and treated wastewater are presented in Table 3. During the tests carried out on the raw and treated wastewater samples, high variability of indicators expressing the content of organic pollutants was not noted. In raw wastewater, the average values were: COD = 1164 ± 157 mg O2 dm−3, BOD5 = 641 ± 84 mg O2 dm−3, and TOC = 267 ± 93 mg O2 dm−3. The average efficiency of removal of organic substances was 94.6 ± 1.5% for COD, 97.8 ± 0.7% for BOD5, and 94.5 ± 1.8% for TOC.
Values of the COD/BOD5 quotient for raw wastewater were from 1.8 to 2.0, which at the efficiency of COD removal above 90% classifies organic contaminants contained in wastewater entering the treatment plant as easily biodegradable (Table 1).
Table 3. Characterization of organic waste in raw and treated wastewater.
Wastewater sample
Range COD mg O2 dm−3
BOD5
mg O2 dm−3 TOC
mg C dm−3
raw minimum 1000 548 182.7 maximum 1340 738 451.3
average 1164 ± 157 641 ± 84 267 ± 93
treated minimum 40 7.7 5.7 maximum 98 24 22.1.
average 62 ± 22 14 ± 6 14 ± 5 The value of the quotient (COD/BOD5 =3.6 − 6.2) calculated for treated wastewater indicates that
the compounds were slowly biodegradable (COD/BOD5 = 3.6 − 5) or non-biodegradable (COD/BOD5 > 5 − 6.2). Estimated on the basis of changes in the COD/BOD5 value, susceptibility to biodegradability of wastewater has been extended by the COD fraction values expressing susceptible and biodegradable fractions, taking into account the presence of contaminants (dissolved, undissolved).
The separation of the fractions into dissolved and undissolved was performed by filtration through a 0.45 μm. filter. In order to control the degree of fraction separation, the particle sizes were determined before and after the filtration process. The distribution of particle sizes in samples of non-filtered wastewater and after filtration is shown in Figure 2.
(a) Unfiltered sample average size 0.62μm
Water 2019, 11, x FOR PEER REVIEW 7 of 11
(b) Filtered sample average size 0.29 μm
Figure 2. Particle size distribution in raw wastewater samples (a) and after filtration through 0.45 μm filter (b).
The particles of sizes between 0.22 and 1.72 μm were found most frequently in the raw wastewater sludge, and of sizes between 0.16 to 0.30 μm in the filtered wastewater. The results confirm the appropriateness of the fraction separation by filtration on a 0.45 μm membrane.
Table 4 presents the values of individual fractions and their percentage in total COD of raw and treated wastewater, determined in accordance with the standard ATV-A131 methodology.
In raw wastewater, the highest COD values were noted for biodegradable fractions: COD of slow-biodegradable undissolved fraction (XS) was on average 787.6 ± 131.8 mg O2 dm−3, and COD of the dissolved fraction SS 280.4 ± 56.3 mg O2 dm−3. The average COD values of non-biodegradable, suspended and dissolved fractions were XI = 61.2 ± 19.2 mg O2 dm−3, and SI = 34.4 ± 10.4 mg O2 dm−3, respectively. The share of individual fractions in the total COD was as follows: XS = 67.6 ± 5.3%, SS = 24.2 ± 4.3%, XI = 5.2 ± 1.1% and SI = 3.0 ± 0.9%.
Table 4. COD fractions in raw wastewater and treated according to the ATV-A131 method.
Wastewater sample Value
SS SI XS XI Total COD mg O2 dm−3
Raw
Minimum 230 20 663 47 1000 Maximum 352 48 990 95 1340 Average 280.4 ± 56.3 34.4 ± 10.4 787.6 ± 131.8 61.2 ± 19.2 1164 ± 157
Treated
Minimum 0 20 13 2 40 Maximum 0 48 40 10 98 Average 0 ± 0.0 34.4 ± 10.4 23.4 ± 10.2 4.6 ± 3.2 62 ± 22
%
Raw
Minimum 18.2 1.9 62.8 4.2
(-)
Maximum 29.5 4.0 75.1 7.1 Average 24.2 ± 4.3 3.0 ± 0.9 67.6 ± 5.3 5.2 ± 1.1
Treated
Minimum 0 49.0 27.1 5.0 Maximum 0 66.7 45.0 10.2 Average 0 ± 0 55.9 ± 7.2 37.3 ± 7.0 6.8 ± 2.1
In treated wastewater, the average COD values of the determined fractions were: SI = 34.4 ± 10.4
mg O2 dm−3, XS = 23.4 ± 10.2 mg O2 dm−3 and XI = 4.6 ± 3.2 mg O2 dm−3, and the corresponding share in the total COD was as follows: SI = 55.9 ± 7.2%, XS = 37.3 ± 7.0% and XI = 6.8 ± 2.1%. According to the standard methodology for determining the COD fraction in treated wastewater, no SS fraction was recorded.
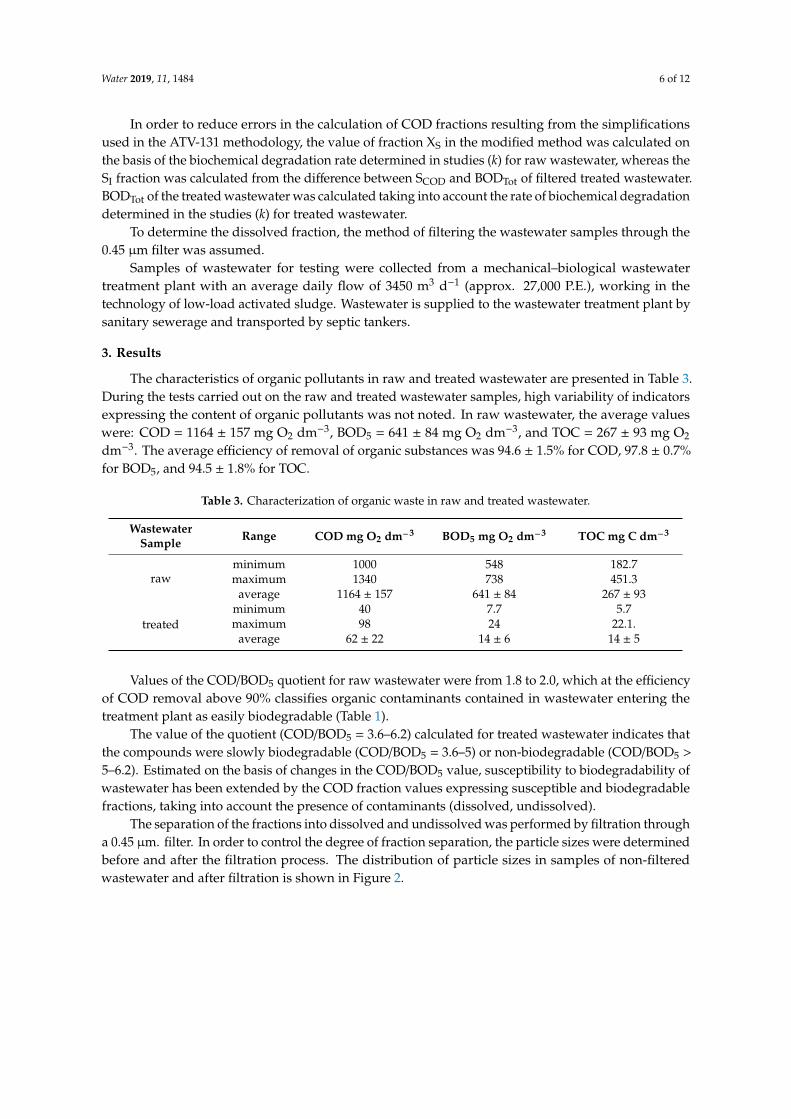
In order to calculate specific fractions of COD based on the modified methodology, the rates of raw and treated wastewater were determined for the rate of biochemical degradation (k). The course of the BOD curves on the basis of which the constants (k) are determined for raw and treated wastewater are shown in Figure 3.
BODt = BODTot (1 − e−k · t)
Figure 2. Particle size distribution in raw wastewater samples (a) and after filtration through 0.45 µmfilter (b).
The particles of sizes between 0.22 and 1.72 µm were found most frequently in the raw wastewatersludge, and of sizes between 0.16 to 0.30 µm in the filtered wastewater. The results confirm theappropriateness of the fraction separation by filtration on a 0.45 µm membrane.
Table 4 presents the values of individual fractions and their percentage in total COD of raw andtreated wastewater, determined in accordance with the standard ATV-A131 methodology.
Table 4. COD fractions in raw wastewater and treated according to the ATV-A131 method.
WastewaterSample Value
SS SI XS XI Total CODmg O2 dm−3
RawMinimum 230 20 663 47 1000Maximum 352 48 990 95 1340Average 280.4 ± 56.3 34.4 ± 10.4 787.6 ± 131.8 61.2 ± 19.2 1164 ± 157
TreatedMinimum 0 20 13 2 40Maximum 0 48 40 10 98Average 0 ± 0.0 34.4 ± 10.4 23.4 ± 10.2 4.6 ± 3.2 62 ± 22
%
RawMinimum 18.2 1.9 62.8 4.2
(-)
Maximum 29.5 4.0 75.1 7.1Average 24.2 ± 4.3 3.0 ± 0.9 67.6 ± 5.3 5.2 ± 1.1
TreatedMinimum 0 49.0 27.1 5.0Maximum 0 66.7 45.0 10.2Average 0 ± 0 55.9 ± 7.2 37.3 ± 7.0 6.8 ± 2.1
In raw wastewater, the highest COD values were noted for biodegradable fractions: COD ofslow-biodegradable undissolved fraction (XS) was on average 787.6 ± 131.8 mg O2 dm−3, and COD ofthe dissolved fraction SS 280.4 ± 56.3 mg O2 dm−3. The average COD values of non-biodegradable,suspended and dissolved fractions were XI = 61.2 ± 19.2 mg O2 dm−3, and SI = 34.4 ± 10.4 mg O2
dm−3, respectively. The share of individual fractions in the total COD was as follows: XS = 67.6 ± 5.3%,SS = 24.2 ± 4.3%, XI = 5.2 ± 1.1% and SI = 3.0 ± 0.9%.
In treated wastewater, the average COD values of the determined fractions were: SI = 34.4 ± 10.4mg O2 dm−3, XS = 23.4 ± 10.2 mg O2 dm−3 and XI = 4.6 ± 3.2 mg O2 dm−3, and the corresponding sharein the total COD was as follows: SI = 55.9 ± 7.2%, XS = 37.3 ± 7.0% and XI = 6.8 ± 2.1%. According to
Water 2019, 11, 1484 8 of 12
the standard methodology for determining the COD fraction in treated wastewater, no SS fractionwas recorded.
In order to calculate specific fractions of COD based on the modified methodology, the rates ofraw and treated wastewater were determined for the rate of biochemical degradation (k). The course ofthe BOD curves on the basis of which the constants (k) are determined for raw and treated wastewaterare shown in Figure 3.Water 2019, 11, x FOR PEER REVIEW 8 of 11
BODt = BODTot (1 − e−k · t)
k = 0.225 d−1, R2 = 0.640 k = 0.174 d−1, R2 = 0.714
(a) Raw wastewater
(b) Treated wastewater
Figure 3. The course of BOD curves for raw and treated wastewater. (a) Raw wastewater; (b) treated wastewater.
The biochemical degradation rate values determined for raw wastewater and treated wastewater differ significantly from the value of constant k = 0.1 d−1, taken as a standard in calculations in accordance with ATV-A131. The mean values of the biochemical degradation rate constants were, respectively, for raw wastewater k = 0.225 d−1 and for treated wastewater k = 0.174 d−1, which corresponds to raw wastewater BODTot = BOD5 / 0.68, and in treated BODTot = BOD5 / 0.58.
The COD values of individual fractions determined on the basis of the modified ATV-A131 methodology and the percentage of fractions in total COD of raw and treated wastewater are presented in Table 5.
Table 5. COD fractions in raw wastewater and treated wastewater according to the modified ATV-A131 method.
Wastewater sample Value
SS SI XS XI Total COD mg O2 dm−3
Raw Minimum 243 7 545 165 1000 Maximum 359 41 845 236 1340 Average 292 ± 55.4 22.8 ± 12.5 656.3 ± 121.5 192.5 ± 27.8 1164 ± 157
Treated Minimum 7 7 3 12 40 Maximum 16 41 29 24 98 Average 11.7 ± 4.4 22.8 ± 12.5 10.9 ± 9.3 18.7 ± 4.6 62 ± 22
%
Raw Minimum 18.7 0.7 51.2 15.2
(-)
Maximum 30.8 3.1 64.1 17.6 Average 25.3 ± 4.5 1.9 ± 0.9 56.3 ± 5.3 16.5 ± 0.9
Treated Minimum 16.7 6.9 6.5 21.7 Maximum 51.2 33.3 29.3 42.6 Average 23.4 ± 10.2 35.0 ± 13.2 12.5 ± 9.5 31.6 ± 8.5
In raw wastewater, the highest COD values were recorded for biodegradable fractions and were
respectively XS = 656.3 ± 121.5 mg O2 dm−3 and SS = 292 ± 55.4 mg O2 dm−3, while the average COD of non-biodegradable, suspended and dissolved fractions were at the level of: XI = 192.5 ± 27.8 mgO2/dm3 and SI = 22.8 ± 12.5 mg O2 dm−3. The share of individual fractions in the total COD was as follows: XS = 67.6 ± 5.3%, SS = 24.2 ± 4.3%, XI = 5.2 ± 1.1% and SI = 3.0 ± 0.9%. In treated wastewater, the average COD values for the analyzed fractions were: SI = 22.8 ± 12.5 mg O2 dm−3 and XS = 9.3 ± 10.9 mg O2 dm−3, SS = 11.7 ± 4.4 mg O2 dm−3, XI = 18.7 ± 4.6 mg O2 dm−3, and the corresponding share in the total COD was as follows: SI =35 ± 13.2%, SS = 20.9 ± 10.2%, XS = 12.5 ± 9.5% and XI = 31.6 ± 8.5%.
Figure 3. The course of BOD curves for raw and treated wastewater. (a) Raw wastewater;(b) treated wastewater.
The biochemical degradation rate values determined for raw wastewater and treated wastewaterdiffer significantly from the value of constant k = 0.1 d−1, taken as a standard in calculations inaccordance with ATV-A131. The mean values of the biochemical degradation rate constants were,respectively, for raw wastewater k = 0.225 d−1 and for treated wastewater k = 0.174 d−1, whichcorresponds to raw wastewater BODTot = BOD5 / 0.68, and in treated BODTot = BOD5 / 0.58.
The COD values of individual fractions determined on the basis of the modified ATV-A131methodology and the percentage of fractions in total COD of raw and treated wastewater are presentedin Table 5.
Table 5. COD fractions in raw wastewater and treated wastewater according to the modifiedATV-A131 method.
Wastewatersample Value
SS SI XS XI Total CODmg O2 dm−3
RawMinimum 243 7 545 165 1000Maximum 359 41 845 236 1340Average 292 ± 55.4 22.8 ± 12.5 656.3 ± 121.5 192.5 ± 27.8 1164 ± 157
TreatedMinimum 7 7 3 12 40Maximum 16 41 29 24 98Average 11.7 ± 4.4 22.8 ± 12.5 10.9 ± 9.3 18.7 ± 4.6 62 ± 22
%
RawMinimum 18.7 0.7 51.2 15.2
(-)
Maximum 30.8 3.1 64.1 17.6Average 25.3 ± 4.5 1.9 ± 0.9 56.3 ± 5.3 16.5 ± 0.9
TreatedMinimum 16.7 6.9 6.5 21.7Maximum 51.2 33.3 29.3 42.6Average 23.4 ± 10.2 35.0 ± 13.2 12.5 ± 9.5 31.6 ± 8.5
In raw wastewater, the highest COD values were recorded for biodegradable fractions and wererespectively XS = 656.3 ± 121.5 mg O2 dm−3 and SS = 292 ± 55.4 mg O2 dm−3, while the averageCOD of non-biodegradable, suspended and dissolved fractions were at the level of: XI = 192.5 ± 27.8
Water 2019, 11, 1484 9 of 12
mgO2/dm3 and SI = 22.8 ± 12.5 mg O2 dm−3. The share of individual fractions in the total COD was asfollows: XS = 67.6 ± 5.3%, SS = 24.2 ± 4.3%, XI = 5.2 ± 1.1% and SI = 3.0 ± 0.9%. In treated wastewater,the average COD values for the analyzed fractions were: SI = 22.8 ± 12.5 mg O2 dm−3 and XS = 9.3 ±10.9 mg O2 dm−3, SS = 11.7 ± 4.4 mg O2 dm−3, XI = 18.7 ± 4.6 mg O2 dm−3, and the correspondingshare in the total COD was as follows: SI =35 ± 13.2%, SS = 20.9 ± 10.2%, XS = 12.5 ± 9.5% and XI =
31.6 ± 8.5%.
4. Discussion of Results
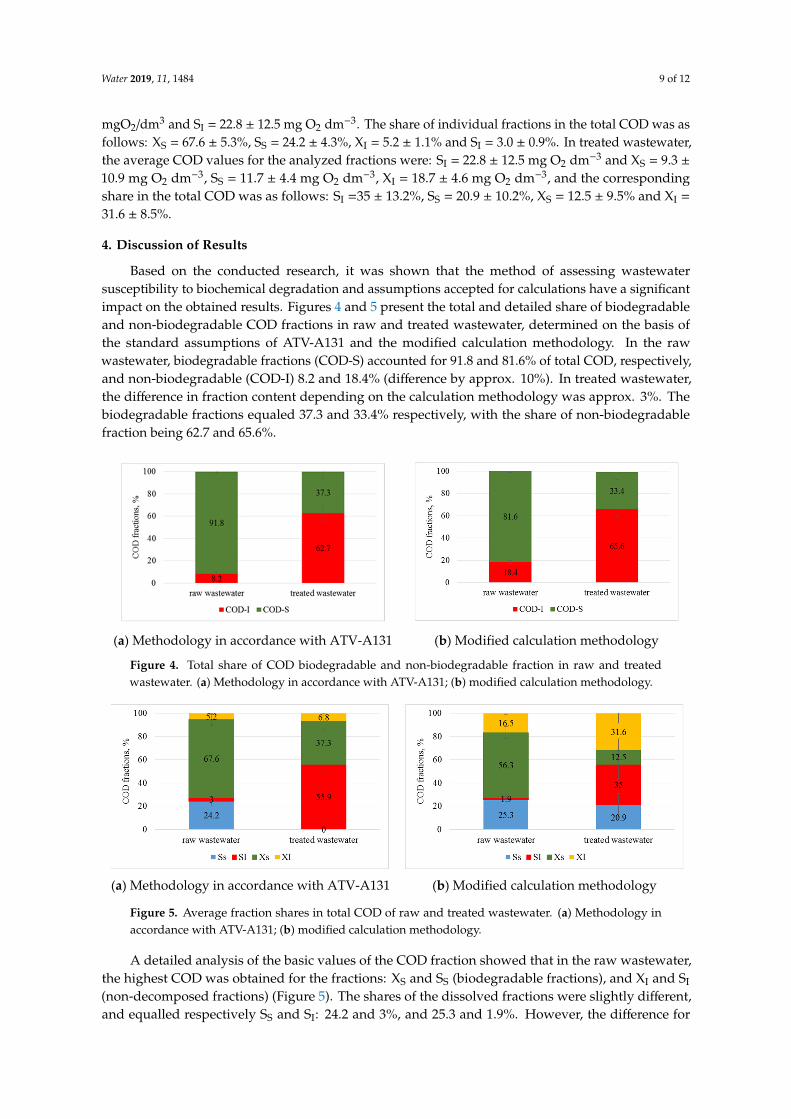
Based on the conducted research, it was shown that the method of assessing wastewatersusceptibility to biochemical degradation and assumptions accepted for calculations have a significantimpact on the obtained results. Figures 4 and 5 present the total and detailed share of biodegradableand non-biodegradable COD fractions in raw and treated wastewater, determined on the basis ofthe standard assumptions of ATV-A131 and the modified calculation methodology. In the rawwastewater, biodegradable fractions (COD-S) accounted for 91.8 and 81.6% of total COD, respectively,and non-biodegradable (COD-I) 8.2 and 18.4% (difference by approx. 10%). In treated wastewater,the difference in fraction content depending on the calculation methodology was approx. 3%. Thebiodegradable fractions equaled 37.3 and 33.4% respectively, with the share of non-biodegradablefraction being 62.7 and 65.6%.
Water 2019, 11, x FOR PEER REVIEW 9 of 11
4. Discussion of Results
Based on the conducted research, it was shown that the method of assessing wastewater susceptibility to biochemical degradation and assumptions accepted for calculations have a significant impact on the obtained results. Figures 4 and 5 present the total and detailed share of biodegradable and non-biodegradable COD fractions in raw and treated wastewater, determined on the basis of the standard assumptions of ATV-A131 and the modified calculation methodology. In the raw wastewater, biodegradable fractions (COD-S) accounted for 91.8 and 81.6% of total COD, respectively, and non-biodegradable (COD-I) 8.2 and 18.4% (difference by approx. 10%). In treated wastewater, the difference in fraction content depending on the calculation methodology was approx. 3%. The biodegradable fractions equaled 37.3 and 33.4% respectively, with the share of non-biodegradable fraction being 62.7 and 65.6%.
(a) Methodology in accordance with ATV-A131
(b) Modified calculation methodology
Figure 4. Total share of COD biodegradable and non-biodegradable fraction in raw and treated wastewater. (a) Methodology in accordance with ATV-A131; (b) modified calculation methodology.
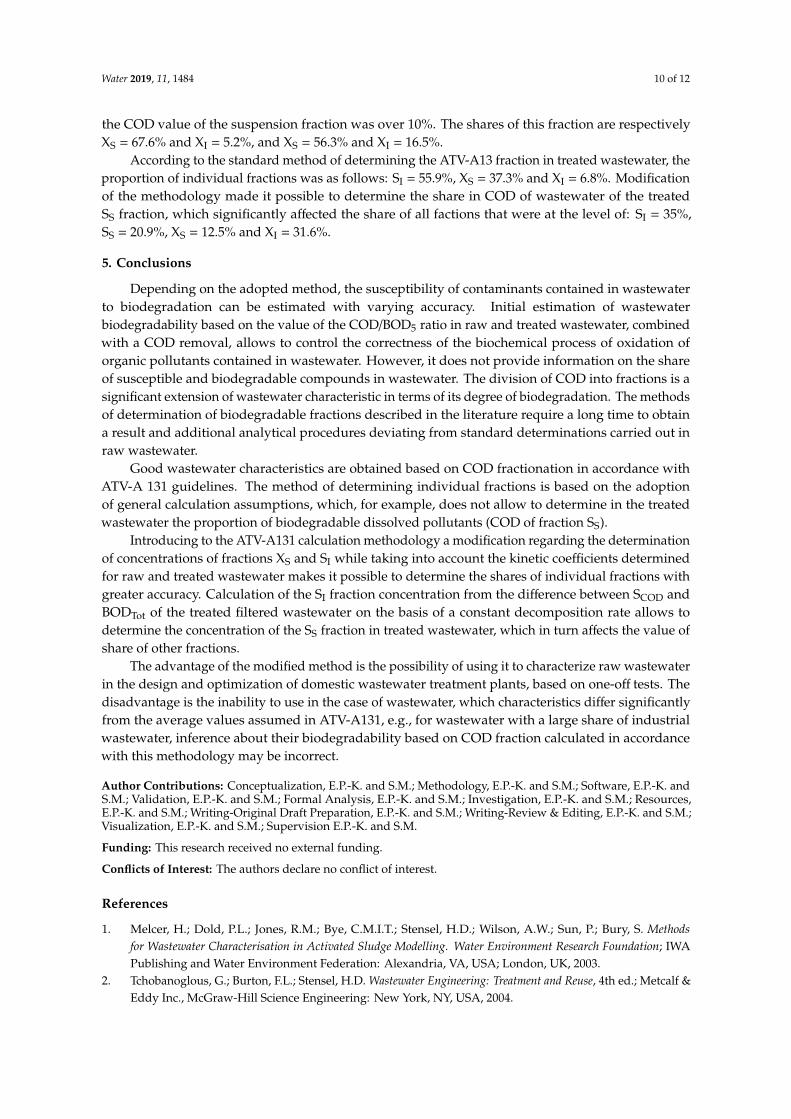
A detailed analysis of the basic values of the COD fraction showed that in the raw wastewater, the highest COD was obtained for the fractions: XS and SS (biodegradable fractions), and XI and SI (non-decomposed fractions) (Figure 5). The shares of the dissolved fractions were slightly different, and equalled respectively SS and SI: 24.2 and 3%, and 25.3 and 1.9%. However, the difference for the COD value of the suspension fraction was over 10%. The shares of this fraction are respectively XS = 67.6% and XI = 5.2%, and XS = 56.3% and XI = 16.5%.
(a) Methodology in accordance with ATV-A131
(b) Modified calculation methodology
Figure 5. Average fraction shares in total COD of raw and treated wastewater. (a) Methodology in accordance with ATV-A131; (b) modified calculation methodology.
According to the standard method of determining the ATV-A13 fraction in treated wastewater, the proportion of individual fractions was as follows: SI = 55.9%, XS = 37.3% and XI = 6.8%. Modification of the methodology made it possible to determine the share in COD of wastewater of the treated SS fraction, which significantly affected the share of all factions that were at the level of: SI = 35%, SS = 20.9%, XS = 12.5% and XI = 31.6%.
Figure 4. Total share of COD biodegradable and non-biodegradable fraction in raw and treatedwastewater. (a) Methodology in accordance with ATV-A131; (b) modified calculation methodology.
Water 2019, 11, x FOR PEER REVIEW 9 of 11
4. Discussion of Results
Based on the conducted research, it was shown that the method of assessing wastewater susceptibility to biochemical degradation and assumptions accepted for calculations have a significant impact on the obtained results. Figures 4 and 5 present the total and detailed share of biodegradable and non-biodegradable COD fractions in raw and treated wastewater, determined on the basis of the standard assumptions of ATV-A131 and the modified calculation methodology. In the raw wastewater, biodegradable fractions (COD-S) accounted for 91.8 and 81.6% of total COD, respectively, and non-biodegradable (COD-I) 8.2 and 18.4% (difference by approx. 10%). In treated wastewater, the difference in fraction content depending on the calculation methodology was approx. 3%. The biodegradable fractions equaled 37.3 and 33.4% respectively, with the share of non-biodegradable fraction being 62.7 and 65.6%.
(a) Methodology in accordance with ATV-A131
(b) Modified calculation methodology
Figure 4. Total share of COD biodegradable and non-biodegradable fraction in raw and treated wastewater. (a) Methodology in accordance with ATV-A131; (b) modified calculation methodology.
A detailed analysis of the basic values of the COD fraction showed that in the raw wastewater, the highest COD was obtained for the fractions: XS and SS (biodegradable fractions), and XI and SI (non-decomposed fractions) (Figure 5). The shares of the dissolved fractions were slightly different, and equalled respectively SS and SI: 24.2 and 3%, and 25.3 and 1.9%. However, the difference for the COD value of the suspension fraction was over 10%. The shares of this fraction are respectively XS = 67.6% and XI = 5.2%, and XS = 56.3% and XI = 16.5%.
(a) Methodology in accordance with ATV-A131
(b) Modified calculation methodology
Figure 5. Average fraction shares in total COD of raw and treated wastewater. (a) Methodology in accordance with ATV-A131; (b) modified calculation methodology.
According to the standard method of determining the ATV-A13 fraction in treated wastewater, the proportion of individual fractions was as follows: SI = 55.9%, XS = 37.3% and XI = 6.8%. Modification of the methodology made it possible to determine the share in COD of wastewater of the treated SS fraction, which significantly affected the share of all factions that were at the level of: SI = 35%, SS = 20.9%, XS = 12.5% and XI = 31.6%.
Figure 5. Average fraction shares in total COD of raw and treated wastewater. (a) Methodology inaccordance with ATV-A131; (b) modified calculation methodology.
A detailed analysis of the basic values of the COD fraction showed that in the raw wastewater,the highest COD was obtained for the fractions: XS and SS (biodegradable fractions), and XI and SI
(non-decomposed fractions) (Figure 5). The shares of the dissolved fractions were slightly different,and equalled respectively SS and SI: 24.2 and 3%, and 25.3 and 1.9%. However, the difference for
Water 2019, 11, 1484 10 of 12
the COD value of the suspension fraction was over 10%. The shares of this fraction are respectivelyXS = 67.6% and XI = 5.2%, and XS = 56.3% and XI = 16.5%.
According to the standard method of determining the ATV-A13 fraction in treated wastewater, theproportion of individual fractions was as follows: SI = 55.9%, XS = 37.3% and XI = 6.8%. Modificationof the methodology made it possible to determine the share in COD of wastewater of the treatedSS fraction, which significantly affected the share of all factions that were at the level of: SI = 35%,SS = 20.9%, XS = 12.5% and XI = 31.6%.
5. Conclusions
Depending on the adopted method, the susceptibility of contaminants contained in wastewaterto biodegradation can be estimated with varying accuracy. Initial estimation of wastewaterbiodegradability based on the value of the COD/BOD5 ratio in raw and treated wastewater, combinedwith a COD removal, allows to control the correctness of the biochemical process of oxidation oforganic pollutants contained in wastewater. However, it does not provide information on the shareof susceptible and biodegradable compounds in wastewater. The division of COD into fractions is asignificant extension of wastewater characteristic in terms of its degree of biodegradation. The methodsof determination of biodegradable fractions described in the literature require a long time to obtaina result and additional analytical procedures deviating from standard determinations carried out inraw wastewater.
Good wastewater characteristics are obtained based on COD fractionation in accordance withATV-A 131 guidelines. The method of determining individual fractions is based on the adoptionof general calculation assumptions, which, for example, does not allow to determine in the treatedwastewater the proportion of biodegradable dissolved pollutants (COD of fraction SS).
Introducing to the ATV-A131 calculation methodology a modification regarding the determinationof concentrations of fractions XS and SI while taking into account the kinetic coefficients determinedfor raw and treated wastewater makes it possible to determine the shares of individual fractions withgreater accuracy. Calculation of the SI fraction concentration from the difference between SCOD andBODTot of the treated filtered wastewater on the basis of a constant decomposition rate allows todetermine the concentration of the SS fraction in treated wastewater, which in turn affects the value ofshare of other fractions.
The advantage of the modified method is the possibility of using it to characterize raw wastewaterin the design and optimization of domestic wastewater treatment plants, based on one-off tests. Thedisadvantage is the inability to use in the case of wastewater, which characteristics differ significantlyfrom the average values assumed in ATV-A131, e.g., for wastewater with a large share of industrialwastewater, inference about their biodegradability based on COD fraction calculated in accordancewith this methodology may be incorrect.
Author Contributions: Conceptualization, E.P.-K. and S.M.; Methodology, E.P.-K. and S.M.; Software, E.P.-K. andS.M.; Validation, E.P.-K. and S.M.; Formal Analysis, E.P.-K. and S.M.; Investigation, E.P.-K. and S.M.; Resources,E.P.-K. and S.M.; Writing-Original Draft Preparation, E.P.-K. and S.M.; Writing-Review & Editing, E.P.-K. and S.M.;Visualization, E.P.-K. and S.M.; Supervision E.P.-K. and S.M.
Funding: This research received no external funding.
Conflicts of Interest: The authors declare no conflict of interest.
References
1. Melcer, H.; Dold, P.L.; Jones, R.M.; Bye, C.M.I.T.; Stensel, H.D.; Wilson, A.W.; Sun, P.; Bury, S. Methodsfor Wastewater Characterisation in Activated Sludge Modelling. Water Environment Research Foundation; IWAPublishing and Water Environment Federation: Alexandria, VA, USA; London, UK, 2003.
2. Tchobanoglous, G.; Burton, F.L.; Stensel, H.D. Wastewater Engineering: Treatment and Reuse, 4th ed.; Metcalf &Eddy Inc., McGraw-Hill Science Engineering: New York, NY, USA, 2004.
Water 2019, 11, 1484 11 of 12
3. Miksch, K.; Sikora, J. Biotechnologia Scieków; Wydawnictwo Naukowe PWN: Warszawa, Poland, 2010.4. Mara, D.; Horan, N. Handbook of Water and Wastewater Microbiology; School of Civil Engineering, University
of Leeds: Leeds, UK, 2003.5. Ekama, G.A.; Wenzel, M.C. Denitrification kinetics in biological N and P removal activated sludge systems
treating municipal wastewater. Water Sci. Technol. 1999, 39, 69–77. [CrossRef]6. Hermanowicz, W.; Dozanska, W.; Dojlido, J.; Koziorowski, B. Fizyczno-Chemiczne Badanie Wody i Scieków;
Arkady: Warszawa, Poland, 1999.7. Imhoff, K.K.R. Kanalizacja Miast i Oczyszczanie Scieków. Poradnik; Oficyna Wydawnicza Projprzem-EKO:
Bydgoszcz, Poland, 1996.8. Viana da Silva, A.M.E.; Bettencourt da Silva, R.J.N.; Filomena, M.; Camões, G.F.C. Optimization of the
determination of chemical oxygen demand in wastewaters. Anal. Chem. Acta 2011, 699, 161–169. [CrossRef]9. Çokgör, E.U.; Sözen, S.; Ohron, D.; Henze, M. Respirometric analysis of activated sludge behavior—I.
Assessment of the readily biodegradable substrate. Water Res. 1998, 32, 461–475. [CrossRef]10. Henze, M. Biological Wastewater Treatment: Principles Modelling and Design; Henze, M., van Loosdrecht, M.C.M.,
Ekama, G.A., Brdjanovic, D., Eds.; IWA Publishing: London, UK, 2008.11. Karahan, Ö.; Dogruel, S.; Dulekgurgen, E.; Ohron, D. COD fraction of tannery wastewaters—Particle size
distribution, biodegradability and modeling. Water Res. 2008, 42, 1083–1092. [CrossRef] [PubMed]12. Ashley, R.; Hvitved-Jacobsen, T.; Krajewski, J.L.B. Quo vadis sewer process modelling? Water Sci. Technol.
1999, 39, 9–22. [CrossRef]13. Klimiuk, E.; Łebkowska, M. Biotechnologia w Ochronie Srodowiska; Wydawnictwo Naukowe PWN: Warszawa,
Poland, 2008.14. Choi, Y.Y.; Baek, S.R.; Kim, J.I.; Choi, J.W.; Hur, J.; Lee, T.U.; Park, C.J.; Lee, B. Characteristics and
biodegradability of wastewater organic matter in municipal wastewater treatment plants collecting domesticwastewater and industrial discharge. Water 2017, 9, 409. [CrossRef]
15. Ekama, G.A.; Dold, P.L.; Marais, G.V.R. Procedures for determining influent COD. Fractions and themaximum species growth rate of heterotrophs in activated sludge systems. Water Sci. Technol. 1986, 18,94–114. [CrossRef]
16. Myszograj, S.; Płuciennik-Koropczuk, E.; Jakubaszek, A.; Swietek, A. COD fractions—Methods ofmeasurement and use in wastewater treatment technology. Civil Environ. Eng. Rep. 2017, 24, 195–206.[CrossRef]
17. Henze, M.; Harremoes, P.; Jes la Cour Jansen, A.E. Oczyszczanie Scieków. Procesy Biologiczne i Chemiczne;Wydawnictwo Politechniki Swietokrzyskiej w Kielcach: Kielce, Poland, 2002.
18. Rybicki, S.M. Metody Oznaczania Wskazników Zanieczyszczen Organicznych w Wodzie i Sciekach. WyznaczanieStezenia Łatwo Rozkładalnego ChZT w Sciekach—Metoda Pomiaru i Zastosowanie w Technologii Oczyszczania;Materiały seminaryjne, Politechnika Krakowska: Kraków, Poland, 2002.
19. Kappeler, J.; Gujer, W. Estimation of kinetic parameters of heterotrophic biomass under aerobic conditionsand characterization of wastewater for activated sludge modeling. Water Sci. Technol. 1992, 25, 125–139.[CrossRef]
20. ATV-A. 131—The dimensioning of single-stage sewage treatment plants with activated sludge; German ATV-DVWKRules and Standards: Hennef, German, 2000.
21. Myszograj, S.; Płuciennik-Koropczuk, E. Frakcje ChZT a charakterystyka scieków komunalnych. Technol.Wody 2018, 6, 70–75.
22. Sözen, S.; Çokgör, E.U.; Ohron, D.; Henze, M. Respirometric analysis of activated sludge behavior—II.Heterotrophic growth under aerobic and anoxic conditions. Water Res. 1998, 32, 476–488. [CrossRef]
23. Płuciennik-Koropczuk, E.; Jakubaszek, A.; Myszograj, S.; Uszakiewicz, S. COD fractions inmechanical-biological wastewater treatment plant. Civil Environ. Eng. Rep. 2017, 24, 207–217. [CrossRef]
24. Baban, A.; Yediler, A.; Ciliz, N.K.; Kettrup, A. Biodegradability oriented treatability studies on high strengthsegregated wastewater of a woolen textile dyeing plant. Chemosphere 2004, 57, 731–738. [CrossRef] [PubMed]
25. Struk-Sokołowska, J. COD Fraction Changes in the Process of Municipal and Dairy Wastewater Treatment inSBR Reactors. PhD Thesis, Bialystok University of Technology, Bialystok, Poland, 2015. (In Polish)
Water 2019, 11, 1484 12 of 12
26. Struk-Sokołowska, J.; Tkaczuk, J. Analysis of bakery sewage treatment process options based on CODfraction changes. J. Ecol. Eng. 2018, 19, 226–235. [CrossRef]
27. Chiavola, A.; Farabegoli, G.; Antonetti, F. Biological treatment of olive mill wastewater in a sequencing batchreactor. Biochem. Eng. J. 2014, 85, 71–78. [CrossRef]
© 2019 by the authors. Licensee MDPI, Basel, Switzerland. This article is an open accessarticle distributed under the terms and conditions of the Creative Commons Attribution(CC BY) license (http://creativecommons.org/licenses/by/4.0/).