nasa cr-134587
TRANSCRIPT
NASA CR-134587
FRACTURE CHARACTERISTICS OFSTRUCTURAL AEROSPACE ALLOYS
CONTAINING DEEP SURFACE FLAWS0 SA-Ci- 134587) FACTU.E CHAIACTERIS'ICS N74-19542'CF S-UCiUuaL AEROSPACE ALLCYS COTAI.NINGEEEF SUiFACE FLAWS (Boeinq Aerospace Co.,
Seattle, Wash.) -2-9- -p HC 15.00 UnclasCSCL 20K G3/32 29040
By ? 4P/?
J. N. Masters, W. D. Bixler and R. W. Finge 3 '
THE frff#4W A f'AW Wff COMPANY
Prepared For
NATIONAL AERONAUTICS AND SPACE ADMINISTRATION
NASA Lewis Research CenterContract NAS,3-14341
JOHN A. MISENCIK - PROJECT MANAGER
1. Report No. 2. Government Accession No. 3. Recipient's Catalog No.
NASA CR-1345874. Title and Subtitle 5. Repqrt Date
FRACTURE CHARACTERISTICS OF STRUCTURAL AEROSPACE DECEMBER 1973
ALLOYS CONTAINING DEEP SURFACE FLAWS 6. Performing Organization Code
7. Author(s) 8. Performing Organization Report No.
J. N. MASTERS, W. D. BIXLER AND R. W. FINGER D180-17759-1
10. Work Unit No.
9. Performing Organization Name and Address
BOEING AEROSPACE COMPANYRESEARCH AND ENGINEERING DIVISION 11. Contract or Grant No.
P. O. BOX 3999 NAS 3-14341SEATTLE, WASHINGTON 98124 13. Type of Report and Period Covered
12. Sponsoring Agency Name end Address CONTRACTOR REPORT
NATIONAL AERONAUTICS AND SPACE ADMINISTRATION JUNE 1970 THROUGH MARCH 1972
LEWIS RESEARCH CENTER 14. Sponsoring Agency Code
21000 BROOKPARK ROAD CLEVELAND, OHIO 44135
15. Supplementary Notes PROJECT MANAGER, JOHN A. MISENCIKMATERIALS AND STRUCTURES DIVISIONNASA LEWIS RESEARCH CENTERCLEVELAND, OHIO 44135
16. Abstract
THIS EXPERIMENTAL PROGRAM WAS UNDERTAKEN TO FURTHER INVESTIGATE CONDITIONS CONTROLLING
THE GROWTH AND FRACTURE OF DEEP SURFACE FLAWS IN AEROSPACE ALLOYS. THE PROGRAM WAS
BASED ON PRIOR WORK PERFORMED UNDER CONTRACT NAS3-10290 "INVESTIGATION OF DEEP FLAWS IN
THIN WALLED TANKS". STATIC FRACTURE TESTS WERE PERFORMED ON 7075-T651 AND 2219-T87
ALUMINUM, AND 6AI-4V STA TITANIUM. CYCLIC FLAW GROWTH TESTS WERE PERFORMED ON THE TWO
LATTER ALLOYS, AND SUSTAIN LOAD TESTS WERE PERFORMED ON THE TITANIUM ALLOY. BOTH THE
CYCLIC AND THE SUSTAIN LOAD TESTS WERE PERFORMED WITH AND WITHOUT A PRIOR PROOF OVERLOAD
CYCLE TO INVESTIGATE POSSIBLE GROWTH RETARDATION EFFECTS. VARIABLES INCLUDED IN ALL TEST
SERIES WERE THICKNESS, FLAW DEPTH-TO-THICKNESS RATIO, AND FLAW SHAPE. RESULTS WERE
ANALYZED AND COMPARED WITH PREVIOUSLY DEVELOPED DATA TO DETERMINE THE LIMITS OF
APPLICABILITY OF AVAILABLE MODIFIED LINEAR ELASTIC FRACTURE SOLUTIONS.
17. Key Words (Suggested by Author(s)) 18. Distribution Statement
SURFACE FLAW CYCLIC FLAW GROWTH7075-T651 ALUMINUM SUSTAINED LOAD2219-T87 ALUMINUM STRESS INTENSITY UNCLASSIFIED, UNLIMITED6AI-4V STA TITANIUM PRESSURE VESSELFRACTURE CONTROL
19. Security Classif. (of this report) 20. Security Classif. (of this psge) 21. No. of Pages 22. Price*
UNCLASSIFI ED UNCLASSIFIED 238 3.00
* For sale by the National Technical Information Service, Springfield, Virginia 22151
NASA-C-16 (Rcv. 6-71)
FOREWORD
This report describes an investigation of flaw growth and fracture character-
istics of structural aerospace alloys containing deep surface flaws performed
by the Boeing Aerospace Company from June 1970 through March 1972 under Con-
tract NAS3-14341. The work was administered by Mr. John A. Misencik of the
NASA Lewis Research Center.
This program was conducted by the Research and Engineering Division of the
Boeing Aerospace Company, Seattle, Washington under the supervision of H. W.
Klopfenstein, Structures Research and Development Manager. The Program Leader
was J. N. Masters, Supervisor, Failure Mechanisms Group. The Technical Leader
was R. W. Finger and W. D. Bixler performed the flaw growth analysis.
A. A. Ottlyk provided test engineering support, and D. G. Good produced the
technical illustrations and art work. This technical report is also released
as Boeing Document D180-17759-1.
PRECEDING PAGE BLANK NOT FILMED
iii
PRECEDING PAGE BLANK NOT FLMED
TABLE OF CONTENTS
Page
1.0 INTRODUCTION 1
2.0 BACKGROUND 3
3.0 MATERIALS AND PROCEDURES 7
3.1 Materials
3.2 Specimen Preparation 8
3.3 Experimental Procedures 93.3.1 Instrumentation
3.3.2 Mechanical Property Tests 103.3.3 Static Fracture Tests
3.3.4 Cyclic Tests
3.3.5 Overload Tests 11
4.0 PRESENTATION AND DISCUSSION OF RESULTS 13
4.1 Mechanical Property Tests
4.2 Static Fracture Tests 14
4.2.1 Stress-Flaw Depth Relationship
4.2.2 Comparison of Magnification Factors 20
4.2.3 Back Surface Dimpling 24
4.2.4 Resistance Curve Considerations 26
4.2.5 Static Test Summary 29
4.3 Cyclic Tests 32
4.3.1 Baseline da/dN Data
4.3.2 Proof Overload Effects on Baseline da/dN 35
Data
4.3.3 Environmental Effects on Baseline da/dN 38
Data
4.3.4 Environment/Proof Overload Effects on da/dN 39
Data
v

TABLE OF CONTENTS (Continued)
Page
4.3.5 Frequency/Proof Overload Effects on da/dN 39
Data
4.3.6 Cyclic Test Summary 40
4.4 Sustained Load Tests
5.0 CONCLUSIONS 45
APPENDIX A - STRAIN MEASUREMENTS 47
APPENDIX B - CALCULATION OF CRACK GROWTH RATES FROM SURFACE 49
FLAW OPENING MEASUREMENTS
REFERENCES 53
vi
LIST OF FIGURES
Figure No. Title Page
Figure 1 - Shape Parameter Curves for Surface Flaws 55
Figure 2 - Effect of Flaw Depth on Apparent K Values 56
Figure 3 - Deep Flaw Ilagnification Curves (Reference 4) 57
Figure 4 - Tensile Specimen 58
Figure 5 - 6AI-4V Titanium Surface Flaw Specimen
Figure 6 - 6AI-4V Titanium Surface Flaw Specimen 59
Figure 7 - 6AI-4V Titanium Surface Flaw Specimen
Figure 8 - GAl-4V Titanium Surface Flaw Specimen 60
Figure 9 - Surface Flaw Specimen 61
Figure 10 - Surface Flaw Specimen 62
Figure 11 - Surface Flaw Specimen 63
Figure 12 - Aluminum Surface Flaw Specimen 64
Figure 13 - Flaw Opening Measurement of Surface Flaw Specimens 65
Figure 14 - Tensile Properties of 2219-T87 Aluminum Base Metal 66
Figure 15 - Tensile Properties of 6Al-4V (STA) Titanium Plate 67
Figure 16 - 2219-T87 Aluminum Stress Versus Flaw Size 68t = 0.38 cm (0.15 Inch)
Figure 17 - 2219-T87 Aluminum Stress Versus Flaw Size 69t = 0.51 cm (0.20 Inch)
Figure 18 - 2219-T87 Aluminum Stress Versus Flaw Size 70t = 1.27 cm (0.50 Inch)
Figure 19 - 2219-T87 Aluminum Stress Versus Flaw Size 71t = 1.90 cm (0.75 Inch)
Figure 20 - 7075.-T651 Aluminum Stress Versus Flaw Size 72(Room Temperature, WT)
vii
LIST OF FIGURES (Continued)
Figure No. Page
Figure 21 - 6Al-4V STA Titanium Stress Versus Flaw Size 73t = 0.15 cm (0.06 Inch)
Figure 22 - 6Al-4V STA Titanium Stress Versus Flaw Size 74t = 0.32 cm (0.125 Inch)
Figure 23 - 6Al-4V STA Titanium Stress Versus Flaw Size 75t = 0.53 cm (0.21 Inch)
Figure 24 - 6Al-4V STA Titanium Stress Versus Flaw Size 76t = 0.76 cm (0.30 Inch)
Figure 25 - Comparison of Magnification Terms, 2219-T87 77Base Metal at 790 K (-320'F), WT Direction
Figure 26 - Comparison of Magnification Terms, 2219-T87 78Base Metal at Room Temperature, RT Direction(Data Taken From Ref. (4))
Figure 27 - Comparison of Magnification Terms, 2219-T87 79Base Metal at 780K (-320'F), RT Direction(Data Taken From Ref. (4))
Figure 28 - Comparison of Magnification Terms, 2219-T87 80.Base Metal at 200K (-423°F), RT Direction(Data Taken From Ref. 4)
Figure 29 - Comparison of Magnification Terms, 7075-T651 81Aluminum at Room Temperature, WT Direction
Figure 30 - Comparison of Magnification Terms, 6Al-4V 82Titanium STA at Room Temperature, RT Direction,a/2c = 0.10
Figure 31 - Comparison of Magnification Terms, 6A1-4V 83Titanium STA at Room Temperature, RT Direction,a/2c = 0.25
Figure 32 - Comparison of Magnification Terms, 6A1-4V 84Titanium STA at Room Temperature, RT Direction,a/2c = 0.40
Figure 33 - Variation of Applied and Critical Stress Intensity 85Around the Periphery of a Surface Flaw 6A1-4VTitanium STA at Room Temperature (RT Direction)
Figure 34 - Dimpling Thresholds for 6Al-4V STA Titanium at 86Room Temperature (RT Direction)
viii
LIST OF FIGURES (Continued)
Figure No. Page
Figure 35 - Comparison of. Experimental and Theoretical 87Dimpling Threshold for 6AI-4V STA Titaniumat Room Temperature RT Direction
Figure 36 - 2219-T87 Aluminum Dimpling Threshold at78K(-320F), WT Direction
Figure 37 - 6A1-4V STA Titanium Dimple Threshold at 88Room Temperature (RT Direction)
Figure 38 - Crack-Growth-Resistance Curve and Crack 89Driving Force Curves for Load ControlledTest - Schematic
Figure 39 - Stable Growth Measurements for 2219-T87 90Base Metal at Room Temperature
Figure 40 - Crack Growth-Resistance and -Driving Curves 91for 2219-T87 Base Metal (a/2c = 0.40)
Figure 41 - Crack Growth-Resistance and -Driving Curves 92for 2219-T87 Base Metal (a/2c = 0.10)
Figure 42 - Generalized Stress Versus Flaw Depth 93Relationship for Static Fracture
Figure 43 - Summary of Static Fracture Test Results 94
Figure 44 - Cyclic Crack Growth for 1.27 cm (0.50 Inch) 95Thick 2219-T87 Aluminum (WT Direction) at780K (-320 0F) with a = 0.67 a and (a/2c).= 0.37 0 ys 1
Figure 45 - Cyclic Crack Growth Rates for 1.27 cm (0.50 96Inch) Thick 2219-T87 Aluminum (WT Direction)at 780 K (-3200 F) with a = 0.67 a and(a/2c) i = 0.30 o0 ys
Figure 46 - Cyclic Growth Rates for 1.27 cm (0.50 Inch) 97Thick 2219-T87 Aluminum (WT Direction) at780K (-3200 F) with a = 0.91 a and (a/2c)iS0.41 0 ys1
Figure 47 - Cyclic Growth Rates for 1.27 cm (0.50 Inch) 98Thick 2219-T87 Aluminum (WT Direction) at780K (-320 0F) with a = 0.91 a and (a/2c)i
0.11 0 ys 1
ix

LIST OF FIGURES (Continued)
Figure No. Page
Figure 48 - Cyclic Growth Rates for 0.51 cm (0.20 Inch) 99Thick 2218-T87 Aluminum (WT Direction) at780 K (-3200 F) with a = 0.91 ays and (a/2c).= 0.40
Figure 49 - Cyclic Crack Growth Rates for 0.51 cm (0.20 100Inch) Thick 2219-T87 Aluminum (WT Direction)at 78°K (-3200 F) with a = 0.91 a and(a/2c)i = 0.09 o ys
Figure 50 - Cyclic Crack Growth Rates for 0.38 cm (0.15 101Inch) Thick 2219-T87 Aluminum (WT Direction)at 780 K (-3200 F) with a = 0.67 y and (1/2c).= 0.37 ysi
Figure 51 - Cyclic Crack Growth Rates for 0.38 cm (0.15 102Inch) Thick 2219-T87 Aluminum (WT Direction)at 780K (-3200F) with a = 0.67 oys and (a/2c) i=0.11 0 1
Figure 52 - Cyclic Crack Growth Rates for 0.38 cm (0.15 103Inch) Thick 2219-T87 Aluminum (WT Direction)at 780K (-3200F) with a = 0.91 a and (a/2c).= 0.38 0 ys i
Figure 53 - Cyclic Crack Growth Rates for 0.38 cm (0.15 104Inch) Thick 2219-T87 Aluminum (WT Direction)at 780K (-3200 F) with a = 0.91 oys and (a/2c)i= 0.10 0 ys 1
Figure 54 - Summary of Baseline Cyclic Crack Growth Rates 105for 2219-T87 Aluminum (WT Direction at 780K (-3200 F)
Figure 55 - Comparison of 2219-T87 Aluminum (WT Direction) 106Fatigue Crack Growth Rate Data at 780K (-320oF)
Figure 56 - Cyclic Crack Growth Rates for 0.54 cm (0.21 107Inch) Thick 6AI-4V STA Titanium (RT Direction)at 295 0 K (720F) in Air With a = 0.77 a and(a/2c) 0.39 0 ys
Figure 57 - Cyclic Crack Growth Rates for 0.54 cm (0.21 108Inch) Thick 6AI-4V STA Titanium (RT Direction)at 2950 K (720 F) in Air with a = 0.77 a and(a/2c)i = 0.10 0 ys
Figure 58 - Cyclic Crack Growth Rates for 0.31 cm (0.12 109Inch) Thick 6Al-4V STA Titanium (RT Direction)at 2950 K (720F) in Air with a = 0.77 s and(a/2c)i = 0.34 o ys
x
LIST OF FIGURES (Continued)
Figure No. Page
Figure 59 - Cyclic Crack Growth Rates for 0.31 cm (0.12 110
Inch) Thick 6A1-4V STA Titanium (RT Direction)
at 295 0 K (72°F) in Air with a= 0.77 ays and
(a/2c)i = 0.10
Figure 60 - Cyclic Crack Growth Rates for 0.16 cm (0.063 111
Inch) Thick 6AI-4V STA Titanium (RT Direction)
at 295 0 K (720F) in Air with o = 0.77 ays and
(a/2c)i = 0.40
Figure 61 - Cyclic Crack Growth Rates for 0.16 cm (0.063 112
Inch) Thick 6Al-4V STA Titanium (RT Direction)
at 295 0K (720F) in Air with ao = 0.77 ays and
(a/2c)i = 0.10
Figure 62 - Summary of Baseline Cyclic Crack Growth Rates 113
for 6Al-4V STA Titanium (RT Direction) Plate at
295 0K (720F)
Figure 63 - Comparison of 6AI-4V STA Titanium (RT Direction) 114
Fatigue Crack Growth Rate Data at 2950K (720F)
Figure 64 - Cyclic Crack Growth Rates for 0.31 cm (0.12 115
Inch) Thick 6Al-4V STA Titanium (WT Direction)
at 295 0K in Argon with a = 0.68 ays and (a/2c)i
= 0.37
Figure 65 - Cyclic Crack Growth Rates for 0.16 cm (0.063 116
Inch) Thick 6AI-4V STA Titanium (WT Direction)
at 295 0 K (720F) in Argon with o = 0.68 ays and(a/2c)i = 0.10
Figure 66 - Effect of Crack Orientation on Fatigue Crack 117
Growth Rate Data for 6A1-4V STA Titanium at
295 0K (720F)
Figure 67 - Cyclic Crack Growth Rates (After a Cryogenic 118
Proof Test) for 1.27 cm (0.50 Inch) Thick 2219-
T87 Aluminum (WT Direction) at 780K) (-3200F)
with a = 0.67 ays and (a/2c)i = 0.39
o ys
Figure 68 - Cyclic Crack Growth Rates (After a Cryogenic 119
Proof Test) for 1.27 cm (0.50 Inch) Thick 2219-
T87 Aluminum (WT Direction) at 780K (-302 °F)
with a = 0.67 ays and (a/2c)i = 0.28Sysi
xi
LIST OF FIGURES (Continued)
Figure No. Page
Figure 69 - Cyclic Crack Growth Rates (After a Cryogenic 120Proof Test) for 1.27 cm (0.50 Inch) Thick 2219-T87 Aluminum (WT Direction) at 780 K (-3200F) witho = 0.91 ays and (a/2c). = 0.40 and 0.10
Figure 70 - Cyclic Crack Growth Rates (After a Cryogenic 121Proof Test) for 0.38 cm (0.15 Inch) Thick 2219-T87 Aluminum (WT Direction) at 780 K (-3200F) witho = 0.67 oys and (a/2c)i = 0.37
Figure 71 - Cyclic Crack Growth Rates (After a Cryogenic 122Proof Test) for 0.38 cm (0.15 Inch) Thick 2219-T87 Aluminum (WT Direction) at 780K (-3200F) withGo = 0.67 y and (a/2c)i = 0.11
Figure 72 - Cyclic Crack Growth Rates (After a Cryogenic 123Proof Test) for 0.38 cm (0.15 Inch) Thick 2219-T87 Aluminum (WT Direction) at 780K (-320oF) witha = 0.76 a - 0.91 s and (a/2c) = 0.11aid 0.36 ys ys 1
Figure 73 - Cyclic Crack Growth Rates (After a Proof Test) 124For 0.54 cm (0.21 Inch) Thick 6AI-4V STA Titanium(RT Direction) at 295 0K (720F) in Air with a =0.77 ays and (a/2c).i 0.37
Figure 74 - Cyclic Crack Growth Rates (After a Proof Test) 125For 0.54 cm (0.21 Inch) Thick 6Al-4V STA Titanium(RT Direction) at 295 0K (72oF) in Air with a =0.77 ays and (a/2c)i = 0.10 0
Figure 75 - Cyclic Crack Growth Rates (After a Proof Test) 126For 0.16 cm (0.063 Inch) Thick 6Al-4V STA Titanium(RT Direction) at 295 0K (72oF) in Air with a =0.77 0ys and (a/2c)i = 0.33
Figure 76 - Cyclic Crack Growth Rates (After a Proof Test) 127For 0.16 cm (0.063 Inch) Thick 6Al-4V STA Titanium(RT Direction) at 295 0 K (720F) in Air with a =0.77 0ys and (a/2c)i = 0.09
Figure 77 - Cyclic Crack Growth Rates (After a Proof Test) 128For 0.31 cm (0.12 Inch) Thick 6AI-4V STA Titanium(WT Direction) at 295 0 K (720 F) in Argon with a =0.68 0ys and (a/2c)i = 0.38
xii
LIST OF FIGURES (Continued)
Figure No. Page
Figure 78 - Cyclic Crack Growth Rates (After a Proof Test) 129For 0.16 cm (0.063 Inch) Thick 6Al-4V STA Titanium(WT Direction) at 2950K (72oF) in Argon with a =0.68 yys and (a/2c)i = 0.10
Figure 79 - Cyclic Crack Growth Rates for 0.31 cm (0.12 130Inch) Thick 6Al-4V STA Titanium (WT Direction)at 295'K (72'F) Salt Water with a 0.68 aand (a/2c) i = 0.37 o
Figure 80 - Cyclic Crack Growth Rates for 0.16 cm (0.063 131Inch) Thick 6Al-4V STA Titanium (WT Direction)at 295 0K (720F) Salt Water with a = 0.68 yand (a/2c). = 0.10 o
Figure 81 - Cyclic Crack Growth Rates (After a Proof Test) 132For 0.31 cm (0.12 Inch) Thick 6AI-4V STA Titanium(WT Direction) at 295 0 K (720 F) in Salt Water witha = 0.68 ays and (a/2c). = 0.38
Figure 82 - Cyclic Crack Growth Rates (After a Proof Test) 133For 0.16 cm (0.063 Inch) Thick 6Al-4V STA Titanium(WT Direction) at 2950 K (720 F) in Salt Water witha = 0.68 a and (a/2c) = 0.10
0 ys
Figure 83 - Cyclic Crack Growth Rates (After a Proof Test) 134for 0.31 cm (0.12 Inch) Thick 6AI-4V STA Titanium(WT Direction) at 295'K (720F) in Salt Water witha = 0.68 ays and (a/2c). = 0.38
0 ys
Figure 84 - Cyclic Crack Growth Rates (After a Proof Test) 135for 0.16 cm (0.063 Inch) Thick 6Al-4V STA Titanium(WT Direction) at 295 0K (720 F) in Salt Water witha 0.68 ays and (a/2c). = 0.10
0 ys
Figure 85 - Summary of Baseline da/dN Developed for 2219-T87 136Aluminum and 6Al-4V STA Titanium in InertEnvironments
Figure 86 - Summary of 6Al-4V STA Titanium (WT Direction) 137Sustained Loaded Data* in Salt Water at 295 0K(720F)
Figure A-1 - Rear Surface Strain Gage Data for 0.381 cm (0.150 139Inch) and 0.508 cm (0.200 Inch) Thick 7075-T651Aluminum at Room Temperature
xiii

LIST OF FIGURES (Continued)
Figure No. Page
Figure A-2 - Rear Surface Strain Gage Data for 1.27 cm (0.500 140Inch) Thick 7075-T651 Aluminum at Room Temperature
Figure A-3 - Rear Surface Strain Gage for 1.905 cm (0.750 Inch) 141Thick 7075-T651 Aluminum at Room Temperature
Figure A-4 - Rear Surface Strain Gage for 0.508 cm (0.200 Inch) 142Thick 2219-T87 Aluminum at 780K (-320 0F)
Figure A-5 - Rear Surface Strain Measurements as a Function of 143Flaw Depth for 7075-T651 Aluminum at Room Temperature
Figure A-6 - Rear Surface Strain Measurement as a Function of Flaw 144Depth for 2219-T87 Aluminum at 780K (-320oF)
Figure A-7 - Rear Surface Strain Gage for 1.27 cm (0.500 Inch) 145Thick 2219-T87 Aluminum at -320 0F
Figure B-1 - EDI Clip Gage Installation 147
Figure 8-2 - Variation of C with Flaw Depth for 2219-T87 Aluminum 148at 780K (-3200 F) and an (a/2c)i = 0.40
Figure B-3 - Variation of C with Flaw Depth for 2219-T87 Aluminum 149at 780 K (-320'F) and an (a/2c) = 0.25
Figure B-4 - Variation of C with Flaw Depth for 2219-T87 Aluminum 150at 780K (-320'F) and an (a/2c) = 0.10
Figure B-5 - Variation of C with Flaw Depth for 7075-T651 Aluminum 151at Room Temperature and an (a/2c)i = 0.25
xiv

LIST OF TABLES
Table No, Title Page
1 Summary: NAS3-10290 Investigation of Deep 153Flaws in Thin Walled Tanks
2 Test Summary 154
3 Chemical Compositions of Materials 155
Tensile Properties 2219-T87 Aluminum Parent 156Metal
5 Tensile Properties 7075-T6 Aluminum Parent 157Metal
6 Tensile Properties 6AI-4V STA Titanium 158Parent Metal
7 Static Fracture Data for 0.38 cm (0.15 Inch) 1592219-T87 Aluminum Parent Metal (WT Direction)
8 Static Fracture Data for 0.51 cm (0.20 Inch) 1602219-T87 Aluminum Parent Metal (WT Direction)
9 Static Fracture Data for 1.27 cm (0.50 Inch) 1612219-T87 Aluminum Parent Metal (WT Direction)
10 Static Fracture Data for 1.91 cm (0.75 Inch) 1632219-T87 Aluminum Parent Metal (WT Direction)
11 Static Fracture Data for 7075-T651 Aluminum 164Parent Metal (WT Direction)
12 Static Fracture Data for 0.08 cm (0.03 Inch) 166and 0.15 cm (0.06 Inch) 6AI-4V STA TitaniumParent Metal (RT Direction)
13 Static Fracture Data for 0.31 cm (0.12 Inch) 1676AI-4V STA Titanium Parent Metal (RT Direction)
14 Static Fracture Data for 0.53 cm (0.21 Inch) 1686Al-4V STA Titanium Parent Metal (RT Direction)
15 Static Fracture Data for 0.76 cm (0.30 Inch) 1706Al-4V STA Titanium Parent Metal (RT Direction)
16 2219-T87 Aluminum Cyclic Flaw Growth Data 171at 780 K (-3200 F); t = 1.27 cm (0.50 Inch),o = 0.67 ays and (a/2c)i = 0.37
xv
LIST OF TABLES (Continued)
Table No. Title Page
17 2219-T87 Aluminum Cyclic Flaw Growth Data 172at 780K (-3200F); t = 1.27 cm (0.50 Inch),a = 0.67 ay and (a/2c) 0.300 ys i
18 2219-T87 Aluminum Cyclic Flaw Growth Data 173at 780K (-3200F); t = 1.27 cm (0.50 Inch),o = 0.91 ays and (a/2c)i 0.41
19 2219-T87 Aluminum Cyclic Flaw Growth Data 174at 780 K (-3200 F); t = 1.27 cm (0.50 Inch),a = 0.91 ys and (a/2c) _ 0.11
20 2219-T87 Aluminum Cyclic Flaw Growth Data 175at 780 K (-320oF); t = 0.51 cm (0.20 Inch),a = 0.91 ays and (a/2c)i 0.40
21 2219-T87 Aluminum Cyclic Flaw Growth Data 176at 780 K (-320'F); t = 0.51 cm (0.20 Inch),a = 0.91 0ys and (a/2c)i 0.09
22 2219-T87 Aluminum Cyclic Flaw Growth Data 177at 780K (-320oF); t = 0.38 cm (0.20 Inch),a = 0.67 y and (a/2c)i ~ 0.37
0 ys23 2219-T87 Aluminum Cyclic Flaw Growth Data 178
at 780K (-320oF); t = 0.38 cm (0.15 Inch),a = 0.67 ays and (a/2c)i 0.11
24 2219-T87 Aluminum Cyclic Flaw Growth Data 179at 780K (-3200F); t = 0.38 cm (0.15 Inch),a = 0.91y s and (a/2c)i ~0.38
25 2219-T87 Aluminum Cyclic Flaw Growth Data 180at 780K (-3200F); t = 0.38 cm (0.15 Inch),a = 0.91 a and (a/2c) ~ 0.09o ys 1
26 6AL-4V STA Titanium (RT Direction) Cyclic 181Flaw Growth Data at 295 0K (720F); t = 0.51 cm(0.21 Inch), ao = 0.77 ys and (a/2c)i 0.39
o ys27 6AL-4V STA Titanium (RT Direction) Cyclic 182
Flaw Growth Data at 295 0K (720F); t = 0.51 cm(0.21 Inch), ao = 0.77 o and (a/2c)i 0.10
ys i =
28 6AL-4V STA Titanium (RT Direction) Cyclic 183Flaw Growth Data at 295 0 K (72oF); t = 0.31 cm(0.12 Inch), ao = 0.77 ays and (a/2c)i - 0.34
0 ys
xvi
LIST OF TABLES (Continued)
Table No. Title Page
29 6AL-4V STA Titanium (RT Direction) Cyclic 184Flaw Growth Data at 295 0 K (720 F); t = 0.31 cm(0.12 Inch), a = 0.77 a and (a/2c) 0.10
0 n ° ys i
30 6AL-4V STA Titanium (RT Direction) Cyclic 185Flaw Growth Data at 295 0 K (72°F); t = 0.16cm(0.063 Inch), a = 0.77 a and (a/2c). 0.40h ° ys i -
31 6AL-4V STA Titanium (RT Direction) Cyclic 186Flaw Growth Data at 295 0K (720F); t = 0.16 cm(0.063 Inch), a = 0.77 5 and (a/2c). I 0.10(h ° ys i
32 6AL-4V STA Titanium (WT Direction) Cyclic Flaw 187Growth Data at 295 0K (720F) in Argon and SaltWater at 10 cpm; t = 0.31 cm (0.12 Inch),a = 0.68 ays and (a/2c)i _ 0.37o 1 -
33 6AL-4V STA Titanium (WT Direction) Cyclic Flaw 188Growth Data at 295 0 K (720F) in Argon and SaltWater at 10 cpm; t = 0.16 cm (0.063 Inch),
= 0.68 ays and (a/2c) 0.100o ys i
34 2219-T87 Aluminum Cyclic Flaw Growth Data 189at 780K (-3200 F) After Cryogenic Proof Test;t = 1.27 cm (0.50 Inch), ao = 0.67 oys and(a/2c) 0.39 ys
35 2219-T87 Aluminum Cyclic Flaw Growth Data at 190780K (-3200 F) After Cryogenic Proof Test;t = 1.27 cm (0.50 Inch), ao = 0.67 ays and(a/2c) 0.28
36 2219-T87 Aluminum Cyclic Flaw Growth Data at 191780 K (-320 0F) After Cryogenic Proof Test;t = 1.27 cm (0.50 Inch), o = 0.91 aand (a/2c)i : 0.40 and 0.16 ys
37 2219-T87 Aluminum Cyclic Flaw Growth Data at 192780K (-3200 F) After Cryogenic Proof Test;t = 0.38 cm (0.15 Inch), ao = 0.67 aand (a/2c) 0.37 0 ys
38 2219-T87 Aluminum Cyclic Flaw Growth Data at 193780K (-320 0F) After Cryogenic Proof Test;t = 0.38 cm (0.15 Inch), o = 0.67 aand (a/2c)i 0.11 0 ys
xvii
LIST OF TABLES (Continued)
Table No. Title Page
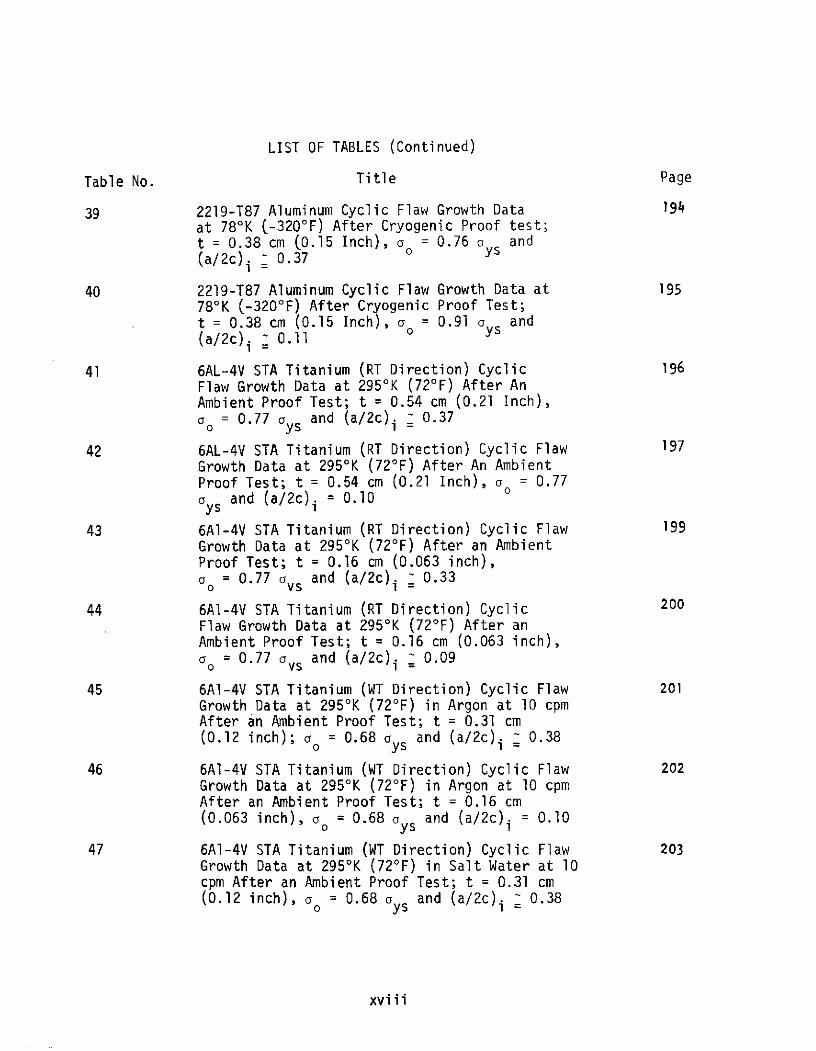
39 2219-T87 Aluminum Cyclic Flaw Growth Data 194at 780K (-3200 F) After Cryogenic Proof test;t = 0.38 cm (0.15 Inch), o = 0.76 a and(a/2c)i 0.37 ys
40 2219-T87 Aluminum Cyclic Flaw Growth Data at 195780K (-3200 F) After Cryogenic Proof Test;t = 0.38 cm (0.15 Inch), a = 0.91 a and(a/2c) 0.11 0 ys
41 6AL-4V STA Titanium (RT Direction) Cyclic 196Flaw Growth Data at 295 0K (720F) After AnAmbient Proof Test; t = 0.54 cm (0.21 Inch),a = 0.77 a and (a/2c)i - 0.37
42 6AL-4V STA Titanium (RT Direction) Cyclic Flaw 197Growth Data at 295 0K (720 F) After An AmbientProof Test; t = 0.54 cm (0.21 Inch), a = 0.770ys and (a/2c) = 0.10
43 6AI-4V STA Titanium (RT Direction) Cyclic Flaw 199Growth Data at 2950 K (720 F) After an AmbientProof Test; t = 0.16 cm (0.063 inch),a = 0.77 vs and (a/2c)i . 0.33
0 VS 1 =
44 6Al-4V STA Titanium (RT Direction) Cyclic 200Flaw Growth Data at 295 0K (720F) After anAmbient Proof Test; t = 0.16 cm (0.063 inch),a = 0.77 a and (a/2c)i - 0.09
0 vs
45 6A1-4V STA Titanium (WT Direction) Cyclic Flaw 201Growth Data at 295 0K (720F) in Argon at 10 cpmAfter an Ambient Proof Test; t = 0.31 cm(0.12 inch); ao = 0.68 oys and (a/2c) - 0.38
46 6Al-4V STA Titanium (WT Direction) Cyclic Flaw 202Growth Data at 2950 K (72°F) in Argon at 10 cpmAfter an Ambient Proof Test; t = 0.16 cm(0.063 inch), ao = 0.68 ays and (a/2c)i = 0.10
47 6A1-4V STA Titanium (WT Direction) Cyclic Flaw 203Growth Data at 295 0K (720F) in Salt Water at 10cpm After an Ambient Proof Test; t = 0.31 cm(0.12 inch), ao = 0.68 oys and (a/2c)i 0.38
xviii
LIST OF TABLES (Continued)
Table No. Title Page
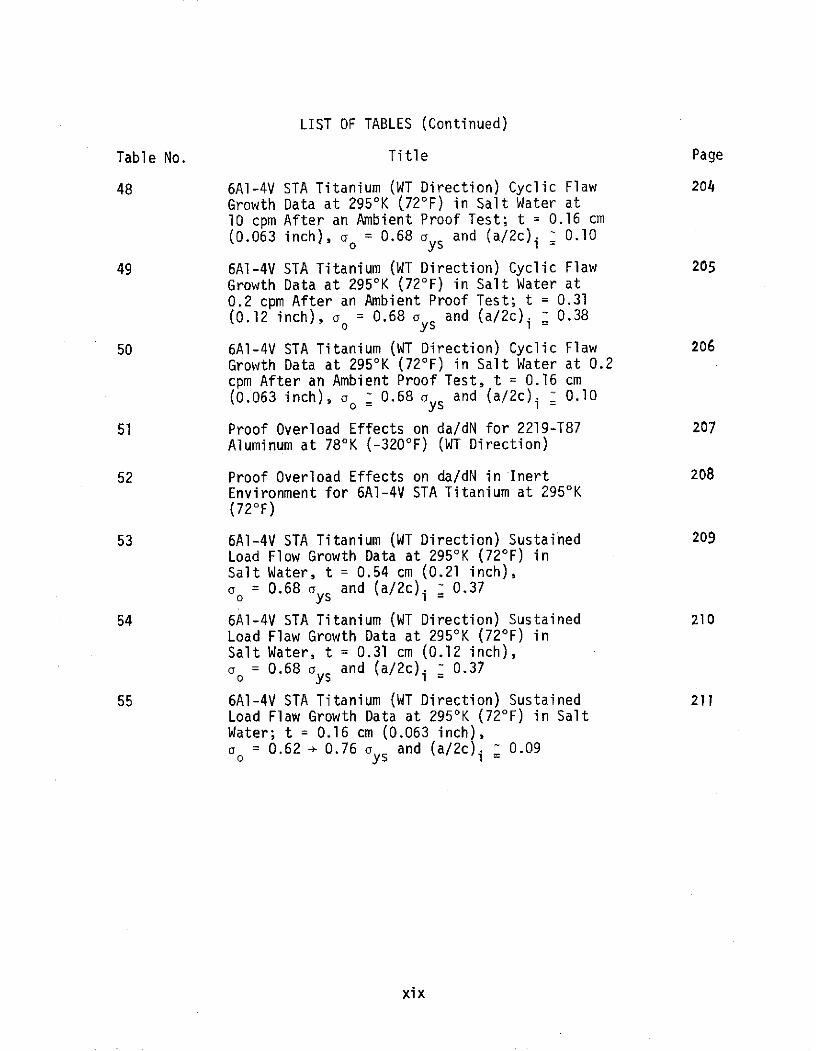
48 6A1-4V STA Titanium (WT Direction) Cyclic Flaw 204Growth Data at 295 0 K (720 F) in Salt Water at10 cpm After an Ambient Proof Test; t = 0.16 cm(0.063 inch), a = 0.68 ays and (a/2c) i - 0.10
49 6Al-4V STA Titanium (WT Direction) Cyclic Flaw 205Growth Data at 295 0K (72oF) in Salt Water at0.2 cpm After an Ambient Proof Test; t = 0.31(0.12 inch), a = 0.68 a and (a/2c) i 0.38
0 ys i =
50 6A1-4V STA Titanium (WT Direction) Cyclic Flaw 206Growth Data at 295 0K (72oF) in Salt Water at 0.2cpm After an Ambient Proof Test, t = 0.16 cm(0.063 inch), a _ 0.68 oy and (a/2c)i - 0.10
51 Proof Overload Effects on da/dN for 2219-T87 207Aluminum at 780K (-3200 F) (WT Direction)
52 Proof Overload Effects on da/dN in Inert 208Environment for 6Al-4V STA Titanium at 2950 K(720 F)
53 6AI-4V STA Titanium (WT Direction) Sustained 209Load Flow Growth Data at 295'K (72°F) inSalt Water, t = 0.54 cm (0.21 inch),a = 0.68 a and (a/2c). 0.37o ys
54 6Al-4V STA Titanium (WT Direction) Sustained 210Load Flaw Growth Data at 295 0 K (720F) inSalt Water, t = 0.31 cm (0.12 inch),a = 0.68 ays and (a/2c)i 0.37
55 6Al-4V STA Titanium (WT Direction) Sustained 211Load Flaw Growth Data at 295 0K (720F) in SaltWater; t = 0.16 cm (0.063 inch),a = 0.62 - 0.76 y s and (a/2c) 0.09
xix 1
xix

xx

1.0 INTRODUCTION
The semi-elliptical surface flaw is an excellent model of common failure
origins in aerospace structure and so has been the object of considerable
study. This type of defect is especially prevalent in failure analysis reports
of welded aerospace pressure vessels and to a lesser degree, percentage wise,
in aircraft primary structures.
Pressure vessel design methods have been developed (1)* for assuring that
crack-like defects will not grow sufficiently to initiate failure during the
required operational life. Similar efforts are now underway to develop more
effective guidelines for assuring structural integrity of military aircraft(2)
A large part of the data used in the formulation of the philosophies of the
reference 1 monograph resulted from testing and analysis of surface flaws in
relatively brittle materials. Flaw and plastic zone sizes usually were
relatively small with respect to other specimen or structure dimensions. The
most significant structural failures of high performance aircraft, those
prompting accelerated Air Force research efforts, also involved surface
defects in high strength (brittle) materials.
With the above situations the defect becomes critical before it can grow
through the thickness and become detectable. Catastrophic failure can and
has occurred. Exact stress intensity solutions for these conditions are not
available, however, the solution due to Irwin (3) for shallow surface flaws
and combined with Kobayashi's original deep flaw magnification values has
proven to be quite useful in solving practical engineering problems.
Recognition of the factors causing these past failure problems has resulted
in gradual but marked changes in new designs and structures. Improved
materials and material processing, and reduced strength and stress levels
have combined to result in conditions in which critical flaw sizes approach or
exceed the wall thickness of the structure. While this improves structural
safety and durability, it complicates the failure mode and life prediction
efforts. The previously developed analytical procedures based upon modified
* numbers in parenthesis refer to references at end of report
1
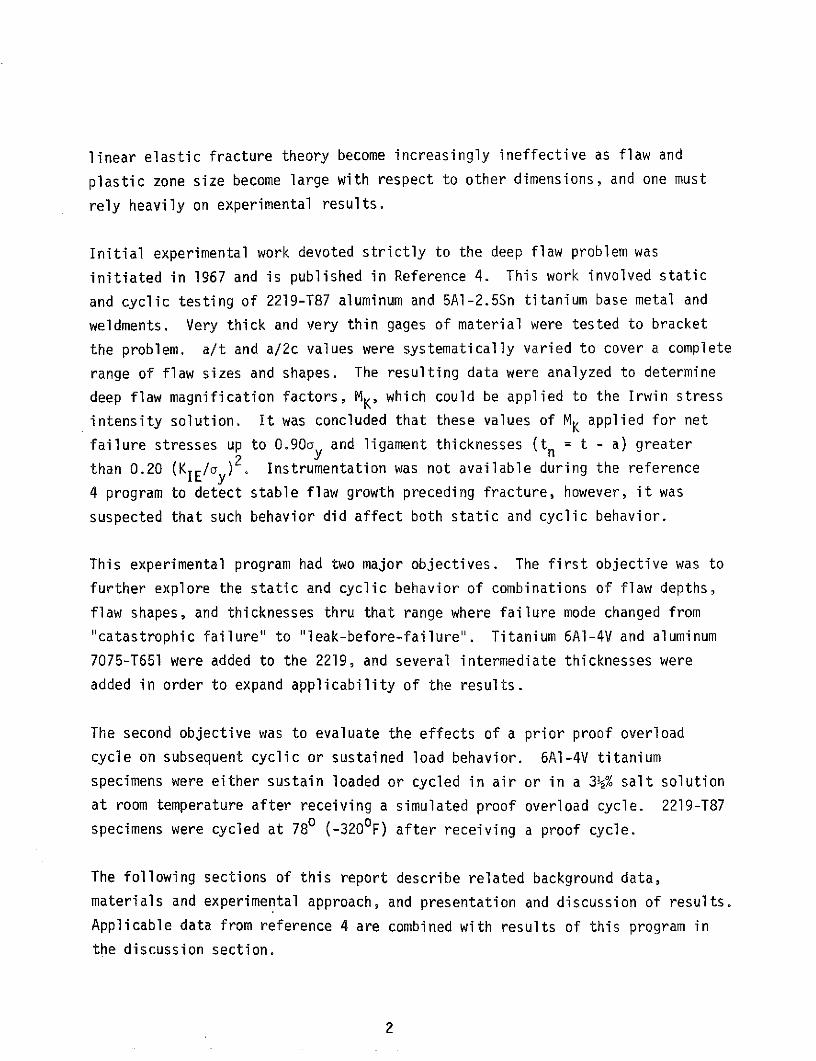
linear elastic fracture theory become increasingly ineffective as flaw and
plastic zone size become large with respect to other dimensions, and one must
rely heavily on experimental results.
Initial experimental work devoted strictly to the deep flaw problem was
initiated in 1967 and is published in Reference 4. This work involved static
and cyclic testing of 2219-T87 aluminum and 5Al-2.5Sn titanium base metal and
weldments. Very thick and very thin gages of material were tested to bracket
the problem. a/t and a/2c values were systematically varied to cover a complete
range of flaw sizes and shapes. The resulting data were analyzed to determine
deep flaw magnification factors, MK, which could be applied to the Irwin stress
intensity solution. It was concluded that these values of MK applied for net
failure stresses up to 0.90ay and ligament thicknesses (t = t - a) greater
than 0.20 (KIE/ay)2. Instrumentation was not available during the reference
4 program to detect stable flaw growth preceding fracture, however, it was
suspected that such behavior did affect both static and cyclic behavior.
This experimental program had two major objectives. The first objective was to
further explore the static and cyclic behavior of combinations of flaw depths,
flaw shapes, and thicknesses thru that range where failure mode changed from
"catastrophic failure" to "leak-before-failure". Titanium 6AI-4V and aluminum
7075-T651 were added to the 2219, and several intermediate thicknesses were
added in order to expand applicability of the results.
The second objective was to evaluate the effects of a prior proof overload
cycle on subsequent cyclic or sustained load behavior. 6AI-4V titanium
specimens were either sustain loaded or cycled in air or in a 3 % salt solution
at room temperature after receiving a simulated proof overload cycle. 2219-T87
specimens were cycled at 780 (-3200 F) after receiving a proof cycle.
The following sections of this report describe related background data,
materials and experimental approach, and presentation and discussion of results.
Applicable data from reference 4 are combined with results of this program in
the discussion section.
2
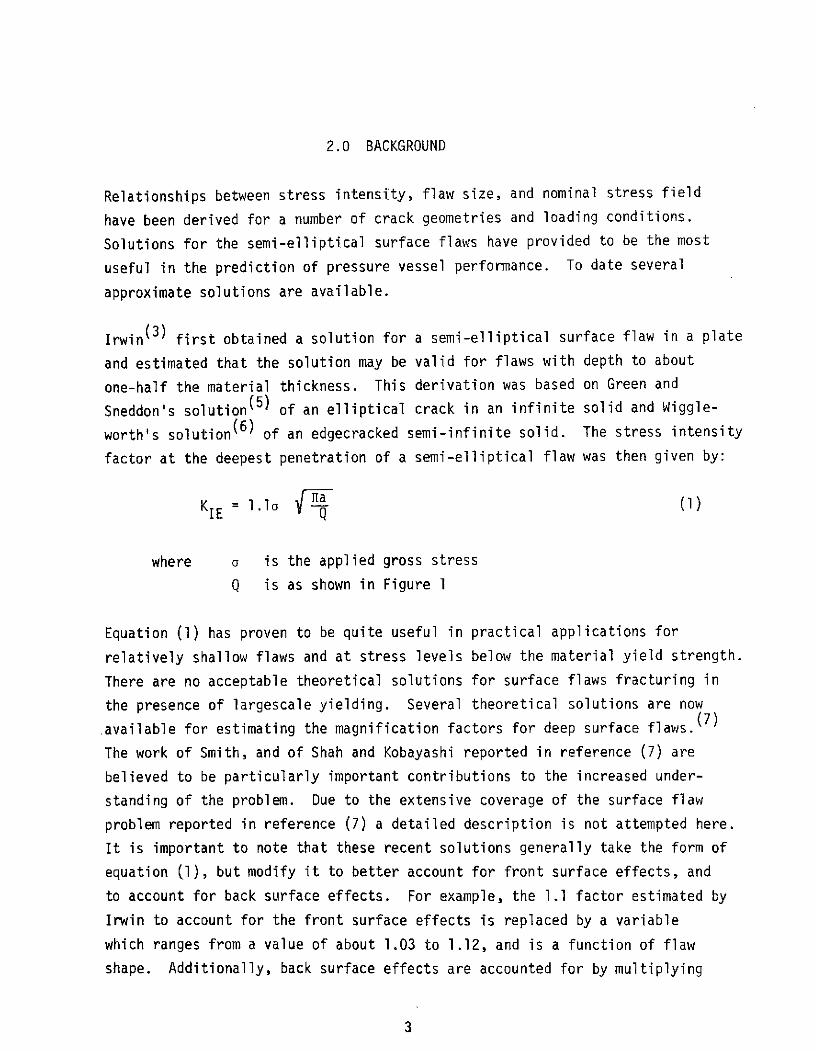
2.0 BACKGROUND
Relationships between stress intensity, flaw size, and nominal stress field
have been derived for a number of crack geometries and loading conditions.
Solutions for the semi-elliptical surface flaws have provided to be the most
useful in the prediction of pressure vessel performance. To date several
approximate solutions are available.
Irwin (3) first obtained a solution for a semi-elliptical surface flaw in a plate
and estimated that the solution may be valid for flaws with depth to about
one-half the material thickness. This derivation was based on Green and
Sneddon's solution(5) of an elliptical crack in an infinite solid and Wiggle-
worth's solution (6) of an edgecracked semi-infinite solid. The stress intensity
factor at the deepest penetration of a semi-elliptical flaw was then given by:
KIE l.lo (1)
where a is the applied gross stress
Q is as shown in Figure 1
Equation (1) has proven to be quite useful in practical applications for
relatively shallow flaws and at stress levels below the material yield strength.
There are no acceptable theoretical solutions for surface flaws fracturing in
the presence of largescale yielding. Several theoretical solutions are now(7)
available for estimating the magnification factors for deep surface flaws.
The work of Smith, and of Shah and Kobayashi reported in reference (7) are
believed to be particularly important contributions to the increased under-
standing of the problem. Due to the extensive coverage of the surface flaw
problem reported in reference (7) a detailed description is not attempted here.
It is important to note that these recent solutions generally take the form of
equation (1), but modify it to better account for front surface effects, and
to account for back surface effects. For example, the 1.1 factor estimated by
Irwin to account for the front surface effects is replaced by a variable
which ranges from a value of about 1.03 to 1.12, and is a function of flaw
shape. Additionally, back surface effects are accounted for by multiplying
3
equation (1) by a correction factor (MK or M2) which varies primarily with flaw
shape and flaw depth-to-thickness ratio.
The first systematic experimental study of deep surface flaws(4) was under-
taken in 1967. This work involved static and cyclic testing of aluminum
2219-T87 and titanium 5AI-2.5Sn base metal and weldment. Each material was
tested in very thick and in very thin gages in an attempt to bracket the
problem; a/t and a/2c values were systematically varied to cover a complete
range of flaw sizes and shapes for each of the materials. A summary of testing
parameters included in the reference (4) work is shown in Table 1.
The approach used to calculate magnification factors consisted of, first,
plotting all data in terms of apparent toughness (KIE per equation 1) versus
depth-to-thickness ratio, a/t for each of the thicknesses, test temperatures,
and flaw shapes. Earlier data (e.g., reference 8) had shown that at net
section stresses above about 90% of yield strength, KIE values are suppressed,
and thus data in this range was not included. A baseline toughness was then
selected as the apparent KIE as a/t approached 0. The MK value then was set
equal to the baseline toughness divided by the calculated apparent toughness
for the particular value of depth and shape tested. Figure 2 shows typical
data for 2219-T87 aluminum base metal at a test temperature of 200 K (-4230 F).
Note that net section stress for all points is less than 90% of yield strength
except as noted, and that the curve of apparent toughness is faired above the
high stress points.
Resultant MK curves for 2219-T87 base metal for varying a/t and a/2c values
are shown in Figure 3. As a result of the analysis of this data, it was
concluded that these curves apply for failure stresses up to 0.90ay s and
ligament thicknesses (tn = t - a) greater than 0.20 (KIE/oys) . Similar
curves for the 5AI-2-1/2Sn material exhibited slightly higher MK values.
With only a few exceptions, the actual data fell within a + 10 percent scatter
band around the curves shown, with the titanium data showing a tendency for
greater scatter than that of the aluminum.
4
The ligament restriction noted above was an estimate, although very few data
points were obtained in this area. It was hypothesized that at this point,
excessive flaw growth preceded failure. In the extreme case, growth through-
the-thickness could occur prior to fracture. Obviously, a surface flaw "model"
would not be expected to describe the failure process in this case--the
specimen actually contains a through-crack at failure. As a result of analysis
of the cyclic test data, it was also concluded that cyclic flaw growth rates
increased markedly when the above noted ligament restrictions were exceeded.
NAS 3-10290 provided considerable data which verified a significant increase in
flaw tip stress intensity for deep flaws, and identified a range of flaw
depth-to-thickness ratios where important deviations from theoretical predic-
tions occur. This range of depths roughly corresponded with the departure from
"castastrophic failure" versus "leak before failure" condition. Thus, additional
data in this range were considered vital for accurate prediction of failure mode
of pressure vessels. The program reported herein was initiated to further
explore this area. 6AI-4V-Ti and 7075-T651 were added to the 2219, and several
intermediate thicknesses were added in order to expand applicability of the
results.
5

PRECEDING PAGE BLANK NOT FILME
3.0 MATERIALS AND PROCEDURES
Table 2 shows an overall summary of tests performed. As can be seen, mechanical
property and static fracture tests were performed on 7075-T651 aluminum, 6A1-4V
STA titanium, and 2219-T87 aluminum. Additionally, simulated proof tests, cyclic
flaw growth tests, and cyclic and sustain load tests following a simulated proof
overload cycle were performed on the latter two alloys. Other test variables
included specimen thickness, flaw shape, and flaw depth-to-thickness ratio.
Specimens of all thicknesses were machined from a common gage for each alloy
with the specimen neutral axis coincident with the plate neutral axis. The
following paragraphs give specific details on test materials and procedures.
3.1 Materials
The 2219 aluminum plate material, 25.4 by 914 by 2134mm (1.0 by 36.0 x 84.0
inches) was purchased in the T87 condition per Boeing BMS 7-105C (equivalent to
MIL-A-8920-ASG). The 7075 aluminum plate material, 25.4 by 914 by 2134mm
(1.0 by 36.0 by 84.0 inches) was purchased in the T651 condition per QQ-A-250/
12D. The 6A-4V titanium plate material, 9.5 by 609 by 1829mm (0.375 by 24.0
by 72.0 inches) was purchased in the annealed condition per MIL-T-9046F, Type II,
Composition C.
Both aluminum alloys were tested in the as received condition without subsequent
thermal treatment. The titanium plates were subjected to the following treat-
ment:
a) solution treat at 1227K (1750F) for 30 minutes
b) water quench with 6 second maximum delay
c) age at 769K (925F) for 8 hours.
Chemical composition of the titanium alloy and the specification limits
for the aluminum alloys are listed in Table 3. All plates of each alloy
were obtained from a common heat.
7
3.2 Specimen Preparation
Mechanical properties were obtained by testing specimens of the configuration
shown in Figure 4. Tests were performed with the specimen axis oriented both
parallel and perpendicular to the major plate rolling direction.
All fracture and flaw growth tests were performed using uniaxially loaded
surface flaw specimens. The many thickness, flaw depth, and flaw shape
variables investigated resulted in requirements for the many different specimen
configurations as shown in Figures 5 through 12. To prevent configuration
variables from affecting test results dimensions were generally controlled to
the following:
specimen length > 3 times width
specimen width > 5 times flaw length.
These constraints were practical for all but a few of the thickest specimens
with the longest flaws. However, as shown in Appendix A, strain gage data
indicate that specimen dimensions were adequate even on those excepted cases.
The objective of this program was to investigate flaw growth characteristics
only up to the point at which the flaw penetrated the thickness (i.e., leakage).Of course, for studies involving growth after this point, greater widths wouldbe required.
All aluminum surface flaws were oriented with the flaw plane parallel to themajor plate rolling direction (referred to as WT orientation/propagation
direction). All titanium surface flaws to be tested in air were oriented withthe flaw plane perpendicular to the major plate rolling direction (RT). Thetitanium specimens tested in argon and salt water (Reference Section 4.0) wereoriented in the WT direction.
All of the test specimens were drilled using drill jigs in which the holes hadbeen located to within a tolerance of +0.025mm (+0.001 inch). The specimengrips were also drilled using the same drill jigs to ensure an accurate fitbetween specimen and loading grip.
8
All surface flaws were prepared by initially introducing a starter notch by
means of an Electric Discharge Machine (EDM) and then extending the starter
notch by means of low stress cyclic fatigue. Since the stress level used to
initially fatigue the crack specimen is dependent upon the material and size
of the EDM starter slot, and a wide variety of flaw sizes were tested, many
different stress levels were used during the initial fatigue cracking. All
of the aluminum specimens, both 2219-T87 and 7075-T651 alloys, were precracked
using a maximum fatigue stress level between 41 and 110 MN/m 2 (6 and 16 ksi).
All of the 6Al-4V STA titanium specimens were precracked using a stress level
between 103 and 310 MN/m 2 (15 and 45 ksi). Care was taken in all cases to
ensure that the precracking stress level was small compared to the anticipated
test stress level. The low stress fatigue cracking was continued on all
specimens until a fatigue crack existed over the entire periphery of the EDM
starter slot. A microscope was used to monitor the size of the fatigue crack
during the precracking operation.
3.3 Experimental Procedures
The following sections describe the instrumentation and experimental procedures
used to accomplish all of the mechanical property, static fracture, cyclic,
overload and load-unload testing performed during the subject program.
3.3.1 Instrumentation
All mechanical property tests were conducted using both extensometer and strain
gages for determination of yield strength, modulus of elasticity and Poisson's
ratio. All of the surfaced flaw specimens were instrumented with an electrical
displacement indicator (EDI) clip gage for determination of crack opening
displacement (COD). The EDI clip gage was attached to the flaw either by means
of tabs micro-spot welded to the specimen or by integrally machined knife edges.
Figure 13 illustrates the two different means of attaching the EDI gage. In
addition to the EDI clip gage, the majority of the surface flawed specimens were
also instrumented with strain gages attached on the rear surface, in order to
monitor the strain field behind the flaw. A discussion of the placement of the
strain gages and the results obtained is given in Appendix A. Initially,
pressure cups were used on selected specimens for determination of flaw break-
through. This system consists of placing a pressure cup either directly over
9
the flaw or directly behind the flaw and then filling one cup with pressurized
gas. The pressure in the cup is then monitored throughout the test; a decrease
in pressure in one cup is accompanied by an increase in pressure in the other,
indicating flaw breakthough.
3.3.2 Mechanical Property Tests
Mechanical property tests were conducted at RT, 78K (-320F), and 20K (-423F) in
air, LN2 and LH2, respectively. A strain rate of 0.005 mm/mm/minute was used
on all specimens until the material yield stress was obtained. A strain rate
of 0.02 mm/mm/minute was then used for the remaining portion of the loading
until failure.
3.3.3 Static Fracture Tests
Static fracture tests were conducted using surface flawed specimens, in air
at room temperature and in liquid nitrogen (LN2) at 78K (-320F). All specimens
tested at 78K (-320F) were submerged in LN2 by means of an open top cryostat.
The liquid level within the cryostat was visually monitored to ensure that the
test section of the specimen had been completely submerged for a minimum of
15 minutes prior to the application of any test load. All specimens were loaded
at a rate such that failure would occur between 1 and 3 minutes after the
initiation of loading.
All specimens were equipped with an EDI clip gage to monitor crack opening
displacement and strain gages to monitor the rear surface strain.
3.3.4 Cyclic Tests
Cyclic tests were conducted, using surface flawed specimens, at both room temp-
erature and 78K (-320F). All of the 6Al-4V STA titanium specimens were tested
at room temperature and all of the 2219-T87 aluminum specimens were tested at
78K (-320F). The technique used to ensure thermal stability for the LN2tests was identical to that used for the static fracture tests. A cyclic
speed of 0.33Hz (20 CPM) was used for all of the testing. In order to definethe flaw size at the time back surface dimpling occurred, the cyclic tests wereinterrupted and low stress fatigue cycles were applied to mark the flaw
10
periphery. (Refer to Section 4.0 for a discussion of back surface dimpling.)
The tests were then continued and finally terminated either at flaw break-
though or immediately prior to failure. Flaw breakthrough was detected by
means of pressure cups using the method described in Section 2.3.1. Continual
monitoring of the EDI output allowed the test machine operator to estimate the
remaining cycles to failure. When failure appeared to be imminent, the operator
stopped the cyclic test and then loaded the specimen to failure. Employment of
this method, rather than cycling all the way to failure, results in a more
easily distinguishable final flaw size. Since the failure stress of all the
tests terminated in this manner were near the prior cyclic stress, it can be
concluded that these tests were stopped within a very few cycles of failure.
3.3.5 Overload Tests
Overload tests were conducted at 780K (-3200 F) using 2219-T87 aluminum specimens
and at room temperature using 6Al-4V STA titanium specimens. The tests consisted
of a proof overload applied at a rate such that maximum load would be obtained
in one minute, followed by either sustained loading or cyclic loading.
For the aluminum specimens tested in LN2, the cyclic loading consisted of a
0.33Hz (20 CPM) sinusoidal profile. Three different cyclic profiles were used
for the titanium specimens. The three cyclic profiles used were 0.33Hz (20 CPM)
sinusoidal, 0.17Hz (10 CPM) triangular, 0.003Hz (0.2 CPM) trapezoidal. The
0.003 Hz (0.2 CPM) trapezoidal loading profile consisted of a 3 second linear
loading, followed by a 294 second hold, and a 3 second linear unloading. By
using the trapezoidal loading just described, it was possible to have identical
loading and unloading profiles between this and the 0.17hz (10 CPM) triangular
profiles.
All of the aluminum overload cyclic specimens were either cycled until the flaw
broke through the rear surface or until failure was imminent. The imminence
of failure was detected by means of an EDI gage as described in the previous
section. Flaw breakthrough was determined by means of a strain gage mounted on
the rear surface slightly above the plane of the flaw. The titanium specimens
cycled in salt water using the trapezoidal loading profile were cycled to
11
failure. For all other cyclic tests the tests were terminated either when the
flaw broke through the rear surface or failure was imminent. The same techniques
as previously described were employed for determination of these two cases. The
sustained load tests which were conducted after overload were held at load
for approximately 7.0 hours and then marked and failed at room temperature.
12
4.0 PRESENTATION AND DISCUSSION OF RESULTS
4.1 Mechanical Property Tests
Results of the mechanical properties tests of the alloys are shown in Tables
4 thru 6. Tests on the 2219 aluminum and the 6A1-4V titanium alloys were
performed at room temperature in air, 780 K (-3200 F) in liquid nitrogen, and
200 K (-4230 F) in liquid hydrogen. The 7075 aluminum alloy was tested only
at room temperature. Utlimate strength, yield strength, elongation, and
Poisson's ratio were determined.
Uniaxial yield strengths were calculated using loads corresponding to a 0.2
percent offset on load-strain curves. Longitudinal strains were measured using
50.8mm (2.0 inch) gage length extensometers.
Poisson's ratio measurements were made from continuous strain gage recordings
of load (P) versus longitudinal strain (EL) and transverse strain (ET). The
elastic Poisson's ratio was then computed from the formula
dET dE
S= -- dP
where P is the elastic Poisson's ratio;
and
d dT Ld
-p- pand Tp- are the average slopes of the elastic portions
of the load-versus-transverse-strain and load-
versus-longitudinal-strain recordings, respec-
tively.
Measured properties are plotted as a function of test temperature in Figure
14 for the 2219 alloy, and in Figure 15 for the titanium alloy. All properties
of the 2219 alloy are quite similar to those of the 2219 alloy tested in the
Reference 4 program.
13
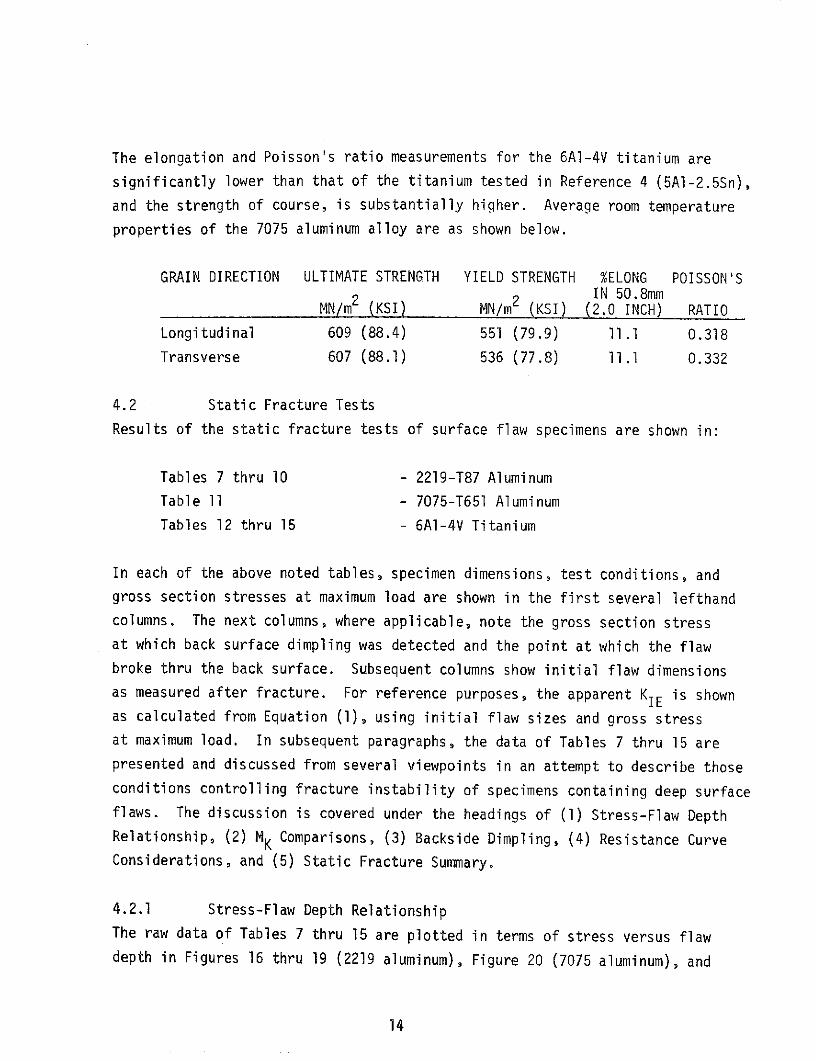
The elongation and Poisson's ratio measurements for the 6A1-4V titanium are
significantly lower than that of the titanium tested in Reference 4 (5A1-2.5Sn),
and the strength of course, is substantially higher. Average room temperature
properties of the 7075 aluminum alloy are as shown below.
GRAIN DIRECTION ULTIMATE STRENGTH YIELD STRENGTH %ELONG POISSON'SIN 50.8mm
MN/m (KSI) MN/m (KSI) (2.0 INCH) RATIO
Longitudinal 609 (88.4) 551 (79.9) 11.1 0.318
Transverse 607 (88.1) 536 (77.8) 11.1 0.332
4.2 Static Fracture Tests
Results of the static fracture tests of surface flaw specimens are shown in:
Tables 7 thru 10 - 2219-T87 Aluminum
Table 11 - 7075-T651 Aluminum
Tables 12 thru 15 - 6Al-4V Titanium
In each of the above noted tables, specimen dimensions, test conditions, and
gross section stresses at maximum load are shown in the first several lefthand
columns. The next columns, where applicable, note the gross section stress
at which back surface dimpling was detected and the point at which the flaw
broke thru the back surface. Subsequent columns show initial flaw dimensions
as measured after fracture. For reference purposes, the apparent KIE is shown
as calculated from Equation (1), using initial flaw sizes and gross stress
at maximum load. In subsequent paragraphs, the data of Tables 7 thru 15 are
presented and discussed from several viewpoints in an attempt to describe those
conditions controlling fracture instability of specimens containing deep surface
flaws. The discussion is covered under the headings of (1) Stress-Flaw Depth
Relationship, (2) MK Comparisons, (3) Backside Dimpling, (4) Resistance Curve
Considerations, and (5) Static Fracture Summary.
4.2.1 Stress-Flaw Depth Relationship
The raw data of Tables 7 thru 15 are plotted in terms of stress versus flaw
depth in Figures 16 thru 19 (2219 aluminum), Figure 20 (7075 aluminum), and
14
Figures 21 thru 24 (6A1-4V titanium). The data are grouped by nominal flaw
shape, with all test points for a given thickness and alloy plotted on a
single page. For example, the 2219-T87 aluminum data for 0.38 cm (0.15 in.)
thick specimens are shown in Figure 16(a) for a/2c of 0.40; in Figure 16(b)
for a/2c of 0.25 and in Figure 16(c) for a/2c of 0.10. Each illustration
shows up to three data points for each specimen; the open triangles indicate
stress levels at which back surface dimpling was detected* the solid circles
indicate stress levels at which the flaws grew through the thickness, and the
open circles indicate stress levels at which the specimens fractured. The
first step in analysis of this data was to determine effective toughness values
which best described the observed failure locii for the various materials,
thicknesses, and flaw geometries. Using the solution and magnification curves
of Figure 3, KIE values were calculated for each alloy which matched the
majority of the data. The resultant nominal values were
KIE
ALLOY MN/m 3/2 (KSIV/-)
2219-T87 Aluminum 55.0 (50.0)
7075-T651 Aluminum 39.6 (36.0)
6Al-4V STA Titanium 80.2 (73.0)
Plots of these values with a scatter band of +10% were then superimposed on
the raw data plots of Figures 16 thru 24. Test results can now be compared with
those predicted using the Figure 3 solution by observation of each of the above
noted figures.
2219 T87 Aluminum
It is seen in Figures 16 through 19 that all of the 2219-T87 aluminum specimens
which failed before break-thru at section stresses less than ninety percent
of the yield strength (19 data points) fall within the predicted toughness band.
Above ninety percent of yield strength, the data points fall below the constant
K band. It would appear that a straight line band drawn between this point and
the point of zero flaw size and ultimate strength would adequately describe the
failure locus through this range.
* See Section 4.2.3 for a discussion of back surface dimpling.
15

Study of the effects of thickness and flaw shape shows that elastic failure
can be expected for all shapes tested (a/2c of 0.10, 0.25 and 0.40) in thick-
nesses of 1.25 cm (0.50 inches) and above. For 0.51 cm (0.20 inch) material
elastic failure can occur only in the two longer flaw shapes, and in the thin-
nest material tested, 0.38 cm (0.15 inch), only the longest flaw shape can
cause elastic failure.
Observation of all of the 2219 T87 specimens which "leaked" before failing
reveals that such behavior can be expected if the initial ligament is less
than about 0.15 cm (0.060 inch). Three of the eleven specimens involved, as
seen in Figure 18(c), had initial ligaments more than 0.15 cm (0.060 inch).
It is seen that leakage and complete failure in these three specimens occurred
almost simultaneously. In a pressure vessel it is doubtful that leakage would
have been detected prior to complete rupture.
The specimens tested in Reference 4 were not instrumented to detect flaw break-
through, however, it was speculated that break through probably did occur in
several of the thinner specimens and tougher materials. If this did occur the
failures could best be described by consideration of the original surface
flaw length (2c) and the plane stress toughness. A comparison of this type was
shown in Figure 71 of Reference 4 for thin titanium surface flaw specimens.
A plot of failure stress versus initial surface length compared quite well with
that obtained from through-cracked specimens over a wide range of crack lengths.
A similar comparison can be made from the data developed in this program. For
example, Figure 18(c) contains the three data points from surface flaws with
a/2c values of 0.10 in 1.27 cm (0.50 inch) plate which broke through before
failing. KCN values were calculated using initial flaw lengths and failure
stresses. The average value was 63.3 MN/m 3/ 2 (57.6 ksi/Tn), which agrees well
with the value of 60.6 MN/m 3/2 (55.1 ksivTn-) which was obtained for 1.58 cm
(0.625 inch) 2219-T87 plate at 780K (-3200 F) in Reference 4. The single similar
data point on Figure 18(b) for a/2c values of 0.25 in the same thickness
represents a KCN value of 68.7 MN/m 3/2 (62.5 ksiVTn). From the above, it is
concluded that fracture of surface flaw specimens which leak before failing can
16
be adequately predicted by considering initial surface flaw length and plane
stress (or transitional stress) toughness for the thickness in question.
Furthermore, the failure stress may be either higher or lower than that which
would be predicted using surface flaw solutions, depending on flaw shape and
the ratio of KIE and KCN for the thickness under consideration.
7075-T651 Aluminum
Results of the 7075-T651 aluminum are shown in Figures 20(a) thru 20(d) for the
four thicknesses tested, all with a/2c values of 0.25.
As can be seen, failures occurred predominantly in the elastic range for all
thicknesses tested. Most of the specimens tested in this series displayed a
distinct pop-in before failure. This was detected both on the COD traces and
the rear surface strain gages as well as by an audible "click". Pop-in occurred
usually at a load of approximately 85 to 90 percent of the subsequent failure
load. Observation of the fracture faces of these specimens failed to reveal
any signs of growth which may have occurred during the pop-in. Therefore, two
specimens of the series (A5-2 and A5-4 of Table 11) were unloaded immediately
after the discontinuity, and then were fatigue marked and failed. Both
fracture faces revealed growth of about 0.50 cm (0.20 inch) predominately at
an angle of about 65 to 750 from the depth direction (i.e., propagation closer
to the WR direction). Little or no growth took place at 0 or 900 from the
depth direction. Overall average calculated K1 of the specimens was about 35
MN/m 3/ 2 (32 ksivin) at the pop-in load as calculated at the bottom of the flaw.
The stress intensity at an angle of 700 from the bottom should be about
28.6 MN/m 3/2 (26.1 ksiin). This value compares favorably with a toughness,
KIC, of 28.5-30.6 MN/m 3/2 (26.0-28.0 ksiVin obtained from bend specimens in
7075-T6 plate tested in the WR direction (Ref. 9). The abrupt extension of the
cracks at pop-in was evidently arrested by the pinning action at the surface
and the higher toughness in the depth direction. After pop-in the COD trace
was relatively straight up to the failure load.
Since flaw sizes after the pop-ins were not discernible on the other specimens,
the data in Figure 20 and subsequent K calculations are based on initial flaw
dimensions and stress at failure.
17
As noted earlier, a KIE value of 39.6 MN/m 3/ 2 (36.0 ksiv-n) with a scatter of
+ten percent was found to best fit the data. By comparing the data of Figures
20(a) thru (d) it is seen that the failure points in the two thinner gages fall
somewhat higher than the overall average toughness band and the points for the
two thickest gages generally appear to fall in the lower part of the toughness
band. (Recall that all specimens were machined from the same thickness). Such
a thickness dependency was not noted in the 2219-T87 data. It may be signifi-
cant that dimpling was not observed in any specimens of the two thicker gages
in the 7075 alloy whereas dimpling was observed in varying degree in all thick-
nesses in the 2219 tests. It is possible that relief of deformation constraint
associated with dimpling would result in increased fracture strength of the
thinner specimens.
One specimen from each of the two thinnest gages experienced break through prior
to failure. In both cases the initial ligament was less than 0.63 cm (0.025
inch). Leakage did not occur in the two thickest gages, however ligament
dimensions were larger than 0.63 cm (0.025 inch) in all of these latter tests.
For the two specimens that did leak (Ref. Figures 20(a) and 20(b)) KCN values
are calculated to be 49.2 MN/m 3/2 (44.8 ksiviTn) and 51.6 MN/m 3/2 (47.0 ksivTn),
respectively. No published KCN data from center cracked specimens of these
thicknesses or test directions could be found, however the values noted appear
to be somewhat low. The edgewise tunneling known to occur during a pop-in
would result in calculated KCN values on the low side.
6AI-4V STA Titanium
Stress-flaw size relationships for the titanium static fracture tests are
shown in Figures 21 thru 24. As noted earlier, a KIE value of 80.2 MN/m3/2
(73.0 ksivin) was initially selected which appeared to fit the overall data
best. This nominal value with a plus or minus 10 percent band is shown in the
figures for comparison with the raw data.
18
As with the 2219 fracture results, elastic failure before leakage was not
observed in the shorter flaws/thinner gage combinations. Elastic failure was
observed in all shapes tested (a/2c of 0.10, 0.25 and 0.40) in thicknesses of
0.318 cm (0.125 inch) and greater. In the thinnest gage of 0.15 cm (0.060 inch)
elastic failure was produced only with the longest flaw (a/2c = 0.10).
There are no systematic variations in failure behavior as affected by varying
thickness. Additionally, dimpling was observed in all thicknesses tested. In
this respect the titanium behavior is similar to that of the 2219 data.
There does appear to be a distinct effect attributable to flaw shape; specimens
with flaw aspect ratio of 0.40 fall below the nominal KIE band; specimens with
shape of 0.25 fall near or slightly below nominal; and the longest flaws fall
at or slightly above. This is best illustrated by comparison of the 0.53 cm
(0.21 inch) data of Figure 23. This is believed to be caused by unusual
directionality of fracture resistance of the plates tested and is discussed
in more detail in Section 4.2.2.
Study of the titanium specimens which leaked before breaking indicates that if
the initial ligament dimension is less than about 0.051 cm (0.020 inch) then such
behavior is highly probable. A few specimens with ligaments of up to 0.102 cm
(0.040 inch) also leaked before failing. There ,were a total of nine specimens
which leaked and then failed at less than 90 percent of yield strength, and
they represented all flaw shapes tested and all but the thickest of the gages
tested. As with the aluminum tests, KCN values were calculated for these nine
soecimens using initial flaw length (2c) and failure stress. The average of
the calculated KCN values was 101.2 MN/m 3/ 2 (92.1 ksivT-n) with a standard
deviation of 8.1 MN/m3/2 (7.4 ksiv7 i). These values are well within the range
of toughness values developed for similarly processed material tested in SST
research(l0).
19
4.2.2 Comparison of Magnification Factors
In the preceding discussion, the surface flaw failure locii of specimens of
various alloys, thicknesses, flaw shapes and flaw depth-to-thickness ratios
were compared with the experimentally determined back surface magnification
factor of Reference 4. Since the development of the Reference 4 data,
considerable effort has been directed toward the derivation of analytical(11-14)solutions for the deep surface flaw. Two of these solutions, that of
Shah and Kobayashi (12) and that of Smith(l1), are compared with available
experimental data in the following paragraphs.
2219-T87 Aluminum
A comparison of the 2219-T87 Aluminum experimental data obtained in this program
with available solutions is shown in Figure 25. The data points included in
Figure 25 consist only of those specimens which failed prior to leakage at net
section stress levels less than 90 percent of yield strength. The curves are
plotted in terms of calculated KIE versus flaw depth-to-thickness ratio (a/t).
Figure 25(a) is a plot of data calculated by equation 1 (Reference 3) and is
included to graphically display the magnitude of the back surface effect. The
family of curves included represent predicted trends of the Figure 3 solution
(i.e., the expected reduction in apparent toughness with increasing a/t if
magnification is ignored).
Figures 25 (b), (c) and (d) show results using magnification terms of Masters (4 )Kobayashi(l2) (11)
Shah and Kobaashi 1 2 ) , and Smith ( . The solutions for the latter two curves
are valid for a Poisson's ratio of 0.30. The Smith data points are calculated
for matching flaw depth and length for an equivalent ellipse (Smith's solution
is based on a part circular crack). Additionally, Smith's analysis is limited
to moderate to high aspect ratios, so data is included only for a/2c ratios of
0.25 and 0.40.
Results of these analyses are shown in terms of the average calculated KIE value
and the standard deviation (S.D.) for the set of data. For example, the
experimentally defined solution from Reference (4) results in an average KIE
20
of 57.2 MN/r 3 ' (52.1 ksi/Yn) with a S.D. of 3.9 MN/m 3/2 (3.6 ksiv . (Note
that this average value is slightly higher than that which was visually
established in the previous section.) Shah's analysis yields an average KIE
of 50.8 MN/m 3/2 (46.3 ksiv-n) and a S.D. of 4.0 MN/m3/2 (3.7 ksivlin) while
Smith's average for the fewer data points is 59.6 MN/m3/2 (54.2 ksivi'n) with a
S.D. of 4.4 MN/m 3/2 (4.0 ksivT~-).
Data from Reference 4 is illustrated in Figures 26, 27 and 28. This data is
for 1.58 cm (0.625 inch) 2219-T87 aluminum tested in the RT direction at room
temperature 780K (-3200 F) and 200K (-4230 F). Trends of this data are similar
to that of Figure 25. That is the average KIE value calculated from Reference
4 is consistently higher than from the Reference 12 solution, and is either
comparable or slightly lower than that calculated from the Reference 11 solu-
tion. Calculated S.D.'s are comparable except that those from Reference 11
probably would have been higher had the same number of data points been assessed.
Again, observation of all data of Figures 25 thru 28 does not reveal any
consistent trends of errors in the handling of the various thickness and flaw
shape variables tested.
7075-T651 Aluminum
Data for the 7075-T651 aluminum were analyzed in a similar manner and are shown
in Figure 29. A comparison of the three deep flaw solutions again shows the
KIE average from Reference 4 higher than that of Reference 12 and close to that
of Reference 11. Scatter in the latter values is the highest with a trend of
over correcting the deeper flaws in evidence.
As noted in Section 4.2.1, there was a discrepancy between the two thinner gage
data as compared to that of the two thicker gages. This is also shown in all
plots of Figure 29; the four data points for the 0.38 cm (0.15 inch) and the
0.51 cm (0.20 inch) test are consistently and significantly above those of the
thicker specimens. As seen in Figure 29(b), the average KIE value for all data
is 40.3 MN/m 3/2 (36.7 ksiv-nT). The average for the thin specimens is
46.0 MN/m 3/2 (41.9 ksivTn) and the average for the thick specimens is
38.3 MN/m 3/ 2 (34.9 ksivl-n).
21
6AI-4V STA Titanium
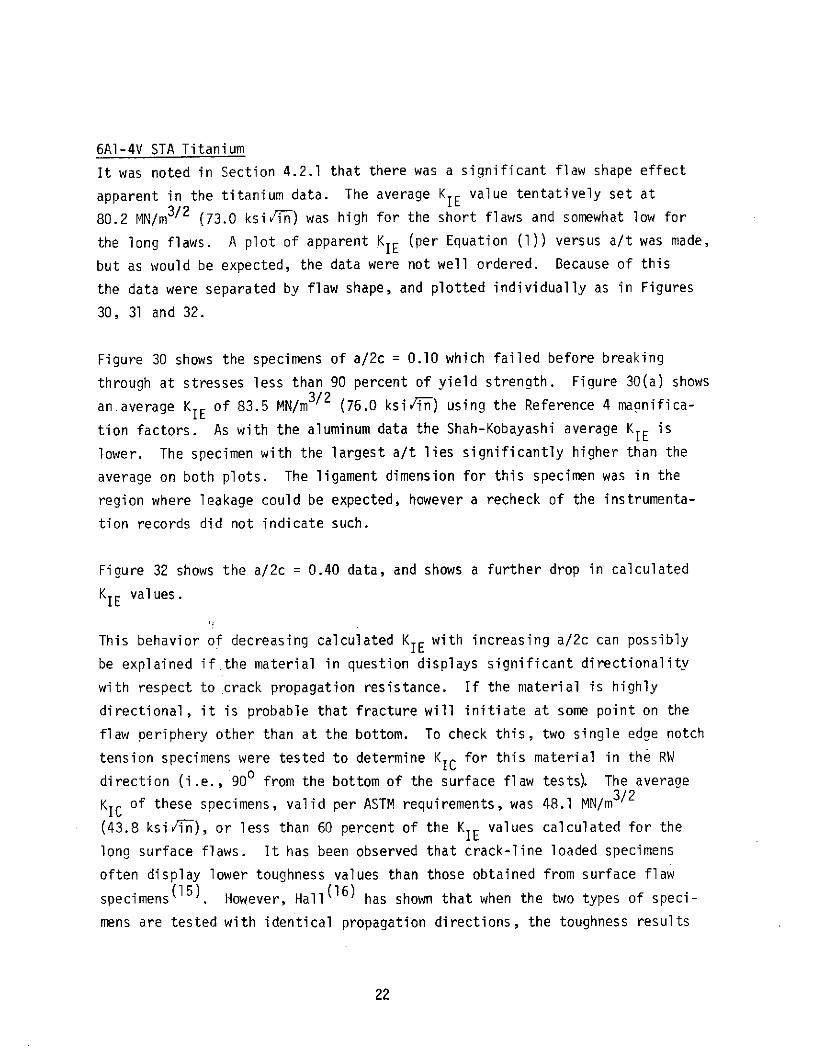
It was noted in Section 4.2.1 that there was a significant flaw shape effect
apparent in the titanium data. The average KIE value tentatively set at
80.2 MN/m 3/2 (73.0 ksiiTn) was high for the short flaws and somewhat low for
the long flaws. A plot of apparent KIE (per Equation (1)) versus a/t was made,
but as would be expected, the data were not well ordered. Because of this
the data were separated by flaw shape, and plotted individually as in Figures
30, 31 and 32.
Figure 30 shows the specimens of a/2c = 0.10 which failed before breaking
through at stresses less than 90 percent of yield strength. Figure 30(a) shows
an average KIE of 83.5 MN/m 3 / 2 (76.0 ksi/1n) using the Reference 4 magnifica-
tion factors. As with the aluminum data the Shah-Kobayashi average KIE is
lower. The specimen with the largest a/t lies significantly higher than the
average on both plots. The ligament dimension for this specimen was in the
region where leakage could be expected, however a recheck of the instrumenta-
tion records did not indicate such.
Figure 32 shows the a/2c = 0.40 data, and shows a further drop in calculated
KIE values.
This behavior of decreasing calculated KIE with increasing a/2c can possibly
be explained if.the material in question displays significant directionality
with respect to crack propagation resistance. If the material is highly
directional, it is probable that fracture will initiate at some point on the
flaw periphery other than at the bottom. To check this, two single edge notch
tension specimens were tested to determine KIC for this material in the RW
direction (i.e., 900 from the bottom of the surface flaw tests). The average
KIC of these specimens, valid per ASTM requirements, was 48.1 MN/m 3/2
(43.8 ksiiin), or less than 60 percent of the KIE values calculated for the
long surface flaws. It has been observed that crack-line loaded specimens
often display lower toughness values than those obtained from surface flaw
specimens 15 ) . However, Hall (16) has shown that when the two types of speci-
mens are tested with identical propagation directions, the toughness results
22
usually compare quite favorably. Hall's conclusions were based on tests of
aluminum and titanium at ambient and cryogenic tempoeratures. Therefore,
it is believed that a large part of the difference between the two directions
is truly an indication of directionality and not a specimen configuration
effect.
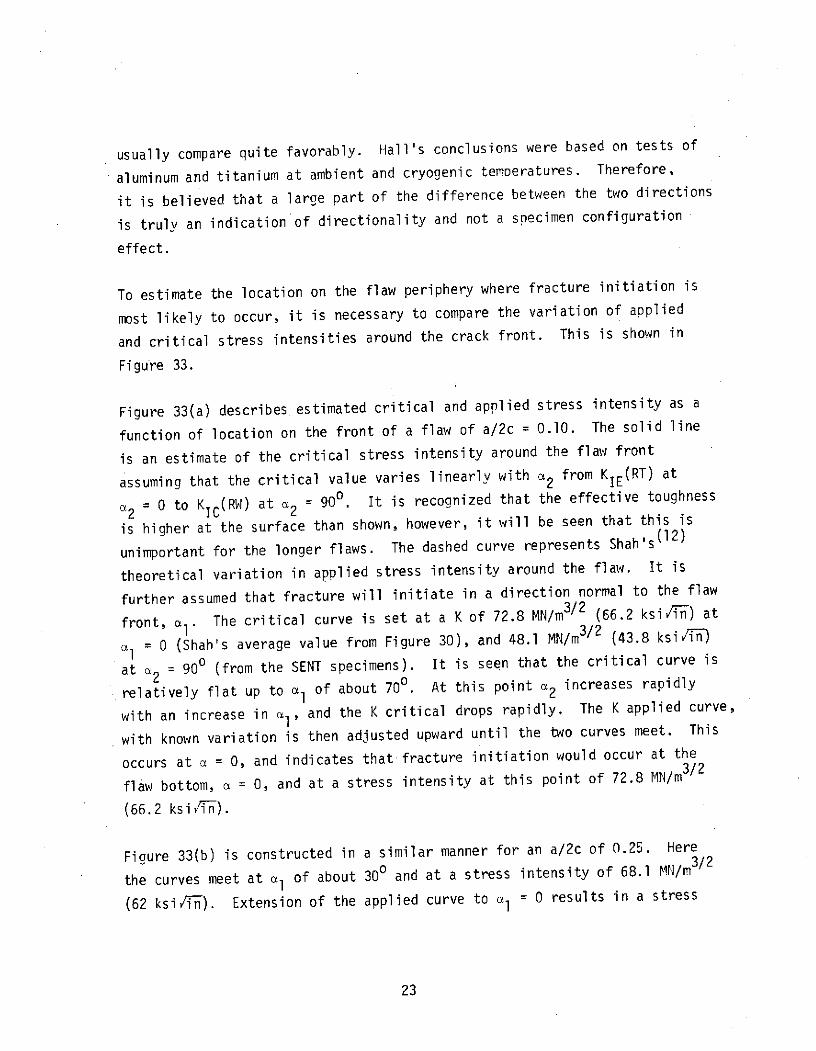
To estimate the location on the flaw periphery where fracture initiation is
most likely to occur, it is necessary to compare the variation of applied
and critical stress intensities around the crack front. This is shown in
Figure 33.
Figure 33(a) describes estimated critical and applied stress intensity as a
function of location on the front of a flaw of a/2c = 0.10. The solid line
is an estimate of the critical stress intensity around the flaw front
assuming that the critical value varies linearly with a2 from KIE(RT) at
a2 = 0 to KIC(RW) at a2 = 90 . It is recognized that the effective toughness
is higher at the surface than shown, however, it will be seen that this is
unimportant for the longer flaws. The dashed curve represents Shah's(12)
theoretical variation in applied stress intensity around the flaw. It is
further assumed that fracture will initiate in a direction normal to the flaw
front, al The critical curve is set at a K of 72.8 MN/m3/2 (66.2 ksiv-n-) at
al = 0 (Shah's average value from Figure 30), and 48.1 MN/m 3/2 (43.8 ksi/Vfn
at a2 = 900 (from the SENT specimens). It is seen that the critical curve is
relatively flat up to al of about 700. At this point a2 increases rapidly
with an increase in al, and the K critical drops rapidly. The K applied curve,
with known variation is then adjusted upward until the two curves meet. This
occurs at a = 0, and indicates that fracture initiation would occur at the
flaw bottom, a = 0, and at a stress intensity at this point of 72.8 MN/m3/2
(66.2 ksiviTn).
Figure 33(b) is constructed in a similar manner for an a/2c of 0.25. Here
the curves meet at a1 of about 300 and at a stress intensity of 68.1 MN/m 3 / 2
(62 ksi lTn). Extension of the applied curve to al = 0 results in a stress
23

intensity of about 69.2 MN/m 3/ 2 (63 ksivT-). This latter value compares well
with Shah's average value for this flaw shape in Figure 31.
Figure 33(c) describes conditions for an a/2c of 0.40. The curve ABD
represents critical stress intensity without relief of the front face
plasticity. It is estimated that this plastic zone depth is approximately(17) 1 K 2
0.13 cm (0.050 inch) using the expression of Rice 17 ) of P = _ ( Ks) and a
nominal K of 66.0 MN/m3 / 2 (60 ksiv -n). This zone would extend from l of
about 500 to the front surface. Thus the actual fracture resistance would
increase through this range. Curve ABC is a rough estimate of the upper limit
of K critical. It is now seen that the K applied curve would intersect the K
critical curve at point D. Shah's calculated average K1 is 64.8 MN/m 3/ 2
(59 ksiv'iTn) in Figure 32. If the applied curve is set at this value at = 0
the curve intersects the resistance curve at point B. Thus, while there are
obviously errors in the values of assumed plastic zone size and the actual
shape of the resistance curve in this area, it does appear plausible that
fracture of short deep flaws would initiate at a1 between 45 and 550
(a2 = 320 to 410). Fracture would initiate at this point at a stress intensity
of about 61.5 MN/m 3/ 2 (56.0 ksiv/TP) but the applied stress intensity calculated
at the flaw bottom should be as shown in Figure 31(c).
Notwithstanding the above noted flaw shape considerations, the plots of Figures
30 through 32 may be used to compare the various magnification values. As
noted, the results are in line with that of the aluminum data. That is, the
calculated KIE values from Shah's solution are consistently the lowest, and
the other two solutions are comparable. Scatter aopears to be similar for all
solutions.
4.2.3 Back Surface Dimpling
Recent studies of back surface dimpling have made use of interferometric
techniques to study the surface displacements caused by the formation of
plastic zones(18, 19) Such techniques were not feasible on this program
because instrumentation used to detect flaw break through made the rear surface
inaccessible for direct observation. For this reason, strain gages were
affixed to the rear surface to detect plastic zone penetration. Appendix
A describes gage locations and includes example data.
24
For these tests it was assumed that dimpling had occurred when the maximum
strain on the back surface was equal to the yield strain of the material
defined by the 0.20 percent offset. The gross section stress at which this
strain was reached is noted as the dimpling stress for each specimen in
Tables 7 thru 15. It is recognized that this definition of dimpling threshold
is somewhat arbitrary, however it does represent a procedure which is fairly
reproducible in view of the fact that we are considering lateral deformations
in the realm of a few hundred microinches.
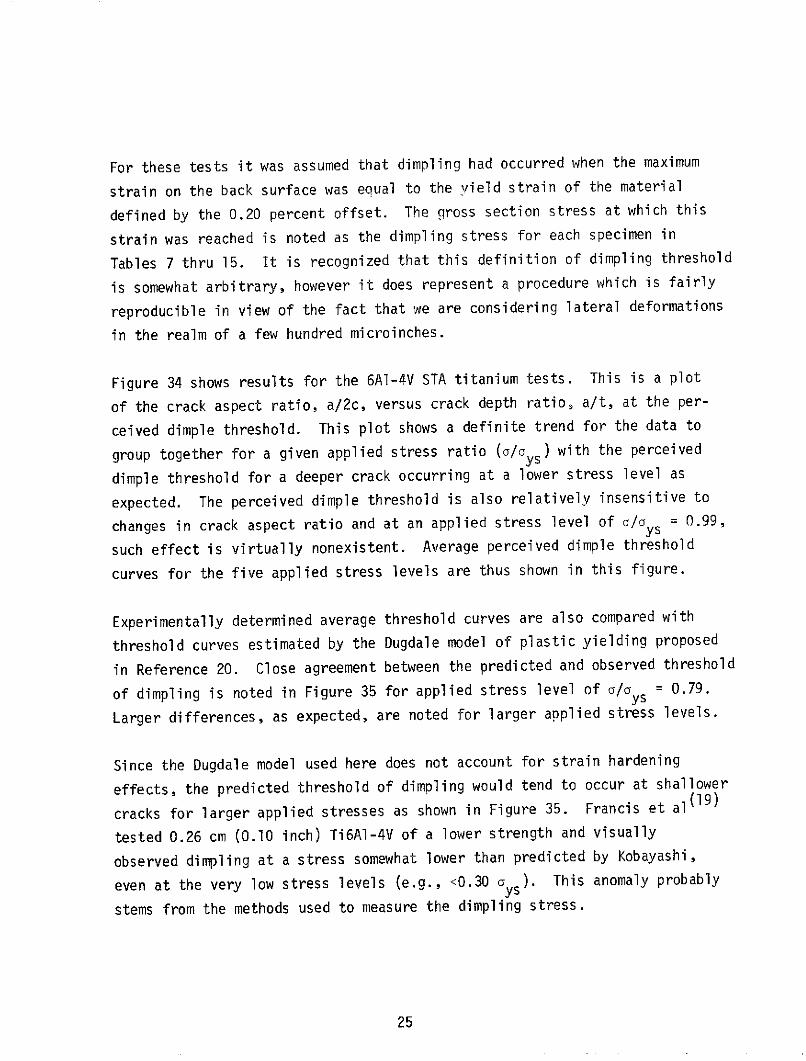
Figure 34 shows results for the 6Al-4V STA titanium tests. This is a plot
of the crack aspect ratio, a/2c, versus crack depth ratio, a/t, at the per-
ceived dimple threshold. This plot shows a definite trend for the data to
group together for a given applied stress ratio (a/a ys ) with the perceived
dimple threshold for a deeper crack occurring at a lower stress level as
expected. The perceived dimple threshold is also relatively insensitive to
changes in crack aspect ratio and at an applied stress level of a/ays = 0.99,
such effect is virtually nonexistent. Average perceived dimple threshold
curves for the five applied stress levels are thus shown in this figure.
Experimentally determined average threshold curves are also compared with
threshold curves estimated by the Dugdale model of plastic yielding proposed
in Reference 20. Close agreement between the predicted and observed threshold
of dimpling is noted in Figure 35 for applied stress level of clay s = 0.79.
Larger differences, as expected, are noted for larger applied stress levels.
Since the Dugdale model used here does not account for strain hardening
effects, the predicted threshold of dimpling would tend to occur at shallower
cracks for larger applied stresses as shown in Figure 35. Francis et al(19)
tested 0.26 cm (0.10 inch) Ti6Al-4V of a lower strength and visually
observed dimpling at a stress somewhat lower than predicted by Kobayashi,
even at the very low stress levels (e.g., <0.30 ays). This anomaly probably
stems from the methods used to measure the dimpling stress.
25
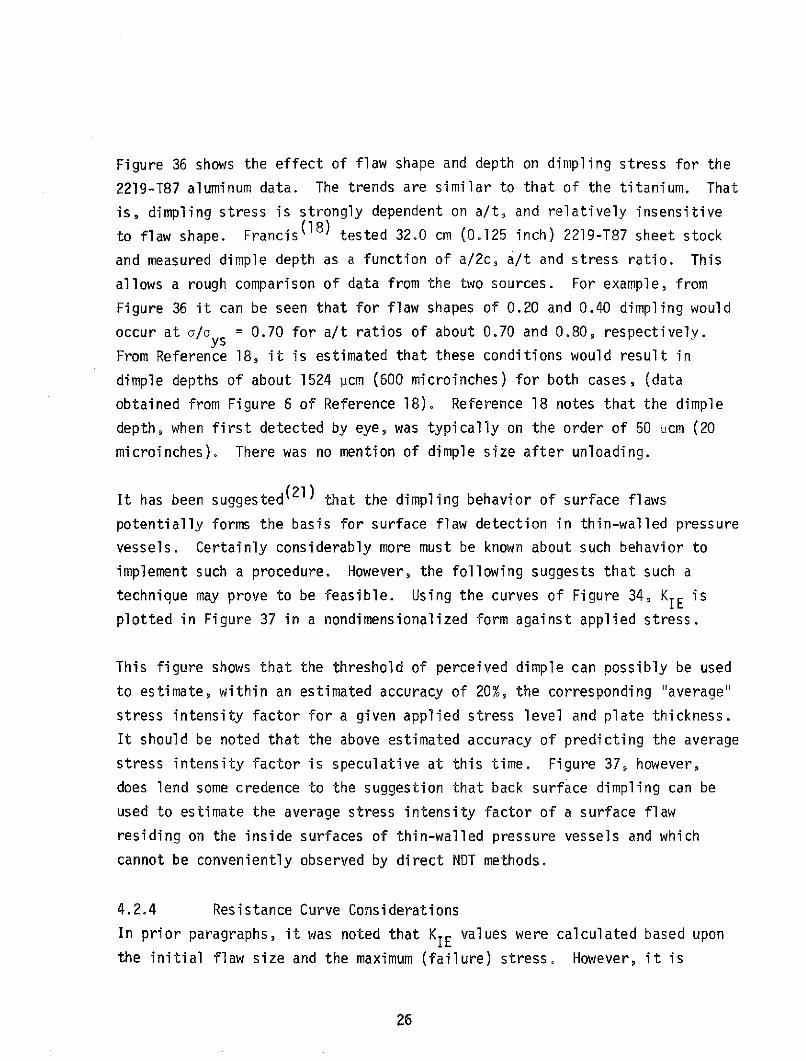
Figure 36 shows the effect of flaw shape and depth on dimpling stress for the
2219-T87 aluminum data. The trends are similar to that of the titanium. That
is, dimpling stress is strongly dependent on a/t, and relatively insensitive
to flaw shape. Francis (18 ) tested 32.0 cm (0.125 inch) 2219-T87 sheet stock
and measured dimple depth as a function of a/2c, a/t and stress ratio. This
allows a rough comparison of data from the two sources. For example, from
Figure 36 it can be seen that for flaw shapes of 0.20 and 0.40 dimpling would
occur at a/oy s = 0.70 for a/t ratios of about 0.70 and 0.80, respectively.
From Reference 18, it is estimated that these conditions would result in
dimple depths of about 1524 pcm (600 microinches) for both cases, (data
obtained from Figure 6 of Reference 18). Reference 18 notes that the dimple
depth, when first detected by eye, was typically on the order of 50 1cm (20
microinches). There was no mention of dimple size after unloading.
It has been suggested(21 ) that the dimpling behavior of surface flaws
potentially forms the basis for surface flaw detection in thin-walled pressure
vessels. Certainly considerably more must be known about such behavior to
implement such a procedure. However, the following suggests that such a
technique may prove to be feasible. Using the curves of Figure 34, KIE is
plotted in Figure 37 in a nondimensionalized form against applied stress.
This figure shows that the threshold of perceived dimple can possibly be used
to estimate, within an estimated accuracy of 20%, the corresponding "average"
stress intensity factor for a given applied stress level and plate thickness.
It should be noted that the above estimated accuracy of predicting the average
stress intensity factor is speculative at this time. Figure 37, however,
does lend some credence to the suggestion that back surface dimpling can be
used to estimate the average stress intensity factor of a surface flaw
residing on the inside surfaces of thin-walled pressure vessels and which
cannot be conveniently observed by direct NDT methods.
4.2.4 Resistance Curve Considerations
In prior paragraphs, it was noted that KIE values were calculated based upon
the initial flaw size and the maximum (failure) stress. However, it is
26

known that some amount of flaw extension precedes instability in most
engineering materials. The actual critical stress intensity may differ from
that calculated depending upon the amount and nature of the flaw extension
occurring during the rising load. Insight into this behavior can be gained
by comparing crack extension driving- and resistance-curves. This concept,
developed by Irwin, has normally been applied to specimen types other than(22, 23, 24 and 25)the surface flaw specimen
The resistance, or R curve, is a plot of crack growth resistance KR as a
function of crack extension in the material as the crack is driven under a
continuously increasing stress intensity factor, as shown in Figure 38. Thus,
R curves characterize the resistance to fracture of (tough) materials during
incremental slow crack growth extension. For through cracked specimens R
curves are dependent on material thickness and are normally assumed to be
independent of specimen initial crack length, ai , and specimen configuration.
R curves can be used to determine the load necessary to cause unstable crack
propagation for a specimen containing a given initial crack size, ai, as shown
in Figure 38. A family of crack driving force curves for the specimen are
generated for initial crack length, a i , as shown in the figure and the unique
curve which is tangent to the R curve defines the load at which unstable
fracture will occur.
This program was not geared to obtain a comprehensive picture of flaw
extension characteristics at or near instability, however, some of the find-
ings obtained in overload/cyclic testing may prove useful in describing, at
least qualitatively, the instability conditions for a set of 2219-T87
aluminum tests. As discussed later in Section 4.3, overload/cyclic tests
were performed to determine the effect of a simulated proof test on subsequent
cyclic flaw growth rates. It is important to.note here only that the amount
of stable growth which occurred on the single overload cycle could be detected
on the fracture face of the specimen. The specimens selected are shown in
Tables 34 through 36 as called out in Section 4.3. The data are for 1.27 cm
(0.50 inch) thick 2217-T87 tested at 780K (-3200F) and are plotted in Figure
39 in terms of applied stress intensity versus growth increment. The initial
flaw shapes are noted by the various symbols, and the initial flaw depth is
27
noted in parentheses next to the points. While there is considerable scatter
in the data, it does appear that the amount of flaw extension can be described
by consideration of both the maximum applied stress intensity and the initial
flaw size. It is seen that there is a general trend, at a given stress
intensity, that the smallest flaws exhibit the greatest extension. This does
not appear to be unreasonable when it is recognized that for a fixed stress
intensity, the smaller flaws would have to be loaded to a higher stress level.
On the other hand, there is no strong indication of a flaw shape effect.
While considerably more data would be required to confidently describe these
interactions, the solid curves in Figure 39 were drawn to represent a best
estimate of the average subcritical growth behavior.
The above noted curves were then used to construct the crack extension
resistance curves shown in Figures 40 and 41. Figure 40 represents specimens
with a/2c of 0.40, comparable to those shown earlier in Figure 18a. The
two specimens shown represent the shallowest and the deepest flaws of speci-
mens which failed elastically. The two dotted curves represent resistance
curves for specimens AS54-4 and -8 which contained initial flaw depths of
0.71 cm (0.28 inch) and 1.09 cm (0.43 inch), respectively. The solid curves
represent driving conditions at constant stress. It is seen that the driving
and resistance curves become tangent at a stress intensity of 52.7 to 54.9
MN/m 3/2 (48 to 50 ksiViTn) after stable flaw extension on the order of about
0.08 cm (0.030 inches).
Figure 41 shows results of similar calculations for 1.27 cm (0.50 inch) thick
2219 specimens containing flaws with a/2c of 0.10. These specimens are
representative of those specimens which failed elastically (refer to Figure
18c) and contained initial flaw depths of 0.41 cm (0.16 inch) through 0.84 cm
(0.33 inch). Again it is seen that the points of tangency of the driving and
resistance curves occur at a relatively constant stress intensity level of
about 53.9 MN/m 3/2 (49.0 ksiiWn).
28
The above examples indicate that crack instability may occur at an applied
stress level somewhat less than the maximum stress attained during the
fracture test, and after some measurable crack extension. However, the KIEvalue calculated using maximum stress and initial flaw size in the cases
studied compares quite well with that obtained by resistance curve considera-
tions. There is not sufficient subcritical crack extension data available
to determine over what range of thickness/flaw geometries this correlation
would hold.
4.2.5 Static Test Summary
Some of the more important observations from the preceding discussion are
summarized in the following paragraphs.
(1) When plotted on a linear scale in terms of stress versus flaw size,
static test results generally fall into one of three different
regions as shown in Figure 42. The first region consists of the
range of flaw sizes from zero at ultimate strength to a point at
which a flaw causes failure at about 90 percent of typical yield
strength. Through this range the failure locus roughly follows
a straight line. With a further increase in flaw size, the failure
locus follows a path which can be described fairly well with the
use of back surface magnification factors of References 4, 11 and
12. With a further increase in flaw size, the third region
develops in which the flaw grows through the thickness prior to
specimen failure. Failure strength in this region can be predicted
by consideration of original flaw length and the applicable through-
crack toughness of the material, KCN. Departure from region II to
region III appears to be a function of the initial ligament
dimensions (t - ai ) and relative toughness of the material
KIE 2) . This is shown in Figure 43 which summarizes behavior
ysof all the static test results. Data is grouped by alloy, flaw
shape, and thicknesses tested. The window in each bar defines the
point where failure mode changes from "fracture" to "leakage-
before-fracture." It appears for each material and flaw shape,
29
that a ligament of 0.10 (KIE/oys)2 falls quite close to the
window. Additionally, for a thickness as small as approximately
0.25 (KE/oys )2 failure can result (prior to leakage) at stresses
below the yield strength.
(2) Within these overall general trends several unique characteristics
peculiar to each of the alloys tested (or at least peculiar to the
relative thickness of the alloys tested) were observed:
(a) Back surface dimpling was detected on the majority of the
2219-T87 aluminum specimens which fell into Region II. There
were no systematic variations in calculated KIE values as
specimen thickness or flaw shape was varied.
(b) Back surface dimpling was detected on the majority of the
6Al-4V STA titanium specimens which fell into Region II.
There were no systematic variations in calculated KIE values
as specimen thickness was varied. Calculated KIE values
(i.e., calculated stress intensity at the bottom of the flaw)
decreased with increasing a/2c ratios.
(c) For the 7075-T651 aluminum tests, back surface dimpling was
observed on the two thinner gages, but was not observed on the
two thicker gages. Calculated average KIE values for the
thinner gages were about 18% higher than those for the thicker
gages.
(3) Based on COD traces and limited evidence from overload/cyclic tests
(Reference Section 4.3) it is believed that varying degrees of flaw
extension occurred prior to failure of all specimens with the
possible exception of some of the thicker 7075 specimens. Based
upon a study of crack driving and resistance curves and very
limited crack extension data, it appears that the practice of
using initial flaw size and maximum stress for KIE calculations
may not result in large errors. Certainly additional data are
necessary in this area.
30
From these observations and related data, four major conclusions are offered.
(1) When the yield zone penetrates the thickness relatively constant
KIE values are obtained over a wide range of thicknesses and
flaw dimensions. Calculated KIE values for thicker specimens
(where the yield zone does not reach the back surface) may be
lower than those obtained from the thinner gages. This was observed
in the 7075 data. Considerably thicker gages would be required
in 2219-T87 aluminum and the 6Al-4V titanium to test this con-
clusion (i.e., over 5.0 cm (2.0 inch) and 1.2 cm (0.50 inch),
respectively).
(2) For materials which are not highly directional with regard to crack
propagation resistance, relatively constant KIE values result over
a wide range of flaw shapes. This implies that the surface flaw
specimen measures the material toughness in the direction of the
flaw minor axis, and that the flaw shape factor, 4 , adequately
describes the flaw geometry variable.
(3) For materials in which the toughness in the edgewise direction
(RW) is significantly lower than in the thickness direction (RT)
fracture may not initiate in the depth direction for high a/2c
geometries. Calculated KIE values, assuming fracture initiates at
the bottom of the flaw, would decrease with increasing a/2c ratio.
It is estimated that the actual toughness in the RW direction
would have to be less than 70 percent of that in the RT direction
before this behavior would result.
(4) As qualified by the above, failure before leakage can be
described by available stress intensity solutions for stress
levels below about 90 percent of yield up to the point where theKIE 2
initial remaining flaw ligament is less than about 0.10 ( ) 2ys
Through this range, use of either of the available magnification
31
terms (e.g., References 4, 11, 12) would appear to be acceptable
as long as consistency is maintained from data generation to
application. Beyond this point, leakage prior to fracture will
result, and fracture strength is dependent upon crack length and
the KCN value of the material and thickness in ouestion.
4.3 Cyclic Tests
The effects of stress level, flaw shape, proof overload cycle, environment and
test frequency on the cyclic flaw growth rates of various thicknesses of
2219-T87 aluminum and 6Al-4V STA titanium were investigated and are presented
in this section. Stress intensity values were calculated using Equation 1 with
a deep flaw magnification factor as defined in Figure 3.
4.3.1 Baseline da/dN Data
Baseline cyclic flaw growth rate data, da/dN, were generated for 2219-T87
aluminum (WT direction) in liquid nitrogen at 78K (-320F), 6Al-4V STA titanium
(RT direction) in air at room temperature and 6Al-4V STA titanium (WT direction)
in argon at room temperature. These baseline data were developed at a a min/ max
(R ratio) of zero.
2219-T87 Aluminum (WT direction)
Three different thicknesses of 2219-T87 aluminum were cyclic tested in liquid
nitrogen with a sinusoidal profile at a frequency of 0.33 Hz (20 cpm). The
thicknesses involved were 1.27 cm (0.50 inch), 0.51 cm (0.20 inch), and 0.38 cm
(0.15 inch). Material thicknesses of 1.27 cm (0.50 inch) and 0.38 cm (0.15
inch) were tested at moderate stress and high stress levels while a material
thickness of 0.51 cm (0.20 inch) was tested only at the high stress level. The
moderate and high stress levels were set at 0.67 ays and 0.91 ays , respectively.
The specimen and test details for these tests are presented in Tables 16 through
25.
32

The baseline da/dN data developed for the 1.27 cm (0.50 inch) thick material
are shown in Figures 44 through 47. The crack growth rate data generated at a
moderate cyclic stress level for specimens with initial flaw shapes, (a/2c)i,of 0.37 and 0.30, are shown in Figures 44 and 45, respectively while Figures
46 and 47 present the crack growth rate data developed at a high stress level
for specimens with initial flaw shapes of 0.41 and 0.11, respectively. The
data scatter bands are established on these plots.
It should be pointed out that not all the fatigue crack growth rate data
generated at a high cyclic stress level were included in establishing the
data scatter bands. The solid symbols presented in Figures 46 and 47 represent
growth rates calculated prior to flaw dimpling. At dimpling, the specimen was
slightly marked so that the flaw size at that instant was clearly defined. It
is believed that a large amount of flaw growth occurred during the first cycle,
based on subsequent visual or photographic observation of the specimen fracture
face. If growth-on-loading did occur during the first cycle and if this amount
of growth was included in the crack growth rate calculations, it would result
in faster apparent fatigue crack growth rates than would actually exist. For
this reason the solid symbols were not included in defining the data scatter
bands.
The baseline da/dN data developed using 0.51 cm (0.20 inch) thick specimens
with initial flaw shapes of 0.40 and 0.09 are shown in Figures 48 and 49.
These data were generated at a high cyclic stress level (o = 0.91 oys ).
The baseline da/dN data developed for the 0.38 cm (0.15 inch) thick materials
are shown in Figures 50 through 53. The crack growth rate data generated at a
moderate cyclic stress level for specimens with initial flaw shapes of 0.37
and 0.11, are shown in Figures 50 and 51, respectively while Figures 52 and 53
present the cyclic flaw growth rate data developed at a high stress level for
specimens with initial flaw shapes of 0.38 and 0.10, respectively.
33
A summary of all the baseline da/dN data presented in the preceding paragraphs
for 2219-T87 aluminum at 78K (-320F) is shown in Figure 54. The majority of
data fall within a relatively narrow scatter band considering the range of
material thicknesses, stress levels and flaw shapes presented. Only one set
of data fell outside the basic scatter band as shown in Figure 54. These
data were developed for the thinnest material tested, 0.38 cm (0.15 inch),
as well as at the highest stress level and longest initial flaw shape. A
previous investigation (Reference 4) demonstrated that thin sections of
2219-T87 aluminum (less than 0.25 cm (0.10 inch) thick) exhibited increasing
crack growth rates as the thickness decreased for a constant stress intensity.
The increased growth rate observed for the 0.38 cm (0.15 inch) material over
the 0.51 cm (0.20 inch) and 1.27 cm (0.50 inch) materials as tested herein
could be the start of the increased crack growth rate for thinner materials
tested in Reference 4.
A comparison was made between the baseline cyclic crack growth rate data devel-
oped in this program for 2219-T87 aluminum and data presented in Reference 25.
These data are directly comparable; the tests being conducted at the same
temperature, frequency, environment and flaw plane orientation. This
comparison is presented in Figure 55 and shows a very good correlation of the
two sets of data at both low cyclic stress (a = 0.46 a ) and high cyclico ,ys
stress (oo = 0.91 a ) levels.
6Al-4V STA Titanium (RT direction)
Three different thicknesses of 6AI-4V STA titanium (RT direction) were cyclic
tested in air with a sinusoidal profile at a frequency of 0.33 Hz (20 cpm).
Material thicknesses of 0.54 cm (0.21 inch), 0.31 cm (0.12 inch) and 0.16 cm
(0.063 inch) were tested at a moderate stress level of 0.77 ays. These data
were generated for initial flaw shapes of about 0.40 and 0.10. The specimen
and test details for these tests are presented in Tables 26 through 31. The
baseline da/dN data developed for the three thicknesses of material tested are
shown in Figures 56 through 61.
34

A summary of all the baseline da/dN data developed in this experimental
program for 6AI-4V STA titanium (RT direction) at 295K (72F) is included in
Figure 62. The data fall within a relatively narrow scatter band considering
the range of material thicknesses and flaw shapes tested.
A comparison was made between the baseline cyclic growth rate data developed
in this program for 6AI-4V STA titanium (RT direction and data presented in
Reference 25. These data are directly comparable; the tests being conducted
at the same temperature, frequency and flaw plane orientation. The environ-
ments were different between the two sets of data; being air for the results
presented herein and gaseous helium for the Reference 25 data. This difference
is not believed to influence the cyclic crack growth rate results. This
comparison is presented in Figure 63 and shows a good correlation of the two
sets of data.
6AI-4V STA Titanium (WT direction)
Two different thicknesses of 6AI-4V STA titanium (WT direction) were cyclic
tested in argon at a frequency of 0.17 Hz (10 cpm). The loading profile for
these tests was triangular. Material thicknesses of 0.31 cm (0.12 inch) and
0.16 cm (0.063 inch) were tested at a moderate stress level of 0.68 ays
These data were generated for initial flaw shapes of 0.37 and 0.40. The
specimen and test details for these tests are presented in Tables 32 and 33.
The baseline da/dN data developed are shown in Figures 64 and 65.
A summary of the data developed for the WT direction is shown in Figure 66
and compares the result with the RT direction results. The scatter band for
the WT direction result essentially falls within the scatter band for the
RT direction.
4.3.2 Proof Overload Effects on Baseline da/dN Data
The effect of a proof overload on the subsequent fatigue crack growth rates
was investigated for 2219-T87 aluminum (WT direction) in liquid nitrogen at
78K (-320F), 6AI-4V STA titanium (RT direction) in air at room temperature
35
and 6Al-4V STA titanium (WT direction) in argon at room temperature. For
these tests, the Proof overload was conducted in the same environment and at
the same temperature as the subsequent cyclic tests.
2219-T87 Aluminum
The effect of a cryogenic proof overload cycle on the fatigue crack growth
rates was investigated for 2219-T87 aluminum using material thicknesses of
1.27 cm (0.50 inch) and 0.38 cm (0.15 inch).
The specimens were cryogenically proof stressed from between 0.85 ays to
1.0 ys and then cycled in liquid nitrogen at stress levels used to develop
the baseline fatigue crack growth rate data (i.e., 0.67 0 and 0.91 0 ).ys ysThese tests were conducted at a frequency of 0.33 Hz (20 cpm).
The specimen and test details for these tests are presented in Table 34 through
40. For comparison purposes, all figures of cyclic flaw growth rate data
presented below show the corresponding baseline growth rate data developed at
the same cyclic stress level and initial flaw shape.
The da/dN data for 1.27 cm (0.50 inch) thick material tested after receiving
a proof overload cycle are shown in Figures 67 through 69. The growth rate
data generated at a moderate cyclic stress level (o = 0.67 ys ) for specimens
with initial flaw shapes of 0.39 and 0.28, are shown in Figures 67 and 68,
respectively. These results show that the fatigue crack growth rates are, in
general, significantly retarded initially after receiving the proof over-load cycle and then tend to converge with the scatter bands of the baseline
data as stress intensity increases. Specimens cycled at stress intensity
values approaching critical after receiving a proof overload cycle do not
show any retardation in crack growth rates. The crack growth rates at low stress
intensity values after receiving an overload cycle are, in general, about one-
fifth the non-overload rates. Figure 72 presents the crack growth rate data at
a high cyclic stress level after receiving a Proof overload cycle for specimens
with initial flaw shapes of 0.36 and 0.11. For initial flaw shapes of 0.36
there does not appear to be any detectable retardation in the crack growth rates
36
after receiving the proof overload cycle (based on a single test) whereas a sig-
nificant retardation in crack growth rate was apparent for the data generated
with an initial flaw shape of 0.11.
It was noted in Section 4.3.1 that growth rates for the 0.38 cm (0.15 inch)
thick specimens and the lowest flaw shape tended to be higher than those of
any of the other thicknesses and shapes tested. As shown in Figure 72, the
overload cycle appears to retard growth rates to values within the range
of the thicker specimen data. While only limited data were generated in this
area, it might be speculated that retardation may be more significant in
thinner gages and lower flaw shape ratios.
6Al-4V STA Titanium (RT direction)
The effect of an ambient proof overload cycle on the fatigue crack growth
rates was investigated for 6Al-4V STA titanium (RT direction) using material
thicknesses of 0.54 cm (0.21 inch) and 0.16 cm (0.063 inch). The specimens
were proof stressed to 0.89 oys and then cycled in air at 0.77 ays (the
stress level used to develop the baseline fatigue crack growth rate data).
These tests were conducted at a frequency of 0.33 Hz (20 cpm). The specimen
and test details for these tests are presented in Tables 41 through 44.
The da/dN data for 0.54 cm (0.21 inch) thick material tested after receiving
a proof overload cycle are shown in Figures 73 and 74. All figures of crack
growth rate data presented show the corresponding baseline growth rate data
developed at the same cyclic stress level and initial flaw shape. These data
were developed for initial flaw shapes of 0.37 and 0.10. From the data presented
in these two figures it appears that the crack growth rates are only very slightly
retarded, if at all, after receiving a proof overload cycle. Figures 75 and
76 present the da/dN data for 0.16 cm (0.063 inch) thick specimens with
initial flaw shapes of 0.33 and 0.09, respectively. The data shown in
Figure 75 (high a/2c) demonstrates a significant initial retardation with a
slight retardation effect over the remaining stress intensity range tested.
The results obtained at the low initial flaw shape (Figure 76) generally
falls within the scatter band of the baseline data with a slight retardation
initially.
37
6AI-4V STA Titanium (WT direction)
The effect of an ambient proof overload cycle on the fatigue crack growth rates
was investigated for 6AI-4V STA titanium (WT direction) using material thick-nesses of 0.31 cm (0.12 inch) and 0.16 cm (0.063 inch). These specimens were
proof tested to 0.91 ayS and then cycled in argon at 0.68 ays (the stresslevel used to develop the baseline fatigue crack growth rate data). The tests
were conducted at a frequency of 0.17 hz (10 cpm) with a triangular loading
profile. The specimen and test details for these tests are presented inTables 45 and 46.
Figure 77 presents the da/dN data for the 0.31 cm (0.12 inch) thick materialtested after receiving a proof overload cycle. All figures of crack growthrate data presented show the corresponding baseline crack growth rate data
developed at the same cyclic stress level and initial flaw shape. These data
were developed for an initial flaw shape of 0.38. Figure 78 shows the crackgrowth rate data for the 0.16 cm (0.063 inch) material tested with an initialflaw shape of 0.10. Both figures show a significant retardation of crackgrowth rate initially and then the rates approach the baseline scatter bandvalues. The thin material results show more retardation than the moderatelythick titanium.
4.3.3 Environmental Effects on Baseline da/dN Data
The effect of cyclic testing surface flawed 6Al-4V STA titanium (WT direction)specimens in a solution of 3.5% NaCl was investigated. These tests wereconducted at 295K (72F) and at a test frequency of 0.17 Hz (10 cpm). Theloading profile for these tests was triangular. Material thicknesses of0.31 cm (0.12 inch) and 0.16 cm (0.063 inch) were tested at a moderate
stress level of 0.68 ays. The specimen and test details for these tests arepresented in Tables 32 and 33.
Figures 79 and 80 present the da/dN developed for the thicknesses of material
tested in environments of argon and salt water and are compared with baseline
data of Figures 64 and 65. These data were generated for initial flaw shapes
38

of 0.37 and 0.10. The data developed in salt-water show almost an order-of-
magnitude increase in the crack growth rates at a given stress intensity com-
pared to those developed in argon.
4.3.4 Environmental/Proof Overload Effects on da/dN Data
The effect of a proof overload on the subsequent fatigue crack growth rates
was investigated using surface flawed 6Al-4V STA titanium (WT direction)
specimens in a 3.5% NaCl solution. These tests were conducted at room
temperature at a frequency of 0.17 Hz (10 cpm) with a triangular loading
profile. Material thicknesses of 0.31 cm (0.12 inch) and 0.16 cm (0.063 inch)
were tested at a moderate stress level of 0.68 ays after receivinG an ambient
proof test in air. The specimen and test details for these tests are presented
in Tables 47 and 48.
Figure 81 presents the da/dN data for the 0.31 cm (0.12 inch) thick material
tested after receiving a proof overload cycle. The figures of crack growth
rate data presented show the corresponding no-proof growth rate data developed
at the same cyclic stress level, initial flaw shape and in the same environment.
These data were developed for an initial flaw shape of 0.38. Figure 82 shows
the crack growth rate data for the 0.16 cm (0.063 inch) material tested with an
initial flaw shape of 0.10. The data shown in Figure 81 show a significant
initial retardation for some specimens compared to the no-proof data but then
the crack growth rates appear to accelerate (compared to the no-proof data) as
the critical stress intensity is approached. In addition, some specimens did
not exhibit the initial retardation at all. The data presented in Figure 82
show no retardation. It appears from this data that a proof overload cannot be
relied upon as an effective means of reducing subsequent crack growth in an
aggressive environment.
4.3.5 Frequency/Proof Overload Effects on da/dN Data
The effect of frequency on proof overloaded fatigue crack growth rates was
investigated using surface flawed 6Al-4V STA titanium (WT direction) specimens
39
tested in a 3.5% NaCl solution. These tests were conducted at room tempera-
ture at a frequency of 3,3 mHz (0.2 cpm) with a trapezoidal loading profile.
The rise and fall time for this profile was 3 seconds for each. Material
thicknesses of 0.31 cm (0.12 inch) and 0.16 cm (0.063 inch) were tested at a
moderate stress level of 0.68 oy s after receiving an ambient proof test inair at a stress of about 0.91 oys. The specimen and test details for these
tests are presented in Tables 49 and 50. Figures 83 and 84 present the da/dN
data developed for the thicknesses of material tested. The figures of crack
growth rate data presented show the corresponding proof overload crack growth
rate data developed at a frequency of 0.17 Hz (10 cpm), and at the same stress
level, initial flaw shape and environment. These crack growth rate data were
generated for initial flaw shapes of 0.38 and 0.10. From these figures there
does not appear to be any effect of decreasing the test frequency from 160 mHz
(10 cpm) to 3.3 mHz (0.2 cDm).
4.3.6 Cyclic Test Summary
A summary of the cyclic results are presented in this paragraph.
(1) Baseline surface flaw da/dN data (that developed with no proof
overloads in inert environments) for a variety of stress levels,
flaw shapes and material thicknesses can be adequately described
as a function of stress intensity for the materials tested herein.
Such plots are shown in Figure 85 for 2219-T87 aluminum and
6AI-4V STA titanium and the ranges of applicability are described
on this figure.
(2) The effect of a prior proof overload cycle on surface flaw fatigue
crack growth rates was investigated for a variety of materials,
cyclic stress levels, flaw shapes and material thicknesses. A
summary of the retardation effects observed are presented in
Tables 51 and 52 for 2219-T87 aluminum and 6AI-4V STA titanium.
In general, retardation can be expected initially after a proof
test if the cyclic stress is considerably below the proof stress;
40

say approximately 0.75 o . As the cyclic stress level approaches
the proof stress level t e retardation becomes negligible.
Generally, the thinner the material, the larger the amount of
retardation due to a proof overload cycle.
Retardation of subsequent da/dN rates due to a proof overload is a
phenomenon that generally occurs but cannot be relied unon in
every instance. Some identical test specimens exhibited no apparent
retardation while others showed significant retardation.
(3) The fatigue crack growth rates developed for 6Al-4V STA titanium
exposed to a 3.5% NaCl solution were almost an order of magnitude
greater than those rates developed in an inert argon environment.
(4) The fatigue crack growth rates developed for 6AI-4V STA titanium
exposed to a 3.5% NaCl solution after being subjected to a proof
overload cycle showed retardation effects ranging from significant
to nonexistent. In general, this retardation cannot be relied
upon to occur.
(5) The fatigue crack growth rates for 6Al-4V STA titanium exposed to a
3.5% NaCl solution after being subjected to a proof overload cycle
were not affected by cyclic frequency between 3.3 mHz (0.2 cpm) to160 mHz (10 cpm).
4.4 Sustained Load Results
The influence of a proof overload cycle on the subsequent sustained loadflaw growth characteristics was investigated using 6AI-4V STA titanium (WT
direction) exposed to a 3.5% NaCl solution. Three different thicknesses of
material were tested; 0.54 cm (0.21 inch), 0.31 cm (0.12 inch) and 0.16 cm
(0.063 inch). The specimens were, in general, sustain loaded at 0.68 0ys
Those specimens receiving a proof test were proofed to 0.91 a in air. The
specimen and test details for these tests are presented in Tables 53 through
55.
41
The results for all three thicknesses of material tested are presented in Figure
86. The data developed using the 0.54 cm (0.21 inch) thick material shows that
the threshold stress intensity, KTH, is considerably less than 45.5 M!/m 3 / 2
(41.3 ksivP-n) for specimens that were not proof tested. All tests conducted
with this thickness of material used specimens with initial flaw shapes of
0.37. These specimens all failed within one minute after being sustain loaded.
Applying a proof test prior to sustain loading specimens resulted in a sig-
nificant elevation of the threshold; 45.5 MlI/m 3 / 2 (41.3 ksil-n) < KTH < 53.0
MN/m 3 / 2 (48.2 ksi in). In addition to the tests discussed above, two specimens
were proof tested, then slightly marked (by low cycle fatigue for less than
0.010 cm (0.004 inch) and then sustain loaded. These tests demonstrated that
a small amount of flaw growth caused by cyclic operation could negate any
beneficial effect a proof test might have.
The data developed for the 0.31 cm (0.12 inch) thick material showed very
similar results as those developed for the 0.54 cm (0.21 inch) material. The
non-proof tested specimens indicated a threshold less than 39.2 MN/m 3/ 2
(35.6 ksi-n-) whereas the proof tested specimens did not show any flaw
grovth at a stress intensity level of 47.2 MN/m 3 / 2 (42.9 ksivl) when loaded
for 8 hours.
The results obtained for the 0.16 cm (0.063 inch) material differed greatly
from the thicker material results presented previously. Besides the difference
in thickness one other difference should be pointed out between the tests, and
that is, that the tests conducted with the 0.16 cm (0.063 inch) thick specimens
had initial flaw shapes of 0.09 whereas the tests using thicker gages were
conducted with specimens having initial flaw shapes of 0.37. As Figure 86
illustrates, the non-proof loaded/threshold is 47.3 MN/m 3/ 2 (43.0 ksivTin).
A single specimen was proof tested and then sustain loaded. This specimen
failed in the same amount of time as the non-proof specimens loaded to the
same stress intensity level thereby indicating no beneficial effect of a
proof test on KTH. The non-proof loaded/threshold appears higher for these
42

tests than those conducted for the tests utilizing thicker material. Again,
it must be emphasized that flaw shape differences existed as well as material
thicknesses and for this reason it cannot be ascertained whether or not a
thickness or flaw shape effect was observed.
From the results presented in Paragraph 4.4 it appears that a proof test is
beneficial (elevates KTH) for 6Al-4V STA titanium in thicknesses ranging from
0.31 cm (0.12 inch) to 0.54 cm (0.21 inch) containing flaws with shapes of
about 0.40 when sustain loaded in a salt-water environment. Such is not the
case for a material thickness of 0.16 cm (0.063 inch) with flaw shapes of
about 0.10; the threshold remains unchanged. It also appears from the tests
conducted that the beneficial effects of proof overload cycle could be
negated by a small amount of flaw growth caused by cyclic operation prior to
being sustain loaded.
43

44
PRECEDING PAGE BLANK NOT FILME
5.0 CONCLUSIONS
Major observations and conclusions were listed in detail in Sections 4.2.5
(static tests), 4.3.6 (cyclic tests), and 4.4 (sustained load tests) and
are summarized below.
Static Fracture Tests
(1) Any of the three available deep flaw solutions (4,11,12) can be used
to describe failing stress flaw size locii for a wide range of
thicknesses, flaw shapes and alloys under the following conditions:
a) for maximum failing stresses of 0.90 ays
b) for minimum thickness of about 0.25 ( KIE )2.ys KIE 2
c) for ligament size greater than about 0.10 ( KIE 2ys
d) for materials in which the fracture resistance in the edgewise
(2c) direction is greater than about 70 percent of that in the
depth (a) direction.
Under these conditions KIE values will vary, depending upon which
of the three solutions are used and thus the solutions should not be
mixed in analyzing and applying the fracture data.
(2) The thickness of the majority of the specimens tested in this programKIE2 KIE2
ranged from 0.25 ( a-) to about 1.50 ( )2 The plastic zone
penetrated the back surface on most of tAese specimens. Thru this
range, calculated KIE values did not vary with thickness. Two
sets of data were obtained on thicknesses of about 2.5 ( ) andnys
higher. In these cases back surface dimpling was not observed, and
calculated KIE values were somewhat lower than for the thinner gages.
45
Cyclic Tests
(1) Baseline cyclic deep flaw growth rate data can be adeouately described
as a function of applied KIE levels (using deep flaw magnification
factors) within the same limits set for static testing noted above.
(2) Growth rates are usually retarded after a proof overload for onerating
stresses less than about 0.75 op. The degree of retardation cenerallv
increases with decreasing thickness, however, the amount varied w ,idelyv
between presumably identical test conditions.
Sustained Load Tests
(1) A proof overload cycle will elevate the sustained load threshold (KTN)
in thick gage 6Al-4V titanium exposed to a salt water environment.
However, this beneficial effect can be negated by a small amount of cyclic
loading prior to the anplication of the sustained load.
46
APPENDIX A - STRAIN MEASUREMENTS
A considerable amount of rear surface strain data was developed during the
course of this prooram and some of this data is presented in this anoendix.
Figures A-1 through A-4 show how the rear surface strain varies as a function
of distance from the flaw plane, stress level and flaw depth for various thick-
nesses of 7075-T651 and 2219-T87 aluminum. These figures demonstrate that the
maximum strain can be expected at about 450 from the plane of the surface flaw.
These figures also show that the rear surface directly behind the flaw aoes
into compression depending upon the apolied stress level and flaw depth-to-
thickness ratio. Typical strain results for the two materials are shown in
Figures A-5 and A-6 as a function of flaw depth-to-thickness ratio for a con-
stant thickness, flaw shape and stress level. These figures illustrate that
significant localized bending exists directly behind the flaw and that this phen-
omena occurs up to the point where the plastic zone engulfs the remaining liga-
ment, at which point the remaining ligament is fully enveloped in a high tension
stress field.
The question of adeauate specimen width relative to the surface crack length
was also addressed during the course of this program. The results of these
tests are presented in Figure A-7 for 2219-T87 aluminum. These test results
show that the strains on the back surface reach the nominal P/A value at a
distance of about 2 - 2.5 times the crack length. The disturbed strain field
behind the flaw appears from these tests to be fairly localized in nature and,
therefore, specimen width-to-flaw length ratios greater than 5 appear more than
adeauate.
47

48
PRECEDING PAGE BLANK -NOT FILMED
APPENDIX B - CALCULATION OF CRACK GROWTH RATES FPnO
SURFACE FLAW OPENING MEASUREMENTS
The specimens in this program that were cyclic tested were instrumented with a
crack opening displacement (COD) measurement device as shown in Figure Bl so
that the crack depth as a function of the applied cycles could be determined
and consequently the crack growth rates calculated. The COD at the diametral
center of a comoletely embedded elliptical flaw under normal stress was first
related to the flaw size by Green and Sneddon (Reference 5) and is expressed
by the equation
COD =6 4(1 - P ) aa (B-l)
Although a rigorous solution is not available for flaw opening displacements
for a semi-elliptical surface flaw, such displacements would also be pronortional
to a and a/ for elastic materials. By following Inrin's orocedure (Reference
3) to account for the effect of plastic yielding, the flaw opening displacement
for a surface flaw can be approximated by
COD = 6 = C aa (B-2)
where C is a constant, dependent upon material properties.
Tests conducted in this program have shown that C tends to increase with increas-
ing crack size, rather than remain constant. Figures B-2 through B-5 show
the variation of C with flaw depth-to-thickness ratio for various flaw shapes.
These data were generated from static fracture tests of 2219-T87 and 7075-T651
aluminum using the general eauation:
da=6 ( a )dC+ Cod ( a ) + C ( a )d. (B-3)
The data presented in the figures were generated using a COD and corresponding
stress level taken from the linear portion of the load/COD curve and the initial
49

stress level taken from the linear portion of the load/COD curve and the initial
flaw dimension. It is assumed that the flaw size and the value of C remains
constant during the linear portion of the load/COD curve, in which case
equation (B-3) reduces to
d6 = C ( a ) do (B-4)
From the figures, it can be seen that the value of C does not vary for short
flaws, (a/2c) = 0.40, but varies significantly with a/t for long flaws,
(a/2c) = 0.10. In general, long flaws grow in depth significantly more than in
the length direction during a cyclic test and therefore the flaw shape increases
rapidly. Thus, the variation of C during a cyclic test of a soecimen containina
a long flaw would never be as severe as presented in Figure B-4. For short
flaws or tests where the flaw growth is small, using a constant value of C aoears
acceptable but to adequately define the flaw size as a function of the COD for
long flaws requires that the variation of C with flaw depth-to-thickness be
accounted for. Analyses were conducted in which the variation in C between
the initial and final flaw size values was assumed to be either linear or a
fourth order oolynominal and these results have shown that computed crack growth
rates are very insensitive to the manner in which C varies. Therefore, the
crack growth rate calculations in this report were based on an assumed linear
variation in C between the known initial and final flaw size values as
calculated below:
C. = T a )1 a i(B-5)
f -a )f
where the subscripts i and f refer to initial and final conditions, respectively.
50
In order to relate the flaw parameter (a/ v7n-) to COD for values of (a/v-- )
between the initial and final values an assumption must be made as to the
manner in which the flaw shape changes from test initiation to termination. It
was assumed that
a - a. 2c - (2c) i
af- a. (2c)f-(2c)i
i.e., both flaw depth and width growth simultaneously reach the same ner-
centage of their respective total growth from initial to final values. The
flaw shape parameter (0) can now be determined as a function of flaw depth
and, in turn, can be related to crack depth using Equation (B-2). The number
of cycles (N) corresponding to each selected flaw depth value can be determined
from the test record and, consequently, the change in N for each increment
of flaw depth is known. With knowledge of the flaw size, the stress intensity
can be determined for any point during the cyclic test. For specimens that were
proof tested prior to being cycled, the growth-on-loading due to the oroof
test was not included in the calculation of fatigue flaw growth rates. The
fracture face of these specimens clearly indicated the amount of growth-on-
loading that had taken place during the proof test. For the specimens that
were not proof tested, the fatigue crack growth rates were calculated as
outlined above based on the initial and final flaw dimensions. For detailed
fatigue growth rate calculations using the above procedure refer to Reference 25.
All stress intensity calculations incorporate the use of the deep flaw magnif-
ication factors from Reference 4.
51

52
PRECEDING PAGE BLANK NOT FILMED
REFERENCES
1. C. F. Tiffany, "Fracture Control of Metallic Pressure Vessels", NASASP 8040, 1970.
2. Current Efforts at Updating MIL-STD-1530 (USAF), Sent. 1972.
3. G. R. Irwin, "Crack Extension Force for a Part-Through Crack in a Plate,"Journal of Applied Mechanics, Vol. 29, Trans, ASME, Vol. 84, Series E,December 1962.
4. J. N. Masters, W. P. Haese and R. W. Finger, "Investigation of DeenFlaws in Thin Walled Tanks," NASA CR-72606, December 1969.
5. A. E. Green and I. N. Sneddon, "The Distribution of Stress in theNeighborhood of a Flat Eiliptical Crack in an Elastic Solid," Proc.Cambridge Phil. Soc., 46, 1959 (1950).
6. L. A. Wigglesworth, "Stress Distribution in a Notched Plate," Mathematica,Vol. 4, 1947.
7. "The Surface Crack: Physical Problems and Computational Solutions,"edited by J. L. Swedlow, ASME, November 1972.
8. A. E. Smith, "Missile Motor Cases," Metals Engineering Quarterly, Vol. 3No. 4, Nov. 1963.
9. Damage Tolerant Design Handbook, MCIC-HB-01, December 1972.
10. "Commercial Supersonic Transport Program" Phase 11-C Report - ContractFA-SS-77-5, prepared for Federal Aviation Agency, March 1966.
11. F. W. Smith, "Stress Intensity Factors for a Surface Flawed FractureSpecimen," Tech. Report No. 1, NASA Grant NGR-06-007-063, ColoradoState University, 1971.
12. R. C. Shah and A. S. Kobayashi, "On the Surface Flaw Problem," TheSurface Crack: Physical Problems and Computational Solutions, editedby J. L. Swedlow, ASME, November 1972.
13. J. R. Rice and N. Levy, "The Part-Through Surface Crack in an ElasticPlate," Journal of Applied Mechanics, Vol. 39, Trans. of ASME, Vol. 94,March 1972.
14. H. Miyamoto and T. Miyoski, "Analysis of Stress Intensity Factor forSurface-Flawed Tension Plate," High Speed Computing of Elastic Structure,Proc. of Symposium of UITAM, Univ. de Liege, 1971.
15. J. N. Masters and J. L. White, "Development of Fracture ToughnessProperties of D6-AC Steel of F-lll Applications," AFML-TR-70-310,January 1971.
53
REFERENCES (Cont'd)
16. L. R. Hall and R. W. Finger, "Investigation of Flaw Geometry and LoadingEffects on Plane Strain Fractures in Metallic Materials," NASA CR-726959,Dec. 1971.
17. J. R. Pice, "Mechanics of Crack Tip Deformation and Extension by Fatigue,"Fatigue Crack Propagation, ASTM STP 415, Am. Soc. Testing Mats., 1967.
18. P. H. Francis and D. L. Davidson, "Exoerimental Characterization of YieldInduced by Surface Flaws," The Surface Crack: Physical Problems andComputational Solutions, edited by J. L. Swedlow, ASME, November 1972.
19. P. H. Francis, D. L. Davidson and R. G. Forman, "An Exnerimental Invest-igation into the Mechanics of Deep Semielliptical Surface Cracks inMode I Loading," Engineering Fracture Mechanics, (to be oublished).
20. A. S. Kobayashi and W. L. Moss, "Stress Intensity Magnification Factorsto Surface-Flawed Tension Plate and Notched Round Tension Bar," FractureProc. 2nd International Conference on Fracture (Brighton), Chapman andKrell, London, 1969.
21. P. H. Francis, "Elasto-Plastic-Analysis of Mode I Edge Crack withApplication to a Surface Notch," International Journal of FractureMechanics, Vol. 7, No. 4, Dec. 1971.
22. G. R. Irwin, "Fracture Testing of High-Strength Sheet Materials UnderConditions Appropriate for Stress Analysis," Report 5486, U.S. NavyResearch Lab., July 27, 1960.
23. J. M. Krafft, A. M. Sullivan, and R. W. Boyle, "Effect of Dimensionson Test Fracture Instability of Matched Sheets," Proc. Crack PropagationSymposium, College of Aeronautics, Cranfield (Englan), Sept. 1961, Vol. I.
24. J. E. Srawley and W. F. Brown, "Fracture Toughness Testing Methods,"Fracture Toughness Testing and Its Application, ASTM Special TechnicalPublication No. 381, April 1965.
25. L. R. Hall and W. D. Bixler, "Subcritical Crack Growth of SelectedAerospace Pressure Vessel Materials," NASA CR-120834, December 1972.
54
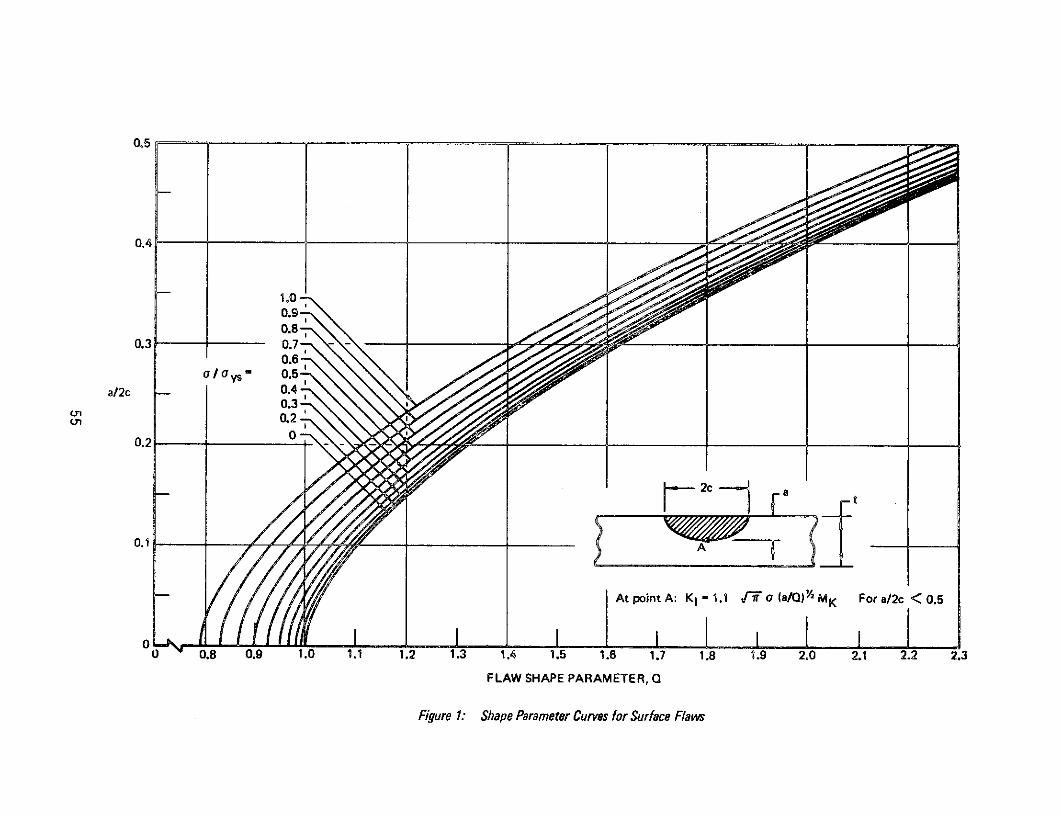
0.5
0.2
0.1.9
0.8-
At point A: KI = 1.1 1 o (a/Q) MK For a/2c < 0.5
0.3 0.8 0.9 1.0 1.1 1.2 1.3 14 1.5 1.6 1.7 1.8 1.9 2.0 2.1 2.2 2
1 1
FLAW SHAPE PARAMETER, 0
Figure 1: Shape Parameter Curves for Surface FlawsFigure 1: Shape Parameter Curves for Surface Flaw
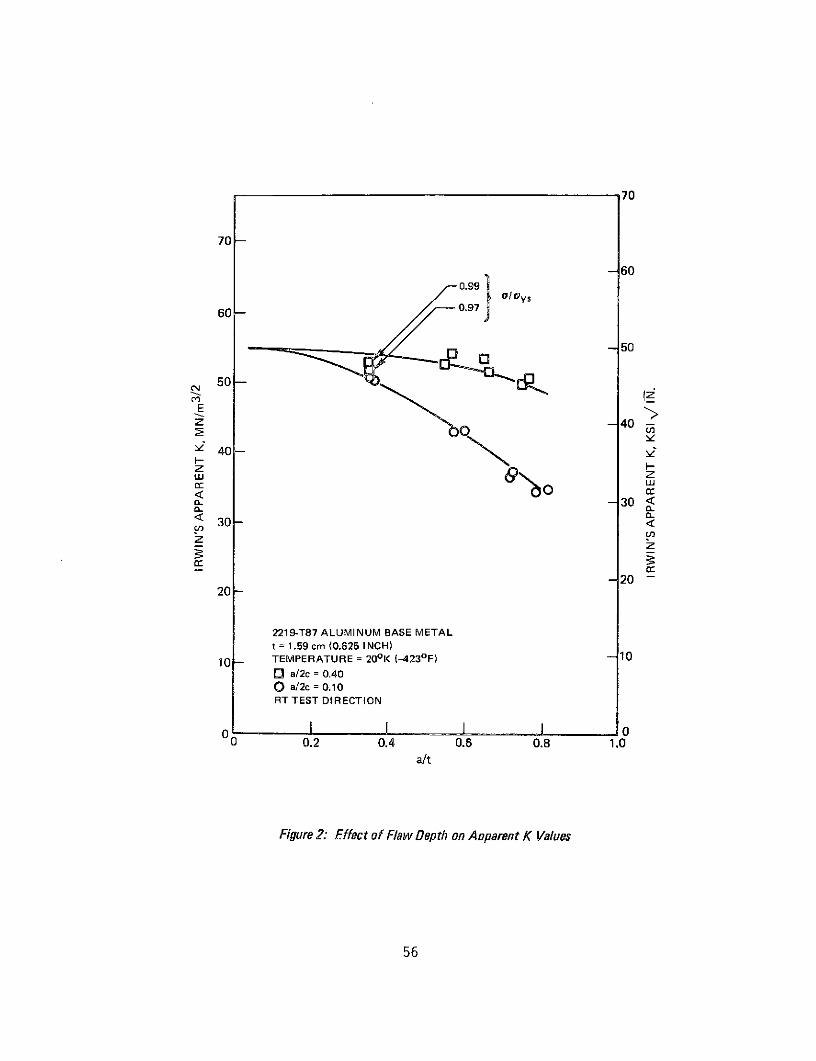
70
70-
- 600.99
o/Gys
-50
50
Ez -40Z 400
I- -
-30 <3030
- 2020-
2219-T87 ALUMINUM BASE METALt = 1.59 cm (0.625 INCH)
10- TEMPERATURE = 20 0 K (--4230 F) -10(3 a/2c = 0.40O a/2c = 0.10RT TEST DIRECTION
0 I 00 0.2 0.4 0.6 0.8 1.0
a/t
Figure 2: Effect of Flaw Depth on Apparent K Values
56

a/2c =
1.7 _ _0.05
0.10
KIE = l.1(Tra/Q)1/2 MK 0.15
1.5
0.20
1.4
MK 0.25
1.30.30
1.2 0.35
1.2
0.40
1.1
1.00 0.1 0.2 0.3 0.4 0.5 0.6 0.7 0.8 0.9 1.0
alt
Fiqure 3: Deep Flaw Magnification Curves (Reference 4)
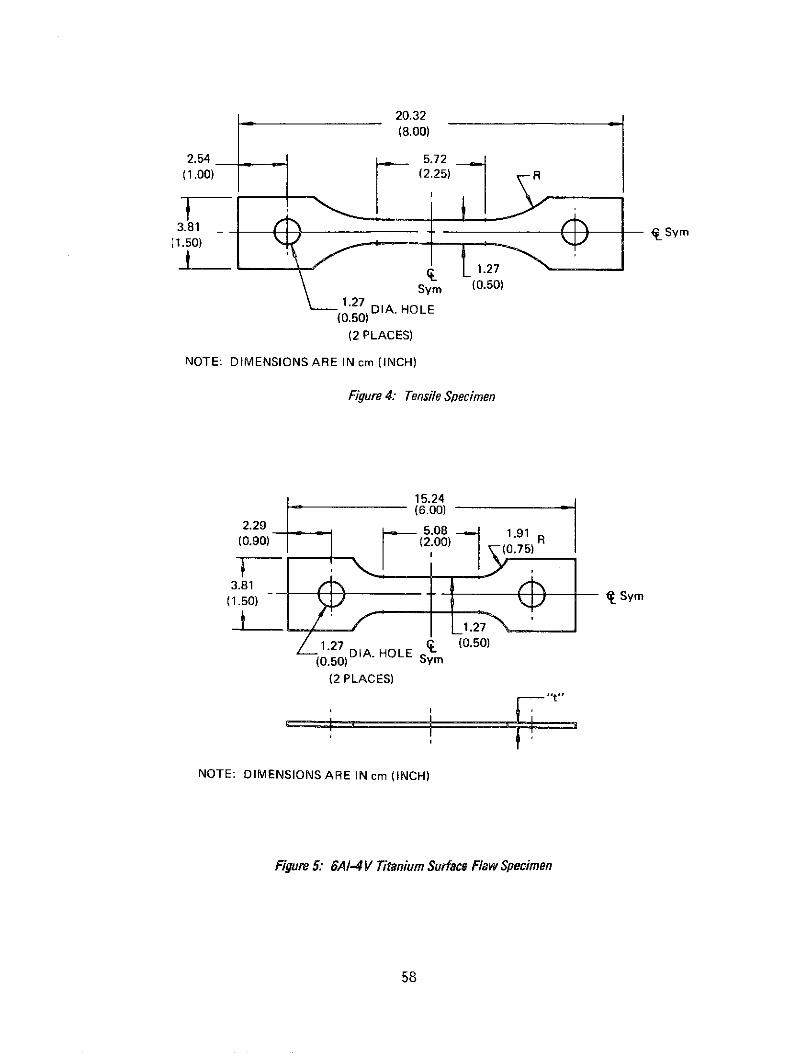
(8.00)
2.54 5.72(1.00) (2.25)
3.81 _ S(1.50)
1.27
Sym (0.50)
1.27 DIA. HOLE(0.50)
(2 PLACES)
NOTE: DIMENSIONS ARE IN cm (INCH)
Figure 4: Tensile Specimen
15.24(6.00)
2.29 5.08 1.91(0.90) (2.00) R
3.81(1.50) - y Sym
L 1.271.27 (0.50)
SDIA. HOLE (0.50)(0.50) Sym
(2 PLACES)
"t"
NOTE: DIMENSIONS ARE IN cm (INCH)
Figure 5: 6A-4 V Titanium Surface Flaw Specimen
58
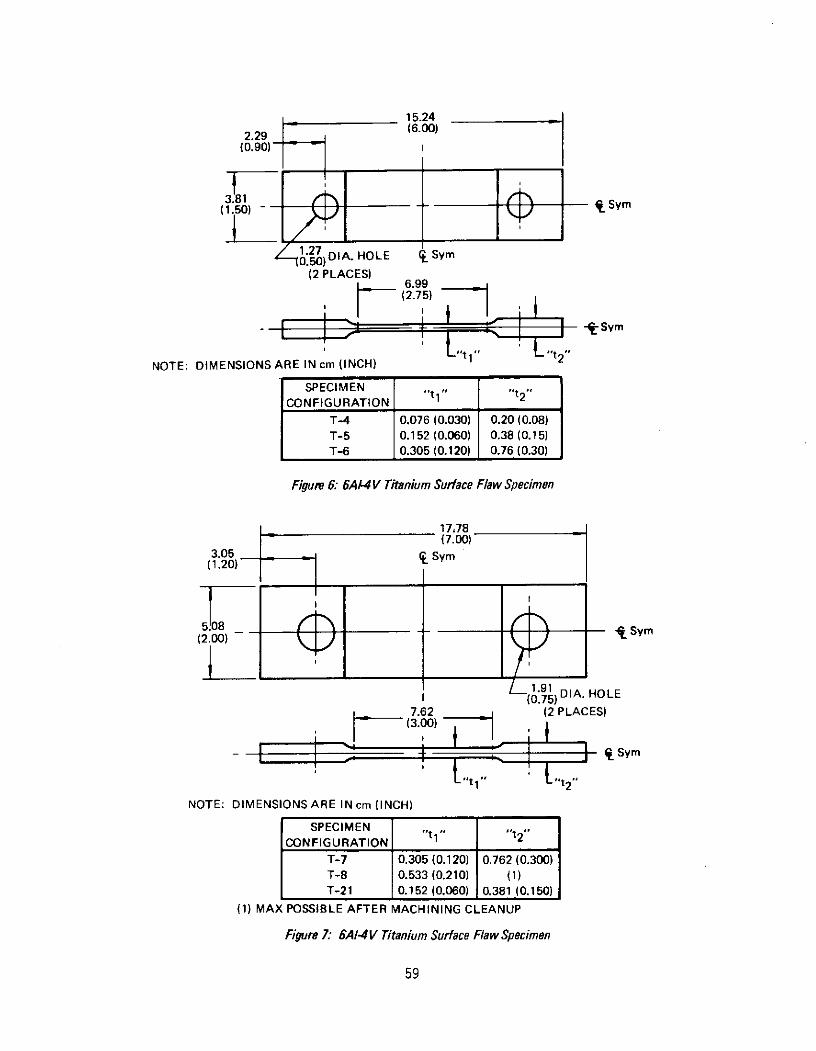
15.24
2.29 (6.00)
(0.90)
3.81 i I
(10 oDIA. HOLE -Sym
(2 PLACES)
t (2.75)t2- Sym
NOTE: DIMENSIONS ARE IN cm (INCH)
SPECIMENCONFIGURATION tt
T-4 0.076 (0.030) 0.20 (0.08)T-5 0.152 (0.060) 0.38 (0.15)T-6 0.305 (0.120) 0.76 (0.30)
Figure 6: 6AI-4V Titanium Surface Flaw Specimen
17378(7.00)
3.05 ( Sym(1.20)
5108 _ __ "_D I
(2.00) Sym
DIA. HOLE
7.62 (2 PLACES)
- Sym
"tl1" Lt2
NOTE: DIMENSIONS ARE IN cm (INCH)
SPECIMENCONFIGURATION t2
T-7 0.305 (0.120) 0.762 (0.300)T-8 0.533 (0.210) (1)T-21 0.152 (0.060) 0.381 (0.150)
(1) MAX POSSIBLE AFTER MACHINING CLEANUP
Figure 7: 6A14V Titanium Surface Flaw Specimen
59
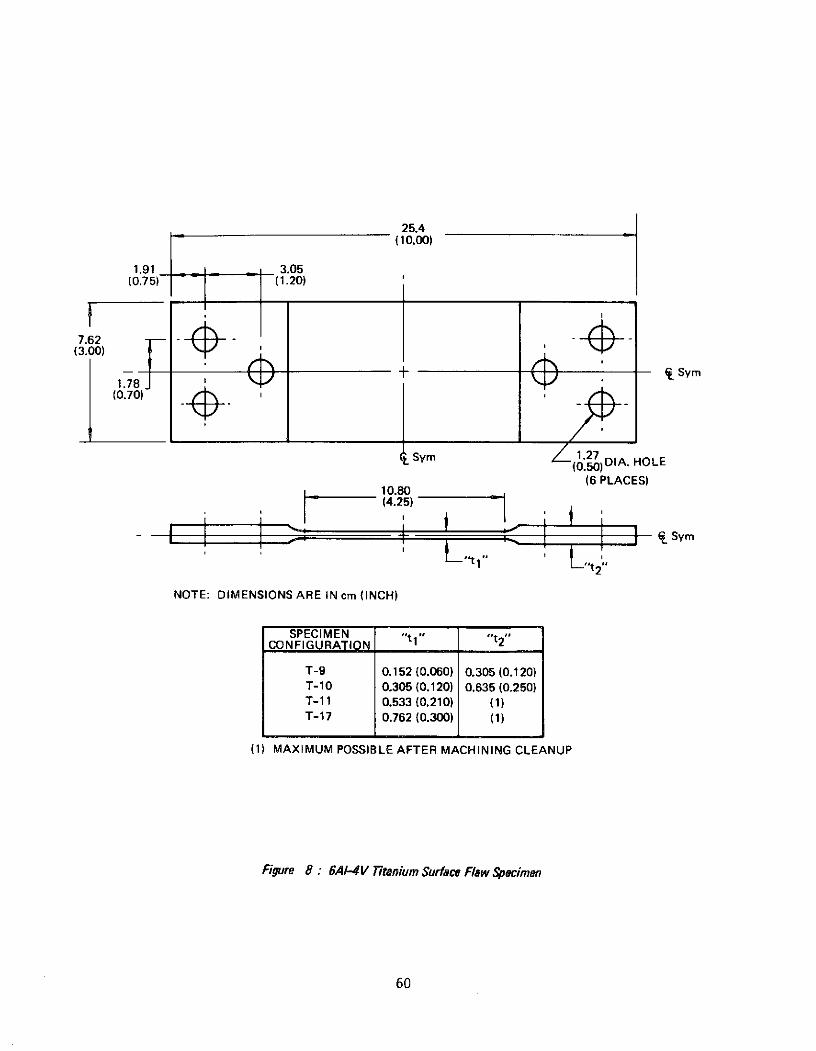
25.4(10.00)
1.91 3.05(0.75) (1.20)
7.62(3.00)
138 I ~Sym
11 27
(0.70)
0Sym 1 5 DIA. HOLE
(6 PLACES)
(4.25)
( Sym
,,, L,t 2
NOTE: DIMENSIONS ARE IN cm (INCH)
SPECIMEN "t2"CONFIGURATION
T-9 0.152 (0.060) 0.305(0.120)T-10 0.305 (0.120) 0.635 (0.250)T-11 0.533 (0.210) (1)T-17 0.762 (0.300) (1)
(1) MAXIMUM POSSIBLE AFTER MACHINING CLEANUP
Figure 8 : 6Ai-4V Titanium Surface Flaw Specimen
60
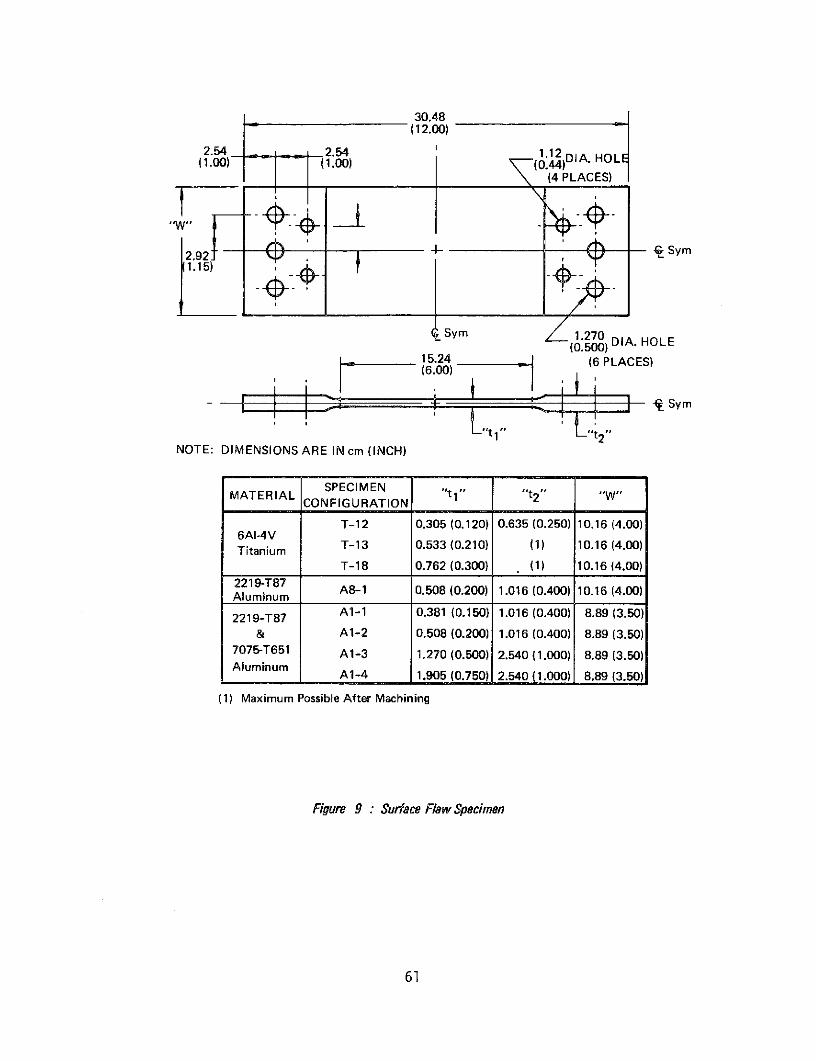
30.48(12.00)
2.54 2.54 1.12(1.00) (1.00) (044)DIA HOLE
(4 PLACES)
'W"
2.92 4- Sym1.15)
Sym 1.270(0.500) DIA. HOLE(0.500)15.24 (6 PLACES)(6.00)
1 11 ,c Sym
Lt2-tl" t2
NOTE: DIMENSIONS ARE IN cm (INCH)
SPECIMEN t 2
MATERIAL CONFIGURATION 'tlt2" "W"CONFIGURATION
T-12 0.305 (0.120) 0.635 (0.250) 10.16 (4.00)6AI-4VTitanium T-13 0.533 (0.210) (1) 10.16 (4.00)Titanium
T-18 0.762 (0.300) (1) 10.16 (4.00)2219-T87 A8-1 0.508 (0.200) 1.016 (0.400) 10.16 (4.00)Aluminum
2219-T87 Al-1 0.381 (0.150) 1.016 (0.400) 8.89 (3.50)
& A1-2 0.508 (0.200) 1.016 (0.400) 8.89 (3.50)7075-T651 A1-3 1.270 (0.500) 2.540 (1.000) 8.89 (3.50)Aluminum A1-4 1.905 (0.750) 2.540 (1.000) 8.89 (3.50)
(1) Maximum Possible After Machining
Figure 9 : Surface Flaw Specimen
61

43.18(17.00)
3.18 3.81(1.25)- (1.50)
12.70(5.00) , -_3.81 + - - Sym
(1.50) - -
Sym 1.597 DIA. HOLE(0.629)
(10 PLACES)17.78
_ Sym
"tl , "t2
NOTE: DIMENSIONS ARE IN cm (INCH)
SPECIMEN "2MATERIAL CONFIGURATION
A2-1 0,381 (0.150) 1.016 (0.400)2219-T87
& A2-2 0.508 (0.200) 1.016 (0.400)
7075-T651 A2-3 1.270 (0.500) 2.413 (0.950)Aluminum A2-4 1.905 (0.750) 2.413 (0.950)
T-14 0.305 (0.120) 0.635 (0.250)6AI-4V
T-15 0.533 (0.210) (1)TitaniumT-16 0.762 (0.300) (1)
(1) MAXIMUM POSSIBLE AFTER MACHINING CLEANUP
Figure 10: Surface Flaw Specimen
62
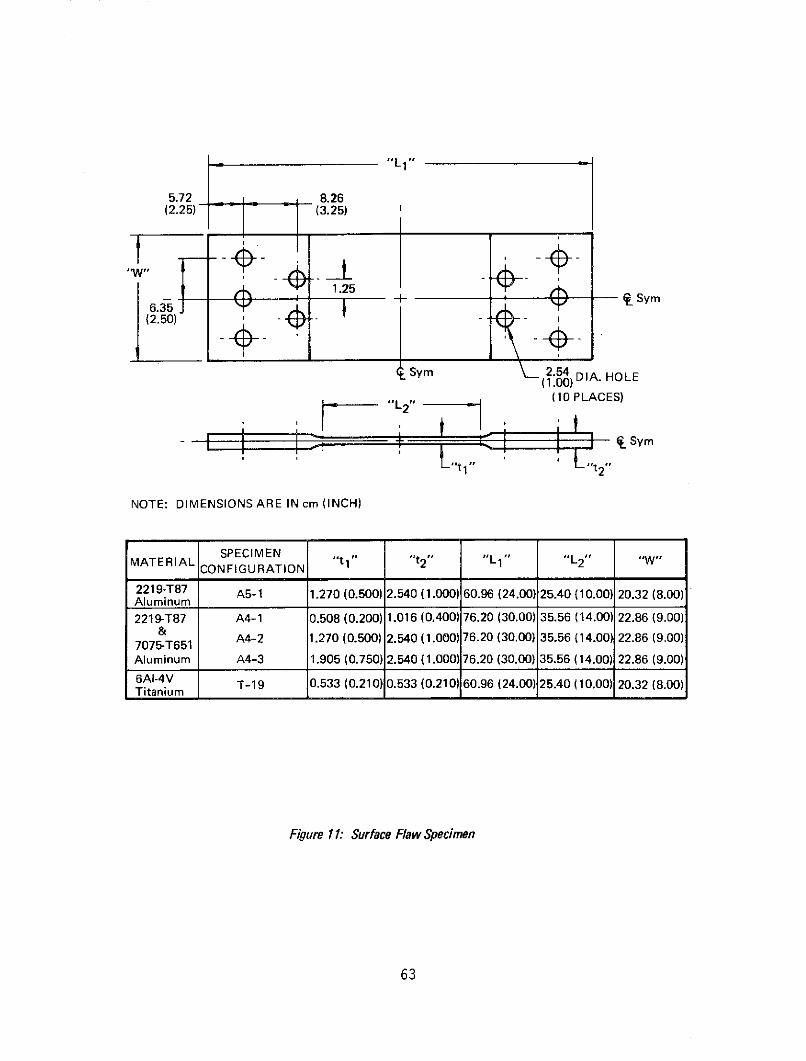
5.72 8.26(2.25) (3.25)
6+ - Sym6.35
(2.50)
Sym ~~2.54DIA. HOLE
(10 PLACES)
_ S y m
vtL2
NOTE: DIMENSIONS ARE IN cm (INCH)
SPECIMEN "t t2" "L "L 2 " W"
CONFIGURATION
2219-T87 A5-1 1.270 (0.500) 2.540 (1.000) 60.96 (24.00) 25.40 (10.00) 20.32 (8.00)Aluminum
2219-T87 A4-1 0.508 (0.200) 1.016 (0.400) 76.20 (30.00) 35.56 (14.00) 22.86 (9.00)&
A4-2 1.270 (0.500) 2.540 (1.000) 76.20 (30.00) 35.56 (14.00) 22.86 (9.00)7075-T651Aluminum A4-3 1.905 (0.750) 2.540 (1.000) 76.20 (30.00) 35.56 (14.00) 22.86 (9.00)
6AI-4V T-19 0.533 (0.210) 0.533 (0.210) 60.96 (24.00) 25.40 (10.00) 20.32 (8.00)Titanium
Figure 11: Surface Flaw Specimen
63
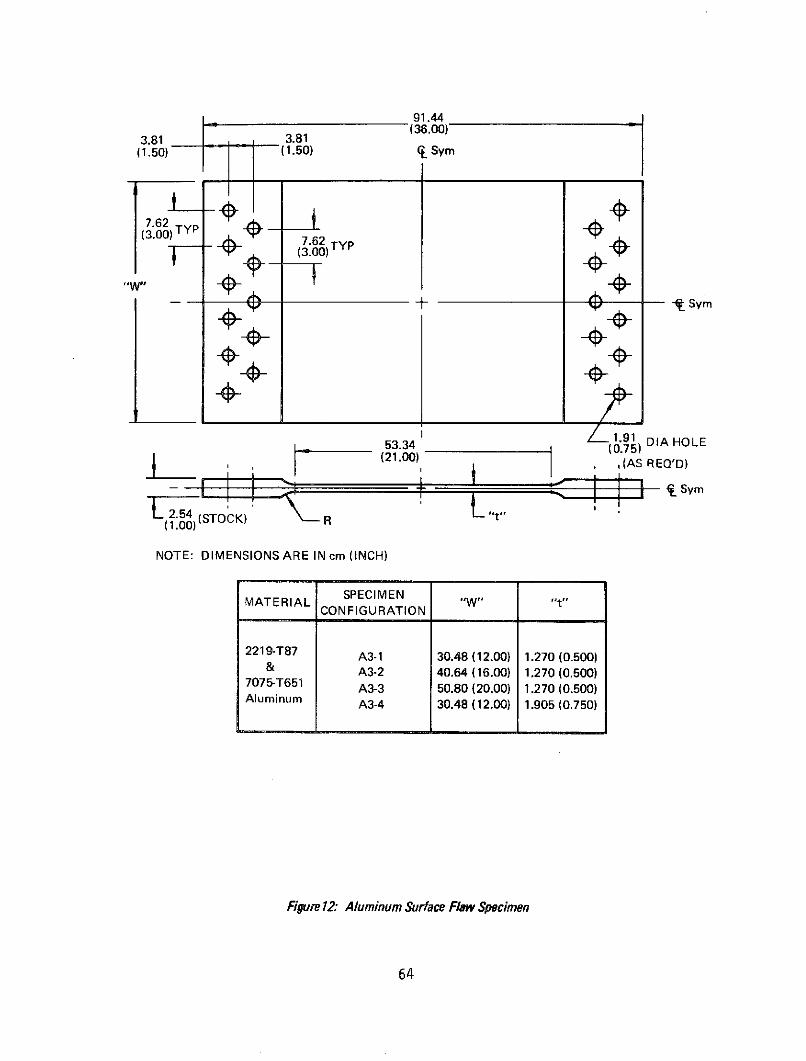
91.44
3.81 3.81 (36.00)(1.50) (1.50) C Sym
7.62 .(3.00) TY P
7.62 TYP
-1--
1.91 DIA HOLE- 53.34 I(0.75)
- Sym
2.54 (STOCK) R(1.00)
NOTE: DIMENSIONS ARE IN cm (INCH)
SPECIMENMATERIAL "W" .t"
CONFIGURATION
2219-T87 A3-1 30.48 (12.00) 1.270 (0.500)& A3-2 40.64 (16.00) 1.270 (0.500)
7075-T651 A3-3 50.80 (20.00) 1.270 (0.500)Aluminum A3-4 30.48 (12.00) 1.905 (0.750)
Figure 12: Aluminum Surface Flaw Specimen
64
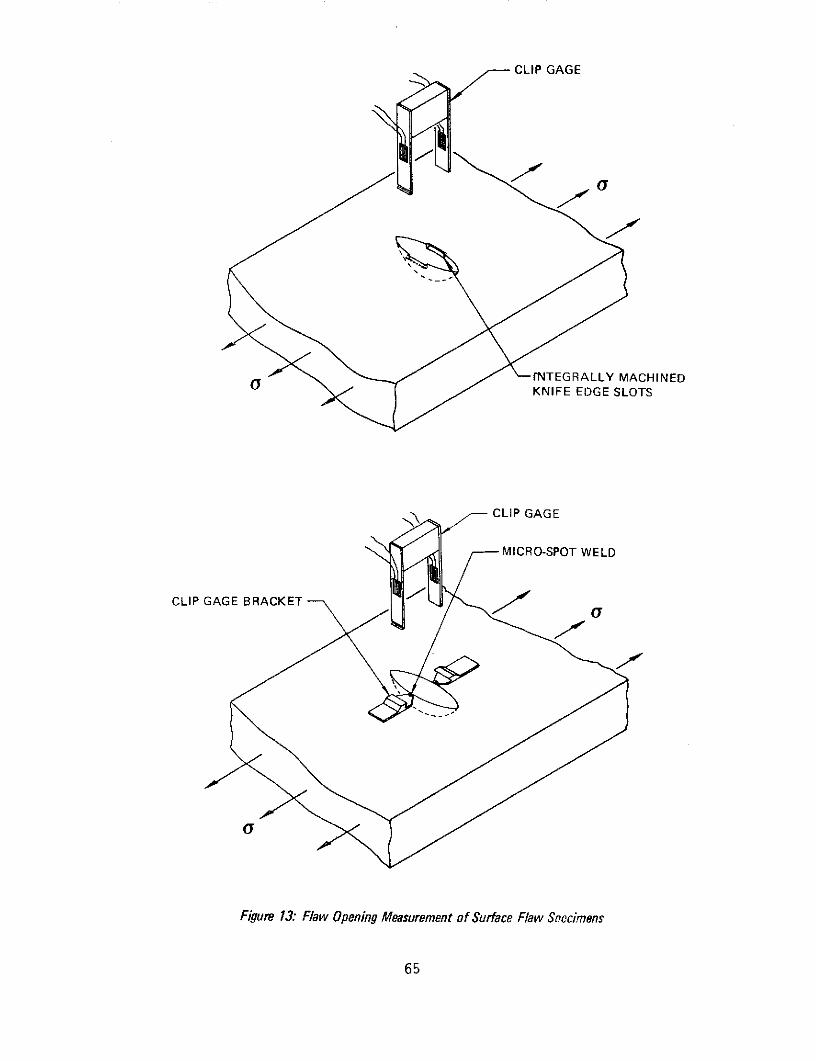
CLIP GAGE
fNTEGRALLY MACHINEDKNIFE EDGE SLOTS
CLIP GAGE
MICRO-SPOT WELD
CLIP GAGE BRACKET
Figure 13: Flaw Opening Measurement of Surface Flaw Snecimens
65
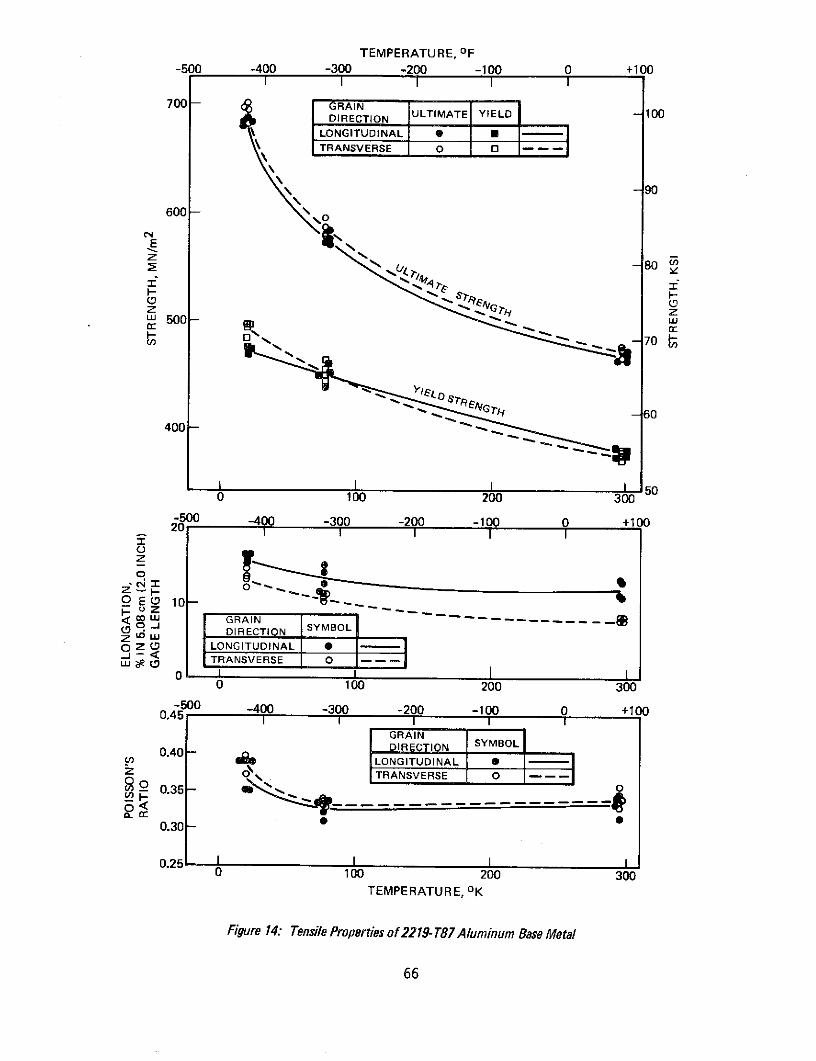
TEMPERATURE, OF-500 -400 -300 -200 -100 0 +100
700 - GRAINDIRECTION ULTIMATE YIELD - 100
LONGITUDINAL
\ -90
600 -
u 500-- Or 70 "
60400- ,
0 100 200 300
-500 -400 -300 -200 -100 0 +10020 II
z
O D DIRECTION SYMBOLZ uJ -
0 z LONGITUDINAL •"J- < TRANSVERSE0 I I
0 100 200 300-500 -400 -300 -200 -100 0 +100
0.45I I I I I
GRAIN0.40 - DIRECTION SYMBOL
OI LONGITUDINAL
Z 4 TRANSVERSE 02 0
0.30 -
0.251 I I0 100 200 300
TEMPERATURE, OK
Figure 14: Tensile Properties of 2219- T87 Aluminum Base Metal
66
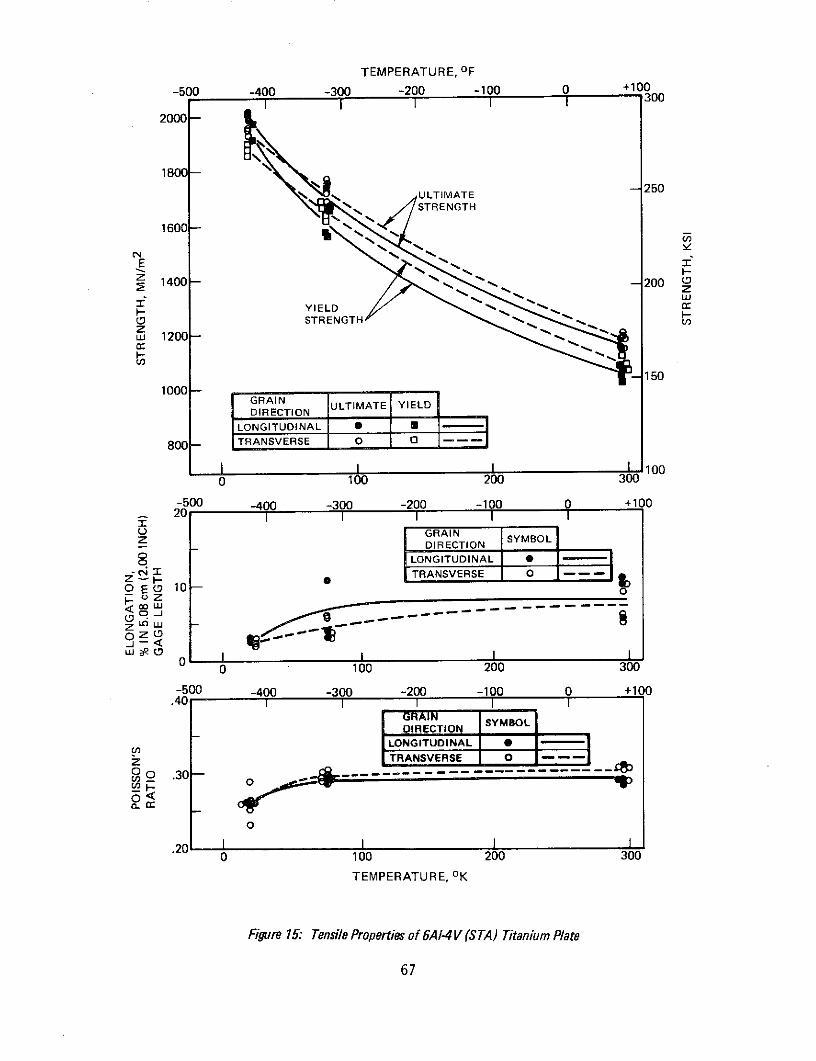
TEMPERATURE, OF
-500 -400 -300 -200 -100 0 +100300
2000-
1800 -S250
1ULTIMATESTRENGTH
1600 -U)
YIELD
( STRENGTHzu 1200 -
-1501000 -
GRAINDIRECTION ULTIMATE YIELDDIRECTION
LONGITUDINAL S M
800- TRANSVERSE O 0
II I I 1000 100 200 300
-500 -400 -300 -200 -100 0 +10020 I I
0 GRAINz DIRECTION SYMBOL
o0 LONGITUDINAL -
o E 10 TRANSVERSE O -o E (D 10 - t
z O
0 100 200 300
-500 -400 -300 -200 -100 0 +100.40 I I I I I
SYMBOLIRECTIONLONGITUDINAL 0
U,
z TRANSVERSE O
oo .30-
0
.20 10 100 200 300
TEMPERATURE, OK
Figure 15: Tensile Properties of 6A1-4V (STA) Titanium Plate
67
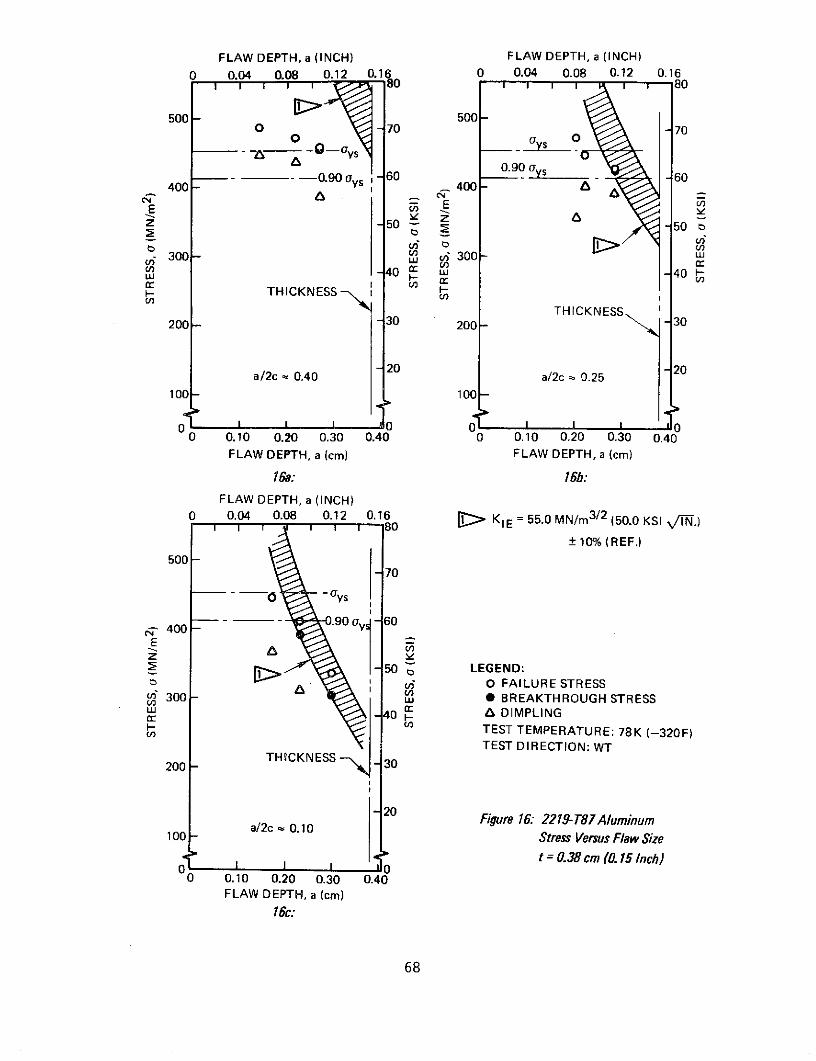
FLAW DEPTH, a (INCH) FLAW DEPTH, a (INCH)
0 0.04 0.08 0.12 0.16 0 0.04 0.08 0.12 0.161r -ys 80 1 1 80
500- 500-0 0 -70 70
1 o-0 0
-- - 0.90 Oys 60 0.90 - 60400 - 400
z - 550 50
300 E 300-c-40 c 40
THICKNESS I
THICKNESS200 - 30 200 30
a/2c , 0.40 20 a/2c 0.25 20100 - 100
0 I 0 0 , 100 0.10 0.20 0.30 0.40 0 0.10 0.20 0.30 0.40
FLAW DEPTH, a (cm) FLAW DEPTH, a (cm)
16a: 16b:
FLAW DEPTH, a (INCH)0 0.04 0.08 0.12 0.16 KIE = 55.0 MN/m3/2 (50.0 KSI .)
+10% (REF.)
50070
q- 400 - .90 - 60
-50 t, LEGEND:3i 0 FAILURE STRESS
S300 w BREAKTHROUGH STRESSr 3-40 A DIMPLING
TEST TEMPERATURE: 78K (-320F)TEST DIRECTION: WT
200- THICKNESS - 30
20Figure 16: 2219-T87 Aluminum
a/2c , 0.10100 - Stress Versus Flaw Size
St = 0.38 cm (0.15 Inch)0 I I 00 0.10 0.20 0.30 0.40
FLAW DEPTH, a (cm)
16c:
68
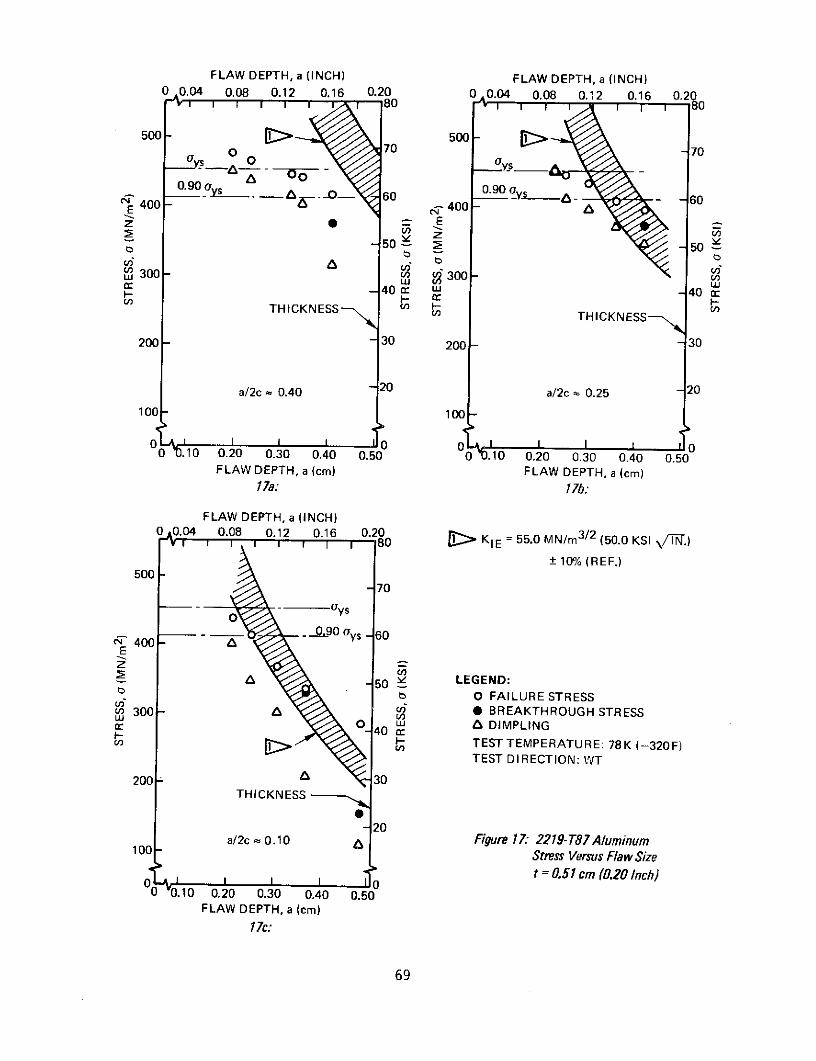
FLAW DEPTH, a (INCH) FLAW DEPTH, a (INCH)0 0.04 0.08 0.12 0.16 0.20 0 0.04 0.08 0.12 0.16 0.20
I I I II 80 80
500 - 500 -o 70 70
ys 4-
09 0090 -- 0- 6000 .90 -60c" 400 400
* - E
50 - 50-5o 5oW U
r 40 c
THICKNESS , THICKNESS
200- -30 200- - 30
a/2c - 0.40 -20 a/2c - 0.25 -20
100 100
0 .10 0.20 0.30 0.40 0.50 0 .10 0.20 0.30 0.40 0.50FLAW DEPTH, a (cm) FLAW DEPTH, a (cm)
17a: 17b:
FLAW DEPTH, a (INCH)0 0 .04 0.08 0.12 0.16 0.20 KIE= 55.0 MN/m 3 / 2 (50.0 KSI .)
± 10% (REF.)500
70O - _-_ 'Oy s
- _ ,90 oys - 60N 400 -
S50 4 LEGEND:uz O FAILURE STRESS09300 A 0 BREAKTHROUGH STRESS
S w A DIMPLINGc- 40 a-0 TEST TEMPERATURE: 78K (-320F)
TEST DIRECTION: WT
200 A 30THICKNESS
20a/2c - 0.10 A Figure 17: 2219-T87Aluminum
100 Stress Versus Flaw Size
St = 0.51 cm (0.20 Inch)0 0.10 0.20 0.30 0.40 0.50
FLAW DEPTH, a (cm)
17c:
69
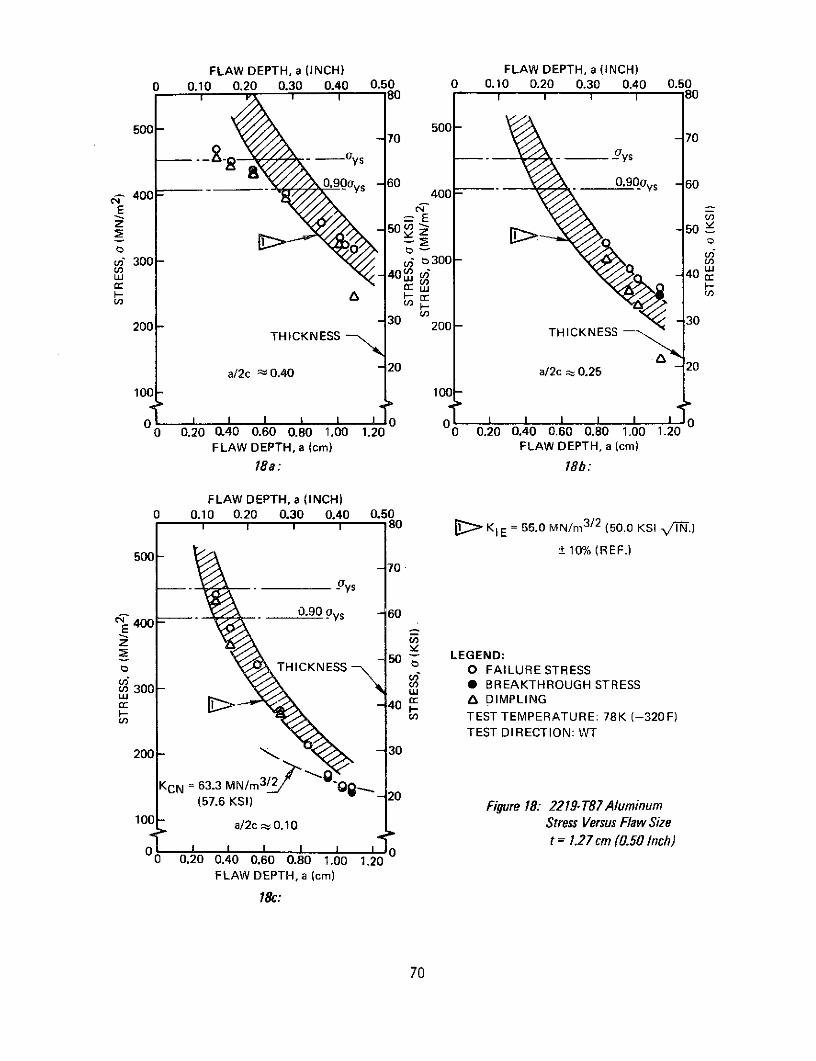
FLAW DEPTH, a (INCH) FLAW DEPTH, a (INCH)0 0.10 0.20 0.30 0.40 0.50 0 0.10 0.20 0.30 0.40 0.50
1 80 1011 0
500 - 70 50070 70
-ys -ys
S0.90ys -60 0.9 0ys 60400 400
300 - 300 -,- , 4U -40 '
200- 30 200 30THICKNESS THICKNESS
a/2c 0.40 20 a/2c ; 0.25 - 20
100 100
0 I0ll 0 I I0 0.20 0.40 0.60 0.80 1.00 1.20 0 0.20 0.40 0.60 0.80 1.00 1.20
FLAW DEPTH, a (cm) FLAW DEPTH, a (cm)
18a: 18b:
FLAW DEPTH, a (INCH)0 0.10 0.20 0.30 0.40 0.50
S I I 80 r KIE = 55.0 MN/m 3 / 2 (50.0 KSI /-N.)
500 - 10% (REF.)- 70
. _Oys
400 -0.90 ays -60
50 LEGEND:THICKNESS O FAILURE STRESS
S300) BREAKTHROUGH STRESS
w S DIMPLINGI-n 40 TEST TEMPERATURE: 78K (-320F)
TEST DIRECTION: WT
200- -30
KCN = 63.3 MN/m 3 2 20(57.6 KSI) Figure 18: 2219-T87 Aluminum
100 - a/2c a 0.10 Stress Versus Flaw Sizet = 1.27 cm (0.50 Inch)
0 -I 100 0.20 0.40 0.60 0.80 1.00 1.20
FLAW DEPTH, a (cm)
18c:
70

FLAW DEPTH, a (INCH)
0 0.20 0.40 0.60 0.80 1.00I I I I I 1 90
600-
TEST TEMPERATURE: 78K (-320F)TEST DIRECTION: WT
-80
500- KIE = 55.0 MN/m3/2 (50.0 KSI /Fi.)
+100/ (REF.) -70
Sys
S _ 0.90ays -60
4040
E
THICKNESS 0
z
-50100
c UJ
O FAILURE STRESS
30 0
-40
200-
a/2c.50 1.00 1.50 2.00 2.500.25
FLAW DTHICKNESSPTH,
a (cm)
LEGEND:SFAILURE STRESS 10Veru F
* BREAKTHROUGH STRESS6 DIMPLING
0 0 l 1 1 i o0 0.50 1.00 1.50 2.00 2.50
FLAW DEPTH, a (cm)
Figure 19: 2219- T87 Aluminum Stress Versus Flaw Size
t = 1.90 cm (0.75 Inch)
71

FLAW DEPTH, a (INCH) FLAW DEPTH, a (INCH)
0 0.05 0.10 0.15 0 0.05 0.10 0.15 0.20S ______qys 80 - - y 80
0-60 -60
E 400 - E 400--E I
50 o -50t
300 - 0 a/2c ; 0.25 OW 300 W 300 W
0U 03 THICKNESS
THICKNESS -30 -30200 - 200 -
LEGEND:(Typ)a/2c z0.25 O FAILURE STRESS
- 20 *BREAKTHROUGH STRESS -20
SDIMPLING
0 I0 0 00 0.10 0.20 0.30 0.40 0 0.10 0.20 0.30 0.40 0.50
FLAW DEPTH, a (cm) FLAW DEPTH, a (cm)
20a: 20b:
FLAW DEPTH, a (INCH) FLAW DEPTH, a (INCH)0 0.10 0.20 0.30 0.40 0.50 0 0.20 0.40 0.60 0.80
S I I y I 0 I I ' qys 80
400 E00EU)Z
zz v
THICKNESS 50 THICKNESS -50 q
S300- W u 300- -"
c a/2c 0.25 -40 - - - 40 c
200 30 200 30
D KIE = 39.6 MN/m3/2 20 a/2c 0.25 - 20
(36.0 KSI VN.) 100
10- + 10% (REF.) W
0 0 0 1 00 0.20 0.40 0.60 0.80 1.00 1.20 0 0.50 1.00 1.50 2.00FLAW DEPTH, a (cm) FLAW DEPTH, a (cm)
20c: 20d:
Figure 20: 7075- T651 Aluminum Stress Versus Flaw Size
(Room Temperature, PWT)
72

FLAW DEPTH, a (INCH) FLAW DEPTH, a (INCH)0 0.02 0.04 0.06 0.08 0 0.02 0.04 0.06 0.08
180 8 0 1 1801200 - 1200 -
1100 - - 160 1100 O - 160o _ ys --- - ys
1000 - 10000 0 .9 0 ays -140 - _ _ 0.90Oy s -140
E 900- 900
S120 v -120800- t D - 800 -
nTHICKNESS 70 A'700 100" c 700 -100THICKNESS I- THICKNESS
cn cn 6 THICKNESS600 600
80 -80
500- 500-
400 a/2c ; 0.40 60 400 a/2c 0.25 60
0 IIIO II 0O0 0.05 0.10 0.15 0.20 0 0.05 0.10 0.15 0.20
FLAW DEPTH, a (cm) FLAW DEPTH, a (cm)
21a: 21b:
FLAW DEPTH, a (INCH)0 0.02 0.04 0.06 0.08
S.04 0.06 080 KIE = 80.2 MN/m 3 / 2 (73.0 KSI V'-N.)1200- 10% (REF.)o1100- -160
- a -- _ ys
1000--- .90 ys -40
" 900 -E n
S-120 LEGEND:2 800 O FAILURE STRESS
C ,- U 0 BREAKTHROUGH STRESS) 700 -0 A DIMPLING
STEST TEMPERATURE: ROOMmu 600- TEST DIRECTION: RT
THICKNESS 80
500
400 -60 Figure 21: 6A1-4VSTA TitaniumStress Versus Flaw Size
t = 0. 15 cm (0.06 Inch)
0 I 00 0.05 0.10 0.15 0.20
FLAW DEPTH, a (cm)
21c:
73

FLAW DEPTH, a (INCH) FLAW DEPTH, a (INCH)
0 0.04 0.08 0.12 0.16 0 0.04 0.08 0.12 0.16
1200 - 80 1200 180
1100- -160 1100 - 160
- 0 -ys - Oys
1000 - 1000 140S 0.90 ys 140 100.90y s 140
c 900 E 900
120 120800 - 800
700- 100 w700 -100000 -
cn 600- 600-80 - 80
500 - THICKNESS 500 - THICKNESS
400 , 60 400 60
a/2c . 0.40 a/2c ; 0.25
0 I I i in 0 0 0Il I l l0 0.10 0.20 0.30 0.40 0 0.10 0.20 0.30 0.40
FLAW DEPTH, a (cm) FLAW DEPTH, a (cm)
22a: 22b:
FLAW DEPTH, a (INCH)
0 0.04 0.08 0.12 0.16S0.04 0.08 0. 1 180 KIE = 80.2 MN/m3/2 (73.0 KSI VIN.)
1200+10% (REF.)
1100- -160
.--Oys1000
0.90ays -140
" 900
E120 LEGEND:-120 y
to O FAILURE STRESS* BREAKTHROUGH STRESS
700 100 DIMPLING
-0 TEST TEMPERATURE: ROOM600 - TEST DIRECTION: RT
80500-
400- - 60 Figure 22: 6AI-4VSTA TitaniumTHICKNESS Stress Versus Flaw Size
a/2c 0.10 t = 0.32 cm (0.125 Inch)
0 I 0I I I I0 0.10 0.20 0.30 0.40
FLAW DEPTH, a (cm)
22c:
74
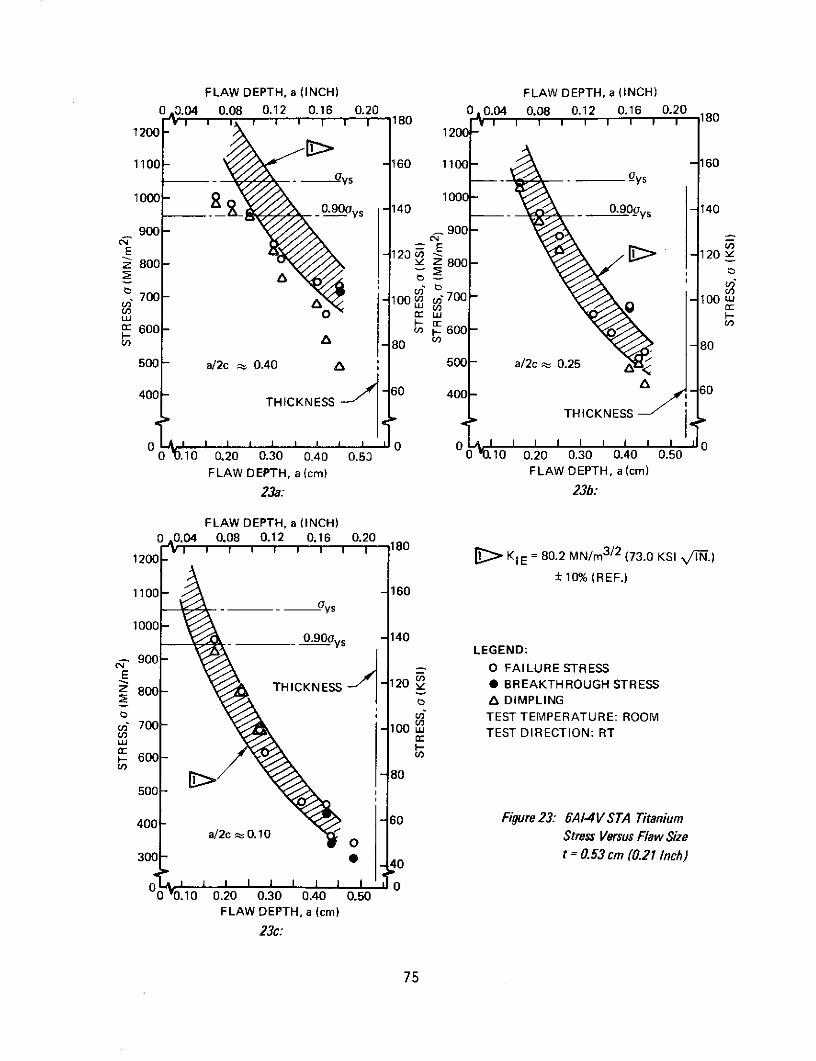
FLAW DEPTH, a (INCH) FLAW DEPTH, a (INCH)
0 .04 0.08 0.12 0.16 0.20 0. 004 0.08 0.12 0.16 0.200 1 , i i 1 180 180
1200- 1200-
1100- -160 1100 - - 160- - - ys -.. - ys
1000- 1 -0 140 - 0.90Oy s 140
900- 900
120 - 120z 800- 2 800 -
S700- i00" )i 700 - -100Uj
600- . 600 -80 -80
500- a/2c 0.40 a 500- a/2c a 0.25
400 - TH E60 400 60
THICKNESSTHICKNESS
0 0 0 00 6.10 0.20 0.30 0.40 0.50 0 .10 0.20 0.30 0.40 0.50
FLAW DEPTH, a (cm) FLAW DEPTH, a (cm)
23a: 23b:
FLAW DEPTH, a (INCH)0 0.04 0.08 0.12 0.16 0.20100 180
1200 -1 KIE = 80.2 MN/m 3 /2 (73.0 KSI Ti-N.)+10% (REF.)
1100 A -160
-ys
1000
0 LEGEND:
E 9 0O FAILURE STRESS
THICKNESS 120 l 0 BREAKTHROUGH STRESSb A DIMPLING
Sb TEST TEMPERATURE: ROOM700- 100 w TEST DIRECTION: RT
- 600- U
-080500-
400- 6- 60 Figure 23: 6A14VSTA Titaniuma/2c - 0.10 O Stress Versus Flaw Size
300 - 0 40 t = 0.53 cm (0.21 Inch)
4o00 0.10 0.20 0.30 0.40 0.50
FLAW DEPTH, a (cm)
23c:
75

FLAW DEPTH, a (INCH)
0 0.05 0.10 0.15 0.20 0.25 0.30I I I I I I 180
1200-
1100 -160
.Oys
0.90ays - 140
900
120800-
E 700
100z-100
S600 -
-., -80
500 - KIE = 80.2 MN/m 3 / 2
(73.0 KSI vJN-.)
+ 10% (REF.)
400- - 60
a/2c - 0.25
300-
THICKNESS 40
200-LEGEND:
O FAILURE STRESS* BREAKTHROUGH STRESS
100- 6 DIMPLINGTEST TEMPERATURE: ROOMTEST DIRECTION: RT
0 I I I I I I I 00 0.10 0.20 0.30 0.40 0.50 0.60 0.70 0.80
FLAW DEPTH, a (cm)
Figure 24: 6A1-4V STA Titanium Stress Versus Flaw Sizet = 0.76cm (0.30 Inch)
76
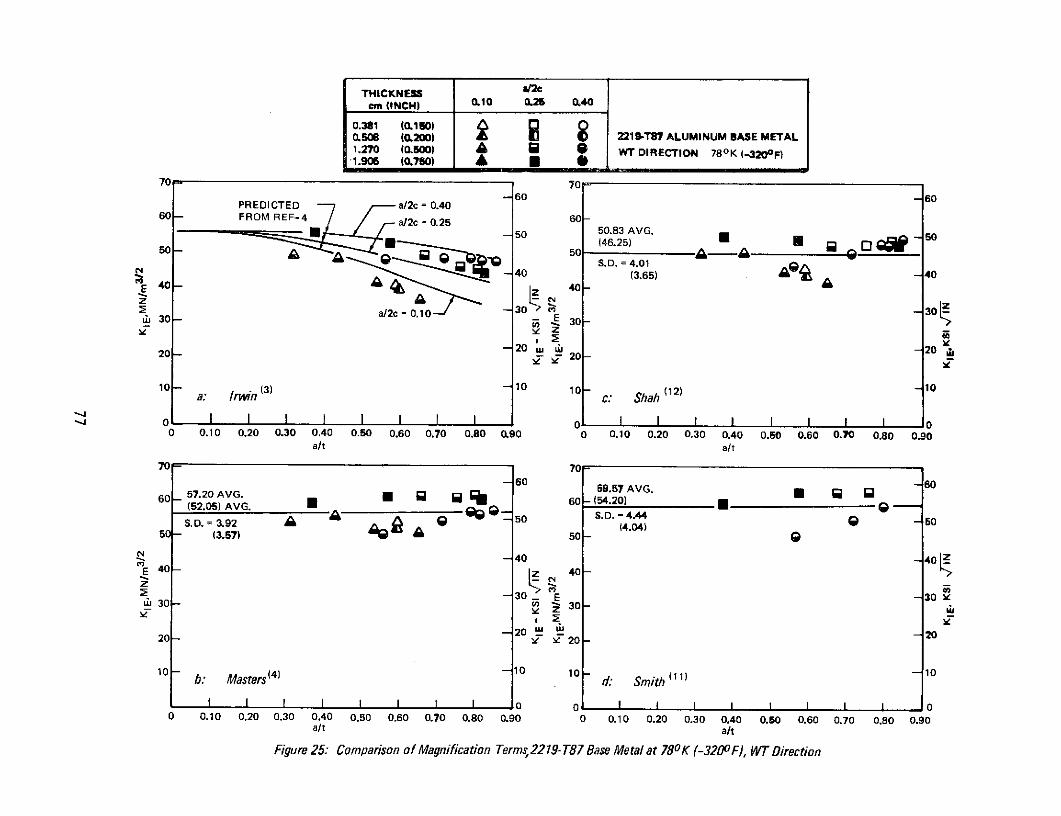
THICKNESS a/2ccm (INCH) 0.10 0.25 0.40
0.381 (0.10) 40.508 (0.200) 8 2219-T87 ALUMINUM BASE METAL1.270 (0.500) A WT DIRECTION 78 0 K (-3200F)-1.905 (0.750) A
70 70-60 60PREDICTED a/2c= 0.40
60 FROM REF-4 a/2c=0.25 6060U 50 50.83 AVG.
S(146.25) 5) -1
5 30 5301 4. (3.65) p 40
4L 40a/2c =0.10 -30 -30S30-
10 1020- -- j 20-
10 (3) 10 1 (12) 10a: rwn (3) c: Shah (12)
o I I I I I I I I I 00 0.10 0.20 0.30 0.40 0.50 0.60 0.70 0.80 0.90 0 0.10 0.20 0.30 0.40 0.50 0.60 0.70 0.80 0.90
a/t a/t
70 70-
60 69.57 AVG. 6 0 6
60- 57.20 AVG. 60- (54.20)(52.05) AVG. _ S.D. - 4 -
S.D. = 3.92 A - 50 S. 4.04) - 5050- (3.57) 5 -
E 40 - 40 -
z-30. E -30 e,L 30 - 30- L
20 20 !2 -2020 20
10 - b: Masters(4) -10 10 - d: Smith (11) - l
I I I I I I I 0 0 I I I 00 0.10 0.20 0.30 0.40 0.50 0.60 0.70 0.80 0.90 0 0.10 0.20 0.30 0.40 0.50 0.60 0.70 0.80 0.90
a/t a/t
Figure 25: Comparison of Magnification Terms,2219- T87 Base Metal at 780 K (-3200F), WT Direction

a a/2c 0.10 2219-T87 ALUMINUM BASE METAL
O a/2c 0.40 ROOM TEMP, RT DIRECTION t - 1.588 cm (0.625 IN.)
70- 70-
60 -60
PREDICTED
FROM REF-4 0FROMa/2 = 0.40 -50 46.53 AVG. 50Oo (42.34) O O O
4 b -O 40 S.D.=2.00 0 -0 40o
a/2c,= 0.10 - a t-30- 30
-20 _ 2020- 20
10- a: rn (3) 10 10- C: Shah (12) -10
00 0 I I I I I I I I 1 0 I I I I I I I I o0 0.10 0.20 0.30 0.40 0.50 0.60 0.70 0.80 0.90 0 0.10 0.20 0.30 0.40 0.50 0.60 0.70 0.80 0.90
aft alt
70- 70
-60 -6060- 606
+ 7.5%50.94 AVG. 6.5% O 50 51.47 AVG. -50
(46.35) 4O '- (46.83) O
S.D. =2.38 O O S.D.= 2.74 OO(2.17) 40 (2.49) 40
S 40- 40-
-30- E -302 30 - 30
20 2020- 20- he
10 1-10
10- b: Masters(4) 10 d: Smith(11 )
0 I I I I I I I I I I I I I 1 00 0.10 0.20 0.30 0.40 0.50 0.60 0.70 0.80 0.90 0 0.10 0.20 0.30 0.40 0.50 0.60 0.70 0.80 0.90
alt
Figure 26: Comparison of Magnification Terms,2219-T87 Base Metal at Room Temperature, RT Direction (Data Taken From Ref. (4))
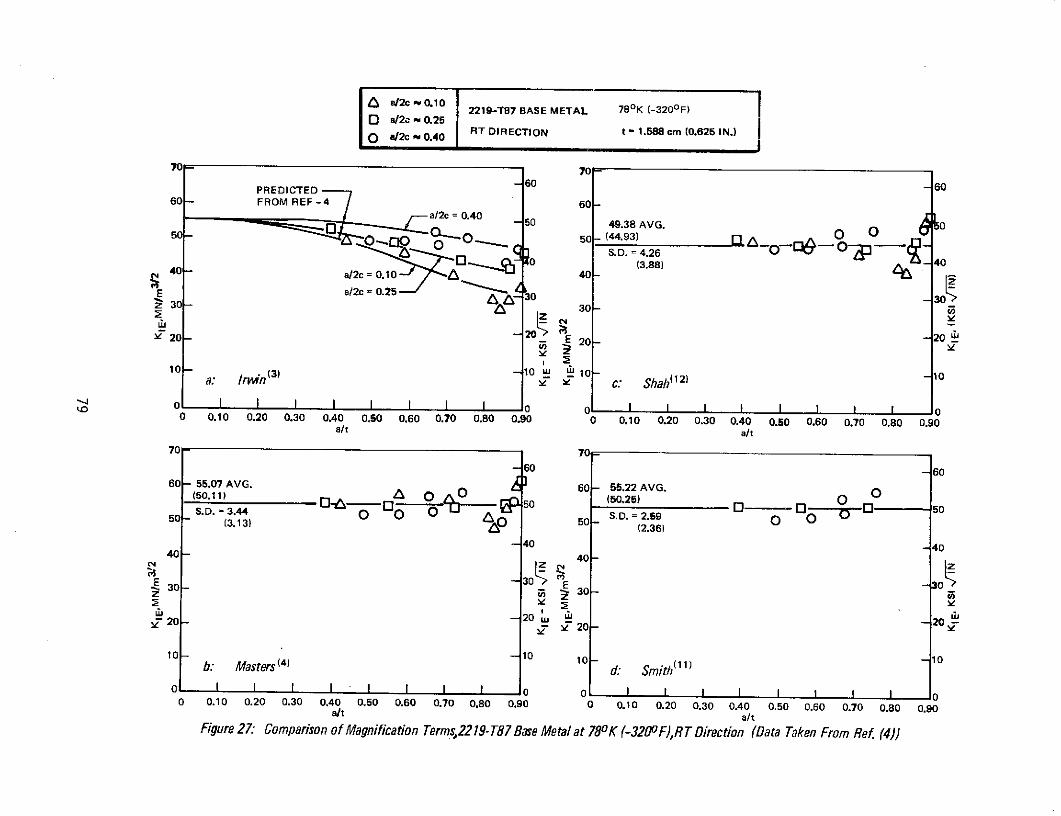
Sa/2c0.10 2219-T87 BASE METAL 78 0 K (-3200F)I a/2c - 0.25
O a/2c v 0.40 RT DIRECTION t - 1.588 cm (0.625 IN.)
70 70-
PREDICTED -60 -60
60 - FROM REF-4 60 -
50 -a/2c =0.40 50 49.38 AVG. 0 0 L050- 0O 0 50- (44.93) O O0 -
5OO .0 S.D. = 4.26 O - 4-1rl 0 (3.88) 4
S40- a/2c=0.10 40 ( 40
E a/2c = 0.25z 30 -A 30 30 3A
S20- 20 E 20- -20
a: Irn ( ) - c: Shah (12 ) 10
0 I 1 I I I I I I0 0.10 0.20 0.30 0.40 0.50 0.60 0.70 0.80 0.90 0 0.10 0.20 0.30 0.40 0.50 0.60 0.70 0.80 0.90
a/t a/t
70 - 70
60 -6060 - 55.07 AVG. 60 55.22 AVG.
(50.11) r-6- 0 4 c, o ro 50to (50.25) 0 OS.D. = 3.44 A 0 0.5 0.0- 50
S5 (2.36)
-40 - 4040 - 40
30- 30 - -30
~y20 -20 L 2020S20
10 -- 10 10 - -10b: Masters (4) d: Smith(11
SI I I I I I0 I I I I I I I I0 0.10 0.20 0.30 0.40 0.50 0.60 0.70 0.80 0.90 0 0.10 0.20 0.30 0.40 0.50 0.60 0.70 0.80 0.90
a/t a/t
Figure 27: Comparison of Magnification Terms,2219-T87 Base Metal at 780 K (-3200F),RT Direction (Data Taken From Ref. (4))

I a/2c - 0.10 2219-T87 BASE METAL 200K (-423oF)
O a/2C - 0.40 RT DIRECTION t - 1.588 cm (0.625 IN.)
70 7 70 -
PREDICTED FROM - 60 60
60 REF- 4 a/2c= 0.40 60
50 - - 49.53 AVG. -050- 505o- (45.07) 6) o0o
S.D. = 3.84 aS40 40 (3.49) 40
40 a/2c = 0.10 o 40
E 30 E 3030 C-Uo o30- 30
2020- 20 20
10 - a: Irwin (3) 10 10- c: Shah(12) -0o
0c: Shah1 21
SI I I I I I I I I I I I I0 0.10 0.20 0.30 0.40 0.50 0.60 0.70 0.80 0.90 0 0.10 0.20 0.30 0.40 0.50 0.60 0.70 0.80 0.90
alt a/t
70 - 70-
56.19 AVG. 58.44 AVG.60 (51.13) 9 60 (53.18) ____1.13 --'-- 50 S.D. = 1.69 6- 50
S.D. = 1.91 .(1.54) 0(1.74) 50
E 30
440 -40
S30 0 - 303 30-
020- v 2
10 - 0 10 - - 1010 b: Masters (4) d: Smith (11 -
0 I I I I l I I I o 1 II0 0.10 0.20 0.30 0.40 0.50 0.60 0.70 0.80 0.90 0 0.10 0.20 0.30 0.40 0.50 0.60 0.70 0.80 0.90
a/t a/t
Figure 28: Comparison of Magnification Terms,2219- T87 Base Metal at 200 K (-4230F),RT Direction (Data Taken From Ref. 4)

THICKNESS a/2ccm (INCH) - 0.25
1.91 (0.75) 01.27 (0.50) 9 7075-T651 ALUMINUM0.51 (0.20) ROOM TEMP., WT DIRECTION0.38 (0.15) 0
70 70
60 - 6060 60-
-50 -5050- 50 -
PREDICTED FROM w
REF-4 40 35.44 AVGE O (a/2c0.25) (32.25) 0
z 0a2c0.25)2 30 30- S.D. =3.23 0 Q O 030 -- .30 (2.94)
20- 20 20 - 20
10 10 10(12)010 a: Irwin (3)10 - Shah (2) 10
S 1 1 1 1 I I I I I 0o0 0.10 0.20 0.30 0.40 0.50 0.60 0.70 0.80 0.90 0 0.10 0.20 0.30 0.40 0.50 0.60 0.70 0.80 0.90a/t a/t
70 - 70 -
-60 6060- ,; 60-
50 _ -5050- 0 L 50 040.33 AVG 40.20 AVG.(36.70) 0 - 40 (36.58) 0 -40
407 -- - 40 O --- -M S.D. = 3.26 G o g 0 S.D.- 4.07 0 WO-S(2.97) 30 (3.70) 30
Z 30- 300
10 Masters (4 10 10b: Masters d: Smith (11)
0 I I I I I I I o I I I I I I II 00 0.10 0.20 0.30 0.40 0.50 0.60 0.70 0.80 0.90 0 0.10 0.20 0.30 0.40 0.50 0.60 0.70 0.80 0.90
a/t a/tFigure 29: Comparison of Magnification Terms,7075- T651 Aluminum at Room Temperature,WT Direction
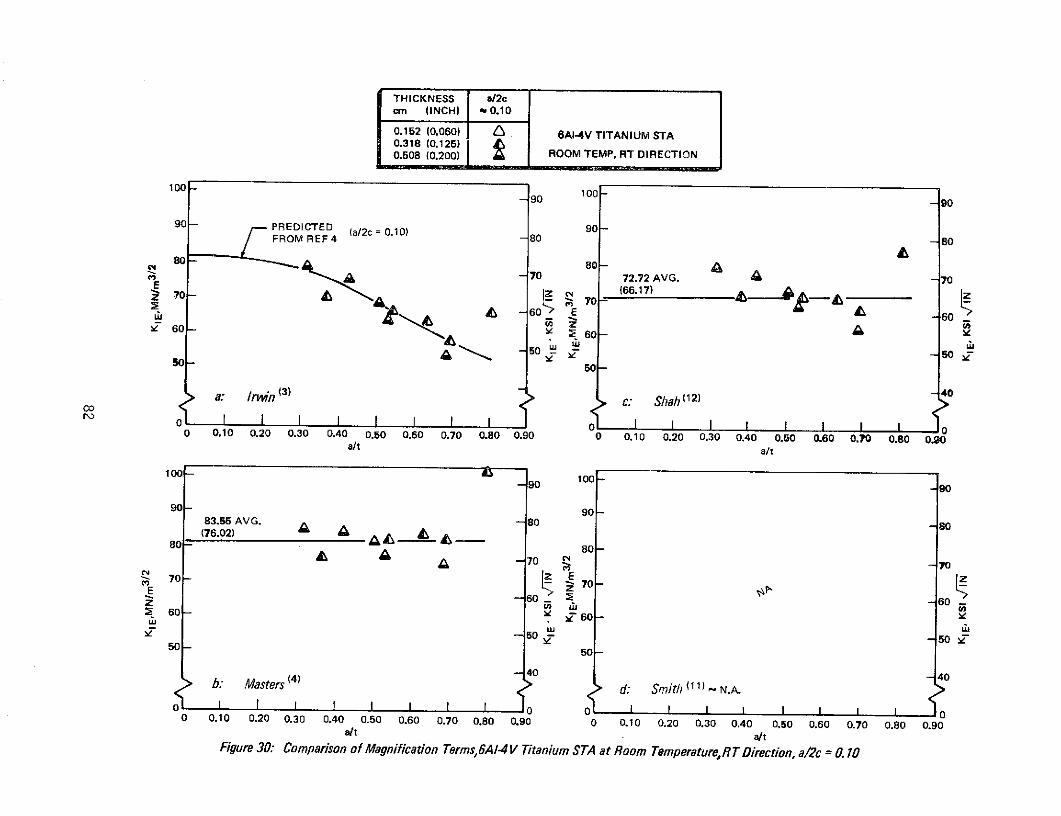
THICKNESS a/2ccm (INCH) j 0.10
0.152 (0.060) I 6AI-4V TITANIUM STA0.318 (0.125)0.508 (0.200) ROOM TEMP, RT DIRECTION
100 90 100 90
90- PREDICTED c 010 90FROM REF4 a/c
= 0.10) - 80 -80
S7 0 72.72 AVG. - 70
70- 70- (66.17)
60 6
50- 50
a: Irwin (3) C: Shah 12 - 40
0 0 00 0.10 0.20 0.30 0.40 0.50 0.60 0.70 0.80 0.90 0 0.10 0.20 0.30 0.40 0.50 0.60 0.70 0.80 0.90
a/t alt
100- d - 90 100- -90
90- 9083.56 AVG. -80 80
(76.02) A0 0
A -70 - 70
70-S 60- 60-0
E
S--50 ~ -5050 50
-40 -40S b: Masters ( d: Smith (11) ~ N.A.
0 0.10 0.20 0.30 0.40 0.50 0.60 0.70 0.80 0.90 0 0.10 0.20 0.30 0.40 0.50 0.60 0.70 0.80 0.90t a/t
Figure 30: Comparison of Magnification Terms,6A/-4V Titanium STA at Room Temperature, RT Direction, a/2c = 0. 10
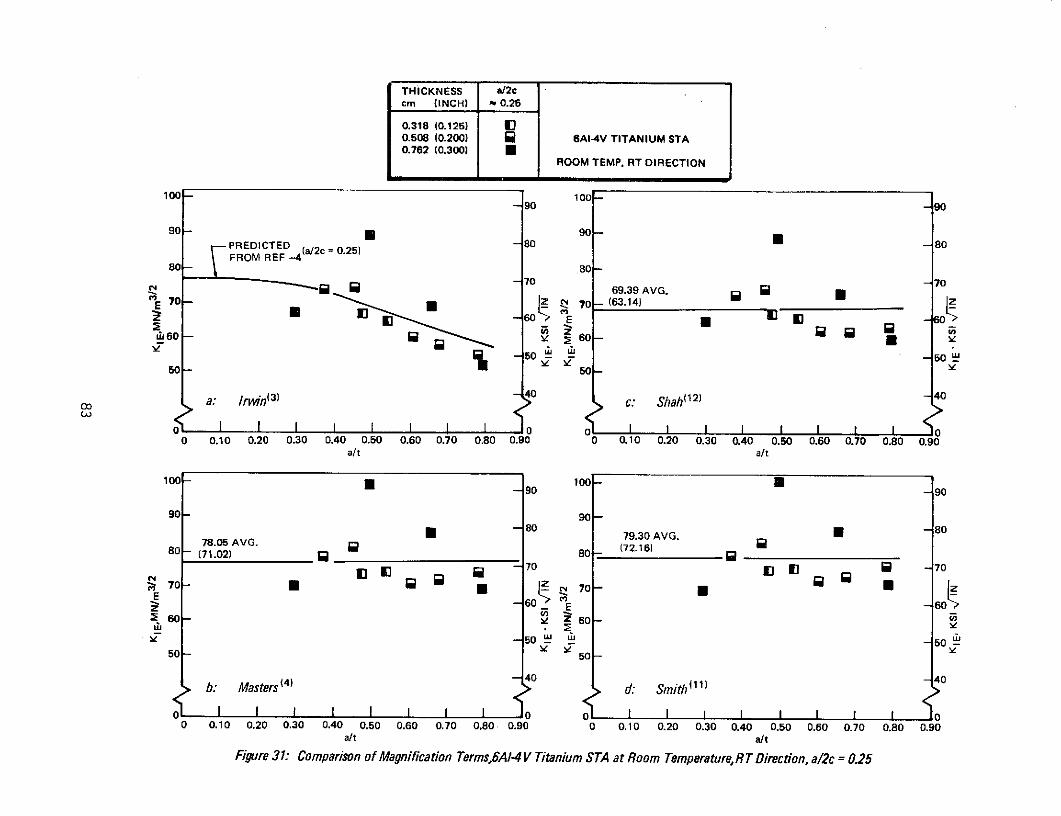
THICKNESS a/2ccm (INCH) - 0.25
0.318 (0.125) 100.508 (0.200) P 6AI-4V TITANIUM STA0.762 (0.300) U
ROOM TEMP, RT DIRECTION
100 - 100 -S90 - 90
90 PREDICTED (a/2c 0.25) - 80 90 80
FROM REF -480- 80-
S0 70 69.39 AVG. - 70
70- 70- (63.14)
d6 E 60
Ica W- -5 -50 "50- - 50
a: Irwin(3 ) 4 c: Shah(12) -40
I I I I I I 0I I I I I I I0 0.10 0.20 0.30 0.40 0.50 0.60 0.70 0.80 0.90 0 0.10 0.20 0.30 0.40 0.50 0.60 0.70 0.80 0.90
alt a/t
100- E 90 100- 9
90- 90-7 -80 79.30 AVG. -80
78.05 AVG. (72.16)80 (71.02) 80- (72.16)E ] 1 70 I - 70
E 70- U 70 -60 E 60
60- Z 60-
-50 -5050- 50
40 40b: Masters (4) d: Smith (11 )
l0 I0 0 I I I0II I I0 0.10 0.20 0.30 0.40 0.50 0.60 0.70 0.80 0.90 0 0.10 0.20 0.30 0.40 0.50 0.60 0.70 0.80 0.90
a/t a/t
Figure 31: Comparison of Magnification Terms,6AI-4V Titanium STA at Room Temperature, RT Direction, a/2c = 0.25
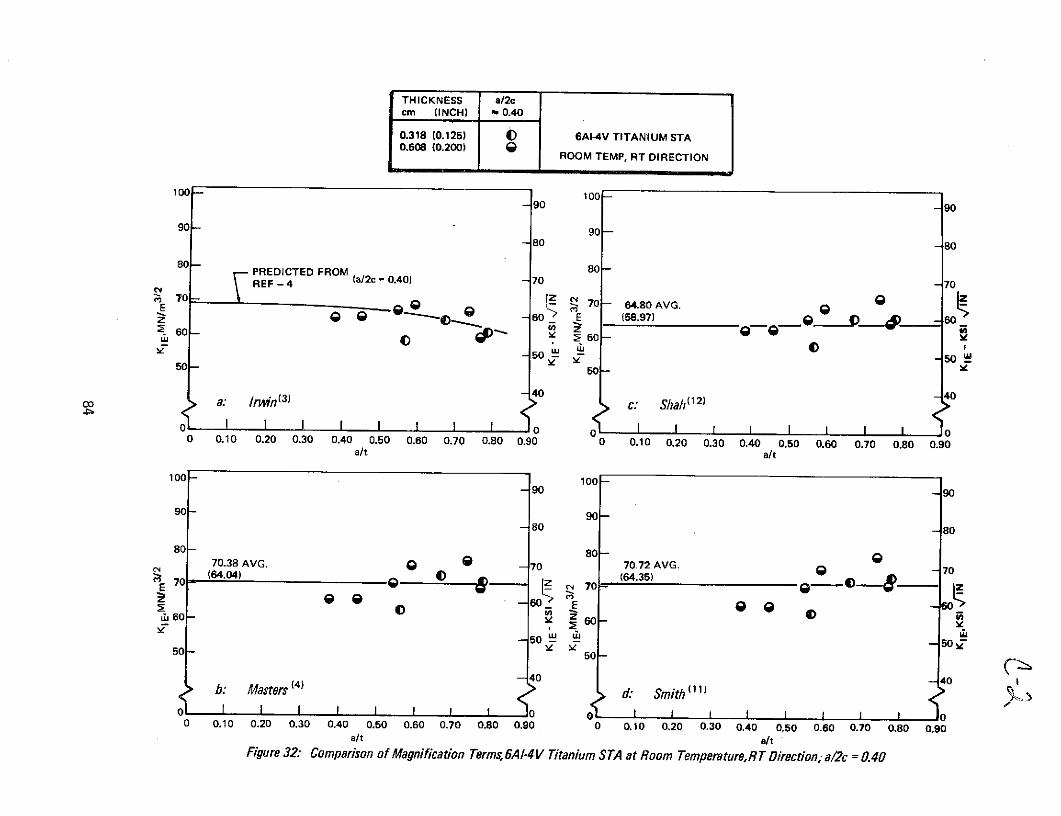
THICKNESS a/2ccm (INCH) - 0.40
0.318 (0.125) D 6AI-4V TITANIUM STA0.508 (0.200) 8 ROOM TEMP. RT DIRECTION
100 9- 1009090
90- 9080 80
PREDICTED FROM 80 -REF - 4 (a/2c = 0.40) -70 70
_E 70 -I 70 64.80 AVG. 9S------ -60 E (58.97) - 60
S60 z6u 0 : 60
50 -5050- 50 l
a rn(3) -40 C: Shah(12) 40o I ! I I I I I 0 0 I I I I I I I I o
0 0.10 0.20 0.30 0.40 0.50 0.60 0.70 0.80 0.90 0 0.10 0.20 0.30 0.40 0.50 0.60 0.70 0.80 0.90a/t a/t
100- 100-90 90
90 - 90 -80 -80
80 - 80 -70.38 AVG. - 870 70.72 AVG. 70
7 (64.04) 0 (64.35) - 70
u 60 - E 66
-50 - 50
50 - 50 -
-40 -40
b: Masters (4) 4 , d: Smith (11)
0 0.10 0.20 0.30 0.40 0.50 0.60 0.70 0.80 0.90 0 0.10 0.20 0.30 0.40 0.50 0.60 0.70 0.80 0.90a/t alt
Figure 32: Comparison of Magnification Terms,6A1-4V Titanium STA at Room Temperature,RT Direction, a/2c = 0.40
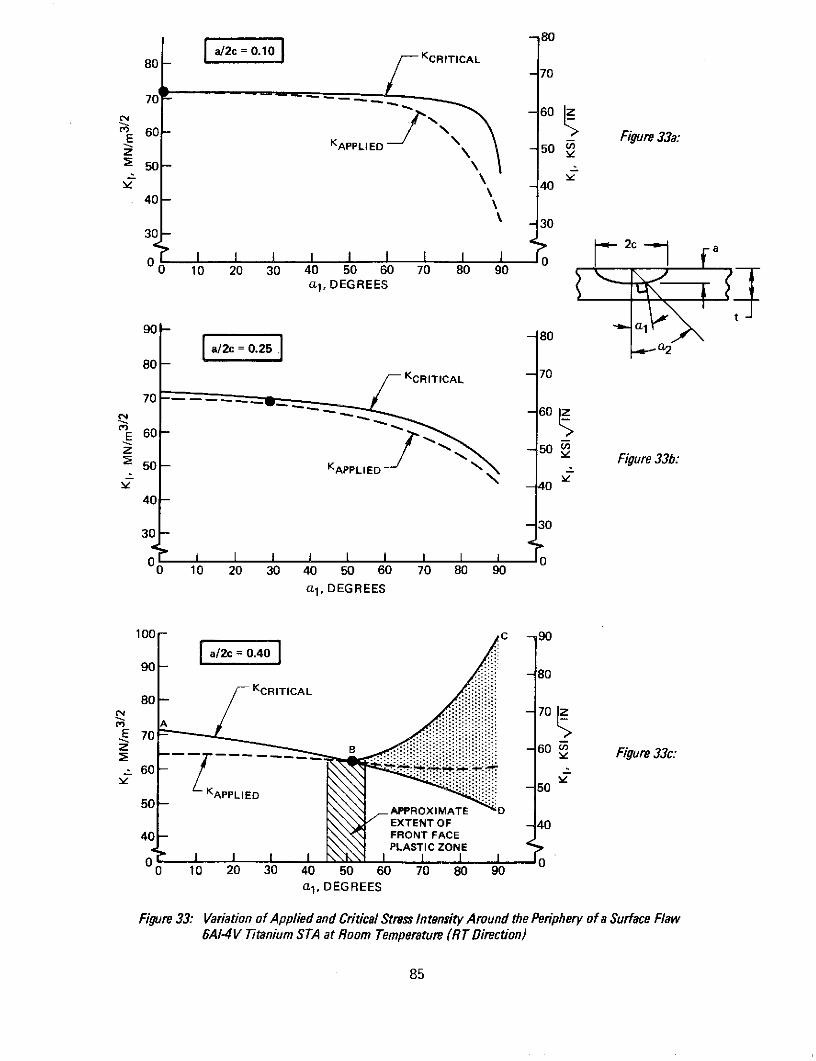
80 I - I KCRITICAL70
670
E 60P- K Figure 33a:APPLIED - 50uz l
4040
3030
S I I I I I I0 10 20 30 40 50 60 70 80 90
al, DEGREES
90- "-801 al
a/2c 0.25 a280-
KCRITICAL -70
N 70 -60
E 60
z 5050- KAPPLIED Figure 33b:
-4040-
3030-
-- ,A
0 10 20 30 40 50 60 70 80 90
al, DEGREES
100 - -90
a/2c = 0.4090 80
KCRITICAL807
S70 70
60 ---------- Figure 33c:60 -
5 KAPPLIED 50
50 50 APPROXIMATE DEXTENT OF - 40
40- FRONT FACEPLASTIC ZONE
0 10 20 30 40 50 60 70 80 90
a1 , DEGREES
Figure 33: Variation of Applied and Critical Stress Intensity Around the Periphery of a Surface Flaw6A1-4V Titanium STA at Room Temperature (RT Direction)
85
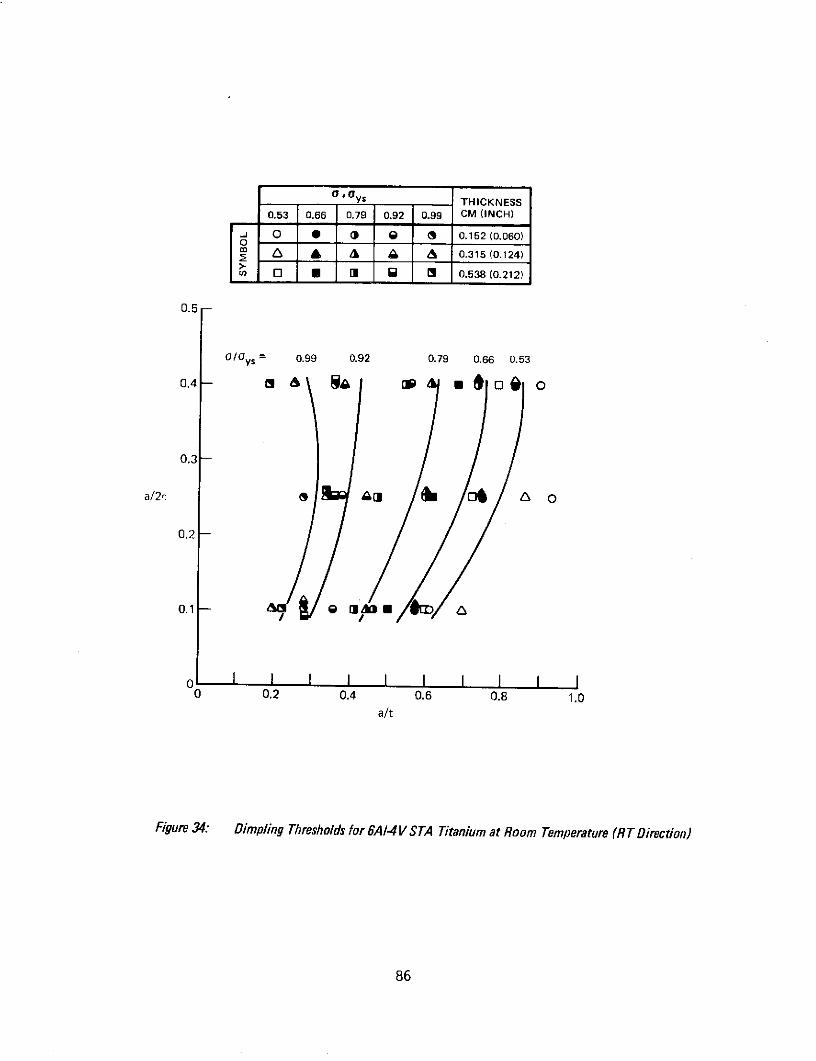
clays THICKNESS
0.53 0.66 0.79 0.92 0.99 CM (INCH)
-j 0 _ @ 0.152 (0.060)
A / A a& _ 0.315 (0.124)
O I [ { 0.538 (0.212)
0.5-
O/Oy s = 0.99 0.92 0.79 0.66 0.53
0.4 - 8 0 O
0.3
/2* a A # 6 O 0
0.2
0.1 Q N&3E A
0 0.2 0.4 0.6 0.8 1.0
a/t
Figure 34: Dimpling Thresholds for 6A1-4V STA Titanium at Room Temperature (RT Direction)
86
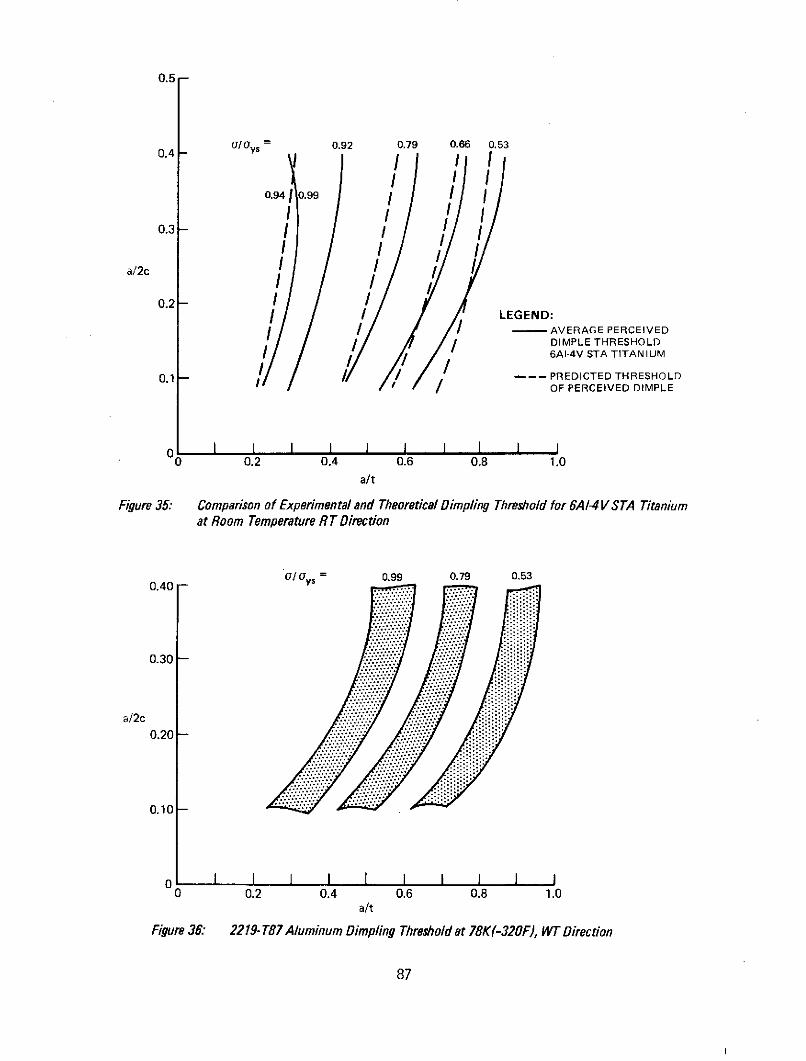
0.5
0.4- /ys = 0.92 0.79 0.66 0.53
I II
0.941 0.99I I
0.3 - I II 1 II I
a/2c II /I
0.2 I/ / / LEGEND:
S- AVERAGE PERCEIVED' // DIMPLE THRESHOLD
I 6Al-4V STA TITANIUM
0.1/ --- PREDICTED THRESHOLDS/ OF PERCEIVED DIMPLE
0 0.2 0.4 0.6 0.8 1.0a/t
Figure 35: Comparison of Experimental and Theoretical Dimpling Threshold for 6A1-4V STA Titaniumat Room Temperature R T Direction
U/ ys = 0.99 0.79 0.530.40 -s
0.30 -
a/2c0.20-
0.10-
o I I I I I I I I0 0.2 0.4 0.6 0.8 1.0
a/t
Figure 36: 2219-T87 Aluminum Dimpling Threshold at 78K(-320F), WTDirection
87
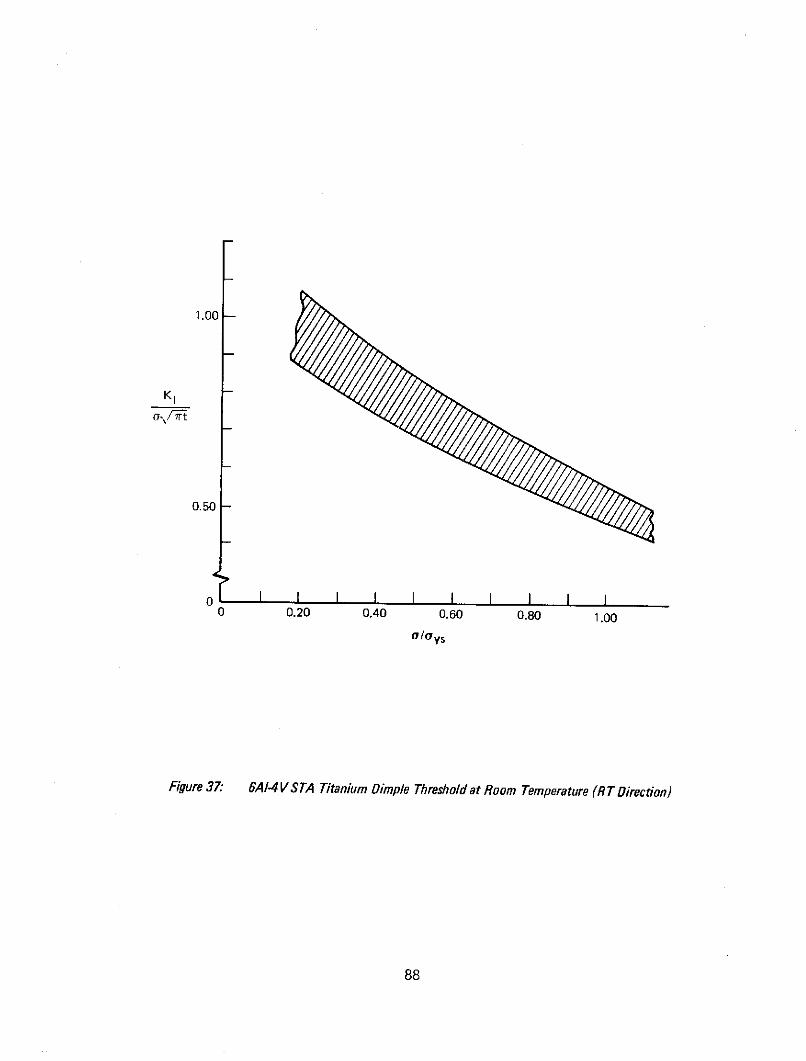
1.00
K1
0.50
0 0.20 0.40 0.60 0.80 1.00
o/oys
Figure 37: 6A-4 V STA Titanium Dimple Threshold at Room Temperature (RT Direction)
88
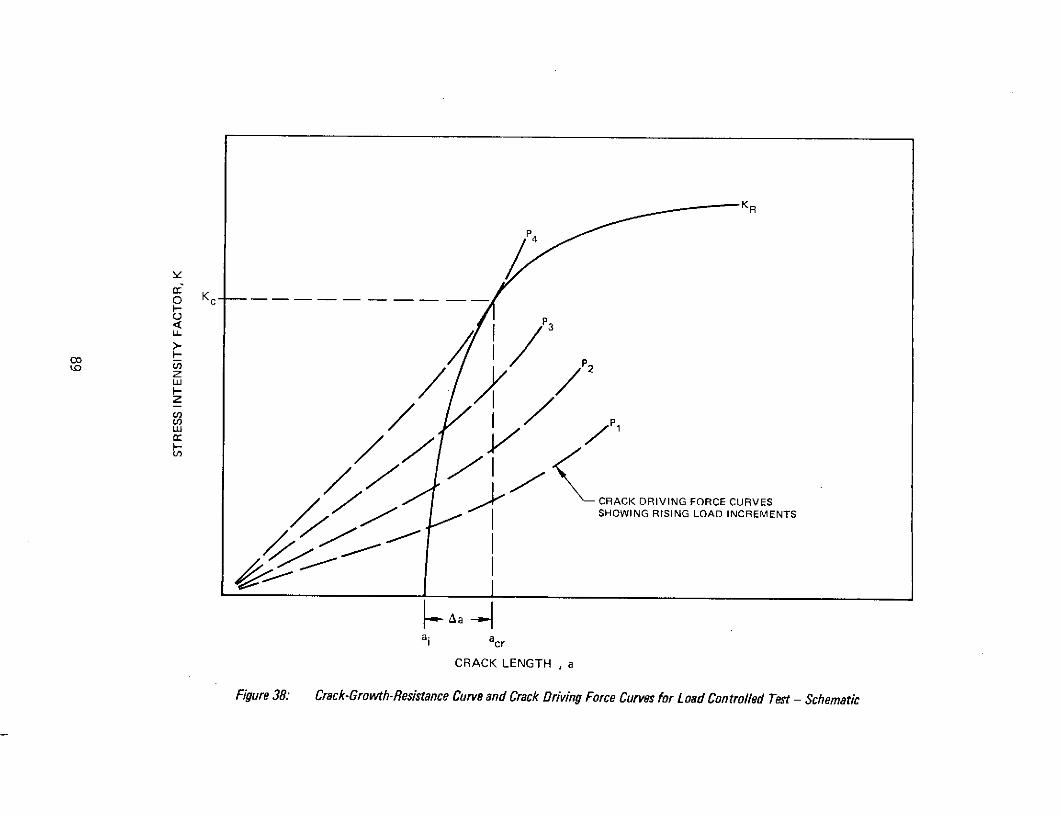
0 K
P3
co
wp3
SHOWING RISING LOAD INCREMENTS
00 -
ai acr
CRACK LENGTH , a
Figure 38: Crack-Growth-Resistance Curve and Crack Driving Force Curves for Load Controlled Test - SchematicFigure 38:- Crack-Growth-Resistance Curve and Crack Driving Force Curves for Load Controlled Test - Schematic
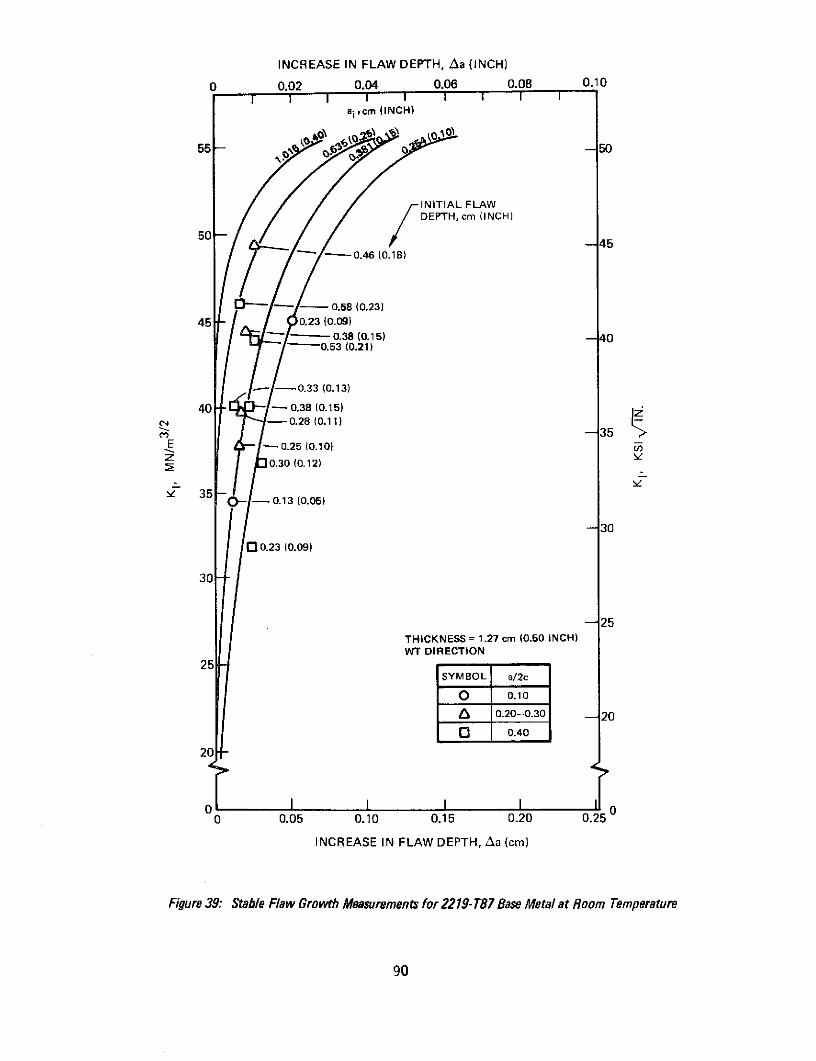
INCREASE IN FLAW DEPTH, Aa (INCH)
0 0.02 0.04 0.06 0.08 0.10I I II II
ai ,cm (INCH)
150
INITIAL FLAWDEPTH, cm (INCH)
50 -45
-/ - 0.46 (0.18)
0 -- - 0.58 (0.23)45 0.23 (0.09)
- 0.38 (0.15) -40-0.53 (0.21)
- -0.33 (0.13)
40 - 0.38 (0.15)C4 -0.28 (0.11)
-35E - 0.25 (0.10)z v0.30 (0.12)
Y 35 3 I- 0.13 (0.05)
-30
0 0.23 (0.09)
30
-25
THICKNESS = 1.27 cm (0.50 INCH)WT DIRECTION
25SYMBOL a/2c
O 0.106 0.20-0.30 - 20
0 0.40
20
01 00 0.05 0.10 0.15 0.20 0.25
INCREASE IN FLAW DEPTH, Aa (cm)
Figure 39: Stable Flaw Growth Measurements for 2219-T87 Base Metal at Room Temperature
90
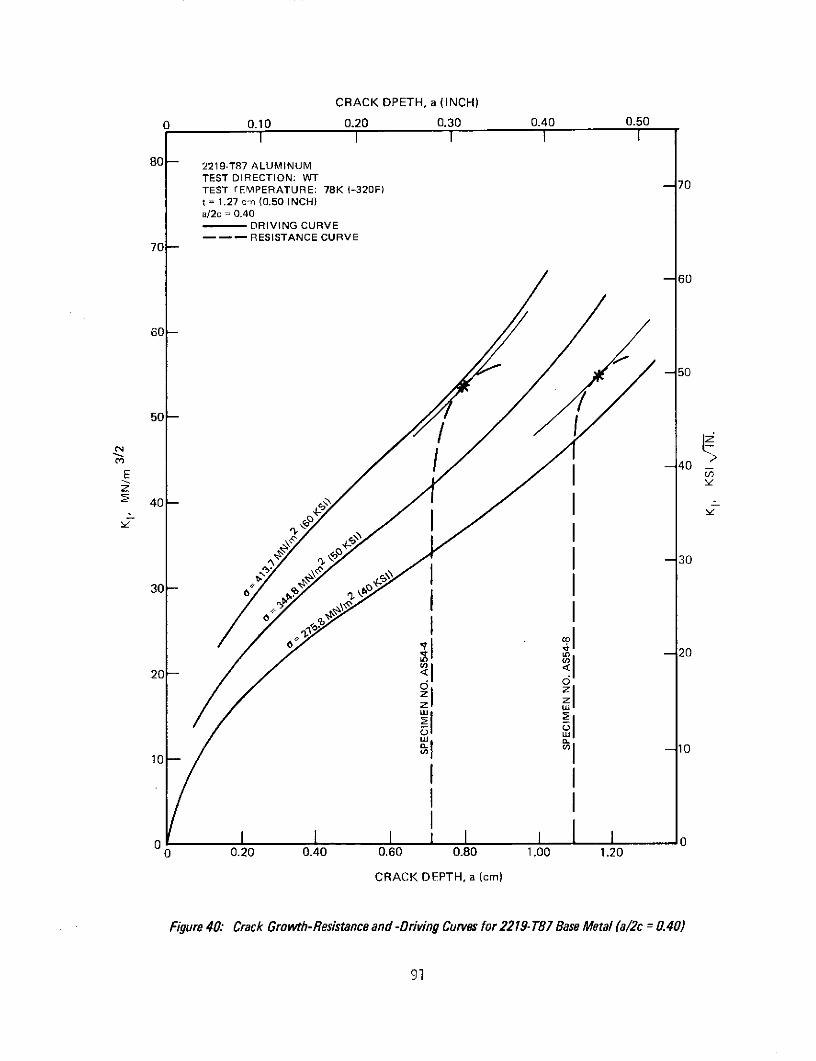
CRACK DPETH, a (INCH)
0 0.10 0.20 0.30 0.40 0.50I I I I I
80 2219-T87 ALUMINUM
TEST DIRECTION: WTTEST TEMPERATURE: 78K (-320F) -70t = 1.27 cm (0.50 INCH)a/2c = 0.40-DRIVING CURVE--- RESISTANCE CURVE
70-
-60
60-
-50
50-
40-40
S-30/ ,
30 0
In 20
20- < <
10
zi I
0 I0 I I I I I I 00 0.20 0.40 0.60 0.80 1.00 1.20
CRACK DEPTH, a (cm)
Figure 40: Crack Growth-Resistance and -Driving Curves for 2219- T87 Base Metal (a/2c = 0.40)
91
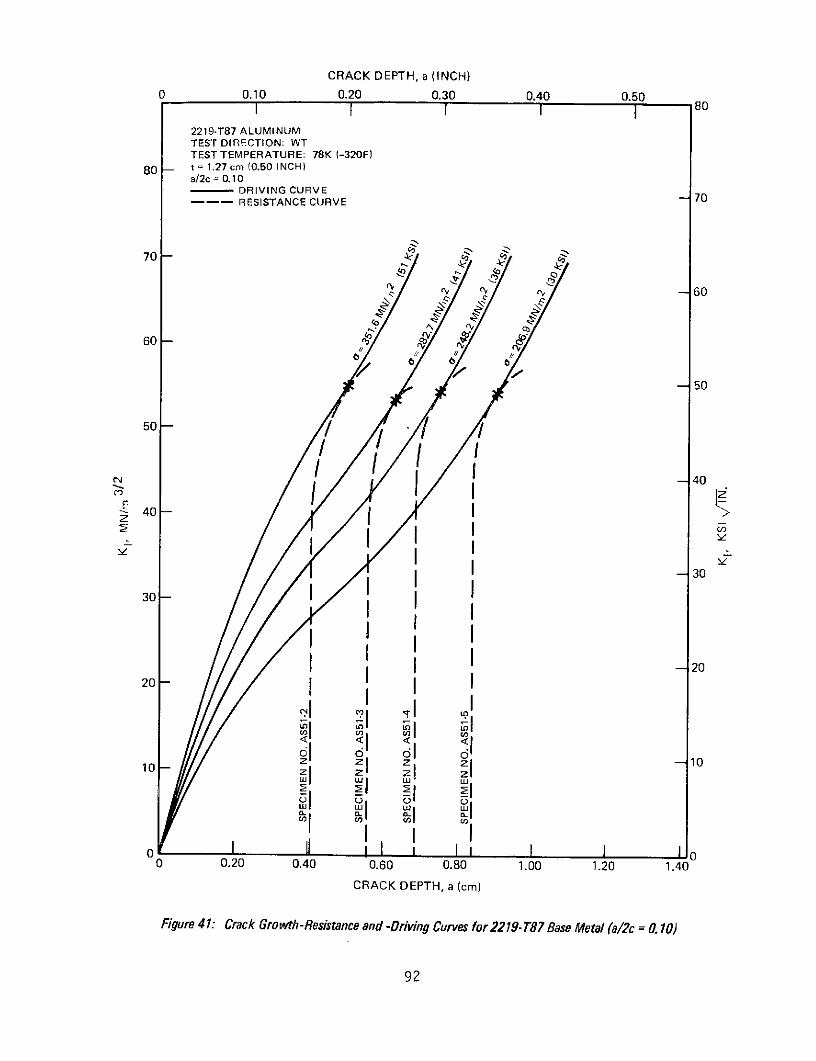
CRACK DEPTH, a (INCH)
0 0.10 0.20 0.30 0.40 0.50SI I I 80
2219-T87 ALUMINUMTEST DIRECTION: WTTEST TEMPERATURE: 78K (-320F)
80 - t = 1.27 cm (0.50 INCH)a/2c
= 0. 10DRIVING CURVE
--- RESISTANCE CURVE -70
70 ' '
6 -60
60 -
- 50
50- -
0 40
30 30
0 I- 2020 5
SIz z z - 1010- z z z50 1 1 _1I I I
o I I I I n I I I I I 0
0 0.20 0.40 0.60 0.80 1.00 1.20 1.40
CRACK DEPTH, a (cm)
Figure 41: Crack Growth-Resistance and -Driving Curves for 2219-T87 Base Metal (a/2c = 0. 10)
92

ULTIMATESTRENGTH
0.90 x YIELDSTRENGTH
THICKNESS
a/2c = CONSTANT
REGION 11
FLAW DEPTH, a
Figure 42: Generalized Stress Versus Flaw Depth Relationship for Static Fracture
93
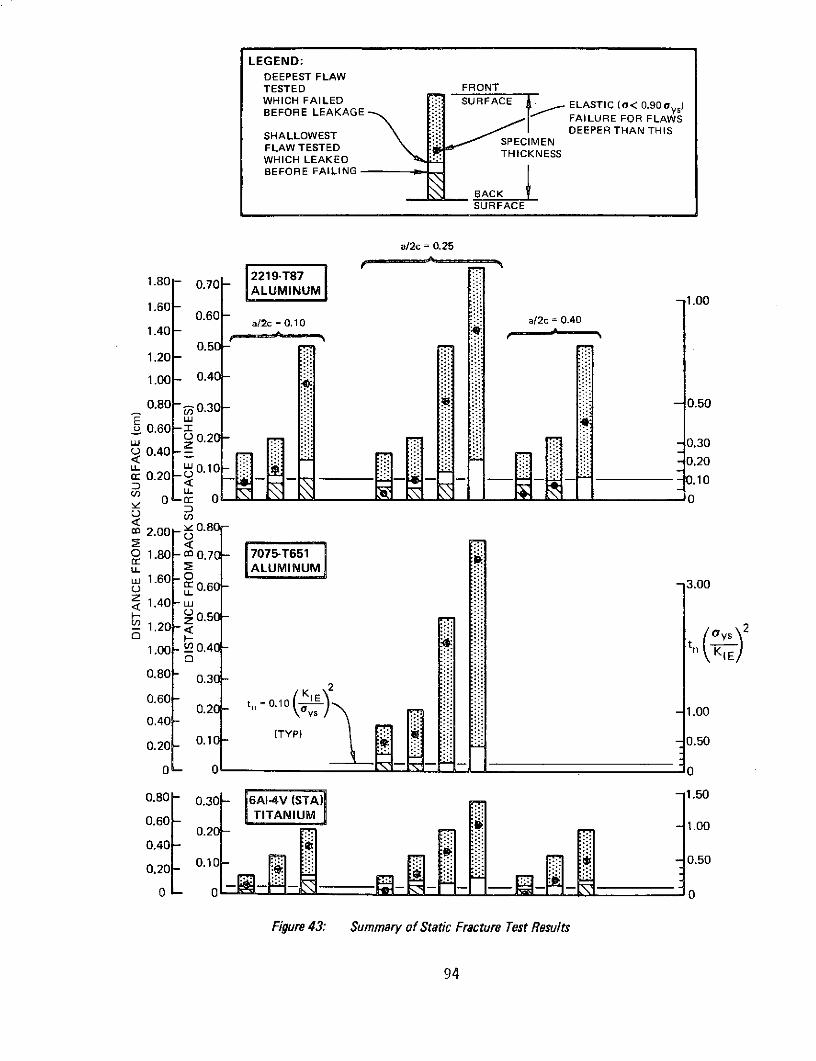
LEGEND:DEEPEST FLAWTESTED FRONT
WHICH FAILED SURFACE ELASTIC ( .90BEFORE LEAKAGE ELASTIC ys
FAILURE FOR FLAWSDEEPER THAN THISSHALLOWEST
FLAW TESTEDWHICH LEAKED THICKNESSBEFORE FAILING
SURFACE
a/2c = 0.25
2219-T871.80- 0.70-ALUMINUM
-1.001.60 -0.60 - a/2c= 0.10 a/2c
= 0.401.40-
0.51.20 -
1.00- 0.40 -
0.80 0.30 - 0.50
S0.60 -- 20w 0.20 - 0.300 0.40 -
S02 -0.200
0.10.1
, r 0
0 - 0 0
m 2.00 -0.80
S1.80 - 0.70 7075T651u. LUMINUM.1
1.60 r 0.60 ::- 3.00
< 1.40 -U 0.50
- 1.20<
1.00 -0.40 - tn KIE
0.80- 0.30-
0.60 / KIE\ 20.6- 0.20 tn =0.10 K I") 1.000.40 -
(TYP)0.20 0.10 -0.50
0- 0 0
0.80- 0.30 - 6A1-4V (STA) -1.50
0.60k "TITANIUM060 0.20 - -1.00
0.20-0.40 -.2 0.10 - -0.50
0.20 V
Figure 43: Summary of Static Fracture Test Results
94
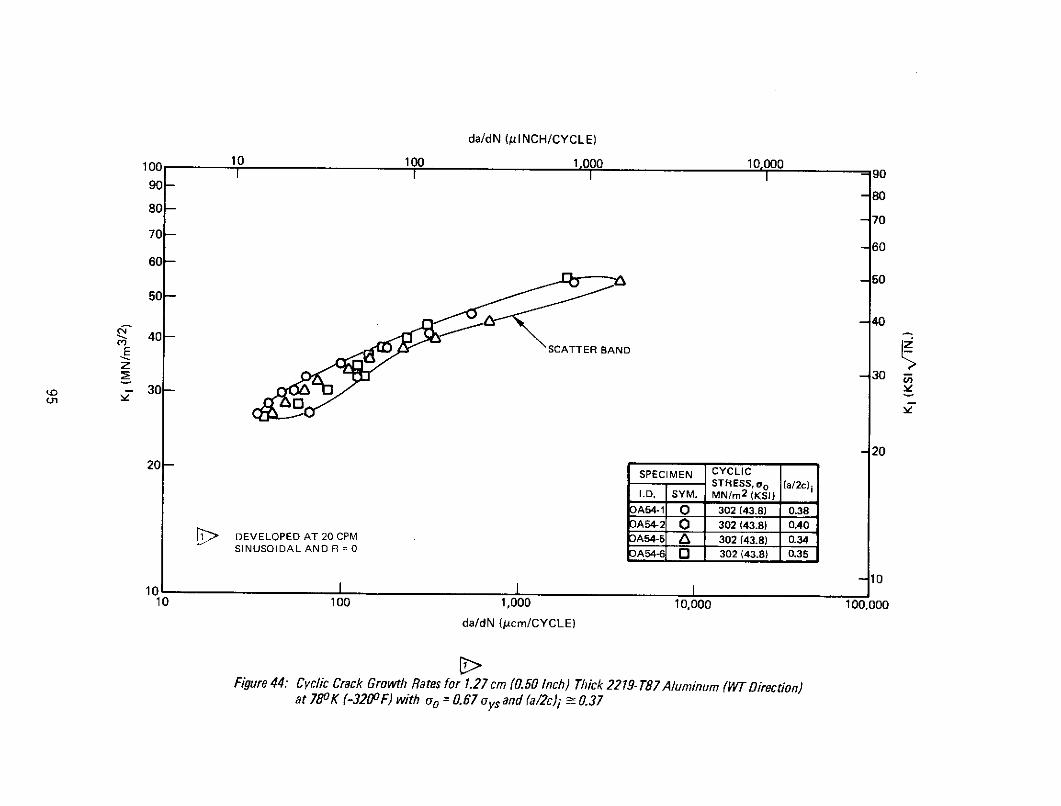
da/dN (pINCH/CYCLE)
100 10 100 1.000 10,000I I I I - 9O90 -80
808080-- 70
70-
60-
-50
50-
40-40
lE SCATTER BAND
-3030-
- 20SPECIMEN CYCLIC
STRESS, o (a/2c)iI.D. SYM. MN/m 2
(KSI)
3A54-1 0 302 (43.8) 0.38A54-2 0 302 (43.8) 0.40
DEVELOPED AT 20 CPM DA54-5 a 302 (43.8) 0.34SINUSOIDAL AND R = 0 DA54-6 3 302 (43.8) 0.35
101010 II10 100 1,000 10,000 100,000
da/dN (micm/CYCLE)
Figure 44: Cyclic Crack Growth Rates for 1.27 cm (0.50 Inch) Thick 2219- T87 Aluminum (WT Direction)at 780 K (-320oF) with oo = 0.67 aysand (a/2c)i _ 0.37

da/dN (pINCH/CYCLE)
100 10 100 1,000 10,000III-90
90--8080
80-- 70
70-- 60
60-
-5050-
-4040-
E SCATTER BAND -30
Z 30-
- 2020- SPECIMEN CYCLIC
STRESS, o (a/2c)iI.D. SYM. MN/m2 (KSI)
OA51-1 0 302 (43.8) 0.29OA51-2 0 302 (43.8) 0.30OA51-5 a 302 (43.8) 0.30
OEVELOPED AT 20 CPM OA51-6 O 302 (43.8) 0.29SINUSOIDAL AND R 0-
10o I I I10 100 1,000 10,000 100,000
da/dN (pcm/CYCLE)
Figure 45: Cyclic Crack Growth Rates for 1.27 cm (0.50 Inch) Thick 2219-T87A/uminum (WT Direction)at 780 K (-320OF) with o0 = 0.67 oys and (a/2c)i 0.30
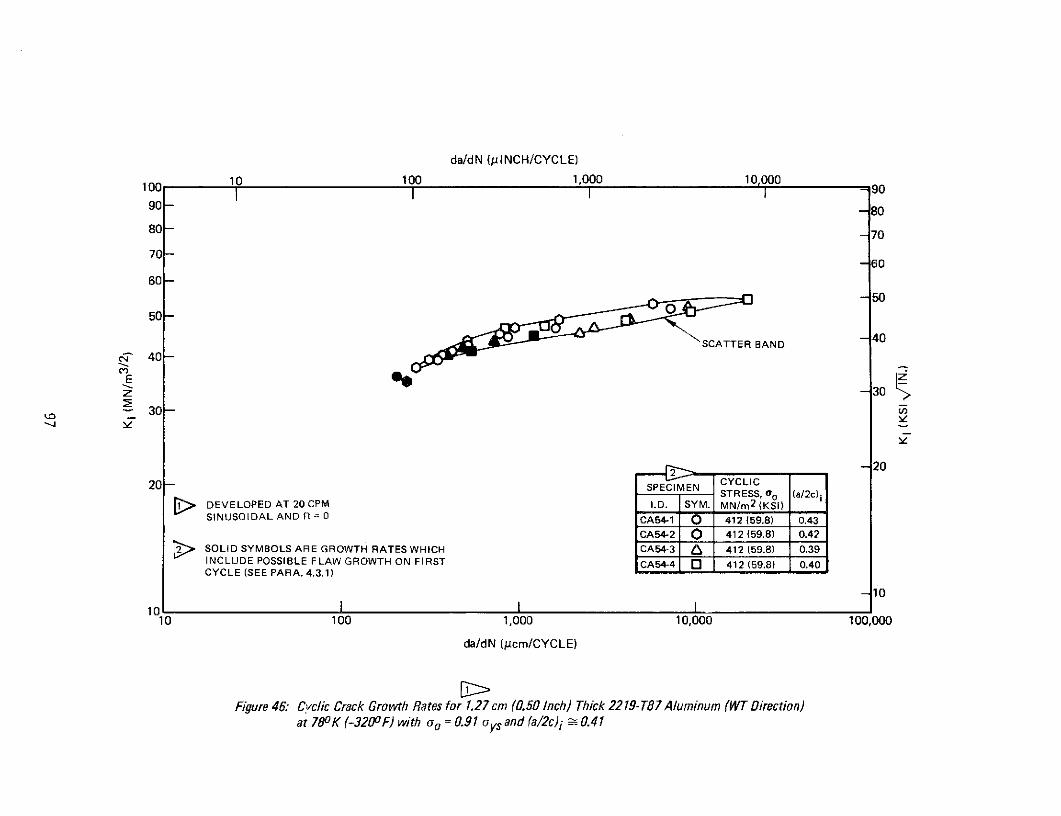
da/dN (pINCH/CYCLE)
100 10 100 1,000 10,000
90- - 80
80 - - 70
70 -
60-
-5050- O
SCATTER BAND -40
c- 40-
z -30
30 -
-20CYCLIC 20
20 - SPECIMEN CYCLICSTRESS, 00 (a/2c)
> DEVELOPED AT 20 CPM I.D. SYM. MN/m2 ( K S I )
SINUSOIDAL AND R = 0 CA54-1 0 412 (59.8) 0.43
CA54-2 0 412 (59.8) 0.42
SSOLID SYMBOLS ARE GROWTH RATES WHICH CA54-3 6 412 (59.8) 0.39INCLUDE POSSIBLE FLAW GROWTH ON FIRST CA54-4 0 412 (59.8) 0.40CYCLE (SEE PARA. 4.3.1)
010
10 100 1,000 10,000 100,000
da/dN (icm/CYCLE)
Figure 46: Cyclic Crack Growth Rates for 1.27cm (0.50 Inch) Thick 2219- T87 Aluminum (WT Direction)at 780 K (-3200F) with o = 0.91 oys and (a/2c)i 0.41
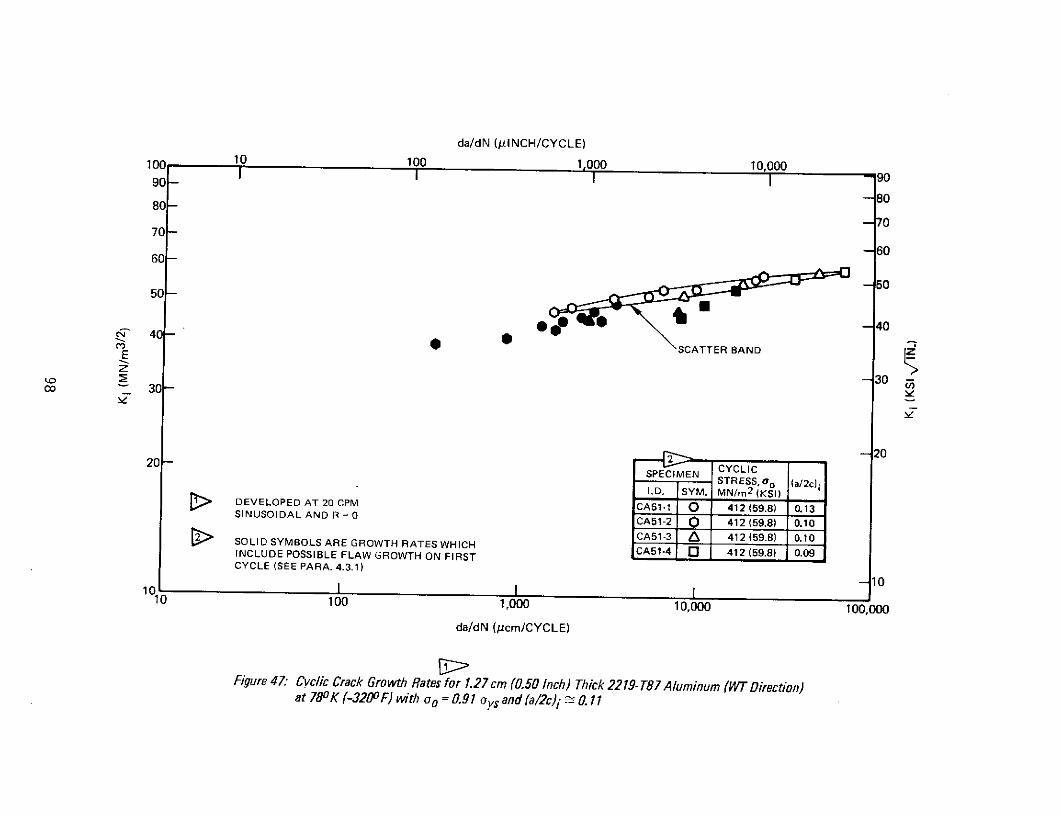
da/dN (pINCH/CYCLE)
10 10 100 1,000 10,00090- I I -C E 90
-8080- - 80
-7070-
- 6060-
50 - -50
67" 40- --40
C, 40SCATTER BAND
2 -30130
20- CYCLIC- 2020SPECIMEN CYCLICSTRESS, o (a/2c)
iI.D. SYM. MN/m 2(KSI)
DEVELOPED AT 20 CPM CA51-1 O 412 (59.8) 0.13SINUSOIDAL AND R = 0 CA51-2 O 412 (59.8) 0.10
CA51-3 6 412 (59.8) 0.10SSOLID SYMBOLS ARE GROWTH RATES WHICH 1INCLUDE POSSIBLE FLAW GROWTH ON FIRST CA51-4 0 412 (59.8) 0.09CYCLE (SEE PARA. 4.3.1)
- 010 1 I I
10 100 1,000 10,000 100,000
da/dN (pcm/CYCLE)
Figure 47: Cyclic Crack Growth Rates for 1.27cm (0.50 Inch) Thick 2219-T87 Aluminum (WT Direction)at 780 K (-320O0F) with o0 = 0.91 ys and (a/2c)i 0.11

da/dN (pINCH/CYCLE)
100 10 100 1,000 10,000
90- -80
80 -- 70
70-
60-
-50
50-
-40SCATTER BAND
e" 40-
Ez -30
30-
CYCLIC -20
20 - SPECIMEN CYCLICSTRESS, o0 (a/2c)iI.D. SYM MN/m2 (KSI)
DEVELOPED AT 20 CPMSYM MN/2 (KS)
SINUSOIDAL AND R = 0 CA24-1 0 412 (59.8) 0.42
CA24-2 0 412 (59.8) 0.40
SSOLID SYMBOLS ARE GROWTH RATES WHICH CA24-3 412(59.8) 0.38INCLUDE POSSIBLE FLAW GROWTH ON FIRST CA24-4 O 412 (59.8) 0.39CYCLE (SEE PARA. 4.3.1)
010
10 I I I10 100 1,000 10,000 100,000
da/dN (pcm/CYCLE)
Figure 48: Cyclic Crack Growth Rates for 0.51 cm (0.20 Inch) Thick 2219-T87 Aluminum (WT Direction)at 780 K (-3200F) with oo = 0.91 oys and (a/2c)i - 0.40

da/dN (plNCH/CYCLE)
10 100 1,000 10,000 9010 I I I90- - 80
80- -70
70- -60
60- -50
50-
-40
40- SCATTER BAND
0 L- 30E AE 30-
- 20
CYCLIC
20
20 SPECIMEN STRESS, o o (a/2c) iI.D. SYM. MN/m 2 (KSI)
> DEVELOPED AT 20 CPM CA21-2 0 412(59.8) 0.10SINUSOIDAL AND R = 0 CA21-5 O 412 (59.8) 0.08
SOLID SYMBOL IS GROWTH RATE WHICH CA21-6 412 (59.8) 0.08j
INCLUDES POSSIBLE FLAW GROWTH ONFIRST CYCLE (SEE PARA.4.3.1)
-10
100 100 1,000 10,000 100,000
da/dN (mcm/CYCLE)
Figure 49: Cyclic Crack Growth Rates for 0.51 cm (0.20 Inch) Thick 2219-T87 Aluminum (WT Direction)
at 780K (-3200F) with o = 0.91 oys and (a/2c)i : 0.09
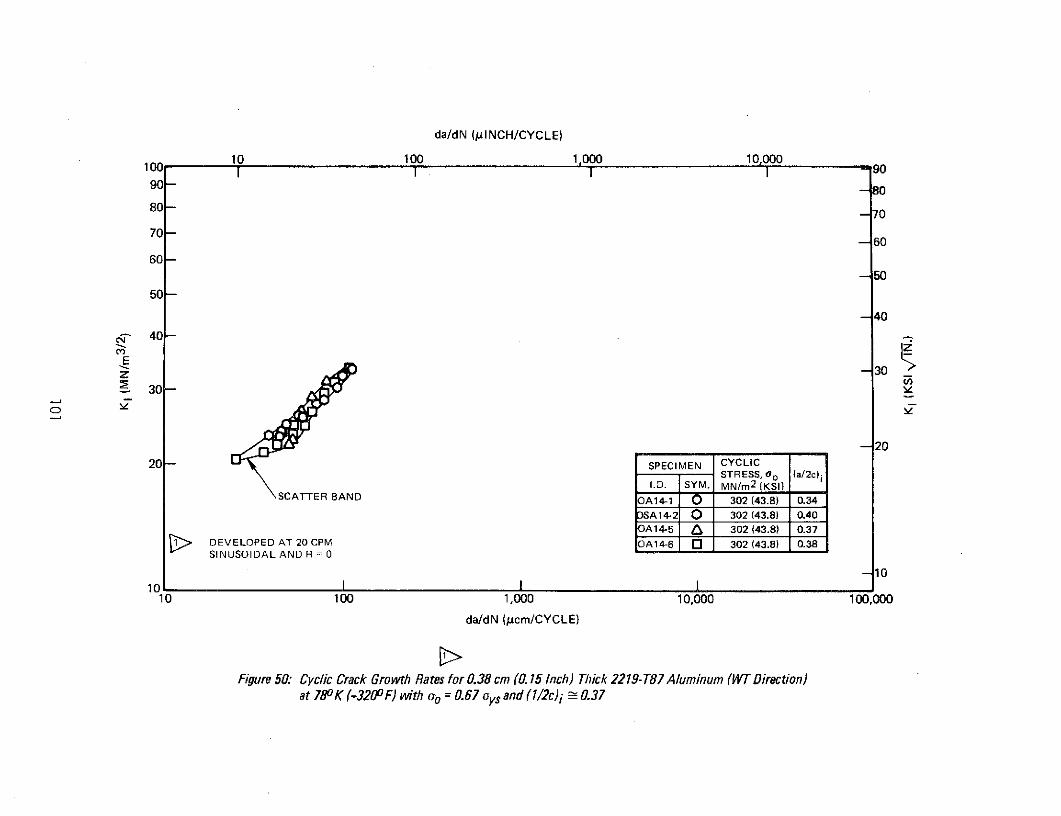
da/dN (plNCH/CYCLE)
10 100 1,000 10,000I I I I - 9o90-
90- 8080 - - 70
70 60- 60
60--50
50-
-40
40-
-E3 30
- 20
20 - SPECIMEN CYCLICSTRESS, oo (a/2c) i
I.D. SYM. MN/m 2(KSI)
SCATTER BAND A14-1 302 (43.8) 0.34
SA14-2 O 302 (43.8) 0.40OA14-5 / 302 (43.8) 0.37
DEVELOPED AT 20 CPM OA14-6 3 302 (43.8) 0.38SINUSOIDAL AND R = 0
-1010 I I I
10 100 1,000 10,000 100,000
da/dN (pcm/CYCLE)
Figure 50: Cyclic Crack Growth Rates for 0.38 cm (0. 15 Inch) Thick 2219-T87 Aluminum (WT Direction)at 780 K (-3200 F) with ao = 0.67 aysand (1/2 c)i 0.37
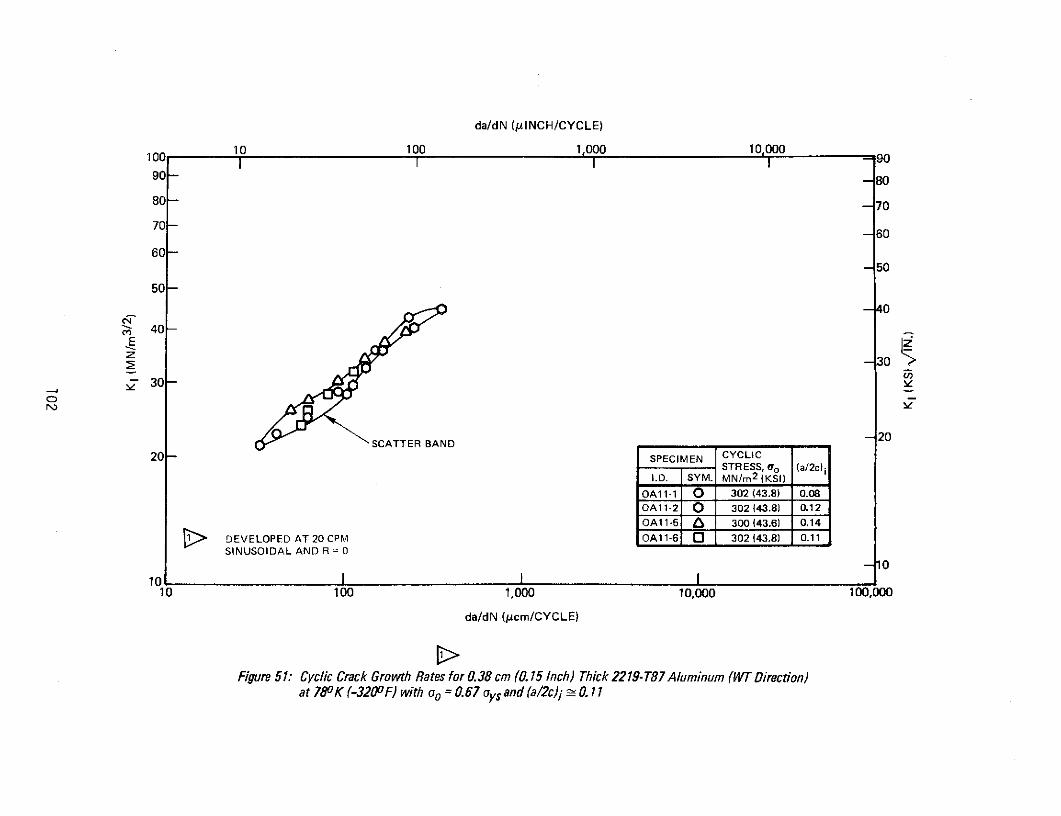
da/dN (jINCH/CYCLE)
10 10 100 1,000 10,00090-0
-80
80 -70 -70
70 -
60-
50
50-
40
- 40-Ez 30
.30-
SCATTER BAND - 20
20 - SPECIMEN CYCLICSTRESS, go (a/2c)i
I.D. SYM. MN/m 2 (KSI)
OA11-1 O 302 (43.8) 0.08OA11-2 O 302 (43.8) 0.12
OA11-5 a 300 (43.6) 0.14OA1-6 302(43.8) 0.11
DEVELOPED AT 20 CPM OA11-6 O 302 (43.8) 0.11SINUSOIDAL AND R = 0
101010 1 I I
10 100 1,000 10,000 100,000
da/dN (Mcm/CYCLE)
Figure 51: Cyclic Crack Growth Rates for 0.38 cm (0.15 Inch) Thick 2219-T87 Aluminum (WT Direction)at 780K (-3200F) with ao = 0.67 oysand (a/2c)i -0. 11
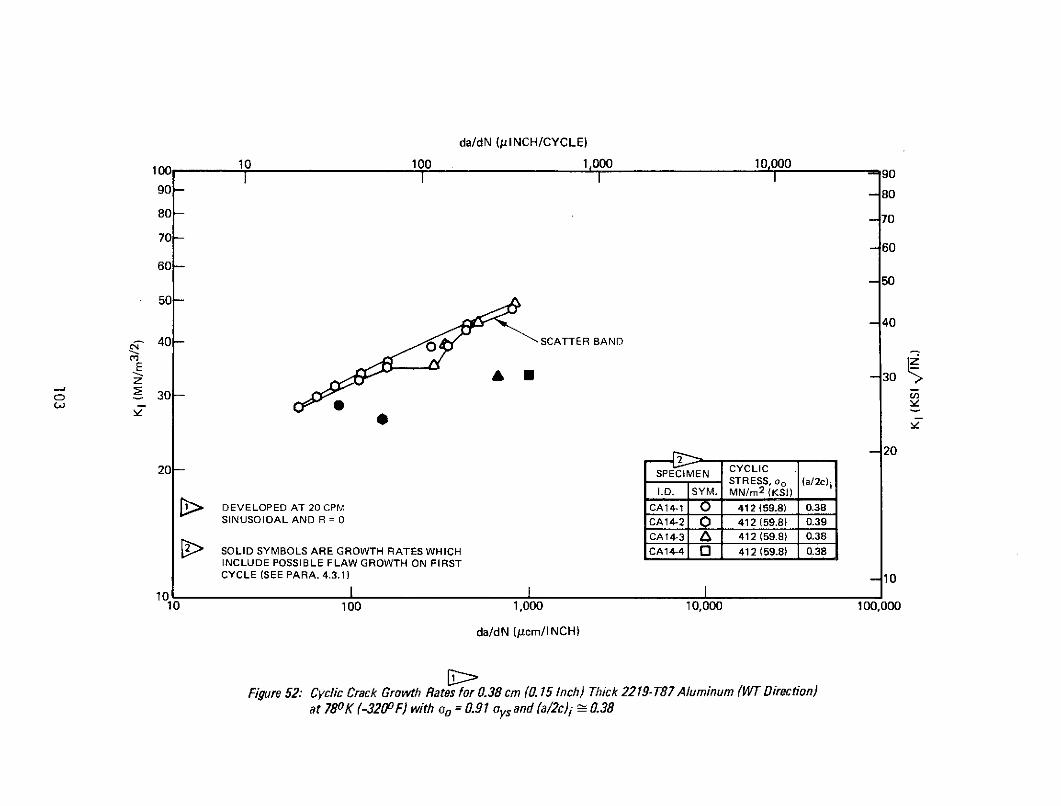
da/dN (lINCH/CYCLE)
100 10 100 1,000 10,00090-90 -- 80
80 -70 -770
70 - -60
60-
-50
50-
-40
40 - SCATTER BAND
0 -30
-4*
20CYCLIC
-20
20 - SPECIMEN CYCLICSTRESS, o (a/2c)i
I.D. SYM. MN/m 2(KSI)
> DEVELOPED AT 20 CPM CA14-1 412 (59.8) 0.38SINUSOIDAL AND R = 0 CA14-2 0 412 (59.8) 0.39
CA14-3 a 412 (59.8) 0.38
> SOLID SYMBOLS ARE GROWTH RATES WHICH CA14-4 O 412 (59.8) 0.38INCLUDE POSSIBLE FLAW GROWTH ON FIRSTCYCLE (SEE PARA. 4.3.1) - 10
10 I I I10 100 1,000 10,000 100,000
da/dN (pcm/INCH)
Figure 52: Cyclic Crack Growth Rates for 0.38 cm (0.15 Inch) Thick 2219-T87 Aluminum (WT Direction)at 780K (-3200F) with oo = 0.91 oys and (a/2c)i - 0.38

da/dN (pINCH/CYCLE)
100 10 100 1,000 10,000 90
90- -80
80- -70
70 -- 60
60-50
50-
40Ez -30
30
-P.
-20
CYCLIC20 -SPECIMEN (a/2
I.D. SYM. MN/m 2 (KSI)
S DEVELOPED AT 20 CPM CA11-1 O 412 (59.8) 0.09SINUSOIDAL AND R = 0 CA11-2 0 412(59.8) 0.10
S SOLID SYMBOLS ARE GROWTH RATES WHICHINCLUDE POSSIBLE FLAW GROWTH ON FIRST
CYCLE (SEE PARA. 4.3.1) - 10
10 I I10 100 1,000 10,000 100,000
da/dN (jcm/CYCLE)
Figure 53: Cyclic Crack Growth Rates for 0.38 cm (0.15 Inch) Thick 2219-T87 Aluminum (WT Direction)at 780K (-3200F) with oo = 0.91 oys and (a/2c)i 0.10
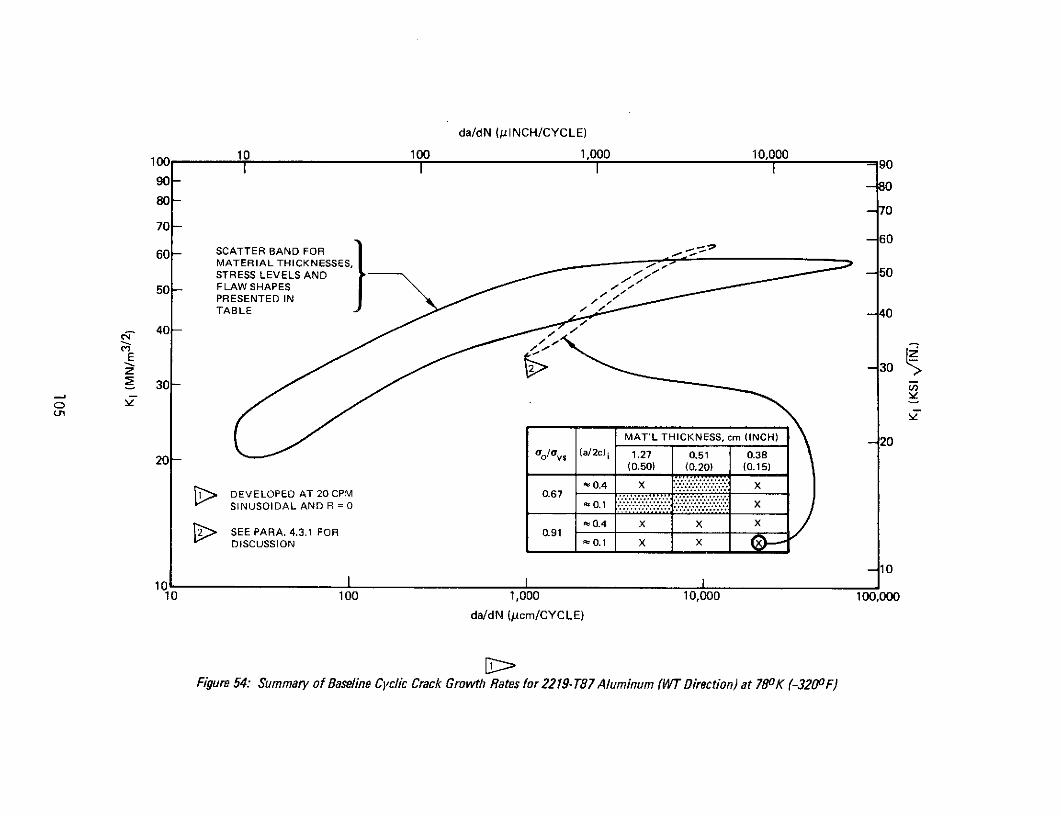
da/dN (gINCH/CYCLE)
10 100 1,000 10,000o I I I I - 90
90- -80
80-- 70
70-- 60
60- SCATTER BAND FORMATERIAL THICKNESSES, .,STRESS LEVELS AND - 50
50- FLAW SHAPES / "PRESENTED IN , /TABLE - ' -40
40- '01
- 30
S30
MAT'L THICKNESS, cm (INCH) -20
20 - o/ovs (a/2c)i 1.27 0.51 0.38
(0.50) (0.20) (0.15)
-,0.4 x :: .:.::::::::::::::' x1 DEVELOPED AT 20 CPM 0.67 ............. . ............
SINUSOIDAL AND R = 0 -0.1 ::':' :':.:::':'....::::.. X
> SEE PARA. 4.3.1 FOR 0.91
DISCUSSION 0.1 X X
10
10 I I10 100 1,000 10,000 100,000
da/dN (pcm/CYCLE)
Figure 54: Summary of Baseline Cyclic Crack Growth Rates for 2219-T87 Aluminum (WT Direction) at 780K (-320 0F)
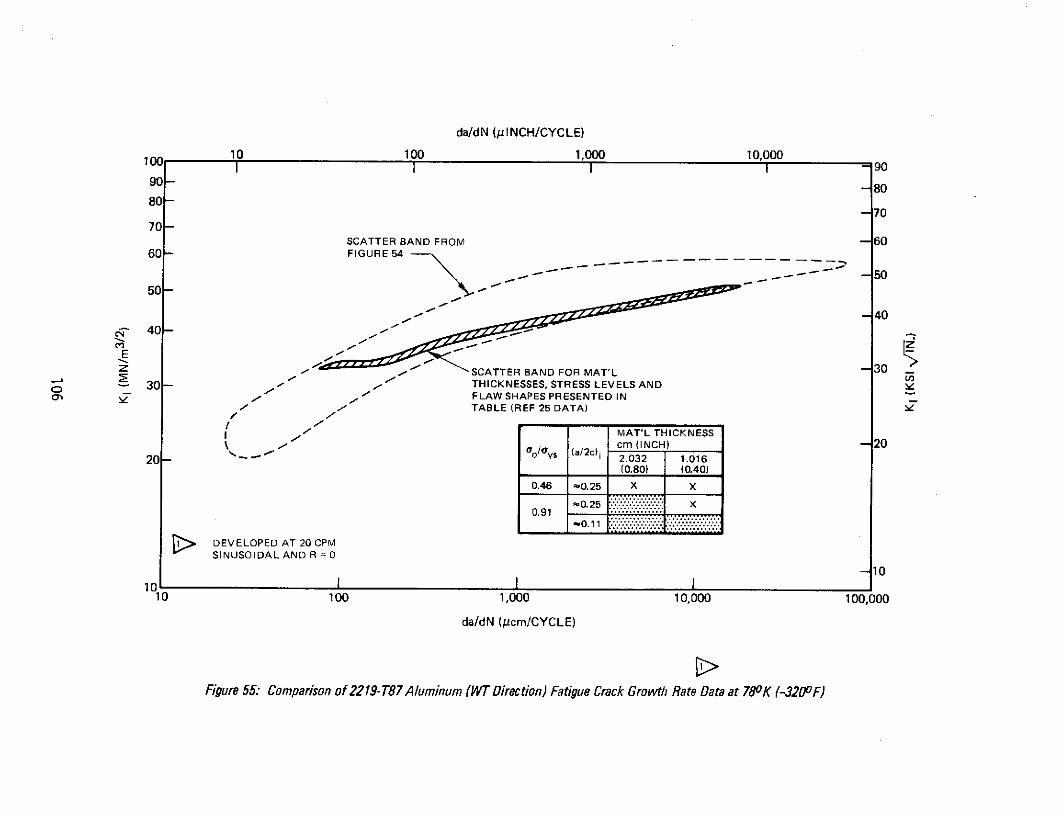
da/dN (pINCH/CYCLE)
100 10 100 1,000 10,0009090
90- 80
80--70
70-SCATTER BAND FROM -60
60 FIGURE 54
50 - 5050-
S40
Ez . ."- SCATTER BAND FOR MAT'L -30
S30- THICKNESSES, STRESS LEVELS AND30 -- / -FLAW SHAPES PRESENTED IN
/ / TABLE (REF 25 DATA)
MAT'L THICKNESS\ cm (INCH) -20
20 - '~" (a/2c)i 2.032 1.016(0.80) (0.40)
0.46 '0.25 X X
0 1 0.25 :''':''.''.'.'.v'.: : X0.91 """"""
DEVELOPED AT 20 CPMSINUSOIDAL AND R = 0
01010 I I I
10 100 1,000 10,000 100,000
da/dN (/cm/CYCLE)
Figure 55: Comparison of 2219- T87Aluminum (WT Direction) Fatigue Crack Growth Rate Data at 780K (-3200F)
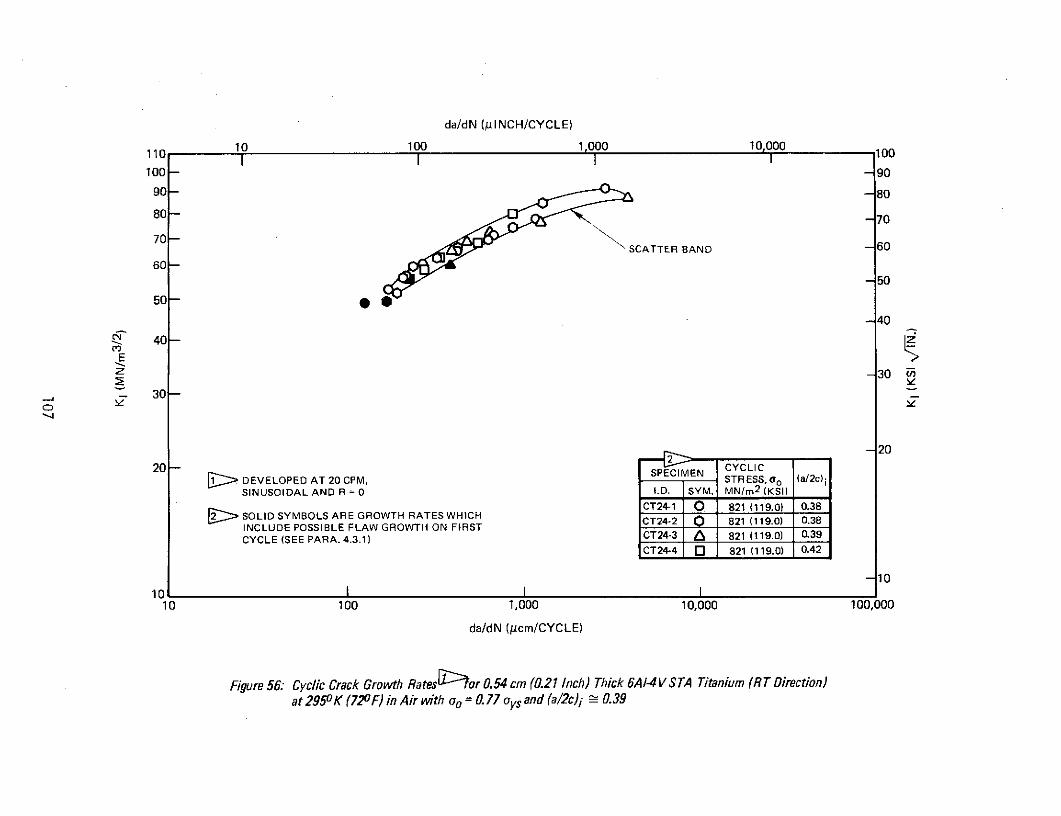
da/dN (plINCH/CYCLE)
110 10 100 1,000 10,000110I I I I loo
100 - - 90
90- -80
80 - -70
70- \ SCATTER BAND -60
60-- 50
50 -
- 40
S 40
-Ez - 30
30-
20 SPECIMEN CYCLIC20 DEVELOPED AT 20 CPM, SPECIMEN STRESS, 0 o (a/2c) i
SINUSOIDAL AND R = 0 I.D. SYM. MN/m 2 (KSII
CT24-1 O 821 (119.0) 0.389 > SOLID SYMBOLS ARE GROWTH RATES WHICH CT24-2 821 (119.0) 0.38
INCLUDE POSSIBLE FLAW GROWTH ON FIRST CT24-2 821 (119.0) 0.38CYCLE (SEE PARA. 4.3.1) CT24-3 a 821 (119.0) 0.39
CT24-4 0 821 (119.0) 0.42
010
10 100 1,000 10,000 100,000
da/dN (ucm/CYCLE)
Figure 56: Cyclic Crack Growth Rates or 0.54 cm (0.21 Inch) Thick 6A1-4V STA Titanium (RT Direction)at 2950 K (720F) in Air with o0 = 0.77 is and (a/2c)i - 0.39
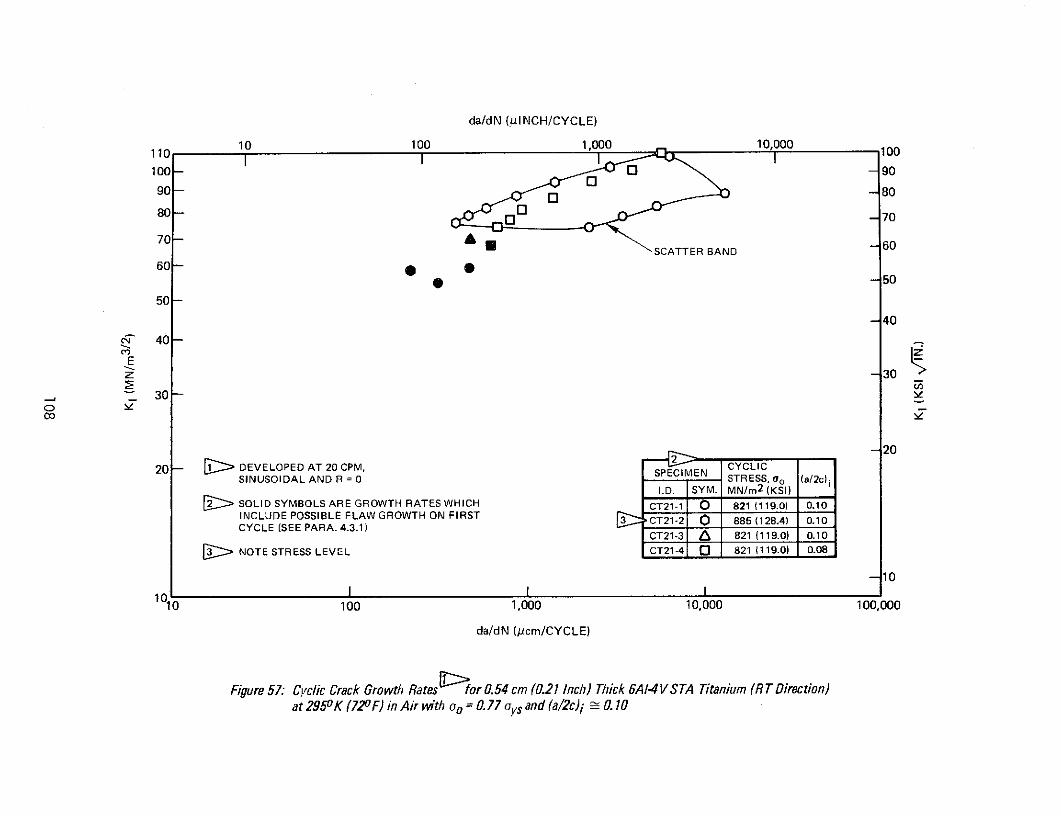
da/dN (lINCH/CYCLE)
110 10 100 1,000 10,000110I I I I loo100 - O - 90
090- - 80
080 - - 70
70- A -60SCATTER BAND 60
60 -50
50
- 40
30-0030o Y
-20
20 DEVELOPED AT 20 CPM, EN CYCLICSINUSOIDAL AND R = 0 STRESS, 0o (a/2c) iI.D. SYM. MN/m 2
(KSI)
[ SOLID SYMBOLS ARE GROWTH RATES WHICH CT21-1 0 821 (119.0) 0.10INCLUDE POSSIBLE FLAW GROWTH ON FIRST 3 CT21-2 0 885 (128.4) 0.10CYCLE (SEE PARA. 4.3.1)
CT21-3 L 821 (119.0) 0.10
NOTE STRESS LEVEL CT21-4 0 821 (119.0) 0.08
-10
1 I I010 100 1,000 10,000 100,000
da/dN (gcm/CYCLE)
Figure 57: Cyclic Crack Growth Rates for 0.54 cm (0.21 Inch) Thick 6A/-4V STA Titanium (RT Direction)at 2950K (72oF) in Air with o = 0. 77 oys and (a/2c)i 0. 10
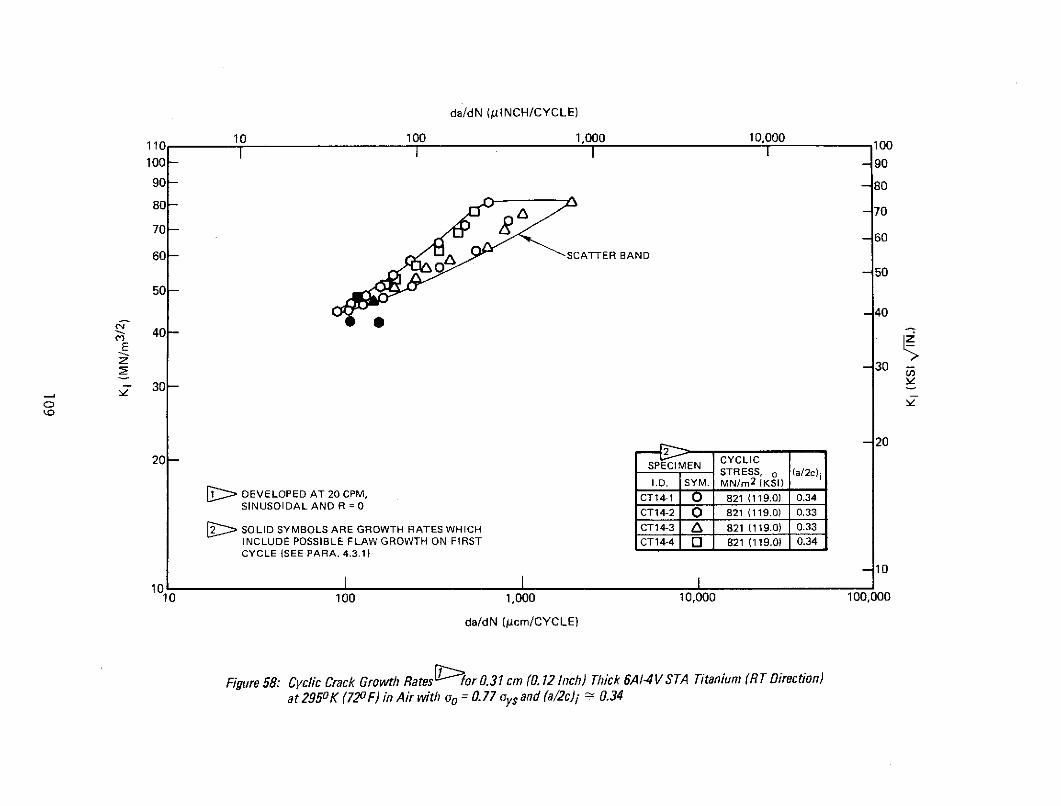
da/dN (pINCH/CYCLE)
10 100 1,000 10,000
100 - -90
90- -80
80 707-70
70- -60
60 A SCATTER BAND
-50
50
C 4440-
E
30 30
-20
20 -CYCLIC
SPECIMENSTRESS, o (a/2c) i
I.D. SYM. MN/m 2 ( KSI)
[> DEVELOPED AT 20 CPM, CT14-1 O _ 821 (119.0) 0.34SINUSOIDAL AND R = 0 CT14-2 0 821 (119.0) 0.33
CT14-2 O 821 (119.0) 0.33
[> SOLID SYMBOLS ARE GROWTH RATES WHICH CT14-3 A 821 (119.0) 0.33INCLUDE POSSIBLE FLAW GROWTH ON FIRST CT14-4 O 821 (119.0) 0.34CYCLE (SEE PARA. 4.3.1)
10
10 100 1,000 10,000 100,000
da/dN (pcm/CYCLE)
Figure 58: Cyclic Crack Growth Rates for 0.31 cm (0.12 Inch) Thick 6A1-4 V STA Titanium (RT Direction)at 2950K (720F) in Air with oo
= 0.77 oys and (a/2c)i - 0.34
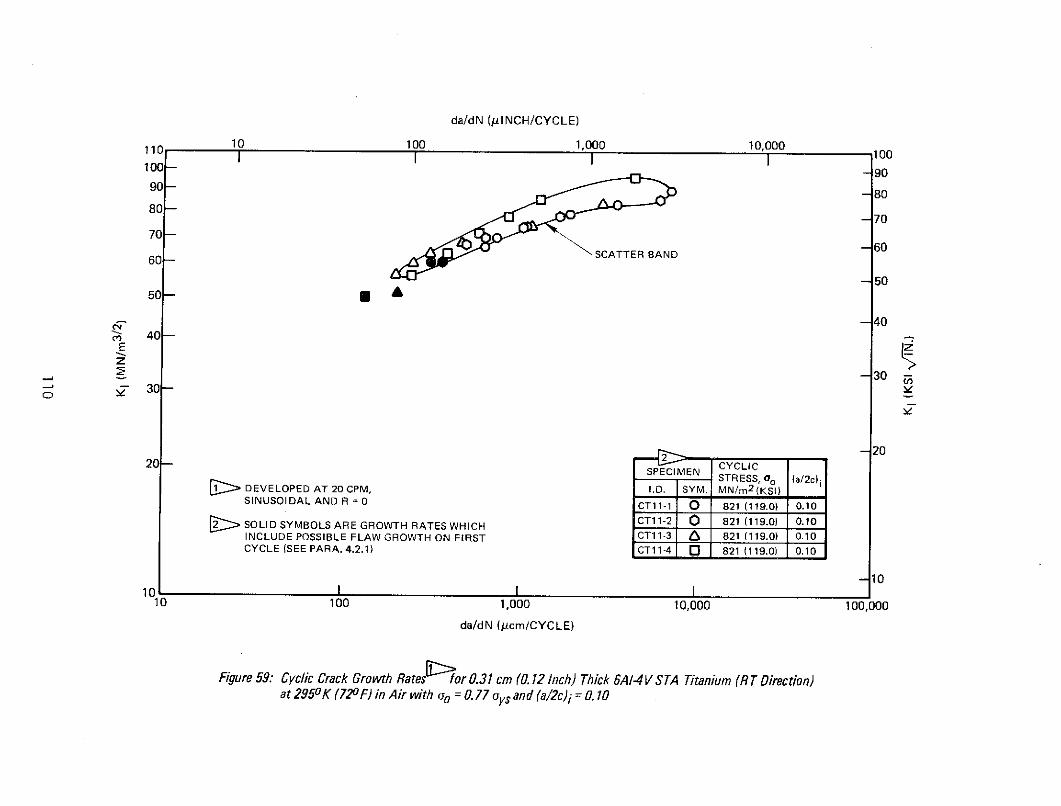
da/dN (MINCH/CYCLE)
110 10 100 1,000 10,000100 - -90
90 - -808080- -70707
- 60SCATTER BAND60-
-5050- * £
7 -4040-
Ez2 -30- 30-
2-2020 -SPECIMEN CYCLICSTRESS, go (a/2c)i
1 DEVELOPED AT 20 CPM, I.D. SYM. MN/m 2 ( K S I )
SINUSOIDAL AND R = 0 CT11-1 0 821 (119.0) 0.10
SSOLID SYMBOLS ARE GROWTH RATES WHICH CT1 1-2 O 821 (119.0) 0.10INCLUDE POSSIBLE FLAW GROWTH ON FIRST CT11-3 6 821 (119.0) 0.10CYCLE (SEE PARA. 4.2.1) CT11-4 0 821 (119.0) 0.10
-1010 I I I
10 100 1,000 10,000 100,000
da/dN (pcm/CYCLE)
Figure 59: Cyclic Crack Growth Rates or 0.31 cm (0.12 Inch) Thick GA1-4V STA Titanium (RT Direction)at 2950K (720 F) in Air with oo = 0.77 ysand (a/2c)i = 0.10

da/dN ( INCH/CYCLE)
10 100 1,000 10,000 100110I I I I100 - - 90
90- -80
80- -70
70 -60
60 5
5050
-4040- 40
Z SCATTER BAND- 30
30-3
-20
20 SPECIMEN CYCLICSTRESS, a0 (a/2c)
I.D. SYM. MN/m 2 (KSI)
CT64-1 0 821 (119.0) 0.37DEVELOPED AT 20 CPM, CT64-2 0 821 (119.0) 0.34
CT64-3 I 821 (119.0) 0.40
CT64-4 0 821 (119.0) 0.44
-10
10 100 1,000 10,000 100,000
da/dN (pcm/CYCLE)
Figure 60: Cyclic Crack Growth Rates for 0.16cm (0.063 Inch) Thick 6A1-4V STA Titanium (RT Direction)at 2950K (720F) in Air with ao = 0.77 oys and (a/2c)i :- 0.40
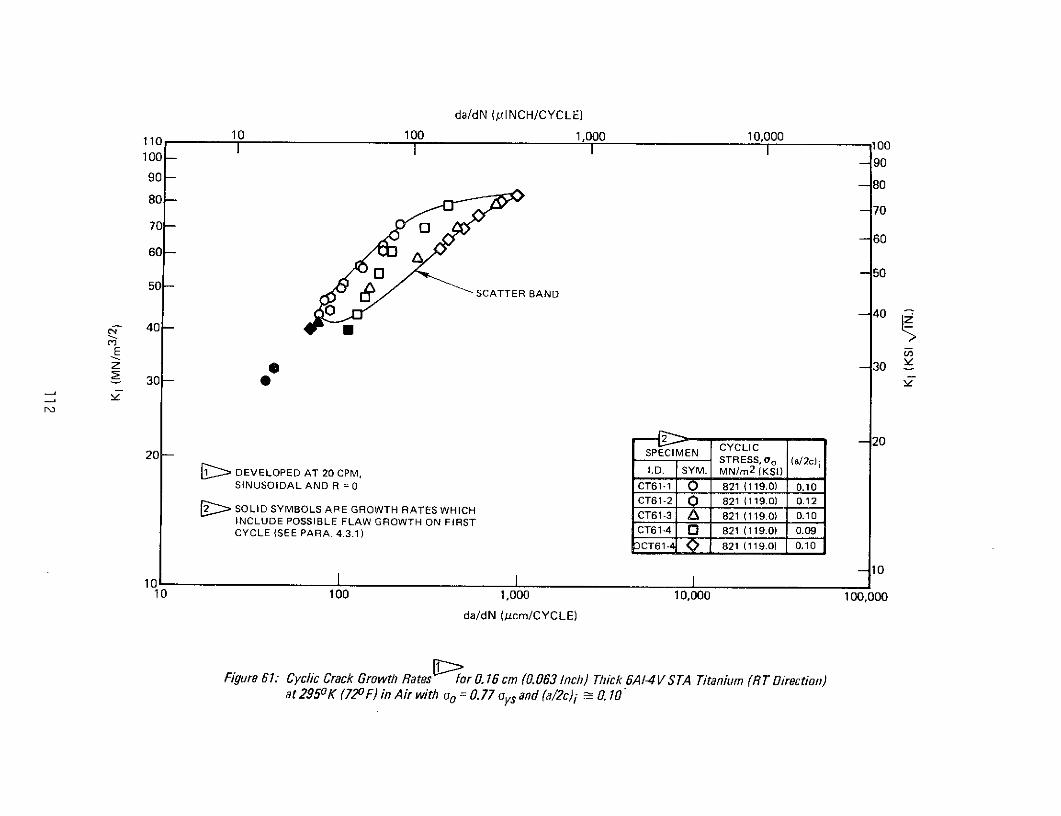
da/dN (,lINCH/CYCLE)
110 10 100 1,000 10,000
100- - 9090 90
90- 80
80-70
70 -- 60
60-
0 -50
SCATTER BAND
404040-
Ez -30
30- 0
CYCLIC -2020 - SPECIMEN
STRESS, o (a/2c)[ DEVELOPED AT 20 CPM, I.D. SYM. MN/m 2 (KSI)
SINUSOIDAL AND R = 0 CT61-1 0 821 (119.0) 0.10CT61-2 0 821 (119.0) 0.12
SOLID SYMBOLS ARE GROWTH RATES WHICH CT61-3 8 821 (119.0) 0.10INCLUDE POSSIBLE FLAW GROWTH ON FIRSTCYCLE (SEE PARA. 4.3.1) CT61-4 0 821 (119.0) 0.09
OCT61-4 821 (119.0) 0.10
10-1010 100 1,000 10,000 100,000
da/dN (/cm/CYCLE)
Figure 61: Cyclic Crack Growth Rates for 0. 16 cm (0.063 Inch) Thick 6A1-4V STA Titanium (RT Direction)at 2950K (720F) in Air with oo = 0.77 oys and (a/2c)i f. 10
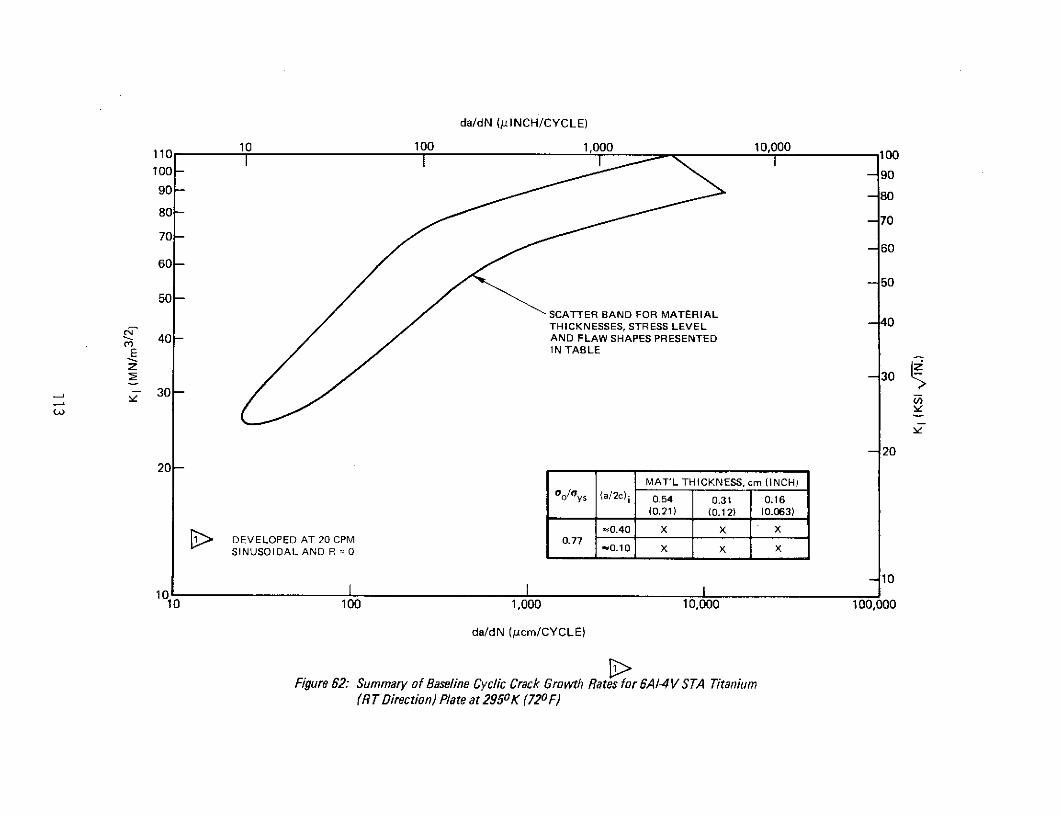
da/dN (jINCH/CYCLE)
10 100 1,000 10,000110 100
100 - -9090 -80
80- -70
70--60
60-
-5050-
SCATTER BAND FOR MATERIAL 40THICKNESSES, STRESS LEVEL
S 40 - AND FLAW SHAPES PRESENTEDE IN TABLE
30
30-
-20
20-MAT'L THICKNESS, cm (INCH)
Go/oys (a/2c)i 0.54 0.31 0.16(0.21) (0.12) (0.063)
-0.40 X X XDEVELOPED AT 20 CPM 0.77SINUSOIDAL AND R = 0 '0.10 X X X
- 10
10 100 1,000 10,000 100,000
da/dN (/cm/CYCLE)
Figure 62: Summary of Baseline Cyclic Crack Growth Rates for 6A1-4V STA Titanium(RT Direction) Plate at 2950K (720F)
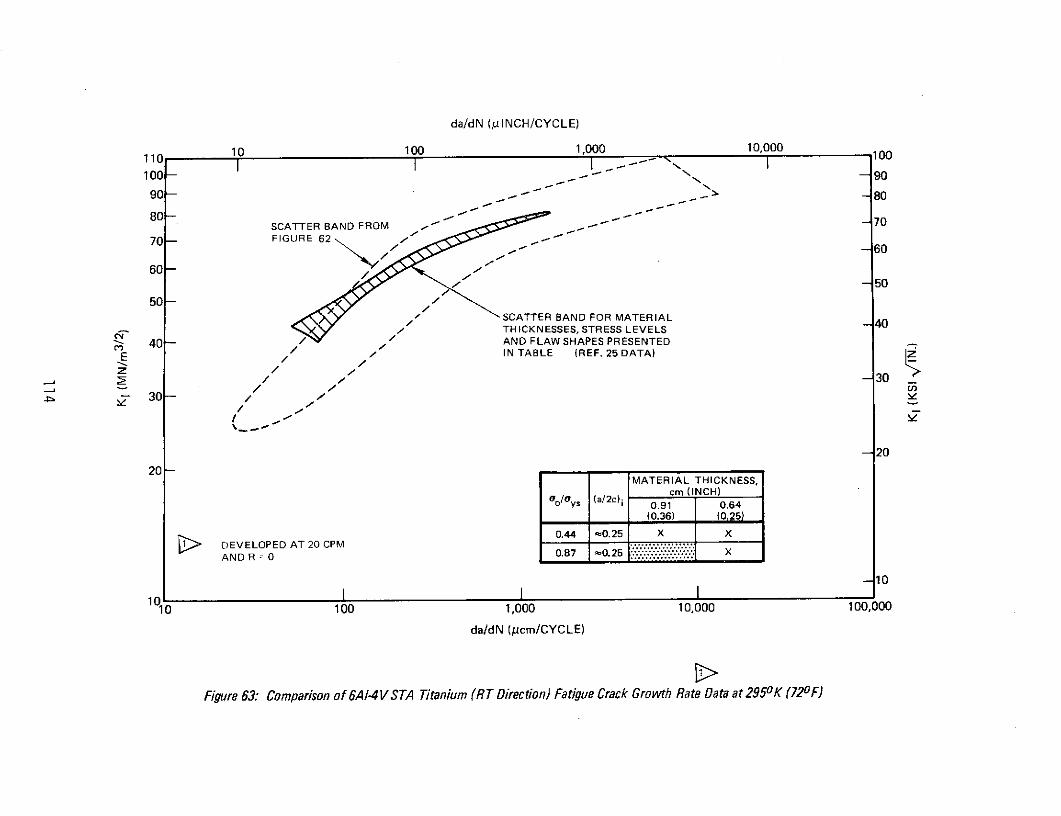
da/dN (pINCH/CYCLE)
10 100 1,000 10,000 100110 100
100 -90
90-- - - 8080 -
SCATTER BAND FROM ,- - 70
70- FIGURE 62 /60 E- 60
-50
50SCATTER BAND FOR MATERIAL 40THICKNESSES, STRESS LEVELS
40 - AND FLAW SHAPES PRESENTED
/E IN TABLE (REF. 25 DATA)
lv,S 30 /
- 20
2020
MATERIAL THICKNESS,cm (INCH)
go/ays (a/2c)i 0.91 0.64(0.36) (0.25)
0.44 -0.25 X XDEVELOPED AT 20 CPM~.25 X XAND R 0 0.87 r0.25 '.'..'.v..v.'.v.' .'... X
-10
I 1 I
1010 100 1,000 10,000 100,000
da/dN (pcm/CYCLE)
Figure 63: Comparison of 6A1-4V STA Titanium (RT Direction) Fatigue Crack Growth Rate Data at 2950K (72 0F)
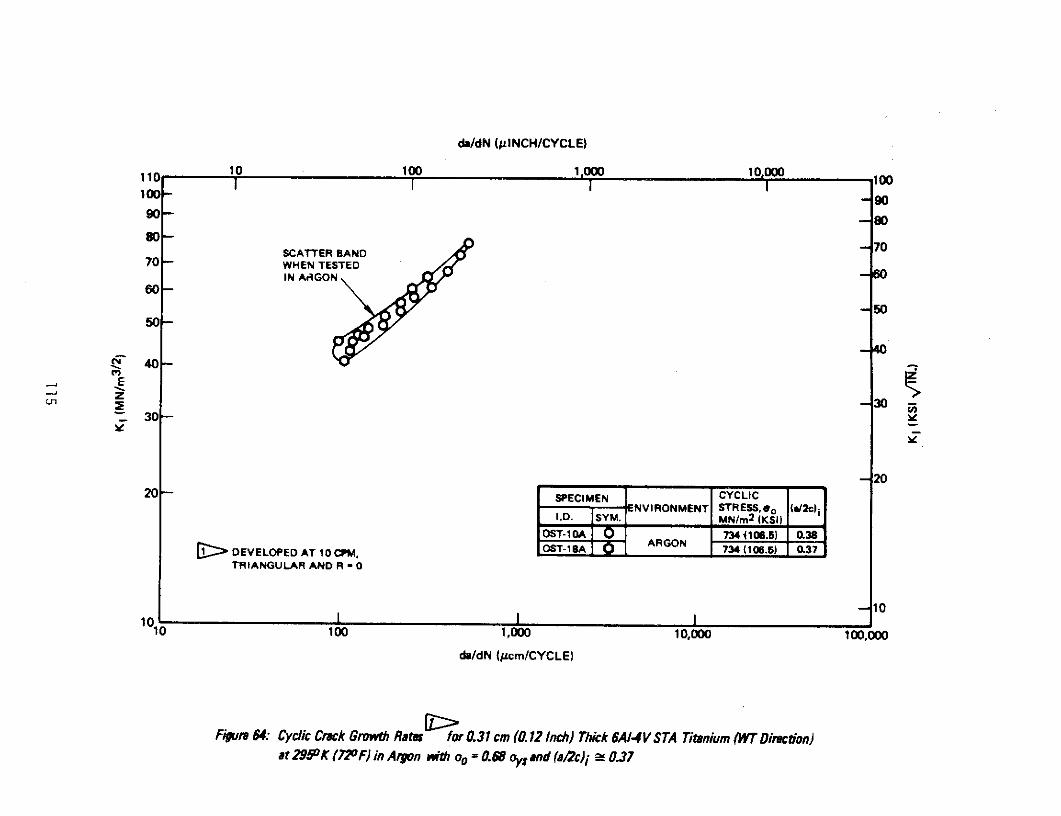
da/dN (plNCH/CYCLE)
110 10 100 1,000 10000 10010 - I I I 100-90
90--80
80-
SCATTER BAND -7070- WHEN TESTED
IN AAGON- 660
-5050-
- 440
E
30
-2020- SPECIMEN CYCLIC
ENVIRONMENT STRESS,eo /2c)iI.D. SYM. MN/m2 (KSI)
OST-10A 0 7344106.5) 0.38
> DEVELOPED AT 10 CPM, OST-18ARGON 734 (106.5) 0.37TRIANGULAR AND R - 0
-1010 I I I
10 100 1,000 10,000 100,000
da/dN (pcm/CYCLE)
Figure 64: Cyclic Crack Growth Rates for 0.31 cm (0.12 Inch) Thick A/I4V STA Titanium (WT Direction)at 295~K (72oF) in Argon WiO o = 0.68 owand (a/2c)i 0.37
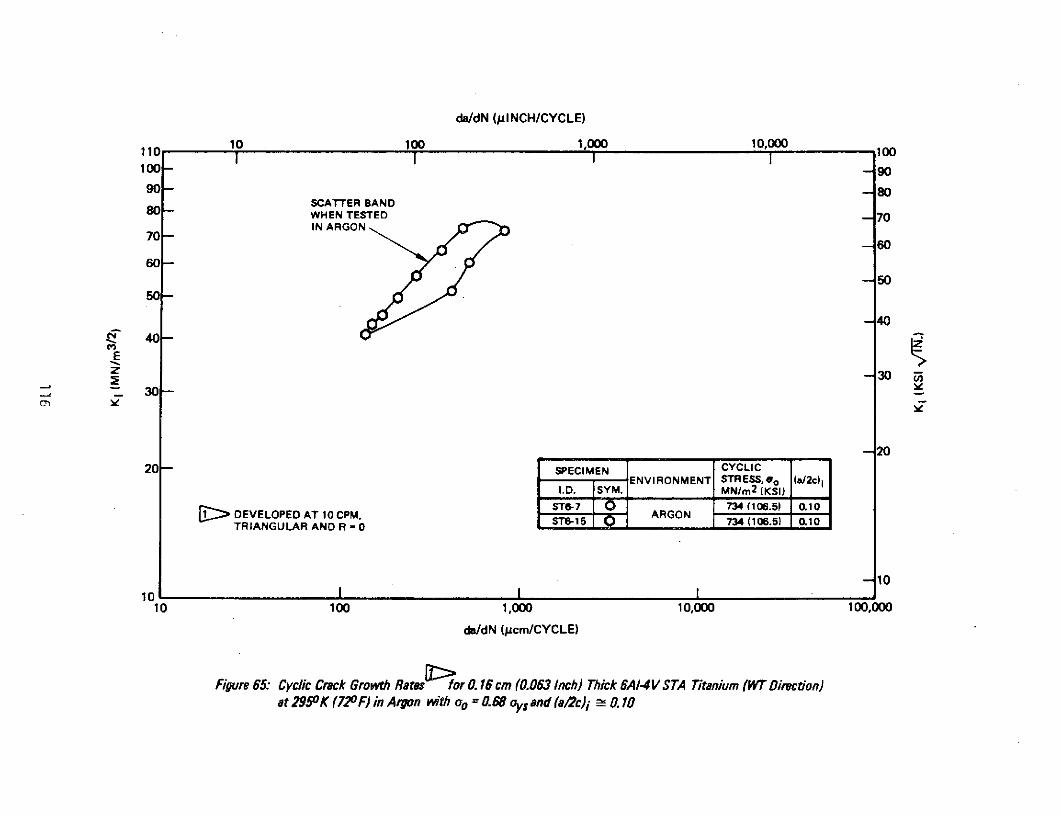
da/dN (pINCH/CYCLE)
10 100 1,000 10,00011o I I I I loo100- -90
90- -- 80SCATTER BANDWHEN TESTED 70IN ARGON
70 --60
60-
5 50
-40
E
3 -30
-2020 - SPECIMEN CYCLIC
ENVIRONMENT STRESS,6o (a/2c) iI.D. SYM. MN/m2 (KSI)ST6-7 734 (106.5) 0.10
DEVELOPED AT 10 CPM, - ARGON(106.5 0.10TRIANGULAR AND R -0 ST6-15 ARG734 (106.5 0.10
- 101o I I I
10 100 1,000 10,000 100,000
de/dN (pcm/CYCLE)
Figure 65: Cyclic Crack Growth Rates for 0. 16 cm (0.063 Inch) Thick 6A14V STA Titanium (WT Direction)at 2950K (720F) in Argon with ao = 0.68 aysand (a/2c)li 0. 10

da/dN (pINCH/CYCLE)
110 10 100 1,000 10,000 100
100 - -90
90 - 80
80 -.- 70
70- - 60
60--50
50 - /
/ SCATTER BAND FOR -40
S4/ WT DIRECTIONS40 - / (REF. FIGURES 64 AND 65)
co / ENVIRONMENT: ARGON
S/ - 30
30-
S .- SCATTER BAND FORRT DIRECTION(REF. FIGURE 62) -20
20- ENVIRONMENT: AIR
DEVELOPED AT 20 CPMSINUSOIDAL AND R = 0
-10
10 100 1,000 10,000 100,000
da/dN (pcm/CYCLE)
Figure 66: Effect of Crack Orientation on Fatigue Crack Growth Rate Data for 6A-4 V STA Titanium at 2950K (720F)
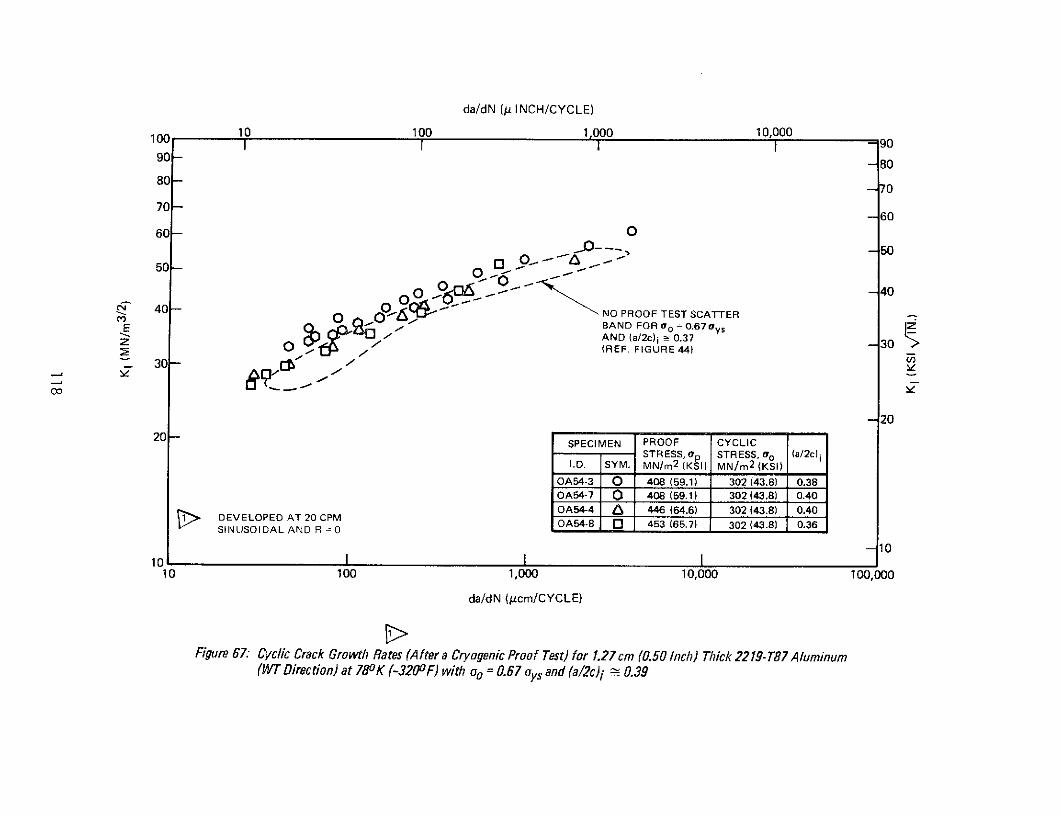
da/dN (p INCH/CYCLE)
100 10 100 1,000 10,000
80 70
- - --
O O -O00 0 - 40040 O -00-NO PROOF TEST SCATTER0 "BAND FORo = 0.67a
O AND (a/2c)i 0.37 3Z (REF. FIGURE 44) -30
30 -
- 20
20- SPECIMEN PROOF CYCLIC
STRESSop STRESS, 00 (a/2c) iI.D. SYM. MN/m
2 (KSI) MN/m
2 (KSI)
OA54-3 0 408 (59.1) 302 (43.8) 0.38oA54-7 0 408 (59.1) 302 (43.8) 0.40OA54-4 6 446 (64.6) 302 (43.8) 0.40
DEVELOPED AT 20 CPMSINUSOIDAL AND R - OA54-8 O 453 (65.7) 302 (43.8) 0.36SINUSOIDAL AND R - 0
101010 I I I
10 100 1,000 10,000 100,000
da/dN (pcm/CYCLE)
Figure 67: Cyclic Crack Growth Rates (After a Cryogenic Proof Test) for 1.27 cm (0.50 Inch) Thick 2219-T87 Aluminum(WT Direction) at 780K (-320oF) with oo = 0.67 oysand (a/2c)i 0.39
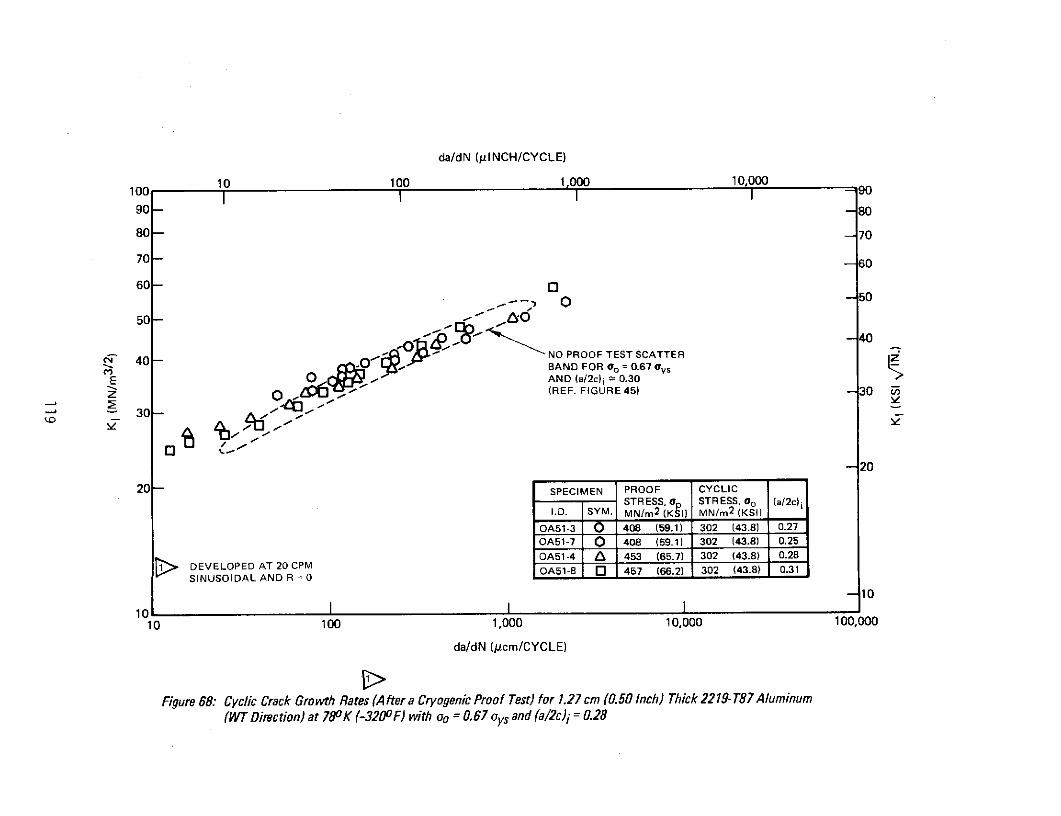
da/dN (pCtNCH/CYCLE)
10 100 1,000 10,000100I II
90- -80
80- -70
70 60
60-
050
570-
40- O2C13BAND FOR 00 = 0.67 VysE AND (a/2c)i 0.30
z O - (REF. FIGURE 45) -30
- 20
20 - SPECIMEN PROOF CYCLICSTRESS, a STRESS, 0 0 (a/2c)i
I.D. SYM. MN/m2
(KI) MN/m2
(KSI)
OA51-3 0 408 (59.1) 302 (43.8) 0.27
OA51-7 0 408 (59.1) 302 (43.8) 0.25
OA51-4 Z 453 (65.7) 302 (43.8) 0.28
SDEVELOPED AT 20 CPM OA51-8 O 457 (66.2) 302 (43.8) 0.31SINUSOIDAL AND R 0
10
1010 100 1,000 10,000 100,000
da/dN (pcm/CYCLE)
Figure 68: Cyclic Crack Growth Rates (After a Cryogenic Proof Test) for 1.27 cm (0.50 Inch) Thick 2219- T87 Aluminum(WT Direction) at 780K (-3200F) with on = 0.67 oys and (a/2c)i = 0.28
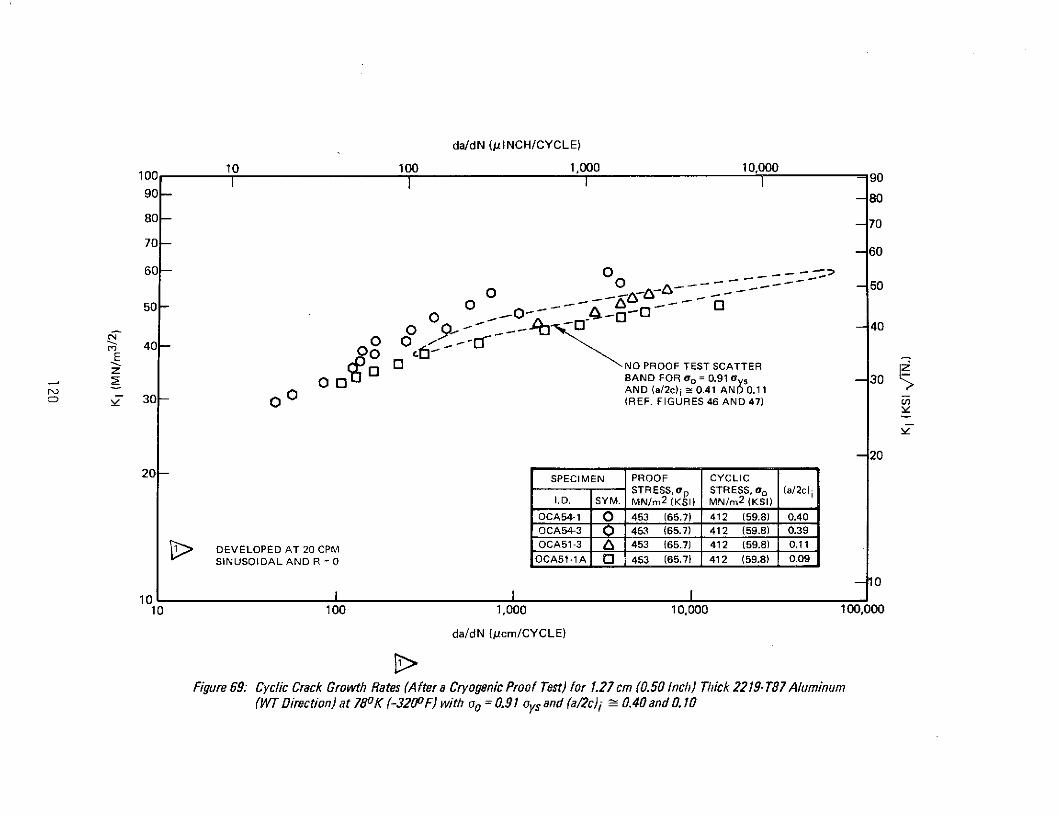
da/dN (IlNCH/CYCLE)
10 100 1,000 10,000100 -I 9 0
90 -80
80 7070-70
60 O 0.- 0-
0 ,- -0S - - 40
40- 0 O - --E
NO PROOF TEST SCATTER
"- _ O OrLj BAND FOR =0.91y s -30r_ 0 3 AND (a/2c) i - 0.41 AND 0.11
S 30 O (REF. FIGURES 46 AND 47)
-20
20- SPECIMEN PROOF CYCLICSTRESS,Op STRESS, 00 (a/2c) i
I.D. SYM. MN/m2 ( KSI) MN/m 2
(KSI)
OCA54-1 0 453 (65.7) 412 (59.8) 0.40OCA54-3 0 453 (65.7) 412 (59.8) 0.39
DEVELOPED AT 20 CPM OCA51-3 a 453 (65.7) 412 (59.8) 0.11
SINUSOIDAL AND R = 0 OCA51-1A 0 453 (65.7) 412 (59.8) 0.09
-10
10 100 1,000 10,000 100,000
da/dN (/cm/CYCLE)
Figure 69: Cyclic Crack Growth Rates (After a Cryogenic Proof Test) for 1.27cm (0.50 Inch) Thick 2219-T87Aluminum(WT Direction) at 780K (-3200F) with ao = 0.91 oys and f(a/2c)i - 0.40 and 0.10
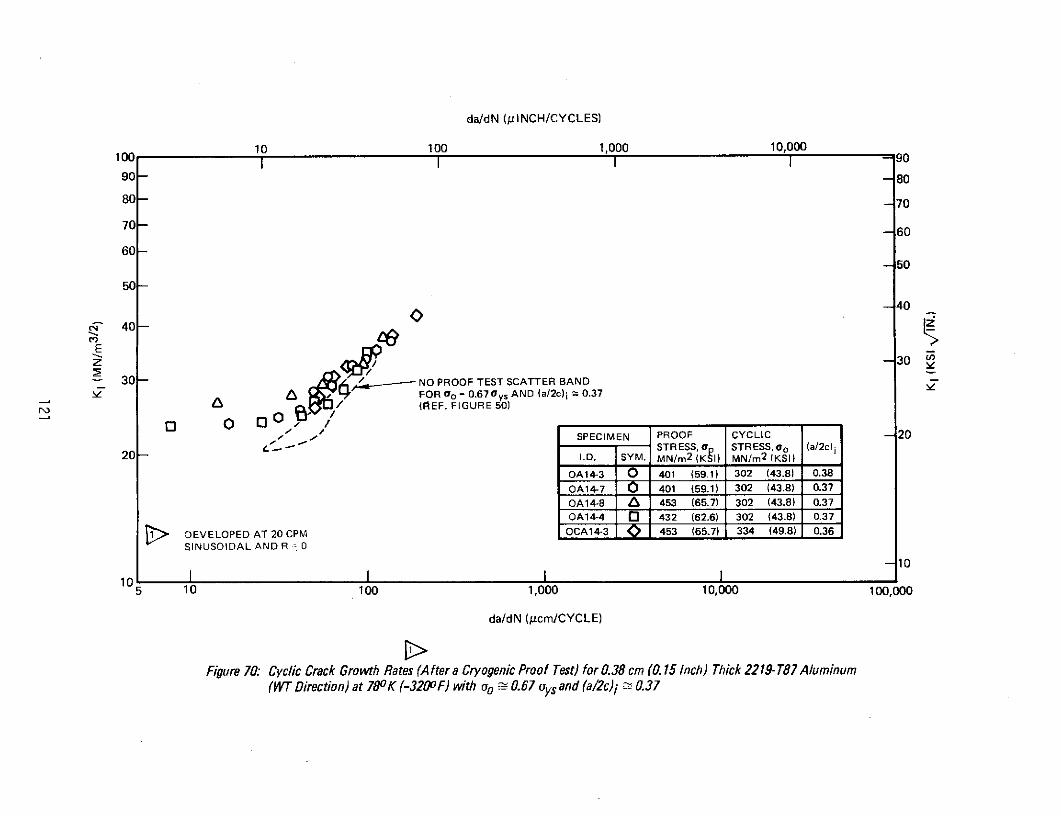
da/dN (pINCH/CYCLES)
10 100 1,000 10,000100 I I 1 I 90
90- -80
80 -- 70
70 -60
60--50
50-
- 40
40 -
S- 30
30 - NO PROOF TEST SCATTER BANDFOR o = 0.67 Oy s AND (a/2c) i 0.37
' / (REF. FIGURE 50)
0 O C3 0, //,- - SPECIMEN PROOF CYCLIC -20
0- STRESS, o STRESS, o o (a/2c) i20 - I.D. SYM. MN/m 2 (KI) MN/m 2 (KSI)
OA14-3 O 401 (59.1) 302 (43.8) 0.38
OA14-7 O 401 (59.1) 302 (43.8) 0.37
OA14-8 6 453 (65.7) 302 (43.8) 0.37
OA14-4 03 432 (62.6) 302 (43.8) 0.37
DEVELOPED AT 20 CPM OCA14-3 453 (65.7) 334 (49.8) 0.36
SINUSOIDAL AND R = 0
-10
10 I I i I
5 10 100 1,000 10,000 100,000
da/dN (gcm/CYCLE)
Figure 70: Cyclic Crack Growth Rates (After a Cryogenic Proof Test) for 0.38 cm (0.15 Inch) Thick 2219-T87 Aluminum(WT Direction) at 780 K (-3200oF) with o - 0.67 oysand (a/2c)i 0.37

da/dN (pINCH/CYCLE)
10 100 1,000 10,00010c 1 1 I I - 9o
- 80
80 -70
70-- 60
60-
S0 00 00 -500 O O OO
, 404
E// FOR 0, = 0.67 Oys AND (a/2c) i - 0.11
Z / //(REF. FIGURE 51) 3
r v 30 /
-20
20 SPECIMEN PROOF CYCLICSTRESS, op STRESS, 0 o (a/2c) i
I.D. SYM. MN/m 2 (KSI) MN/m 2 ( K
SI)
OA11-3 0 382 (55.4) 302 (43.8) 0.09
OA11-7 0 408 (59.1) 302 (43.8) 0.10
> DEVELOPED AT 20 CPM OA11-8 Za 449 (65.0) 302 (43.8) 0.13
SINUSOIDAL AND R = 0
- 10
10 I I10 100 1,000 10,000 100,000
da/dN (pcm/CYCLE)
Figure 71: Cyclic Crack Growth Rates (After a Cryogenic Proof Test) for 0.38 cm (0.15 Inch) Thick 2219-T87 Aluminum
(WT Direction) at 780K (-3200F) with oo = 0.67 a,, and (a/2c)i 0. 11
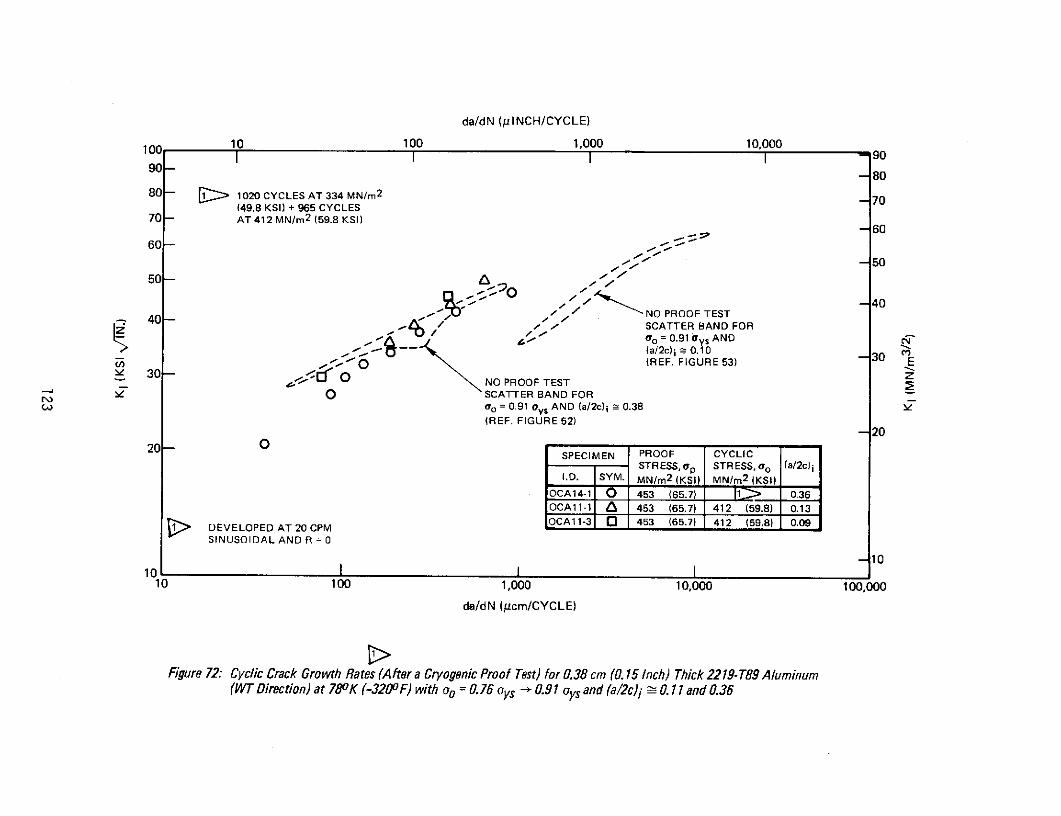
da/dN (pINCH/CYCLE)
100 10 100 1,000 10,00090-8
-8080 1020 CYCLES AT 334 MN/m 2
70(49.8 KSI) + 965 CYCLES
70 - AT 412 MN/m 2 (59.8 KSI)
-5050 -
0
40-. NO PROOF TEST40-/ ./ SCATTER BAND FOR
-. ," o = 0.91 dys AND C"(a/2c) i 0.10
0 (REF. FIGURE 53) E30- fO zS30 NO PROOF TEST
0 SCATTER BAND FORa o = 0.91 Oy s AND (a/2c) i 5 0.38(REF. FIGURE 52)
-2020- O SPECIMEN PROOF CYCLIC
STRESS,op STRESS,o (a/2c)iI.D. SYM. MN/m 2 (KSI) MN/m 2 (KSI)
OCA14-1 0 453 (65.7) 1 > 0.36OCA11-1 & 453 (65.7) 412 (59.8) 0.13
DEVELOPED AT 20 CPM OCAll-3 3 453 (65.7) 412 (59.8) 0.09
SINUSOIDAL AND R = 0
1010 I I I
10 100 1,000 10,000 100,000
da/dN (pcm/CYCLE)
Figure 72: Cyclic Crack Growth Rates (After a Cryogenic Proof Test) for 0.38 cm (0.15 Inch) Thick 2219-T89 Aluminum(WT Direction) at 780 K (-320oF) with oo = 0.76 oys - 0.91 oys and (a/2c)i -.. 11 and 0.36
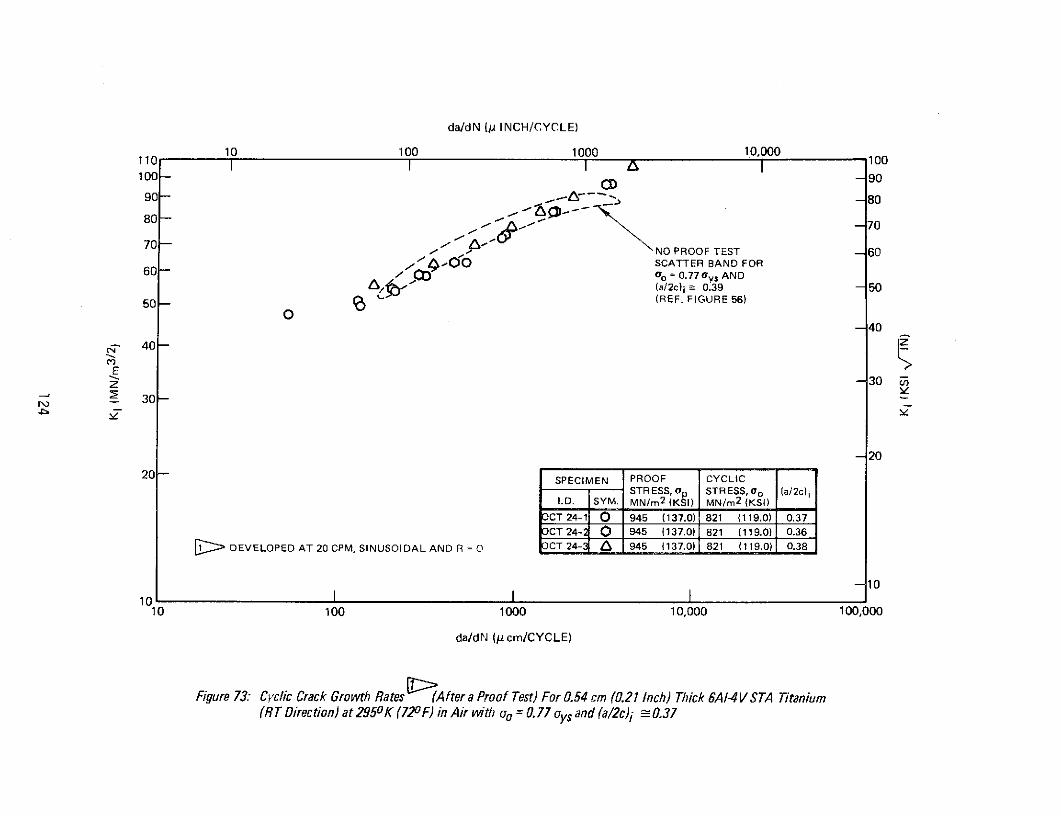
da/dN (p INCH/CYCLE)
10 100 1000 10,000110 100100- - 90
90- --A ' -80
80- 707- - 7070- NO PROOF TEST -60
60 O/ SCATTER BAND FOR-60 -/
o = 0 . 7 7 vs AND
(a/2c)i 0.39 -50
50- - (REF. FIGURE 56)O
- 404-
-ECz -30
30-
-20
20- SPECIMEN PROOF CYCLICSTRESS, a STRESS, a o (a/2c) i
I.D. SYM. MN/m2 (KI) MN/m
2 (KSI)
OCT 24-1 0 945 (137.0) 821 (119.0) 0.37
CT 24-2 0 945 (137.0) 821 (119.0) 0.36
DEVELOPED AT 20 CPM SINUSOIDAL AN24- 945 (137.0) 821 (119.0) 0.38
101010
10 100 1000 10,000 100,000
da/dN (p cm/CYCLE)
Figure 73: Cyclic Crack Growth Rates (After a Proof Test) For 0.54 cm (0.21 Inch) Thick 6A/-4V STA Titanium(RT Direction) at 295OK (720F) in Air with o = 0.77 oy, and (a/2c)i -0.37
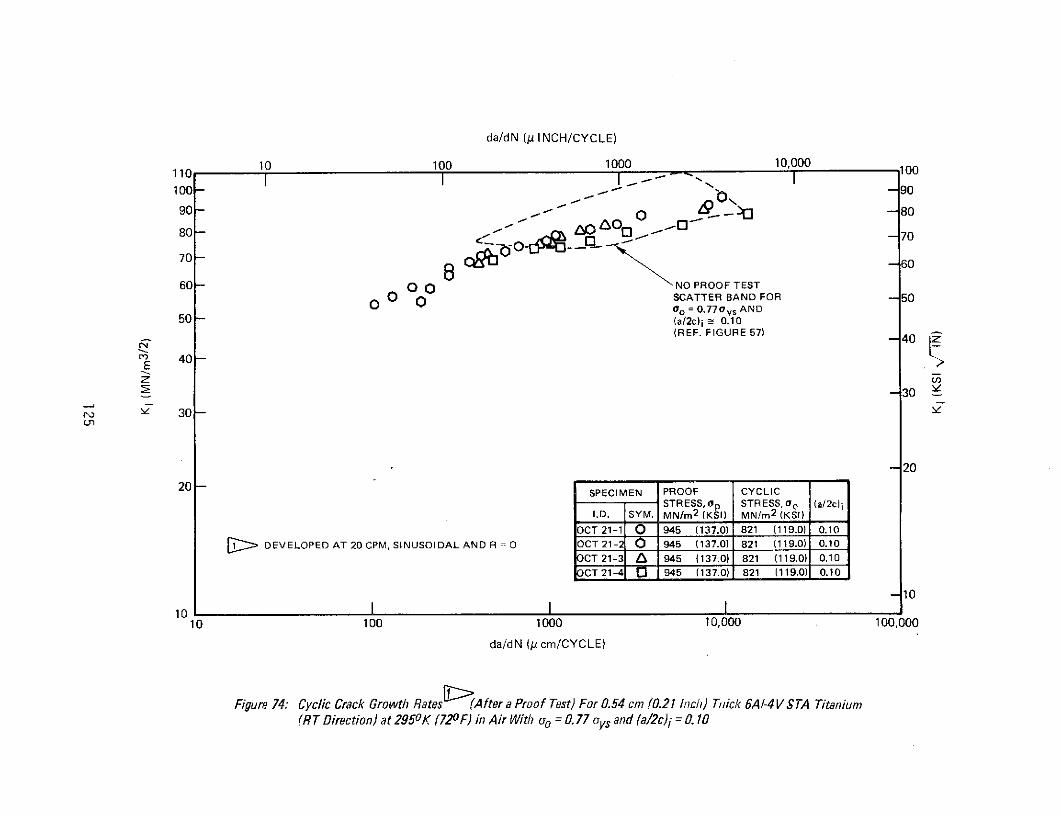
da/dN (p INCH/CYCLE)
10 100 1000 10,000 00Ic II - 90 I 9
100 -- -- 9
90 - O -80
800 __- 0 -70-0-70- -60
60 O0 NO PROOF TEST
OO O SCATTER BAND FOR -50
ao = 0.7 7 0ys AND
50- (a/2c) i - 0.10(REF. FIGURE 57) -40
040-
-30
N 30-
- 2020--1
SPECIMEN PROOF CYCLICSTRESS, op STRESS, 0o (a/2c)i
I.D. SYM. MN/m2 (KSI) MN/m 2 (KSI)
OCT 21-1 0 945 (137.0) 821 (119.0) 0.10
S::DEVELOPED AT 20 CPM, SINUSOIDAL AND R = OCT 21-20 945 (137.0) 821 (119.0) 0.10
OCT 21-3 a 945 (137.0) 821 (119.0) 0.10
OCT21-4 3 1945 (137.0) 821 (119.0) 0.10
10
10 I I I10 100 1000 10,000 100,000
da/dN (MI cm/CYCLE)
Figure 74: Cyclic Crack Growth Rates (After a Proof Test) For 0.54 cm (0.21 Inch) Tiick 6A/-4V STA Titanium(RT Direction) at 2950oK (720F) in Air With oo = 0.77 oys and (a/2c)i = 0. 10

da/dN (/p INCH/CYCLE)
110 1 10 100 1000i100100 -90 -90
90 -80- 80
80 -70
70 -60
60- 0 'a/ -50
/ I/ 0
S40/ NO PROOF TESTE0/ /, SCATTER BAND FOR KSo = 0.77Oy s AND(a/2c)i -0.40 - 30 7
30- / (REF. FIGURE 60)
N
O
O O011
0- 2020-
SPECIMEN PROOF CYCLICSTR ESS, ap STRESS, oo (a/2c)i
DEVELOPED AT 20 CPM, I.D SYM. MN/m 2 (KSI) MN/m 2
(KSI)SINUSOIDAL AND R = O OCT 64-1 0 945 (137.0) 821 (119.0) 0.31
[ AVERAGE GROWTH RATE SHOWN CT 64-2 0 945 (137.0) 821 (119.0) 0.30CT 64-3 945 (137.0) 821 (119.0) 0.39
-1010I I I
1 10 100 1000 10,000
da/dN (P cm/CYCLE)
Figure 75: Cyclic Crack Growth Rates (After a Proof Test) For 0. 16 cm (0.063 Inch) Thick 6A/-4V STA Titanium(R T Direction) at 2950K (720 F) in Air With oo = 0.77 oysand (a/2c)i - 0.33

da/dN (p INCH/CYCLE)
110 10 100 1000 10,000
100 -9090-
g- 8080 -- - -
70- / O 0 /0
-606060 - ,/ ,
50 / / NO PROOF SCATTER BAND50/ -/ FOR oo =0.77oy s AND---- !(a/2c) i 0.10
O3 (REF. FIGURE 61)E 40-
S30 - O O 300 0
- 2020-
SPECIMEN PROOF CYCLICSTRESS, p STRESS, ao (a/2c) iI.D. SYM. MN/m
2 (KSI) MN/m 2
(KSI)
OCT 61-1 945 (137.0) 821 (119.0) 0.08> DEVELOPED AT 20 CPM, O CT61-2 1 945 (137.0) 821 (119.0) 0.09
SINUSOIDAL AND R = O OCT 61-3 a 945 (137.0) 821 (119.0) 0.11
1010 I I I
10 100 1000 10,000 100,000
da/dN (p cm/CYCLE)
Figure 76: Cyclic Crack Growth Rates (After a Proof Test) For O. 16 cm (0.063 Inch) Thick 6AI-4VSTA Titanium(RT Direction) at 2950K (72oF) in Air With oo = 0.77 oys and (a/2c)i = 0.09
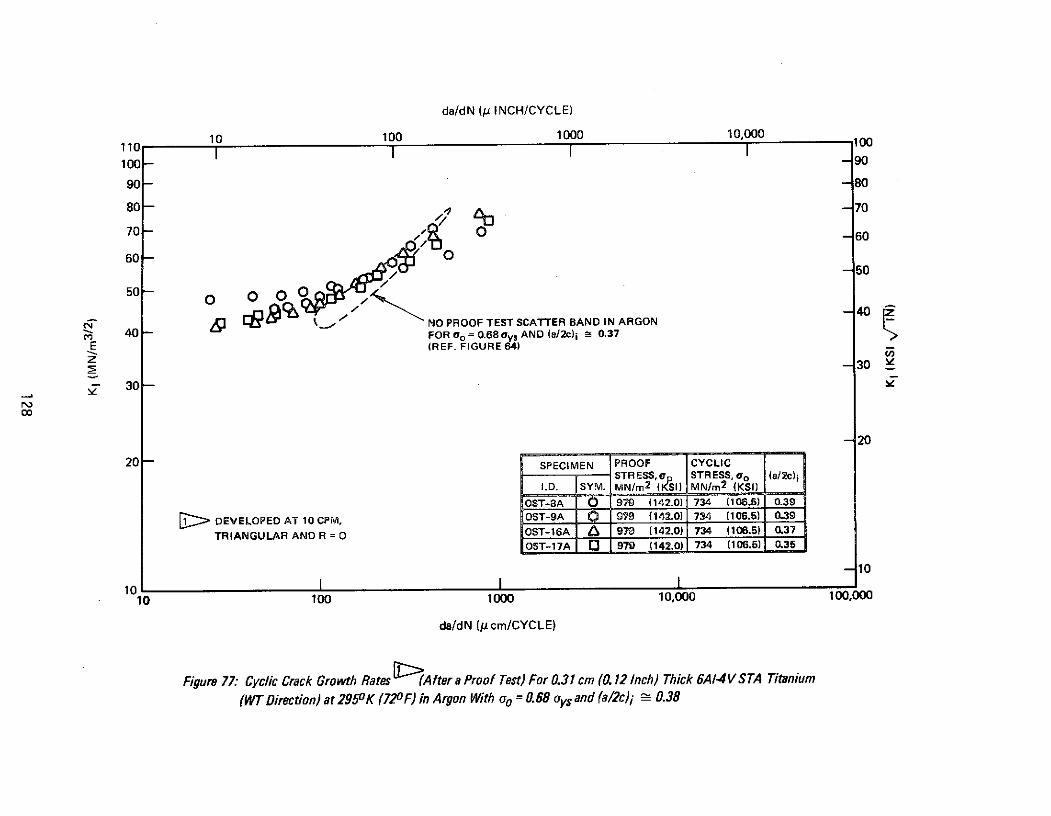
da/dN (p INCH/CYCLE)
10 100 1000 10,000 100
100- -90
90- -80
80- 70
70_70 - / - 60
60- 0-50
50- 0 0o olo40 .' NO PROOF TEST SCATTER BAND IN ARGON
" 40 - FOR go= 0.68 ys AND (a/2c) i 2 0.37E (REF. FIGURE 64)z
: - 30
- 30-
r%co
-20
20 - SPECIMEN PROOF CYCLICSTRESS, o STRESS, o (a/2c)i
I.D. SYM. MN/m 2 (ISI) MN/m 2 (KSI)
OST-8A 0 979 (142.0) 734 (106.5) 0.39
:> DEVELOPED AT 10 CPM, OST-9A 0 970 (142.0) 734 (106.5) 0.39
TRIANGULAR AND R = 0 OST-16A 1 970 (142.0) 734 (106.5) 0.37
OST-17A 0 979 (142.0) 734 (106.5) 035
-10
10 I i I10 100 1000 10,000 100,000
da/dN (p cm/CYCLE)
Figure 77: Cyclic Crack Growth Rates (After a Proof Test) For 0.31 cm (0.12 Inch) Thick 6A1-4V STA Titanium
(WT Direction) at 2950K (720F) in Argon With oo = 0.68 oys and (a/2c)i - 0.38
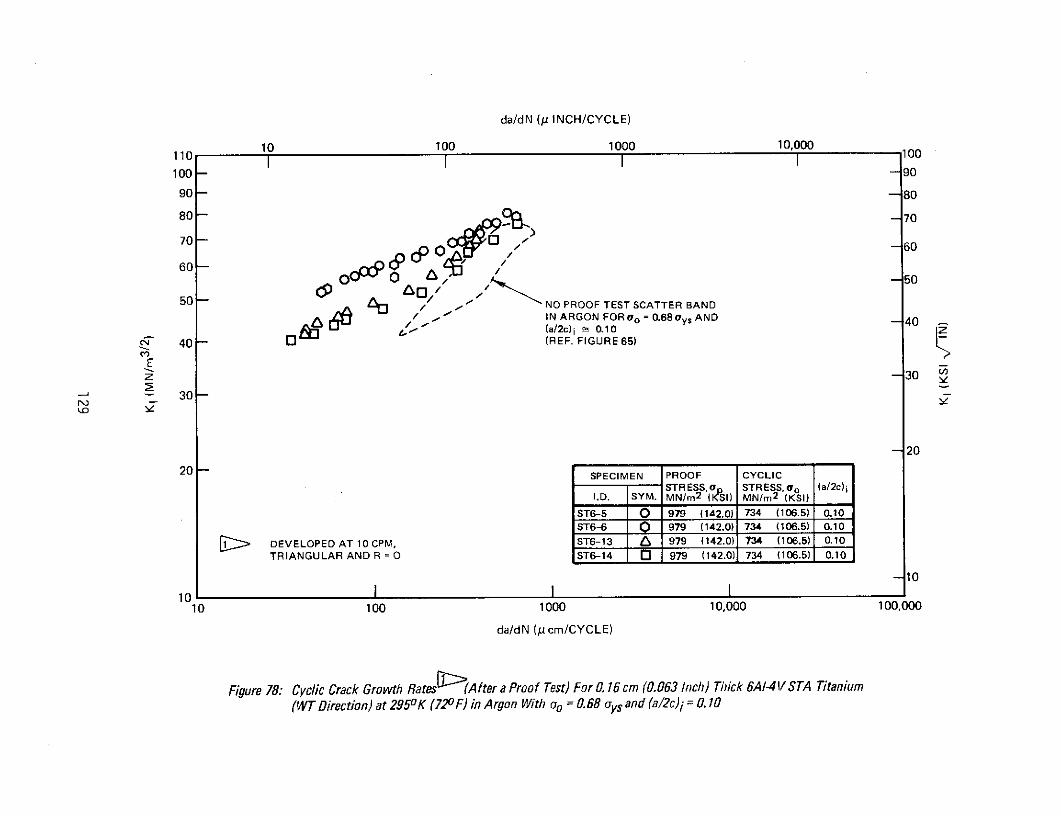
da/dN (p INCH/CYCLE)
10 100 1000 10,000110 I I I I 100oo100- -90
90- -80
80- -70
70-
60 0 o -50
50 / / NO PROOF TEST SCATTER BAND/ , IN ARGON FOR ao = 0.68ys AND -40
r i-
i L (a/2c) i 5 0.10c-y- 40- (REF. FIGURE 65)C.,
S-30
S 30-
- 2020- SPECIMEN PROOF CYCLIC
STRESS, a STRESS, o (a/2c) i
I.D. SYM. MN/m 2 (KSI) MN/m 2
(KSI)
ST6-5 0 979 (142.0) 734 (106.5) 0.10
ST6-6 0 979 (142.0) 734 (106.5) 0.10
DEVELOPED AT 10 CPM. ST6-13 6 979 (142.0) 734 (106.5) 0.10
TRIANGULAR AND R = O ST6-14 O 979 (142.0) 734 (106.5) 0.10
10
1010 100 1000 10,000 100,000
da/dN (p cm/CYCLE)
Figure 78: Cyclic Crack Growth Rates (After a Proof Test) For 0. 16 cm (0.063 Inch) Thick 6A1-4V STA Titanium
(WrT Direction) at 2950 K (72oF) in Argon With oo = 0.68 oys and (a/2c)i = 0. 10
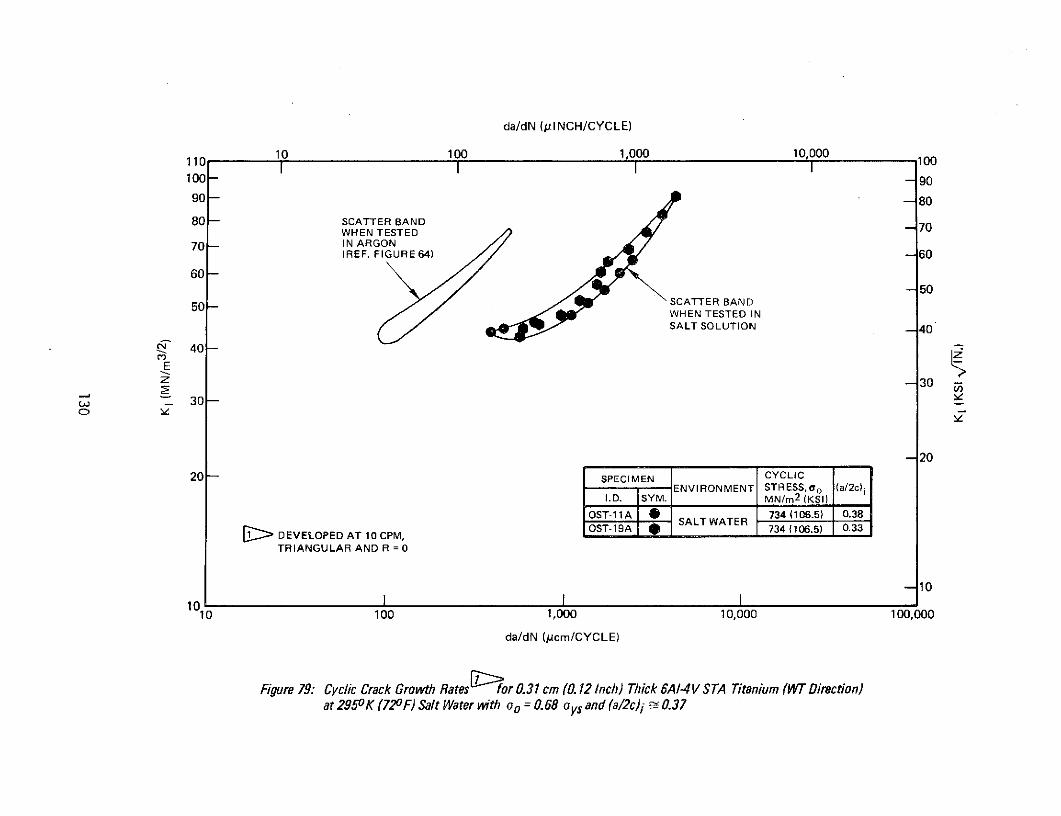
da/dN ( INCH/CYCLE)
110 10 100 1,000 10,000
100 - - 90
90 - - 80
80 - SCATTER BANDWHEN TESTED 70
70- IN ARGON(REF. FIGURE 64) 60
60--50
50_ SCATTER BANDWHEN TESTED INSALT SOLUTION -40
TZ 40
Ez -30
) - 30
-20
20 SPECIMEN CYCLICENVIRONMENT STRESS, oo (a/2c) iI.D. SYM. MN/m 2
(KSI)
OST-11 A 734(106.5) 0.38
1 DEVELOPED AT 10 CPM, OST-19A 734 (106.5) 033
TRIANGULAR AND R = 0
-10
10 1010 100 1,000 10,000 100,000
da/dN (pcm/CYCLE)
Figure 79: Cyclic Crack Growth Rates for 0.31 cm (0.12 Inch) Thick 6A1-4V STA Titanium (WT Direction)at 2950K (720F) Salt Water with oo = 0.68 oys and (a/2c)i - 0.37
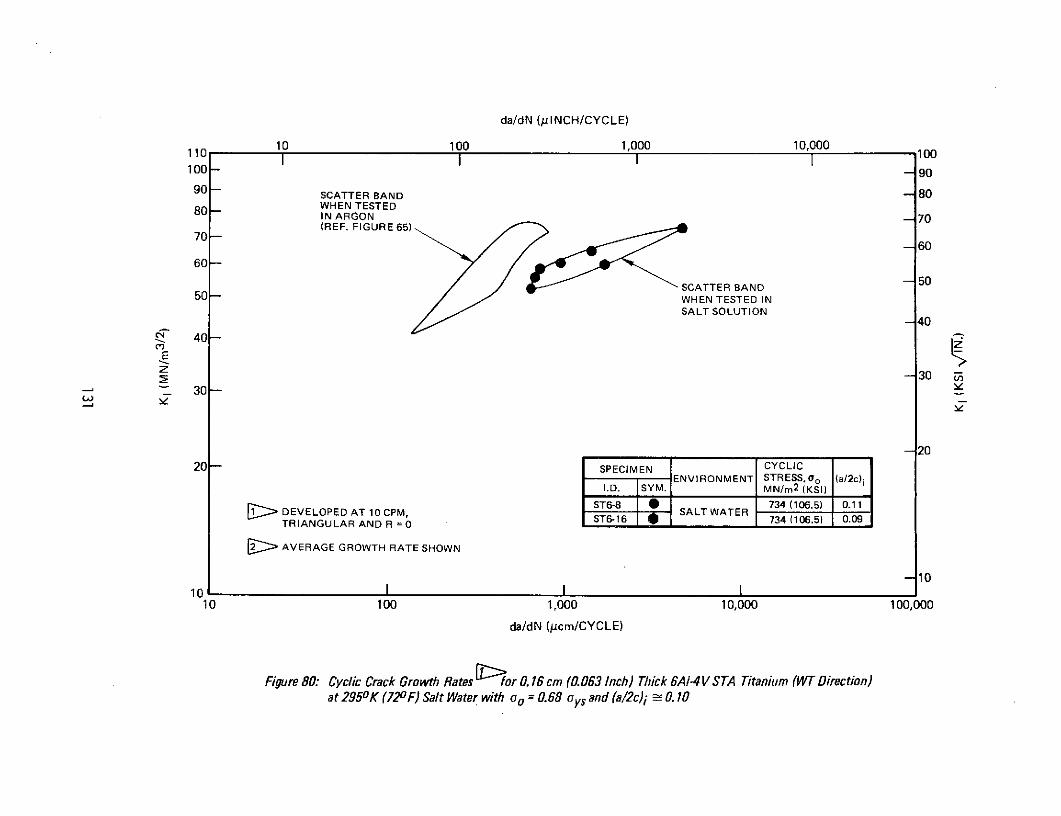
da/dN (pINCH/CYCLE)
10 100 1,000 10,000110 I I I I 100100- 1- 90
90- SCATTER BAND - 8080- WHEN TESTEDIN ARGON
-70(REF. FIGURE 65)
70--60
60-
SCATTER BAND 5050- WHEN TESTED IN
SALT SOLUTION-40
" 40 -C,,
E
-30"- 30 -
- 2020- SPECIMEN CYCLIC
ENVIRONMENT STRESS,v o (a/2c)iI.D. SYM. MN/m 2 (KSI)
ST6-8 • 734 (106.5) 0.11DEVELOPED AT 10 CPM, ST6-8 SALT WATER 73406.5) 0.11
TRIANGULAR AND R = 0 ST6-16 734 (106.5) 0.09
P AVERAGE GROWTH RATE SHOWN
1010
10 100 1,000 10,000 100,000
da/dN (pcm/CYCLE)
Figure 80: Cyclic Crack Growth Rates for 0. 16 cm (0.063 Inch) Thick 6AI-4V STA Titanium (WT Direction)at 2950K (720F) Salt Water with oo = 0.68 oys and (a/2c)i - 0.10
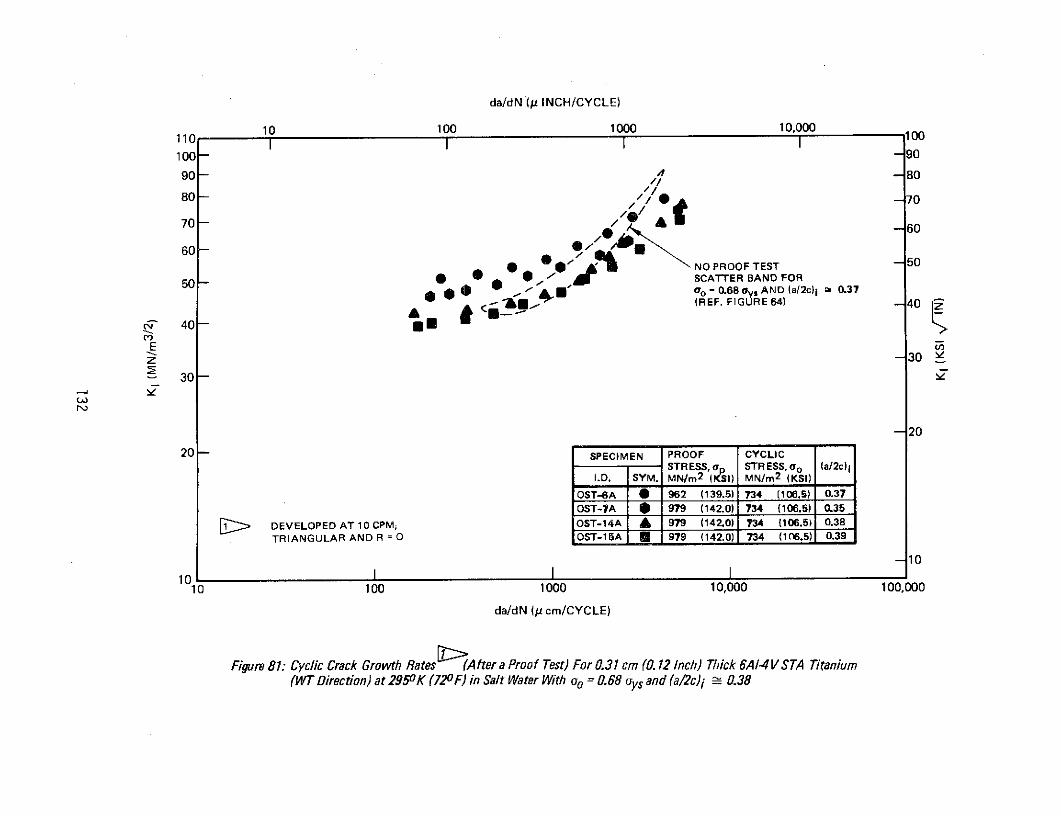
da/dN (p INCH/CYCLE)
10 100 1000 10,000110 0I 0 I I loo100- -90
90- -80
80- / -70
70 / 60
60 -e / 0 : NO PROOF TEST 50
50- SCATTER BAND FORl ei ' 00 = 0.68 ys AND (a/2c)i 2 0.37
o . )Ci'"-A (REF. FIGURE 64)- 40
6 40 -
Ez --30
30-
-20
20 - SPECIMEN PROOF CYCLICSTRESS, a STRESS, ao (a/2c) i
I.D. SYM. MN/m 2 (SI) MN/m 2 (KSI)
OST-6A 1 962 (139.5) 734 (106.5) 0.37OST-7A S 979 (142.0) 734 (106.5) 0.35
DEVELOPED AT 10 CPM, OST-14A A 979 (142.0) 734 (106.5) 0.38TRIANGULAR AND R = O OST-15A U 979 (142.0) 734 (106.5) 0.39
10
10 I I I10 100 1000 10,000 100,000
da/dN (p cm/CYCLE)
Figure 81: Cyclic Crack Growth Rates (After a Proof Test) For 0.31 cm (0.12 Inch) Thick 6AI4VSTA Titanium(WT Direction) at 2950K (720F) in Salt Water With oo = 0.68 aysand (a/2c)i : 0.38

da/dN (p INCH/CYCLE)
110 10 100 1000 10,000 00
100- -90
90- -80
70 - - 60
60 -0 Aj * -50
50 - NO PROOF TEST SCATTERi Au BAND FOR 0o = 68 0ys AND 40
(a/2c)i a 0.10-40- (REF. FIGURE 65)
E-30
t 30-
-20
20 - SPECIMEN PROOF CYCLICSTRESS, a STRESS, oo (a/2c)i
I.D. SYM. MN/m 2 (SI) MN/m 2 (KSI)
ST6-3 O 975 (141.4) 734 (106.5) 0.11ST6-4 I 883 (128.0) 734 (106.5) 0.10
[:> DEVELOPED AT 10 CPM, ST-11 979 (142.0) 734 (106.5) 0.10TRIANGULAR AND R = O ST6-12 U 979 (142.0) 734 (106.5) 0.10
-10
10 I I I10 100 1000 10,000 100,000
da/dN (u cm/CYCLE)
Figure 82: Cyclic Crack Growth Rates (After a Proof Test) For 0.16 cm (0.063 Inch) Thick 6A-4V STA Titanium
(WT Direction) at 2950K (720 F) in Salt Water With oo = 0.68 oys and (a/2c)i - 0. 10
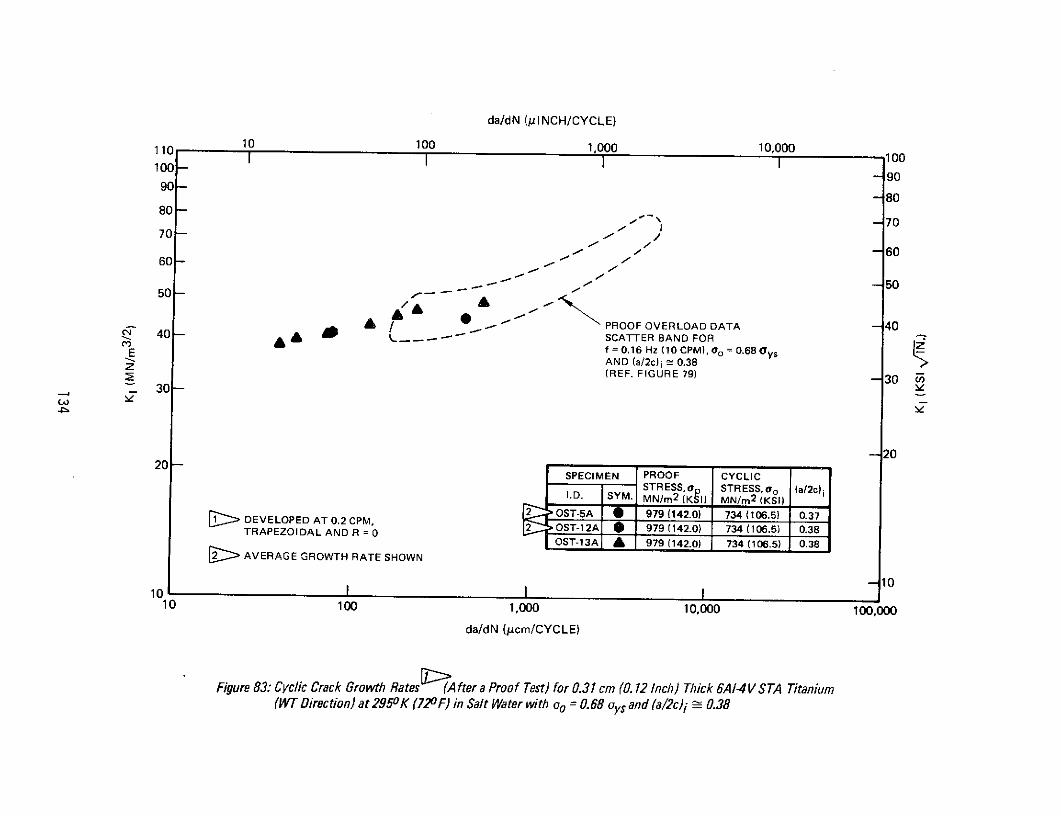
da/dN (/INCH/CYCLE)
110 10 100 1,000 10,000SI I I 100100 -90-90
-8080-80
80- - 70
70-
60- -60
- 5050- --
SPROOF OVERLOAD DATA -40C 1 40 A -- SCATTER BAND FOR
E f = 0.16 Hz (10 CPM), 0o = 0.68 Oy sZ AND (a/2c) i 0.38
(REF. FIGURE 79) 3030 -
- 2020-
SPECIMEN PROOF CYCLICSTRESS, a STRESS, ao (a/2c) iI.D. SYM. MN/m2 (KI) MN/m2
(KSI)2 OST-5A 0 979 (142.0) 734 (106.5) 0.37
SDEVELOPED AT 0.2 CPM, OST-5A 979 (142.0) 734 (106.5) 0.37TRAPEZOIDAL AND R = 0 2 OST-12A 979 (142.0) 734 (106.5) 0.38
AVERAGE GROWTH RATE SHOWN OST-13A A 979 (142.0) 734(106.5) 0.38[ AVERAGE GROWTH RATE SHOWN
- 10o10 I I I
10 100 1,000 10,000 100,000da/dN (Mcm/CYCLE)
Figure 83: Cyclic Crack Growth Rates (After a Proof Test) for 0.31 cm (0.12 Inch) Thick 6A1-4V STA Titanium(WT Direction) at 2950K (720F) in Salt Water with o = 0.68 oysand (a/2c)i - 0.38
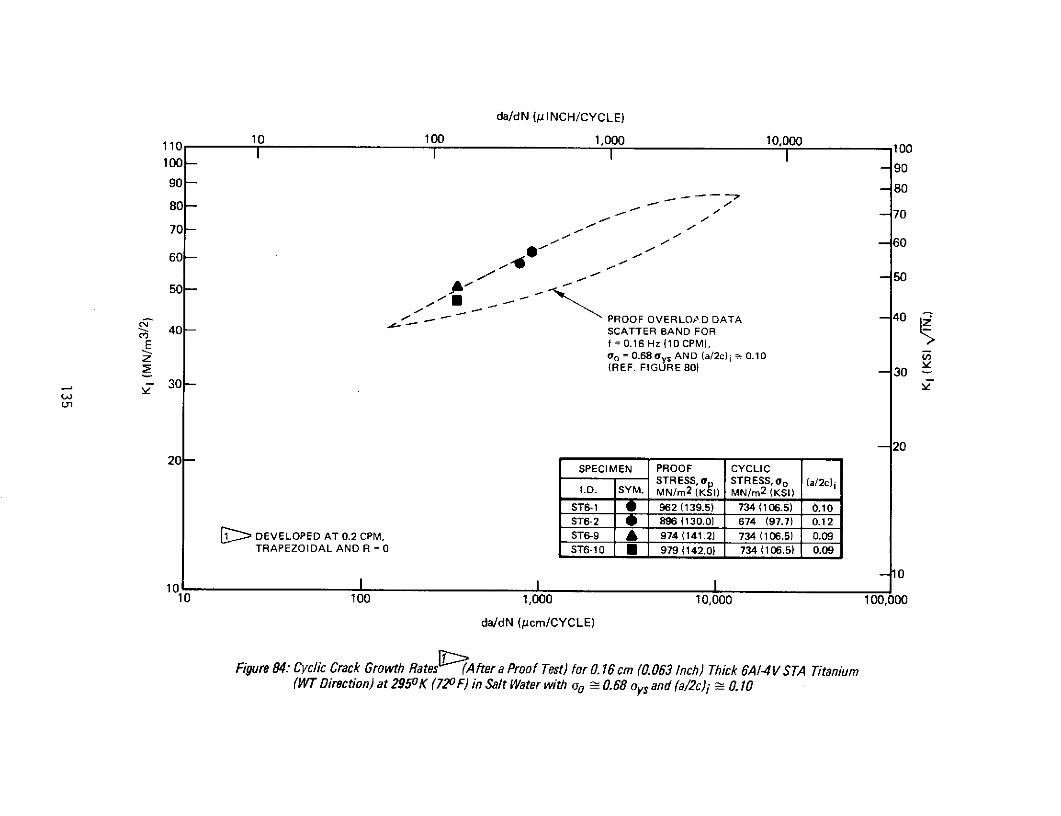
da/dN (ChINCH/CYCLE)
110 10 100 1,000 10,000 100
100- -9090 90
90
-60
60 --
/ 5050 -
PROOF OVERLOAD DATA 4040 0- SCATTER BAND FOR
E f =
0.16 Hz (10 CPM),E o = 0.68ys AND (a/2c) i 0.10
z(REF. FIGURE 80) -30
30-
2020 -
SPECIMEN PROOF CYCLICSTRESS,ap STRESS, a o (a/2c)iI.D. SYM. MN/m 2
(KSI) MN/m 2 (KSI)
ST6-1 962 (139.5) 734 (106.5) 0.10ST6-2 896 (130.0) 674 (97.7) 0.12
DEVELOPED AT 0.2 CPM, ST6-9 A 974 (141.2) 734 (106.5) 0.09TRAPEZOIDAL AND R = 0 ST6-10 U 979 (142.0) 734 (106.5) 0.09
-10
10 100 1,000 10,000 100,000
da/dN (pcm/CYCLE)
Figure 84: Cyclic Crack Growth Rates (After a Proof Test) for 0. 16 cm (0.063 Inch) Thick 6A-4V STA Titanium(WT Direction) at 295oK (72oF) in Salt Water with oo - 0.68 oys and (a/2c)i - 0. 10
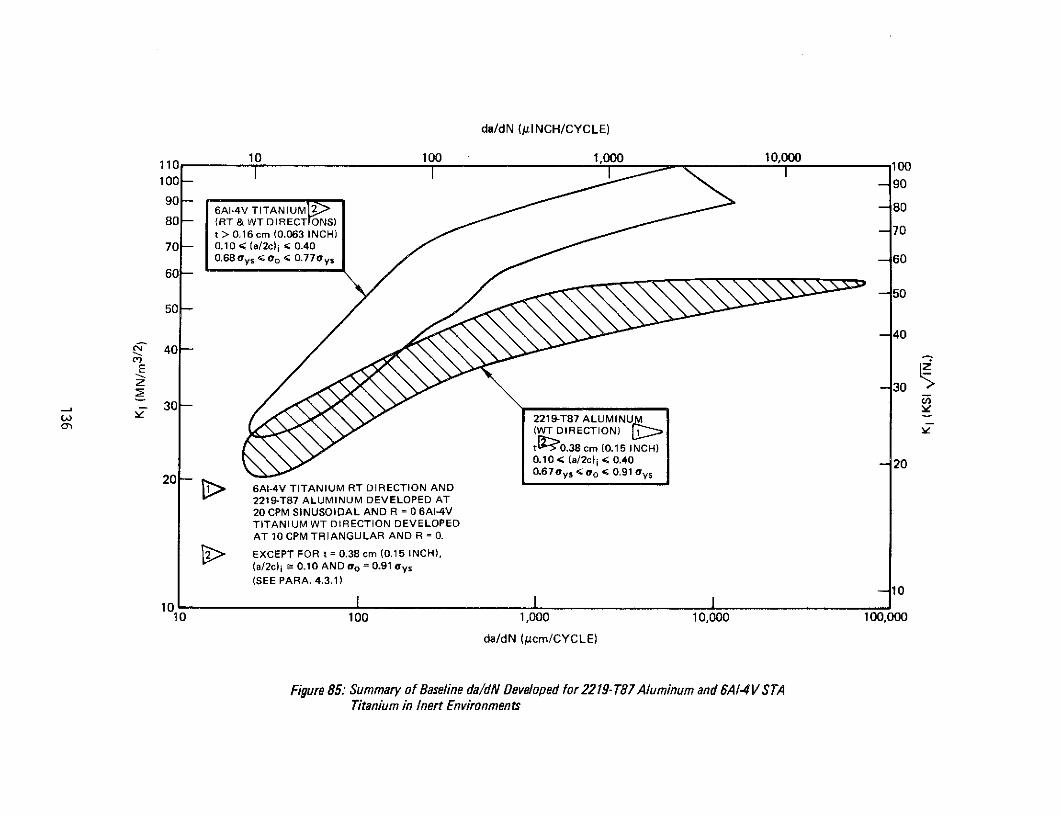
da/dN (/IINCH/CYCLE)
110 10 100 1,000 10,000
100- ' 90
90 86AI-4V TITANIUM -80
80- (RT & WT DIRECTIONS)t > 0.16 cm (0.063 INCH) - 70
70- 0.10 < (a/2c) i < 0.400.
6 8 ys < co 0.
7 7 ys 6060-
50
50
-40
v 222192T87DALUMINUM
(WT DIRECTION) 1 DtF0.38 cm 0.15 INCH)
0.10 < (a/2c)i < 0.40 420 0
lo0.67 o 0 0.91 bys20 -6Al-4V TITANIUM RT DIRECTION AND221F9-T87 ALUMINUM DEVELOPED AT20 CPM SINUSOIDAL AND R = 0 6AE-4VTITANIUM WT DIRECTION DEVELOPEDAT 10 CPM TRIANGULAR AND R = 0.
EXCEPT FOR t = 0.38 cm (0.15 INCH),(a/2c)i 0.10 ANDoo= 0.91ys(SEE PARA. 4.3.1)
10
10 100 1,000 10,000 100,000
da/dN (jicm/CYCLE)
Figure 85: Summary of Baseline da/dN Developed for 2219- T7 Aluminum and 6A/-4 V STATitanium in Inert Environments

0.54 cm (0.21 INCH) 0.31 cm (0.12 INCH) 0.16 cm (0.063 INCH)THICK DATA THICK DATA THICK DATA
80 (a/2c) i 0.37 80 (a/2c)i 0.37 80 (a/2c) i 5 0.0970- 45.5 < KP+S < 53.0 MN/m3/2 70- 70 -
H -KP+S > 47.2 MN/m3/260- 60- TH 6
o-o d 1 45
E 0 Ez 40- 0 40-
S30 - KS H <45.5 MN/m3/ 2 - 30 - 30
20 20- KSH < 39.2 MN/m3/2 H 47.3 MN/m3/2
SSLIGHT MARK APPLIED j SPECIMENS SUSTAINED10- AFTER PROOF TEST 10 - 1SPECIMENS AT 0.76 SUSTAINED
0 I I I I I 0I I I0.1 1 10 100 1,000 10,000 0.1 1 10 100 1,000 10,000 0.1 1 10 100 1,000 10,000SUSTAINED TIME (MIN.) SUSTAINED TIME (MIN.) SUSTAINED TIME (MIN.)
LEGEND:
SALL SPECIMENS SUSTAIN LOADEDAT oo = 0.68 oys, UNLESS NOTED
0- 0-- O SUSTAIN LOADED (S)
PROOFED + SUSTAIN LOADED (P+S)
Figure 86: Summary of 6A1-4 V STA Titanium (WT Direction) Sustained Load Data in Salt Water at 2950K (720F)

138

PRECDING PAGE BLANK NOT FIMII)
Sa/ = -0.3910 -2c 029
4.0-
3.0- Al-24/t 05 176
D 2.0 - a/2c =0.242
a/2c = 0.20D 2.
D z/t - a1.0
alays= 0.20
4. A2-2= 0.40
0- a /t 0.4629 = 0.6D a/2c - 0.268
D 2 = C70
1.0 -0.80
O r = O90
3.0 - at = 0.602D 2.0 a/2c = 0.241
4.0
0 .
3.0 - A2-4alt = 0.762
D 2.0 a/2c 0.273
1.0
0 .001 .00001 03 .004 .005 .006 .00 . .009 .010 .011
STRAIN, e, cm/cm (INCH/INCH)
Figure A-1: Ror Surface Strain Gap Date for a381 cm (a150 Inch) and a5S0 cm (a2W Inch) Thick7075. T61 Aluminum at Room Temperature
139
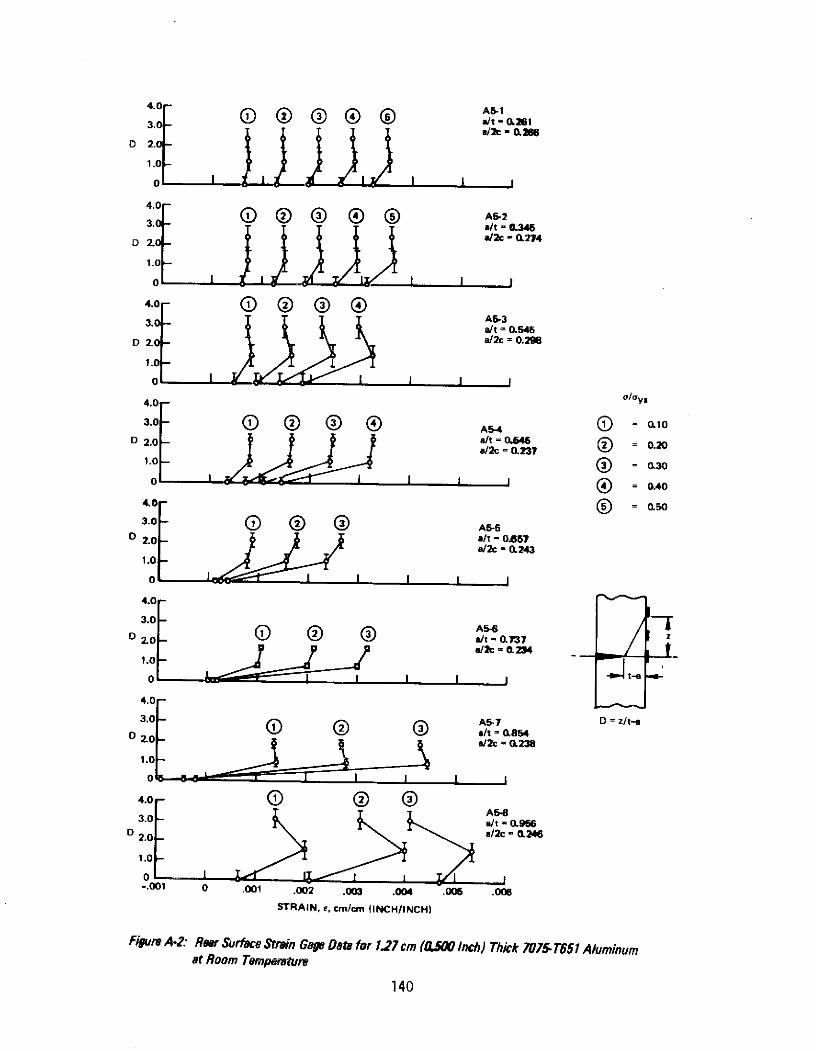
4.0 A5-
a/tc = 0.283.0 0 - 0,261
D 2.0
1.0
O I I I a12c 0.2"
4.0 - 050
3.0 000 AA2Sa/2c = 0.4345
_ I II I4.0 la3.0- A-3
at .0= 0546
a/2c = 0.234
1.0 -4.0- o/Gys
3.0- ( A5 = -= 0.40
4.0- = 0 03.0 - A5-5
D 2.0 - sh = 0.857a/2c = 0.243
1.0
o 001 I I .02 I I
.0140
4.0 -
3.0 - A-7 D = z/t-e
D 2.0 -it = 0.854
1.0-
-.001 0 .001 .002 .003 .004 .005 .008
140
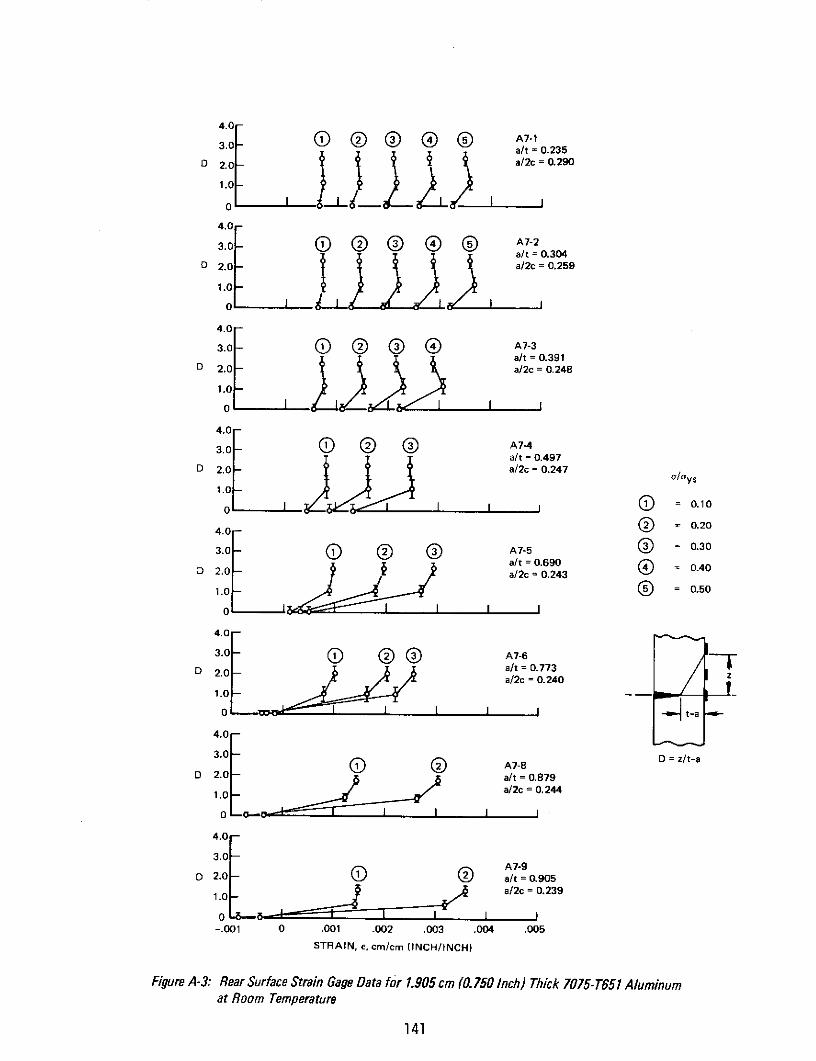
4.0-
3.0 - ® A7-1a/t = 0.235
D 2.0 a/2c = 0.290
1.0
4.0 -
3.0 Q @ A7-2a/t = 0.304
D 2.0- a/2c = 0.259
1.0
0 __
4.0 -
3.0 - A7-3a/t = 0.391
D 2.0 a/2c = 0.248
1.0-
4.0-
30 A7-4a/t = 0.497
D 2.0 - a/2c = 0.247 /y s
1.0 -
o 1 I I I I = 0.10
4.0 = 0.20
3.0- 0 A7-5 = 0.30
D alt = 0.690 0.402.0 - Da/2c = 0.243
1.0 5== 0.50
o I I I
4.0
3.0 7
30- @ @ ® A7-9 i
D - a/t = 0.77320 a/2c = 0.240 z1.0
3.00 D= z/t-a
D 2.0- A7-82h = 0.879
1.0- ,a/2c = 0.244
4.0141
3.0-A7-9
D 2.0 0 a/ = 0.905
-. 001 0 .001 .002 .003 .004 .005STRAIN, e, cm/cm (INCH/INCH)
Figure A-3: Rear Surface Strain Gage Data for 1.905cm (0.750 Inch) Thick 7075-T651 Aluminum
at Room Temperature
141
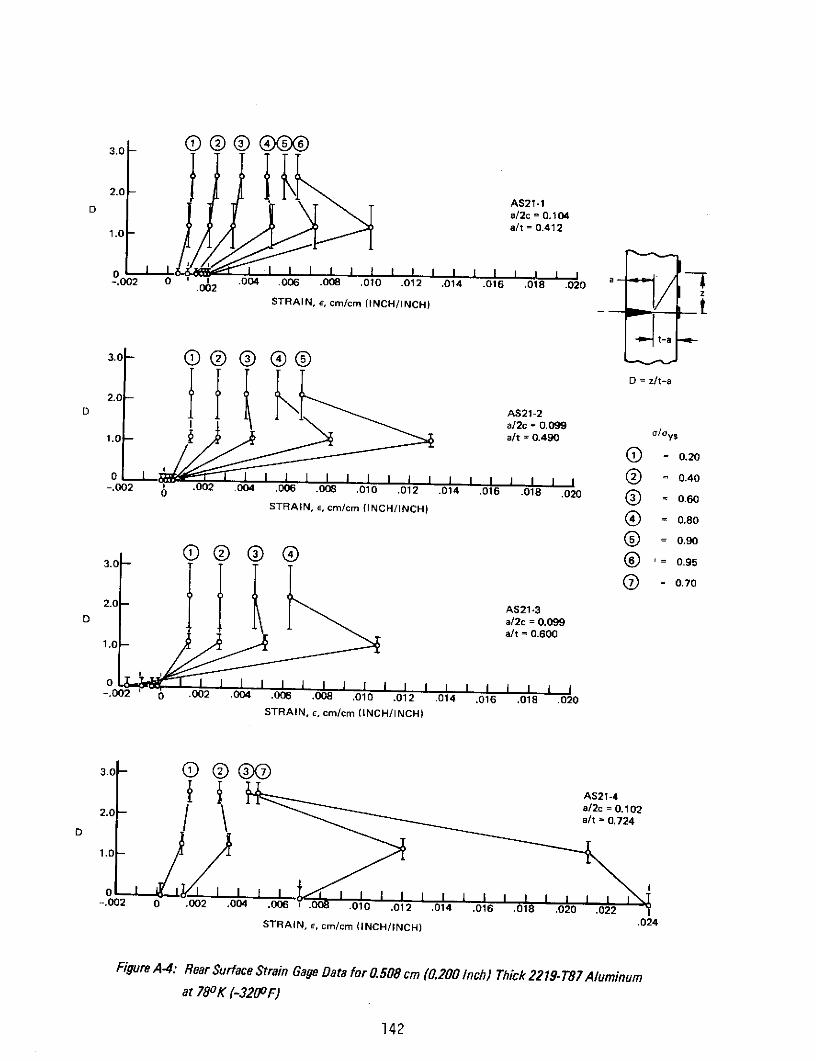
3.0 O O ®@@
2AS21-1a/2c = 0.104
1.0 a/t = 0.412
1.0
-. 002 0 ' 2 .004 .006 .008 .010 .012 .014 .016 .018 .020 a- I z
4a t-a
3.0-
Df= z/t-a2.0 -
D AS21-2a/2c = 0.099
-1. 0 a/t= 0.490 olys
= 0.20
SI I I I I I I = 0.40-. 002 .002 .004 .006 .00 .010 .012 .014 .016 .018 .020 = 0.60
STRAIN, e, cm/cm (INCH/INCH) = 0.80
= 0.903.0 0000 = 0.95
0 = 0.70
2.0 - AS21-3D a/2c = 0.099
a/t = 0.6001.0
0-. 002 0 .002 .004 .006 .008 .010 .012 .014 .016 .018 .020
STRAIN, e, cm/cm (INCH/INCH)
3.0 0 00SAS21-4
2.0 a2c= 0. 102a/t = 0.724
1.0
-.002 0 .002 .004 .006 I .00 .012 .014 .016 .018 .020 .022STRAIN, e, cm/cm (INCH/INCH) .024
Figure A-4: Rear Surface Strain Gage Data for 0 .508 cm (0.200 Inch) Thick 2219- T7Aluminumat 780 K (-320OF)
142

.006
7075-T651 ALUMINUM.005t = 1.27 cm (0.500 INCH)
o/ays = 0.30(a/2c) i a 0.25
z
o .004
a =450E
OE .oo
U .001
0
fI-U-
aa/t
-.001 -
Figure A-5: Rear Surface Strain Measurements as a Function of Flaw Depth for 7075-T651 Aluminum
at Room Temperature
143
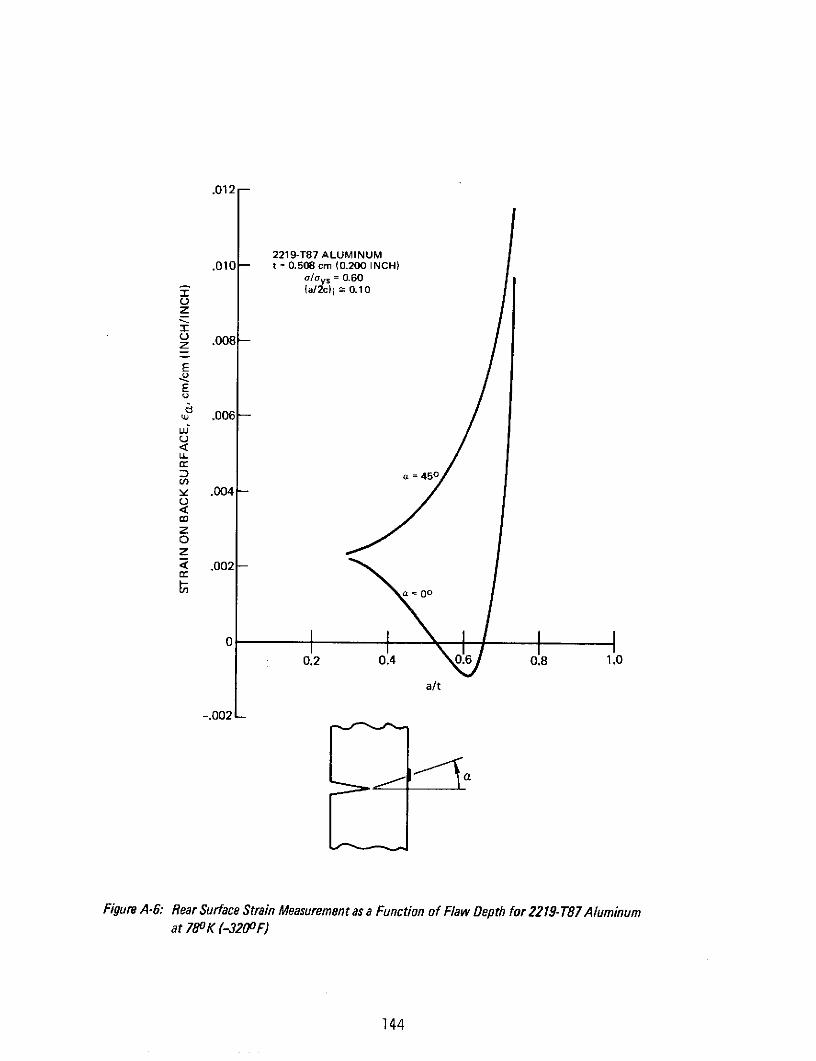
.012
2219-T87 ALUMINUM.010 t = 0.508 cm (0.200 INCH)
a/ays =0.60' (a/2c) i 0.10
zIZ-)z .008
E
E
w .006l
U-1
2 .004
Oz0z< .002
a= 00
01 1 -I I I0.2 0.4 0.6 0.8 1.0
a/t
-. 002
Figure A-6: Rear Surface Strain Measurement as a Function of Flaw Depth for 2219-T87 Aluminumat 780 K (-3200F)
144
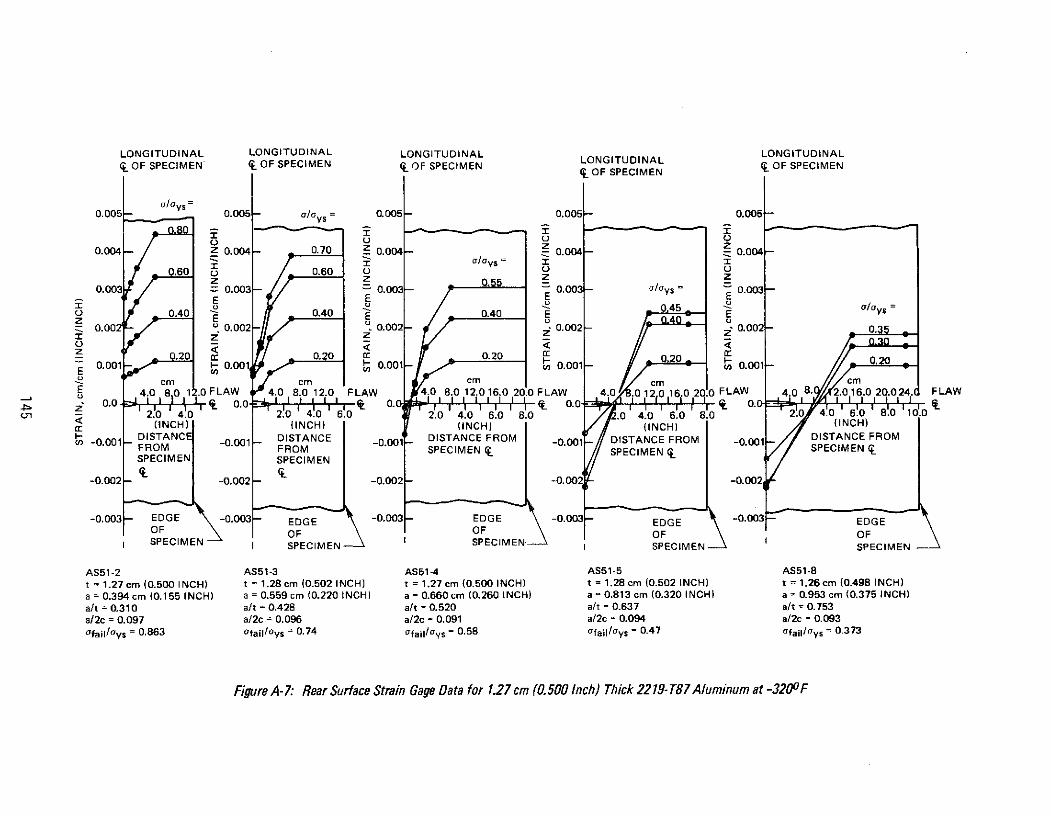
LONGITUDINAL LONGITUDINAL LONGITUDINNGITUDINAL LONGITUDINAL LONGITUDINAL( OF SPECIMEN ECIMEN CI OF OF SPECIMEN OF SPECIMENAL OF SPECIMEN
o/ays0.005 0.005- /aly = 0.005 - 0.005- 0.005-
ys .
0.004 Z 0.004 0.70 0.004- 0.004- 0.004-
I i alOys0.60 o 0.60 0 o
z z 0.55 z z0.003 0.003 - 0.003 0 0.003- oys 0.003-
z E 0.400.00 0.002 - 0.002 - 0.002- 0.002- 0.3
z z
,r 02 00.20 Er 0.20 0.20 0t20
0.001 0.001 0.001 0.001 0 0 0.001- 0.
" cm cm cm cm cm2 4.0 80 12.0 FLAW "4.0 8.0 12.0 FLAW 4.0 8.0 12.016.0 20.0 FLAW 4.0 .0 12 0 16 0 20.0 FLAW 4.0 8. 2.0 16.0 20.024. FLAW• 1_0.0. . , 0.0 0_
0 40 2.0 40 60 2.0 4.0 6.0 8.0 .0 4.0 6.0 8.0 2.0 40 6.0 8.0 10.0(INCH) (INCH) (INCH) (INCH) (INCH)
-- DISTANC DISTANCE DISTANCE FROM -0.00 DISTANCE FROM -0.001 DISTANCE FROMFROM FROM SPECIMEN ( SPECIMEN L SPECIMENSPECIMEN SPECIMEN
-0.002- -0.002- -0.002- -0.002 -0.002
-0.003 EDGE -0.003 - EDGE -0.003- EDGE -0.003 - EDGE -0.003 EDGEOF OF OF OF OFSPECIMEN SPECIMEN SPECIMEN SPECIMEN SPECIMEN
AS51-2 AS51-3 AS51-4 AS51-5 AS51-8t = 1.27 cm (0.500 INCH) t = 1.28 cm (0.502 INCH) t = 1.27 cm (0.500 INCH) t = 1.28 cm (0.502 INCH) t = 1.26 cm (0.498 INCH)
a = 0.394 cm (0.155 INCH) a = 0.559 cm (0.220 INCH) a = 0.660 cm (0.260 INCH) a = 0.813 cm (0.320 INCH) a = 0.953 cm (0.375 INCH)a/t
= 0.310 alt = 0.428 a/t = 0.520 a/t = 0.637 a/t = 0.753a/2c
= 0.097 a/2c = 0.096 a/2c = 0.091 a/2c = 0.094 a/2c = 0.093
ofail/ays = 0.863 Ofaill/ys = 0.74 ofail/as = 0.58 ofail/oys = 0.47 Ofail/Oys = 0.373
Figure A-7: Rear Surface Strain Gage Data for 1.27 cm (0.500 Inch) Thick 2219-T87 Aluminum at -3200F

146
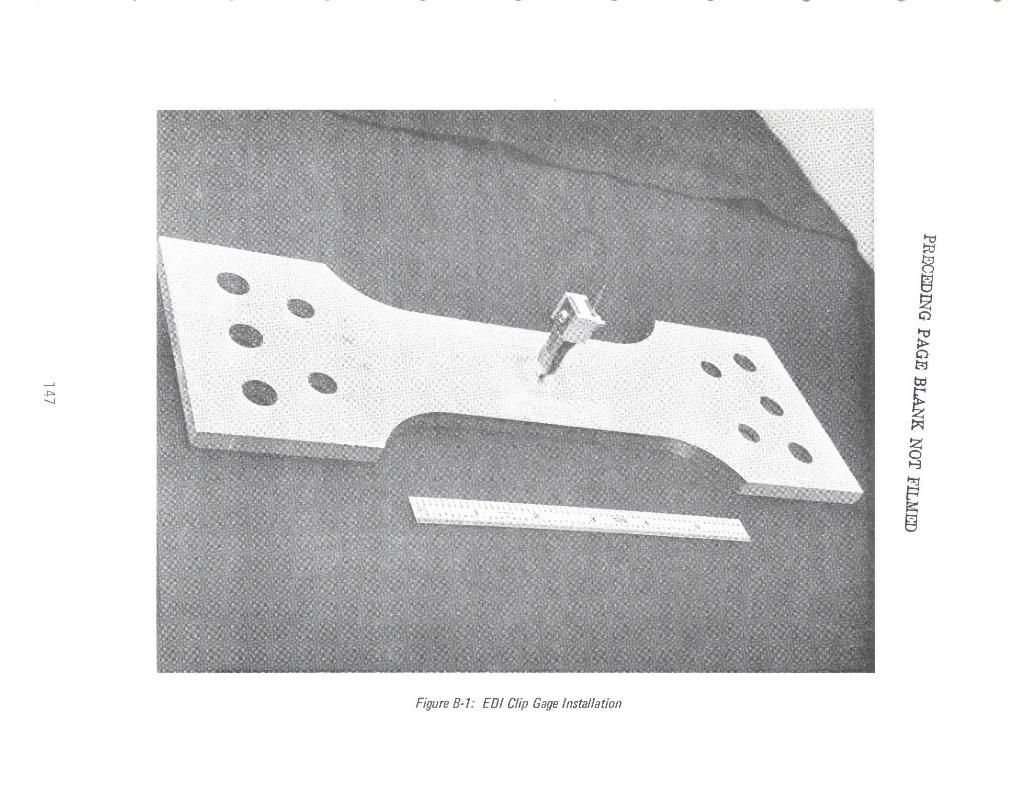
410%
Im I!1 II:! ::
Figure B-1: EDI Clip Gage Installation
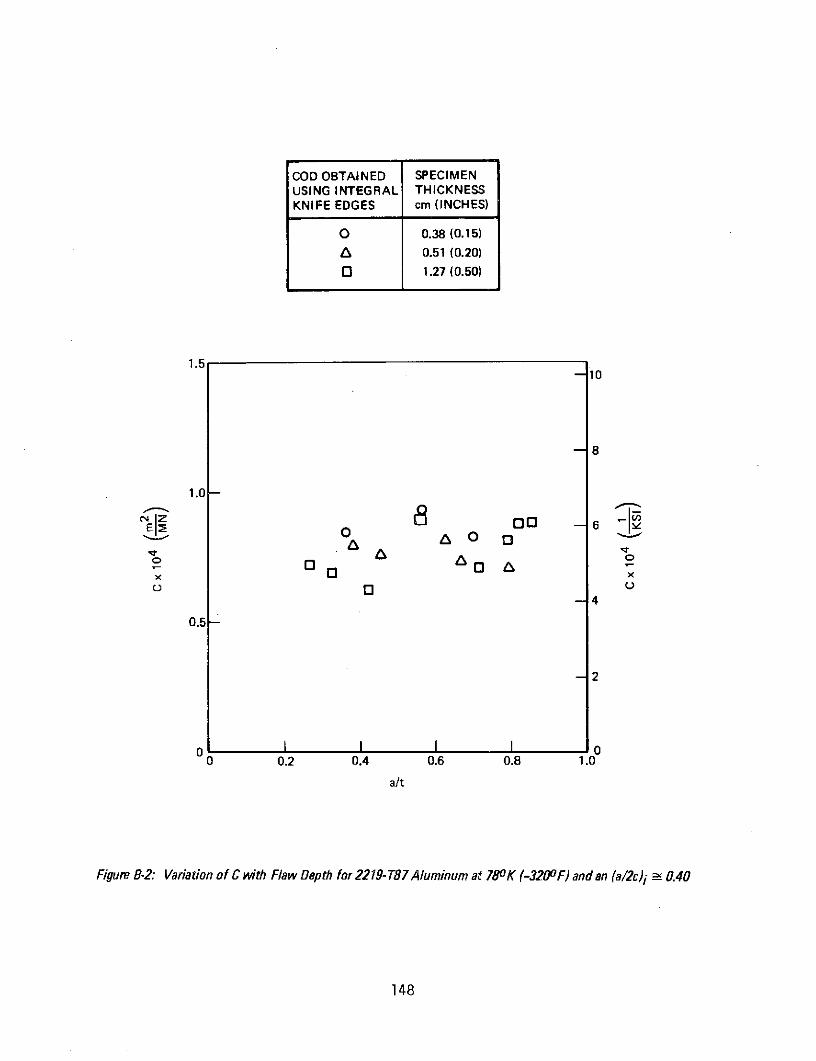
COD OBTAINED SPECIMENUSING INTEGRAL THICKNESSKNIFE EDGES cm (INCHES)
O 0.38 (0.15)A 0.51 (0.20)
O 1.27 (0.50)
1.5-10
8
1.0
0 0 00A 00 o 3 A
x
-4
0.5-
2
0 I I I I 00 0.2 0.4 0.6 0.8 1.0
a/t
Figure B-2: Variation of C with Flaw Depth for 2219-T87Aluminum at 780K (-320OF) and an (a/2c)i r 0.40
148
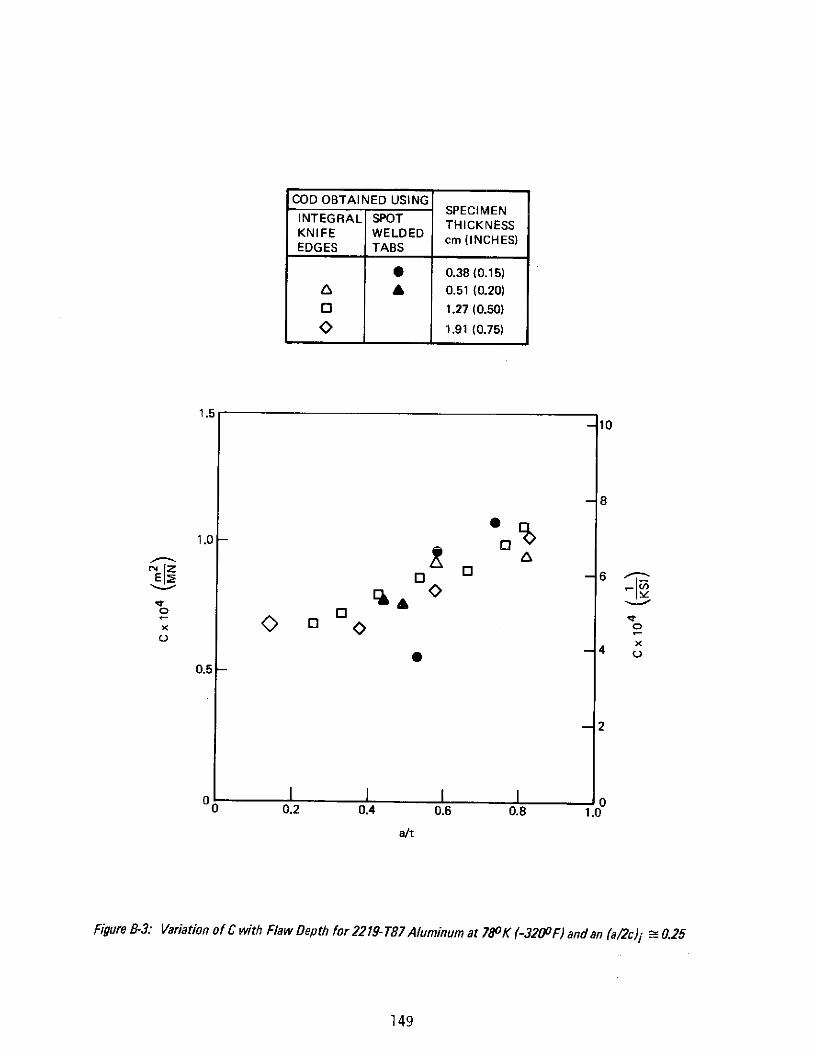
COD OBTAINED USINGSPECIMEN
INTEGRAL SPOTTHICKNESS
KNIFE WELDEDcm (INCHES)EDGES TABS
0 0.38 (0.15)A A 0.51 (0.20)
O 1.27 (0.50)
O 1.91 (0.75)
1.5-10
-8
1.0 -O
4 -4
00
x 00
0.5-
-2
0 I 00 0.2 0.4 0.6 0.8 1.0
a/t
Figure B-3: Variation of C with Flaw Depth for 2219-T87 Aluminum at 780 K (-3200F) and an (a/2c)i n 0.25
149
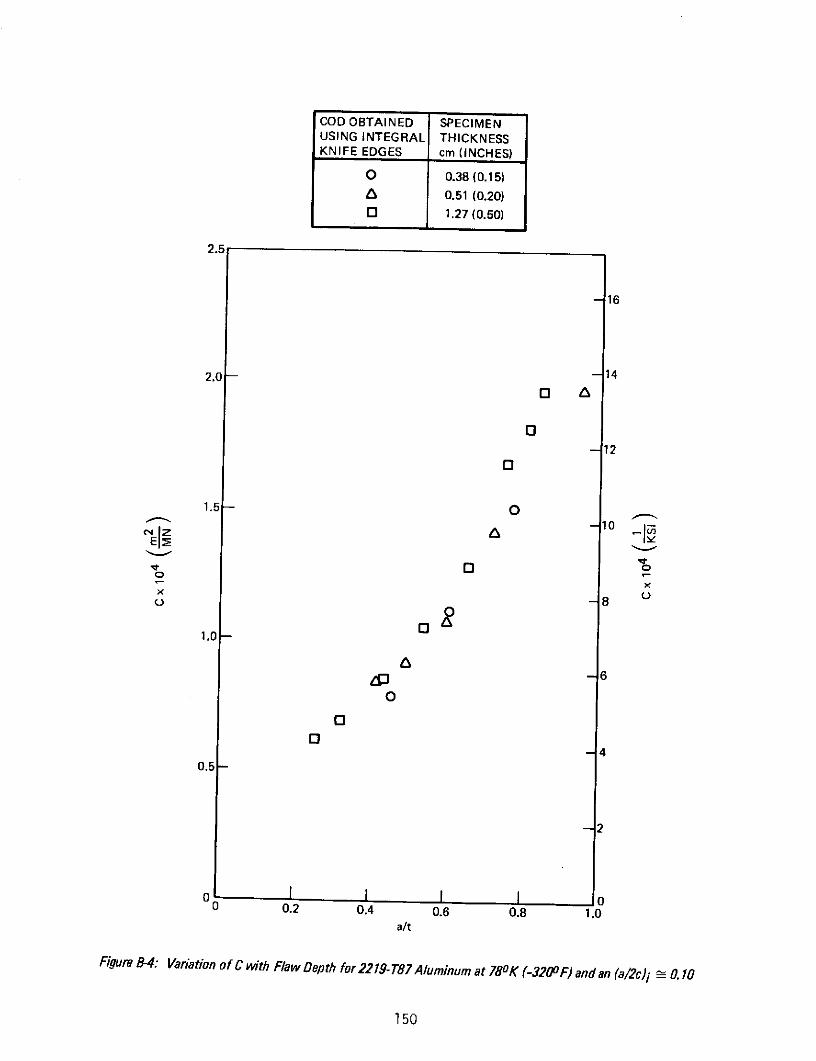
COD OBTAINED SPECIMENUSING INTEGRAL THICKNESSKNIFE EDGES cm (INCHES)
O 0.38 (0.15)a 0.51 (0.20)O 1.27 (0.50)
2.5
-16
2.0 -- 14
O A
0-12
0
1.5- O
-10
og
1.0-
-6
0
O
40.5-
2
0 00 0.2 0.4 0.6 0.8 1.0a/t
Figure 8-4: Variation of C with Flaw Depth for 22 19-T67 Aluminum at 78OK (-320OF) and an (a/2c)i 0.10
150
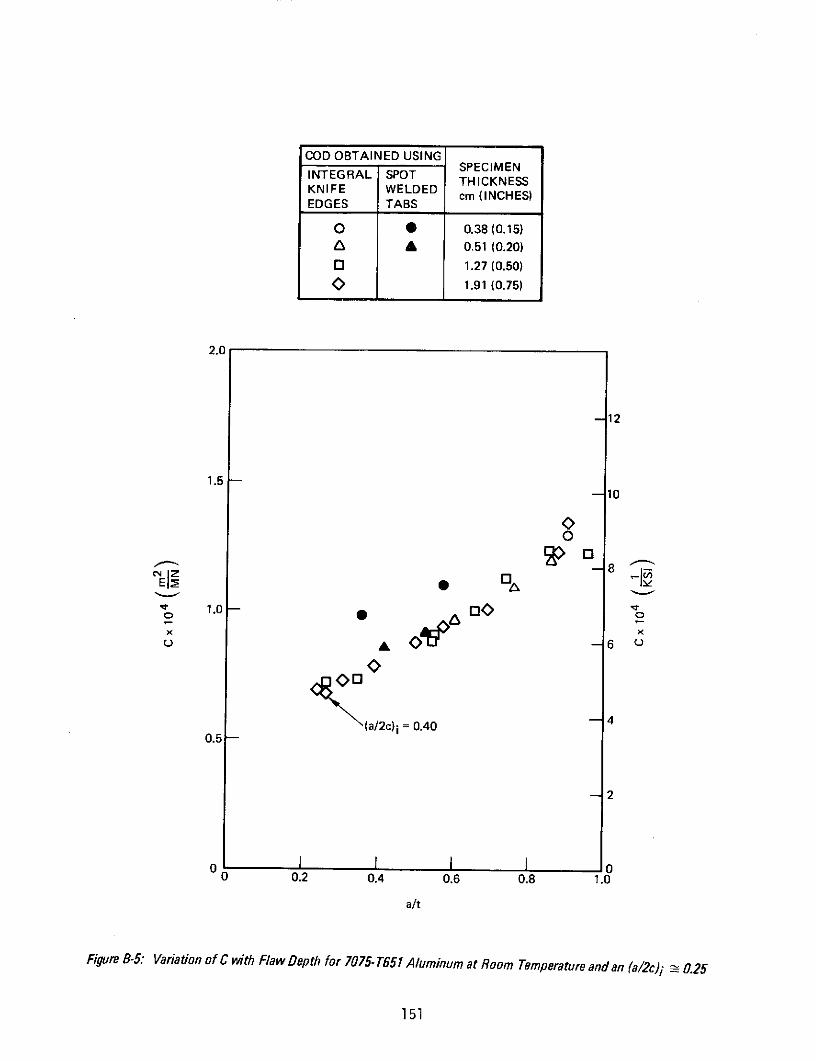
COD OBTAINED USING
INTEGRAL SPOT SPECIMENTHICKNESS
KNIFE WELDED THICKNESSEDGES TABS cm (INCHES)EDGES TABS
O 0 0.38 (0.15)6 A 0.51 (0.20)
O 1.27 (0.50)
O 1.91 (0.75)
2.0
-12
1.5-10
O -8
S 1.0 - 0
-4(a/2c)i = 0.40
0.5-
- 2
0 0.2 0.4 0.6 0.8 1.0
a/t
Figure 8-5: Variation of C with Flaw Depth for 7075- T651 Aluminum at Room Temperature and an (a/2c)i - 0.25
151

152

PRECEDING PAGE BLANK NOT FILMED
Table 1: Summary: NAS3-10290 Investigation of Deep Flaws in Thin Walled Tanks
TEST TYPE
THICKNESS TEST STATIC FRACTURE CYCLICMATERIAL TEMPERATURE
cm (INCH) OK (OF) TENSILE SURFACE CENTER SURFACEFLAWED CRACK FLAWED
2219-T87 1.588 (0.625) R.T. X X X XALUMINUM & 78 (-320) X X X XPARENT METAL 0.160 (0.063) 20 (-423) X X X X
2219 2.54 (1.00) R.T. X X X XALUMINUM & 78 (-320) X X X XWELD METAL 0.318 (0.125) 20 (-423) X X X X
5AI-2.55n ELI 0.508 (0.200) R.T. X X X XTITANIUM & 78 (-320) X X X XPARENT METAL 0.051 (0.020) 20 (-423) X X X X
5AI-2.5Sn 0.508 (0.200) R.T. X X X XTITANIUM & 78 (-320) X X X XWELD METAL 0.051 (0.020) 20 (-423) X X X X
153

Table 2: Test Summary
SURFACE FLAW TESTS
MATERIAL GAGNESS TENSILE TET FLAW DEPTH TO LENGTH RATIO (a/2c)MATERIAL THICKNESS TENSILE TESTcm (INCH) TESTS TEMPERATURE STATIC OVERLOAD OVERLOAD
OK (OF) FRACTURE CYCLIC CYCLIC SUSTAINED
2219-T87 0.381 (0.150) (A) 0.10,0.25,0.40 0.10&0.40 0.10&0.40 0.10&0.40ALUMINUM 0.508 (0.200) - (-320 0.10, 0.25, 0.40 - -
PARENT METAL 1.270 (0.500) - 0.10,0.25,0.40 0.10&0.40 0.10&0.40 0.10&0.401.905 (t.750) (A) 0.25 - -
- 0.076 (0.030) (A) 0.10, 0.25, 0.40 - -6A1-4V STA 0.152 (0080) - 0.10, 0.25, 0.40 0.10 & 0.40 0.10 & 0.40 0.10 & 0.40TITANIUM 0.30 (0.120) - R.T. 0.10, 0.25, 0.40 - 0.10 & 0.40 0.10 & 0.40PARENT METAL 0.U33 (0.210) - 0.10, 0.25, 0.40 0.10 & 0.40 0.10 & 0.40 0.10 & 0.40
0.762 (0.300) (A) 0.25 - - -
7075T651 0.381 (0.150) (B) 0.25 - - -ALUMINUM 0.508 (0.200) - R.T 0.25 - -PARENT METAL 1.270 (0.500) - 0.25 - - -PAR1.950 (0.750) (B) 0.25 - - -
(A) - TENSILE TESTS (BOTH LONGITUDINAL & TRANSVERSE) CONDUCTED AT R.T., 78 0K (-3200 F) AND 200 K (-4230 F)(B) - TENSILE TESTS (BOTH LONGITUDINAL & TRANSVERSE) CONDUCTED AT R.T.
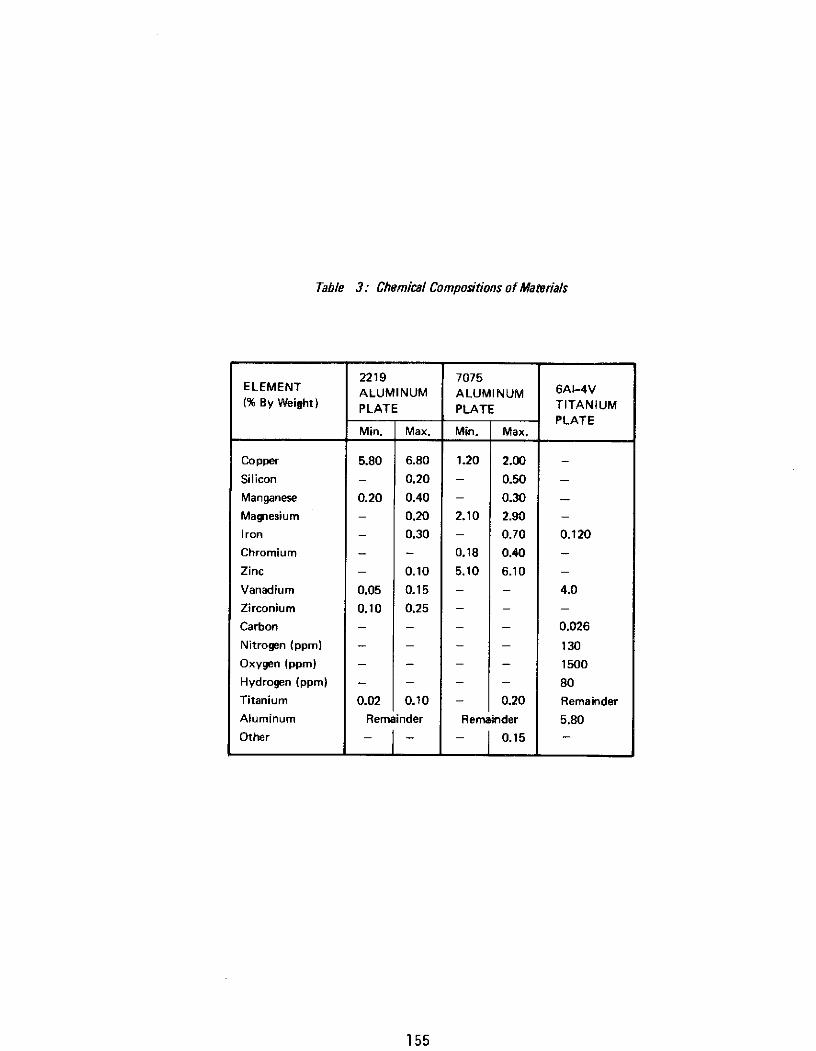
Table 3: Chemical Compositions of Materials
2219 7075ELEMENT ALUMINUM ALUMINUM 6AI-4V(% By Weight) PLATE PLATE TITANIUM
PLATEMin. Max. Min. Max.
Copper 5.80 6.80 1.20 2.00 -
Silicon - 0.20 - 0.50 -
Manganese 0.20 0.40 - 0.30 -
Magnesium - 0.20 2.10 2.90 -
Iron - 0.30 - 0.70 0.120
Chromium - - 0.18 0.40 -
Zinc - 0.10 5.10 6.10 -
Vanadium 0.05 0.15 - - 4.0
Zirconium 0.10 0.25 - - -
Carbon - - - - 0.026
Nitrogen (ppm) - - - - 130
Oxygen (ppm) - - - - 1500
Hydrogen (ppm) - - - - 80
Titanium 0.02 0.10 - 0.20 Remainder
Aluminum Remainder Remainder 5.80Other 0.15
155
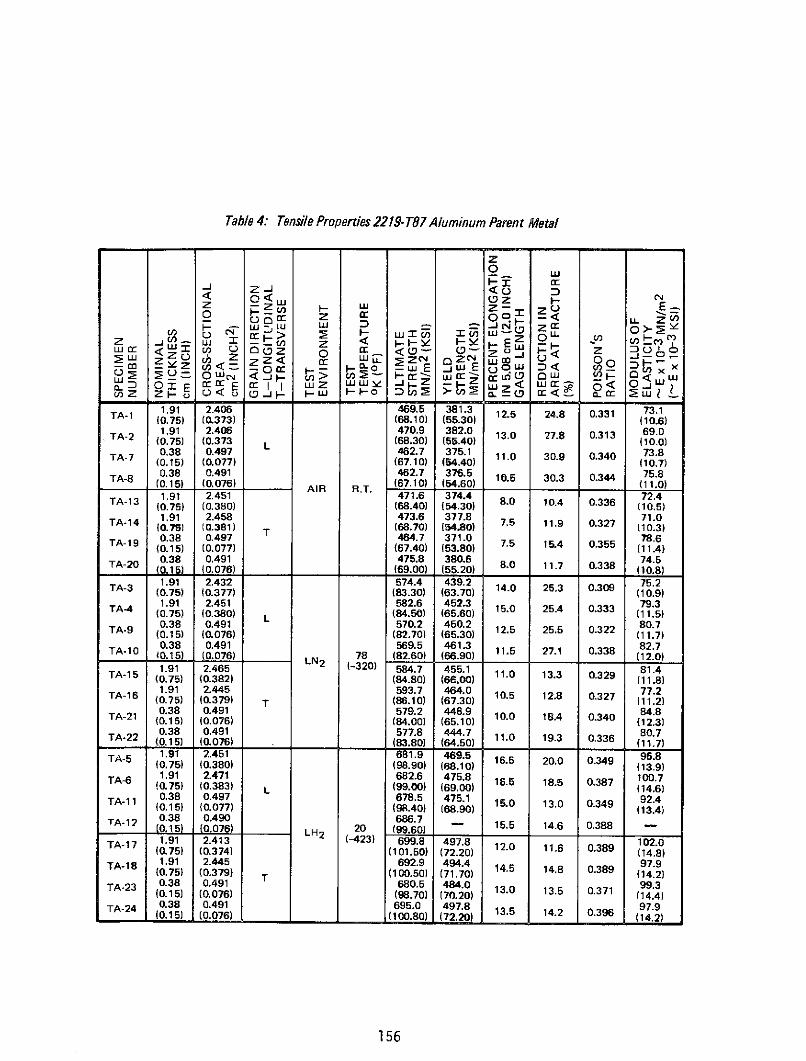
Table 4: Tensile Properties 2219- T87 Aluminum Parent Metal
z0 uw
Z --0 < -
(n F- Cq- ILU W D eF-zC0
TA-i 1.91 2.406 469.5 381.3 12.5 24.8 0.331 73.1(0.75) (0.373) (68.10) (55.30) (10.6)
1.91 2.406 470.9 382.0 13.0 27.8 0.313 69.0S 0.75) (0.373 L (68.30) (55.40) (10.0)
0.38 0.497 462.7 375.1 11.0 30.9 0.340 73.8A-7 (0.15) (0.077) (67.10) (54.40) (10.7)
TA-8 0.38 0.491 462.7 376.5 10.5 30.3 0.344 75.8S (0.15) (0.076) AIR R.T. (67.10) (54.60) (11.0)
1.91 2.40651 471.6 374.4 72.4(0.75) (0.380) (68.40) (54.30) 8.0 10.4 0.336 (10.5)
1.91 2.458 473.6 377.8 0.3 71.0TA-14 (0.75) (0.381) T (68.70) (54.80) 7.5 11.9 0.327 (10.3)
0.38 0.497 464.7 371.0 78.6TA-19 (0.15) (0.077) (67.40) (53.80) 7.5 15.4 0.355 (11.4)
(0.15) (0.077) (67.40) (54.40) (10.7)0.38 0.491 46275.8 380.6 74.58
TA20 (0.15) (0.076) A (69.00) (55.20) 8.0 11.7 0.338 (10.8)
1.91 2.432 574.4 439.2 75.2
TA-3 (0.75) (0.377) (83.30) (63.70) 14.0 25.3 0.309 (10.9)TA- 1.91 2.451 582.6 452.3 79.30.33(0.75) (0.380) L (84.50) (65.60) (11.5)
TA-9 0.38 0.491 570.2 450.2 125 25.5 0322 80.7(0.15) (0.076) (82.70) (65.30) (11.7)
0.38 0.491 569.5 461.3 033 82.7TA-10 (0.15) (0.076) 78 (82.60) (66.90) 11.5 27.1 0.338 (12.0)
1.91 2.465 LN2 (-320) 584.7 455.1 7581.4TA-15 (0.75) (0.382) (84.80) (66.00) 11.0 13.3 0.329 (11.8)TA-16 1.91 2.445 593.7 464.0 10.5 12.8 0.327 77.2(0.75) (0.379) T (86.10) (67.30) (11.2)
0.38 0.491 579.2 448.9 100 18.4 0.340 84.8TA-21 (0.15) (0.076) (84.00) (65.10) (12.3)0.38 0.491 577.8 444.7 11.0 13 0.336 80.7TA-22 (0.15) (0.076) 78 (83.80) (64.50) 9 (11.7)
1.91 2.451 681.9 (-32 16.5 20.0 0.349 95.8
TA-5 (0.75) (0.380) (98.90) (68.10) (13.9)
TA-6 1.91 2.471 682.6 475.8 16.5 18.5 0.387 100.7(0.75) (0.383) L (99.00) (69.00) (14.6)
TA-11 0.38 0.497 678.5 475.1 150 13.0 0349 92.4(0.15) (0.077) (98.40) (68.90) (13.4)0.38 0.490 686.7.TA-12 0.15) (0.076) LH 20 (99.60) - 15.5 14.6 0.388 -
TA-17 1.91 2.413 (-423) 699.8 497.8 120 11.6 0.389 102.0(0.75) (0.374) (101.50) (72.20) (14.8)
TA-18 1.91 2.445 692.9 494.4 15 1 0.38 10097.9(0.75) (0.379) T (100.50) (71.70) (14.2)
TA-23 0.38 0.491 680.5 44.01 99.4(0.15) (0.076) (98.70) (70.20) (14.4)
TA-24 0.38 0.491 695.0 497.8 13.5 14. 0.388 97.9
(0.15) (0.076) (100.80) (72.20) (14.2)
156
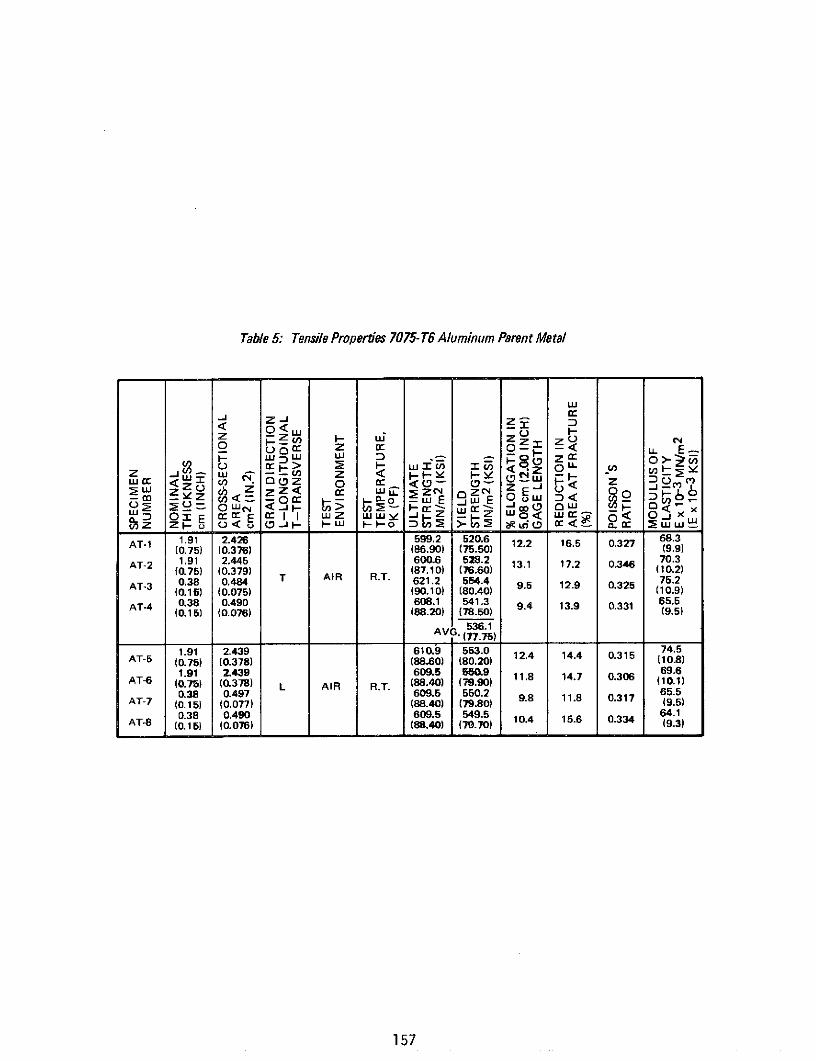
Table 5: Tensile Properties 7075-T6 Aluminum Parent Metal
LU-
U
z O E Ee Wz W_ z ov<Wt 0 Ow . x
0 2 r z a 0 3: - < U- EL
AT-1 1.91 2.426 599.2 520.6 12.2 16.5 0.327 68.3(0.75) (0.376) (86.90) (75.50) (9.9)AT-2 1.91 2.445 600.6 58.2 13.1 17.2 0.346 70.3
(0.75) (0.379) (87.10) (76.60) (10.2)
AT-3 0.38 0.484 T AIR R.T. 621.2 554.4 9.5 12.9 0.325 75.2(0.15) (0.075) (90.10) (80.40) (10.9)
AT-4 0.38 0.490 608.1 541.3 9.4 13.9 0.331 65.5(0.15) (0.076) (88.20) (78.50) (9.5)
AVG. ( w.75)
1.91 2.439 610. 553.0 12.4 14.4 0.315 74.5AT-5 (0.75) (0.378) (88.60) (80.20) (10.8)
1.91 2.439 609.5 550.9 11.8 14.7 0.306 69.6AT-o (0.75) (0.378) L AIR R.T (88.40) (79.90) (10.1)
0.38 0.497 609.5 550.2 9.8 11.8 0.317 65.5AT-7 (0.15) (0.077) (88.40) (79.80) (9.5)0.38 0.490 609.5 549.5 10.4 15.6 0.33 64.1
AT-8 (0.15) (0.076) (88.40) (79.70) (9.3)
157157

Table 6: Tensile Properties 6A14V STA Titanium Parent Metal
w
< 0 < -"
(0.25) (0.1 ) (1 30) (155. ) (17.1)
0 1174.2 10 z1 118.6I -w
(0.25) (0.24) L (130) (155.20) (17.2)T-7 0.0r 0.071 1137.0 1017.0 117.9
(0.02) (0011) AIR R.T. (165.80) (150.80) 5 .3 0.1 (172)
WU - *? z 0 Z
M ::E E cn < 0Iz wwt~ W Z 0 0 <
TT-1 0.64 0.806 1174.2 1073.0 9.0 351. 0.28 117.9(0.25) (0.125) (172.80) (162.70) (17.1)
TT- 0.64 0.800 1174.2 1070.1 1.0 34.3 0.29 11.6(0.25) (0.124) L (17030) (155.20) (1.)TT-1 0.05 0.071 1137.0 1017.04 6.0 30.9 0.310 127.
(0.02) (0.011) (164.90) (147.50) (17.7)TT-8 0.0 0.071 1143. 1039.8 5.0 23.3 0. 118.6
(0.02) (0.011) (165.80) (150.80) (17.2)0.64 0.819 1191.5 1117.0 9.0 31.2 0.290 133.1
(0.25) (0.127) (172.80) (162.00) (189.3)TT-4 0.64 0.819 1199.7 1115.6 10.0 36.3 0.291 132.4
(0.25) (0.127) T (172.00) (161.70) (19.2)-9 0.05 0.071 1137.7 1049.4 6.0 28.9 0.306 125.5(0.02) (0.011) (165242.400) (152.20) (18.2)
TT-10 0.05 0.071 1181.1 1019.0 5.0 23.3 0.308 124.11 0.02) (0.011) LN 2 78 (239.10) (156.80) (18.1)TT-3 0.64 0.819 17168.9 1658.3 133.1
(0.25) (0.127) (255.10) (24037.10) 0.2 (19.3)TT-4 0.64 0.819 1741.0 1659.6 10.6 3 0.291 132.4(0.25) (0.127) (252.50) (241.10) 6.0 .1 (19.5)TT-9 0.05 0.071 1671. 161570.7 40 22.4 0.285 125.5
(0.02) (0.011) (242.40) (227.80) (18.2)TT-10 0.05 0.071 1642.46 1568.0 3.0 21.7 0.2 124.1
(0.02) (0.0110)(2 0) (2 0) 029 (18.0)(0.64 0.819 LN (-30) 1716.9 1634.8 122.2TT-15 (0.25) (0.127) (2490.700) (237.10) (19.3)0.64 0.819 1730.50 1662.4 3.0 15.9 0.30 134.5
(0.25) (0.127) T (25.690) (241.10) (19.5)TT-12 0.05 0.071 1689.2 161923.0 2.4 12.8 0.261 133.8
(0.02) (0.011) (244.70) (233.80) (19.4)0.05 0.071 1762.4 1684.4 3. 19.2 0.294 139.
(0.02) (0.011)' (255.60) (2 1__ (0.J2)0
TT-5 0.64 0.794 2004.4 1976.1 - 18.7 0.259 122.2(0.25) (0.127) (290.7) (286.9) (17.72)
TT-6 0.64 0.813 2017.5 1972 3.0 15.9 0.264 127.9(0.25) (0.126) L (292.6) (286.9) (18.51)
TT.11 0.08 0.071 127.4(.02) (0.011) 0.262 (18.48)
TT-12 0.05 0.071 1989.2 1923.0 24 1.8 0.261 1234.5(0.02) (0.012) 20 (28&5) (2M9) (1835)TT17 0.64 0.819 LH2 (-423) 1931.3 1909.2 30 18.0 ( 136.7
(0.26) (0.127) (2801) (278.9) (19.83)064 0.819 1949.2 - 133.1
(0.25) (0.127) T (282.7) (19.31)0.05 0.071 1953.4 1861.0 3.0 18.0 0.261 134.9(0.02) (0.011) (283.3) (269.9) (19.57)TT-24 05 0.071 1958.2 1881.0 135.7
-24 (02) (0.011) (278 0.25) (19.3)
158
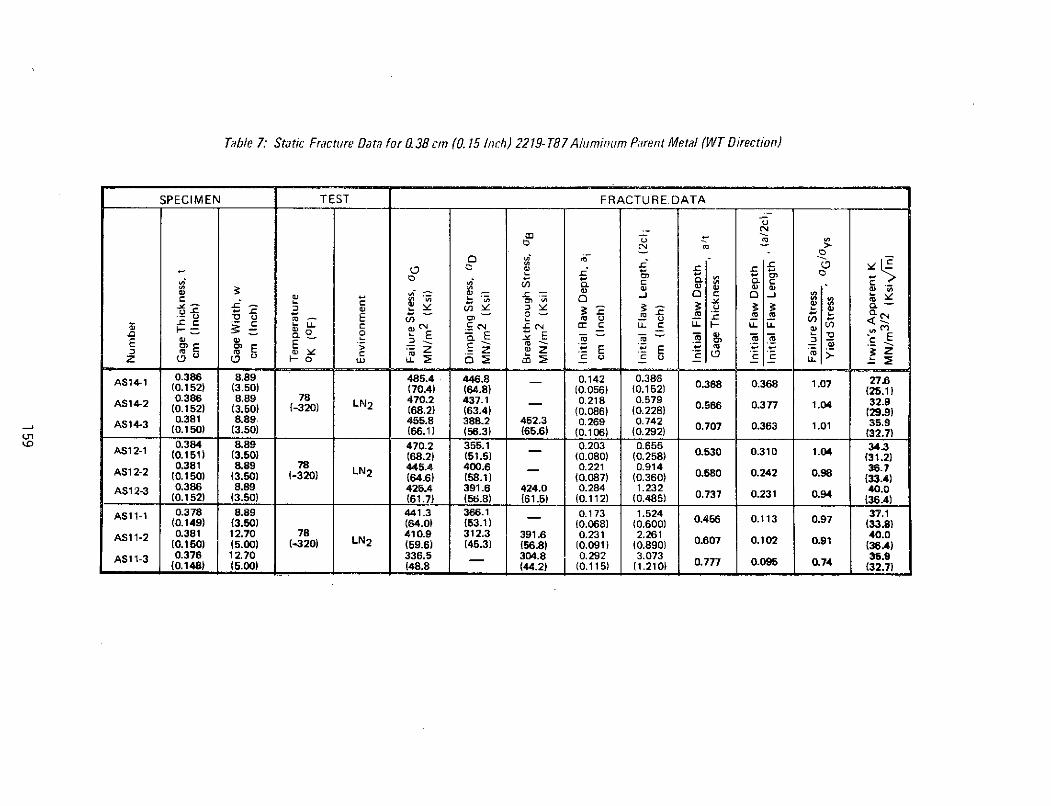
Table 7: Static Fracture Data for 0.38 cm (0. 15 Inch) 2219-T87 Aluminum Parent Metal (WT Direction)
SPECIMEN TEST FRACTURE DATA
u
S0 M W C
AS14-2 038 L 470.2 3 . 0.566 0.377 1.04 3.
(0.150) (3.50) (66.1) (56.3) (65.6) (0.106) (0.292) (32.7)
0.38 8.89 470.2 355.1 0.203 0.655 34
AS12-1 (0.151) (3.50) (68.2) (51.5) (0.080) (0.258) 0.530 0.310 1.04 (31.2)
0.381 8.89 78 445.4 400.6 0.221 0.914 36.7AS1-2 (0.150) (3.50) (-320) LN 2 (6.6) (58.1) (0.087) (0.360) 0.580 0.242 0.98 (23.4)
AS12-3 0.386 8.89 425.4 391.6 424.0 0.284 1. 232 40.0(0.152) (3.50) (61.7) (56.8) (61.5) (0.112) (0.485) 0.737 0.231 0.94
AS1-1 0.378 8.89 441.3 366.1 0.173 1.524 37.1(0.149) (3.50) (64.0) (53.1) (0.068) (0.600) 0.456 0.113 0.97 (33.8)
AS11-2 0.381 12.70 78 410.9 312.3 391.6 0.231 2.261 40.0(0.150) (5.00) (-320) LN2 (59.6) (45.3) (56.8) (0.091) (0.890) 0.607 0.102 0.91 (36.4)
AS11-3 0.376 12.70 336.5 3048. 0.292 3.073 07 074.(0.148) (5.00) (48.8 (44.2) (0.115) (1210) (32.7)
(0.148) (5.00) (48.8 (44.2) (0.115) (1.210) 0.777 0.095 0.74 (32.7)
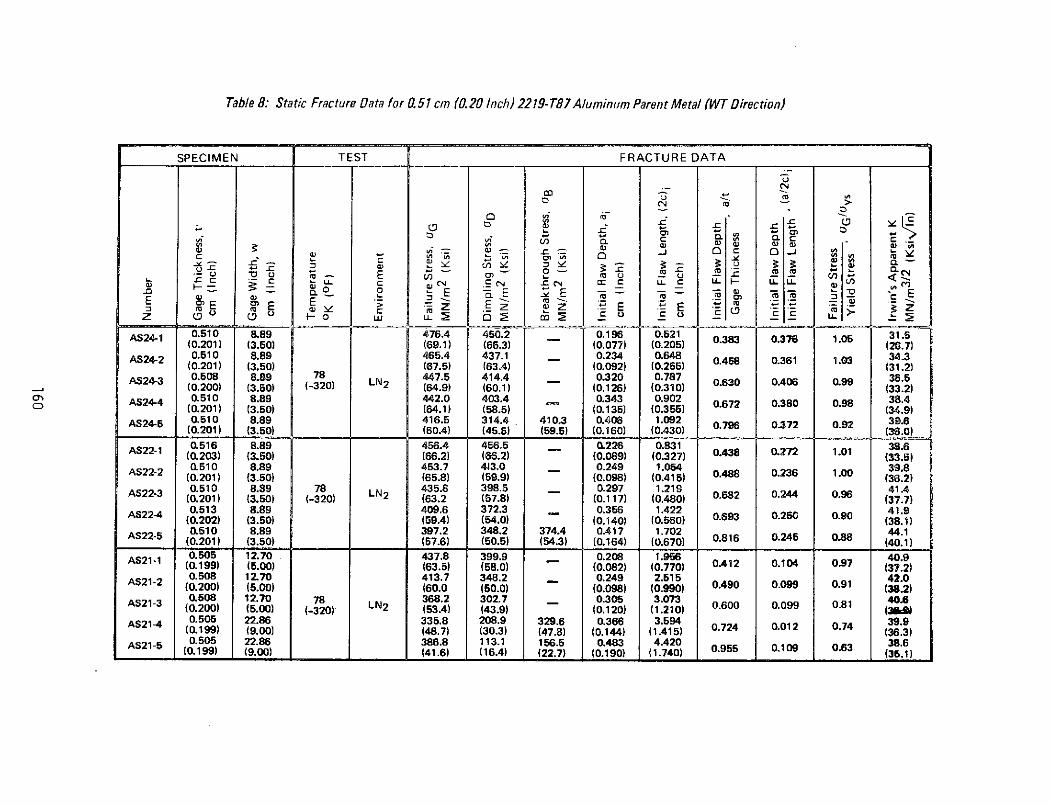
Table 8: Static Fracture Data for 0.51 cm (0.20 Inch) 2219- T87Aluminum Parent Metal (WT Direction)
SPECIMEN TEST FRACTURE DATA
CO,
Sm- - ,/
CL .. ..
.C - Co u m . 'jC
zC U- - E m C LL LL uu
AS24-1 0.510 8.89 476.4 450.2 0.196 0.521 ......... 0 31.5(0.201) (3.50) (69.1) (65.3) (0.077) (0.205) 0.383 0.376 .s (28.7)AS24-2 0.510 8.89 465.4 437.1 0.234 0.648 0.458 0.361 134.3
(0.201) (3.50) (67.5) (63.4) (0.092) (0.255) (31.2)AS24-3 0.508 8.89 78 447.5 414.4 0.320 0.787 0.630 0.406 0.99 38.5
(0.200) (3.50) (-320) L 2 (64.9) (60.1) (0.126) (0.310) (33.2)AS24-4 0.510 8.89 442.0 403.4 0.343 0.902 38.4
o: (0.201) (3.50) (64.1) (58.5) (0.135) (0355) (34.9)AS24-5 0.510 8.89 416.5 314.4 410.3 0.406 1.092 039.6
(0.201) (3.50) (60.4) (45.6) (59.5) (0.160) (0.430) (38.0)0.516 8.89 456.4 456.5 0.226 0.831 38.6
(0.203) (3.50) (66.2) (66.2) (0.089) (0.327) 0.438 0.272 1.01 (33.6)0.510 8.89 453.7 413.0 0.249 1.064 39.8AS22-2 (0.201) (3.50) (65.8) (59.9) (0.098) (0.415) 0.488 0.236 1.00 (36.2)0.510 8.89 78 LN 435.8 398.5 0.297 1.219 41.4AS22-3 (0.201) (3.50) (-320) (63.2 (57.8) (0.117) (0.480) 0.582 0.244 0.96 (37.7)0.513 8.89 409.6 372.3 0.356 1.422 41.9AS22-4 (0.202) (3.50) (59.4) (54.0) (0.140) (0.560) 0.693 0.26 0.90 (38.1)0.510 8.89 397.2 348.2 374.4 0.417 1.702 44.1
AS22-5 (0.201) (3.50) (57.6) (50.5) (54.3) (0.164) (0.670) 0.816 0.245 0.88 (40.1)0.505 12.70 437.8 399.9 0.208 1.956 40.9(0.199) (5.00) (63.5) (58.0) (0.082) (0.770) 0.412 0.104 0.97 (37.2)0.508 12.70 413.7 348.2 0.249 2.515 42.0
(0.200) (5.00) (60.0 (50.0) (0.098) (0.990) 0.490 0.099 0.91 (38.2)0.508 12.70 78 368.2 302.7 0.305 3.073 40.6AS21-3 (0.200) (5.00) (-320) LN2 (53.4) (43.9) (0.120) (1.210) 0.600 0.099 0.81 (3
AS21-4 0.505 22.86 335.8 208.9 329.6 0.366 3.594 39.9(0.199) (9.00) (48.7) (30.3) (47.8) (0.144) (1.415) 0.724 0.012 (36.3)0.505 22.86 386.8 113.1 156.5 0.483 4.420 38.6
(0.199) (9.00) (41.6) (16.4) (22.7) (0.190) (1.740) 0.955 0.109 0.63 (3.1)
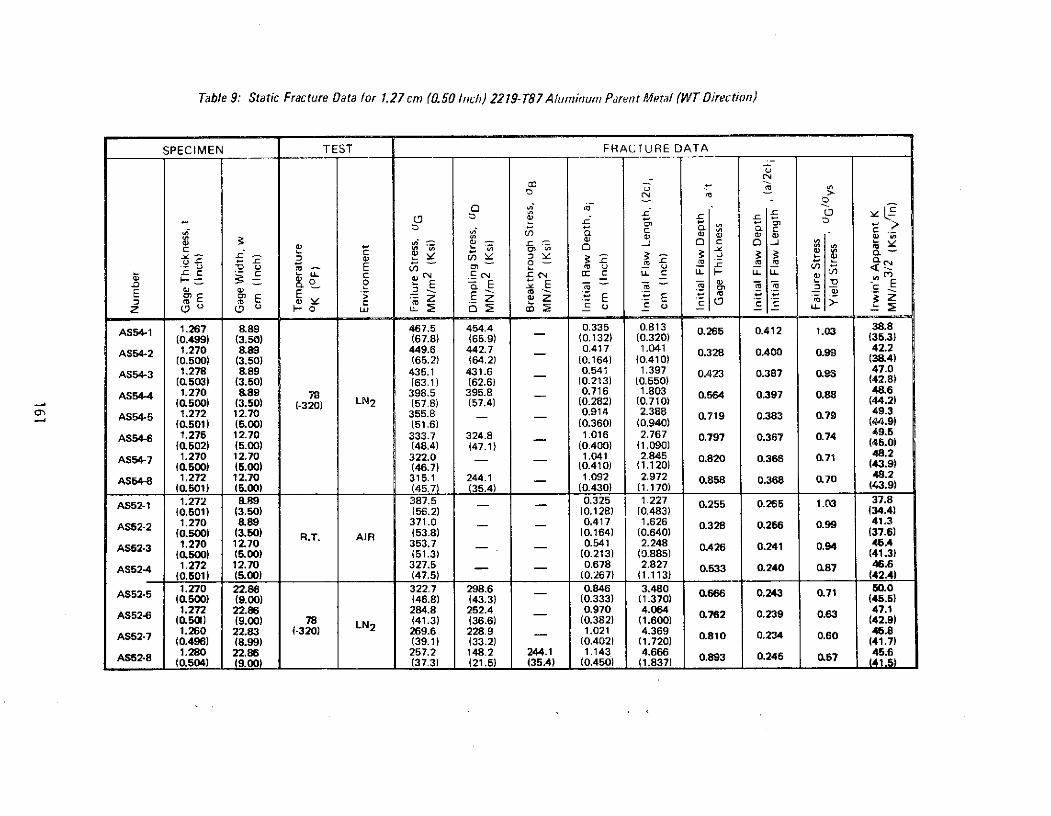
Table 9: Static Fracture Data for 1.27cm (0.50 Inch) 2219- T87 Aluminum Pdrent Metal (WT Direction)
SPECIMEN TEST FRACTURE DATA
CO-,
U -- (m - L u
SWC
E E E Z -c -E E > Z C - - z .
-U U- O
AS54-1 1.267 8.89 467.5 454.4 0.335 0.813 0.265 0.412 1.03 38.8(0.499) (3.50) (67.8) (65.9) (0.132) (0.320) (35.3)
AS54-2 1.270 8.89 449.6 442.7 0.417 1.041 0.328 0.400 0.99 42.2(0.500) (3.50) (65.2) (64.2) (0.164) (0.410) (38.4)
AS54-3 1.278 8.89 435.1 431.6 0.541 1.397 0.423 0.387 0.98 47.0
(0.503) (3.50) (63.1) (62.6) (0.213) (0.550) (42.8)
AS54-4 1.270 889 78 398.5 395.8 0.716 1.803 0.564 0.397 0.88 48.6(0.500) (3.50) (-320) LN2 (57.8) (57.4) (0.282) (0.710) (44.2)
AS54-5 1.272 12.70 355.8 0.914 2.388 0.719 0.383 0.79 49.3(0.501) (5.00) (51.6) (0.360) (0.940) (44.9)
AS54-6 1.275 12.70 333.7 324.8 1.016 2.767 0.797 0.367 0.74 49.5(0.502) (5.00) (48.4) (47.1) (0.400) (1.090) (46.0)
AS54-7 1.270 12.70 322.0 - 1.041 2.845 0.820 0.366 0.71 48.2(0.500) (5.00) (46.7) (0.410) (1.120) (43.9)
AS54-8 1.272 12.70 315.1 244.1 1.092 2.972 0.858 0.368 0.70 48.2(0.501) (5.00) (45.7) (35.4) (0.430) (1.170) (43.9)
AS52-1 1.272 8.89 387.5 0.325 1 227 0.255 0.265 1.03 37.8(0.501) (3.50) (56.2) (0.128) (0.483) (34.4)
AS52-2 1.270 8.89 371.0 - 0.417 1.626 0.328 0.256 0.99 41.3(0.500) (3.50) R.T. AIR (53.8) (0.164) (0.640) (37.6)
AS52-3 1.270 12.70 353.7 0.541 2.248 0.426 0.241 0.94 46.4(0.500) (5.00) (51.3) (0.213) (0.885) (41.3)
AS52-4 1.272 12.70 327.5 0.678 2.827 0.533 0.240 087 46.6(0.501) (5.00) (47.5) (0.267) (1.113) (42.4)
1.270 22.86 322.7 298.6 0.846 3.480 0.666 0.243 0.71 50.0(0.500) (9.00) (46.8) (43.3) (0.333) (1.370) (45.5)
AS52-6 1.272 22.86 284.8 252.4 0.970 4.064 0.762 0.239 0.63 47.1(0.501) (9.00) 78 (41.3) (36.6) (0.382) (1.600) (42.9)
1.260 22.83 (-320) LN2 269.6 228.9 - 1.021 4.369 0.810 0.234 0.60 45.8(0.496) (8.99) (39.1) (33.2) (0.402) (1.720) (41.7)
AS52-8 1.280 22.86 257.2 148.2 244.1 1.143 4.666 0.893 0.245 0.57 45.6(0.504) (9.00) (37.3) (21.5) (35.4) (0.450) (1.837) 1 (41.5)
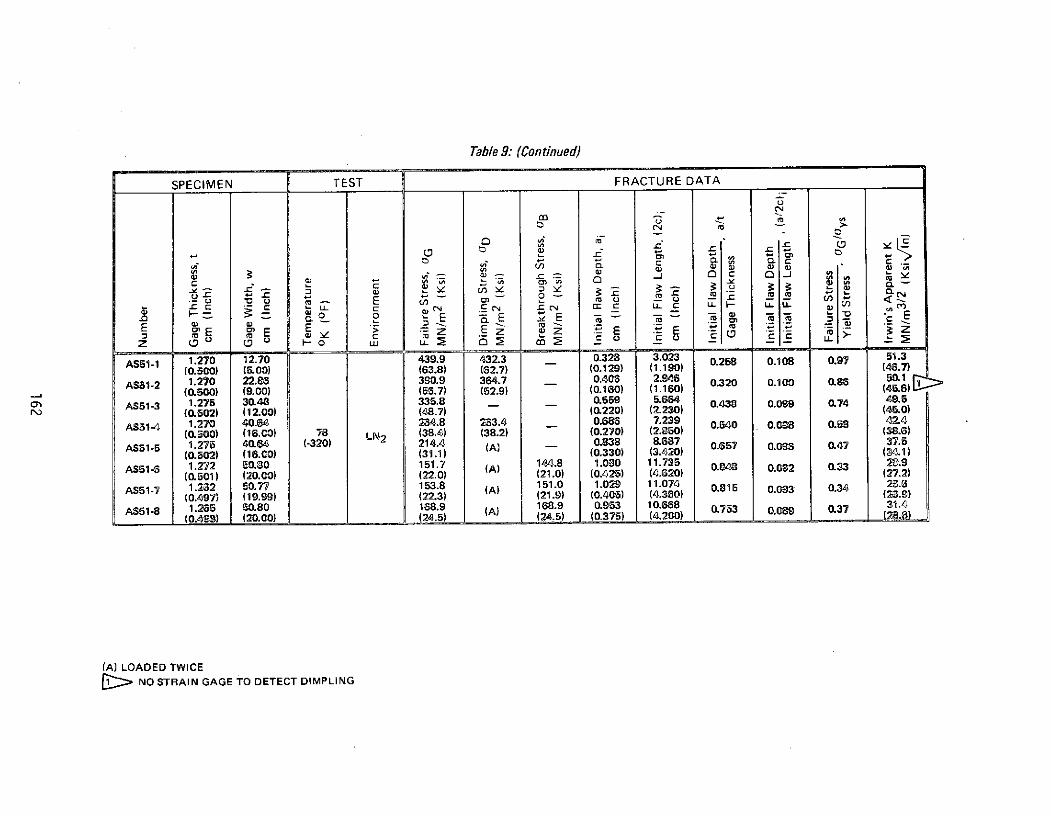
Table 9: (Continued)
SPECIMEN TEST FRACTURE DATA
zm - W cm
(0.500) (5.00) (63.8) (62.7) (0.129) (1.190) (46.7)AS51-2 1.270 22.88 300.9 364.7 0.4-c 2.94 0.320 0.100 0.86
.C C L "
(0.502) (12.00) (48.7) (0.220) (2.230) (4 .0)
AS51- 1.22 5.80 151.7 (A) 0 0.848 0.2 0.33
(0.497) (19.9) (22.3) (21.9) (0.405) (4.30) (2.)
(A) LOADED TWICEEE E ET A T E -F c EC O O C Co CCC
Z 0" LU LLo L Lo 0 c .E - U
AS51-1 1.270 12.70 439.9 432.3 0.328 3.023 0.258 0.108 0.97 51.3
(0.500) (5.00) (63.8) (62.7) (0.129) (1.190) (46.7)
AS8-2 1.270 22.3 390.9 364.7 - 0.403 2.902 010 s(0.500) (9.00) (66.7) (52.9) (0.160) (1.160) 030 .6 8
m AS51-3 1.275 30.48 335.8 0.559 5.64 0.438 0.0(4074)NJ (0.502) (12.00) (48.7) (0.220) (2.230) 03.9.
AS51-4 1.270 40.G4 2M4.8 233.4 0.686 7.239 0.640 O.(m 0.58 42.4(0.600) (16.0) 78 LN2 (38.4) (38.2) (0.270) (2.850) 0.98.6)
AS51-5 1.275 40.64 (-320) 214.4 0.838 8.687 0.7 034 37.5(0.52) (16.00) (31.1) (0.330) (3.420) 0673.04
AS51- 1.272 50.30 151.7 (A) 144.8 1.030 11.735 0." 0092 0.33(0.501) (20.0) (22.0) (21.0) (0.425) (4.620) (27.2)
AS51-7 1.232 50.77 I 153.8 (A) 151.0 1.029 11.074 0.815 0.093 0.32(0.497) (19.99) (22.3) (21.9) (0.405) (4.360) 0.3.03
AS51-8 1.205 50.80 I 168.9 16.9 0.953 10.668 0.753 0.189 037 3.4(0.4g9) (20.00) (24.5) (24.5) (0.375)
(A) LOADED TWICE
E: NO STRAIN GAGE TO DETECT DIMPLING
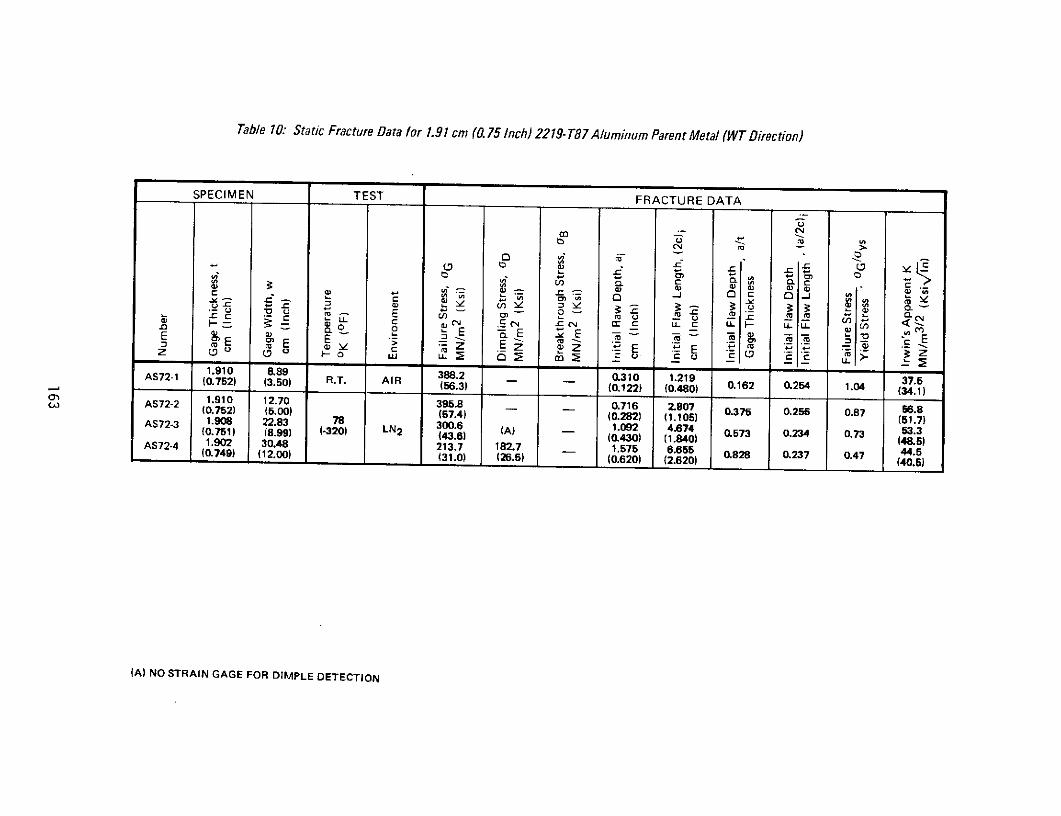
Table 10: Static Fracture Data for 1.91 cm (0.75 Inch) 2219- T87 Aluminum Parent Metal (WT Direction)
SPECIMEN TEST FRACTURE DATA
>
1 .. L..-
CLJ
Y r ,. ,-, ,"Q1 .1 .,r 0 Y
CC
WN cv
_E -S CN CCN rz N Cr LL aLL LL LO
4-- -a - ,
- , - - u _ ,- - 4- _ u
G) 4) 0) 0) :_ w -
Ez E -) E 7m ,Q :2 -c E ..-2 - M -.-
.. .... ,
E cE zE zE E M c:3 Q ME Q a cv _ -DM>.
1.910 8.89 388.2 0.310 1.219 37.5AS72-1 (0.752) (3.50) R.T. AIR (56.3) (0.122) (0.480) 0.162 0.254 1.04 (34.1)S 1.910 12.70 395.8 0.716 807.256 0.87 56.8AS72-2 (0.752) (5.00) (57.4) (0.282) (1.105) 0.87 (51.7)AS72-3 1.908 22.83 78 ( - 0 .51.7)(0.751) (8.99) (-320) LN2 300.6 (A) 1.092 4.674 0.573 .3 .753.3S_(43.6) (0.430) (1.840) (48.5)AS72-4 1.902 30.48 213.7 182.7 __ 1.575 6.655 44.5(0.749) (12.00) (31.0) (26.5) (0.620) (2.620) 08 027 0.47 (40.5)
(A) NO STRAIN GAGE FOR DIMAPLE DETECTION
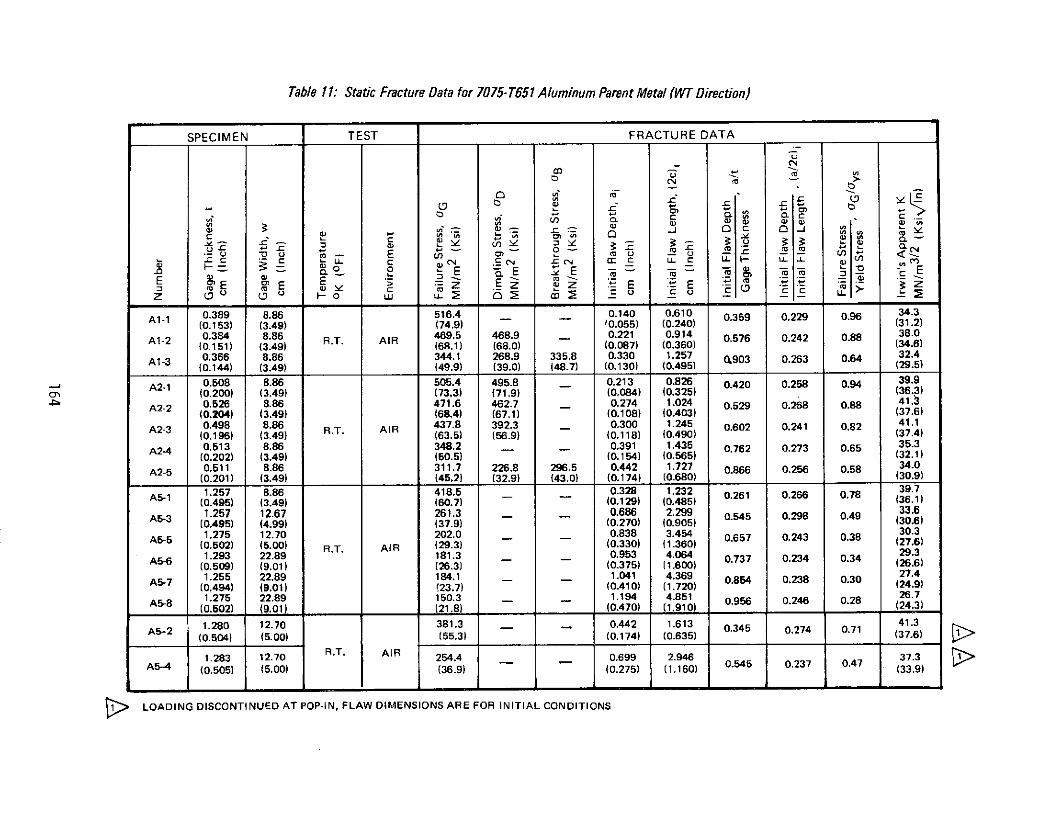
Table 11: Static Fracture Data for 7075- T651 Aluminum Parent Metal (WT Direction)
SPECIMEN TEST FRACTURE DATA
C14 >
A 0 .10- 0.. 0.
0 3 440 0) 3 L- C
4-0-1 c3.c 6880• - " c .0) 41) -0 _ 4 *9 <0 E 'a E _)e E _-2 _4 -0 3Sa - M -- -
E m E > Z . Z E - E E 4- M a,U Q C- U. Ca C CC L
Z (D (.o 0 y ,- 2 2 00 .
A1-1 0.389 8.86 516.4 _ 0.140 0.610 0.359 0.229 0.96 34.3(0.153) (3.49) (74.9) (0.055) (0.240) (31.2)
A1-2 0.384 8.86 R.T. AIR 469.5 468.9 - 0.221 0.914 0.576 0.242 0.88 38.0(0.151) (3.49) (68.1) (68.0) (0.087) (0.360) (34.6)
A1-3 0.366 8.86 344.1 268.9 335.8 0.330 1.257 0.903 0.263 0.64 32.4(0.144) (3.49) _(49.9) (39.0) (48.7) (0.130) (0.495) (9.5)
A2-1 0.508 8.86 505.4 495.8 0.213 0.826 0.420 0.258 0.94 3.3(0.200) (3.49) (73.3) (0.084) (0.325) (36.3)
4 - A2-2 0.526 8.86 471.6 462.7 0.274 1.024 0.5296 0.268 0.88 41.3(0.204) (3.49) (68.4) (67.1) (0.108) (0.403) (37.6)
A2-3 0.498 8.86 RT AIR 437.8 392.3 0.300 1.245 0.602 0.241 0.82 41.1
(0.196) (3.49) (63.5) (56.9) (0.118) (0.490) (37.4)A2-4 0.513 8.86 348.2 _ 0.391 1.435 0.762 0.273 0.65 35.3(0.202) (3.49) (50.5) (0.154) (0.565) (32.1)
A2-5 0.511 8.86 311.7 226.8 296.5 0.442 1.727 0.866 0.256 0.58 30.0(0.201) (3.49) (45.2) (32.9) (43.0) (0.174) (0.680) (37.6)
1.257 8.86 418.5 0.328 1.232 0.261 0.266 0.78 39.7A5 (0.495) (3.49) (60.7) - (0.129) (0.485) (36.1)
1.257 12.67 261.3 0.686 2.299 0.545 0.298 0.49 33.6A5-3 (0.495) (4.99) (37.9) (0.270) (0.905) (30.6)
A- 1.275 12.70 202.0 0.838 3.454 0.6. 0.24 0.8 36.(0.502) (5.00) R.T. AIR (29.3) (0.330) (1.360) (27.6)
1.293 22.89 181.3 - 0.953442 1.064 0.737 0.234 0.34 29.3(0.509) (9.01) (26.3) (0.375) (1.600) (26.6)1.255 22.89 184.1 1.041 4.369 0.854 0.238 0.30 27.4
A5-7 (0.494) (9.01) (23.7) (0.410) (1.720) (32.9)A- 1.275 22.89 150.3 1.194 4.851 0.956 0.246 0.28 26.7A - (0.502) (9.01) 1 _ _ (21.8) (0.470) (1.910) (24.3)
A5-2 1.280 12.70 381.3 0.442 1.613 0.345 0.274 0.71 41.3(0.504) (5.00) (55.3) (0.174) (0.635) (37.6)
1.283 12.70 R.T. AIR 254.4 0.699 2.946 0.37.3A5-4 (0.505) (5.00) (36.9) (0.275) (1.160) 0.545 0.237 0.33.9)
SLOADING DISCONTINUED AT POP-IN, FLAW DIMENSIONS ARE FOR INITIAL CONDITIONS
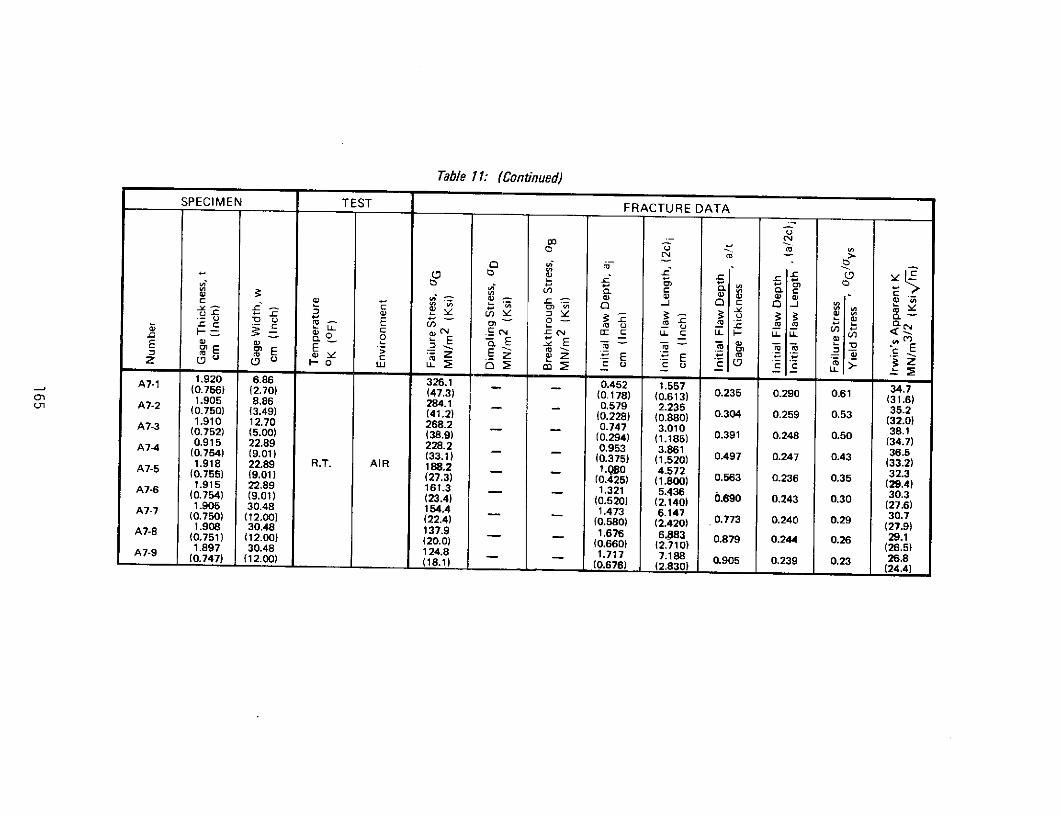
Table 11: (Continued)
SPECIMEN TEST FRACTURE DATA
c.)
mvC.)
0 ..- -,,
"U = ° E -- -- -c ,,.- 4- ._ ~- -
0
19 63) 0.45 .5 38.1eA (2.70 (73 ()-o0.) 0.6) a 0.3 6)
A72 .750 .49) (4.) 022) 080) 0.04 25 0.3 320
C.S LL E a' CN C2 r cc c -L c -L U_ LL . <C U- u 0 0 m
w C _ E ;E E w - -E m I= E M n - n Em
cm ;, = CUc z E *E ' D -')U U Ho W- LL 0~ - --- - -- L L - m C C . c U LA7-1 1.920 6.86 326.1 0.452 1.557 34.7A7- (0.756) (2.70) (47.3) (0.178) (0.613) 0.235 0.290 0.61 (3.)1.905 8.86 284.1 0.579 2.235 35.2A7-2 (0.750) (3.49) (41.2) (0.228) (0.880) 0.304 0.259 0.53 (3.2A7-3 1.910 12.70 268.2 0.7 .0 32.1(075) (50) 3.9 0.747 3.010 3.(0.752) (.0) (28.9) (0.294) (1.185) 0.391 0.248 0.50 (3.)A7-4 .915 22.89 2.2 .3 3.861 36.5A7 (0.754) (9.01) (33.1) (0.375) (1.520) 0.497 0.24 0.43 (33.2)1.918 22.89 R.T. AIR 188.2 (1.375 (.527 36.5(075) (90) 2.3 1.080 4.572 3.A7- (0.75) (.0) (27.3) (0.425) (1.800) 0.563 0.236 0.35 (2.)1.915 22.89 161.3 1.1 463
1.908 30.48 137.9 - 1.676 6.88 0.879 0.244 0.26 29.1A7- (0.751) (12.00) (20.0) (0.660) (2.710) (26.5)A7-9 1.897 30.48 124.8 1.717 7.188 26.8(0.747) (12.00) (18.1) (0.676) (2.830) (2.5 )A7- 1.97 0.8 14.81.7 7 2.8 0.0(.3.3 2.8)
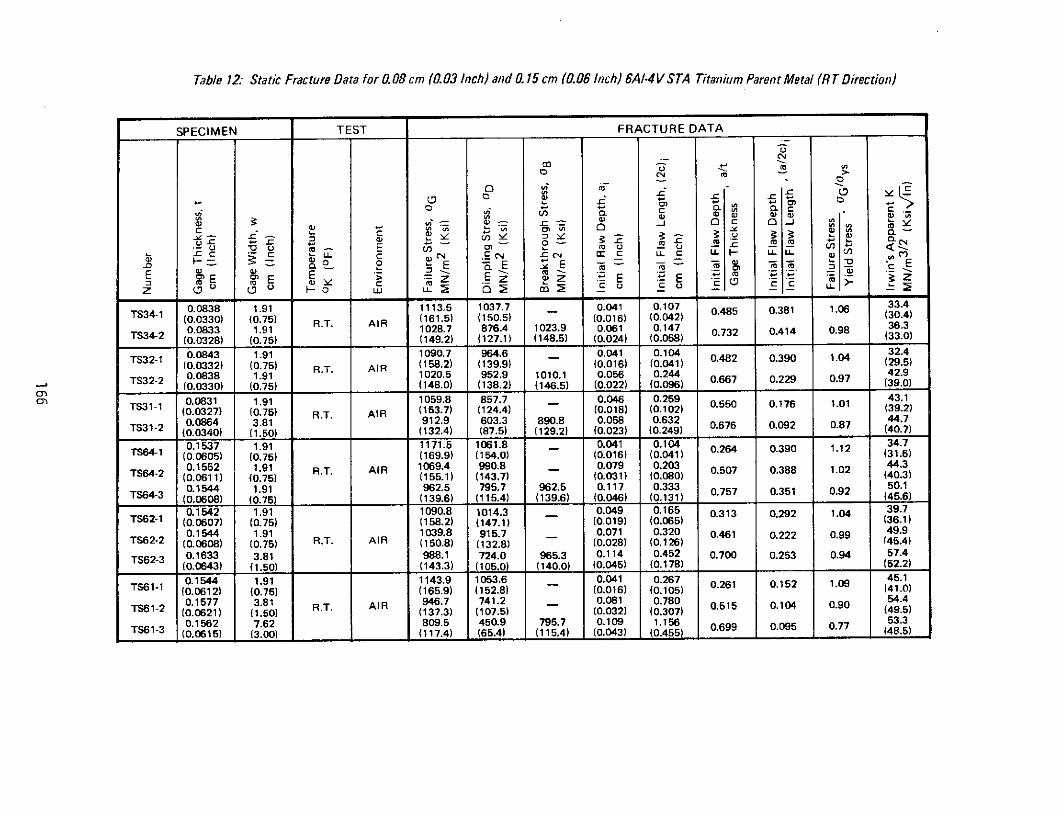
Table 12: Static Fracture Data for 0.08 cm (0.03 Inch) and 0. 15 cm (0.06 Inch) 6A-4VSTA Titanium Parent Metal (RT Direction)
SPECIMEN TEST FRACTURE DATA
n -
V) C
08 3 C 9 067 0 0.87M L C
E -, E > Z Z z-. c z E E 0Z (0 03 0. 5 0) (-2o4u C ) 1 9 ,-s U C U _ I4 0 .7)
0.0838 1.91 1113.5 1037.7 0.041 0.107 0.4 0.3 1. 33.4(0.0330) (0.75) R.T. AIR (161.5) (150.5) (0.016) (0.042) (30.4)
0.0833 1.91 1028.7 876.4 1023.9 0.061 0.147 0.732 0.414 0.98 36.3TS4-2 (0.0328) (0.75) (149.2) (127.1) (148.5) (0.024) (0.058) (33.0)
TS32-1 0.0843 1.91 1090.7 964.6 0.041 0.10 4 32.4(0.0332) (0.75) R.T. AIR (158.2) (139.9) (0.016) (0.041) 0.48(29.5)
TS32-2 0.0838 1.91 1020.5 952.9 1010.1 0.056 0.244 42.9(0.0330) (0.75) (148.0) (138.2) (146.5) (0.022) (0.096) (39.0)
0.0831 1.91 1059.8 857.7 0.046 0.259 0. 0.1 1.0.1TS31-1 (0.0327) (0.75) R.T. AIR (153.7) (124.4) (0.018) (0.102) (39.2)
0.0864 3.81 912.9 603.3 890.8 0.058 0.632 0. 0. 0.44.7TS61-2 (0.0340) (1.50) (132.4) (87.5) (129.2) (0.023) (0.249) (49.7)
0.1537 1.91 1171.5 1061.8 - 0.041 0.104 34.7TS64-1 (0.0305) (0.75) (169.9) (154.0) (0.016) (0.041) 0. 0. 1.1 (31.6)
0.1552 1.91 1069.4 990.8 8 0.079 0.203 44.3
TS64-2 (0.0611) (0.75) (155.1) (143.7) (0.031) (0.080) 0.507 0.388 1.02 (40.3)0.1544 1.91 962.5 795.7 962.5 0.117 0.333 0.757 0.351 0.92 50.1
TS64-3 (0.0608) (0.75) (139.6) (115.4) (139.6) (0.046) (0.131) (45.6)
0.1542 1.91 1090.8 1014.3 0.049 0.165 0.313 0.292 1.04 39.7TS62-1 (0.0607) (0.75) (158.2) (147.1) (0.019) (0.065) (36.1)
0.1544 1.91 1039.8 915.7 0.071 0.320 0.461 0.222 099 49.9TS62-2 (0.0608) (0.75) R.T. AIR (150.8) (132.8) (0.028) (0.126) (45.4)
TS62-3 0.1633 3.81 988.1 724.0 965.3 0.114 0.452 0.700 0.253 0.94 57.4(0.0643) (1.50) (143.3) (105.0) (140.0) (0.045) (0.178) (52.2)
0.1544 1.91 1143.9 1053.6 0.041 0.267 0.261 0.152 1.09 45.1TS61-1 (0.0612) (0.75) (165.9) (152.8) (0.016) (0.105) (41.0)
0.1577 3.81 946.7 741.2 - 0.081 0.780 54.4TS61-2 (0.0621) (1.50) R.T. AIR (137.3) (107.5) (0.032) (0.307) 0.515 0.104 0.90
0.1562 7.62 809.5 450.9 795.7 0.109 1.156 0.699 0.095 0.77 53.3TS61-3 (0.0615) (3.00) (117.4) (65.4) (115.4) (0.043) (0.455) (48.5)

Table 13: Static Fracture Data for 0.31 cm (0. 12 Inch) 6A1-4V STA Titanium Parent Metal (RT Direction)
SPECIMEN TEST FRACTURE DATA
U
U0 C.L8 0 0v -- ,_
-- - -- U- ,-1 0.3 1 1 3 . 0.1 0.
TS14-1 0.307 1.91 52..3 9.0 0.117 0.146(150.0) (137.2) " 0.106 0.29 0421 042 098
(0.121) (0.75) 31.2) 9.6 (0.061) (0.163) 0.504 0.374 0.93 (51.8)TS14-3 0.300 3781 (14.2 (42)6 0.155 0.414
S RT AIR ) (0.067) (0.187) 0. 0. 0. (54.3
TS14-4 0.307 1.91 1034.3 946.0 0.130 0.297 52.3
(0.126) (1.50) (150.2) (137.2) (0.085) (0.11237) 0.675 0.359 0.88 .TS14-5 0.310 3.81 973.6 973.6 0.155 0.441 61.7
(0.122) (1.50) (11.1) (141.6) 0.096) (0.268) 0.50787 0.3574 0.9380 (56.1)
(0.1) (1.50) 1045.3 1011.5 0.114 0.457 1.
(0.158) (1.50) (151.6) (12846.7) (0.06745) (0.180) 0.369 0.250 1.00 (5.)TS1- 03 3.81 932.2 731.6 - 0.216 0.601 0 0 08 65.7(0.120) (1.50) R.T. (135.) (16.1) (0.065) (0.270) 0.5 0. (59.8)(0.310 (.08 839.1 63815.7 833.6 0.24408 0.889 61.7(0.122) (1.50) (121.7) (118.3) (120.9) (0.0962) (0.26350) 0.78695 0.2348 0.80 (56.1)TS12-5 0.300 5.08 751045.7 637.8 715.0 0.2414 1.041 6.4(0.118) (2.00) (15109.6) (14692.5) (103.7) (0.095) (0.410) 0.805 0.232 0.72 (5.)TS11 0.318 5.8 1007.4 968.1 0.117 1.156 71.0(0.125) (2.00) (146.) (1940.4) (0.05946) (0.455) 0.368 0.101 0.96 (64.6)TS112-3 0.305 3.81 934.3 875.0 0.165 .686 66.9(0.120) (1.50) (135.5) (126.9) (0.065) (0.27650) 0.542 0.100 0.79 (60.9)TS 1-3 0.30 0 9.1 815.7 833.6 0.208 0.889 65.9(0.1218) (4.00) (121.7) (118.) (120.9) (0.0 82) (0.350) (6.)755.0.080) (0.720)637.8 715.0 024.635 0.111 0.69 63.
TS1 1-1 0.318 01012.2 895.0 0.117 1.156 71.0
(0.125) (.00) (1492.8) (12967.4) (0.04687) (0.45890) 0.696 0.098 0.61 (53.0)
TS11-5 0.318 1270 673.6 426.1 0.257 2.565 66.2(0.125) (5.00) (97.7) (61.8) (0.101) (1.010) 0.808 0.100 0.64 (60.2)

Table 14: Static Fracture Data for 0.53 cm (0.21 Inch) 6AI-4V STA Titanium Parent Metal (RT Direction)
SPECIMEN TEST FRACTURE DATA
- , '
E,- .7a .- 0 C
S- . .2 M- . .
TS24-1 0.541 5.08 1003.9 982.5 - 0.170 0.417 0.315 0.409 0.96 59.3(0.213) (2.00) (145.6) (142.5) (0.067) (0.164) (54.0)
TS24-2 0.541 5.08 981.8 955.6 - 0.206 0.549 0.380 0.376 0.93 66.2(0.213) (2.00) (142.4) (138.6) (0.081) (0.216) (60.2)
TS24-3 0.541 5.08 952.2 908.1 - 0.246 0.587 0.455 0.420 0.91 66.5(0.213) (2.00) (138.1) (131.7) (0.097) (0.231) (60.5)
TS24-4 0.546 5.08 857.7 839.8 - 0.300 0.787 0.549 0.381 082 68.5(0.215) (2.00) (124.4) (121.8) (0.118) (0.310) (62.3)
TS24-5 0.533 5.08 R.T. AIR 813.6 753.6 - 0.318 0.947 0.595 0.335 0.77 70.1(0.210) (2.00) (118.0) (109.3) (0.125) (0.373) (63.8)TS24-6 0.533 7.62 744.6 676.4 0.396 1.085 0O743 0.365 0.71 68.
(0.210) (3.00) (108.0 (98.1) (0.156) (0.427) (626)TS24-7 0.533 7.62 647.4 566.8 0.417 1.151 0.781 0.362 0.62 61.1
(0.210) (3.00) (93.9) (822) (0.164) (0.453) (55.6)TS24-8 0.533 7.62 730.9 484.0 712.9 0.447 1.227 0.838 0.364 0.70 71.8
(0.210) (3.00) (106.0) (70.2) (103.4) (0.176) (0.483) (653)
TS22-1 0.536 5.08 1040.5 1027.4 - 0.160 0.622 0.299 0.257 0.99 71.8(0.211) (2.00) (150.9) (149.0) (0.063) (0.245) (65.3)TS22-2 0.541 5.08 952.9 926.7 0.203 0.851 0.376 0.239 0.91 74.7
(0.213) (2.00) (138.2) (134.4) (0.080) (0.335) (68.0)TS22-3 0.546 5.08 880.5 840.5 - 0.249 1.029 0.456 0.242 0.84 764
(0.215) (2.00) (127.7) (121.9) (0.098) (0.405) (68.6)TS22-4 0.536 7.62 644.0 - 0.325 1.295 0.607 0.251 0.61 60.8
(0.211) (3.00) (93.4) (0.128) (0.510) (5563)TS22-5 0.536 7.62 AI 586.8 - 0.366 1.473 0.682 0.248 0.56 586
(0.211) (3.00) (85.1) (0.144) (0.580) (53.3)TS22-6 0.536 7.62 668.1 479.2 663.3 0.406 1.740 0.758 0.234 0.64 72.0
(0.211) (3.00) (96.9) (69.5) (96.2) (0.160) (0.685) (65.5)TS22-7 0.544 10.16 508.9 492.3 0.427 1.842 0.785 0.232 0.48 55.6
(0.214) (4.00) (73.8) (71.4) (0.168) (0.725) (50.2)TS22-8 0.544 10.16 529.6 431.6 [ 0.442 1.880 0.813 0.235 0.50 58.7
(0.214) (4.00) (76.8) (62.6) (0.174) (0.740) (53.4)
:> POSSIBLE BREAKTHROUGH AT 529.6 MN/m 2 (76.8 KSI)
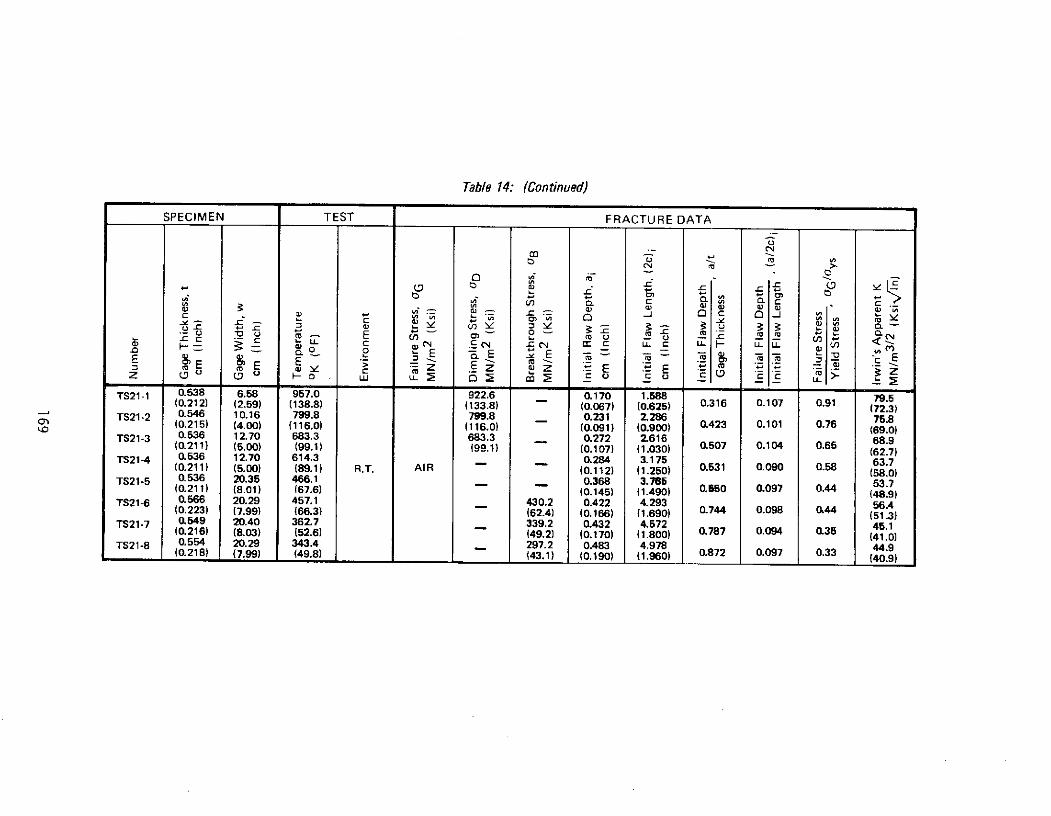
Table 14: (Continued)
SPECIMEN TEST FRACTURE DATA
T1 .
(4 0- 0.4 3 C
SO 0. -o, W a) cz ' Qr Q) O
a. : 3-.>-- C .- N -C -, r- - U. - U. " Y 4 N.__ v U N ,
z , ' N E z -E E >. < zZ_ LL
TS21-1 0.538 6.58 957.0 922.6 0.170 1.588 79.5(0.212) (2.59) (138.8) (133.8) (0.067) (0.625) 0.316 0.107 0.91 (72.3)
TS21-2 0.546 10.16 799.8 799.8 0.231 2.286 75.8(0.215) (4.00) (116.0) (116.0) (0.091) (0.900) 0.423 0.101 0.76 .
TS21-3 0.536 12.70 683.3 683.3 - 0.272 2.616 68.9(0.211) (5.00) (99.1) (99.1) (0.107) (1.030) 0.507 0.104 0.65 (6.)
TS21-4 0.536 12.70 614.3 0.284 3.175 63.7(0.211) (5.00) (89.1) R.T. AIR - 0.112) (1.250) 0.531 0.090 0.58 (58.0)
TS21-5 0.536 20.35 466.1 ( 0.368 3.785 53.7(0.211) (8.01) (67.6) (0.145) (1.490) 0.650 0.097 0.44 (48.9)
TS21-6 0.566 20.29 457.1 430.2 0.422 4.293 56.4(0.223) (7.99) (66.3) (62.4) (0.166) (1.690) 0.744 0.098 0,44 (51.3)
TS21-7 0.549 20.40 362.7 339.2 0.432 4.572 45.1(0.216) (8.03) (52.6) (49.2) (0.170) (1.800) 0.787 0.094 0.35 (41.0)TS21-8 0.554 20.29 343.4 - 297.2 0.483 4.978 44.9(0.218) (7.99) (49.8) (43.1) (0.190) (1.960) 0.872 0.097 0.33 (40.9)
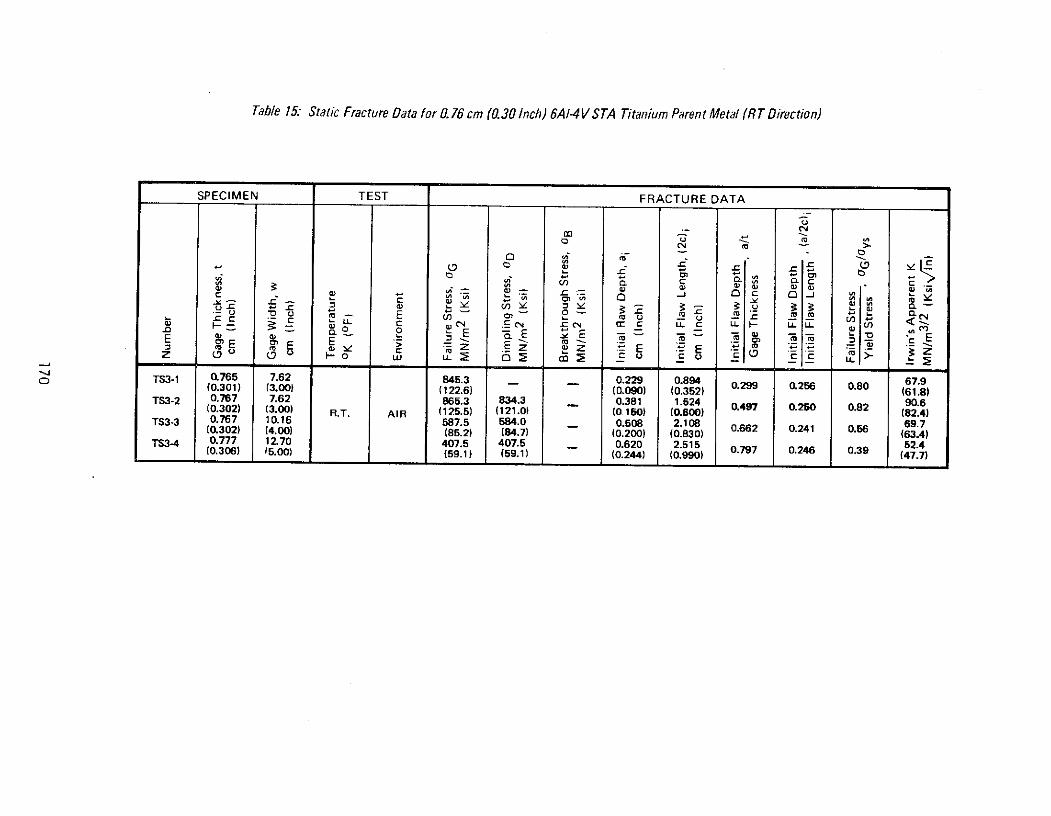
Table 15: Static Fracture Data for .76cm (0.30 Inch) 6AI-4VSTA Titanium Parent Metal (RT Direction)
SPECIMEN TEST FRACTURE DATA
C.
.In oo " E- - - ,_ ._-
Y CO >
T720C3 , . -r -3
r n c cn CW (w CU (CD C W v
M- rC. o,
E c E aE o _I W
(0.301) (3.00) (122.6) (0.090) (0.362) 0.9 0.256 0.80 (61.8)TS3-2 0.767 7.62 865.3 834.3 __ 0.381 1.524 0.9 .5 .2 90.6(0.302) (3.00) R.T. AIR (125.5) (121.0) (0,150) (0.600) 0.9 .~ .2 (82.4)TS3-3 0.767 10.16 587.5 584.0 __ 0.508 2.108 69.7(0.302) (4.00) (85.2) (84.7) (0.200) (0.830) 0.662 0.241 0.56 (63.4)TS3-4 0.777 12.70 407.5 407.5 __ 0.620 2.515 52.4(0.306) 15.00) (59.1) (59.1) (0,244) (0.990) 0.797 0.248 0.39 (77
C C O r ~C 3:
of N C N Er C C E C14(D 0 0 w MowLLr ~ r r tO oL
0 T3.0 - E 7a E E E29 0.94 7.
z (D 0 F- 0 L.U LL7. 5 C LL -.18 9.C)0.765 7.62 845.3 0.229 0.894 67.941 0.5(0.31) (.00 (12.6)(0.090) (0.352) (61.8)
TS3-4 0 ,777 12.70 407.5 407.5 - 0.620 2.515 0.9 .4 .9 52.4(0.306) (5.00) (59.1) (59.1) (0.244) (0.990)9 (47.7)

Table 16: 2219-T87 Aluminum Cyclic Flaw Growth Data at 780K (-3200F),; t = 1.27cm (0.50 Inch),oo = 0.67 oy, and (a/2c)i 0.37
W UI Uj YW cc 2 REMARKSz W -0 - 1 E z CL cr Z
U 0 3:= z E H
0.338 0.894 25.4 25.81 302.0 (0.133) 0.38 0.26 LN (23.1) (23.5) TEST TERMINATED IMMED.
OA54-1 (0.504) (5.00 (43.8) 1.016 3.429 2 48.1 60.7 PRIOR TO FAILURE AT(0.504) (5.00) (0400) (1 0.30 0.79(43.8) (55.2) 4960 CYCLES; SPECIMEN
267.5 1.016 3.429 42.9 54.0 THEN FAILED AT R.T.(38.8) (0.400) (1 0.3 0.79 AIR49.1)
0.356 0.902 0.39 0.2825.5 2.(0.140) (0355 0.28 (23.2) (23.7) FLAW SIZE AFTER 766 CYCLES
0.406 0.998 0.41 0.32 26.9 27.4302.0 (0.160) ) 0.32 (24.5) (24.9) SPECIMEN OVERLOAD ON 767TH
A54-2 1.270 12.70 (43.8) 0.422 1.130 0.37 0.33 CYCLE; FLAW SIZE AT 768TH(0.500) (5.00) (0.166) (0445) 2 (25.9) (26.6) CYCLE. SPECIMEN CYCLED FOR51 1.524 03633.0 34.2 2236 CYCLES AND THEN OVER-
(0.217) (0.600) 0.43 30.0) (31.1) LOADED TO FAILURE ON 2237TH0.51 1.524 0.36 0.43 - - CYCLE(0.217) (0.600) 0_36 0.4 _ _ __0.312 0.914 0.34 0.25 25.4 25.9
302.0 (0.123) (0.360) 0.25 (23.1) (23.6) TEST TERMINATED IMMEDIATELYOA54-5 (0.500) (5.00) (43.8) .3 0.34 0.90 2 PRIOR TO FAILURE AT 4640 CYCLES;(0500) (5.00) (0.450) (1.320) (44.2) SPECIMEN THEN FAILED AT R.T.257.2 T.T43 3.353 41.4
(37.3) (0.350) I(120) 0.34 0.90 AIR (37.7)0.315 .84 0.35 0.25 25.2 25.6(2. 1 24) (0.352) 0.35 0.25
0.3(22.9) (23.3) FLAW SIZE AFTER 3758 CYCLES0.59 15 039 0.33.2 34.2302.0 (0,236) (0.600) 09 0.47
1.270 12.70 (4302.0 (0.23610 1.524 (30.2) 31.1) FLAW SIZE AFTER MARKING.A54-6 (5.00) (43.8 (24 (6 0.40 0.48 SPECIMEN TEST TERMINATED
1.118 3.759 50.4 IMMED. PRIOR TO FAILURE AT(0.440) 1.48 0.30 0.88(45.9) - 4803 CYCLES; SPECIMEN THEN1.118 ( FAILED AT R.T.
(0.440) 1.480 0.30 0.88 AIR -
:> INITIAL CYCLIC CONDITIONS4 TERMINATION OF CYCLIC TEST
SFAILURE
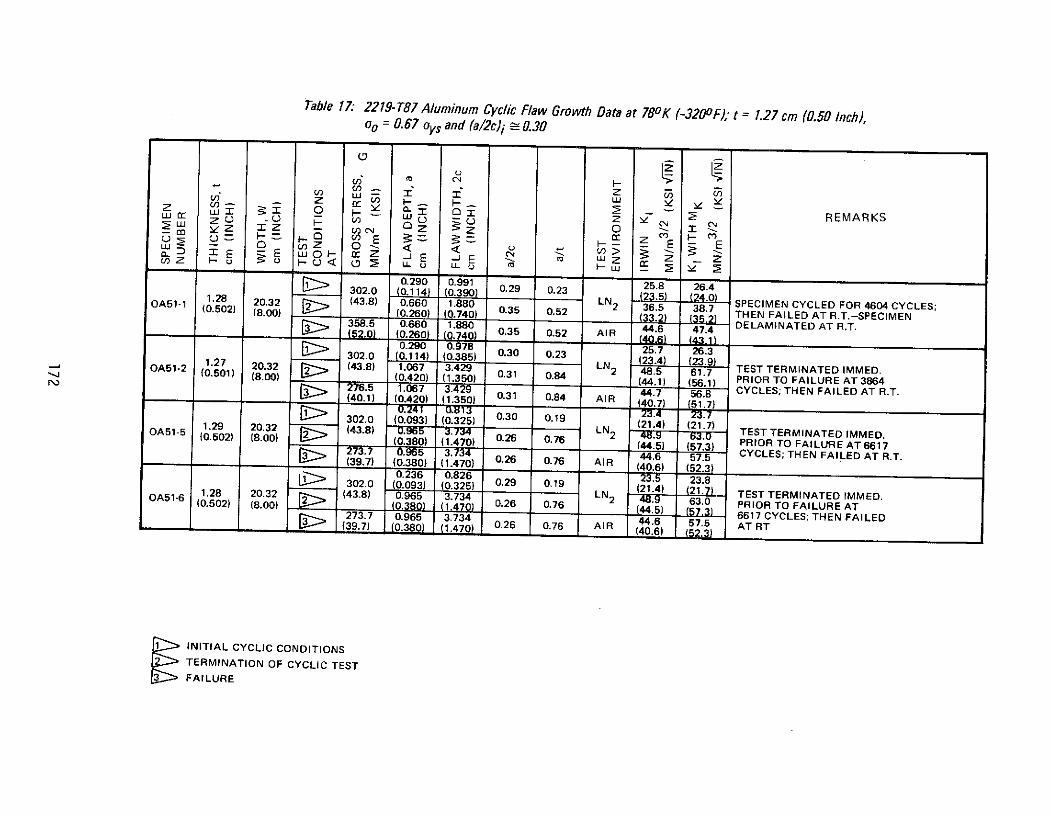
Table 17 2219-T87 Aluminum Cyclic Flaw Growth Data at 780 K (-3200F), t = 1.27 cm (0.50 Inch),oo = 0.67 oys and (a/2c)i - 0.30
- n o YI w,0 -r-u Z REMARKS
mz -- -1 z o I3 c( 0) ( u 2 .oU L = -- = ( E 3 :. E E3u z 5 z AI Z
0.290 0.991 25.8 26.4302.0 (0.114) (0.390) 0.29 0.23 2. 2.2 (8.00) (0.260) (1.0) LN 365 38.7 SPECIMEN CYCLED FOR 4604 CYCLES;S(0.502 (8.00) ( 7 (.4 03.2) (35.2) THEN FAILED AT R.T.-SPECIMEN
358.5 0.660 1.880 44.6 47.4 DELAMINATED AT R.T.(5.0) (0.260) (0.7401 0.35 0.52 AIR .6 (43.1)
0.290 0.978 25.7 26.3S 302.0 (0.114) (0.385) 0.30 0.23 23.1.27 0 2 (43.8) 1.067 3429 LN (23.4) (23.9OA51-2 (0.501) (8.00) (43. (0.420) (1.350) 0.31 0.4 2 48.5 617 TEST TERMINATED IMMED.(0.0) 0.84(44.1) (56.1) PRIOR TO FAILURE AT 3864276.5 1.067 3.429 44.7 56 8 CYCLES; THEN FAILED AT R.T.(40.1) (0.420) (1.350) 0.31 0.84 AIR (40.7) (51.7)
302.0 (0.093) (0.325) 0.30 0.1920.32 LN (21.4) (21.7)OA51- 1.2 20.32 (.2(43.8) LN 2 4 (21.7) TEST TERMINATED IMMED.
.2(0.380) (1.470) 0.26 0.76 2 4. . PRIOR TO FAILURE AT 6617(44.5) (57.3)
273.7 .965 3.734 44.6 575 CYCLES; THEN FAILED AT R.T.(39.7) (0.380) (1.470) 0.26 0.76 AIR (40.6) (52.3)0.236 0.826 23.8302.0 (0.093) (0.325) 0.29 0.19 23.87)
1.28 20.32 (43.8) 0.965 LN 2 4 . TEST TERMINATED IMMED.OA51-6 (0.502) (8.00) 0.26 0.76 63.0 PRIOR TO FAILURE AT380) (1.470) 0.26 0.76 (44.5) (57.3) 6617 CYCLES; THEN FAILED273.7 0.965 3.734 44.6 57.5 AT RTL- (39.7) (0.380) (1.470) 0.26 0.76 AIR (40.6) ___15.3) A I
1 INITIAL CYCLIC CONDITIONS
TERMINATION OF CYCLIC TESTFAILURE

Table 18: 2219- T87 Aluminum Cyclic Flaw Growth Data at 780K (-3200F); t = 1.27 cm (0.50 Inch),oo = 0.91 oys and (a/2c)i -0.41
(3 CN
S_ _ O I: - 2 REMARKS
0.335 0.787 33.4 33.70 D Z 0 Z
.132) (0.310) 0.43 0.27 0.(30.4) (30.7)
1.27 11.46 412.3 0.) (1003 0.4237.7 38.2 SPECIMEN DIMPLED AFTERCA54-1 (0.499) (4.51) 59.8) 0432 1016 LN2 421 CYCLES AND FAILED ON
(0.170) (0.400) 0.43 0.34 (34.5) (35.0) 735TH CYCLE IN LN 2(0.400) (34.5) (35.0)0.754 1956 0.39 0.60 52.4 55.6
(0.297) (0.770) (47.7) (50.6)0.333 0.787 33.4 33.7
(0.131) (0.310) 0.42 0.26(30.4) (30.7)412.3 (0.166) (0.927 0.46 0.3336.3 36.6 SPECIMEN DIMPLED AFTER 380
1.28 1146 412.3 (0.166) (0.365) (33.0) (33.3) CYCLES AND TEST TERMINATEDCA54-2 (0.504) (4.51) (59.8) 0.429 0.940 36.5 36.8 IMMED. PRIOR TO FAILURE AT(0.169) (0.370) 0.46 0.34 LN 2 (33.2) (33.5) 834 CYCLES; SPECIMEN THEN
(0.300) (0.800) 0.38 0.60 5) (5:9) FAILED IN LN 2(48.5) (51.9)
412.3 0.762 2.023 53.3 57.0(59.8) (0.300) (0.800) 0.38 0.60 (48.5) (51.9)
0.411 1.059 38.6 39.5(0.162) (0.417) (35.1) (35.9)0.521 1.346 0.343.5 44.5
1.28 11.43 412.3 (0.205) (0.530) 9 0.41 39.6) (40.5) SPECIMEN DIMPLED AFTER 220CA54-3 (0.504) (4.50) (59.8) 0.528 1.359 43.7 44.7 CYCLES AND TEST TERMINATED
(0.208) (0.535) 0.39 0.41 LN2 (39.8) (40.7) IMMED. PRIOR TO FAILURE AT0.673 1.901 51.4 54.6 251 CYCLES; SPECIMEN THEN(0.265) (0.750) 0.35 0.53 (46.8) (49.7 FAILED IN LN2413.7 0.673 1.905 51.5 54.8
(60.0) (065) (0.750) 0.35 0.53(469 (490.422 1.067 38.8 39.6
(0.166) (0420 0.40 0.33(36.0)0.518 1.422 44.5 45.9
412.3 (0.2) (.0) 0.36 0.41 SPECIMEN DIMPLED AFTER 150CA54-4 1.27 11.43 (59.8) 0.528 1.448 44.9 CYCLES AND TEST TERMINATED
(0.501) (4.50)0.208) (0.570) 0:37 0.42 LN2 40.9) 4. IMMED. PRIOR TO FAILURE AT 1890.711 2.007 52.8 . CYCLES; SPECIMEN THEN FAILED0.711 2.0070.56 52.8 56.6 IN LN 2S(0.280) (0.790) 0.35 0.56 (48.0) 51.5 IN LN2399.2 0.711 2.007 50.9 54.6-_7.9) (0.280) (0.790) (4630.35 0.56 (4.7)
INITIAL CYCLIC CONDITIONS
2 DIMPLING OCCURRED
RE-START OF CYCLIC TEST AFTERDIMPLING AND MARKING
4 TERMINATION OF CYCLIC TEST
FAILURE
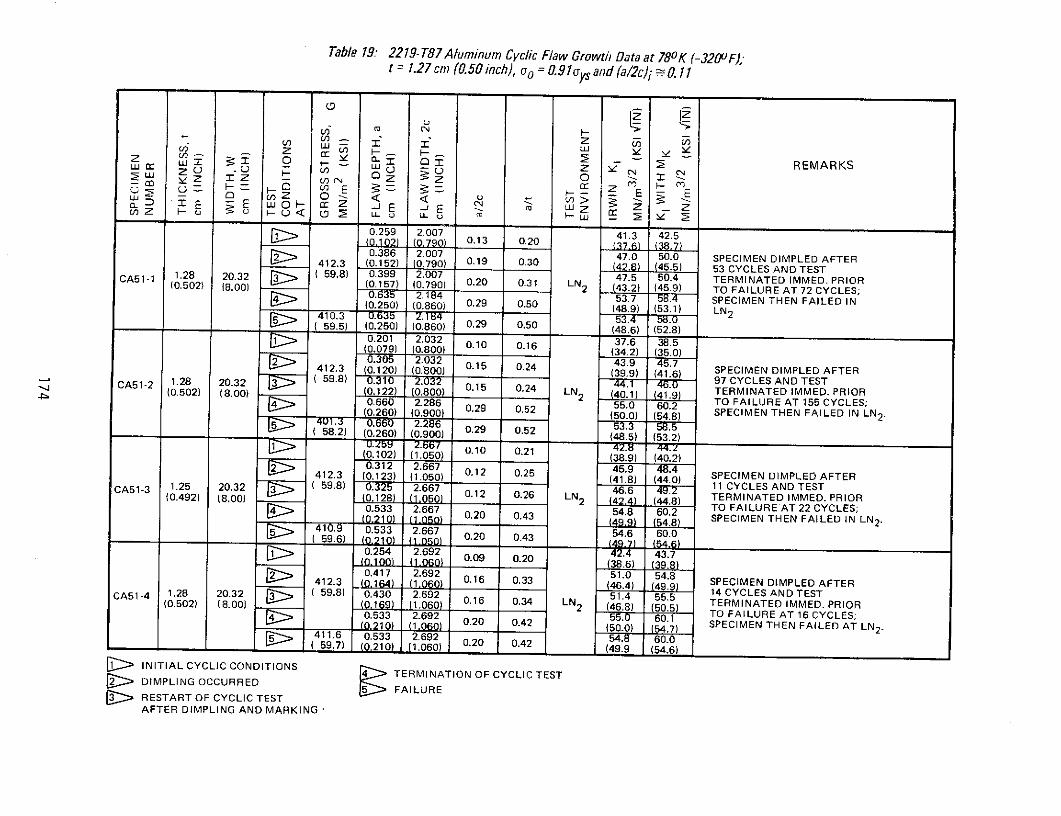
Table 19: 2219- T87 Aluminum Cyclic Flaw Growth Data at 780K (-3200F),t = 1.27 cm (0.50 inch), oo = 0.91ays and (a/2c)i . 11
) 0.2 9 . Z 413 0
(42.) (45.5) 53 CYCLES AND TEST410.3 0.63 2.14 53.4 5.0
0.201 2.032 37.6 38.5REMARKS
L o1 ~- -Z Q -E E -
34)Z 0 < <(35.0)>) x E E (jj U..cj E E LAJ
0.259 2.007 41.3 42.5(0,121 .79()) 0.13 0.20 8.412.3 0.386 2.007 47.0 50.0 SPECIMEN DIMPLED AFTER412.3 (0.152) 0.790) 0.19 030 4.1 46.5) 53 CYCLES AND TEST
CA5-1 1.28 20.32 59.8) 0.399 2.007 0.24 LN 2 47.5 50.4 TERMINATED IMMED. PRIOR(0.502) (8.00) (0.157) (0.790) 0.20 06031 LN (43.2) (45.9) TO FAILURE AT 72 CYCLES;(0.260) (0.900) 0.29 0.5(50.0) (54.8) SPECIMEN THEN FAILED IN(0.250) (0.860) 10.29 0.5 (48.9) (53.1) LN2> 410.3 0.6 2.6 53.4
59.5) (0.250) (0.860) 0.29 0.5 (48.6) (528)0.201 2.032 0.1037.6 38.5
(0.10279) (0.800) (34.2) (35.0)0.312 2.66732 4.9 48.4
412.3 (0.12) (1.050) 0.1 0.2(39.9) (41.6) SPECIMEN DIMPLED AFTERCA51-3 1.28 20.32 3 59.8) 0.325 2.667 46.6 49.2 197 CYCLES AND TESTCA (0.50492) (8.00) (0.122) (10.800) 0.15 0.24 LN2 (42.4) (44.8) TERMINATED IMMED. PRIOR
0.660 2.286 0.2 2 54.8 60.2 TO FAILURE AT 155 CYCLES;(0.260) (0.900) 0.2 0.43(50.0) (54.8) SPECIMEN THEN FAILED IN LN2.
41.3 0.633 2.28 54.6 . .0
58.2) (0.260) (0.900) 0.29 0.52 (48.5) (53.2)(l= -- b- (49.7) (54.6)
(0.102) (1.060) 0.10 0.21 (38.6) (39.8)2 0.312 2.667 5.0412.3 (0.134) (1.060) 0.12 0.253 (46.4) (49.9) SPECIMEN DIMPLED AFTER0. (1.050) (41.8) (44.0) SCI LED ATCA51-3 1.25 20.32 ( 59.8) 0.430 2.667 51.4 55.5 14 CYCLES AND TEST(0.492) (8.00) (0.12869) 1.060 0.1 0.34 LN 2 2.46.8) 50.5) TERMINATED IMMED. PRIOR
0.533 2.692 55.0 60.1 TO FAILURE AT 2216 CYCLES;(.210) (1060 0.20 0.42 (50.0) 4.8 SPECIMEN THEN FAILED IN LN 2 .
410. 0.533 2.667 54.6 60.0S1 59.6) (,210) (1.00) 0.20 0.43 (49.6 .6)0.254 2.692 43.7
0.09 0.20 38.6) 9.80.417 2.692 51.0 54.8
CA54INITIAL CYCLIC CONDITIONS 20.32CA51-4 1.28 20.32 59.8) 0.430 2.692 51.4 55.5 14 CYCLES AND TEST(0.502) (8.00) 1) (1.060) 0.16 0.34 LN2 (46.8) 50.5) TERMINATED IMMED. PRIOR
INITIAL CYCLIC CONDITIONS 4 TERMINATION OF CYCLIC TESTDIMPLING OCCURRED FAILURE
RESTART OF CYCLIC TEST
AFTER DIMPLING AND MARKING
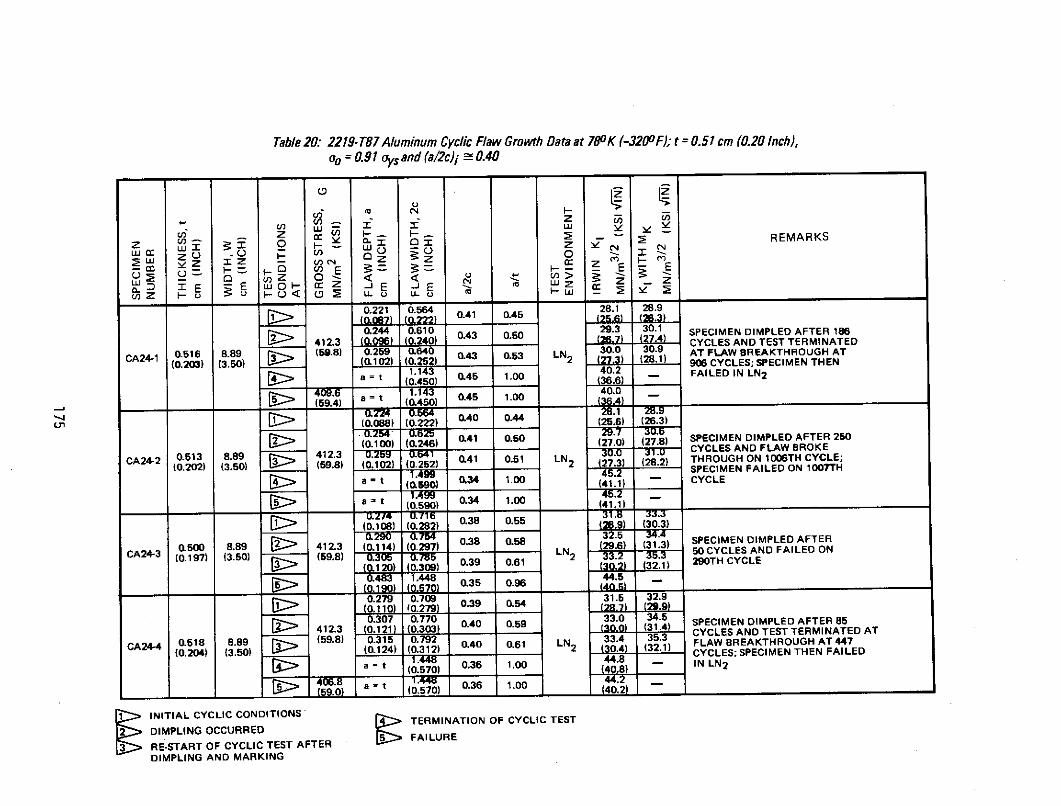
Table 20: 2219-T87Aluminum Cyclic Flaw Growth Data at 780K (-320 F); t = 0.51 cm (0.20 Inch),oo = 0.91 oys and (a/2c)i 2 0.40
Cm 1
W z r I I Z - 2 REMARKS
0.221 0.564 0.41 0.45 28.1 28.9
0.244 0.610 0.43 0.50 29.3 30.1 SPECIMEN DIMPLED AFTER 18604 412.3 ( 4096) (0.240) (26.7) (27.4) CYCLES AND TEST TERMINATED
z 41. 0 t; (0.2b0) _z N C
CA24-1 0.516 8.89 (59.8) 0.259 0.640 0.43 0.53 LN 30.0 30.9 AT FLAW BREAKTHROUGH AT0.203) (3.50) (0.102) (0.252) 0 .(27.3) 28.1) 906 CYCLES; SPECIMEN THEN
1.143 40.2 - FAILED IN LN 2
a 1.143 0.45 1.00 40.0
0.224 0.564 040 0.44 2.1 28.9(0.088) (0.222) (25 (2.3)
0.244 0.61) 0.41 0.50 (27.0) (27.8) SPECIMEN DIMPLED AFTER 250
412.3 (0.00) (0.240) (267) (2 CYCLES AND TEST TERMINATED
CA24-2 0.513 8.89 4 12 3 0.259 0.64W 30.0 3.9 AT FLAW BREAKTHROUGH AT
(0.20) (3.50) 59.8 (0.102) 0.252) 0.41 0.51 LN 2 (27.3 28.) THROUGH ON 100THSPECIME CYN THCLE;
a=t 1.4 45. SPECIMEN FAILED ON 100TH
a = t 0.590) 0.34 1.00 CYCLE
9.4) a t (0.590) 0.34 1.00 (41.1)
-T-9- - 0.64 0.38 0.55 . (3.3)(0.108) (0.282) 0.38 0.55 (28.9) (2630.3)
S038 0325 5 34.40.0 0. 0.4138 0.58 (29.6) (31.3) SPECIMEN DIMPLED AFTER0.5 8.89 412.3 0. 0.39 0.61 LN 2 50 CYCLE S AND FAILED ONKE
CA24-3 (0.20197) (3.50) (59.8) 0.0THROUGH ON 1006TH CYCLE;
012 0 059() (4 1.0 CYCLE
0.483 1.448 0.3 44.5
(a. ) (0.570) 0.35 0.9 (41.1)
0.279 0.709 31.5 32.9(0.110) (0.279) 0.3 0.5 (28.9) (30.93)S0.307 0.770 33.0 34. SPECIMEN DIMPLED AFTER
CA24412.3 (0.121) (0.303) 0.40 0.59 (.0) (31.4) 50 CYCLES AND FATEST TERMINATLED ON AT
CA24-4 0.518 8.89 (59.8) 0.315 0.792 33.4 35.3 FLAW BREAKTHROUGH AT 447(0.204) (3.50) (0.124) (0.312) 0.40 0.61 LN 2 0.4 (32.1) CYCLE N THEN FAILED
0.120) (32.1)
8 1448 44.5S= t'(0:570) 0.36 1.00 40.8) - IN LN 2
036 1..00 4.2 __11a = t 0.70 0.36 1.00 4 . 2
INITIAL CYCLIC CONDITIONS1.4) CYCLES AND TEST TERMINATION OF CYCLIC TEST
DIMPLING OCCURRED
ALURE0.40 0.61 LN 1) FLAWBREAKTHROUGHAT447
RE-START OF CYCLIC TEST AFTERDIMPLING AND MARKING

Table 21: 2219-T87 Aluminum Cyclic Flaw Growth Data at 780K (-3200F); t = 0.51 cm (0.20 Inch),oo = 0.91 oys and f(a/2c) i f 0.09
- t - I-r C REMARKS
0.0 0. 0 Z 08
(412.3 (0.050) (0.790) 0.09 0.25 SPECIMEN DIMPLED AFTER 131
CA21-5 10. ) (59.8) 0.330 .07 L 30.3 32.1 SPIMEN FAILD AREAT
(0 ) 64 024 0.77FAILED IN LN 2
S0.394 1.626
(0.155) (0.640) 0.24 0 .77
0.107 1.410 28. 29.2(0.042) (0.550) 0.08 0.21
( .127 10.397)(25.7) (26.6)
S412.3 (0.08) 0.50) 0.10 0.28 SPECIMEN DIMPLED AFTER 153
2.3 (0.050) 550) 0.09 0.25 (27.4) (28. CYCLES AND TEST TERMINATED
CA21-6 0.518 10.16 (59.8) 0.152 1.410 32.4 34.8 CIEN DIPED TER 131
(0.204) (4.00) (59.8) 0.11 0.29 LN2 32.1 IMMED. PRIOR TO FAILURE AT(0.201) (4.00) (0.051) (0.55) 0.09 0.25 LN (27.6) (29.2) 6O CYCLES; SPECIMEN THEN
0.330 1.524 42.3 52.3 FAILED IN LN2
(0.13055) (0.60) 0.2 0.7764 8.5 (47.6
(60.1) (0130) (0.55600) (0..7) (2.6)AFTER DIMPLING.1 1. 0.AND0 0.2 AND MARKING SPECIMEN DIMPLED AFTER 153
TERI2.A3 (N0.05) (0.55) _ (2) ( CYCLES AND TEST TERMINATED5 0.FAILURE0 0.2 LN IMED. PRIOR TO FAILURE AT0.201 (4.00) (0.29.5 (31.) 745CYCLES; SPECIMEN THEN0.33 1 40.22.3 . FAILED IN LN2(.155)8 (.64o) 0.28) (47.6)
14.4 0.330 1.524 42.5 52.6(013) (0.600) 0.22 0.64 (38.7) (47.9)
DIMPLING OCCURREDRE-START OF CYCLIC TEST
C1TERMINATION OF CYCLIC TEST .0..P O

Table 22: 2219- T87 Aluminum Cyclic Flaw Growth Data at 780K (-3200F); t = 0.38 cm (0.20 Inch),oo = 0.6 7 oys and f(a/2c)i 0.37
F-,
: am Ez o I 7r- 302.0 (z 6 0,34 0.56 21.1 22.9
Cn c; a- m REMARKS
SEZ E Ea.-3:E wO- CZ Eco WZ 2 zw Z H u < HO Q U.(DU Z> LL LL Hu -
0.216 0.635 0.34 0.56 21.1 22.9OA14-1 0.386 8.89 (43.8) 1016 LN (192 (20.8) FLAW BREAKTHROUGH AT 2490(A14-1 0.386 8.89 a = t 1.016 0.38 1.00 2 27.0 CYCLES, THEN PULLED TO350.3 1.016(24. FAILURE IN R. T. AIR(50.8) a
= t 0.400) 0.38 1.00 AIR (32.12
302. 0.254 0.635 0.67 21.4 23.0302.0 (0.100) (0.250) (19.5)OSA14-2 0.378 8.89 (43.8) 0.991 LN 26.7 FLAW BREAKTHROUGH AT 1818(0.149) (3.50) a = t (0.390) 0.38 1.00 (24.3) CYCLES, THEN PULLED TOS(24.3) - CYCLES, THEN PULLED TO340.6 a 0.991 30.8 FAILURE IN R.T. AIR(49.4) a = t (0.390) 0.38 1.00 AIR (28.0)
0.2340.37 0.54302.0 (0.092) (0.227) 0.37 0.54 2
(0A14-5 140) (350) a = t 0. 0.40 1.00 LN 25.4 FLAW BREAKTHROUGH AT 2026(0.140) 350) at 0.0 1.00 (23.1) - CYCLES, THEN PULLED TO350.3 0.889 0.40 1.00 AIR 30.1 _ FAILURE IN R.T. AIR(50.8) a =
t ( 0.40 1.00 AIR0.(0.)- (27.4)0.196 0.521 19.3 20.302.0 (0.077) (0.205) 0.38 0.51OA14-6 0.384 8.89 (43.8) 0.991 LN 2 (17.6) (18.4) FLAW BREAKTHROUGH AT 3180(0. (9 FLAW BREAKTHROUGH AT 3180S (0390) 0.39(24.3) CYCLES, THEN PULLED TO
S346.1 0.991 039 100 3 FAILURE IN R.T. AIR(50.2) a= t 0.39 1.00 AIR 31.3- --. AIR (28.5) -
> INITIAL CYCLIC CONDITIONS2 TERMINATION OF CYCLIC TEST3 FAILURE
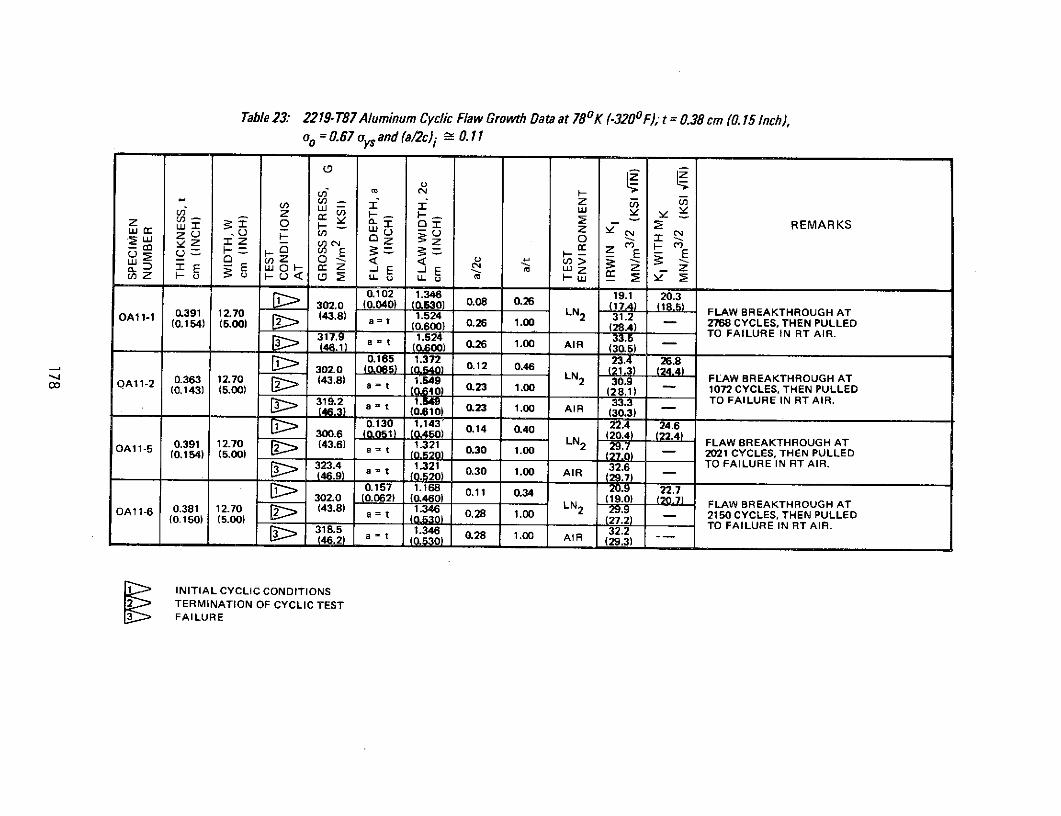
Table 23: 2219- T87 Aluminum Cyclic Flaw Growth Data at 780K (-320F); t = 0.38 cm (0.15 Inch),
o = 0.67 o and (a/2c)i 0. 11
m C,4
L- r OI - REMARKSS 302.0 0.040) 30 008 0.26 (17.4) (185)
OA1-1 0.391 12.70 (43.8) 1.524 LN2 31.2 FLAW BREAKTHROUGH AT
317.9 1.524 33.5 TO FAILURE IN RT AIR. E4.1 a = t 600 ) 026 1.00 AIR (30.5)
0E _ q- a: z -E -J E E
0.102 1.36 1923.4 26.8
1 302.0 (0.04065) (0.540) 0.12 0.461. 2.OAll-2 0.39163 12.70 (43.8) 1.549 LN 310.9 FLAW BREAKTHROUGH AT
(0.154) (5.00) = t (0.600) 0.26 1.00 (28.1) 1072 CYCLES, THEN PULLED3179.2 1.524 33.3 TO FAILURE IN RT AIR.(463) a = t (0.610) 0.23 1.00 AIR (30.5)
0.165 1.372 22.4 26.8302.0 (051) 0.450) 0.46(20.4) (2.4)
0.39163 12.70 (43.68) 1.321549 LN2 29.7 FLAW BREAKTHROUGH ATOA11-5 (0.154) (5.00) a = t 0.23 1.00 (28.1) 21072 CYCLES, THEN PULLED
3 319.2 1.34 32.3 TO FAILURE IN RT AIR.
S (46.) a = t (0.50) 0.23 1.00 AIR (30.3) -0.130 1.143 0.14 0.40 2 24.6
300.6 (0.05) (0.450) LN (20.4) FLAW BREAKTHROUGH ATOA11-5 0.391 12.70 (43.6) 1.321 0.30 1.00 2 L.W BETHRU(0.154) (5.00) a 1.00(053 . - 2021 CYCLES, THEN PULLED
> 323.4 1.321 0.30 1.00 AIR 32. FAILURE IN T AIR
A 6 0381 12.TERMINATION70 43.8) 1.6 0.28 1.CYCLIC TESTN 2 LAW BREAKTHROUGH AT(0150t FAILURE2150 CYCLES THEN PULLED18.5 1.3 0.2 1.00 AFAILUREINRTAIR.- - - (46.2) 0,5- - (29.3)
INITIAL CYCLIC CONDITIONSTERMINATION OF CYCLIC TESTFAILURE
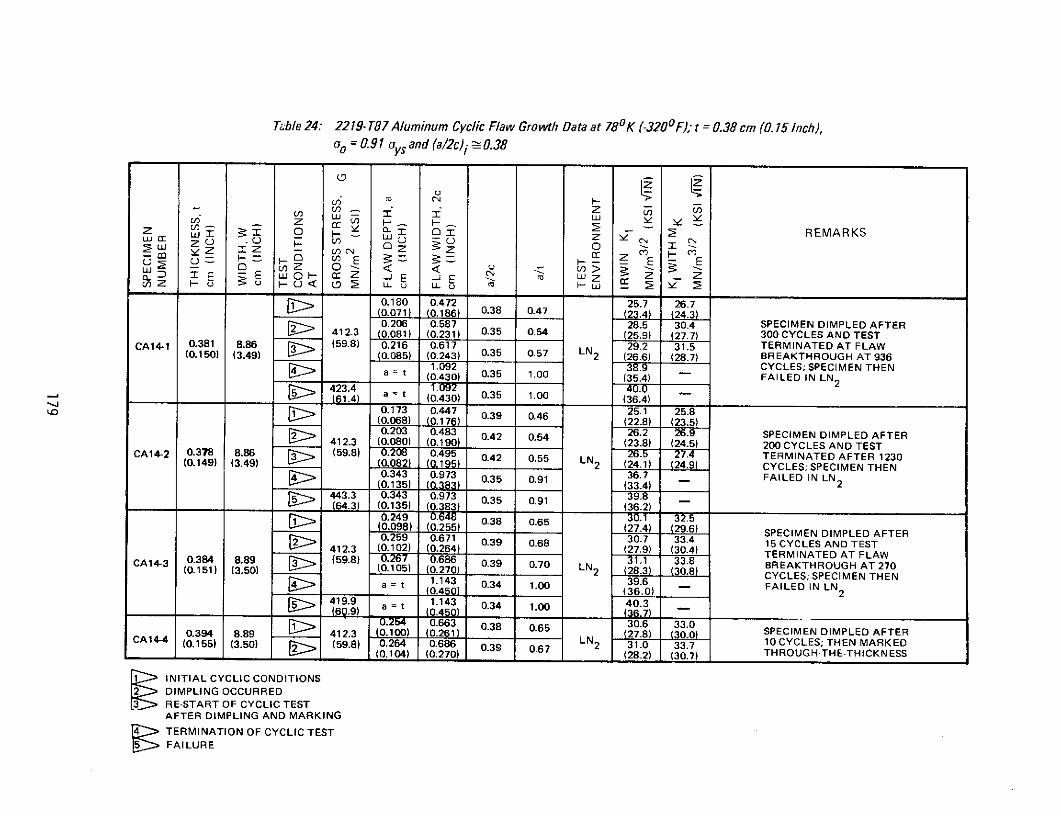
Table 24: 2219- T87 Aluminum Cyclic Flaw Growth Data at 780K (-3200F); t = 0.38 cm (0. 15 Inch),
oo = 0.91 oys and (a/2c)i -0.38
S) . - z
z , _I - O - : 2 - Z REMARKSS Lo <- (- Z -Z - ci Z Z O ~
0.180 0.472 25.7 26.7(0.071) (0.186) 0.38 0.47 (23.4) (24.3)0.206 0.587 28.5 30.4 SPECIMEN DIMPLED AFTER
412.3 (0.081) (0.231) 0.35 0.54 (25.9) (27.7) 300 CYCLES AND TESTCA14-1 0.381 8.86 (59.8) 0.216 0.617 29.2 31.5 TERMINATED AT FLAW
(0.150) (3.49) 3 (0.085) (0.243) 0.35 0.57 LN2 (26.6) (28.7) BREAKTHROUGH AT 9361.092 38.9 CYCLES; SPECIMEN THENa t (0.430) 0.35 1.00 (35.4) FAILED IN LN 2[ > 423.4 1.092 4.0
S(61.4 = t (0.430) 0.35 1.00 (36.4)
0.173 0.447 0.39 0.46 25.1 25.8(0.068) (0.176) (22.8) (23.5)0.203 0.483 0.42 0.54 26.2 26.9 SPECIMEN DIMPLED AFTER
412.3 (0.080) (0.190) (23.8) (24.5) 200 CYCLES AND TESTCA14-2 0.378 8.86 (59.8) 0.208 0.495 0.42 0.55 LN 26.5 27.4 TERMINATED AFTER 1230
(0.149) (3.49) (0.082) (0195) LN2 (24.1) (24.9) CYCLES; SPECIMEN THEN0.343 0.973 0.35 0.91 36.7 FAILED IN LN
(0.135) (0.383) (33.4) 2443.3 0.343 0.973 0.35 0.91 39.(64.3) (0.135) (0.383 (36.2)
0.249 0.648 0.38 0.65 30. 32.50.098) (0.255) (27.4) 29.6 SPECIMEN DIMPLED AFTER0.259 0.671 0.39 0.68 30.7 33.4 15 CYCLES AND TEST412.3 (0.102) (0.264) (27.9) (30.4) TERMINATED AT FLAW
CA14-3 0.384 8.89 . (59.8) 267 0.686 039 070 31.1 33.8 BREAKTHROUGH AT 270(0.151) (3.50) (0.105) (0.270) 0.39 0.70 LN2 (28.3) (30.8 CYCLES; SPECIMEN THENa *143 039.6 CYCLES; SPECIMEN THEN
= (0.4 0.34 1.00 (36.0) FAILED IN LN2419.9 a = t 1.143 0.34 1.00 40.3(69.9) (0.450) (36.7j_
0.25 0.663 0.38 0.65 30.6 33.00.394 8.89 412.3 (0.100) (0.261) (27.8) (30.0) SPECIMEN DIMPLED AFTER
CA14-4 (0.155) (3.50) [ (59.8) 0.264 0.686 0.39 0.67 LN 2 31.0 33.7 10 CYCLES; THEN MARKED(0.104) (0.270) (28.2) (30.7) THROUGH-THE-THICKNESS
INITIAL CYCLIC CONDITIONSDIMPLING OCCURREDRE-START OF CYCLIC TESTAFTER DIMPLING AND MARKING
4 TERMINATION OF CYCLIC TESTFAILURE
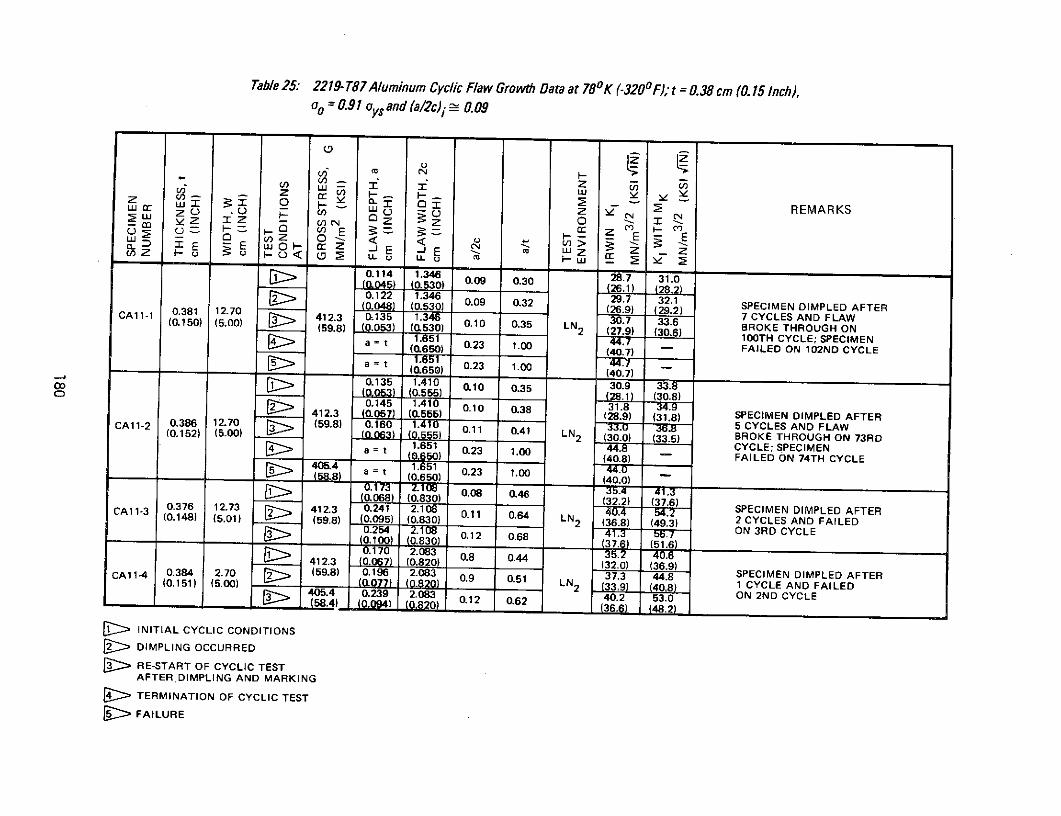
Table 25: 2219- T87 Aluminum Cyclic Flaw Growth Data at 780K (-3200F); t = 0.38 cm (0.15 Inch),oo = 0.91 oys and (a/2c)i 0.09
L)
VO (0.30 z0.30.z V) ( .
0(0,8181203 0.09 0.32 26 NSPECIMEN DIMPLED AFTER
C JZn - C r F F _
2 Z w0 ) Z Z 0
CAl1-1(0.150 (5.00) 412.3 0.135 1.346 630.7 33.6 7 CYCLES AND FLAW(59.8) (0.053) (0.530) 0.10 0.35 LN 2 (27.9) (30.6) BROKE THROUGH ONa = t 1.651 44.7 100TH CYCLE; SPECIMEN
(0.650) 1(40.7) - FAILED ON 102ND CYCLE(0.650) 0.23 1.00 - .7
0.135 1.410 0.10 0.35 30.9 33.8(.Q5) (0.555) 028.1) (30.8)0.145 1.410 20.10 0.38 31.8 34.9
412.3 (0.057) (0.555 ) 26.9) (31.8) SPECIMEN DIMPLED AFTER
CA11-2 0.386 12.70 (59.8) 0.160 1.410 0.11 0 33. 36.8 5 CYCLES AND FLAW(0.15) (5.00) ) (0.053) (0.555) .41 LN 2 (30.0) (33.5) BROKE THROUGH ON 73RD1.651 0.23 1.00 44100TH.8 CYCLE; SPECIMEN
(0.650) 1.00(40.8) FAILED ON 74TH CYCLE165 0 _44.0a= t (0.650) 0.23 1.00 (40.0)
(>01 (.18 ) 0.08 0.46
(2 0.068) (0830) (32.2) (37.6) SPECIMEN DIMPLED AFTER
CA11- 0.376 12.73 (59412.3 0.241 2.108 0.11 0.64 40.4 54.2 SPECIMEN DIMPLED AFTER(0.148) (5.01) (59.8) (0.095) (0.830) 0.41 LN2 (36.8) (49.333) BROK2 CYCLES A ND FAILED
0.254 2.108 0.12(40.8) FAILED56.7 ON 743RD TH CYCLE
405.4 0 a0t 10.81 0.23 1.00
S(0.6537. 60) (51.6)(40.0).,170 2.083 0.8 0. 35.240.6412.3 0. 7) 0.820) 0.8 ) (37.6)
CA11-4 0.384 2.70 (59.8) 0.196 2.083 0.9 0.51 37.3 44.8 SPECIMEN DIMPLED AFTER(0.151 ( (0.077) (0.820) LN2 33.9 408 1 CYCLE AND FAILEDS 239 2.083 0.12 0.62 40.2 53.0 ON 2ND CYCLE
0. 0.80) (36.6) (48.2)
SINITIAL CYCLIC CONDITIONS
[ DIMPLING OCCURRED
: RE-START OF CYCLIC TESTAFTER DIMPLING AND MARKING
R :> TERMINATION OF CYCLIC TEST
9 FAILURE
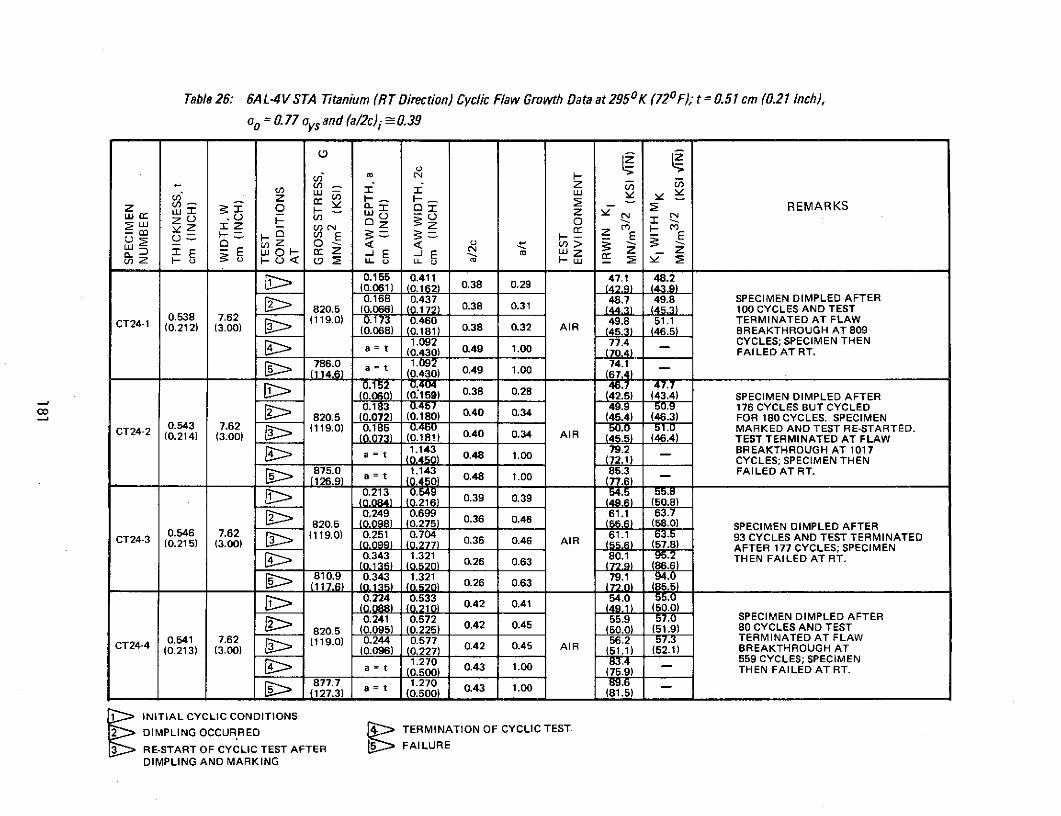
Table 26: 6A L-4V STA Titanium (RT Direction) Cyclic Flaw Growth Data at 2950 K (720F); t = 0.51 cm (0.21 Inch),
ao = 0. 77 oys and (a/2c)i 0.39
z 0 L 2 - REMARKS
0.155 0.411 47.1 48.2
(0.061) (0.162) 0.38 0.29 (42.9) (43.9)0.168 0.437 48.7 49.8 SPECIMEN DIMPLED AFTER
2 820.5 (0.066) (0.172) 0.38 0.31 (44.3) (45.3) 100 CYCLES AND TEST
CT24-1 0.538 7.62 (119.0) 0.173 0.460 49.8 51.1 TERMINATED AT FLAW(0.212) (3.00) (0.068) (0.181) 0.38 0.32 AIR (45.3) (46.5) BREAKTHROUGH AT809
1.092 77.4 CYCLES; SPECIMEN THENa = t (0.430) 0.49 1.00 (70.4) FAILED AT RT.
786.0 1.092 74.1(1146) = (0.430) 0.49 1.00 (67.4)
0.152 0.404 46.7 47.(0.060) (0:159) 0.38 0.28 (42.5) (43.4) SPECIMEN DIMPLED AFTER0.183 49.9 50.9 176 CYCLES BUT CYCLED
820.5 (0.072) (0.180) 0.40 0.34 (45.4) (46.3) FOR 180 CYCLES. SPECIMENCT24-2 0.543 7.6200) (119.0) 0.185 0.460 50.0 51.0 MARKED AND TEST RE-STARTED.CT24- (0.214) (3.00) (0073) (0.18) 0.40 0.34 AIR (45.5) (46.4) TEST TERMINATED AT FLAW
a = t 1.143 0.48 1 79.2 BREAKTHROUGH AT 1017(0.450) 0 .00 (72.1) CYCLES; SPECIMEN THEN
S875.0 = t 1.143 85;3 FAILED AT RT.(126.9) a = t (0.450 0.48 1.00 (77.6)
0.213 09 0 54.5 5bb.8S (0084) (0.21 0.39 0.39 (49.6) (50.8)0.249 0.699 61.1 63.7
2 820.5 (0.098) (0.275) 0.36 0.(55.6) (58.0) SPECIMEN DIMPLED AFTER0.546 7.62 (119.0) 0.251 0.704 61.1 63.5 93 CYCLES AND TEST TERMINATED
CT24-3 (0.215) (3.00) (0099) (0.277) 0.36 0.46 AIR (55) (57.8) AFTER 177 CYCLES; SPECIMEN0.343 1.321 80.1 95.2 THEN FAILED AT RT.(0.135) (0.520) 0.26 0.63 (72.9) (86.6)
810.9 0.343 1.321 79.1(1176) (0.135) (0,520) 0.26 0.63 (72.0) (85.5)
0.224 0.533 54.0 55.0(0088) (0.210) 0.42 0.41 (50.0)0.241 0.572 55.9 57.0 SPECIMEN DIMPLED AFTER
2-> 820.5 (0.095) (0.225) 0.42 0.45 (50.0) (51.9) 80 CYCLES AND TEST0.541 7.62 (119.0) 0.244 0.577 56.2 57.3 TERMINATED AT FLAW
CT24-4(0.096) 0.42 0.45 AIR (51.1) (52.1) BREAKTHROUGH AT1.270 83.4 559 CYCLES; SPECIMEN
a = t (0.500) 0.43 1.00 (759) THEN FAILED AT RT.
S877.7 1.270 0.43 1.0089.6(127.3) a = t (0.500) 0.43 1.00 (81.5)
INITIAL CYCLIC CONDITIONS
DIMPLING OCCURRED 4 TERMINATION OF CYCLIC TEST
RE-START OF CYCLIC TEST AFTER FAILURE
DIMPLING AND MARKING
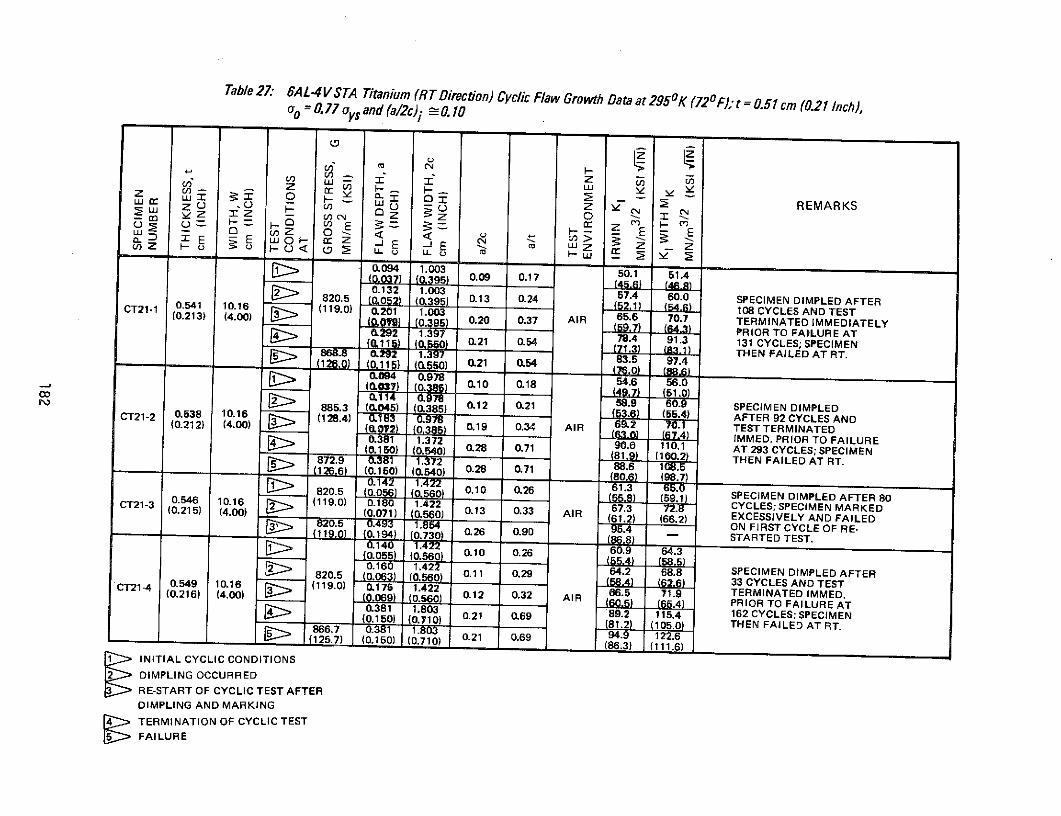
Table 27 6AL-4VSTA Titanium (RT Direction) Cyclic Flaw Growth Data at 2950K (72OF); t = 0.51 cm (0.21 Inch),
- Cd, - x C4 ,REMARKSWm u z h-OL L J I Z 0 0-
y 2 / 7) z0 5) 1 .003
820.5 _(0052) (0,395) 0.13 0.24 57.4 60.0 SPECIMEN DIMPLED AFTER(0.213) .) (119.0 0.201 1.003 108 CYCLES AND TEST(0.09) (0,395) 0.20 0.37 AIR 65.6 70.7 TERMINATED IMMEDIATELY0.292 1.397 PRIOR TO FAtLURE AT(_115) (0,550) .21 054 78.4 91.3 131 CYCLES; SPECIMEN
868.8 0.292 1.397 1.3 THEN FAILED AT RT.-*(126.0) 0115 (0.550) 0.21 0.54 83.5 97.4
(03) (0.385) 0.10 0.18 54.6 51.40.114 09978 (49.7) (51.0)
885.3 (45) (0.385 0.12 0.21 58.9 60.9 SPECIMEN DIMPLED
CT21-2 0.54138 10.16 (19.) =U 0(53.6 CYCLES AND TEST
0.(0.2172) (0385 0.19 0.34 AIR 69.2 0. TEST TERMINATEDS1 (6IMMED. PRIOR TO FAILURE0.150) (0.540) 0.28 0.71 90. 110.1 AT 293 CYCLES; SPECIMEN
872.9 0 (381 1.372 581 (10.2) THEN FAILED AT RT.
(126.6) (0.150) (0.540) 0.28 0.71 88.6 108.5
0.014 Q2 (805.6) (98.7)820.5 (0.056) (0.560) 0.10 0.26 61.3 51.0
S1(59. 0.21) SPECIMEN DIMPLED AFTER 80
(0.215) . ) (119.0)0 1.422 0.13 0.33 AIR 67.3 72.8 CYCLES; SPECIMEN MARKED
885.3 ) (0.560) 01(61.2) (66.2) EXCESSIVELY AND
805 04 0.0 26 090 4 ON FIRST CYCLE OF RE-
'-~ 820.5 0) (0,560) 0.11 0.29 64.2 68.8 SPECIMEN DIMPLED AFTERCT21-4 0.549 10.16 (119.0) .175 1.422 33 CYCLES AND TEST
(0.216) (4.00) 0 (0.560) 0.12 0.3 AIR 66.5 71.9 TERMINATED IMMED.
0.381 1.803 MMED. PRIOR TO FAILURE(0.150) (0.710) 0.21 0.69 89.2 115.4 162 CYCLES; SPECIMEN
866.7 0.381 1.803 (81.2) (105.0) THEN FAILED AT RT.(125.7) (0.150) (0.710) 0.21 0.69 94.9 122.6
INITIAL CYCLIC CONDITIONS
DIMPLING OCCURREDRE-START OF CYCLIC TEST AFTERDIMPLING AND MARKINGTERMINATION OF CYCLIC TEST
FAILURE[ - FAILURE

Table 28: 6AL-4V STA Titanium (RT Direction) Cyclic Flaw Growth Data at 2950 K (720F); t = 0.31 cm (0.12 Inch),oo = 0.77 oys and (a/2c)i :0.34
K _UJ M 0 0 3 - REMARKS
Lc Z U 'n cU- Z 0 M
E3 -C OE - = u) E - EE E LU0 - cZ -JE - 1 E -J Z
0.104 0.305 40.2 41.5(0041 (0.12 0.34 0.34(36.) (37.8) SPECIMEN DIMPLED AFTER0.114 0.325 41.7 43.0 84 CYCLES BUT CYCLED
820.5 (0.045) (0.128) 0.35 0.37 (37.9) (39.1) FOR 96 CYCLES. SPECIMENCT14-I 0.310 5.08 (119.0) 0.117 0.343 42.6 44.1 MARKED AND TEST RE-STARTED.(0.122) (2.00) (0.046) (0.135) 0.34 0.38 AIR _38.8) (40.1) TEST TERMINATED AT FLAW
0.762 64. BREAKTHROUGH AT 691(0.300) 0.41 1.00 (58.7) - CYCLES; SPECIMEN THEN
877.0 t 0.41 1.00 .2 FAILED AT RT.(127.2) a = t (0.300) 0.41 1.00 (63.0)
0.102 0.305 40.1 41.5(0040) (0.120) 0.33 0.34 36.5 (37.8) SPECIMEN DIMPLED AFTER0.114 0.320 41.4 42.6 77 CYCLES BUT CYCLED
2- 820.5 (0.045) (0.126) 0.36 0.38 (37.7) (38.8) FOR 82 CYCLES BT CYCLED
CT14-2 0.300 5.08 (119.0) D.34 - FOR 82 CYCLES. SPECIMENCT 0.118) (2.00) (.046) (0.135) 0.34 0.39 AIR (38.8) (40.2) MARKED AND TEST RE-STARTED.(0.118) 0.838 67.0 TEST TERMINATED AT FLAW
St (0.330) 0.36 1.00 (61.0) BREAKTHROUGH AT 747 CYCLES;
869.5 0.33t 0.36 1.01. SPECIMEN THEN FAILED AT RT.(126.1) a t 0 0.36 1.00
0.124 0.381 0.33 0.41 44.7 .6(0,049) (0.150) (40.7) (42.4) SPECIMEN DIMPLED AFTER0.137 0.406 .34 0.45 46.4 48.6 84 CYCLES BUT CYCLED
820.5 MW __(0.160) (42.2) (44.2) FOR 90 CYCLES. SPECIMENCT14-3 0.305 5.08 (119.0) 0.145 0.432 0.34 0.48 47.8 50.4 MARKED AND TEST RE.STARTED.
(0.120) (2.00) (0.057) (0.170) AIR (43.5) (45.9TEST TERMINATED AT FLAW0.762 0.40 1.4 BREAKTHROUGH AT 434(0300) ) CYCLES; SPECIMEN THEN
819.8 0.762 64.4 FAILED AT RT.5 (118.9) at (0.300) 0.40 1.00 (586)0.130 0.386 45.2 47.0(0.051) (0.152) 0.34 0.42 (41.1) (42.8) SPECIMEN DIMPLED AFTER0.137 0.406 46.4 48.6 6SPECYCLES BUTCYCLED
820.5 (0.054) (0.160) 0.34 0.45 (42.2) (44.2) FOR 64 CYCLES BUT CYCLED
0.307 5.08 p- 64 49.3CT14-4 0.307121) 52.00) (119.0) 0.142 0.417 47.0 49.3 R CYCLES. SPECIMEN(0.121) (2.00) (0.056) (0.164) 0.34 0.46 AIR (42.8) 44.9) MARKED AND TEST RE-STARTED.
0.762 84.4 TEST TERMINATED AT FLAWa = t 00) 0.40 1.00 (58.6) BREAKTHROUGH AT 605 CYCLES;
886.0 0.762 70.0 SPECIMEN THEN FAILED AT RT.(128.5) a = t 00 0.40 1.00 (63.7)
INITIAL CYCLIC CONDITIONSTERMINATION OF CYCLIC TESTDIMPLING OCCURRED F
RE-START OF CYCLIC TEST AFTERDIMPLING AND MARKING

Table 29: 6AL4V STA Titanium (RT Direction) Cyclic Flaw Growth Data at 2950K (720 F); t = 0.31 cm (0.12 Inch),oo = 0.77 oys and (a/2c)i - 0. 10
(0 4)
Lo 0 -C M REMARKS, , , I C I 0- =
m pZ IZ - Cr z 0 Z) C
w z a 04U Z zo. E u OH 0_ EZ -j E -J E M X .... ZU)Z U 0 U < ( L U L UZ
0.107 1.041 53.0 57.8(0 . (0.410 0.10 0.340.127 1.041 58.7 63.0 SPECIMEN DIMPLED AFTER
820.5 (0.050) (0.410) 0.12 0.41(51.6) (57.3) 64 CYCLES AND TEST
0.310 10.16 (119.0) 0.132 1.041 57.5 64.5 TERMINATED IMMED.CT11-1 0.122) (4.00) (0.052) 0.410) (52.5) (58.7) PRIOR TO FAILURE AT
0.213 1.219 69.6 92.3 120 CYCLES; SPECIMEN(0.084) (0.480) 0.18 0.69 (63.3) (84.0) THEN FAILED AT RT.
5[ 851.5 0.13 71.219 72.5 96.3(123.5) (0.084) (0.480) 6608 769
0.104 1.029 0.10 0.34 . 5.1(0.041) (0.405) (47.7) (52.0)0.127 1.029 0.12 0.41 .6 62. SPECIMEN DIMPLED AFTER
00 820.5 (0.050) (0.405) (51.5) (57.2) 62 CYCLES AND TEST0.C11- 310 10.16 (119.0) 0.132 0.13 0.43 AIR . TERMINATED IMMED.
CT1-2 (0.122) (4.00) 0.2) (0405) 52.3) 58.6) PRIOR TO FAILURE AT0.223 1.143 0.20 0.73 69. 93.6 131 CYCLES; SPECIMEN
(0.089) (0.450) (63.5) (85.2) THEN FAILED AT R-T.
5 837.1 0.22 1.143 0.20 0.73 .2 ,089 (0.450) (64.9) (87.1)U.061 0.800 0.10 0.27 17. 49.1
Cc.>32J 031 0.10 0.27 t42.1) 44.7)
O.G 0.800 0.12 0.33 -5.6 54.1 SECIMEN DIMPLED AFTER820.5 (0.039) (0.315) (45.5) (49.2) 85 CYCLES AND TEST
0.305 10.16 3 (119.0) 0.104 0. AIR 5.3 TERMINATED IMMED.CT11-3 (0.120) (4.00) L0.041) (0.315) PRIOR TO FAILURE AT
0.216 1.041 0.21 0.71 67.5 88.4 294 CYCLES; SPECIMEN( 5) (0_10) 61.4) (80., ) THEN FAILED AT RT.
860.5 0.216 1.041 0.21 0.71 71.2 93.2(124.8) (0.0 ) 0.0, )_ (4_8) (_ __)
0.079 0.787 0.10 0.25 45.6 48.10031) (0310) (41.5) )0.094 0.787 0.12 0.30 48.9 52.5 SPECIMEN DIMPLED AFTER
820.5 (0037) (0.310) (44.5) (47.8) 111 CYCLES AND TEST
CT11-4 0.315 10.16 (119.0) 0.097 0.787 49.3 53.2 TERMINATED AT FLAW(0.124) (4.00) (0.038) (0.310) (44.9) (48.4) BREAKTHROUGH AT411
t 1.067 030 1.00 73.7 CYCLES; SPECIMEN(0.420) 1.(67.1) THEN FAILED AT RT.
844.6 1.067 0.30 1.00 76.2(122.5) (0.420) (69.3)
INITIAL CYCLIC CONDITION TERMINATION OF CYCLIC TESTDIMPLING OCCURRED
RE-START OF CYCLIC TEST AFTERDIMPLING AND MARKING
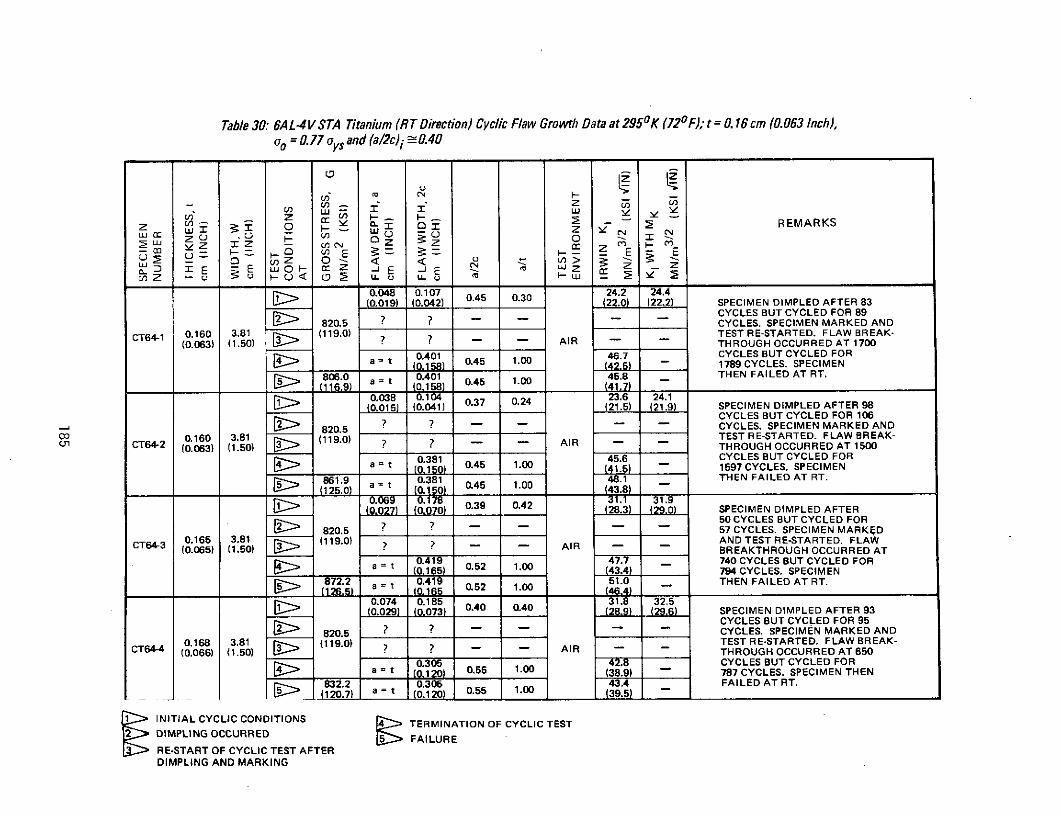
Table 30: 6AL-4VSTA Titanium (RT Direction) Cyclic Flaw Growth Data at 2950K (720F); t = .16 cm (0.063 Inch),oo = 0.77 oys and (a/2c) i 0.40
Z 0 C REMARKSLU r" C3: z Zz o 'Z U u
(0.063) (1.50) ? ? - THROUGH OCCURRED AT 1700
0.401 46.7 CYCLES BUT CYCLED FOR
(42.5) 1789 CYCLES. SPECIMEN E
806.0 0.401 45.8 _ THEN FAILED AT RT.
Z U (116.9 (0158) LU U 4W.
0.048 0.104 24.2 24.4(0.01) (0.04) 220..037 0.24 (22.2) SPECIMEN DIMPLED AFTER 83
CYCLES BUT CYCLED FOR 89820.5 ? ? - CYCLES. SPECIMEN MARKED AND
CT64-1 0.160 3.81 (119.0) TEST RE-STARTED. FLAW BREAK-(0.063) (1.50) ? ? - - AIR - - THROUGH OCCURRED AT 1700
0.401 45.60.45 1.00 CYCLES BUT CYCLED FORa ) 0.45 1.00 (41.5) 1789 CYCLES. SPECIMEN
806.0 at 0.401 45.81 THEN FAILED AT RT.(116.9) t 0.158) 0.45 1.00 4.
0,069 01.1 31.9
0.038 0.104 0.37 0.24 23.6 24.1(0,02715) (007041) 0.39 0.42 (28.3) (29.0) SPECIMEN DIMPLED AFTER 98
50 CYCLES BUT CYCLED FOR 106- 820.5 ? -57 CYCLES. SPECIMEN MARKED AND
CT 0.16 3.81 (119.0) ANDTEST RE-STARTED. FLAW BREAK-CT (0.06) (1.50) BREAKTHROUGH OCCURRED A T 1500
0.381 45.6 740 CYCLES BUT CYCLED FOR(0165 0.52 1.00 41.5) 1597 CYCLES. SPECIMEN
86172.29 0.381 48.1 THEN FAILED AT RT.(12.) a = t 0.52 1.00 (43.8)
0.074 0.185 31.8 32.5(0.029) (0,07) 0.40 0.40 (28.93) (29.) SPECIMEN DIMPLED AFTER
50 CYCLES BUT CYCLED FOR820.5 .. 57 CYCLES. SPECIMEN MARKED
0.16 3.81 (119.0)AND TEST RE-STARTED. FLAW0.165 3.81 (119.0) - I AIR - -CT64-4 (0.066) (1.50) ? ? BREAKTHROUGH OCCURRED AT
0.41305 42.8740 CYCLES BUT CYCLED FORt ,10) 0.5 1.00 (38.9) 794 CYCLES. SPECIMEN832.2 0.41305 51.0 THEN FAILED AT RT.(120.7) a = t (0.120) 0.5 1.00 (39.5)
0.074INITIAL 0.185 NATION OF CYCLIC 31.8 32.50.40 0DMPLNG SPECIMEN DIMPLED AFTER 93
820.RE-START OF CYCLIC TEST AFTERCYCLES BUT CYCLED FOR 95
DIMPLINGCYCLES. SPECIMEN MARKED AND
CT64-4 0.168 3.81 D-. (119.0) TEST RE-STARTED. FLAW BREAK-(0:066) (1.50) AIR THROUGH OCCURRED AT 650
0.305 CYCLES BUT CYCLED FORS=t 10120) 0.55 1.00 (38.9) 787 CYCLES. SPECIMEN THEN
[ ~ 832.2 0.305 4T4 FAILED AT RT.(120.7) a= t I.12 0.55 1.00 (3
INITIAL CYCLIC CONDITIONS 4 TERMINATION OF CYCLIC TESTDIMPLING OCCURRED ALR
RE-START OF CYCLIC TEST AFTERDIMPLING AND MARKING
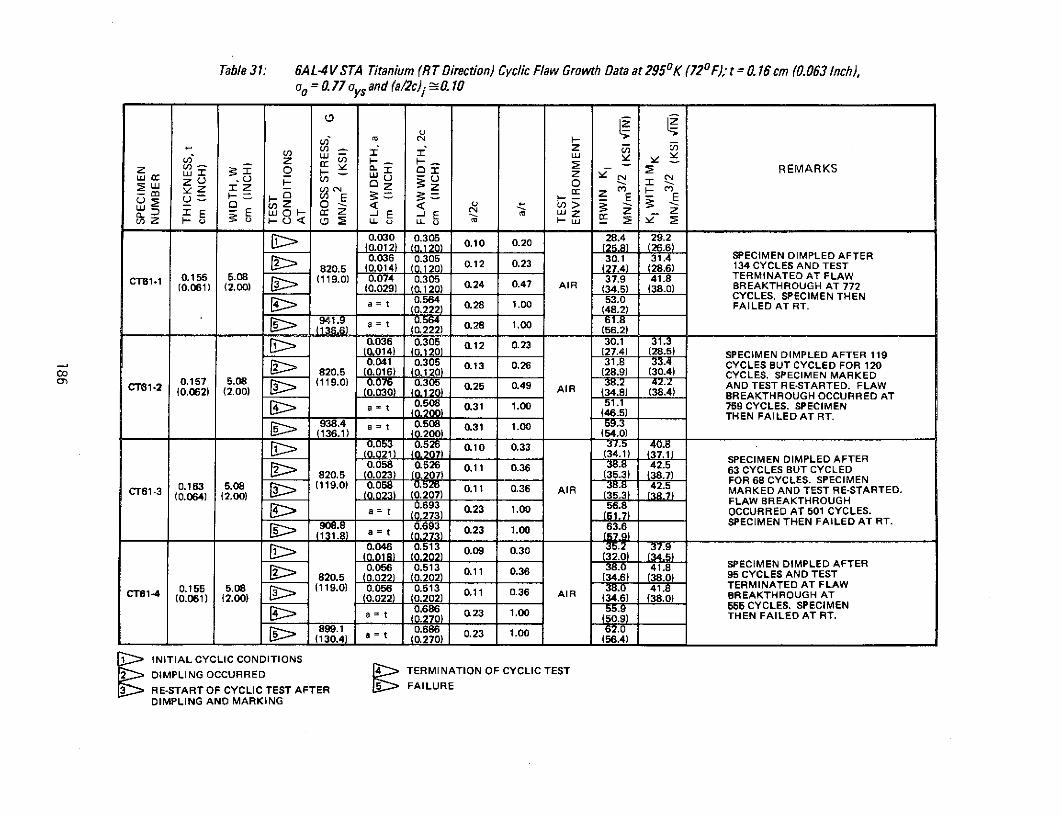
Table 31: 6AL-4V STA Titanium (RT Direction) Cyclic Flaw Growth Data at 2950K (720 F); t = .16 cm (0.063 Inch),oo = . 77 oys and (a/2c)i . 10
Uo Co N
,zI O T " M - REMARKS
(0.012) ( 1 ) 0.10 0.20 (25.8) (26.6)
0) =0E 0 ) z E E
0.564 53.0 CYCLES. SPECIMEN THEN
> 91.9 a = t LLu 0 1 u J0.036 0.305 28.4 29.2(0.012) (00120) 0.10 0.20 26.6)
0.036 0.305 30(7.4) (8.5) SPECIMEN DIMPLED AFTER820.5 (0.0140) (28.9) (2830.4) 134CYCLES ANDTEST
CT61-2 0.15 5.08 (119.0) 0.074 0.305 0.2 0.4 AIR 4AND TERMINATED AT FLAW(0.061) (2.00) (0.029) (0.120) AIR (34.5) (38.0) BREAKTHROUGH AT 772Sat 0.56408 0.31 1.00 51.1 759 CYCLES. SPECIMEN THEN
a = t (0.200) 28(46.5) THEN FAILED AT RT.
938.4 a = t 0508 031 1.00 59.3
(136.1) (0.222) 0.28 (54.2)
0.036 0.305 0.12 0.23 30.1 3140.(0.021) (0 207) (34.1) (37.1) SPECIMEN DIMPLED AFTER 1190.041 0.305 0.13 0.26 31. CYCLES BUT CYCLED FOR 120
820.5 (0.016) (0.20) (28.9) (30.4) CYCLES. SPECIMEN MARKEDCT61-3 0.157 5.08 (119.0) 0.0 0. 0.2511 0.36 AIR MARKED AND TEST RE-STARTED. FLAW
CT612 (0.062) (2.00) (0.030) (020) (3) (38.4)FAW BREAKTHROUGH OCCURRED AT
a = t 0.508273 0.31 1.00 1.7) OCCURRED AT 50159 CYCLES. SPECIMEN
0. 023 1.00 63.6 SPECIMEN5) THEN FAILED AT RT.T.
938.4 a=t 0.508 031 1.00(0136.1) (0.202) (54.0) (34.5)
- 0.526 0.10 0.33 37.5 40.8
0.056 0.513 0.11 06 (38.0 41.8 SPECIMEN DIMPLED AFTER0.058 0.526 0.11 0.36 . 42.5 63 CYCLES BUT CYCLED820.5 (0.02 (0.20) (34.6) (38.0)FOR 68 CYCLES. SPECIMEN
5.08 0.526 42.5
CT 0.155 5.08 (119.0) 0.056 0 .513 38.0 41.8 MARKED AND TEST RE-STARTED.
CT61-4 (0.061) (2.00) 0.022) (0.20) 0.11 0.36 AIR ( ) (38.0) REAK RO
0.693 0.23 1.00 56.8 FLAW BREAKTHROUGH
(0273) 023 1. OCCURRED AT 501 CYCLES.
a = t (0.693 SPECIMEN THEN FAILED AT RT. T.13 a
= t (0. 0.23 1.00 63.6
0.046 0.513 0.09 0.30 (32.0) 37.9
0.056 0.513 OCCURRED TERMINATION OF CYCLIC 0 41.8 SPECIMEN DIMPLED ATE
0.RE-STARTOF CYCLIC 55 CYCLESTEST AFTER SPECIMFAILUREENS0. DIMPLING.9) THEN FAILED AT T.MARKING
899.1 0.686 62.01.00 6!2M5_ _(130.4)(2 0.23
> INITIAL CYCLIC CONDITIONSDIMPLING OCCURRED TERMINATION OF CYCLIC TEST
RE-START OF CYCLIC TEST AFTER LC> FAILUREDIMPLING AND MARKING

Table 32: 6AL-4V STA Titanium (WT Direction) Cyclic Flaw Growth Data at 2950K (720F) in Argonand Salt Water at 10 cpm; t = 0.31 cm (0.12 Inch), oo = 0.68 oys and (a/2c)i 1 0.37
Cl i Iu-
z , O - I -0 REMARKS~~ O Z ~ (NUMBER OF CYCLESm E - O "E r- . Z E E REFER TO TOTAL CYCLES)
L 0 z -E - E -= - E0. m: E E 0 cr- z E -J E uJ
0.163 0.427 42.6 44.5734.3 (0.064) (0.168) 0.38 0.52 (3.8) (40.5) CYCLIC TEST TERMINATED
OST-10A 0.315 5.11 (106.5) 0.864 ARGON 60.4 AT FLAW BREAKTHROUGH(0-124) (2.01) at 0.37 1.00.0 AT 128 CYCLES. SPECIMEN
857.7 0.864 71.2 37 FAILED IN RT AIR.124.4) a =t 0.34 0.37 1.00 AIR 71.2
0.130 0.51 38.6 39.8
S734.3 (0.051) (0.138) 0.37 0.43 ARGON (35.1) (36.2) CYCLIC TEST TERMINATEDO 1 0.305 5.11 0.77 0. 41 1056.3 AT FLAW BREAKTHROUGH
(0.120) (2.01) (0.290) 1 _ 1.2) AT342 CYCLES. SPECIMEN919.1 0t 73 01 1.00 AIR 7.4 FAILED IN RT AIR.(133.3) a =
(0.290) AIR (65.0)0.155 0.406 0.38 0.54 41.5 43.6
7343 (0.061) (0.160) SALT (37.8) (39.7) CYCLIC TEST TERMINATEDOS 0.290114) (2.01 0.27 0.70 WATER AT39 CYCLES. SPECIMEN
(0.114) (2.01) (64.1 .1 FAILED IN RT AIR.935.7 0.203 0.762 0.27 0.70 AIR .(135.7) (0.080) .} AIR (64.1) (79.1)
0.130 0 0.33 0.42 40.4 42.2734.3 (0.051) (0.156) SALT (36.8) (38.4) CYCLIC TEST TERMINATED
OST-19A 0.310 5.11 (106.5) 0.287 1.2 0.23 0.93 WATER 67.3 AT FLAW BREAKTHROUGH(0.122) (2.01) (0.113) (0. 50) (AI 7 -- AT 59 CYCLES. SPECIMEN
749.5 0.287 1.270 0.23 0.93 68.8 FAILED IN RT AIR.(108.7) (0.113) (0.500) AIR (62.6)
> INITIAL CYCLIC CONDITIONS
> TERMINATION OF CYCLIC TEST
9 FAILURE
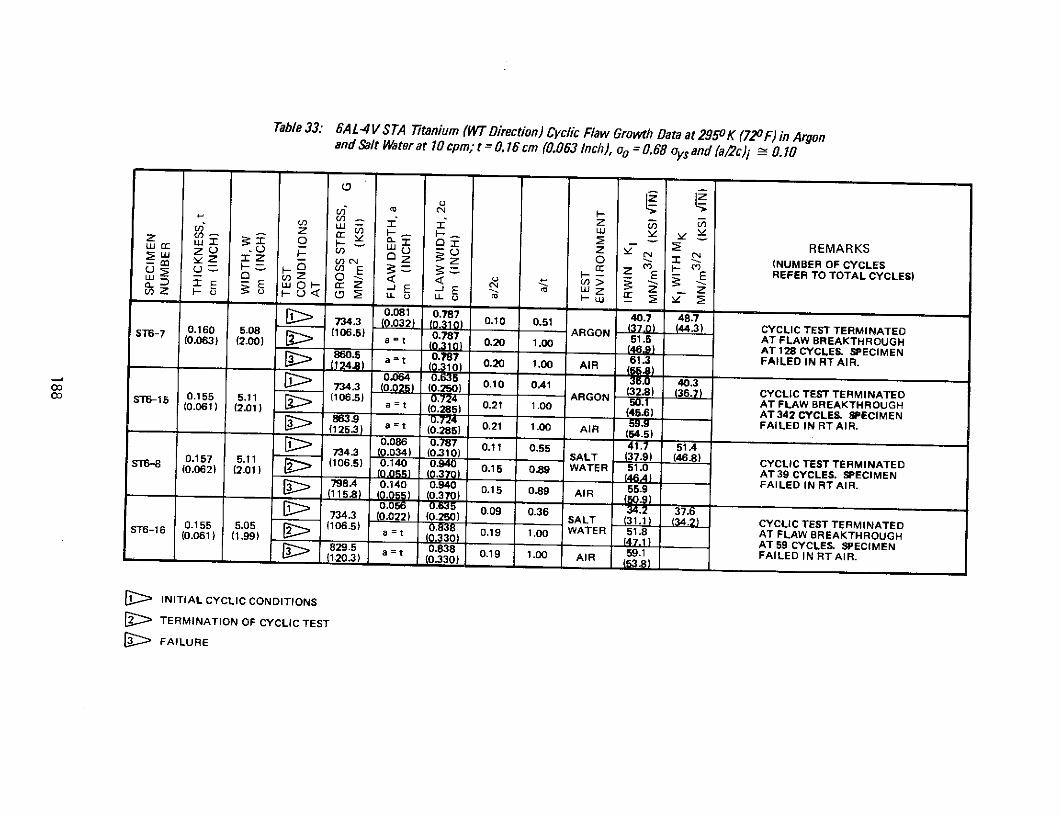
Table 33: 6AL-4V STA Titanium (WT Direction) Cyclic Flaw Growth Data at 295OK (720F) in Argonand Salt Water at 10 cpm; t = 0.16 cm (0.063 Inch), oo 0.68 oy and (a/2c)i -0.10
Z -i -l -z Cr I
W - O O -O - REMARKSS3 Z -r Z zc 0 (NUMBER OF CYCLES0 O- H E E E REFER TO TOTAL CYCLES)u 0 < <- . c >a ZO -i E -J E cu wZ Z .Z< U LL E L Lu
0.081 0.787 40.7 48.7i> 734 (0.032) L0 (0.10 0.51 44.3) CYCLIC TEST TERMINATEDST6-7 0.160 5.08 (106.5) 0.787 ARGON(443)S 0.063) (2.0060) a t 0.77 0.20 1.00 51.5 AT FLAW BREAKTHROUGH0.3 8
ARGON860.5) (469) AT 128 CYCLES. SPECIMEN860124.) at 0.787 61.3 FAILED IN RT AIR.a t 0.20 1.00 AIR
734.3 (0.025) (0.250) 0.10 0A1 40.3ST6-15 0.155 5.11 (106.5) 0.724 ARGON (32.8) 36. CYCLIC TEST TERMINATED(0.061) (2.01) a = t (0.285) 0.21 1.00 50.1 AT FLAW BREAKTHROUGH(0. (2.01) . (45.6) AT 342 CYCLES. SPECIMEN863-9 0t74 59IX FAILED IN RT AIR.(125.3) a = t (0.285) 0.21 1.00 AIR (54.5)
0.086 0.787 0.11 0.55 41.7 51.40.157 5.11 734.3 (0.04 0310) SALT (37.9) (46.8) CYCLIC TEST TERMINATEDST 0.062) .1 (106.5) 15 WATER CYCLIC TEST TERMINATED55(0.062) (2.015) 0.15
AT39 CYCLES. SPECIMEN798A 0.140 0.940 55.9 FAILED IN RT AIR.[ (1158)0. 0.15 0.89 AIR 0.
7343 0.022) (0.250) S0.09 0.36 ALT (31.1) ) CYCLIC TEST TERMINATED0.06155 5.0599 (1065) (0.330 0.19 1.00 WATER 51.8 AT FLAW BREAKTHROUGH829.5(0.061) (1 a t 0.83830) (471) AT 59 CYCLES. SPECIMEN120.3) a = t 0.838 0.19 1.00 AIR 59.1 FAILED IN RT AIR.(120 (0.330) (53.8)
> INITIAL CYCLIC CONDITIONS
TERMINATION OF CYCLIC TEST
[ FAILURE
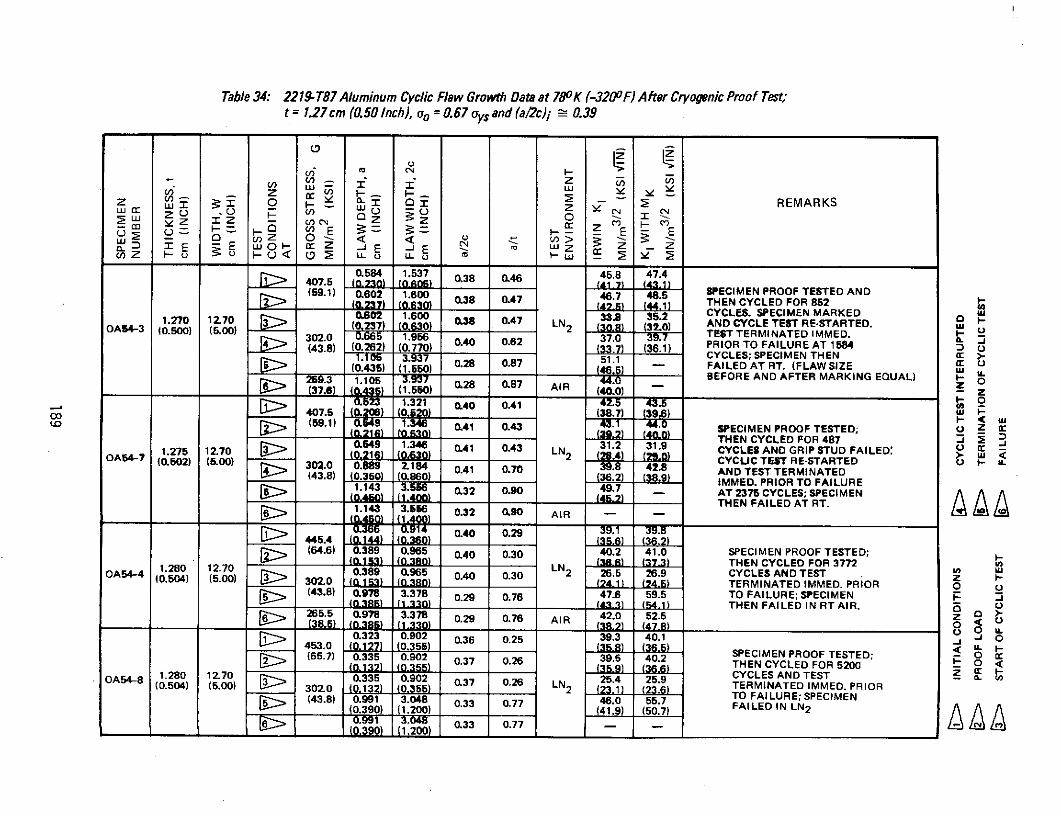
Table 34: 2219-T87 Aluminum Cyclic Flaw Growth Data at 780K (-3200F) After Cryogenic Proof Test;t = 1.27 cm (0.50 Inch), oo = 0.67 oys and (a/2c)i r 0.39
O -O )- O L z - REMARKS
(4.8 06 0 04 06 ( 0PFV) .93 C) CYCLCS)
0 12Z 0 >. 6 - F EC 9E E wQ 0 ZH 0 E 8E -WZ Z Z F(n. ( 4. L) 0 LL U LL u I (40.0
0.584 1.537 0.38 0.41 45.8 47.4407.5 (o.o) (0.650.46 71 (43.1)(59.1) 0.602 1.600 0.38 0.47 46.7 485 SPECIMEN PROOF TESTED AND
0.237Z) (0.630) .. 7 4.1 THEN CYCLED FOR 8521.270 12.70 0.4700 33.8 35.2 CYCLES. SPECIMEN MARKED1.270 12.70 07) (03 0. 0.4 LN2 ( 3 AND CYCLE TEST RE-STARTED.
OA154-3 (0.500) (5.00) (02) (030) 2 (30.8) (32.0)302.0) 065 (.0 (.0 041 TEST TERMINATED IMMED. I-(43.8) (0.262) (0.770) 0.62(33.7) (36.1) PRIOR TO FAILURE AT 1584 U
8(.3) 0.28 0.87 51.1 CYCLES; SPECIMEN THEN >(1. 0.28 0.87 51.1 FAILEDATRT. (FLAWSIZE rr C
S259.3 1.105 3.937 40 BEFORE AND AFTER MARKING EQUAL) -0.28 0.87 AIR 2(37.6) (0435) (1.560) AIR (40.0) - Z
1523 1.321 0.40 0.41 42.5 43.5407.5 (0. ) (0.0) (38.) (39.6)(59.1) 9 .6 0.41 0.43 . 4.0 SPECIMEN PROOF TESTED; Z -
S (0.21) (0.530) (39.2) (47.3) THEN CYCLED FOR 487 7j E 31.275 12.70 0.549 1.346 0.41 0.43 LN 2 31.2 31.9 CYCLES AND GRIP STUD FAILED: _A1 ((0.502) (5.00) 8 2. CYCUC TEST RE-STARTED - .302.0 0.889 2.184 0.41 0.70 .8 4.8 AND TEST TERMINATED
(43.8) (0.350) (0.860) (36.1 (38.9) IMMED. PRIOR TO FAILURE.143 3.378 0.32 0.90 49.7 AT 2375 CYCLES; SPECIMEN Q *(0.80) (1.400) (41.52) _1 THEN FAILED AT RT.1.143 3.556 0.32 0.90 AIR - A. A0.34 0.94 0.40 0.29 39.3 4.445.4 (0.144) (0.30) (35.6) (36.2)
(64.6) 0.389 0.965 0.40 0.30 40.2 41.0 SPECIMEN PROOF TESTED;(0.153) (0.350) 0 0(3-91 (366) THEN CYCLED FOR 3772
1.280 12.70 0.389 0.965 0.40 0.30 LN2 26.5 26.9 CYCLES AND TEST U) U.OA54 (0.504) (5.00) 302.0 (0_153) (03) (241) (24.5) TERMINATED IMMED. PRIOR 0 O(43.8) 0.978 3.378 0.29 0.76 47.6 59.5 TO FAILURE; SPECIMEN
(0.390 (1.20) (43l (5.1 THEN FAILED IN RT AIR. )265.5 0.978 3.378 0.29 0.76 AIR 42.0 52.5 0(38.5) (.-38 (.33) (39.2) (47,- 0O --
0.323 0.902 0.36 0.25 39.3 40.1 -_J o453.0 (0.127) (0.355) (35.8) (36.5)(65.7) 0.335 0.902 0.37 0.26 39.5 40.2 SPECIMEN PROOF TESTED; 0
(0.1321 (0. __355) _59 (3.THEN CYCLED FOR 5200
A54-8 1.280 12.70 0.335 0.902 0.37 0.26 LN 25.4 25.9 CYCLES AND TEST Z U(0.504) (5.00) 3 0 2 . 0 (0.132) (0.355) LN (23.1) (23.6) TERMINATED IMMED. PRIOR
((43.8) 0)1 (.00) 0.33 0.77 46.0 55.7 TO FAILURE; SPECIMEN(0.390) (1.200) (41.9 (50.7) FAILED IN LN 2
(0.390) (1.200) 0.33 0.77
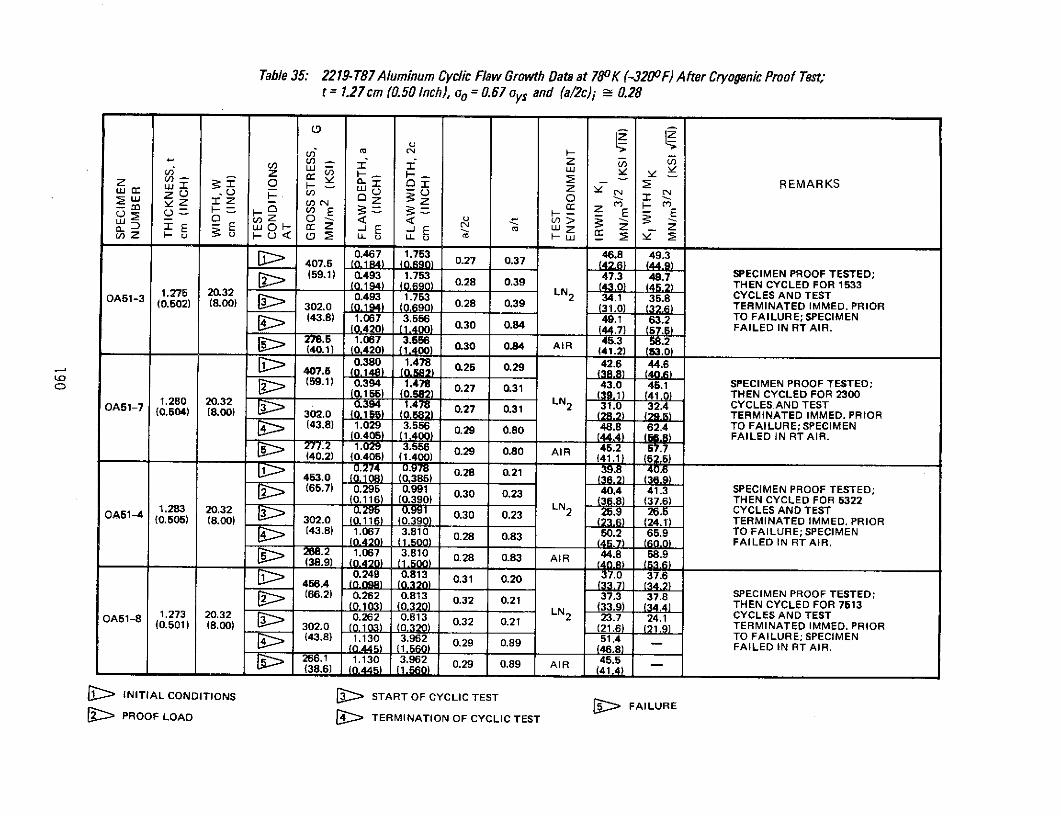
Table 35: 2219- T87 Aluminum Cyclic Flaw Growth Data at 780K (-320oF) After Cryogenic Proof Test;t = 1.27cm (0.50 Inch), oo = 0.67 ys and (a/2c)i 0.28
z U1. 4
4r 0 2 T REMARKS- Z "Z 0 - I
- E F- S -- Ez 0 < 0 03 >
0Z u U z -IE -E LL u LL L-zL i0.467 1.753 46.8 49.3
407.5 (0.14) (0.690) 0.27 0.37 (42.6) (44.9)(59.1) 0.493 1.753 47.3 49.7 SPECIMEN PROOF TESTED;
(0.194) (0.690) 0.28 0.39 .0 (45.2) THEN CYCLED FOR 1533OA51- 1.275 20.32 0.493 1.753 LN2 34.1 35.8 CYCLES AND TEST(0.502) (8.00) 302. (0690) 0.28 0.39 (31.0) (32.) TERMINATED IMMED. PRIOR
S (43.8) 1.067 3.556 49.1 63.2 TO FAILURE; SPECIMEN(0.420) (1.400) 0.30 0.(44.7) 57.5) FAILED IN RT AIR.
27.5 1.067 3.556 45.3 58.2(40.1) (0420) (1400) 0.30 0.84 AR (41.) (53.
407. 0.380 1.478 0 .29 42.6 44.64.5 (0,148) (0582) .)0.25 0.29(6)
(59.1) 0.394 1.4 0.7831 43.0 45.1 SPECIMEN PROOF TESTED;
(0.155) (0.582) 0 1 (39 1) (41.0) THEN CYCLED FOR 2300OA5 1.280 20.32 0.394 1.478 0.27 0.31 LN2 31.0 32.4 CYCLES AND TEST
(0.504) (8.00) 302.0 (0.1) 0.(2.2) (24 TERMINATED IMMED. PRIOR(43.8) 1.029 3.556 48.8 62.4 TO FAILURE; SPECIMEN
(0.405) (1.400) (44.4) (0.U) FAILED IN RT AIR.277.2 1.029 3.556 0.2 0.8 AIR 45.2 57.7(40.2) (0.405) (1.400) (41.1) 52.5)
0.274 0.98 0.28 0.2 39.8 40.6453.0 (0.108) (0.385) 0.28 0.21(3> (65.7) 0.295 0.991 0.30 0.23 40.4 41.3 SPECIMEN PROOF TESTED;
(0.116) (0.390) (33.8 (37.6) THEN CYCLED FOR 5322OA1- .283 20.32 0.299 0 2 25.9 2. CYCLES AND TEST1.283 20.32 0 0.9 2
(0.505) (8.00) 302.0 (0.116) (0.390) 0.30 0.23 26 . TERMINATED IMMED. PRIOR> (43.8) 1.067 3.810 0.28 0.83 50.2 65.9 TO FAILURE; SPECIMEN
(0420) -(1.500) (46.7) (60.0) FAILED IN RT AIR.268.2 1.067 3.810 0.28 0.83 AIR 44.8 58.9(38.9) (0.420) (1,500) (4 .) (53.)
0.249 0.813 0.31 0.20 0 37.6.4 (.l) _ .3 0 (33.7) (34.2)
(66.2) 0.262 0.813 0.32 0.21 37.3 37.8 SPECIMEN PROOF TESTED:(0.103) (0,320)0.21 (33.9) (34.4) THEN CYCLED FOR 7513
OA1-8 1.273 20.32 0.262 0.813 LN 23.7 24.1 CYCLES AND TEST(0.501) (8.00) 0 0.21 TERMINATED IMMED. PRIOR302.0 _______ - - (21.6 21.9(43.8) 1.130 3.962 0.29 0.89 51.4 TO FAILURE; SPECIMEN
S(0,445) (1,560) (46.8) FAILED IN RT AIR.266. 1 1.130 3.962 0.29 0.89 AR 45.5(38.6) 0L (41.4) 1-- 1
SINITIAL CONDITIONS [ START OF CYCLIC TEST FAILURE
PROOF LOAD R TERMINATION OF CYCLIC TEST
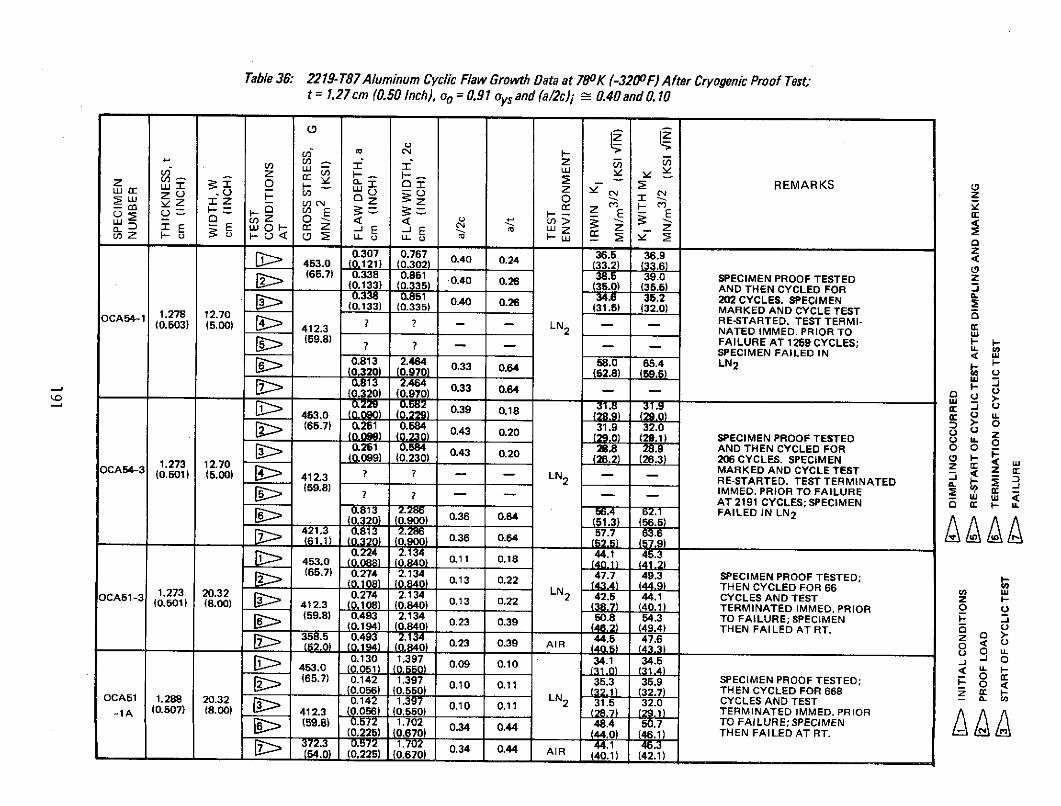
Table 36: 2219- T87 Aluminum Cyclic Flaw Growth Data at 780K (-3200F) After Cryogenic Proof Test;t = 1.27 cm (0.50 Inch), oo = 0.91 ys, and (a/2c)i - 0.40 and 0. 10
z W 0 3 2 REMARKSIz C F ,,,o - 0 e C' N
C/' C3 Z 0I
(65.7) 0338 081 38. 39.0 SPECIMEN PROOF TESTED0. 0.851 0.40 0.26 34.6 35.2 202 CYCLES. SPECIMEN
S(0133) (0.335) (31.5) (32.0) MARKED AND CYCLE TEST_CA54- 1.27 1.
CA41(0,503) (5.00) 412.3 ? ? LN 2 RE-STARTED. TEST TERMI-
(59.8) FAILURE AT 129 CYCLES; -
SPECIMEN FAILED IN LL
0.307 0.767 4 58.0 65.4 LN 2 .-1 453.0 3121) (03 0.2) 52.8) (59.5)
(0.13 ) .464 0.33 0.64 -- "
0. 0.b2 039 0.831.8 31 . .
(65.7) 0.9338) 0.85120) (38.0) (29.1) SPECIMEN PROOF TESTED u.0.21 0.33584 0.43 0.20 2(35.0) (35.59 AND THEN CYCLED FOR1273 12.70 (0099) (0.851230) (26.2) (26.3)2 206 CYCLES. SPECIMEN C "
(0.133OCA54-3 (0.501) (0.335) (.00 (31.5) (32.0) MARKED AND CYCLE TESTCA54-1 1.278 12.70 RE-STARTED. TEST TERMI-(59.8)(0.503) (5.00) 412.3 2 NATED IMMED. PRIOR TO FAILURE
59.8 A 2191 CYCLES; SPECIMEN AT12CYCLES;0.813 2.286 56.4 62.1 FASPECIMEN FAILED IN N2
0.813 2.286 57.7 65.4 N7 (61.1) (0.320) (0900) 0.33 0.64 (52.) (,27,9
0.224 2 .134 44. 45.3453.0 (0,088) (040) 0.11 0.18 00.251 084 31.9 32.0 )) Q(65.7) 0.0.43 0.20 47.7 (29.1 SPECIMEN PROOF TESTED;
0.251 0.584 26.8 44.AND THEN CYCLED FOR 660.274 (0.230) 0.3 020 26.2 (26.3206 CYCLES. SPECIMENST z4?MARKED AND CYCLE TEST ZZ 3
(0.501) (5.00) 412.3 (0108)LN 2 (040)RE-STARTED. TEST TERMINATED IMMED. PRIOR O
S (59.8) IMMED. PRIOR TO FAILURE; SPECIMENAT 2191 CYCLES; SPECIMEN B cr U.
(0) (0.40) 0.36 0.640. . 57.FAILED AT RT.63.6
(2.1) (0,392) (0,900) 0.36 0.6439 AIR (6.5) (.)
0.130 1.3224 97 0.09 0.10 34.1 34.5 .31 453.0 (0.051) (0.560) 0.11 0.18(31.4) I(65.7) 0.274 1.397 0.1 0.11 3547.7 49.3 5.9 SPECIMEN PROOF TESTED; 0
(0.056) 0.550) (32.1) (32.7) THEN CYCLED FOR 668 UOCA51 1.273 20.32 3 0. 142 1.397 N2 42.5 44.1 CYCLES AND TEST Z-(0.50) (8.00) 412.3 (0.108) (0.840) 0.13 0. 8.7) (40.1 TERMINATED IMMED. PRIOR 0
> (59.8) 0.493 2.134 50.8 54.3 TO FAILURE; SPECIMEN H(0.225) (0.6740) 0.2344.0) (46.1) THEN FAILED AT RT. O
372.3 0.493572 1.702 0.34 0.44 44.5 47.6 .354.0 (0.225194) (0.60) 0.23 (40.1)0.39 AIR (42.1)0.130 1.397 0.09 0.10 34.1 34.5 H 1
(65.7) 0.142 1.397 0 05 .- (0.056) 0.550) 03.3 32.9P THEN CYCLED FOR 668 cOCA51 1.288 20.32 0.14 LN2 1E 32.7N D C E FO 6
0.10 0.11 31.5 32.0 C0.507) (8.00) 412.3 (0.056) (0.550) . TERMINATED IMMED. PRIOR
.7T(59.8) (-572 1.702 .44 48.4 50.7 TO FAILURE; SPECIMEN(0.225) (0.670) 0 (.0 (46.1) THEN FAILED AT RT.
r 372U3 1 1(1.702 0.34 0.44 AIR 40.1 (42.1)(54.__ (0.225) (0.670) 1___ ___ (40.1)_ (21 _ _ ___________________

Table 37: 2219- T87 Aluminum Cyclic Flaw Growth Data at 780K (-3200F) After Cryogenic Proof Test;t = 0.38 cm (0. 15 Inch), oo = 0.67 oys and (a/2c)i - 0.37
C 0 O I 2 REMARKSZH 0 0se z Ia UN Z H- - - EL cn E 3 = -E = E E- - - - -- - - - E _ - - - --- - -
0.300 0.787 32.9 37.11 407.5 (0.118) (0.310) 0.38 0.76 (29.9) (33SPECIMEN PROOF TESTED;(59.1) 0.310 0.813 33.3 38.2 THEN CYCLED FOR 1050(0.122) (0.320) 0.38 0.79 THEN CYCLED FOR 1050
0.394 8.89 (0.3 0 0.813 LN2 30.3) (34.8) CYCLES TO BREAKTHROUGH.A14-3 .1 0.813 2 24.2 27.7 CYCLING CONTINUED FOR(0.155) (3.50) 302.0 (0.122) (0.320) 0.38 0.79 (22.0) (25.2) TOTAL OF 1450 CYCLES.(43.8) 1.1 8. TOTALSPECIMEN FAILED IN
a= t (0.465) 0.33 1.00 (26.2) -FAILED IN39RT AIR.
S337.90) a t - - 1.00 AIR - -
0.246 0.660 0.62 30.0 32.4407.5 (0,097) (0.260) (27.3)0.37 0.622
[(> (59.1) 0.249 0.66530.1(59.1) 0.098) (0.262) 0.37 0.63 SPECIMEN PROOF TESTED;__0_8 (0.262 0.3(27.4) (29.7) THEN CYCLED FOR
A14-7 0.396 8.89 0.249 0.665 LN TE C L(0.15OA14-7 6) (3.50) 302.0 (008 (0.22) 0.37 0.63 2 80 CYCLES TO PECIMEN(022(43.8) 1.130 2 BREAKTHROUGH; SPECIMEN
a = t (0.445) 0.35 1.00 (25.7) - FAILED IN RT AIR.
48.3)33 a = t (0.445) 0.35 1.00 AIR (29.0)
0.198 UB .3 0.5 630.3 32.2453.0 (0,078) (0.210) 0.37 0.56(27.6) (293)(65.7) 0.236 0.260 0.36 0.66 33.6 37.5 SPECIMEN PROOF TESTED;
40) (3 0.036 03. (30.6) 34.1) THEN CYCLED FOR 1720OA14-8 0.356 8.89 0.236 . LN2 21.7 24.1(0140) (3.50) 302.0 (0093) 0.60) 0,36 0.66 CYCLES TO BREAK-
_(19.7) 9 THROUGH; SPECIMEN(43.8) a t 0.420) 0.33 1.00 27.4 - FAILED IN RT AIR.410.3 1.067 38.5
(59) t (0420) 0.33 1.00 AIR 35.0 -
0.229 0.622 31.0 33.3431.6 (0.090) (0.245) 0.37 0.59 (2. (30.3(62.6) 0.241 0.63.62 31.4 33.7 SPECIMEN PROOF TESTED
0.095) 0.250) (28.6) (30.7) AND THEN CYCLED FOR0.389 8.89 1 0.635 21.3 23.0 1300 CYCLES. SPECIMENOA14-4 0.389 8.89 (0.095) (0.250) 0.38 0.62 LN 2 19.4) (20.9) MARKED AND CYCLE TEST
(0.153) (3.50) 302.0 . RE-STATED. TEST TERMINATED(43.8) 27.4 AT BREAKTHROUGH; SPECIMEN
a 1.041 0.36 1.00 27.4 FAILED IN RT AIR.
343.4 1.041 31.8(49.8) a t (0.410) 0.36 1.00 AIR (28.9)
INITIAL CONDITIONS F START OF CYCLIC TEST R TERMINATION OF CYCLIC TEST
PROOF LOAD CYCLIC TEST INTERRUPTION FAILURE[ PROOF LOAD
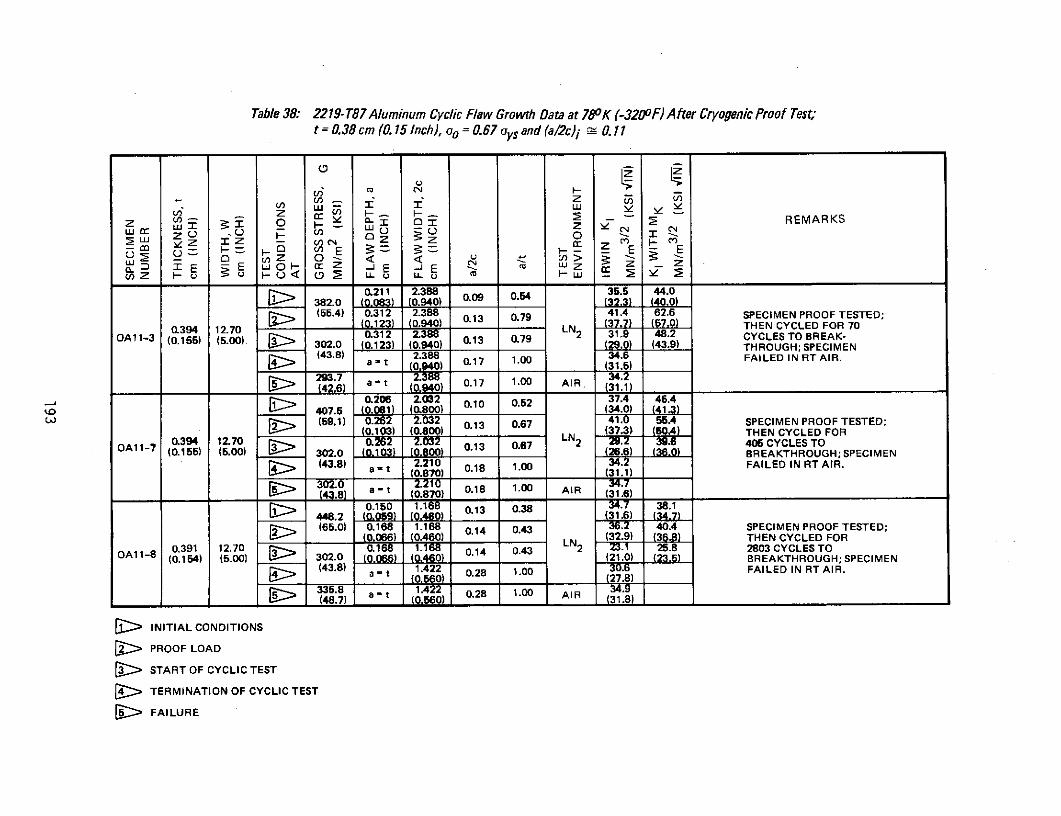
Table 38: 2219- T87 Aluminum Cyclic Flaw Growth Data at 780K (-3200F) After Cryogenic Proof Test;t = 0.38 cm (0. 15 Inch), oo = 0.67 oys and (a/2c)i 0~ . 11
En z
IC gI O - REMARKSzE zo 0 L L J o I0
Lu Z 3 z CN z E
o. E u i±J- z -E -J E - c c..ZU aZ -u (D u_ _ LL L) m _
0.211 2.388 0.54 35.6 44.0382.0 (0.083) (0.940) 0.09(32.3) (400)(55.4) 0.312 2.388 0.13 0.79 41.4 62.6 SPECIMEN PROOF TESTED;
0.394 12.70 (0123) 0.940) N 0.13(37.7) (57.0) THEN CYCLED FOR 70OA11-3 (0.155 (.00) 0.312 2.3 0.13 0.79 LN 2 31.9 48.2 CYCLES TO BREAK-
302.0 (0.123) (0.940) 0.13 0.79 29.0) (43.9) THROUGH; SPECIMEN(43.8) 2.388 1.00 34.6 FAILED IN RT AIR.
2(426) a t 0940) 0.17 1.00 AIR .
0.206 2.032 0.10 0.52 37.4 45.4407.5 (0,081) (0.800) (34.0) (41.3)(59.1) 0.262 2.032 0.13 0.67 41.0 55.4 SPECIMEN PROOF TESTED;
0.103) (0.800) LN (37.3 (50A) THEN CYCLED FOR
0.394 12.70 0.262 2.032 0.13 0.67 LN2 . 406 CYCLES TOOA11-7 (0.155) (5.00) 302.0 (0.103 (0800) (26.6) BREAKTHROUGH; SPECIMEN
(43.8) = t 2.210 1.00 FAILED IN RT AIR.
a - t 0.18 1.00
(0.870) 0(31.1)302.0 2.210 34.74-.8- a t (0.870) 0.18 1.00 AIR (31.6)
0.150 1.168 0.13 0.38 .7 38.1448.2 (0.09) (0.460) (31.6) (347)(65.0) 0.168 1.168 0.14 0.43 36.2 40.4 SPECIMEN PROOF TESTED;
(0.066) (0.460) (32.9) 3 THEN CYCLED FOR0.391 12.70 0.168 1.18 0.14 0.43 2 25.8 2803 CYCLES TO
OA11-8 (0.154) (5.00) 302.0 (0.066) (0.460) (21.0) (23.5) BREAKTHROUGH; SPECIMEN(43.8) a - t 422 0.28 1.00 30. FAILED IN RT AIR.
a = t 56 0.28 1.00 27.8)335.8 1.42 0.28 1.00 AIR 34.9(48.7) = (0.560) (31.8)
> INITIAL CONDITIONS
R PROOF LOAD
> START OF CYCLIC TEST
R TERMINATION OF CYCLIC TEST
R FAILURE
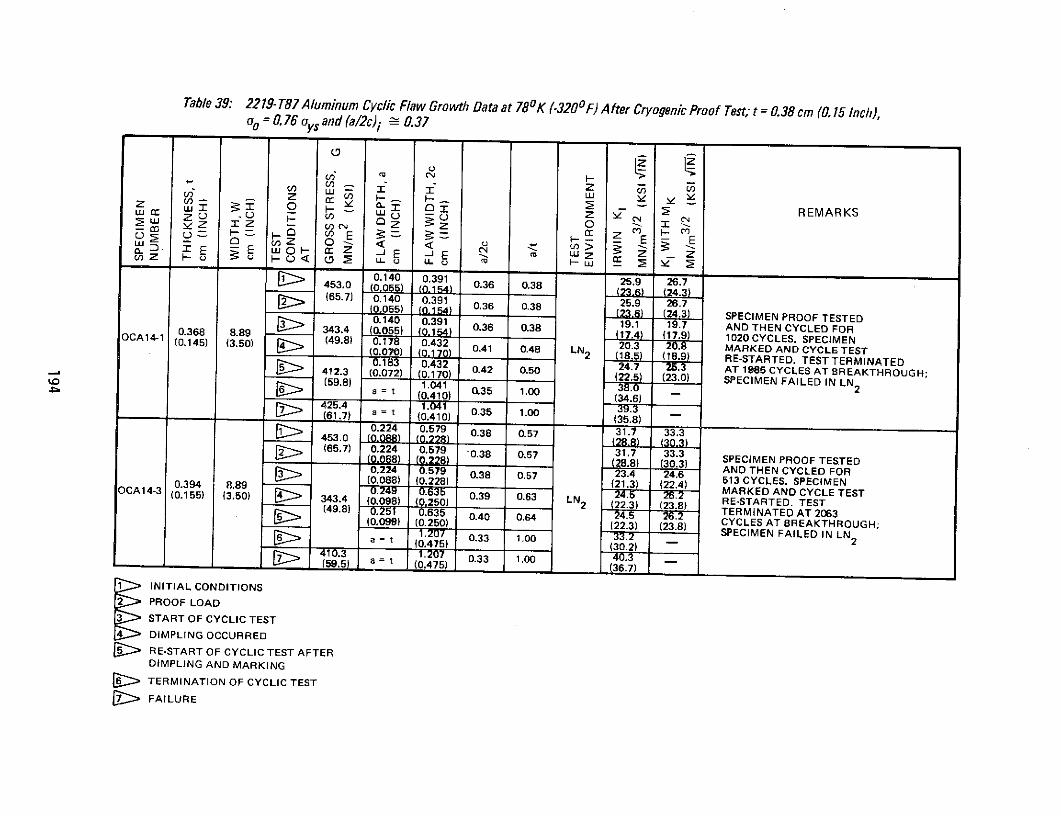
Table 39: 2219-T87A/uminum Cyclic Flaw Growth Data at 780 K (-3200F) After Cryogenic Proof Test; t = 0.38 cm (0.15 Inch),oo =0.76 ays and a/2c)i - 0.37
V) .u .z I
uZ 0 . - REMARKSu 140 03 v5. N
4w 0 ( Z ) 0 0- Z E -: =... cc c m
U)Z I- - LL m . W -
453.0 0.140 0.36 0.38 25.9 26.7055(23.6) (24.3(65.7) 0.140 0.391 25.9 26.7(0.055) 154) 0.36 0.38 24.3 SPECIMEN PROOF TESTED0.368 0.140 0.391 19.1 19.7 AND THEN CYCLED FOR0.368 8.89 343.4 (0.055) (014) 0.36 0.38 (17.4 (17.9) 1020 CYCLES. SPECIMENOCA14-1 (0.145) (3.50) (49.8) 0.178 0.432 20.3 20.8 MARKED AND CYCLE TEST
- 0.070) (0.170) 0 LN2 (18.5 (18.9) RE-STARTED. TEST TERMINATEDS412.3 (0.072) ( 0.50170) 0.42 4.70.50 AT 1985 CYCLES AT BREAKTHROUGH;0 0. 0(22.5) (23.0) SPECIMEN FAILED IN LN 2a = t (0.41 0.35 1.00 (34.6)(0.410) (34.6)425.4 1.041 39.3
(61.7) a = t (0.410) 0.35 1.00(35.8)
453.0 .224 0.579 0.38 0.57 31.7 33.3[ (65.7) 0.224 0.579 0.38 0.57 31.7 33.3 SPECIMEN PROOF TESTED
(0088) (0.22) (30.37 SPECIMEN PROOF TESTED0.224 0.579 0.38 0.57 23.4 24.6 AND THEN CYCLED FOR0.394 8.89 (0.088) (0.228) (21.3) (22.4) 513 CYCLES. SPECIMENOCA14-3 0. . 0.249 0.635 0.39 0.63 24.5 26.2 MARKED AND CYCLE TESTOCA14-3 (0.155) (3.50) 343.4 0.098) (0.250) LN 2 (22.3) (23.8) RE-STARTED. TEST
(49.8) 0.251 0.635 0.40 0.64 24. TERMINATED AT 2063(0.099) (0.250) (22.3) (23.8) CYCLES AT BREAKTHROUGH;
0.33 1.00SPECIMEN FAILED IN LN2a = t (0.45) 0.33 1.00(32410.3 (.307.2) 1.004( 59.5) a = (0.475) 0.33 1.00 (36.7)
1 INITIAL CONDITIONS
PROOF LOAD
START OF CYCLIC TESTDIMPLING OCCURRED
[ RE-START OF CYCLIC TEST AFTERDIMPLING AND MARKING
> TERMINATION OF CYCLIC TEST
C> FAILURE
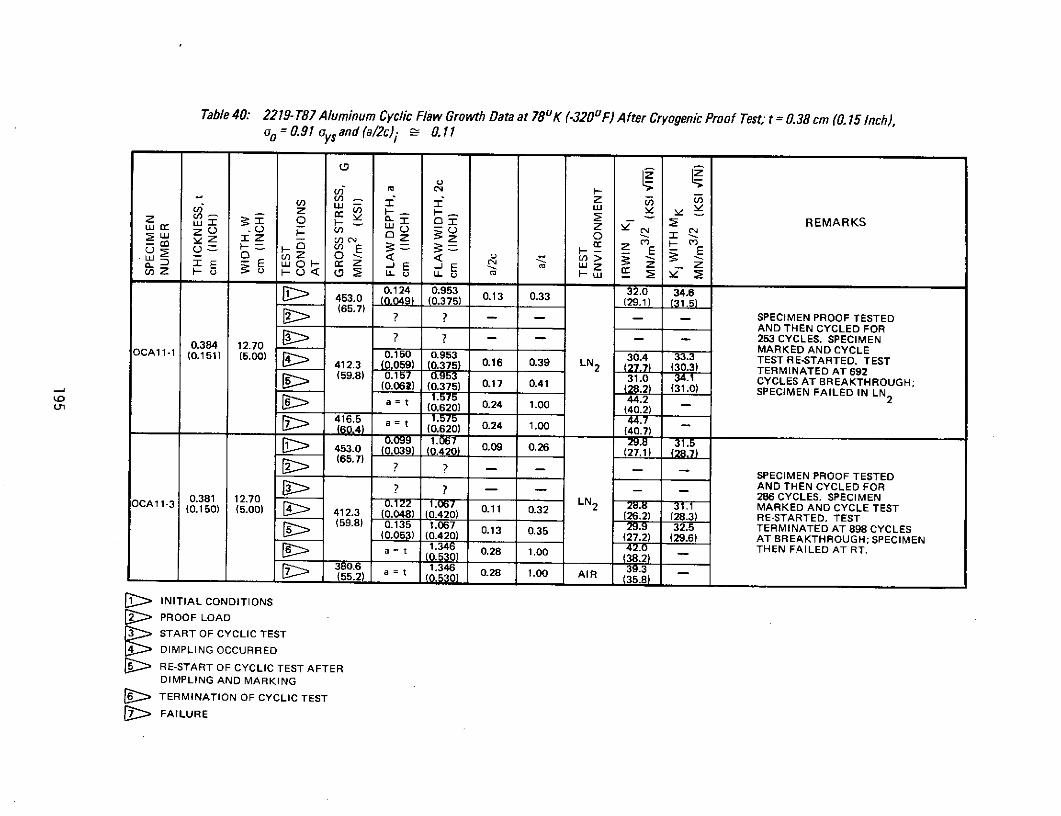
Table 40: 2219-T87 Aluminum Cyclic Flaw Growth Data at 78u K (-3200F) After Cryogenic Proof Test; t = 0.38 cm (0.15 Inch),oo =0.91 oysand(a/2 c)i ~ 0.11
Z J u) E5
SLU12j Ic W - 4 C REMARKS-m z - C C Z
OC ()z E Z E E
------------ - - LL LL u M -- - - -.12 5 0 0.953 32.0 34.6
(65.7) ? ? . SPECIMEN PROOF TESTEDAND THEN CYCLED FOR
0.384 12.70 ? ? . . 253 CYCLES. SPECIMENMARKED AND CYCLEOCA11-1 (0.151) (5.00) 0.150 0.953 30.4 33.3 TEST RE-STARTED. TEST412.3 (0.059) (0.375) 0.16 0.39 LN 2 (277) (30.3) TERMINATED AT692(59.8) 0.157 0.95 31.0 34.1 CYCLES AT BREAKTHROUGH;
(0.06) (0.375) 0.17 0.41 28.2) (31.0) SPECIMEN FAILED IN LN2a = t 1.575 0.2 44.2Lc (0.620) 0.24 1.00 (40.2)416.5 a =t .5 0.27 1.00 4(60.4) (0.620) 0.24 1.00 (40.7)
453.0 (0.039) (0.420) 0.09 0.26 (27.1) (28.7)(65.7) ( .1)
(65.7) SPECIMEN PROOF TESTED
? ? . IAND THEN CYCLED FOR0.381 12.70 10 LN 286 CYCLES. SPECIMEN
A (0.150) (5.00) 412.3 048) (0.420) 0.11 0.32 2 MARKED AND CYCLE TESTS(26.2) (28.3) RE-STARTED. TEST(59.8) 0.135 1.067 0.13 0.35 .9 32.5 TERMINATED AT 898 CYCLES(0.05) (0.420) (27.2) (29.6) AT BREAKTHROUGH; SPECIMEN1.346 2 THEN FAILED AT RT.a = t 0.28 1.00
380.6 a = t 0.28 1.00 AIR 39.3
> INITIAL CONDITIONS
> PROOF LOAD
1 START OF CYCLIC TEST4 DIMPLING OCCURRED
> RE-START OF CYCLIC TEST AFTERDIMPLING AND MARKING
r TERMINATION OF CYCLIC TEST
> FAILURE
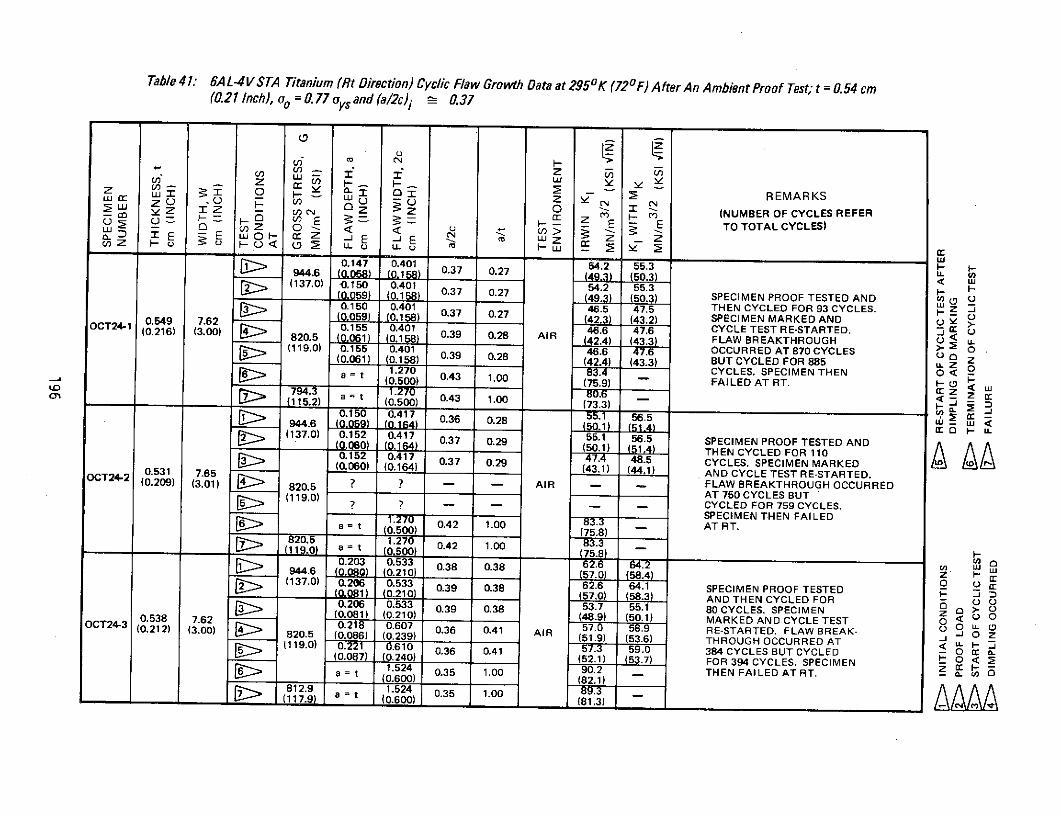
Table 41: 6AL-4V STA Titanium (Rt Direction) Cyclic Flaw Growth Data at 2950 K (720 F) After An Ambient Proof Test; t = 0.54 cm(0.21 Inch), aoo = 0.77 oys and (a/2c)i _ 0.37
,- 0 , REMARKS0 Z 0-- H E z 1 z z" (NUMBER OF CYCLES REFER
Gy E - Z o E c, L E E TO TOTAL CYCLES)E EZ o xz -J E -E Z z z
-, ---- --- --
0.147 0.401 54.2 55.3 H944.6 (0.058) (0.158) 0.37 0.27 (49.3) (50.3) U.(137.0) -0.150 0.401 54.2 55.3 -(0,059) (0.158) 0.37 0.27 (49.3) (50.3) SPECIMEN PROOF TESTED AND c0.150 0.401 46.5 47.5 THEN CYCLED FOR 93 CYCLES. I. j0.549 762 (0.059) (0.158) .37 0.27 42.3 (43.2) SPECIMEN MARKED AND
CT241 0.59 7.62 0.155 0.401 46.6 47.6 CYCLE TEST RE-STARTED. a(0.216) (3.00) 820.5 (0.061) (0.158) 0.39 0.28 AIR 42.4) (43.3) FLAW BREAKTHROUGH < u_(119.0) 0.155 0.401 46.6 47.6 OCCURRED AT 870 CYCLES 0
(0.061) (0.158) (42.4) (43.3) BUT CYCLED FOR 885 0u Z= t 1.270 0.43 83.4 CYCLES. SPECIMEN THEN 0 < O(0.500) 1.00 (75.9) FAILED AT RT. i- ('.0 794.3 1.270 80 .6 < Z cr=t 0.43 1.00 -S(115.2) t (0.500) (73.3)
0.150 0.417 0.36 0.28 55.1 56.5 <944.6 (0.059) (0.164) 00.1) (51.4,o, u(137.0) 0.152 0.417 0.37 0.29 55.1 56.5 SPECIMEN PROOF TESTED AND(0.060) (0.164) (50.1) (51,4) THEN CYCLED FOR 110
0.152 0.417 0.37 0.29 48.5 CYCLES. SPECIMEN MARKED(0.00) (0.164) (43.1) (44.1) AND CYCLE TEST RE-STARTED.
OCT24-2 (0.209) (3.01) 820.5 ? ? - - AIR - - FLAW BREAKTHROUGH OCCURRED(119.0) AT 750 CYCLES BUT(119.0 ? ? - - - - CYCLED FOR 759 CYCLES.
1.27 8SPECIMEN THEN FAILEDa t (0.500) 0.42 1.00 (75.8) - AT RT.
82.5 1.270 83.3(
119.0) a = t 0.500 0.42 1.000.203 0.533 6038 022. 6 .
944.6 (0.080) (0.210) 57.00.38 0.3858.4(137.0) 0.206 0.533 62.6 64.1 2O 2 n(137.0) 0. 0.39 0.38 SPECIMEN PROOF TESTED 0 D
1.j 0.210 (57.0) (58.3) AND THEN CYCLED FOR0.206 0.533 0.39 0.38 53.7 55.1 80CYCLES. SPECIMEN Z > )(0.081) (0.210) (48.9) (50.1) MARKED AND CYCLE TEST 0 ..J O 0CT24 0.53 762 0.218 0.607 0.36 0.41 AIR 57.0 58.9 RE-STARTED. FLAW BREAK- _ ZOCT24-3 (0.212) (3.00) 820.551.9 (0.086) (0.239) (53.6) THROUGH OCCURRED AT
(119.0) 0.221 0.610 0.36 0.41 57.3 59.0 384 CYCLES BUT CYCLED O(0.087) (0.240) (52.1) (53.7) FOR 394 CYCLES. SPECIMEN <
a t 0.35 1.00 90.2 THEN FAILED AT RT. -9 a =t 524 0.35 1.00 89.3(117.9) a = t 0.600) (81.3)
0.39~L_ 0.L_62.6L4.1L
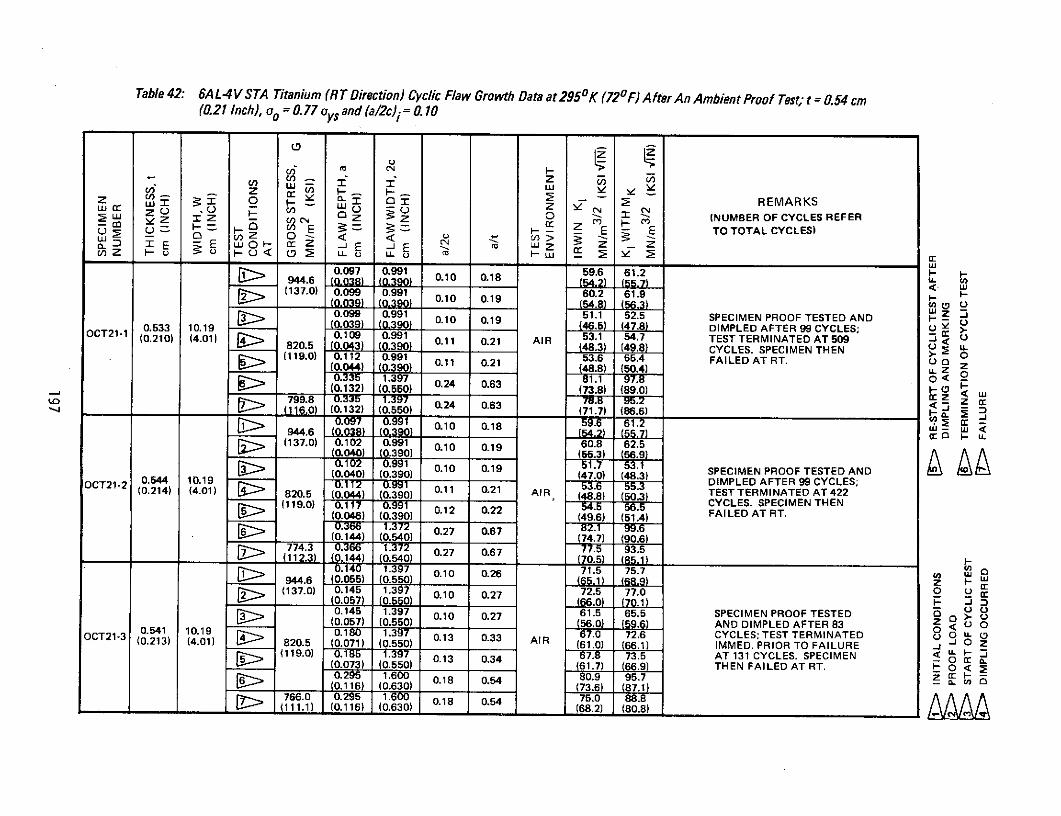
Table 42: 6AL-4V STA Titanium (RT Direction) Cyclic Flaw Growth Data at 295oK (720F) After An Ambient Proof Test; t = 0.54 cm(0.21 Inch), oo = 0.77 oys and (a/2 c)i = 0. 10
E E O a--E Ez
z 0 (137.0) 0.099 0.991 60.2 61.9 . -
(0.039) (0.390) U (54.8) (56.3)
S . (0.039) ( .390) (NUMBER OF CYCLES REFER
OC 00 (.1 (.. 0 . Y E E TO TOTAL CYCLES)(119.0) FAILED AT RT.
0.097 0.991 0.10 0.18 59.6 61.2
944.6 (0038) (0.3 0.90) 020.18 U. U ,
(137.0) o.o9 o0.991 0.10 0.19 60.2 61.9(0.0L (0.390) (5.8I) (56.)0.099 0991 051.1 52.5 SPECIMEN PROOF TESTED AND I0.10 0.19 1o -
0.533 10.19 0.039) (0390) (4.5 47.8 DIMPLED AFTER 99 CYCLES; U cOCT211 (4.01) 820.5 (0.04) (0.390) .91 0.21 AIR . 54.7 TEST TERMINATED AT 509
_W0. 1 0 (2 . 48.3) . CYCLES. SPECIMEN THEN0(119.0) 0.112 0.991 53.6 55.4) FAILED AT RT.(0.044) (0.390) 0.1 0.(48.8) (50.4) U o
74 (0.132) 0. 0.24 0.63 1. 3.(0. ) (0.550) (73.8) (89.0) 0 S< w04 101 0 799.8 0.33 39 .U 5.7- <CYLS
(116.0) (0.132) (0.550) 0.24 0.63 (71.7) (86.6) CT TE A-Z67 0.99 0.10 0.18 5 61.2 -
944.6 (0Q038 (39)o (. (- u.(137.0) 0.102 0.991 10 0.19 60.8 62.5 A
(0.040) (0.390) (66.) (56.9) 1E T0.102 1.397 0.10 0.19 11 5.6 SPECIMEN PROOF TESTED AND
0.544 1019 (0.040) (0.390) (47.0) (.) DIMPLED AFTER 99 CYCLES;(0.214) (4.01) 820.5 (0.044) (0.390) 1 0.21 AIR TEST TERMINATED AT 422
(119.0) 0.10 0.39 0.1 0..) 5.5) CYCLES. SPECIMEN THEN0.10(119.0).015.7u012 0.22 5(0.046) (0.390) (49.6) (51.4) FAILED AT IT.
0.295 1.60 0.27 0.67 2.1 99.6
(0.144) (0.540) (74.7) 90.6)(774.3 0 6 1.372 70.27 0.673.5112.3) (g_542) 0,27 0.67 (70.5) (7.1)-
0.100.10 019 71.5 75.7944.6 0055) 0.0 65.1 ( t -(137.0) 0.145 1.397 0.10 0.27 72.5 77.0 0(0.057) (0.550) (66.0) (70.1) . 1 5
0.145 1.397 0 0.27 61.5 65.5 SPECIMEN PROOF TESTED A U U67.0 0.16 07 ! O >- 0(0.057) (0.550) (56.0) 59.6 AND DIMPLED AFTER 83 0 <)
0.541 10.19 01 W 1397 13 67.0 72.6 CYCLES; TEST TERMINATED U 0 DOCT21-3 (0.213) (4.01) 820.5 (0.071) (0.550) 0.33 AIR (61.0) 66.1) IMMED. PRIOR TO FAILURE - 0 z> (119.0) 0.185 .97 013 0.34 67. 73.5 AT 131 CYCLES. SPECIMEN -0 '
C.(0.073) (0.550) ___ (61.7) 66.9) THEN FAILED AT RT. 0 < 20.295 1.600 018 0.54 80.9 95.7 z 0.c 0(0.116) (0.630) (73.6) (87.1)
S 766.0 0.295 1600 0.18 0.54 75.0 88.8-- 111.1) (0.116) (0.630) 1 (68.2) (80.8)
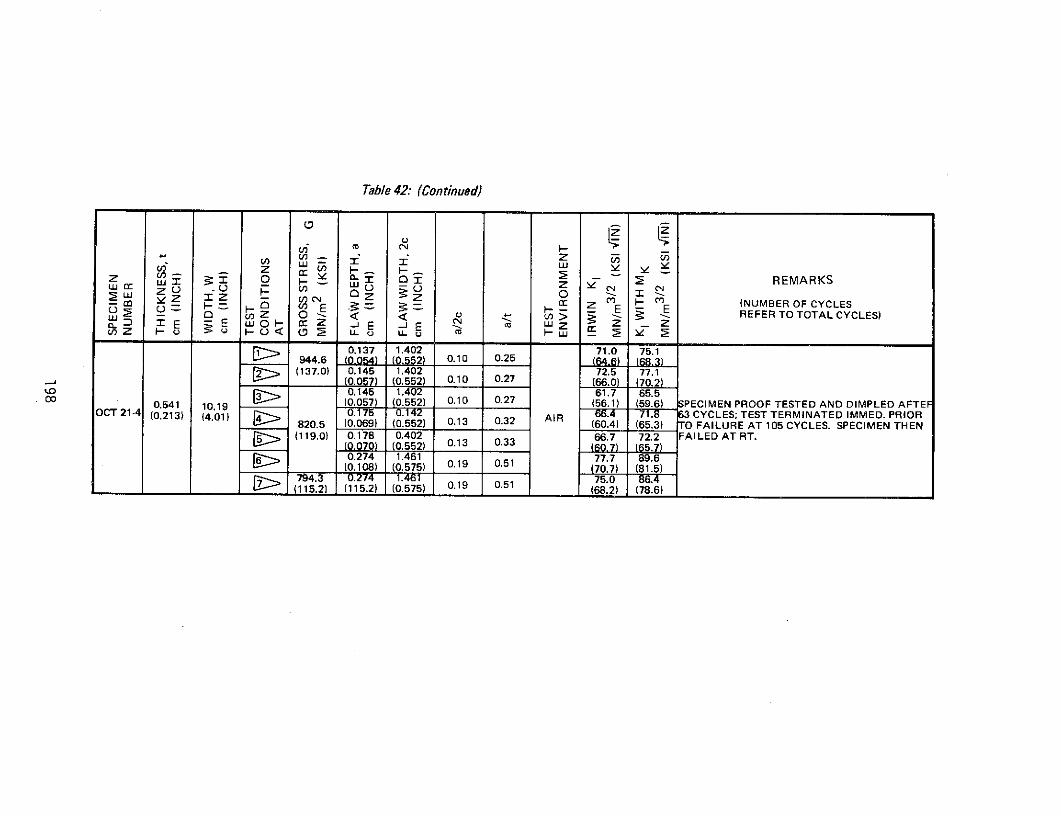
Table 42: (Continued)
Sw O z Z REMARKS
SZ z ~ (-NUMBER OF CYCLES- O ( > REFER TO TOTAL CYCLES)
CE wo H cz J E -J E Lu Z .rU)Z H-u F- L U.O LL m HUj
0.137 1.402 71.0 75.1944.6 (0.054) (0.552) 0.10 0.25 (64) (68.3)
2 (137.0) 0.145 1.402 72.5 77.1(0.057) (0.552) 0.10 0.27 (66.0) (70.2)0.145 1.402 61.7 65.50.541 10.19 (0.057) (0.552) 0.10 0.27 (56.1) (59.6) SPECIMEN PROOF TESTED AND DIMPLED AFTEF
OCT 21-4 (02113) (4.01) 0.175 0.142 AIR 66.4 71.8 63 CYCLES; TEST TERMINATED IMMED. PRIOR(4.01) 820.5 (0.069) (0.552) 0.13 0.32 (60.4) (65.3) TO FAILURE AT 105 CYCLES. SPECIMEN THEN
5 (119.0) 0.178 0.402 66.7 72.2 FAILED AT RT.(0.070) (0.552) 0.13 0.33 5.70.274 1.461 77.7 89.6
(0.108) (0.575) 0.19 0.51 (70.7) (81.5)794.3 0.274 1.461 75.0(115.2) (115.2) (0.575) 0.19 0.51 (68.2) (78.6)
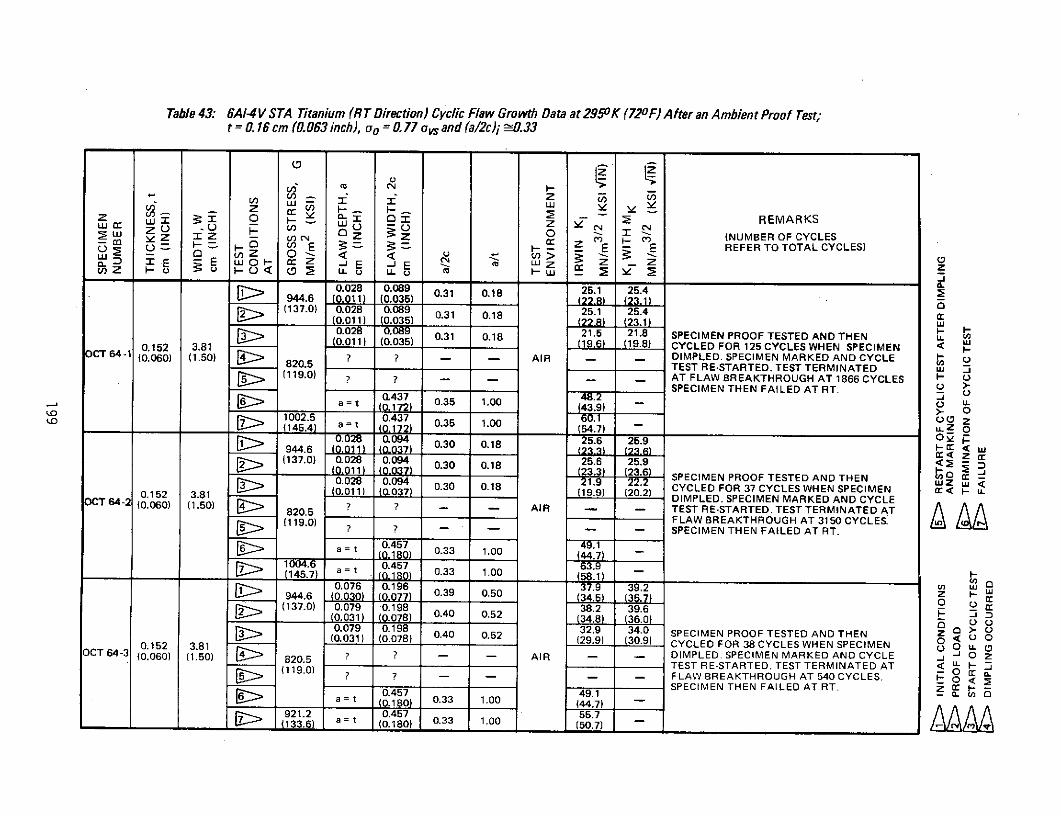
Table 43: 6A1-4V STA Titanium (RT Direction) Cyclic Flaw Growth Data at 2950K (72oF) After an Ambient Proof Test;t = 0.16cm (0.063 inch), ao = 0.77 ovs and (a/2c)i --.33
4z ) 8 0 0
1. 0.028 0.089 0.31 0.18 25.1 25.4
S(0.011) (0.035) REMARKS0.0 0.0 0.31 0.18 SP ECIMEN PROOF TESTED AND THEN
0(196) (19.8) CYCLED FOR 125 CYCLES WHEN SPECIMEN <
(119.0) AT FLAW BREFEROTO TOTAL CYCLES)
SPECIMEN THEN FAILED AT RT. L) >-
0.35 1 0.00 a M E E WL0 cZ _E -JE z c
11002. a 4 L 0.35 1.00 60O . Z (3
0.028 0.089 25.6 25.9 O 2944.6 (0.011) (0.035) 0.20.8 (23.1)-
(137.0) 0.028 0.089 0.30 0.18 25.1 25.49 c(0.011) (0.035) (22,B) (23.1)
0.00.31 0.18 21.5 21.8 SPECIMEN PROOF TESTED AND THEN uI0.01) (0.035) (19.9 2.2 < ,0.152 3.81 0.037) 0.30 0.18(19. ) CYCLED FOR 125 CYCLES WHEN SPECIMEN <OCT 64-1 (0.060) (1.50) 820.5 AIR DIMPLED. SPECIMEN MARKED AND CYCLE820.5 ? - - AIR - - TEST RE-STARTED. TEST TERMINATED AT
(119.0) AT FLAW BREAKTHROUGH AT 1866 CYCLES0.43 ? 3. - SPECIMEN THEN FAILED AT RT.0.437 4.
a=0t .1) 0.33 1.00 4. -01002.5 0.437 6. Z(145.4) a = t (0.172) 0.35 1.00 (54.7) - .Z
0.07630 0.18 25.6 25.9 I944.6 (0.030 (0077) 0.3 0.50 (34) 3.7) --
(137.0) 0.28 0. 0.30 0.18 25.6 25.9_ _ _ (0.011) (07) ( 230..0 0. 23 6)
9 018 09 05. SPECIMEN PROOF TESTED AND THEN0.152 3.81 (0.01) 037) 0.0 0. (19.9) (20.) CYCLED FOR 37 CYCLES WHEN SPECIMEN OO < .
OCT 64-3 (0.060) (1.50) 820.5 ? AIR - - DIMPLED. SPECIMEN MARKED AND CYCLECT64-2 (0.060) (1.50) 8205 AIR TEST RE-STARTED. TEST TERMINATED AT
(119.0) ? ? FLAW BREAKTHROUGH AT 3150 CYCLES. OA(1)7 SPECIMEN THEN FAILED AT RT.
a= t .1457 0.33 1.00 44.7 -
10.6 0.457 0.7
. a = t 0.33 1.00 6. 30.076 0.1963.9 .2 U) W
944.6 (0.030) (0.077) 0.39 0.50 34, 3.(137.0) 0.079 0.198 38.2 39.6 :)
(0.031) (0.078) 034.8 36.0 p 00.079 0.198 0.32.9 34.0 SPECIMEN PROOF TESTED AND THEN Z < U 0(0.031) (0.078) (29.9) (30.9) CYCLED FOR 38 CYCLES WHEN SPECIMEN U 0 UDOCT 64-3 0.152 381 820.5 ? - - AIR DIMPLED. SPECIMEN MARKED AND CYCLE - J Z
TEST RE-STARTED. TEST TERMINATED AT < u- -(119.0) ? ? - - FLAVI BREAKTHROUGH AT 540 CYCLES.SPECIMEN THEN FAILED AT RT.
a t (0.180) 0.33 1.00 (44.7)~ 921.2 0.457 55.7
133.6) a (0.180) 0.33 1.00 (50.7)A- --
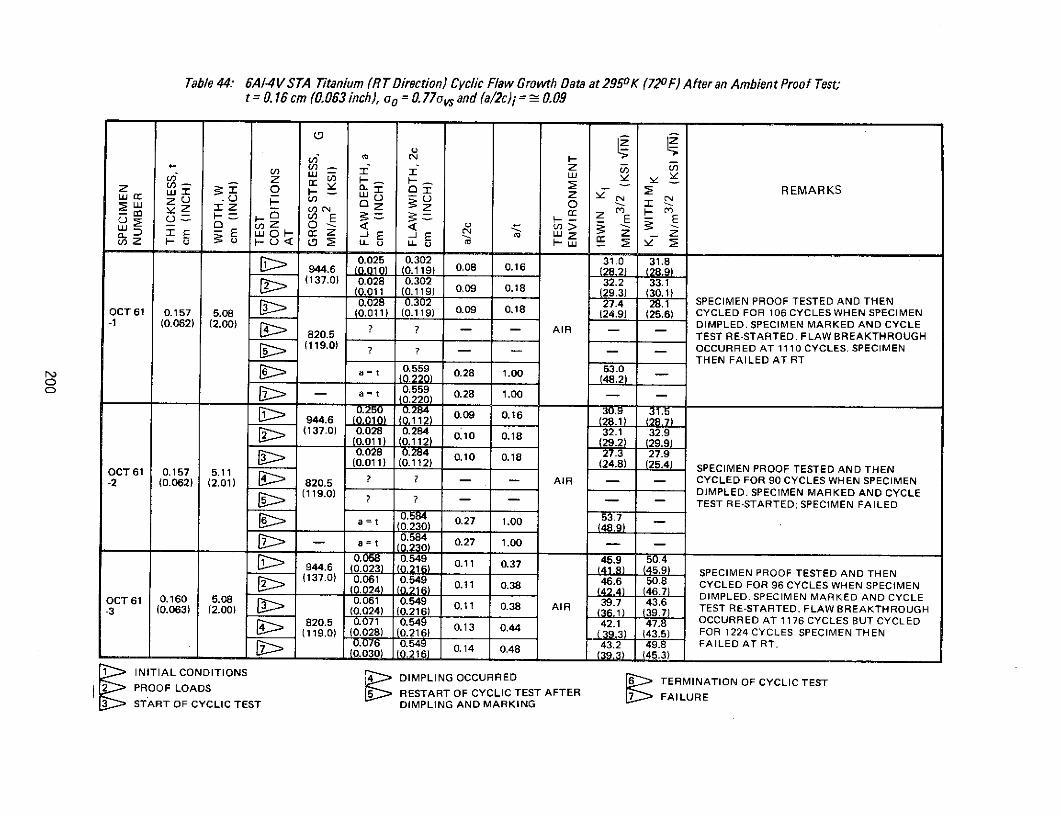
Table 44: 6A/4V STA Titanium (RT Direction) Cyclic Flaw Growth Data at 2950K (720F) After an Ambient Proof Test;t = 0. 16 cm (0.063 inch), oo = 0. 77vs and (a/2c)i = - 0.09
z l .
Z e 04 NF- 0 0<
r " O -2 u REMARKS
0.025 0.302 31.0 31.8944.6 (0.010) (0.119) 0.08 0.16 (28.2) (28.9)
(137.0) 0.028 0.302 32.2 33.1(0.011 (0.119) 0.09 0.18 (29.3) (30.1)
50.028 0.302 27.4 1 SPECIMEN PROOF TESTED AND THENOCT 61 0.157 5.08 (0.011) (0.119) 0.09 0.18 (24.9) (25.6) CYCLED FOR 106 CYCLES WHEN SPECIMEN
-1 (0.062) (2.00) 7 - - AIR - DIMPLED. SPECIMEN MARKED AND CYCLE820.5 "TEST RE-STARTED. FLAW BREAKTHROUGH
(119.0) ? - - OCCURRED AT 1110 CYCLES. SPECIMENTHEN FAILED AT RT.
a = t 0.559 0.28 1.00 53.00 (0.220) (48.2)
S- a = t 0.559 0.28 1.00 - -
0.250 0.284 0.09 0.16 30.9 31.944.6 (0010) (0.112) (28.1) (28.7)
[ (137.0) 0.028 0.284 0.10 0.18 32.1 32.9(0.011 (011 ( 12) ( 18 29.2) (29.9)0.028 0.284 0.10 0.18 27.3 27.9
OCT 61 0.157 5.11 (0.011) (0.112) (24.8) (25.4) SPECIMEN PROOF TESTED AND THEN-2 (0.062) (2.01) 820.5 ? ? - - AIR CYCLED FOR 90 CYCLES WHEN SPECIMEN
(119.0) DIMPLED. SPECIMEN MARKED AND CYCLES(119.0) ? ? - - TEST RE-STARTED; SPECIMEN FAILED
(0.230) 0.27 1.00 48.9
a 0.584 0.27 1.00
0.058 0.549 0.11 0.37 45.9 50.4944.6 (0.023) (0.216) (41.8) (45.9) SPECIMEN PROOF TESTED AND THEN(137.) 0.061 0.549 0.11 0.3846.6 50.8 CYCLED FOR 96 CYCLES WHEN SPECIMEN42._ ( 046.7) DIMPLED. SPECIMEN MARKED AND CYCLE
OCT61 0.160 5.08 0.061 0.549 39.7 43.6 DIMPLED.SPECIMENMARKEDANDCYCLE-3 (0.063) (2.00) (0.024) 0.216) 0.11 0.38 AIR .1 (39.7) TEST RE-STARTED. FLAW BREAKTHROUGH
820.5 0.071 0.549 13 0.44 42.1 47.8 OCCURRED AT 1176 CYCLES BUT CYCLED
(119.0) (0.028) (0.216) 0.13 0.44 (39.3) (43.5) FOR 1224 CYCLES. SPECIMEN THEN0.076 0.549 0.14 0.48 43.2 49. FAILED AT RT.
(0.030) (0.216) (393) (45.3)
INITIAL CONDITIONS 44 DIMPLING OCCURRED 6 TERMINATION OF CYCLIC TEST
PROOF LOADS RESTART OF CYCLIC TEST AFTER FAILURE
START OF CYCLIC TEST DIMPLING AND MARKING
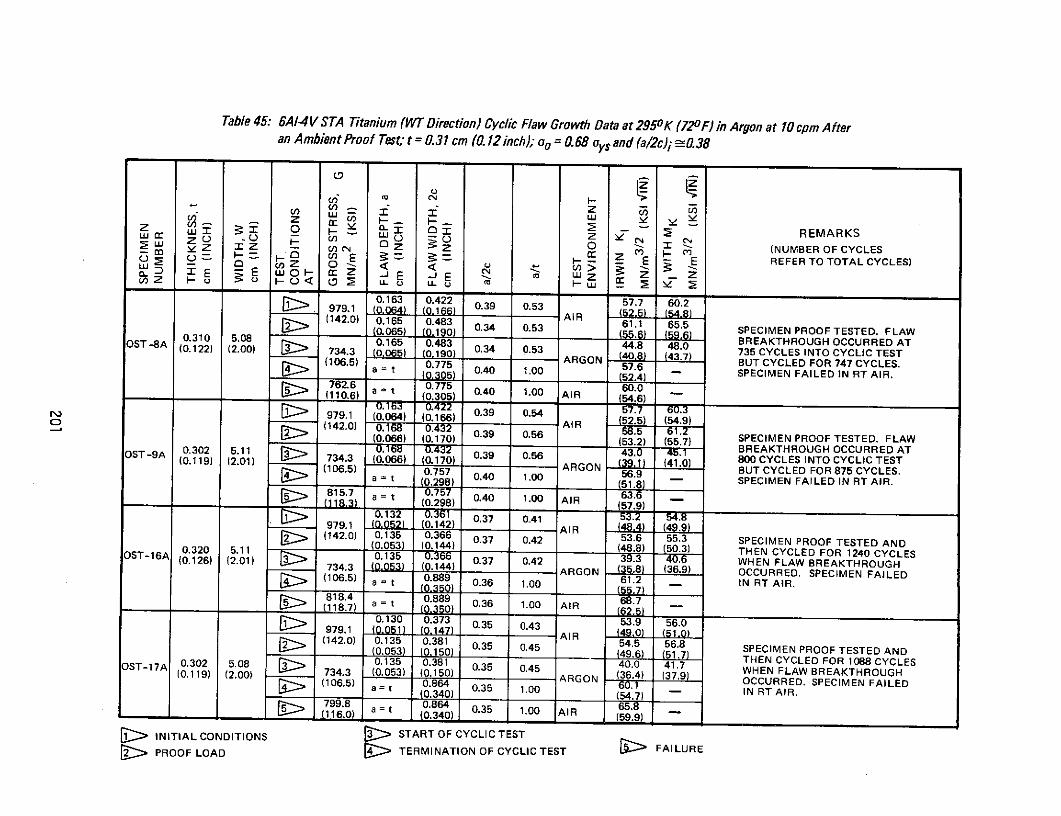
Table 45: 6A-4 V STA Titanium (WT Direction) Cyclic Flaw Growth Data at 2950K (720 F) in Argon at 10 cpm Afteran Ambient Proof Test; t = 0.31 cm (0.12 inch); oo = 0.68 oys and (a/2c)i -0.38
z 01 0 0.53 6 60 REMARKS
(12065 (59.3A RSPECIMEN PROOF TESTED. FLAW
(0.122) (2.00) 734.3 (NUMBER OF CYCLESS0 7 E O Z 5E BUT CYCLE REFER TO TOTAL CYCLES)
- . a = t (0, 05) 0.40 1.00 (52.4) SPECIMEN FAILED IN RT AIR.
(i2Z Ho ,t, ,U HO, m U-o LI r
0.163 0.422 39 053 57.7 60.2
979.1 (00) 0.39 0.54
(142.) 00.3 0.53 (5) (5.) SPECIMEN PROOF TESTED. FLAW0.310 5.08 0.165 0.4832 43.0 45.1 BREAKTHROUGH OCCURRED ATO A (0.1221 (2.01 9 734.3 0.066) 0.170) .56 ) (4.0) 735 CYCLES INTO CYCLIC TEST
(106.5) 0.757 ARGON 5.8 BUT CYCLED FOR 747 CYCLES.a t 0. 0.40 100 (51.8) - SPECIMEN FAILED IN RT AIR.762.6 0.775 60.0
(110.6) (0t 0.40 1.00 AIR (54
0.132 0.3 0. 53.2 54.8
S 979.1 (0.064) (0.166) 0.3AIR (48.4) (49.9C (142.0) 0 A IR52.5) (54.9)
00.20.37 0.42 53.2)6 55.37) SPECIMEN PROOF TESTED. FLAWTl (0.119) (2.01) 734.3 (0.066) (0.170) 0.3 0.56 BREAKTHROUGHOS-1AA 734.3 (() 3 0 041.0) 800 CYCLES INTO CYCLIC TEST(106.5) ARGON BUT CYCLED FOR 875 CYCLES.0.a = t 8 0.40 1.00 OCCURRED. SPECIMEN FAILED IN RT AIR.815.7 5. -
11.7) a = t (0.98) 0.40 1.00 AIR 63.6(7. 0.373 57.9) 56.
979.1 0. (0.14 0.37 0.413 AIR(142.0) 0.135 0.366 037 0.42 53.6 55.3 SPECIMEN PROOF TESTED AND(0.053) (0.144) 0. 0.5(48.8) (50.3) THEN CYCLED FOR 1240 CYCLES
OST-17A 0.302 5.0811 0.135 0.381 0.35 40.0 41.7 HEN L R
(0.126) (2.010) 7343 (005) 0.37 0.42 (3) (3.9) WHEN FLAW BREAKTHROUGH1734.3 .0.144) 10 ARGON 35.8 (36.9) OCCURRED. SPECIMEN FAILED(106.5) a = t 0.889 0.36 1.00 61.2 IN RT AIR.
a = t 0) 0.35 1.00 AIR -
i 818.4 0.889 0.36 68.7 _
(1 18 .7 ) a = _ _._ __) 1.0_0 A IR_(6 2_5 )0.130 0.373 0.35 0.43 53.9 56.0
979.1 (0,051) Z7 AIR 49.0 1INITIAL(142.0) 0.135 0.381 035 0.4554.5 56.8 SPECIMEN PROOF TESTED AND
PROOF LOA5.08 0. 40.0 41.7 THEN CYCLED FOR 1088 CYCLES0.2 58 00.153 0.10 5 0.45 WHEN FLAW BREAKTHROUGH(0.119) (2.00) 734.3 .053) (0.150) (36.4) (37.9) OCCURRED. SPECIMEN FAILED(106.5 a=t 0.864 035 1.00 - IN RT AIR.(0.340) _' (54.7)799.8 0.864 65.1160) (0.340- (59.9)
E>INITIAL CONDITIONS START OF CYCLIC TESTPROOF LOAD TERMINATION OF CYCLIC TEST FAILURE

Table 46: 6AI-4VSTA Titanium (WT Direction) Cyclic Flaw Growth Data at 295oK (720F) in Argon at 10 cpm Afteran Ambient Proof Test; t = 0.16 cm (0.063 inch), oo = 0.68 oy, and (a/2c)i = 0.10
W- c - w Z- .
0.079 0.795 0.10 0.50 55.7 66.3979.1 (0.031) (0,313) (50.7) (60.3)
(142.0) 0.094 0.795 1 AIR 59.6 76.40.037) (0.313 012 0.60 (542) (69.5) SPECIMEN PROOF TESTED. FLAW
ST6 0.157 5.11 0.094 0.795 43.1 55.2 BREAKTHROUGH OCCURRED AT-5 (0.062) (2.01) 734.3 (0.037) (0.313) 0.12 0.60 (39.2) (50.2) 302 CYCLES INTO CYCLIC TEST.0.05)6t019 0 ARGON 8SPECIMEN THEN FAILED IN RT AIR.
86 a (0.325 0.19 1.00 AIR 1.8
0.076 0.780 0.10 0.48 54.8 64.3
979.1 (0.030) (0.307) A R (49.9) (58.5)(142.0) 0.089 0.70 0.11 0.56 . 72.2. (0.035) (0.307) (52.9) (65.7) SPECIMEN PROOF TESTED. FLAW
-6 0 0.089 (6 ( 3u 0.11 0.56 42.0 52.2 BREAKTHROUGH OCCURRED AT734.3 (0,035) (0.307) ARGON (38.2) (47,5) 405 CYCLES INTO CYCLIC TEST.(106.5) = t 0.013 0.20 1.00 51.9 SPECIMEN THEN FAILED IN RT AIR.( . = (0.320) (47.2)
863.3 0.1 t 0.20 1.00 AIR LU
0.061 0. 0.10 0.3955.7 66.3979.1 (0.024) (0.245) AIR 44.6) 49.4
(142.0) 0.066 0.762 0.11 0.42 50.6 56.8(0.02637) ( ) (46.0) 51.7) SPECIMEN PROOF TESTED. FLAWST6 0.157 5.11 (0.066 0.622 0.11 0.42 43.1 55.2 BREAKTHROUGH OCCURRED AT-13 (0.062) (2.01) 734.3 (00) (0.245) ARGON (33.2) (3750.2) 651 CYCLES INTO CYCLIC TEST.
(106.5) a = t 0.686 0.23 1.00 49.7 SPECIMEN THEN FAILED IN RT AIR.
61. a = t 0.686 0.23 1.00 AIR 62.50.061 0.4 0.10 0.49.2 54.5
C979.1 (0.0304) (0.252) AIR (44.8) (49.)
(142.0) 0.064 0.640 50.0 55.6(0.025) (0.252) 0.10 0.40 (52.9) (50.6) SPECIMEN PROOF TESTED. FLAW
ST6 (0.157 5.11 0.064 0.40 36.0 40.1 BREAKTHROUGH OCCURRED AT-14 (0.06) (2.01) 734.3 (0.025) (0.30252) 0.1 0.40(32.8) (38.2) 6.5) 565 CYCLES INTO CYCLIC TEST.(106.5) . 0.2ARGON 51.0 SPECIMEN THEN FAILED IN RT AIR.
(1 . a = t (0.300) 0.21 1.00 (56.4)
1564 0.10 0.396.
(124.2) 00a = 0.300) 0.21 1.00 AIR 60.28
0.026)INITIAL CONDITIONS START OF CYCLICTEST PROOF TESTED. FLAWFAILURE
PROOF LOAD (13. TERMINATION OF CYCLIC TEST
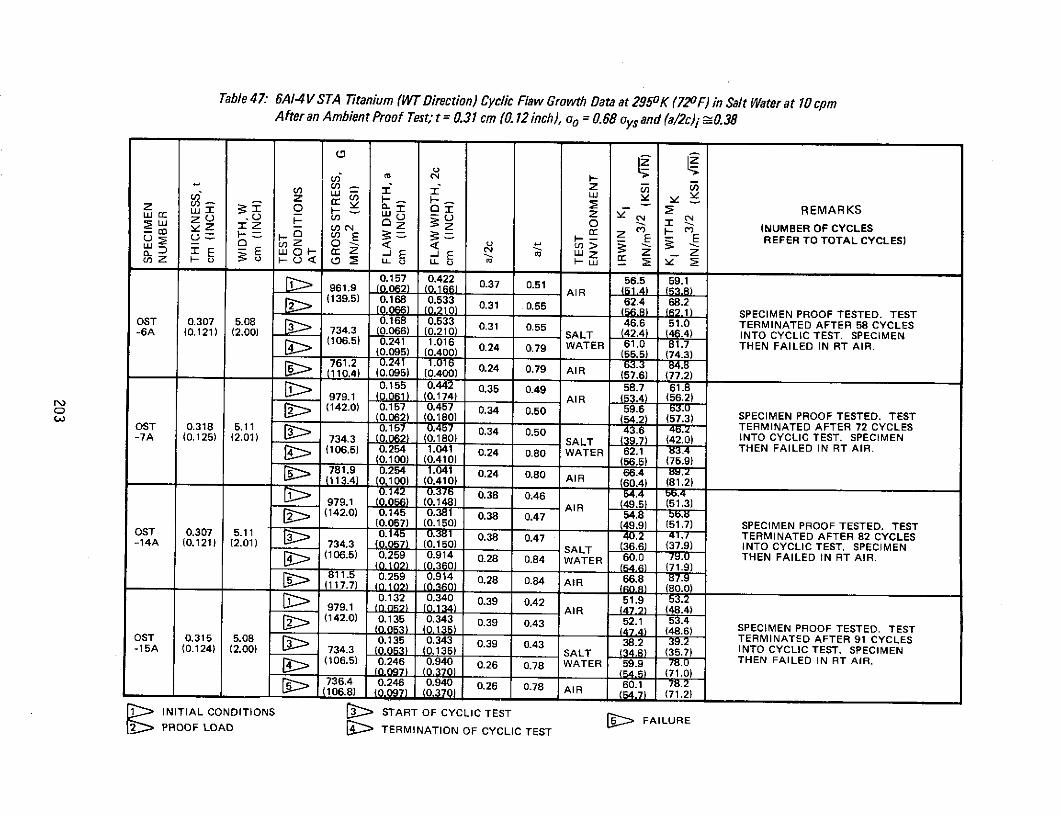
Table 47: 6A1-4V STA Titanium (WT Direction) Cyclic Flaw Growth Data at 2950K (720 F) in Salt Water at 10 cpmAfter an Ambient Proof Test; t = 0.31 cm (0.12 inch), oo = 0.68 ays and (a/2c)i -0.38
LU I
S U , - REMARKSIz -I z zi i --.-
- %Z IZ Un Z = Z 0 , % (NUMBER OF CYCLESSO E 3= = E E REFER TO TOTAL CYCLES)
CLE E wo0 cr z -E -JE LZ Z zZ-1---- - LL L---- -LU
0.157 0.422 37 051 56.5 59.1961.9 (0062) (0 0.37 0.51 AIR ) )(139.5) 0.168 0.533 031 62.4 68.2
(0(066) (0,210) 5 8) (6 21) SPECIMEN PROOF TESTED. TESTOST 0.307 5.08 0.168 0.533 0.31 0.55 46.6 51.0 TERMINATED AFTER 58 CYCLES-6A (0.121) (2.00) 734.3 (0.066) (0.210) SALT (42.4) (46.4) INTO CYCLIC TEST. SPECIMEN(106.5) 0.2415) 016 0.24 0.79 WATER 61.0 81.7 THEN FAILED IN RT AIR.(0.095) (0.400) (55.5) (74.3)
761.2 0.241 1016 063.3 M7.8(110.4) (0.095) (0.400) 0.24 0.79 AIR (57.6) (77.2)
0.155 0.442 0.35 0.49 58.7 61.8979.1 (0.061) (0.174) AIR (53.4) (56.2)(142.0) 0.157 0.457 0.34 0.50 59.6 3.1 0.062) (0.180) 054.2 (57.3) SPECIMEN PROOF TESTED. TEST
OST 0.318 5.11 - 0.157 0.457 0.34 0.50 43.6 4.2 TERMINATED AFTER 72 CYCLES-7A (0.125) (2.01) 734.3 (0.062) (0.180) SALT 39.7 (42.0) INTO CYCLIC TEST. SPECIMENr. 1(106.5) 0.254 1.041 0.24 0.80 WATER 62.1 THEN FAILED IN RT AIR.
(0.100) (0.410) (56.5) (75.9)[r- 781.9 0.254 1.041 0.24 0.80 66.4 8(.2
(113.4) 0.100) (0.410) AIR (60.4) (81.2)0.142 0.376 0.38 0.46 54.4 bb.4
979.1 (0.056) (0.148) AIR (49.5) (51.3)S(142.0) 0.145 0.381 0.38 0.47 54.8 bb.8
(0.057) (0.150) (49.9) (51.7) SPECIMEN PROOF TESTED. TESTOST 0.307 5.11 0.145 0.381 0.38 0.47 40.2 4 TERMINATED AFTER 82 CYCLES-14A (0.121) (2.01) 734.3 (0.057) (0.150) SALT (36.6) (37.9) INTO CYCLIC TEST. SPECIMEN(106.5) 0.259 0.914 0.28 0.84 WATER 60.0 19.0 THEN FAILED IN RT AIR.(0102) (0 360) (54.6) (71.9)811.5 0.259 0.914 0.28 0.84 AIR 66.8 87.9
_ _ (117.7) (0102) (036Q) ( (80.0)0.132 0.340 0.39 0.42 51.9 53.2
979.1 -(0052) (0.134) AIR (47.2) (48.4)(142.0) 0.135 0.343 0.39 0.43 52.1 53.4
(0053) (0.135) (474) (48.6) SPECIMEN PROOF TESTED. TESTOST 0.315 5.08 0.135 0.343 0.39 0.43 38.2 39.2 TERMINATED AFTER 91 CYCLES
-15A (0.124) (2.00) 734.3 (0.053) (0.135) SALT (34.8) (35.7) INTO CYCLIC TEST. SPECIMEN(106.5) 0.246 0.940 0.26 0.78 WATER 59.9 8.THEN FAILED IN RT AIR.
(0.097) (0.370) (54. 5) (71.0)736.4 0.246 0.940 0.26 0.78 AIR 60.1 8.2
(106.8) (0097) 0.370 AIR (547) (71.2)
INITIAL CONDITIONS START OF CYCLIC TEST2 PROOF LOAD TERMINATION OF CYCLIC TEST
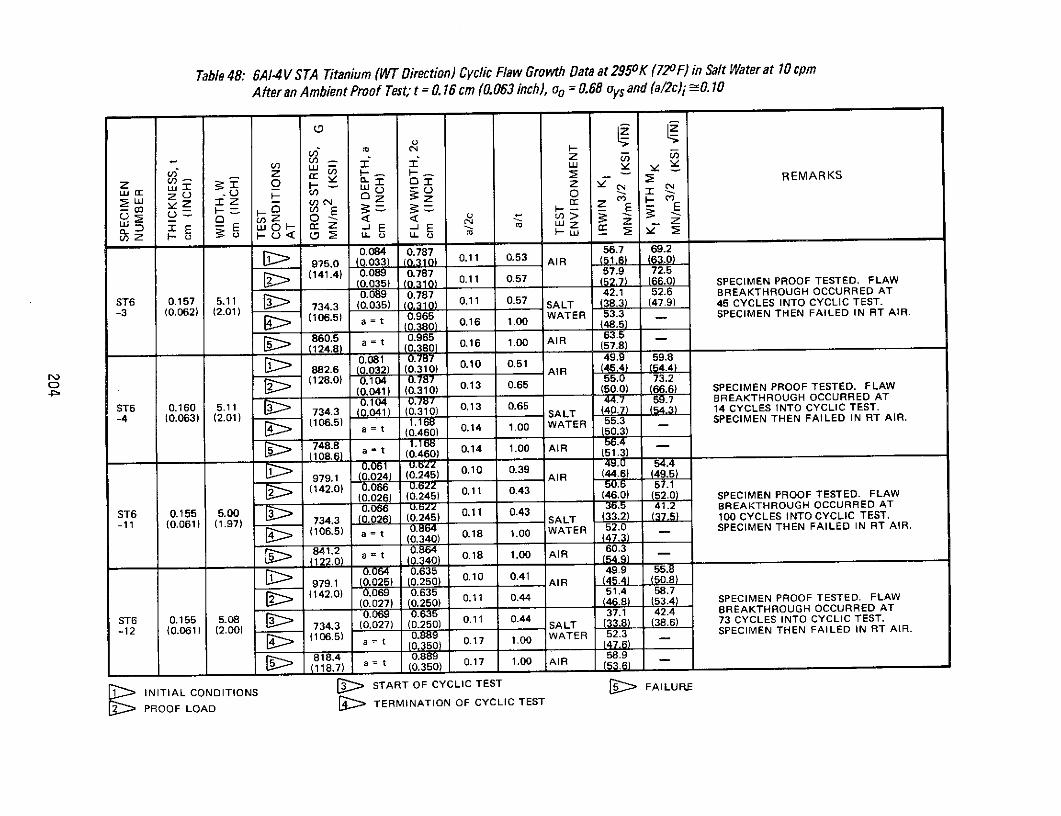
Table 48: 6A-4 V STA Titanium (WT Direction) Cyclic Flaw Growth Data at 2950K (720 F) in Salt Water at 10 cpm
After an Ambient Proof Test; t = 0.16 cm (0.063 inch), oo = 0.68 oys and (a/2c)i -0. 10
iz Ii je 0- x 2 REMARKS
00 NZ 3Z = =-.-(n Z 0 >- E
E 0 1--r Z -JE -jE c LU Z cr ZZ -u FO -0 < ) L Lu U Uu -
0.084 0.787 56.7 69.2975.0 (0.033) (0310 0.11 0.53 AIR (516) (63.0)
(141.4) 0.089 0.787 57.9 72.5(0.035) (0310) 0.11 0.57 (52.7) (66.0) SPECIMEN PROOF TESTED. FLAW
ST6 0.157 5.11 0.089 0.787 42.1 52.6 BREAKTHROUGH OCCURRED AT
-3ST6 0.157062) (2.01) 734.3 (0.035) (0310) 0.11 0.57 SALT R 38.3) (47.9) 45 CYCLES INTO CYCLIC TEST.-3(106.5) a = t 0.965 WATER 53.3 SPECIMEN THEN FAILED IN RT AIR.
a=t (0.380) 0.16 1.00 (48.5
860.5 a t 0.965 63.5(124.8) a
= t 8 0.16 1.00 AIR (57.8)
0.081 0.10.787 0 0.51 49.9 59.8882.6 (0.032) (0.310) AIR 45.4) (54.4)
D (128.0) 0.104 0.187 55.0 73.2(128 (0.041) (0.310) 0.13 0.65 (50.0) (66.6) SPECIMEN PROOF TESTED. FLAW
0.104 787 44.7 59.7 BREAKTHROUGH OCCURRED AT
ST6 0.160 5.11 7343 0.041) (0.310) 0.13 0.65 SALT 40.7 (54.3) 14 CYCLES INTO CYCLIC TEST.18(106.5) t WATER 1055.3 SPECIMEN THEN FAILED IN RT AIR.
8=t (0.460) (50.3)748.8 = t 0.14 1.0056.4
S(108.6) a (0.460) 0.14 1.00 AIR (51.3)
1 0.10 0.39979.1 (0.024) (0.245) 0.10 0.39 AIR (.6) 49.5
2 (142.0) 0.066 .522 0. 57.1(0.026) (0.245) 0.11 0.43 (46.0) (52.0) SPECIMEN PROOF TESTED. FLAW
T6 0.155 5.00 0.0 36.5 41.2 BREAKTHROUGH OCCURRED AT
ST6 0.061) (1.97734.3 (0.026) (0.245) 0.11 0.43 SALT (33.2) 100 CYCLES INTO CYCLIC TEST.
(106.5) a = t 0.18 1.00 WATER 52.0 SPECIMEN THEN FAILED IN RT AIR.
(106.5) a = t (0.340) 0.18 1(47.3) --
841.2 a = t 0.864 0.18 1.00 AIR 60.3122.0) at (0.340) 0.18 1.00 AIR (5460.3
0.064 0.635 0.10 041 49.9 55.8
979.1 (0.025) (0.250) AIR (45.4) (50.8)
S (142.0) 0.069 0.635 51.4 58.7(0.027) (0.250) 0.11 0.44 46.8) 53.4) SPECIMEN PROOF TESTED. FLAW
T6 0.155 5.08 0.635 37.1 42.4 BREAKTHROUGH OCCURRED AT
-12 (0.061) (2.00) 734.3 (0.027) (0.250) 011 044 SALT (33.8) (38.6) 73 CYCLES INTO CYCLIC TEST.
(106.5) a t 1.00 WATER 52.3 SPECIMEN THEN FAILED IN RT AIR.
S818.4 0.889 58.9
(118.7 a = t 0.17 1.00 AIR g
INITIAL CONDITIONS 3 START OF CYCLIC TEST 5 FAILURE
PROOF LOAD TERMINATION OF CYCLIC TEST

Table 49: 6A/-4V STA Titanium (WT Direction) Cyclic Flaw Growth Data at 2950 K (720 F) in Salt Water at 0.2 cpmAfter an Ambient Proof Test; t = 0.31 (0.12 inch), oo = 0.68 oys and (a/2c)i =0.38
w I I W
z 3: x O C x REMARKS
3= F- IE - i- H E E= z 0 z 0 <E E w0Q- az - E -J E ca LZ
Cn Z LLU LLU (M F _ _
0.160 0.419 0.38 0.52 57.5 60.0979.1 (0.063) (0.165) AIR (52.3) (54.6) SPECIMEN PROOF TESTED, THEN
OST 0.307 5.08 (142.0) 0.163 0.429 38.1 61.0 SPECIMEN FAILED AFTER 2.5-4A (0.121) (2.00) {(0,064) (0,169) 0 .2.L (55.5) MINUTES OF FIRST CYCLE INTO
734.3 0.163 0.429 0.38 0.53 SALT 42.6 44.6 CYCLIC TEST.(106.5) (0,04) (0.169) WATER (38.8) (40.6)
0.152 0.414 0.37 0.49 57.0 59.6979.1 (0.060) (0.163) 9 AIR (51.9) (54.2)
OST 0.310 5.08 142.0) 0.157 0.424 037 051 57.7 60.4 SPECIMEN PROOF TESTED, THENOST 0.310 5.08 (0.062) 0.167) 0.37 0.51 (52.5) (55.0) SPECIMEN FAILED AFTER 3.4-5A (0.122) (2.00) 0.157 0.424 0.37 0.51 42.4 44.4 MINUTES OF 19TH CYCLE INTO
o - 0 (00) 734.3 (0.062) (0.167) SALT (38.6) (40.4) CYCLIC TEST.rl (106.5) U.165 0.437 0.38 0.53 WATER 43.0 44.9
(0.065) (0.172) (39.1) (40.9)
0.13 0.345) 0.38 0.42 52.1 5.6979.1 (0.051) (0.136) AIR (47.4) (48.8)(142.0) 0.132 0.351 0.38 0.43 52.5 54.1
(0.052) (0.138) (47.8) (49.2) SPECIMEN PROOF TESTED AND THEN
OST 0.310 5.11 3 .132 .31 0.38 0.43 38.6 39.8 CYCLED FOR 260 CYCLES. TEST
-12A (0.122) (2.01) 734.3 (0.052) (0.138) SALT (35.1) (36.2) TERMINATED AND SPECIMEN(106.5) 0.152 0.411 0.37 0.49 WATER 41.8 43.5 MARKED AND FAILED IN RT AIR.
(0.060) (0.162) (38.0) (39.6)0.152 0.483 0.33 0.51 AIR - -
0.121 0.333 0.38 0.41 51.2 52.5979.1 (0.050) (0.131) AIR (46.6) (47.8)
J (142.0) 0.130 0.335 0.39 0.42 51.4 52.8 SPECIMEN PROOF TESTED, THENOST 0.310 5.11 (0.051) (0,132) (46.8) (48.0) SPECIMEN FAILED AFTER 1.3-13A (0.122) (2.01) 3 0.130 0.335 0.39 0.42 37.8 38.8 MINUTES OF 475TH CYCLE INTO
734.3 (0.051) (0.132) SALT (34.4) CYCLIC TEST.(106.5) 0.183 0.508 0.36 0.59 WATER 46.3 49.9
(0072). (0.200) (42.1) (45.4)
1 INITIAL CONDITIONS
PROOF LOAD
START OF CYCLIC TEST
TERMINATION OF CYCLIC TEST
FAILURE
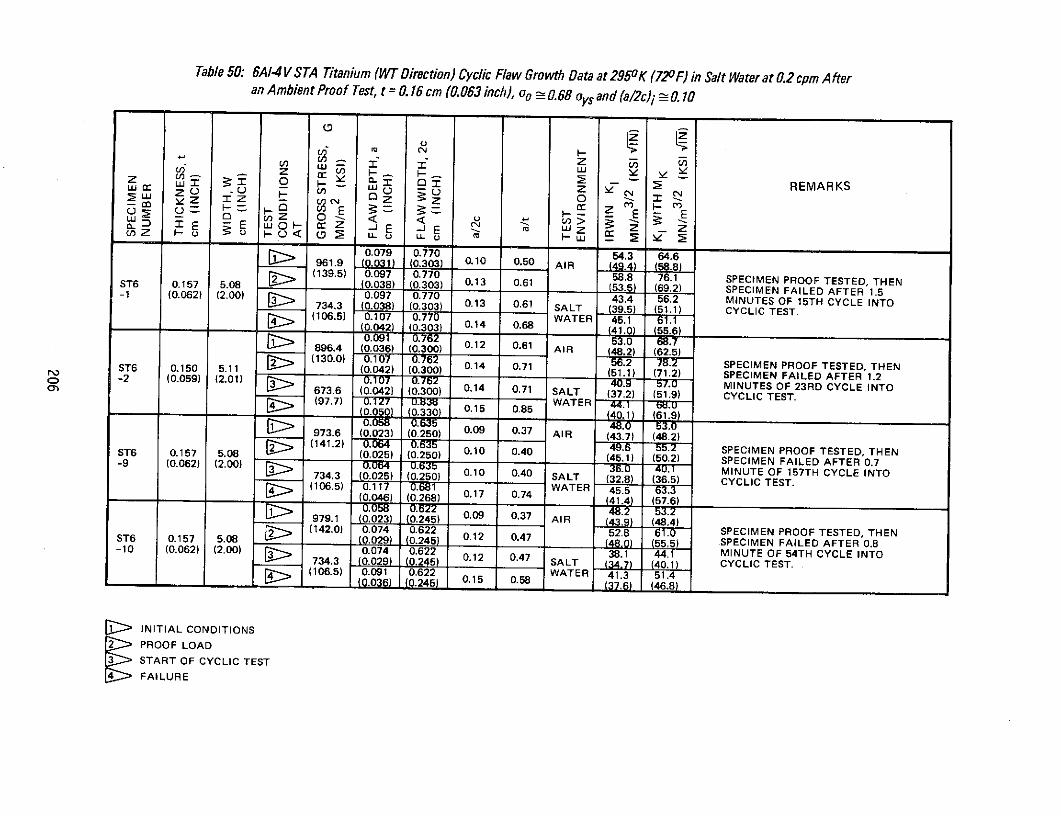
Table 50: 6A-4 V STA Titanium (WT Direction) Cyclic Flaw Growth Data at 2950K (720F) in Salt Water at 0.2 cpm Afteran Ambient Proof Test, t = 0.16 cm (0.063 inch), 0o 0.68 oys and (a/2c)i 0.10
CZ Z , Z
U 2 ZE E
0.079 0.770 54.3 64.6961.9 (0.031) (0.303) 0.10 0.50 AIR (49.4) (58.8)
ST6 0.157 5.08 (139.5) 0.097 0.770 58.8 76.1 SPECIMEN PROOF TESTED, THENST6 0.157 5.08 (0.038) (0.303) 0.13 0.61 (53.5) (69.2) SPECIMEN FAILED AFTER 1.5-1 ( 0.097 0.770 43.4 56.2 MINUTES OF 15TH CYCLE INTO1 (0.062) (2.00) 734.3 038) (0.303) 0.13 0.61 SALT (39.5 (51.1) CYCLIC TEST.(106.5) 0.107 0.770 WATER 45.1 61.1
(0.042) (0.303) 0.14 0.68 41.0) 55.6)0.091 0.762 0.12 53.0 68.7896.4 (0.036) (0.300) 0.12 0.61 AIR (48.2) (62.5)
ST6 0.150 5.11 (130.0)02) (0.300) 0.14 0.71 56.2 78.2 SPECIMEN PROOF TESTED, THENS(0.042) (0.300 0.14 0.71 (51.1) (71.2) SPECIMEN FAILED AFTER 1.2-2 (0.059) (2.01) 0.673.6 107 ) 0.9 5 MINUTES OF 23RD CYCLE INTOS673.6 (0.042) (0.300) 0.14 0.71 SALT (37.2) (51.9) CYCLIC TEST.(97.7) 0.127 0.83 5 WATER 44.1 .0.050 ) 0.330 ) 0.15 0.85 40.1 (61.9)0.058 0.635 48.0 53.0
973.6 (0.023) (0.250) 0.09 0.37 AIR (43.7) (48.2)ST6 0.157 5.08 (141.2) (0.250) 0.10 0.40 SPECIMEN PROOF TESTED, THENS 0.157 5.08 (0.025) (0.250) 0.10 0.40 (45.1) (50.2) SPECIMEN FAILED AFTER 0.7734.3 (0.062) 0.025) (0.250) 0.10 0.40 SALT 36.0 4.1 MINUTE OF 157TH CYCLE INTO734.3 (0.025) (0.250) 0.10 0.40 SALT (32.8) (36.5) CYCLIC TEST.(106.5) 0.117 0.681 WATER 45.5
(0.046) (0.268) 0.17 0.74 41.4) (57.6)0.058 0.622 48.2 53.2
979.1 (0.023) (0.245) 0.09 0.37 AIR (43.9) (48.4)ST6 0.157 5.08 (142.0) 0.074 0.622 52.8 61. SPECIMEN PROOF TESTED, THENST6 0.157 5.08 (0.029) (0.245) 0.12 0.47 (48.0 (55.5) SPECIMEN FAILED AFTER 0.8-10 (0.062) (2.00) (0.074 0.622 0.12 0.47 38.1 44.1 MINUTE OF 54TH CYCLE INTO
734.3 (0.029) (0.245) SALT (34.7) 40.1) CYCLIC TEST.(106.5) 0.091 0.622 WATER 41.3 51.4
(0.036) (0.245) 0.15 0.58 (37.6) (46.8)
SINITIAL CONDITIONS
PROOF LOAD
START OF CYCLIC TEST
FAILURE
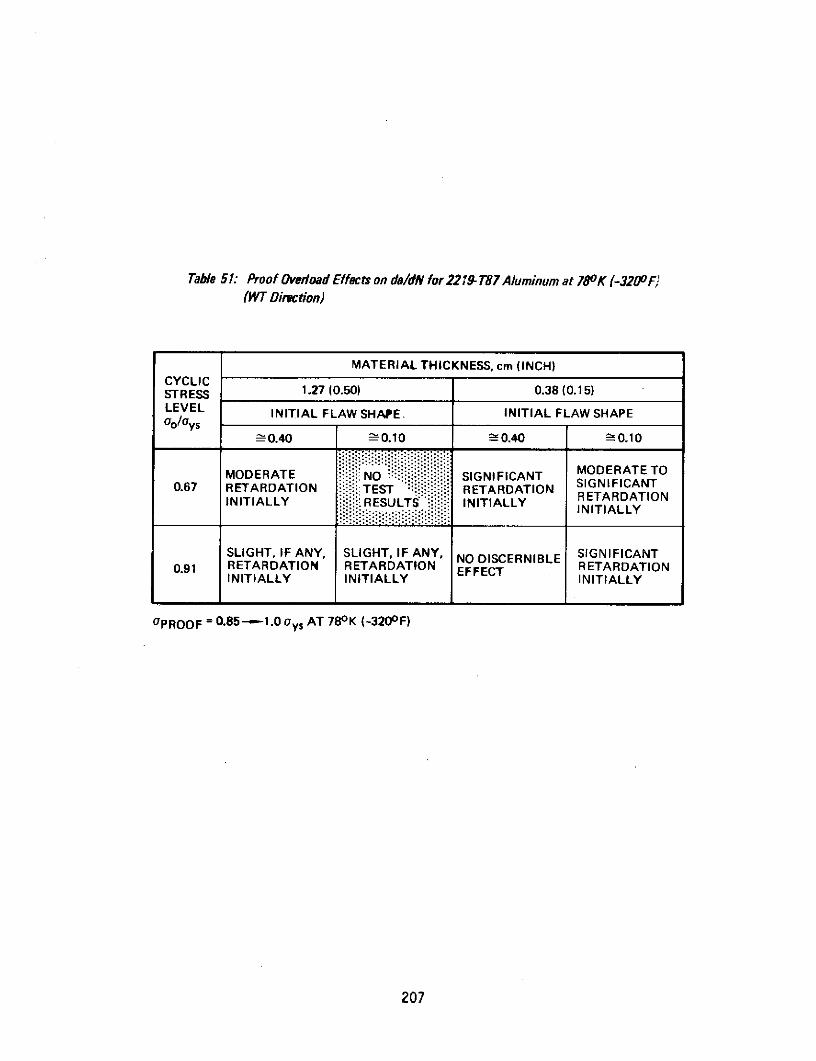
Table 51: Proof Ovedoad Effects on de/dN for 221- 87 Aluminum at 780K (-3200F,(WT Direction)
MATERIAL THICKNESS, cm (INCH)CYCLICSTRESS 1.27 (0.50) 0.38 (0.15)LEVEL INITIAL FLAW SHAPE. INITIAL FLAW SHAPEOo/Oys
S0.40 20.10 0.40 --0.10
MODERATE :::::::NO SIGNIFICANT MODERATE TO0.67 RETARDATION TEST RETARDATION SIGNIFICANT
INITIALLY .RESULTS INITIALLY RETARDATIONINITIALLY
SLIGHT, IF ANY, SLIGHT, IF ANY, NO DISCERNIBLE SIGNIFICANT0.91 RETARDATION RETARDATION EFFECT RETARDATION
INITIALLY INITIALLY INITIALLY
OPROOF = 0.8 5-1.0 oys AT 780 K (-3200F)
207
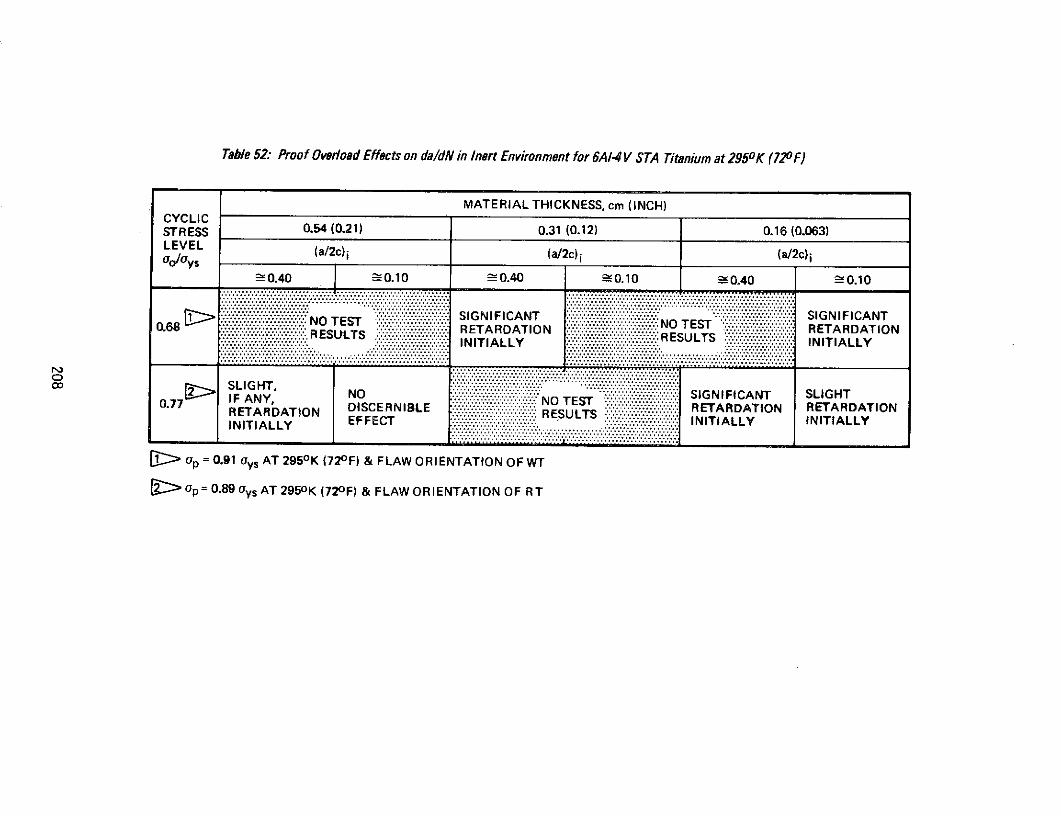
Table 52: Proof Overload Effects on da/dN in Inert Environment for 6A-4 V STA Titanium at 2950K (720F)
MATERIAL THICKNESS, cm (INCH)CYCLICSTRESS 0.54 (0.21) 0.31 (0.12) 0.16 (0.063)LEVELLEVEL (a/2c) i (a/2c) i (a/2c) iOo/Uys
0.40 0.10 1 0.40 R0.10 0.40 -0.10
... NO TES.................S...........IG N
v v0.68. ...v.. .... v.v.'.. RE S '' ' : : RET DTI ON :::::::::::::::::::;::: : : : RESULTS - RETARDATION: : : : :: :INITIALLY :::::!: ::::::::::INITIALLY
IFANY NO ::::::::::::::::::::::::::::::::::::::ST SIGNIFICA NT SLIGHT
0.77 RETARDATION DISCERNIBLE ETARDATION RETARDATION
INITIALLY EFFECT ::::::RESULTS INITIALLY INITIALLY
op = 0.91 Oys AT 2950K (72 0 F) & FLAW ORIENTATION OF WT
Op= 0.89 Oys AT 2950 K (72oF) & FLAW ORIENTATION OF RT

Table 53: 6A1-4V STA Titanium (WT Direction) Sustained Load Flow Growth Data at 2950K (72oF) in Salt Water,t = 0.54 cm (0.21 inch), oo = 0.68 ys and (a/2c)i 0.37
S 0. Q 2 REMARKS- 0 - Z v
- (0.21) (.) 0.3 0.32 Z
XT-5 0. .0 (0.079) 0 0.3 0.3 SPECIMEN FAILED IN 0.25 MIN.r-.. 734.3 0.175 0.498 SALT 49.6 541.4SUXT4 0.21 1.93 3 (1065) (0.192) 0.3 0.32 WATER (41) (4.) SPECIMEN FAILED IN 0.72 MIN.
0.170 0.467 60.6 62.2979.1 (0.067) (0.184) 0.36 0.32S(142.0) 0.173 0.490 AIR (55.1) 56.60.279 0.19 61.8 63.6
2.) (0 ) 0.3 0.32 .) ( ) SPECIMEN PROOF TESTED AND THENOST2 0.533 5.08 734 0.173 0490 45.4 46.7 SUSTAIN LOADED FOR 8.0 HOURS-1 (0.210) (2.00) 6 734.3 (0,068) (0.193) 0.35 0.32 WATER (41.) (45) WITH NO FLAW GROWTH. SPECIMEN
I (106.5) 0.173 0490 WATER 454 . THEN MARKED AND FAILED IN(0.068) (0.193) 0.35 0.32 4.346 . RT AIR.
C 1041.1 018 052 67.9 70.0S151.0 (0.073 (0.208) 0.36 0.35 AIR 61
979.1 (0.074) (0.208) 0.36 0.35 ) (SPECIMEN PROOF TESTED ANDOST2 0.531 5.08 (142.0) 0.191 . AIR 45.4 6 STIN O ED A0ND
-2 (0.209 2.00 142.0) . 0.5 3 0.3 67.4 70.0IR THEN A SLIGHT MARK APPLIED.-1 (0.210) (2.00) (0.075) (0.234) 0(4.) (63.7) SPECIMEN FAILED IN 1.33
TERM8 N 0.8 6WATER 45.979.1 (0.073) (0.191) 0.38 0.355(142.0) 0.191 00. AIR (6.8) (57.7)
0.075) (0.220) 0.34 0.36 65.7 68.0 SPECIMEN PROOF TESTED AND THENS(0.07) (0.2) (59.8) (61.9) SUSTAIN LOADED FOR 7.0 HOURSOST2 0.536 5.08 (142 91 0 SALT 4.1 4 WITH NO FLAW GROWTH. SPECIMEN-3 (0.211) (2.00)734.3 0.075) (0.220) WATER 43.8 45.4 THEN MARKED AND FAILED IN
(106.5) 0.198 0.635 50.8 52.9 RT AIR.(0.078) (0.250) 0.31 0.37 46.) _ 5.1 (481)946.0 0.249 0.762 0.73.6 77.8
0.178 0.478 61.3 62.9979.1 (0.070) (0.188) 0A37 0.33(56.3) (57
T2 0.533 5.08 (142.0) 0 62.8 64.4 A SLIGHT MARK APPLIED. SPECIMEN(0.074) (0.197) 0.38 0.35 (57.1) (58.6) FAILED IN 1.7 MINUTES OF BEING734.3 0 0 SUSTAIN LOADED.
(106.5) (0.076) (0.198) 0.38 0.36 WATER (42.1) (43.1)
INITIAL CONDITIONS 5 TER0MINATION OF SUSTAINED LOAD
9PROOF LOAD( FAILURE
RSTART OF SUSTAINED LOAD TEST
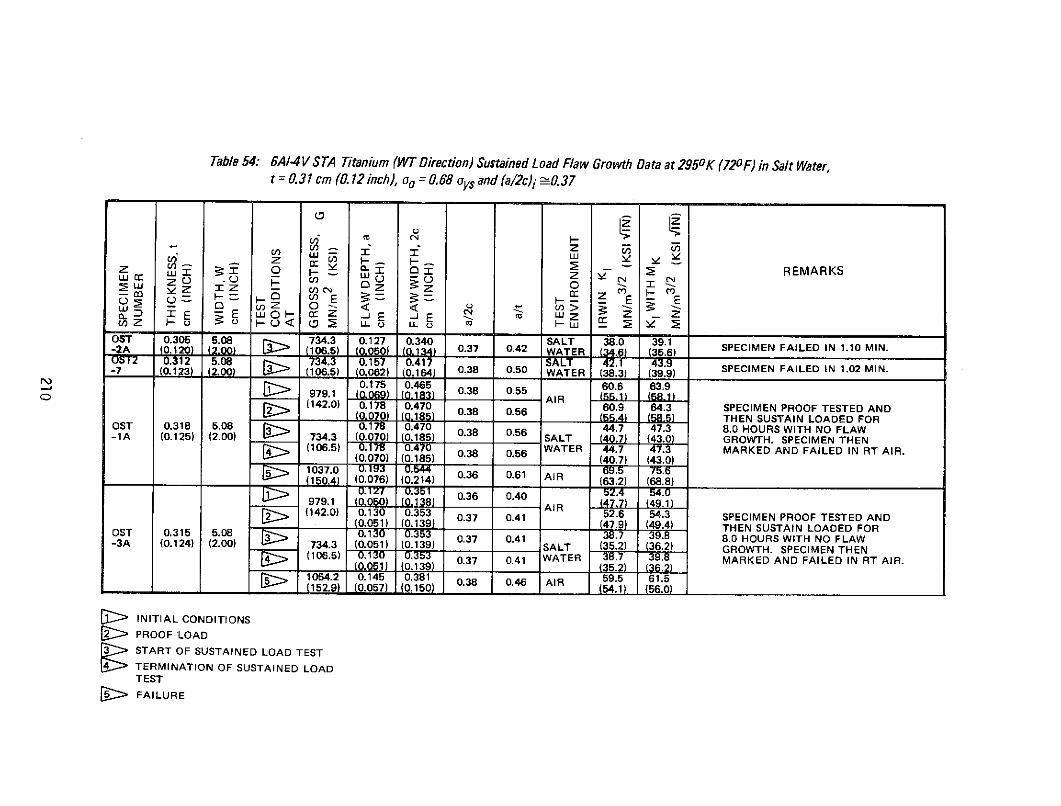
Table 54: 6A1-4V STA Titanium (WT Direction) Sustained Load Flaw Growth Data at 2950K (720 F) in Salt Water,t = 0.31 cm (0.12 inch), oo = 0.68 oys and (a/2c)i 0.37
175 0.465 60.6 639(142.0) 0.178 0.470 0.38 0.56 60.9 64.3 SPECIMEN PROOF TESTED AND(554) (5) THEN SUSTAIN LOADED FOR
OST 0.305 5.08 734.3 0.127 0.340 SALT 38.0 39.13 8.0 HOURS WITH NO FLAW-1A (0.125) (2.00) 734.3 (0.00) (0.185) 0.37 0.42 WATER (40.7) (43.0 GROWTH. SPECIMEN FAILED IN 1.THE MIN.-7 (0.123) (2.00) (106.5) (0.062)17 (0.16470 0.38 0.56 WATER (3844.7 47.3 MARKED AND FAILED IN 1.02RT AIR.
1037.0 0.175 0.465 0.38 0.55 60.6 63.9
150.4 (0.076) (0.214) AIR (63.2) (68.8)
- 979.1 (0.050) (0.138) R (47.7) (49.1)
(142.0) 0.178 0.353 0.37 0.41 60.9 64.3 SPECIMEN PROOF TESTED AND(0.051) (0.139) (47.9) (49.4) THEN SUSTAIN LOADED FOROST 0.318 5.08 > 0.178 0.470 .3 0. 447 47.3 8.0 HOURS WITH NO FLAW-A (0.12) (2.00) 734.3 (0.070) (0.185) SALT (34.7) (43.0) GROWTH. SPECIMEN THEN
(106.5) 0.17 0.473 0.37 0.41 WATER 44.7 4 .3 MARKED AND FAILED IN RT AIR.(0.070) (0.185) (40.7) (43.0)
1054.2 0.145 0. 0.36 0.61 AIR 59.5 61.5(152.9) (0.057) (0.214) (54.1) (56.0)
979.1 0. 0 (0.138 0.36 0.40 .1PROOF LOAD0.130 0.353 52.6 .3 SPECIMEN PROOF TESTED AND
START OF SUSTAINED LOAD TEST
0.051) (0.139) (47.9) 49.4) THEN SUSTAIN LOADED FOR
EST 0.315 5.08 0.130 0.353
-3FAILURE (0.124) (2.00) 0.37 0.41 8.0 HOURS WITH NO FLAW(106.5) WATER 3 7 MARKED AND FAILED IN RT AIR.(0.061 (0.139) (35.2)1054.2 0.145 0.381 038 046 AIR 59.5 61.5-15 0.057) 0.150 (54.1) (56.0)
> INITIAL CONDITIONS>~ PROOF LOAD
7 START OF SUSTAINED LOAD TESTTERMINATION OF SUSTAINED LOADTEST
~ FAILURE
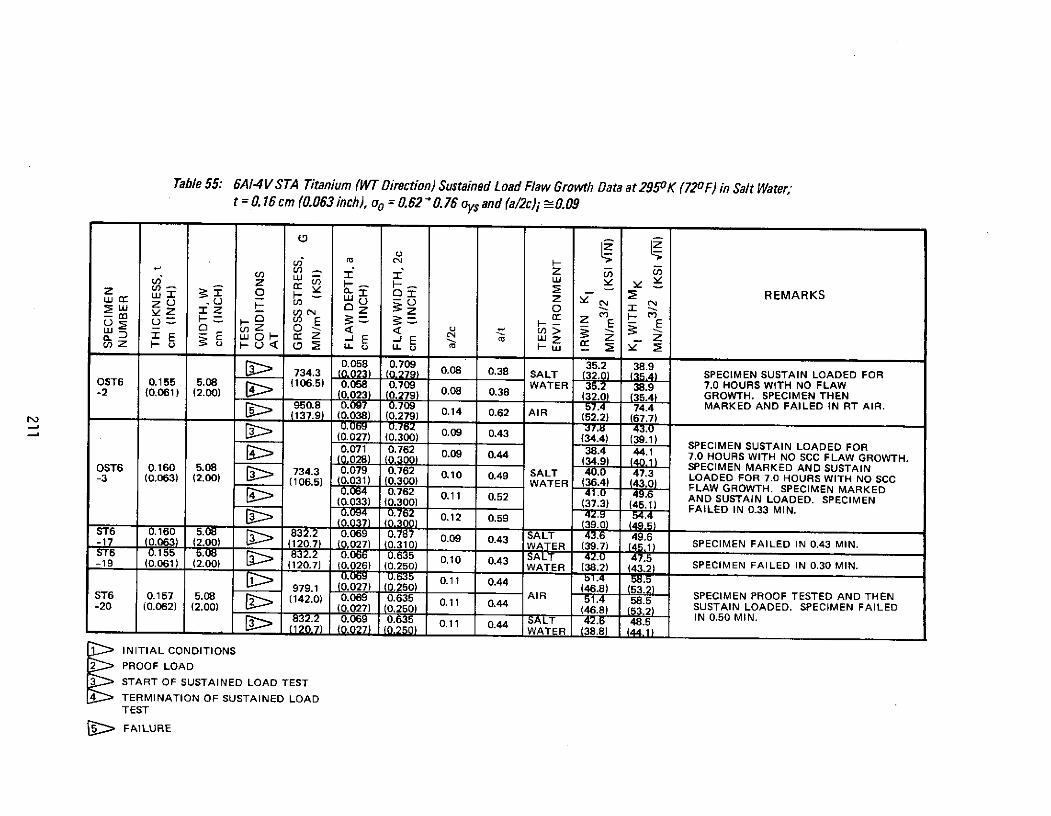
Table 55: 6A-4 V STA Titanium (WT Direction) Sustained Load Flaw Growth Data at 2950K (720F) in Salt Water,t = 0.16 cm (0.063 inch), oo = 0.62 0.76 oys and (a/2c)i 0.09
--------- -- zz, U) F -
0.058 REMARKS
[3 734.3 (0.023) (0.27) 0.08 0.38 SALT (32.0) (35.4 SPECIMEN SUSTAIN LOADED FOR
S Z (0.038) (0.279) 0.14 062 AIR (52.2) (67.7)
0.069 0.762 37. 43.0
HO F E -H Z E E(0.027) (0.300) 0.43 (34.4) (39.1)H-J EE -.JOH E -WE Z -. cvV) Z LL LLo Hw
734.3 0.08 0.38 SALT 32 SPECIMEN SUSTAIN LOADED FOROST6 0.155 5.08 106.5) 0.058 0.709 WATER .2 38.9 7.0 HOURS WITH NO FLAW-2 (0.061) (2.00) 0.023) 79) 0. 08 0.38 (3.0 FLAW GROWTH. SPECIMEN THEN
950.8 0.03 70.6 0.11 0.52 37 4.) MARKED AND FAILED IN SPECT AIR.137.9 (0.038) (0.279) 4 (..6) (67.7)
0.094 0.762 0.12 0.59 42.9 54.4
(0.027) (0.300) 0.09 0.43 (34.4) (39.1)0. .00832.2 0.071 0.76287 0.09 0.44 43. 4.1 7.0 HOURS WITH NO SCC FLAW GROWTH.0028) (34.
T 0. .0(120.7) 0.027 ) 0.3100.43 WATER (397) (4.1 SPECIMEN FAILRKED IN 0.43 MSUSTAINST6-3 (0.15563) 5.080) 734.3 0.079 0.762 0.10 0.49 SALT 42.0 47.3 LOADED FOR 7.0 HOURS WITH NO SCC-19 (0.06) (2.00) (120.7) (0.026) (0.30250) WATER (38.2) (43.2) FLAW GROWTH. SPECIMEN MARKED0.069 0.635 0.11 0.52 44.6 AND SUSTAIN LOADED. SPECIMEN
979.1 (0.027) (0.250) (46.8) (53.2)
0 () (2 (37.3) (45.1)( FAILED IN 0.33 MIN.
(0.027) (0.0. .12250) 0. (46.8) (53.2) SUSTAIN LOADED. SPECIMEN FAILED
T 0.10 832.2 0.069 0.787 0.11 0.44 SALT 42.6 49.6 SPECIMEN FAILED IN 0.50 MIN7 (0.6 (2.00) (120.7) (0.027) (0.310) WATER (39.7) (44.1) 1NITIAL CONDITIO 832.2 0.635 0.10NS 0.43NS-19 (0.061) (200 (120.7) (0.026) (0.250) WATER (38.2) (43.2) SPECIMEN FAILED IN 0.30 MIN.0.6 93 0.11 0.44
979.1 0.027) (0.250)PROOF LOADST6 0.157 5.08UTAINED (142.0) 0.069 0.635 11 0.44 TESTAI SPECIMEN PROOF TESTED AND THEN-20 (0.062) (2.00) (0.027) (0.250) (46.8) (532) SUSTAIN LOADED. SPECIMEN FAILED0.069 10.635 0.11 0.44 SAT IN 0.50 MIN.
(0-027) -(0,250) - . L QWATER (38.8) 1(,)
1 INITIAL CONDITIONS2 PROOF LOAD
3 TART OF SUSTAINED LOAD TEST4 TERMINATION OF SUSTAINED LOAD
TEST
FAILURE

212