85. .2833 - nasa/ads
TRANSCRIPT
1980
AJ
85.
.28
33
THE ASTRONOMICAL JOURNAL VOLUME 85, NUMBER 3 MARCH 1980
RADIO OBSERVATIONS AND ANALYSIS OF NOVA VI500 CYGNI
E. R. Seaquist and Nebojsa Duric David Dunlap Observatory, Richmond Hill, Ontario, Canada
F. P. Israel Owens Valley Radio Observatory, Pasadena, California 93513
T. A. T. Spoelstra Netherlands Foundation for Radio Astronomy, Dwingelo, Netherlands
B. L. Ulich National Radio Astronomy Observatory, Tucson, Arizona 85705
P. C. Gregory Department of Physics, University of British Columbia, Vancouver, British Columbia, Canada
Received 23 July 1979; revised 13 November 1979
ABSTRACT
We present the results and analysis of radio observations of Nova V1500 Cygni (1975). The data are consistent with thermal bremmstrahlung from an expanding cloud of ionized gas. Our data, combined with curves published by Hjellming (1977), are fit to thick shell models with density laws of the form ne = A /f1. The models require a large velocity dispersion with the outer shell boundary having V = 3600 D km s “ \ where D is the distance to the nova in kpc. The radio data therefore indicate the presence of a high velocity component not readily detect- able in the optical emission line data, although it is detectable in the prenebular absorption line data. By combining the radio data with the infrared data of Ennis et al. (1977), we show that the ejected shell must have been ionization bounded during the first several weeks after the outburst, and density bounded thereafter. The mass and kinetic energy in the shell for a dis- tance of 1.4 kpc are ~1.4xl0-4Afo and l.lxl046erg, respectively.
I. INTRODUCTION
The remarkable fast nova VI500 Cyg is one of the most well studied novae to date. In addition to the wealth of data in the uv, optical, and infrared (IR), there exist extensive radio data (see, for example, Hjellming 1977). As in the case for previous radio detections of novae, the observed radio emission is well accounted for by thermal bremmstrahlung from an expanding cloud of ionized gas. The radio data provide information on the structure and total mass of the nebular shell. For example, Seaquist and Palimaka (1977) have shown that the radio emission from nova FH Serpentis (1970) could be accounted for by a thick expanding shell with a density gradient of the form ne = Ajr1. In our subsequent discussion we shall use “wide” and “narrow” to indicate geometrical thickness in order to avoid confusion with optical thickness. We present here extensive radio data on Nova Cygni at several frequencies. These data are combined with other published radio and IR data and analyzed to produce a model for the shell behavior.
The IR data we have used are those published by Ennis et al. (1977). The IR flux densities, like the radio data, are consistent with an expanding cloud of ionized gas, but cover an earlier epoch than do the radio data. By combining the IR and radio data, therefore, it should
be possible to construct a picture of development of the expanding shell over a range ld ,5 i ,5 3 yr. Ennis et al. have interpreted their data in terms of a narrow shell expanding with v ^ 2000 kms-1. The shell widens in accordance with the sound speed (10 kms-1) in an ion- ized gas with electron temperature 7^, = 104 K. During the earliest phases (t < 60d) the shell width is constant at approximately 1013 cm. The constant width seems necessary to account for the shallow slope (Sv oc /~2) of the optically thin IR flux during this early phase. This model has been used and refined by several authors (e.g., Neff, Smith, and Ketelsen 1978). In addition, the optical emission-line strengths in the nebular phase indicate the same behavior in support of this type of model (Boyar- chuk and Gershberg 1977).
However, in spite of the agreement between this model and the IR data, absorption lines in the first few days indicate the presence of the blue shifts up to 5,000 km s-1 (Rosino and Tempesti 1977). Furthermore, the widths of the absorption lines are comparable to the shifts themselves. These results suggest a substantial velocity dispersion which is two orders of magnitude higher than the sound speed. They also suggest the presence of a wide shell, not a narrow shell. Since the radio flux densities are sensitive to the radii of the shell boundaries and to the density gradient, the combined
283 Astron. J. 85 (3), March 1980 0004-6256/80/030283-11 $00.90 © 1980 Am. Astron. Soc. 283
© American Astronomical Society • Provided by the NASA Astrophysics Data System
1980
AJ
85.
.28
33
284 SEAQUIST ET AL.: NOVA VI500 CYGNI 284
Table I. Telescopes and frequencies used for V1500 Cyg observations.
Telescopes Frequencies
(GHz) Beamwidth
(FWHM) (arcmin)
WSRT
N.R.A.O. interferometer
A.R.O. 46-m telescope
N.R.A.O. 11-m telescope
0.6 1.4 5.0 2.7 8.1
10.5 22.5 90.0
Depended on (u,v) Coverage (see text)
Same as above 2.8 1.4 1.3
radio data may provide further insight into this apparent discordance.
II. OBSERVATIONS
Observations of Nova VI500 Cygni were made at several frequencies using several different telescopes. An overall summary of the instruments and frequencies used is presented in Table I. Below we give a short description of the observing method with each instrument.
a) Westerbork Synthesis Radio Telescope {WSRT)
Measurements with the WSRT were made (by F.P.I. and T.S.) beginning three days after visual maximum, and continued up until January 1978. The observations were made at the three operating frequencies of the WSRT: 0.6, 1.4, and 5.0 GHz. The synthesized beam- width in right ascension is 58, 24.6, and 7.2 arcsec, re- spectively, for a source observed in the meridian. The shape and size of the actual synthesized beam depended on the {u,v) plane coverage, and was different for every observation, since the nova was used as a filler source between longer observations of other sources. However, in order to determine the degree of confusion in the field of the object we also made a full 12h synthesis at both 1.4 and 5.0 GHz early in the observing period. Since only one frequency can be observed at any given time, our cov- erage is not complete during the observing period. The nova was first detected at 5.0 GHz on day 75325 ( = 1975, day 325), 84 days after maximum light. Because the WSRT was then switched over to 1.4 GHz, the peak emission at 5.0 GHz (presumably about 40 days later) was not observed. At 1.4 GHz the nova first became clearly visible on day 76060, 184 days after maximum light. Peak emission was observed around day 76080. The last detection of the nova at 1.4 GHz was on day 77267. At 0.6 GHz we made only sporadic observations, and the nova was never detected.
Flux densities were determined from contour maps at the nova position; this method was generally quite ac- curate at 5.0 GHz, but at 1.4 GHz some observations show the effects of confusion with other sources in the field. At 0.6 GHz we compared original maps and cleaned maps.
Table III contains a list of sources found in the field centered on the nova. The nearest source strong enough to create a confusion problem for single dish observations is source # 13 at a distance of 9 arcmin.
b) National Radio Astronomy Observatory {NRAO) Three Element Interferometer
Limited observations were made at 2.7 and 8.1 GHz with the interferometer at Green Bank, West Virginia. In the case of the observations on day 76106, the flux density was obtained from a contour map made from observations at several hour angles with {u,v) coverage provided by only a single configuration. For the obser- vations pertaining to the period 77059-77124, data from several observing runs were combined because the source was very weak (^5 mJy at 8.1 GHz) and because the flux density was not expected to vary significantly during the averaging period. The process of combining the data from several observing runs also provided better {u,v) plane coverage since different configurations were used. The approximate synthesized beam sizes for the com- bined data were 32.9 X 6.5 and 12.9 X 2.1 arcsec with p.a. = 8° at 2.7 and 8.1 GHz, respectively. In all maps used, the source was clearly identifiable, and no con- fusing sources were evident.
c) Algonquin 46-m Telescope
Occasional observations were made with the 46-m telescope (by P.C.G.) at 10.5 and 22.5 GHz. In each case, a beam switching technique was employed to re- duce the effects of variations in terrestrial atmospheric emission. An observing procedure termed “wagging” was used in which the source was alternately positioned in the main and reference beams. The two feed horns are displaced in azimuth relative to one another. The system temperatures and bandwidths at the time of the obser- vations were approximately 120 K and 100 MHz at 10.5 GHz and 400 K and 360 MHz at 22.5 GHz.
d) NRAO 11-m Telescope
Observations at six epochs were made (by B.L.U.) with the NRAO 11 -m telescope on Kitt Peak. The f/13.8 Cassegrain receiver was a dual-polarization, cooled mixer radiometer tuned to 90 GHz. Each of the channels had a double-side band system temperature of 300 K and an IF bandwidth of 500 MHz. The aperture efficiency was 30%. A nutating subreflector was used as a Dicke switch to cancel the terrestrial atmospheric background. The quoted flux density errors do not include the un- certainty in absolute calibration (estimated to be ±3%). Nova Cygni 1975 was clearly detected in December 1975, and probably detected in January 1976. Later observations indicate a significant decrease in intensity to a level undetectable with existing millimeter wave- length telescopes.
© American Astronomical Society • Provided by the NASA Astrophysics Data System
1980
AJ
85.
.28
33
285 SEAQUIST ET AL.: NOVA VI500 CYGNI 285
Table II. Flux density measurements on Nova V1500 Cyg.
Frequency (GHz) Date Julian Date 244+ Flux density ± la (mJy)
0.610
1.415
4.995
2.7
8.1
10.5 22.5 90.0
76029/033 210/227 272
77083 75244
246/247 248 251/259 260/261
76041 060 060 060/062 068 074 103 107 113 137 312 318 351
77164 237 252 262 267 308
75263/273 273/287 297/303 305/313 325
76182 187 202 238 265
77012 060
76106 77059/124 76106 77059/124 76154/156 76126 75243 75317 75349 76031 76241 77161
2807/2811 2988/3005 3050 3227 2657 2659/2660 2661 2664/2672 2673/2674 2819 2838 2840 2838/40 2846 2852 2881 2885 2891 2915 3090 3096 3129 3308 3381 3396 3406 3411 3452 2676/2686 2686/2700 2710/2716 2718/2726 2738 2960 2965 2980 3016 3043 3156 3204 2884 3203/3268 2884 3203/3268 2932/2934 2904 2656 2730 2762 2809 2819 3305
<2.5 <5.0 <5.0 <2.5 <1.0 <2.5 <1.0 <1.0 <2.5
1.0+ 1.0 3.0 ± 1.0 4.0 ± 2.0 2.0 ± 2.0 3.0 ± 2.0 4.0+ 1.5 4.0 ± 1.5 4.0+ 1.5 3.0 ± 2.0 4.0+ 1.5 3.9 ±0.5 3.8 ±0.5 3.6 ±0.5 2.5 ± 2.0 1.5 ± 1.0 0.7 ± 1.0 4.5 ± 2.5 1.7 ± 1.5
<2.0 <5.0
5.0 ± 5.0 <5.0 <10.0
17.0 ± 2.0 13.0 ± 3.0 16.5 ± 3.0 12.5 ± 3.0 12.0 ± 3.0 12.5 ± 4.0 9.0 ± 2.0 9.0 ± 2.0 8.7 ± 1.5 5.0 ±2.0 26 + 3 5.0+ 1.0 24 + 5 67 ± 15 40+ 190 80+ 150
260 ± 30 118 ± 48
-36 ± 86 18 ± 35
The flux densities measured at each frequency are recorded in Table II. These measurements are combined with other data from the literature in performing the analysis in Sec. Ill of the paper.
III. ANALYSIS
An inspection of the data in Table II and the curves in Fig. 1 show clearly the behavior expected for an ex- panding shell of gas emitting thermal bremmstrahlung. The flux densities are characterized by an increase during the early phase, produced by the optically thick region, followed by a decay after the shell becomes op- tically thin. This behavior has already been noted for this
nova by Hjellming (1977), as well as for other novae (Hjellming 1974; Seaquist and Palimaka 1977).
We combine our radio data with those published by Hjellming (1977) to investigate various models for the expansion of the ejected shell. For simplicity we consider only spherically symmetric shells. This assumption is not strictly in accordance with the emission lines which in- dicate the presence of polar blobs and an equatorial ring (see for, e.g., Hutchings and McCall 1977). There are several reasons, however, why the assumption of spher- ical symmetry is justified here. First of all, the shell ge- ometry derived from studies of the emission lines is not uniquely known, although the polar shell-equatorial ring geometry does seem to be a plausible idea. However, the
© American Astronomical Society • Provided by the NASA Astrophysics Data System
1980
AJ
85.
.28
33
286 SEAQUIST ET AL.: NOVA VI500 GYGNI 286
Table III. Other sources in the field of V1500 Cygni from WSRT observations.
Source Number Equatorial Coordinates (1950.0) Flux Density (mJy)
$0.6 S ] 4 Remarks
1 2 3 4 5 6 7 8 9
10 11 12 13 14 15 16 17 18 19 20 21 22 23 24 25 26 27 28
21h04n
04 05 06 07 08 09 09 09 09 09 10 10 10 11 11 11 11 12 12 12 12 13 13 13 14 14 15
34.s5 57.1 22.7 40.6 01.4 02.3 13.2 24.2 50.5 50.8 58.7 31.3 48.9 49.8 02.8 03.7 09.7 23.4 03.2 04.2 43.1 57.2 01.2 16.2 25.0 01.3 52.4 25.4
+47°39/09//
47 59 30 48 47 47 47 48 48 48 48 47
47 47 47 48 48 48 48
47 47 48
14 33 16 16 40 15 40 03 04 03 04 32 41 35 14 46 33 34
48 09 55 47 53 38
34 01 44 30 17 33 05 22 17 23 55 56 27 14
48 04 31 48 03 32 47 21 53 47 47 24 48 41 09
53 39 31 03 33 32
70 ±8 83 ± 6 96 ± 6 51 ± 6 24 ± 3 65 ± 4
<25 <25 103 ± 5 <25 <25 <25
17 ± 2 <25
75 ± 3 30 ± 4
<25 140 ± 4 121 ± 3
27 ± 4 296 ± 6
Confused 342 ± 10
77 ± 4 1185 ± 39
48 ± 4 217 ± 10 509 ± 24
51 ± 2 10 ± 1 12 ± 1
12 i 2 15 ± 1 12 ± 1 10
27 =fc 1 53 ± 1
15 ± 1 82 ± 4
102 ± 3
229 ± 15 170 ± 18
63 ± 8
S5.o < 3 mJy
LHE499
46 + 48.53
radio emission may indicate the presence of components not apparent in the emission-line data. As we shall see later, ionized gas which is too tenuous to emit significant emission lines may, nevertheless, be optically thick at radio wavelengths, and hence readily detectable. In this case, the emission lines provide an incomplete picture of the shell geometry, and it seems reasonable to make the simplest assumptions possible. Secondly, the continuum thermal emission from the shell is not very sensitive to moderate departures from spherical symmetry, as sug- gested by the analysis of Seaquist and Palimaka (1977). It is sensitive, however, to the radial density gradient and motion of the shell boundaries. Moreover, Ennis et al. (1977) found that a spherically symmetric shell repre- sents an adequate fit to the IR data, a further indication perhaps that the behavior is not very sensitive to depar- tures from spherical symmetry.
We consider first the type of model investigated by Ennis et al, and later wide shell models of the type in- vestigated by Seaquist and Palimaka (1977).
a) Narrow Shell Models
We have made detailed calculations (not shown) which confirm that a narrow shell model of the type proposed by Ennis et al. (1977) provides an adequate fit to the IR data. However, this model is a poor fit to the radio data. The peak flux densities for the theoretical curves in each case occur far too late in comparison to the data, regardless of the numerical value adopted for the sound speed. The discord is a manifestation of the slow expansion velocity required by the IR data {v ^
1000 kms-1 for/) = 1 kpc), whereas the rapid increase in radio flux densities during the radio optically thick phase requires a surface expanding with v »' 1000 km s"1.
A further problem with the uniform narrow shell is that it does not predict the correct slope of the radio spectrum during the optically thick phase. For a uniform narrow shell there is a rapid transition near rv = 1 from a flat spectrum at high frequencies to a behavior at low frequencies such that Sv « v2. The optically thick radio spectrum for April 15, 1976, an epoch with several data points available, possesses a slope which is roughly unity instead of 2.0. This difference indicates the presence of significant inhomogeneities in the density distribution, such that different regions become optically thick at different frequencies. These inhomogeneities may occur on small or large scale, or both. We concluded that the uniform narrow shell model extrapolated forward in time does not adequately account for the radio behavior.
An alternative approach is to consider models which fit the radio data, and to see how they fit the IR data. The possibility of large-scale inhomogeneity in the shell leads us to consider a wide shell with a density gradient, similar to that considered by Seaquist and Palimaka (1977) for Nova FH Ser.
b) Wide Shell Models
There is abundant evidence in the optical data to suggest that the ejecta do form a wide shell, as pointed out earlier. We adopted the view that a shell was ejected essentially instantaneously compared with the time scale
© American Astronomical Society • Provided by the NASA Astrophysics Data System
1980
AJ
85.
.28
33
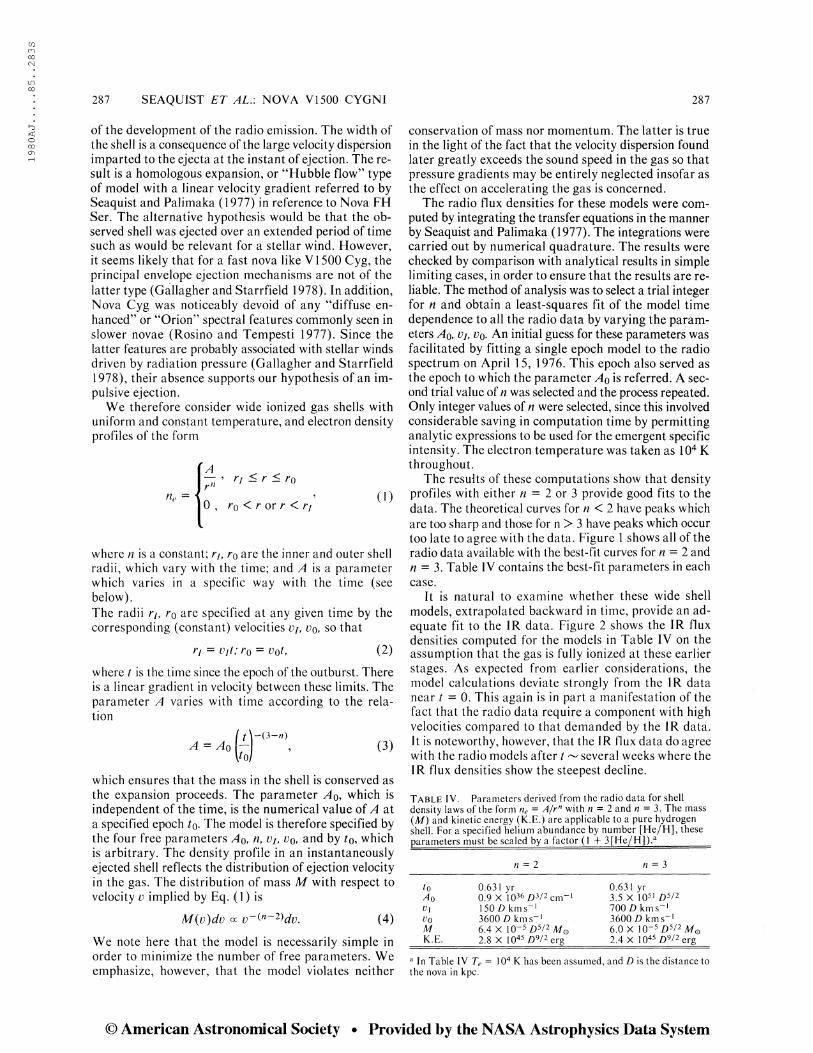
287 SEAQUIST ET AL.: NOVA VI500 CYGNI 287
of the development of the radio emission. The width of the shell is a consequence of the large velocity dispersion imparted to the ejecta at the instant of ejection. The re- sult is a homologous expansion, or “Hubble flow” type of model with a linear velocity gradient referred to by Seaquist and Palimaka (1977) in reference to Nova FH Ser. The alternative hypothesis would be that the ob- served shell was ejected over an extended period of time such as would be relevant for a stellar wind. However, it seems likely that for a fast nova like V1500 Cyg, the principal envelope ejection mechanisms are not of the latter type (Gallagher and Starrfield 1978). In addition, Nova Cyg was noticeably devoid of any “diffuse en- hanced” or “Orion” spectral features commonly seen in slower novae (Rosino and Tempesti 1977). Since the latter features are probably associated with stellar winds driven by radiation pressure (Gallagher and Starrfield 1978), their absence supports our hypothesis of an im- pulsive ejection.
We therefore consider wide ionized gas shells with uniform and constant temperature, and electron density profiles of the form
ne
r¡ < r < r0
ro < r or r < n (1)
where /7 is a constant; ri, r0 are the inner and outer shell radii, which vary with the time; and a! is a parameter which varies in a specific way with the time (see below). The radii rj, r0 are specified at any given time by the corresponding (constant) velocities vj, uq, so that
G = vjt; r0 = u0t, (2)
where t is the time since the epoch of the outburst. There is a linear gradient in velocity between these limits. The parameter A varies with time according to the rela- tion
I ¿W3-«) ^ = ^oH ’ (3) Vo/
which ensures that the mass in the shell is conserved as the expansion proceeds. The parameter Aq, which is independent of the time, is the numerical value of A at a specified epoch The model is therefore specified by the four free parameters Aq, n, v¡, vq, and by to, which is arbitrary. The density profile in an instantaneously ejected shell reflects the distribution of ejection velocity in the gas. The distribution of mass M with respect to velocity v implied by Eq. (1) is
M(v)dv oc v~^n~2^dv. (4)
We note here that the model is necessarily simple in order to minimize the number of free parameters. We emphasize, however, that the model violates neither
conservation of mass nor momentum. The latter is true in the light of the fact that the velocity dispersion found later greatly exceeds the sound speed in the gas so that pressure gradients may be entirely neglected insofar as the effect on accelerating the gas is concerned.
The radio flux densities for these models were com- puted by integrating the transfer equations in the manner by Seaquist and Palimaka (1977). The integrations were carried out by numerical quadrature. The results were checked by comparison with analytical results in simple limiting cases, in order to ensure that the results are re- liable. The method of analysis was to select a trial integer for n and obtain a least-squares fit of the model time dependence to all the radio data by varying the param- eters Aq, Vj, vq. An initial guess for these parameters was facilitated by fitting a single epoch model to the radio spectrum on April 15, 1976. This epoch also served as the epoch to which the parameter Ao is referred. A sec- ond trial value of n was selected and the process repeated. Only integer values of n were selected, since this involved considerable saving in computation time by permitting analytic expressions to be used for the emergent specific intensity. The electron temperature was taken as 104 K throughout.
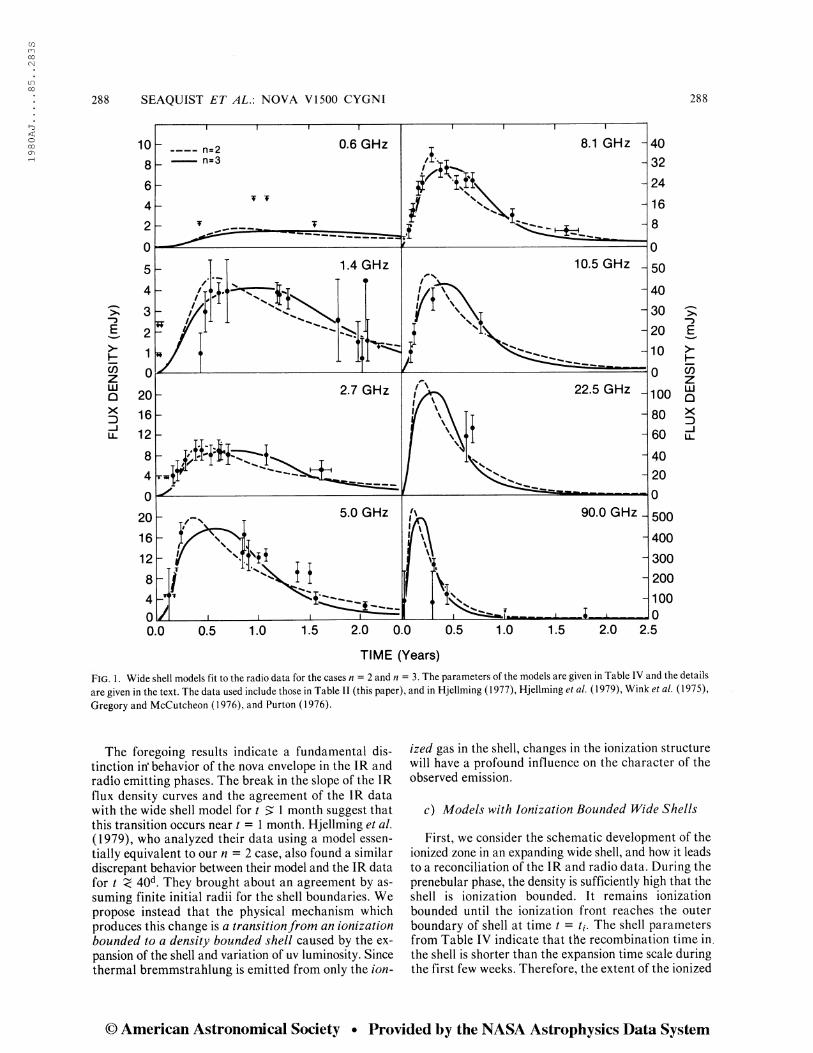
The results of these computations show that density profiles with either « = 2 or 3 provide good fits to the data. The theoretical curves for /? < 2 have peaks which are too sharp and those for n > 3 have peaks which occur too late to agree with the data. Figure 1 shows all of the radio data available with the best-fit curves for « = 2 and n = 3. Table IV contains the best-fit parameters in each case.
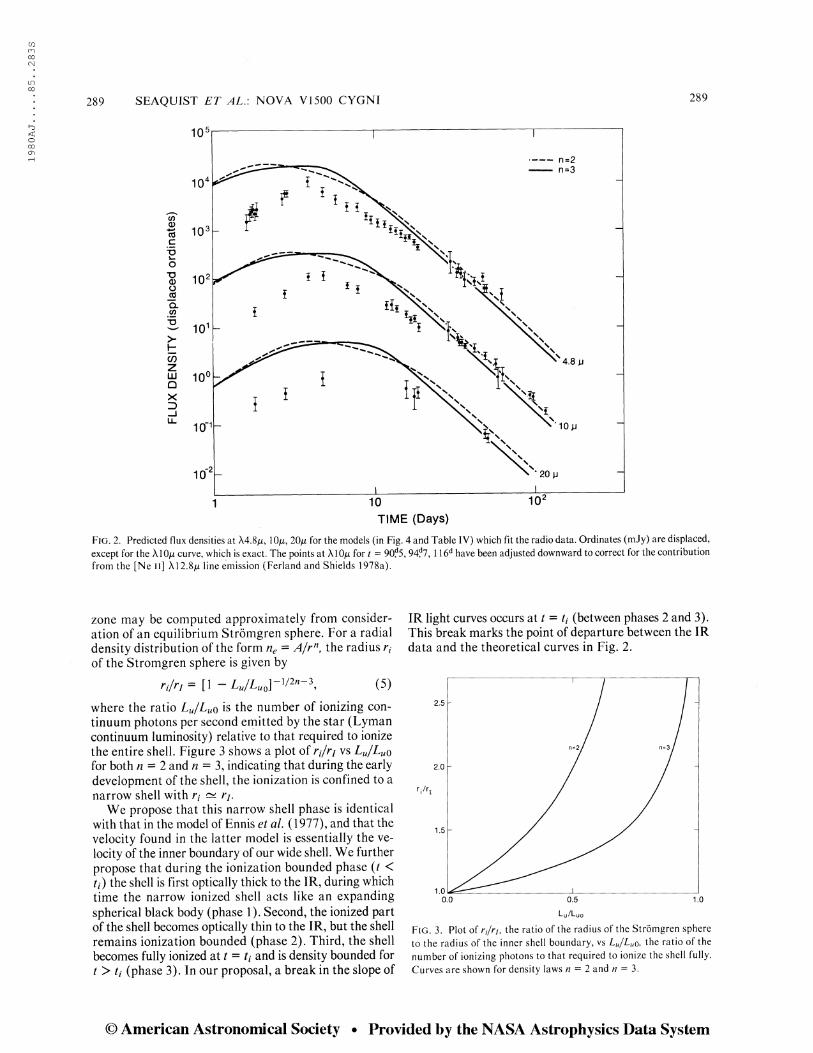
It is natural to examine whether these wide shell models, extrapolated backward in time, provide an ad- equate fit to the IR data. Figure 2 shows the IR flux densities computed for the models in Table IV on the assumption that the gas is fully ionized at these earlier stages. As expected from earlier considerations, the model calculations deviate strongly from the IR data near t = 0. This again is in part a manifestation of the fact that the radio data require a component with high velocities compared to that demanded by the IR data. It is noteworthy, however, that the IR flux data do agree with the radio models after t ~ several weeks where the IR flux densities show the steepest decline.
Table IV. Parameters derived from the radio data for shell density laws of the form ne = A/rn with « = 2 and « = 3. The mass (A/) and kinetic energy (K.E.) are applicable to a pure hydrogen shell. For a specified helium abundance by number [He/H], these parameters must be scaled by a factor (1 + 3[He/H]).a
to Ao
M K.E.
0.631 yr 0.9 X 1036 Z)3/2 cm“1
150 D kms-1
3600 Z) kms“1
6.4 X 10“5 Z)5/2 2.8 X 1045 D9/2 erg
0.631 yr 3.5 X 1051 Z)5/2
700 D kms-1
3600 D kms-1
6.0 X 10⁻⁵£>5/2 Mo 2.4 X 1045 D9/2 erg
a In Table IV 77 = 104 K has been assumed, and D is the distance to the nova in kpc.
© American Astronomical Society • Provided by the NASA Astrophysics Data System
288
C/} 00 00 CM
LO 00
'o c o 00 CO
288 SEAQUIST ET AL.: NOVA VI500 CYGNI
>s “D E > H co Z LU D X 3
TIME (Years)
FIG. 1. Wide shell models fit to the radio data for the cases « = 2 and « = 3. The parameters of the models are given in Table IV and the details are given in the text. The data used include those in Table II (this paper), and in Hjellming (1977), Hjellming et al. (1979), Wink et al. (1975), Gregory and McCutcheon (1976), and Purton (1976).
The foregoing results indicate a fundamental dis- tinction in’behavior of the nova envelope in the IR and radio emitting phases. The break in the slope of the IR flux density curves and the agreement of the IR data with the wide shell model for / > 1 month suggest that this transition occurs near t = 1 month. Hjellming et al. (1979), who analyzed their data using a model essen- tially equivalent to our n = 2 case, also found a similar discrepant behavior between their model and the IR data for t < 40d. They brought about an agreement by as- suming finite initial radii for the shell boundaries. We propose instead that the physical mechanism which produces this change is a transition from an ionization bounded to a density bounded shell caused by the ex- pansion of the shell and variation of uv luminosity. Since thermal bremmstrahlung is emitted from only the ion-
ized gas in the shell, changes in the ionization structure will have a profound influence on the character of the observed emission.
c) Models with Ionization Bounded Wide Shells
First, we consider the schematic development of the ionized zone in an expanding wide shell, and how it leads to a reconciliation of the IR and radio data. During the prenebular phase, the density is sufficiently high that the shell is ionization bounded. It remains ionization bounded until the ionization front reaches the outer boundary of shell at time t = ti. The shell parameters from Table IV indicate that the recombination time in. the shell is shorter than the expansion time scale during the first few weeks. Therefore, the extent of the ionized
© American Astronomical Society • Provided by the NASA Astrophysics Data System
289 SEAQUIST ET AL.: NOVA VI500 CYGNI 289
C/} 00 00 CN
LO 00
Fig. 2. Predicted flux densities at A4.8)U, 10^, 20fx for the models (in Fig. 4 and Table IV) which fit the radio data. Ordinates (mJy) are displaced, except for the AlO/u curve, which is exact. The points at AlO/z for t = 90?5, 94?7, 116d have been adjusted downward to correct for the contribution from the [Ne il] Al2.8ju line emission (Ferland and Shields 1978a).
zone may be computed approximately from consider- ation of an equilibrium Strömgren sphere. For a radial density distribution of the form ne = A/rn, the radius r/ of the Stromgren sphere is given by
[i - (5)
where the ratio Lu/Luq is the number of ionizing con- tinuum photons per second emitted by the star (Lyman continuum luminosity) relative to that required to ionize the entire shell. Figure 3 shows a plot of r^rj vs Lu/Luo for both n = 2 and /? = 3, indicating that during the early development of the shell, the ionization is confined to a narrow shell with rz ^ r¡.
We propose that this narrow shell phase is identical with that in the model of Ennis et al. (1977), and that the velocity found in the latter model is essentially the ve- locity of the inner boundary of our wide shell. We further propose that during the ionization bounded phase {t < U) the shell is first optically thick to the IR, during which time the narrow ionized shell acts like an expanding spherical black body (phase 1). Second, the ionized part of the shell becomes optically thin to the IR, but the shell remains ionization bounded (phase 2). Third, the shell becomes fully ionized at t = and is density bounded for t > ti (phase 3). In our proposal, a break in the slope of
IR light curves occurs at i = ti (between phases 2 and 3). This break marks the point of departure between the IR data and the theoretical curves in Fig. 2.
Fig. 3. Plot of g/o, the ratio of the radius of the Strömgren sphere to the radius of the inner shell boundary, vs Lu/Luq, the ratio of the number of ionizing photons to that required to ionize the shell fully. Curves are shown for density laws n = 2 and « = 3.
© American Astronomical Society • Provided by the NASA Astrophysics Data System
290 SEAQUIST ET AL.: NOVA VI500 CYGNI 290
w oo oo CN
LO oo
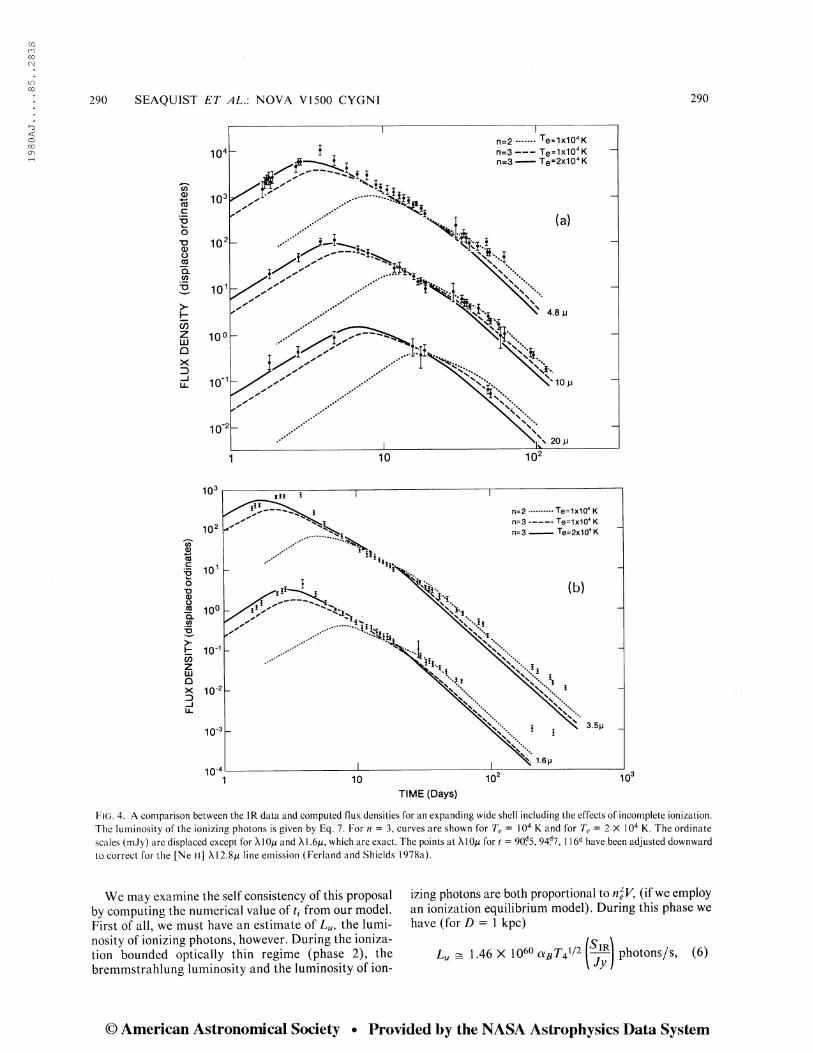
Fig. 4. A comparison between the IR data and computed flux densities for an expanding wide shell including the effects of incomplete ionization. The luminosity of the ionizing photons is given by Eq. 7. For n = 3, curves are shown for Te = 104 K and for 77, = 2 X 10⁴ K. The ordinate scales (mJy) are displaced except for WO/i and Xl .6/u, which are exact. The points at XlO/u for t = 90?5, 94?7, 116d have been adjusted downward to correct for the [Ne II] Xl2.8ju line emission (Ferland and Shields 1978a).
We may examine the self consistency of this proposal by computing the numerical value of ti from our model. First of all, we must have an estimate of LUt the lumi- nosity of ionizing photons, however. During the ioniza- tion bounded optically thin regime (phase 2), the bremmstrahlung luminosity and the luminosity of ion-
izing photons are both proportional to n^V, (if we employ an ionization equilibrium model). During this phase we have (for Z) = 1 kpc)
Lu ^ 1.46 X 1060 clbTaXI1 photons/s, (6)
© American Astronomical Society • Provided by the NASA Astrophysics Data System
1980
AJ
85.
.28
33
291 SEAQUIST ET AL.: NOVA VI500 CYGNI 291
where Sir refers to wavelengths where hv « &T, and aB densities for t < 40d that are required by the wide shell is the recombination coefficient for Menzel case B. An models, examination of the IR data for t < 60d yields
Lu ^ 7.1 X lO^jy/2 t \-1.94 —J phMons/s. (7)
The epoch for complete ionization of the wide shell may then be computed from a consideration of ionization equilibrium. Using » rj, we obtain
Luiti) AtTObAI /?0\2(3—«)
(In - 3)(i;/?()2«-3(//] (8)
The numerical values of Aq and v¡ are obtained from Table IV. Combining Eqs. (7) and (8), we obtain ti = 46d for « = 2 and ti = 22d for « = 3. These values are indeed close to the time at which the departure occurs between the IR data and the theoretical curves in Fig. 2.
A more complete test of this suggestion may be made by computing in addition the entire IR light curve as a function of time, with Lu given by Eq. (7). The IR flux density may be computed for any given time once the width of the ionized part of the shell is known. The radius (//) of the ionization boundary for any time t is given by
(i)2'2“3 = (i)2'2"3 _ O - i)Lu M2u-«). [nj \o) 4-KaBAl \toj
The IR optical depth was computed from formulae given by Lang (1974). The free-free and bound-free gaunt factors were obtained, respectively, from Karzas and Latter (1961) and Aller and Liller (1968).
Figure 4 shows the results for the calculated IR light curves for « = 2 and n = 3. For the case « = 3, curves are shown for both Te = 104 K and 7^, = 2 X 10⁴ K. The results show fairly good agreement with the data for n = 3 and 7^ = 2 X 10⁴ K. In the optically thick region, there is poor agreement however with n = 2 although this model gives better agreement for t > ti. It should be re- called that the parameters for the thick shell model were derived earlier for Te= 104 K. Acceptance of = 2 X 10⁴ K in the early IR phase for w = 3 would require that the gas kinetic temperature be higher during this phase. In fact, the analysis of Ferland and Shields (1978b) in- dicates that the temperature decreases with time by about a factor of 2, although they find that the span of time over which this occurs is about three years.
We conclude that if the assumption of spherical symmetry is valid, the combination of the radio and IR data favors the n = 3 (steeper density gradient) model with Te = 2 X 10⁴ K. It is probable, however, that a model with more complex geometry would modify this* conclusion to some degree, and that either n = 2or n = 3 models may be acceptable. A more compelling con- clusion of this analysis is that the assumption of an ion- ization bounded shell removes the excessive IR flux
IV. DISCUSSION
The foregoing discussion suggests that effects in an ionization bounded nebula are observable in the radio and IR emission during the early development of the shell. It is noteworthy that Gallagher (1977) applied a Strömgren sphere ionization model to VI500 Cyg and found that the ionization time scale is ~40d. From sim- ilar arguments Strittmatter et al. ( 1977) conclude that the ionization-bounded phase lasted about a month. These estimates are in excellent accord with our own based on entirely independent data. This conclusion is also consistent with the observation of neutral oxygen lines throughout the decline (Ferland and Shields 1978b) indicating that some portion of the ejecta were optically thick to ionizing photons.
In the foregoing picture, the optically thin IR emission during t < ti is a direct measure of the rate of emission of ionizing photons during this interval. This interpre- tation suggests a possible reason for the unusual behavior of the IR light curves near their peaks. Figure 5 of Ennis et al. (1977) shows a precipitous drop in the IR emission at the beginning of the optically thin phase with a shal- lower slope beginning at t ~ 5d. Ennis et al. do not dis- cuss the origin of this behavior, although it is clear that it is not explained by their narrow shell model. It is probable that this sharp drop is a direct consequence of a corresponding drop in the ionizing flux intercepted by the shell. Since the shell is ionization bounded, the vol- ume emission measure (n2
e V), and therefore the IR lu- minosity, is proportional to the luminosity of ionizing photons, as pointed out earlier. Rosino and Tempesti (1977) note that the visual light curve also exhibits a break in the slope at i = 3?7 with the steeper slope at t < 3?7. Therefore the observable effects of an ionization bounded shell provide a natural explanation for this behavior if the visual and uv light curves possess a similar break in slope.
The outer velocity ¿;o in the model used to fit the radio data is dependent upon the assumed distance to the nova. A comparison of the velocity with the maximum velocity observed in the absorption line spectrum could in prin- ciple provide an estimate of the distance to the nova using Table IV. This maximum velocity is not easily observ- able, however. Table 9 of Rosino and Tempesti (1977) shows a maximum velocity of 5,000 km s“1 which suggests 7) = 1.4 kpc. Various methods of deriving the distance to the nova are summarized by Neff, Smith, and Ketelsen (1978). The derived distances range from 0.8 kpc to 2.7 kpc. These authors themselves find 7) = 1.6 =fc 0.2 kpc from an estimate of the color excess and the distance reddening law found by Schild (1976). These values are consistent with 7) = 1.4 kpc, although we stress that we cannot consider the latter figure to be an accurate determination.
© American Astronomical Society • Provided by the NASA Astrophysics Data System
1980
AJ
85.
.28
33
292 SEAQUIST ET AL.: NOVA VI500 CYGNI 292
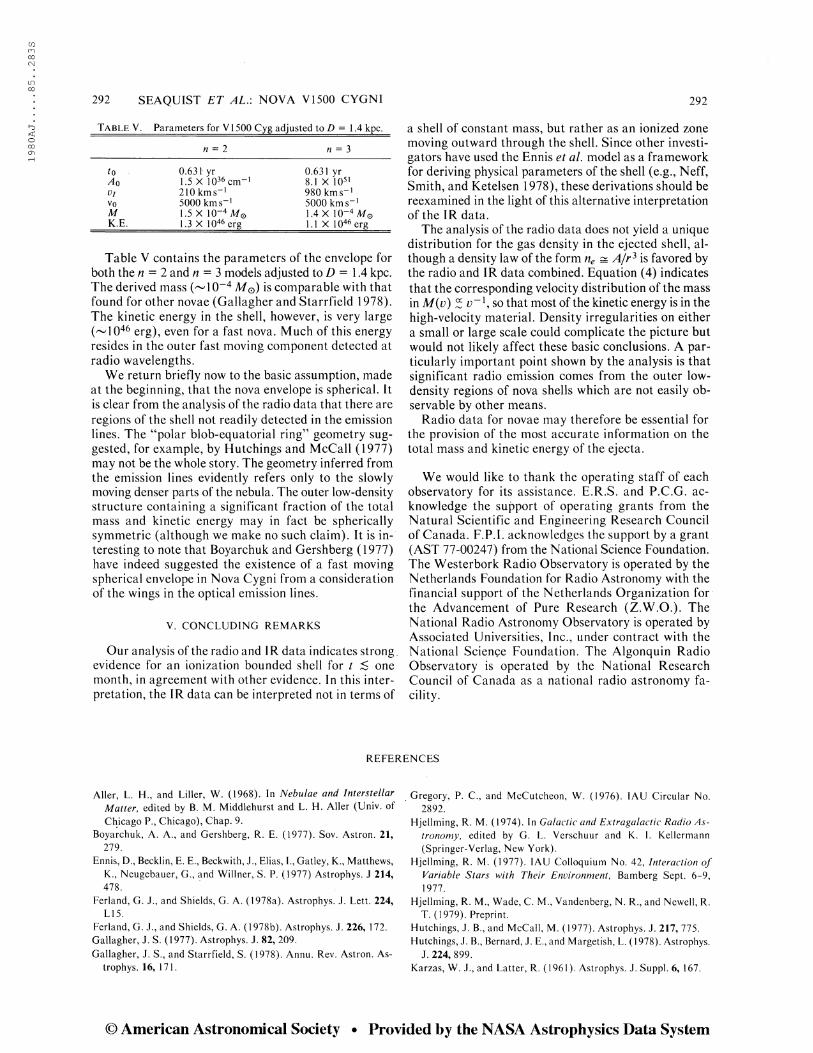
Table V. Parameters for V1500 Cyg adjusted to D - 1.4 kpc.
« = 2 « = 3
to Ao vi vo M K.E.
0.631' yr 1.5 X 1036 cm-1
210 kms-1
5000 kms-1
1.5 X 10“4 M© 1.3 X 1046 erg
0.631 yr 8.1 X 1051
980 kms“1
5000 kms-1
1.4 X 10⁻⁴ M0 1.1 X 1046 erg
Table V contains the parameters of the envelope for both the = 2 and « = 3 models adjusted to /) = 1.4 kpc. The derived mass ('MO-4 M0) is comparable with that found for other novae (Gallagher and Starrfield 1978). The kinetic energy in the shell, however, is very large (MO46 erg), even for a fast nova. Much of this energy resides in the outer fast moving component detected at radio wavelengths.
We return briefly now to the basic assumption, made at the beginning, that the nova envelope is spherical. It is clear from the analysis of the radio data that there are regions of the shell not readily detected in the emission lines. The “polar blob-equatorial ring” geometry sug- gested, for example, by Hutchings and McCall (1977) may not be the whole story. The geometry inferred from the emission lines evidently refers only to the slowly moving denser parts of the nebula. The outer low-density structure containing a significant fraction of the total mass and kinetic energy may in fact be spherically symmetric (although we make no such claim). It is in- teresting to note that Boyarchuk and Gershberg (1977) have indeed suggested the existence of a fast moving spherical envelope in Nova Cygni from a consideration of the wings in the optical emission lines.
V. CONCLUDING REMARKS
Our analysis of the radio and IR data indicates strong. evidence for an ionization bounded shell for t ;$ one month, in agreement with other evidence. In this inter- pretation, the IR data can be interpreted not in terms of
a shell of constant mass, but rather as an ionized zone moving outward through the shell. Since other investi- gators have used the Ennis et al. model as a framework for deriving physical parameters of the shell (e.g., Neff, Smith, and Ketelsen 1978), these derivations should be reexamined in the light of this alternative interpretation of the IR data.
The analysis of the radio data does not yield a unique distribution for the gas density in the ejected shell, al- though a density law of the form ne ^ A/r3 is favored by the radio and IR data combined. Equation (4) indicates that the corresponding velocity distribution of the mass in M(v) Zv~\ so that most of the kinetic energy is in the high-velocity material. Density irregularities on either a small or large scale could complicate the picture but would not likely affect these basic conclusions. A par- ticularly important point shown by the analysis is that significant radio emission comes from the outer low- density regions of nova shells which are not easily ob- servable by other means.
Radio data for novae may therefore be essential for the provision of the most accurate information on the total mass and kinetic energy of the ejecta.
We would like to thank the operating staff of each observatory for its assistance. E.R.S. and P.C.G. ac- knowledge the support of operating grants from the Natural Scientific and Engineering Research Council of Canada. F.P.I. acknowledges the support by a grant (AST 77-00247) from the National Science Foundation. The Westerbork Radio Observatory is operated by the Netherlands Foundation for Radio Astronomy with the financial support of the Netherlands Organization for the Advancement of Pure Research (Z.W.O.). The National Radio Astronomy Observatory is operated by Associated Universities, Inc., under contract with the National Science Foundation. The Algonquin Radio Observatory is operated by the National Research Council of Canada as a national radio astronomy fa- cility.
REFERENCES
Aller, L. H., and Filler, W. (1968). In Nebulae and Interstellar Matter, edited by B. M. Middlehurst and L. H. Aller (Univ. of Chicago P., Chicago), Chap. 9.
Boyarchuk, A. A., and Gershberg, R. E. (1977). Sov. Astron. 21, 279.
Ennis, D., Becklin, E. E., Beckwith, J., Elias, F, Gatley, K., Matthews, K., Neugebauer, G., and Willner, S. P. (1977) Astrophys. J 214, 478.
Ferland, G. J., and Shields, G. A. (1978a). Astrophys. J. Lett. 224, LI 5.
Ferland, G. J., and Shields, G. A. (1978b). Astrophys. J. 226, 172. Gallagher, J. S. (1977). Astrophys. J. 82, 209. Gallagher, J. S., and Starrfield, S. (1978). Annu. Rev. Astron. As-
trophys. 16, 171.
Gregory, P. C., and McCutcheon, W. (1976). IAU Circular No. 2892.
Hjellming, R. M. (1974). In Galactic and Extragalactic Radio As- tronomy, edited by G. L. Verschuur and K. I. Kellermann (Springer-Verlag, New York).
Hjellming, R. M. (1977). IAU Colloquium No. 42, Interaction of Variable Stars with Their Environment, Bamberg Sept. 6-9, 1977.
Hjellming, R. M., Wade, C. M., Vandenberg, N. R., and Newell, R. T. (1979). Preprint.
Hutchings, J. B., and McCall, M. (1977). Astrophys. J. 217, 775. Hutchings, J. B., Bernard, J. E., and Margetish, L. ( 1978). Astrophys.
J. 224, 899. Karzas, W. J., and Latter, R. (1961). Astrophys. J. Suppl. 6, 167.
© American Astronomical Society • Provided by the NASA Astrophysics Data System
1980
AJ
85.
.28
33
293 SEAQUIST ET AL.: NOVA VI500 CYGNI
Lang, K. R. (1974). Astrophysical Formulae (Springer-Verlag, New York), Chap. 1.
Neff, J. S., Smith, V. V., and Ketelsen, D. A. (1978). Astrophys. J. Suppl. 38, 89.
Purton, C. R. (1976). Private communication. Rosino, L.. and Tempesti, P. (1977). Sov. Astron. 21, 291. Schild, R. E. (1976). Astrophys. J. Lett. 209, 35.
293
Seaquist, E. R., and Palimaka, John (1977). Astrophys. J. 217, 781.
Strittmatter, P. A., Woolf, N. J., Thompson, R. L, Wilkerson, S., Angel, J. R. P., Stockman, H. S., and Gilbert, G. (1977). Astrophys. J. 216, 23.
Wink, T. E., Von Kap-herr, A., and Altenhoff, W. J. (1975). IAU Circular No. 2851.
© American Astronomical Society • Provided by the NASA Astrophysics Data System