multiple data clustering algorithms applied in search of patterns of clay minerals in soils close to...
TRANSCRIPT

Applied Clay Science 46 (2009) 1–6
Contents lists available at ScienceDirect
Applied Clay Science
j ourna l homepage: www.e lsev ie r.com/ locate /c lay
Multiple data clustering algorithms applied in search of patterns of clay minerals insoils close to an abandoned manganese oxide mine
G-I.E. Ekosse a,⁎, K.S. Mwitondi b
a Directorate of Research Development, Walter Sisulu University, Private Bag XI Mthatha, Eastern Cape 5117, South Africab Computing and Communication Research Group, Faculty of Arts, Computing, Engineering and Sciences, Sheffield Hallam University, Sheffield S1 1WB, UK
⁎ Corresponding author.E-mail address: [email protected] (G.-I.E. Ekosse).
0169-1317/$ – see front matter © 2009 Elsevier B.V. Aldoi:10.1016/j.clay.2009.06.018
a b s t r a c t
a r t i c l e i n f oArticle history:Received 19 December 2008Received in revised form 7 June 2009Accepted 9 June 2009Available online 26 June 2009
Keywords:Data miningKaoliniteModel reliabilityMultiple clustering algorithmsMuscoviteOver-fitting
This paper proposes a multi-level approach to data clustering and provides a novel approach to char-acterisation of clay soils by, effectively, looking at the same clay sample from different angles. It is shown thatusing this approach can help avoid detection of spurious clusters or skipping vital natural grouping in data.Muscovite, illite and kaolinite were identified by X-ray diffraction (XRD) in b4 μm fraction of soil samplesobtained from the periphery of an abandonedmanganese oxide mine and semi quantified as major, minor andtrace. Based on information inherent in the data attributes, useful rules for grouping the samples weregenerated andwith the aid of multiple data clustering, applied to characterize the clayminerals occurrences inthe soils. The paper found that the presence of large quantities of illite and kaolinite heavily influence theformation of clusters. When the most influential variables—LJ and KJ were taken out, the resulting modelshowed that muscovite traces play a vital role in initial cluster building and the importance matrix of inputssuggested inter-dependence betweenmuscovite, kaolinite and illite traces as well as between them andminorquantities of illite. Dwelling on aspects of claymineralogyandmodelling sciences, the papermarks a significantdeparture from the conventional approaches to clay characterisation by showing how effectively data miningmethods can be adopted in the area. For a successful approach to characterisation of clay minerals in Africansoils, the paper recommends to set-up data repositories thatwill provide scientific data sources and forums in amulti-disciplinary environment. This is particularly important as capturing interesting patterns requires expertknowledge describing the emerging natural groupings.
© 2009 Elsevier B.V. All rights reserved.
1. Introduction
Soil mineral components and how they impact on agriculture,environment, health and other aspects of life have been widelystudied using a variety of statistical methods. Bianchini et al. (2002)investigated distributions of two groups of soil samples in order toestablish whether or not high heavy-metal concentrations wererelated to urban–industrial–agricultural activities or original litholo-gies. Statistical studies of over 2000 samples of soil clay fraction fromIvory Coast, Nigeria, Tanzania, and Uganda (Asadu et al., 1997)revealed significant correlations between all the data attributes andthe effective cation exchange capacity (ECEC). Using conventionalstatistical methods, Tombale (1986) interpreted sediments of theJwaneng area, and Ekosse and Fouche (2006a) studied abundance anddistribution patterns of haematite and goethite in soils close to anabandoned manganese oxide (MnOx) mine in Kgwakgwe, both inBotswana. Other conventional statistical approaches include applica-tions of principal components analysis (Jongman et al., 1995), and
l rights reserved.
impact of noisy environmental data on canonical correspondence(McCune, 1997).
One of themainproblems tackled in datamining is data clustering—a technique used in detecting naturally arising groups in data whendata class labels are not known. Data clustering, which describes a setof mainly distribution-free algorithms, belongs to the data miningfamily of algorithms for extracting knowledge from data (Kogan,2007; Valiant, 1984). Kogan (2007) provides mathematically rigor-ous approaches to data clustering withmain clustering issues such asfunction smoothing fully addressed. A statistical version of datamining is provided by Hastie et al. (2001) and Taylor and Mwitondi(2001). In the last few years there has been growing interest in theapplications of data mining algorithms in clay and soil analyses.Bianchini et al. (2002) investigated the mineralogical composition ofthe fine fraction of soil using X-ray powder diffraction (XRPD); andidentified groups in data on the basis of their heterogeneity—which isthe main idea of data clustering. Brown et al. (2001) applied neuralnetworks in gold prospecting. Eriksson et al. (2001) used dataminingprocedures in monitoring early fault detection and classification aswell as in identifying relationships between chemical compositionsand biological properties. Taylor and Mwitondi (2001) adapted theexpectation–maximisation (EM) algorithm in detecting structures inecological data. Henderson et al. (2005) applied decision trees in

Fig. 1. Map of the study area showing sampling positions.
Table 1Ten out of the 400 samples in a coded tabular illustration.
Sampleno.
Muscovite Illite Kaolinite
None + ++ +++ None + ++ +++ None + ++ +++
1 0 4 72 0 0 03 1 4 74 0 4 05 1 4 06 0 6 07 1 0 98 0 0 89 1 0 910 0 0 7
(Note:+,++ and+++ correspond to trace, minor andmajor presence respectively ofmuscovite, illite and kaolinite).
2 G.-I.E. Ekosse, K.S. Mwitondi / Applied Clay Science 46 (2009) 1–6
constructing soil property predictions by accessing the Australiannational soils point database. Ekosse and Fouche (2007a,b) appliedassociation rules to elicit inherent relationships among Mn mineralsin soils.
Previous mineralogical study of 400 soil samples from theKgwakgwe area revealed weak correlation coefficients except betweenkaolinite and illite which was moderate (Ekosse and Fouche, 2006b). Asingle clustering model was fitted and generated four clusters but thestudy fell short of addressing core issues such as the way the clusterformation was influenced by the distributions of the data andconsequently how the presence/absence of any one of the claymineralsinfluenced the presence/absence of the other. Apparently, applying asingle clustering model to 400 samples from a confined geographicalarea impaired the validity of its conclusions. The validity of results fromdata clustering models exclusively depend on their ability to captureinteresting groupings in data and on the corresponding expert knowl-edge in providing useful descriptions of those groupings. Themechanicsof typical data clustering algorithm stipulate that the initial number ofclusters be knownprior to its initialisationwhich is paradoxical becauseit is supposed to determine the number of distinguishable clusters.Hence, one of the most frequently asked questions relates to howmanydata clusters to start with for which, unfortunately, there are notheoretical rules. Typically, cluster searching is guided by trial and error,expert knowledge and exploratory data analysis (EDA) results and quiteoften data clustering proceeds by combining the three. This paper seeksto address some of these issues.
The paper takes a novel approach to soil clay minerals characteriza-tion using multiple data clustering algorithms. It proposes an optimalapproach to combining data resources, tools/techniques and technicalskills for thepurposes of capturinganddescribingnatural clusters in clayminerals input data. The algorithms, based on the philosophy of K-Means algorithm (McQueen, 1967), are used to search for naturallyarising structures in clay minerals data obtained from soil sampleswithin the periphery of an abandoned manganese oxide mine. Inparticular, it advances a combination of data clustering techniques as
suitable interpretive methods in elucidating on the mutual influence ofthe clay minerals on each other—which is central towards thecharacterization of Mn contaminated soils at Kgwakgwe.
2. Materials and methods
2.1. Background
This paper forms part of a wide study in understanding environ-mental mining impact on soils close to an abandoned MnOx minewhich has been extensively studied by Ekosse (2008) and Ekosse andFouche (2006a,b), Ekosse and Fouche, 2007a, 2007b) and kaolindeposit (Ekosse, 2001). Both mine and deposit are located in theKgwakgwe area, 4 km south of the Kanye township in southeasternBotswana, between latitudes 24o59' and 25o02', and longitudes 25o17'and 25o20' covering approximately 4 km2 in a 2 km by 2 km space asshown in Fig. 1. Four hundred soil samples were collected from thearea in Fig. 1 using both random techniques highlighted in Jewell et al.(1993) and judgmental techniques described in Crépin and Johnson
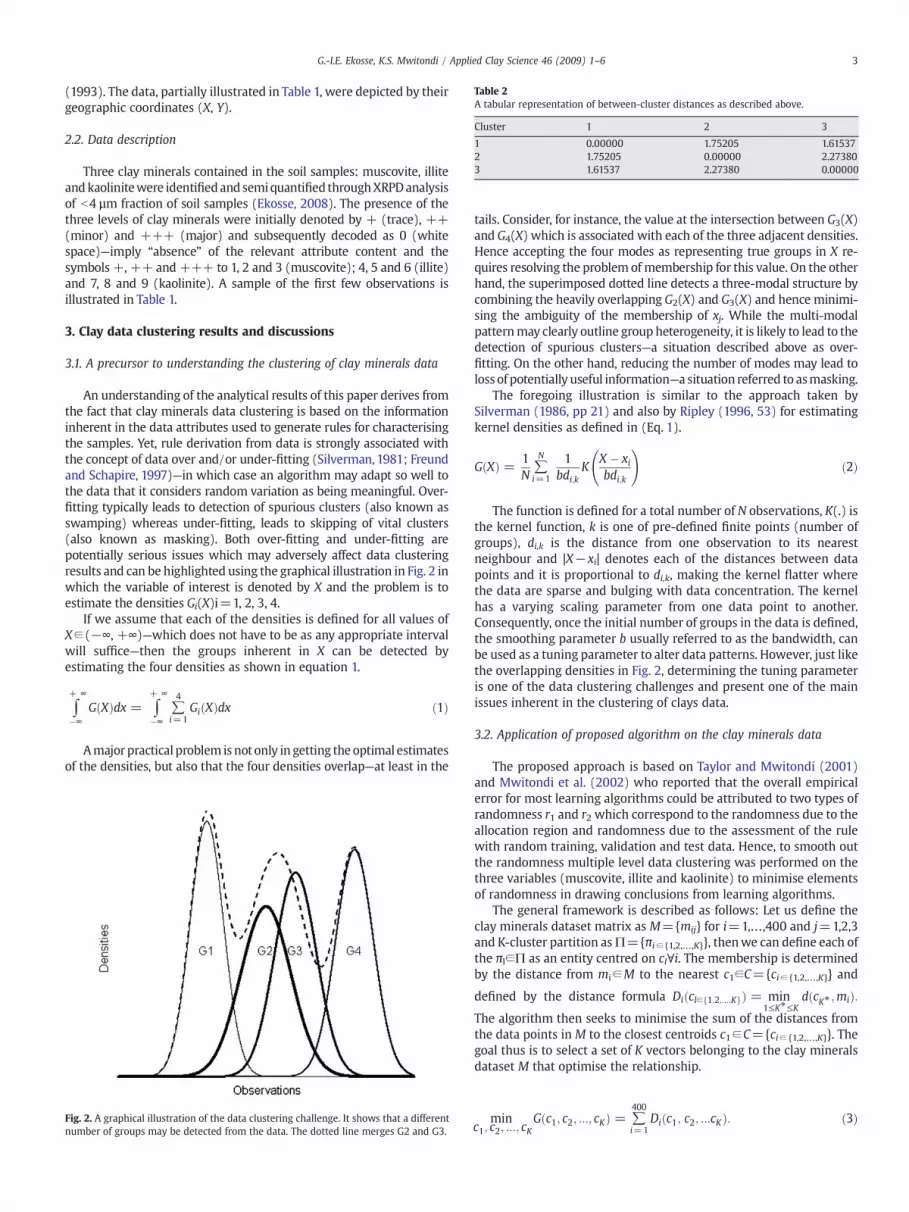
Table 2A tabular representation of between-cluster distances as described above.
Cluster 1 2 3
1 0.00000 1.75205 1.615372 1.75205 0.00000 2.273803 1.61537 2.27380 0.00000
3G.-I.E. Ekosse, K.S. Mwitondi / Applied Clay Science 46 (2009) 1–6
(1993). The data, partially illustrated in Table 1, were depicted by theirgeographic coordinates (X, Y).
2.2. Data description
Three clay minerals contained in the soil samples: muscovite, illiteandkaolinitewere identifiedand semiquantified throughXRPDanalysisof b4 µm fraction of soil samples (Ekosse, 2008). The presence of thethree levels of clay minerals were initially denoted by + (trace), ++(minor) and +++ (major) and subsequently decoded as 0 (whitespace)—imply “absence” of the relevant attribute content and thesymbols +, ++ and +++ to 1, 2 and 3 (muscovite); 4, 5 and 6 (illite)and 7, 8 and 9 (kaolinite). A sample of the first few observations isillustrated in Table 1.
3. Clay data clustering results and discussions
3.1. A precursor to understanding the clustering of clay minerals data
An understanding of the analytical results of this paper derives fromthe fact that clay minerals data clustering is based on the informationinherent in the data attributes used to generate rules for characterisingthe samples. Yet, rule derivation from data is strongly associated withthe concept of data over and/or under-fitting (Silverman, 1981; Freundand Schapire, 1997)—in which case an algorithm may adapt so well tothe data that it considers random variation as being meaningful. Over-fitting typically leads to detection of spurious clusters (also known asswamping) whereas under-fitting, leads to skipping of vital clusters(also known as masking). Both over-fitting and under-fitting arepotentially serious issues which may adversely affect data clusteringresults and can be highlighted using the graphical illustration in Fig. 2 inwhich the variable of interest is denoted by X and the problem is toestimate the densities Gi(X)i=1, 2, 3, 4.
If we assume that each of the densities is defined for all values ofX∈(−∞, +∞)—which does not have to be as any appropriate intervalwill suffice—then the groups inherent in X can be detected byestimating the four densities as shown in equation 1.
∫+ ∞
�∞GðXÞdx = ∫
+ ∞
�∞∑4
i=1GiðXÞdx ð1Þ
Amajor practical problem is not only in getting the optimal estimatesof the densities, but also that the four densities overlap—at least in the
Fig. 2. A graphical illustration of the data clustering challenge. It shows that a differentnumber of groups may be detected from the data. The dotted line merges G2 and G3.
tails. Consider, for instance, the value at the intersection between G3(X)and G4(X) which is associated with each of the three adjacent densities.Hence accepting the four modes as representing true groups in X re-quires resolving the problem ofmembership for this value. On the otherhand, the superimposed dotted line detects a three-modal structure bycombining the heavily overlapping G2(X) and G3(X) and hence minimi-sing the ambiguity of the membership of xj. While the multi-modalpatternmay clearly outline group heterogeneity, it is likely to lead to thedetection of spurious clusters—a situation described above as over-fitting. On the other hand, reducing the number of modes may lead toloss of potentially useful information—a situation referred to asmasking.
The foregoing illustration is similar to the approach taken bySilverman (1986, pp 21) and also by Ripley (1996, 53) for estimatingkernel densities as defined in (Eq. 1).
GðXÞ = 1N
∑N
i=1
1bdi;k
KX � xibdi;k
!ð2Þ
The function is defined for a total number of N observations, K(.) isthe kernel function, k is one of pre-defined finite points (number ofgroups), di,k is the distance from one observation to its nearestneighbour and |X−xi| denotes each of the distances between datapoints and it is proportional to di,k, making the kernel flatter wherethe data are sparse and bulging with data concentration. The kernelhas a varying scaling parameter from one data point to another.Consequently, once the initial number of groups in the data is defined,the smoothing parameter b usually referred to as the bandwidth, canbe used as a tuning parameter to alter data patterns. However, just likethe overlapping densities in Fig. 2, determining the tuning parameteris one of the data clustering challenges and present one of the mainissues inherent in the clustering of clays data.
3.2. Application of proposed algorithm on the clay minerals data
The proposed approach is based on Taylor and Mwitondi (2001)and Mwitondi et al. (2002) who reported that the overall empiricalerror for most learning algorithms could be attributed to two types ofrandomness r1 and r2 which correspond to the randomness due to theallocation region and randomness due to the assessment of the rulewith random training, validation and test data. Hence, to smooth outthe randomness multiple level data clustering was performed on thethree variables (muscovite, illite and kaolinite) to minimise elementsof randomness in drawing conclusions from learning algorithms.
The general framework is described as follows: Let us define theclay minerals dataset matrix as M={mij} for i=1,…,400 and j=1,2,3and K-cluster partition asΠ={πi∈ {1,2,…,K}}, thenwe can define each ofthe πl∈Π as an entity centred on cl∀i. The membership is determinedby the distance from mi∈M to the nearest c1∈C={ci∈ {1,2,…,K}} and
defined by the distance formula Diðcl∈f1;2;:::;KgÞ = min1≤K*≤K
dðcK* ;miÞ:The algorithm then seeks to minimise the sum of the distances fromthe data points in M to the closest centroids c1∈C={ci∈ {1,2,…,K}}. Thegoal thus is to select a set of K vectors belonging to the clay mineralsdataset M that optimise the relationship.
minc1; c2; :::; cK
Gðc1; c2; :::; cKÞ = ∑400
i=1Diðc1; c2; :::cKÞ: ð3Þ
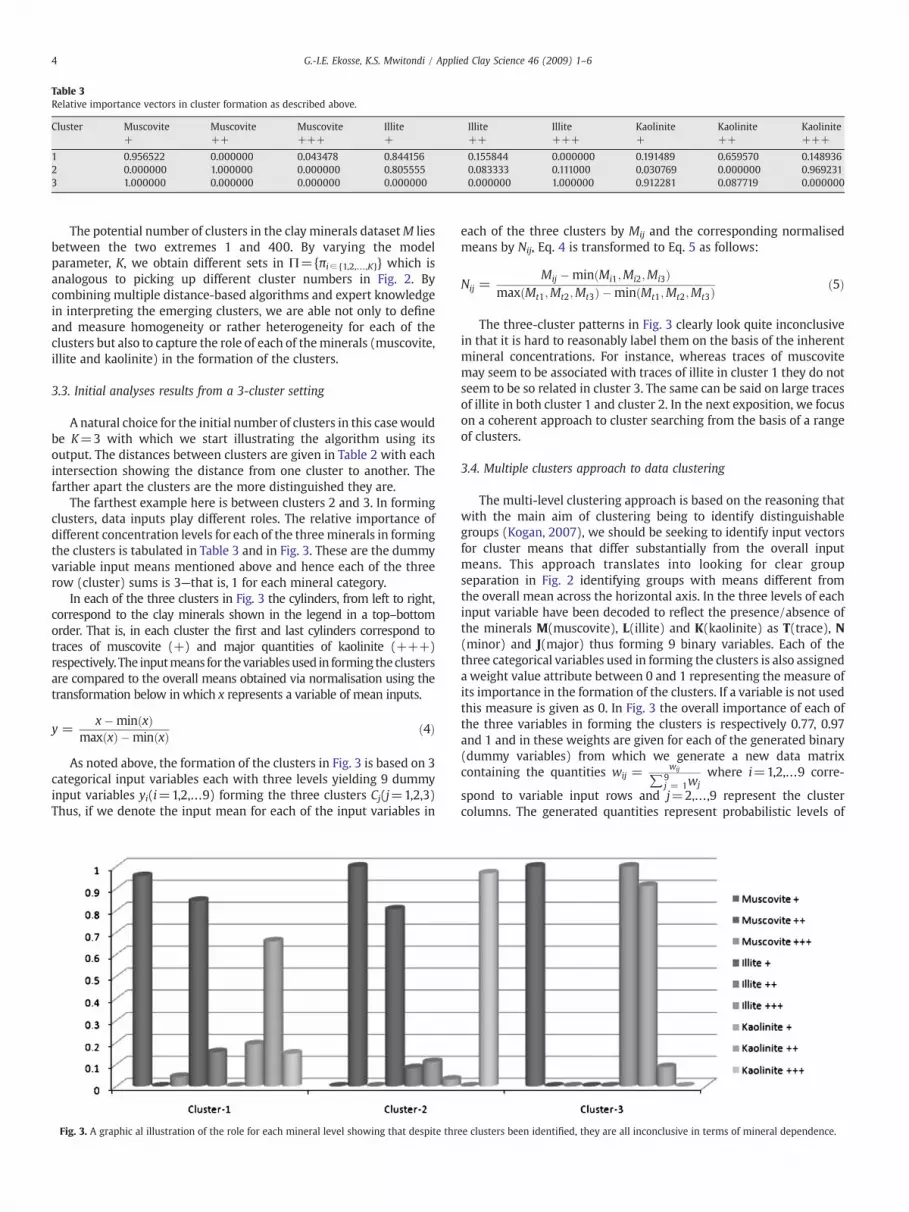
Table 3Relative importance vectors in cluster formation as described above.
Cluster Muscovite+
Muscovite++
Muscovite+++
Illite+
Illite++
Illite+++
Kaolinite+
Kaolinite++
Kaolinite+++
1 0.956522 0.000000 0.043478 0.844156 0.155844 0.000000 0.191489 0.659570 0.1489362 0.000000 1.000000 0.000000 0.805555 0.083333 0.111000 0.030769 0.000000 0.9692313 1.000000 0.000000 0.000000 0.000000 0.000000 1.000000 0.912281 0.087719 0.000000
4 G.-I.E. Ekosse, K.S. Mwitondi / Applied Clay Science 46 (2009) 1–6
The potential number of clusters in the clay minerals datasetM liesbetween the two extremes 1 and 400. By varying the modelparameter, K, we obtain different sets in Π={πi∈ {1,2,…,K}} which isanalogous to picking up different cluster numbers in Fig. 2. Bycombining multiple distance-based algorithms and expert knowledgein interpreting the emerging clusters, we are able not only to defineand measure homogeneity or rather heterogeneity for each of theclusters but also to capture the role of each of theminerals (muscovite,illite and kaolinite) in the formation of the clusters.
3.3. Initial analyses results from a 3-cluster setting
A natural choice for the initial number of clusters in this casewouldbe K=3 with which we start illustrating the algorithm using itsoutput. The distances between clusters are given in Table 2 with eachintersection showing the distance from one cluster to another. Thefarther apart the clusters are the more distinguished they are.
The farthest example here is between clusters 2 and 3. In formingclusters, data inputs play different roles. The relative importance ofdifferent concentration levels for each of the threeminerals in formingthe clusters is tabulated in Table 3 and in Fig. 3. These are the dummyvariable input means mentioned above and hence each of the threerow (cluster) sums is 3—that is, 1 for each mineral category.
In each of the three clusters in Fig. 3 the cylinders, from left to right,correspond to the clay minerals shown in the legend in a top–bottomorder. That is, in each cluster the first and last cylinders correspond totraces of muscovite (+) and major quantities of kaolinite (+++)respectively. The inputmeans for thevariablesused in forming theclustersare compared to the overall means obtained via normalisation using thetransformation below inwhich x represents a variable of mean inputs.
y =x�minðxÞ
maxðxÞ �minðxÞ ð4Þ
As noted above, the formation of the clusters in Fig. 3 is based on 3categorical input variables each with three levels yielding 9 dummyinput variables yi(i=1,2,…9) forming the three clusters Cj(j=1,2,3)Thus, if we denote the input mean for each of the input variables in
Fig. 3. A graphic al illustration of the role for each mineral level showing that despite thr
each of the three clusters by Mij and the corresponding normalisedmeans by Nij, Eq. 4 is transformed to Eq. 5 as follows:
Nij =Mij �minðMi1;Mi2;Mi3Þ
maxðMt1;Mt2;Mt3Þ �minðMt1;Mt2;Mt3Þð5Þ
The three-cluster patterns in Fig. 3 clearly look quite inconclusivein that it is hard to reasonably label them on the basis of the inherentmineral concentrations. For instance, whereas traces of muscovitemay seem to be associated with traces of illite in cluster 1 they do notseem to be so related in cluster 3. The same can be said on large tracesof illite in both cluster 1 and cluster 2. In the next exposition, we focuson a coherent approach to cluster searching from the basis of a rangeof clusters.
3.4. Multiple clusters approach to data clustering
The multi-level clustering approach is based on the reasoning thatwith the main aim of clustering being to identify distinguishablegroups (Kogan, 2007), we should be seeking to identify input vectorsfor cluster means that differ substantially from the overall inputmeans. This approach translates into looking for clear groupseparation in Fig. 2 identifying groups with means different fromthe overall mean across the horizontal axis. In the three levels of eachinput variable have been decoded to reflect the presence/absence ofthe minerals M(muscovite), L(illite) and K(kaolinite) as T(trace), N(minor) and J(major) thus forming 9 binary variables. Each of thethree categorical variables used in forming the clusters is also assigneda weight value attribute between 0 and 1 representing the measure ofits importance in the formation of the clusters. If a variable is not usedthis measure is given as 0. In Fig. 3 the overall importance of each ofthe three variables in forming the clusters is respectively 0.77, 0.97and 1 and in these weights are given for each of the generated binary(dummy variables) from which we generate a new data matrixcontaining the quantities wij =
wij
∑9j = 1wj
where i=1,2,…9 corre-
spond to variable input rows and j=2,…,9 represent the clustercolumns. The generated quantities represent probabilistic levels of
ee clusters been identified, they are all inconclusive in terms of mineral dependence.

Table 4Importance of inputs in the formation of clusters 2 to 9.
Input C2 C3 C4 C5 C6 C7 C8 C9
MT 0.5471 0.4670 0.0000 0.5636 0.7856 0.6327 0.4905 0.6005MN 0.3082 0.0000 0.0000 0.6626 0.6752 0.5770 0.6619 0.5229MJ 0.0000 0.0000 0.0000 0.0000 0.0000 0.0000 0.0000 0.0000LT 1.0000 0.3419 0.4148 0.4899 0.3878 0.5059 0.0000 0.5589LN 0.0000 0.0000 0.4445 0.3185 0.3920 0.3774 0.4821 0.4269LJ 0.5766 1.0000 1.0000 1.0000 1.0000 1.0000 1.0000 1.0000KT 0.7186 0.3055 0.7065 0.6307 0.7537 0.6043 0.8583 0.0000KN 0.0000 0.5543 0.5726 0.0000 0.0000 0.0000 0.7330 0.5903KJ 0.3715 0.8016 0.7879 0.7070 0.7245 0.6527 0.9503 0.7831
Fig. 4. Data input contributions in forming cluster formation.
5G.-I.E. Ekosse, K.S. Mwitondi / Applied Clay Science 46 (2009) 1–6
contribution made by each of the input variables. Hence, if there arenaturally arising structures in the data, they should be capturedwithinthese patterns.
Our aim is two-fold. Firstly, we seek to identify clusters which areclearly distinguishable and secondly we need to identify inputs whichconsistently appear together in forming clusters. The latter amounts totaking a collective look at the importance the input variables in clusterformation which should reveal the collective behaviour of theminerals. A graphical illustration of potential patterns of clay mineralsin data is given in Fig. 4 which is based on based on the same notationused in Table 4 and its blocks of mineral influence are proportionallybuilt as a percentage of the total influence. It can be seen that majorquantities of illite and kaolinite are hugely influential in formingclusters across the selected range. Particularly interesting are theconsistent patterns observed in clusters 5, 6 and 7 in which theproportions appear to be uniform across clusters and for the purposeof establishing which minerals occur together, we can ignore theseclusters. It is imperative to carry out an in-depth investigationinvolving traces which in Fig. 4 do not clearly suggest influencingthe presence or absence of any of the minerals. The four clusters inFig. 5 are generated without using the influential variables LJ and KJ soas to measure the impact of the traces on the presence or absence ofother minerals.
It can be seen from Fig. 5 that muscovite traces play vital role in aninitial cluster building. Down the cluster building structure tracesdominate, with the exception of minor quantities in one of the finalgrouping. The importance matrix of the inputs used in building thefour clusters suggested a link between traces of muscovite, kaoliniteand illite. It also suggested a link between these traces and minorquantities of illite.
4. Conclusions and potential future directions
Using multiple data clustering algorithms, the paper showed howthe presence of large quantities of illite and kaolinite influence theformation of clusters. Consistent patterns were observed in clusters 5,6 and 7 which had almost uniform proportions of clay minerals. Inanswering the question as to which minerals occur together, we tookaway themost influential variables—LJ and KJ in order to get an insightinto the impact of the traces on the presence or absence of otherminerals. The results showed that muscovite traces play a vital role in
an initial cluster building with the importance matrix of inputssuggesting an inter-dependence between muscovite, kaolinite andillite traces as well as between the traces andminor quantities of illite.
The above findings were attained via a novel approach tocharacterisation of clay soils—effectively looking at the same samplefrom different perspectives. That is, dwelling on aspects of claymineralogy and modelling sciences, the paper marks a significantdeparture from the conventional approaches to clay characterisationby showing how effectively data mining methods can be adopted inthe area. Further, it highlights a new era in the application of dataclustering techniques in the absence of theoretical support in decidingon the number of optimal clusters.
The clustering approach used in this paper is based on Mwitondiet al. (2002) who reported that the overall empirical error for mostlearning algorithms could be attributed to two types of randomness r1and r2 denoting the randomness due to the model's allocation regionand randomness due to the assessment of the rule with randomtraining, validation and test data. Thus, multi-level algorithms wereimplemented on the data to minimise these elements of randomness.With applications of data mining procedures in clay science still veryrare and far between, the findings from this paper can only best beused as input to further studies. To effectively achieve that goal, wepropose setting up African clay and clay minerals data repositories tobe made available to future researchers in the area and making itpossible for them to share not only data, but also regularly updatingthe repositories and sharing research results and experiences. This isin line with Bianchini et al. (2002) who recommended setting up ageochemical–mineralogical database as the first step towards prepar-ing more complete thematic maps.

Fig. 5. Clusters build without the influence of the variables LJ and KJ.
6 G.-I.E. Ekosse, K.S. Mwitondi / Applied Clay Science 46 (2009) 1–6
In light of the above observations, data analysis results from thispaper can hardly be generalised across the continent but repeatedsamples in similar or different environments, archived data, resultsand expert experiences have great potential to provide a unifiedinterpretation of the emerging clay data structures and a step forwardtowards the principles that guide and strengthen practical applica-tions in clay science. Thus, we recommend African-specific datarepositories for several reasons—mainly because a number of factorsmay impinge on the accomplishment of the clustering proceduresimplemented in this paper. Such scheme will help in minimising theelements of randomness and hence lead to more reliable conclusionson clay minerals characteristics.
References
Asadu, C., Diels, J., Vanlauwe, B., 1997. A comparison of the contributions of clay, silt andorganic matter to the effective ECEC of soils of Sub-Saharan Africa. Soil Science 162 (11),785–794.
Bianchini, G., Laviano, R., Lovo, S., Vaccaro, C., 2002. Chemical–mineralogicalcharacterisation of clay sediments around Ferrara (Italy): a tool for an environ-mental analysis. Applied Clay Science 21 (3–4), 165–176.
Brown, W.M., Gedeon, T.D., Groves, D.I., Barnes, R.G., 2001. Artificial neural networks: anew method for mineral prospectivity mapping. Australian Journal of EarthSciences 47 (4), 757–770.
Ekosse, G., 2001. Provenance of the Kgwakgwe kaolin deposit in south eastern Botswanaand its possible utilization. Applied Clay Science 20 (3), 137–152.
Ekosse, G., 2008. Application ofmultivariate analysis in understanding anions in soils close toan abandonedmanganese oxide ore mine. Journal of Applied Sciences 8 (8), 1519–1526.
Ekosse, G.-I., Fouche, P.S., 2006a. Environmental association of iron minerals and ironconcentrations in soils close to an abandoned manganese mine—a multivariateanalytical approach. Journal of Applied Sciences and Environmental Management10 (1), 31–36.
Ekosse, G-I, Fouche, P., 2006b. Environmental association of clay minerals withpotassium concentrations in soils close to an abandoned manganese mine—a
multivariate and GIS analytical approach. International Journal of EnvironmentalStudies 63 (5), 617–632.
Ekosse, G.-I., Fouche, P.S., 2007a. Mining association rules applied to goethite andhaematite abundances in manganese contaminated soils. Polish Journal ofEnvironmental Studies 16 (4), 531–538.
Ekosse, G.-I., Fouche, P.S., 2007b. Multivariate analysis and spatial distribution ofselected cations in soils within the proximity of an abandoned manganese mine,Kgwakgwe, Botswana. Fresenius Environmental Bulletin 16 (3), 261–271.
Eriksson, L., Johansson, E., Kettaneh-Wold, N., Trygg, J., Wikström, C., Wold, S., 2001.Multi- and megavariate data analysis part I: basic principles and applications.Umetrics Academy.
Freund, F., Schapire, R., 1997. A decision-theoretic generalization of on-line learning andan application to boosting. Journal of Computer and System Sciences 55, 119–139.
Hastie, T., Tibshirani, R. and Friedman, J., 2001. Elements of Statistical Learning—DataMining, Inference and Prediction, 1–8. Springer Series in Statistics.
Henderson, B.L., Bui, E.N., Moran, C. J. and Simon, D.A.P., 2005. Australia-widepredictions of soil properties using decision trees; Geoderma 124 (3–4).
Jongman, R, Ter Braak, C., van Tongeren, O., 1995. Data analysis in community andlandscape ecology. Cambridge University Press.
Kogan, J., 2007. Introduction to clustering large and high-dimensional data. CambridgeUniversity Press, pp. 101–122.
McCune, B., 1997. Influence of noisy environmental data on canonical correspondenceanalysis. Ecological Society of America, Journal of Ecology 78 (8), 2617–2623.
McQueen, J., 1967. Some methods for classification and analysis of multivariateobservations. Proceedings of the Fifth Berkeley Symposium on MathematicalStatistics and Probability, pp 281–297.
Mwitondi, K., Tylor, C., Kent, J., 2002. Using boosting in classification. Proceedings of the LeedsAnnual Statistical Research Conference. Leeds University Press, pp. 125–128.
Ripley, B.D., 1996. Pattern recognition and neural networks. Cambridge University Press.Silverman, B., 1981. Using Kernel Density Estimation to investigate multimodality.
Journal of the Royal Statistical Society B43, 97–99.Silverman, B., 1986. Density estimation for statistics and data analysis. Chapman and
Hall.Taylor, C., Mwitondi, K., 2001. Robust methods in data mining—in spatial statistics?
Proceedings of the Leeds Annual Statistical Research Conference. Leeds UniversityPress, pp. 67–70.
Tombale, A.R., 1986. Geological map of the Jwaneng area (QDS 2424D) (1:125 000) withbrief description. Geological Survey of Botswana; Government Printer, Gaborone.
Valiant, L.G., 1984. A theory of the learnable. Communications of the ACM27,1134–1142.