multiple concentric spirals for the flow field of a proton exchange membrane fuel cell
TRANSCRIPT

Mm
DFD
a
ARRAA
KTNSPEN
1
eot(r
nt
H
udd
f
0d
Journal of Power Sources 196 (2011) 8019– 8030
Contents lists available at ScienceDirect
Journal of Power Sources
jo ur nal homep age: www.elsev ier .com/ locate / jpowsour
ultiple concentric spirals for the flow field of a proton exchangeembrane fuel cell
aniel Juarez-Robles, Abel Hernandez-Guerrero ∗, Bladimir Ramos-Alvarado,rancisco Elizalde-Blancas, Cesar E. Damian-Ascencioepartment of Mechanical Engineering, University of Guanajuato, Mexico
r t i c l e i n f o
rticle history:eceived 22 March 2011eceived in revised form 6 May 2011ccepted 12 May 2011vailable online 19 May 2011
eywords:hree-dimensionalon-isothermal
a b s t r a c t
The present analysis considers a three-dimensional non-isothermal model in a single phase of a PEM fuelcell with a flow field path in the shape of 1, 2, 3, 4, 6, and 8 concentric spirals. The current density contours,the water content and the entropy generated in all zones of the fuel cell are predicted. The analysis of thethree-dimensional model includes the gas flow channels in the six geometric shapes mentioned above,the current collectors, gas diffusion layers, catalyst layers on both sides of the model, anode and cathode,and a proton exchange membrane in between. The energy equation, mass conservation, and transport ofspecies equations are solved, including source terms that take into account the electrochemical effectsoccurring inside the cell. Also, the entropy generation equation is added to the governing equations of the
ingle phaseEM fuel cellntropy generationumerical
model. The results allow a comparison to help to decide which of the 6 analyzed configurations improvethe performance of the fuel cell, increasing the current density produced, reducing the pressure dropand producing the most uniform current density. The entropy generation analysis reveals the effects thatcause the most significant losses (irreversibilities) in the cell. The Bejan number and the � number areused to compare the irreversibilities produced by the matter flow and by the heat transfer for each one
of the six models.. Introduction
Fuel cells are electrochemical devices that convert the chemicalnergy of a fuel directly to electrical energy. There is a whole familyf fuel cells that can be characterized by the electrolyte used. All ofhese fuel cells function in the same basic way. At the anode, a fuelusually hydrogen) is dissociated, while at the cathode oxygen iseduced to oxide species.
The proton exchange membrane fuel cell, PEMFC, derives itsame from the special membrane used as the electrolyte. The elec-rochemical reactions that take place inside the cell are:
2 → 2H+ + 2e− (1)
12 O2 + 2H+ + 2e− → H2O (2)
Proton exchange membrane fuel cells have gained a lot of pop-larity amongst scientists due to their operating conditions, highensity of energy generated and the portable capabilities of theseevices.
∗ Corresponding author. Tel.: +52 464 6479940x2382;ax: +524646479940x2311.
E-mail address: [email protected] (A. Hernandez-Guerrero).
378-7753/$ – see front matter © 2011 Elsevier B.V. All rights reserved.oi:10.1016/j.jpowsour.2011.05.029
© 2011 Elsevier B.V. All rights reserved.
Fig. 1 shows the cross section of a PEM fuel cell. The main com-ponents of a PEMFC are the current collectors, the gas diffusionlayers (GDL’s), the catalysts layers and the proton exchange mem-brane. The main factors that determine the fuel cell performanceare the operating conditions, the reactant’s humidity, the proper-ties of the materials and the flow distribution of the gases in theMEA by means of the geometry of the gas channels.
The geometries of the bipolar plates have been the object ofmany studies. The serpentine shape [1,2] has proved to have a goodperformance as a flow distributor, with the inconvenient of produc-ing larger pressure drops caused mainly by the numerous sudden,sharp turns. The parallel channels geometry [3] is a bad gas distrib-utor causing larger concentration gradients. The geometry calledinterdigitated [4,5] is also a deficient gas distributor because it pro-duces flooding zones (although its performance improves whenthe operating pressure increases.) These 3 geometries are alreadyconsidered as conventional due to their wide commercial use.
Recently, new and non-conventional flow configurations for theflow field of the PEMFC have been reported in the technical litera-ture. These results reveal the fact that the fuel cells require a multiobjective optimization to make them an option to replace fossil fuel
based technologies. The main objective behind those designs is toimprove the fuel cell performance, developing larger current den-sities in smaller areas. These designs, such as the radial [6,7], theconstructal theory-based [8,9], the biomimetical [10], the tree net-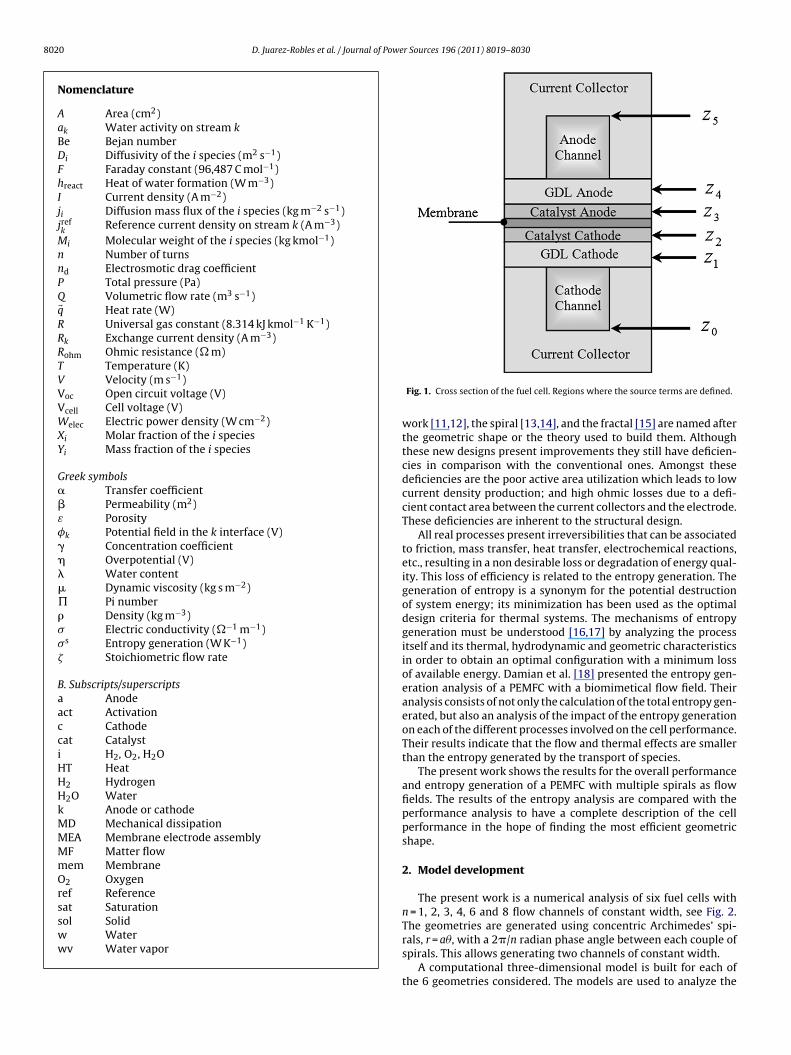
8020 D. Juarez-Robles et al. / Journal of Power Sources 196 (2011) 8019– 8030
Nomenclature
A Area (cm2)ak Water activity on stream kBe Bejan numberDi Diffusivity of the i species (m2 s−1)F Faraday constant (96,487 C mol−1)hreact Heat of water formation (W m−3)I Current density (A m−2)ji Diffusion mass flux of the i species (kg m−2 s−1)jrefk
Reference current density on stream k (A m−3)Mi Molecular weight of the i species (kg kmol−1)n Number of turnsnd Electrosmotic drag coefficientP Total pressure (Pa)Q Volumetric flow rate (m3 s−1)�q Heat rate (W)R Universal gas constant (8.314 kJ kmol−1 K−1)Rk Exchange current density (A m−3)Rohm Ohmic resistance (� m)T Temperature (K)V Velocity (m s−1)Voc Open circuit voltage (V)Vcell Cell voltage (V)Welec Electric power density (W cm−2)Xi Molar fraction of the i speciesYi Mass fraction of the i species
Greek symbols� Transfer coefficient� Permeability (m2)ε Porosity�k Potential field in the k interface (V)� Concentration coefficient� Overpotential (V)� Water content� Dynamic viscosity (kg s m−2)� Pi number� Density (kg m−3)� Electric conductivity (�−1 m−1)�s Entropy generation (W K−1)� Stoichiometric flow rate
B. Subscripts/superscriptsa Anodeact Activationc Cathodecat Catalysti H2, O2, H2OHT HeatH2 HydrogenH2O Waterk Anode or cathodeMD Mechanical dissipationMEA Membrane electrode assemblyMF Matter flowmem MembraneO2 Oxygenref Referencesat Saturationsol Solidw Waterwv Water vapor
Fig. 1. Cross section of the fuel cell. Regions where the source terms are defined.
work [11,12], the spiral [13,14], and the fractal [15] are named afterthe geometric shape or the theory used to build them. Althoughthese new designs present improvements they still have deficien-cies in comparison with the conventional ones. Amongst thesedeficiencies are the poor active area utilization which leads to lowcurrent density production; and high ohmic losses due to a defi-cient contact area between the current collectors and the electrode.These deficiencies are inherent to the structural design.
All real processes present irreversibilities that can be associatedto friction, mass transfer, heat transfer, electrochemical reactions,etc., resulting in a non desirable loss or degradation of energy qual-ity. This loss of efficiency is related to the entropy generation. Thegeneration of entropy is a synonym for the potential destructionof system energy; its minimization has been used as the optimaldesign criteria for thermal systems. The mechanisms of entropygeneration must be understood [16,17] by analyzing the processitself and its thermal, hydrodynamic and geometric characteristicsin order to obtain an optimal configuration with a minimum lossof available energy. Damian et al. [18] presented the entropy gen-eration analysis of a PEMFC with a biomimetical flow field. Theiranalysis consists of not only the calculation of the total entropy gen-erated, but also an analysis of the impact of the entropy generationon each of the different processes involved on the cell performance.Their results indicate that the flow and thermal effects are smallerthan the entropy generated by the transport of species.
The present work shows the results for the overall performanceand entropy generation of a PEMFC with multiple spirals as flowfields. The results of the entropy analysis are compared with theperformance analysis to have a complete description of the cellperformance in the hope of finding the most efficient geometricshape.
2. Model development
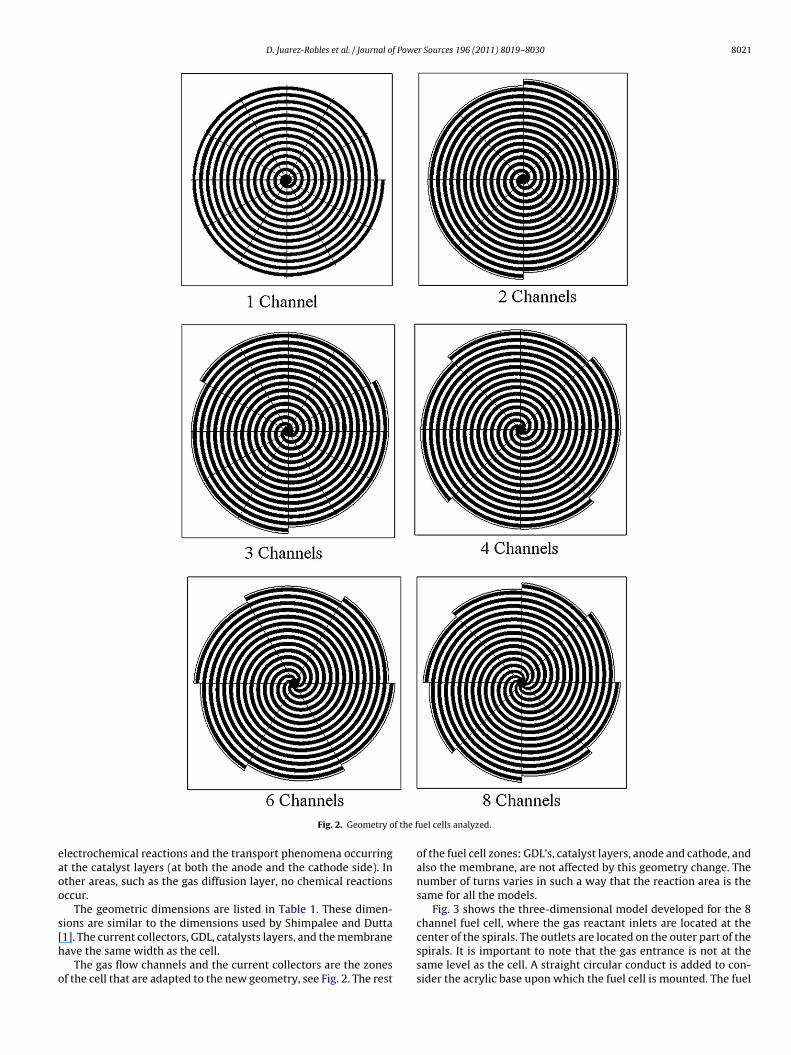
The present work is a numerical analysis of six fuel cells withn = 1, 2, 3, 4, 6 and 8 flow channels of constant width, see Fig. 2.The geometries are generated using concentric Archimedes’ spi-
rals, r = a�, with a 2/n radian phase angle between each couple ofspirals. This allows generating two channels of constant width.A computational three-dimensional model is built for each ofthe 6 geometries considered. The models are used to analyze the
D. Juarez-Robles et al. / Journal of Power Sources 196 (2011) 8019– 8030 8021
f the f
eaoo
s[h
o
Fig. 2. Geometry o
lectrochemical reactions and the transport phenomena occurringt the catalyst layers (at both the anode and the cathode side). Inther areas, such as the gas diffusion layer, no chemical reactionsccur.
The geometric dimensions are listed in Table 1. These dimen-ions are similar to the dimensions used by Shimpalee and Dutta
1]. The current collectors, GDL, catalysts layers, and the membraneave the same width as the cell.The gas flow channels and the current collectors are the zonesf the cell that are adapted to the new geometry, see Fig. 2. The rest
uel cells analyzed.
of the fuel cell zones: GDL’s, catalyst layers, anode and cathode, andalso the membrane, are not affected by this geometry change. Thenumber of turns varies in such a way that the reaction area is thesame for all the models.
Fig. 3 shows the three-dimensional model developed for the 8channel fuel cell, where the gas reactant inlets are located at the
center of the spirals. The outlets are located on the outer part of thespirals. It is important to note that the gas entrance is not at thesame level as the cell. A straight circular conduct is added to con-sider the acrylic base upon which the fuel cell is mounted. The fuel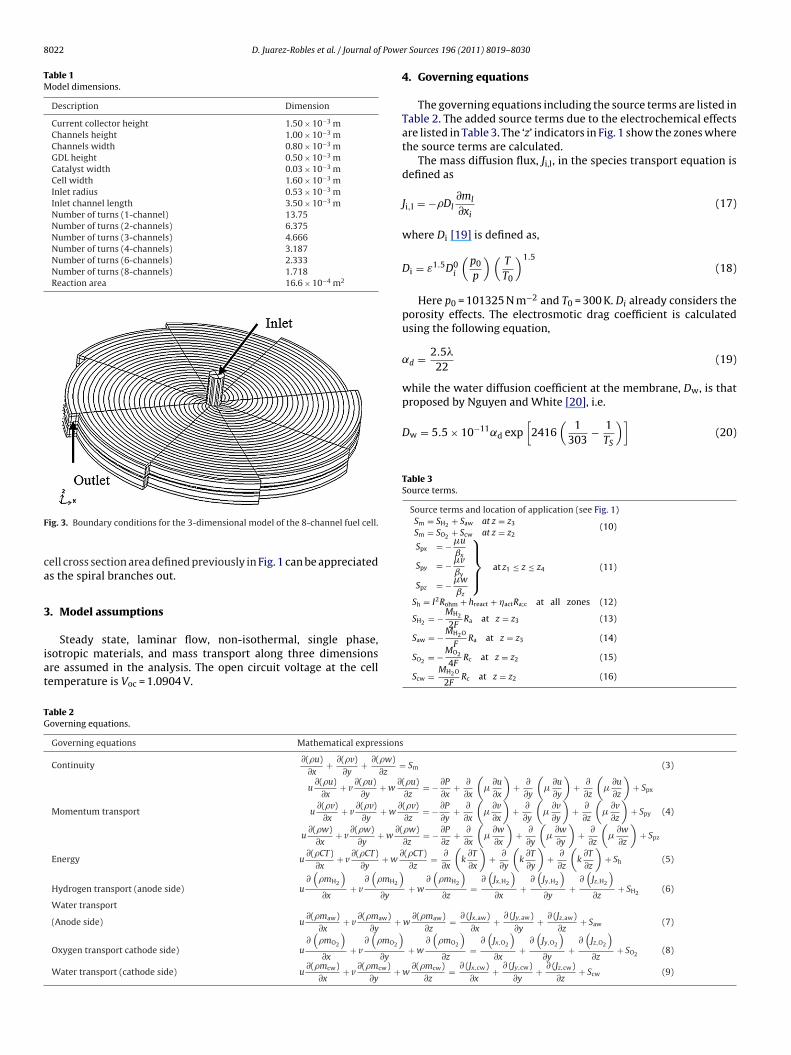
8022 D. Juarez-Robles et al. / Journal of Powe
Table 1Model dimensions.
Description Dimension
Current collector height 1.50 × 10⁻³ mChannels height 1.00 × 10⁻³ mChannels width 0.80 × 10⁻³ mGDL height 0.50 × 10⁻³ mCatalyst width 0.03 × 10⁻³ mCell width 1.60 × 10⁻³ mInlet radius 0.53 × 10⁻³ mInlet channel length 3.50 × 10⁻³ mNumber of turns (1-channel) 13.75Number of turns (2-channels) 6.375Number of turns (3-channels) 4.666Number of turns (4-channels) 3.187Number of turns (6-channels) 2.333Number of turns (8-channels) 1.718Reaction area 16.6 × 10⁻⁴ m2
F
ca
3
iat
proposed by Nguyen and White [20], i.e.
Dw = 5.5 × 10⁻¹¹˛d exp[
2416(
1303
− 1TS
)](20)
Table 3Source terms.
Source terms and location of application (see Fig. 1)Sm = SH2 + Saw at z = z3
Sm = SO2 + Scw at z = z2(10)
Spx = − �u
ˇx
Spy = − �vˇy
Spz = − �w
ˇz
⎫⎪⎬⎪⎭ at z1 ≤ z ≤ z4 (11)
Sh = I2Rohm + hreact + actRa;c at all zones (12)
SH2 = − MH2
2FRa at z = z3 (13)
Saw = − MH2O
FRa at z = z3 (14)
TG
ig. 3. Boundary conditions for the 3-dimensional model of the 8-channel fuel cell.
ell cross section area defined previously in Fig. 1 can be appreciateds the spiral branches out.
. Model assumptions
Steady state, laminar flow, non-isothermal, single phase,
sotropic materials, and mass transport along three dimensionsre assumed in the analysis. The open circuit voltage at the cellemperature is Voc = 1.0904 V.able 2overning equations.
Governing equations Mathematical expressions
Continuity∂(u)
∂x+ ∂(v)
∂y+ ∂(w)
∂z=
Momentum transport
u∂(u)
∂x+ v
∂(u)∂y
+ w∂
u∂(v)
∂x+ v
∂(v)∂y
+ w∂
u∂(w)
∂x+ v
∂(w)∂y
+ w∂(
Energy u∂(CT)
∂x+ v
∂(CT)∂y
+ w∂
Hydrogen transport (anode side) u∂(
mH2
)∂x
+ v∂(
mH2
)∂y
Water transport
(Anode side) u∂(maw)
∂x+ v
∂(maw)∂y
+
Oxygen transport cathode side) u∂(
mO2
)∂x
+ v∂(
mO2
)∂y
Water transport (cathode side) u∂(mcw)
∂x+ v
∂(mcw)∂y
+
r Sources 196 (2011) 8019– 8030
4. Governing equations
The governing equations including the source terms are listed inTable 2. The added source terms due to the electrochemical effectsare listed in Table 3. The ‘z’ indicators in Fig. 1 show the zones wherethe source terms are calculated.
The mass diffusion flux, Ji,l, in the species transport equation isdefined as
Ji,l = −Dl∂ml
∂xi(17)
where Di [19] is defined as,
Di = ε1.5D0i
(p0
p
)(T
T0
)1.5(18)
Here p0 = 101325 N m−2 and T0 = 300 K. Di already considers theporosity effects. The electrosmotic drag coefficient is calculatedusing the following equation,
˛d = 2.5�
22(19)
while the water diffusion coefficient at the membrane, Dw, is that
SO2 = − MO2
4FRc at z = z2 (15)
Scw = MH2O
2FRc at z = z2 (16)
Sm (3)
(u)∂z
= − ∂P
∂x+ ∂
∂x
(�
∂u
∂x
)+ ∂
∂y
(�
∂u
∂y
)+ ∂
∂z
(�
∂u
∂z
)+ Spx
(v)∂z
= − ∂P
∂y+ ∂
∂x
(�
∂v∂x
)+ ∂
∂y
(�
∂v∂y
)+ ∂
∂z
(�
∂v∂z
)+ Spy
w)∂z
= − ∂P
∂z+ ∂
∂x
(�
∂w
∂x
)+ ∂
∂y
(�
∂w
∂y
)+ ∂
∂z
(�
∂w
∂z
)+ Spz
(4)
(CT)∂z
= ∂
∂x
(k
∂T
∂x
)+ ∂
∂y
(k
∂T
∂y
)+ ∂
∂z
(k
∂T
∂z
)+ Sh (5)
+ w∂(
mH2
)∂z
=∂(
Jx,H2
)∂x
+∂(
Jy,H2
)∂y
+∂(
Jz,H2
)∂z
+ SH2 (6)
w∂(maw)
∂z= ∂ (Jx,aw)
∂x+ ∂ (Jy,aw)
∂y+ ∂ (Jz,aw)
∂z+ Saw (7)
+ w∂(
mO2
)∂z
=∂(
Jx,O2
)∂x
+∂(
Jy,O2
)∂y
+∂(
Jz,O2
)∂z
+ SO2 (8)
w∂(mcw)
∂z= ∂ (Jx,cw)
∂x+ ∂ (Jy,cw)
∂y+ ∂ (Jz,cw)
∂z+ Scw (9)
f Powe
p
l
u
�
wS
�
h
a
tmp
∇∇
tpmt
B
R
R
f
w
V
w
�
trtp
�
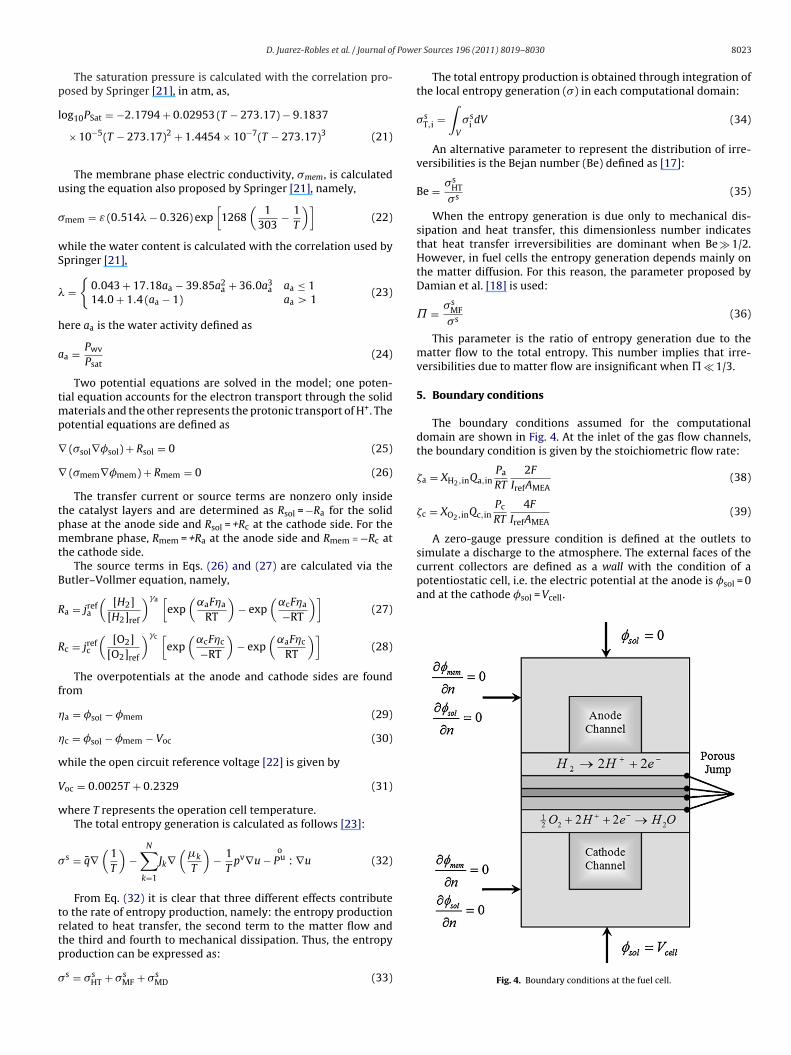
simulate a discharge to the atmosphere. The external faces of thecurrent collectors are defined as a wall with the condition of apotentiostatic cell, i.e. the electric potential at the anode is �sol = 0and at the cathode �sol = Vcell.
D. Juarez-Robles et al. / Journal o
The saturation pressure is calculated with the correlation pro-osed by Springer [21], in atm, as,
og10PSat = −2.1794 + 0.02953 (T − 273.17) − 9.1837
× 10−5(T − 273.17)2 + 1.4454 × 10⁻⁷(T − 273.17)3 (21)
The membrane phase electric conductivity, �mem, is calculatedsing the equation also proposed by Springer [21], namely,
mem = ε (0.514� − 0.326) exp[
1268(
1303
− 1T
)](22)
hile the water content is calculated with the correlation used bypringer [21],
={
0.043 + 17.18aa − 39.85a2a + 36.0a3
a aa ≤ 114.0 + 1.4 (aa − 1) aa > 1
(23)
ere aa is the water activity defined as
a = Pwv
Psat(24)
Two potential equations are solved in the model; one poten-ial equation accounts for the electron transport through the solid
aterials and the other represents the protonic transport of H+. Theotential equations are defined as
(�sol∇�sol) + Rsol = 0 (25)
(�mem∇�mem) + Rmem = 0 (26)
The transfer current or source terms are nonzero only insidehe catalyst layers and are determined as Rsol = −Ra for the solidhase at the anode side and Rsol = +Rc at the cathode side. For theembrane phase, Rmem = +Ra at the anode side and Rmem = −Rc at
he cathode side.The source terms in Eqs. (26) and (27) are calculated via the
utler–Vollmer equation, namely,
a = jrefa
([H2]
[H2]ref
)�a [exp
(˛aF a
RT
)− exp
(˛cF a
−RT
)](27)
c = jrefc
([O2]
[O2]ref
)�c [exp
(˛cF c
−RT
)− exp
(˛aF c
RT
)](28)
The overpotentials at the anode and cathode sides are foundrom
a = �sol − �mem (29)
c = �sol − �mem − Voc (30)
hile the open circuit reference voltage [22] is given by
oc = 0.0025T + 0.2329 (31)
here T represents the operation cell temperature.The total entropy generation is calculated as follows [23]:
s = q∇(
1T
)−
N∑k=1
Jk∇(
�k
T
)− 1
Tpv∇u −
oPu : ∇u (32)
From Eq. (32) it is clear that three different effects contributeo the rate of entropy production, namely: the entropy productionelated to heat transfer, the second term to the matter flow and
he third and fourth to mechanical dissipation. Thus, the entropyroduction can be expressed as:s = �sHT + �s
MF + �sMD (33)
r Sources 196 (2011) 8019– 8030 8023
The total entropy production is obtained through integration ofthe local entropy generation (�) in each computational domain:
�sT,i =
∫V
�si dV (34)
An alternative parameter to represent the distribution of irre-versibilities is the Bejan number (Be) defined as [17]:
Be = �sHT
�s (35)
When the entropy generation is due only to mechanical dis-sipation and heat transfer, this dimensionless number indicatesthat heat transfer irreversibilities are dominant when Be � 1/2.However, in fuel cells the entropy generation depends mainly onthe matter diffusion. For this reason, the parameter proposed byDamian et al. [18] is used:
= �sMF
�s (36)
This parameter is the ratio of entropy generation due to thematter flow to the total entropy. This number implies that irre-versibilities due to matter flow are insignificant when � � 1/3.
5. Boundary conditions
The boundary conditions assumed for the computationaldomain are shown in Fig. 4. At the inlet of the gas flow channels,the boundary condition is given by the stoichiometric flow rate:
�a = XH2,inQa,inPa
RT
2F
IrefAMEA(38)
�c = XO2,inQc,inPc
RT
4F
IrefAMEA(39)
A zero-gauge pressure condition is defined at the outlets to
Fig. 4. Boundary conditions at the fuel cell.
8024 D. Juarez-Robles et al. / Journal of Powe
Table 4Operating conditions.
Parameter Value
Pressure 202650 PaCell temperature 343 KHumidity at the anode side 100%Humidity at the cathode side 100%Anode stoichiometric flow rate 1.5Cathode stoichiometric flow rate 2
Table 5Electrochemical parameters.
Property Value
Current collector conductivity [25] �sol = 1.25 × 10⁵ ˝−1 m−1
GDL and catalyst conductivity [25] �cat = �GDL = 53 ˝−1 m−1
GDL porosity [24] εGDL = 0.4Catalyst porosity [24] εcat = 0.112Concentration exp. (anode) [24] �a = 0.5Concentration exp. (cathode) [24] �c = 1Transfer coefficient (anode) [24] ˛a = 2Transfer coefficient (cathode) [24] ˛c = 2Ref. current density (anode) [24] jref
a = 1 × 10⁹ A m−3
Ref. current density (cathode) [24] jrefc = 3 × 10⁵ A m−3
Hydrogen reference diffusivity [24] D0H2
= 1.1 × 10⁻⁴ m2 s−1
Oxygen reference diffusivity [24] D0O2
= 3.2 × 10⁻⁵ m2 s−1
Water reference diffusivity [24] D0H2O = 7.35 × 10⁻⁵ m2 s−1
a
6
i
m
7
i
8.1. Validation of the numerical model
A validation of the numerical model was conducted by repro-ducing the experimental performance curve reported in [24]. Fig. 6
Nitrogen reference diffusivity [12] D0N2
= 8 × 10⁻⁵ m2 s−1
Permeability [12] = 2 × 10⁻¹⁰ m2
The terminal walls are defined as adiabatic, while the side wallsre defined at the cell temperature.
. Operating conditions
The model was analyzed under the operating conditions listedn Table 4.
The electrochemical parameters employed in the numericalodel are listed in Table 5.
. Numerical procedure
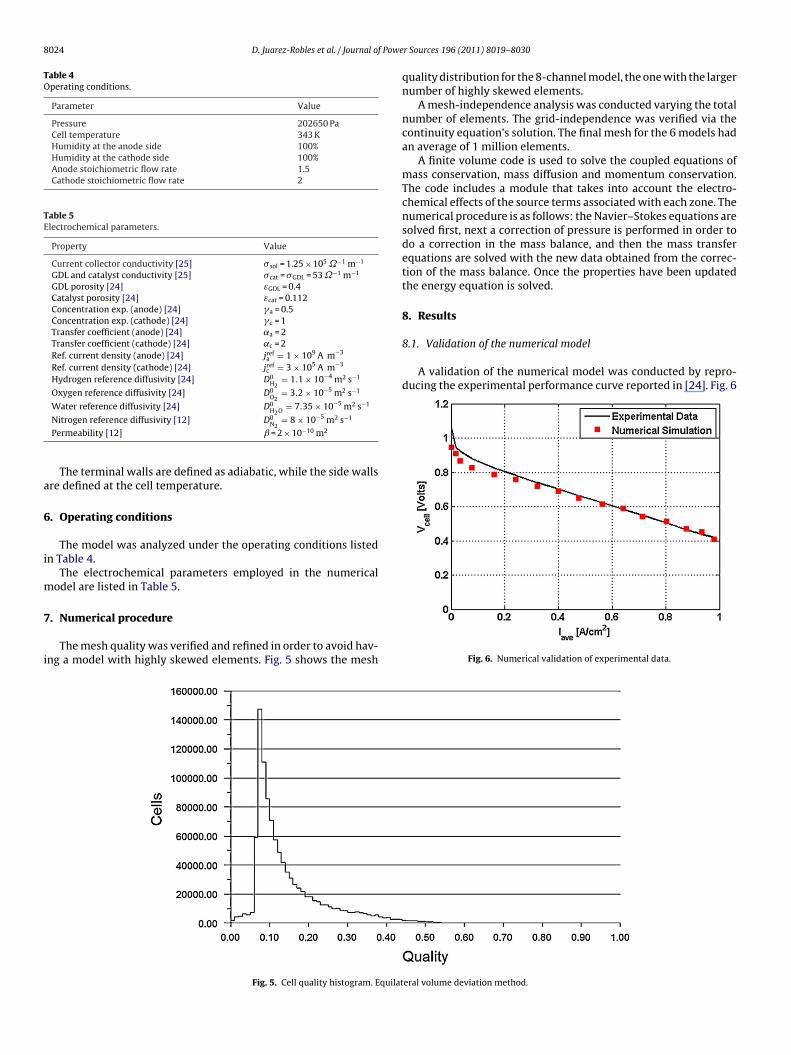
The mesh quality was verified and refined in order to avoid hav-ng a model with highly skewed elements. Fig. 5 shows the mesh
Fig. 5. Cell quality histogram. Equilat
r Sources 196 (2011) 8019– 8030
quality distribution for the 8-channel model, the one with the largernumber of highly skewed elements.
A mesh-independence analysis was conducted varying the totalnumber of elements. The grid-independence was verified via thecontinuity equation’s solution. The final mesh for the 6 models hadan average of 1 million elements.
A finite volume code is used to solve the coupled equations ofmass conservation, mass diffusion and momentum conservation.The code includes a module that takes into account the electro-chemical effects of the source terms associated with each zone. Thenumerical procedure is as follows: the Navier–Stokes equations aresolved first, next a correction of pressure is performed in order todo a correction in the mass balance, and then the mass transferequations are solved with the new data obtained from the correc-tion of the mass balance. Once the properties have been updatedthe energy equation is solved.
8. Results
Fig. 6. Numerical validation of experimental data.
eral volume deviation method.
f Power Sources 196 (2011) 8019– 8030 8025
scpgpa
8
atu
tbt
tTplt8
D. Juarez-Robles et al. / Journal o
hows the comparison between the experimental and the numeri-al simulation using the same operating conditions and dimensionsresented by Um and Wang [24]. The comparison shows a veryood agreement between numerical and experimental data. Theresent validation ensures that the model described so far workss a PEM fuel cell performance simulator.
.2. Polarization and power curves
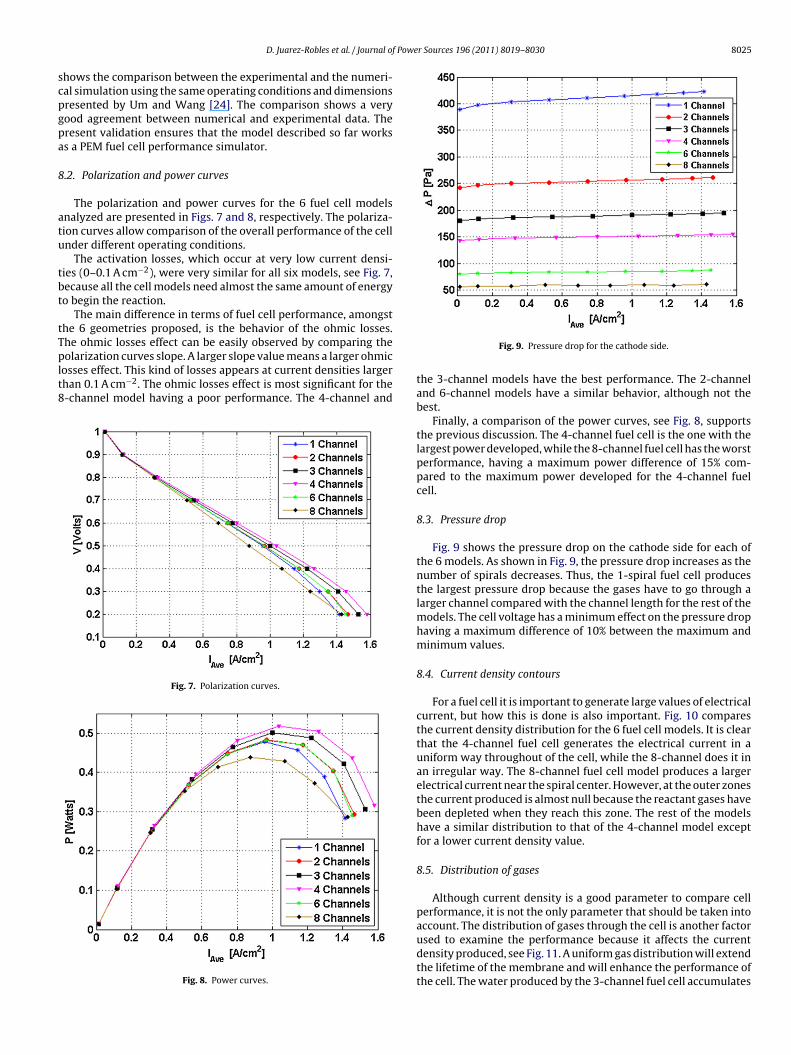
The polarization and power curves for the 6 fuel cell modelsnalyzed are presented in Figs. 7 and 8, respectively. The polariza-ion curves allow comparison of the overall performance of the cellnder different operating conditions.
The activation losses, which occur at very low current densi-ies (0–0.1 A cm−2), were very similar for all six models, see Fig. 7,ecause all the cell models need almost the same amount of energyo begin the reaction.
The main difference in terms of fuel cell performance, amongsthe 6 geometries proposed, is the behavior of the ohmic losses.he ohmic losses effect can be easily observed by comparing the
olarization curves slope. A larger slope value means a larger ohmicosses effect. This kind of losses appears at current densities largerhan 0.1 A cm−2. The ohmic losses effect is most significant for the-channel model having a poor performance. The 4-channel and
Fig. 7. Polarization curves.
Fig. 8. Power curves.
Fig. 9. Pressure drop for the cathode side.
the 3-channel models have the best performance. The 2-channeland 6-channel models have a similar behavior, although not thebest.
Finally, a comparison of the power curves, see Fig. 8, supportsthe previous discussion. The 4-channel fuel cell is the one with thelargest power developed, while the 8-channel fuel cell has the worstperformance, having a maximum power difference of 15% com-pared to the maximum power developed for the 4-channel fuelcell.
8.3. Pressure drop
Fig. 9 shows the pressure drop on the cathode side for each ofthe 6 models. As shown in Fig. 9, the pressure drop increases as thenumber of spirals decreases. Thus, the 1-spiral fuel cell producesthe largest pressure drop because the gases have to go through alarger channel compared with the channel length for the rest of themodels. The cell voltage has a minimum effect on the pressure drophaving a maximum difference of 10% between the maximum andminimum values.
8.4. Current density contours
For a fuel cell it is important to generate large values of electricalcurrent, but how this is done is also important. Fig. 10 comparesthe current density distribution for the 6 fuel cell models. It is clearthat the 4-channel fuel cell generates the electrical current in auniform way throughout of the cell, while the 8-channel does it inan irregular way. The 8-channel fuel cell model produces a largerelectrical current near the spiral center. However, at the outer zonesthe current produced is almost null because the reactant gases havebeen depleted when they reach this zone. The rest of the modelshave a similar distribution to that of the 4-channel model exceptfor a lower current density value.
8.5. Distribution of gases
Although current density is a good parameter to compare cellperformance, it is not the only parameter that should be taken intoaccount. The distribution of gases through the cell is another factor
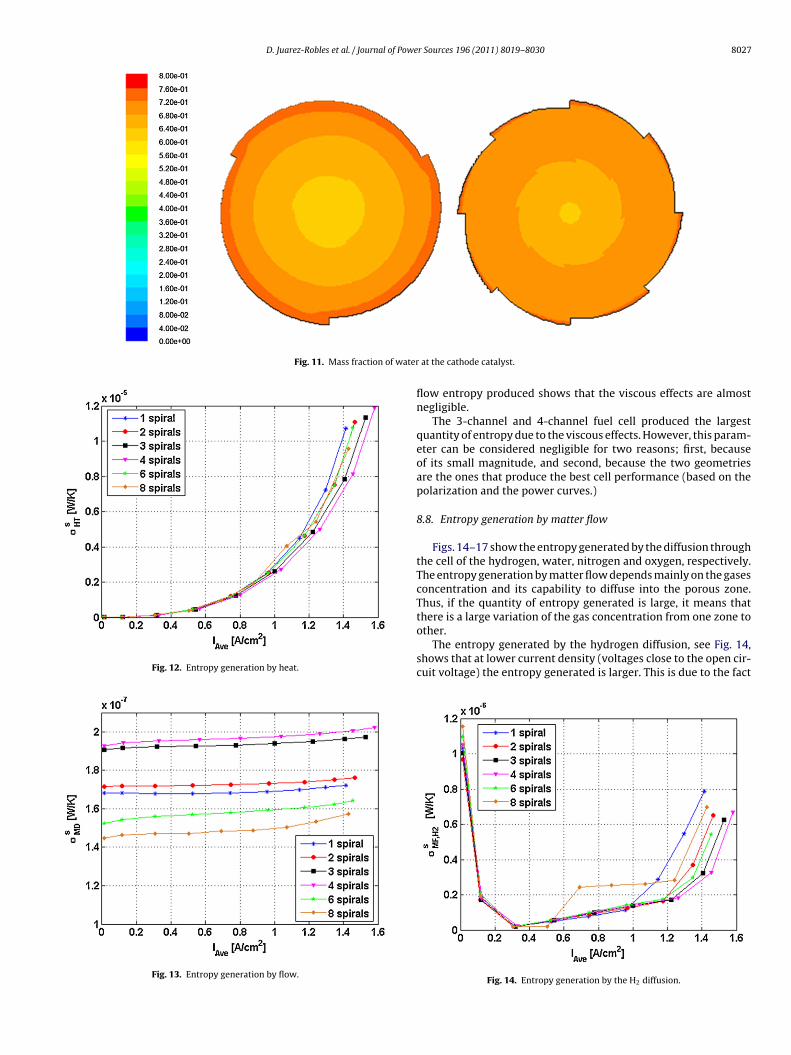
used to examine the performance because it affects the currentdensity produced, see Fig. 11. A uniform gas distribution will extendthe lifetime of the membrane and will enhance the performance ofthe cell. The water produced by the 3-channel fuel cell accumulates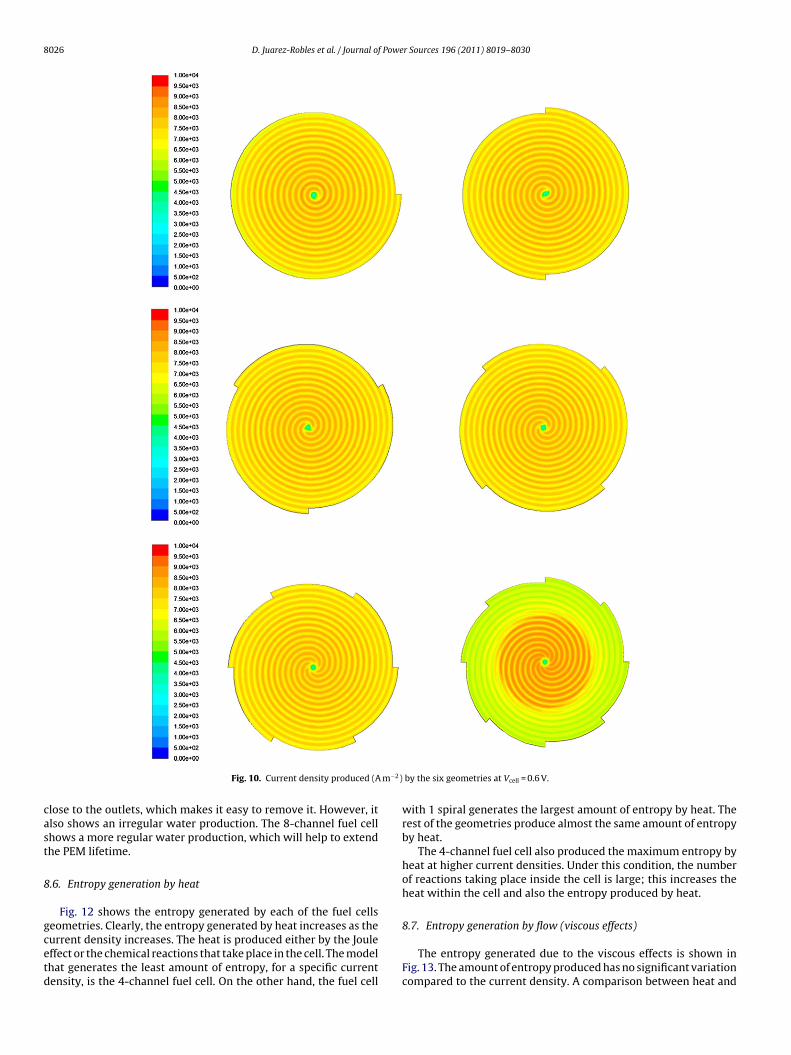
8026 D. Juarez-Robles et al. / Journal of Power Sources 196 (2011) 8019– 8030
m−2)
cast
8
gcetd
Fig. 10. Current density produced (A
lose to the outlets, which makes it easy to remove it. However, itlso shows an irregular water production. The 8-channel fuel cellhows a more regular water production, which will help to extendhe PEM lifetime.
.6. Entropy generation by heat
Fig. 12 shows the entropy generated by each of the fuel cellseometries. Clearly, the entropy generated by heat increases as the
urrent density increases. The heat is produced either by the Jouleffect or the chemical reactions that take place in the cell. The modelhat generates the least amount of entropy, for a specific currentensity, is the 4-channel fuel cell. On the other hand, the fuel cellby the six geometries at Vcell = 0.6 V.
with 1 spiral generates the largest amount of entropy by heat. Therest of the geometries produce almost the same amount of entropyby heat.
The 4-channel fuel cell also produced the maximum entropy byheat at higher current densities. Under this condition, the numberof reactions taking place inside the cell is large; this increases theheat within the cell and also the entropy produced by heat.
8.7. Entropy generation by flow (viscous effects)
The entropy generated due to the viscous effects is shown inFig. 13. The amount of entropy produced has no significant variationcompared to the current density. A comparison between heat and
D. Juarez-Robles et al. / Journal of Power Sources 196 (2011) 8019– 8030 8027
Fig. 11. Mass fraction of water
Fig. 12. Entropy generation by heat.
Fig. 13. Entropy generation by flow.
at the cathode catalyst.
flow entropy produced shows that the viscous effects are almostnegligible.
The 3-channel and 4-channel fuel cell produced the largestquantity of entropy due to the viscous effects. However, this param-eter can be considered negligible for two reasons; first, becauseof its small magnitude, and second, because the two geometriesare the ones that produce the best cell performance (based on thepolarization and the power curves.)
8.8. Entropy generation by matter flow
Figs. 14–17 show the entropy generated by the diffusion throughthe cell of the hydrogen, water, nitrogen and oxygen, respectively.The entropy generation by matter flow depends mainly on the gasesconcentration and its capability to diffuse into the porous zone.Thus, if the quantity of entropy generated is large, it means thatthere is a large variation of the gas concentration from one zone to
other.The entropy generated by the hydrogen diffusion, see Fig. 14,shows that at lower current density (voltages close to the open cir-cuit voltage) the entropy generated is larger. This is due to the fact
Fig. 14. Entropy generation by the H2 diffusion.
8028 D. Juarez-Robles et al. / Journal of Powe
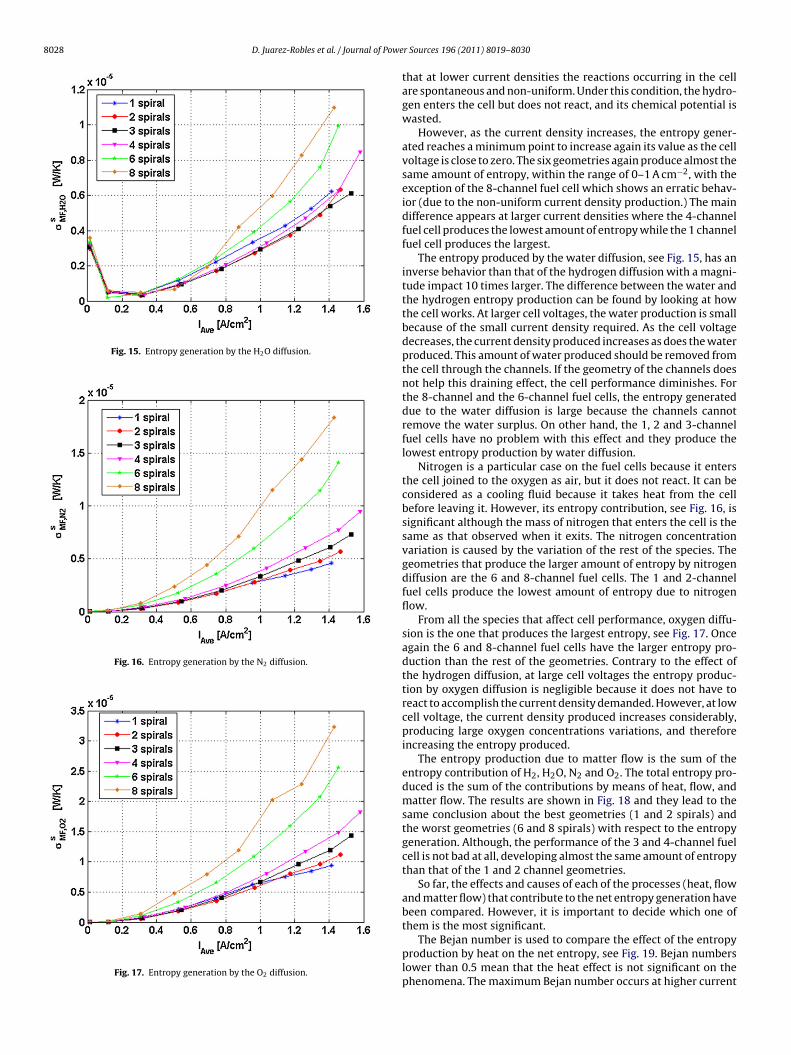
Fig. 15. Entropy generation by the H2O diffusion.
Fig. 16. Entropy generation by the N2 diffusion.
Fig. 17. Entropy generation by the O2 diffusion.
r Sources 196 (2011) 8019– 8030
that at lower current densities the reactions occurring in the cellare spontaneous and non-uniform. Under this condition, the hydro-gen enters the cell but does not react, and its chemical potential iswasted.
However, as the current density increases, the entropy gener-ated reaches a minimum point to increase again its value as the cellvoltage is close to zero. The six geometries again produce almost thesame amount of entropy, within the range of 0–1 A cm−2, with theexception of the 8-channel fuel cell which shows an erratic behav-ior (due to the non-uniform current density production.) The maindifference appears at larger current densities where the 4-channelfuel cell produces the lowest amount of entropy while the 1 channelfuel cell produces the largest.
The entropy produced by the water diffusion, see Fig. 15, has aninverse behavior than that of the hydrogen diffusion with a magni-tude impact 10 times larger. The difference between the water andthe hydrogen entropy production can be found by looking at howthe cell works. At larger cell voltages, the water production is smallbecause of the small current density required. As the cell voltagedecreases, the current density produced increases as does the waterproduced. This amount of water produced should be removed fromthe cell through the channels. If the geometry of the channels doesnot help this draining effect, the cell performance diminishes. Forthe 8-channel and the 6-channel fuel cells, the entropy generateddue to the water diffusion is large because the channels cannotremove the water surplus. On other hand, the 1, 2 and 3-channelfuel cells have no problem with this effect and they produce thelowest entropy production by water diffusion.
Nitrogen is a particular case on the fuel cells because it entersthe cell joined to the oxygen as air, but it does not react. It can beconsidered as a cooling fluid because it takes heat from the cellbefore leaving it. However, its entropy contribution, see Fig. 16, issignificant although the mass of nitrogen that enters the cell is thesame as that observed when it exits. The nitrogen concentrationvariation is caused by the variation of the rest of the species. Thegeometries that produce the larger amount of entropy by nitrogendiffusion are the 6 and 8-channel fuel cells. The 1 and 2-channelfuel cells produce the lowest amount of entropy due to nitrogenflow.
From all the species that affect cell performance, oxygen diffu-sion is the one that produces the largest entropy, see Fig. 17. Onceagain the 6 and 8-channel fuel cells have the larger entropy pro-duction than the rest of the geometries. Contrary to the effect ofthe hydrogen diffusion, at large cell voltages the entropy produc-tion by oxygen diffusion is negligible because it does not have toreact to accomplish the current density demanded. However, at lowcell voltage, the current density produced increases considerably,producing large oxygen concentrations variations, and thereforeincreasing the entropy produced.
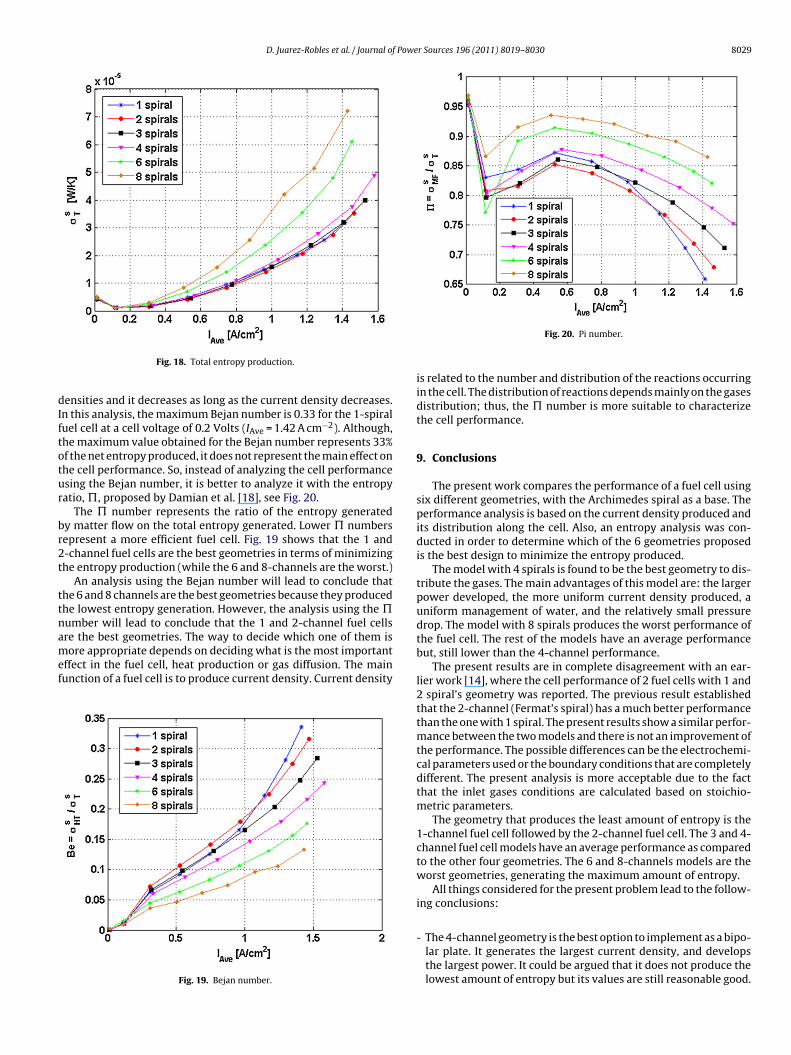
The entropy production due to matter flow is the sum of theentropy contribution of H2, H2O, N2 and O2. The total entropy pro-duced is the sum of the contributions by means of heat, flow, andmatter flow. The results are shown in Fig. 18 and they lead to thesame conclusion about the best geometries (1 and 2 spirals) andthe worst geometries (6 and 8 spirals) with respect to the entropygeneration. Although, the performance of the 3 and 4-channel fuelcell is not bad at all, developing almost the same amount of entropythan that of the 1 and 2 channel geometries.
So far, the effects and causes of each of the processes (heat, flowand matter flow) that contribute to the net entropy generation havebeen compared. However, it is important to decide which one ofthem is the most significant.
The Bejan number is used to compare the effect of the entropyproduction by heat on the net entropy, see Fig. 19. Bejan numberslower than 0.5 mean that the heat effect is not significant on thephenomena. The maximum Bejan number occurs at higher current
D. Juarez-Robles et al. / Journal of Power Sources 196 (2011) 8019– 8030 8029
dIftotur
br2t
ttnamef
Fig. 18. Total entropy production.
ensities and it decreases as long as the current density decreases.n this analysis, the maximum Bejan number is 0.33 for the 1-spiraluel cell at a cell voltage of 0.2 Volts (IAve = 1.42 A cm−2). Although,he maximum value obtained for the Bejan number represents 33%f the net entropy produced, it does not represent the main effect onhe cell performance. So, instead of analyzing the cell performancesing the Bejan number, it is better to analyze it with the entropyatio, �, proposed by Damian et al. [18], see Fig. 20.
The � number represents the ratio of the entropy generatedy matter flow on the total entropy generated. Lower � numbersepresent a more efficient fuel cell. Fig. 19 shows that the 1 and-channel fuel cells are the best geometries in terms of minimizinghe entropy production (while the 6 and 8-channels are the worst.)
An analysis using the Bejan number will lead to conclude thathe 6 and 8 channels are the best geometries because they producedhe lowest entropy generation. However, the analysis using the �umber will lead to conclude that the 1 and 2-channel fuel cellsre the best geometries. The way to decide which one of them is
ore appropriate depends on deciding what is the most importantffect in the fuel cell, heat production or gas diffusion. The mainunction of a fuel cell is to produce current density. Current density
Fig. 19. Bejan number.
Fig. 20. Pi number.
is related to the number and distribution of the reactions occurringin the cell. The distribution of reactions depends mainly on the gasesdistribution; thus, the � number is more suitable to characterizethe cell performance.
9. Conclusions
The present work compares the performance of a fuel cell usingsix different geometries, with the Archimedes spiral as a base. Theperformance analysis is based on the current density produced andits distribution along the cell. Also, an entropy analysis was con-ducted in order to determine which of the 6 geometries proposedis the best design to minimize the entropy produced.
The model with 4 spirals is found to be the best geometry to dis-tribute the gases. The main advantages of this model are: the largerpower developed, the more uniform current density produced, auniform management of water, and the relatively small pressuredrop. The model with 8 spirals produces the worst performance ofthe fuel cell. The rest of the models have an average performancebut, still lower than the 4-channel performance.
The present results are in complete disagreement with an ear-lier work [14], where the cell performance of 2 fuel cells with 1 and2 spiral’s geometry was reported. The previous result establishedthat the 2-channel (Fermat’s spiral) has a much better performancethan the one with 1 spiral. The present results show a similar perfor-mance between the two models and there is not an improvement ofthe performance. The possible differences can be the electrochemi-cal parameters used or the boundary conditions that are completelydifferent. The present analysis is more acceptable due to the factthat the inlet gases conditions are calculated based on stoichio-metric parameters.
The geometry that produces the least amount of entropy is the1-channel fuel cell followed by the 2-channel fuel cell. The 3 and 4-channel fuel cell models have an average performance as comparedto the other four geometries. The 6 and 8-channels models are theworst geometries, generating the maximum amount of entropy.
All things considered for the present problem lead to the follow-ing conclusions:
- The 4-channel geometry is the best option to implement as a bipo-
lar plate. It generates the largest current density, and developsthe largest power. It could be argued that it does not produce thelowest amount of entropy but its values are still reasonable good.
8 f Powe
-
-
-
piit
m�thDa
R
[
[
[
[
[
[
[
[
[
[
[
[
[
[
[
030 D. Juarez-Robles et al. / Journal o
The second best option for the fuel cell geometry is the 3-channel.Its performance is very similar to that of the 4-channel model butwith the difference that it produces a lower current density.
The 1-channel and 2-channel models have an average perfor-mance from all points of views, being good options if the criterionto meet is the minimum entropy generation.
Finally, the 6-channel and the 8-channel develop the worst per-formance as a fuel cell. They produce the lowest current densityand the largest entropy production.
Thus, the number of channels used considerably affects the cellerformance, finding the optimal value between 3 or 4 channels. It
s not convenient to increase the number of channels because theres not a significant improvement on the cell performance, and alsohe manufacturing of the flow channels becomes more complex.
Two different parameters were used to compare the cell perfor-ance based on the entropy analysis, the Bejan number and the
number. The present results are in complete agreement withhose previous results of Damian et al. [18] in that the matter flowas a more significant effect than the thermal effects. The work byamian and the presented work enhance the use of the � numbers the best option to analyze and characterize fuel cells.
eferences
[1] S. Dutta, S. Shimpalee, J.W. Van Zee, W.K. Lee, Effect of humidity on PEM fuel cellperformance part II—Numerical simulation, in: Proceedings of ASME IMECE,HTD 364-1, 1999, pp. 367–374.
[2] P.T. Nguyen, T. Berning, N. Djilali, Computational model of a PEM fuel cell withserpentine gas flow channels, Journal of Power Sources 130 (2004) 149–157.
[3] Pollegri A., Spaziante P.; 1980. US Patent no. 4197178.[4] Guilin Hu, Jianren Fan, Song Chen, Three-dimensional numerical analysis of
proton exchange membrane fuel cells (PEMFCs) with conventional and inter-digitated flow fields, Journal of Power Sources 136 (2004) 1–9.
[5] D.L. Wool, J.S. Yi, T.V. Nguyen, Effect of the liquid water injection and interdig-itated flow field on the performance of proton exchange membrane fuel cells,Electrochemical Acta 43 (1998) 3795–3809.
[6] S. Cano-Andrade, A. Hernandez-Guerrero, D. Juarez-Robles, C. Rubio-Arana,
Experimental study for PEMFCs with conventional and innovative channelconfigurations, in: Proceedings of ECOS 2009; RS30600B, Paraná, Brazil, 2009.[7] I. Perez-Raya, A. Hernandez-Guerrero, D. Juarez-Robles, M. Gutierrez-Rivera,J.C. Rubio-Arana, New radial-based flow configurations for PEMFCs, in: Pro-ceedings of ASME IMECE 2009: 12202, Florida, USA, 2009.
[
r Sources 196 (2011) 8019– 8030
[8] J.V.C. Vargas, J.C. Ordonez, A. Bejan, Constructal flow structure for a PEMfuel cell, International Journal of Heat and Mass Transfer 47 (2004) 4177–4193.
[9] C.E. Damian-Ascencio, A. Hernandez-Guerrero, J.A. Escobar-Vargas, C. Rubio-Arana, F. Elizalde-Blancas, Three dimensional numerical prediction of thecurrent density for a constructal theory-based flow field pattern, in: Proceed-ings of ASME IMECE 2007; 42449, Seattle, USA, 2007.
10] A. Chapman, I. Mellor, Development of biomimetic flow field plates for PEMfuel cells, in: Eighth Grove Fuel Cell Symposium, London, UK, 2003.
11] S. Senn, D. Poulikakos, Tree network channels as fluid distributors constructingdouble staircase polymer electrolyte fuel cells, Journal of Applied Physics 96(2004) 842–852.
12] B. Ramos-Alvarado, A. Hernandez-Guerrero, D. Juarez-Robles, J.C. Rubio-Arana,Analysis of flow distribution in a symmetric bipolar plate for PEMFC, in: Pro-ceedings of ECOS 2009, Paraná, Brazil, 2009.
13] J.A. Escobar-Vargas, A. Hernandez-Guerrero, A. Alatorre Ordaz, C.E. Damian-Ascencio, F. Elizalde-Blancas, Performance of a non-conventional flow field ina PEMFC, in: Proceedings of ECOS 2007, 2007, pp. 1083–1091.
14] D. Juarez-Robles, A. Hernandez-Guerrero, C.E. Damian-Ascencio, J.C. Rubio-Arana, Three dimensional analysis of a PEM fuel cell with the shape of a Fermatspiral for the flow channel configuration, in: Proceedings of IMECE 2008; 68101,Chicago, USA, 2008.
15] K. Tüber, A. Oedegaard, M. Hermann, C. Hebling, Investigation of fractal flow-fields in portable proton exchange membrane and direct methanol fuel cells,Journal of Power Sources 131 (2004) 175–181.
16] A. Bejan, Second-law analysis in heat transfer and thermal design, AdvancedHeat Transfer 15 (1982) 1–58.
17] A. Bejan, Entropy Generation Minimization, CRC Press, Boca Raton, New York,1996.
18] C.E. Damian-Ascencio, A. Hernandez-Guerrero, F. Ascencio-Cendejas, D. Juarez-Robles, Entropy generation analysis for a PEM fuel-cell with a biomimetic flowfield, in: Proceedings of ASME IMECE 2009, 12057, Florida, USA, 2009.
19] J.H. Nam, M. Karviany, Effective diffusivity and water-saturation distributionin single and two-layer PEMFC diffusion medium, International Journal of HeatMass Transfer 46 (24) (2003) 4595–4611.
20] T. Nguyen, R. White, A water and heat management model for proton-exchange-membrane fuel cells, Journal of Electrochemistry Society 140 (1993)2178–2186.
21] T.E. Springer, A. Zawodzinski, S. Gottesfeld, Polymer electrolyte fuel cell model,Journal of Electrochemistry Society 138 (1991) 2334–2341.
22] A. Parthasarathy, S. Srinivasan, J. Appleby, Journal of Electrochemistry Society139 (1932) 2530.
23] D. Jou, J. Casas-Vazquez, G. Lebon, Extended irreversible thermodynamics, Edit.Springer, Germany, 1996.
24] S.M. Sukkee Um, C.Y. Wang, Three-dimensional analysis of transport and elec-
trochemical reactions in polymer electrolyte fuel cells, Journal of Power Sources125 (2004) 40–51.25] D. Senn, Poulikakos, Polymer electrolyte fuel cells with porous materials asfluid distributors and comparisons with traditional channeled systems, Journalof Heat Transfer 123 (3) (2004).