modeling moisture absorption process of wood-based composites under over-saturated moisture...
TRANSCRIPT
ORI GIN AL
Modeling moisture absorption process of wood-basedcomposites under over-saturated moisture conditionsusing two-part equations
Sheldon Q. Shi Æ Dongfeng Wu
Received: 19 November 2007 / Published online: 17 June 2008
� Springer-Verlag 2008
Abstract The objective of this study was to investigate the moisture absorption
process for wood-based composites subjected to over-saturated moisture condi-
tions. Two stages are comprised in the moisture transfer process at the over-
saturated moisture conditions, an initial stage which is the moisture transfer
process mainly under fiber saturation point (FSP), and a second stage which is
the moisture transfer process beyond the FSP. A model was developed based on
two-part equations to describe the process, from which three coefficients (k1, k21,and k22) can be used to quantitatively describe the moisture transfer process
under the conditions. Two different wood-based composites, wood fiberboard and
wood fiber/polymer composites (polymer content: 30%), were used to test the
model at four different ambient temperatures (30, 45, 62, and 80�C). It was
shown that the two-part equation can accurately describe the moisture absorption
process under over-saturated moisture conditions. The moisture absorption rate in
the initial stage was about 30–60% greater than that in the second stage for most
of the cases evaluated in this study. The higher the temperature, the greater
moisture absorption parameters were obtained. At both moisture absorption stages
(below FSP and above FSP), the calculated activation energy for the moisture
This manuscript is approved for publication as Journal Article No. FP 398 of the Forest and Wildlife
Research Center, Mississippi State University.
S. Q. Shi (&)
Forest Products Department,
Mississippi State University, Box 9820, Mississippi State, MS 39762, USA
e-mail: [email protected]
D. Wu
Bioinformatics and Biostatistics Department, University of Louisville,
Louisville, KY 40292, USA
123
Wood Sci Technol (2009) 43:143–152
DOI 10.1007/s00226-008-0201-x
absorption rate of wood fiberboard was very close to that of wood fiber/polymer
composites.
Introduction
Moisture movement in wood or wood-based materials is mainly controlled by
diffusion if the moisture content of the wood is below fiber saturation point (FSP).
Skaar (1958) indicated that the moisture diffusion was a combination of two
movements: the vapor diffusion through the void structure and the bound water
diffusion through the cell wall. It is shown that the moisture de-sorption process in
wood (drying) can be successfully described by the diffusion model based on Fick’s
second law (Skaar 1958; Avramidis and Siau 1987; Liu 1989; Chen et al. 1995).
However, when this diffusion model was applied to the moisture absorption process
under water vapor conditions, systematic errors occurred at the initial moisture
absorption process (Shi and Gardner 2006a) thanks to the hydroxyl groups on the
wood surface accelerating the moisture absorption at the initial stage of the moisture
absorption process as opposed to the delay during the moisture de-sorption process.
Some researchers (Cloutier and Fortin 1993; Hartley and Schneider 1993; Cai and
Shang 1992; Wu and Suchsland 1996) have conducted modeling the moisture
absorption process in wood-based composites. Shi (2007a) developed a simple
model describing the moisture absorption (WA) process as follows:
WAðtÞ ¼WA11
1001� e�k1t1=2� �
1þ WA11100
e�k1t1=2
0@
1A� 100 ð1Þ
where WA11 is the equilibrium water absorption (%), k1 is the moisture absorption
coefficient (s-1/2), a constant referred to as intrinsic relative moisture absorption
rate, and t is the time (s).
This equation has been successfully applied to model the moisture absorption
process under water vapor conditions, from which k1 can be used to quantify the
rate of the moisture absorption in wood or wood-based materials. The similar
function has also been used successfully to describe the hygroscopic thickness
swelling process of wood-based composites (Shi and Gardner 2006a, b).
Over-saturated moisture condition is that when the relative humidity in the
environment is 100% and the moisture condensation also occurs on the material
surface. At this condition, the environment is filled with moisture mists, and the
equilibrium moisture contents (EMC) of wood is higher than the FSP, but is
lower than that under full saturated conditions (moisture occupies all the lumens
and voids in wood-based material). This condition often occurs during the
summer time in Gulf south of the United States, where the weather is humid and
the ambient temperature is high. The objective of this research is to develop a
mathematical model for moisture absorption process in over-saturated moisture
conditions. In addition, through applying the developed model, the effect of the
temperature on the moisture absorption process of wood-based composites was
investigated.
144 Wood Sci Technol (2009) 43:143–152
123
Model development
Two-part equation model
Under the over-saturated conditions, the moisture transfer in wood-based materials
can be considered to consist of two stages. The first stage is in the initial period of
the moisture transfer process when most of the moisture absorption process is
dominated by the bound water diffusion, of which the moisture content is below
FSP. According to Shi (2007b), Eq. (1) can be used to describe the process for the
first stage of the moisture transfer process.
The second stage of the moisture absorption process in over-saturated conditions
is during the period when the moisture content of the materials is above the FSP. For
modeling this process, the moisture absorption rate of wood-based composites
(dWðtÞdt1=2 , in order to shorten the scale, a square root of time is used) can be assumed to
be proportional to the specimen weight at the initial portion of the moisture
absorption event, which is expressed as:
dWðtÞdt1=2
¼ k21WðtÞ ð2Þ
where W is the weight of the specimen, t is the time, and k21 is the moisture
absorption rate constant (s-1/2).
During the second stage, the moisture in the cell wall maybe almost saturated,
and free water movement in lumens of wood elements and voids in the composites
might be dominating the moisture absorption process. Based on this consideration,
one coefficient in the model is sufficient to describe the moisture transfer process.
Another coefficient (k22) is introduced in the model for adjustment. Since this
adjustment coefficient can be a function of time, the initial moisture absorption rate
can be expressed as:
dWðtÞdt1=2
¼ ðk21 þ k22t1=2Þ �WðtÞ ð3Þ
where k22 is the adjustment coefficient for the moisture absorption rate (s-1/2).
The relative moisture absorption rate declines linearly with an increase in the
weight of the specimen. Therefore, the rate of change in specimen weight is then
given by the differential equation:
dWðtÞdt1=2
¼ ðk21 þ k22t1=2Þ �WðtÞ � ð1�WðtÞW21Þ ð4Þ
where W2? is the equilibrium moisture content during the second stage of the
moisture absorption process.
The analytical solution of Eq. (4) is:
WðtÞ ¼ W21
1þ W21W0� 1
� �e�k21t1=2�k22
2t
ð5Þ
Moisture absorption of the board can be determined by the following
equation:
Wood Sci Technol (2009) 43:143–152 145
123
WAðtÞ ¼ WðtÞ �W0
W0
� 100 ð6Þ
Combine Eqs. (5) and (6), after simplification, the following equation is obtained for
WA (t) (%):
WAðtÞ ¼WA21
1001� e�k21t1=2�k22
2t
� �
1þ WA21100
e�k21t1=2�k222
t
0@
1A� 100 ð7Þ
Equation (7) is used to describe the second stage of the moisture absorption process.
Therefore, the two-part equation model is a combination of Eqs. (1) and (7) of
which Eq. (1) is for the first stage of the moisture absorption process under over-
saturated conditions, and Eq. (7) is for the second stage. The optimal point (WA1)
between the Stage 1 and Stage 2 is obtained from the data set when the program
seeks the minimum sum of square for the data fit with the non-linear curve fitting
method. The coefficients k1 from Eq. (1), and k21 and k22 from Eq. (7) can also be
obtained.
The total equilibrium water absorption (WA?) can be calculated as:
WA1 ¼WA1 þWA21 ð8Þ
Experimental
For the evaluation of the two-part equation model, the laboratory developed
compression molded wood fiber based composites and wood fiber/polymer
composites (30% polymer content), were used (Shi 1997). In the preparation of
wood fiber based composites, hardwood fiber with 75% aspen and 25% other
hardwoods were used for the wood fiberboard manufacture. The wood fiber/polymer
composites were also made from hardwood fibers and the reclaimed automobile
polymer mixtures. The polymer mixtures were processed from automobile shredder
residual (ASR), also called automobile fluff, which contains a polymer mixture of
about 27% polyurethane, 17% polypropylene, 12% polyvinyl chloride (PVC), 9%
acrylonitrile butadiene styrene (ABS), and 35% other polymers. The mixed polymers
were ground into particles at a size of 35 mesh (0.5 mm), and blended into the
hardwood fiber furnish for making the wood fiber/polymer composites. Polymeric
diphenylmethane diisocyanate (pMDI) was used as a binder. The board thickness
was targeted as 3.2 mm. All the boards were processed at a press temperature of
130�C, a press time of 4 min, and a resin solids level of 4%. The target board density
was 900 kg/m3. Specimens with a dimension of 50 9 50 9 3.2 mm3 were prepared
for the moisture absorption tests. Three replicates were used for each composite type.
The average of the three WA measurements was used for the model evaluation. The
edges of the specimens were sealed by aluminum foil bonded with epoxy to ensure
moisture transport into the composites in one direction. To ensure the same moisture
content for all the specimens, before each test, all the specimens were oven-dried at
103 ± 2�C until a constant weight was reached.
146 Wood Sci Technol (2009) 43:143–152
123
A humidity chamber, of which the wet bulb temperature was set higher than the
dry bulb temperature, was used to control the moisture conditions. At this condition,
moisture mist developed and moisture condensations were shown in the chamber,
which is considered as over-saturated moisture conditions. The water droplets were
also observed precipitating on the surface of the specimens. In order to evaluate the
effect of temperature on the moisture absorption process, four different tempera-
tures, 30, 45, 62, and 80�C, were used in the experiment.
This model with the two-part equations was applied to fit the experimental data.
A program written in S-Plus� software (Professional Edition) was used to conduct
non-linear curve fitting to the test data to find the parameters, k1 and WA1? of Eq.
(1), and k21, k22, and WA2? from Eq. (7). The optimal cutting point, WA1, was
found in the data set where to start applying the Eq. (7).
Results and discussions
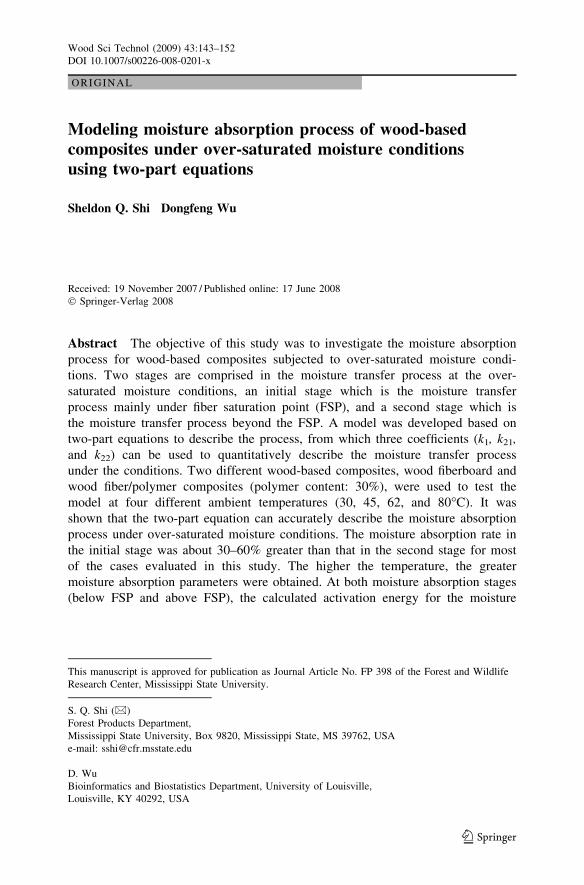
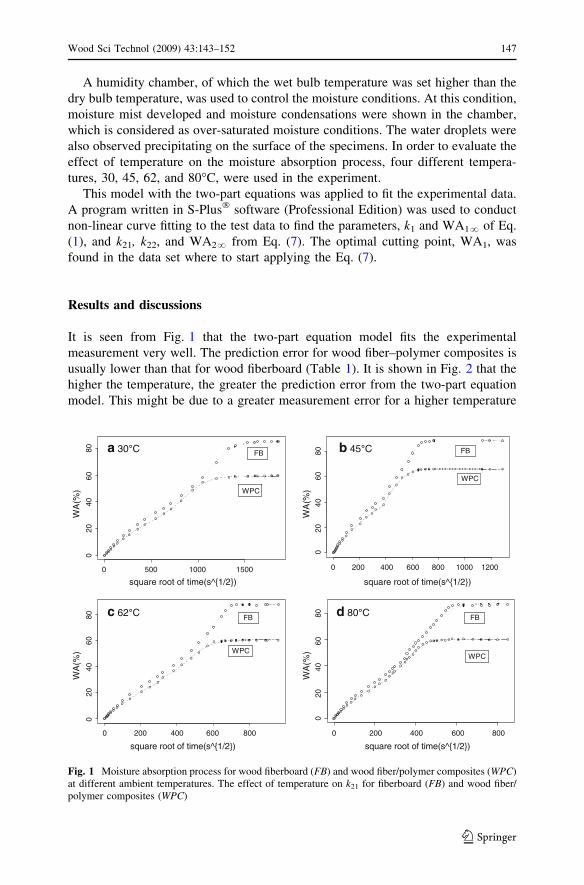
It is seen from Fig. 1 that the two-part equation model fits the experimental
measurement very well. The prediction error for wood fiber–polymer composites is
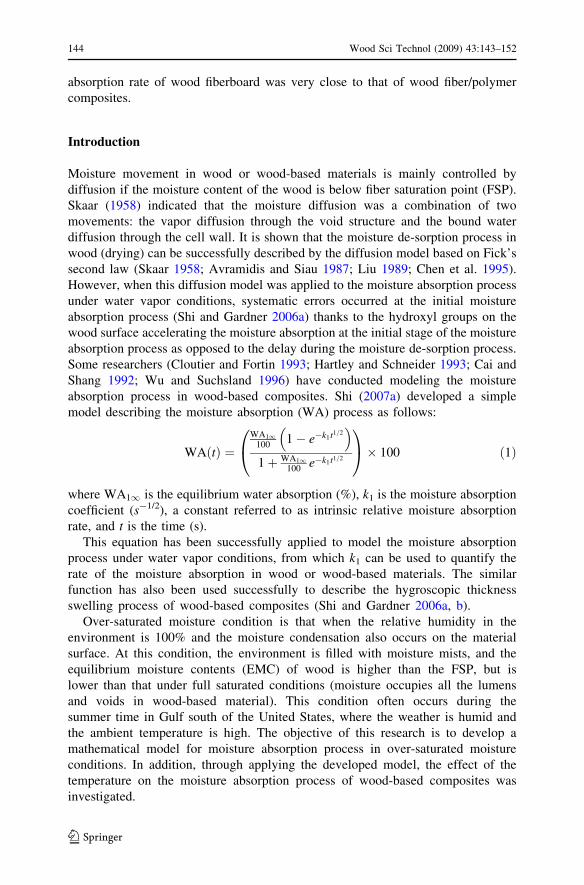
usually lower than that for wood fiberboard (Table 1). It is shown in Fig. 2 that the
higher the temperature, the greater the prediction error from the two-part equation
model. This might be due to a greater measurement error for a higher temperature
square root of time(s^{1/2})
WA
(%)
0
0 ooooo
oo
oo
oo
oo
o
o
oo o o o oo o o oo
FB
WPC
square root of time(s^{1/2})
ooooo
oo
o
oo
oo
oo
o
o
oo
o oo o o o o o o
FB
WPC
square root of time(s^{1/2})
oooo
ooo
oo
oo
oo
oo
oo
oo o o o o o o o oo o
FB
WPC
square root of time(s^{1/2})
ooooo
oo
oo
oo
oo
oo
ooo
ooo
oo
oo o oo o o o o o o o o o o o o
FB
WPC
2040
6080
WA
(%)
020
4060
80
500 1000 1500 0 200 400 600 800 1000 1200
0 200 400 600 800 0 200 400 600 800
WA
(%)
020
4060
80
WA
(%)
020
4060
80
a 30°C
c 62°C d 80°C
b 45°C
Fig. 1 Moisture absorption process for wood fiberboard (FB) and wood fiber/polymer composites (WPC)at different ambient temperatures. The effect of temperature on k21 for fiberboard (FB) and wood fiber/polymer composites (WPC)
Wood Sci Technol (2009) 43:143–152 147
123
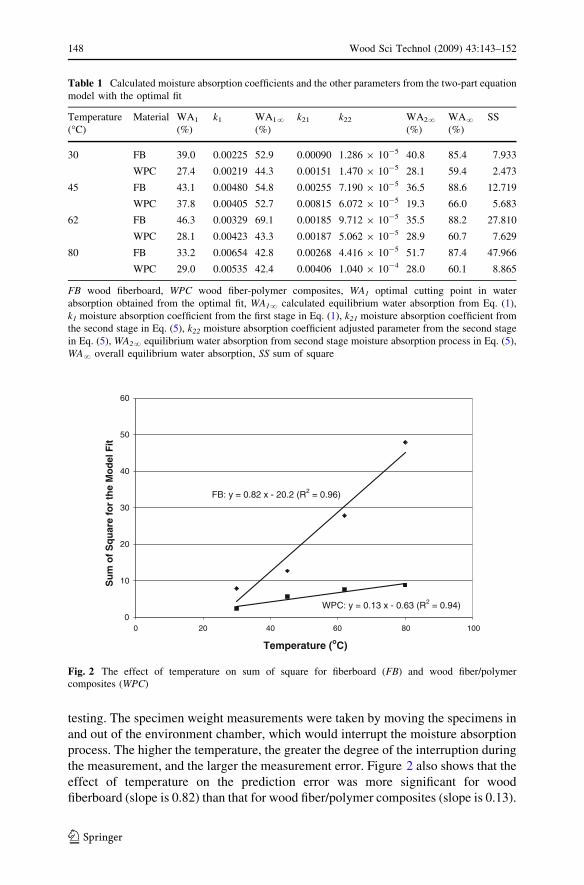
testing. The specimen weight measurements were taken by moving the specimens in
and out of the environment chamber, which would interrupt the moisture absorption
process. The higher the temperature, the greater the degree of the interruption during
the measurement, and the larger the measurement error. Figure 2 also shows that the
effect of temperature on the prediction error was more significant for wood
fiberboard (slope is 0.82) than that for wood fiber/polymer composites (slope is 0.13).
0
10
20
30
40
50
60
0
Temperature (oC)
Su
m o
f S
qu
are
for
the
Mo
del
Fit
FB: y = 0.82 x - 20.2 (R2 = 0.96)
WPC: y = 0.13 x - 0.63 (R2 = 0.94)
20 40 60 80 100
Fig. 2 The effect of temperature on sum of square for fiberboard (FB) and wood fiber/polymercomposites (WPC)
Table 1 Calculated moisture absorption coefficients and the other parameters from the two-part equation
model with the optimal fit
Temperature
(�C)
Material WA1
(%)
k1 WA1?
(%)
k21 k22 WA2?
(%)
WA?
(%)
SS
30 FB 39.0 0.00225 52.9 0.00090 1.286 9 10-5 40.8 85.4 7.933
WPC 27.4 0.00219 44.3 0.00151 1.470 9 10-5 28.1 59.4 2.473
45 FB 43.1 0.00480 54.8 0.00255 7.190 9 10-5 36.5 88.6 12.719
WPC 37.8 0.00405 52.7 0.00815 6.072 9 10-5 19.3 66.0 5.683
62 FB 46.3 0.00329 69.1 0.00185 9.712 9 10-5 35.5 88.2 27.810
WPC 28.1 0.00423 43.3 0.00187 5.062 9 10-5 28.9 60.7 7.629
80 FB 33.2 0.00654 42.8 0.00268 4.416 9 10-5 51.7 87.4 47.966
WPC 29.0 0.00535 42.4 0.00406 1.040 9 10-4 28.0 60.1 8.865
FB wood fiberboard, WPC wood fiber-polymer composites, WA1 optimal cutting point in water
absorption obtained from the optimal fit, WA1? calculated equilibrium water absorption from Eq. (1),
k1 moisture absorption coefficient from the first stage in Eq. (1), k21 moisture absorption coefficient from
the second stage in Eq. (5), k22 moisture absorption coefficient adjusted parameter from the second stage
in Eq. (5), WA2? equilibrium water absorption from second stage moisture absorption process in Eq. (5),
WA? overall equilibrium water absorption, SS sum of square
148 Wood Sci Technol (2009) 43:143–152
123
From the two-part equation model, it is seen that the first equation has one
moisture absorption coefficient (k1), which is similar to the bound water diffusion
process (first stage of the process) since most of the diffusion occurs below fiber
saturation point of wood-based materials. For the second equation in the model, a
second coefficient (k22) was used since it is to describe the moisture process with
much more free water movement, in addition to having a moisture absorption
coefficient (k21). This second coefficient is the adjustment parameter which is used
to adjust the prediction errors due to the free water movement in the lumens and
voids. For most cases, the moisture absorption rate at the first stage (k1) is about 30–
50% greater than that at the second stage (k21), as shown in Table 1. This is mainly
due to the nature of the moisture absorption process. At the initial stage of the
moisture absorption process, the moisture absorption is faster. As the time elapses,
the moisture absorption rates slow, and tend to reach 0 at equilibrium. The
adjustment coefficients for the second stage (k22) are usually small, around only
1–5% of k21.
Since the first equation is mainly describing the moisture transfer below FSP,
technically, the optimal cutting point in water absorption values, WA1, obtained
from the non linear curve fitting program should be close to the FSP of the
composites. As shown in Table 1, the WA1 values were in the range of 33–46% for
wood fiberboard and 27–37% for wood fiber/polymer composites. They were about
9–17% higher than the FSP which is around 24–29% for wood fiberboard and 19–
24% for wood fiber/polymer composites with 30% polymer content (Shi 2007b).
While bound water diffusion dominates the moisture absorption process, some
degree of free water movement also occurs. This may be part of the reason that the
calculated starting points for the second moisture transfer stage are higher than the
FSP.
As shown in Table 1, the overall equilibrium water absorption (WA?) was
obtained as 85–89% for wood fiberboard, and 59–66% for wood fiber/polymer
composites. This was about 60% higher than the FSP for wood fiberboard and 40%
for wood fiber/polymer composites (existing in the lumens or voids of the
composites as free water). It is also seen from the equilibrium water absorption data
in Table 1, that wood fiber/polymer composites provided about 30% less moisture
uptake than the wood fiberboard. This coincides with the polymer content used for
the wood fiber/polymer composites (30%). Therefore, wood fiber is the main
contributor to the water absorption in wood fiber/polymer composites.
It was also seen from Table 1 that both moisture absorption coefficients of two
stages changed as a function of temperature. The higher the temperature, the
greater the moisture absorption rate in the wood-based composite. This process
occurs because water molecules move faster at higher temperature. As shown in
Table 1, from 30 to 80�C, the moisture absorption rate increase for the initial
stage was 191% for the wood fiberboard and 144% for the wood fiber/polymer
composite. For the second stage, the rate was 198% for the wood fiberboard and
169% for the wood fiber/polymer composites. This shows that temperature has a
greater effect on the wood fiberboard compared with the wood fiber/polymer
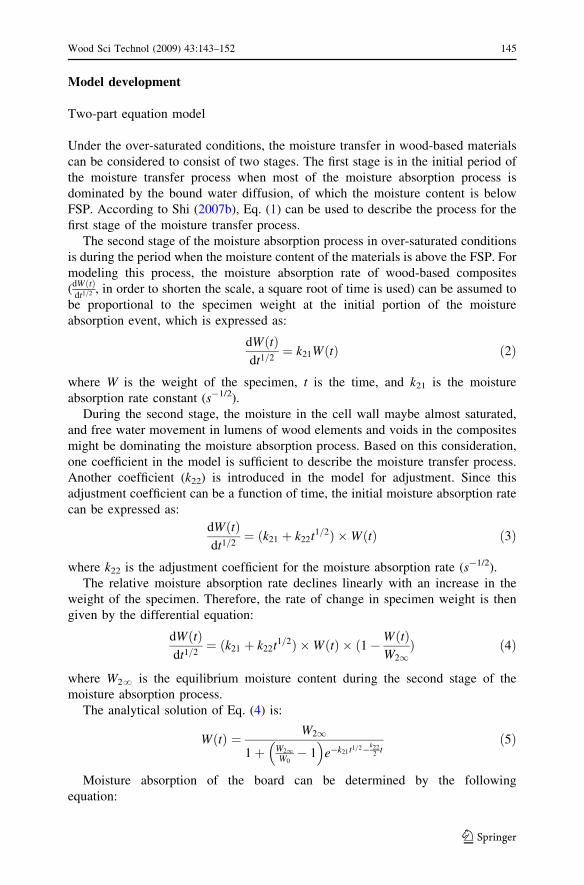
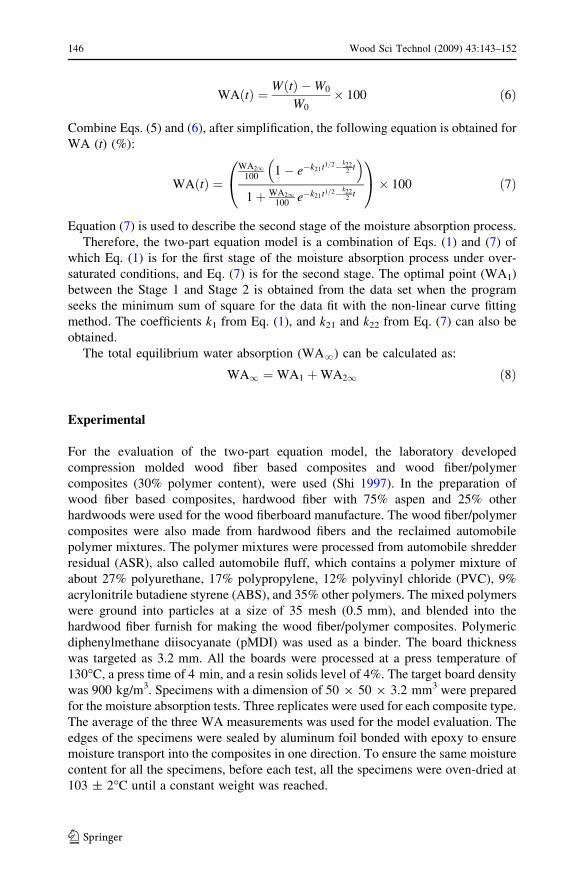
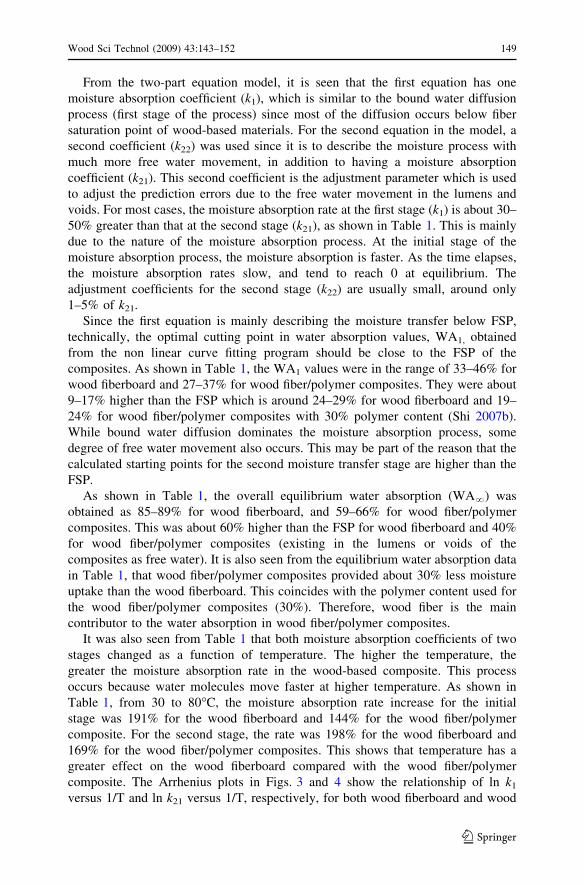
composite. The Arrhenius plots in Figs. 3 and 4 show the relationship of ln k1
versus 1/T and ln k21 versus 1/T, respectively, for both wood fiberboard and wood
Wood Sci Technol (2009) 43:143–152 149
123
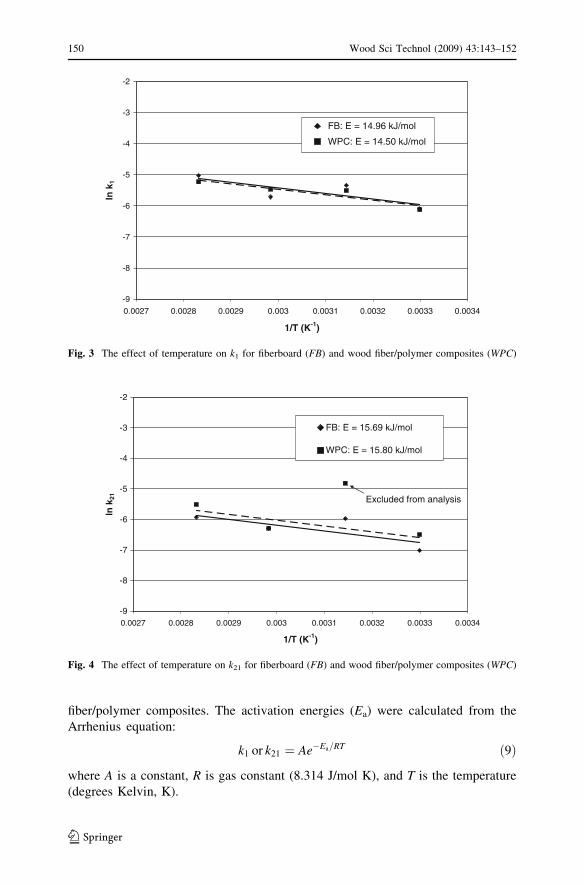
fiber/polymer composites. The activation energies (Ea) were calculated from the
Arrhenius equation:
k1 or k21 ¼ Ae�Ea=RT ð9Þ
where A is a constant, R is gas constant (8.314 J/mol K), and T is the temperature
(degrees Kelvin, K).
-9
-8
-7
-6
-5
-4
-3
-2
0.0027 0.0028 0.0029 0.003 0.0031 0.0032 0.0033 0.0034
1/T (K-1)
ln k
1
FB: E = 14.96 kJ/mol
WPC: E = 14.50 kJ/mol
Fig. 3 The effect of temperature on k1 for fiberboard (FB) and wood fiber/polymer composites (WPC)
-9
-8
-7
-6
-5
-4
-3
-2
0.0027 0.0028 0.0029 0.003 0.0031 0.0032 0.0033 0.0034
1/T (K-1)
ln k
21
FB: E = 15.69 kJ/mol
WPC: E = 15.80 kJ/mol
Excluded from analysis
Fig. 4 The effect of temperature on k21 for fiberboard (FB) and wood fiber/polymer composites (WPC)
150 Wood Sci Technol (2009) 43:143–152
123
It is seen from Figs. 3 and 4 that the activation energies calculated from the plots
of wood fiberboard and wood fiber/polymer composites are similar (14.96 vs.
14.50 kJ/mol for k1 and 15.69 vs. 15.80 kJ/mol for k21). This indicates that the
degree of temperature effect on moisture absorption rate is similar between the
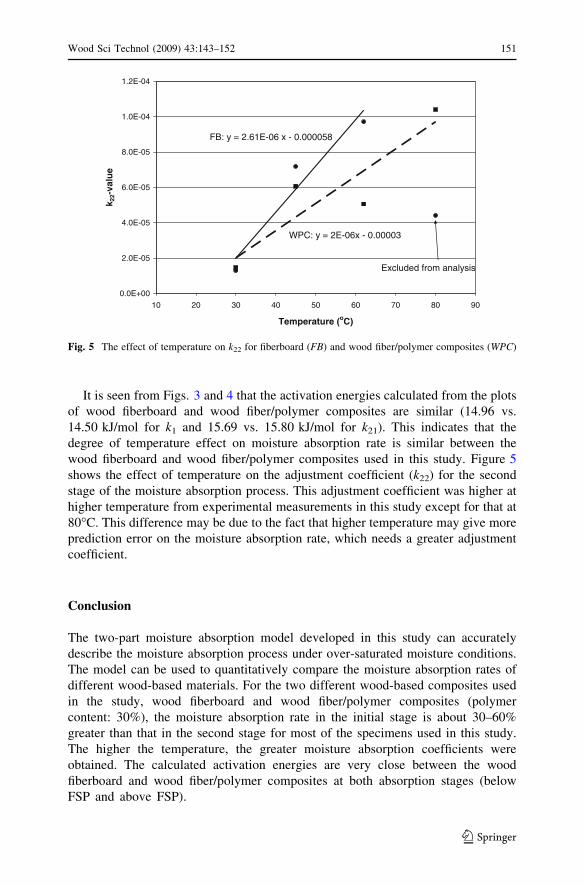
wood fiberboard and wood fiber/polymer composites used in this study. Figure 5
shows the effect of temperature on the adjustment coefficient (k22) for the second
stage of the moisture absorption process. This adjustment coefficient was higher at
higher temperature from experimental measurements in this study except for that at
80�C. This difference may be due to the fact that higher temperature may give more
prediction error on the moisture absorption rate, which needs a greater adjustment
coefficient.
Conclusion
The two-part moisture absorption model developed in this study can accurately
describe the moisture absorption process under over-saturated moisture conditions.
The model can be used to quantitatively compare the moisture absorption rates of
different wood-based materials. For the two different wood-based composites used
in the study, wood fiberboard and wood fiber/polymer composites (polymer
content: 30%), the moisture absorption rate in the initial stage is about 30–60%
greater than that in the second stage for most of the specimens used in this study.
The higher the temperature, the greater moisture absorption coefficients were
obtained. The calculated activation energies are very close between the wood
fiberboard and wood fiber/polymer composites at both absorption stages (below
FSP and above FSP).
WPC: y = 2E-06x - 0.00003
0.0E+00
2.0E-05
4.0E-05
6.0E-05
8.0E-05
1.0E-04
1.2E-04
10 20 30 40 50 60 70 80 90
Temperature (oC)
k 22-
valu
e
FB: y = 2.61E-06 x - 0.000058
Excluded from analysis
Fig. 5 The effect of temperature on k22 for fiberboard (FB) and wood fiber/polymer composites (WPC)
Wood Sci Technol (2009) 43:143–152 151
123
References
Avramidis ST, Siau JF (1987) An investigation of the external and internal resistance to moisture
diffusion in wood. Wood Sci Technol 21:249–256
Cai L, Shang D (1992) Modeling pf the moisture transfer process in particleboard. Holz Roh Werkst
50:395–399
Chen Y, Choong ET, Wetzel DM (1995) Evaluation of diffusion coefficient and surface emission
coefficient by an optimization technique. Wood Fiber Sci 27(2):178–182
Cloutier A, Fortin Y (1993) A model of moisture movement in wood based on water potential and
determination of the effective water conductivity. Wood Sci Technol 27:95–114
Hartley LD, Schneider MH (1993) Water vapour diffusion and adsorption characteristics of sugar maple
(Acer saccharum, Marsh.) wood polymer composites. Wood Sci Technol 27:421–427
Liu JY (1989) A new method for separating diffusion coefficient and surface emission coefficient. Wood
Fiber Sci 21(2):133–141
Shi SQ (1997) Composites processed from wood fibers and automobile polymer fluff. PhD dissertation,
Michigan Technological University
Shi SQ (2007a) Diffusion model based on Fick’s second law for the moisture absorption process in wood
fiber-based composites: is it suitable or not? Wood Sci Technol 41(8):645–658
Shi SQ (2007b) A simple model for moisture absorption process in wood-based composite and wood-
polymer composites under water vapor conditions. Forest Products Society 61st International
Convention, Knoxville, Tennessee, USA, June 10–13
Shi SQ, Gardner DJ (2006a) Hygroscopic thickness swelling rate of compression molded wood fiberboard
and wood fiber/polymer composites. Compos A Appl Sci Manufact 37(9):1276–1285
Shi SQ, Gardner DJ (2006b) Effect of density and polymer content on the hygroscopic thickness swelling
rate of compression molded wood fiber/polymer composites. Wood Fiber Sci 38(3):520–526
Skaar C (1958) Moisture movement in beech below the fiber saturation point. Forest Prod J 8:352–357
Wu Q, Suchsland O (1996) Prediction of moisture content and moisture gradient of an overlaid
particleboard. Wood Fiber Sci 28(2):227–239
152 Wood Sci Technol (2009) 43:143–152
123