limited effect of dietary saturated fat on plasma saturated fat in the context of a low carbohydrate...
TRANSCRIPT

ORIGINAL ARTICLE
Limited Effect of Dietary Saturated Fat on Plasma SaturatedFat in the Context of a Low Carbohydrate Diet
Cassandra E. Forsythe • Stephen D. Phinney • Richard D. Feinman • Brittanie M. Volk •
Daniel Freidenreich • Erin Quann • Kevin Ballard • Michael J. Puglisi • Carl M. Maresh •
William J. Kraemer • Douglas M. Bibus • Maria Luz Fernandez • Jeff S. Volek
Received: 6 January 2010 / Accepted: 22 August 2010 / Published online: 7 September 2010
� AOCS 2010
Abstract We recently showed that a hypocaloric carbo-
hydrate restricted diet (CRD) had two striking effects: (1) a
reduction in plasma saturated fatty acids (SFA) despite
higher intake than a low fat diet, and (2) a decrease in
inflammation despite a significant increase in arachidonic
acid (ARA). Here we extend these findings in 8 weight
stable men who were fed two 6-week CRD (12%en car-
bohydrate) varying in quality of fat. One CRD emphasized
SFA (CRD-SFA, 86 g/d SFA) and the other, unsaturated fat
(CRD-UFA, 47 g SFA/d). All foods were provided to
subjects. Both CRD decreased serum triacylglycerol (TAG)
and insulin, and increased LDL-C particle size. The CRD-
UFA significantly decreased plasma TAG SFA (27.48 ±
2.89 mol%) compared to baseline (31.06 ± 4.26 mol%).
Plasma TAG SFA, however, remained unchanged in the
CRD-SFA (33.14 ± 3.49 mol%) despite a doubling in SFA
intake. Both CRD significantly reduced plasma palmitoleic
acid (16:1n-7) indicating decreased de novo lipogenesis.
CRD-SFA significantly increased plasma phospholipid
ARA content, while CRD-UFA significantly increased EPA
and DHA. Urine 8-iso PGF2a, a free radical-catalyzed
product of ARA, was significantly lower than baseline
following CRD-UFA (-32%). There was a significant
inverse correlation between changes in urine 8-iso PGF2a
and PL ARA on both CRD (r = -0.82 CRD-SFA; r =
-0.62 CRD-UFA). These findings are consistent with the
concept that dietary saturated fat is efficiently metabolized
in the presence of low carbohydrate, and that a CRD results
in better preservation of plasma ARA.
Keywords Saturated fat � Palmitic acid �Palmitoleic acid � Plasma fatty acid composition �Ketogenic diet � Omega-3 eggs � Metabolic syndrome �Insulin sensitivity � Controlled human feeding study �EPA � DHA � LDL/HDL ratio
Abbreviations
ALA a-Linoleic acid
ARA Arachidonic acid
BMI Body mass index
CRD Carbohydrate restricted diet
CVD Cardiovascular disease
CE Cholesteryl ester
D6D Delta-6-desaturase
DHA Docosahexaenoic acid
EPA Eicosapentaenoic acid
FM Fat mass
hs-CRP High sensitivity C-reactive protein
HOMA-IR Homeostasis model assessment insulin
resistance index
C. E. Forsythe � B. M. Volk � D. Freidenreich � E. Quann �K. Ballard � M. J. Puglisi � C. M. Maresh �W. J. Kraemer � J. S. Volek (&)
Department of Kinesiology, University of Connecticut,
2095 Hillside Road, Unit 1110, Storrs, CT 06269-1110, USA
e-mail: [email protected]
M. J. Puglisi � M. L. Fernandez
Department of Nutritional Science, University of Connecticut,
Storrs, CT, USA
R. D. Feinman
Department of Cell Biology, SUNY Downstate Medical Center,
Brooklyn, NY, USA
S. D. Phinney
School of Medicine (Emeritus), University of California,
Davis, Davis, CA, USA
D. M. Bibus
University of Minnesota and Lipid Technologies,
LLC, Austin, MN, USA
123
Lipids (2010) 45:947–962
DOI 10.1007/s11745-010-3467-3
IL Interleukin
LA Linoleic acid
MCP-1 Monocyte chemotactic protein-1
MUFA Monounsaturated fatty acids
MI Myocardial infarction
NA Not available
%en Percent total energy
PUFA Polyunsaturated fatty acids
TAG Triacylglycerol
PL Phospholipid
ROS Reactive oxygen species
RDA Recommended daily allowance
SFA Saturated fatty acids
TNF-a Tumor necrosis factor-a
Introduction
The rationale for using carbohydrate-restricted diets (CRD)
in an experimental setting is that dietary carbohydrate is
the major stimulus of the glucose-insulin axis which, in
turn has profound effects on several metabolic processes.
The shift away from an anabolic state leads to an increase
in fat oxidation thereby altering lipoprotein metabolism
and cardio-metabolic profile [1]. Low carbohydrate diets
consistently decrease fasting and postprandial plasma tri-
acylglycerol (TAG), increase HDL-cholesterol (HDL-C),
lower plasma insulin, and improve insulin sensitivity [2].
While LDL-cholesterol (LDL-C) responses are more vari-
able, there is a consistent shift from small to larger particles
[3]. These responses to carbohydrate restriction have been
shown to occur in isocaloric experiments [4–6] indicating
that the effects are not solely due to weight loss.
In our previous study of overweight men and women
consuming a hypocaloric CRD, one of the most striking
responses was a significantly greater reduction in plasma
SFA levels in response to a CRD compared to a low fat
diet, despite a threefold greater presence of dietary SFA in
the carbohydrate-reduced diet [7]. Control of lipid metab-
olism, particularly SFA availability, is of current interest
because of a recent meta-analysis showing that dietary SFA
is not a risk factor for cardiovascular disease [8] and the
indication that replacement by carbohydrate, in particular,
may increase risk [9]. The extent to which plasma SFA
reflects dietary saturated fat consumption is not clear-cut
and is significantly affected by the presence of carbohy-
drate [3, 7]. Cassady et al. [10], for example, found that
plasma palmitic and stearic acids did not depend on the
saturated fat content of two different CRD. Two other
studies reported lower plasma levels of SFA in response to
diets that contained two to threefold greater intake of SFA
but were lower in carbohydrate than standard intakes [11,
12].
The other remarkable finding in our previous investi-
gation was a significant decrease in inflammatory markers
despite a marked increase in plasma arachidonic acid
(ARA) [7]. The metabolic intermediates in the production
of ARA were decreased suggesting that synthesis was not
increased. We proposed rather that the increase was due to
better preservation of ARA. This idea was supported
indirectly by the observation of significant reductions in
several inflammatory cytokines that were also inversely
correlated with changes in ARA. The ratio of n-6 to n-3
highly unsaturated fatty acids in phospholipids (PL) has
received significant attention due to their conversion to
eicosanoids of different biologic effects. The n-6 ARA
(20:4n-6) more readily promotes inflammation when
converted enzymatically or non-enzymatically to pro-
inflammatory eicosanoids and F2-isoprostanes [13, 14],
whereas an increase in membrane eicosapentaenoic acid
(EPA; 20:5n-3), an n-3 PUFA has anti-inflammatory
effects and decreases risk of cardiovascular disease [15,
16]. Increasing ARA in membranes, however, does not
inevitably lead to greater inflammation and may in fact
have the opposite effect [15, 17]. The proinflammatory
effects of ARA are due to metabolites produced sub-
sequent to its release from membranes rather than the
proportion of the intact fatty acid. Enzymatic metabolism
of free ARA results in production of eicosanoids, and free
radical-induced peroxidation of ARA results in the for-
mation of isoprostanes. Measurement of isoprostanes is
considered an accurate marker of oxidative stress, but
it also represents a unique non-enzymatic degradation
product of ARA [18].
Here, we extend the findings of our previous study by
assessing plasma fatty acid composition responses in men
who participated in two 6-week weight maintenance CRD
feeding periods varying only in fatty acid composition.
One CRD was designed to be high in SFA (emphasizing
dairy fat and eggs), and the other was designed to be
lower in saturated fat and consequently higher in unsat-
urated fat from both polyunsaturated (PUFA) and mono-
unsaturated (MUFA) fatty acids (emphasizing fish, nuts,
omega-3 enriched eggs, and olive oil). The objectives
were to: (1) establish whether the disconnect between
dietary and plasma SFA levels persists under isocaloric
conditions, (2) determine if a weight stable CRD increa-
ses plasma ARA and the association with inflammatory
markers and isoprostanes, and (3) determine whether an
increase in dietary EPA and docosahexaenoic acid
(DHA; 22:6n-3) on a CRD mitigates the increase in
plasma ARA and its association with inflammatory
markers and isoprostanes.
948 Lipids (2010) 45:947–962
123
Experimental Procedures
Study Participants
Eight men, aged 38–58 years old, with BMI of 25–35 kg/m2
participated in this controlled dietary intervention. Medical
history, family history, and dietary intake from a 3 day
diet record were collected at baseline. Exclusion criteria
were abnormal glucose levels, hypercholesterolemia, a
diagnosis of Type I or II diabetes, liver or other metabolic
or endocrine dysfunction, hypertension, or use of cholesterol
or diabetic medications. Subjects were also excluded if
they were taking any supplements known to affect serum
lipoprotein levels (i.e. fish oil, niacin, psyllium fiber) or
inflammation (i.e. aspirin). Subjects were not excluded if
they were already following a CRD, but were excluded if
they were trying to lose weight or had a body mass that
changed ±3 kg in the last 3 months. Subjects were asked to
maintain their same activity level during the experimental
period (verified by activity records) and sedentary individ-
uals were not allowed to start a new exercise program in
order to account for possible confounding effects on the
dependant variables.
Study Design and Dietary Intervention
In a randomized, cross-over, controlled design, an isoca-
loric carbohydrate restricted high saturated fat diet (CRD-
SFA) was compared to a CRD higher in unsaturated fat
(CRD-UFA). Each dietary feeding period was 6 weeks in
duration, based on previous research showing that the fatty
acid composition of plasma PL stabilizes within 4–6 weeks
of dietary change [19] and blood lipids stabilize within
6 weeks of a CRD [20]. Three weeks prior to starting each
of the 6 week dietary feeding periods, all subjects were
counseled to consume a run-in free-living weight-main-
taining CRD (*10%en from carbohydrate, 65%en from
fat, and 25%en from protein), using standardized proce-
dures from our research laboratory. The purpose of this
run-in period was to: aide in determining an appropriate
energy level to maintain body weight; standardize subject’s
physiologic state before each diet; and initiate metabolic
adaptations to carbohydrate restriction. Urinary ketones
were monitored throughout the entire CRD run-in period
and intervention using reagent strips (Bayer Corporation,
Elkart, IN) to ensure compliance and to assure the presence
of nutritional ketosis. After the run-in period, subjects were
randomized to one of two dietary arms as described above.
Following the 6 week feeding period, subjects returned to
their individual baseline diet for 4 weeks. Once washed
out, they returned to the same run-in CRD for another
3 weeks, and then crossed over to the next 6 week con-
trolled CRD feeding arm.
Dietary energy for each subject was prescribed to
maintain body weight, estimated using the Harris-Benedict
equation and multiplied by an activity factor from 1.2 to
1.55 depending on individual activity level. This was
averaged with their caloric intake during their baseline
dietary intake and run-in CRD period. Composition of the
experimental diets was developed using nutrient analysis
software consisting of normal foods that differed only in
the relative amount of saturated and unsaturated fatty acids,
but were matched for food type, energy, total fat, dietary
fiber, trans fat, and cholesterol (Food Processor 7.71,
ESHA Research, Salem, OR). Validation of the daily
nutrient composition was confirmed by chemical analysis
(Covance Inc, Princeton, NJ). Table 1 shows the average
nutrient intake for 3 days of the 7-day rotational menu via
chemical analysis. A daily multi-vitamin and mineral
Table 1 Nutritional analysis of habitual and experimental diets
Nutrient Baseline CRD-SFA CRD-UFA
Energy (kcal/d) 2,072 ± 498 2,513 ± 214 2,513 ± 214
Protein (%) 24.6 ± 7.3 28.5 ± 2.7 29.8 ± 1.5
Protein (g) 128.3 ± 45 179.1 ± 15 187.2 ± 15
Carbohydrates (%) 34.2 ± 18 13.4 ± 2.6 12.3 ± 2.5
Carbohydrates (g) 174.2 ± 99 84.9 ± 7.1 77.3 ± 6.6
Fiber (g) 12.4 ± 5.1 19.2 ± 4.8 18.5 ± 1.2
Fat (%) 41.3 ± 12.0 58.6 ± 3.7 57.9 ± 3.9
Fat (g) 94.1 ± 35.0 163.6 ± 11.9 161.3 ± 7.5
SFA (%) 17.2 ± 5.0 30.8 ± 4.3 17.0 ± 2.0
SFA (g) 39.8 ± 11.9 85.6 ± 6.9 47.2 ± 2.8
14:0 NA 9.45 ± 2.4 4.02 ± 1.8
16:0 (g) NA 46.1 ± 3.4 23.2 ± 4.9
18:0 (g) NA 22.9 ± 1.9 13.1 ± 2.1
MUFA (%) 16.4 ± 5.8 20.9 ± 0.8 24.7 ± 3.1
MUFA (g) 37.0 ± 13.4 58.1 ± 2.1 68.6 ± 8.7
18:1 (g) NA 56.6 ± 1.4 64.3 ± 6.9
PUFA (%) 7.4 ± 2.4 4.5 ± 0.3 14.7 ± 3.0
PUFA (g) 16.3 ± 6.5 12.4 ± 1.9 40.8 ± 8.1
n-3 PUFA (%) NA 0.6 ± 0.1 2.9 ± 0.3
n-6 PUFA (%) NA 3.8 ± 0.8 10.8 ± 2.0
18:2n-6 (g) NA 9.9 ± 2.6 27.9 ± 6.3
18:3n-3 (g) NA 1.2 ± 0.3 7.5 ± 1.4
20:4n-6 (g) NA 0.5 ± 0.1 0.5 ± 0.2
20:5n-3 (g) NA 0.2 ± 0.0 0.6 ± 0.2
22:6n-3 (g) NA 0.2 ± 0.1 0.9 ± 0.1
Trans fatty acids (g) 1.7 ± 1.9 2.4 ± 0.3 1.4 ± 0.1
Cholesterol (mg) 426.4 ± 267.4 854 ± 97.3 849 ± 41.9
Values are mean percentages of total energy ± SD. NA data not
available from habitual diet records. Habitual diets calculated from
baseline 3-day food records of each participant. Habitual diets ana-
lyzed by Food Processor, ESHA Research, Salem, OR. Experimental
diets analyzed by Covance Laboratories, Inc, Princeton, NJ
Lipids (2010) 45:947–962 949
123
supplement at levels C100% of the RDA was also given to
subjects and consumed throughout the entire intervention
to ensure adequate micronutrient status.
In each 6-week feeding period, all food and beverages
were provided for subjects in a 7-day rotational menu, and
no other foods or beverages were allowed, unless they were
calorie-free or very-low-calorie (i.e., tea, water, diet soda).
Predominant foods in the CRD-SFA were high-fat dairy
(cream, butter, cheese, and low-carbohydrate milk), eggs,
meat, poultry, and white fish, and a few low omega-3 nuts
and seeds (such as almonds). In the CRD-UFA, predomi-
nant foods were liquid omega-3 PUFA eggs (Egg Cre-
ations, Burnbrae Farms Ltd, ON, Canada. Containing EPA,
DPA and DHA), hard shell omega-3 eggs (high in ALA
and DHA), salmon, sardines, meat, poultry, olive oil,
canola oil, low-fat low-carbohydrate dairy, walnuts, and
seeds. Subjects picked up prepared, packaged food every
Monday, Wednesday and Friday. All take-out food con-
tainers were returned unwashed and inspected to ensure
that all food and fat had been consumed.
Anthropometrics
Body weight was measured weekly in the morning before
food consumption and maintained within ±2 kg during the
dietary intervention. Adjustments in caloric intake were
made to maintain body weight within these parameters.
Body composition was measured by dual-energy X-ray
absorptiometry (Prodigy, Lunar Corporation, Madison, WI)
at baseline, and at the start and end of each diet feeding
intervention. Analyses were performed by the same blinded
technician.
Blood Collection and Analysis
Blood samples were obtained at baseline, pre-dietary
intervention and post-dietary intervention for both feeding
periods. The sample was obtained from an arm vein after
subjects rested quietly for 10 min in the supine position.
Whole blood was collected into tubes with no preservative
or EDTA and centrifuged at 1,5009g for 15 min and 4 �C,
and promptly aliquoted into separate storage tubes which
were stored at -75 �C until analyzed. A portion of serum
(*3 ml) was immediately sent to a certified medical lab-
oratory (Quest Diagnostics, Wallingford, CT) for deter-
mination of total cholesterol (TC), HDL-C, TAG, and
calculated LDL-C concentrations using automated enzy-
matic procedures (Olympus America Inc., Melville, NY).
Glucose and insulin concentrations were analyzed in
serum in duplicate (YSI 2300 STAT, Yellow Springs, OH,
CV 0.5%) and radioimmunoassay (Diagnostic Systems
Laboratory, Webster, TX, CV 4.3%), respectively, and used
to calculate an index of insulin resistance [HOMA-IR;
calculated as Glucose (mmol/l) Insulin (lIU/ml/22.5)].
The 75th percentile cut-off value for insulin resistance in
non-diabetic individuals has been determined to corre-
spond to a value of 2.29 [17]. Lipoprotein particle size of
LDL-C was determined in serum using non-gradient
polyacrylamide gel electrophoresis (Lipoprint LDL Sys-
tem, Quantimetrix Co., Redondo Beach, CA) as previously
described [21]. Serum total ketone bodies were determined
by a cyclic enzymatic method that measures both aceto-
acetate (AcAc) and 3-hydroxybutyrate (3-HB) (Wako
Chemicals USA Inc, Richmond, VA). Absorbance was
read at a wavelength of 404 nm on a microplate reader
(Versa Max Molecular Devices Corp. Sunnyvale, CA,
USA) and analyzed with associated SoftMax Pro software
(CV 4.2%). Serum IL-6, IL-8, MCP-1, TNF-a, and leptin
were measured using xMAP� technology on a Luminex�
IS 200 system with antibodies to these analytes from
LINCO Research (St. Charles, MO). Assays were com-
pleted in duplicate according to manufacturer’s instruc-
tions (IL-6 CV 12.7%, IL-8 CV 10.4%, MCP-1 CV 7.3%,
TNF-a CV 9.7%, Leptin CV 10.2%). High Sensitivity
C-reactive protein (hs-CRP) was determined in serum on an
IMMULITE Automated Analyzer using the commercially
available immulite chemiluminescent enzyme immuno-
metric assay (Immulite�, Diagnostic Products Corp., Los
Angeles, CA, USA).
A 24-h urine collection was performed at baseline and
post-dietary intervention. A 10-ml aliquot of urine was
stored at -75 �C for subsequent analysis of F2-Isoprostane
(8-iso PGF2a) concentrations. All samples were analyzed in
triplicate using column extraction followed by an ACETM
Competitive Enzyme Immunoassay with 8-Isoprostane
enzyme-linked immunosorbent assay (EIA) kit (Cayman
Chemicals, Ann Arbor, MI). Briefly, 2 ml frozen thawed
urine was purified through an 8-Isoprostane Affinity Col-
umn (Caymen Chemicals), washed with column buffer and
ultra pure water, and eluted with ethanol:water (95:5).
Elution was dried with nitrogen; the volume of the dried
sample was brought to 2 ml with enzyme immunoassay
buffer in a 1:10 dilution. Absorbance was read at 420 nm
and data was analyzed with a log-logit curve fit (CV 5.7%).
The results were expressed relative to creatinine concen-
trations determined using Jaffe’s colorimetric method
(Cayman Chemicals) read at an absorbance of 490 nm (CV
3.2%).
Fatty Acid Composition
Plasma was shipped on dry ice to Lipid Technologies LLC
(Austin, MN) and analyzed for plasma fatty acid compo-
sition in circulating PL, TAG and CE using capillary gas
chromatography as previously described [7]. Lipids were
extracted according to the method of Bligh/Dyer whereby
950 Lipids (2010) 45:947–962
123
mixtures of plasma, methanol, chloroform and water were
prepared such that lipid is recovered in a chloroform layer.
The resulting lipid extracts were maintained under an
atmosphere of nitrogen following extraction and kept fro-
zen prior to additional processing. Immediately prior to
lipid class separation, lipid samples were dried under a
gentle stream of nitrogen, rediluted in 50 ll of chloroform
and prepared for lipid class separation. Lipid classes were
separated on commercial silica gel G plates (AnalTech,
Newark, DE). The chromatographic plates were developed
in a solvent system consisting of distilled petroleum ether
(b.p.30–60 �C): diethyl ether: acetic acid (80:20:1, by vol).
Following development, the silica gel plates were sprayed
with a methanolic solution containing 0.5% 2,7-dichloro-
fluorescein which was then used to visualize lipid classes
under ultraviolet light. Desired corresponding lipid bands
were then scraped into Teflon-lined screw cap tubes. The
samples were then transesterified with boron trifluoride
(10%) in excess methanol (Supelco, Bellefonte, PA) in an
80 �C water bath for 90 min. Resulting fatty acid methyl
esters were extracted with water and petroleum ether and
stored frozen until gas chromatographic analysis was
performed.
Lipid class fatty acid methyl ester composition was
determined by capillary gas chromatography. Methyl ester
samples were blown to dryness under nitrogen and resus-
pended in hexane. Resulting fatty acid methyl esters were
separated and quantified with a Shimadzu capillary gas
chromatograph (GC17) utilizing a 30 m Restek free fatty
acid phase (FFAP) coating and EZChrom software. The
instrument temperature was programmed from 190 to 240�at 7 �C/min with a final hold of 10 min, separating and
measuring fatty acid methyl esters ranging from 12:0 to
24:1. The detector temperature was 250 �C. Helium carrier
gas was used at a flow rate of 1.4 ml/min. and a split ratio
of 1:25. Chromatographic data was collected and processed
with EZChrom software (Scientific Products, CA). Fatty
acids were identified by comparison to authentic fatty acid
standards and quantitated with peak area and internal
standard. Individual peaks, representing as little as 0.05%
of the fatty acid methyl esters, were distinguished. Fatty
acid data are expressed in relative (mol%) and absolute
(nmol/ml) terms.
Statistics
ANOVA with repeated measures was used to evaluate
changes from baseline across diets. Data that was not
normally distributed was log transformed. Significant main
effects were further analyzed using a Tukey post hoc test.
Differences between values following CRD-SFA and
CRD-UFA were evaluated using paired student’s t test. The
alpha level for significance was \0.05.
Results
Dietary Intake
Nutrient intake estimated at baseline from dietary records
showed a lower than expected energy, 2,072 kcal/d com-
pared to 2,513 kcal/d for the feeding periods. This was
likely due to under-reporting at baseline (Table 1) [22]
although it has been argued that the demands of gluco-
neogenesis and other processes require more energy for
weight maintenance [23]. Habitual carbohydrate intake was
also lower than the average American diet at 32%en
reflecting two subjects who were habitually consuming a
lower-carbohydrate diet. Both CRD were well tolerated
and compliance was excellent as assessed by verbal feed-
back and inspection of returned food containers throughout
the intervention. There was no consistent preference for
one diet treatment over the other by subjects. Briefly, the
main difference between the two low carbohydrate diets
was in the relative amount of SFA, MUFA, PUFA (CRD-
SFA = 31, 21, and 5%; CRD-UFA = 17, 25, and 15%).
Although the CRD-UFA contained higher amounts of both
n-6 and n-3 PUFA, the ratio of n-6/n-3 PUFA was lower in
the CRD-UFA. Other nutrients, including cholesterol, were
matched with the exception of (naturally occurring) trans
fatty acids which were inherently higher on the CRD-SFA
diet due to the higher intake of high-fat dairy. Compared to
baseline, the CRD-SFA diet provided more than twice as
much dietary SFA (86 vs. 40 g) while in the CRD-UFA,
intake of SFA was 47 grams. Compared to baseline, the
CRD-UFA provided more total PUFA (41 vs. 16 g), n-3
PUFA (3%en vs. 0.7%en), and n-6 PUFA (11%en vs.
7%en). Cholesterol intake in both diets was about twofold
higher than baseline intake.
Body Weight and Composition
Body fat percentage and body mass of subjects after the two
experimental diets were not significantly different from
baseline. A small, but significant (P \ 0.05) decrease in body
mass (difference: 0.94 ± 0.13 kg) occurred following the
CRD-UFA diet compared to the CRD-SFA diet (Table 2).
Blood Markers
Blood lipid, metabolic, and inflammatory markers are
presented in Table 2. Serum ketones were moderately
elevated as a result of carbohydrate restriction. Fasting
plasma TC and LDL-C were variable but were higher on
average following CRD-SFA compared to CRD-UFA. The
increase in HDL-C following CRD-SFA (14%) and CRD-
UFA (8%) from baseline resulted in no significant change
in the TC/HDL or LDL/HDL ratios.
Lipids (2010) 45:947–962 951
123
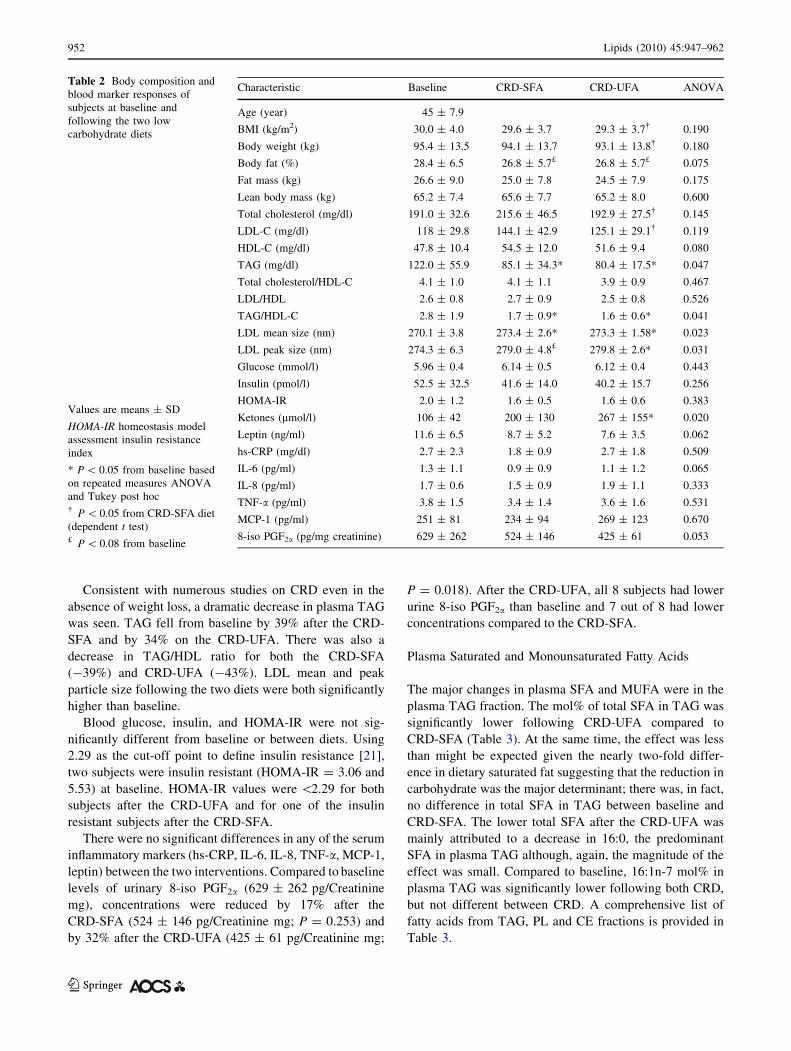
Consistent with numerous studies on CRD even in the
absence of weight loss, a dramatic decrease in plasma TAG
was seen. TAG fell from baseline by 39% after the CRD-
SFA and by 34% on the CRD-UFA. There was also a
decrease in TAG/HDL ratio for both the CRD-SFA
(-39%) and CRD-UFA (-43%). LDL mean and peak
particle size following the two diets were both significantly
higher than baseline.
Blood glucose, insulin, and HOMA-IR were not sig-
nificantly different from baseline or between diets. Using
2.29 as the cut-off point to define insulin resistance [21],
two subjects were insulin resistant (HOMA-IR = 3.06 and
5.53) at baseline. HOMA-IR values were \2.29 for both
subjects after the CRD-UFA and for one of the insulin
resistant subjects after the CRD-SFA.
There were no significant differences in any of the serum
inflammatory markers (hs-CRP, IL-6, IL-8, TNF-a, MCP-1,
leptin) between the two interventions. Compared to baseline
levels of urinary 8-iso PGF2a (629 ± 262 pg/Creatinine
mg), concentrations were reduced by 17% after the
CRD-SFA (524 ± 146 pg/Creatinine mg; P = 0.253) and
by 32% after the CRD-UFA (425 ± 61 pg/Creatinine mg;
P = 0.018). After the CRD-UFA, all 8 subjects had lower
urine 8-iso PGF2a than baseline and 7 out of 8 had lower
concentrations compared to the CRD-SFA.
Plasma Saturated and Monounsaturated Fatty Acids
The major changes in plasma SFA and MUFA were in the
plasma TAG fraction. The mol% of total SFA in TAG was
significantly lower following CRD-UFA compared to
CRD-SFA (Table 3). At the same time, the effect was less
than might be expected given the nearly two-fold differ-
ence in dietary saturated fat suggesting that the reduction in
carbohydrate was the major determinant; there was, in fact,
no difference in total SFA in TAG between baseline and
CRD-SFA. The lower total SFA after the CRD-UFA was
mainly attributed to a decrease in 16:0, the predominant
SFA in plasma TAG although, again, the magnitude of the
effect was small. Compared to baseline, 16:1n-7 mol% in
plasma TAG was significantly lower following both CRD,
but not different between CRD. A comprehensive list of
fatty acids from TAG, PL and CE fractions is provided in
Table 3.
Table 2 Body composition and
blood marker responses of
subjects at baseline and
following the two low
carbohydrate diets
Values are means ± SD
HOMA-IR homeostasis model
assessment insulin resistance
index
* P \ 0.05 from baseline based
on repeated measures ANOVA
and Tukey post hoc� P \ 0.05 from CRD-SFA diet
(dependent t test)£ P \ 0.08 from baseline
Characteristic Baseline CRD-SFA CRD-UFA ANOVA
Age (year) 45 ± 7.9
BMI (kg/m2) 30.0 ± 4.0 29.6 ± 3.7 29.3 ± 3.7� 0.190
Body weight (kg) 95.4 ± 13.5 94.1 ± 13.7 93.1 ± 13.8� 0.180
Body fat (%) 28.4 ± 6.5 26.8 ± 5.7£ 26.8 ± 5.7£ 0.075
Fat mass (kg) 26.6 ± 9.0 25.0 ± 7.8 24.5 ± 7.9 0.175
Lean body mass (kg) 65.2 ± 7.4 65.6 ± 7.7 65.2 ± 8.0 0.600
Total cholesterol (mg/dl) 191.0 ± 32.6 215.6 ± 46.5 192.9 ± 27.5� 0.145
LDL-C (mg/dl) 118 ± 29.8 144.1 ± 42.9 125.1 ± 29.1� 0.119
HDL-C (mg/dl) 47.8 ± 10.4 54.5 ± 12.0 51.6 ± 9.4 0.080
TAG (mg/dl) 122.0 ± 55.9 85.1 ± 34.3* 80.4 ± 17.5* 0.047
Total cholesterol/HDL-C 4.1 ± 1.0 4.1 ± 1.1 3.9 ± 0.9 0.467
LDL/HDL 2.6 ± 0.8 2.7 ± 0.9 2.5 ± 0.8 0.526
TAG/HDL-C 2.8 ± 1.9 1.7 ± 0.9* 1.6 ± 0.6* 0.041
LDL mean size (nm) 270.1 ± 3.8 273.4 ± 2.6* 273.3 ± 1.58* 0.023
LDL peak size (nm) 274.3 ± 6.3 279.0 ± 4.8£ 279.8 ± 2.6* 0.031
Glucose (mmol/l) 5.96 ± 0.4 6.14 ± 0.5 6.12 ± 0.4 0.443
Insulin (pmol/l) 52.5 ± 32.5 41.6 ± 14.0 40.2 ± 15.7 0.256
HOMA-IR 2.0 ± 1.2 1.6 ± 0.5 1.6 ± 0.6 0.383
Ketones (lmol/l) 106 ± 42 200 ± 130 267 ± 155* 0.020
Leptin (ng/ml) 11.6 ± 6.5 8.7 ± 5.2 7.6 ± 3.5 0.062
hs-CRP (mg/dl) 2.7 ± 2.3 1.8 ± 0.9 2.7 ± 1.8 0.509
IL-6 (pg/ml) 1.3 ± 1.1 0.9 ± 0.9 1.1 ± 1.2 0.065
IL-8 (pg/ml) 1.7 ± 0.6 1.5 ± 0.9 1.9 ± 1.1 0.333
TNF-a (pg/ml) 3.8 ± 1.5 3.4 ± 1.4 3.6 ± 1.6 0.531
MCP-1 (pg/ml) 251 ± 81 234 ± 94 269 ± 123 0.670
8-iso PGF2a (pg/mg creatinine) 629 ± 262 524 ± 146 425 ± 61 0.053
952 Lipids (2010) 45:947–962
123

Plasma Polyunsaturated Fatty Acids
The major changes in plasma PUFA were in the PL frac-
tion. There were distinct differences between the CRD in
plasma PL long chain n-6 and n-3 PUFA (Table 3).
Compared to baseline, all subjects had an increase in
20:4n-6 after the CRD-SFA, and those values were higher
than 20:4n-6 after the CRD-UFA in all but one subject.
Interestingly, despite an increase in 20:4n-6 in response to
the CRD-SFA the immediate precursor 20:3n-6 was not
increased and was in fact lower than baseline. Total n-3
PUFA was significantly higher following the CRD-UFA
than baseline and CRD-SFA values primarily due to
greater increases in 20:5n-3 (EPA) and 22:6n-3 (DHA).
The PL n-6/n-3 ratio (calculated as the sum of all n-6
PUFA divided by the sum of all n-3 PUFA), was signifi-
cantly lower following CRD-UFA than CRD-SFA and
baseline. Compared to baseline, the ARA/EPA ratio was
significantly increased after the CRD-SFA whereas it was
decreased after the CRD-UFA. Compared to baseline the
ARA/EPA ratio was decreased after the CRD-UFA in all
subjects, and it was higher during the CRD-SFA than the
CRD-UFA in all subjects.
Intuitively, one might presume an increase in PL ARA
would result in a corresponding increase in 8-iso PGF2a,
yet we observed the opposite. There was a significant
inverse correlation between changes in urine 8-iso PGF2a
and PL ARA on both low carbohydrate diets (r = -0.82
CRD-SFA, P = 0.007; r = -0.62 CRD-UFA, P = 0.05)
indicating that those subjects who showed greater increases
in plasma ARA had greater reductions in 8-iso PGF2a.
Discussion
Dietary saturated fat has been the focus of nutritional
recommendations since the 1970 study of Ancel Keys [24].
Current recommendations are as low as 7% [25] although
the subject has always generated some controversy. The
biologic effect of dietary SFA is presumed to rest with its
effect on plasma SFA and other lipid fractions but a
number of reports in the literature suggest that this needs to
be experimentally established [7, 11, 12]. In the current
study, we used a controlled-feeding design to examine
responses in plasma fatty acids, lipoproteins, isoprostanes
and inflammatory markers in men who switched from their
habitual diet to a CRD either high in SFA (CRD-SFA) or
unsaturated fat (CRD-UFA) including eggs with long chain
n-3 PUFA. The primary findings were that: (1) there is
limited effect of dietary SFA on plasma SFA in the context
of a weight maintenance low carbohydrate diet, (2) a
weight maintenance CRD high in SFA (representing the
typical nutrient composition of CRD we have studied in
our many previous investigations) resulted in a significant
increase in plasma ARA without an accompanying increase
in inflammation or oxidative stress, (3) a weight mainte-
nance CRD higher in unsaturated fat (CRD-UFA) includ-
ing EPA and DHA (CRD-UFA) prevented the increase in
plasma ARA while increasing plasma EPA and DHA
content and significantly decreasing urine 8-iso PGF2a, a
degradation breakdown product of ARA, and, (4) the
changes in plasma ARA and urine 8-iso PGF2a were
inversely correlated on both CRD independent of fat
composition supporting and strengthening our hypothesis
of less catabolism of ARA (i.e., better preservation of
ARA) on a CRD.
Saturated Fat
The most striking finding was the lack of association
between dietary SFA intake and plasma SFA concentra-
tions. Compared to baseline, a doubling of saturated fat
intake on the CRD-SFA did not increase plasma SFA in
any of the lipid fractions, and when saturated fat was only
moderately increased on the CRD-UFA, the proportion of
SFA in plasma TAG was reduced from 31.06% to
27.48 mol%. Since plasma TAG was also reduced, the total
SFA concentration in plasma TAG was decreased by 47%
after the CRD-UFA, similar to the 57% decrease we
observed in overweight men and women after 12 week of a
hypocaloric CRD [7]. These results can best be explained
by the metabolic adaptations induced by carbohydrate
restriction [1], notably less stimulation of insulin. Lower
insulin levels result in increased lipolysis and fatty acid
oxidation while simultaneously decreasing activity of key
enzymes in de novo lipogenesis. From a mechanistic
standpoint, restriction in dietary carbohydrate is the dom-
inant dietary manipulation that accelerates fat mobilization
and oxidation [26]. The lipid fraction most responsive to
carbohydrate restriction was TAG. Higher incorporation of
SFA into VLDL TAG is correlated with insulin resistance
and adiposity [27], probably reflecting accelerated hepatic
de novo lipogenesis. Plasma TAG transports the greatest
amount of fatty acids that are actively involved in energy
exchange. Therefore a decrease in plasma SFA, from
reduced hepatic fatty acid synthesis or increased beta-
oxidation, may attenuate atherogenic cell-signaling even in
the presence of higher dietary SFA. The limited change in
SFA in PL may be due to lower turnover in this fraction
(the sn-1 position almost always carries a SFA), or to the
short duration of this study. Previous studies have shown
that increased plasma PL and CE SFA levels predict
development of cardiovascular disease (CVD) [28, 29].
The presence of palmitoleic acid (16:1n-7) is an indi-
cator of de novo fatty acid synthesis [30] since the com-
pound is limited in the diet. Both isocaloric CRD feeding
Lipids (2010) 45:947–962 953
123

Table 3 Plasma TAG, PL and CE fatty acid responses at baseline and following the two low carbohydrate diets
Baseline CRD-SFA CRD-UFA ANOVA
TAG (nmol/ml)
SFA
14:0 66.5 ± 48.3 32.8 ± 15.7 23.9 ± 10.1* 0.023
15:0 10.5 ± 5.3 7.8 ± 3.5 6.4 ± 1.8 0.090
16:0 915.8 ± 585.7 540.8 ± 157.9 482.1 ± 167.8* 0.036
18:0 126.0 ± 72.9 98.3 ± 32.8 83.5 ± 21.3 0.216
20:0 1.8 ± 0.6 1.4 ± 0.5 1.4 ± 0.3 0.222
22:0 0.9 ± 0.7 0.6 ± 0.9 0.9 ± 0.7 0.711
24:0 1.1 ± 0.7 1.1 ± 0.6 1.7 ± 1.5 0.392
Total SFA 1122 ± 707 683 ± 203 600 ± 200* 0.043
MUFA
14:1 3.9 ± 5.3 1.7 ± 2.0 0.1 ± 0.3 0.105
15:1 1.4 ± 0.6 1.0 ± 0.3 1.1 ± 0.6 0.280
16:1 147.4 ± 113.7 55.9 ± 20.1* 58.4 ± 25.1* 0.014
17:1 9.7 ± 5.9 6.7 ± 2.8 6.3 ± 2.7 0.132
18:1n9 1233.6 ± 562.6 772.8 ± 203.7* 821 ± 271.8* 0.018
20:1n7 4.5 ± 3.4 2.9 ± 2.3 1.6 ± 1.6 0.085
20:1n9 7.7 ± 2.6 5.8 ± 1.7 7.6 ± 3.3 0.177
22:1n9 2.7 ± 1.6 2.2 ± 1.6 2.4 ± 1.5 0.731
24:1 0.0 ± 0.0 0.1 ± 0.3 0.6 ± 1.2 –
Total MUFA 1411 ± 687 849 ± 227* 899 ± 302* 0.017
PUFA
18:3n3 37.8 ± 16.6 16.8 ± 7.9* 39.0 ± 21.0� 0.014
18:4n3 5.6 ± 4.4 3.6 ± 2.5 3.7 ± 3.2 0.283
20:3n3 0.7 ± 0.8 0.2 ± 0.3 0.3 ± 0.5 0.245
20:4n3 1.5 ± 1.6 0.8 ± 0.9 1.3 ± 1.8 0.548
20:5n3 8.9 ± 5.7 4.2 ± 2.5 32.7 ± 49.6 0.148
22:5n3 12.9 ± 7.5 7.7 ± 3.1 15.9 ± 10.6 0.111
22:6n3 15.2 ± 6.7 12.2 ± 6.9 53.6 ± 75.1 0.128
18:2n6 712.0 ± 330.7 382.9 ± 146.7* 469.1 ± 170.9* 0.007
18:3n6 16.4 ± 10.1 8.5 ± 7.4 5.6 ± 2.1* 0.026
20:2n6 6.2 ± 3.6 3.1 ± 1.1* 2.7 ± 1.1* 0.007
20:3n6 10.3 ± 6.6 4.8 ± 2.0* 3.6 ± 1.6* 0.009
20:4n6 43.4 ± 14.3 40.0 ± 15.4 34.1 ± 15.0 0.169
22:4n6 4.7 ± 2.2 3.6 ± 1.7 1.9 ± 0.7* 0.005
22:5n6 2.7 ± 1.3 2.9 ± 1.5 2.0 ± 1.6 0.150
20:3n9 2.4 ± 0.9 2.8 ± 1.5 1.4 ± 0.4� 0.009
Total PUFA 881 ± 377 494 ± 189* 667 ± 307 0.010
Total n3 82.6 ± 21.0 45.4 ± 19.9 46.5 ± 151.9 0.087
Total n6 796 ± 362 455 ± 170* 519 ± 186* 0.008
n6/n3 9.5 ± 3.2 10.3 ± 2.3 5.1 ± 2.2*,� 0.003
AA/EPA 6.6 ± 3.8 10.5 ± 3.2 2.3 ± 1.6� 0.001
TAG (mol%)
SFA
14:0 1.75 ± 0.59 1.55 ± 0.45 1.09 ± 0.26* 0.018
15:0 0.31 ± 0.06 0.37 ± 0.10 0.30 ± 0.07 0.074
16:0 25.22 ± 3.72 26.20 ± 2.09 21.99 ± 2.39� 0.023
18:0 3.65 ± 0.78 4.86 ± 1.24* 3.92 ± 0.59� 0.008
954 Lipids (2010) 45:947–962
123
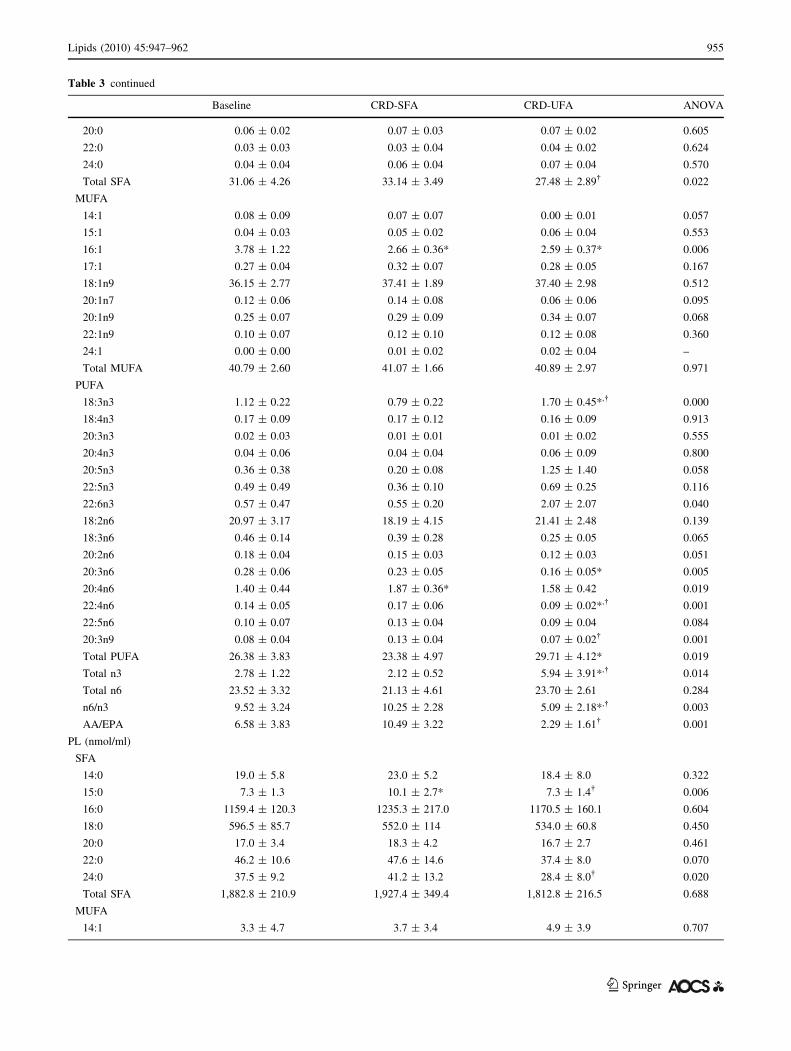
Table 3 continued
Baseline CRD-SFA CRD-UFA ANOVA
20:0 0.06 ± 0.02 0.07 ± 0.03 0.07 ± 0.02 0.605
22:0 0.03 ± 0.03 0.03 ± 0.04 0.04 ± 0.02 0.624
24:0 0.04 ± 0.04 0.06 ± 0.04 0.07 ± 0.04 0.570
Total SFA 31.06 ± 4.26 33.14 ± 3.49 27.48 ± 2.89� 0.022
MUFA
14:1 0.08 ± 0.09 0.07 ± 0.07 0.00 ± 0.01 0.057
15:1 0.04 ± 0.03 0.05 ± 0.02 0.06 ± 0.04 0.553
16:1 3.78 ± 1.22 2.66 ± 0.36* 2.59 ± 0.37* 0.006
17:1 0.27 ± 0.04 0.32 ± 0.07 0.28 ± 0.05 0.167
18:1n9 36.15 ± 2.77 37.41 ± 1.89 37.40 ± 2.98 0.512
20:1n7 0.12 ± 0.06 0.14 ± 0.08 0.06 ± 0.06 0.095
20:1n9 0.25 ± 0.07 0.29 ± 0.09 0.34 ± 0.07 0.068
22:1n9 0.10 ± 0.07 0.12 ± 0.10 0.12 ± 0.08 0.360
24:1 0.00 ± 0.00 0.01 ± 0.02 0.02 ± 0.04 –
Total MUFA 40.79 ± 2.60 41.07 ± 1.66 40.89 ± 2.97 0.971
PUFA
18:3n3 1.12 ± 0.22 0.79 ± 0.22 1.70 ± 0.45*,� 0.000
18:4n3 0.17 ± 0.09 0.17 ± 0.12 0.16 ± 0.09 0.913
20:3n3 0.02 ± 0.03 0.01 ± 0.01 0.01 ± 0.02 0.555
20:4n3 0.04 ± 0.06 0.04 ± 0.04 0.06 ± 0.09 0.800
20:5n3 0.36 ± 0.38 0.20 ± 0.08 1.25 ± 1.40 0.058
22:5n3 0.49 ± 0.49 0.36 ± 0.10 0.69 ± 0.25 0.116
22:6n3 0.57 ± 0.47 0.55 ± 0.20 2.07 ± 2.07 0.040
18:2n6 20.97 ± 3.17 18.19 ± 4.15 21.41 ± 2.48 0.139
18:3n6 0.46 ± 0.14 0.39 ± 0.28 0.25 ± 0.05 0.065
20:2n6 0.18 ± 0.04 0.15 ± 0.03 0.12 ± 0.03 0.051
20:3n6 0.28 ± 0.06 0.23 ± 0.05 0.16 ± 0.05* 0.005
20:4n6 1.40 ± 0.44 1.87 ± 0.36* 1.58 ± 0.42 0.019
22:4n6 0.14 ± 0.05 0.17 ± 0.06 0.09 ± 0.02*,� 0.001
22:5n6 0.10 ± 0.07 0.13 ± 0.04 0.09 ± 0.04 0.084
20:3n9 0.08 ± 0.04 0.13 ± 0.04 0.07 ± 0.02� 0.001
Total PUFA 26.38 ± 3.83 23.38 ± 4.97 29.71 ± 4.12* 0.019
Total n3 2.78 ± 1.22 2.12 ± 0.52 5.94 ± 3.91*,� 0.014
Total n6 23.52 ± 3.32 21.13 ± 4.61 23.70 ± 2.61 0.284
n6/n3 9.52 ± 3.24 10.25 ± 2.28 5.09 ± 2.18*,� 0.003
AA/EPA 6.58 ± 3.83 10.49 ± 3.22 2.29 ± 1.61� 0.001
PL (nmol/ml)
SFA
14:0 19.0 ± 5.8 23.0 ± 5.2 18.4 ± 8.0 0.322
15:0 7.3 ± 1.3 10.1 ± 2.7* 7.3 ± 1.4� 0.006
16:0 1159.4 ± 120.3 1235.3 ± 217.0 1170.5 ± 160.1 0.604
18:0 596.5 ± 85.7 552.0 ± 114 534.0 ± 60.8 0.450
20:0 17.0 ± 3.4 18.3 ± 4.2 16.7 ± 2.7 0.461
22:0 46.2 ± 10.6 47.6 ± 14.6 37.4 ± 8.0 0.070
24:0 37.5 ± 9.2 41.2 ± 13.2 28.4 ± 8.0� 0.020
Total SFA 1,882.8 ± 210.9 1,927.4 ± 349.4 1,812.8 ± 216.5 0.688
MUFA
14:1 3.3 ± 4.7 3.7 ± 3.4 4.9 ± 3.9 0.707
Lipids (2010) 45:947–962 955
123
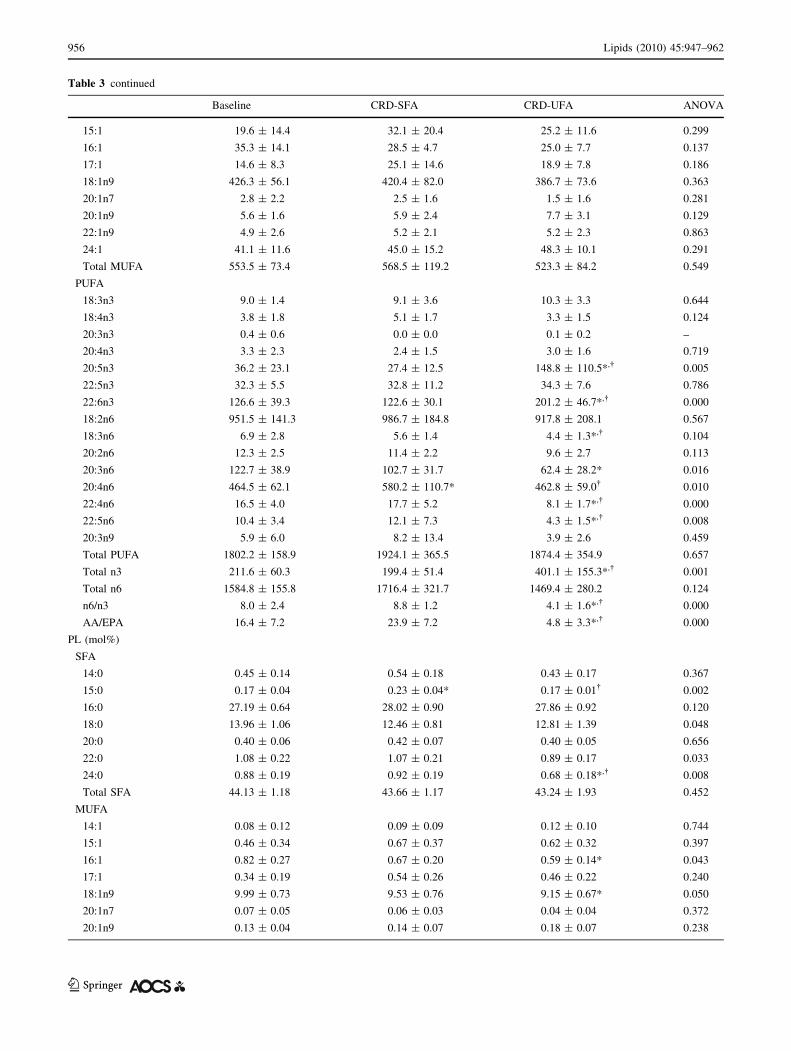
Table 3 continued
Baseline CRD-SFA CRD-UFA ANOVA
15:1 19.6 ± 14.4 32.1 ± 20.4 25.2 ± 11.6 0.299
16:1 35.3 ± 14.1 28.5 ± 4.7 25.0 ± 7.7 0.137
17:1 14.6 ± 8.3 25.1 ± 14.6 18.9 ± 7.8 0.186
18:1n9 426.3 ± 56.1 420.4 ± 82.0 386.7 ± 73.6 0.363
20:1n7 2.8 ± 2.2 2.5 ± 1.6 1.5 ± 1.6 0.281
20:1n9 5.6 ± 1.6 5.9 ± 2.4 7.7 ± 3.1 0.129
22:1n9 4.9 ± 2.6 5.2 ± 2.1 5.2 ± 2.3 0.863
24:1 41.1 ± 11.6 45.0 ± 15.2 48.3 ± 10.1 0.291
Total MUFA 553.5 ± 73.4 568.5 ± 119.2 523.3 ± 84.2 0.549
PUFA
18:3n3 9.0 ± 1.4 9.1 ± 3.6 10.3 ± 3.3 0.644
18:4n3 3.8 ± 1.8 5.1 ± 1.7 3.3 ± 1.5 0.124
20:3n3 0.4 ± 0.6 0.0 ± 0.0 0.1 ± 0.2 –
20:4n3 3.3 ± 2.3 2.4 ± 1.5 3.0 ± 1.6 0.719
20:5n3 36.2 ± 23.1 27.4 ± 12.5 148.8 ± 110.5*,� 0.005
22:5n3 32.3 ± 5.5 32.8 ± 11.2 34.3 ± 7.6 0.786
22:6n3 126.6 ± 39.3 122.6 ± 30.1 201.2 ± 46.7*,� 0.000
18:2n6 951.5 ± 141.3 986.7 ± 184.8 917.8 ± 208.1 0.567
18:3n6 6.9 ± 2.8 5.6 ± 1.4 4.4 ± 1.3*,� 0.104
20:2n6 12.3 ± 2.5 11.4 ± 2.2 9.6 ± 2.7 0.113
20:3n6 122.7 ± 38.9 102.7 ± 31.7 62.4 ± 28.2* 0.016
20:4n6 464.5 ± 62.1 580.2 ± 110.7* 462.8 ± 59.0� 0.010
22:4n6 16.5 ± 4.0 17.7 ± 5.2 8.1 ± 1.7*,� 0.000
22:5n6 10.4 ± 3.4 12.1 ± 7.3 4.3 ± 1.5*,� 0.008
20:3n9 5.9 ± 6.0 8.2 ± 13.4 3.9 ± 2.6 0.459
Total PUFA 1802.2 ± 158.9 1924.1 ± 365.5 1874.4 ± 354.9 0.657
Total n3 211.6 ± 60.3 199.4 ± 51.4 401.1 ± 155.3*,� 0.001
Total n6 1584.8 ± 155.8 1716.4 ± 321.7 1469.4 ± 280.2 0.124
n6/n3 8.0 ± 2.4 8.8 ± 1.2 4.1 ± 1.6*,� 0.000
AA/EPA 16.4 ± 7.2 23.9 ± 7.2 4.8 ± 3.3*,� 0.000
PL (mol%)
SFA
14:0 0.45 ± 0.14 0.54 ± 0.18 0.43 ± 0.17 0.367
15:0 0.17 ± 0.04 0.23 ± 0.04* 0.17 ± 0.01� 0.002
16:0 27.19 ± 0.64 28.02 ± 0.90 27.86 ± 0.92 0.120
18:0 13.96 ± 1.06 12.46 ± 0.81 12.81 ± 1.39 0.048
20:0 0.40 ± 0.06 0.42 ± 0.07 0.40 ± 0.05 0.656
22:0 1.08 ± 0.22 1.07 ± 0.21 0.89 ± 0.17 0.033
24:0 0.88 ± 0.19 0.92 ± 0.19 0.68 ± 0.18*,� 0.008
Total SFA 44.13 ± 1.18 43.66 ± 1.17 43.24 ± 1.93 0.452
MUFA
14:1 0.08 ± 0.12 0.09 ± 0.09 0.12 ± 0.10 0.744
15:1 0.46 ± 0.34 0.67 ± 0.37 0.62 ± 0.32 0.397
16:1 0.82 ± 0.27 0.67 ± 0.20 0.59 ± 0.14* 0.043
17:1 0.34 ± 0.19 0.54 ± 0.26 0.46 ± 0.22 0.240
18:1n9 9.99 ± 0.73 9.53 ± 0.76 9.15 ± 0.67* 0.050
20:1n7 0.07 ± 0.05 0.06 ± 0.03 0.04 ± 0.04 0.372
20:1n9 0.13 ± 0.04 0.14 ± 0.07 0.18 ± 0.07 0.238
956 Lipids (2010) 45:947–962
123

Table 3 continued
Baseline CRD-SFA CRD-UFA ANOVA
22:1n9 0.11 ± 0.06 0.12 ± 0.05 0.12 ± 0.05 0.901
24:1 0.96 ± 0.24 1.03 ± 0.35 1.16 ± 0.25 0.237
Total MUFA 12.96 ± 0.69 12.84 ± 0.94 12.45 ± 1.04 0.397
PUFA
18:3n3 0.21 ± 0.03 0.20 ± 0.05 0.25 ± 0.08 0.278
18:4n3 0.09 ± 0.04 0.11 ± 0.03 0.08 ± 0.05 0.203
20:3n3 0.01 ± 0.02 0.00 ± 0.00 0.00 ± 0.01 –
20:4n3 0.08 ± 0.05 0.05 ± 0.03 0.07 ± 0.03 0.568
20:5n3 0.87 ± 0.59 0.61 ± 0.23 3.44 ± 2.23*,� 0.002
22:5n3 0.76 ± 0.12 0.73 ± 0.15 0.81 ± 0.13 0.097
22:6n3 2.97 ± 0.84 2.77 ± 0.46 4.79 ± 0.92*,� 0.000
18:2n6 22.36 ± 2.79 22.32 ± 1.14 21.63 ± 2.24 0.493
18:3n6 0.16 ± 0.05 0.13 ± 0.02 0.10 ± 0.02* 0.031
20:2n6 0.29 ± 0.05 0.26 ± 0.05 0.23 ± 0.06 0.110
20:3n6 2.86 ± 0.77 2.31 ± 0.53 1.49 ± 0.58* 0.002
20:4n6 10.96 ± 1.63 13.14 ± 0.78* 11.03 ± 0.51� 0.002
22:4n6 0.38 ± 0.07 0.40 ± 0.10 0.19 ± 0.04*,� 0.000
22:5n6 0.25 ± 0.08 0.27 ± 0.14 0.10 ± 0.03*,� 0.002
20:3n9 0.14 ± 0.13 0.19 ± 0.32 0.09 ± 0.06 0.496
Total PUFA 42.37 ± 2.45 43.49 ± 1.71 44.32 ± 1.93 0.153
Total n3 4.98 ± 1.42 4.47 ± 0.60 9.45 ± 2.89*,� 0.000
Total n6 37.25 ± 2.58 38.83 ± 1.61 34.78 ± 2.50� 0.002
n6/n3 8.04 ± 2.42 8.81 ± 1.23 4.08 ± 1.56*,� 0.000
AA/EPA 16.04 ± 7.22 23.85 ± 7.22 4.82 ± 3.31*,� 0.000
CE (nmol/ml)
SFA
14:0 36.59 ± 7.9 51.16 ± 25.0 30.46 ± 9.7� 0.047
15:0 10.52 ± 7.1 15.57 ± 6.9 9.16 ± 6.9 0.099
16:0 608.76 ± 51.4 720.01 ± 213.0 611.48 ± 66.2 0.138
18:0 95.77 ± 109.6 71.97 ± 20.9 54.75 ± 12.2 0.512
20:0 5.13 ± 4.8 10.28 ± 13.5 3.50 ± 5.2 0.241
22:0 0.69 ± 1.3 5.44 ± 9.6 2.76 ± 2.8 0.273
24:0 0.41 ± 0.8 1.18 ± 2.3 0.76 ± 1.7 0.672
Total SFA 757.87 ± 106.3 875.61 ± 263.2 712.87 ± 65.6 0.208
MUFA
14:1 0.55 ± 1.0 2.25 ± 2.6 1.88 ± 1.3 0.110
15:1 1.52 ± 3.0 1.29 ± 1.2 1.07 ± 1.5 0.924
16:1 123.62 ± 64.5 119.63 ± 32.8 85.55 ± 5.5 0.221
17:1 10.47 ± 1.7 16.90 ± 9.7 10.37 ± 1.6 0.071
18:1n9 878.74 ± 120.6 1063.96 ± 362.2 925.07 ± 181.7 0.146
20:1n7 0.00 ± 0.0 0.00 ± 0.0 0.00 ± 0.0 –
20:1n9 0.00 ± 0.0 0.00 ± 0.0 0.00 ± 0.0 –
22:1n9 9.54 ± 9.4 18.09 ± 33.0 6.00 ± 4.9 0.383
24:1 13.58 ± 20.1 6.84 ± 16.7 6.39 ± 8.9 0.615
Total MUFA 11038.03 ± 158.0 228.97 ± 400.1 1036.33 ± 176.4 0.189
PUFA
18:3n3 22.23 ± 6.2 24.61 ± 15.3 34.74 ± 10.8*,� 0.013
18:4n3 12.89 ± 8.6 8.80 ± 7.8 3.50 ± 3.6* 0.039
Lipids (2010) 45:947–962 957
123
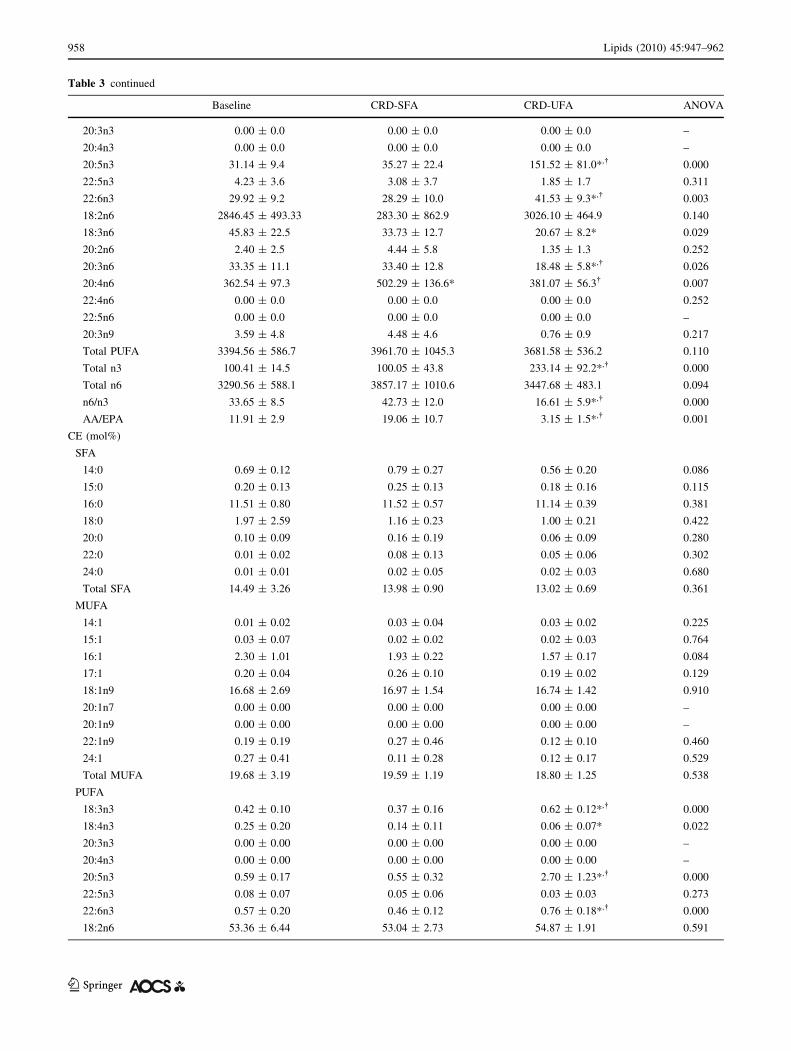
Table 3 continued
Baseline CRD-SFA CRD-UFA ANOVA
20:3n3 0.00 ± 0.0 0.00 ± 0.0 0.00 ± 0.0 –
20:4n3 0.00 ± 0.0 0.00 ± 0.0 0.00 ± 0.0 –
20:5n3 31.14 ± 9.4 35.27 ± 22.4 151.52 ± 81.0*,� 0.000
22:5n3 4.23 ± 3.6 3.08 ± 3.7 1.85 ± 1.7 0.311
22:6n3 29.92 ± 9.2 28.29 ± 10.0 41.53 ± 9.3*,� 0.003
18:2n6 2846.45 ± 493.33 283.30 ± 862.9 3026.10 ± 464.9 0.140
18:3n6 45.83 ± 22.5 33.73 ± 12.7 20.67 ± 8.2* 0.029
20:2n6 2.40 ± 2.5 4.44 ± 5.8 1.35 ± 1.3 0.252
20:3n6 33.35 ± 11.1 33.40 ± 12.8 18.48 ± 5.8*,� 0.026
20:4n6 362.54 ± 97.3 502.29 ± 136.6* 381.07 ± 56.3� 0.007
22:4n6 0.00 ± 0.0 0.00 ± 0.0 0.00 ± 0.0 0.252
22:5n6 0.00 ± 0.0 0.00 ± 0.0 0.00 ± 0.0 –
20:3n9 3.59 ± 4.8 4.48 ± 4.6 0.76 ± 0.9 0.217
Total PUFA 3394.56 ± 586.7 3961.70 ± 1045.3 3681.58 ± 536.2 0.110
Total n3 100.41 ± 14.5 100.05 ± 43.8 233.14 ± 92.2*,� 0.000
Total n6 3290.56 ± 588.1 3857.17 ± 1010.6 3447.68 ± 483.1 0.094
n6/n3 33.65 ± 8.5 42.73 ± 12.0 16.61 ± 5.9*,� 0.000
AA/EPA 11.91 ± 2.9 19.06 ± 10.7 3.15 ± 1.5*,� 0.001
CE (mol%)
SFA
14:0 0.69 ± 0.12 0.79 ± 0.27 0.56 ± 0.20 0.086
15:0 0.20 ± 0.13 0.25 ± 0.13 0.18 ± 0.16 0.115
16:0 11.51 ± 0.80 11.52 ± 0.57 11.14 ± 0.39 0.381
18:0 1.97 ± 2.59 1.16 ± 0.23 1.00 ± 0.21 0.422
20:0 0.10 ± 0.09 0.16 ± 0.19 0.06 ± 0.09 0.280
22:0 0.01 ± 0.02 0.08 ± 0.13 0.05 ± 0.06 0.302
24:0 0.01 ± 0.01 0.02 ± 0.05 0.02 ± 0.03 0.680
Total SFA 14.49 ± 3.26 13.98 ± 0.90 13.02 ± 0.69 0.361
MUFA
14:1 0.01 ± 0.02 0.03 ± 0.04 0.03 ± 0.02 0.225
15:1 0.03 ± 0.07 0.02 ± 0.02 0.02 ± 0.03 0.764
16:1 2.30 ± 1.01 1.93 ± 0.22 1.57 ± 0.17 0.084
17:1 0.20 ± 0.04 0.26 ± 0.10 0.19 ± 0.02 0.129
18:1n9 16.68 ± 2.69 16.97 ± 1.54 16.74 ± 1.42 0.910
20:1n7 0.00 ± 0.00 0.00 ± 0.00 0.00 ± 0.00 –
20:1n9 0.00 ± 0.00 0.00 ± 0.00 0.00 ± 0.00 –
22:1n9 0.19 ± 0.19 0.27 ± 0.46 0.12 ± 0.10 0.460
24:1 0.27 ± 0.41 0.11 ± 0.28 0.12 ± 0.17 0.529
Total MUFA 19.68 ± 3.19 19.59 ± 1.19 18.80 ± 1.25 0.538
PUFA
18:3n3 0.42 ± 0.10 0.37 ± 0.16 0.62 ± 0.12*,� 0.000
18:4n3 0.25 ± 0.20 0.14 ± 0.11 0.06 ± 0.07* 0.022
20:3n3 0.00 ± 0.00 0.00 ± 0.00 0.00 ± 0.00 –
20:4n3 0.00 ± 0.00 0.00 ± 0.00 0.00 ± 0.00 –
20:5n3 0.59 ± 0.17 0.55 ± 0.32 2.70 ± 1.23*,� 0.000
22:5n3 0.08 ± 0.07 0.05 ± 0.06 0.03 ± 0.03 0.273
22:6n3 0.57 ± 0.20 0.46 ± 0.12 0.76 ± 0.18*,� 0.000
18:2n6 53.36 ± 6.44 53.04 ± 2.73 54.87 ± 1.91 0.591
958 Lipids (2010) 45:947–962
123
periods in this study significantly decreased TAG 16:1n-7,
suggesting that similar reductions in our previous experi-
ments using a hypocaloric CRD [3, 7], were a consequence
of carbohydrate restriction rather than calorie reduction or
weight loss. Lower 16:1n-7 also provides an explanation
for the lack of association between dietary and plasma SFA
since the 16:0 species is the primary product of fatty acid
synthesis. Parallel reduction in 16:0 and 16:1n-7 suggests
that stearoyl-CoA desaturase-1 (SCD-1), the enzyme
responsible for desaturating 16:0, was not down-regulated
independent of lipogenesis, since, in that case, the pro-
portion of 16:0 would be expected to rise. Increased plasma
levels of SFA and 16:1n-7 have been reported in obese
adolescents [31] and adults with MetSyn [32] and higher
16:1n-7 is associated with increased abdominal obesity,
lipogenesis, and hypertriglyceridemia [33, 34].
Highly Unsaturated Fatty Acids
The increase in PL ARA in weight stable men after the
CRD-SFA (order of 2 units expressed as mol%) is similar
to the previously reported effect in overweight men on a
hypocaloric diet [7] indicating that the latter was not due to
weight loss. Replacing SFA with unsaturated fat including
n-3 PUFA prevented the increase in plasma ARA, and also
resulted in a marked increase in plasma EPA and DHA,
likely a result of higher dietary intake on the CRD-UFA
(1.5 g vs. 0.4 g/day). Previous studies have shown close
association between dietary EPA and DHA and plasma
EPA and DHA [35]. Increased plasma ARA following
CRD-SFA may have resulted from less competition from
n-3 PUFA for preferential acyl incorporation into the sn-2
position of phospholipids [36]. Dietary intakes of ARA
were high in both CRD-UFA and CRD-SFA. Competition
among n-3 and n-6 PUFA at the level of desaturation and
chain elongation steps of fatty acid biosynthesis may also
be important.
An increase in phospholipid ARA mol% and PL ARA/
EPA ratio is commonly viewed as contributing to a pro-
inflammatory and pro-oxidative state. These effects fol-
lowing CRD-SFA, however, were not accompanied by
elevation of any of the inflammatory markers or 8-iso
PGF2a. Along these lines, a meta-analysis of 14 case–
control and prospective cohort studies found that increased
ARA in plasma PL or triglycerides was not associated with
coronary events [37], while a recent case-controlled study
of acute coronary syndrome (ACS) found a U-shaped
relationship between odds ratio for ACS and erythrocyte
ARA content [38]. Ferrucci L et al. [15] demonstrated and
inverse relation between plasma ARA and pro-inflamma-
tory markers, in agreement with the current study. A CRD
that resulted in an increased ARA/EPA ratio also decreased
C-reactive protein (CRP) [17]. A number of other studies
have failed to link increased ARA in plasma lipids with
deleterious outcomes [39–43]. The lack of association
between plasma PL ARA and plasma PL ARA/EPA ratio and
inflammation following CRD-SFA supports the idea that
ARA in plasma membranes is not pro-inflammatory, espe-
cially in the context of low dietary carbohydrate. In fact,
there was a trend (P \ 0.08) for an anti-inflammatory effect
on the adipocytokine leptin. Although leptin is not a classic
cytokine, several immune cells (including polymorphonu-
clear leukocytes, monocytes, macrophages and lympho-
cytes) have leptin receptors and their activity can be
modulated by leptin. Leptin has also been shown to stimulate
production of ROS by activated monocytes in vitro [44].
Table 3 continued
Baseline CRD-SFA CRD-UFA ANOVA
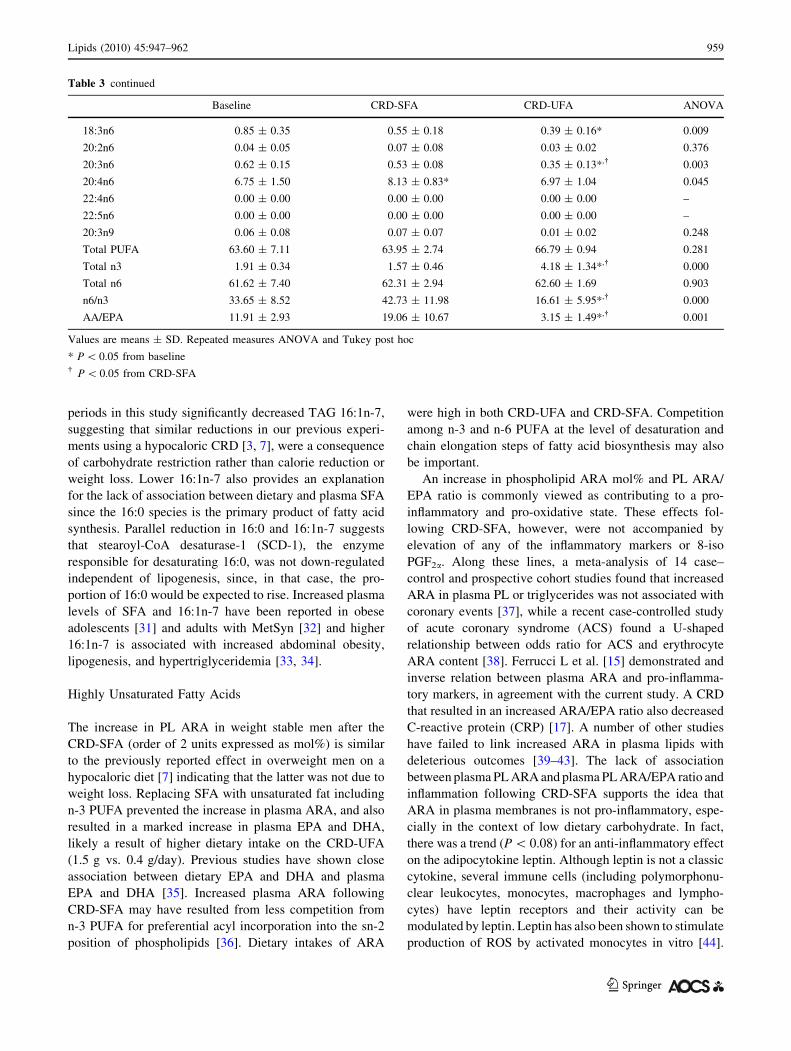
18:3n6 0.85 ± 0.35 0.55 ± 0.18 0.39 ± 0.16* 0.009
20:2n6 0.04 ± 0.05 0.07 ± 0.08 0.03 ± 0.02 0.376
20:3n6 0.62 ± 0.15 0.53 ± 0.08 0.35 ± 0.13*,� 0.003
20:4n6 6.75 ± 1.50 8.13 ± 0.83* 6.97 ± 1.04 0.045
22:4n6 0.00 ± 0.00 0.00 ± 0.00 0.00 ± 0.00 –
22:5n6 0.00 ± 0.00 0.00 ± 0.00 0.00 ± 0.00 –
20:3n9 0.06 ± 0.08 0.07 ± 0.07 0.01 ± 0.02 0.248
Total PUFA 63.60 ± 7.11 63.95 ± 2.74 66.79 ± 0.94 0.281
Total n3 1.91 ± 0.34 1.57 ± 0.46 4.18 ± 1.34*,� 0.000
Total n6 61.62 ± 7.40 62.31 ± 2.94 62.60 ± 1.69 0.903
n6/n3 33.65 ± 8.52 42.73 ± 11.98 16.61 ± 5.95*,� 0.000
AA/EPA 11.91 ± 2.93 19.06 ± 10.67 3.15 ± 1.49*,� 0.001
Values are means ± SD. Repeated measures ANOVA and Tukey post hoc
* P \ 0.05 from baseline� P \ 0.05 from CRD-SFA
Lipids (2010) 45:947–962 959
123

Previous CRD investigations indicate significant reductions
in response to a low carbohydrate diet even when normal-
izing for changes in body or fat mass [3].
The isoprostane 8-iso PGF2a is a free radical-catalyzed
product of ARA measured as a general indicator of oxi-
dative stress [18]. We found no change in 8-iso PGF2a after
the CRD-SFA despite a significant increase in plasma
ARA. Similarly, a significant decrease in 8-iso PGF2a was
observed after the CRD-UFA where there was no change in
plasma ARA. The inverse correlation between changes in
plasma PL ARA and 8-iso PGF2a indicates better preser-
vation of ARA in response to a CRD. The fat sources in
this diet, olive oil and lipid from fish and liquid omega-3
eggs, may have contributed to lower urinary 8-iso PGF2a
following CRD-UFA. Urinary excretion has been shown to
be reduced by extra virgin olive oil [45], moderate fish oil
supplementation (3.6 g/d n-3 PUFA), [46] and one daily
fish meal (providing 3 g n-3 PUFA) reduced urinary
F2-isoprostane levels in dyslipidemic non-insulin-depen-
dent diabetic patients [47].
Insulin Resistance Syndrome
Saturated fatty acids are often implicated in the worsening
of insulin resistance [48], but the effect is contingent upon
the presence of ample carbohydrate. Carbohydrate restric-
tion in the presence of high saturated fat leads to
improvement in insulin sensitivity despite increased lipo-
lytic rates and release of fatty acids into the circulation
[49]. In the current study, the two subjects who had insulin
resistance at baseline improved after restricting carbohy-
drate. The TAG/HDL-C ratio is strongly correlated with
insulin resistance and levels [3.5 are indicative of
increased CVD risk [50]. All subjects showed TAG/HDL-C
values less than this value after the CRD consistent with
the HOMA-IR results. Carbohydrate restrictions thus
improved insulin sensitivity independent of dietary fatty
acid composition. Many factors can influence serum cho-
lesterol responses to saturated fat [51] including genetic
variations [52] and the current study showed high vari-
ability in LDL-C. Independent of LDL-C concentration,
however, individuals with a predominance of small LDL
particles (pattern B) have [threefold risk of CVD [53]. In
the current study, the variable LDL response was accom-
panied by uniform increase in LDL particle size.
Dietary Recommendations
The current findings further challenge the broad recom-
mendation to restrict saturated fat especially since those
calories are likely to be replaced with carbohydrate. The
many factors that contribute to the relation of fat intake and
fatty acid composition have been reviewed [54], and our
results emphasize the substantial impact of a low carbo-
hydrate intake in regulating the connection between dietary
and plasma SFA. A higher saturated fat intake can be
efficiently metabolized in the presence of low carbohydrate
and lead to consistent improvements in markers of CVD
risk. Whereas studies of benefits of carbohydrate restriction
are rarely cited in the literature, responses of even a single
meal high in saturated fat are taken as convincing evidence
even if done in the presence of high carbohydrate. Ulti-
mately, however, long term studies show that replacement
of saturated fat with carbohydrate is at best neutral [55, 56].
Persistence of recommendations in the face of continued
failure of large trials to show an effect of saturated fat
remains one of the strange anomalies in current medical
science.
Substitution of a portion of the SFA within a CRD with
UFA including a combination of both MUFA and n-6 and
n-3 PUFA had a profound effect on plasma fatty acid
composition, reduced oxidative stress, but did not alter the
positive effects on features of metabolic syndrome (e.g.,
insulin, TAG, LDL particle size). As low carbohydrate
diets become more widely prescribed and used, it will be
important to determine the range of dietary fatty acids most
conducive to improving long-term health. Our results point
to a suitable diet that had an emphasis on low carbohydrate
foods with fat sources emphasizing MUFA and n-3 PUFA
(e.g., omega-3 eggs, avocado, salmon, sardines, meat,
poultry, olive oil, canola oil, nuts and seeds) although
there was little if any detriment in a higher saturated fat
approach.
Acknowledgments This work was supported by the American Egg
Board-Egg Nutrition Center Dissertation Fellowship in Nutrition
Award. The funding agency had no input to the design and conduct of
the study, the interpretation of the data, or preparation and approval of
manuscripts.
References
1. Volek JS, Fernandez ML, Feinman RD, Phinney SD (2008)
Dietary carbohydrate restriction induces a unique metabolic state
positively affecting atherogenic dyslipidemia, fatty acid parti-
tioning, and metabolic syndrome. Prog Lipid Res 47:307–318
2. Volek JS, Feinman RD (2005) Carbohydrate restriction improves
the features of metabolic syndrome. Metabolic syndrome may be
defined by the response to carbohydrate restriction. Nutr Metab
(Lond) 2:31
3. Volek JS, Phinney SD, Forsythe CE et al (2009) Carbohydrate
restriction has a more favorable impact on the metabolic
syndrome than a low fat diet. Lipids 44:297–309
4. Krauss RM, Blanche PJ, Rawlings RS, Fernstrom HS, Williams
PT (2006) Separate effects of reduced carbohydrate intake and
weight loss on atherogenic dyslipidemia. Am J Clin Nutr
83:1025–1031
5. Sharman MJ, Kraemer WJ, Love DM et al (2002) A ketogenic
diet favorably affects serum biomarkers for cardiovascular
disease in normal-weight men. J Nutr 132:1879–1885
960 Lipids (2010) 45:947–962
123
6. Volek JS, Sharman MJ, Gomez AL, Scheett TP, Kraemer WJ
(2003) An isoenergetic very low carbohydrate diet improves
serum HDL cholesterol and triacylglycerol concentrations, the
total cholesterol to HDL cholesterol ratio and postprandial lipe-
mic responses compared with a low fat diet in normal weight,
normolipidemic women. J Nutr 133:2756–2761
7. Forsythe CE, Phinney SD, Fernandez ML et al (2008) Compar-
ison of low fat and low carbohydrate diets on circulating fatty
acid composition and markers of inflammation. Lipids 43:65–77
8. Siri-Tarino PW, Sun Q, Hu FB, Krauss RM (2010) Meta-analysis of
prospective cohort studies evaluating the association of saturated fat
with cardiovascular disease. Am J Clin Nutr 91(3):535–546
9. Siri-Tarino PW, Sun Q, Hu FB, Krauss RM (2010) Saturated fat,
carbohydrate, and cardiovascular disease. Am J Clin Nutr
91(3):502–509
10. Cassady BA, Charboneau NL, Brys EE, Crouse KA, Beitz DC,
Wilson T (2007) Effects of low carbohydrate diets high in red
meats or poultry, fish and shellfish on plasma lipids and weight
loss. Nutr Metab (Lond) 4:23
11. King IB, Lemaitre RN, Kestin M (2006) Effect of a low-fat diet
on fatty acid composition in red cells, plasma phospholipids, and
cholesterol esters: investigation of a biomarker of total fat intake.
Am J Clin Nutr 83:227–236
12. Raatz SK, Bibus D, Thomas W, Kris-Etherton P (2001) Total fat
intake modifies plasma fatty acid composition in humans. J Nutr
131:231–234
13. Hjelte LE, Nilsson A (2005) Arachidonic acid and ischemic heart
disease. J Nutr 135:2271–2273
14. Lands B (2008) A critique of paradoxes in current advice on
dietary lipids. Prog Lipid Res 47:77–106
15. Ferrucci L, Cherubini A, Bandinelli S, Bartali B, Corsi A, Lau-
retani F, Martin A, Andres-Lacueva C, Senin U, Guralnik JM
(2006) Relationship of plasma polyunsaturated fatty acids to
circulating inflammatory markers. J Clin Endocrinol Metab
91:439–446
16. von Schacky C, Harris WS (2007) Cardiovascular risk and
the omega-3 index. J Cardiovasc Med (Hagerstown) 8(Suppl 1):
S46–S49
17. Johnston CS, Tjonn SL, Swan PD, White A, Hutchins H, Sears B
(2006) Ketogenic low-carbohydrate diets have no metabolic
advantage over nonketogenic low-carbohydrate diets. Am J Clin
Nutr 83:1055–1061
18. Morrow JD, Roberts LJ (1997) The isoprostanes: unique bioac-
tive products of lipid peroxidation. Prog Lipid Res 36:1–21
19. Harris WS, Pottala JV, Sands SA, Jones PG (2007) Comparison
of the effects of fish and fish-oil capsules on the n 3 fatty acid
content of blood cells and plasma phospholipids. Am J Clin Nutr
86:1621–1625
20. Volek JS, Gomez AL, Kraemer WJ (2000) Fasting lipoprotein
and postprandial triacylglycerol responses to a low-carbohydrate
diet supplemented with n-3 fatty acids. J Am Coll Nutr
19:383–391
21. Radikova Z, Koska J, Huckova M et al (2006) Insulin sensitivity
indices: a proposal of cut-off points for simple identification of
insulin-resistant subjects. Exp Clin Endocrinol Diab 114:249–256
22. Hoidrup S, Andreasen AH, Osler M et al (2002) Assessment of
habitual energy and macronutrient intake in adults: comparison of
a seven day food record with a dietary history interview. Eur J
Clin Nutr 56:105–113
23. Feinman RD, Fine EJ (2004) ‘‘A calorie is a calorie’’ violates the
second law of thermodynamics. Nutr J 3(9)
24. Keys A (1970) Coronary heart disease in seven countries 41(Supp l):
1–211
25. American Diabetes Association (2008) Nutrition recommenda-
tions and interventions for diabetes—2008. Diabetes Care
31(Suppl 1):S61–S78
26. Klein S, Wolfe RR (1992) Carbohydrate restriction regulates the
adaptive response to fasting. Am J Physiol 262:E631–E636
27. Kotronen A, Velagapudi VR, Yetukuri L et al (2009) Serum
saturated fatty acids containing triacylglycerols are better mark-
ers of insulin resistance than total serum triacylglycerol concen-
trations. Diabetologia 52:684–690
28. Miettinen TA, Naukkarinen V, Huttunen JK, Mattila S, Kumlin T
(1982) Fatty-acid composition of serum lipids predicts myocar-
dial infarction. Br Med J (Clin Res Ed) 285:993–996
29. Wang L, Folsom AR, Eckfeldt JH (2003) Plasma fatty acid
composition and incidence of coronary heart disease in middle
aged adults: the atherosclerosis risk in communities (ARIC)
study. Nutr Metab Cardiovasc Dis 13:256–266
30. Aarsland A, Wolfe RR (1998) Hepatic secretion of VLDL fatty
acids during stimulated lipogenesis in men. J Lipid Res
39:1280–1286
31. Klein-Platat C, Drai J, Oujaa M, Schlienger JL, Simon C (2005)
Plasma fatty acid composition is associated with the metabolic
syndrome and low-grade inflammation in overweight adolescents.
Am J Clin Nutr 82:1178–1184
32. Warensjo E, Riserus U, Vessby B (2005) Fatty acid composition
of serum lipids predicts the development of the metabolic syn-
drome in men. Diabetologia 48:1999–2005
33. Kunesova M, Hainer V, Tvrzicka E et al (2002) Assessment of
dietary and genetic factors influencing serum and adipose fatty
acid composition in obese female identical twins. Lipids
37:27–32
34. Paillard F, Catheline D, Duff FL et al (2008) Plasma palmitoleic
acid, a product of stearoyl-coA desaturase activity, is an inde-
pendent marker of triglyceridemia and abdominal adiposity. Nutr
Metab Cardiovasc Dis 18:436–440
35. Vidgren HM, Agren JJ, Schwab U, Rissanen T, Hanninen O,
Uusitupa MI (1997) Incorporation of n-3 fatty acids into plasma
lipid fractions, and erythrocyte membranes and platelets during
dietary supplementation with fish, fish oil, and docosahexae-
noic acid-rich oil among healthy young men. Lipids 32:697–
705
36. Lands WE, Libelt B, Morris A, Kramer NC, Prewitt TE, Bowen
P, Schmeisser D, Davidson MH, Burns JH (1992) Maintenance of
lower proportions of (n-6) eicosanoid precursors in phospholipids
of human plasma in response to added dietary (n-3) fatty acids.
Biochim Biophys Acta 1180:147–162
37. Harris WS, Poston WC, Haddock CK (2007) Tissue n-3 and n-6
fatty acids and risk for coronary heart disease events. Athero-
sclerosis 193:1–10
38. Block RC, Harris WS, Reid KJ, Spertus JA (2008) Omega-6 and
trans fatty acids in blood cell membranes: a risk factor for acute
coronary syndromes? Am Heart J 156:1117–1123
39. Nelson GJ, Schmidt PC, Bartolini G, Kelley DS, Phinney SD,
Kyle D, Silbermann S, Schaefer EJ (1997) The effect of dietary
arachidonic acid on plasma lipoprotein distributions, apoproteins,
blood lipid levels, and tissue fatty acid composition in humans.
Lipids 32:427–433
40. Nelson GJ, Schmidt PC, Bartolini G, Kelley DS, Kyle D (1997)
The effect of dietary arachidonic acid on platelet function,
platelet fatty acid composition, and blood coagulation in humans.
Lipids 32:421–425
41. Kelley DS, Taylor PC, Nelson GJ, Schmidt PC, Mackey BE, Kyle
D (1997) Effects of dietary arachidonic acid on human immune
response. Lipids 32:449–456
42. Kelley DS, Taylor PC, Nelson GJ, Mackey BE (1998) Arachi-
donic acid supplementation enhances synthesis of eicosanoids
without suppressing immune functions in young healthy men.
Lipids 33:125–130
43. Calder PC (2007) Dietary arachidonic acid: harmful, harmless or
helpful? Br J Nutr 98:451–453
Lipids (2010) 45:947–962 961
123

44. Guzik TJ, Mangalat D, Korbut R (2006) Adipocytokines—novel
link between inflammation and vascular function? J Physiol
Pharmacol 57:505–528
45. Visioli F, Caruso D, Galli C, Viappiani S, Galli G, Sala A (2000)
Olive oils rich in natural catecholic phenols decrease isoprostane
excretion in humans. Biochem Biophys Res Commun
278:797–799
46. Nalsen C, Vessby B, Berglund L, Uusitupa M, Hermansen K,
Riccardi G, Rivellese A, Storlien L, Erkkila A, Yla-Herttuala S,
Tapsell L, Basu S (2006) Dietary (n-3) fatty acids reduce plasma
F2-isoprostanes but not prostaglandin F2alpha in healthy humans.
J Nutr 136:1222–1228
47. Mori TA, Dunstan DW, Burke V, Croft KD, Rivera JH, Beilin LJ,
Puddey IB (1999) Effect of dietary fish and exercise training on
urinary F2-isoprostane excretion in non-insulin-dependent dia-
betic patients. Metabolism 48:1402–1408
48. Vessby B, Unsitupa M, Hermansen K et al (2001) Substituting
dietary saturated for monounsaturated fat impairs insulin sensi-
tivity in healthy men and women: the KANWU study. Diabeto-
logia 44:312–319
49. Kirk E, Reeds DN, Finck BN, Mayurranjan SM, Patterson BW,
Klein S (2009) Dietary fat and carbohydrates differentially alter
insulin sensitivity during caloric restriction. Gastroenterology
136:1552–1560
50. McLaughlin T, Reaven G, Abbasi F et al (2005) Is there a simple
way to identify insulin-resistant individuals at increased risk of
cardiovascular disease? Am J Cardiol 96:399–404
51. Wilke MS, Clandinin MT (2005) Influence of dietary saturated
fatty acids on the regulation of plasma cholesterol concentration.
Lipids 40:1207–1213
52. Mata P, Lopez-Miranda J, Pocovi M et al (1998) Human apoli-
poprotein A-I gene promoter mutation influences plasma low
density lipoprotein cholesterol response to dietary fat saturation.
Atherosclerosis 137:367–376
53. Austin MA, King MC, Vranizan KM, Krauss RM (1990) Ath-
erogenic lipoprotein phenotype. A proposed genetic marker for
coronary heart disease risk. Circulation 82:495–506
54. Lands WEM (1995) Long-term fat intake and biomarkers. Am J
Clin Nutr 61:721S–725S
55. Howard BV, Van Horn L, Hsia J et al (2006) Low-fat dietary
pattern and risk of cardiovascular disease: the women’s health
initiative randomized controlled dietary modification trial. JAMA
295:655–666
56. Jakobsen MU, O’Reilly EJ, Heitmann BL et al (2009) Major
types of dietary fat and risk of coronary heart disease: a pooled
analysis of 11 cohort studies. Am J Clin Nutr 89:1425–1432
962 Lipids (2010) 45:947–962
123