effects of dietary carbohydrate, fat, and protein on norepinephrine turnover in rats
TRANSCRIPT
T
Effects of Dietary Carbohydrate, Fat andProtein on Growth, Body Composition andBlood Metabolite Levels in the Dog1
DALE R. ROMSOS,2 PANFILO S. BELO,2MAURICE R. BENNINK,2 WERNER G. BERGEN 3ANDGILBERT A. LEVEILLE -
Departments of Food Science and Human Nutrition andAnimal Husbandry, Michigan State University,East Lansing, Michigan 48824
ABSTRACT Six semipurified canned diets ranging in composition from0 to 62% of energy from carbohydrate and from 20% to 48% of energy fromprotein were fed to female beagle dogs for 8 months. Additionally, threecommercial-type diets were also fed. The effects of these diets on growth,body composition and selected blood metabolite levels in the dogs werestudied. The dogs readily consumed each of the nine diets fed. The level ofcarbohydrate, fat or protein in the diet did not influence body weight gainduring the first 16 weeks nor was nitrogen balance affected by the diets.At the end of the 32-week study, dogs fed the high-carbohydrate (62% ofenergy) diet contained less body fat, but an equal fat-free mass, than diddogs fed lower-carbohydrate (20-42% of energy) diets with a similarquantity of protein. Consumption of carbohydrate-free diets did not influence postprandial levels of circulating glucose or insulin in the dogs.Plasma cholesterol levels were elevated in dogs consuming the diets highin fat but plasma triglycéridelevels were not influenced by the diets fed.Consumption of high-protein (46-48% of energy) diets elevated plasmaurea nitrogen levels but had minimal influence on plasma amino acid levels.The general response of these young dogs was not markedly influenced byconsumption of diets ranging from carbohydrate-free to high-carbohydrateand from adequate-protein to high-protein. J. Nutr. J06: 1452-1464,1976.INDEXING KEY WORDS carbohydrate-free diet •high-proteindiets •growth •body composition •blood metabolites •dogs
The optimal ratio of protein :f at :carbo- respond better when fed a carbohydrate-hydrate in a diet will depend on the physi- free diet than when fed a diet containingological needs of the animal. For the dog, carbohydrate (5). However, few studiesthere has been considerable discussion have been conducted to assess the influ-about the optimal level of carbohydrate in enee of carbohydrate-free diets on speciesthe diet and about possible adverse ef- other than the rat and chicken.fects of high-protein diets (1-7). A mini- The purpose of this study was to exam-mum dietary carbohydrate requirement for ine the effects of dietary carbohydrate, fatdogs has not been established (3). All and protein on growth, body compositionanimals appear to have a metabolic re-quirement for glucose; however, the rat ™£' ^°l^™^ from theand chicken at least are able tO meet their General Foods Corporation nnd from the Quaker Oatsv.<u»r1c- fr,v rrl. idrico „7;fV>r,.if an ovr.cTonr.iic Company and by Research Career Development Awardneeds tor glucose without an exogenous Nm K04 AMooii2 to DRR. Michigan AgriculturalSOUrce OÕ this carbohydrate (8-14). It has Experiment Station Journal Article No. 7624, j .i_ . ' . ijj •i_i 2Food Science and Human Nutrition Department.been Suggested that racing Sled dOgS might a Animal Husbandry Department.
1452
DIETARY FACTORS, GROWTH AND BODY COMPOSITION OF DOGS 1453
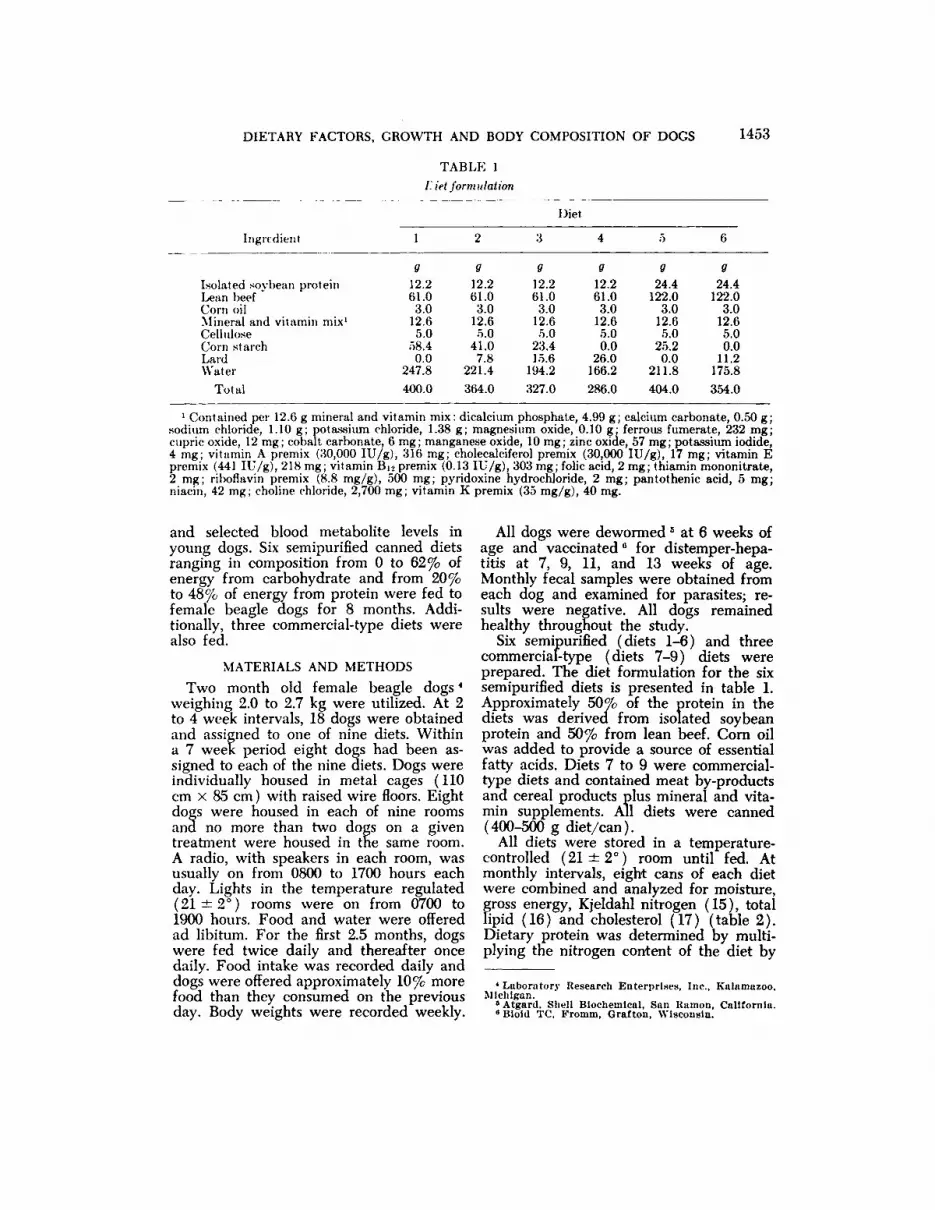
TABLE 1
E iet formulation
Ingredient
Diet
Isolated soybeanproteinLeanbeefCornoilMineral
and vitaminmix1CelluloseCorn
starchLardWaterTotalg12.261.03.012.fi5.058.40.0247.8400.0g12.261.03.012.65.041.07.8221.4364.0g12.261.03.012.65.023.415.6194.2327.0g12.261.03.012.65.00.026.0166.2286.0g24.4122.03.012.65.025.20.0211.8404.0g24.4122.03.012.65.00.011.2175.8354.0
1Contained per 12.6 g mineral and vitamin mix: dicalcium phosphate, 4.99 g; calcium carbonate, 0.50 g;sodium chloride, 1.10 g; potassium chloride, 1.38 g; magnesium oxide, 0.10 g- ferrous fumerate, 232 mg;cupric oxide, 12 mg; cobalt carbonate, 6 mg; manganese oxide, 10 mg; zinc oxide, 57 mg; potassium iodide,4 mg; vitamin A premix (30,000 lU/g), 316 mg; cholecalciferol premix (30,000 lU/g), 17 mg; vitamin Epremix (441 lU/g), 218 mg; vitamin B12premix (0.13 lU/g), 303 mg; folie acid, 2 mg; thiamin mononitrate,2 mg; ribofiavin premix (8.8 mg/g), 500 mg; pyridoxine hydrochloride, 2 mg; pantothenic acid, 5 mg;niacin, 42 mg; choline chloride, 2,700 mg; vitamin K premix (35 mg/g), 40 mg.
and selected blood metabolite levels inyoung dogs. Six semipurified canned dietsranging in composition from 0 to 62% ofenergy from carbohydrate and from 20%to 48% of energy from protein were fed tofemale beagle dogs for 8 months. Additionally, three commercial-type diets werealso fed.
MATERIALS AND METHODSTwo month old female beagle dogs4
weighing 2.0 to 2.7 kg were utilized. At 2to 4 week intervals, 18 dogs were obtainedand assigned to one of nine diets. Withina 7 week period eight dogs had been assigned to each of the nine diets. Dogs wereindividually housed in metal cages (110cm x 85 cm ) with raised wire floors. Eightdogs were housed in each of nine roomsand no more than two dogs on a giventreatment were housed in the same room.A radio, with speakers in each room, wasusually on from 0800 to 1700 hours eachday. Lights in the temperature regulated(21 ±2°)rooms were on from 0700 to
1900 hours. Food and water were offeredad libitum. For the first 2.5 months, dogswere fed twice daily and thereafter oncedaily. Food intake was recorded daily anddogs were offered approximately 10% morefood than they consumed on the previousday. Body weights were recorded weekly.
All dogs were dewormed 5 at 6 weeks ofage and vaccinated " for distemper-hepatitis at 7, 9, 11, and 13 weeks of age.Monthly fecal samples were obtained fromeach dog and examined for parasites; results were negative. All dogs remainedhealthy throughout the study.
Six semipurified (diets 1-J6) and threecommercial-type (diets 7-9) diets wereprepared. The diet formulation for the sixsemipurified diets is presented in table 1.Approximately 50% of the protein in thediets was derived from isolated soybeanprotein and 50% from lean beef. Corn oilwas added to provide a source of essentialfatty acids. Diets 7 to 9 were commercial-type diets and contained meat by-productsand cereal products plus mineral and vitamin supplements. All diets were canned(400-500 g diet/can).
All diets were stored in a temperature-controlled (21 ±2°)room until fed. Atmonthly intervals, eight cans of each dietwere combined and analyzed for moisture,gross energy, Kjeldahl nitrogen (15), totallipid (16) and cholesterol (17) (table 2).Dietary protein was determined by multiplying the nitrogen content of the diet by
•Laboratory Research Enterprises, Inc., Knlamazoo,Michigan.
»Atgard. Shell Biochemical, San Knmon, California.0 Biold TC. Fromm, Grafton, Wisconsin.
1454 ROMSOS ET AL.
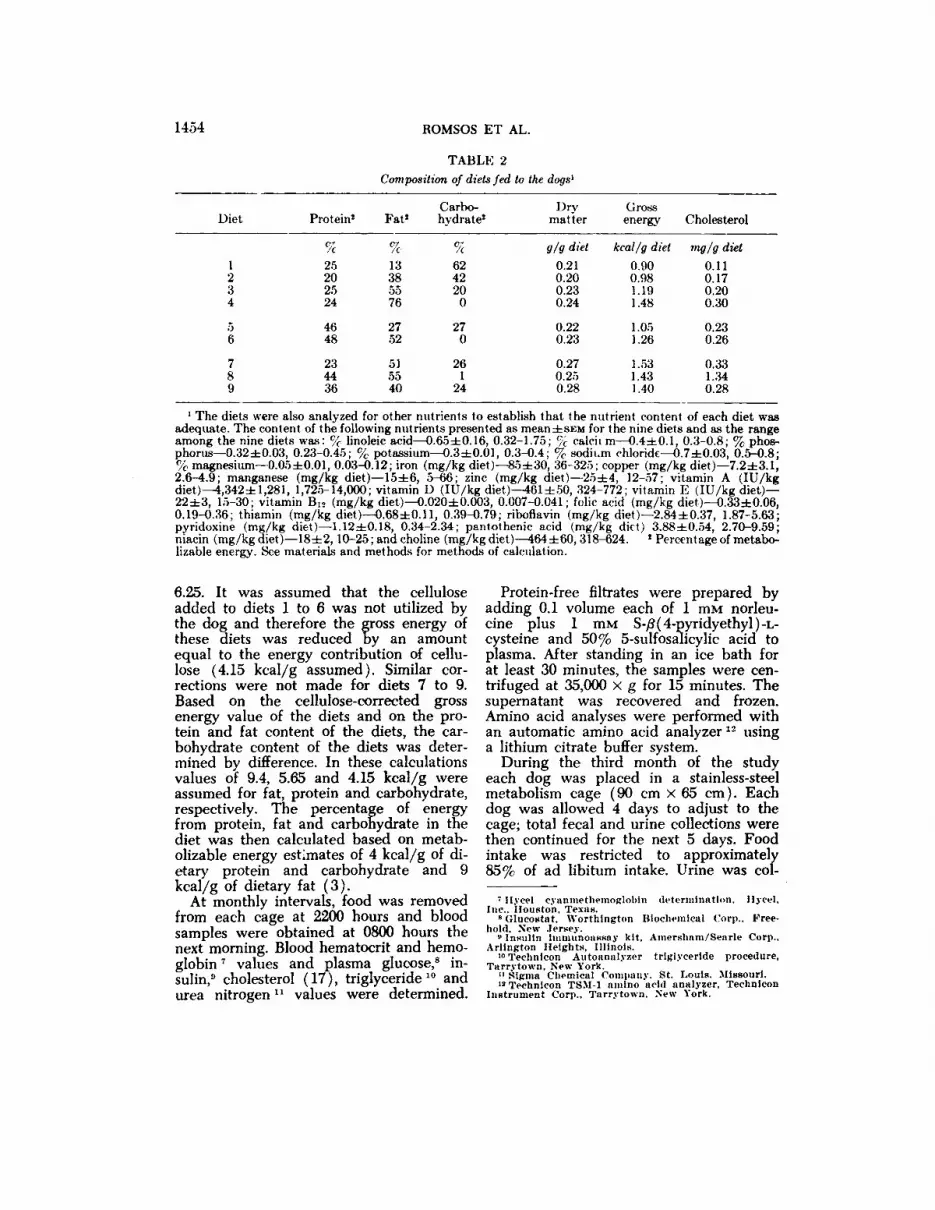
TABLE 2Composition of diets fed to the dogs1
DietProtein*%1
252 203 254245
466487
238 449 36Fat1%l:i
7627
5240Carbo
hydrate'%62
4220027
026
124Drymatterg/g
diet0.21
0.200.230.240.22
0.230.27
0.250.28t
;i-iissenergykcal/g
diet0.90
0.981.191.481.05
1.261.53
1.431.40Cholesterolmg/g
diet0.11
0.170.200.300.23
0.260.33
1.340.28
1The diets were also analyzed for other nutrients to establish that the nutrient content of each diet wasadequate. The content of the following nutrients presented as mean±sEM for the nine diets and as the rangeamong the nine diets was: % linoleic acid—0.65±0.16, 0.32-1.75; % calcirm—0.4±0.1, 0.3-0.8; % phosphorus—0.32±0.03, 0.23-0.45; % potassium—0.3±0.01, 0.3-0.4; % sodium chloride—0.7±0.03, 0.5-0.8;% magnesium—0.05±0.01, 0.03-0.12; iron (mg/kg diet)—85±30, 36-325; copper (mg/kg diet)—7.2±3.1,2.6-4.9; manganese (mg/kg diet)—15±6, 5-66; zinc (mg/kg diet)—25db4, 12-57; vitamin A (lU/kgdiet)—4,342±1,281, 1,725-14,000; vitamin D (IU/kg diet)—401±50,324-772; vitamin E (IU/kg diet)—22±3, 15-30; vitamin Bi2 (mg/kg diet)—0.020±0.003, 0.007-0.041; folie acid (mg/kg diet)—0.33±0.06,0.19-0.36; thiamin (mg/kg diet)—0.68±0.11, 0.39-0.79; riboflavin (mg/kg diet)—2.84±0.37, 1.87-5.63;pyridoxine (mg/kg diet)—1.12±0.18, 0.34-2.34; pantothenic acid (mg/kg diet) 3.88±0.54, 2.70-9.59;niacin (mg/kg diet)—18±2,10-25 ; and choline (mg/kg diet)—464±60,318-624. t Percentage of metabo-lizable energy. See materials and methods for methods of calculation.
6.25. It was assumed that the celluloseadded to diets 1 to 6 was not utilized bythe dog and therefore the gross energy ofthese diets was reduced by an amountequal to the energy contribution of cellulose (4.15 kcal/g assumed). Similar corrections were not made for diets 7 to 9.Based on the cellulose-corrected grossenergy value of the diets and on the protein and fat content of the diets, the carbohydrate content of the diets was determined by difference. In these calculationsvalues of 9.4, 5.65 and 4.15 kcal/g wereassumed for fat, protein and carbohydrate,respectively. The percentage of energyfrom protein, fat and carbohydrate in thediet was then calculated based on metab-olizable energy estimates of 4 kcal/g of dietary protein and carbohydrate and 9kcal/g of dietary fat (3).
At monthly intervals, food was removedfrom each cage at 2200 hours and bloodsamples were obtained at 0800 hours thenext morning. Blood hematocrit and hemoglobin " values and plasma glucose,8 insulin/1 cholesterol (17), triglycéride10andurea nitrogen11 values were determined.
Protein-free filtrates were prepared byadding 0.1 volume each of 1 niM norleu-cine plus l mM S-ß(4-pyridyethyl)-L-cysteine and 50% 5-sulfosalicylic acid toplasma. After standing in an ice bath forat least 30 minutes, the samples were cen-trifuged at 35,000 X g for 15 minutes. Thesupernatant was recovered and frozen.Amino acid analyses were performed withan automatic amino acid analyzer12 usinga lithium citrate buffer system.
During the third month of the studyeach dog was placed in a stainless-steelmetabolism cage (90 cm X 65 cm). Eachdog was allowed 4 days to adjust to thecage; total fecal and urine collections werethen continued for the next 5 days. Foodintake was restricted to approximately85% of ad libitum intake. Urine was col-
' Hycel cyanmetheinoglobin determination, Hycel,Inc.. Houston. Texas.
»Glucostat, Worthington Biochemical Corp., Freehold, New Jersey.
»Insulin tmmunoassay kit. Amersham/Searle Corp.,Arlington Heights, Illinois.
'"Technlcon Autoanalyzer triglycéride procedure,Tarrvtown, New York.
11Sigma Chemical Company. St. Louis. Missouri."Technicon TSM-1 amino acid analyzer, Technlcon
Instrument Corp., Tarrytown. New York.

DIETARY FACTORS, GROWTH AND BODY COMPOSITION OF DOGS 1455
lected into acidified containers. Urine andfecal samples were removed twice dailyfrom the collection containers and frozen.
Acidified feces were dried in a forcedair oven (105°) and subsequently groundthrough a Wiley Mill. Total Kjeldahl-nitrogen (15) in feces and urine was determined. A bomb-calorimeter was utilizedto determine total fecal energy.
After the dogs had been fed their respective diets for 5 to 7 months, the diurnal pattern of food intake was determined. Food intake of the dogs was recorded during each of four 6-hour periods;from 0700 to 1300 hours; 1300 to 1900hours; 1900 to 0100 hours and 0100 to0700 hours.
The normal routine in the animal facility was maintained. Dogs were given anew bowl of diet between 0800 and 1000hours; the cages were also cleaned duringthis period. During the night, room lightswere not turned on; the food bowls wereremoved, weighed in another area andimmediately returned to the dog cage. Oneweek later the procedure was repeated.
During week 32, each dog was injectedwith 100 to 200 /tCi tritiated water. Ablood sample was obtained 3 hours laterand the specific activity of the plasma wasdetermined. In an initial experiment wedetermined that the injected dose oftritium had equilibrated with the bodywater pool within 2 hours. Body watercontent obtained with 3HaO gives a highervalue than obtained by desiccation. Frompublished data (18), it was calculated that3H2O overestimates body water content of6 to 12 kg beagles by 19%. To calculatethe body water content of the dogs, thevalues obtained with 3H2O were multiplied by 0.81. Water was assumed to constitute 73% of the fat-free mass (19, 20).Thus, the fat-free mass was obtained bydividing the total body water content ofthe dog by 0.73. The fat content was calculated by subtracting the fat-free massfrom the body weight of the dog.
Data were analyzed by one-way analysisof variance or when observations wereobtained at more than one time intervalby split-plot analysis of variance ( 21 ). TheBonferroni-f-test was utilized to maketreatment comparisons (22). Within diets1 to 4, 5 and 6, and 7 to 9 individual treat
ment comparisons were made. The following multiple treatment comparisons werealso made: diets 1 to 4 vs. 5 and 6, 7, 8 or9; and diets 5 and 6 vs. 7, 8 or 9.
RESULTSThe composition of the nine diets is pre
sented in table 2. Diets 1 to 4 were formulated to contain an equal quantity of protein (percentage of energy) and an increasing portion of total energy from fat.The analyzed content ranged from 20% to25% of energy from protein and from13% to 76% of energy from fat (table 2).Diet 4 was carbohydrate-free. Based onthe nutrient requirements for growingdogs, the level of protein in these fourdiets was adequate (3). Diets 5 and 6were formulated to contain twice the levelof protein in diets 1 to 4. Analysis of thediets indicated that diets 5 and 6 contained 46% to 48% of energy from protein. Other than the corn oil added todiet 5 to supply a source of essential fattyacids, all the fat was associated with themeat. Thus, 27% of energy from carbohydrate was the maximum level of carbohydrate which could be incorporated intodiet 5 and still maintain the protein :energyratio equal to that of diet 6. Diet 6 wascarbohydrate-free. The commercial-typediets (diets 7-9) contained 23% to 44%of energy from protein. Diet 8 was nearlycarbohydrate-free. To facilitate adequateprocessing, the moisture content of thediets averaged about 73%. The grossenergy values of the diets ranged from0.9 kcal/g for diet 1 to 1.53 kcal/g for diet7. The cholesterol content of the dietsranged from 0.11 mg cholesterol/g for diet1 to 1.34 mg/g for diet 8. Generally, asexpected, the level of cholesterol in thediets paralleled the level of fat (largelyanimal fat) in the diet. The cholesterolcontent of diet 8, which contained a largeportion of meat byproducts, was 4 to 12fold higher than observed in the othereight diets.
To obtain information on the pattern offood intake in the dogs, food consumptionwas recorded every 6 hours during twoseparate 24-hour periods. Because the pattern of food intake appeared similar forall nine diets, the results were combined.The dogs consumed 41% of their food in
1456 ROMSOS ET AL.
the 6-hour period from 0700 to 1300 hours(table 3). They consumed 65% of theirfood during the light hours. Food intakefor the first 6 hours after the lights wereturned off was similar to that observedfrom 1300 to 1900 hours.
Several factors probably contributed tothe large intake of food by the dogs inthe morning. Dogs were offered a newbowl of food at this time. Even thoughfood was always available, the dogs consistently consumed food as soon as a newbowl was placed in the cage. Also duringthis period, their cages were cleaned, consequently the dogs were active.
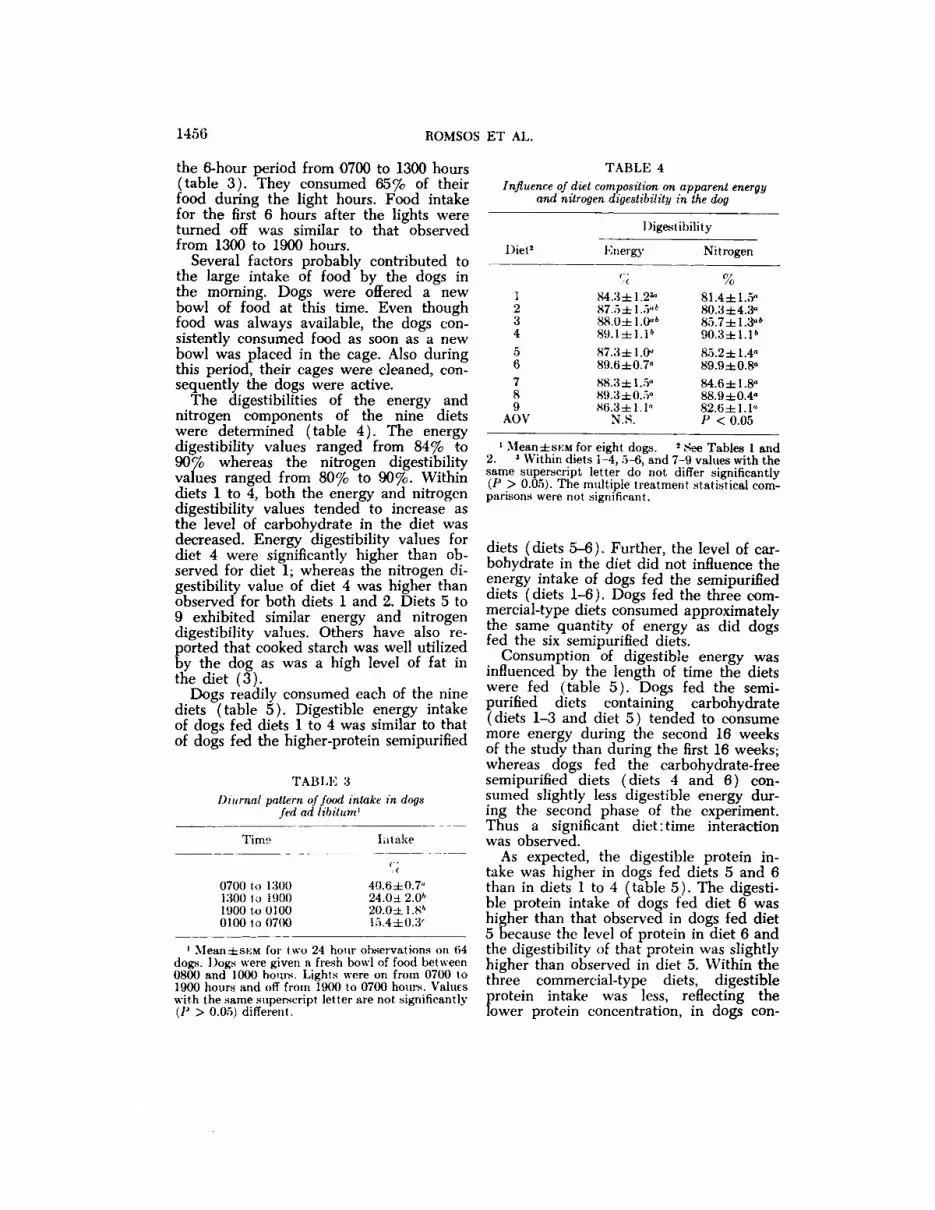
The digestibilities of the energy andnitrogen components of the nine dietswere determined (table 4). The energydigestibility values ranged from 84% to90% whereas the nitrogen digestibilityvalues ranged from 80% to 90%. Withindiets 1 to 4, both the energy and nitrogendigestibility values tended to increase asthe level of carbohydrate in the diet wasdecreased. Energy digestibility values fordiet 4 were significantly higher than observed for diet 1; whereas the nitrogen digestibility value of diet 4 was higher thanobserved for both diets 1 and 2. Diets 5 to9 exhibited similar energy and nitrogendigestibility values. Others have also reported that cooked starch was well utilizedby the dog as was a high level of fat inthe diet (3).
Dogs readily consumed each of the ninediets (table 5). Digestible energy intakeof dogs fed diets 1 to 4 was similar to thatof dogs fed the higher-protein semipurified
TABLE 3Diurnal pattern of food intake in dogs
fed ad libitum1
Intake
4Q.6±0.7"24.0d 2.01-20.0Ü.S''15.4±0.3'
TABLE 4Influence of diet composition on apparent energy
and nitrogen digestibility in the dog
0700 to 13001300 to 19001900 to 01000100 to 0700
1 MeaniSKM for two 24 hour observations on 64dogs. Dogs were given a fresh bowl of food between0800 and 1000 hours. Lights were on from 0700 to1900 hours and off from 1900 to 0700 hours. Valueswith the same superscript letter are not significantly(P > 0.05) different.
Digestibility
Diet« Energy Nitrogen
12345(i789AOV84.3±1.23°87.5±1.5°'88.0±1.0°689.1±1.1687.3
±1.0»89.6±0.7°88.3±1.5«89.3±0.5»86.3
±1.1«N.S.81.4il.5-80.3
±4.3°85.7±1.3°»90.3±1.1*85.2
±1.4°89.9±0.8°84.6±1.8°88.9
±0.4»82.6±1.1«P
< 0.05
1Mean±8EMfor eight dogs. J See Tables 1 and2. * Within diets 1-4, 5-6, and 7-9 values with thesame superscript letter do not differ significantly(P > 0.05). The multiple treatment statistical comparisons were not significant.
diets (diets 5-6). Further, the level of carbohydrate in the diet did not influence theenergy intake of dogs fed the semipurifieddiets (diets 1-6). Dogs fed the three commercial-type diets consumed approximatelythe same quantity of energy as did dogsfed the six semipurified diets.
Consumption of digestible energy wasinfluenced by the length of time the dietswere fed (table 5). Dogs fed the semi-purified diets containing carbohydrate(diets 1-3 and diet 5) tended to consumemore energy during the second 16 weeksof the study than during the first 16 weeks;whereas dogs fed the carbohydrate-freesemipurified diets (diets 4 and 6) consumed slightly less digestible energy during the second phase of the experiment.Thus a significant diet:time interactionwas observed.
As expected, the digestible protein intake was higher in dogs fed diets 5 and 6than in diets 1 to 4 (table 5). The digestible protein intake of dogs fed diet 6 washigher than that observed in dogs fed diet5 because the level of protein in diet 6 andthe digestibility of that protein was slightlyhigher than observed in diet 5. Within thethree commercial-type diets, digestibleprotein intake was less, reflecting thelower protein concentration, in dogs con-
DIETARY FACTORS, GROWTH AND BODY COMPOSITION OF DOGS 1457
TABLE 5Food intake and food efficiency in dogs fed various diets1
FoodintakeDigestible
energyDiet0-16
weeks17-32weeks/,
000kcal1
23
4567sAOV95
±5'°104±6«101±7«102±7°99
±3«119±4°122
±6"117±4°123±7«D.
T.104±
6«I22±10»I10± 9°92±14°109±
114±lili
118±DXT6«
S"6"5°Digestible
protein0-1
6 weeks17-32weeks100
g49±3°41
±2»5 3 ±4°53±3°72
±2«109±4^90
±4'«D,
T.54
±43±57±54±3«
7«4«80
± 4°113Ü21"153±
115±DXT3.CFood
efficiencyEnergy
efficiency0-16
weeks17-32weeksgain
in gII. 000 kcalDE58±2»
58 ±2°63 ±2«56±3»60
±2°56±2»53
±2°*60 ±1«47 ±3'D.
T,14±1°
19 ±2»»23 ±3°'23±1*20
±2«13±1°21
±2°24 ±3°
17±2-DXTProtein
efficiency0-1
6 weeks17-32weeksgain
in g/ 100 gDP111±3«
148±4»m±.ì"108±4°82
±1°110±3°c
68±1'B64 ±3»«D.
T26±1°
46 ±3'43±4'27±1°43±3°c
24±1'*24-tiki,
DXT
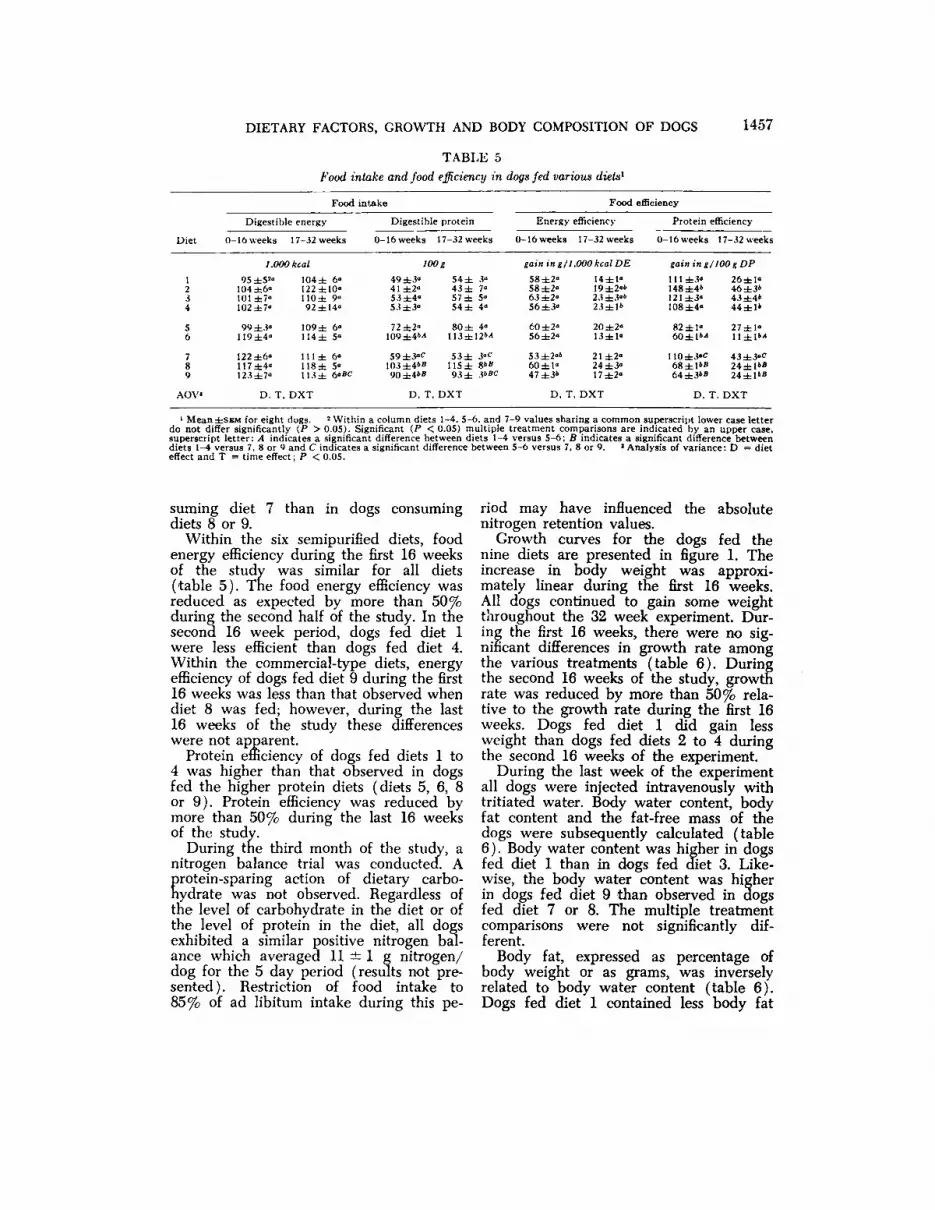
1MeaniSEM for eight dogs. 2Within a column diets 1-4. 5-6. and 7-9 values sharing a common superscript lower case letterdo not differ significantly (P > 0.05). Significant (P < 0.05) multiple treatment comparisons are indicated by an upper case,superscript letter: A indicates a significant difference between diets 1-4 versus 5-6; B indicates a significant difference betweendiets 1-4 versus 7. 8 or 9 and C indicates a significant difference between 5-6 versus 7, 8 or 9. " Analysis of variance: D = dieteffect and T = time effect; P < 0.05.
suming diet 7 than in dogs consumingdiets 8 or 9.
Within the six semipurified diets, foodenergy efficiency during the first 16 weeksof the study was similar for all diets(table 5). The food energy efficiency wasreduced as expected by more than 50%during the second half of the study. In thesecond 16 week period, dogs fed diet 1were less efficient than dogs fed diet 4.Within the commercial-type diets, energyefficiency of dogs fed diet 9 during the first16 weeks was less than that observed whendiet 8 was fed; however, during the last16 weeks of the study these differenceswere not apparent.
Protein efficiency of dogs fed diets 1 to4 was higher than that observed in dogsfed the higher protein diets (diets 5, 6, 8or 9). Protein efficiency was reduced bymore than 50% during the last 16 weeksof the study.
During the third month of the study, anitrogen balance trial was conducted. AErotein-sparing action of dietary carbo-
ydrate was not observed. Regardless ofthe level of carbohydrate in the diet or ofthe level of protein in the diet, all dogsexhibited a similar positive nitrogen balance which averaged 11 ±l g nitrogen/dog for the 5 day period (results not presented). Restriction of food intake to85% of ad libitum intake during this pe
riod may have influenced the absolutenitrogen retention values.
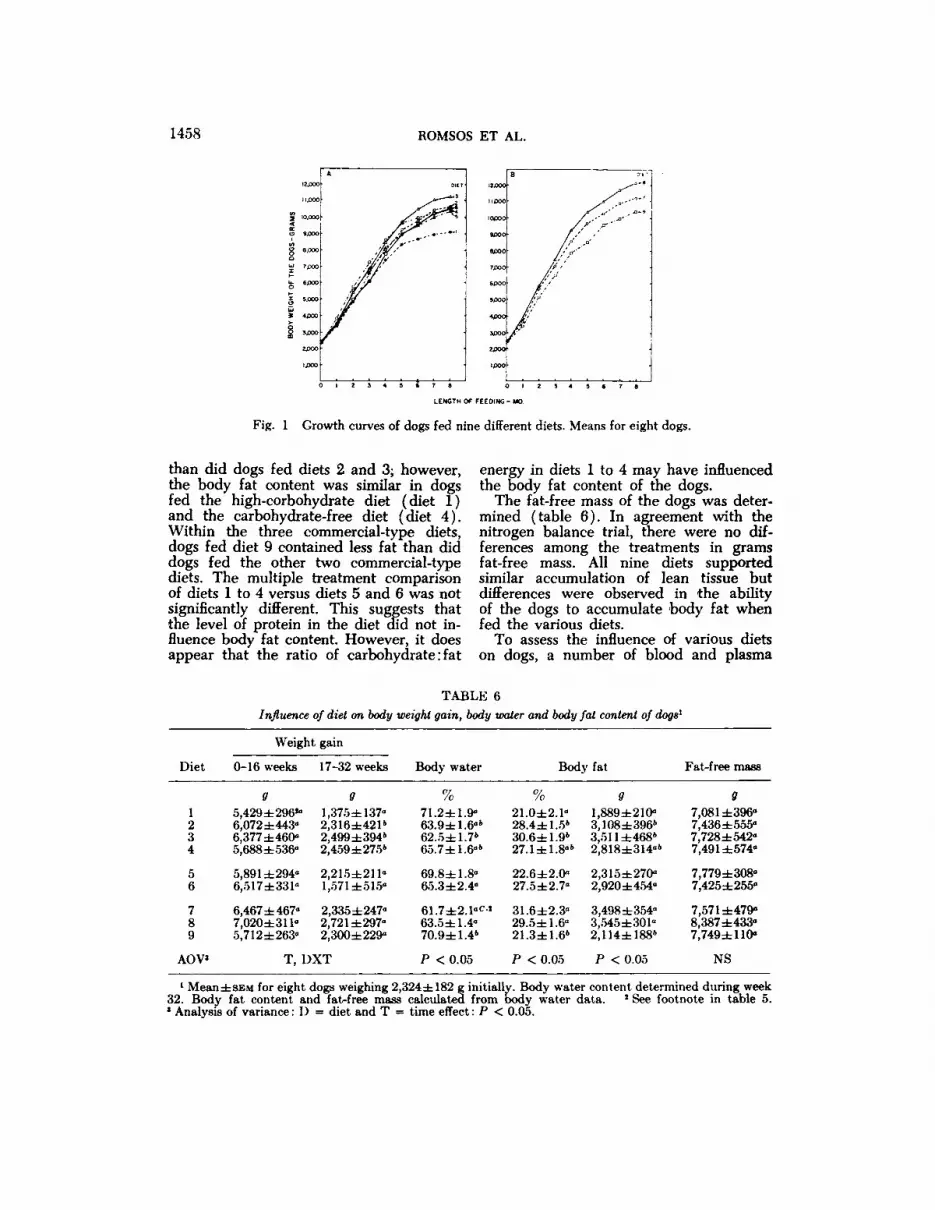
Growth curves for the dogs fed thenine diets are presented in figure 1. Theincrease in body weight was approximately linear during the first 16 weeks.All dogs continued to gain some weightthroughout the 32 week experiment. During the first 16 weeks, there were no significant differences in growth rate amongthe various treatments (table 6). Duringthe second 16 weeks of the study, growthrate was reduced by more than 50% relative to the growth rate during the first 16weeks. Dogs fed diet 1 did gain lessweight than dogs fed diets 2 to 4 duringthe second 16 weeks of the experiment.
During the last week of the experimentall dogs were injected intravenously withtritiated water. Body water content, bodyfat content and the fat-free mass of thedogs were subsequently calculated (table6 ). Body water content was higher in dogsfed diet 1 than in dogs fed diet 3. Likewise, the body water content was higherin dogs fed diet 9 than observed in dogsfed diet 7 or 8. The multiple treatmentcomparisons were not significantly different.
Body fat, expressed as percentage ofbody weight or as grams, was inverselyrelated to body water content (table 6).Dogs fed diet 1 contained less body fat
1458 ROMSOS ET AL.
12000
£00
10.000
9.000
8000
fix»
ÃŽ.OOO
8JXJO
R000
MX»
4.COO
3POO
LENGTH Of FEEDING-MO
Fig. l Growth curves of dogs fed nine different diets. Means for eight dogs.
than did dogs fed diets 2 and 3; however,the body fat content was similar in dogsfed the high-corbohydrate diet (diet 1)and the carbohydrate-free diet (diet 4).Within the three commercial-type diets,dogs fed diet 9 contained less fat than diddogs fed the other two commercial-typediets. The multiple treatment comparisonof diets 1 to 4 versus diets 5 and 6 was notsignificantly different. This suggests thatthe level of protein in the diet did not influence body fat content. However, it doesappear that the ratio of carbohydrate :fat
energy in diets 1 to 4 may have influencedthe body fat content of the dogs.
The fat-free mass of the dogs was determined (table 6). In agreement with thenitrogen balance trial, there were no differences among the treatments in gramsfat-free mass. All nine diets supportedsimilar accumulation of lean tissue butdifferences were observed in the abilityof the dogs to accumulate body fat whenfed the various diets.
To assess the influence of various dietson dogs, a number of blood and plasma
TABLE 6Influence of diet on body weight gain, body water and body fat content of dogs1
WeightgainDiet1
2345
67
80AOV0-16
weeksg5,429
±296""6,072±443°6,377 ±460«5,688±536°5,891
±294«6,517±331°6,467
±467"7,020±311«5,712±263°17-32
weeksg1,
375 ±137«2,316±42162,499±39462,459±275»2,215±211«
1,571±515"2,335
±247«2,721 ±297"
2,300±229°T,
DXTBody
water%71.2±1.9°
63.9±1.6°k62.5±1.7b65.7±1.6°»69.8±1.8°
65.3±2.4"61.7±2.1°c-s
63.5±1.4"70.9±1.4kP
< 0.05Body%21.0±2.1"
28.4 ±1.5»30.6±1.9i>27.1±1.8«622.6±2.0°
27.5±2.7"31.6±2.3«
29.5±1.6°21.3±1.66P
< 0.05fatg1,889±210«
3,108±396»3,51¡±468*2,818±314°62,315±270«
2,920±454°3,498
±354°3,545±301«2,114±1881'P
< 0.05Fat-free
massg7,081
±396°7,436±555°7,728±542»7,491±574«7,779±308°
7,425±255°7,571
±479°8,387±433«7,749±110°N8
1Mean±SEMfor eight dogs weighing 2,324±182g initially. Body water content determined during week32. Body fat content and fat^free mass calculated from body water data. *See footnote in table 5.3Analysis of variance : D = diet and T = time effect : P < 0.05.
DIETARY FACTORS, GROWTH AND BODY COMPOSITION OF DOGS 1459
LENGTH OF FEEDING - MO
"! t 34 5 « i
LENGTH OF FEEDING - MO
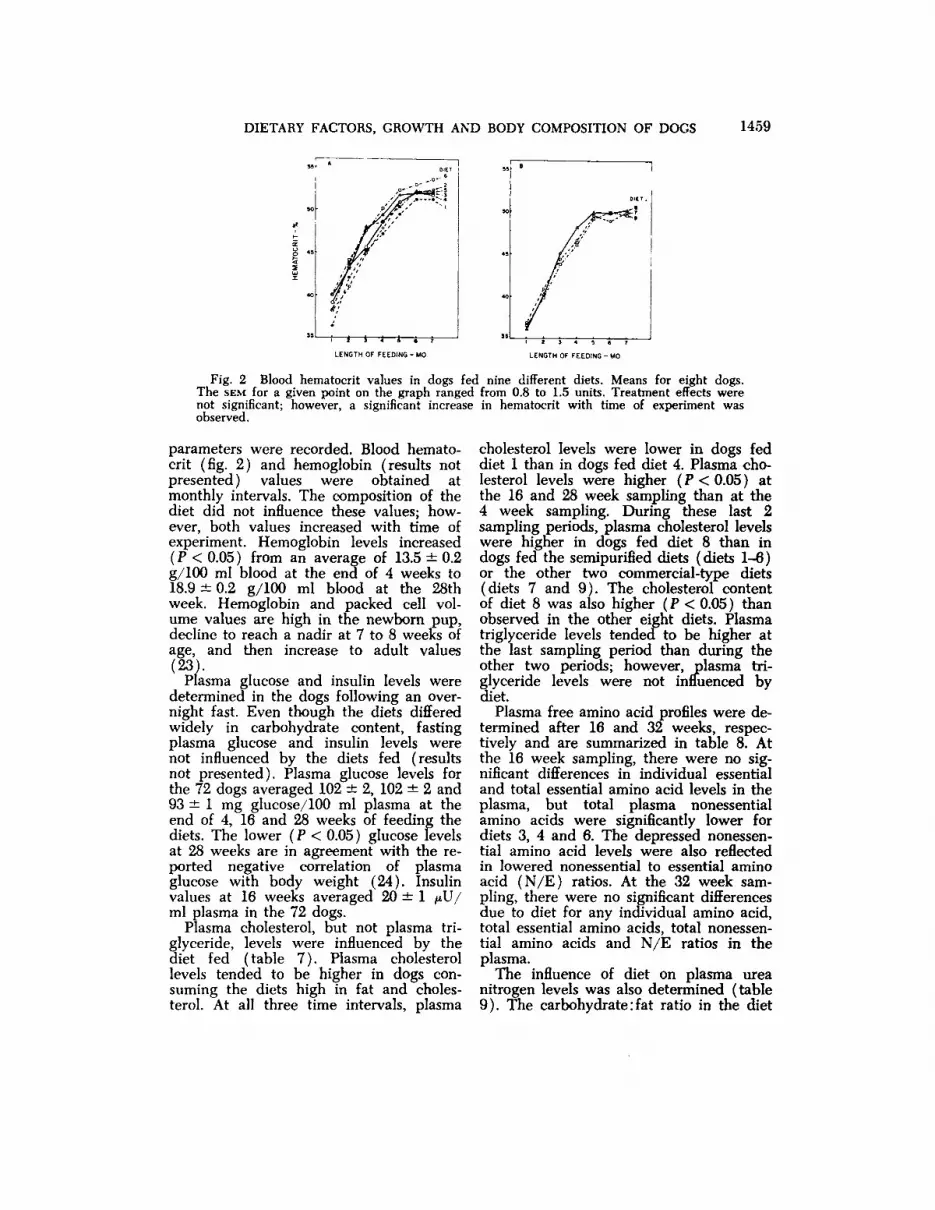
Fig. 2 Blood hematocrit values in dogs fed nine different diets. Means for eight dogs.The SEM for a given point on the graph ranged from 0.8 to 1.5 units. Treatment effects werenot significant; however, a significant increase in hematocrit with time of experiment wasobserved.
parameters were recorded. Blood hematocrit (fig. 2) and hemoglobin (results notpresented) values were obtained atmonthly intervals. The composition of thediet did not influence these values; however, both values increased with time ofexperiment. Hemoglobin levels increased(P < 0.05) from an average of 13.5 ±0.2g/100 ml blood at the end of 4 weeks to18.9 ±0.2 g/100 ml blood at the 28thweek. Hemoglobin and packed cell volume values are high in the newborn pup,decline to reach a nadir at 7 to 8 weeks ofage, and then increase to adult values(23).
Plasma glucose and insulin levels weredetermined in the dogs following an overnight fast. Even though the diets differedwidely in carbohydrate content, fastingplasma glucose and insulin levels werenot influenced by the diets fed (resultsnot presented). Plasma glucose levels forthe 72 dogs averaged 102 ±2, 102 ±2 and93 ±1 mg glucose/100 ml plasma at theend of 4, 16 and 28 weeks of feeding thediets. The lower ( P < 0.05 ) glucose levelsat 28 weeks are in agreement with the reported negative correlation of plasmaglucose with body weight (24). Insulinvalues at 16 weeks averaged 20 ±1 /xU/ml plasma in the 72 dogs.
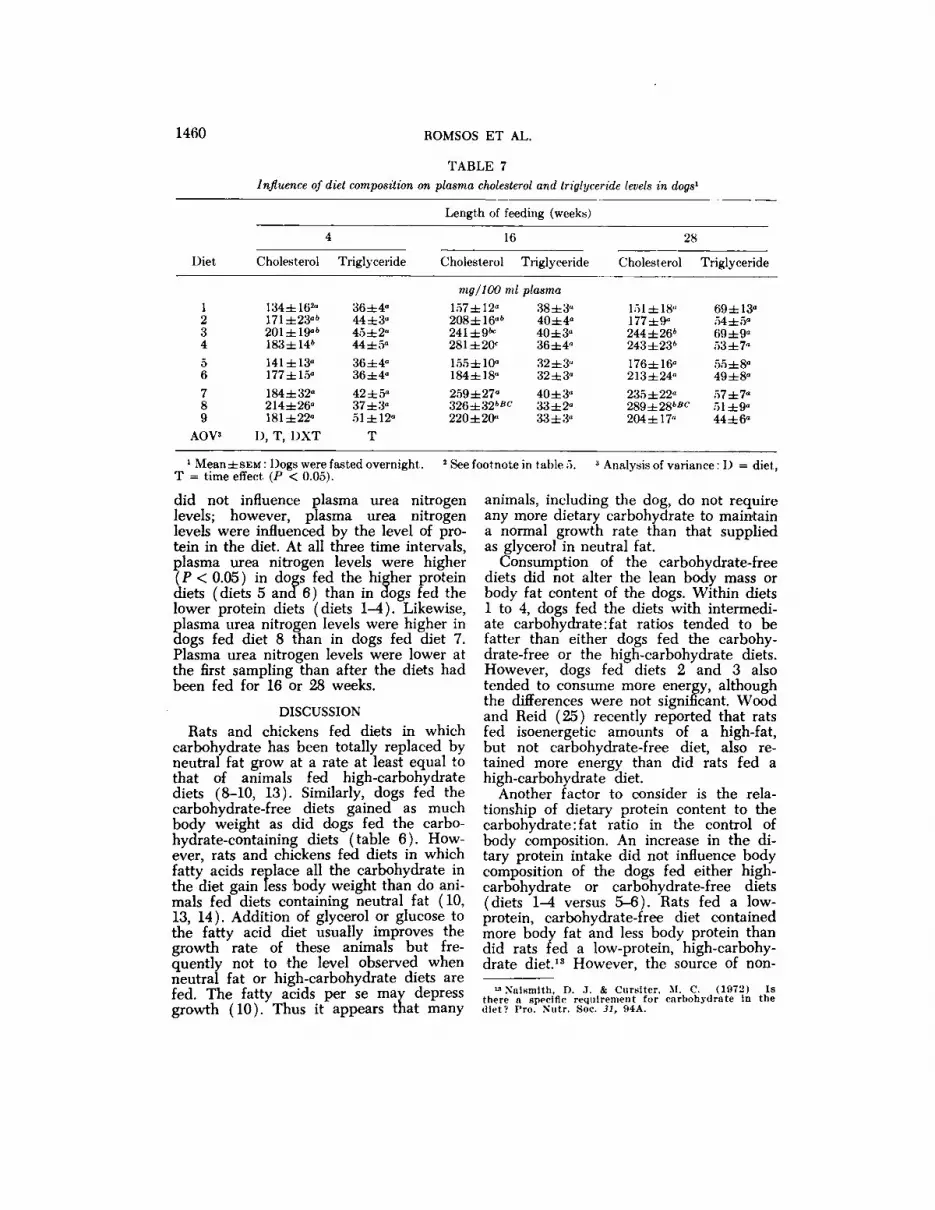
Plasma cholesterol, but not plasma triglycéride,levels were influenced by thediet fed (table 7). Plasma cholesterollevels tended to be higher in dogs consuming the diets high in fat and cholesterol. At all three time intervals, plasma
cholesterol levels were lower in dogs feddiet 1 than in dogs fed diet 4. Plasma cholesterol levels were higher (P < 0.05) atthe 16 and 28 week sampling than at the4 week sampling. During these last 2sampling periods, plasma cholesterol levelswere higher in dogs fed diet 8 than indogs fed the semipurified diets (diets 1-6)or the other two commercial-type diets(diets 7 and 9). The cholesterol contentof diet 8 was also higher (P < 0.05) thanobserved in the other eight diets. Plasmatriglycéridelevels tended to be higher atthe last sampling period than during theother two periods; however, plasma triglycéridelevels were not influenced bydiet.
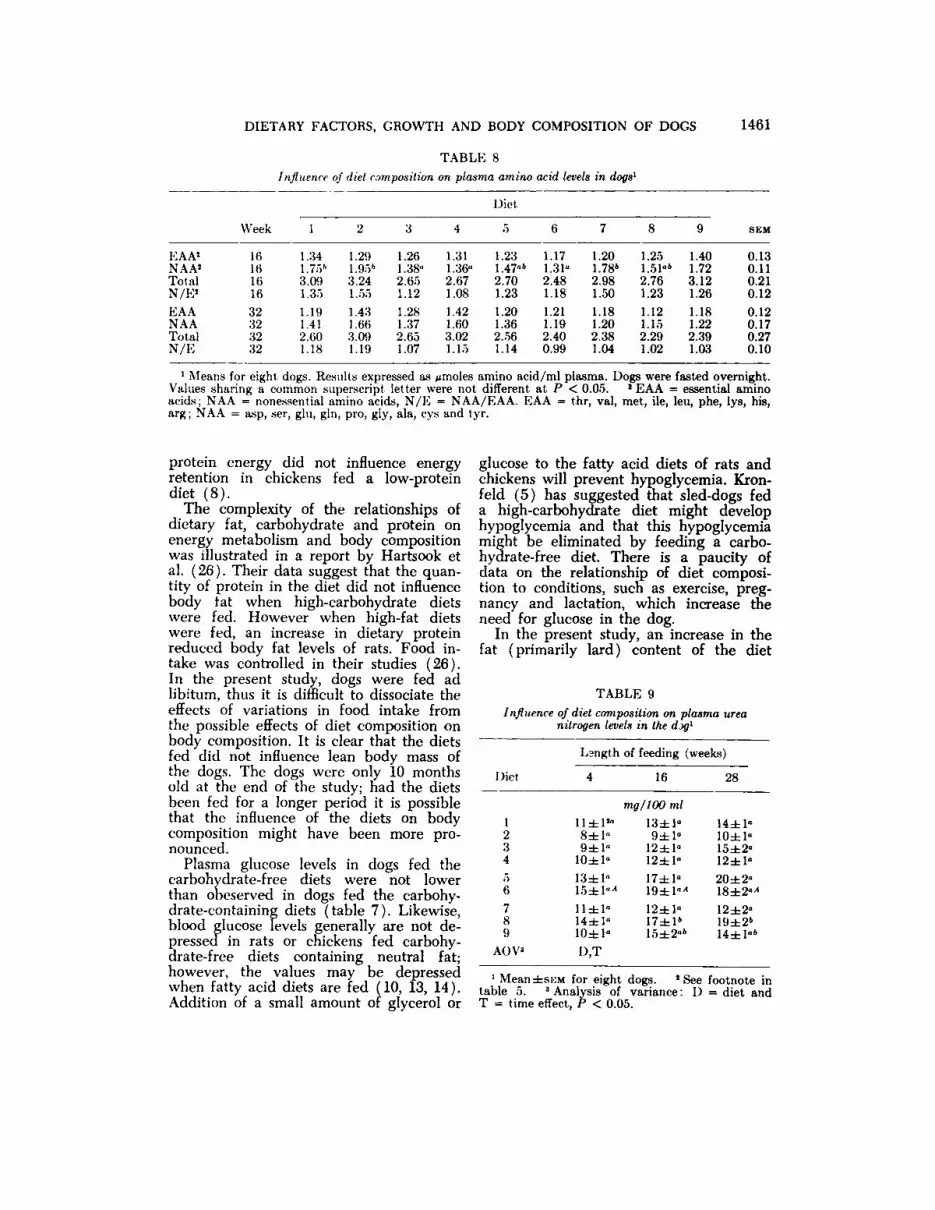
Plasma free amino acid profiles were determined after 16 and 32 weeks, respectively and are summarized in table 8. Atthe 16 week sampling, there were no significant differences in individual essentialand total essential amino acid levels in theplasma, but total plasma nonessentialamino acids were significantly lower fordiets 3, 4 and 6. The depressed nonessential amino acid levels were also reflectedin lowered nonessential to essential aminoacid (N/E) ratios. At the 32 week sampling, there were no significant differencesdue to diet for any individual amino acid,total essential amino acids, total nonessential amino acids and N/E ratios in theplasma.
The influence of diet on plasma ureanitrogen levels was also determined (table9). The carbohydrate :fat ratio in the diet
1460 ROMSOS ET AL.
TABLE 7Influence of diet composition on plasma cholesterol and triglycéridelevels in dogs1
Length of feeding (weeks)
lit 28
Diet Cholesterol Triglycéride Cholesterol Triglycéride Cholesterol Triglycéride
12
3457
89AOV3134±162»
171±23°6201±19°6183±14'141
±13°177±15«184±32°
214±26°181±22«I),
T, DXT36
±4«44 ±3"45 ±2°44±5"36
±4"36±4«42
±5»37 ±3«51 ±12»Tmg
/l 00ml157±12°
208±16°'241±9<«281±20'155±10"
184±18°259±27°
220±20°plasma38
±3°40±4"40±3"36±4"32
±3"32±3«40±3°
33±2°33±3«151
±18°177±9°
244±266243±23fc176±16°
213±24«235±22«
289±286BC204±17"69±13°
54±5°69±9°53±7«55
±8°49±8°57±7°
51±9"44±6°
1Mean±SEM: Dogs were fasted overnight.T = time effect (P < 0.05).
2See footnote in table 5. 3Analysis of variance : D = diet,
did not influence plasma urea nitrogenlevels; however, plasma urea nitrogenlevels were influenced by the level of protein in the diet. At all three time intervals,plasma urea nitrogen levels were higher( P < 0.05 ) in dogs fed the higher proteindiets (diets 5 and 6) than in dogs fed thelower protein diets (diets 1-4). Likewise,plasma urea nitrogen levels were higher indogs fed diet 8 than in dogs fed diet 7.Plasma urea nitrogen levels were lower atthe first sampling than after the diets hadbeen fed for 16 or 28 weeks.
DISCUSSIONRats and chickens fed diets in which
carbohydrate has been totally replaced byneutral fat grow at a rate at least equal tothat of animals fed high-carbohydratediets (8-10, 13). Similarly, dogs fed thecarbohydrate-free diets gained as muchbody weight as did dogs fed the carbohydrate-containing diets (table 6). However, rats and chickens fed diets in whichfatty acids replace all the carbohydrate inthe diet gain less body weight than do animals fed diets containing neutral fat (10,13, 14). Addition of glycerol or glucose tothe fatty acid diet usually improves thegrowth rate of these animals but frequently not to the level observed whenneutral fat or high-carbohydrate diets arefed. The fatty acids per se may depressgrowth (10). Thus it appears that many
animals, including the dog, do not requireany more dietary carbohydrate to maintaina normal growth rate than that suppliedas glycerol in neutral fat.
Consumption of the carbohydrate-freediets did not alter the lean body mass orbody fat content of the dogs. Within diets1 to 4, dogs fed the diets with intermediate carbohydrate :fat ratios tended to befatter than either dogs fed the carbohydrate-free or the high-carbohydrate diets.However, dogs fed diets 2 and 3 alsotended to consume more energy, althoughthe differences were not significant. Woodand Reid (25) recently reported that ratsfed isoenergetic amounts of a high-fat,but not carbohydrate-free diet, also retained more energy than did rats fed ahigh-carbohydrate diet.
Another factor to consider is the relationship of dietary protein content to thecarbohydrate :fat ratio in the control ofbody composition. An increase in the di-tary protein intake did not influence bodycomposition of the dogs fed either high-carbohydrate or carbohydrate-free diets(diets 1-4 versus 5-6). Rats fed a low-protein, carbohydrate-free diet containedmore body fat and less body protein thandid rats fed a low-protein, high-carbohydrate diet.13 However, the source of non-
"Naismith, D. J. & Cursiter, M. C. (1972) Isthere a specific requirement for carbohydrate in thediet? Pro. Nutr. Soc. 31, 94A.
DIETARY FACTORS, GROWTH AND BODY COMPOSITION OF DOGS 1461
TABLE 8influence of diet composition on plasma amino acid levels in dogs'
Diet
\\>ck
EAA1NAA'TotalN/E'EAANAATotalN/E161(11616323232321.341.75»3.091.351.191.412.601.181.291.95*3.241.551.431
.663.091.191.261.38»2.651.121.281.372.651.071.311.36«2.671.081.421.603.021.151.231.47'-k2.701.231.201.362.561.141.171.31«2.481.181.211.192.400.991.201.78*2.981.501.181.202.381.041.251.51«'2.761.231.121.152.291.021.401.723.121.261.181.222.391.030.130.110.210.120.120.170.270.10
1Means for eight dogs. Results expressed as Amólesamino acid/ml plasma. Dogs were fasted overnight.Values sharing a common superscript letter were not different at P < 0.05. ' EAA = essential aminoacids; NAA = nonessential amino acids, N/E = NAA/EAA. EAA = thr, val, met, ile, leu, phe, lys, his,arg ; NAA = asp, ser, glu, gin, pro, gly, ala, cys and tyr.
protein energy did not influence energyretention in chickens fed a low-proteindiet (8).
The complexity of the relationships ofdietary fat, carbohydrate and protein onenergy metabolism and body compositionwas illustrated in a report by Hartsook etal. (26). Their data suggest that the quantity of protein in the diet did not influencebody fat when high-carbohydrate dietswere fed. However when high-fat dietswere fed, an increase in dietary proteinreduced body fat levels of rats. Food intake was controlled in their studies (26).In the present study, dogs were fed adlibitum, thus it is difficult to dissociate theeffects of variations in food intake fromthe possible effects of diet composition onbody composition. It is clear that the dietsfed did not influence lean body mass ofthe dogs. The dogs were only 10 monthsold at the end of the study; had the dietsbeen fed for a longer period it is possiblethat the influence of the diets on bodycomposition might have been more pronounced.
Plasma glucose levels in dogs fed thecarbohydrate-free diets were not lowerthan obeserved in dogs fed the carbohydrate-containing diets (table 7). Likewise,blood glucose levels generally are not depressed in rats or chickens fed carbohydrate-free diets containing neutral fat;however, the values may be depressedwhen fatty acid diets are fed (10, 13, 14).Addition of a small amount of glycerol or
glucose to the fatty acid diets of rats andchickens will prevent hypoglycemia. Kronfeld (5) has suggested that sled-dogs feda high-carbohydrate diet might develophypoglycemia and that this hypoglycemiamight be eliminated by feeding a carbohydrate-free diet. There is a paucity ofdata on the relationship of diet composition to conditions, such as exercise, pregnancy and lactation, which increase theneed for glucose in the dog.
In the present study, an increase in thefat (primarily lard) content of the diet
TABLE 9
Influence of diet composition on plasma ureanitrogen levels in the d.*/1
Lsngth of feeding (weeks)
Diet 16 2S
mg/100ml123456789AOV1llil2"8±1"9±1»10±1"13±1°15±1'"<11±1"14±1"10±1"D,T13±1«9±1«12±1«12±1°17±1°19Ü«-412±1°17±1»15±2«*14±1°lOztl"15±2°12±1°20
±2«^±2°^12±2°19±2»14Ì1"»
1Mean±SKM for eight dogs. 'See footnote intable 5. 3Analysis of variance : D = diet andT = time effect, P < 0.05.

1462 ROMSOS ET AL.
resulted in a corresponding increase incholesterol intake and an increase in postprandial plasma cholesterol levels. Others(27, 28) have reported that coconut oil,sunflower oil and olive oil, which are cholesterol-free, increase plasma cholesterollevels in dogs above the values observedwhen a low-fat diet was fed. Frigge andGrande (28) have suggested that elevations in plasma free fatty acid levels observed when high-fat diets are fed may bepart of the mechanism whereby high-fatdiets elevate serum cholesterol levels indogs.
Plasma triglycéride levels in the dogswere not influenced by the level of carbohydrate in the diet. When sucrose wasreplaced with coconut oil in the diet ofdogs, changes in plasma triglycéridelevelswere not observed (27). However, replacement of sucrose with protein diddepress plasma triglycérides.In the present study, plasma triglycéridelevels tendedto be lower in dogs fed the high-proteindiets (diets 5-6) than in dogs fed diets1 to 4 but the differences were not significant.
Nitrogen metabolism was not adverselyinfluenced by the source of nonproteinenergy. Neither nitrogen balance nor leanbody mass of the dogs changed whencarbohydrate-free or high-carbohydratediets were fed. Further, plasma urea nitrogen levels were also unchanged as thesource of nonprotein energy was varied.Others have reported that the source ofnonprotein energy may influence nitrogenmetabolism; however, their animals werealso switched from high-carbohydrate tohigh-fat diets (29). Alterations of nitrogenmetabolism in animals during a metabolictransition period might not be apparent inanimals fully adapted to a diet.
Plasma amino acid profiles were alsodetermined to assess any potential negative effect of the various diets on nitrogenmetabolism and to assess the effect ofhigh-carbohydrate or high-fat diets onplasma amino acids in the dog. The plasmafree amino acid results did not indicateany qualitative diversity among the dietsor any major dietary limitation in any essential amino acid. This should not be surprising as the protein portion of all ninediets was formulated to meet or exceed
the requirements of these dogs. The actualobserved amino acid concentrations weresimilar to those observed previously indogs fed beef protein (30, 31).
Circulating nonessential amino acidlevels were depressed at the first samplingin dogs fed diets containing no carbohydrate ( diets 4, 6 ) or a small amount of carbohydrate (diet 3). In studies on protein-energy deficiency in dogs fed low and highprotein diets with either carbohydrate orfat as the major dietary energy source,Heard et al. (32) observed that the dogsfed the diets of higher fat content hadlower N/E ratios than dogs fed the high-carbohydrate diets. This depressing effectof dietary fat on plasma N/E ratios wasseen in both high protein and low proteindiets, but was more pronounced in thelow protein diets. Heard et al. (32) reasoned that carbohydrates could supplycarbon skeletons (precursors) for non-essential amino acids, not supplied by fats,to explain their results.
These results on the influence of thenonprotein energy source on nitrogenmetabolism are in agreement with otherreports. Renner noted that the protein requirement of chicks fed carbohydrate-free diets was no greater than when thediet contained carbohydrate (8). Morerecently, she reported that the chickens requirement for an essential amino acid,methionine, was also unchanged when fatwas substituted for glucose in the diet(33). Refeeding either fat or carbohydrateto fasted rats caused an increased incorporation of phenylalanine into liver andmuscle proteins of rats presumably by increasing the reutilization of endogenousamino acids (34). Nakano and Ashida(35) have also shown that rats prefed adiet containing fat as the nonproteinenergy excreted less urinary nitrogen whenswitched to a high-protein diet than didrats prefed a high-carbohydrate diet.These results suggest that in some situations fat may nave a greater protein-sparing action than carbohydrate. Obviously the results obtained depend on theexperimental protocol. Short-term transitory effects may be evident when animalsare suddenly switched from one diet toanother but may not be evident in animalsfully-adapted to their respective diets. It
DIETARY FACTORS, GROWTH AND BODY COMPOSITION OF DOGS 14Ü3
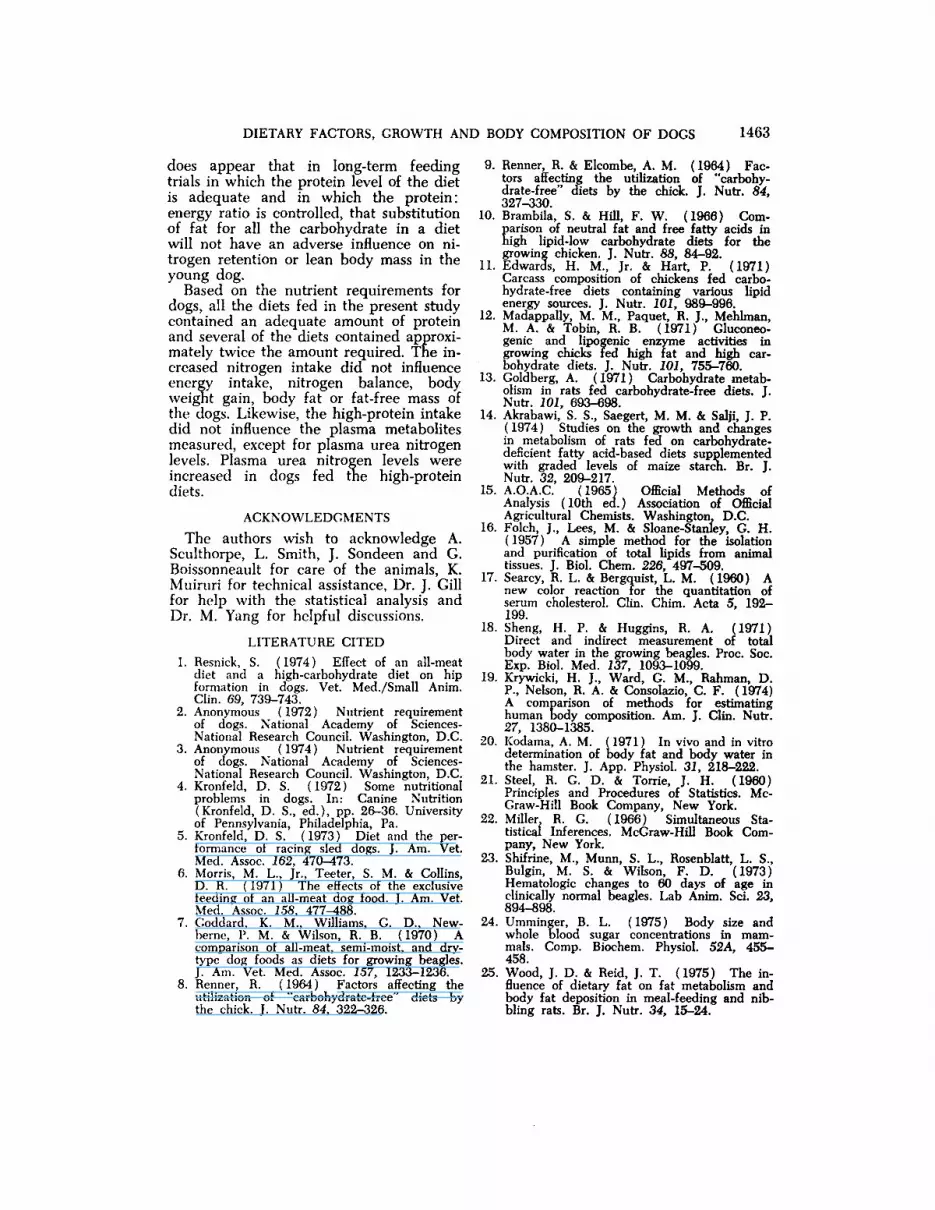
docs appear that in long-term feedingtrials in which the protein level of the dietis adequate and in which the protein:energy ratio is controlled, that substitutionof fat for all the carbohydrate in a dietwill not have an adverse influence on nitrogen retention or lean body mass in theyoung dog.
Based on the nutrient requirements fordogs, all the diets fed in the present studycontained an adequate amount of proteinand several of the diets contained approximately twice the amount required. The increased nitrogen intake did not influenceenergy intake, nitrogen balance, bodyweight gain, body fat or fat-free mass ofthe dogs. Likewise, the high-protein intakedid not influence the plasma metabolitesmeasured, except for plasma urea nitrogenlevels. Plasma urea nitrogen levels wereincreased in dogs fed the high-proteindiets.
ACKNOWLEDGMENTS
The authors wish to acknowledge A.Sculthorpe, L. Smith, J. Sondeen and G.Boissonneault for care of the animals, K.Muiruri for technical assistance, Dr. J. Gillfor help with the statistical analysis andDr. M. Yang for helpful discussions.
LITERATURE CITED1. Resnick, S. (1974) Effect of an all-meat
diet and a high-carbohydrate diet on hipformation in dogs. Vet. Med./Small Anim.Clin. 69, 739-743.
2. Anonymous ( 1972 ) Nutrient requirementof dogs. National Academy of Sciences-National Research Council. Washington, D.C.
3. Anonymous ( 1974 ) Nutrient requirementof dogs. National Academy of Sciences-National Research Council. Washington, D.C.
4. Kronfeld, D. S. (1972) Some nutritionalproblems in dogs. In: Canine Nutrition(Kronfeld, D. S., ed.), pp. 26-36. Universityof Pennsylvania, Philadelphia, Pa.
5. Kronfeld, D. S. (1973) Diet and the performance of racing sled dogs. J. Am. Vet.Med. Assoc. 162, 470-473.
6. Morris, M. L., Jr., Teeter, S. M. & Collins,D. R. ( 1971 ) The effects of the exclusivefeeding of an all-meat dog food. J. Am. Vet.Med. Assoc. 158, 477-488.
7. Goddard, K. M., Williams, G. D., New-berne, P. M. & Wilson, R. B. (1970) Acomparison of all-meat, semi-moist, and dry-type dog foods as diets for growing beagles.J. Am. Vet. Med. Assoc. 157, 1233-1236.
8. Renner, R. (1964) Factors affecting theutilization of "carbohydrate-free" diets bythe chick. J. Nutr. 84, 322-326.
9. Renner, R. & Elcombe, A. M. (1964) Factors affecting the utilization of "carbohydrate-free" diets by the chick. J. Nutr. 84,327-330.
10. Brambila, S. & Hill, F. W. (1966) Comparison of neutral fat and free fatty acids innigh lipid-low carbohydrate diets for thegrowing chicken. J. Nutr. 88, 84-92.
11. Edwards, H. M., Jr. & Hart, P. (1971)Carcass composition of chickens fed carbohydrate-free diets containing various lipidenergy sources. J. Nutr. 101, 989-996.
12. Madappally, M. M., Paquet, R. J., Mehlman,M. A. & Tobin, R. B. (1971) Gluconeo-genic and lipogenic enzyme activities ingrowing chicks fed high fat and high carbohydrate diets. J. Nutr. 101, 755-760.
13. Goldberg, A. (1971) Carbohydrate metabolism in rats fed carbohydrate-free diets. J.Nutr. 101, 693-698.
14. Akrabawi, S. S., Saegert, M. M. & Salji, J. P.( 1974 ) Studies on the growth and changesin metabolism of rats fed on carbohydrate-deficient fatty acid-based diets supplementedwith graded levels of maize starch. Br. J.Nutr. 32, 209-217.
15. A.O.A.C. (1965) Official Methods ofAnalysis ( 10th ed. ) Association of OfficialAgricultural Chemists. Washington, D.C.
16. Folch, J., Lees, M. & Sloane-Stanley, G. H.(1957) A simple method for the isolationand purification of total lipids from animaltissues. J. Biol. Chem. 226, 497-509.
17. Searcy, R. L. & Bergquist, L. M. (1960) Anew color reaction for the quantitation ofserum cholesterol. Clin. Chim. Acta 5, 192-199.
18. Sheng, H. P. & Huggins, R. A. (1971)Direct and indirect measurement of totalbody water in the growing beagles. Proc. Soc.Exp. Biol. Med. 137, 1093-1099.
19. Krywicki, H. J., Ward, G. M., Rahman, D.P., Nelson, R. A. & Consolazio, C. F. ( 1974)A comparison of methods for estimatinghuman body composition. Am. J. Clin. Nutr.27, 1380-1385.
20. Kodama, A. M. (1971) In vivo and in vitrodetermination of body fat and body water inthe hamster. J. App. Physiol. 31, 218-222.
21. Steel, R. G. D. & Torrie, J. H. (1960)Principles and Procedures of Statistics. McGraw-Hill Book Company, New York.
22. Miller, R. G. (1966) Simultaneous Statistical Inferences. McGraw-Hill Book Company, New York.
23. Shifrine, M., Munn, S. L., Rosenblatt, L. S.,Bulgin, M. S. & Wilson, F. D. (1973)Hématologie changes to 60 days of age inclinically normal beagles. Lab Anim. Sci. 23,894-898.
24. Umminger, B. L. (1975) Body size andwhole blood sugar concentrations in mammals. Comp. Biochem. Physiol. 52A, 455-458
25. Wood, J. D. & Reid, J. T. (1975) The influence of dietary fat on fat metabolism andbody fat deposition in meal-feeding and nibbling rats. Br. J. Nutr. 34, 15-24.
14IÌ4 ROMSOS ET AL.
26. Hartsook, E. W., Hershberger, T. V. & Nee,J. C. M. (1973) Effects of dietary proteincontent and ratio of fat to carbohydratecalories on energy metabolism and body composition of growing rats. J. Nutr. 103, 167-178.
27. Grande, F. & Frigge, W. F. (1974) Serumlipid changes produced in dogs by substituting coconut oil for either sucrose or proteinin the diet. J. Nutr. 104, 613-618.
28. Frigge, W. F. & Grande, F. (1973) Effectsof dietary fat and of a hpolytic agent on postprandial free fatty acids and fasting serumlipids in the dog. J. Nutr. 103, 1200-1207.
29. Munro, H. N. (1951) Carbohydrate andfat as factors in protein utilization and metabolism. Physiol. Rev. 31, 449-488.
30. Ganapathy, S. N. & Nasset, E. S. (1962)Free amino acids in dog blood and gutcontents after feeding meat. J. Nutr. 78, 241-244.
31. Elwyn, D. H. (1968) Modification ofplasma amino acid patterns by the liver. In:Protein Nutrition and Free Amino Acid Patterns (Leathern, J. H., ed.), Rutgers University Press, New Brunswick, N.J.
32. Heard, C. R. C., Kriegsman, S. M. & Platt,B. S. (1969) The interpretation of plasmaamino acid ratios in protein-calorie deficiency. Br. J. Nutr. 23, 203-210.
33. Looi, S. H. & Renner, R. (1974) Effect offeeding "carbohydrate-free" diets on thechick's requirement for methionine. J. Nutr.104, 400-404.
34. Nakano, K., Ando, T. & Ashida, K. (1974)Effect of feeding carbohydrate or fat on incorporation of "C-phenylalanine in vivo andin vitro into rat liver and muscle protein. J.Nutr. 104, 264-271.
35. Nakano, K. & Ashida, K. (1975) Role ofsome hormones in protein sparing action ofdietary fat. Agr. Biol. Chem. 39, 1233-1238.