mitral annular systolic velocities predict left ventricular wall motion abnormality during...
TRANSCRIPT

Original Article Cardiol Res • 2011;2(1):16-26
ressElmer
Articles © The authors | Journal compilation © Cardiol Res and Elmer Press™ | www.cardiologyres.org
Mitral Annular Systolic Velocities Predict Left Ventricular Wall Motion Abnormality During Dobutamine
Stress Echocardiography Dawod Sharifa, b, c, Amal Sharif-Rasslanb, Camilia Shahlaa
Abstract
Background: Longitudinal systolic left ventricular contraction is complementary to the radial performance and can be assessed using tissue Doppler imaging (TDI). This study was performed to evalu-ate the contribution of mitral annular systolic velocities using TDI after dobutamine stress echocardiography (DSE).
Methods and Results: Fifty subjects with suspected coronary ar-tery disease and chest pain were examined, using DSE as usual, as well as TDI imaging of the mitral annulus at the septal, lateral, infe-rior, anterior, posterior regions and the proximal anteroseptal region from the apical views, before and immediately after DSE. In 24 subjects the study was normal, while wall motion abnormality was seen in 26, 9 of them only after DSE. Mitral annular systolic veloc-ity at the 6 locations increased significantly after DSE both in nor-mal subjects and in those with wall motion abnormality (WMA). After DSE mitral annular septal systolic velocity in normals, 19.2 ± 3.8 cm/sec, was higher than in those with WMA, 14.6 ± 2.5 cm/sec, P < 0.0003. Post-DSE mitral systolic velocity was senstive and accurate in predicting WMA.
Conclusions: Systolic mitral TDI velocities increase after DSE, however to a lesser extent in those with wall motion abnormality, and can differentiate them from normal subjects.
Keywords: Stress echocardiogrpahy; Dobutamine; Tissue Doppler imaging; Ischemia; Coronary artery disease
Introduction
Dobutamine stress echocardiography is an established method for the assessment of coronary artery disease with a sensitivity and specificity of 80% - 85% [1, 2], comparable to those of radio-isotopic myocardial perfusion studies. The major limitations of dobutamine stress echocardiography are lack of suitable acoustic window [3], suboptimal delineation of the endocardial border necessitating harmonic and con-trast imaging [4-7], the subjective nature of analysis and the lack of uniform diagnostic criteria requiring high level of ex-pertise in wall motion analysis [8-11].
The most important diagnostic element in dobutamine stress echocardiography is segmental systolic performance in the radial direction. However, abnormalities of longitudi-nal systolic performance may precede radial abnormalities and thus their evaluation may enhance the sensitivity of de-tection of contractile abnormalities [12, 13]. Tissue Doppler imaging has been shown to correlate with segmental myo-cardial wall motion [14-16].
Sampling at the mitral valve annulus, tissue Doppler im-aging may reflect longitudinal systolic performance of the left ventricle.
The purpose of this study was to correlate immediate post dobutamine stress echocardiography regional mitral an-nular tissue Doppler imaging indices with regional left ven-tricular wall motion abnormalities during dobutamine stress echocardiography and their contribution to diagnsois.
Methods
Population
Fifty patients, 29 women, age 60.3 ± 13.4 years, were pro-spectively evaluated for the presence of coronary artery dis-ease. All had transthoracic echocardiography before dobu-tamine stress echocardiography. Coronary angiography was performed according to clinical indications taking into con-sideration the dobutamine stress echocardiography (DSE) results.
Manuscript accepted for publication February 21, 2011
aDepartment of Cardiology, Bnai Zion Medical Center, Haifa, IsraelbTechnion - Israel Institute of Technology, Haifa, IsraelcCorresponding author: Dawod Sharif, Department of Cardiology, Bnai Zion Medical Center, 47 Golomb St, Haifa, Israel. Email: [email protected]
doi:10.4021/cr14w
16 17

Cardiol Res • 2011;2(1):16-26Sharif et al
Articles © The authors | Journal compilation © Cardiol Res and Elmer Press™ | www.cardiologyres.org
Dobutamine stress echocardiography
The protocol of dobutamine infusion consisted of 3 minute stages for each dose, staring with 5 μg/kg/min and increasing to 10, 20, 30 and 40 μg/kg/min. If end-points did not occur or 85% of the age adjusted heart rate was not achieved, 0.25 mg atropine was injected every 2 minutes up to 1 mg or until the target heart rate was achieved. Blood pressure and 12 lead electrocardiograms were recorded at rest and throughout the dobutamine stress echocardiography study. Horizontal or down-sloping > 1 mm ST-segment depression at 0.06 sec after the J point was considered as evidence for myocardial ischemia.
Image acquisition
Images were obtained while the patients in the left lateral decubitus position. A standard commercial Hewlett Packard Sonos 5500 echocardiographic machine equipped with S4 transducer and second harmonic imaging as well as color-kinesis was used. Parasternal long axis and short axis as well as apical 4-chamber and 2-chamber views were recorded at rest, low dose dobutamine infusion, peak exercise and in the recovery period. Digital images were stored on magneto-optic discs for later off-line analysis. In addition super VHS videotape recordings were performed throughout the studies.
Dobutamine stress echocardiographic analysis
Segmental left ventricular wall motion analysis was per-formed using 16-segment model [17]. Regional wall motion was estimated as normal, hypokinetic, akinetic or dyskinetic. Analysis of the gray-scale two-dimensional image as well as the color-kinesis overlay was combined in the assessment of regional left ventricular wall motion. New or worsening segmental wall motion was considered as ischemic response. Ischemic response (I) was identified when wall motion de-creased by at least 1 grade in 2 adjacent segments or wall motion decreased by at least 2 grades in 1 segment, other-wise no ischemia, or normal response (N) was diagnosed.
Tissue Doppler imaging
The apical 4 chamber, 2 chamber and 3 chamber views were used to assess the longitudinal velocities of the mitral an-nulus. The sample volume of the pulsed wave Doppler was located at the mitral annulus and recording was performed from the septal, lateral, anterior, inferior and posterior por-tions of the annulus. In addition Doppler sampling from the proximal anteroseptal segment was performed. Annular Doppler velocities were recorded on videotape for off-line analysis. Resting annular longitudinal velocities (S0), and immadiate post- dobutamine stress echocardiography peak
WMSI-Rest WMSI-Stress HR Rest HR Peak
Pt 1.166 ± 0.21 1.34 ± 0.18 62.4 ± 9.88 123.77 ± 14.38
Pt1 1 ± 0 1.33 ± 0.13 62.67 ± 10.79 130 ± 15.96
P value (Pt : Pt1) 0.00053 0.85634 0.950696 0.283587
Pt2 1.19 ± 0.09 1.06 ± 0.88 60 ± 7.07 118 ± 11.31
P value (Pt : Pt2) 0.800539 0.059406 0.7385 0.586514
Pt3 1.58 ± 0.32 1.58 ± 0.32 61.67 ± 15.57 109.33 ± 18.82
P value (Pt : Pt3) 0.154403 0.325027 0.90601 0.120262
Pt4 1.18 ± 0.12 1.34 ± 1.24 62.83 ± 9.33 123.67 ± 10.68
P value (Pt : Pt4) 0.761902 0.913018 0.90437 0.98257
Pt1 + Pt4 1.1 ± 0.13 1.34 ± 0.12 62.76 ± 9.7 126.4 ± 13.23
P value (Pt : Pt1 + Pt4) 0.43 0.113 0.45 0.26
Table 1. Left Ventricular Wall Motion Score Index at Rest and After Stress Echocardiography in Subgroups of Wall Motion Abnormality
Pt: All 26 subjects with WMAPt1: Subjects with WMA only after DSEPt2: Subjects with WMA at rest and improved after DSEPt3: Subjects with WMA at rest and did not changed after DSEPt4: Subjects with WMA at rest and worsened during DSE
16 17

Cardiol Res • 2011;2(1):16-26 Mitral Annular Systolic Velocities in Stress Echo
Articles © The authors | Journal compilation © Cardiol Res and Elmer Press™ | www.cardiologyres.org
Mean ± STD septum lat inf ant post antseptum
Normals
Systolic velocity at rest (cm/sec) 11.1 ± 1.6 13 ± 2.3 12.2 ± 1.8 11.7 ± 2.5 12.4 ± 1.8 10.1 ± 1.3
Systolic velocity after stress (cm/sec)
19.2 ± 3.3 18.7 ± 3.6 17.97 ± 3.8 16.5 ± 4.3 17.95 ± 3 15.8 ± 3.5
N: P value Rest : Stress 4.15E-14 4.92E-08 1.97E-08 1.91E-05 6.06E-10 1.68E-09
WMA(*)
Systolic velocity at rest (cm/sec) 10.7 ± 1.3 12 ± 1.6 11.2 ± 1.6 10.8 ± 1.4 11.1 ± 1.4 9.6 ± 1.3
Systolic velocity after stress (cm/sec)
14.6 ± 2.5 16.7 ± 3.4 15.9 ± 3.2 15.1 ± 4.1 16.4 ± 2.6 14 ± 3.2
WMA: P value Rest : Stress 3.83E-09 4.32E-08 1.6E-08 4.54E-06 4.21E-12 2.39E-08
P value Normal : WMA(*)
Systolic velocity at rest (cm/sec) 0.385106 0.072574 0.034469 0.128962 0.009679 0.203429
Systolic velocity after DSE (cm/sec)
2.25E-6 0.050644 0.038527 0.23492 0.05088 0.065086
septum lat int ant post antseptum
dS
Normals 8.1 ± 3.14 5.7 ± 3.7 5.8 ± 3.33 4.8 ± 2.9 5.6 ± 2.5 5.74 ± 3.6
WMA 3.87 ± 2.25 4.77 ± 3.23 4.69 ± 2.66 4.27 ± 3.5 5.26 ± 2.3 4.39 ± 2.9
P value (N : WMA) 2.79E-06 0.347103 0.219606 0.562961 0.624443 0.156402
dS/S0
Normals 0.75 ± 0.34 0.47 ± 0.33 0.48 ± 0.29 0.41 ± 0.24 0.47 ± 0.22 0.59 ± 0.37
WMA 0.37 ± 0.23 0.4 ± 0.29 0.43 ± 0.24 0.39 ± 0.31 0.48 ± 0.23 0.46 ± 0.299
P value (N : WMA) 4.13E-05 0.523187 0.456129 0.833189 0.778375 0.194333
S1/S0
Normals 1.75 ± 0.34 1.47 ± 0.33 1.48 ± 0.29 1.41 ± 0.24 1.47 ± 0.22 1.59 ± 0.37
WMA 1.33 ± 0.35 1.41 ± 0.29 1.43 ± 0.24 1.39 ± 0.31 1.48 ± 0.23 1.46 ± 0.29
P value (N : WMA) 7.7E-05 0.523187 0.456129 0.833189 0.778375 0.194333
Table 2. Mitral Annular Systolic Velocities at Rest and After Dobutamine Stress Echocardiography in All Subjects
Table 3. Mitral Annular Systolic Velocity Calculated Parameters at Rest and After Dobutamine Stress Echocardiog-raphy in All Subjects
(*) WMA = Wall motion abnormality
S0: Systolic velocity at rest (cm/sec)S1: Systolic velocity after DSE (cm/sec)dS: S1 - S0dS/S0: ratioS1/S0: ratio
18 19
Cardiol Res • 2011;2(1):16-26Sharif et al
Articles © The authors | Journal compilation © Cardiol Res and Elmer Press™ | www.cardiologyres.org
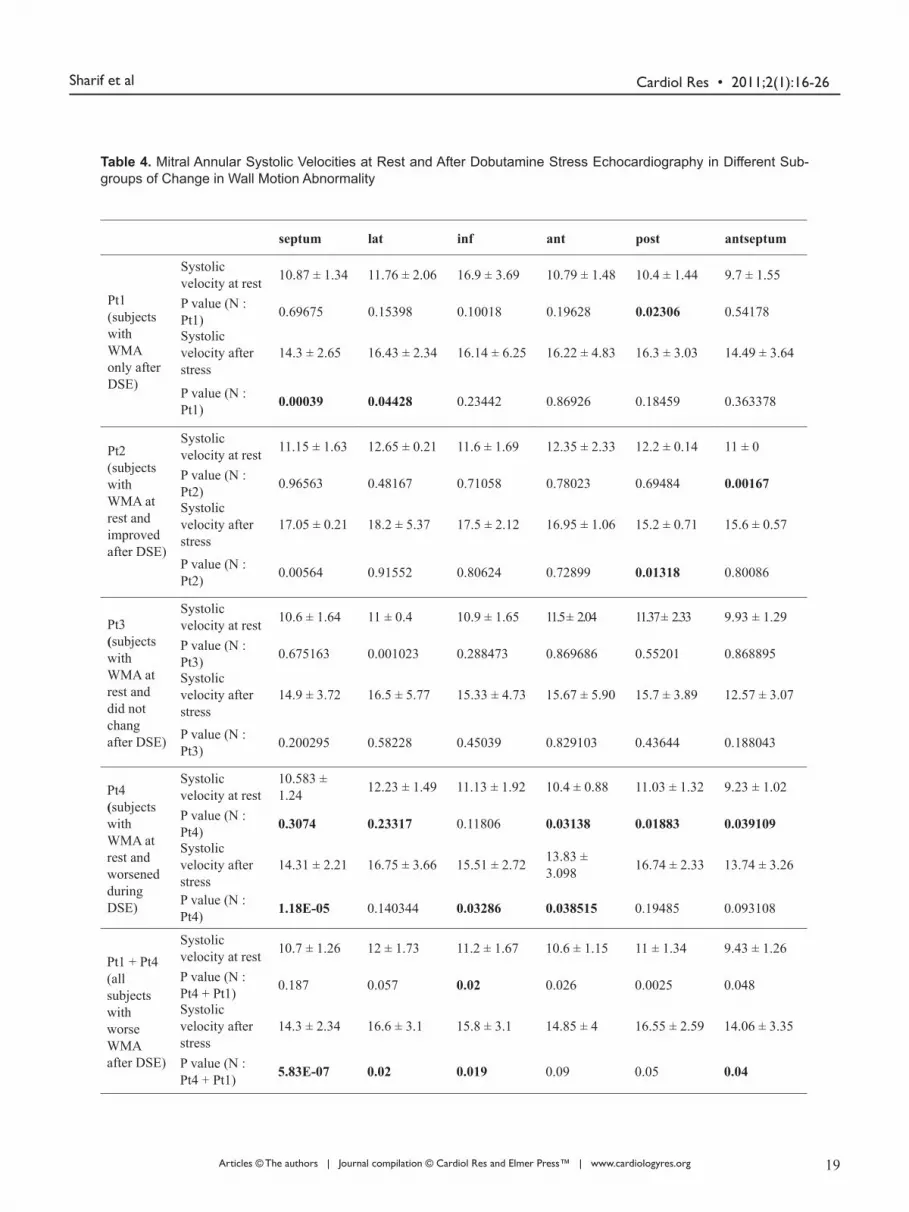
Table 4. Mitral Annular Systolic Velocities at Rest and After Dobutamine Stress Echocardiography in Different Sub-groups of Change in Wall Motion Abnormality
septum lat inf ant post antseptum
Pt1(subjects with WMA only after DSE)
Systolic velocity at rest 10.87 ± 1.34 11.76 ± 2.06 16.9 ± 3.69 10.79 ± 1.48 10.4 ± 1.44 9.7 ± 1.55
P value (N : Pt1) 0.69675 0.15398 0.10018 0.19628 0.02306 0.54178
Systolic velocity after stress
14.3 ± 2.65 16.43 ± 2.34 16.14 ± 6.25 16.22 ± 4.83 16.3 ± 3.03 14.49 ± 3.64
P value (N : Pt1) 0.00039 0.04428 0.23442 0.86926 0.18459 0.363378
Pt2(subjects with WMA at rest and improved after DSE)
Systolic velocity at rest 11.15 ± 1.63 12.65 ± 0.21 11.6 ± 1.69 12.35 ± 2.33 12.2 ± 0.14 11 ± 0
P value (N : Pt2) 0.96563 0.48167 0.71058 0.78023 0.69484 0.00167
Systolic velocity after stress
17.05 ± 0.21 18.2 ± 5.37 17.5 ± 2.12 16.95 ± 1.06 15.2 ± 0.71 15.6 ± 0.57
P value (N : Pt2) 0.00564 0.91552 0.80624 0.72899 0.01318 0.80086
Pt3(subjects with WMA at rest and did not chang after DSE)
Systolic velocity at rest 10.6 ± 1.64 11 ± 0.4 10.9 ± 1.65 11.5 ± 2.04 11.37 ± 2.33 9.93 ± 1.29
P value (N : Pt3) 0.675163 0.001023 0.288473 0.869686 0.55201 0.868895
Systolic velocity after stress
14.9 ± 3.72 16.5 ± 5.77 15.33 ± 4.73 15.67 ± 5.90 15.7 ± 3.89 12.57 ± 3.07
P value (N : Pt3) 0.200295 0.58228 0.45039 0.829103 0.43644 0.188043
Pt4(subjects with WMA at rest and worsened during DSE)
Systolic velocity at rest
10.583 ± 1.24 12.23 ± 1.49 11.13 ± 1.92 10.4 ± 0.88 11.03 ± 1.32 9.23 ± 1.02
P value (N : Pt4) 0.3074 0.23317 0.11806 0.03138 0.01883 0.039109
Systolic velocity after stress
14.31 ± 2.21 16.75 ± 3.66 15.51 ± 2.72 13.83 ± 3.098 16.74 ± 2.33 13.74 ± 3.26
P value (N : Pt4) 1.18E-05 0.140344 0.03286 0.038515 0.19485 0.093108
Pt1 + Pt4(all subjects with worse WMA after DSE)
Systolic velocity at rest 10.7 ± 1.26 12 ± 1.73 11.2 ± 1.67 10.6 ± 1.15 11 ± 1.34 9.43 ± 1.26
P value (N : Pt4 + Pt1) 0.187 0.057 0.02 0.026 0.0025 0.048
Systolic velocity after stress
14.3 ± 2.34 16.6 ± 3.1 15.8 ± 3.1 14.85 ± 4 16.55 ± 2.59 14.06 ± 3.35
P value (N : Pt4 + Pt1) 5.83E-07 0.02 0.019 0.09 0.05 0.04
18 19

Cardiol Res • 2011;2(1):16-26 Mitral Annular Systolic Velocities in Stress Echo
Articles © The authors | Journal compilation © Cardiol Res and Elmer Press™ | www.cardiologyres.org
systolic velocities (S1) were measured, and their difference (dS), dS/S0 and ratio (S1/S0) were calculated.
Statistical analysis
Mean values and standard deviation of the 6 annular mitral longitudinal velocities, S0, S1, dS, dS/S0 and S1/S0 were calculated for all. Student t-test assuming unequal variances, was performed; P < 0.05 was considered significant.
Results
All subjects underwent DSE studies safely and uneventfully. Heart rate increased from 62.4 ± 9.9 bpm to 123 ± 14.4 bpm. Systolic blood pressure increased from 138 ± 7 mmHg to 162 ± 9 mmHg.
Left ventricular wall motion abnormalities
In 24 patients the dobutamine stress echocardiography re-sults were considered normal (N), without baseline or do-butamine induced wall motion abnormalities. In 26 left ventricular wall motion abnormalities were observed (Pt), in 9 only after dobutamine infusion (Pt1), while resting wall motion abnormalities were observed in 17, with apical in-volvement in 5, antrior-septal in 2, inferior in 13, posterior in 4 and lateral in 1. In patients with resting wall motion abnormalities, in 2 (Pt2) wall motion improved after dobu-tamine stress echocardiography, in 3 (Pt3) wall motion did not change after dobutamine stress echocardiography, and in 12 (Pt4) worsened after dobutamine stress echocardiography (Table 1).
Mitral annular systolic velocities at rest
Generally, velocities were similar in normal subjects and in those with wall motion abnormality (WMA), except for slightly higher inferior and posterior mitral annular veloci-ties in normal subjects (about 1 cm/sec higher) which, how-ever, reached statistical significance (Table 2).
Systolic mitral annular velocities after dobutamine stress echocardiography
After dobutamine stress echocardiography, mitral annular systolic velocities increased significantly in normal subjects and those with WMA, in all 6 regions of Doppler sampling (Table 2). However, only septal peak annular velocities after dobutamine stress echocardiography (Septal-S1) were sig-nificantly higher in normal subjects (Table 2).Calculated parameters of systolic mitral velocities
Post-dobutamine stress echocardiography and baseline ve-
locity difference (dS = S1 - S0), and ratio (S1/S0) as well as dS/S1 were significantly higher in normal subjects compared to those with wall motion abnormalities (Table 3).
Relation of mitral annular systolic velocities to different groups of timing of wall motion abnormality
As shown in Table 4 systolic mitral annular velocities were normal at rest in all subgroups with wall motion abnormal-ity. After DSE mitral annular systolic velocities were lower than normal in all subjects with WMA, except those without change in wall motion (Pt3). Combining the 21 subjects with ischemic response (Pt1 and Pt4) revealed that sytolic septal annular velocities were lower than normal after DSE.
Relation of mitral annular systolic velocities to different groups of location of wall motion abnormality
Systolic mitral septal annular velocities at rest in subejcts with wall motion abnormality at different locations were similar to normal. After DSE mitral annular septal systolic velocities were less than normal in all the groups with wall motion abnormalities at all locations (Table 5).
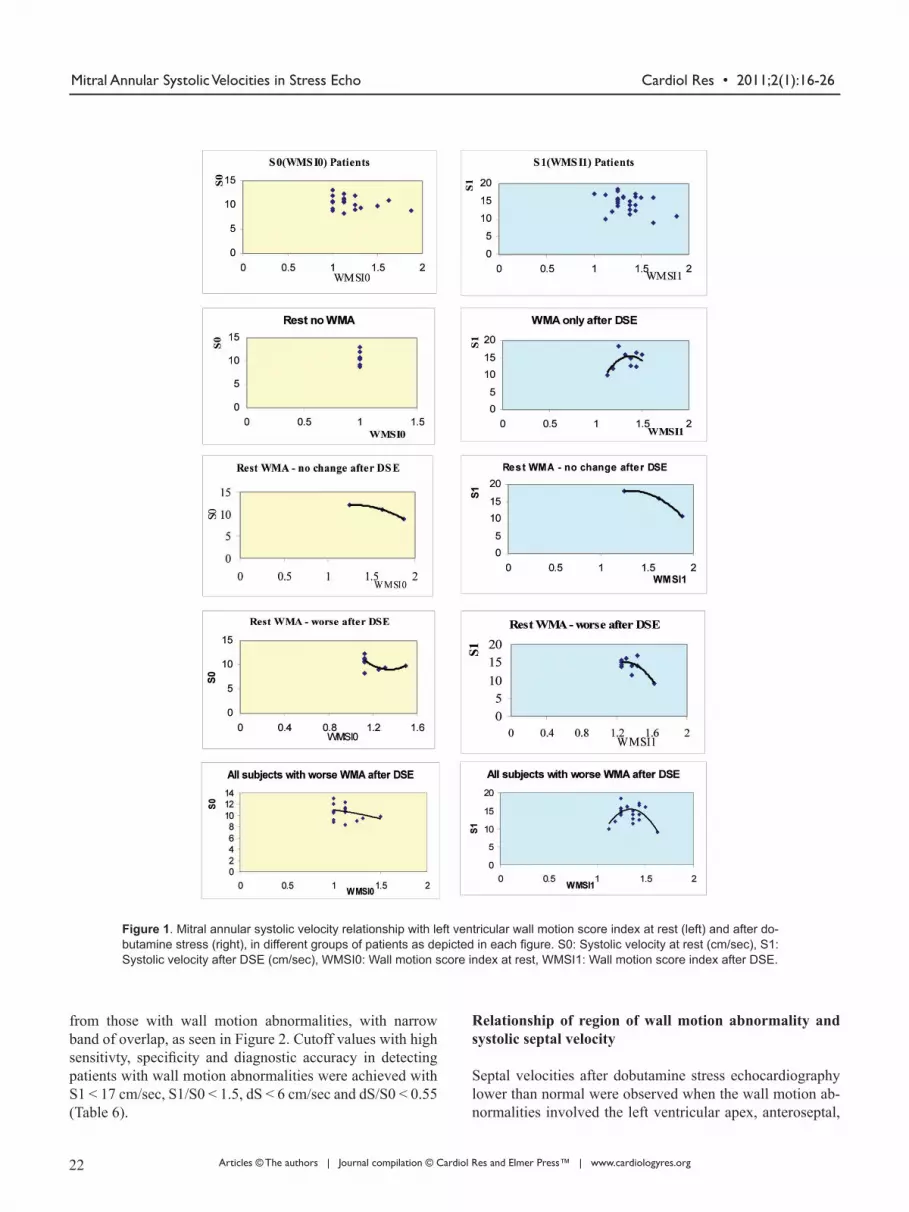
Relation to wall motion score index
In subjects with wall motion abnormalities, an inverse re-lationship between baseline septal systolic velocity S0 and post-dobutamine stress echocardiography velocity S1 on one hand and wall motion score index on the other was observed (Fig. 1). Septal velocity began to decrease when wall mo-tion score index exceeded 1.25. The same inverse relation-ship was obsereved in ptaients who developed wall motion abnormalities only after dobutamine stress echocardiogra-phy (Pt1), in those with baseline wall motion abnormalities which did not change during dobutamine stress echocardiog-raphy (Pt3), and in those with resting wall motion abnor-malities which worsened during dobutamine stress echo-cardiography (Pt 4). In all these patient subgroups, systolic septal annular velocities decreased when wall motion score index exceeded 1.25. Subjects with ischemic response (Pt1 and Pt4 combined together) showed the same finding. More-over, the increase in septal velocity after dobutamine stress echocardiography (dS), as well as (dS/S0) decreased when the difference in wall motion score index (WMSI) after do-butamine stress echocardiography was larger (Fig. 1).
Diagnostic value of systolic septal annular velocities
Baseline septal velocities (S0) did not differentiate between normal subjects and those with wall motion abnormalities (Fig. 2). However, post-dobutamine stress echocardiography septal velocities (S1), as well as velocity differnece (dS), (dS/S0) and (S1/S0) effectively differntiated normal subjects
20 21

Cardiol Res • 2011;2(1):16-26Sharif et al
Articles © The authors | Journal compilation © Cardiol Res and Elmer Press™ | www.cardiologyres.org
septum lat inf ant post antseptum
WMA lat
Systolic velocity at rest 10.75 ± 1.69 11.3 ± 2.61 10.7 ± 2.16 10.48 ± 0.98 10.9 ± 1.88 10.2 ± 2.17
P value 0.7122 0.28568 0.25436 0.102278 0.22409 0.91791
Systolic velocity after DSE
13.16 ± 3.18 13.5 ± 3.57 14.78 ± 4.1 12.28 ± 2.42 14.98 ± 3.26 12.1 ± 2.89
P value 0.025677 0.05386 0.218365 0.02454 0.162935 0.06997
WMA inf
Systolic velocity at rest 10.52 ± 1.13 12.15 ± 1.51 11.03 ± 1.46 10.61 ± 1.18 10.92 ± 1.08 9.35 ± 0.95
P value 0.173157 0.152316 0.02069 0.06015 0.002898 0.038125
Systolic velocity after DSE
14.32 ± 2.28 16.58 ± 2.95 15.72 ± 3.11 14.94 ± 4.25 16.29 ± 2.47 14.16 ± 3.23
P value 1.51E-06 0.038304 0.03795 0.23025 0.05339 0.11599
WMA ant
Systolic velocity at rest 10.3 ± 1.80 10.33 ± 2.14 10.27 ± 2.42 10.03 ± 0.51 10.47 ± 2.04 10.27 ± 2.65
P value 0.546108 0.1366 0.30985 0.009865 0.266757 0.913125
Systolic velocity after DSE
13.4 ± 1.29 15.75 ± 8.84 14.13 ± 4.77 12.83 ± 2.63 14.73 ± 3.95 11.3 ± 2.95
P value 0.13139 0.17168 0.311784 0.1252 0.306382 0.09256
WMA post
Systolic velocity at rest 10.48 ± 1.02 11.78 ± 1.91 11.09 ± 0.59 10.39 ± 1.08 10.76 ± 0.95 9.09 ± 0.94
P value 0.227 0.139556 0.010516 0.039644 0.00307 0.02527
Systolic velocity after DSE
14.59 ± 2.16 16.49 ± 2.48 16.68 ± 3.49 14.31 ± 2.89 16.41 ± 2.79 13.63 ± 2.47
P value 0.00012 0.05679 0.368676 0.09697 0.18818 0.05932
WMA apex
Systolic velocity at rest 10.72 ± 1.59 12.13 ± 1.34 11.32 ± 1.62 11.17 ± 1.38 11.73 ± 1.79 10.1 ± 1.16
P value 0.62475 0.24804 0.26814 0.47069 0.47243 0.96421
Systolic velocity after DSE
15.78 ± 2.55 16.98 ± 4.05 17.38 ± 3.75 16.37 ± 3.83 16.07 ± 3.17 13.95 ± 2.89
P value 0.022146 0.36996 0.7406 0.92985 0.22995 0.211088
Table 5. Mitral Annular Systolic Velocities at Rest and After Dobutamine Stress Echocardiography According to Loca-tion of Wall Motion Abnormality Compared to Normal
P value: versus Normal
20 21
Cardiol Res • 2011;2(1):16-26 Mitral Annular Systolic Velocities in Stress Echo
Articles © The authors | Journal compilation © Cardiol Res and Elmer Press™ | www.cardiologyres.org
from those with wall motion abnormalities, with narrow band of overlap, as seen in Figure 2. Cutoff values with high sensitivty, specificity and diagnostic accuracy in detecting patients with wall motion abnormalities were achieved with S1 < 17 cm/sec, S1/S0 < 1.5, dS < 6 cm/sec and dS/S0 < 0.55 (Table 6).
Relationship of region of wall motion abnormality and systolic septal velocity
Septal velocities after dobutamine stress echocardiography lower than normal were observed when the wall motion ab-normalities involved the left ventricular apex, anteroseptal,
Figure 1. Mitral annular systolic velocity relationship with left ventricular wall motion score index at rest (left) and after do-butamine stress (right), in different groups of patients as depicted in each figure. S0: Systolic velocity at rest (cm/sec), S1: Systolic velocity after DSE (cm/sec), WMSI0: Wall motion score index at rest, WMSI1: Wall motion score index after DSE.
22 23

Cardiol Res • 2011;2(1):16-26Sharif et al
Articles © The authors | Journal compilation © Cardiol Res and Elmer Press™ | www.cardiologyres.org
lateral and inferior segments (Table 5). Only in those with anterior wall motion abnormalities no
differnece was obeserved most probably due to small num-ber of subjects.
Relation to coronary angiography
Coronary angiography was not performed in subjects with-out wall motion abnormality and without ischemic response.
In 12 subjects with wall motion abnormality coronary angi-ography was performed and stenotic lesion locations corre-lated with sites of regional wall motion abnormality.
Discussion The aim of the present was to examine the utility of longi-tudinal left ventricular systolic function from mitral annular
Figure 2. Scattergrams of mitral annular systolic velocities in normal subjects (rhomboids) and in patients with left ventricular wall motion abnormality (squares) at rest and after stress.
Sensitivity (%) Specificity (%) Diagnostic Accuracy (%)
S1 < 17 92 80 88
S1/S0 < 1.5 85 88 86
dS < 6 88 79 84
dS/S0 < 0.55 85 79 82
Table 6. Diagnostic Value of Mitral Annular Systolic Velocity Parameters for the Detection of Wall Motion Abnormality
S0: Systolic velocity at rest (cm/sec)S1: Systolic velocity after DSE (cm/sec)dS: S1 - S0dS/S0: ratioS1/S0: ratio
22 23

Cardiol Res • 2011;2(1):16-26 Mitral Annular Systolic Velocities in Stress Echo
Articles © The authors | Journal compilation © Cardiol Res and Elmer Press™ | www.cardiologyres.org
tissue Doppler velocities in evaluation of dobutamine stress echocardiographic studies. It was found that mitral annular systolic velocities increased after dobutamine stress echo-cardiography in those with or without left ventricular wall motion abnormalities. In subjects with left ventricular wall motion abnormalities, the increase in septal annular systol-ic velocities after dobutamine stress was blunted. Systolic mitral annular velocity less than 17 cm/sec was sensitive, specific and accurate in predicting presence of wall motion abnormalities. Other calculated indices relating post-dobuta-mine stress echocardiography systolic mitral annular veloc-ity to baseline values exhibited similar behavior.
Myocardial ischemia results in alteration of diastolic and systolic left ventricular function. The sequence of regional changes in myocardial function induced by acute ischemia was defined by experimental sonomicrometric techniques [18, 19]. Accordingly, detection of the presence of myocar-dial ischemia includes delay in onset of myocardial thick-ening, decrease in the rate and degree of thickening, late systolic thinning followed by delay in peak thickening and post-systolic thickening. The findings of this study relate to differences in the changes in the rate of longitudinal left ven-tricular systolic function represented by peak mitral annular systolic velocity.
Despite the widespread use of dobutamine stress echo-cardiography, evaluation of wall motion is still mostly visual and subjective resulting in inter-observer variability [8-11]. Optimal technique of evaluation should not only quantify the parameters of regional myocardial ischemia, velocities, amplitude and timing of motion but also should be simple in order to gain widespread application.
Several imaging methods have been introduced to make analysis of stress echocardiography more quantitative and less subjective [20-23]. However some of these may lack simplicity and cannot be applied by many commercially available echocardigraphic machines. In this study, simple numerical parameter-mitral annular systolic velocity, could predict presence of wall motion abnormalities making evalu-ation of stress echocardiographic studies more objective, al-though predicting localization of wall motion abnormalities was not effective. Mitral annular systolic velocity emerged as a parameter of global ischemia not related to the region of ischemia.
Tissue Doppler imaging methods have been applied for the detection of myocardial ischemia [24-26]. In normal subjects the segmental response to increase in dobuatmine infusion is a gradual and continuous increase in myocardial velocities, strain rate and strain [15, 27-29]. Consistent with our study it was reported that abnormal increase in segmen-tal velocity during stress indicates ischemia [30, 31].
Mitral annular systolic velocity at the site insertion of the anterior mitral leaflet with the inter-ventricular septum was the most valuable region of evaluation of tissue Dop-pler velocities resulting in significant differences in veloci-
ties after stress between subjects with and those without left ventricular wall motion abnormality. When left ventricular wall motion score index was equal or greater than 1.25, sep-tal mitral annular Doppler velocity was reduced as a marker of global left ventricular systolic dysfunction.
Strengths and limitations
The strength of this study is that a simple evaluation of mi-tral annular tissue Doppler velocity after dobutamine stress echocardiography and related calculated were accurate in predicting left ventricular wall motion abnormality. How-ever these parameters were not related to the site of wall mo-tion abnormality, and instead they were related to global sys-tolic function and dysfunction like increase in left ventricular wall motion score index more than 1.25. Another limitation was that coronary angiography was not performed in all sub-jects, therefore correlation with this hard gold standard was not possible.
Conclusion
Systolic mitral TDI velocities increase after DSE, however to a lesser extent in those with wall motion abnormality, and can differentiate them from normal subjects. Application of TDI mitral velocities may simplify and aid in interpreting dobutamine stress echo studies.
Disclosure
None
Conflict of Interest
None
References
1. Geleijnse ML, Fioretti PM, Roelandt JR. Methodol-ogy, feasibility, safety and diagnostic accuracy of do-butamine stress echocardiography. J Am Coll Cardiol 1997;30(3):595-606.
2. Picano E. Stress echocardiography: a historical perspec-tive. Am J Med 2003;114(2):126-130.
3. Kasprzak JD, Paelinck B, Ten Cate FJ, Vletter WB, de Jong N, Poldermans D, Elhendy A, et al. Comparison of native and contrast-enhanced harmonic echocardiogra-phy for visualization of left ventricular endocardial bor-der. Am J Cardiol 1999;83(2):211-217.
4. Spencer KT, Bednarz J, Rafter PG, Korcarz C, Lang RM.
24 25
Cardiol Res • 2011;2(1):16-26Sharif et al
Articles © The authors | Journal compilation © Cardiol Res and Elmer Press™ | www.cardiologyres.org
Use of harmonic imaging without echocardiographic contrast to improve two-dimensional image quality. Am J Cardiol 1998;82(6):794-799.
5. Al-Mansour HA, Mulvagh SL, Pumper GM, Klarich KW, Foley DA. Usefulness of harmonic imaging for left ventricular opacification and endocardial border delin-eation by optison. Am J Cardiol 2000;85(6):795-799, A710.
6. Cohen JL, Cheirif J, Segar DS, Gillam LD, Gottdiener JS, Hausnerova E, Bruns DE. Improved left ventricular endocardial border delineation and opacification with OPTISON (FS069), a new echocardiographic contrast agent. Results of a phase III Multicenter Trial. J Am Coll Cardiol 1998;32(3):746-752.
7. Finkelhor RS, Pajouh M, Kett A, Stefanski R, Bosich G, Youssefi ME, Bahler RC. Clinical impact of second harmonic imaging and left heart contrast in echocardio-graphic stress testing. Am J Cardiol 2000;85(6):740-743.
8. Picano E, Lattanzi F, Orlandini A, Marini C, L’Abbate A. Stress echocardiography and the human factor: the importance of being expert. J Am Coll Cardiol 1991;17(3):666-669.
9. Hoffmann R, Lethen H, Marwick T, Arnese M, Fio-retti P, Pingitore A, Picano E, et al. Analysis of inter-institutional observer agreement in interpretation of dobutamine stress echocardiograms. J Am Coll Cardiol 1996;27(2):330-336.
10. Kvitting JP, Wigstrom L, Strotmann JM, Sutherland GR. How accurate is visual assessment of synchronicity in myocardial motion? An In vitro study with computer-simulated regional delay in myocardial motion: clinical implications for rest and stress echocardiography stud-ies. J Am Soc Echocardiogr 1999;12(9):698-705.
11. Hoffmann R, Marwick TH, Poldermans D, Lethen H, Ciani R, van der Meer P, Tries HP, et al. Refinements in stress echocardiographic techniques improve inter-insti-tutional agreement in interpretation of dobutamine stress echocardiograms. Eur Heart J 2002;23(10):821-829.
12. Ballo P, Quatrini I, Giacomin E, Motto A, Mondillo S. Circumferential versus longitudinal systolic function in patients with hypertension: a nonlinear relation. J Am Soc Echocardiogr 2007;20(3):298-306.
13. Maciver DH, Townsend M. A novel mechanism of heart failure with normal ejection fraction. Heart 2008;94(4):446-449.
14. Yamada E, Garcia M, Thomas JD, Marwick TH. Myo-cardial Doppler velocity imaging--a quantitative tech-nique for interpretation of dobutamine echocardiogra-phy. Am J Cardiol 1998;82(6):806-809, A809-810.
15. Wilkenshoff UM, Sovany A, Wigstrom L, Olstad B, Lindstrom L, Engvall J, Janerot-Sjoberg B, et al. Re-gional mean systolic myocardial velocity estimation by real-time color Doppler myocardial imaging: a new
technique for quantifying regional systolic function. J Am Soc Echocardiogr 1998;11(7):683-692.
16. Pasquet A, Armstrong G, Beachler L, Lauer MS, Mar-wick TH. Use of segmental tissue Doppler velocity to quantitate exercise echocardiography. J Am Soc Echo-cardiogr 1999;12(11):901-912.
17. Armstrong WF, Pellikka PA, Ryan T, Crouse L, Zoghbi WA. Stress echocardiography: recommendations for performance and interpretation of stress echocardiog-raphy. Stress Echocardiography Task Force of the No-menclature and Standards Committee of the American Society of Echocardiography. J Am Soc Echocardiogr 1998;11(1):97-104.
18. Theroux P, Ross J, Jr., Franklin D, Kemper WS, Sasya-ma S. Regional Myocardial function in the conscious dog during acute coronary occlusion and responses to morphine, propranolol, nitroglycerin, and lidocaine. Cir-culation 1976;53(2):302-314.
19. Ehring T, Heusch G. Left ventricular asynchrony: an in-dicator of regional myocardial dysfunction. Am Heart J 1990;120(5):1047-1057.
20. Perez JE, Waggoner AD, Davila-Roman VG, Cardona H, Miller JG. On-line quantification of ventricular func-tion during dobutamine stress echocardiography. Eur Heart J 1992;13(12):1669-1676.
21. Gorcsan J, 3rd, Strum DP, Mandarino WA, Gulati VK, Pinsky MR. Quantitative assessment of alterations in re-gional left ventricular contractility with color-coded tis-sue Doppler echocardiography. Comparison with sono-micrometry and pressure-volume relations. Circulation 1997;95(10):2423-2433.
22. Koch R, Lang RM, Garcia MJ, Weinert L, Bednarz J, Korcarz C, Coughlan B, et al. Objective evaluation of regional left ventricular wall motion during dobuta-mine stress echocardiographic studies using segmen-tal analysis of color kinesis images. J Am Coll Cardiol 1999;34(2):409-419.
23. Hanekom L, Cho GY, Leano R, Jeffriess L, Marwick TH. Comparison of two-dimensional speckle and tissue Doppler strain measurement during dobutamine stress echocardiography: an angiographic correlation. Eur Heart J 2007;28(14):1765-1772.
24. Derumeaux G, Ovize M, Loufoua J, Andre-Fouet X, Minaire Y, Cribier A, Letac B. Doppler tissue imaging quantitates regional wall motion during myocardial isch-emia and reperfusion. Circulation 1998;97(19):1970-1977.
25. Bach DS, Armstrong WF, Donovan CL, Muller DW. Quantitative Doppler tissue imaging for assessment of regional myocardial velocities during transient ischemia and reperfusion. Am Heart J 1996;132(4):721-725.
26. Derumeaux G, Ovize M, Loufoua J, Pontier G, An-dre-Fouet X, Cribier A. Assessment of nonunifor-mity of transmural myocardial velocities by color-
24 25

Cardiol Res • 2011;2(1):16-26 Mitral Annular Systolic Velocities in Stress Echo
Articles © The authors | Journal compilation © Cardiol Res and Elmer Press™ | www.cardiologyres.org
coded tissue Doppler imaging: characterization of normal, ischemic, and stunned myocardium. Circulation 2000;101(12):1390-1395.
27. Gorcsan J, 3rd, Deswal A, Mankad S, Mandarino WA, Mahler CM, Yamazaki N, Katz WE. Quantification of the myocardial response to low-dose dobutamine using tissue Doppler echocardiographic measures of velocity and velocity gradient. Am J Cardiol 1998;81(5):615-623.
28. Urheim S, Edvardsen T, Torp H, Angelsen B, Smiseth OA. Myocardial strain by Doppler echocardiography. Validation of a new method to quantify regional myo-cardial function. Circulation 2000;102(10):1158-1164.
29. Weidemann F, Jamal F, Kowalski M, Kukulski T, D’Hooge J, Bijnens B, Hatle L, et al. Can strain rate and
strain quantify changes in regional systolic function dur-ing dobutamine infusion, B-blockade, and atrial pacing--implications for quantitative stress echocardiography. J Am Soc Echocardiogr 2002;15(5):416-424.
30. Armstrong G, Pasquet A, Fukamachi K, Cardon L, Ol-stad B, Marwick T. Use of peak systolic strain as an index of regional left ventricular function: comparison with tissue Doppler velocity during dobutamine stress and myocardial ischemia. J Am Soc Echocardiogr 2000;13(8):731-737.
31. Pasquet A, Armstrong G, Rimmerman C, Marwick TH. Correlation of myocardial Doppler velocity response to exercise with independent evidence of myocardial isch-emia by dual-isotope single-photon emission computed tomography. Am J Cardiol 2000;85(5):536-542.
26 217