mitochondrial dna copy number is modulated by genetic variation in the signal transducer and...
TRANSCRIPT

M E T A B O L I S M C L I N I C A L A N D E X P E R I M E N T A L X X ( 2 0 1 1 ) X X X – X X X
ava i l ab l e a t www.sc i enced i r ec t . com
www.metabo l i sm jou rna l . com
Mitochondrial DNA copy number is modulated by geneticvariation in the signal transducer and activator of transcription3 (STAT3)
Tomas Fernández Gianottia, Gustavo Castañob,c, Carolina Gemmaa, Adriana L. Burgueñoa,Maria Soledad Rossellid, Carlos J. Pirolaa,1, Silvia Sookoianb,c,d,⁎,1
a Department of Molecular Genetics and Biology of Complex Diseases, Institute of Medical Research A Lanari-IDIM, University of BuenosAires-CONICET, Ciudad Autónoma de Buenos Aires, Argentinab Research Council in Health, Government of the City of Buenos Aires, Ciudad Autónoma de Buenos Aires, Argentinac Department of Medicine and Surgery, Hospital Abel Zubizarreta, Ciudad Autónoma de Buenos Aires, Argentinad Department of Clinical and Molecular Hepatology, Institute of Medical Research A Lanari-IDIM, University of Buenos Aires-CONICET.Ciudad Autónoma de Buenos Aires, Argentina
A R T I C L E I N F O
Author contributions: TFG, CG, ALB, anddata collection; GC and SS collected patients'and CJP contributed to the design and coanalysis, data interpretation, and manuscrip⁎ Corresponding author. Instituto de Invest
Lanari, Buenos Aires (1427), Argentina. Tel.: +fax: +54 11 4523 8947.
E-mail address: [email protected] Shared senior authorship.
0026-0495/$ – see front matter © 2010 Elsevidoi:10.1016/j.metabol.2010.12.008
Please cite this article as: Gianotti TF, ettransducer and activator of transcription
A B S T R A C T
Article history:Received 4 October 2010Accepted 15 December 2010
The regulation of mitochondrial DNA (mtDNA) copy number not only is critical for themaintenance of the normal mitochondrial function but has a strong clinical significance. Arecent report revealed that the signal transducer and activator of transcription 3 (STAT3) isinvolved in the regulation of the mitochondrial function and is required for the optimalfunction of the electron transport chain. In this study, we explored whether gene variants inthe STAT3 influence the leukocyte mtDNA copy number. Clinical data and blood sampleswere collected from 179 subjects (aged 52.8 ± 0.9 years). Mitochondrial DNA quantificationusing nuclear DNA (nDNA) as a reference was carried out by a real-time quantitativepolymerase chain reaction method; results are presented as the mtDNA/nDNA ratio. Weselected 3 tag single nucleotide polymorphisms showing a minor allele frequency greaterthan 10% (rs2293152 C/G, rs6503695 C/T, and rs9891119 A/C), representing 24 polymorphicsites of the STAT3 (r2 > 0.8). We observed a significant association between mtDNA/nDNAratio and both rs6503695 and rs9891119, adjusted by age and homeostasis modelassessment index. The proportion of the total variance of the mtDNA/nDNA ratioaccounted for by the rs6503695 and rs9891119 genotypes was 4.7% and 6.53%,respectively. Common variation in the STAT3 may influence mtDNA copy number.
© 2010 Elsevier Inc. All rights reserved.
MSR contributed tosamples and data; SSnduct of the study,t writing.igaciones Médicas A54 11 4514 8701x167;
ba.ar (S. Sookoian).
er Inc. All rights reserved
al, Mitochondrial DNA c3 (STAT3), Metabolism
1. Introduction
The human mitochondrial genome is a double-strandedcircular molecule of DNA encompassing 16 569 base pairs(bp) in length that encodes 12S and 16S rRNAs, 22 tRNAs, and13 polypeptides. Mitochondria are involved in the respiratoryelectron transport chain and adenosine triphosphate synthe-sis; thus, it is not surprising that the number of mitochondriaand mitochondrial DNA (mtDNA) molecules per mitochon-drion varies according to the different cell types and the
.
opy number is modulated by genetic variation in the signal(2011), doi:10.1016/j.metabol.2010.12.008
2 M E T A B O L I S M C L I N I C A L A N D E X P E R I M E N T A L X X ( 2 0 1 1 ) X X X – X X X
specific tissue energetic demands. On average, a single cellcan contain from 200 to 2000 mitochondria [1]; and althoughthe number of mitochondria in specific cell types variesconsiderably, within a given cell type, the number is closelyregulated [2]. In addition, despite differences in the number ofmitochondrial genome copies per cell (ranging mostly from1000-10 000 [3]) that were previously reported, Tang et al [4]showed that mammalian cells maintain a constant mass ofmtDNA, suggesting that mtDNA copy number is a tightlycontrolled process.
The control of mitochondrial biogenesis is extremelycomplex; and in addition to the mitochondrial RNA polymer-ase, several nuclear genes are involved in the maintenance ofthe mtDNA content, for instance, mitochondrial transcriptionfactor A (TFAM), peroxisome proliferator-activated receptorgamma coactivator 1 alpha (PPARGC1A), and nuclear respira-tory factor 1 (NRF1) [5]. Moreover, it was recently reported thatthe peroxisome proliferator-activated receptor gamma(PPARG) activation promotes biogenesis of functional mito-chondria [6]. As well, PPARG activation increases the expres-sion of the messenger RNA (mRNA) of mitochondrialuncoupling protein–1, a member of the family of mitochon-drial anion carrier proteins [7]. In addition, PPARG is requiredfor the biologic function of PPARGC1A on mitochondrialbiogenesis [8].
Interestingly, a recent report from Wegrzyn and coworkers[9] revealed that the signal transducer and activator oftranscription 3 (STAT3) plays a key role in the regulation ofthe mitochondrial function and provided evidence that STAT3not only is required for the optimal function of the electrontransport chain, but is a modulator of the mitochondrialrespiration. These observations are consistent with thefinding that STAT3 also resides within the mitochondria [9].Actually, the authors stated that STAT3 exerts its actions notas a transcription factor that regulates nuclear gene expres-sion, but through its localization in the mitochondria.
The regulation of the mtDNA copy number not only iscritical for the maintenance of the normal mitochondrialfunction but has a strong clinical significance, as manysyndromes and diseases are associated with depletion ofmtDNA content. In fact, it is suggested that even in the absenceof detectablemtDNAmutations, abnormal amounts ofmtDNA,either depletion or elevation, can be indicative of mitochon-drial dysfunction [10]. Although mtDNA mutations, oftenfounded as substitution, deletion, or duplication of mtDNAbases, are widely associated with different mitochondrial,metabolic, cardiovascular, and neurologic disorders, there isalso some evidence about the role of genetic variation innuclear genes contributing to the regulationof themtDNAcopynumber [11-13]. Nevertheless, the published evidence ismostlyrestricted to the role of genetic polymorphisms of the TFAM.
Based on the hypothesis that polymorphisms in nuclearand mitochondrial genes might regulate the mtDNA copynumber and the fact that STAT3 not only is required theoptimal mitochondrial function but also resides within themitochondria, we explored whether common gene variants inthe STAT3 influence the mtDNA content. We further investi-gated the role of functional gene variants in 2 additional genesinvolved in the regulation of mitochondrial biogenesis andmtDNA copy number, such as TFAM and PPARG.
Please cite this article as: Gianotti TF, et al, Mitochondrial DNAtransducer and activator of transcription 3 (STAT3), Metabolism
2. Subjects and methods
2.1. Subjects
A sample of 179 subjects, aged 52.8 ± 0.9 years, was included inour study in a cross-sectional fashion. Health examinationsincluded anthropometric measurements, a questionnaire onhealth-related behaviors, and biochemical determinations.After a 30-minute rest in a quiet room, the systolic anddiastolic arterial blood pressure was measured while thesubject was in sitting position. The blood pressure values werethemeans of 3 different measurements. Bodymass index wascalculated as weight/height2 (kilograms per square meter) andwas used as the index for relative weight. In addition, trainedstaff assessed waist and hip circumferences.
All participants were asked to fast for at least 8 hours, andblood was drawn from subjects who had lain in supine restingposition for at least 30 minutes. Serum insulin, total choles-terol, high-density lipoprotein and low-density lipoproteincholesterol, triglycerides, and plasma glucose were measuredby standard clinical laboratory techniques. Homeostasismodel assessment (HOMA) was used to evaluate the insulinresistance index and was calculated as fasting serum insulin(microunits permilliliter) × fasting plasma glucose (millimolesper liter)/22.5.
2.2. Quantification of mtDNA
Nucleic acids were extracted from white blood cells from ablood sample by a standard method as previously described[14]. An assay based on real-time quantitative polymerasechain reaction (PCR) was used for both nuclear DNA (nDNA)and mtDNA quantification using SYBR Green as a fluorescentdye (Invitrogen, Buenos Aires, Argentina) as we previouslydescribed [15]. Briefly, the primer sequences for mtDNA,mtF3212 (5′CACCCAAGAACAGGGTTTGT3′) and mtR3319 (5′TGGCCATGGGTATGTT-GTTAA3′), and those for nDNA forloading normalization, 18S rRNA gene 18S1546F (5′TAGAGG-GACAAGTGGCGTTC3′) and 18S1650R (5′CGCTGAGCCAGTCA-GTGT3′), were reported previously by Bai et al [10].
The PCR profile was 1 cycle of 95°C for 2 minutes followedby 35 cycles (95°C 15 seconds and 60°C 1 minute). Real-timequantitative PCR was carried out in a BioRad iCycler (Bio-RadLaboratories, Hercules, CA). The calculation of DNA copynumber involved extrapolation from the fluorescence read-ings in the mode of background subtracted from the BioRadiCycler according to Rutledge [16].
The evaluation of the specificity of the amplified (108 bp)region ofmtDNAwas assessed aswe previously described [15].
The 2 target amplicon sequences (mtDNA and nDNA) werevisualized in agarose 2% and purified by Qiagen Qiaex II gelextraction kit (Tecnolab, Buenos Aires, Argentina), and dilu-tions of purified amplicons were used as the standard curve.The interassay variation coefficient was less than 20%. Theresults were presented as the mtDNA/nDNA ratio.
2.3. STAT3 gene variants
To assess the contribution of STAT3 variants to the mtDNAcontent in peripheral white blood cells, we selected tag single
copy number is modulated by genetic variation in the signal(2011), doi:10.1016/j.metabol.2010.12.008
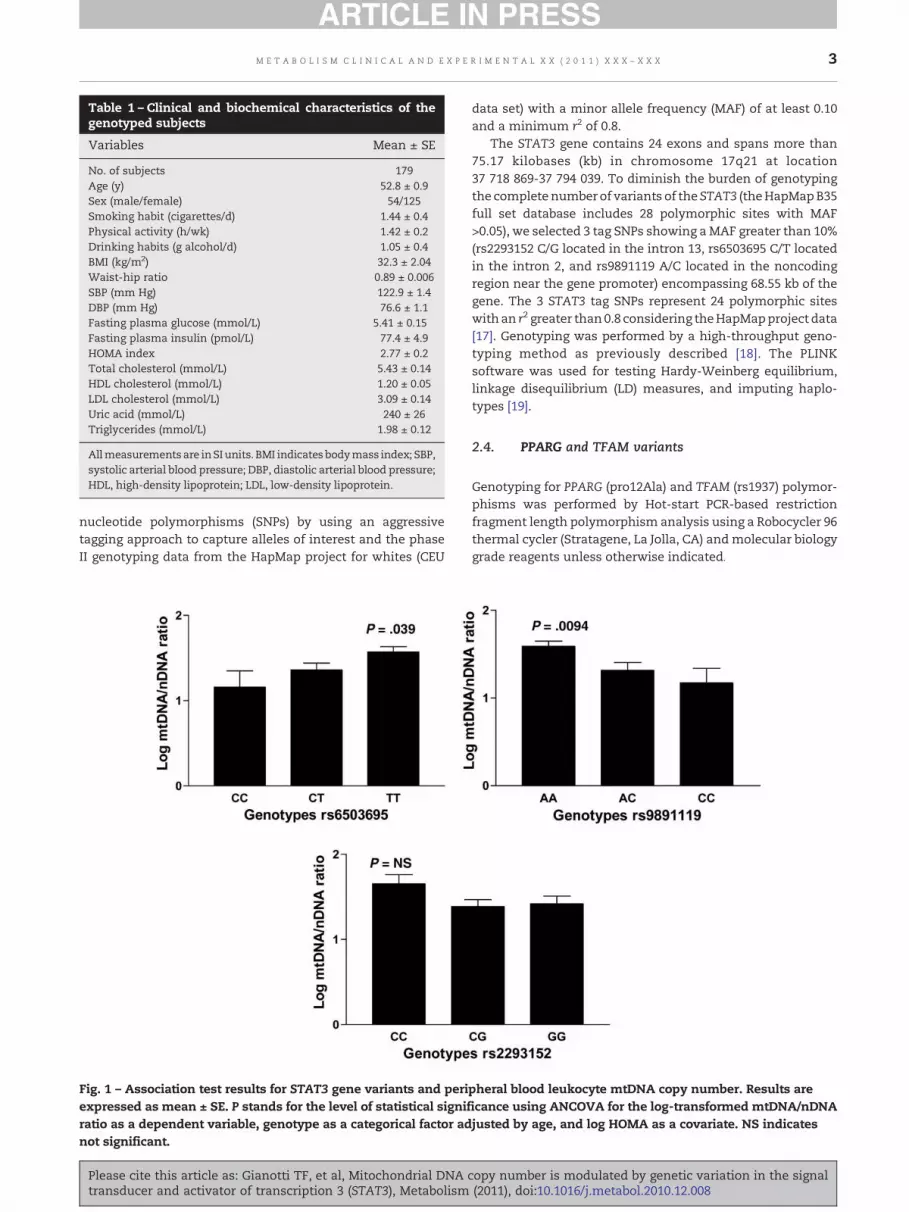
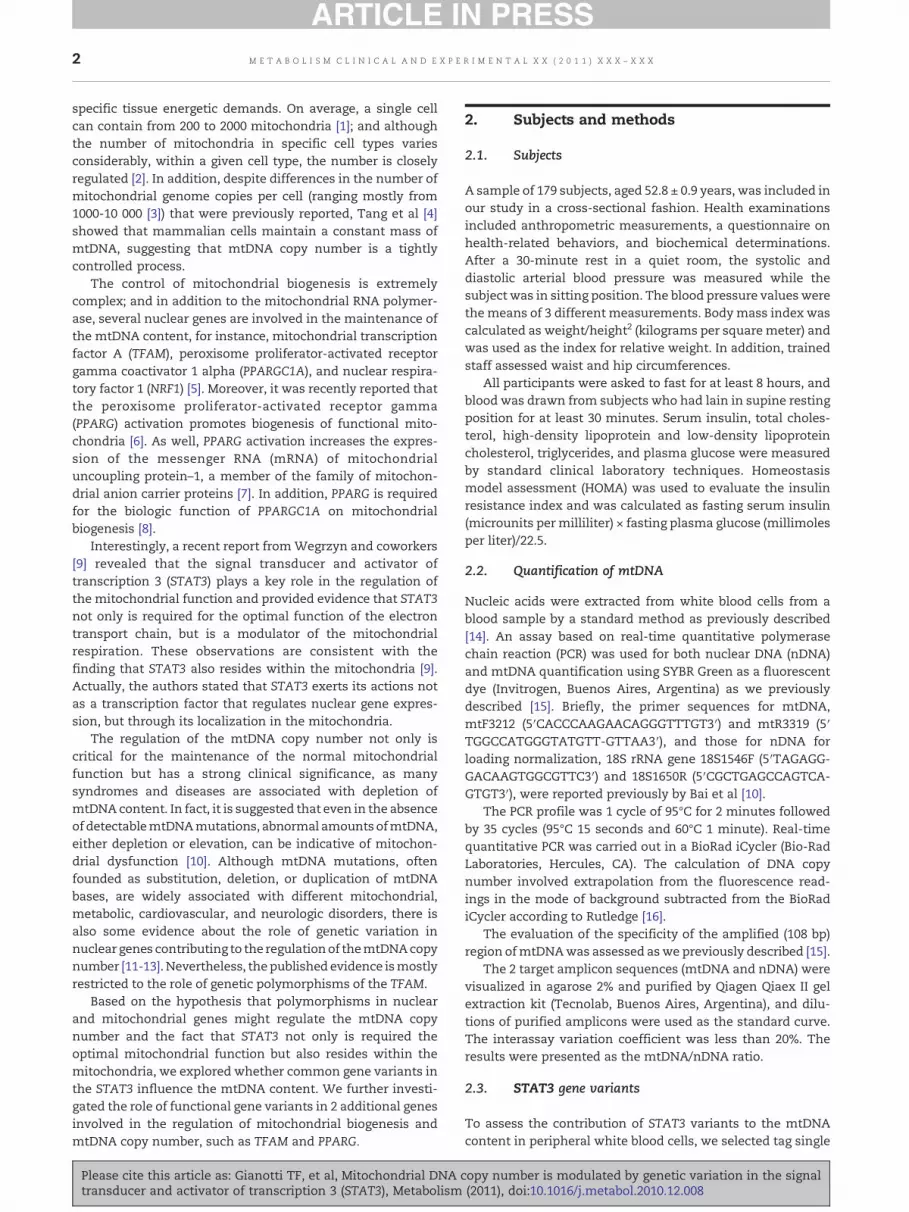
Table 1 – Clinical and biochemical characteristics of thegenotyped subjects
Variables Mean ± SE
No. of subjects 179Age (y) 52.8 ± 0.9Sex (male/female) 54/125Smoking habit (cigarettes/d) 1.44 ± 0.4Physical activity (h/wk) 1.42 ± 0.2Drinking habits (g alcohol/d) 1.05 ± 0.4BMI (kg/m2) 32.3 ± 2.04Waist-hip ratio 0.89 ± 0.006SBP (mm Hg) 122.9 ± 1.4DBP (mm Hg) 76.6 ± 1.1Fasting plasma glucose (mmol/L) 5.41 ± 0.15Fasting plasma insulin (pmol/L) 77.4 ± 4.9HOMA index 2.77 ± 0.2Total cholesterol (mmol/L) 5.43 ± 0.14HDL cholesterol (mmol/L) 1.20 ± 0.05LDL cholesterol (mmol/L) 3.09 ± 0.14Uric acid (mmol/L) 240 ± 26Triglycerides (mmol/L) 1.98 ± 0.12
Allmeasurementsare inSIunits. BMI indicates bodymass index; SBP,systolic arterial blood pressure; DBP, diastolic arterial blood pressure;HDL, high-density lipoprotein; LDL, low-density lipoprotein.
3M E T A B O L I S M C L I N I C A L A N D E X P E R I M E N T A L X X ( 2 0 1 1 ) X X X – X X X
nucleotide polymorphisms (SNPs) by using an aggressivetagging approach to capture alleles of interest and the phaseII genotyping data from the HapMap project for whites (CEU
Fig. 1 – Association test results for STAT3 gene variants and periexpressed as mean ± SE. P stands for the level of statistical signifratio as a dependent variable, genotype as a categorical factor adnot significant.
Please cite this article as: Gianotti TF, et al, Mitochondrial DNA ctransducer and activator of transcription 3 (STAT3), Metabolism
data set) with a minor allele frequency (MAF) of at least 0.10and a minimum r2 of 0.8.
The STAT3 gene contains 24 exons and spans more than75.17 kilobases (kb) in chromosome 17q21 at location37 718 869-37 794 039. To diminish the burden of genotypingthe complete numberof variants of the STAT3 (theHapMapB35full set database includes 28 polymorphic sites with MAF>0.05), we selected 3 tag SNPs showing a MAF greater than 10%(rs2293152 C/G located in the intron 13, rs6503695 C/T locatedin the intron 2, and rs9891119 A/C located in the noncodingregion near the gene promoter) encompassing 68.55 kb of thegene. The 3 STAT3 tag SNPs represent 24 polymorphic siteswith an r2 greater than0.8 considering theHapMapproject data[17]. Genotyping was performed by a high-throughput geno-typing method as previously described [18]. The PLINKsoftware was used for testing Hardy-Weinberg equilibrium,linkage disequilibrium (LD) measures, and imputing haplo-types [19].
2.4. PPARG and TFAM variants
Genotyping for PPARG (pro12Ala) and TFAM (rs1937) polymor-phisms was performed by Hot-start PCR-based restrictionfragment length polymorphism analysis using a Robocycler 96thermal cycler (Stratagene, La Jolla, CA) andmolecular biologygrade reagents unless otherwise indicated.
pheral blood leukocyte mtDNA copy number. Results areicance using ANCOVA for the log-transformed mtDNA/nDNAjusted by age, and log HOMA as a covariate. NS indicates
opy number is modulated by genetic variation in the signal(2011), doi:10.1016/j.metabol.2010.12.008

Fig. 2 – Association test results for STAT3 rs9891119 genotypes and HOMA of insulin resistance (left panel) and plasma fastinginsulin levels (right panel). Results are expressed as mean ± SE. P stands for the level of statistical significance using ANCOVA.
4 M E T A B O L I S M C L I N I C A L A N D E X P E R I M E N T A L X X ( 2 0 1 1 ) X X X – X X X
The most commonly studied PPARG variant is the coding-nonsynonymous pro12Ala (rs1801282); thus, it was chosen inour study. In addition, the minor ala allele is associated withdecreased binding affinity to the cognate promoter elementand reduced ability to transactivate responsive promoters [20].Primers to detect Pro12Ala variant were 5′-GCC AAT TCA AGCCCA GTC-3′ and 5′-GAT ATG TTT GCA GAC AGT GTA TCA GTGAAG GAA TCG CTT TCC G-3′; the variant was genotyped usingdigestion with BstUI (New England Biolabs, Ipswich, MA).
We selected for genotyping in our study the rs1937, amissence SNP (Ser12Thr) located in exon 1 of the TFAM gene,because this SNP is the only coding-nonsynonymous variantvalidated by cluster, frequency, and the HapMap. In addition,sequence analysis of a part of TFAM exon 1 confirmed SNPrs1937 (G>C), predicting the amino acid change S12T in themitochondrial signal peptide sequence [21]. Primers to detectthe rs1937 polymorphismwere 5′ TAGGAGGGGCAGAAAGTGA3′ and 5′ CGGGTTCCAGTTGTGATTG 3′, and genotyping useddigestion with DdeI (New England Biolabs, Ipswich, MA).
Fig. 3 –Association test results for PPARγ and TFAM gene variantsare expressed as mean ± SE. P stands for the level of statistical snDNA ratio as a dependent variable, genotype as a categorical fa
Please cite this article as: Gianotti TF, et al, Mitochondrial DNAtransducer and activator of transcription 3 (STAT3), Metabolism
2.5. Statistical analysis
Quantitative data were expressed as mean ± SE. Because themtDNA/nDNA ratio does not have a normal distribution, weassessed differences in this variable according to genotypesas categorical factors by analysis of covariance (ANCOVA)after a log transformation and using age and HOMA index ascofounders owing to the well-known effect of these variableson mitochondrial DNA content. Univariate and haplotypeanalyses were performed by linear regression as implemen-ted in the PLINK software. We used the CSS/Statisticaprogram package, StatSoft V 6.0 (Tulsa, OK) to performthese analyses.
3. Results
A summary of the clinical features, anthropometric variables,and laboratory findings of the participants is shown in Table 1.
and peripheral blood leukocytemtDNA copy number. Resultsignificance using ANCOVA for the log-transformed mtDNA/ctor adjusted by age, and log HOMA as a covariate.
copy number is modulated by genetic variation in the signal(2011), doi:10.1016/j.metabol.2010.12.008
5M E T A B O L I S M C L I N I C A L A N D E X P E R I M E N T A L X X ( 2 0 1 1 ) X X X – X X X
STAT3 genotype frequencies were in Hardy-Weinbergequilibrium. Statistical analysis of the log-transformedmtDNA/nDNA ratio of individuals classified according togenotypes of STAT3 tag SNPs showed a significant associationbetween mtDNA/nDNA ratio and SNPs rs6503695 andrs9891119, either unadjusted (rs6503695; β: −0.4852 ± 0.1871,P < .011 and rs9891119; β: −0.5546 ± 0.174, P < .0018, whichremained significant even after considering the most conser-vativemultiple testing correction of Bonferroni P < .05/3 = .016)or adjusted by HOMA and age as covariate (Fig. 1); the lowermtDNA content was observed in those homozygous for eitherthe rs6503695 C or rs9891119 C allele. The proportion of thetotal variance of the mtDNA/nDNA ratio accounted for by thers6503695 and rs9891119 genotypes was 4.7% and 6.53%,respectively. These associations are not entirely surprisingbecause of the relative linkage of both SNP rs6503695 and SNPrs9891119 (r2: 0.778). Although we found no significantassociation between mtDNA content and the rs2293152variant (Fig. 1), the relatively common haplotype composedof the rs2293152 G, rs6503695 C, and rs9891119 C variants(frequency: 19%) was significantly associated with decreasedmtDNA content (β: −0.6672, P < .0015) and a trend toward theopposite for the haplotype composed of the rs2293152 C,rs6503695 T, and rs9891119 A variants (frequency: 45%,β: 0.307, P < .07). To further evaluate the potential physiologicsignificance of our findings, we examined whether STAT3variation correlated with any clinical or biochemical param-eter in our sample. Interestingly, we observed that thers9891119 genotypes were also significantly associated withHOMA of insulin resistance index (Fig. 2, left panel).Moreover, those homozygous for the rs9891119 A alleleshow significantly higher levels of plasma fasting insulin incomparison with carriers of the C allele (Fig. 2, right panel).
In addition, the variants of PPARG, rs1801282 (pro12Ala)and TFAM, rs1937 were evaluated in the whole sample; andgenotype frequencies were in Hardy-Weinberg equilibrium.When we studied the mtDNA content in relation with theaforementioned variants of these candidate genes, we foundno significant differences in the mtDNA/nDNA ratio amongthe genotypes (Fig. 3).
4. Discussion
Themain conclusion of this study is that common variation inthe STAT3may be implicated in the regulation of mtDNA copynumber. The SNPswe found to be strongly associated with themtDNA/nDNA ratio accounted for a substantial proportion ofthe total variance (4.7%-6.53%), as the genetic contribution tothe phenotypic variance in complex traits is much less onaverage. To our knowledge, the involvement of the STAT3gene variation as amodulator of themtDNA content has neverbeen previously reported.
STAT3, a transcription factor also known as an acute-phaseresponse factor, is involved in several cellular process, such as
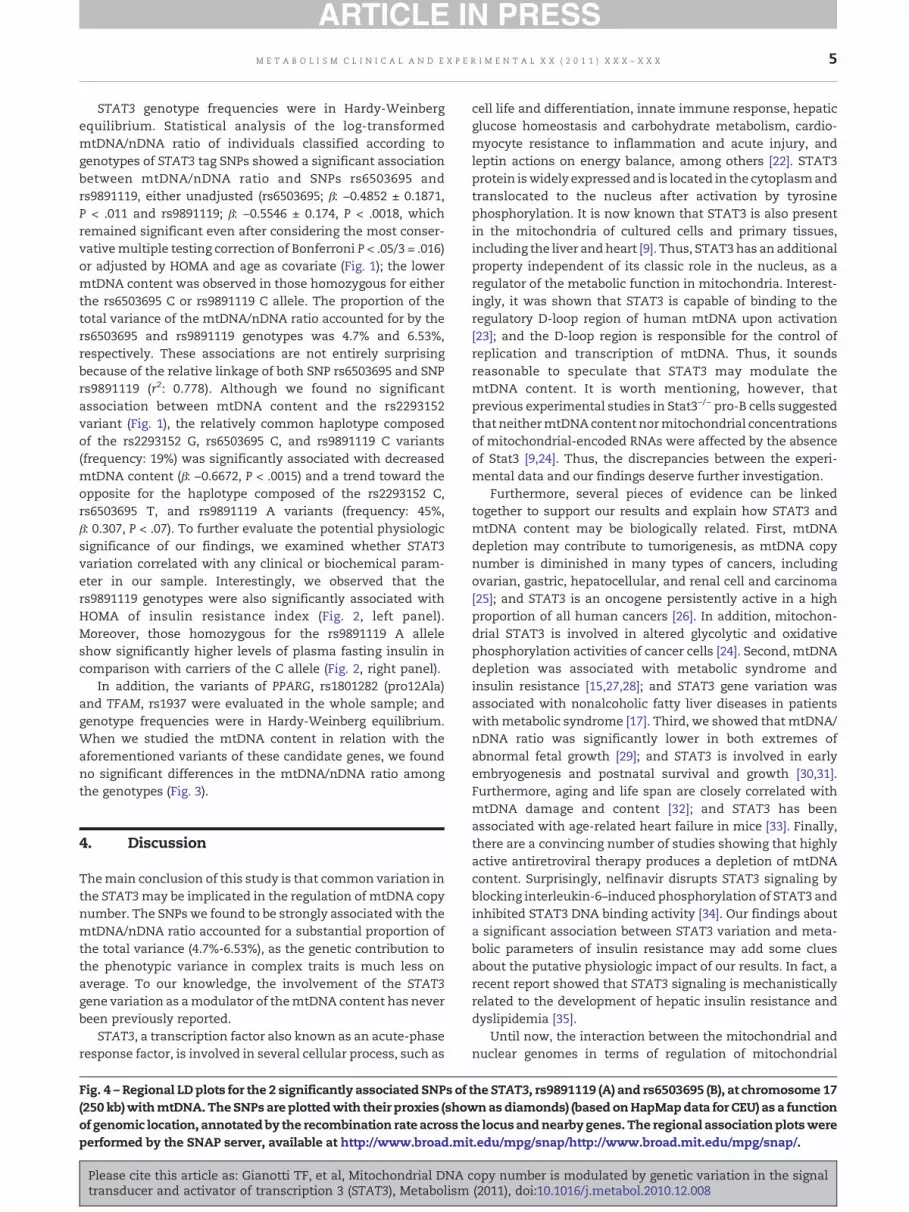
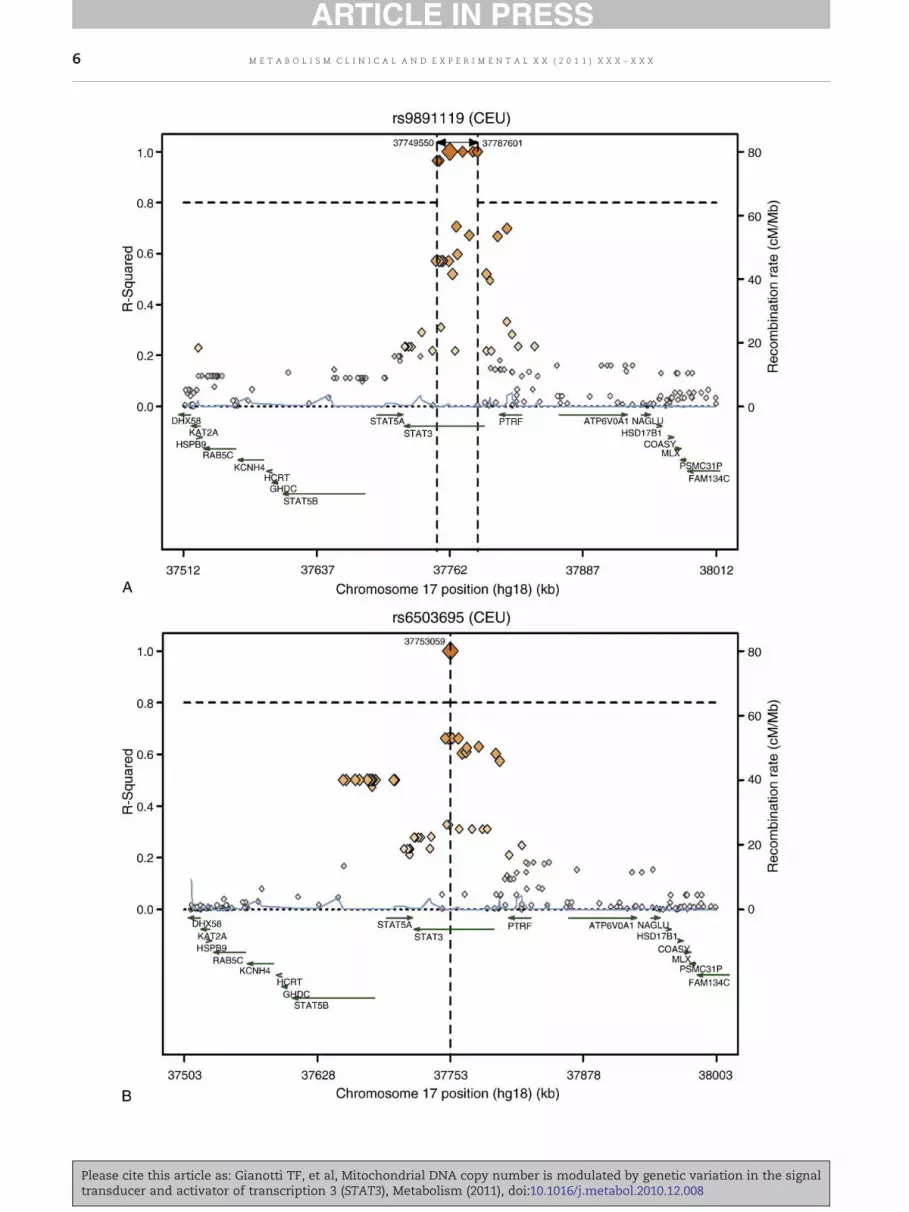
Fig. 4 – Regional LD plots for the 2 significantly associated SNPs of(250 kb)withmtDNA. TheSNPs are plottedwith their proxies (showof genomic location, annotatedby the recombination rate across thperformed by the SNAP server, available at http://www.broad.mi
Please cite this article as: Gianotti TF, et al, Mitochondrial DNA ctransducer and activator of transcription 3 (STAT3), Metabolism
cell life and differentiation, innate immune response, hepaticglucose homeostasis and carbohydrate metabolism, cardio-myocyte resistance to inflammation and acute injury, andleptin actions on energy balance, among others [22]. STAT3protein iswidely expressed and is located in the cytoplasmandtranslocated to the nucleus after activation by tyrosinephosphorylation. It is now known that STAT3 is also presentin the mitochondria of cultured cells and primary tissues,including the liver andheart [9]. Thus, STAT3has an additionalproperty independent of its classic role in the nucleus, as aregulator of the metabolic function in mitochondria. Interest-ingly, it was shown that STAT3 is capable of binding to theregulatory D-loop region of human mtDNA upon activation[23]; and the D-loop region is responsible for the control ofreplication and transcription of mtDNA. Thus, it soundsreasonable to speculate that STAT3 may modulate themtDNA content. It is worth mentioning, however, thatprevious experimental studies in Stat3−/− pro-B cells suggestedthat neithermtDNAcontent normitochondrial concentrationsof mitochondrial-encoded RNAs were affected by the absenceof Stat3 [9,24]. Thus, the discrepancies between the experi-mental data and our findings deserve further investigation.
Furthermore, several pieces of evidence can be linkedtogether to support our results and explain how STAT3 andmtDNA content may be biologically related. First, mtDNAdepletion may contribute to tumorigenesis, as mtDNA copynumber is diminished in many types of cancers, includingovarian, gastric, hepatocellular, and renal cell and carcinoma[25]; and STAT3 is an oncogene persistently active in a highproportion of all human cancers [26]. In addition, mitochon-drial STAT3 is involved in altered glycolytic and oxidativephosphorylation activities of cancer cells [24]. Second, mtDNAdepletion was associated with metabolic syndrome andinsulin resistance [15,27,28]; and STAT3 gene variation wasassociated with nonalcoholic fatty liver diseases in patientswithmetabolic syndrome [17]. Third, we showed that mtDNA/nDNA ratio was significantly lower in both extremes ofabnormal fetal growth [29]; and STAT3 is involved in earlyembryogenesis and postnatal survival and growth [30,31].Furthermore, aging and life span are closely correlated withmtDNA damage and content [32]; and STAT3 has beenassociated with age-related heart failure in mice [33]. Finally,there are a convincing number of studies showing that highlyactive antiretroviral therapy produces a depletion of mtDNAcontent. Surprisingly, nelfinavir disrupts STAT3 signaling byblocking interleukin-6–induced phosphorylation of STAT3 andinhibited STAT3 DNA binding activity [34]. Our findings abouta significant association between STAT3 variation and meta-bolic parameters of insulin resistance may add some cluesabout the putative physiologic impact of our results. In fact, arecent report showed that STAT3 signaling is mechanisticallyrelated to the development of hepatic insulin resistance anddyslipidemia [35].
Until now, the interaction between the mitochondrial andnuclear genomes in terms of regulation of mitochondrial
the STAT3, rs9891119 (A) and rs6503695 (B), at chromosome 17nas diamonds) (based onHapMapdata for CEU) as a functione locus andnearbygenes. The regional associationplotsweret.edu/mpg/snap/http://www.broad.mit.edu/mpg/snap/.
opy number is modulated by genetic variation in the signal(2011), doi:10.1016/j.metabol.2010.12.008
6 M E T A B O L I S M C L I N I C A L A N D E X P E R I M E N T A L X X ( 2 0 1 1 ) X X X – X X X
Please cite this article as: Gianotti TF, et al, Mitochondrial DNA copy number is modulated by genetic variation in the signaltransducer and activator of transcription 3 (STAT3), Metabolism (2011), doi:10.1016/j.metabol.2010.12.008

7M E T A B O L I S M C L I N I C A L A N D E X P E R I M E N T A L X X ( 2 0 1 1 ) X X X – X X X
biogenesis has been mostly focused on some particularnuclear genes. For instance, previous evidence showed thatTFAM controls the mitochondrial copy number by recognitionof mtDNA sequence motifs, which are involved in the mtDNAtranscription and replication machineries [36]. Afterward, inaddition to the STAT3 variants, we also evaluated whether 2functional polymorphisms of the genes TFAM and PPARGwereassociated with mtDNA content. We did not observe anysignificant association between leukocytemtDNA content andthese variants evenafter adjustment for potential confounderssuch as age andHOMA index. Althoughwewere unable to finda significant association between PPARG and TFAM polymor-phisms andmtDNA content, we do not exclude the possibilitythat a novel or untyped variant in linkage equilibriumwith theselected SNPs in the previously mentioned genes may beinvolved in the regulation of mtDNA content.
As a final comment, it is noteworthy that the STAT3 tagSNPs genotyped in our study represent another 24 genevariants [17] (including 3 SNPs in the 3′UTR region and 21intronic SNPs); thus, they may be not necessarily the causalvariant. Although our study does not answer the question ofhow these SNPs exert their effect on mtDNA content, it isimportant to note that analyzing the functional effect of SNPswill not always explain the mechanism by which the SNPalleles cause the phenotypic changes. In particular, becauseany alteration in DNA sequencemay have an effect other thangene expression and protein function, SNPs in the 3′ caninfluence RNA half-life and ribosomal translation of mRNA;and intronic SNPs may interfere with the mRNA processing[37]. Moreover, the variants canmodulate the function of othergenes on different chromosomes. For instance, annotation ofnearby SNPs in LD (proxies) with the rs9891119 and rs6503695variants based on HapMap data shows that although theputatively associated variants are in the STAT3 locus, they alsorepresent some other variants, despite having a low r2, of 2nearby loci (PTRF, RNA polymerase I and transcript releasefactor and STAT5A, signal transducer and activator of tran-scription 5A) (Fig. 4).
Finally, the STAT3 variants identified in our study werefound in association with other human diseases [38-40],suggesting that they or their tagged SNPs may have any affecton STAT3 protein or transcription. Moreover, the rs6503695 isin high LD with the rs4796793, a variant located in the STAT3promoter region that may have functional effects on geneexpression by affecting transcription factor binding sitesactivity [41].
In summary, the mechanism underlying the role of theSTAT3 gene variation in the regulation ofmtDNA copy numberremains under investigation. Nevertheless, our findings mayopen new avenues of investigation toward understanding theimpact of STAT3 polymorphisms on mtDNA dynamics and itsinfluence on the susceptibility of human diseases.
Acknowledgment
Source of funding: This study was partially supported bygrants M055 (UBACyT, Universidad de Buenos Aires), PICT2006-124, and PICT 2008-1521 (Agencia Nacional de PromociónCientífica y Tecnológica), and Consejo de Investigación en
Please cite this article as: Gianotti TF, et al, Mitochondrial DNA ctransducer and activator of transcription 3 (STAT3), Metabolism
Salud, Gobierno de la Ciudad de Buenos Aires. TFG, ALB, MSR,SS, and CJP belong to Consejo Nacional de InvestigacionesCientíficas. SS and GC belong to Consejo de Investigación enSalud, Gobierno de la Ciudad de Buenos Aires.
R E F E R E N C E S
[1] Veltri KL, Espiritu M, Singh G. Distinct genomic copy numberinmitochondria of differentmammalian organs. J Cell Physiol1990;143:160–4.
[2] Robin ED, Wong R. Mitochondrial DNA molecules and virtualnumber of mitochondria per cell in mammalian cells. J CellPhysiol 1988;136:507–13.
[3] Chinnery PF, Schon EA. Mitochondria. J Neurol NeurosurgPsychiatry 2003;74:1188–99.
[4] Tang Y, Schon EA, Wilichowski E, et al. Rearrangements ofhuman mitochondrial DNA (mtDNA): new insights into theregulation of mtDNA copy number and gene expression. MolBiol Cell 2000;11:1471–85.
[5] Moraes CT. What regulates mitochondrial DNA copy numberin animal cells? Trends Genet 2001;17:199–205.
[6] Miglio G, Rosa AC, Rattazzi L, et al. PPARgamma stimulationpromotes mitochondrial biogenesis and prevents glucosedeprivation-induced neuronal cell loss. Neurochem Int2009;55:496–504.
[7] Wilson-Fritch L, Burkart A, Bell G, et al. Mitochondrialbiogenesis and remodeling during adipogenesis and inresponse to the insulin sensitizer rosiglitazone. Mol Cell Biol2003;23:1085–94.
[8] Puigserver P, Wu Z, Park CW, et al. A cold-induciblecoactivator of nuclear receptors linked to adaptive thermo-genesis. Cell 1998;92:829–39.
[9] Wegrzyn J, Potla R, Chwae YJ, et al. Function of mitochondrialStat3 in cellular respiration. Science 2009;323:793–7.
[10] Bai RK, Perng CL, Hsu CH, et al. Quantitative PCR analysis ofmitochondrial DNA content in patients with mitochondrialdisease. Ann N Y Acad Sci 2004;1011:304–9.
[11] Alvarez V, Corao AI, Sanchez-Ferrero E, et al. Mitochondrialtranscription factor A (TFAM) gene variation in Parkinson'sdisease. Neurosci Lett 2008;432:79–82.
[12] Alvarez V, Corao AI, Alonso-Montes C, et al. Mitochondrialtranscription factor A (TFAM) gene variation and risk of late-onset Alzheimer's disease. J Alzheimers Dis 2008;13:275–80.
[13] Curran JE, Jowett JB, Abraham LJ, et al. Genetic variation inPARL influences mitochondrial content. Hum Genet 2010;127:183–90.
[14] Kawasaki ES. Sample preparation from blood, cells, and otherfluids. In: Innis MA, Gelfand DH, Sninsky JJ, et al, editors. PCRprotocols. A guide to methods and applications. San Diego(Calif): Academic Press, INC; 1990. p. 146–52.
[15] Gianotti TF, Sookoian S, Dieuzeide G, et al. A decreasedmitochondrial DNA content is related to insulin resistance inadolescents. Obesity (Silver Spring) 2008;16:1591–5.
[16] Rutledge RG. Sigmoidal curve-fitting redefines quantitativereal-time PCR with the prospective of developing automatedhigh-throughput applications. Nucleic Acids Res 2004;32:e178.
[17] Sookoian S, Castano G, Gianotti TF, et al. Genetic variants inSTAT3 are associated with nonalcoholic fatty liver disease.Cytokine 2008;44:201–6.
[18] Myakishev MV, Khripin Y, Hu S, et al. High-throughput SNPgenotyping by allele-specific PCR with universal energy-transfer–labeled primers. Genome Res 2001;11:163–9.
[19] Purcell S, Neale B, Todd-Brown K, et al. PLINK: a tool set forwhole-genome association and population-based linkageanalyses. Am J Hum Genet 2007;81:559–75.
opy number is modulated by genetic variation in the signal(2011), doi:10.1016/j.metabol.2010.12.008

8 M E T A B O L I S M C L I N I C A L A N D E X P E R I M E N T A L X X ( 2 0 1 1 ) X X X – X X X
[20] Deeb SS, Fajas L, Nemoto M, et al. A Pro12Ala substitution inPPARgamma2 associated with decreased receptor activity,lower body mass index and improved insulin sensitivity. NatGenet 1998;20:284–7.
[21] Gunther C, von HK, Muller-Thomsen T, et al. Possibleassociation of mitochondrial transcription factor A (TFAM)genotype with sporadic Alzheimer disease. Neurosci Lett2004;369:219–23.
[22] Levy DE, Lee CK. What does Stat3 do? J Clin Invest 2002;109:1143–8.
[23] Vassilev AO, Lorenz DR, Tibbles HE, et al. Role of theleukemia-associated transcription factor STAT3 in plateletphysiology. Leuk Lymphoma 2002;43:1461–7.
[24] Gough DJ, Corlett A, Schlessinger K, et al. MitochondrialSTAT3 supports Ras-dependent oncogenic transformation.Science 2009;324:1713–6.
[25] Higuchi M. Regulation of mitochondrial DNA content andcancer. Mitochondrion 2007;7:53–7.
[26] Inghirami G, Chiarle R, Simmons WJ, et al. New and oldfunctions of STAT3: a pivotal target for individualizedtreatment of cancer. Cell Cycle 2005;4:1131–3.
[27] Kelley DE, He J, Menshikova EV, et al. Dysfunction ofmitochondria in human skeletal muscle in type 2 diabetes.Diabetes 2002;51:2944–50.
[28] Song J, Oh JY, Sung YA, et al. Peripheral blood mitochondrialDNA content is related to insulin sensitivity in offspring oftype 2 diabetic patients. Diabetes Care 2001;24:865–9.
[29] Gemma C, Sookoian S, Alvarinas J, et al. Mitochondrial DNAdepletion in small- and large-for-gestational-age newborns.Obesity (Silver Spring) 2006;14:2193–9.
[30] Shen Y, Schlessinger K, Zhu X, et al. Essential role of STAT3 inpostnatal survival and growth revealed bymice lacking STAT3serine 727 phosphorylation. Mol Cell Biol 2004;24:407–19.
[31] Takeda K, Noguchi K, Shi W, et al. Targeted disruption of themouse Stat3 gene leads to early embryonic lethality. Proc NatlAcad Sci U S A 1997;94:3801–4.
Please cite this article as: Gianotti TF, et al, Mitochondrial DNAtransducer and activator of transcription 3 (STAT3), Metabolism
[32] Barazzoni R, Short KR, Nair KS. Effects of aging on mito-chondrial DNA copy number and cytochrome c oxidase geneexpression in rat skeletal muscle, liver, and heart. J Biol Chem2000;275:3343–7.
[33] Jacoby JJ, Kalinowski A, Liu MG, et al. Cardiomyocyte-restricted knockout of STAT3 results in higher sensitivity toinflammation, cardiac fibrosis, and heart failure with ad-vanced age. Proc Natl Acad Sci U S A 2003;100:12929–34.
[34] Yang Y, Ikezoe T, Takeuchi T, et al. HIV-1 protease inhibitorinduces growth arrest and apoptosis of human prostatecancer LNCaP cells in vitro and in vivo in conjunction withblockade of androgen receptor STAT3 and AKT signaling.Cancer Sci 2005;96:425–33.
[35] ElamMB, Yellaturu C, Howell GE, et al. Dysregulation of sterolregulatory element binding protein-1c in livers of morbidlyobese women is associated with altered suppressor ofcytokine signaling–3 and signal transducer and activator oftranscription–1 signaling. Metabolism 2010;59:587–98.
[36] Bonawitz ND, Clayton DA, Shadel GS. Initiation and beyond:multiple functions of the human mitochondrial transcriptionmachinery. Mol Cell 2006;24:813–25.
[37] Pagani F, Baralle FE. Genomic variants in exons and introns:identifying the splicing spoilers. Nat Rev Genet 2004;5:389–96.
[38] Jakkula E, Leppa V, Sulonen AM, et al. Genome-wideassociation study in a high-risk isolate for multiple sclerosisreveals associated variants in STAT3 gene. Am J Hum Genet2010;86:285–91.
[39] Barrett JC, Hansoul S, Nicolae DL, et al. Genome-wideassociation defines more than 30 distinct susceptibility locifor Crohn's disease. Nat Genet 2008;40:955–62.
[40] Holland SM, DeLeo FR, Elloumi HZ, et al. STAT3 mutations inthe hyper-IgE syndrome. N Engl J Med 2007;357:1608–19.
[41] Xu Z, Taylor JA. SNPinfo: integrating GWAS and candidategene information into functional SNP selection for geneticassociation studies. Nucleic Acids Res 2009;37:W600–5.
copy number is modulated by genetic variation in the signal(2011), doi:10.1016/j.metabol.2010.12.008