minnesota comprehensive assessments-series iii
TRANSCRIPT
Minnesota Comprehensive Assessments-Series III
Science Item SamplerGrade HS
18 Point
ITEM SAMPLERS ARE NOT SECURE TEST MATERIALS. THIS ITEM SAMPLER TEST BOOK MAY BE COPIED
OR DUPLICATED.
Name

State of Minnesota © Copyright Minnesota Department of Education
Roseville, MN 55113-4266
3
Go on to the next page.
Science TestGeneral Directions
• This test contains two segments.
• You may write in this test book or use scratch paper.
• All answers must be marked in this test book.
• This test has four kinds of questions.
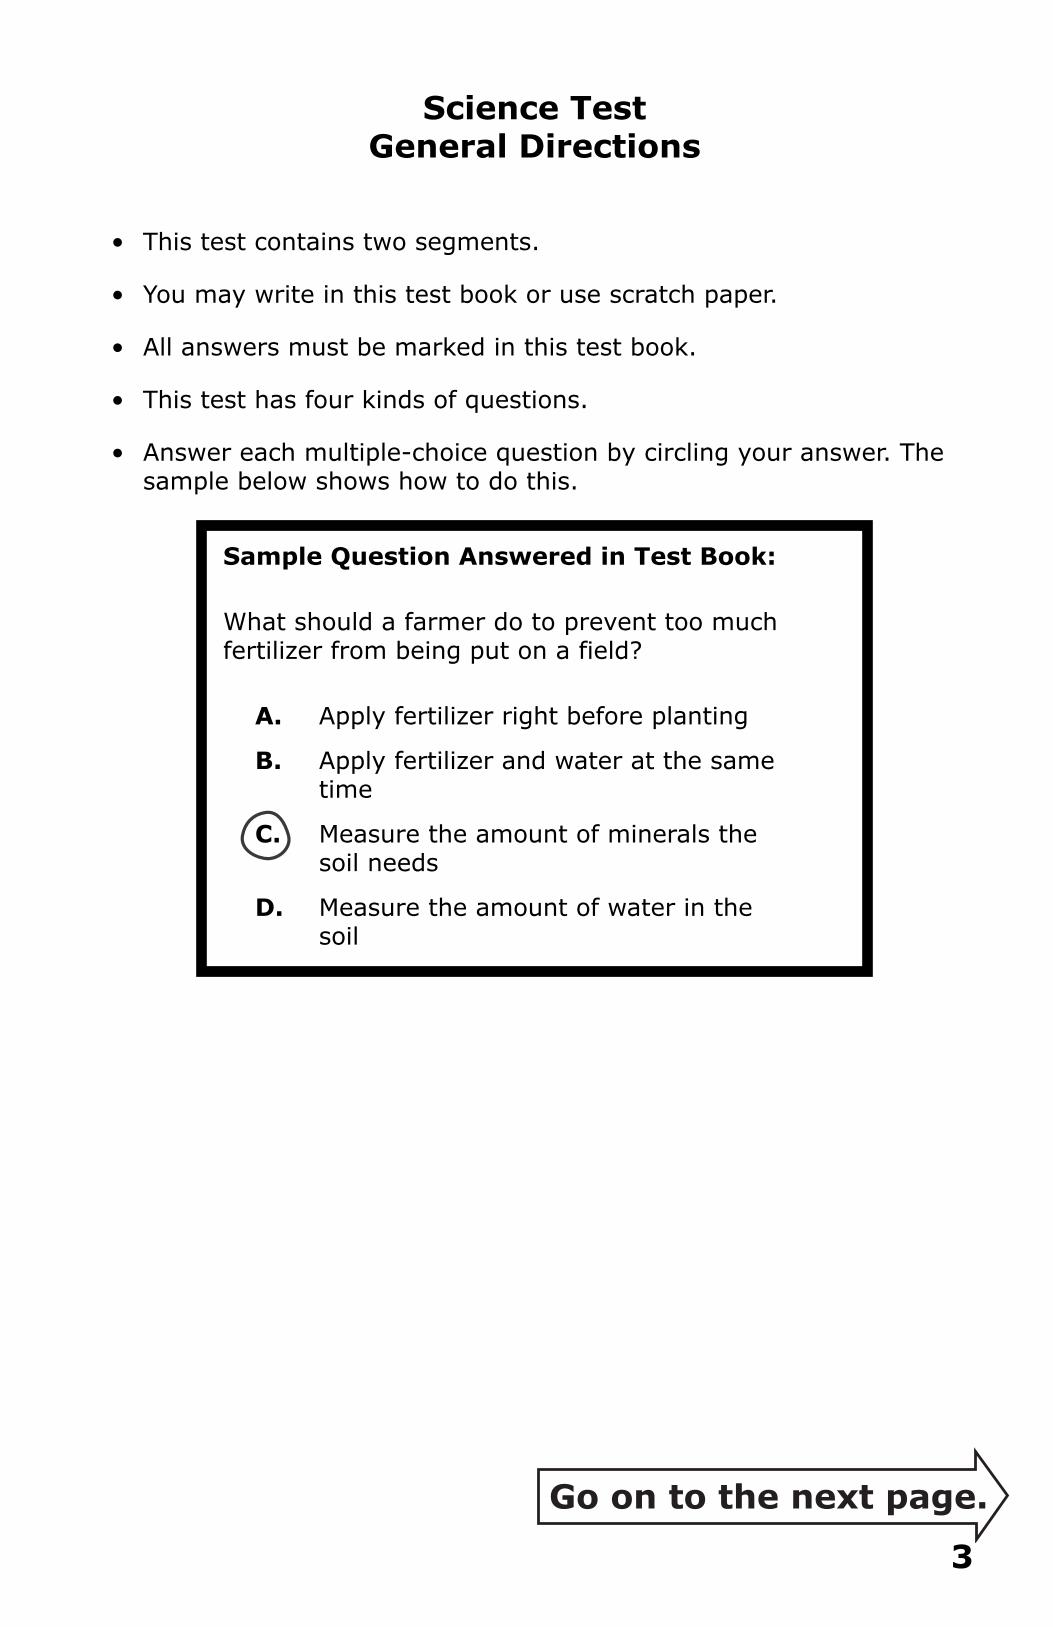
• Answer each multiple-choice question by circling your answer. The sample below shows how to do this.
Sample Question Answered in Test Book:
What should a farmer do to prevent too much fertilizer from being put on a field?
A. Apply fertilizer right before planting
B. Apply fertilizer and water at the same time
C. Measure the amount of minerals the soil needs
D. Measure the amount of water in the soil
4
Go on to the next page.
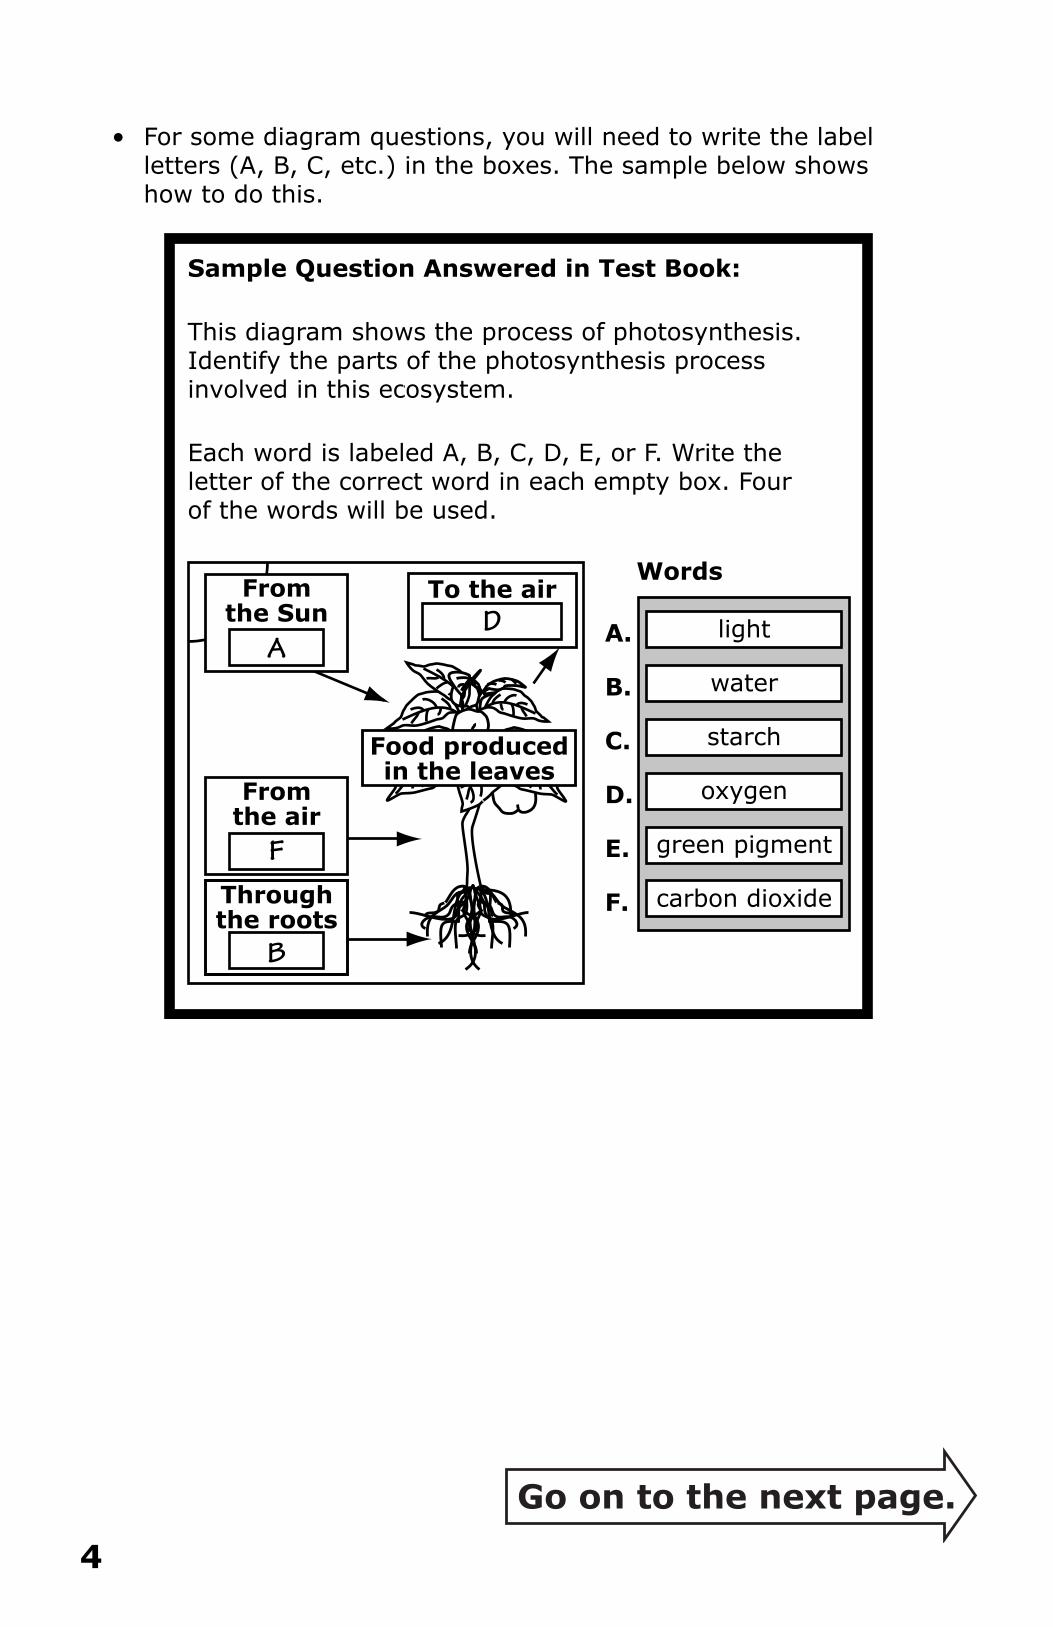
• For some diagram questions, you will need to write the label letters (A, B, C, etc.) in the boxes. The sample below shows how to do this.
Sample Question Answered in Test Book:
This diagram shows the process of photosynthesis.Identify the parts of the photosynthesis process involved in this ecosystem.
Each word is labeled A, B, C, D, E, or F. Write the letter of the correct word in each empty box. Four of the words will be used.
450212_sample
carbon dioxide
light
water
starch
oxygen
green pigment
Words
A.
B.
C.
D.
E.
F.
Food producedin the leaves
Fromthe Sun
A
Throughthe roots
B
Fromthe air
F
To the airD

5
Go on to the next page.
There is no test material on this page.
6
Go on to the next page.
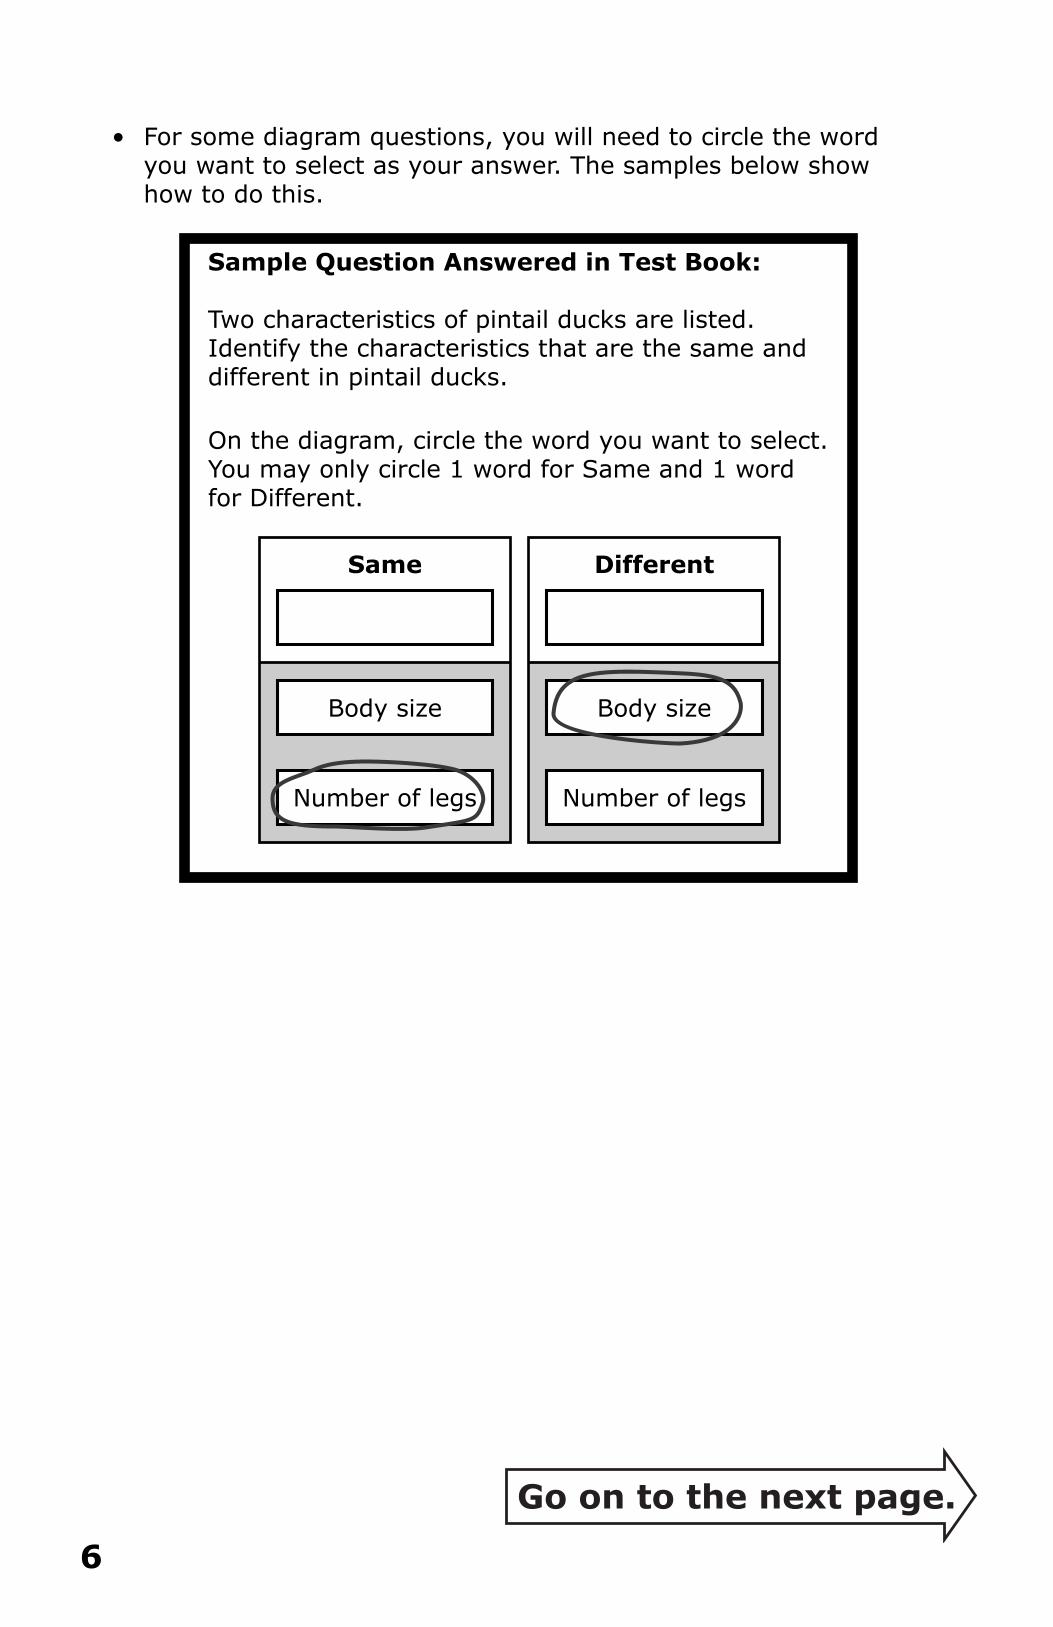
• For some diagram questions, you will need to circle the word you want to select as your answer. The samples below show how to do this.
Sample Question Answered in Test Book:
Two characteristics of pintail ducks are listed. Identify the characteristics that are the same and different in pintail ducks.
On the diagram, circle the word you want to select. You may only circle 1 word for Same and 1 word for Different.
Same
Body size
Number of legs
Body size
Number of legs
Different
7
Go on to the next page.
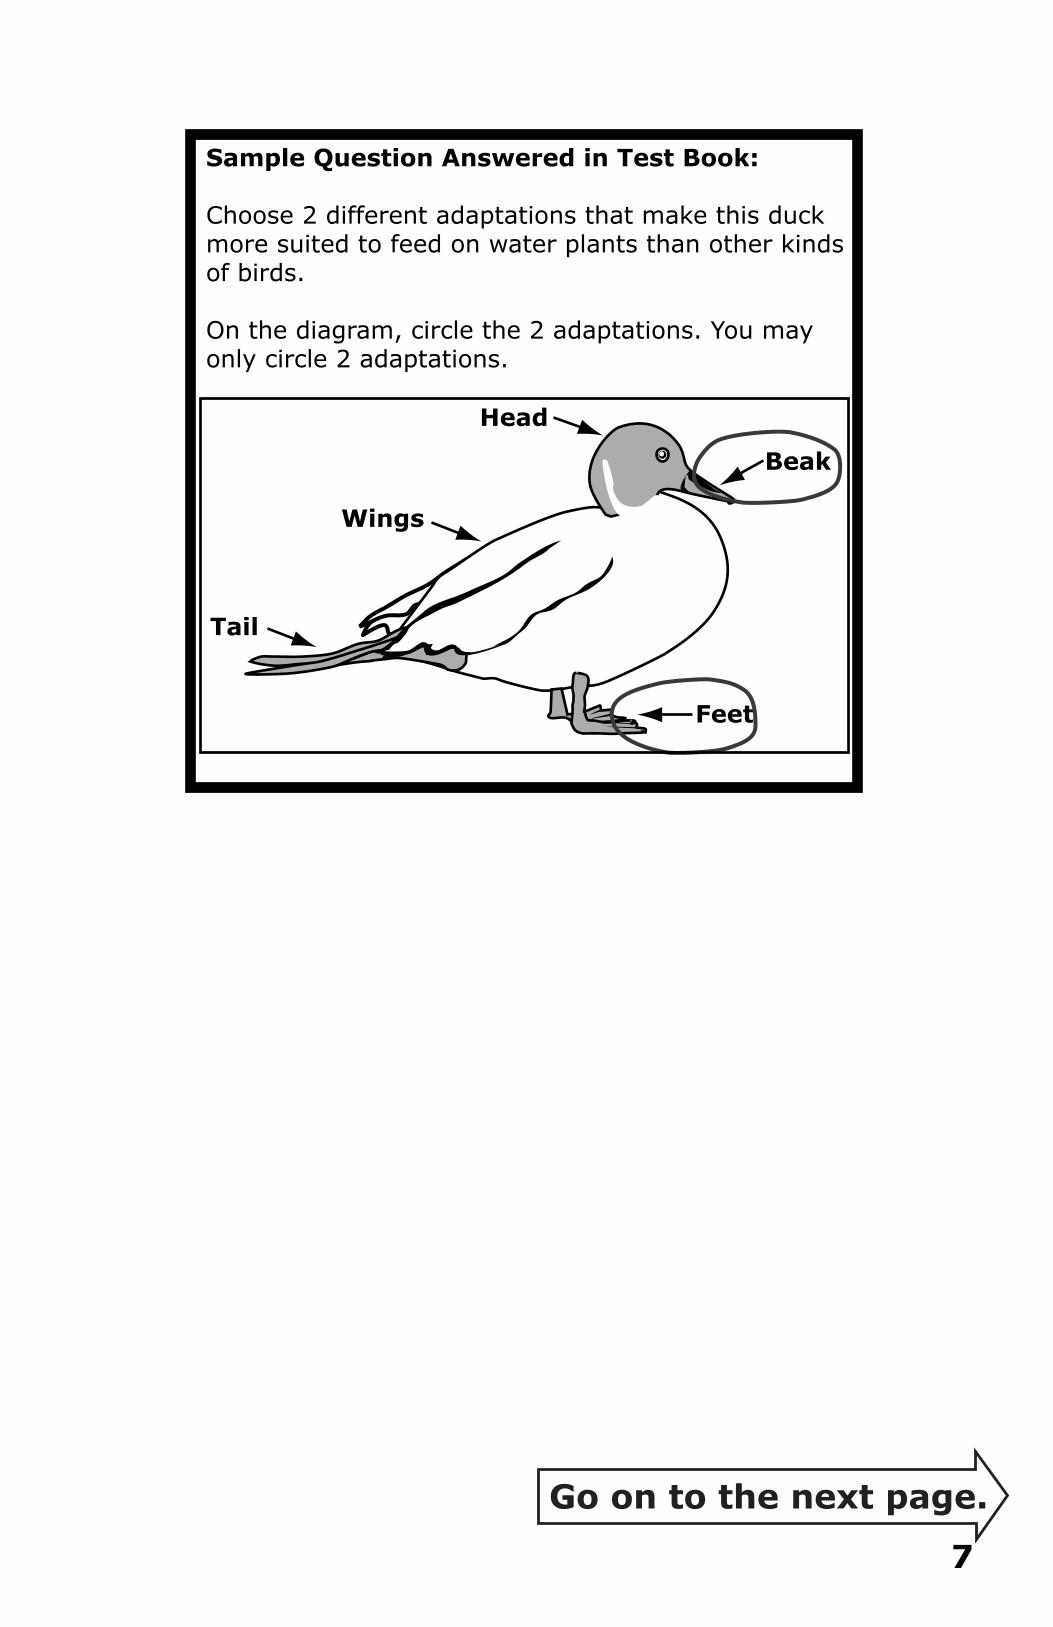
Sample Question Answered in Test Book:
Choose 2 different adaptations that make this duck more suited to feed on water plants than other kinds of birds.
On the diagram, circle the 2 adaptations. You may only circle 2 adaptations.
Head
Beak
Feet
Tail
Wings
8
Go on to the next page.
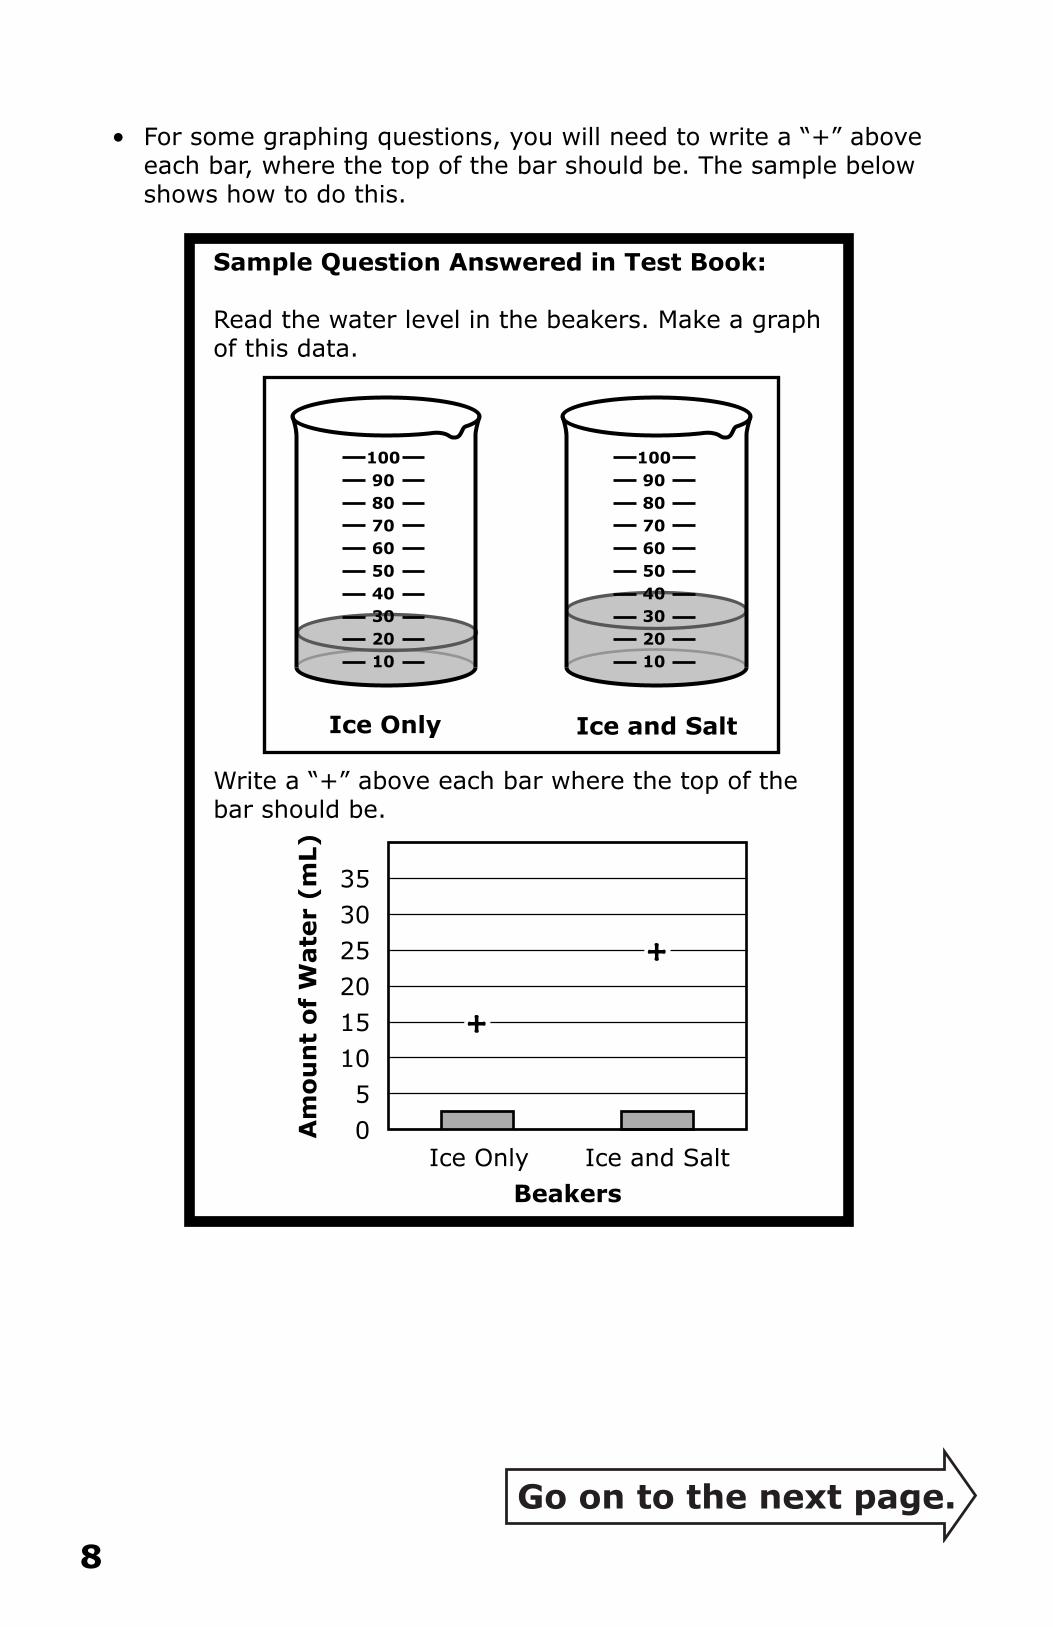
• For some graphing questions, you will need to write a “+” above each bar, where the top of the bar should be. The sample below shows how to do this.
Sample Question Answered in Test Book:
Read the water level in the beakers. Make a graph of this data.
Write a “+” above each bar where the top of the bar should be.
Ice Only Ice and Salt
35302520151050
Beakers
Am
ou
nt
of
Wate
r (m
L)
++
++
Ice and SaltIce Only

9
• When you finish a segment of the test, stop and check your answers. Then use the sticker given to you to seal it. Once you seal a segment, you cannot go back to it. Each segment must be sealed before you move on to the next segment.
STOP

10

11
1
You will be told when to begin this segment.
Segment 1
Put
stic
ker
her
e
12
Go on to the next page.
There is no test material on this page.
1
13
Go on to the next page.
1
ITEM SAMPLER MAY BE DUPLICATED.
Science Test — Segment 1
Pea Plant Genetics
14
Go on to the next page.
1
ITEM SAMPLER MAY BE DUPLICATED.
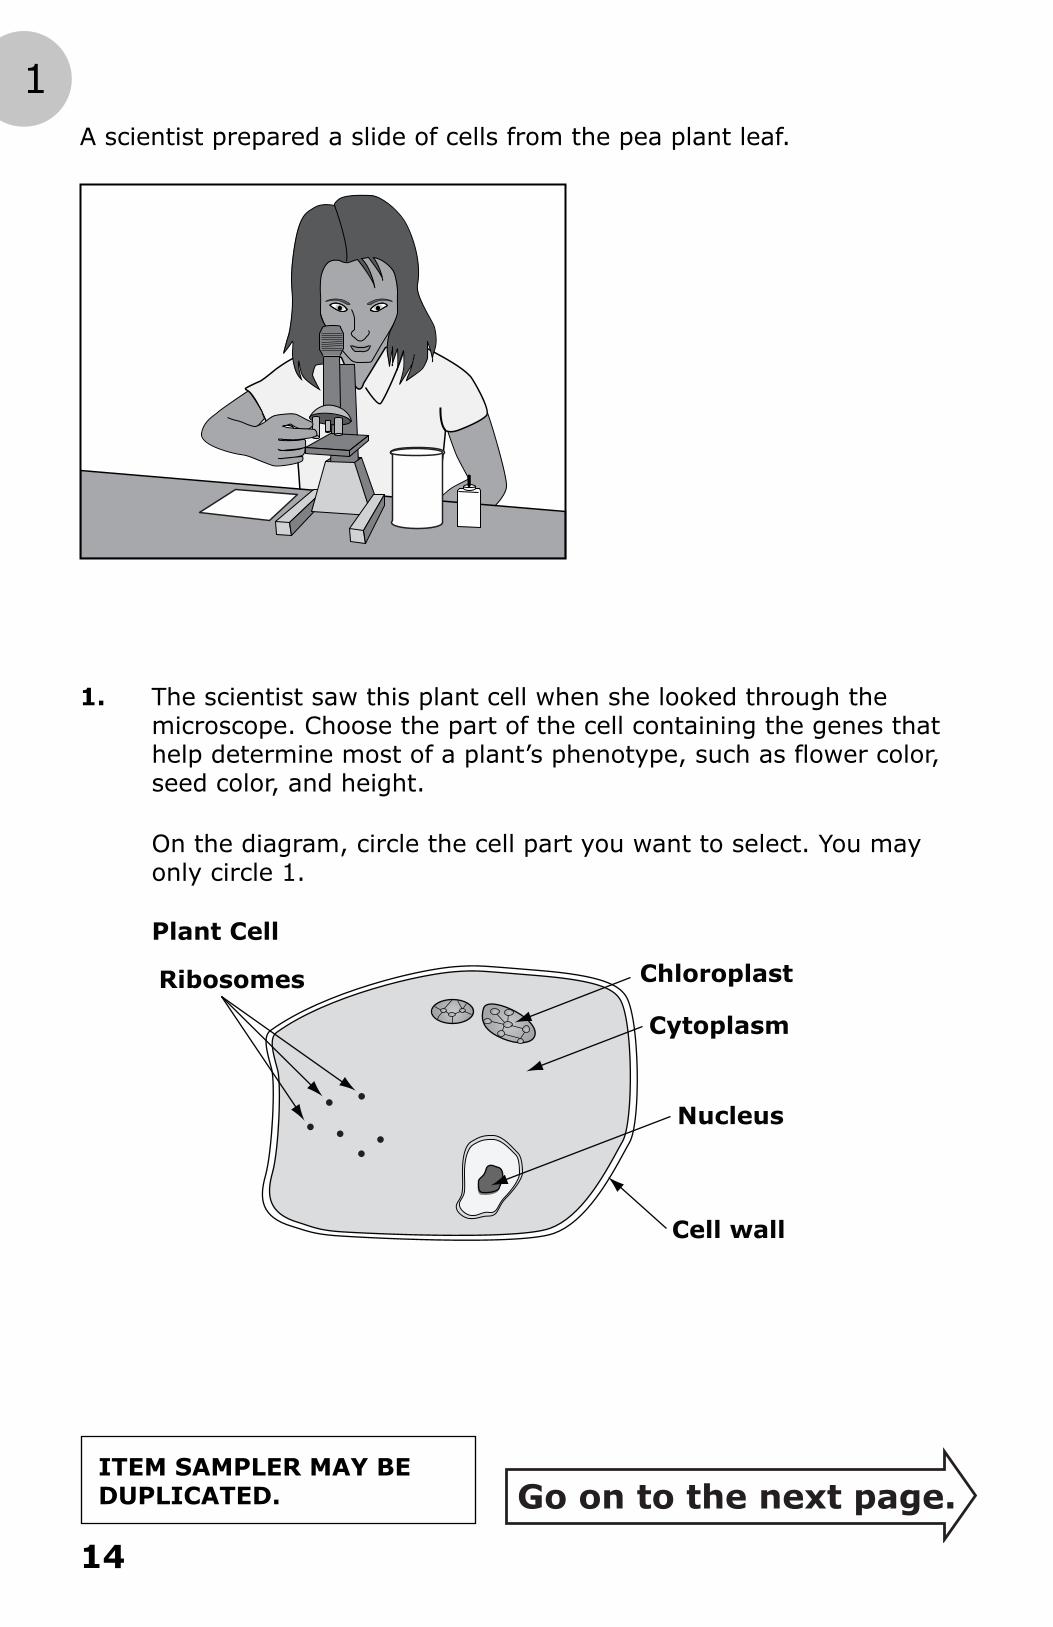
A scientist prepared a slide of cells from the pea plant leaf.
1. The scientist saw this plant cell when she looked through the microscope. Choose the part of the cell containing the genes that help determine most of a plant’s phenotype, such as flower color, seed color, and height.
On the diagram, circle the cell part you want to select. You may only circle 1.
Plant Cell
Nucleus
Cytoplasm
ChloroplastRibosomes
Cell wall
15
Go on to the next page.
1
ITEM SAMPLER MAY BE DUPLICATED.
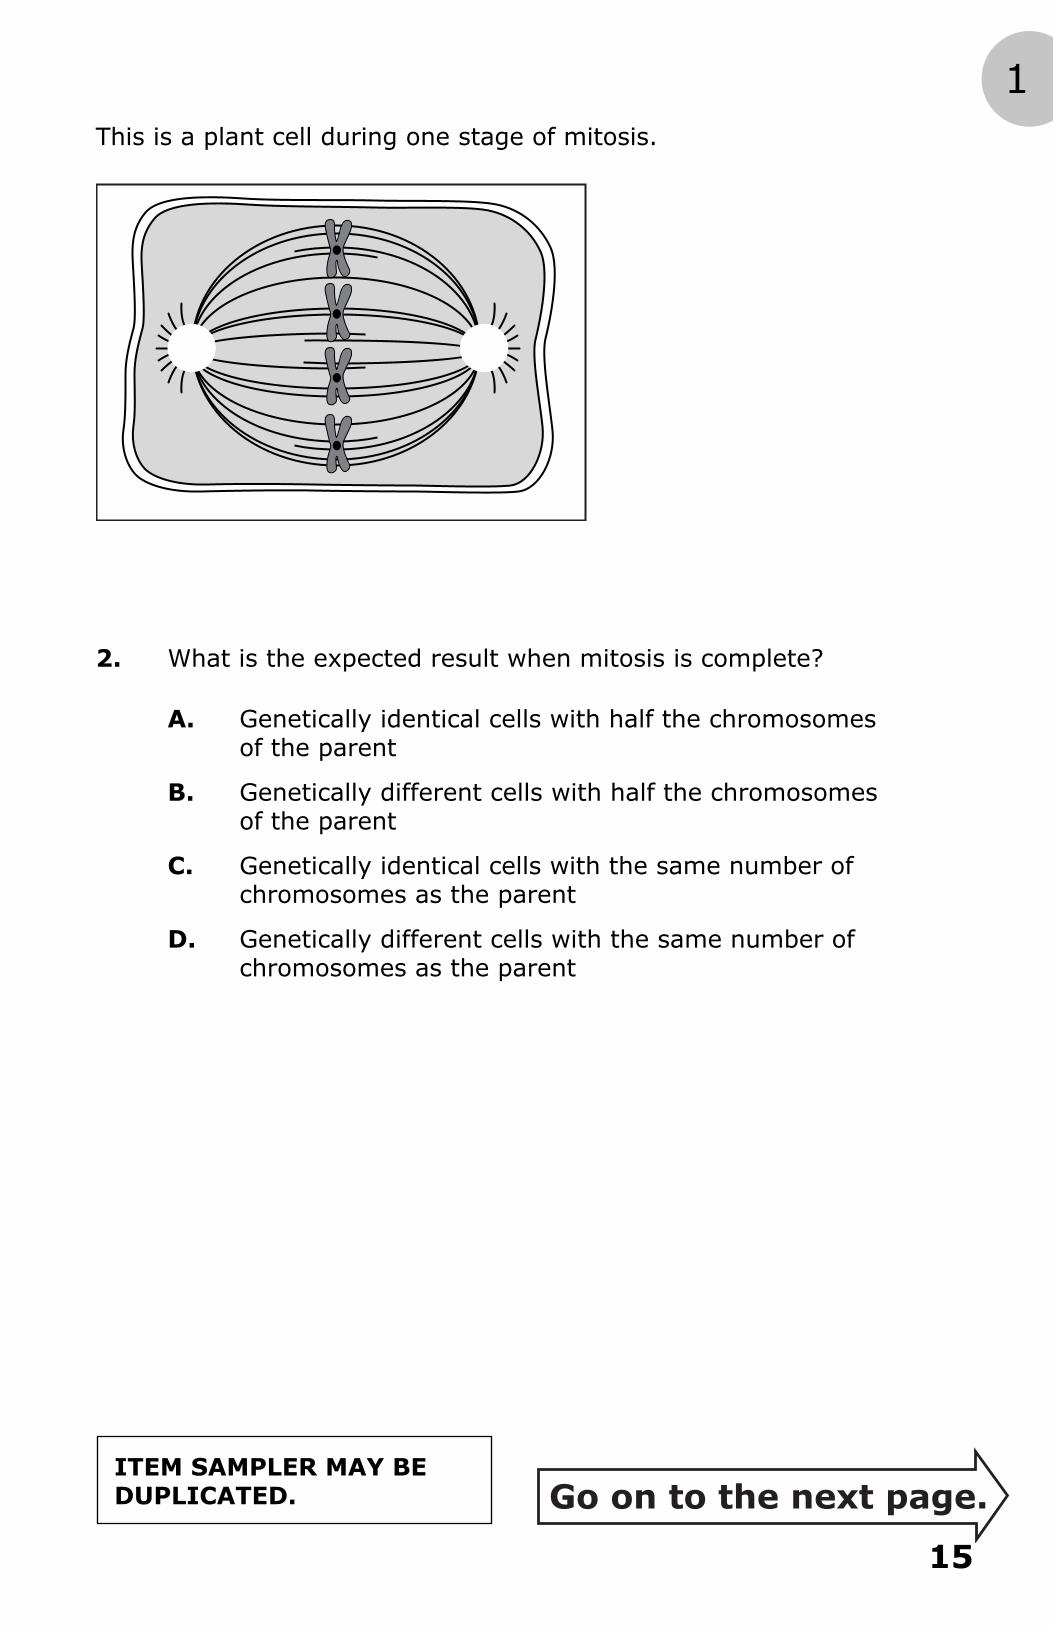
This is a plant cell during one stage of mitosis.
2. What is the expected result when mitosis is complete?
A. Genetically identical cells with half the chromosomes of the parent
B. Genetically different cells with half the chromosomes of the parent
C. Genetically identical cells with the same number of chromosomes as the parent
D. Genetically different cells with the same number of chromosomes as the parent
16
Go on to the next page.
1
ITEM SAMPLER MAY BE DUPLICATED.
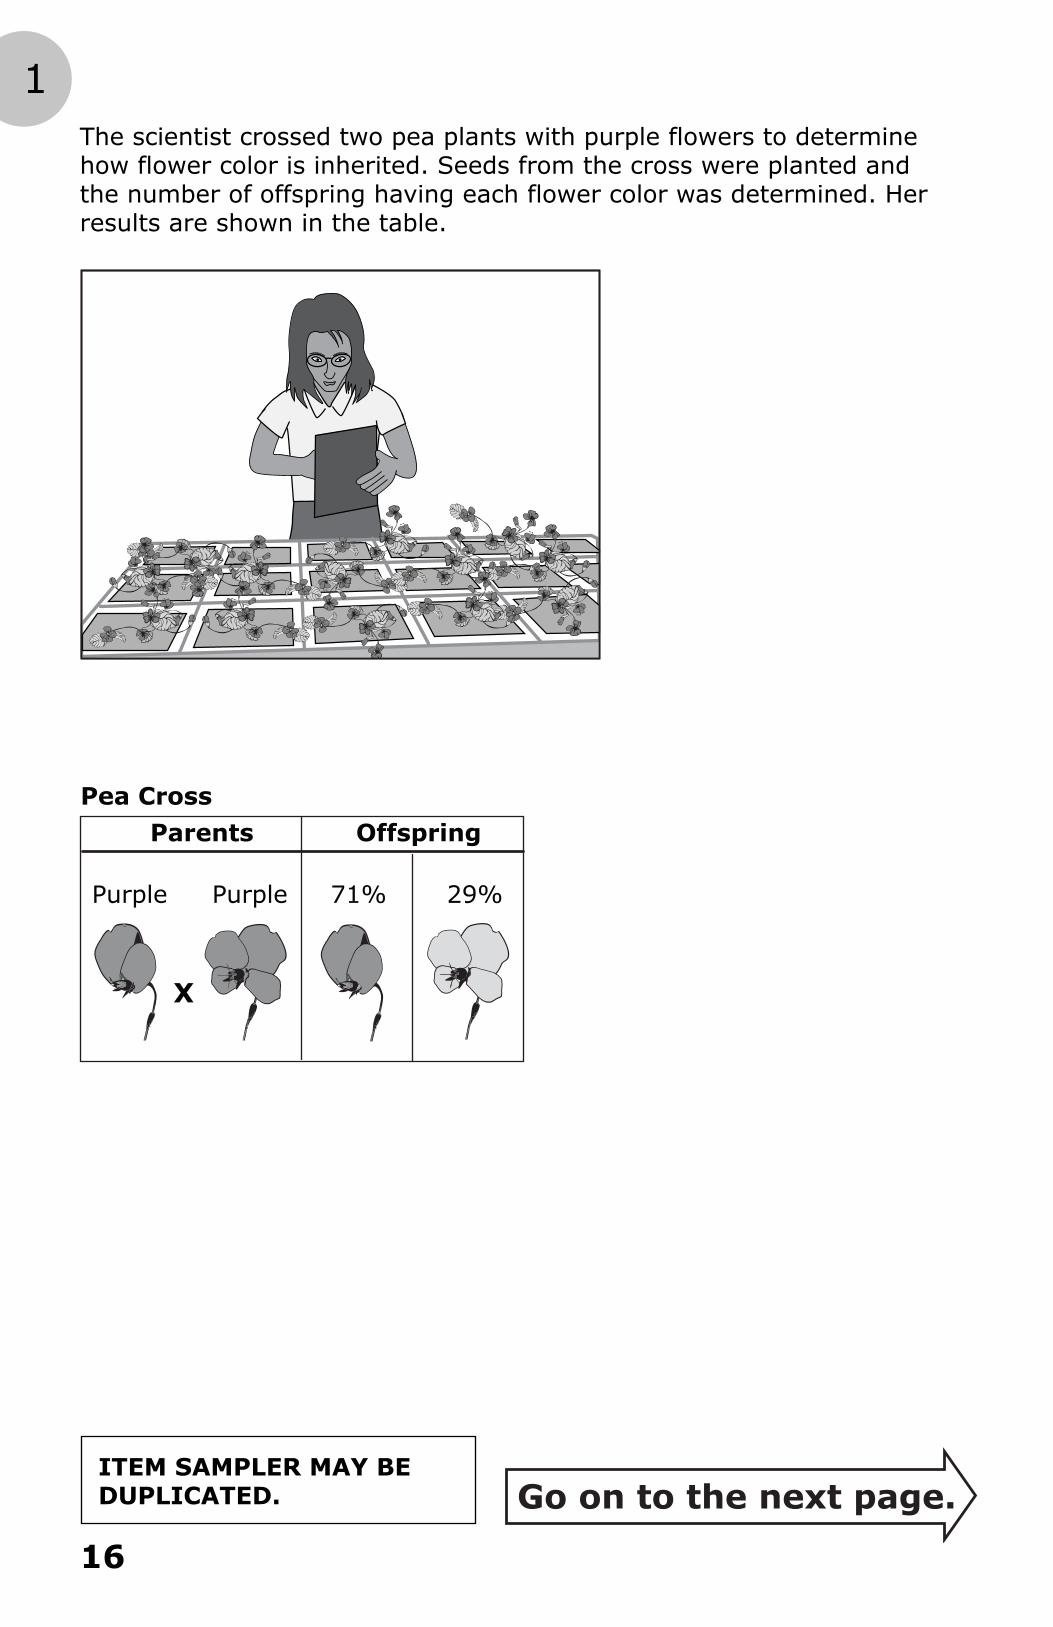
The scientist crossed two pea plants with purple flowers to determine how flower color is inherited. Seeds from the cross were planted and the number of offspring having each flower color was determined. Her results are shown in the table.
Parents
Pea Cross
Purple Purple
X
71% 29%
Offspring
17
Go on to the next page.
1
ITEM SAMPLER MAY BE DUPLICATED.
3. In this cross, the scientist predicted that the offspring would be 75% purple and 25% white. She controlled all the variables that she could to get this result. Which is the best explanation of the source of error in the result?
A. Technique used to count the offspring
B. Chance during fertilization of the ovules
C. Growing conditions for the offspring
D. Parents used in the crosses
4. Which process best shows how the information in the flower-color genes leads to flower color?
A. DNA RNA protein
B. RNA DNA protein
C. DNA protein RNA
D. Protein RNA DNA
5. A heterozygous parent and a homozygous recessive parent have offspring. Which question about the offspring is not answered by Mendel’s laws?
A. What is the probability that an individual offspring will be heterozygous?
B. What will be the phenotype of any individual offspring?
C. Approximately what fraction of a large number of offspring will display the dominant trait?
D. Approximately what fraction of a large number of offspring will display the recessive trait?
18
Go on to the next page.
1
ITEM SAMPLER MAY BE DUPLICATED.
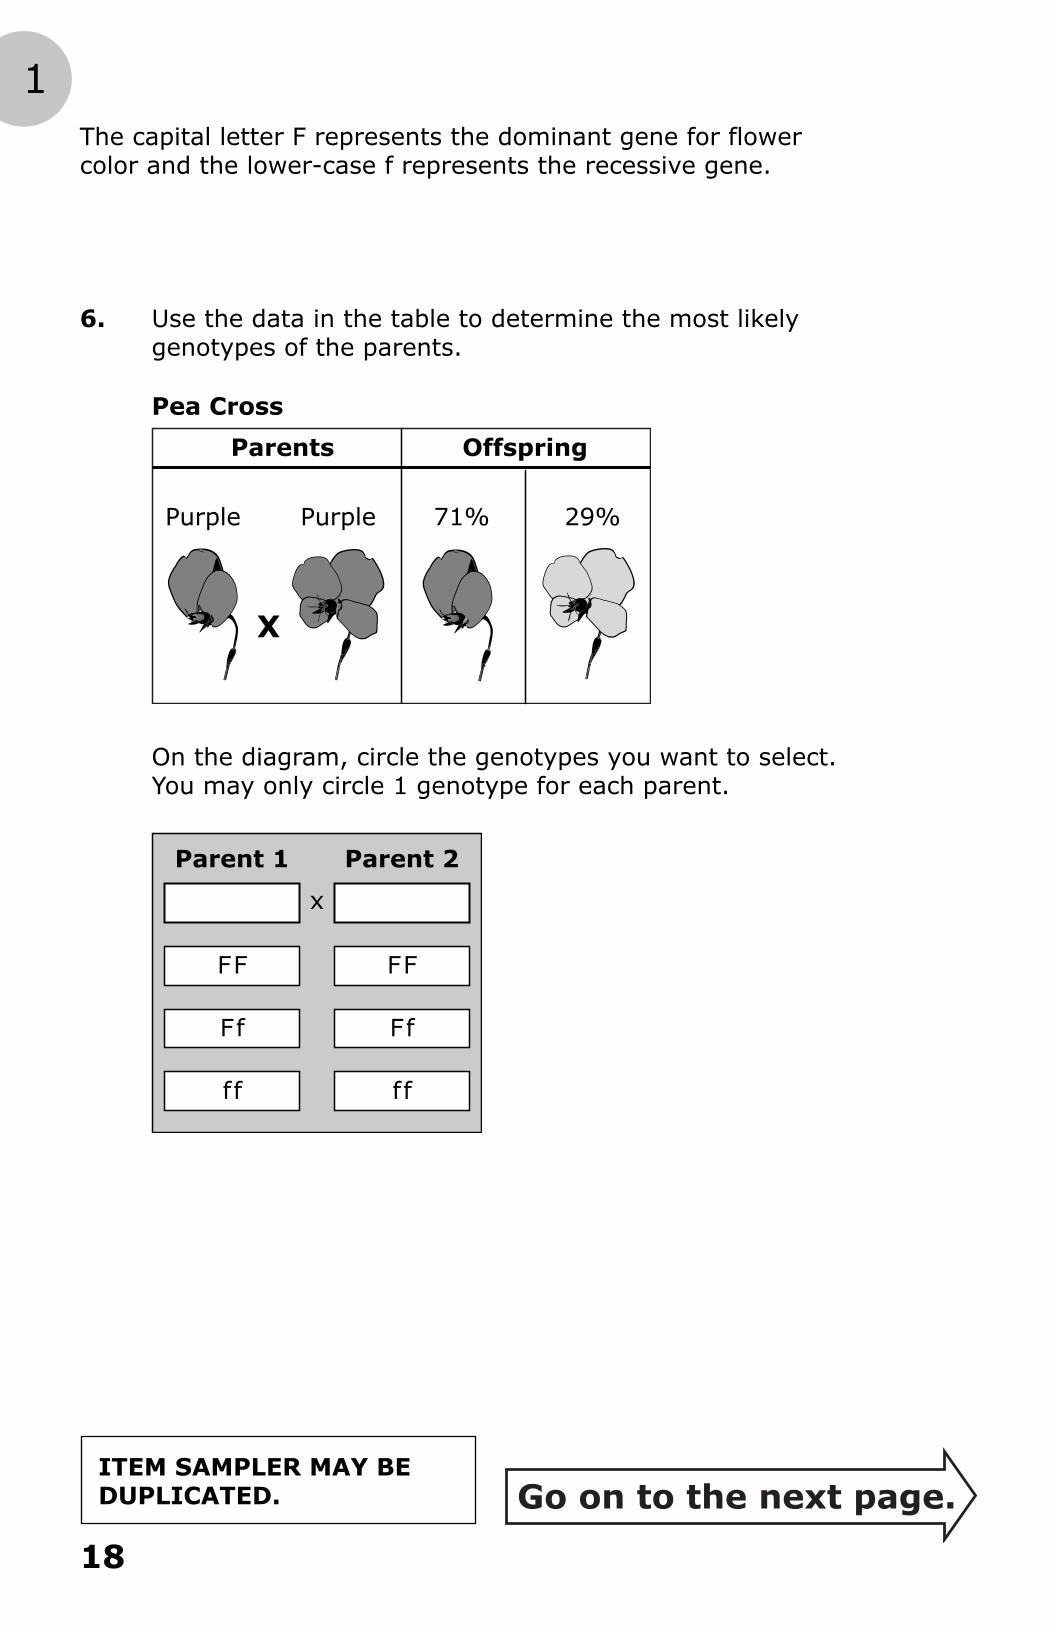
The capital letter F represents the dominant gene for flower color and the lower-case f represents the recessive gene.
6. Use the data in the table to determine the most likely genotypes of the parents.
Parents
Pea Cross
Purple Purple
X
71% 29%
Offspring
On the diagram, circle the genotypes you want to select. You may only circle 1 genotype for each parent.
Parent 1 Parent 2
x
FF
Ff
ff
FF
Ff
ff
19
Go on to the next page.
1
ITEM SAMPLER MAY BE DUPLICATED.
7. What is the probability that the first offspring of a cross between two parents with the genotypes FF and ff will display the dominant trait?
Write your answer in the box. You may use up to 5 numbers.
%

20
This is the end of Segment 1.
STOP
Put
stic
ker
her
e
21
You will be told when to begin this segment.
Segment 2
Put
stic
ker
her
e
22
Go on to the next page.
2
There is no test material on this page.
23
Go on to the next page.
2
ITEM SAMPLER MAY BE DUPLICATED.
PhotosynthesisInvestigation
Science Test — Segment 2
24
Go on to the next page.
2
ITEM SAMPLER MAY BE DUPLICATED.
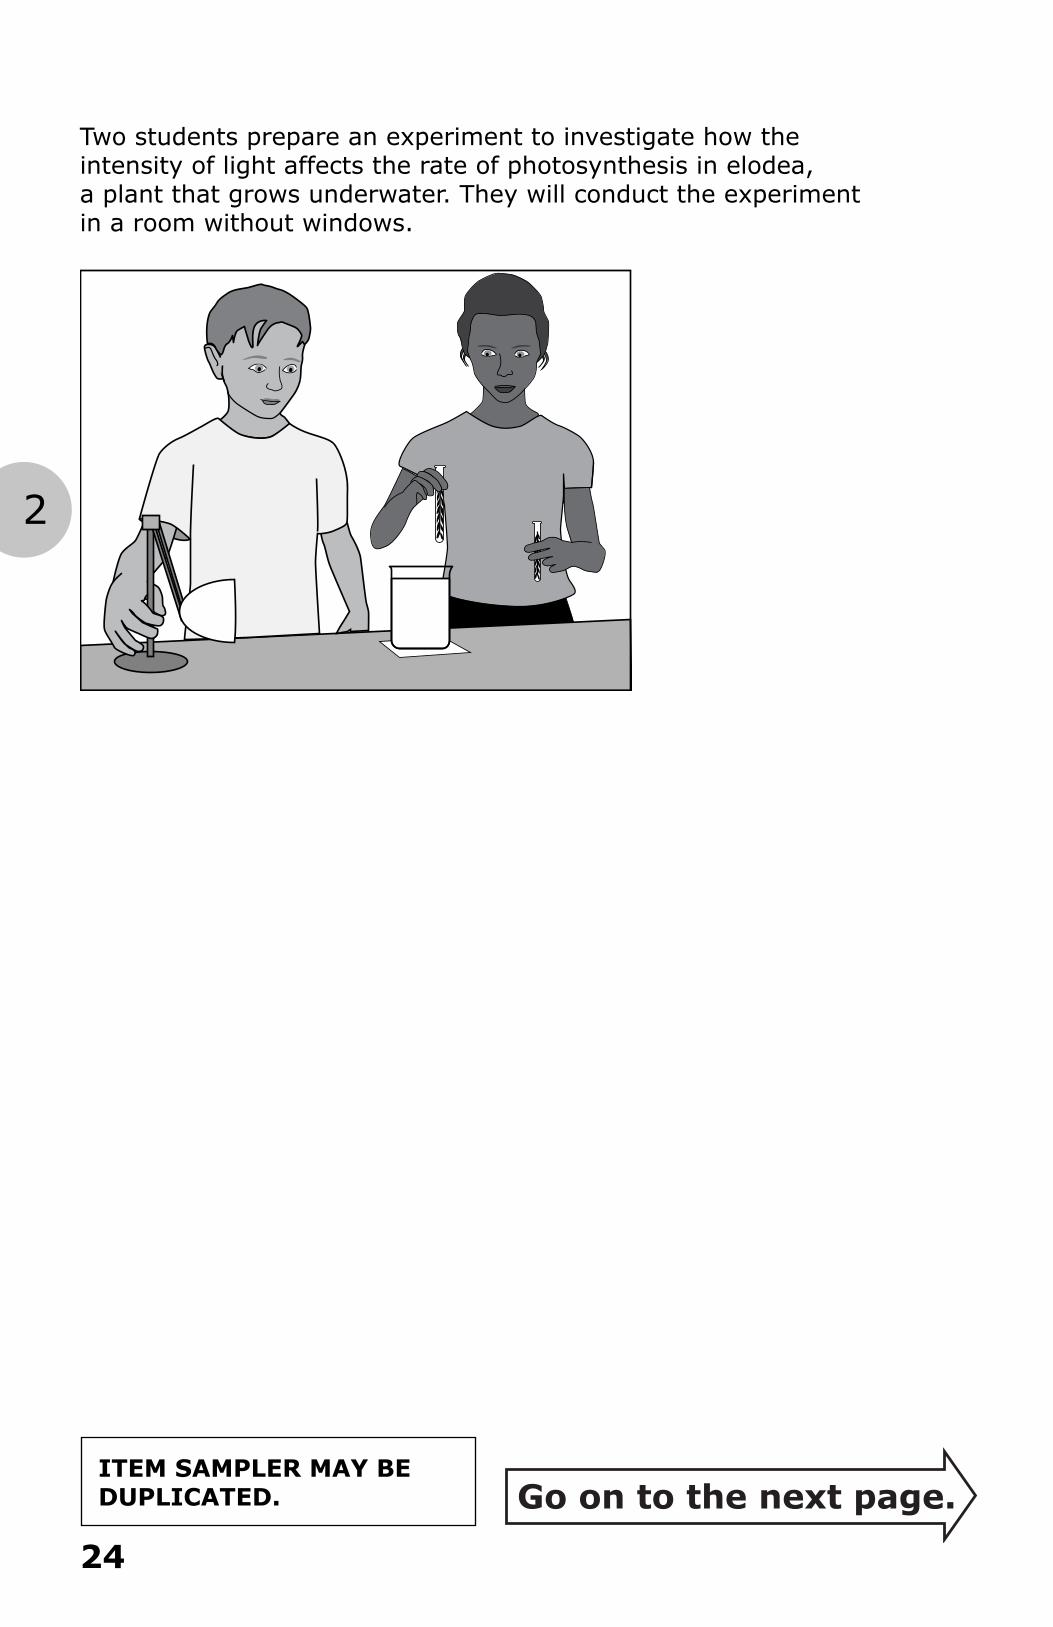
Two students prepare an experiment to investigate how the intensity of light affects the rate of photosynthesis in elodea, a plant that grows underwater. They will conduct the experiment in a room without windows.
25
Go on to the next page.
2
ITEM SAMPLER MAY BE DUPLICATED.
8. Which statement is an appropriate hypothesis for this experiment?
A. The distance from the light source to the elodea should remain the same.
B. As the light intensity increases, the rate of photosynthesis will increase.
C. The students will measure the rate of photosynthesis by counting bubbles.
D. Experimenting in a room without windows helps control the amount of light reaching the elodea.
26
Go on to the next page.
2
ITEM SAMPLER MAY BE DUPLICATED.
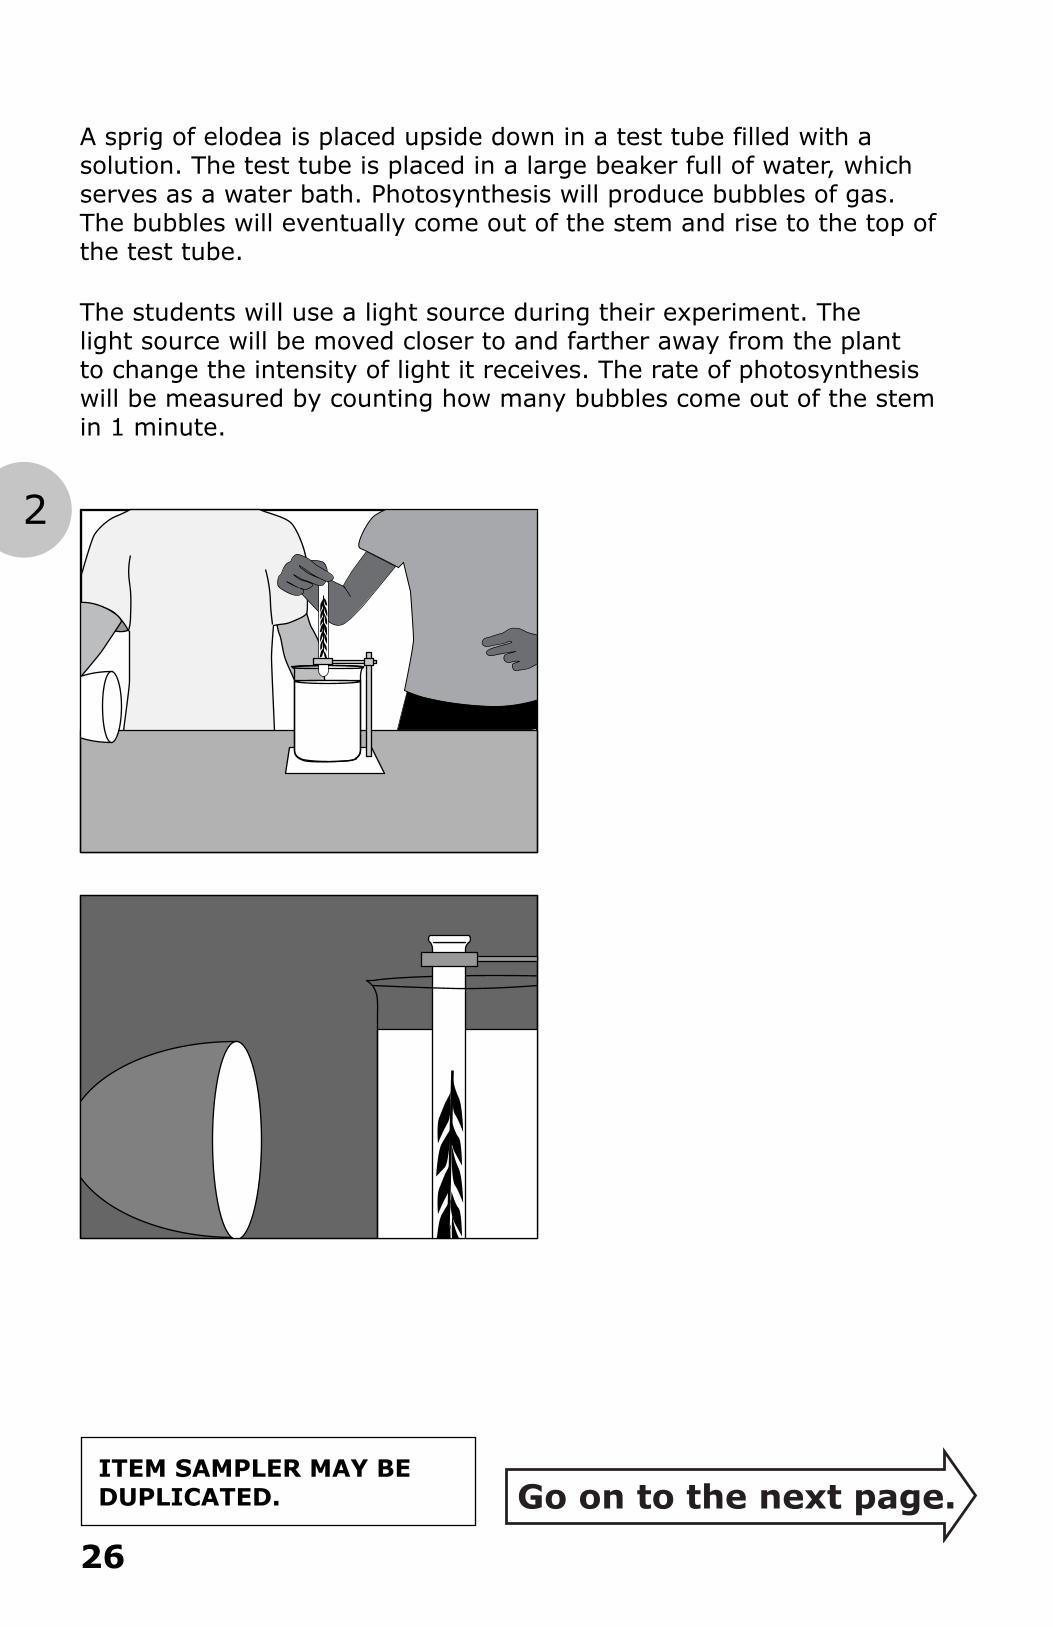
A sprig of elodea is placed upside down in a test tube filled with a solution. The test tube is placed in a large beaker full of water, which serves as a water bath. Photosynthesis will produce bubbles of gas. The bubbles will eventually come out of the stem and rise to the top of the test tube.
The students will use a light source during their experiment. The light source will be moved closer to and farther away from the plant to change the intensity of light it receives. The rate of photosynthesis will be measured by counting how many bubbles come out of the stem in 1 minute.
27
Go on to the next page.
2
ITEM SAMPLER MAY BE DUPLICATED.
9. Which of these variables would be most important to keep constant during the experiment?
A. Number of bubbles produced by the elodea
B. Distance of the light from the test tube
C. Temperature of the solution in the test tube
D. Time of day the experiment is conducted
28
Go on to the next page.
2
ITEM SAMPLER MAY BE DUPLICATED.
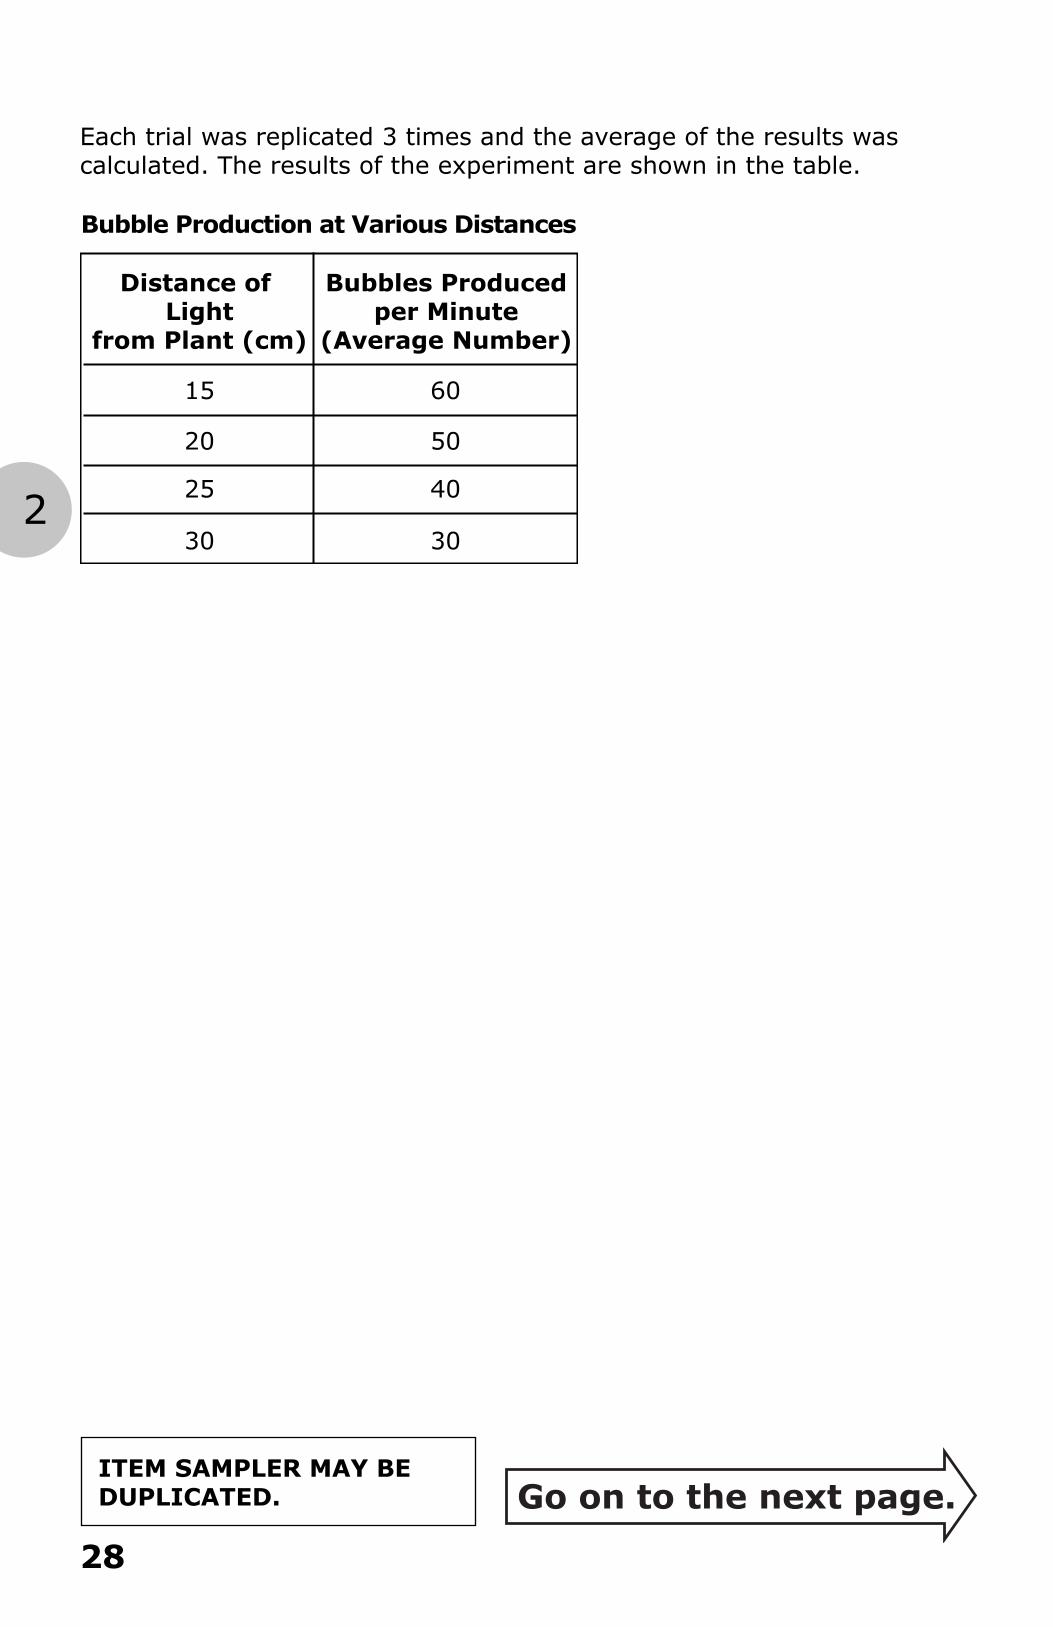
Each trial was replicated 3 times and the average of the results was calculated. The results of the experiment are shown in the table.
Bubble Production at Various Distances
Distance of Light
from Plant (cm)
15
20
25
30
60
50
40
30
Bubbles Producedper Minute
(Average Number)
29
Go on to the next page.
2
ITEM SAMPLER MAY BE DUPLICATED.
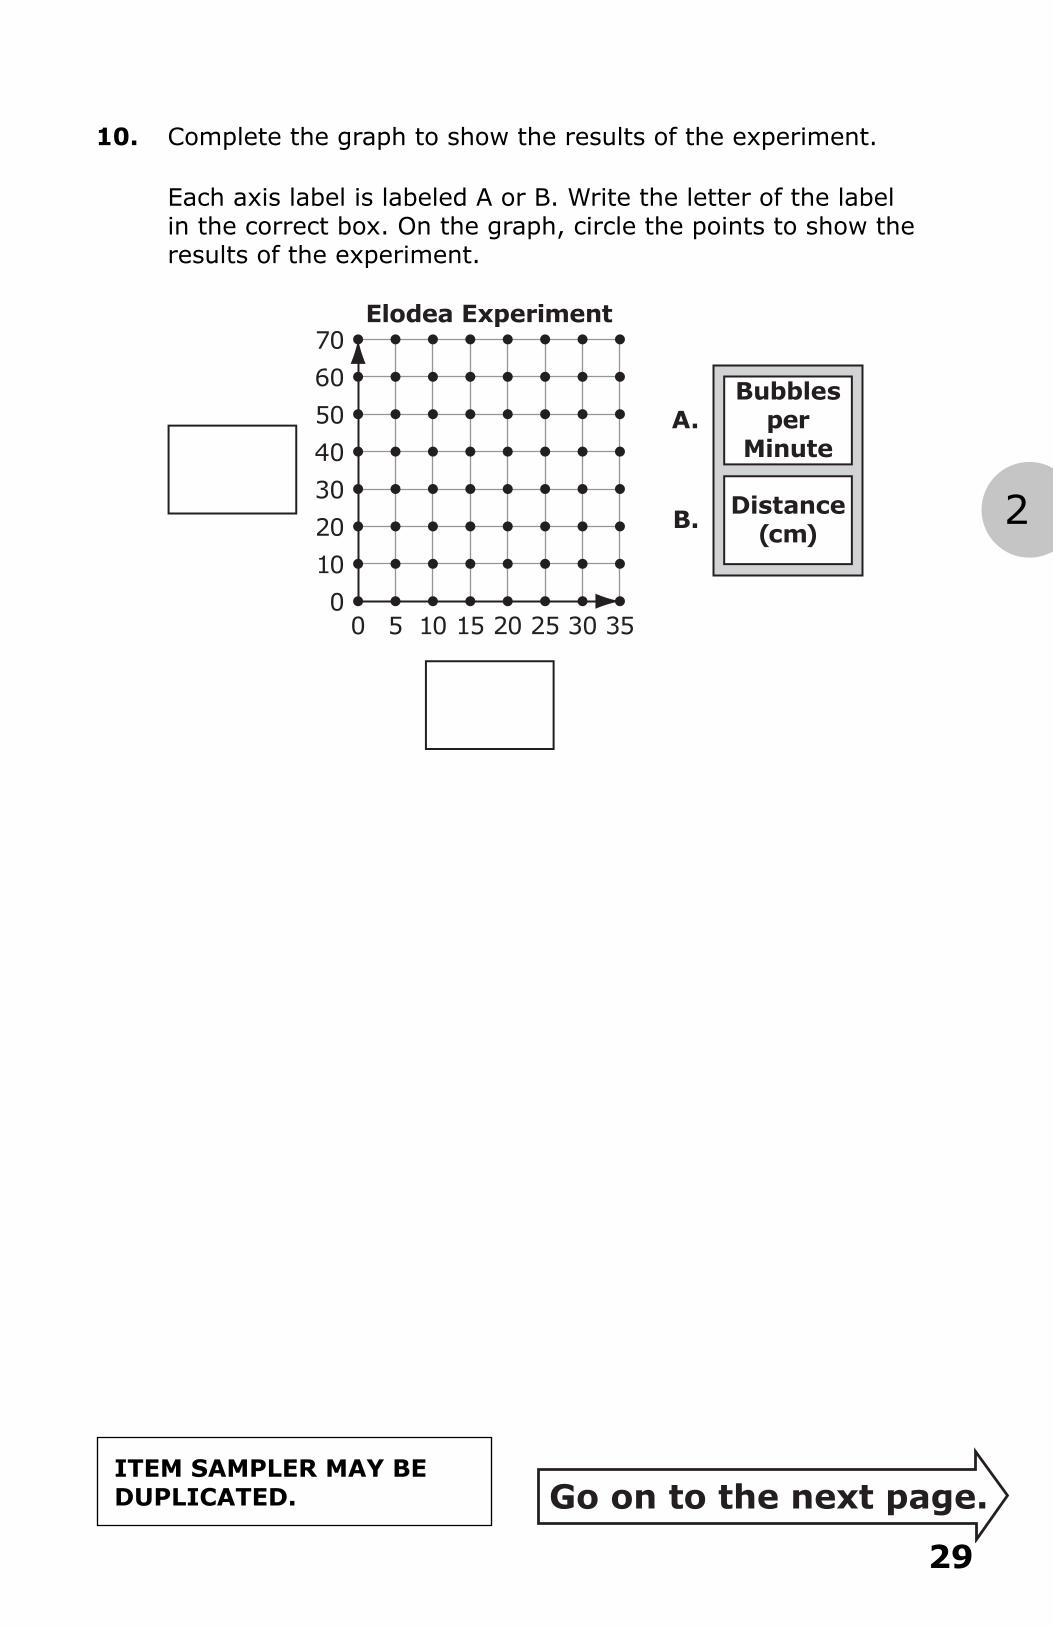
10. Complete the graph to show the results of the experiment.
Each axis label is labeled A or B. Write the letter of the label in the correct box. On the graph, circle the points to show the results of the experiment.
Elodea Experiment
5 10 15 20 25 30 350
10
20
30
40
50
60
70
0
Bubblesper
Minute
Distance(cm)
A.
B.
30
Go on to the next page.
2
ITEM SAMPLER MAY BE DUPLICATED.
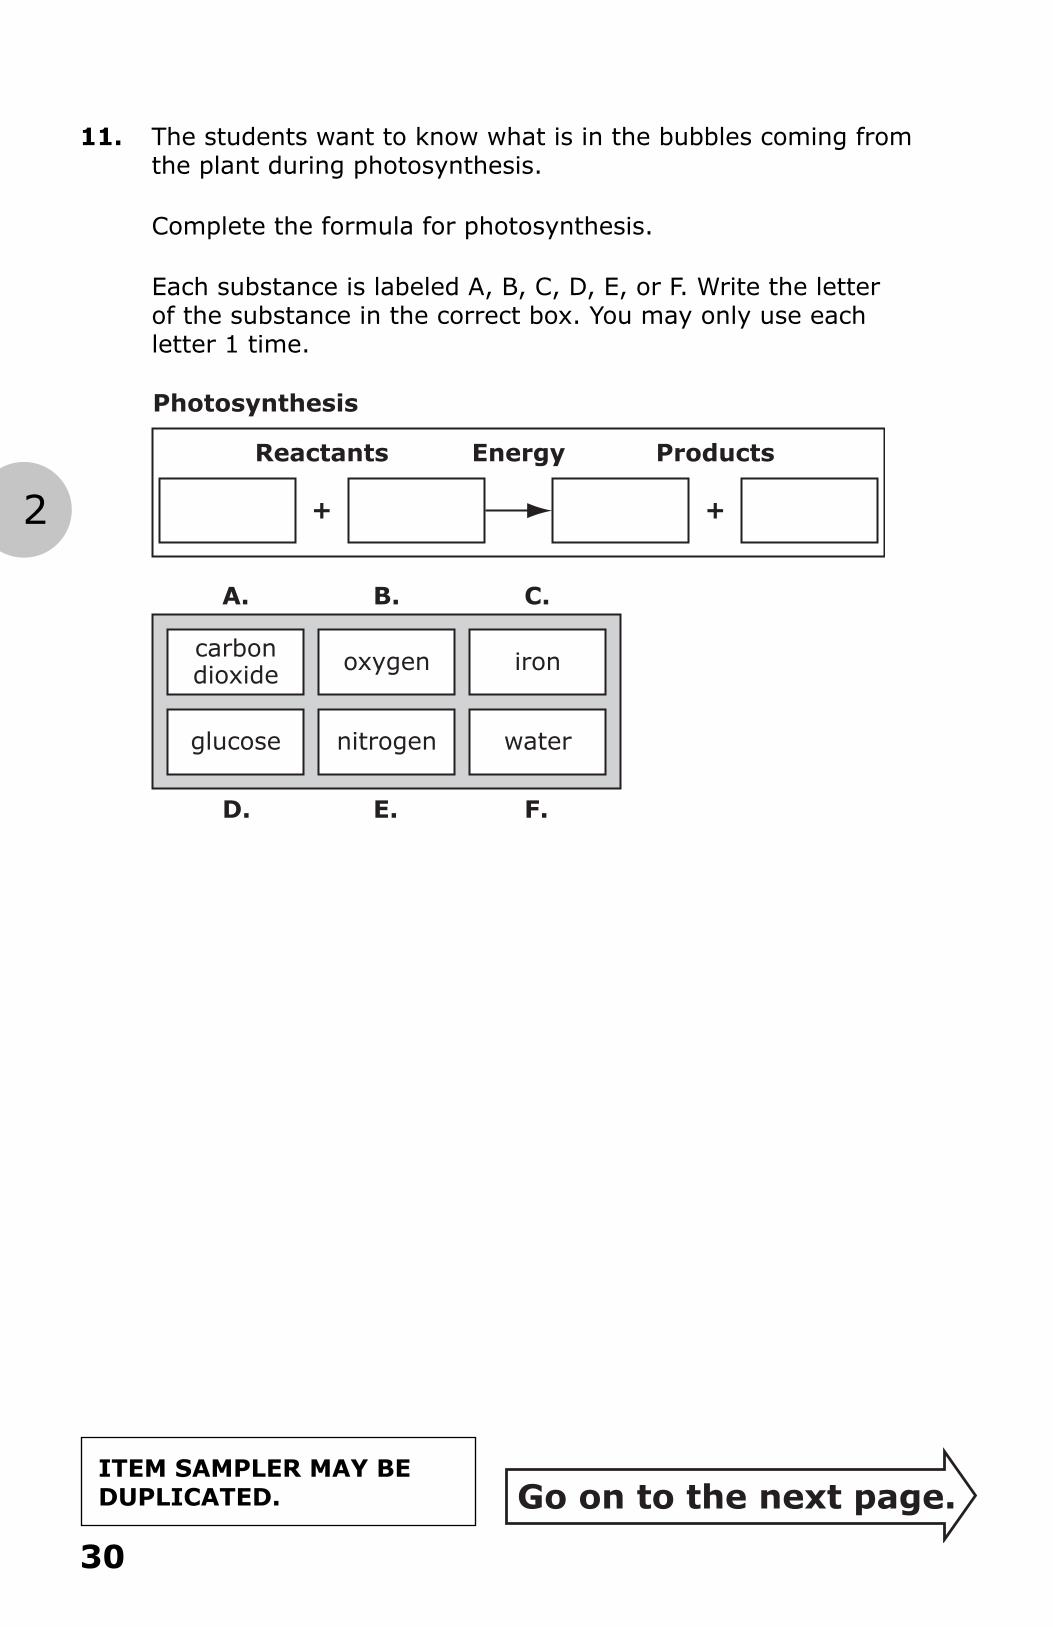
11. The students want to know what is in the bubbles coming from the plant during photosynthesis.
Complete the formula for photosynthesis.
Each substance is labeled A, B, C, D, E, or F. Write the letter of the substance in the correct box. You may only use each letter 1 time.
+ +
Reactants ProductsEnergy
Photosynthesis
carbondioxide oxygen iron
glucose nitrogen water
A. B. C.
D. E. F.
31
Go on to the next page.
2
ITEM SAMPLER MAY BE DUPLICATED.
PlantGrowth
32
Go on to the next page.
2
ITEM SAMPLER MAY BE DUPLICATED.
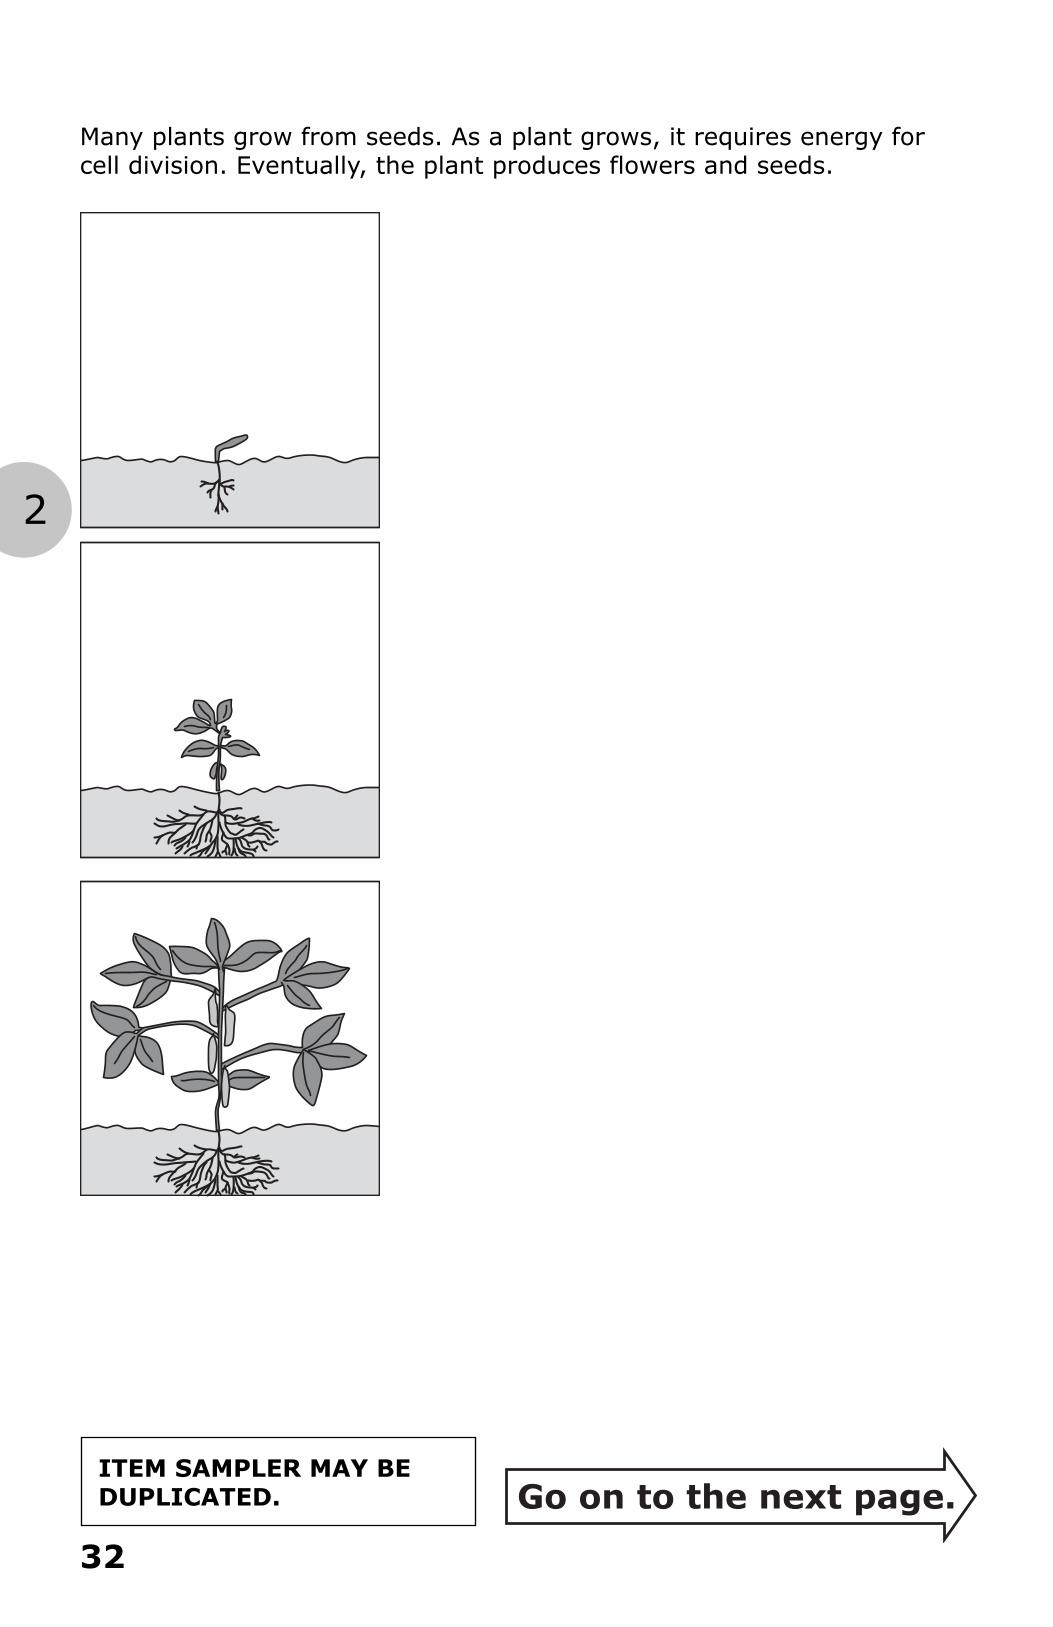
Many plants grow from seeds. As a plant grows, it requires energy for cell division. Eventually, the plant produces flowers and seeds.
33
Go on to the next page.
2
ITEM SAMPLER MAY BE DUPLICATED.
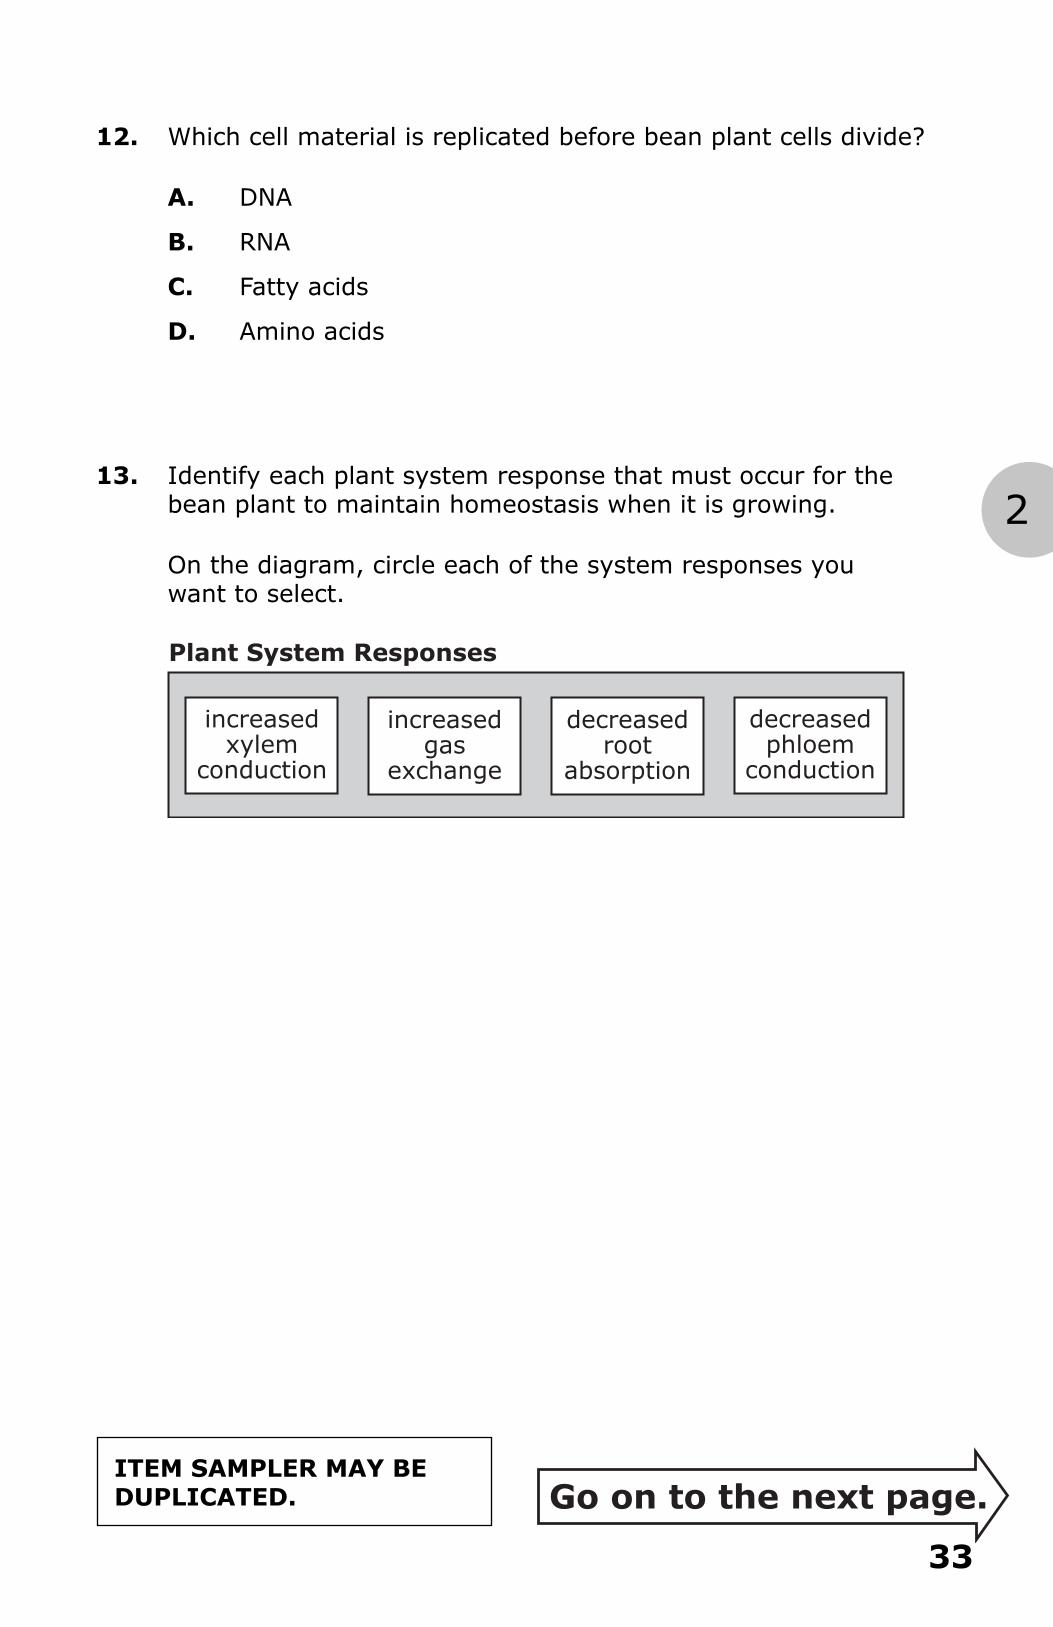
12. Which cell material is replicated before bean plant cells divide?
A. DNA
B. RNA
C. Fatty acids
D. Amino acids
13. Identify each plant system response that must occur for the bean plant to maintain homeostasis when it is growing.
On the diagram, circle each of the system responses you want to select.
Plant System Responses
increasedxylem
conduction
increasedgas
exchange
decreasedroot
absorption
decreasedphloem
conduction
34
Go on to the next page.
2
ITEM SAMPLER MAY BE DUPLICATED.
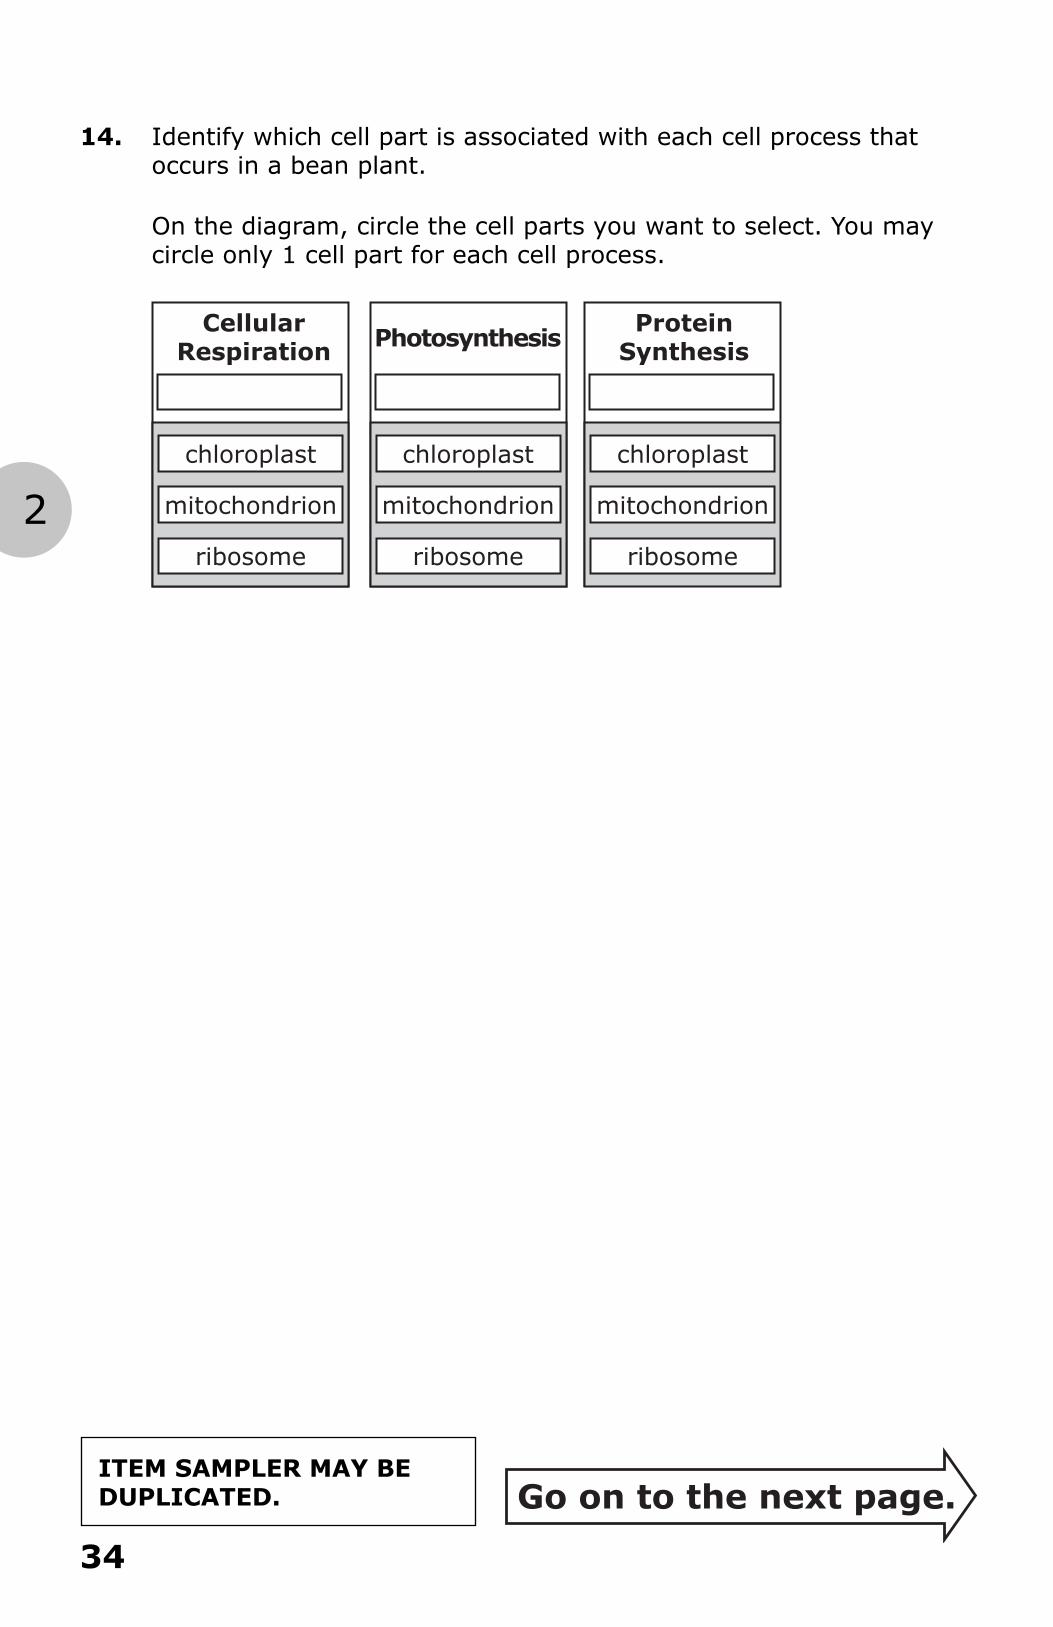
14. Identify which cell part is associated with each cell process that occurs in a bean plant.
On the diagram, circle the cell parts you want to select. You may circle only 1 cell part for each cell process.
CellularRespiration Photosynthesis
ProteinSynthesis
ribosome
mitochondrion
chloroplast
ribosome
mitochondrion
chloroplast
ribosome
mitochondrion
chloroplast
35
Go on to the next page.
2
ITEM SAMPLER MAY BE DUPLICATED.
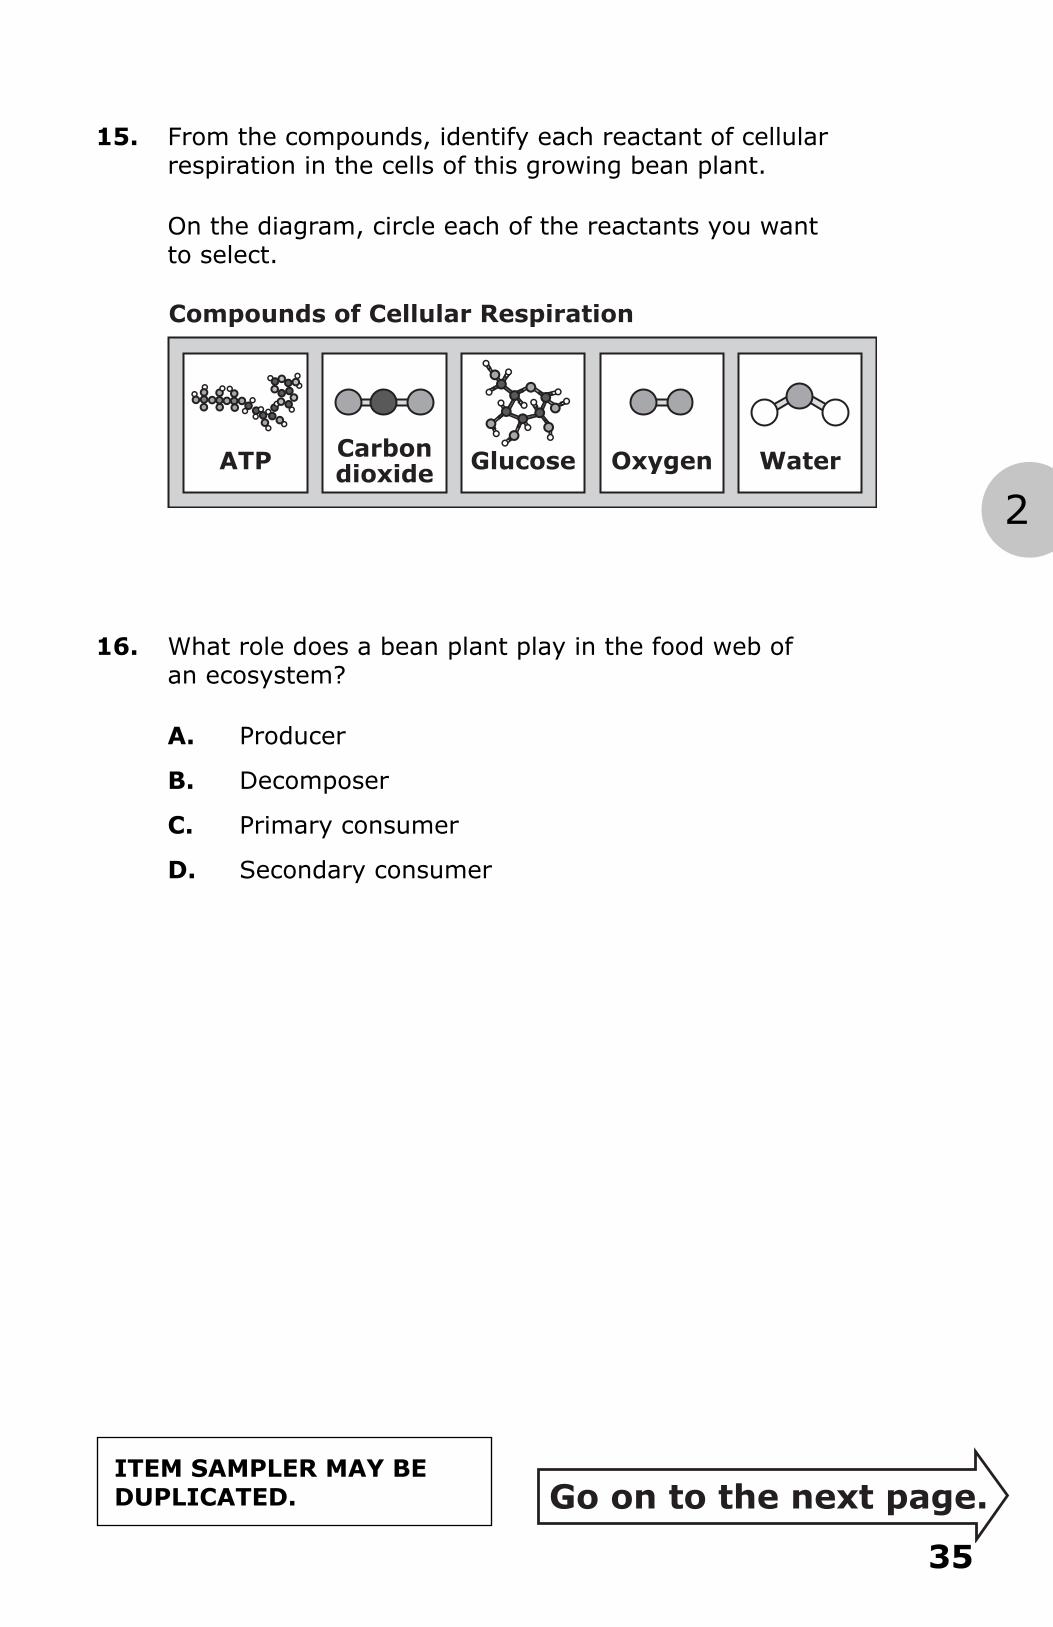
15. From the compounds, identify each reactant of cellular respiration in the cells of this growing bean plant.
On the diagram, circle each of the reactants you want to select.
Compounds of Cellular Respiration
CarbondioxideATP Glucose Oxygen Water
16. What role does a bean plant play in the food web of an ecosystem?
A. Producer
B. Decomposer
C. Primary consumer
D. Secondary consumer

36
This is the end of Segment 2.
Put
stic
ker
her
e
STOP


Grade HSScience Item Sampler
18pt
ITEM SAMPLERS ARE NOT SECURE TEST MATERIALS. THIS ITEM SAMPLER TEST BOOK MAY BE COPIED
OR DUPLICATED.