2016_summer.pdf - minnesota auto dealers association
TRANSCRIPT
Volume 12 • Issue 4www.mada.orgSummer 2016
Inside this issue:
Dealership Showcase Brandl Chevrolet Buick GMC
Defending Our Franchises
DEALERSHIP
2016 Executive CommitteeChair
Mike Saxon, Inver Grove Ford LincolnVice Chair
Rick Jensen, Jensen Motors, Inc.Treasurer
Michael Stanzak, Key Cadillac, Inc.Secretary
Peter Kolar, Kolar Toyota ScionImmediate Past Chair
Greg House, House Chevrolet CompanyPresident
Scott Lambert
EDITORIAL STAFFScott Lambert, Publisher
Amber Backhaus, Senior EditorGinger Lemke, EditorPHOTOGRAPHY
Jim Mims, Mims PhotographySUBSCRIPTIONS
Minnesota Dealer Outlook is an official Minnesota Auto Dealer Association
publication, provided Quarterly to Members of the Minnesota Automobile
Dealers Association.SUBMIT ADDRESS CHANGES TO:Minnesota Automobile Dealers Association
200 Lothenbach AvenueWest St. Paul, MN 55118-3505
Phone: 651-291-2400 • Fax: 651-291-2894Toll Free: 1-800-652-9029Email: [email protected]
ADVERTISING SALES:Ginger Lemke
Phone: 651-291-2400Email: [email protected]
IN THIS ISSUE10Cover: Defending our Franchises
34Dealership Showcase:Brandl Chevrolet Buick GMC
On the Cover: MADA Chair Mike Saxon of Inver Grove Ford Lincoln tests out his weaponry on MADA President Scott Lambert. See page 10 to learn more about the actual tools MADA will be using to defend our franchises from the factories.
Advertising Directory
3M ................................................................... 31Blue Cross Blue Shield MN ............................ 11CliftonLarsonAllen .................................... 32CVR ............................................................ 5Greg Johnson, LLC .................................. 11JM&A Group ............................................. 16LED Supply Co. ........................................ 27LubeTech .................................................. 31MADA Business Cards ............................. 20
MADA Choose Your News ........................ 37MADA Direct Mail ....................................... 4MADA Endorsed Services and Vendors ..... 4Protective ....................................Back CoverReliable Plus ............................................. 23Schmit Towing .......................................... 23SuperAmerica ........................................... 31StarTribune ......................Back Inside CoverWIPFLI LLP .....................Inside Front Cover
Table of ContentsMADA Minutes2016 National Automotive Technology Competition ...............................................6Council MinutesAutomotive STEP Students .......................7On the CoverDefending Our Franchises .......................10Dealers Are Good NeighborsGood News ..............................................14MADA NewsDriving Minnesota’s Economy ...................8Property Crimes Initiative ........................30Minnesota Auto OutlookComprehensive New & Used Vehicle Information on Minnesota’s Automotive Market ......................................................17Dealership ShowcaseBrandl Chevrolet Buick GMC ...................34
Data Source Information for Minnesota Auto Outlook on pages 17 - 29.Exclusive source for new vehicle registration data presented in Minnesota Auto Outlook is R. L. Polk and Company, a leader in providing detailed new and used vehicle sales and registration statistics. Data is available on a timely basis on the internet. For more information visit www.polk.com
www.mada.org 3
www.mada.org4
Call MADA for all of
your Direct Mail Needs.
651-291-2400 • 800-652-9029
MADA Endorsed Services & VendorsCheck Guarantee/Credit Card Processing Certegy / FIS
Collections Springer Collections
Computerized Vehicle Registration CVR
Dealer Bond Program Ensure Agency
Dealership Marketing Visible Customer
Disability Income Insurance & Section 125 Cafeteria Plans American Fidelity Assurance
F&I Products Protective
Fleet Fueling Program SuperAmerica
Group Health Insurance Blue Cross Blue Shield of MN Delta Dental ReliaStar Life
Hole-In-One Insurance Hole-In-One-USA
Lighting LED Supply Company
Office Supplies InnovativeOfficeSolutions
OSHA, EPA & DOT Compliance/Training ComplyNet Corporation
Pre-Paid Legal, Jim Gavin Identity Theft Shield & Pre-Paid Legal Services
Uniforms and Linen Services AmeriPride Linen and Apparel Services
Workers Compensation Ensure Agency
www.mada.org 5
COMIC CORNER
Benefits of CVR:• Increase CSI scores• Accurate fees• Flexibility with plate
assignments• Increased
revenue
Contact MADA today to get in touch with CVR.
I think I’ll do something nice for
my customers... like CVR
www.mada.org6
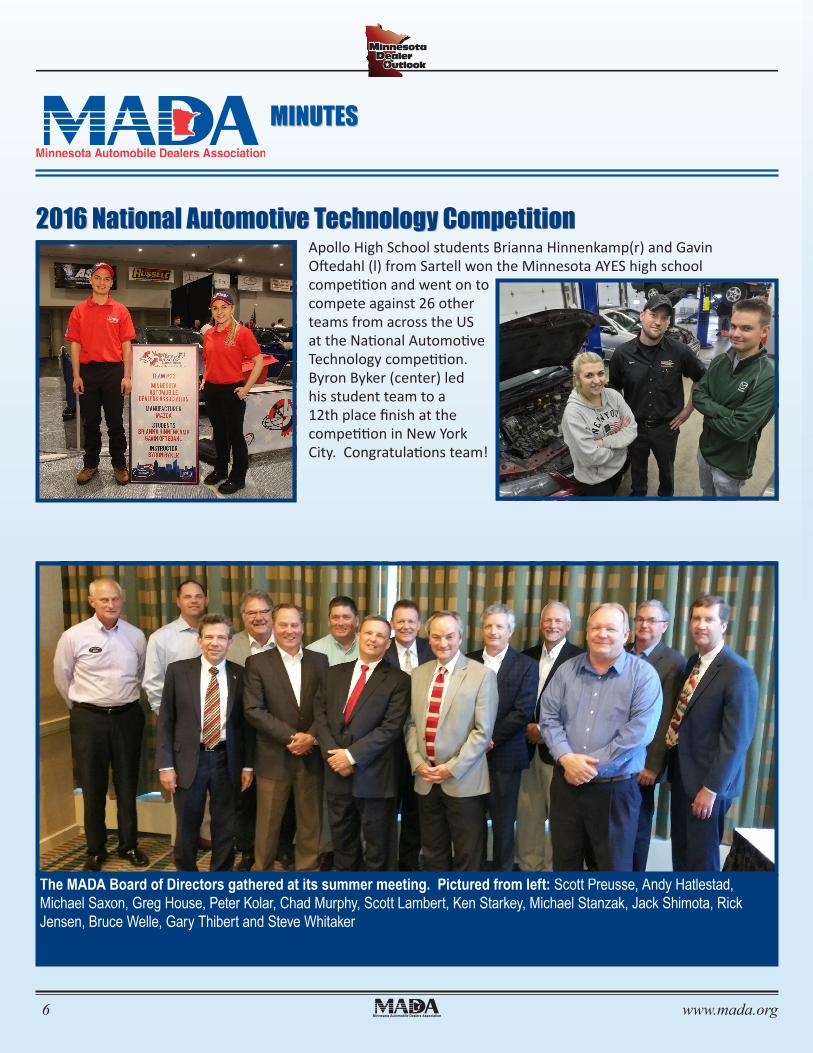
2016 National Automotive Technology CompetitionApollo High School students Brianna Hinnenkamp(r) and Gavin Oftedahl (l) from Sartell won the Minnesota AYES high school competition and went on to compete against 26 other teams from across the US at the National Automotive Technology competition. Byron Byker (center) led his student team to a 12th place finish at the competition in New York City. Congratulations team!
MINUTES
The MADA Board of Directors gathered at its summer meeting. Pictured from left: Scott Preusse, Andy Hatlestad, Michael Saxon, Greg House, Peter Kolar, Chad Murphy, Scott Lambert, Ken Starkey, Michael Stanzak, Jack Shimota, Rick Jensen, Bruce Welle, Gary Thibert and Steve Whitaker
www.mada.org 7
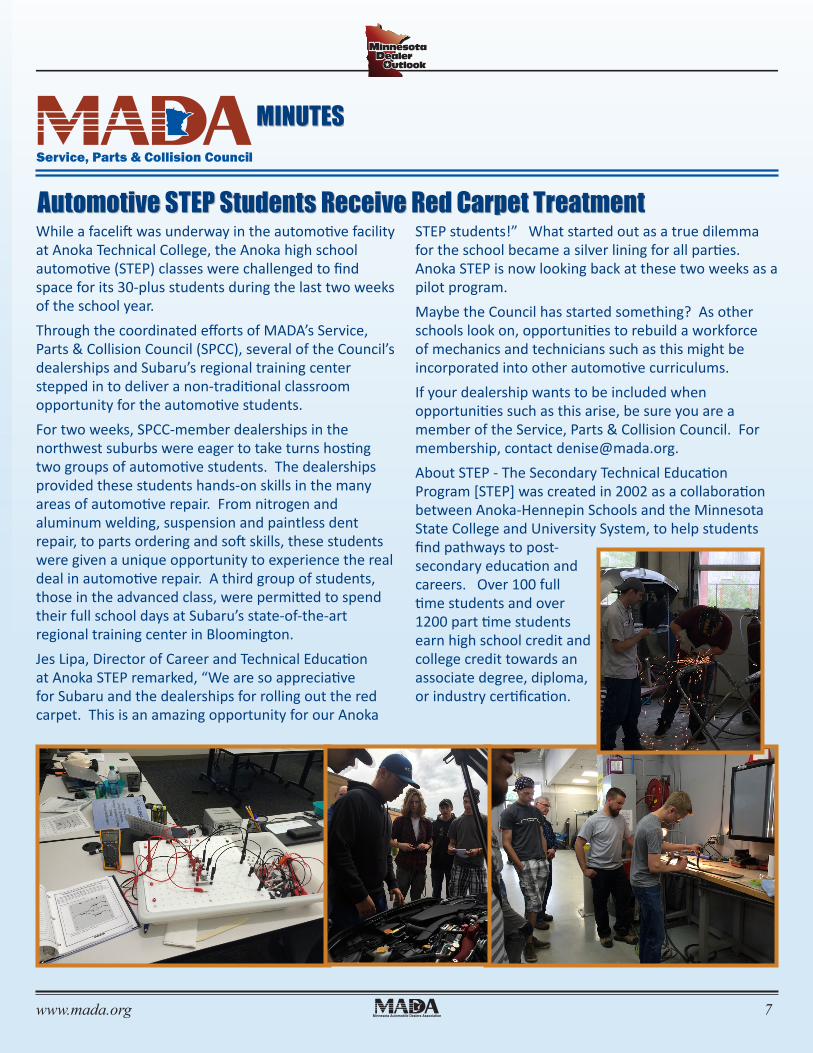
Automotive STEP Students Receive Red Carpet TreatmentWhile a facelift was underway in the automotive facility at Anoka Technical College, the Anoka high school automotive (STEP) classes were challenged to find space for its 30-plus students during the last two weeks of the school year.Through the coordinated efforts of MADA’s Service, Parts & Collision Council (SPCC), several of the Council’s dealerships and Subaru’s regional training center stepped in to deliver a non-traditional classroom opportunity for the automotive students. For two weeks, SPCC-member dealerships in the northwest suburbs were eager to take turns hosting two groups of automotive students. The dealerships provided these students hands-on skills in the many areas of automotive repair. From nitrogen and aluminum welding, suspension and paintless dent repair, to parts ordering and soft skills, these students were given a unique opportunity to experience the real deal in automotive repair. A third group of students, those in the advanced class, were permitted to spend their full school days at Subaru’s state-of-the-art regional training center in Bloomington.Jes Lipa, Director of Career and Technical Education at Anoka STEP remarked, “We are so appreciative for Subaru and the dealerships for rolling out the red carpet. This is an amazing opportunity for our Anoka
STEP students!” What started out as a true dilemma for the school became a silver lining for all parties. Anoka STEP is now looking back at these two weeks as a pilot program. Maybe the Council has started something? As other schools look on, opportunities to rebuild a workforce of mechanics and technicians such as this might be incorporated into other automotive curriculums. If your dealership wants to be included when opportunities such as this arise, be sure you are a member of the Service, Parts & Collision Council. For membership, contact [email protected] STEP - The Secondary Technical Education Program [STEP] was created in 2002 as a collaboration between Anoka-Hennepin Schools and the Minnesota State College and University System, to help students find pathways to post-secondary education and careers. Over 100 full time students and over 1200 part time students earn high school credit and college credit towards an associate degree, diploma, or industry certification.
MINUTESService, Parts & Collision Council
Minnesota Automobile Dealers Association | www.mada.org200 Lothenbach Ave | West St. Paul, MN 55118 | 651-291-2400 | 1-800-652-9029 | www.mada.orgMADA Legislative Affairs | Amber Backhaus: [email protected]
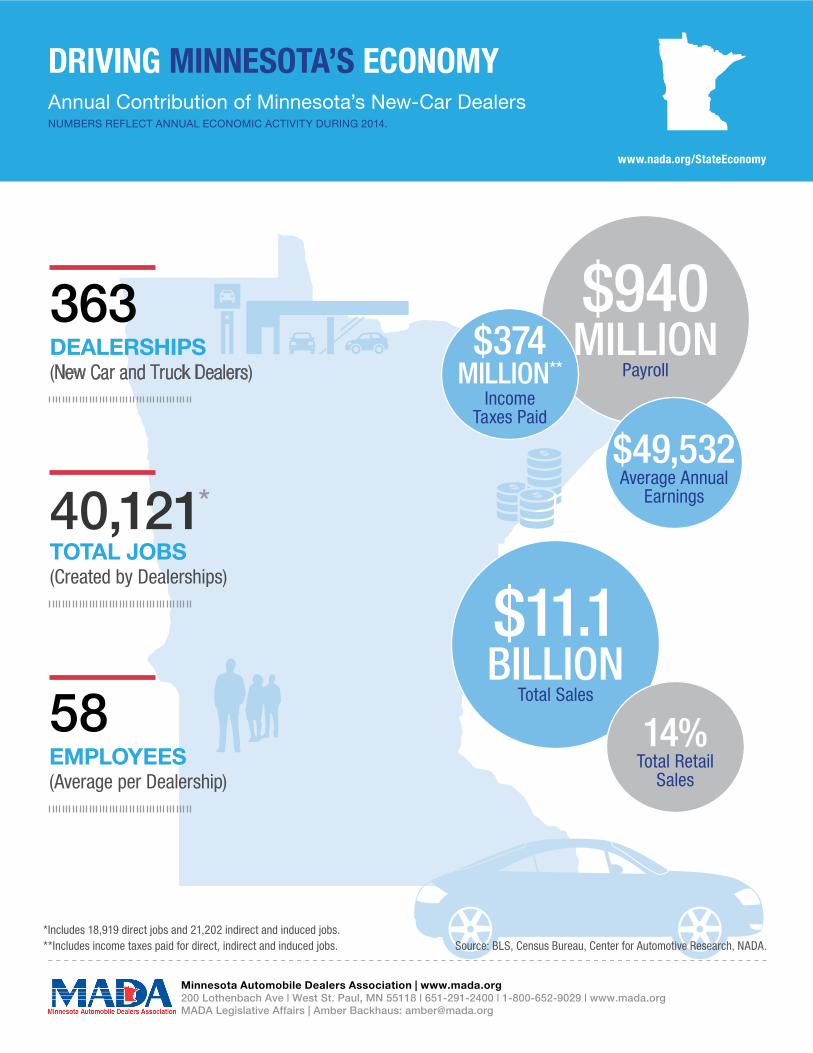
$940MILLION
Payroll
$11.1BILLION
Total Sales
14%Total Retail
Sales
$374MILLION**
Income Taxes Paid
$49,532Average Annual
Earnings
DRIVING MINNESOTA’S ECONOMYAnnual Contribution of Minnesota’s New-Car DealersNUMBERS REFLECT ANNUAL ECONOMIC ACTIVITY DURING 2014.
www.nada.org/StateEconomy
*Includes 18,919 direct jobs and 21,202 indirect and induced jobs.**Includes income taxes paid for direct, indirect and induced jobs. Source: BLS, Census Bureau, Center for Automotive Research, NADA.
363DEALERSHIPS(New Car and Truck Dealers)
40,121*
TOTAL JOBS(Created by Dealerships)
58EMPLOYEES(Average per Dealership)

www.mada.org 9
better togetherWelcome to Blue Cross and Blue Shield of Minnesota. Together, the Minnesota Automobile Dealers Association and Blue Cross are offering you and your employees:
➜➜ More choice – The largest network of providers in the state delivers value and preserves provider choice
➜➜ Better value – More benefit plan options make it easy to choose a plan that fits your health care needs and your budget
➜➜ Bigger savings – Working with providers, Blue Cross rewards quality of care to deliver you bigger savings
➜➜ Added convenience – From retail clinics to online care options, we make it convenient for your employees to get the care they need
Blue Cross® and Blue Shield® of Minnesota and Blue Plus® are nonprofit independent licensees of the Blue Cross and Blue Shield Association.
Find out how to accelerate your health care savings.
Contact your Blue Cross sales representative or call MADA Insurance at (651) 291-2400 or 1-800-652-9029.
www.mada.org10
As the factories chip away at the autonomy of franchisees and dealer profit margins, it
,s time to defend
our franchises.Dealers are seeing record sales as the business has recovered from the depths of the 2009 recession. Unfortunately, they are not seeing record profits. The factories have gotten more aggressive in creating programs that tie up dealer capital (both human and financial), making it harder and harder to make a profit on new car sales. Dealerships looked to their fixed operations to make up the difference, and the manufacturers are now trying to cut into those dollars by undercutting reimbursement rates on warranty work and plying consumers with coupons for discounted service that comes out of the pocket of dealers.
Defending Our Franchises
www.mada.org 11
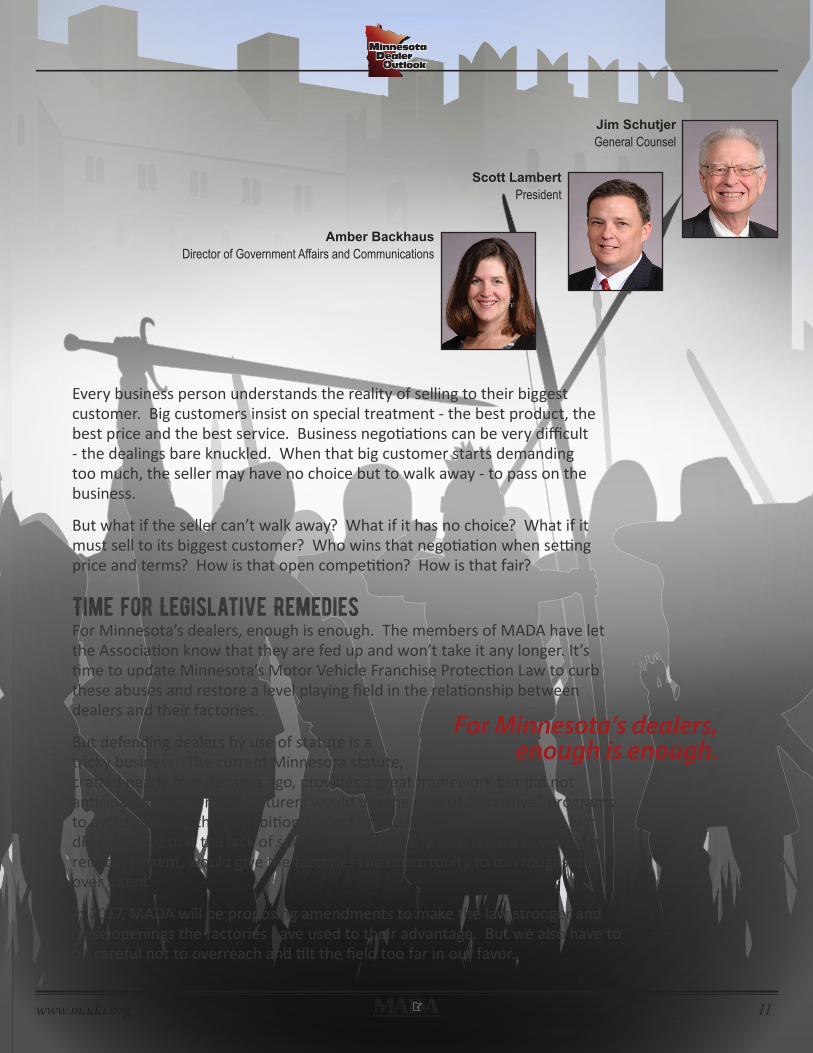
Jim SchutjerGeneral Counsel
Every business person understands the reality of selling to their biggest customer. Big customers insist on special treatment - the best product, the best price and the best service. Business negotiations can be very difficult - the dealings bare knuckled. When that big customer starts demanding too much, the seller may have no choice but to walk away - to pass on the business.
But what if the seller can’t walk away? What if it has no choice? What if it must sell to its biggest customer? Who wins that negotiation when setting price and terms? How is that open competition? How is that fair?
Time for Legislative RemediesFor Minnesota’s dealers, enough is enough. The members of MADA have let the Association know that they are fed up and won’t take it any longer. It’s time to update Minnesota’s Motor Vehicle Franchise Protection Law to curb these abuses and restore a level playing field in the relationship between dealers and their factories.
But defending dealers by use of statute is a tricky business. The current Minnesota statute, crafted nearly four decades ago, provides a great framework but did not anticipate that the manufacturers would use the ruse of “incentive” programs to avoid violating the prohibition against unequal treatment of dealers. Nor did it foresee that the lack of specificity, particularly with regard to warranty reimbursement, would give the factories the opportunity to run roughshod over intent.
In 2017, MADA will be proposing amendments to make the law stronger and close openings the factories have used to their advantage. But we also have to be careful not to overreach and tilt the field too far in our favor.
For Minnesota’s dealers, enough is enough.
Scott LambertPresident
Amber BackhausDirector of Government Affairs and Communications
www.mada.org12
Good intentions sometimes don,t pan out.
Auto dealer associations around the country have worked with their state legislatures to craft laws to help level the playing field between dealer and manufacturers. However, sometimes the effort is too successful and manufacturers punish dealers by pulling or threatening to pull valuable programs from the state.
Virginia passed a law in 2011 designed to curtail the leverage manufacturers employ with “voluntary” facility upgrade programs. General Motors responded by telling its Virginia dealers that it would terminate its Essential Brand Elements (EBE) program because of language which allows dealers to source these elements from non-GM authorized vendors. Eventually a compromise was worked out but only because the Virginia Automobile Dealers Association was able to arrange for an amendment to the new law.
New Hampshire dealers passed comprehensive legislation in 2013 designed to promote fairness and transparency in factory incentive programs. Rather than comply with a requirement of the new law to provide advance notice of the details of its incentive programs, General Motors pulled the program from the state arguing that it has always been transparent with its dealers but was unwilling to give advance notice of its incentive plans to its competitors.
The Iowa Automobile Dealers Association passed ground breaking legislation in 1986 designed to prevent manufactures from giving sweetheart deals to the big fleet and daily rental companies. When the factories responded by passing over Iowa dealers for fleet deals and threatening to pull consumer rebates from the state, IADA was forced to go back into the legislature the following year and repeal the law.
MADA plans to get tough with the factories, but wants to ensure the consequences of stronger laws don’t lead the factories to pull programs out of the state altogether.
The Development ProcessTo get ready for this change, MADA has spent the last year studying not only our own statute, but case law and the experience of other states’ efforts. Connecticut passed a significant warranty reimbursement law that withstood legal challenges from the manufacturers at every level of the judicial system, providing an excellent template for our own initiative. These efforts elsewhere
www.mada.org 13
This is a group effort. Dealers need to get engaged.
have also informed us of the arguments and tactics the factories will use to try to undermine our initiative, so we won’t go into this process blind.
After drafting our “wish list,” MADA staff filtered many changes through a working group and took input from dealers at seven regional meetings around the state, and ultimately gained the blessing of our own Board of Directors.
Time to EngageNow comes the long game. Before the 2017 session begins, we need to meet with as many legislators as possible to explain not only the changes we want, but why a franchise law is important. And by “we,” we are not referring solely to MADA staff and our paid lobbyists. This is a group effort. Dealers need to get engaged.
Legislators care about the impact of proposed laws on their constituents, especially the businesses in their districts and the consumers those businesses serve. They will be most compelled to act when they hear directly from you about how the factories are jeopardizing your ability to stay profitable and provide jobs in community. They need to hear, from you, examples of the problems today and why updates to the franchise law are critical to the viability of your business.
If you don’t know them already, MADA staff can assist you find your legislator and schedule some time for them to visit your store. Use the time to make sure they understand the value your business brings to the community (in terms of payroll, taxes paid, charities supported, etc…) Remind them of the level playing field that our franchise law brings to the relationship with the manufacturers and inform them of the necessary changes.
This effort will be decided in the summer and fall of this year. If lawmakers arrive in St. Paul informed of the importance of these changes, then MADA lobbyists can work through the hard details of fashioning a good sound law in 2017 – and restore parity in the relationship between Minnesota dealers and their manufacturers.
www.mada.org14
Supporting Local Charities
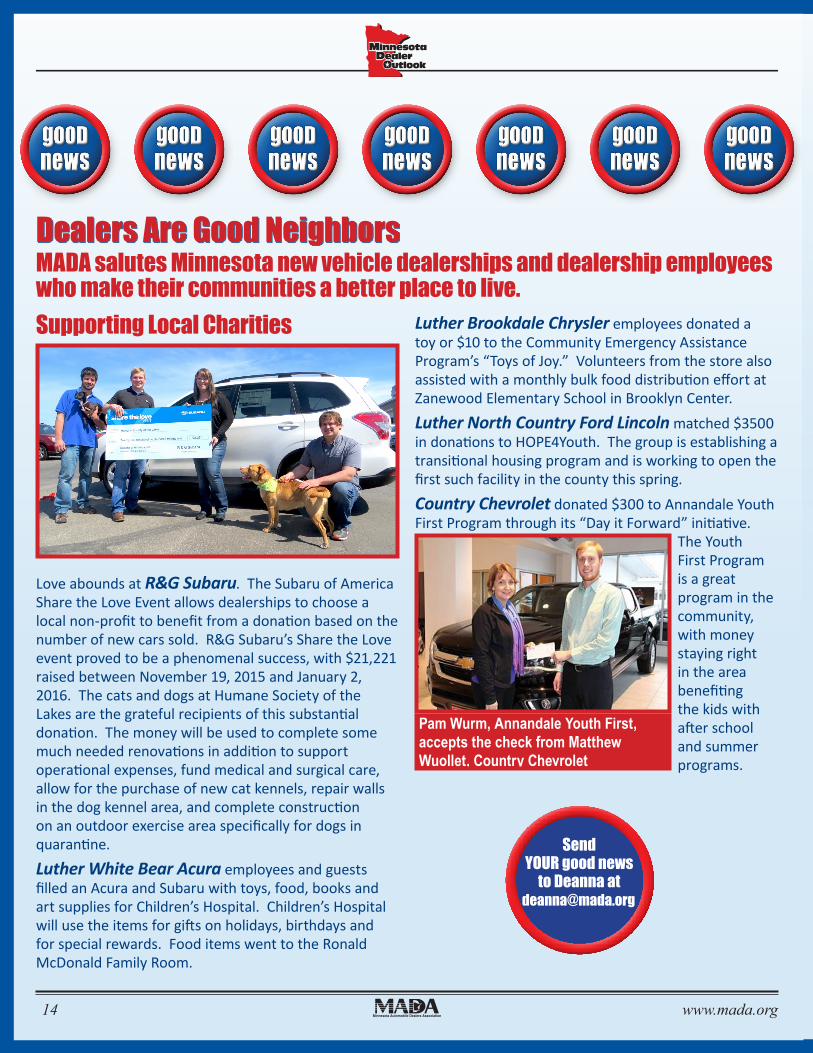
Love abounds at R&G Subaru. The Subaru of America Share the Love Event allows dealerships to choose a local non-profit to benefit from a donation based on the number of new cars sold. R&G Subaru’s Share the Love event proved to be a phenomenal success, with $21,221 raised between November 19, 2015 and January 2, 2016. The cats and dogs at Humane Society of the Lakes are the grateful recipients of this substantial donation. The money will be used to complete some much needed renovations in addition to support operational expenses, fund medical and surgical care, allow for the purchase of new cat kennels, repair walls in the dog kennel area, and complete construction on an outdoor exercise area specifically for dogs in quarantine.Luther White Bear Acura employees and guests filled an Acura and Subaru with toys, food, books and art supplies for Children’s Hospital. Children’s Hospital will use the items for gifts on holidays, birthdays and for special rewards. Food items went to the Ronald McDonald Family Room.
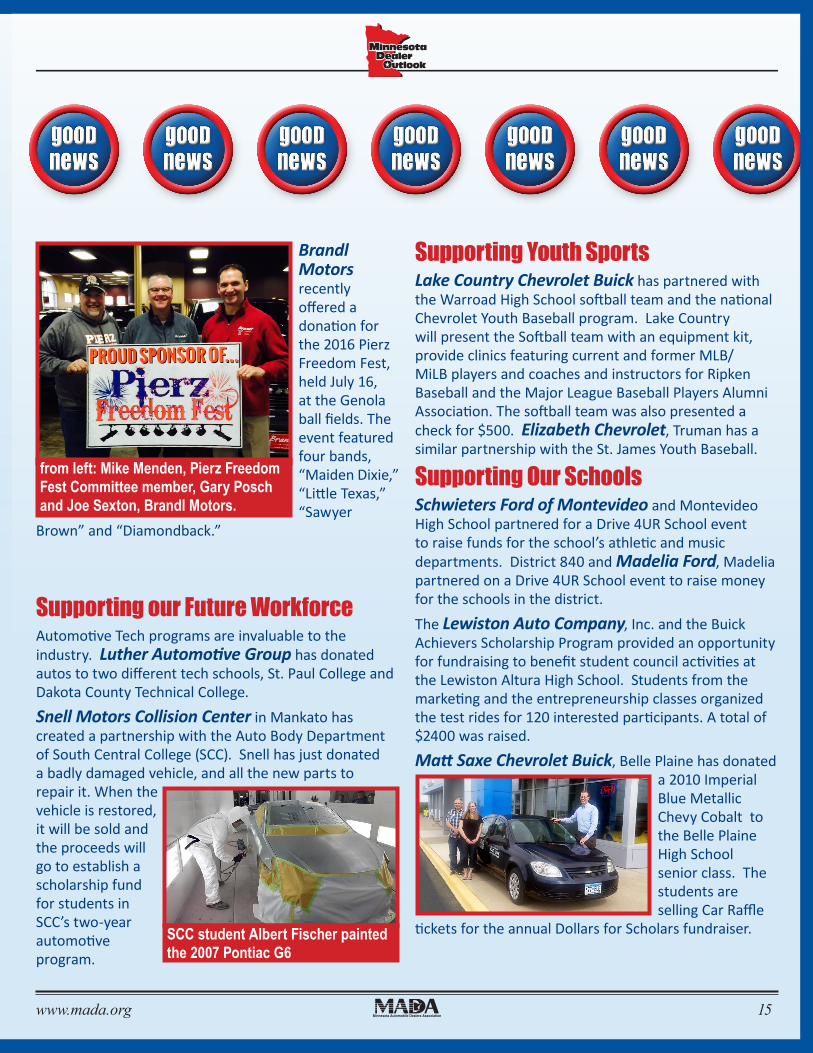
Luther Brookdale Chrysler employees donated a toy or $10 to the Community Emergency Assistance Program’s “Toys of Joy.” Volunteers from the store also assisted with a monthly bulk food distribution effort at Zanewood Elementary School in Brooklyn Center.Luther North Country Ford Lincoln matched $3500 in donations to HOPE4Youth. The group is establishing a transitional housing program and is working to open the first such facility in the county this spring.Country Chevrolet donated $300 to Annandale Youth First Program through its “Day it Forward” initiative.
The Youth First Program is a great program in the community, with money staying right in the area benefiting the kids with after school and summer programs.
Dealers Are Good NeighborsMADA salutes Minnesota new vehicle dealerships and dealership employees who make their communities a better place to live.
Send YOUR good news
to Deanna at [email protected]
Pam Wurm, Annandale Youth First, accepts the check from Matthew Wuollet, Country Chevrolet
www.mada.org 15
Brandl Motors recently offered a donation for the 2016 Pierz Freedom Fest, held July 16, at the Genola ball fields. The event featured four bands, “Maiden Dixie,” “Little Texas,” “Sawyer
Brown” and “Diamondback.”
Supporting our Future WorkforceAutomotive Tech programs are invaluable to the industry. Luther Automotive Group has donated autos to two different tech schools, St. Paul College and Dakota County Technical College.Snell Motors Collision Center in Mankato has created a partnership with the Auto Body Department of South Central College (SCC). Snell has just donated a badly damaged vehicle, and all the new parts to repair it. When the vehicle is restored, it will be sold and the proceeds will go to establish a scholarship fund for students in SCC’s two-year automotive program.
Supporting Youth SportsLake Country Chevrolet Buick has partnered with the Warroad High School softball team and the national Chevrolet Youth Baseball program. Lake Country will present the Softball team with an equipment kit, provide clinics featuring current and former MLB/MiLB players and coaches and instructors for Ripken Baseball and the Major League Baseball Players Alumni Association. The softball team was also presented a check for $500. Elizabeth Chevrolet, Truman has a similar partnership with the St. James Youth Baseball.
Supporting Our SchoolsSchwieters Ford of Montevideo and Montevideo High School partnered for a Drive 4UR School event to raise funds for the school’s athletic and music departments. District 840 and Madelia Ford, Madelia partnered on a Drive 4UR School event to raise money for the schools in the district.The Lewiston Auto Company, Inc. and the Buick Achievers Scholarship Program provided an opportunity for fundraising to benefit student council activities at the Lewiston Altura High School. Students from the marketing and the entrepreneurship classes organized the test rides for 120 interested participants. A total of $2400 was raised.Matt Saxe Chevrolet Buick, Belle Plaine has donated
a 2010 Imperial Blue Metallic Chevy Cobalt to the Belle Plaine High School senior class. The students are selling Car Raffle
tickets for the annual Dollars for Scholars fundraiser.
from left: Mike Menden, Pierz Freedom Fest Committee member, Gary Posch and Joe Sexton, Brandl Motors.
SCC student Albert Fischer painted the 2007 Pontiac G6
www.mada.org16
JM Family is a diversified automotive company ranked on the FORTUNE® 100 Best Companies to Work For® list, its seventeenth consecutive year. © 2015 Jim Moran and Associates, Inc.
A division of
Mark McGoldrick, Division Manager(571) 216-2511
Michael Snyder, Region Manager(410) 446-6655
JM&A Group is proud to announce that its Minnesota presence just got a lot more powerful. We now have seven field representatives dedicated exclusively to our valued Minnesota dealer customers. That’s seven times the attention, manpower and opportunity to boost your store’s F&I performance and profitability.
Contact us today to schedule a preview of what our team can do to improve your dealerships performace.
There Is Power In Numbers. Let’s Put That Power To The Test..
LET’S TALK!
MADA Minneapolis Ad mj03-151218.indd 1 12/22/15 3:12 PM
www.mada.org 17
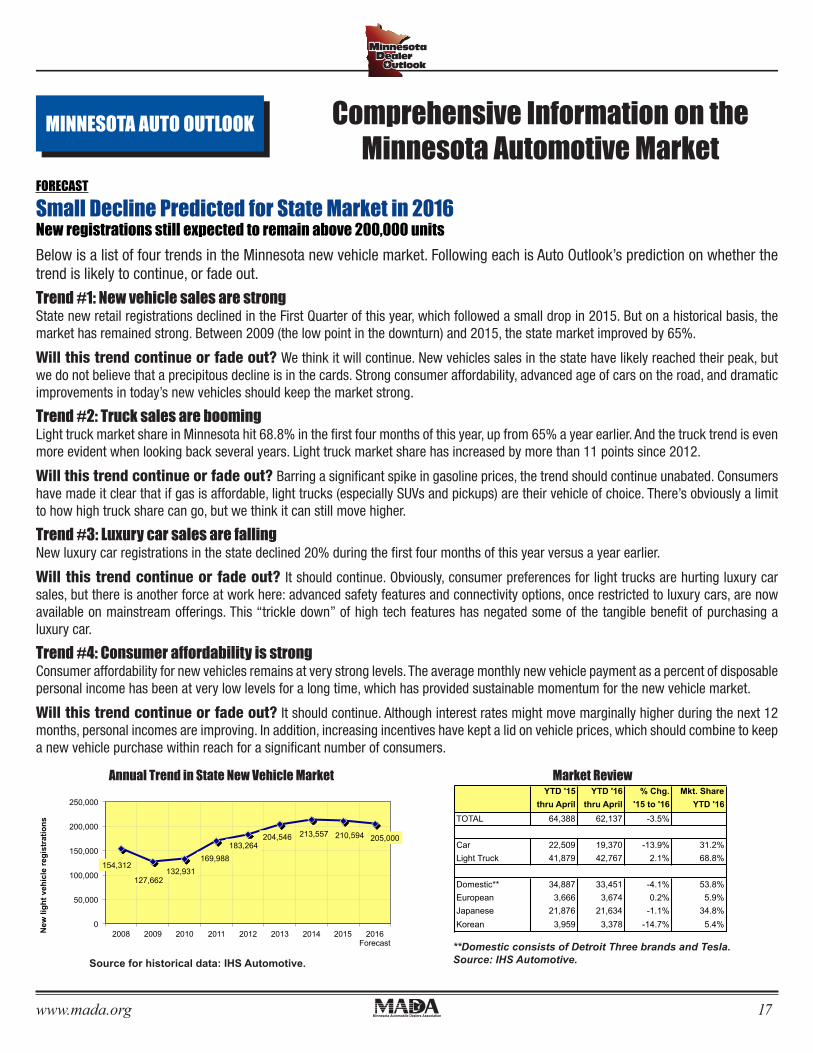
Below is a list of four trends in the Minnesota new vehicle market. Following each is Auto Outlook’s prediction on whether the trend is likely to continue, or fade out.
Trend #1: New vehicle sales are strongState new retail registrations declined in the First Quarter of this year, which followed a small drop in 2015. But on a historical basis, the market has remained strong. Between 2009 (the low point in the downturn) and 2015, the state market improved by 65%.
Will this trend continue or fade out? We think it will continue. New vehicles sales in the state have likely reached their peak, but we do not believe that a precipitous decline is in the cards. Strong consumer affordability, advanced age of cars on the road, and dramatic improvements in today’s new vehicles should keep the market strong.
Trend #2: Truck sales are booming Light truck market share in Minnesota hit 68.8% in the first four months of this year, up from 65% a year earlier. And the truck trend is even more evident when looking back several years. Light truck market share has increased by more than 11 points since 2012.
Will this trend continue or fade out? Barring a significant spike in gasoline prices, the trend should continue unabated. Consumers have made it clear that if gas is affordable, light trucks (especially SUVs and pickups) are their vehicle of choice. There’s obviously a limit to how high truck share can go, but we think it can still move higher.
Trend #3: Luxury car sales are falling New luxury car registrations in the state declined 20% during the first four months of this year versus a year earlier.
Will this trend continue or fade out? It should continue. Obviously, consumer preferences for light trucks are hurting luxury car sales, but there is another force at work here: advanced safety features and connectivity options, once restricted to luxury cars, are now available on mainstream offerings. This “trickle down” of high tech features has negated some of the tangible benefit of purchasing a luxury car.
Trend #4: Consumer affordability is strong Consumer affordability for new vehicles remains at very strong levels. The average monthly new vehicle payment as a percent of disposable personal income has been at very low levels for a long time, which has provided sustainable momentum for the new vehicle market.
Will this trend continue or fade out? It should continue. Although interest rates might move marginally higher during the next 12 months, personal incomes are improving. In addition, increasing incentives have kept a lid on vehicle prices, which should combine to keep a new vehicle purchase within reach for a significant number of consumers.
MINNESOTA AUTO OUTLOOK Comprehensive Information on the Minnesota Automotive Market
FORECAST
Small Decline Predicted for State Market in 2016 New registrations still expected to remain above 200,000 units
x
154,312
127,662 132,931
169,988
183,264 204,546 213,557 210,594 205,000
0
50,000
100,000
150,000
200,000
250,000
2008 2009 2010 2011 2012 2013 2014 2015 2016 Forecast
New
ligh
t veh
icle
reg
istr
atio
ns
FORECAST
Small Decline Predicted for State Market in 2016 New registrations still expected to remain above 200,000 units
Market Review
**Domestic consists of Detroit Three brands and Tesla.
Below is a list of four trends in the Minnesota new vehicle market. Following each is Auto Outlook’s prediction on whether the trend is likely to continue, or fade out.
Trend #1: New vehicle sales are strong State new retail registrations declined in the First Quarter of this year, which followed a small drop in 2015. But on an historical basis, the market has remained strong. Between 2009 (the low point in the downturn) and 2015, the state market improved by 65%.
Will this trend continue or fade out? We think it will continue. New vehicles sales in the state have likely reached their peak, but we do not believe that a precipitous decline is in the cards. Strong consumer affordability, advanced age of cars on the road, and dramatic improvements in today’s new vehicles should keep the market strong.
Trend #2: Truck sales are booming Light truck market share in Minnesota hit 68.8% in the first four months of this year, up from 65% a year earlier. And the truck trend is even more evident when looking back several years. Light truck market share has increased by more than 11 points since 2012.
Will this trend continue or fade out? Barring a significant spike in gasoline prices, the trend should continue unabated. Consumers have made it clear that if gas is affordable, light trucks (especially SUVs and pickups) are their vehicle of choice. There’s obviously a limit to how high truck share can go, but we think it can still move higher.
Trend #3: Luxury car sales are falling New luxury car registrations in the state declined 20% during the first four months of this year versus a year earlier.
Will this trend continue or fade out? It should continue. Obviously, consumer preferences for light trucks are hurting luxury car sales, but there is another force at work here: advanced safety features and connectivity options, once restricted to luxury cars, are now available on mainstream offerings. This “trickle down” of high tech features has negated some of the tangible benefit of purchasing a luxury car.
Trend #4: Consumer affordability is strong Consumer affordability for new vehicles remains at very strong levels. The average monthly new vehicle payment as a percent of disposable personal income has been at very low levels for a long time, which has provided sustainable momentum for the new vehicle market.
Will this trend continue or fade out? It should continue. Although interest rates might move marginally higher during the next 12 months, personal incomes are improving. In addition, increasing incentives have kept a lid on vehicle prices, which should combine to keep a new vehicle purchase within reach for a significant number of consumers.
Annual Trend in State New Vehicle Market
Source for historical data: IHS Automotive.
YTD '15 YTD '16 % Chg. Mkt. Sharethru April thru April '15 to '16 YTD '16
TOTAL 64,388 62,137 -3.5%
Car 22,509 19,370 -13.9% 31.2%Light Truck 41,879 42,767 2.1% 68.8%
Domestic** 34,887 33,451 -4.1% 53.8%European 3,666 3,674 0.2% 5.9%Japanese 21,876 21,634 -1.1% 34.8%Korean 3,959 3,378 -14.7% 5.4%
Annual Trend in State New Vehicle Market Market Review
Source for historical data: IHS Automotive.**Domestic consists of Detroit Three brands and Tesla.Source: IHS Automotive.
www.mada.org18
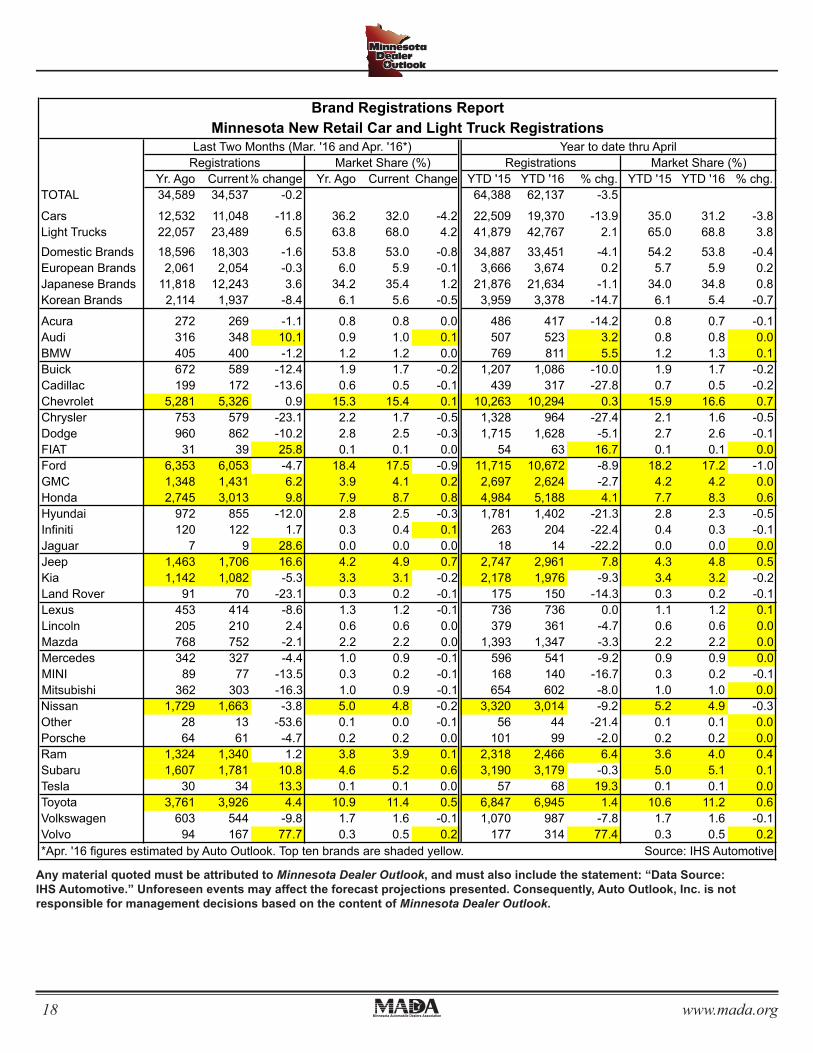
Brand Registrations ReportMinnesota New Retail Car and Light Truck Registrations
Last Two Months (Mar. '16 and Apr. '16*) Year to date thru AprilRegistrations Market Share (%) Registrations Market Share (%)
Yr. Ago Current% change Yr. Ago Current Change YTD '15 YTD '16 % chg. YTD '15 YTD '16 % chg.TOTAL 34,589 34,537 -0.2 64,388 62,137 -3.5
Cars 12,532 11,048 -11.8 36.2 32.0 -4.2 22,509 19,370 -13.9 35.0 31.2 -3.8Light Trucks 22,057 23,489 6.5 63.8 68.0 4.2 41,879 42,767 2.1 65.0 68.8 3.8Domestic Brands 18,596 18,303 -1.6 53.8 53.0 -0.8 34,887 33,451 -4.1 54.2 53.8 -0.4European Brands 2,061 2,054 -0.3 6.0 5.9 -0.1 3,666 3,674 0.2 5.7 5.9 0.2Japanese Brands 11,818 12,243 3.6 34.2 35.4 1.2 21,876 21,634 -1.1 34.0 34.8 0.8Korean Brands 2,114 1,937 -8.4 6.1 5.6 -0.5 3,959 3,378 -14.7 6.1 5.4 -0.7
Acura 272 269 -1.1 0.8 0.8 0.0 486 417 -14.2 0.8 0.7 -0.1Audi 316 348 10.1 0.9 1.0 0.1 507 523 3.2 0.8 0.8 0.0BMW 405 400 -1.2 1.2 1.2 0.0 769 811 5.5 1.2 1.3 0.1Buick 672 589 -12.4 1.9 1.7 -0.2 1,207 1,086 -10.0 1.9 1.7 -0.2Cadillac 199 172 -13.6 0.6 0.5 -0.1 439 317 -27.8 0.7 0.5 -0.2Chevrolet 5,281 5,326 0.9 15.3 15.4 0.1 10,263 10,294 0.3 15.9 16.6 0.7Chrysler 753 579 -23.1 2.2 1.7 -0.5 1,328 964 -27.4 2.1 1.6 -0.5Dodge 960 862 -10.2 2.8 2.5 -0.3 1,715 1,628 -5.1 2.7 2.6 -0.1FIAT 31 39 25.8 0.1 0.1 0.0 54 63 16.7 0.1 0.1 0.0Ford 6,353 6,053 -4.7 18.4 17.5 -0.9 11,715 10,672 -8.9 18.2 17.2 -1.0GMC 1,348 1,431 6.2 3.9 4.1 0.2 2,697 2,624 -2.7 4.2 4.2 0.0Honda 2,745 3,013 9.8 7.9 8.7 0.8 4,984 5,188 4.1 7.7 8.3 0.6Hyundai 972 855 -12.0 2.8 2.5 -0.3 1,781 1,402 -21.3 2.8 2.3 -0.5Infiniti 120 122 1.7 0.3 0.4 0.1 263 204 -22.4 0.4 0.3 -0.1Jaguar 7 9 28.6 0.0 0.0 0.0 18 14 -22.2 0.0 0.0 0.0Jeep 1,463 1,706 16.6 4.2 4.9 0.7 2,747 2,961 7.8 4.3 4.8 0.5Kia 1,142 1,082 -5.3 3.3 3.1 -0.2 2,178 1,976 -9.3 3.4 3.2 -0.2Land Rover 91 70 -23.1 0.3 0.2 -0.1 175 150 -14.3 0.3 0.2 -0.1Lexus 453 414 -8.6 1.3 1.2 -0.1 736 736 0.0 1.1 1.2 0.1Lincoln 205 210 2.4 0.6 0.6 0.0 379 361 -4.7 0.6 0.6 0.0Mazda 768 752 -2.1 2.2 2.2 0.0 1,393 1,347 -3.3 2.2 2.2 0.0Mercedes 342 327 -4.4 1.0 0.9 -0.1 596 541 -9.2 0.9 0.9 0.0MINI 89 77 -13.5 0.3 0.2 -0.1 168 140 -16.7 0.3 0.2 -0.1Mitsubishi 362 303 -16.3 1.0 0.9 -0.1 654 602 -8.0 1.0 1.0 0.0Nissan 1,729 1,663 -3.8 5.0 4.8 -0.2 3,320 3,014 -9.2 5.2 4.9 -0.3Other 28 13 -53.6 0.1 0.0 -0.1 56 44 -21.4 0.1 0.1 0.0Porsche 64 61 -4.7 0.2 0.2 0.0 101 99 -2.0 0.2 0.2 0.0Ram 1,324 1,340 1.2 3.8 3.9 0.1 2,318 2,466 6.4 3.6 4.0 0.4Subaru 1,607 1,781 10.8 4.6 5.2 0.6 3,190 3,179 -0.3 5.0 5.1 0.1Tesla 30 34 13.3 0.1 0.1 0.0 57 68 19.3 0.1 0.1 0.0Toyota 3,761 3,926 4.4 10.9 11.4 0.5 6,847 6,945 1.4 10.6 11.2 0.6Volkswagen 603 544 -9.8 1.7 1.6 -0.1 1,070 987 -7.8 1.7 1.6 -0.1Volvo 94 167 77.7 0.3 0.5 0.2 177 314 77.4 0.3 0.5 0.2*Apr. '16 figures estimated by Auto Outlook. Top ten brands are shaded yellow. Source: IHS Automotive
Any material quoted must be attributed to (name of the publication), and must also include the statement: “Data Source: IHS Automotive.” Unforeseen events may affect the forecast projections presented. Consequently, Auto Outlook, Inc. is not responsible for management decisions based on the content of (name of publication).
Any material quoted must be attributed to Minnesota Dealer Outlook, and must also include the statement: “Data Source: IHS Automotive.” Unforeseen events may affect the forecast projections presented. Consequently, Auto Outlook, Inc. is not responsible for management decisions based on the content of Minnesota Dealer Outlook.
www.mada.org 19
MARKET TRACKER: QUARTERLY RESULTS
State Market Declined 6.1% in 1Q 2016
State Hybrid and Electric VehicleNew Retail Registrations
2009 thru 2015, YTD '16 thru March
Year HybridsPlug inhybrids Electrics Total
2009 3996 0 8 40042010 3260 0 7 32672011 3176 63 12 32512012 4762 319 115 51962013 6036 364 276 66762014 5030 321 256 56072015 3507 226 287 4020YTD '16, March 643 65 89 797Source: IHS Automotive
-3.2
-0.6
0.7
3.1
-6.0 -4.0 -2.0 0.0 2.0 4.0 6.0
Non-Luxury Car
Luxury Car
Luxury Truck
Non-Luxury Truck
Change in market share
0.0%
0.5%
1.0%
1.5%
2.0%
2.5%
3.0%
3.5%
4.0%
Q2 '12
Q3 '12
Q4 '12
Q1 '13
Q2 '13
Q3 '13
Q4 '13
Q1 '14
Q2 '14
Q3 '14
Q4 '14
Q1 '15
Q2 '15
Q3 '15
Q4 '15
Q1 '16
Trendline
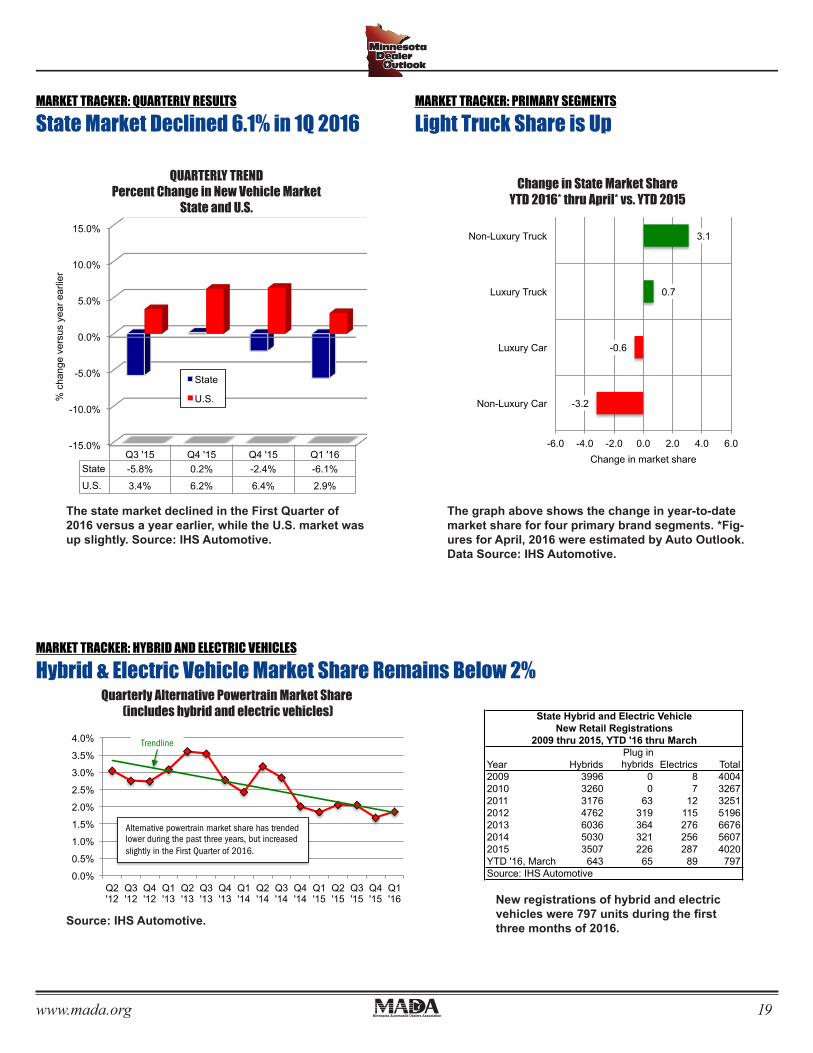
Alternative powertrain market share has trended lower during the past three years, but increased slightly in the First Quarter of 2016.
-15.0%
-10.0%
-5.0%
0.0%
5.0%
10.0%
15.0%
Q3 '15 Q4 '15 Q4 '15 Q1 '16 State -5.8% 0.2% -2.4% -6.1%
U.S. 3.4% 6.2% 6.4% 2.9%
% c
hang
e ve
rsus
yea
r ear
lier
State
U.S.
New registrations of hybrid and electric vehicles were 797 units during the first three months of 2016.
MARKET TRACKER: HYBRID AND ELECTRIC VEHICLES
Hybrid & Electric Vehicle Market Share Remains Below 2% Quarterly Alternative Powertrain Market Share
(includes hybrid and electric vehicles)
The state market declined in the First Quarter of 2016 versus a year earlier, while the U.S. market was up slightly.
Source: IHS Automotive.
Source: IHS Automotive.
MARKET TRACKER: QUARTERLY RESULTS
State Market Declined 6.1% in 1Q 2016
QUARTERLY TREND Percent Change in New Vehicle Market
State and U.S.
MARKET TRACKER: PRIMARY SEGMENTS
Light Truck Share is Up
The graph above shows the change in year-to-date market share for four primary brand segments. *Figures for April, 2016 were estimated by Auto Outlook. Data Source: IHS Automotive.
Change in State Market Share YTD 2016* thru April* vs. YTD 2015
MARKET TRACKER: HYBRID AND ELECTRIC VEHICLES
Hybrid & Electric Vehicle Market Share Remains Below 2%State Hybrid and Electric Vehicle
New Retail Registrations2009 thru 2015, YTD '16 thru March
Year HybridsPlug inhybrids Electrics Total
2009 3996 0 8 40042010 3260 0 7 32672011 3176 63 12 32512012 4762 319 115 51962013 6036 364 276 66762014 5030 321 256 56072015 3507 226 287 4020YTD '16, March 643 65 89 797Source: IHS Automotive
-3.2
-0.6
0.7
3.1
-6.0 -4.0 -2.0 0.0 2.0 4.0 6.0
Non-Luxury Car
Luxury Car
Luxury Truck
Non-Luxury Truck
Change in market share
0.0%
0.5%
1.0%
1.5%
2.0%
2.5%
3.0%
3.5%
4.0%
Q2 '12
Q3 '12
Q4 '12
Q1 '13
Q2 '13
Q3 '13
Q4 '13
Q1 '14
Q2 '14
Q3 '14
Q4 '14
Q1 '15
Q2 '15
Q3 '15
Q4 '15
Q1 '16
Trendline
Alternative powertrain market share has trended lower during the past three years, but increased slightly in the First Quarter of 2016.
-15.0%
-10.0%
-5.0%
0.0%
5.0%
10.0%
15.0%
Q3 '15 Q4 '15 Q4 '15 Q1 '16 State -5.8% 0.2% -2.4% -6.1%
U.S. 3.4% 6.2% 6.4% 2.9%
% c
hang
e ve
rsus
yea
r ear
lier
State
U.S.
New registrations of hybrid and electric vehicles were 797 units during the first three months of 2016.
MARKET TRACKER: HYBRID AND ELECTRIC VEHICLES
Hybrid & Electric Vehicle Market Share Remains Below 2% Quarterly Alternative Powertrain Market Share
(includes hybrid and electric vehicles)
The state market declined in the First Quarter of 2016 versus a year earlier, while the U.S. market was up slightly.
Source: IHS Automotive.
Source: IHS Automotive.
MARKET TRACKER: QUARTERLY RESULTS
State Market Declined 6.1% in 1Q 2016
QUARTERLY TREND Percent Change in New Vehicle Market
State and U.S.
MARKET TRACKER: PRIMARY SEGMENTS
Light Truck Share is Up
The graph above shows the change in year-to-date market share for four primary brand segments. *Figures for April, 2016 were estimated by Auto Outlook. Data Source: IHS Automotive.
Change in State Market Share YTD 2016* thru April* vs. YTD 2015 QUARTERLY TREND
Percent Change in New Vehicle MarketState and U.S.
Quarterly Alternative Powertrain Market Share (includes hybrid and electric vehicles)
Source: IHS Automotive.
State Hybrid and Electric VehicleNew Retail Registrations
2009 thru 2015, YTD '16 thru March
Year HybridsPlug inhybrids Electrics Total
2009 3996 0 8 40042010 3260 0 7 32672011 3176 63 12 32512012 4762 319 115 51962013 6036 364 276 66762014 5030 321 256 56072015 3507 226 287 4020YTD '16, March 643 65 89 797Source: IHS Automotive
-3.2
-0.6
0.7
3.1
-6.0 -4.0 -2.0 0.0 2.0 4.0 6.0
Non-Luxury Car
Luxury Car
Luxury Truck
Non-Luxury Truck
Change in market share
0.0%
0.5%
1.0%
1.5%
2.0%
2.5%
3.0%
3.5%
4.0%
Q2 '12
Q3 '12
Q4 '12
Q1 '13
Q2 '13
Q3 '13
Q4 '13
Q1 '14
Q2 '14
Q3 '14
Q4 '14
Q1 '15
Q2 '15
Q3 '15
Q4 '15
Q1 '16
Trendline
Alternative powertrain market share has trended lower during the past three years, but increased slightly in the First Quarter of 2016.
-15.0%
-10.0%
-5.0%
0.0%
5.0%
10.0%
15.0%
Q3 '15 Q4 '15 Q4 '15 Q1 '16 State -5.8% 0.2% -2.4% -6.1%
U.S. 3.4% 6.2% 6.4% 2.9%
% c
hang
e ve
rsus
yea
r ear
lier
State
U.S.
New registrations of hybrid and electric vehicles were 797 units during the first three months of 2016.
MARKET TRACKER: HYBRID AND ELECTRIC VEHICLES
Hybrid & Electric Vehicle Market Share Remains Below 2% Quarterly Alternative Powertrain Market Share
(includes hybrid and electric vehicles)
The state market declined in the First Quarter of 2016 versus a year earlier, while the U.S. market was up slightly.
Source: IHS Automotive.
Source: IHS Automotive.
MARKET TRACKER: QUARTERLY RESULTS
State Market Declined 6.1% in 1Q 2016
QUARTERLY TREND Percent Change in New Vehicle Market
State and U.S.
MARKET TRACKER: PRIMARY SEGMENTS
Light Truck Share is Up
The graph above shows the change in year-to-date market share for four primary brand segments. *Figures for April, 2016 were estimated by Auto Outlook. Data Source: IHS Automotive.
Change in State Market Share YTD 2016* thru April* vs. YTD 2015
New registrations of hybrid and electric vehicles were 797 units during the first three months of 2016.
The state market declined in the First Quarter of 2016 versus a year earlier, while the U.S. market was up slightly. Source: IHS Automotive.
State Hybrid and Electric VehicleNew Retail Registrations
2009 thru 2015, YTD '16 thru March
Year HybridsPlug inhybrids Electrics Total
2009 3996 0 8 40042010 3260 0 7 32672011 3176 63 12 32512012 4762 319 115 51962013 6036 364 276 66762014 5030 321 256 56072015 3507 226 287 4020YTD '16, March 643 65 89 797Source: IHS Automotive
-3.2
-0.6
0.7
3.1
-6.0 -4.0 -2.0 0.0 2.0 4.0 6.0
Non-Luxury Car
Luxury Car
Luxury Truck
Non-Luxury Truck
Change in market share
0.0%
0.5%
1.0%
1.5%
2.0%
2.5%
3.0%
3.5%
4.0%
Q2 '12
Q3 '12
Q4 '12
Q1 '13
Q2 '13
Q3 '13
Q4 '13
Q1 '14
Q2 '14
Q3 '14
Q4 '14
Q1 '15
Q2 '15
Q3 '15
Q4 '15
Q1 '16
Trendline
Alternative powertrain market share has trended lower during the past three years, but increased slightly in the First Quarter of 2016.
-15.0%
-10.0%
-5.0%
0.0%
5.0%
10.0%
15.0%
Q3 '15 Q4 '15 Q4 '15 Q1 '16 State -5.8% 0.2% -2.4% -6.1%
U.S. 3.4% 6.2% 6.4% 2.9%
% c
hang
e ve
rsus
yea
r ear
lier
State
U.S.
New registrations of hybrid and electric vehicles were 797 units during the first three months of 2016.
MARKET TRACKER: HYBRID AND ELECTRIC VEHICLES
Hybrid & Electric Vehicle Market Share Remains Below 2% Quarterly Alternative Powertrain Market Share
(includes hybrid and electric vehicles)
The state market declined in the First Quarter of 2016 versus a year earlier, while the U.S. market was up slightly.
Source: IHS Automotive.
Source: IHS Automotive.
MARKET TRACKER: QUARTERLY RESULTS
State Market Declined 6.1% in 1Q 2016
QUARTERLY TREND Percent Change in New Vehicle Market
State and U.S.
MARKET TRACKER: PRIMARY SEGMENTS
Light Truck Share is Up
The graph above shows the change in year-to-date market share for four primary brand segments. *Figures for April, 2016 were estimated by Auto Outlook. Data Source: IHS Automotive.
Change in State Market Share YTD 2016* thru April* vs. YTD 2015 Change in State Market Share
YTD 2016* thru April* vs. YTD 2015
The graph above shows the change in year-to-date market share for four primary brand segments. *Fig-ures for April, 2016 were estimated by Auto Outlook. Data Source: IHS Automotive.
MARKET TRACKER: PRIMARY SEGMENTS
Light Truck Share is Up
www.mada.org20
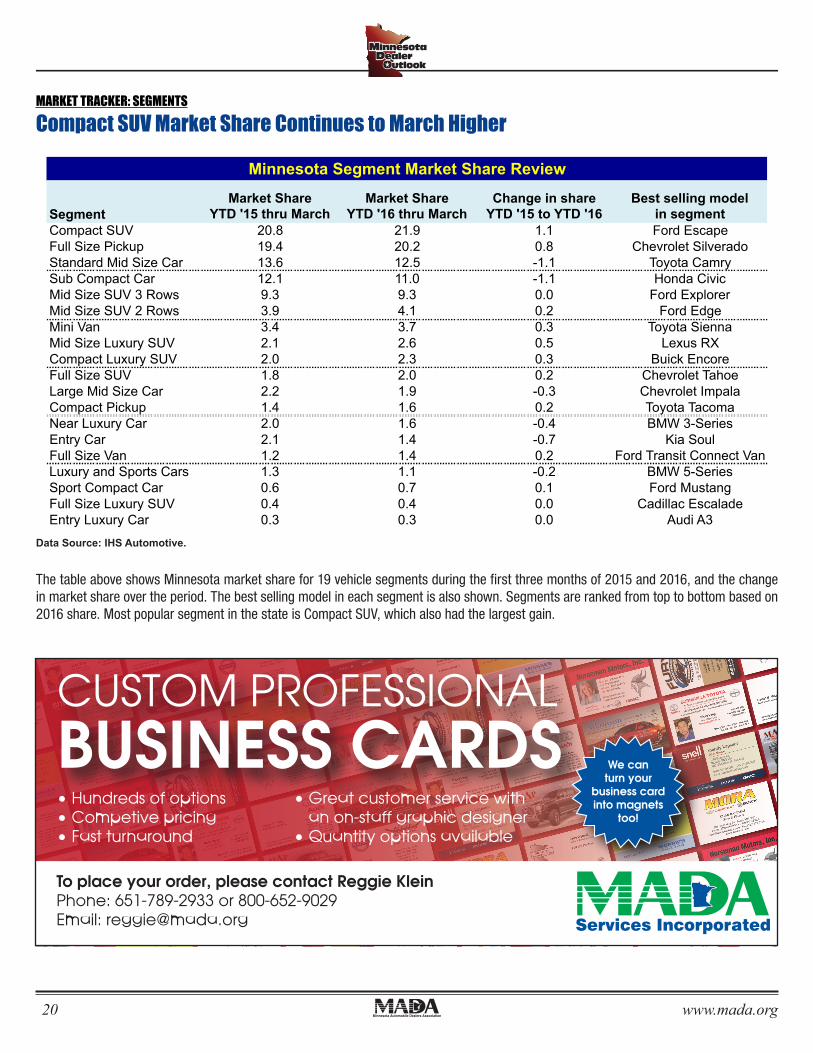
Minnesota Segment Market Share Review
SegmentMarket Share
YTD '15 thru MarchMarket Share
YTD '16 thru MarchChange in share
YTD '15 to YTD '16Best selling model
in segmentCompact SUV 20.8 21.9 1.1 Ford EscapeFull Size Pickup 19.4 20.2 0.8 Chevrolet SilveradoStandard Mid Size Car 13.6 12.5 -1.1 Toyota CamrySub Compact Car 12.1 11.0 -1.1 Honda CivicMid Size SUV 3 Rows 9.3 9.3 0.0 Ford ExplorerMid Size SUV 2 Rows 3.9 4.1 0.2 Ford EdgeMini Van 3.4 3.7 0.3 Toyota SiennaMid Size Luxury SUV 2.1 2.6 0.5 Lexus RXCompact Luxury SUV 2.0 2.3 0.3 Buick EncoreFull Size SUV 1.8 2.0 0.2 Chevrolet TahoeLarge Mid Size Car 2.2 1.9 -0.3 Chevrolet ImpalaCompact Pickup 1.4 1.6 0.2 Toyota TacomaNear Luxury Car 2.0 1.6 -0.4 BMW 3-SeriesEntry Car 2.1 1.4 -0.7 Kia SoulFull Size Van 1.2 1.4 0.2 Ford Transit Connect VanLuxury and Sports Cars 1.3 1.1 -0.2 BMW 5-SeriesSport Compact Car 0.6 0.7 0.1 Ford MustangFull Size Luxury SUV 0.4 0.4 0.0 Cadillac EscaladeEntry Luxury Car 0.3 0.3 0.0 Audi A3
MARKET TRACKER: SEGMENTS
Compact SUV Market Share Continues to March Higher
The table above shows Minnesota market share for 19 vehicle segments during the first three months of 2015 and 2016, and the change in market share over the period. The best selling model in each segment is also shown. Segments are ranked from top to bottom based on 2016 share. Most popular segment in the state is Compact SUV, which also had the largest gain.
Source: IHS Automotive. The table above shows Minnesota market share for 19 vehicle segments during the first three months of 2015 and 2016, and the change in market share over the period. The best selling model in each segment is also shown. Segments are ranked from top to bottom based on 2016 share. Most popular segment in the state is Compact SUV, which also had the largest gain.
MARKET TRACKER: SEGMENTS
Compact SUV Market Share Continues to March Higher
Data Source: IHS Automotive.
CUSTOM PROFESSIONALBUSINESS CARDS• Hundreds of options• Competive pricing• Fast turnaround
To place your order, please contact Reggie KleinPhone: 651-789-2933 or 800-652-9029Email: [email protected]
We canturn your
business cardinto magnets
too!
• Great customer service with an on-staff graphic designer• Quantity options available
C
M
Y
CM
MY
CY
CMY
K
MADA BC Ad 1-3h 5_11.pdf 1 5/27/11 11:04 AM
www.mada.org 21
-21.3%
-9.3%
-22.4%
-14.2%
-9.2%
-8.0%
-3.3%
-0.3%
0.0%
1.4%
4.1%
-22.2%
-16.7%
-14.3%
-9.2%
-7.8%
-2.0%
3.2%
5.5%
16.7%
77.4%
-27.8%
-27.4%
-10.0%
-8.9%
-5.1%
-4.7%
-2.7%
0.3%
6.4%
7.8%
19.3%
-75.0% -50.0% -25.0% 0.0% 25.0% 50.0% 75.0% 100.0%
Hyundai
Kia
Infiniti
Acura
Nissan
Mitsubishi
Mazda
Subaru
Lexus
Toyota
Honda
Jaguar
MINI
Land Rover
Mercedes
Volkswagen
Porsche
Audi
BMW
FIAT
Volvo
Cadillac
Chrysler
Buick
Ford
Dodge
Lincoln
GMC
Chevrolet
Ram
Jeep
Tesla
Detroit Three Brands
European Brands
Japanese Brands
Korean Brands
BRAND SCOREBOARD-PART ONE
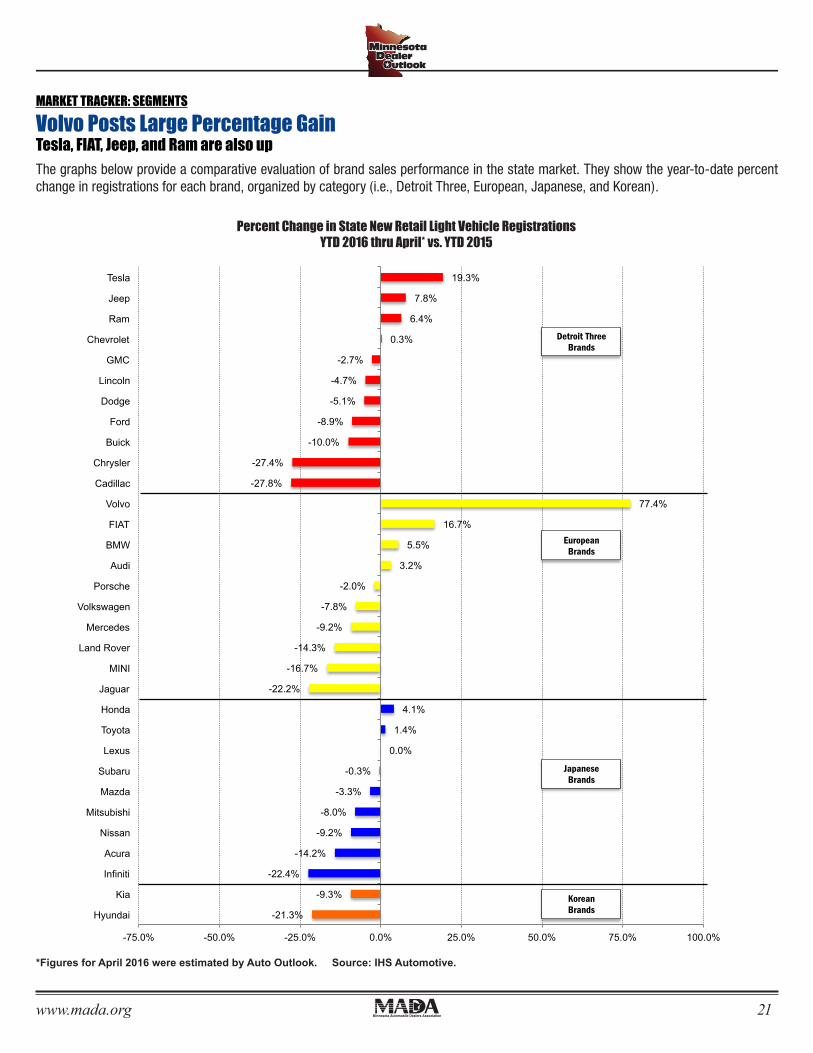
Volvo Posts Large Percentage Gain Tesla, FIAT, Jeep, and Ram are also up
The graphs below provide a comparative evaluation of brand sales performance in the state market. They show the year-to-date percent change in registrations for each brand, organized by category (i.e., Detroit Three, European, Japanese, and Korean).
Percent Change in State New Retail Light Vehicle Registrations YTD 2016 thru April* vs. YTD 2015
*Figures for April 2016 were estimated by Auto Outlook. Source: IHS Automotive.
The graphs below provide a comparative evaluation of brand sales performance in the state market. They show the year-to-date percent change in registrations for each brand, organized by category (i.e., Detroit Three, European, Japanese, and Korean).
MARKET TRACKER: SEGMENTS
Volvo Posts Large Percentage GainTesla, FIAT, Jeep, and Ram are also up
*Figures for April 2016 were estimated by Auto Outlook. Source: IHS Automotive.
Percent Change in State New Retail Light Vehicle RegistrationsYTD 2016 thru April* vs. YTD 2015
www.mada.org22
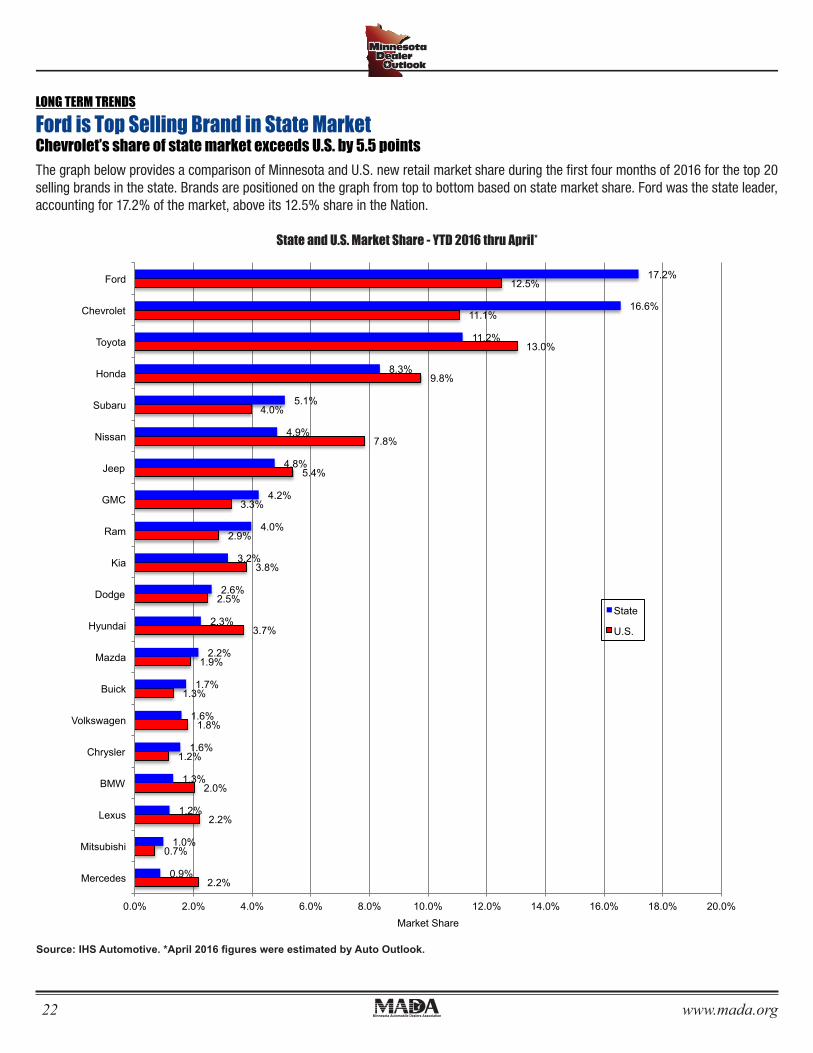
The graph below provides a comparison of Minnesota and U.S. new retail market share during the first four months of 2016 for the top 20 selling brands in the state. Brands are positioned on the graph from top to bottom based on state market share. Ford was the state leader, accounting for 17.2% of the market, above its 12.5% share in the Nation.
LONG TERM TRENDS
Ford is Top Selling Brand in State Market Chevrolet’s share of state market exceeds U.S. by 5.5 points
2.2%
0.7%
2.2%
2.0%
1.2%
1.8%
1.3%
1.9%
3.7%
2.5%
3.8%
2.9%
3.3%
5.4%
7.8%
4.0%
9.8%
13.0%
11.1%
12.5%
0.9%
1.0%
1.2%
1.3%
1.6%
1.6%
1.7%
2.2%
2.3%
2.6%
3.2%
4.0%
4.2%
4.8%
4.9%
5.1%
8.3%
11.2%
16.6%
17.2%
0.0% 2.0% 4.0% 6.0% 8.0% 10.0% 12.0% 14.0% 16.0% 18.0% 20.0%
Mercedes
Mitsubishi
Lexus
BMW
Chrysler
Volkswagen
Buick
Mazda
Hyundai
Dodge
Kia
Ram
GMC
Jeep
Nissan
Subaru
Honda
Toyota
Chevrolet
Ford
Market Share
State
U.S.
BRAND SCOREBOARD - PART TWO
Ford is Top Selling Brand in State Market Chevrolet’s share of state market exceeds U.S. by 5.5 points
The graph below provides a comparison of Minnesota and U.S. new retail market share during the first four months of 2016 for the top 20 selling brands in the state. Brands are positioned on the graph from top to bottom based on state market share. Ford was the state leader, accounting for 17.2% of the market, above its 12.5% share in the Nation.
State and U.S. Market Share - YTD 2016 thru April*
Source: IHS Automotive. *April 2016 figures were estimated by Auto Outlook.
State and U.S. Market Share - YTD 2016 thru April*
Source: IHS Automotive. *April 2016 figures were estimated by Auto Outlook.
www.mada.org 23
Take advantage of Utility rebate incentives while you still can!
Why go LED
Up to 75% Energy Savings
Industry best 5 and 10 year product warranties
Improved lighting quality for product presentation
Eliminate lighting maintenance contracts
“We selected LED Supply CO to upgrade our exterior lights and interior areas because
they stood out from other suppliers in regards to pricing, expertise, and service.”
—Jack Saxon, Owner Saxon Ford
877-595-4769www.LEDSupplyCo.com
AFTER
LED Supply Co. Services— No Cost Auditing and Proposal
— Certified lighting design services
— Turn Key Services available
— Financing and Tax Incentives
— Optimized Rebate Incentives
Take advantage of rebates while you can!
Upgrade to efficient LED lighting today!C
M
Y
CM
MY
CY
CMY
K
led-half-page-ad-bleed.pdf 8/31/15 11:28:54 AM
Introducing the Mark VII Choicewash XT®. Decades of proven Aquajet® Touch-free technology and the unsurpassed efficiency and effectiveness of a Softwash XT® Soft-touch automatic—truly two machines in one! Choicewash XT® is an industry first . . . One machine that can deliver a top quality wash in either mode and it’s your customer’s choice!
For more information on upgrading your car wash—
Call Reliable Plus today 800.782.8793 reliableplus.com
Soft-touch & Touch-free now on one machine.
The Best of Both Worlds:
Minnesota • Wisconsin
North Dakota • South Dakota
www.mada.org24
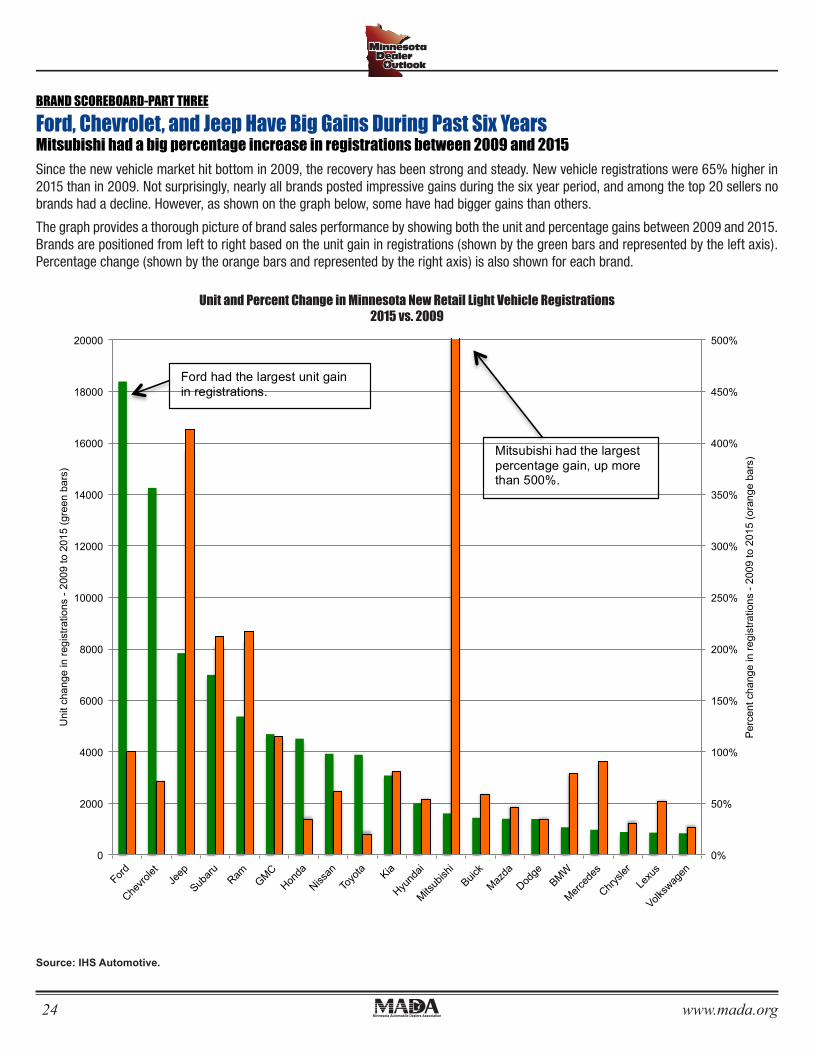
BRAND SCOREBOARD-PART THREE
Ford, Chevrolet, and Jeep Have Big Gains During Past Six Years Mitsubishi had a big percentage increase in registrations between 2009 and 2015
0%
50%
100%
150%
200%
250%
300%
350%
400%
450%
500%
0
2000
4000
6000
8000
10000
12000
14000
16000
18000
20000
Per
cent
cha
nge
in re
gist
ratio
ns -
2009
to 2
015
(ora
nge
bars
)
Uni
t cha
nge
in re
gist
ratio
ns -
2009
to 2
015
(gre
en b
ars)
BRAND SCOREBOARD-PART THREE
Ford, Chevrolet, and Jeep Have Big Gains During Past Six Years Mitsubishi had a big percentage increase in registrations between 2009 and 2015
Since the new vehicle market hit bottom in 2009, the recovery has been strong and steady. New vehicle registrations were 65% higher in 2015 than in 2009. Not surprisingly, nearly all brands posted impressive gains during the six year period, and among the top 20 sellers no brands had a decline. However, as shown on the graph below, some have had bigger gains than others.
The graph provides a thorough picture of brand sales performance by showing both the unit and percentage gains between 2009 and 2015. Brands are positioned from left to right based on the unit gain in registrations (shown by the green bars and represented by the left axis). Percentage change (shown by the orange bars and represented by the right axis) is also shown for each brand.
Source: IHS Automotive.
Unit and Percent Change in Minnesota New Retail Light Vehicle Registrations 2015 vs. 2009
Ford had the largest unit gain in registrations.
Mitsubishi had the largest percentage gain, up more than 500%.
Since the new vehicle market hit bottom in 2009, the recovery has been strong and steady. New vehicle registrations were 65% higher in 2015 than in 2009. Not surprisingly, nearly all brands posted impressive gains during the six year period, and among the top 20 sellers no brands had a decline. However, as shown on the graph below, some have had bigger gains than others.
The graph provides a thorough picture of brand sales performance by showing both the unit and percentage gains between 2009 and 2015. Brands are positioned from left to right based on the unit gain in registrations (shown by the green bars and represented by the left axis). Percentage change (shown by the orange bars and represented by the right axis) is also shown for each brand.
Source: IHS Automotive.
Unit and Percent Change in Minnesota New Retail Light Vehicle Registrations2015 vs. 2009
www.mada.org 25
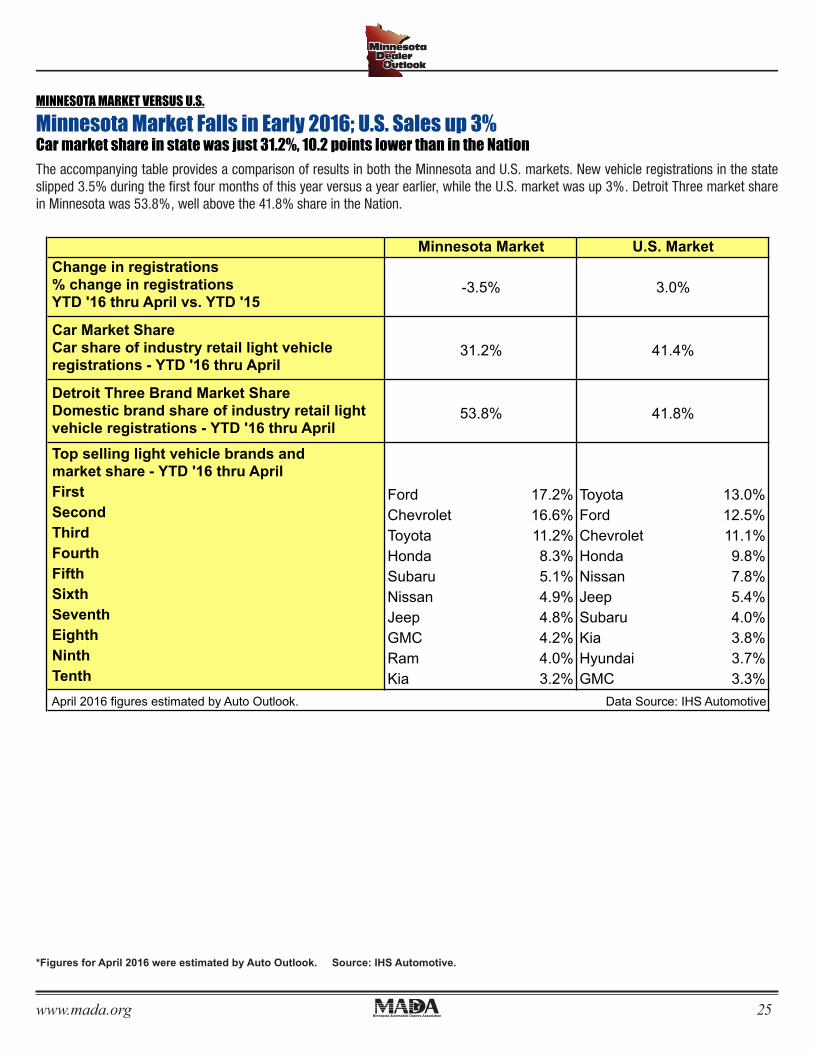
Minnesota Market U.S. MarketChange in registrations% change in registrationsYTD '16 thru April vs. YTD '15
-3.5% 3.0%
Car Market ShareCar share of industry retail light vehicleregistrations - YTD '16 thru April
31.2% 41.4%
Detroit Three Brand Market ShareDomestic brand share of industry retail light vehicle registrations - YTD '16 thru April
53.8% 41.8%
Top selling light vehicle brands andmarket share - YTD '16 thru AprilFirst Ford 17.2% Toyota 13.0%Second Chevrolet 16.6% Ford 12.5%Third Toyota 11.2% Chevrolet 11.1%Fourth Honda 8.3% Honda 9.8%Fifth Subaru 5.1% Nissan 7.8%Sixth Nissan 4.9% Jeep 5.4%Seventh Jeep 4.8% Subaru 4.0%Eighth GMC 4.2% Kia 3.8%Ninth Ram 4.0% Hyundai 3.7%Tenth Kia 3.2% GMC 3.3%April 2016 figures estimated by Auto Outlook. Data Source: IHS Automotive
MINNESOTA MARKET VERSUS U.S.
Minnesota Market Falls in Early 2016; U.S. Sales up 3% Car market share in state was just 31.2%, 10.2 points lower than in the Nation
The accompanying table provides a comparison of results in both the Minnesota and U.S. markets. New vehicle registrations in the state slipped 3.5% during the first four months of this year versus a year earlier, while the U.S. market was up 3%. Detroit Three market share in Minnesota was 53.8%, well above the 41.8% share in the Nation.
The accompanying table provides a comparison of results in both the Minnesota and U.S. markets. New vehicle registrations in the state slipped 3.5% during the first four months of this year versus a year earlier, while the U.S. market was up 3%. Detroit Three market share in Minnesota was 53.8%, well above the 41.8% share in the Nation.
MINNESOTA MARKET VERSUS U.S.
Minnesota Market Falls in Early 2016; U.S. Sales up 3%Car market share in state was just 31.2%, 10.2 points lower than in the Nation
*Figures for April 2016 were estimated by Auto Outlook. Source: IHS Automotive.
www.mada.org26
Minnesota Retail Used Light Vehicle RegistrationsYTD thru March
Registrations % Change Market ShareYTD '15 YTD '16 '15 to '16 YTD '15 YTD '16
TOTAL 163,925 144,515 -11.8%
Cars 80,643 68,164 -15.5% 49.2% 47.2%Light Trucks 83,282 76,351 -8.3% 50.8% 52.8%
Detroit Three 113,494 97,566 -14.0% 69.2% 67.5%European 10,000 9,053 -9.5% 6.1% 6.3%Japanese 35,338 32,926 -6.8% 21.6% 22.8%Korean 5,093 4,970 -2.4% 3.1% 3.4%
0
5000
10000
15000
20000
25000
Jan-
13
Feb-
13
Mar
-13
Apr
-13
May
-13
Jun-
13
Jul-1
3 A
ug-1
3 S
ep-1
3 O
ct-1
3 N
ov-1
3 D
ec-1
3 Ja
n-14
Fe
b-14
M
ar-1
4 A
pr-1
4 M
ay-1
4 Ju
n-14
Ju
l-14
Aug
-14
Sep
-14
Oct
-14
Nov
-14
Dec
-14
Jan-
15
Feb-
15
Mar
-15
Apr
-15
May
-15
Jun-
15
Jul-1
5 A
ug-1
5 S
ep-1
5 O
ct-1
5 N
ov-1
5 D
ec-1
5 Ja
n-16
Fe
b-16
M
ar-1
6
Reg
istra
tions
6 yr. old or newer used
New
'10 to '11 '11 to '12 '12 to '13 '13 to '14 '14 to '15 YTD '15 to YTD '16
New 27.9% 7.8% 11.6% 4.4% -1.4% -3.5%
Used 4.3% 0.0% 9.3% -10.8% 5.4% -11.8%
-15.0%
-10.0%
-5.0%
0.0%
5.0%
10.0%
15.0%
20.0%
25.0%
30.0%
RECENT RESULTS IN MINNESOTA USED VEHICLE MARKET
Used Vehicle Market Moves Lower in First Quarter of 2016 Used vehicle registrations declined by 11.8% in early 2016
% Change in Retail New and Used Vehicle Markets 2010 thru 2015, YTD 2016 thru March*
Minnesota New and Used Retail Registrations - Three Month Moving Average (used only includes vehicles 6 years old or newer)
Source: IHS Automotive.
Data Source: IHS Automotive.
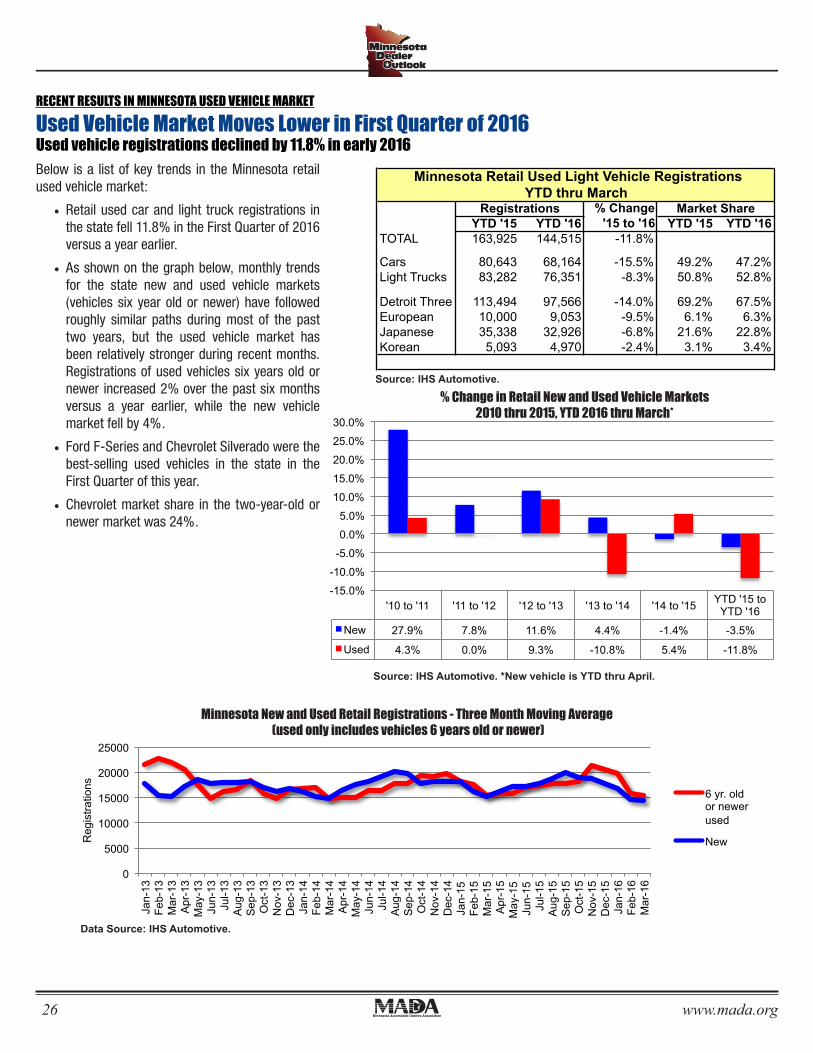
Below is a list of key trends in the Minnesota retail used vehicle market:
• Retail used car and light truck registrations in the state fell 11.8% in the First Quarter of 2016 versus a year earlier.
• As shown on the graph below, monthly trends for the state new and used vehicle markets (vehicles six year old or newer) have followed roughly similar paths during most of the past two years, but the used vehicle market has been relatively stronger during recent months. Registrations of used vehicles six years old or newer increased 2% over the past six months versus a year earlier, while the new vehicle market fell by 4%.
• Ford F-Series and Chevrolet Silverado were the best-selling used vehicles in the state in the First Quarter of this year.
• Chevrolet market share in the two year old or newer market was 24%.
Source: IHS Automotive. *New vehicle is YTD thru April.
RECENT RESULTS IN MINNESOTA USED VEHICLE MARKET
Used Vehicle Market Moves Lower in First Quarter of 2016Used vehicle registrations declined by 11.8% in early 2016
Minnesota Retail Used Light Vehicle RegistrationsYTD thru March
Registrations % Change Market ShareYTD '15 YTD '16 '15 to '16 YTD '15 YTD '16
TOTAL 163,925 144,515 -11.8%
Cars 80,643 68,164 -15.5% 49.2% 47.2%Light Trucks 83,282 76,351 -8.3% 50.8% 52.8%
Detroit Three 113,494 97,566 -14.0% 69.2% 67.5%European 10,000 9,053 -9.5% 6.1% 6.3%Japanese 35,338 32,926 -6.8% 21.6% 22.8%Korean 5,093 4,970 -2.4% 3.1% 3.4%
0
5000
10000
15000
20000
25000
Jan-
13
Feb-
13
Mar
-13
Apr
-13
May
-13
Jun-
13
Jul-1
3 A
ug-1
3 S
ep-1
3 O
ct-1
3 N
ov-1
3 D
ec-1
3 Ja
n-14
Fe
b-14
M
ar-1
4 A
pr-1
4 M
ay-1
4 Ju
n-14
Ju
l-14
Aug
-14
Sep
-14
Oct
-14
Nov
-14
Dec
-14
Jan-
15
Feb-
15
Mar
-15
Apr
-15
May
-15
Jun-
15
Jul-1
5 A
ug-1
5 S
ep-1
5 O
ct-1
5 N
ov-1
5 D
ec-1
5 Ja
n-16
Fe
b-16
M
ar-1
6
Reg
istra
tions
6 yr. old or newer used
New
'10 to '11 '11 to '12 '12 to '13 '13 to '14 '14 to '15 YTD '15 to YTD '16
New 27.9% 7.8% 11.6% 4.4% -1.4% -3.5%
Used 4.3% 0.0% 9.3% -10.8% 5.4% -11.8%
-15.0%
-10.0%
-5.0%
0.0%
5.0%
10.0%
15.0%
20.0%
25.0%
30.0%
RECENT RESULTS IN MINNESOTA USED VEHICLE MARKET
Used Vehicle Market Moves Lower in First Quarter of 2016 Used vehicle registrations declined by 11.8% in early 2016
% Change in Retail New and Used Vehicle Markets 2010 thru 2015, YTD 2016 thru March*
Minnesota New and Used Retail Registrations - Three Month Moving Average (used only includes vehicles 6 years old or newer)
Source: IHS Automotive.
Data Source: IHS Automotive.
Below is a list of key trends in the Minnesota retail used vehicle market:
• Retail used car and light truck registrations in the state fell 11.8% in the First Quarter of 2016 versus a year earlier.
• As shown on the graph below, monthly trends for the state new and used vehicle markets (vehicles six year old or newer) have followed roughly similar paths during most of the past two years, but the used vehicle market has been relatively stronger during recent months. Registrations of used vehicles six years old or newer increased 2% over the past six months versus a year earlier, while the new vehicle market fell by 4%.
• Ford F-Series and Chevrolet Silverado were the best-selling used vehicles in the state in the First Quarter of this year.
• Chevrolet market share in the two year old or newer market was 24%.
Source: IHS Automotive. *New vehicle is YTD thru April.
Below is a list of key trends in the Minnesota retail used vehicle market:
• Retail used car and light truck registrations in the state fell 11.8% in the First Quarter of 2016 versus a year earlier.
• As shown on the graph below, monthly trends for the state new and used vehicle markets (vehicles six year old or newer) have followed roughly similar paths during most of the past two years, but the used vehicle market has been relatively stronger during recent months. Registrations of used vehicles six years old or newer increased 2% over the past six months versus a year earlier, while the new vehicle market fell by 4%.
• Ford F-Series and Chevrolet Silverado were the best-selling used vehicles in the state in the First Quarter of this year.
• Chevrolet market share in the two-year-old or newer market was 24%.
Source: IHS Automotive.
Data Source: IHS Automotive.
Source: IHS Automotive. *New vehicle is YTD thru April.
Minnesota Retail Used Light Vehicle RegistrationsYTD thru March
Registrations % Change Market ShareYTD '15 YTD '16 '15 to '16 YTD '15 YTD '16
TOTAL 163,925 144,515 -11.8%
Cars 80,643 68,164 -15.5% 49.2% 47.2%Light Trucks 83,282 76,351 -8.3% 50.8% 52.8%
Detroit Three 113,494 97,566 -14.0% 69.2% 67.5%European 10,000 9,053 -9.5% 6.1% 6.3%Japanese 35,338 32,926 -6.8% 21.6% 22.8%Korean 5,093 4,970 -2.4% 3.1% 3.4%
0
5000
10000
15000
20000
25000
Jan-
13
Feb-
13
Mar
-13
Apr
-13
May
-13
Jun-
13
Jul-1
3 A
ug-1
3 S
ep-1
3 O
ct-1
3 N
ov-1
3 D
ec-1
3 Ja
n-14
Fe
b-14
M
ar-1
4 A
pr-1
4 M
ay-1
4 Ju
n-14
Ju
l-14
Aug
-14
Sep
-14
Oct
-14
Nov
-14
Dec
-14
Jan-
15
Feb-
15
Mar
-15
Apr
-15
May
-15
Jun-
15
Jul-1
5 A
ug-1
5 S
ep-1
5 O
ct-1
5 N
ov-1
5 D
ec-1
5 Ja
n-16
Fe
b-16
M
ar-1
6
Reg
istra
tions
6 yr. old or newer used
New
'10 to '11 '11 to '12 '12 to '13 '13 to '14 '14 to '15 YTD '15 to YTD '16
New 27.9% 7.8% 11.6% 4.4% -1.4% -3.5%
Used 4.3% 0.0% 9.3% -10.8% 5.4% -11.8%
-15.0%
-10.0%
-5.0%
0.0%
5.0%
10.0%
15.0%
20.0%
25.0%
30.0%
RECENT RESULTS IN MINNESOTA USED VEHICLE MARKET
Used Vehicle Market Moves Lower in First Quarter of 2016 Used vehicle registrations declined by 11.8% in early 2016
% Change in Retail New and Used Vehicle Markets 2010 thru 2015, YTD 2016 thru March*
Minnesota New and Used Retail Registrations - Three Month Moving Average (used only includes vehicles 6 years old or newer)
Source: IHS Automotive.
Data Source: IHS Automotive.
Below is a list of key trends in the Minnesota retail used vehicle market:
• Retail used car and light truck registrations in the state fell 11.8% in the First Quarter of 2016 versus a year earlier.
• As shown on the graph below, monthly trends for the state new and used vehicle markets (vehicles six year old or newer) have followed roughly similar paths during most of the past two years, but the used vehicle market has been relatively stronger during recent months. Registrations of used vehicles six years old or newer increased 2% over the past six months versus a year earlier, while the new vehicle market fell by 4%.
• Ford F-Series and Chevrolet Silverado were the best-selling used vehicles in the state in the First Quarter of this year.
• Chevrolet market share in the two year old or newer market was 24%.
Source: IHS Automotive. *New vehicle is YTD thru April.
Minnesota New and Used Retail Registrations - Three Month Moving Average (used only includes vehicles 6 years old or newer)
% Change in Retail New and Used Vehicle Markets2010 thru 2015, YTD 2016 thru March*
www.mada.org 27
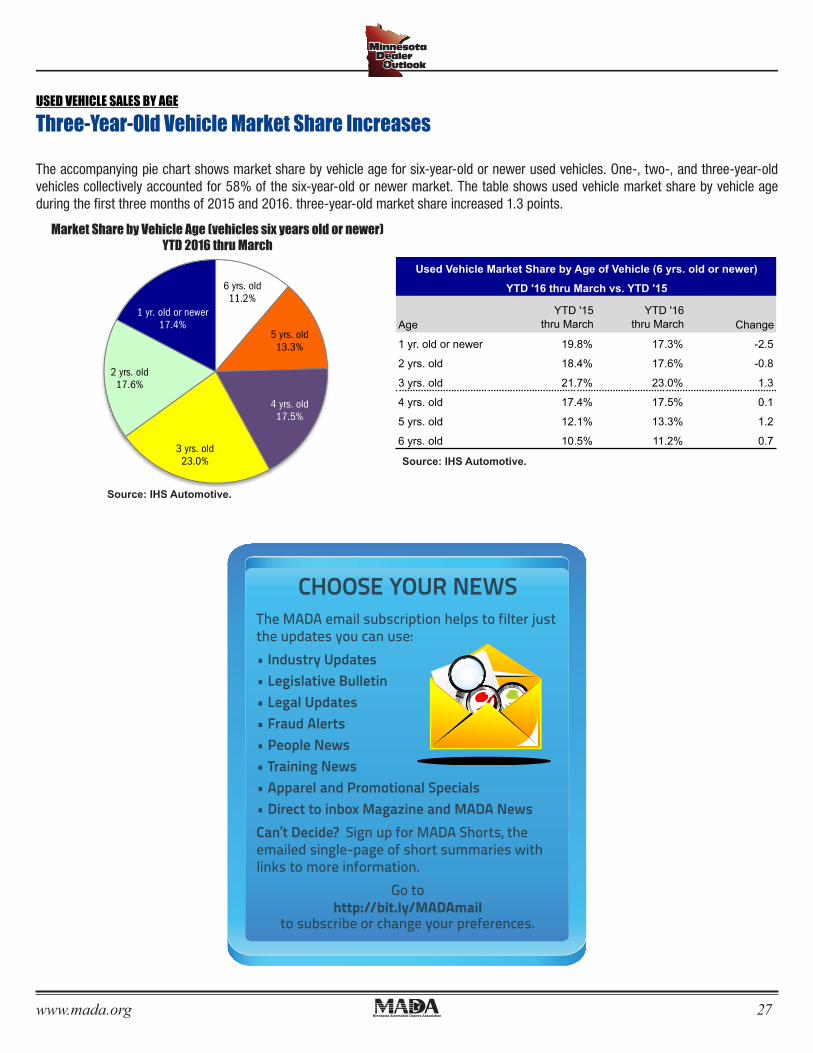
The accompanying pie chart shows market share by vehicle age for six-year-old or newer used vehicles. One-, two-, and three-year-old vehicles collectively accounted for 58% of the six-year-old or newer market. The table shows used vehicle market share by vehicle age during the first three months of 2015 and 2016. three-year-old market share increased 1.3 points.
USED VEHICLE SALES BY AGE
Three-Year-Old Vehicle Market Share Increases
Market Share by Vehicle Age (vehicles six years old or newer)YTD 2016 thru March
Used Vehicle Market Share by Age of Vehicle (6 yrs. old or newer)
YTD '16 thru March vs. YTD '15
AgeYTD '15
thru MarchYTD '16
thru March Change
1 yr. old or newer 19.8% 17.3% -2.5
2 yrs. old 18.4% 17.6% -0.8
3 yrs. old 21.7% 23.0% 1.3
4 yrs. old 17.4% 17.5% 0.1
5 yrs. old 12.1% 13.3% 1.2
6 yrs. old 10.5% 11.2% 0.7
6 yrs. old 11.2%
5 yrs. old 13.3%
4 yrs. old 17.5%
3 yrs. old 23.0%
2 yrs. old 17.6%
1 yr. old or newer 17.4%
USED VEHICLE SALES BY AGE
Three Year Old Vehicle Market Share Increases
The accompanying pie chart shows market share by vehicle age for 6 year-old or newer used vehicles. 1,2, and 3 year-old vehicles collectively accounted for 58% of the 6 year-old or newer market. The table shows used vehicle market share by vehicle age during the first three months of 2015 and 2016. 3 year-old market share increased 1.3 points.
Market Share by Vehicle Age (vehicles six years old or newer) YTD 2016 thru March
Source: IHS Automotive.
Source: IHS Automotive.
Source: IHS Automotive.
Source: IHS Automotive.
CHOOSE YOUR NEWSThe MADA email subscription helps to filter just the updates you can use:• Industry Updates • Legislative Bulletin • Legal Updates • Fraud Alerts • People News • Training News • Apparel and Promotional Specials • Direct to inbox Magazine and MADA News Can’t Decide? Sign up for MADA Shorts, the emailed single-page of short summaries with links to more information.
Go to http://bit.ly/MADAmail
to subscribe or change your preferences.
www.mada.org28
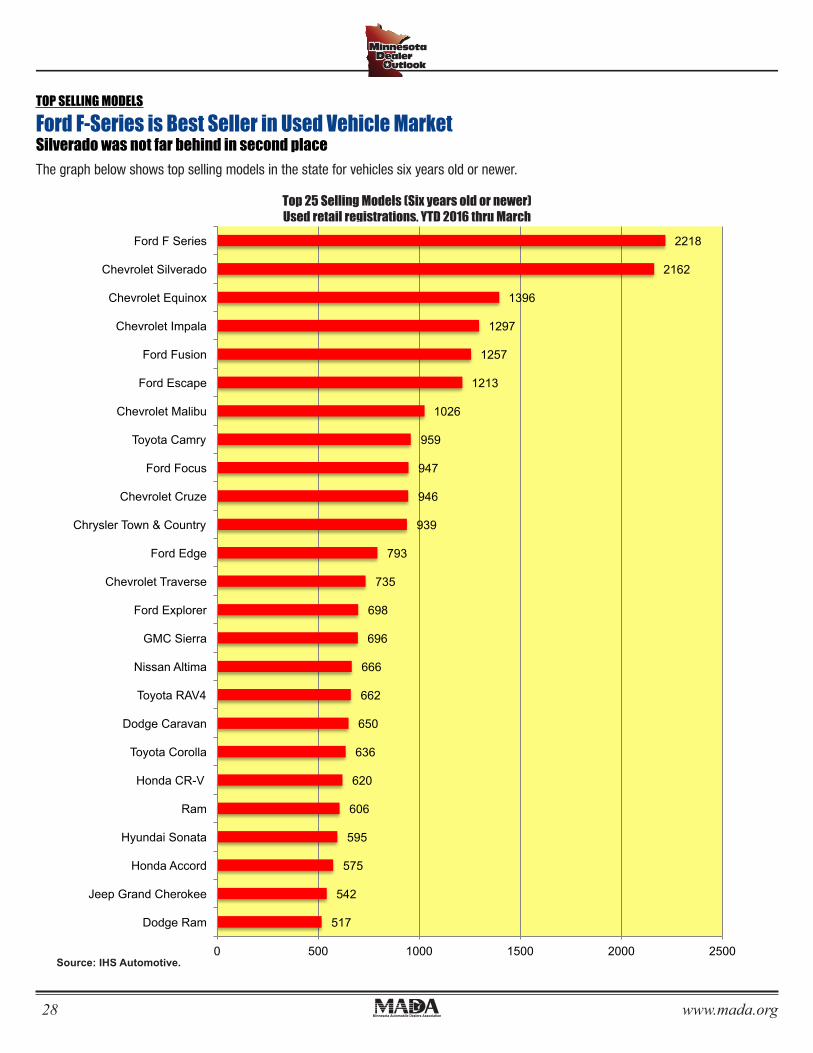
TOP SELLING MODELS
Ford F-Series is Best Seller in Used Vehicle MarketSilverado was not far behind in second placeThe graph below shows top selling models in the state for vehicles six years old or newer.
Source: IHS Automotive.
Top 25 Selling Models (Six years old or newer)Used retail registrations, YTD 2016 thru March
517
542
575
595
606
620
636
650
662
666
696
698
735
793
939
946
947
959
1026
1213
1257
1297
1396
2162
2218
0 500 1000 1500 2000 2500
Dodge Ram
Jeep Grand Cherokee
Honda Accord
Hyundai Sonata
Ram
Honda CR-V
Toyota Corolla
Dodge Caravan
Toyota RAV4
Nissan Altima
GMC Sierra
Ford Explorer
Chevrolet Traverse
Ford Edge
Chrysler Town & Country
Chevrolet Cruze
Ford Focus
Toyota Camry
Chevrolet Malibu
Ford Escape
Ford Fusion
Chevrolet Impala
Chevrolet Equinox
Chevrolet Silverado
Ford F Series
TOP SELLING MODELS
Ford F-Series is Best Seller in Used Vehicle Market Silverado was not far behind in second place
The graph below shows top selling models in the state for vehicles six years old or newer.
Top 25 Selling Models (Six years old or newer) Used retail registrations, YTD 2016 thru March
Source: IHS Automotive.
www.mada.org 29
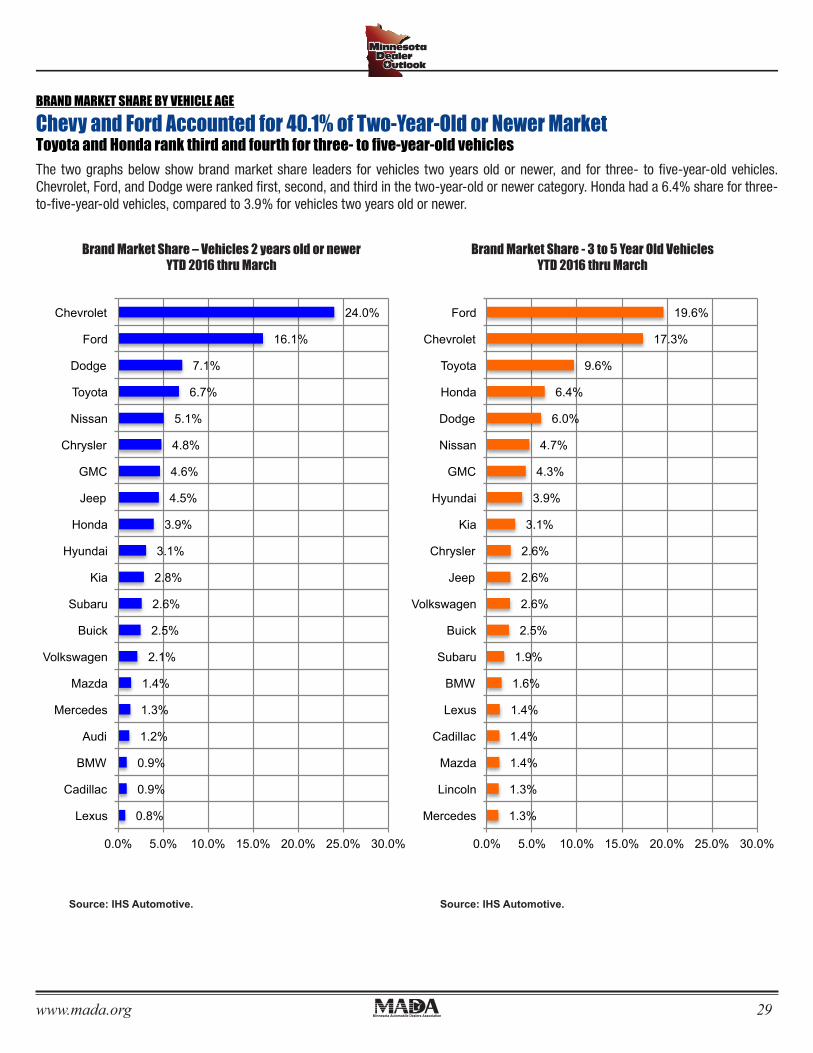
BRAND MARKET SHARE BY VEHICLE AGE
Chevy and Ford Accounted for 40.1% of Two-Year-Old or Newer MarketToyota and Honda rank third and fourth for three- to five-year-old vehicles
1.3%
1.3%
1.4%
1.4%
1.4%
1.6%
1.9%
2.5%
2.6%
2.6%
2.6%
3.1%
3.9%
4.3%
4.7%
6.0%
6.4%
9.6%
17.3%
19.6%
0.0% 5.0% 10.0% 15.0% 20.0% 25.0% 30.0%
Mercedes
Lincoln
Mazda
Cadillac
Lexus
BMW
Subaru
Buick
Volkswagen
Jeep
Chrysler
Kia
Hyundai
GMC
Nissan
Dodge
Honda
Toyota
Chevrolet
Ford
0.8%
0.9%
0.9%
1.2%
1.3%
1.4%
2.1%
2.5%
2.6%
2.8%
3.1%
3.9%
4.5%
4.6%
4.8%
5.1%
6.7%
7.1%
16.1%
24.0%
0.0% 5.0% 10.0% 15.0% 20.0% 25.0% 30.0%
Lexus
Cadillac
BMW
Audi
Mercedes
Mazda
Volkswagen
Buick
Subaru
Kia
Hyundai
Honda
Jeep
GMC
Chrysler
Nissan
Toyota
Dodge
Ford
Chevrolet
BRAND MARKET SHARE BY VEHICLE AGE
Chevy and Ford Accounted for 40.1% of Two Year Old or Newer Market Toyota and Honda rank third and fourth for 3 to 5 year old vehicles
The two graphs below show brand market share leaders for vehicles two years old or newer, and for 3 to 5 year old vehicles. Chevrolet, Ford, and Dodge were ranked first, second, and third in the 2 year old or newer category. Honda had a 6.4% share for three to five year old vehicles, compared to 3.9% for vehicles two years old or newer.
Brand Market Share - 3 to 5 Year Old Vehicles YTD 2016 thru March
Brand Market Share – Vehicles 2 years old or newer YTD 2016 thru March
Source: IHS Automotive. Source: IHS Automotive.
Brand Market Share – Vehicles 2 years old or newerYTD 2016 thru March
The two graphs below show brand market share leaders for vehicles two years old or newer, and for three- to five-year-old vehicles. Chevrolet, Ford, and Dodge were ranked first, second, and third in the two-year-old or newer category. Honda had a 6.4% share for three-to-five-year-old vehicles, compared to 3.9% for vehicles two years old or newer.
Source: IHS Automotive.
Brand Market Share - 3 to 5 Year Old VehiclesYTD 2016 thru March
Source: IHS Automotive.
1.3%
1.3%
1.4%
1.4%
1.4%
1.6%
1.9%
2.5%
2.6%
2.6%
2.6%
3.1%
3.9%
4.3%
4.7%
6.0%
6.4%
9.6%
17.3%
19.6%
0.0% 5.0% 10.0% 15.0% 20.0% 25.0% 30.0%
Mercedes
Lincoln
Mazda
Cadillac
Lexus
BMW
Subaru
Buick
Volkswagen
Jeep
Chrysler
Kia
Hyundai
GMC
Nissan
Dodge
Honda
Toyota
Chevrolet
Ford
0.8%
0.9%
0.9%
1.2%
1.3%
1.4%
2.1%
2.5%
2.6%
2.8%
3.1%
3.9%
4.5%
4.6%
4.8%
5.1%
6.7%
7.1%
16.1%
24.0%
0.0% 5.0% 10.0% 15.0% 20.0% 25.0% 30.0%
Lexus
Cadillac
BMW
Audi
Mercedes
Mazda
Volkswagen
Buick
Subaru
Kia
Hyundai
Honda
Jeep
GMC
Chrysler
Nissan
Toyota
Dodge
Ford
Chevrolet
BRAND MARKET SHARE BY VEHICLE AGE
Chevy and Ford Accounted for 40.1% of Two Year Old or Newer Market Toyota and Honda rank third and fourth for 3 to 5 year old vehicles
The two graphs below show brand market share leaders for vehicles two years old or newer, and for 3 to 5 year old vehicles. Chevrolet, Ford, and Dodge were ranked first, second, and third in the 2 year old or newer category. Honda had a 6.4% share for three to five year old vehicles, compared to 3.9% for vehicles two years old or newer.
Brand Market Share - 3 to 5 Year Old Vehicles YTD 2016 thru March
Brand Market Share – Vehicles 2 years old or newer YTD 2016 thru March
Source: IHS Automotive. Source: IHS Automotive.
www.mada.org30
MADA is gathering data on property crimes being perpetrated on dealerships. We are particularly interested in wheel/tire theft. This data will be collected over the next several months and be used to gain a better understanding of the problem.
MADA is asking all dealerships that are victims of these crimes to report them directly to Associate Counsel Dan Louismet via phone or email. Specifically, MADA would like to know:
(1) Dealership name, date, time, and location of the crime within the dealership (i.e. back lot, front display, etc.);
(2) Year, make, and model of the vehicle(s) hit;
(3) Specific items stolen (tires/wheels, tailgates) and their fair market value; and
(4) Police reports and police contact information (if available).
This information can be reported via email at [email protected] or by calling Dan directly at (651) 789-2948. This does not replace your responsibility to report each theft to your local law enforcement agency.
If anyone has any immediate questions or concerns regarding this request, or about property crimes in general, please do not hesitate to contact Dan Louismet
NOTE: Through this initiative, MADA received a report from a metro dealership that concrete “cinder” blocks were found in the beds of several pickup trucks. Concrete blocks are used to speed-up the process of stealing wheels and tires. MADA also received a report of lug nuts missing from the wheels of vehicles in a concentrated area within a given lot. These are known indicators of a future theft. MADA recommends that dealers instruct lot staff to be on the look-out for vehicles with multiple missing lug nuts and/or concrete blocks in the beds of pickup trucks or under vehicles. If your personnel spot such activity at your dealership, report it to your local law enforcement and request additional patrol over the next several days.
MADA NEWS
MADA Property Crimes Initiative
Dan LouismetAssociate General Counsell
www.mada.org 31
TOTALCUSTOMER
CAREMany of today’s vehicles are built with impact-resistant structural adhesives as part of their weld- or rivet-bonded constructions. 3M™ Impact Resistant Structural Adhesive (IRSA) is designed to meet auto maker requirements for repairing those structural bonds. IRSA delivers higher impact strength than traditional bonding adhesives where impact strength matters most.
Learn more at:
3MCollision.com/IRSA
When impact resistance matters.
3M is a trademark of 3M Company. © 3M 2016. All rights reserved.
SUPER SAVINGS ON FUELIN STORE AND AT THE PUMP
SMART BUSINESSSMART BUSINESS+ =
SA FLEET CARD
8¢OFFPER GALLON*
APPLY TODAY SUPERAMERICA.COM/FLEET/APPLY
®
MY SA REWARDS® CARD*
5¢PER GAL
3¢PER GAL
AT PARTICIPATING LOCATIONS*
CLAconnect.com/dealerships612-376-4513
Investment advisory services are offered through CliftonLarsonAllen Wealth Advisors, LLC, an SEC-registered investment advisor.
WEALTH ADVISORY | OUTSOURCING | AUDIT, TAX, AND CONSULTING
©20
15 C
lifton
Lars
onAl
len
LLP
ROCK SOLID FINANCIALS Generate confidence in your financials with the help of experienced numbers people.
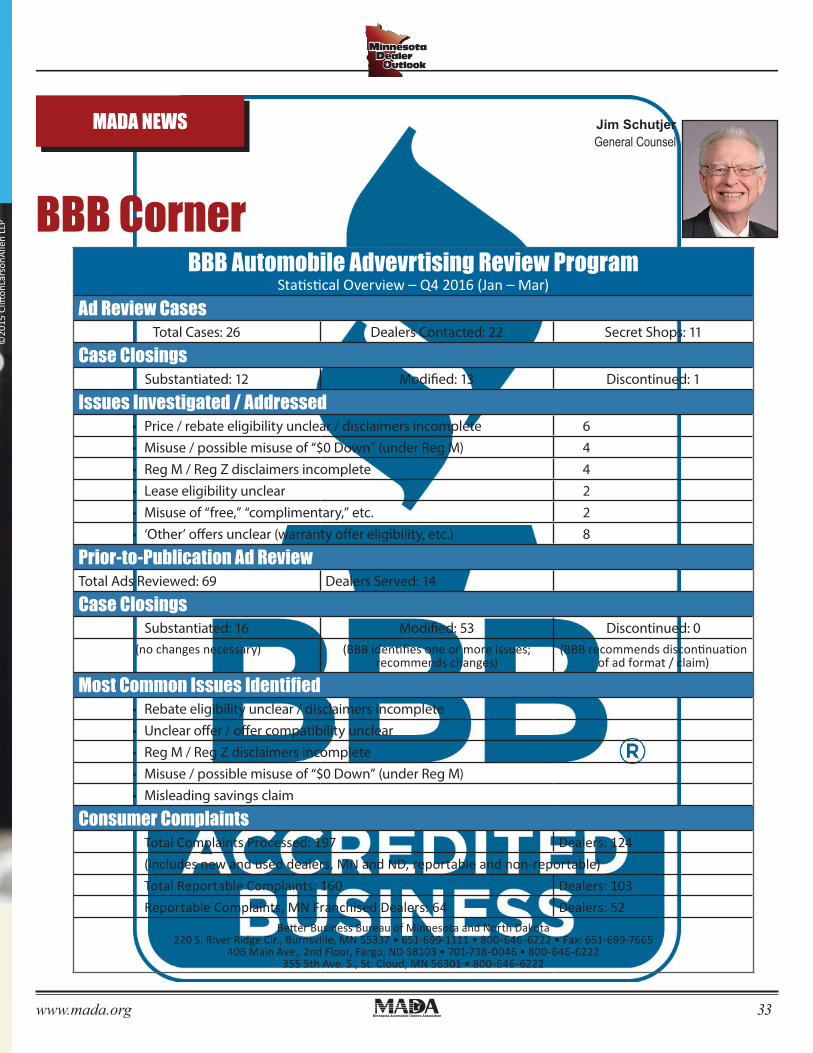
www.mada.org 33CLAconnect.com/dealerships612-376-4513
Investment advisory services are offered through CliftonLarsonAllen Wealth Advisors, LLC, an SEC-registered investment advisor.
WEALTH ADVISORY | OUTSOURCING | AUDIT, TAX, AND CONSULTING
©20
15 C
lifton
Lars
onAl
len
LLP
ROCK SOLID FINANCIALS Generate confidence in your financials with the help of experienced numbers people. MADA NEWS
BBB Corner
Jim SchutjerGeneral Counsel
BBB Automobile Advevrtising Review ProgramStatistical Overview – Q4 2016 (Jan – Mar)
Ad Review CasesTotal Cases: 26 Dealers Contacted: 22 Secret Shops: 11
Case ClosingsSubstantiated: 12 Modified: 13 Discontinued: 1
Issues Investigated / Addressed• Price / rebate eligibility unclear / disclaimers incomplete 6• Misuse / possible misuse of “$0 Down” (under Reg M) 4• Reg M / Reg Z disclaimers incomplete 4• Lease eligibility unclear 2• Misuse of “free,” “complimentary,” etc. 2• ‘Other’ offers unclear (warranty offer eligibility, etc.) 8
Prior-to-Publication Ad ReviewTotal Ads Reviewed: 69 Dealers Served: 14
Case ClosingsSubstantiated: 16 Modified: 53 Discontinued: 0
(no changes necessary) (BBB identifies one or more issues; recommends changes)
(BBB recommends discontinuation of ad format / claim)
Most Common Issues Identified• Rebate eligibility unclear / disclaimers incomplete• Unclear offer / offer compatibility unclear• Reg M / Reg Z disclaimers incomplete• Misuse / possible misuse of “$0 Down” (under Reg M)• Misleading savings claim
Consumer ComplaintsTotal Complaints Processed: 197 Dealers: 124(includes new and used dealers, MN and ND, reportable and non-reportable)Total Reportable Complaints: 160 Dealers: 103Reportable Complaints, MN Franchised Dealers: 64 Dealers: 52
Better Business Bureau of Minnesota and North Dakota 220 S. River Ridge Cir., Burnsville, MN 55337 • 651-699-1111 • 800-646-6222 • Fax: 651-699-7665
406 Main Ave., 2nd Floor, Fargo, ND 58103 • 701-738-0046 • 800-646-6222 355 5th Ave. S., St. Cloud, MN 56301 • 800-646-6222
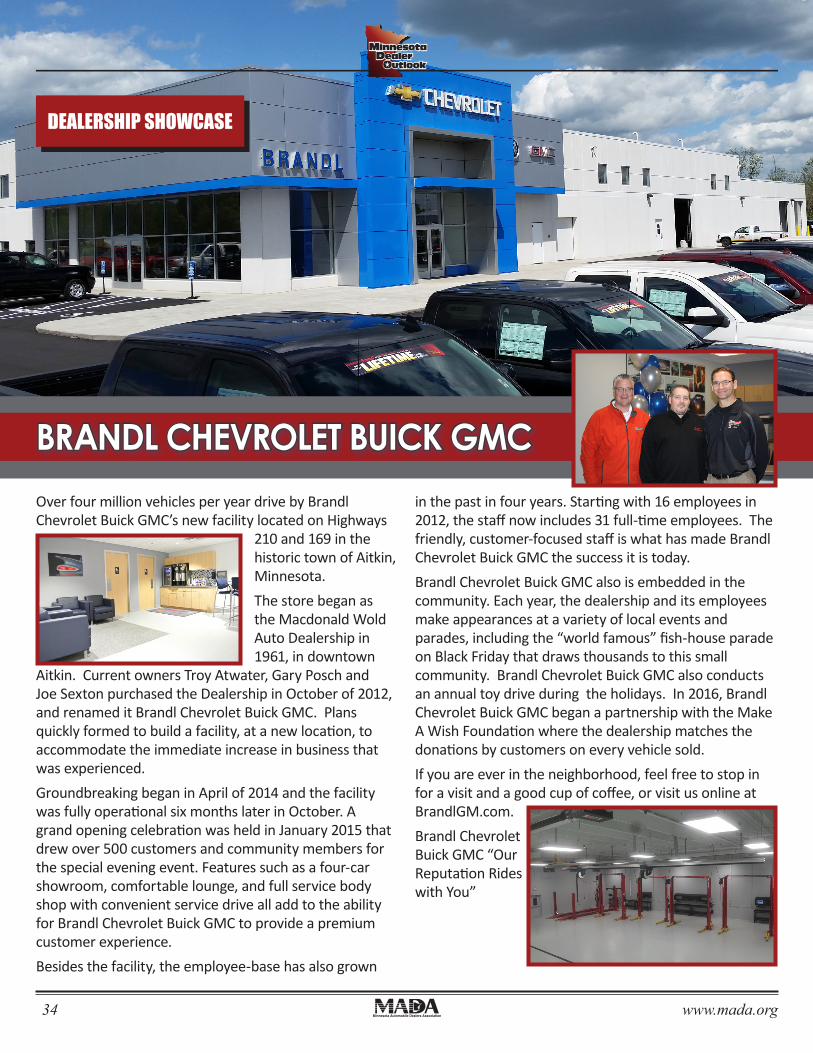
www.mada.org34
Over four million vehicles per year drive by Brandl Chevrolet Buick GMC’s new facility located on Highways
210 and 169 in the historic town of Aitkin, Minnesota.The store began as the Macdonald Wold Auto Dealership in 1961, in downtown
Aitkin. Current owners Troy Atwater, Gary Posch and Joe Sexton purchased the Dealership in October of 2012, and renamed it Brandl Chevrolet Buick GMC. Plans quickly formed to build a facility, at a new location, to accommodate the immediate increase in business that was experienced.Groundbreaking began in April of 2014 and the facility was fully operational six months later in October. A grand opening celebration was held in January 2015 that drew over 500 customers and community members for the special evening event. Features such as a four-car showroom, comfortable lounge, and full service body shop with convenient service drive all add to the ability for Brandl Chevrolet Buick GMC to provide a premium customer experience. Besides the facility, the employee-base has also grown
in the past in four years. Starting with 16 employees in 2012, the staff now includes 31 full-time employees. The friendly, customer-focused staff is what has made Brandl Chevrolet Buick GMC the success it is today.Brandl Chevrolet Buick GMC also is embedded in the community. Each year, the dealership and its employees make appearances at a variety of local events and parades, including the “world famous” fish-house parade on Black Friday that draws thousands to this small community. Brandl Chevrolet Buick GMC also conducts an annual toy drive during the holidays. In 2016, Brandl Chevrolet Buick GMC began a partnership with the Make A Wish Foundation where the dealership matches the donations by customers on every vehicle sold.If you are ever in the neighborhood, feel free to stop in for a visit and a good cup of coffee, or visit us online at BrandlGM.com.Brandl Chevrolet Buick GMC “Our Reputation Rides with You”
BRANDL CHEVROLET BUICK GMC
DEALERSHIP SHOWCASE
Rev up your advertising. Call Brian Maginnis at 612-673-7118 or Stephanie Rowh at 612-673-4667.
Star Tribune offers more options to drive more active car shoppers into your showroom. So don’t get stuck in neutral, take it to the next gear and reach over 61% of metro adults who are ready to buy. Vroom. Vroom.
Put your sales into
3254194/7/16
NEWSPAPER
RETARGETING
MOBILE & APPS
GEO AND AUDIENCE TARGETING
SEARCH ENGINE MARKETING
E-MAIL MARKETING

PROTECTIVE’S VEHICLE PROTECTION PLAN
IS A NO-BRAINER.Introducing the NEW Vehicle Protection Plan
from Protective Asset Protection.
Coverage that better meets the needs of an evolving marketplace
Updated F&I technology, including e-rating
Simplified contract and materials
Backed by over 50 years of reliably serving
dealers
Protect Tomorrow. Embrace Today.TM
Vehicle Protection Plans | GAP Coverage | Credit Insurance | Limited Warranty Products Dealer Participation Programs | F&I Training | Advanced F&I Technology
Limited Warranty Products, Vehicle Protection Plans (VPPs) and GAP are backed by Lyndon Property Insurance Company in all states except NY. In NY, VPPs are backed by Old Republic Insur-ance Company, Limited Warranty Products are backed by Western General Insurance Company and GAP is not available. Credit Insurance by Protective Life Insurance Company in all states except NY, where it is backed by Protective Life and Annuity Insurance Company.
visit
protectivevpp.com
or call
866 927 2908
Contact Protective’s Minnesota representative,James Mercer at 866 927 2908