9.1 exchange rates - authorised dealers
TRANSCRIPT
SBP Annual Report-Statistical Supplement FY 10
96
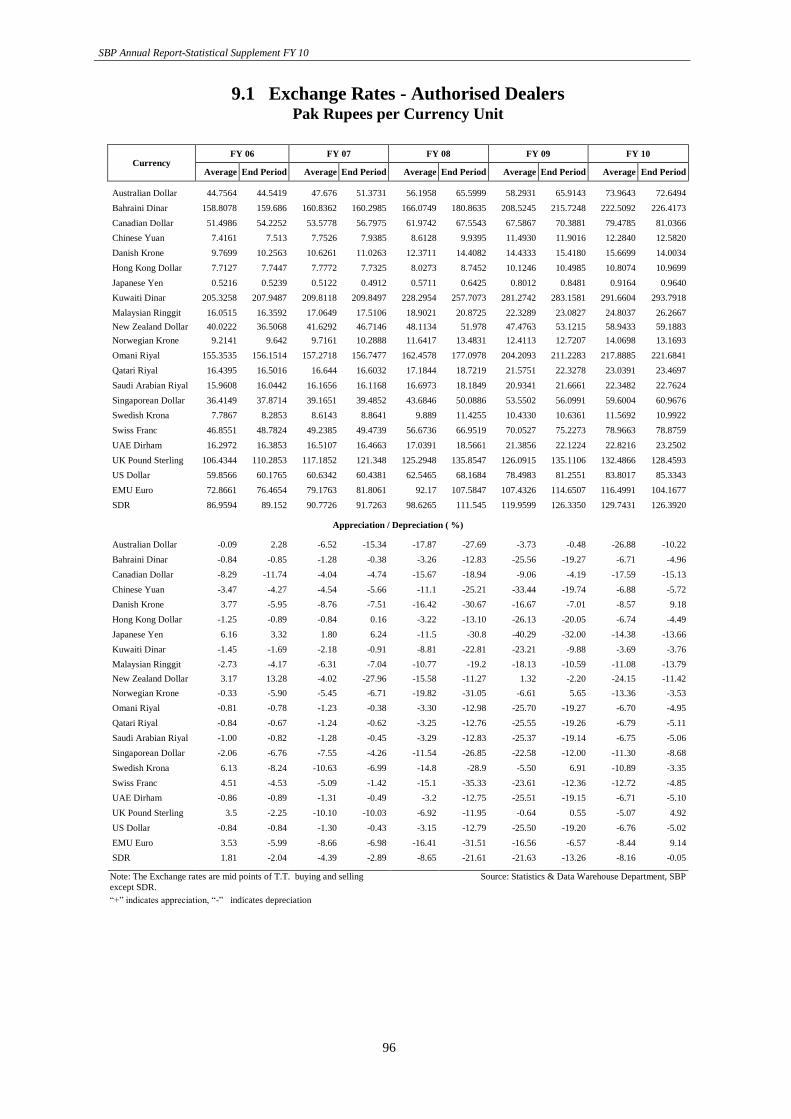
9.1 Exchange Rates - Authorised Dealers Pak Rupees per Currency Unit
Currency FY 06 FY 07 FY 08 FY 09 FY 10
Average End Period Average End Period Average End Period Average End Period Average End Period
Australian Dollar 44.7564 44.5419 47.676 51.3731 56.1958 65.5999 58.2931 65.9143 73.9643 72.6494
Bahraini Dinar 158.8078 159.686 160.8362 160.2985 166.0749 180.8635 208.5245 215.7248 222.5092 226.4173
Canadian Dollar 51.4986 54.2252 53.5778 56.7975 61.9742 67.5543 67.5867 70.3881 79.4785 81.0366
Chinese Yuan 7.4161 7.513 7.7526 7.9385 8.6128 9.9395 11.4930 11.9016 12.2840 12.5820
Danish Krone 9.7699 10.2563 10.6261 11.0263 12.3711 14.4082 14.4333 15.4180 15.6699 14.0034
Hong Kong Dollar 7.7127 7.7447 7.7772 7.7325 8.0273 8.7452 10.1246 10.4985 10.8074 10.9699
Japanese Yen 0.5216 0.5239 0.5122 0.4912 0.5711 0.6425 0.8012 0.8481 0.9164 0.9640
Kuwaiti Dinar 205.3258 207.9487 209.8118 209.8497 228.2954 257.7073 281.2742 283.1581 291.6604 293.7918
Malaysian Ringgit 16.0515 16.3592 17.0649 17.5106 18.9021 20.8725 22.3289 23.0827 24.8037 26.2667
New Zealand Dollar 40.0222 36.5068 41.6292 46.7146 48.1134 51.978 47.4763 53.1215 58.9433 59.1883
Norwegian Krone 9.2141 9.642 9.7161 10.2888 11.6417 13.4831 12.4113 12.7207 14.0698 13.1693
Omani Riyal 155.3535 156.1514 157.2718 156.7477 162.4578 177.0978 204.2093 211.2283 217.8885 221.6841
Qatari Riyal 16.4395 16.5016 16.644 16.6032 17.1844 18.7219 21.5751 22.3278 23.0391 23.4697
Saudi Arabian Riyal 15.9608 16.0442 16.1656 16.1168 16.6973 18.1849 20.9341 21.6661 22.3482 22.7624
Singaporean Dollar 36.4149 37.8714 39.1651 39.4852 43.6846 50.0886 53.5502 56.0991 59.6004 60.9676
Swedish Krona 7.7867 8.2853 8.6143 8.8641 9.889 11.4255 10.4330 10.6361 11.5692 10.9922
Swiss Franc 46.8551 48.7824 49.2385 49.4739 56.6736 66.9519 70.0527 75.2273 78.9663 78.8759
UAE Dirham 16.2972 16.3853 16.5107 16.4663 17.0391 18.5661 21.3856 22.1224 22.8216 23.2502
UK Pound Sterling 106.4344 110.2853 117.1852 121.348 125.2948 135.8547 126.0915 135.1106 132.4866 128.4593
US Dollar 59.8566 60.1765 60.6342 60.4381 62.5465 68.1684 78.4983 81.2551 83.8017 85.3343
EMU Euro 72.8661 76.4654 79.1763 81.8061 92.17 107.5847 107.4326 114.6507 116.4991 104.1677
SDR 86.9594 89.152 90.7726 91.7263 98.6265 111.545 119.9599 126.3350 129.7431 126.3920
Appreciation / Depreciation ( %)
Australian Dollar -0.09 2.28 -6.52 -15.34 -17.87 -27.69 -3.73 -0.48 -26.88 -10.22
Bahraini Dinar -0.84 -0.85 -1.28 -0.38 -3.26 -12.83 -25.56 -19.27 -6.71 -4.96
Canadian Dollar -8.29 -11.74 -4.04 -4.74 -15.67 -18.94 -9.06 -4.19 -17.59 -15.13
Chinese Yuan -3.47 -4.27 -4.54 -5.66 -11.1 -25.21 -33.44 -19.74 -6.88 -5.72
Danish Krone 3.77 -5.95 -8.76 -7.51 -16.42 -30.67 -16.67 -7.01 -8.57 9.18
Hong Kong Dollar -1.25 -0.89 -0.84 0.16 -3.22 -13.10 -26.13 -20.05 -6.74 -4.49
Japanese Yen 6.16 3.32 1.80 6.24 -11.5 -30.8 -40.29 -32.00 -14.38 -13.66
Kuwaiti Dinar -1.45 -1.69 -2.18 -0.91 -8.81 -22.81 -23.21 -9.88 -3.69 -3.76
Malaysian Ringgit -2.73 -4.17 -6.31 -7.04 -10.77 -19.2 -18.13 -10.59 -11.08 -13.79
New Zealand Dollar 3.17 13.28 -4.02 -27.96 -15.58 -11.27 1.32 -2.20 -24.15 -11.42
Norwegian Krone -0.33 -5.90 -5.45 -6.71 -19.82 -31.05 -6.61 5.65 -13.36 -3.53
Omani Riyal -0.81 -0.78 -1.23 -0.38 -3.30 -12.98 -25.70 -19.27 -6.70 -4.95
Qatari Riyal -0.84 -0.67 -1.24 -0.62 -3.25 -12.76 -25.55 -19.26 -6.79 -5.11
Saudi Arabian Riyal -1.00 -0.82 -1.28 -0.45 -3.29 -12.83 -25.37 -19.14 -6.75 -5.06
Singaporean Dollar -2.06 -6.76 -7.55 -4.26 -11.54 -26.85 -22.58 -12.00 -11.30 -8.68
Swedish Krona 6.13 -8.24 -10.63 -6.99 -14.8 -28.9 -5.50 6.91 -10.89 -3.35
Swiss Franc 4.51 -4.53 -5.09 -1.42 -15.1 -35.33 -23.61 -12.36 -12.72 -4.85
UAE Dirham -0.86 -0.89 -1.31 -0.49 -3.2 -12.75 -25.51 -19.15 -6.71 -5.10
UK Pound Sterling 3.5 -2.25 -10.10 -10.03 -6.92 -11.95 -0.64 0.55 -5.07 4.92
US Dollar -0.84 -0.84 -1.30 -0.43 -3.15 -12.79 -25.50 -19.20 -6.76 -5.02
EMU Euro 3.53 -5.99 -8.66 -6.98 -16.41 -31.51 -16.56 -6.57 -8.44 9.14
SDR 1.81 -2.04 -4.39 -2.89 -8.65 -21.61 -21.63 -13.26 -8.16 -0.05
Note: The Exchange rates are mid points of T.T. buying and selling
except SDR.
Source: Statistics & Data Warehouse Department, SBP
“+” indicates appreciation, “-” indicates depreciation

Balance of Payment and Foreign Trade
97
9.1 Exchange Rates - Authorised Dealers Pak Rupees Per Currency Unit
Currency FY 10
Jul. Aug. Sep. Oct. Nov. Dec. Jan. Feb. Mar. Apr. May Jun.
Average
Australian Dollar 65.87 69.11 71.21 75.42 76.88 75.83 77.11 75.27 76.87 77.71 73.55 72.75
Bahraini Dinar 218.02 219.85 220.01 220.99 221.61 223.06 224.41 225.39 223.84 222.78 223.82 226.32
Canadian Dollar 72.99 76.18 76.50 79.01 78.80 79.57 81.08 80.45 82.32 83.52 81.17 82.17
Chinese Yuan 12.02 12.13 12.14 12.20 12.23 12.31 12.39 12.44 12.36 12.30 12.36 12.51
Danish Krone 15.52 15.86 16.18 16.57 16.73 16.51 16.22 15.61 15.40 15.17 14.26 14.02
Hong Kong Dollar 10.60 10.69 10.70 10.75 10.78 10.84 10.90 10.94 10.87 10.82 10.84 10.96
Japanese Yen 0.87 0.87 0.91 0.92 0.93 0.94 0.93 0.94 0.93 0.90 0.92 0.94
Kuwaiti Dinar 285.96 288.75 289.28 291.20 292.57 294.36 295.13 294.71 292.53 291.22 291.01 293.22
Malaysian Ringgit 23.13 23.55 23.70 24.45 24.64 24.64 25.04 24.87 25.38 26.19 25.95 26.11
New Zealand Dollar 52.80 55.91 58.17 61.43 61.09 60.23 61.45 59.25 59.32 59.73 58.97 58.97
Norwegian Krone 12.90 13.63 14.00 14.74 14.81 14.60 14.74 14.35 14.25 14.19 13.45 13.18
Omani Riyal 213.51 215.26 215.43 216.40 217.00 218.42 219.82 220.70 219.18 218.15 219.17 221.61
Qatari Riyal 22.55 22.76 22.77 22.88 22.94 23.09 23.24 23.34 23.19 23.08 23.18 23.45
Saudi Arabian Riyal 21.87 22.08 22.09 22.20 22.26 22.40 22.53 22.64 22.50 22.39 22.49 22.74
Singaporean Dollar 56.56 57.44 58.17 59.55 60.10 60.20 60.52 60.12 60.27 60.71 60.56 61.01
Swedish Krona 10.65 11.56 11.81 11.97 12.08 11.82 11.85 11.69 11.80 11.69 10.99 10.91
Swiss Franc 76.02 77.50 79.51 81.44 82.40 81.69 81.78 79.20 79.05 78.72 74.70 75.59
UAE Dirham 22.32 22.52 22.55 22.66 22.72 22.87 23.02 23.13 22.98 22.87 22.98 23.24
UK Pound Sterling 134.06 136.87 135.15 134.57 138.58 136.44 136.51 132.73 126.93 128.59 123.69 125.70
US Dollar 82.01 82.77 82.85 83.22 83.45 84.00 84.52 84.90 84.35 83.94 84.33 85.28
EMU Euro 115.36 117.93 120.29 123.20 124.35 122.68 120.60 116.11 114.52 112.78 106.02 104.15
SDR 127.6205 129.3225 130.9010 132.4204 133.6614 133.164 132.462 130.7219 129.0145 127.4146 124.8691 125.3455
End Month
Australian Dollar 68.8230 69.6989 73.0665 75.1491 77.0828 75.4182 74.9068 75.6066 76.9502 78.0541 72.1162 72.6494
Bahraini Dinar 220.8753 220.3433 220.6351 221.9054 221.5649 223.4085 225.0820 225.6323 223.3377 222.6820 225.8150 226.4173
Canadian Dollar 76.9351 75.8805 76.9053 77.1341 79.5727 80.0480 79.2980 80.3079 82.5714 83.6588 81.1218 81.0366
Chinese Yuan 12.1772 12.1543 12.1820 12.2532 12.2342 12.3386 12.4240 12.4576 12.3358 12.3037 12.4607 12.5820
Danish Krone 15.7710 15.9457 16.3327 16.5592 16.9594 16.2610 15.7911 15.5077 15.1536 14.9511 14.0875 14.0034
Hong Kong Dollar 10.7322 10.7154 10.7273 10.7915 10.7795 10.8625 10.9311 10.9876 10.8405 10.8155 10.9261 10.9699
Japanese Yen 0.8722 0.8954 0.9268 0.9276 0.9612 0.9119 0.9405 0.9520 0.9009 0.8934 0.9307 0.9640
Kuwaiti Dinar 289.4426 289.5596 290.2506 292.8421 292.9308 293.6445 295.6406 294.6517 290.7153 290.7863 293.5313 293.7918
Malaysian Ringgit 23.5936 23.5726 23.8992 24.4982 24.7263 24.5765 24.8489 24.9829 25.7118 26.3377 26.1059 26.2667
New Zealand Dollar 54.5229 56.7019 59.9567 60.0566 60.4857 61.1544 59.4696 58.9918 59.7368 60.9236 58.1473 59.1883
Norwegian Krone 13.4177 13.7633 14.2718 14.5959 14.9709 14.5702 14.3160 14.3409 14.0428 14.1943 13.1555 13.1693
Omani Riyal 216.3982 215.6973 216.0362 217.2575 216.9438 218.7748 220.4610 220.9351 218.7041 218.0519 221.1154 221.6841
Qatari Riyal 22.8507 22.7987 22.8437 22.9735 22.9362 23.1252 23.3207 23.3632 23.1227 23.0646 23.3758 23.4697
Saudi Arabian Riyal 22.1590 22.1227 22.1566 22.2915 22.2587 22.4274 22.6005 22.6602 22.4308 22.3919 22.6893 22.7624
Singaporean Dollar 57.6711 57.5769 58.7748 59.7810 60.4772 59.9750 60.3310 60.3354 60.0194 61.3500 60.7016 60.9676
Swedish Krone 11.2571 11.6436 11.8999 11.7843 12.1785 11.7966 11.5086 11.8733 11.5890 11.5992 10.9069 10.9922
Swiss Franc 76.6218 78.3262 80.4182 81.4615 83.9157 81.3282 79.9983 78.8456 78.7654 77.5930 73.6615 78.8759
UAE Dirham 22.6059 22.5756 22.6153 22.7515 22.7193 22.9098 23.0836 23.1499 22.9106 22.8664 23.1700 23.2502
UK Pound Sterling 137.1471 134.7176 133.0534 137.3175 139.2247 135.1269 135.5336 129.7496 126.6960 128.7076 122.9918 128.4593
US Dollar 83.0582 82.9601 83.0951 83.5793 83.4471 84.1449 84.7482 84.9749 84.0846 83.9501 85.0390 85.3343
EMU Euro 117.2644 118.5607 121.4783 122.9375 125.9434 120.8538 117.4482 115.3829 112.6335 111.1518 104.6485 104.1677
SDR 129.3030 130.1450 131.7830 132.9970 134.5480 132.0990 131.6930 130.3160 127.8050 126.6590 125.4140 126.3920
Note: The Exchange rates are mid points of T.T. buying and selling except
SDR. Source: Statistics & Data Warehouse Department, SBP
SBP Annual Report-Statistical Supplement FY 10
98
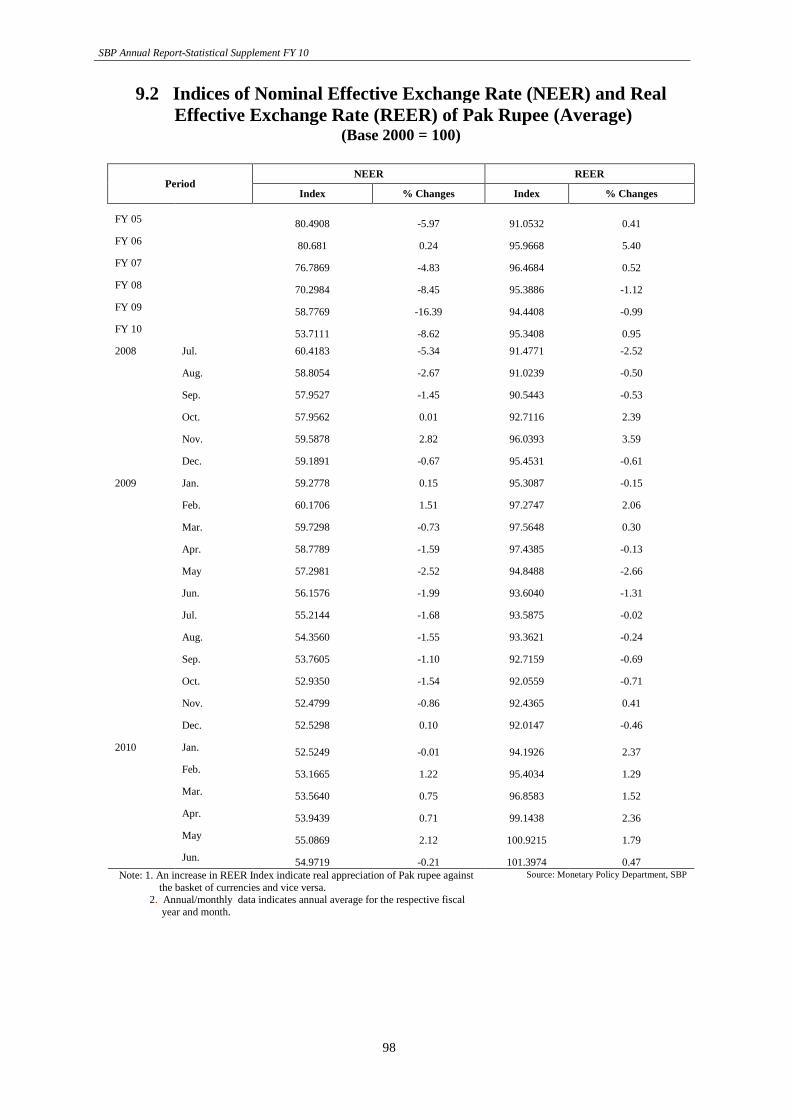
9.2 Indices of Nominal Effective Exchange Rate (NEER) and Real
Effective Exchange Rate (REER) of Pak Rupee (Average) (Base 2000 = 100)
Period NEER REER
Index % Changes Index % Changes
FY 05 80.4908 -5.97 91.0532 0.41
FY 06 80.681 0.24 95.9668 5.40
FY 07 76.7869 -4.83 96.4684 0.52
FY 08 70.2984 -8.45 95.3886 -1.12
FY 09 58.7769 -16.39 94.4408 -0.99
FY 10 53.7111 -8.62 95.3408 0.95
2008 Jul. 60.4183 -5.34 91.4771 -2.52
Aug. 58.8054 -2.67 91.0239 -0.50
Sep. 57.9527 -1.45 90.5443 -0.53
Oct. 57.9562 0.01 92.7116 2.39
Nov. 59.5878 2.82 96.0393 3.59
Dec. 59.1891 -0.67 95.4531 -0.61
2009 Jan. 59.2778 0.15 95.3087 -0.15
Feb. 60.1706 1.51 97.2747 2.06
Mar. 59.7298 -0.73 97.5648 0.30
Apr. 58.7789 -1.59 97.4385 -0.13
May 57.2981 -2.52 94.8488 -2.66
Jun. 56.1576 -1.99 93.6040 -1.31
Jul. 55.2144 -1.68 93.5875 -0.02
Aug. 54.3560 -1.55 93.3621 -0.24
Sep. 53.7605 -1.10 92.7159 -0.69
Oct. 52.9350 -1.54 92.0559 -0.71
Nov. 52.4799 -0.86 92.4365 0.41
Dec. 52.5298 0.10 92.0147 -0.46
2010 Jan. 52.5249 -0.01 94.1926 2.37
Feb. 53.1665 1.22 95.4034 1.29
Mar. 53.5640 0.75 96.8583 1.52
Apr. 53.9439 0.71 99.1438 2.36
May 55.0869 2.12 100.9215 1.79
Jun. 54.9719 -0.21 101.3974 0.47
Note: 1. An increase in REER Index indicate real appreciation of Pak rupee against
the basket of currencies and vice versa. 2. Annual/monthly data indicates annual average for the respective fiscal
year and month.
Source: Monetary Policy Department, SBP
Balance of Payment and Foreign Trade
99
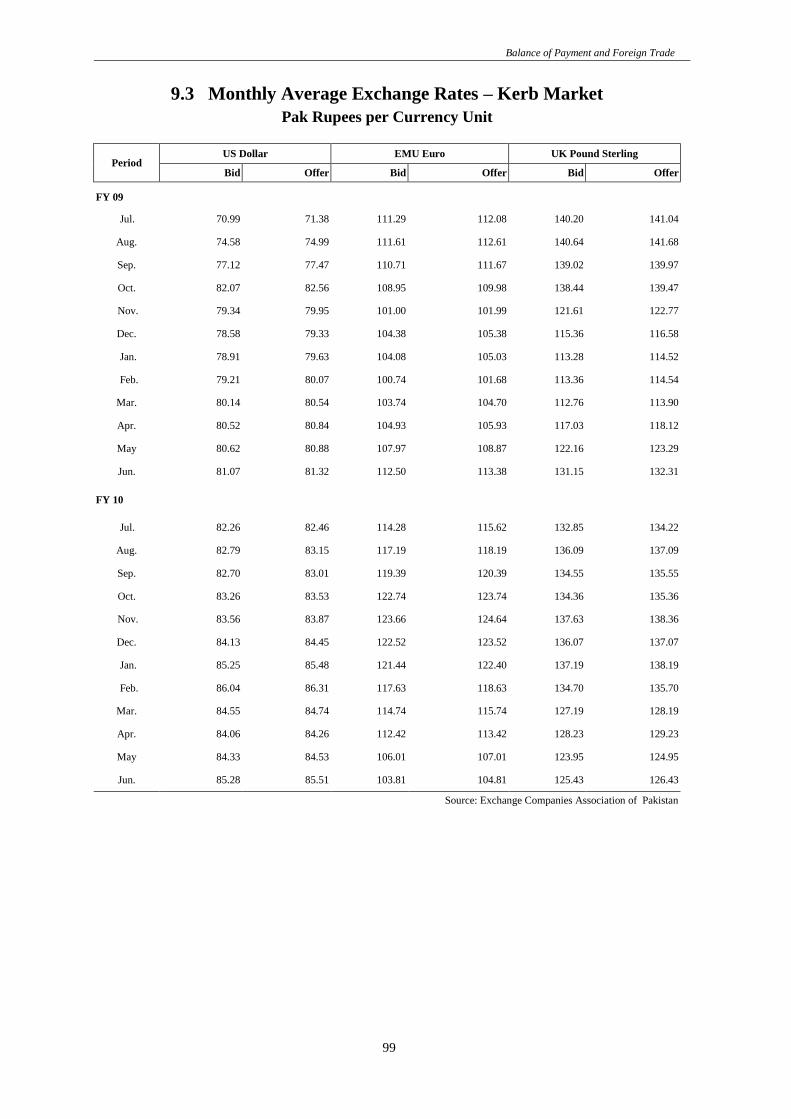
9.3 Monthly Average Exchange Rates – Kerb Market
Pak Rupees per Currency Unit
Period US Dollar EMU Euro UK Pound Sterling
Bid Offer Bid Offer Bid Offer
FY 09
Jul. 70.99 71.38 111.29 112.08 140.20 141.04
Aug. 74.58 74.99 111.61 112.61 140.64 141.68
Sep. 77.12 77.47 110.71 111.67 139.02 139.97
Oct. 82.07 82.56 108.95 109.98 138.44 139.47
Nov. 79.34 79.95 101.00 101.99 121.61 122.77
Dec. 78.58 79.33 104.38 105.38 115.36 116.58
Jan. 78.91 79.63 104.08 105.03 113.28 114.52
Feb. 79.21 80.07 100.74 101.68 113.36 114.54
Mar. 80.14 80.54 103.74 104.70 112.76 113.90
Apr. 80.52 80.84 104.93 105.93 117.03 118.12
May 80.62 80.88 107.97 108.87 122.16 123.29
Jun. 81.07 81.32 112.50 113.38 131.15 132.31
FY 10
Jul. 82.26 82.46 114.28 115.62 132.85 134.22
Aug. 82.79 83.15 117.19 118.19 136.09 137.09
Sep. 82.70 83.01 119.39 120.39 134.55 135.55
Oct. 83.26 83.53 122.74 123.74 134.36 135.36
Nov. 83.56 83.87 123.66 124.64 137.63 138.36
Dec. 84.13 84.45 122.52 123.52 136.07 137.07
Jan. 85.25 85.48 121.44 122.40 137.19 138.19
Feb. 86.04 86.31 117.63 118.63 134.70 135.70
Mar. 84.55 84.74 114.74 115.74 127.19 128.19
Apr. 84.06 84.26 112.42 113.42 128.23 129.23
May 84.33 84.53 106.01 107.01 123.95 124.95
Jun. 85.28 85.51 103.81 104.81 125.43 126.43
Source: Exchange Companies Association of Pakistan
SBP Annual Report-Statistical Supplement FY 10
100
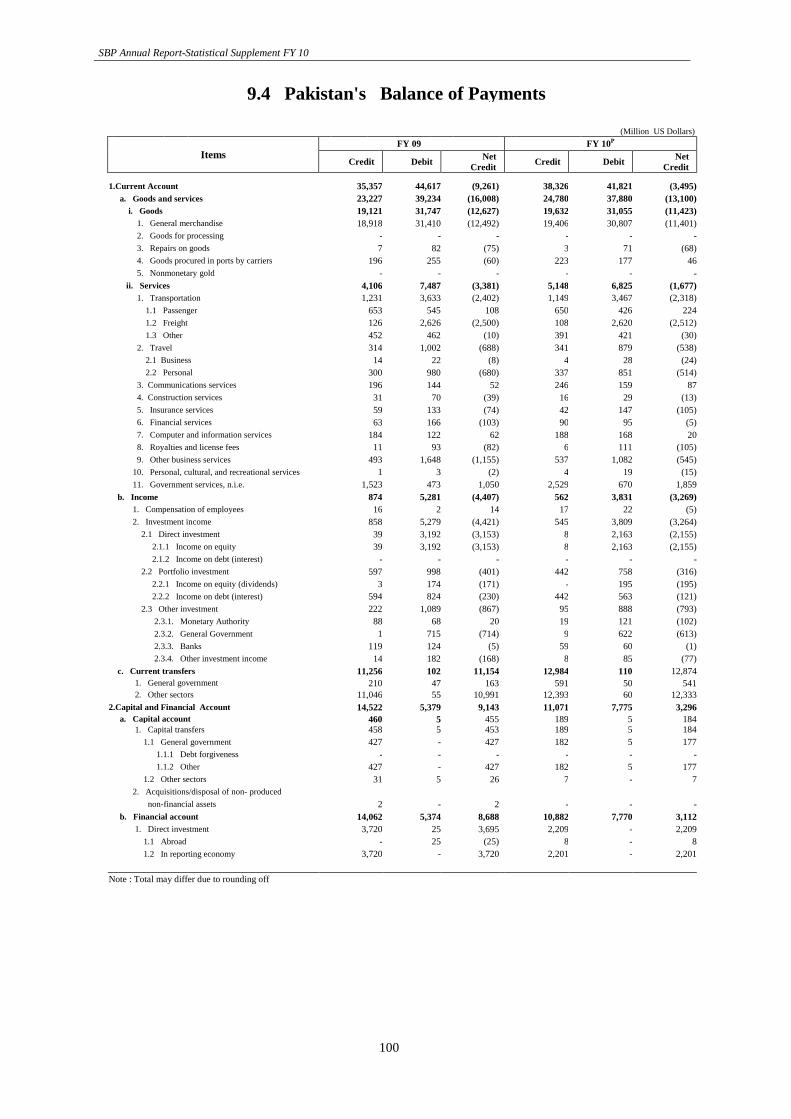
9.4 Pakistan's Balance of Payments
(Million US Dollars)
Items FY 09 FY 10P
Credit Debit Net
Credit Credit Debit
Net
Credit
1.Current Account 35,357 44,617 (9,261) 38,326 41,821 (3,495)
a. Goods and services 23,227 39,234 (16,008) 24,780 37,880 (13,100)
i. Goods 19,121 31,747 (12,627) 19,632 31,055 (11,423)
1. General merchandise 18,918 31,410 (12,492) 19,406 30,807 (11,401)
2. Goods for processing - - - - - -
3. Repairs on goods 7 82 (75) 3 71 (68)
4. Goods procured in ports by carriers 196 255 (60) 223 177 46
5. Nonmonetary gold - - - - - -
ii. Services 4,106 7,487 (3,381) 5,148 6,825 (1,677)
1. Transportation 1,231 3,633 (2,402) 1,149 3,467 (2,318)
1.1 Passenger 653 545 108 650 426 224
1.2 Freight 126 2,626 (2,500) 108 2,620 (2,512)
1.3 Other 452 462 (10) 391 421 (30)
2. Travel 314 1,002 (688) 341 879 (538)
2.1 Business 14 22 (8) 4 28 (24)
2.2 Personal 300 980 (680) 337 851 (514)
3. Communications services 196 144 52 246 159 87
4. Construction services 31 70 (39) 16 29 (13)
5. Insurance services 59 133 (74) 42 147 (105)
6. Financial services 63 166 (103) 90 95 (5)
7. Computer and information services 184 122 62 188 168 20
8. Royalties and license fees 11 93 (82) 6 111 (105)
9. Other business services 493 1,648 (1,155) 537 1,082 (545)
10. Personal, cultural, and recreational services 1 3 (2) 4 19 (15)
11. Government services, n.i.e. 1,523 473 1,050 2,529 670 1,859
b. Income 874 5,281 (4,407) 562 3,831 (3,269)
1. Compensation of employees 16 2 14 17 22 (5)
2. Investment income 858 5,279 (4,421) 545 3,809 (3,264)
2.1 Direct investment 39 3,192 (3,153) 8 2,163 (2,155)
2.1.1 Income on equity 39 3,192 (3,153) 8 2,163 (2,155)
2.1.2 Income on debt (interest) - - - - - -
2.2 Portfolio investment 597 998 (401) 442 758 (316)
2.2.1 Income on equity (dividends) 3 174 (171) - 195 (195)
2.2.2 Income on debt (interest) 594 824 (230) 442 563 (121)
2.3 Other investment 222 1,089 (867) 95 888 (793)
2.3.1. Monetary Authority 88 68 20 19 121 (102)
2.3.2. General Government 1 715 (714) 9 622 (613)
2.3.3. Banks 119 124 (5) 59 60 (1)
2.3.4. Other investment income 14 182 (168) 8 85 (77)
c. Current transfers 11,256 102 11,154 12,984 110 12,874
1. General government 210 47 163 591 50 541
2. Other sectors 11,046 55 10,991 12,393 60 12,333
2.Capital and Financial Account 14,522 5,379 9,143 11,071 7,775 3,296
a. Capital account 460 5 455 189 5 184 1. Capital transfers 458 5 453 189 5 184
1.1 General government 427 - 427 182 5 177
1.1.1 Debt forgiveness - - - - - -
1.1.2 Other 427 - 427 182 5 177
1.2 Other sectors 31 5 26 7 - 7
2. Acquisitions/disposal of non- produced
non-financial assets 2 - 2 - - -
b. Financial account 14,062 5,374 8,688 10,882 7,770 3,112
1. Direct investment 3,720 25 3,695 2,209 - 2,209
1.1 Abroad - 25 (25) 8 - 8
1.2 In reporting economy 3,720 - 3,720 2,201 - 2,201
Note : Total may differ due to rounding off
Balance of Payment and Foreign Trade
101
9.4 Pakistan's Balance of Payments
( Million US Dollars)
Items FY 09 FY 10P
Credit Debit Net
Credit Credit Debit
Net
Credit
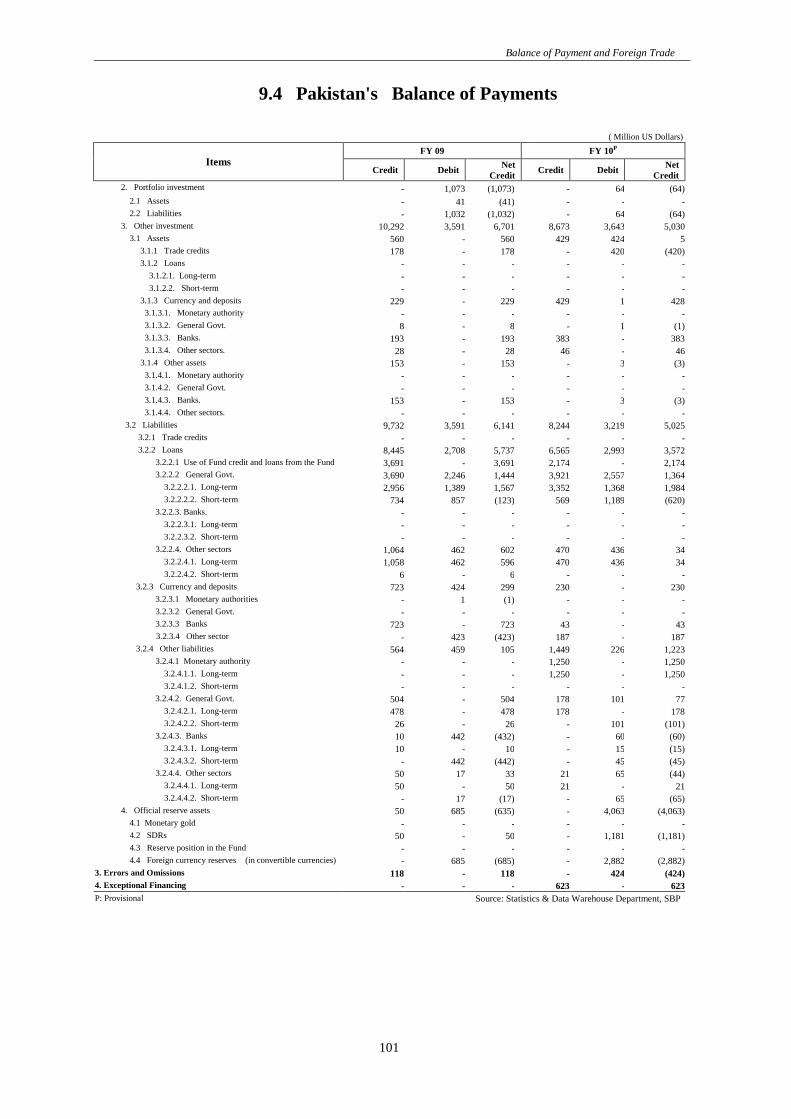
2. Portfolio investment - 1,073 (1,073) - 64 (64)
2.1 Assets - 41 (41) - - -
2.2 Liabilities - 1,032 (1,032) - 64 (64)
3. Other investment 10,292 3,591 6,701 8,673 3,643 5,030
3.1 Assets 560 - 560 429 424 5
3.1.1 Trade credits 178 - 178 - 420 (420)
3.1.2 Loans - - - - - -
3.1.2.1. Long-term - - - - - -
3.1.2.2. Short-term - - - - - -
3.1.3 Currency and deposits 229 - 229 429 1 428
3.1.3.1. Monetary authority - - - - - -
3.1.3.2. General Govt. 8 - 8 - 1 (1)
3.1.3.3. Banks. 193 - 193 383 - 383
3.1.3.4. Other sectors. 28 - 28 46 - 46
3.1.4 Other assets 153 - 153 - 3 (3)
3.1.4.1. Monetary authority - - - - - -
3.1.4.2. General Govt. - - - - - -
3.1.4.3. Banks. 153 - 153 - 3 (3)
3.1.4.4. Other sectors. - - - - - -
3.2 Liabilities 9,732 3,591 6,141 8,244 3,219 5,025
3.2.1 Trade credits - - - - - -
3.2.2 Loans 8,445 2,708 5,737 6,565 2,993 3,572
3.2.2.1 Use of Fund credit and loans from the Fund 3,691 - 3,691 2,174 - 2,174
3.2.2.2 General Govt. 3,690 2,246 1,444 3,921 2,557 1,364
3.2.2.2.1. Long-term 2,956 1,389 1,567 3,352 1,368 1,984
3.2.2.2.2. Short-term 734 857 (123) 569 1,189 (620)
3.2.2.3. Banks. - - - - - -
3.2.2.3.1. Long-term - - - - - -
3.2.2.3.2. Short-term - - - - - -
3.2.2.4. Other sectors 1,064 462 602 470 436 34
3.2.2.4.1. Long-term 1,058 462 596 470 436 34
3.2.2.4.2. Short-term 6 - 6 - - -
3.2.3 Currency and deposits 723 424 299 230 - 230
3.2.3.1 Monetary authorities - 1 (1) - - -
3.2.3.2 General Govt. - - - - - -
3.2.3.3 Banks 723 - 723 43 - 43
3.2.3.4 Other sector - 423 (423) 187 - 187
3.2.4 Other liabilities 564 459 105 1,449 226 1,223
3.2.4.1 Monetary authority - - - 1,250 - 1,250
3.2.4.1.1. Long-term - - - 1,250 - 1,250
3.2.4.1.2. Short-term - - - - - -
3.2.4.2. General Govt. 504 - 504 178 101 77
3.2.4.2.1. Long-term 478 - 478 178 - 178
3.2.4.2.2. Short-term 26 - 26 - 101 (101)
3.2.4.3. Banks 10 442 (432) - 60 (60)
3.2.4.3.1. Long-term 10 - 10 - 15 (15)
3.2.4.3.2. Short-term - 442 (442) - 45 (45)
3.2.4.4. Other sectors 50 17 33 21 65 (44)
3.2.4.4.1. Long-term 50 - 50 21 - 21
3.2.4.4.2. Short-term - 17 (17) - 65 (65)
4. Official reserve assets 50 685 (635) - 4,063 (4,063)
4.1 Monetary gold - - - - - -
4.2 SDRs 50 - 50 - 1,181 (1,181)
4.3 Reserve position in the Fund - - - - - -
4.4 Foreign currency reserves (in convertible currencies) - 685 (685) - 2,882 (2,882)
3. Errors and Omissions 118 - 118 - 424 (424)
4. Exceptional Financing - - - 623 - 623
P: Provisional
Source: Statistics & Data Warehouse Department, SBP
SBP Annual Report-Statistical Supplement FY 10
102
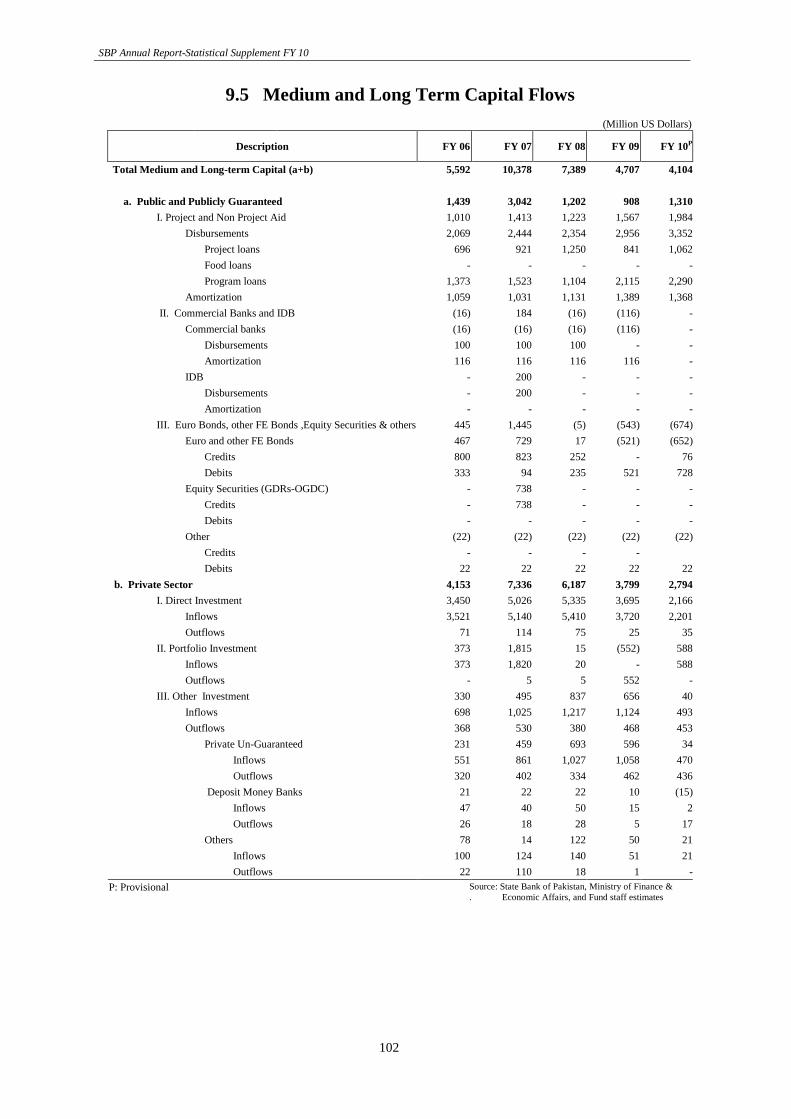
9.5 Medium and Long Term Capital Flows
d Long Term Capital Flows (Million US Dollars)
Description FY 06 FY 07 FY 08 FY 09 FY 10P
Total Medium and Long-term Capital (a+b) 5,592 10,378 7,389 4,707 4,104
a. Public and Publicly Guaranteed 1,439 3,042 1,202 908 1,310
I. Project and Non Project Aid 1,010 1,413 1,223 1,567 1,984
Disbursements 2,069 2,444 2,354 2,956 3,352
Project loans 696 921 1,250 841 1,062
Food loans - - - - -
Program loans 1,373 1,523 1,104 2,115 2,290
Amortization 1,059 1,031 1,131 1,389 1,368
II. Commercial Banks and IDB (16) 184 (16) (116) -
Commercial banks (16) (16) (16) (116) -
Disbursements 100 100 100 - -
Amortization 116 116 116 116 -
IDB - 200 - - -
Disbursements - 200 - - -
Amortization - - - - -
III. Euro Bonds, other FE Bonds ,Equity Securities & others 445 1,445 (5) (543) (674)
Euro and other FE Bonds 467 729 17 (521) (652)
Credits 800 823 252 - 76
Debits 333 94 235 521 728
Equity Securities (GDRs-OGDC) - 738 - - -
Credits - 738 - - -
Debits - - - - -
Other (22) (22) (22) (22) (22)
Credits - - - -
Debits 22 22 22 22 22
b. Private Sector 4,153 7,336 6,187 3,799 2,794
I. Direct Investment 3,450 5,026 5,335 3,695 2,166
Inflows 3,521 5,140 5,410 3,720 2,201
Outflows 71 114 75 25 35
II. Portfolio Investment 373 1,815 15 (552) 588
Inflows 373 1,820 20 - 588
Outflows - 5 5 552 -
III. Other Investment 330 495 837 656 40
Inflows 698 1,025 1,217 1,124 493
Outflows 368 530 380 468 453
Private Un-Guaranteed 231 459 693 596 34
Inflows 551 861 1,027 1,058 470
Outflows 320 402 334 462 436
Deposit Money Banks 21 22 22 10 (15)
Inflows 47 40 50 15 2
Outflows 26 18 28 5 17
Others 78 14 122 50 21
Inflows 100 124 140 51 21
Outflows 22 110 18 1 -
P: Provisional
Source: State Bank of Pakistan, Ministry of Finance &
. Economic Affairs, and Fund staff estimates
Balance of Payment and Foreign Trade
103
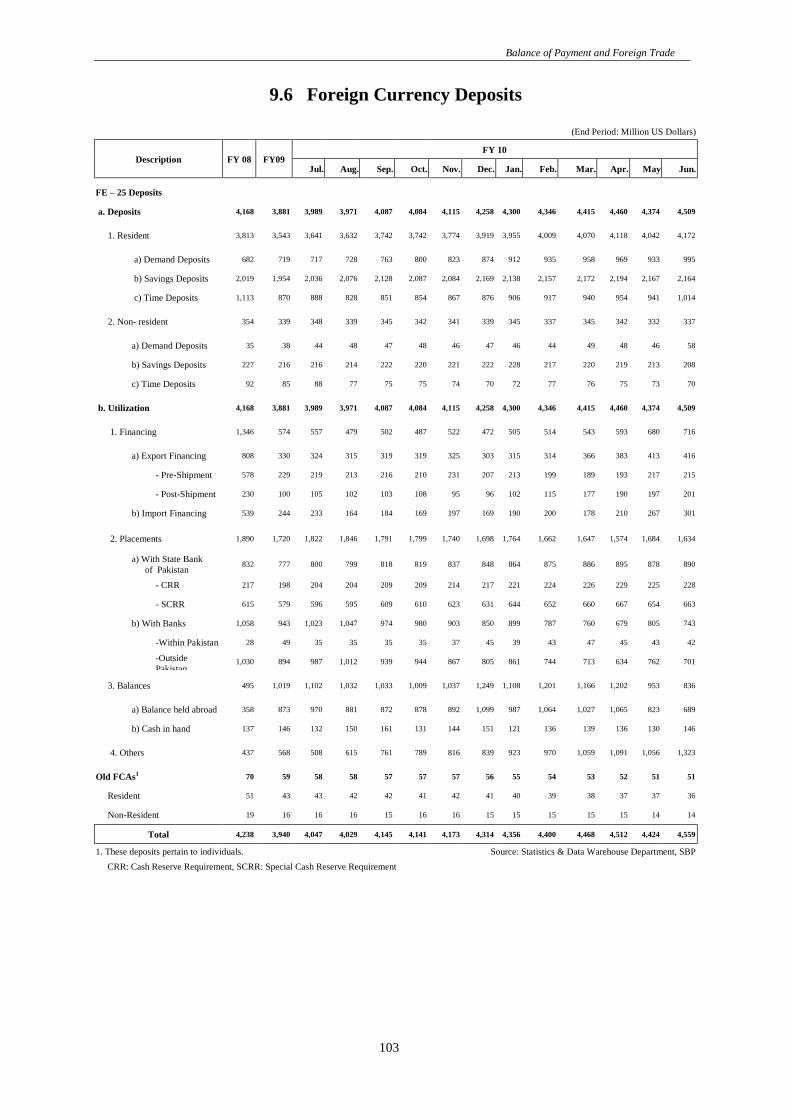
9.6 Foreign Currency Deposits
(End Period: Million US Dollars)
Description FY 08 FY09 FY 10
Jul. Aug. Sep. Oct. Nov. Dec. Jan. Feb. Mar. Apr. May Jun.
FE – 25 Deposits
a. Deposits 4,168 3,881 3,989 3,971 4,087 4,084 4,115 4,258 4,300 4,346 4,415 4,460 4,374 4,509
1. Resident 3,813 3,543 3,641 3,632 3,742 3,742 3,774 3,919 3,955 4,009 4,070 4,118 4,042 4,172
a) Demand Deposits 682 719 717 728 763 800 823 874 912 935 958 969 933 995
b) Savings Deposits 2,019 1,954 2,036 2,076 2,128 2,087 2,084 2,169 2,138 2,157 2,172 2,194 2,167 2,164
c) Time Deposits 1,113 870 888 828 851 854 867 876 906 917 940 954 941 1,014
2. Non- resident 354 339 348 339 345 342 341 339 345 337 345 342 332 337
a) Demand Deposits 35 38 44 48 47 48 46 47 46 44 49 48 46 58
b) Savings Deposits 227 216 216 214 222 220 221 222 228 217 220 219 213 208
c) Time Deposits 92 85 88 77 75 75 74 70 72 77 76 75 73 70
b. Utilization 4,168 3,881 3,989 3,971 4,087 4,084 4,115 4,258 4,300 4,346 4,415 4,460 4,374 4,509
1. Financing 1,346 574 557 479 502 487 522 472 505 514 543 593 680 716
a) Export Financing 808 330 324 315 319 319 325 303 315 314 366 383 413 416
- Pre-Shipment 578 229 219 213 216 210 231 207 213 199 189 193 217 215
- Post-Shipment 230 100 105 102 103 108 95 96 102 115 177 190 197 201
b) Import Financing 539 244 233 164 184 169 197 169 190 200 178 210 267 301
2. Placements 1,890 1,720 1,822 1,846 1,791 1,799 1,740 1,698 1,764 1,662 1,647 1,574 1,684 1,634
a) With State Bank
of Pakistan 832 777 800 799 818 819 837 848 864 875 886 895 878 890
- CRR 217 198 204 204 209 209 214 217 221 224 226 229 225 228
- SCRR 615 579 596 595 609 610 623 631 644 652 660 667 654 663
b) With Banks 1,058 943 1,023 1,047 974 980 903 850 899 787 760 679 805 743
-Within Pakistan 28 49 35 35 35 35 37 45 39 43 47 45 43 42
-Outside
Pakistan 1,030 894 987 1,012 939 944 867 805 861 744 713 634 762 701
3. Balances 495 1,019 1,102 1,032 1,033 1,009 1,037 1,249 1,108 1,201 1,166 1,202 953 836
a) Balance held abroad 358 873 970 881 872 878 892 1,099 987 1,064 1,027 1,065 823 689
b) Cash in hand 137 146 132 150 161 131 144 151 121 136 139 136 130 146
4. Others 437 568 508 615 761 789 816 839 923 970 1,059 1,091 1,056 1,323
Old FCAs1 70 59 58 58 57 57 57 56 55 54 53 52 51 51
Resident 51 43 43 42 42 41 42 41 40 39 38 37 37 36
Non-Resident 19 16 16 16 15 16 16 15 15 15 15 15 14 14
Total 4,238 3,940 4,047 4,029 4,145 4,141 4,173 4,314 4,356 4,400 4,468 4,512 4,424 4,559
1. These deposits pertain to individuals. Source: Statistics & Data Warehouse Department, SBP
CRR: Cash Reserve Requirement, SCRR: Special Cash Reserve Requirement
SBP Annual Report-Statistical Supplement FY 10
104
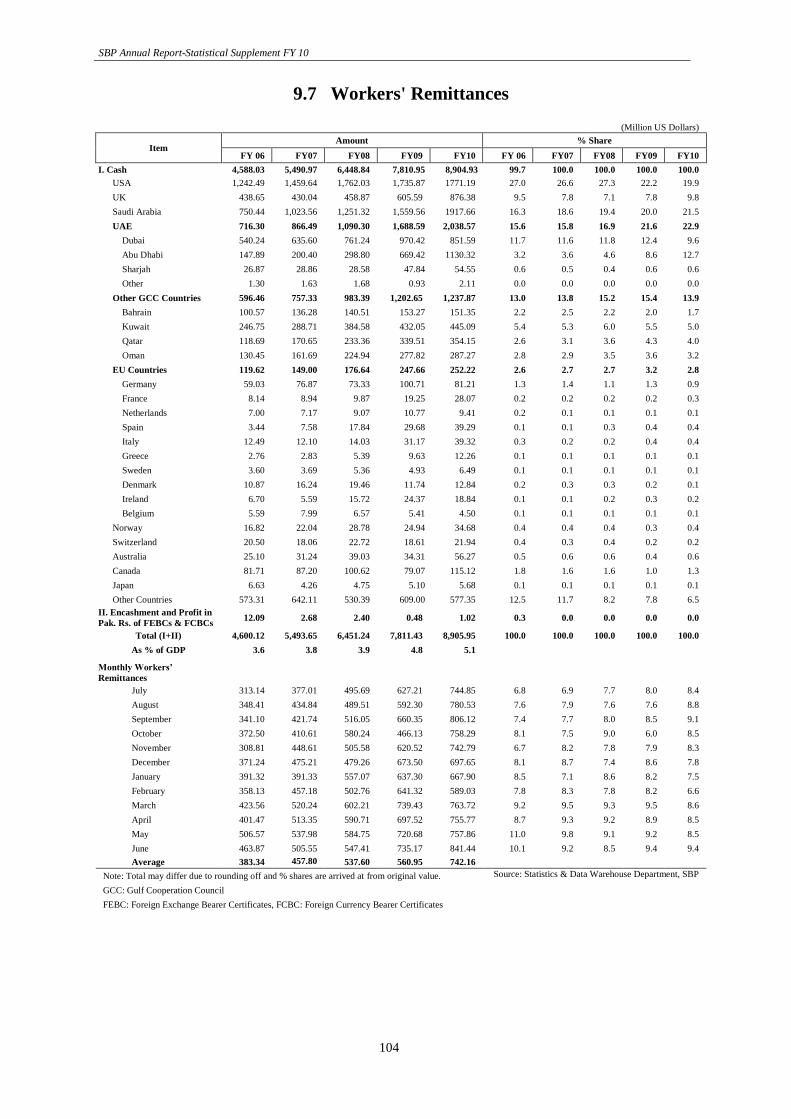
9.7 Workers' Remittances
(Million US Dollars)
Item Amount % Share
FY 06 FY07 FY08 FY09 FY10 FY 06 FY07 FY08 FY09 FY10
I. Cash 4,588.03 5,490.97 6,448.84 7,810.95 8,904.93 99.7 100.0 100.0 100.0 100.0
USA 1,242.49 1,459.64 1,762.03 1,735.87 1771.19 27.0 26.6 27.3 22.2 19.9
UK 438.65 430.04 458.87 605.59 876.38 9.5 7.8 7.1 7.8 9.8
Saudi Arabia 750.44 1,023.56 1,251.32 1,559.56 1917.66 16.3 18.6 19.4 20.0 21.5
UAE 716.30 866.49 1,090.30 1,688.59 2,038.57 15.6 15.8 16.9 21.6 22.9
Dubai 540.24 635.60 761.24 970.42 851.59 11.7 11.6 11.8 12.4 9.6
Abu Dhabi 147.89 200.40 298.80 669.42 1130.32 3.2 3.6 4.6 8.6 12.7
Sharjah 26.87 28.86 28.58 47.84 54.55 0.6 0.5 0.4 0.6 0.6
Other 1.30 1.63 1.68 0.93 2.11 0.0 0.0 0.0 0.0 0.0
Other GCC Countries 596.46 757.33 983.39 1,202.65 1,237.87 13.0 13.8 15.2 15.4 13.9
Bahrain 100.57 136.28 140.51 153.27 151.35 2.2 2.5 2.2 2.0 1.7
Kuwait 246.75 288.71 384.58 432.05 445.09 5.4 5.3 6.0 5.5 5.0
Qatar 118.69 170.65 233.36 339.51 354.15 2.6 3.1 3.6 4.3 4.0
Oman 130.45 161.69 224.94 277.82 287.27 2.8 2.9 3.5 3.6 3.2
EU Countries 119.62 149.00 176.64 247.66 252.22 2.6 2.7 2.7 3.2 2.8
Germany 59.03 76.87 73.33 100.71 81.21 1.3 1.4 1.1 1.3 0.9
France 8.14 8.94 9.87 19.25 28.07 0.2 0.2 0.2 0.2 0.3
Netherlands 7.00 7.17 9.07 10.77 9.41 0.2 0.1 0.1 0.1 0.1
Spain 3.44 7.58 17.84 29.68 39.29 0.1 0.1 0.3 0.4 0.4
Italy 12.49 12.10 14.03 31.17 39.32 0.3 0.2 0.2 0.4 0.4
Greece 2.76 2.83 5.39 9.63 12.26 0.1 0.1 0.1 0.1 0.1
Sweden 3.60 3.69 5.36 4.93 6.49 0.1 0.1 0.1 0.1 0.1
Denmark 10.87 16.24 19.46 11.74 12.84 0.2 0.3 0.3 0.2 0.1
Ireland 6.70 5.59 15.72 24.37 18.84 0.1 0.1 0.2 0.3 0.2
Belgium 5.59 7.99 6.57 5.41 4.50 0.1 0.1 0.1 0.1 0.1
Norway 16.82 22.04 28.78 24.94 34.68 0.4 0.4 0.4 0.3 0.4
Switzerland 20.50 18.06 22.72 18.61 21.94 0.4 0.3 0.4 0.2 0.2
Australia 25.10 31.24 39.03 34.31 56.27 0.5 0.6 0.6 0.4 0.6
Canada 81.71 87.20 100.62 79.07 115.12 1.8 1.6 1.6 1.0 1.3
Japan 6.63 4.26 4.75 5.10 5.68 0.1 0.1 0.1 0.1 0.1
Other Countries 573.31 642.11 530.39 609.00 577.35 12.5 11.7 8.2 7.8 6.5
II. Encashment and Profit in
Pak. Rs. of FEBCs & FCBCs 12.09 2.68 2.40 0.48 1.02 0.3 0.0 0.0 0.0 0.0
Total (I+II) 4,600.12 5,493.65 6,451.24 7,811.43 8,905.95 100.0 100.0 100.0 100.0 100.0
As % of GDP 3.6 3.8 3.9 4.8 5.1
Monthly Workers’
Remittances
July 313.14 377.01 495.69 627.21 744.85 6.8 6.9 7.7 8.0 8.4
August 348.41 434.84 489.51 592.30 780.53 7.6 7.9 7.6 7.6 8.8
September 341.10 421.74 516.05 660.35 806.12 7.4 7.7 8.0 8.5 9.1
October 372.50 410.61 580.24 466.13 758.29 8.1 7.5 9.0 6.0 8.5
November 308.81 448.61 505.58 620.52 742.79 6.7 8.2 7.8 7.9 8.3
December 371.24 475.21 479.26 673.50 697.65 8.1 8.7 7.4 8.6 7.8
January 391.32 391.33 557.07 637.30 667.90 8.5 7.1 8.6 8.2 7.5
February 358.13 457.18 502.76 641.32 589.03 7.8 8.3 7.8 8.2 6.6
March 423.56 520.24 602.21 739.43 763.72 9.2 9.5 9.3 9.5 8.6
April 401.47 513.35 590.71 697.52 755.77 8.7 9.3 9.2 8.9 8.5
May 506.57 537.98 584.75 720.68 757.86 11.0 9.8 9.1 9.2 8.5
June 463.87 505.55 547.41 735.17 841.44 10.1 9.2 8.5 9.4 9.4
Average 383.34 457.80
537.60 560.95 742.16
Note: Total may differ due to rounding off and % shares are arrived at from original value. Source: Statistics & Data Warehouse Department, SBP
GCC: Gulf Cooperation Council
FEBC: Foreign Exchange Bearer Certificates, FCBC: Foreign Currency Bearer Certificates
Balance of Payment and Foreign Trade
105
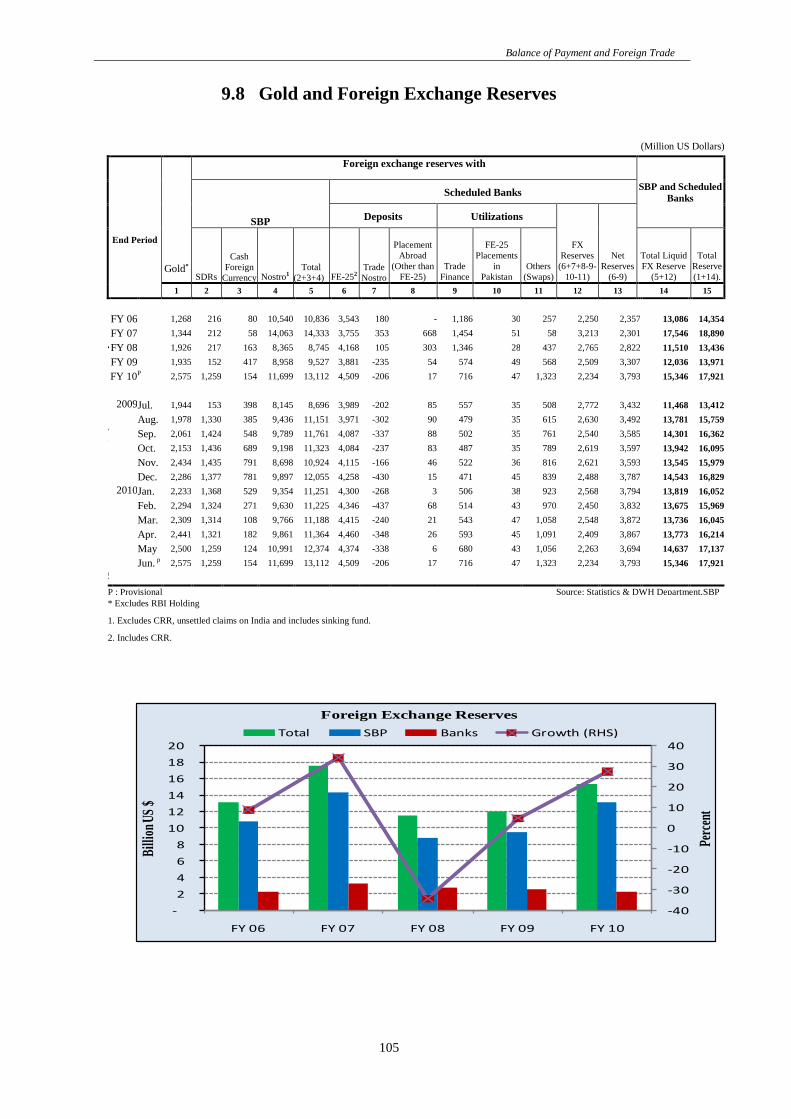
9.8 Gold and Foreign Exchange Reserves
(Million US Dollars)
End Period
End Period
Gold*
Foreign exchange reserves with
SBP
Foreign Exchange Reserves with
SBP and Scheduled
Banks
SBP
Scheduled Banks
Deposits Utilizations
FX
Reserves
(6+7+8-9-
10-11)
Net
Reserves
(6-9) SDRs
Cash
Foreign
Currency Nostro1
Total
(2+3+4) FE-252
Trade
Nostro
Placement
Abroad
(Other than
FE-25)
Trade
Finance
FE-25
Placements
in
Pakistan
Others
(Swaps)
Total Liquid
FX Reserve
(5+12)
Total
Reserve
(1+14).
1 2 3 4 5 6 7 8 9 10 11 12 13 14 15
FY 06 1,268 216 80 10,540 10,836 3,543 180 - 1,186 30 257 2,250 2,357 13,086 14,354
FY 07 1,344 212 58 14,063 14,333 3,755 353 668 1,454 51 58 3,213 2,301 17,546 18,890
4
,
1
2
5
.
9
FY 08 1,926 217 163 8,365 8,745 4,168 105 303 1,346 28 437 2,765 2,822 11,510 13,436
FY 09 1,935 152 417 8,958 9,527 3,881 -235 54 574 49 568 2,509 3,307 12,036 13,971
FY 10P 2,575 1,259 154 11,699 13,112 4,509 -206 17 716 47 1,323 2,234 3,793 15,346 17,921
2009 Jul. 1,944 153 398 8,145 8,696 3,989 -202 85 557 35 508 2,772 3,432 11,468 13,412
Aug. 1,978 1,330 385 9,436 11,151 3,971 -302 90 479 35 615 2,630 3,492 13,781 15,759
7
8
7.
3
Sep. 2,061 1,424 548 9,789 11,761 4,087 -337 88 502 35 761 2,540 3,585 14,301 16,362
Oct. 2,153 1,436 689 9,198 11,323 4,084 -237 83 487 35 789 2,619 3,597 13,942 16,095
Nov. 2,434 1,435 791 8,698 10,924 4,115 -166 46 522 36 816 2,621 3,593 13,545 15,979
Dec. 2,286 1,377 781 9,897 12,055 4,258 -430 15 471 45 839 2,488 3,787 14,543 16,829
2010 Jan. 2,233 1,368 529 9,354 11,251 4,300 -268 3 506 38 923 2,568 3,794 13,819 16,052
Feb. 2,294 1,324 271 9,630 11,225 4,346 -437 68 514 43 970 2,450 3,832 13,675 15,969
Mar. 2,309 1,314 108 9,766 11,188 4,415 -240 21 543 47 1,058 2,548 3,872 13,736 16,045
Apr. 2,441 1,321 182 9,861 11,364 4,460 -348 26 593 45 1,091 2,409 3,867 13,773 16,214
May 2,500 1,259 124 10,991 12,374 4,374 -338 6 680 43 1,056 2,263 3,694 14,637 17,137
Jun. p 2,575 1,259 154 11,699 13,112 4,509 -206 17 716 47 1,323 2,234 3,793 15,346 17,921
5
7
8.
1
P : Provisional Source: Statistics & DWH Department,SBP
SBP * Excludes RBI Holding
1. Excludes CRR, unsettled claims on India and includes sinking fund.
2. Includes CRR.
-40
-30
-20
-10
0
10
20
30
40
-
2
4
6
8
10
12
14
16
18
20
FY 06 FY 07 FY 08 FY 09 FY 10
Perc
ent
Bill
ion
US
$
Foreign Exchange Reserves
Total SBP Banks Growth (RHS)
SBP Annual Report-Statistical Supplement FY 10
106
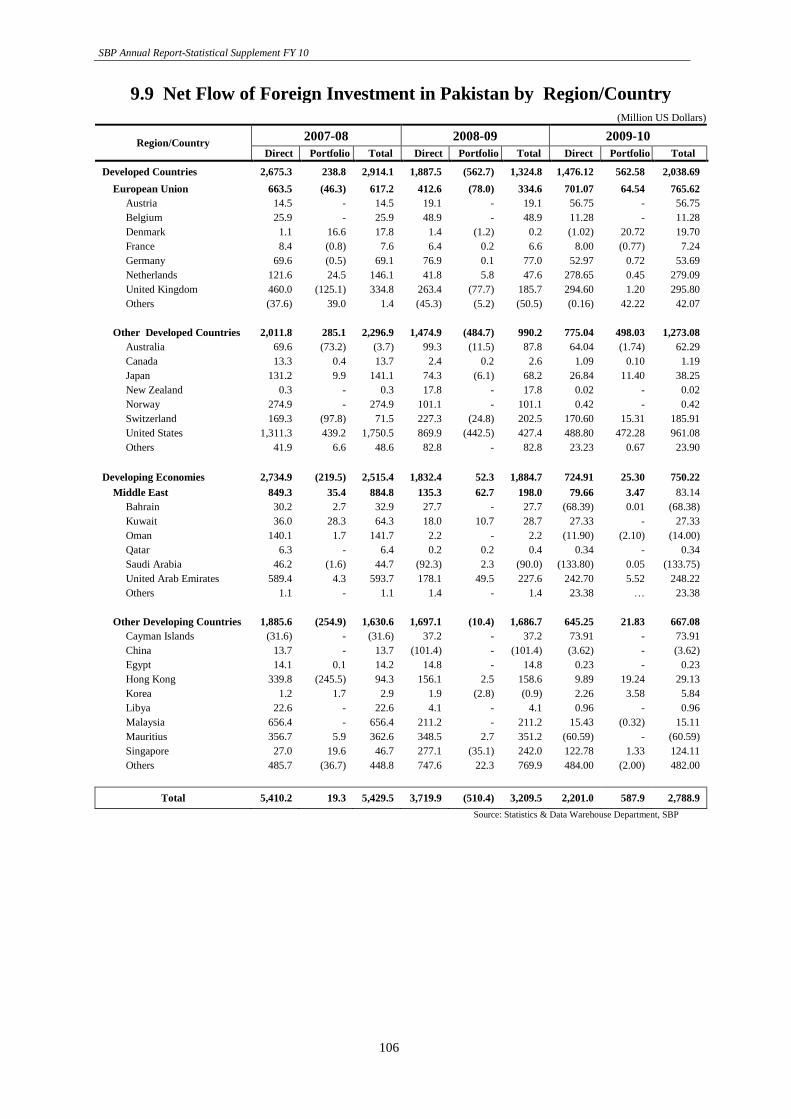
9.9 Net Flow of Foreign Investment in Pakistan by Region/Country
(Million US Dollars)
Region/Country 2007-08 2008-09 2009-10
Direct Portfolio Total Direct Portfolio Total Direct Portfolio Total
Developed Countries 2,675.3 238.8 2,914.1 1,887.5 (562.7) 1,324.8 1,476.12 562.58 2,038.69
European Union 663.5 (46.3) 617.2 412.6 (78.0) 334.6 701.07 64.54 765.62
Austria 14.5 - 14.5 19.1 - 19.1 56.75 - 56.75
Belgium 25.9 - 25.9 48.9 - 48.9 11.28 - 11.28
Denmark 1.1 16.6 17.8 1.4 (1.2) 0.2 (1.02) 20.72 19.70
France 8.4 (0.8) 7.6 6.4 0.2 6.6 8.00 (0.77) 7.24
Germany 69.6 (0.5) 69.1 76.9 0.1 77.0 52.97 0.72 53.69
Netherlands 121.6 24.5 146.1 41.8 5.8 47.6 278.65 0.45 279.09
United Kingdom 460.0 (125.1) 334.8 263.4 (77.7) 185.7 294.60 1.20 295.80
Others (37.6) 39.0 1.4 (45.3) (5.2) (50.5) (0.16) 42.22 42.07
Other Developed Countries 2,011.8 285.1 2,296.9 1,474.9 (484.7) 990.2 775.04 498.03 1,273.08
Australia 69.6 (73.2) (3.7) 99.3 (11.5) 87.8 64.04 (1.74) 62.29
Canada 13.3 0.4 13.7 2.4 0.2 2.6 1.09 0.10 1.19
Japan 131.2 9.9 141.1 74.3 (6.1) 68.2 26.84 11.40 38.25
New Zealand 0.3 - 0.3 17.8 - 17.8 0.02 - 0.02
Norway 274.9 - 274.9 101.1 - 101.1 0.42 - 0.42
Switzerland 169.3 (97.8) 71.5 227.3 (24.8) 202.5 170.60 15.31 185.91
United States 1,311.3 439.2 1,750.5 869.9 (442.5) 427.4 488.80 472.28 961.08
Others 41.9 6.6 48.6 82.8 - 82.8 23.23 0.67 23.90
Developing Economies 2,734.9 (219.5) 2,515.4 1,832.4 52.3 1,884.7 724.91 25.30 750.22
Middle East 849.3 35.4 884.8 135.3 62.7 198.0 79.66 3.47 83.14
Bahrain 30.2 2.7 32.9 27.7 - 27.7 (68.39) 0.01 (68.38)
Kuwait 36.0 28.3 64.3 18.0 10.7 28.7 27.33 - 27.33
Oman 140.1 1.7 141.7 2.2 - 2.2 (11.90) (2.10) (14.00)
Qatar 6.3 - 6.4 0.2 0.2 0.4 0.34 - 0.34
Saudi Arabia 46.2 (1.6) 44.7 (92.3) 2.3 (90.0) (133.80) 0.05 (133.75)
United Arab Emirates 589.4 4.3 593.7 178.1 49.5 227.6 242.70 5.52 248.22
Others 1.1 - 1.1 1.4 - 1.4 23.38 … 23.38
Other Developing Countries 1,885.6 (254.9) 1,630.6 1,697.1 (10.4) 1,686.7 645.25 21.83 667.08
Cayman Islands (31.6) - (31.6) 37.2 - 37.2 73.91 - 73.91
China 13.7 - 13.7 (101.4) - (101.4) (3.62) - (3.62)
Egypt 14.1 0.1 14.2 14.8 - 14.8 0.23 - 0.23
Hong Kong 339.8 (245.5) 94.3 156.1 2.5 158.6 9.89 19.24 29.13
Korea 1.2 1.7 2.9 1.9 (2.8) (0.9) 2.26 3.58 5.84
Libya 22.6 - 22.6 4.1 - 4.1 0.96 - 0.96
Malaysia 656.4 - 656.4 211.2 - 211.2 15.43 (0.32) 15.11
Mauritius 356.7 5.9 362.6 348.5 2.7 351.2 (60.59) - (60.59)
Singapore 27.0 19.6 46.7 277.1 (35.1) 242.0 122.78 1.33 124.11
Others 485.7 (36.7) 448.8 747.6 22.3 769.9 484.00 (2.00) 482.00
Total 5,410.2 19.3 5,429.5 3,719.9 (510.4) 3,209.5 2,201.0 587.9 2,788.9
Source: Statistics & Data Warehouse Department, SBP
Balance of Payment and Foreign Trade
107
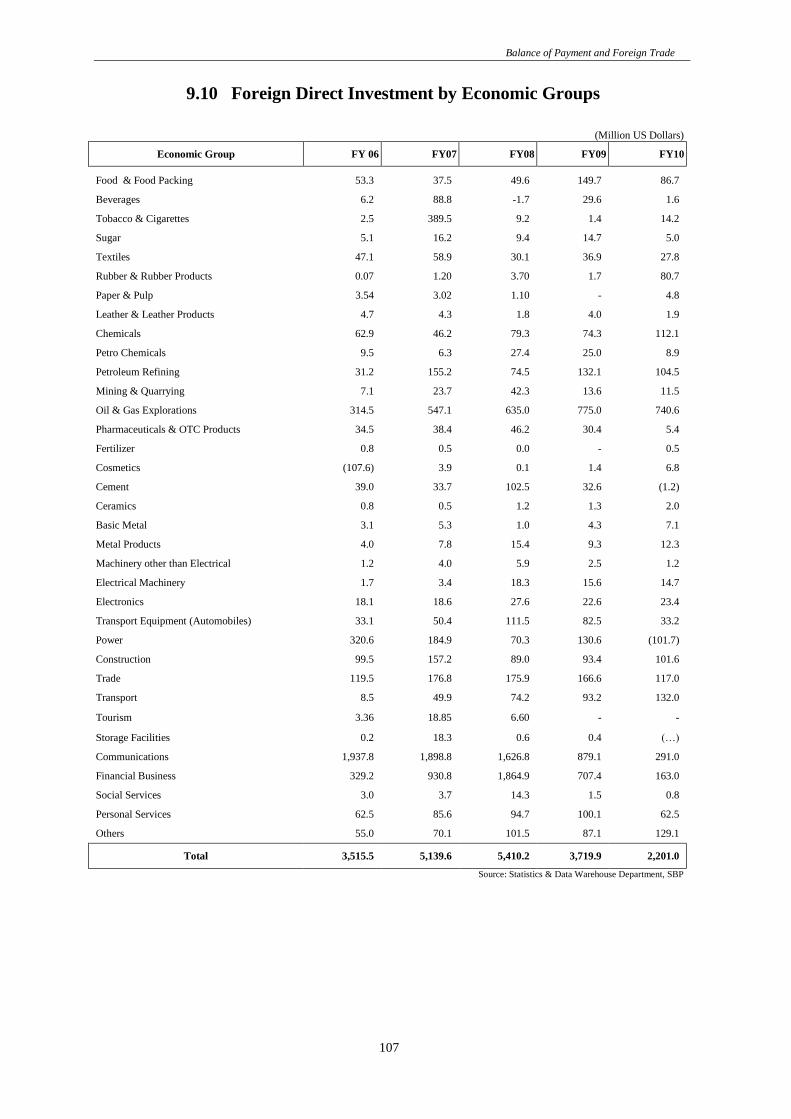
9.10 Foreign Direct Investment by Economic Groups
(Million US Dollars)
Economic Group FY 06 FY07 FY08 FY09 FY10
Food & Food Packing 53.3 37.5 49.6 149.7 86.7
Beverages 6.2 88.8 -1.7 29.6 1.6
Tobacco & Cigarettes 2.5 389.5 9.2 1.4 14.2
Sugar 5.1 16.2 9.4 14.7 5.0
Textiles 47.1 58.9 30.1 36.9 27.8
Rubber & Rubber Products 0.07 1.20 3.70 1.7 80.7
Paper & Pulp 3.54 3.02 1.10 - 4.8
Leather & Leather Products 4.7 4.3 1.8 4.0 1.9
Chemicals 62.9 46.2 79.3 74.3 112.1
Petro Chemicals 9.5 6.3 27.4 25.0 8.9
Petroleum Refining 31.2 155.2 74.5 132.1 104.5
Mining & Quarrying 7.1 23.7 42.3 13.6 11.5
Oil & Gas Explorations 314.5 547.1 635.0 775.0 740.6
Pharmaceuticals & OTC Products 34.5 38.4 46.2 30.4 5.4
Fertilizer 0.8 0.5 0.0 - 0.5
Cosmetics (107.6) 3.9 0.1 1.4 6.8
Cement 39.0 33.7 102.5 32.6 (1.2)
Ceramics 0.8 0.5 1.2 1.3 2.0
Basic Metal 3.1 5.3 1.0 4.3 7.1
Metal Products 4.0 7.8 15.4 9.3 12.3
Machinery other than Electrical 1.2 4.0 5.9 2.5 1.2
Electrical Machinery 1.7 3.4 18.3 15.6 14.7
Electronics 18.1 18.6 27.6 22.6 23.4
Transport Equipment (Automobiles) 33.1 50.4 111.5 82.5 33.2
Power 320.6 184.9 70.3 130.6 (101.7)
Construction 99.5 157.2 89.0 93.4 101.6
Trade 119.5 176.8 175.9 166.6 117.0
Transport 8.5 49.9 74.2 93.2 132.0
Tourism 3.36 18.85 6.60 - -
Storage Facilities 0.2 18.3 0.6 0.4 (…)
Communications 1,937.8 1,898.8 1,626.8 879.1 291.0
Financial Business 329.2 930.8 1,864.9 707.4 163.0
Social Services 3.0 3.7 14.3 1.5 0.8
Personal Services 62.5 85.6 94.7 100.1 62.5
Others 55.0 70.1 101.5 87.1 129.1
Total 3,515.5 5,139.6 5,410.2 3,719.9 2,201.0
Source: Statistics & Data Warehouse Department, SBP
SBP Annual Report-Statistical Supplement FY 10
108
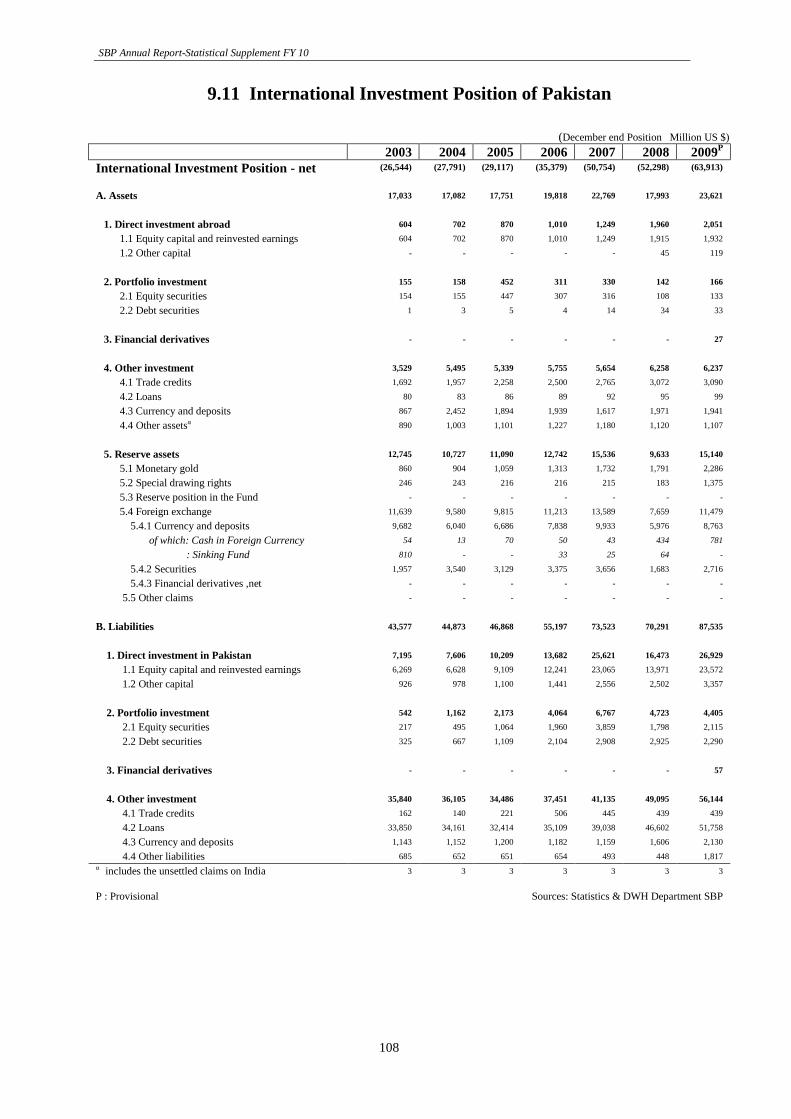
9.11 International Investment Position of Pakistan
(December end Position Million US $)
2003 2004 2005 2006 2007 2008 2009P
International Investment Position - net (26,544) (27,791) (29,117) (35,379) (50,754) (52,298) (63,913)
A. Assets 17,033 17,082 17,751 19,818 22,769 17,993 23,621
1. Direct investment abroad 604 702 870 1,010 1,249 1,960 2,051
1.1 Equity capital and reinvested earnings 604 702 870 1,010 1,249 1,915 1,932
1.2 Other capital - - - - - 45 119
2. Portfolio investment 155 158 452 311 330 142 166
2.1 Equity securities 154 155 447 307 316 108 133
2.2 Debt securities 1 3 5 4 14 34 33
3. Financial derivatives - - - - - - 27
4. Other investment 3,529 5,495 5,339 5,755 5,654 6,258 6,237
4.1 Trade credits 1,692 1,957 2,258 2,500 2,765 3,072 3,090
4.2 Loans 80 83 86 89 92 95 99
4.3 Currency and deposits 867 2,452 1,894 1,939 1,617 1,971 1,941
4.4 Other assetsα 890 1,003 1,101 1,227 1,180 1,120 1,107
5. Reserve assets 12,745 10,727 11,090 12,742 15,536 9,633 15,140
5.1 Monetary gold 860 904 1,059 1,313 1,732 1,791 2,286
5.2 Special drawing rights 246 243 216 216 215 183 1,375
5.3 Reserve position in the Fund - - - - - - -
5.4 Foreign exchange 11,639 9,580 9,815 11,213 13,589 7,659 11,479
5.4.1 Currency and deposits 9,682 6,040 6,686 7,838 9,933 5,976 8,763
of which: Cash in Foreign Currency 54 13 70 50 43 434 781
: Sinking Fund 810 - - 33 25 64 -
5.4.2 Securities 1,957 3,540 3,129 3,375 3,656 1,683 2,716
5.4.3 Financial derivatives ,net - - - - - - -
5.5 Other claims - - - - - - -
B. Liabilities 43,577 44,873 46,868 55,197 73,523 70,291 87,535
1. Direct investment in Pakistan 7,195 7,606 10,209 13,682 25,621 16,473 26,929
1.1 Equity capital and reinvested earnings 6,269 6,628 9,109 12,241 23,065 13,971 23,572
1.2 Other capital 926 978 1,100 1,441 2,556 2,502 3,357
2. Portfolio investment 542 1,162 2,173 4,064 6,767 4,723 4,405
2.1 Equity securities 217 495 1,064 1,960 3,859 1,798 2,115
2.2 Debt securities 325 667 1,109 2,104 2,908 2,925 2,290
3. Financial derivatives - - - - - - 57
4. Other investment 35,840 36,105 34,486 37,451 41,135 49,095 56,144
4.1 Trade credits 162 140 221 506 445 439 439
4.2 Loans 33,850 34,161 32,414 35,109 39,038 46,602 51,758
4.3 Currency and deposits 1,143 1,152 1,200 1,182 1,159 1,606 2,130
4.4 Other liabilities 685 652 651 654 493 448 1,817
α includes the unsettled claims on India 3 3 3 3 3 3 3
P : Provisional
Sources: Statistics & DWH Department SBP
Balance of Payment and Foreign Trade
109
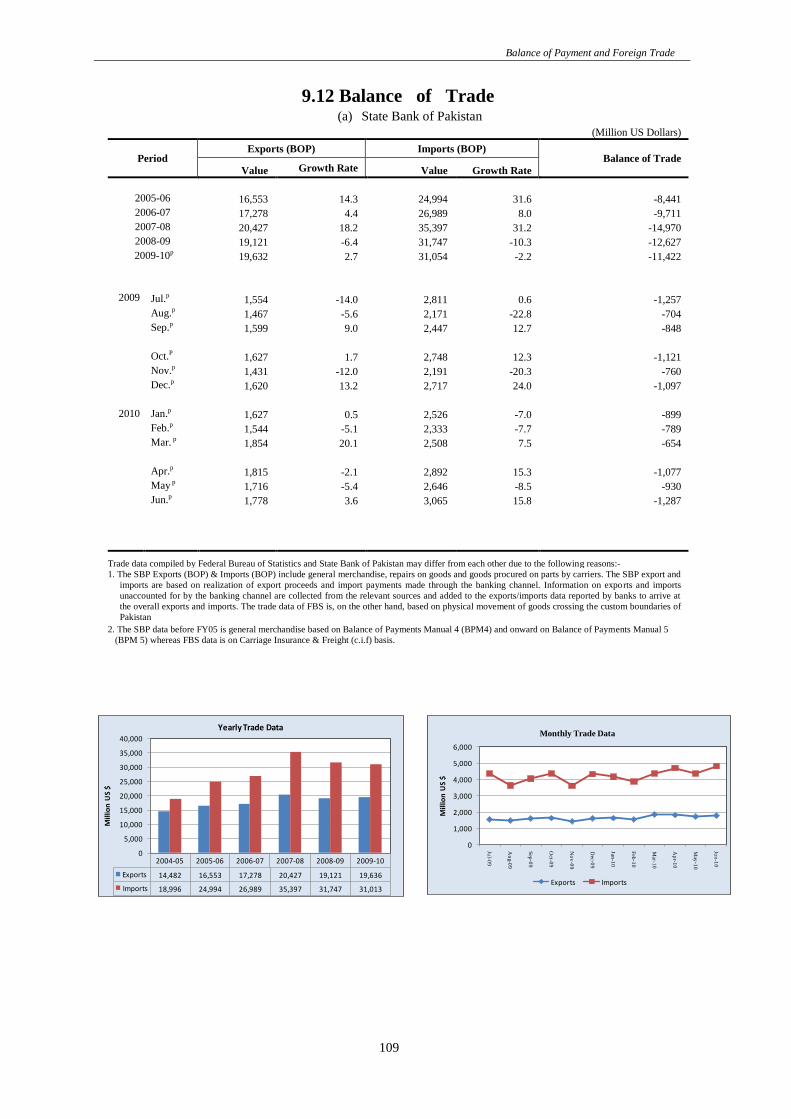
9.12 Balance of Trade (a) State Bank of Pakistan
(Million US Dollars)
Period Exports (BOP) Imports (BOP)
Balance of Trade
Value Growth Rate Value Growth Rate
2005-06 16,553 14.3 24,994 31.6 -8,441
2006-07 17,278 4.4 26,989 8.0 -9,711
2007-08 20,427 18.2 35,397 31.2 -14,970
2008-09 19,121 -6.4 31,747 -10.3 -12,627
2009-10p 19,632 2.7 31,054 -2.2 -11,422
2009
Jul.p 1,554 -14.0 2,811 0.6 -1,257
Aug.p 1,467 -5.6 2,171 -22.8 -704
Sep.p 1,599 9.0 2,447 12.7 -848
Oct.P 1,627 1.7 2,748 12.3 -1,121
Nov.p 1,431 -12.0 2,191 -20.3 -760
Dec.p 1,620 13.2 2,717 24.0 -1,097
2010 Jan.p 1,627 0.5 2,526 -7.0 -899
Feb.p 1,544 -5.1 2,333 -7.7 -789
Mar. p 1,854 20.1 2,508 7.5 -654
Apr.p 1,815 -2.1 2,892 15.3 -1,077
May p 1,716 -5.4 2,646 -8.5 -930
Jun.p 1,778 3.6 3,065 15.8 -1,287
Trade data compiled by Federal Bureau of Statistics and State Bank of Pakistan may differ from each other due to the following reasons:-
1. The SBP Exports (BOP) & Imports (BOP) include general merchandise, repairs on goods and goods procured on parts by carriers. The SBP export and
imports are based on realization of export proceeds and import payments made through the banking channel. Information on exports and imports
unaccounted for by the banking channel are collected from the relevant sources and added to the exports/imports data reported by banks to arrive at
the overall exports and imports. The trade data of FBS is, on the other hand, based on physical movement of goods crossing the custom boundaries of
Pakistan
2. The SBP data before FY05 is general merchandise based on Balance of Payments Manual 4 (BPM4) and onward on Balance of Payments Manual 5
(BPM 5) whereas FBS data is on Carriage Insurance & Freight (c.i.f) basis.
2004-05 2005-06 2006-07 2007-08 2008-09 2009-10
Exports 14,482 16,553 17,278 20,427 19,121 19,636
Imports 18,996 24,994 26,989 35,397 31,747 31,013
0
5,000
10,000
15,000
20,000
25,000
30,000
35,000
40,000
Mill
ion
US
$
Yearly Trade Data
0
1,000
2,000
3,000
4,000
5,000
6,000
Jul-0
9
Au
g-09
Sep
-09
Oct-0
9
No
v-0
9
Dec-0
9
Jan-1
0
Feb
-10
Mar-1
0
Ap
r-10
May
-10
Jun
-10
Mill
ion
US
$
Monthly Trade Data
Exports Imports
SBP Annual Report-Statistical Supplement FY 10
110
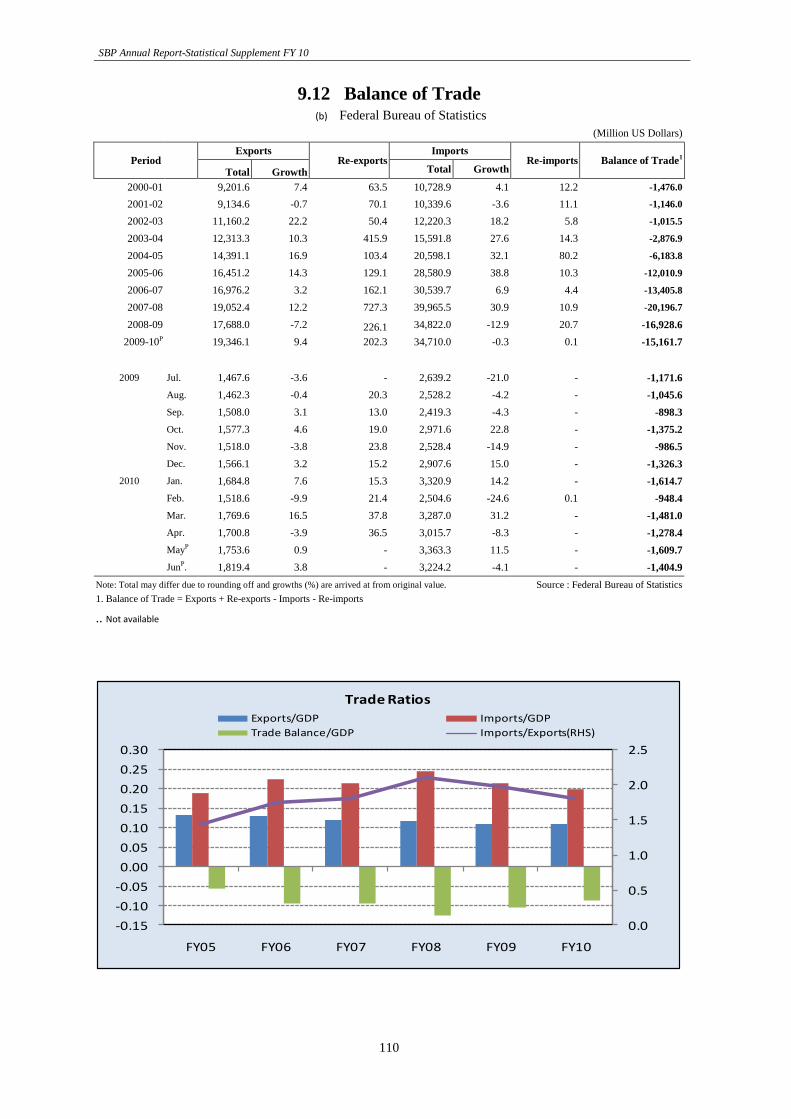
9.12 Balance of Trade
( (b) Federal Bureau of Statistics
(Million US Dollars)
Period Exports
Re-exports Imports
Re-imports Balance of Trade1 Total Growth Total Growth
2000-01 9,201.6 7.4 63.5 10,728.9 4.1 12.2 -1,476.0
2001-02 9,134.6 -0.7 70.1 10,339.6 -3.6 11.1 -1,146.0
2002-03 11,160.2 22.2 50.4 12,220.3 18.2 5.8 -1,015.5
2003-04 12,313.3 10.3 415.9 15,591.8 27.6 14.3 -2,876.9
2004-05 14,391.1 16.9 103.4 20,598.1 32.1 80.2 -6,183.8
2005-06 16,451.2 14.3 129.1 28,580.9 38.8 10.3 -12,010.9
2006-07 16,976.2 3.2 162.1 30,539.7 6.9 4.4 -13,405.8
2007-08 19,052.4 12.2 727.3 39,965.5 30.9 10.9 -20,196.7
2008-09 17,688.0 -7.2 226.1 34,822.0 -12.9 20.7 -16,928.6
2009-10P 19,346.1 9.4 202.3 34,710.0 -0.3 0.1 -15,161.7
2009 Jul. 1,467.6 -3.6 - 2,639.2 -21.0 - -1,171.6
Aug. 1,462.3 -0.4 20.3 2,528.2 -4.2 - -1,045.6
Sep. 1,508.0 3.1 13.0 2,419.3 -4.3 - -898.3
Oct. 1,577.3 4.6 19.0 2,971.6 22.8 - -1,375.2
Nov. 1,518.0 -3.8 23.8 2,528.4 -14.9 - -986.5
Dec. 1,566.1 3.2 15.2 2,907.6 15.0 - -1,326.3
2010 Jan. 1,684.8 7.6 15.3 3,320.9 14.2 - -1,614.7
Feb. 1,518.6 -9.9 21.4 2,504.6 -24.6 0.1 -948.4
Mar. 1,769.6 16.5 37.8 3,287.0 31.2 - -1,481.0
Apr. 1,700.8 -3.9 36.5 3,015.7 -8.3 - -1,278.4
MayP 1,753.6 0.9 - 3,363.3 11.5 - -1,609.7
JunP. 1,819.4 3.8 - 3,224.2 -4.1 - -1,404.9
Note: Total may differ due to rounding off and growths (%) are arrived at from original value. Source : Federal Bureau of Statistics
1. Balance of Trade = Exports + Re-exports - Imports - Re-imports
.. Not available
0.0
0.5
1.0
1.5
2.0
2.5
-0.15
-0.10
-0.05
0.00
0.05
0.10
0.15
0.20
0.25
0.30
FY05 FY06 FY07 FY08 FY09 FY10
Trade Ratios
Exports/GDP Imports/GDP
Trade Balance/GDP Imports/Exports(RHS)
Balance of Payment and Foreign Trade
111
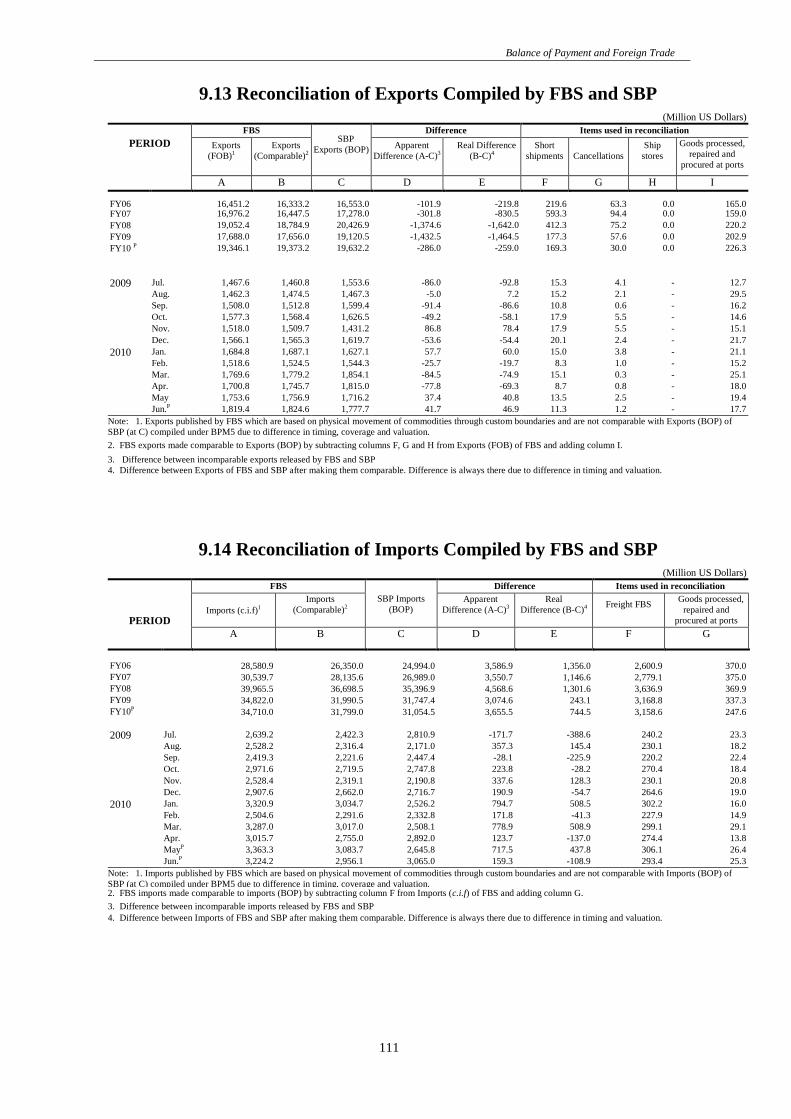
9.13 Reconciliation of Exports Compiled by FBS and SBP (Million US Dollars)
PERIOD
FBS
SBP
Exports (BOP)
Difference
Items used in reconciliation
Exports
(FOB)1
Exports
(Comparable)2
Apparent
Difference (A-C)3
Real Difference
(B-C)4
Short
shipments
Cancellations
Ship
stores
Goods processed,
repaired and
procured at ports
A B C D E F G H I
FY06 16,451.2 16,333.2 16,553.0 -101.9 -219.8 219.6 63.3 0.0 165.0 FY07 16,976.2 16,447.5 17,278.0 -301.8 -830.5 593.3 94.4 0.0 159.0
FY08 19,052.4 18,784.9 20,426.9 -1,374.6 -1,642.0 412.3 75.2 0.0 220.2
FY09 17,688.0 17,656.0 19,120.5 -1,432.5 -1,464.5 177.3 57.6 0.0 202.9
FY10 P 19,346.1 19,373.2 19,632.2 -286.0 -259.0 169.3 30.0 0.0 226.3
2009 Jul. 1,467.6 1,460.8 1,553.6 -86.0 -92.8 15.3 4.1 - 12.7
Aug. 1,462.3 1,474.5 1,467.3 -5.0 7.2 15.2 2.1 - 29.5
Sep. 1,508.0 1,512.8 1,599.4 -91.4 -86.6 10.8 0.6 - 16.2
Oct. 1,577.3 1,568.4 1,626.5 -49.2 -58.1 17.9 5.5 - 14.6
Nov. 1,518.0 1,509.7 1,431.2 86.8 78.4 17.9 5.5 - 15.1
Dec. 1,566.1 1,565.3 1,619.7 -53.6 -54.4 20.1 2.4 - 21.7
2010 Jan. 1,684.8 1,687.1 1,627.1 57.7 60.0 15.0 3.8 - 21.1
Feb. 1,518.6 1,524.5 1,544.3 -25.7 -19.7 8.3 1.0 - 15.2
Mar. 1,769.6 1,779.2 1,854.1 -84.5 -74.9 15.1 0.3 - 25.1
Apr. 1,700.8 1,745.7 1,815.0 -77.8 -69.3 8.7 0.8 - 18.0
May 1,753.6 1,756.9 1,716.2 37.4 40.8 13.5 2.5 - 19.4
Jun.P 1,819.4 1,824.6 1,777.7 41.7 46.9 11.3 1.2 - 17.7
Note: 1. Exports published by FBS which are based on physical movement of commodities through custom boundaries and are not comparable with Exports (BOP) of
SBP (at C) compiled under BPM5 due to difference in timing, coverage and valuation.
2. FBS exports made comparable to Exports (BOP) by subtracting columns F, G and H from Exports (FOB) of FBS and adding column I.
3. Difference between incomparable exports released by FBS and SBP
4. Difference between Exports of FBS and SBP after making them comparable. Difference is always there due to difference in timing and valuation.
9.14 Reconciliation of Imports Compiled by FBS and SBP (Million US Dollars)
PERIOD
FBS
SBP Imports
(BOP)
Difference
Items used in reconciliation
Imports (c.i.f)1
Imports
(Comparable)2
Apparent
Difference (A-C)3
Real
Difference (B-C)4
Freight FBS
Goods processed,
repaired and
procured at ports
A B C D E F G
FY06 28,580.9 26,350.0 24,994.0 3,586.9 1,356.0 2,600.9 370.0
FY07 30,539.7 28,135.6 26,989.0 3,550.7 1,146.6 2,779.1 375.0
FY08 39,965.5 36,698.5 35,396.9 4,568.6 1,301.6 3,636.9 369.9
FY09 34,822.0 31,990.5 31,747.4 3,074.6 243.1 3,168.8 337.3
FY10P 34,710.0 31,799.0 31,054.5 3,655.5 744.5 3,158.6 247.6
2009 Jul. 2,639.2 2,422.3 2,810.9 -171.7 -388.6 240.2 23.3
Aug. 2,528.2 2,316.4 2,171.0 357.3 145.4 230.1 18.2
Sep. 2,419.3 2,221.6 2,447.4 -28.1 -225.9 220.2 22.4
Oct. 2,971.6 2,719.5 2,747.8 223.8 -28.2 270.4 18.4
Nov. 2,528.4 2,319.1 2,190.8 337.6 128.3 230.1 20.8
Dec. 2,907.6 2,662.0 2,716.7 190.9 -54.7 264.6 19.0
2010 Jan. 3,320.9 3,034.7 2,526.2 794.7 508.5 302.2 16.0
Feb. 2,504.6 2,291.6 2,332.8 171.8 -41.3 227.9 14.9
Mar. 3,287.0 3,017.0 2,508.1 778.9 508.9 299.1 29.1
Apr. 3,015.7 2,755.0 2,892.0 123.7 -137.0 274.4 13.8
MayP 3,363.3 3,083.7 2,645.8 717.5 437.8 306.1 26.4
Jun.P 3,224.2 2,956.1 3,065.0 159.3 -108.9 293.4 25.3
Note: 1. Imports published by FBS which are based on physical movement of commodities through custom boundaries and are not comparable with Imports (BOP) of
SBP (at C) compiled under BPM5 due to difference in timing, coverage and valuation.
2. FBS imports made comparable to imports (BOP) by subtracting column F from Imports (c.i.f) of FBS and adding column G.
3. Difference between incomparable imports released by FBS and SBP
4. Difference between Imports of FBS and SBP after making them comparable. Difference is always there due to difference in timing and valuation.
SBP Annual Report-Statistical Supplement FY 10
112
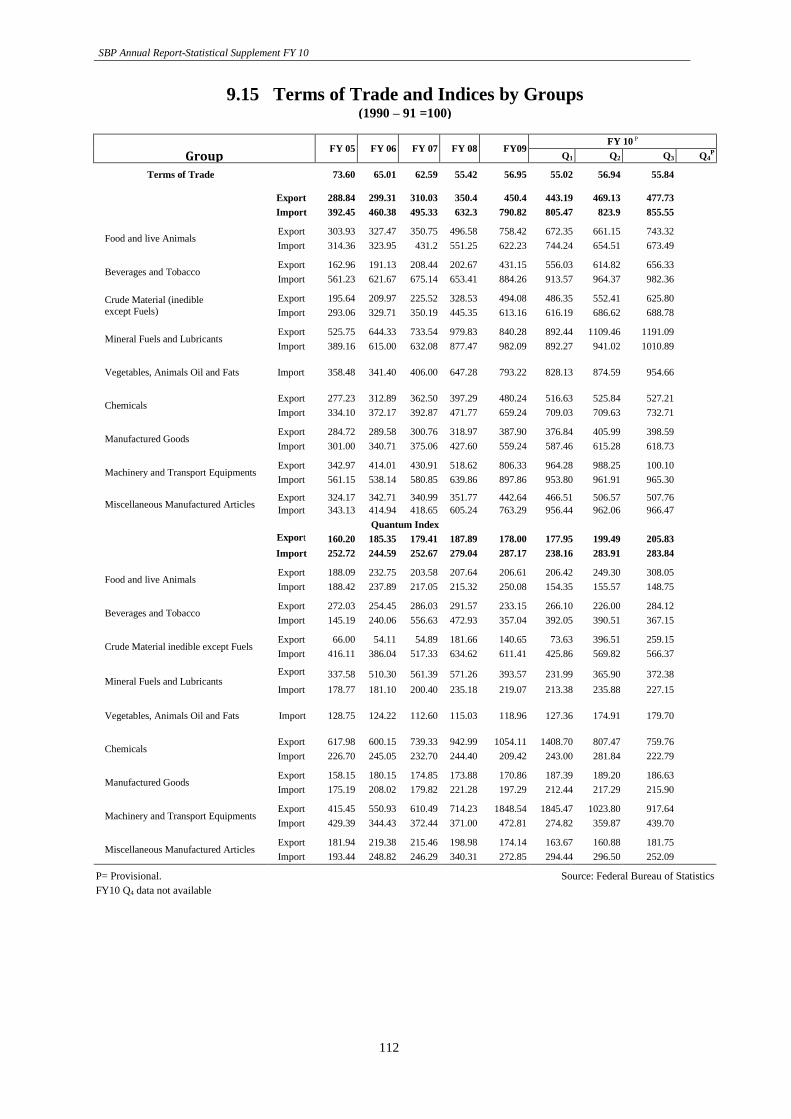
9.15 Terms of Trade and Indices by Groups (1990 – 91 =100)
Group FY 05 FY 06 FY 07 FY 08 FY09
FY 10 P
Q1 Q2
Q3 Q4
P
Terms of Trade 73.60 65.01 62.59 55.42 56.95 55.02 56.94 55.84
All Groups
Export 288.84 299.31 310.03 350.4 450.4 443.19 469.13 477.73
Import 392.45 460.38 495.33 632.3 790.82 805.47 823.9 855.55
Food and live Animals Export 303.93 327.47 350.75 496.58 758.42 672.35 661.15 743.32
Import 314.36 323.95 431.2 551.25 622.23 744.24 654.51 673.49
Beverages and Tobacco Export 162.96 191.13 208.44 202.67 431.15 556.03 614.82 656.33
Import 561.23 621.67 675.14 653.41 884.26 913.57 964.37 982.36
Crude Material (inedible
except Fuels)
Export 195.64 209.97 225.52 328.53 494.08 486.35 552.41 625.80
Import 293.06 329.71 350.19 445.35 613.16 616.19 686.62 688.78
Mineral Fuels and Lubricants Export 525.75 644.33 733.54 979.83 840.28 892.44 1109.46 1191.09
Import 389.16 615.00 632.08 877.47 982.09 892.27 941.02 1010.89
Vegetables, Animals Oil and Fats Import 358.48 341.40 406.00 647.28 793.22 828.13 874.59 954.66
Chemicals Export 277.23 312.89 362.50 397.29 480.24 516.63 525.84 527.21
Import 334.10 372.17 392.87 471.77 659.24 709.03 709.63 732.71
Manufactured Goods Export 284.72 289.58 300.76 318.97 387.90 376.84 405.99 398.59
Import 301.00 340.71 375.06 427.60 559.24 587.46 615.28 618.73
Machinery and Transport Equipments Export 342.97 414.01 430.91 518.62 806.33 964.28 988.25 100.10
Import 561.15 538.14 580.85 639.86 897.86 953.80 961.91 965.30
Miscellaneous Manufactured Articles Export 324.17 342.71 340.99 351.77 442.64 466.51 506.57 507.76
Import 343.13 414.94 418.65 605.24 763.29 956.44 962.06 966.47
Quantum Index
All Groups
Export
160.20 185.35 179.41 187.89 178.00 177.95 199.49 205.83
Import 252.72 244.59 252.67 279.04 287.17 238.16 283.91 283.84
Food and live Animals Export 188.09 232.75 203.58 207.64 206.61 206.42 249.30 308.05
Import 188.42 237.89 217.05 215.32 250.08 154.35 155.57 148.75
Beverages and Tobacco Export 272.03 254.45 286.03 291.57 233.15 266.10 226.00 284.12
Import 145.19 240.06 556.63 472.93 357.04 392.05 390.51 367.15
Crude Material inedible except Fuels Export 66.00 54.11 54.89 181.66 140.65 73.63 396.51 259.15
Import 416.11 386.04 517.33 634.62 611.41 425.86 569.82 566.37
Mineral Fuels and Lubricants Export
337.58 510.30 561.39 571.26 393.57 231.99 365.90 372.38
Import 178.77 181.10 200.40 235.18 219.07 213.38 235.88 227.15
Vegetables, Animals Oil and Fats Import 128.75 124.22 112.60 115.03 118.96 127.36 174.91 179.70
Chemicals Export 617.98 600.15 739.33 942.99 1054.11 1408.70 807.47 759.76
Import 226.70 245.05 232.70 244.40 209.42 243.00 281.84 222.79
Manufactured Goods Export 158.15 180.15 174.85 173.88 170.86 187.39 189.20 186.63
Import 175.19 208.02 179.82 221.28 197.29 212.44 217.29 215.90
Machinery and Transport Equipments Export 415.45 550.93 610.49 714.23 1848.54 1845.47 1023.80 917.64
Import 429.39 344.43 372.44 371.00 472.81 274.82 359.87 439.70
Miscellaneous Manufactured Articles Export 181.94 219.38 215.46 198.98 174.14 163.67 160.88 181.75
Import 193.44 248.82 246.29 340.31 272.85 294.44 296.50 252.09
P= Provisional. Source: Federal Bureau of Statistics
FY10 Q4 data not available
Balance of Payment and Foreign Trade
113
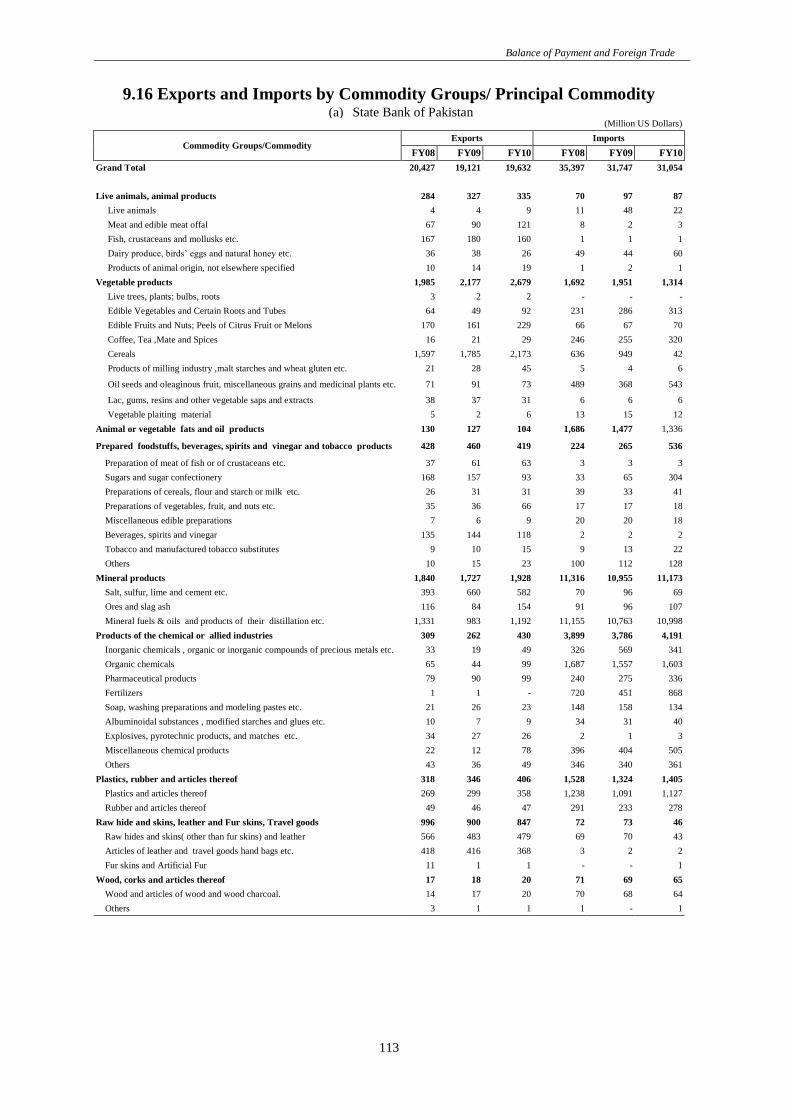
9.16 Exports and Imports by Commodity Groups/ Principal Commodity (a) State Bank of Pakistan
(Million US Dollars)
Commodity Groups/Commodity Exports Imports
FY08 FY09 FY10 FY08 FY09 FY10
Grand Total 20,427 19,121 19,632 35,397 31,747 31,054
Live animals, animal products 284 327 335 70 97 87
Live animals 4 4 9 11 48 22
Meat and edible meat offal 67 90 121 8 2 3
Fish, crustaceans and mollusks etc. 167 180 160 1 1 1
Dairy produce, birds’ eggs and natural honey etc. 36 38 26 49 44 60
Products of animal origin, not elsewhere specified 10 14 19 1 2 1
Vegetable products 1,985 2,177 2,679 1,692 1,951 1,314
Live trees, plants; bulbs, roots 3 2 2 - - -
Edible Vegetables and Certain Roots and Tubes 64 49 92 231 286 313
Edible Fruits and Nuts; Peels of Citrus Fruit or Melons 170 161 229 66 67 70
Coffee, Tea ,Mate and Spices 16 21 29 246 255 320
Cereals 1,597 1,785 2,173 636 949 42
Products of milling industry ,malt starches and wheat gluten etc. 21 28 45 5 4 6
Oil seeds and oleaginous fruit, miscellaneous grains and medicinal plants etc. 71 91 73 489 368 543
Lac, gums, resins and other vegetable saps and extracts 38 37 31 6 6 6
Vegetable plaiting material 5 2 6 13 15 12
Animal or vegetable fats and oil products 130 127 104 1,686 1,477 1,336
Prepared foodstuffs, beverages, spirits and vinegar and tobacco products 428 460 419 224 265 536
Preparation of meat of fish or of crustaceans etc. 37 61 63 3 3 3
Sugars and sugar confectionery 168 157 93 33 65 304
Preparations of cereals, flour and starch or milk etc. 26 31 31 39 33 41
Preparations of vegetables, fruit, and nuts etc. 35 36 66 17 17 18
Miscellaneous edible preparations 7 6 9 20 20 18
Beverages, spirits and vinegar 135 144 118 2 2 2
Tobacco and manufactured tobacco substitutes 9 10 15 9 13 22
Others 10 15 23 100 112 128
Mineral products 1,840 1,727 1,928 11,316 10,955 11,173
Salt, sulfur, lime and cement etc. 393 660 582 70 96 69
Ores and slag ash 116 84 154 91 96 107
Mineral fuels & oils and products of their distillation etc. 1,331 983 1,192 11,155 10,763 10,998
Products of the chemical or allied industries 309 262 430 3,899 3,786 4,191
Inorganic chemicals , organic or inorganic compounds of precious metals etc. 33 19 49 326 569 341
Organic chemicals 65 44 99 1,687 1,557 1,603
Pharmaceutical products 79 90 99 240 275 336
Fertilizers 1 1 - 720 451 868
Soap, washing preparations and modeling pastes etc. 21 26 23 148 158 134
Albuminoidal substances , modified starches and glues etc. 10 7 9 34 31 40
Explosives, pyrotechnic products, and matches etc. 34 27 26 2 1 3
Miscellaneous chemical products 22 12 78 396 404 505
Others 43 36 49 346 340 361
Plastics, rubber and articles thereof 318 346 406 1,528 1,324 1,405
Plastics and articles thereof 269 299 358 1,238 1,091 1,127
Rubber and articles thereof 49 46 47 291 233 278
Raw hide and skins, leather and Fur skins, Travel goods 996 900 847 72 73 46
Raw hides and skins( other than fur skins) and leather 566 483 479 69 70 43
Articles of leather and travel goods hand bags etc. 418 416 368 3 2 2
Fur skins and Artificial Fur 11 1 1 - - 1
Wood, corks and articles thereof 17 18 20 71 69 65
Wood and articles of wood and wood charcoal. 14 17 20 70 68 64
Others 3 1 1 1 - 1
SBP Annual Report-Statistical Supplement FY 10
114
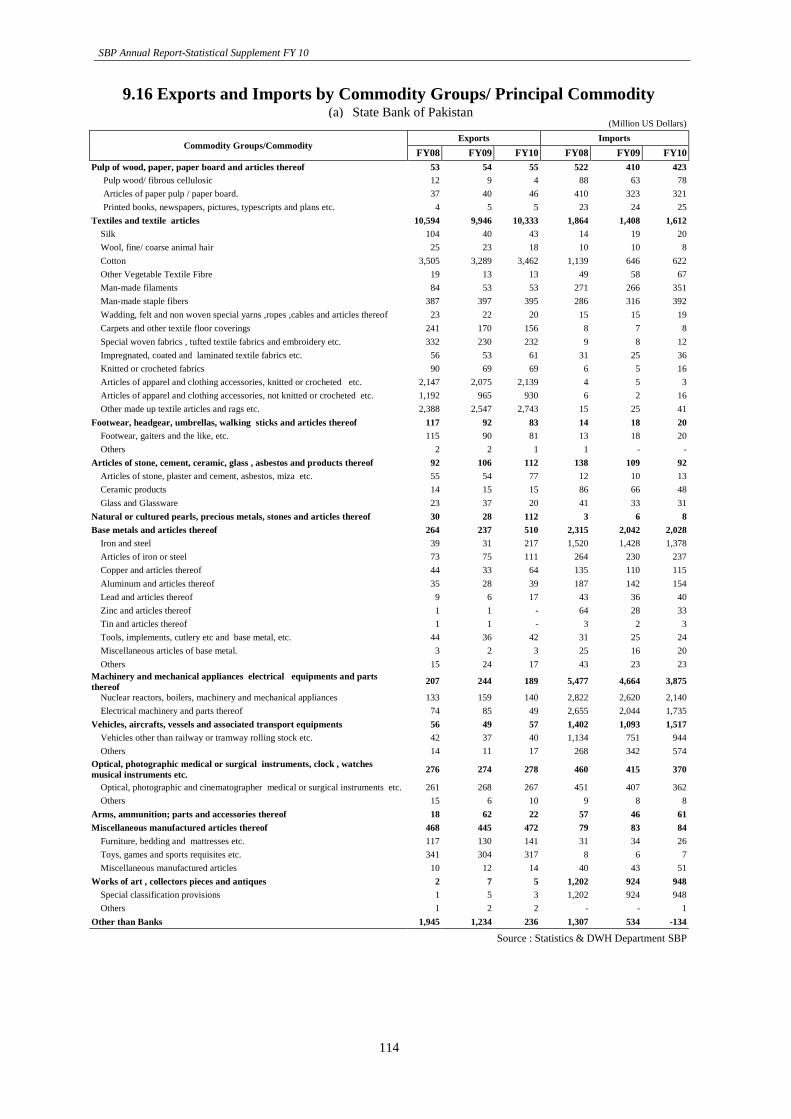
9.16 Exports and Imports by Commodity Groups/ Principal Commodity (a) State Bank of Pakistan
(Million US Dollars)
Commodity Groups/Commodity Exports Imports
FY08 FY09 FY10 FY08 FY09 FY10
Pulp of wood, paper, paper board and articles thereof 53 54 55 522 410 423
Pulp wood/ fibrous cellulosic 12 9 4 88 63 78
Articles of paper pulp / paper board. 37 40 46 410 323 321
Printed books, newspapers, pictures, typescripts and plans etc. 4 5 5 23 24 25
Textiles and textile articles 10,594 9,946 10,333 1,864 1,408 1,612
Silk 104 40 43 14 19 20
Wool, fine/ coarse animal hair 25 23 18 10 10 8
Cotton 3,505 3,289 3,462 1,139 646 622
Other Vegetable Textile Fibre 19 13 13 49 58 67
Man-made filaments 84 53 53 271 266 351
Man-made staple fibers 387 397 395 286 316 392
Wadding, felt and non woven special yarns ,ropes ,cables and articles thereof 23 22 20 15 15 19
Carpets and other textile floor coverings 241 170 156 8 7 8
Special woven fabrics , tufted textile fabrics and embroidery etc. 332 230 232 9 8 12
Impregnated, coated and laminated textile fabrics etc. 56 53 61 31 25 36
Knitted or crocheted fabrics 90 69 69 6 5 16
Articles of apparel and clothing accessories, knitted or crocheted etc. 2,147 2,075 2,139 4 5 3
Articles of apparel and clothing accessories, not knitted or crocheted etc. 1,192 965 930 6 2 16
Other made up textile articles and rags etc. 2,388 2,547 2,743 15 25 41
Footwear, headgear, umbrellas, walking sticks and articles thereof 117 92 83 14 18 20
Footwear, gaiters and the like, etc. 115 90 81 13 18 20
Others 2 2 1 1 - -
Articles of stone, cement, ceramic, glass , asbestos and products thereof 92 106 112 138 109 92
Articles of stone, plaster and cement, asbestos, miza etc. 55 54 77 12 10 13
Ceramic products 14 15 15 86 66 48
Glass and Glassware 23 37 20 41 33 31
Natural or cultured pearls, precious metals, stones and articles thereof 30 28 112 3 6 8
Base metals and articles thereof 264 237 510 2,315 2,042 2,028
Iron and steel 39 31 217 1,520 1,428 1,378
Articles of iron or steel 73 75 111 264 230 237
Copper and articles thereof 44 33 64 135 110 115
Aluminum and articles thereof 35 28 39 187 142 154
Lead and articles thereof 9 6 17 43 36 40
Zinc and articles thereof 1 1 - 64 28 33
Tin and articles thereof 1 1 - 3 2 3
Tools, implements, cutlery etc and base metal, etc. 44 36 42 31 25 24
Miscellaneous articles of base metal. 3 2 3 25 16 20
Others 15 24 17 43 23 23
Machinery and mechanical appliances electrical equipments and parts
thereof 207 244 189 5,477 4,664 3,875
Nuclear reactors, boilers, machinery and mechanical appliances 133 159 140 2,822 2,620 2,140
Electrical machinery and parts thereof 74 85 49 2,655 2,044 1,735
Vehicles, aircrafts, vessels and associated transport equipments 56 49 57 1,402 1,093 1,517
Vehicles other than railway or tramway rolling stock etc. 42 37 40 1,134 751 944
Others 14 11 17 268 342 574
Optical, photographic medical or surgical instruments, clock , watches
musical instruments etc. 276 274 278 460 415 370
Optical, photographic and cinematographer medical or surgical instruments etc. 261 268 267 451 407 362
Others 15 6 10 9 8 8
Arms, ammunition; parts and accessories thereof 18 62 22 57 46 61
Miscellaneous manufactured articles thereof 468 445 472 79 83 84
Furniture, bedding and mattresses etc. 117 130 141 31 34 26
Toys, games and sports requisites etc. 341 304 317 8 6 7
Miscellaneous manufactured articles 10 12 14 40 43 51
Works of art , collectors pieces and antiques 2 7 5 1,202 924 948
Special classification provisions 1 5 3 1,202 924 948
Others 1 2 2 - - 1
Other than Banks 1,945 1,234 236 1,307 534 -134
Source : Statistics & DWH Department SBP

Balance of Payment and Foreign Trade
115
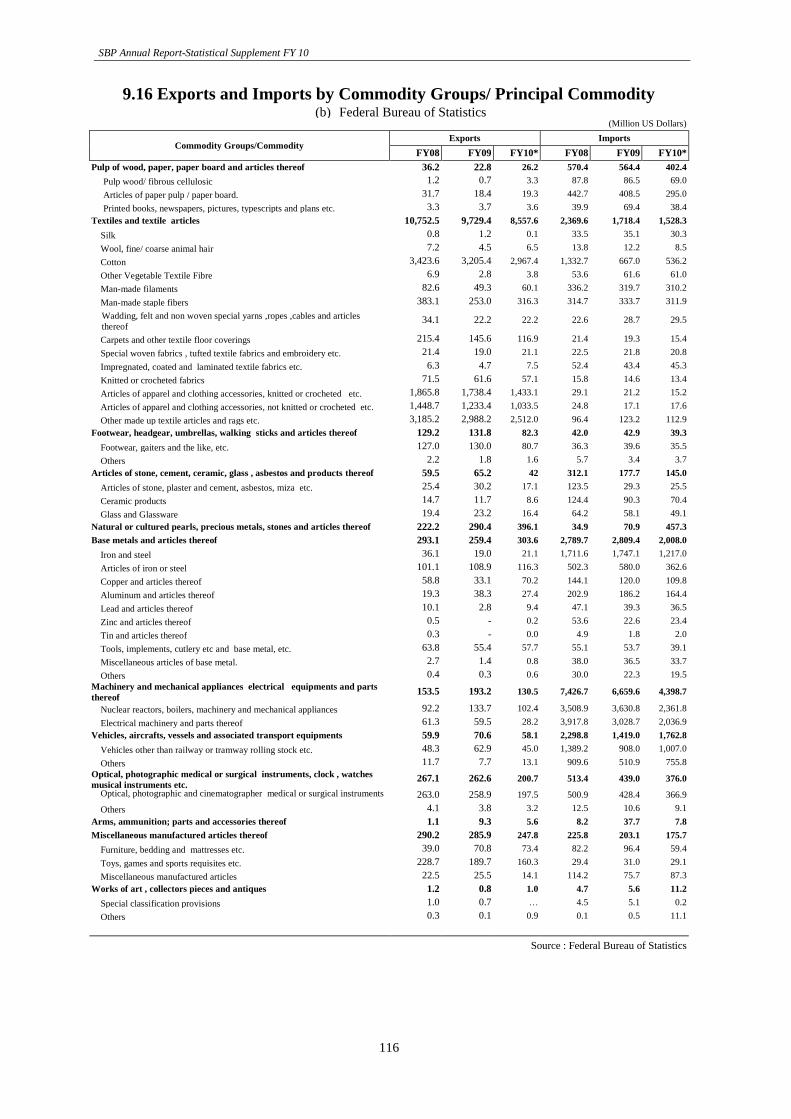
9.16 Exports and Imports by Commodity Groups/ Principal Commodity (b) Federal Bureau of Statistics
(Million US Dollars)
Commodity Groups/Commodity Exports Imports
FY08 FY09 FY10* FY08 FY09 FY10*
Grand Total 19,052.4 17,688.0 15,773.2 39,965.5 34,822.0 28,122.4
Live animals, animal products 296.4 349.9 328.7 64.8 65.2 65.8
Live animals 0.1 0.7 22.4 5.5 10.0 9.4
Meat and edible meat offal 48.9 70.9 80.4 6.8 2.7 3.3
Fish, crustaceans and mollusks etc. 189.1 213.4 161.8 1.3 1.3 1.1
Dairy produce, birds’ eggs and natural honey etc. 37.3 38.9 39.8 49.7 49.7 50.3
Products of animal origin, not elsewhere specified 21.0 25.9 24.3 1.5 1.4 1.6
Vegetable products 2,265.1 2,420.8 2,282.3 2,178.0 2,376.2 1,279.5
Live trees, plants; bulbs, roots 0.7 0.8 0.5 1.1 0.7 1.3
Edible Vegetables and Certain Roots and Tubes 53.6 73.0 93.1 296.0 418.4 308.4
Edible Fruits and Nuts; Peels of Citrus Fruit or Melons 142.8 157.6 213.2 110.4 111.8 95.0
Coffee, Tea ,Mate and Spices 28.8 36.2 36.6 287.1 293.8 288.9
Cereals 1,873.3 2,039.2 1,859.8 919.6 1,136.4 75.1
Products of milling industry ,malt starches and wheat gluten etc. 65.5 20.2 17.5 11.4 11.6 47.3
Oil seeds and oleaginous fruit, miscellaneous grains and medicinal plants etc. 57.7 61.2 33.6 528.5 378.2 442.7
Lac, gums, resins and other vegetable saps and extracts 37.9 30.4 23.2 7.2 7.8 7.6
Vegetable plaiting material 4.8 2.3 4.8 16.9 17.6 13.2
Animal or vegetable fats and oil products 137.0 135.2 78.6 1,843.2 1,595.3 1,145.1
Prepared foodstuffs, beverages, spirits and vinegar and tobacco products 511.7 445.9 312.6 266.6 325.3 445.0
Preparation of meat of fish or of crustaceans etc. 23.3 22.8 20.4 3.9 3.9 2.9
Sugars and sugar confectionery 194.4 156.9 81.6 35.1 71.4 205.0
Preparations of cereals, flour and starch or milk etc. 20.1 24.7 18.0 48.3 38.8 53.4
Preparations of vegetables, fruit, and nuts etc. 23.5 22.9 21.0 19.8 20.3 17.4
Miscellaneous edible preparations 13.3 13.2 10.2 34.6 32.1 29.6
Beverages, spirits and vinegar 219.6 179.9 127.5 9.5 5.9 5.6
Tobacco and manufactured tobacco substitutes 7.3 12.5 10.9 10.9 13.2 17.9
Others 10.2 13.0 23.0 104.4 139.7 113.2
Mineral products 1,868.7 1,506.4 1,363.4 12,522.1 10,433.6 8615.1
Salt, sulfur, lime and cement etc. 441.6 614.6 432.0 90.9 99.0 62.5
Ores and slag ash 159.9 86.1 134.1 130.0 141.9 53.5
Mineral fuels & oils and products of their distillation etc. 1,267.1 805.7 797.3 12,301.2 10,192.8 8499.1
Products of the chemical or allied industries 219.9 240.9 301.2 4,530.7 4,130.2 3,797.8
Inorganic chemicals , organic or inorganic compounds of precious metals etc. 14.4 18.4 21.7 423.8 563.2 301.8
Organic chemicals 11.9 16.7 57.9 1,779.9 1,528.4 1369.7
Pharmaceutical products 110.1 116.5 145.3 416.7 438.7 486.3
Fertilizers 0.5 0.6 0.7 879.3 543.2 729.4
Soap, washing preparations and modeling pastes etc. 10.6 15.0 11.4 177.9 168.9 123.8
Albuminoidal substances , modified starches and glues etc. 7.9 8.1 7.3 29.6 29.9 26.7
Explosives, pyrotechnic products, and matches etc. 25.8 21.3 18.1 4.4 5.2 3.0
Miscellaneous chemical products 9.4 12.7 9.3 415.7 471.0 420.7
Others 29.3 31.4 29.5 403.3 381.7 336.4
Plastics, rubber and articles thereof 274.6 292.2 305 1,746.2 1,526.3 1,322.8
Plastics and articles thereof 264.9 282.8 298.4 1,383.4 1,214.1 1044.2
Rubber and articles thereof 9.7 9.4 6.9 362.7 312.2 278.7
Raw hide and skins, leather and Fur skins, Travel goods 1,198.0 952.4 729.3 115.2 115.8 68.6
Raw hides and skins( other than fur skins) and leather 414.6 299.1 259.3 103.8 101.6 52.4
Articles of leather and travel goods hand bags etc. 783.4 652.8 469.9 11.0 13.3 15.2
Fur skins and Artificial Fur - 0.5 0.1 0.4 0.9 1.0
Wood, corks and articles thereof 14.9 22.8 20.0 102.4 98.8 70.2
Wood and articles of wood and wood charcoal. 14.8 22.7 19.9 102.0 98.4 69.9
Others 0.1 0.1 0.1 0.4 0.4 0.3
Note: FY10 (July09 to April10)
SBP Annual Report-Statistical Supplement FY 10
116
9.16 Exports and Imports by Commodity Groups/ Principal Commodity (b) Federal Bureau of Statistics
(Million US Dollars)
Commodity Groups/Commodity Exports Imports
FY08 FY09 FY10* FY08 FY09 FY10*
Pulp of wood, paper, paper board and articles thereof 36.2 22.8 26.2 570.4 564.4 402.4
Pulp wood/ fibrous cellulosic 1.2 0.7 3.3 87.8 86.5 69.0
Articles of paper pulp / paper board. 31.7 18.4 19.3 442.7 408.5 295.0
Printed books, newspapers, pictures, typescripts and plans etc. 3.3 3.7 3.6 39.9 69.4 38.4
Textiles and textile articles 10,752.5 9,729.4 8,557.6 2,369.6 1,718.4 1,528.3
Silk 0.8 1.2 0.1 33.5 35.1 30.3
Wool, fine/ coarse animal hair 7.2 4.5 6.5 13.8 12.2 8.5
Cotton 3,423.6 3,205.4 2,967.4 1,332.7 667.0 536.2
Other Vegetable Textile Fibre 6.9 2.8 3.8 53.6 61.6 61.0
Man-made filaments 82.6 49.3 60.1 336.2 319.7 310.2
Man-made staple fibers 383.1 253.0 316.3 314.7 333.7 311.9
Wadding, felt and non woven special yarns ,ropes ,cables and articles
thereof 34.1 22.2 22.2 22.6 28.7 29.5
Carpets and other textile floor coverings 215.4 145.6 116.9 21.4 19.3 15.4
Special woven fabrics , tufted textile fabrics and embroidery etc. 21.4 19.0 21.1 22.5 21.8 20.8
Impregnated, coated and laminated textile fabrics etc. 6.3 4.7 7.5 52.4 43.4 45.3
Knitted or crocheted fabrics 71.5 61.6 57.1 15.8 14.6 13.4
Articles of apparel and clothing accessories, knitted or crocheted etc. 1,865.8 1,738.4 1,433.1 29.1 21.2 15.2
Articles of apparel and clothing accessories, not knitted or crocheted etc. 1,448.7 1,233.4 1,033.5 24.8 17.1 17.6
Other made up textile articles and rags etc. 3,185.2 2,988.2 2,512.0 96.4 123.2 112.9
Footwear, headgear, umbrellas, walking sticks and articles thereof 129.2 131.8 82.3 42.0 42.9 39.3
Footwear, gaiters and the like, etc. 127.0 130.0 80.7 36.3 39.6 35.5
Others 2.2 1.8 1.6 5.7 3.4 3.7
Articles of stone, cement, ceramic, glass , asbestos and products thereof 59.5 65.2 42 312.1 177.7 145.0
Articles of stone, plaster and cement, asbestos, miza etc. 25.4 30.2 17.1 123.5 29.3 25.5
Ceramic products 14.7 11.7 8.6 124.4 90.3 70.4
Glass and Glassware 19.4 23.2 16.4 64.2 58.1 49.1
Natural or cultured pearls, precious metals, stones and articles thereof 222.2 290.4 396.1 34.9 70.9 457.3
Base metals and articles thereof 293.1 259.4 303.6 2,789.7 2,809.4 2,008.0
Iron and steel 36.1 19.0 21.1 1,711.6 1,747.1 1,217.0
Articles of iron or steel 101.1 108.9 116.3 502.3 580.0 362.6
Copper and articles thereof 58.8 33.1 70.2 144.1 120.0 109.8
Aluminum and articles thereof 19.3 38.3 27.4 202.9 186.2 164.4
Lead and articles thereof 10.1 2.8 9.4 47.1 39.3 36.5
Zinc and articles thereof 0.5 - 0.2 53.6 22.6 23.4
Tin and articles thereof 0.3 - 0.0 4.9 1.8 2.0
Tools, implements, cutlery etc and base metal, etc. 63.8 55.4 57.7 55.1 53.7 39.1
Miscellaneous articles of base metal. 2.7 1.4 0.8 38.0 36.5 33.7
Others 0.4 0.3 0.6 30.0 22.3 19.5
Machinery and mechanical appliances electrical equipments and parts
thereof 153.5 193.2 130.5 7,426.7 6,659.6 4,398.7
Nuclear reactors, boilers, machinery and mechanical appliances 92.2 133.7 102.4 3,508.9 3,630.8 2,361.8
Electrical machinery and parts thereof 61.3 59.5 28.2 3,917.8 3,028.7 2,036.9
Vehicles, aircrafts, vessels and associated transport equipments 59.9 70.6 58.1 2,298.8 1,419.0 1,762.8
Vehicles other than railway or tramway rolling stock etc. 48.3 62.9 45.0 1,389.2 908.0 1,007.0
Others 11.7 7.7 13.1 909.6 510.9 755.8
Optical, photographic medical or surgical instruments, clock , watches
musical instruments etc. 267.1 262.6 200.7 513.4 439.0 376.0
Optical, photographic and cinematographer medical or surgical instruments
etc. 263.0 258.9 197.5 500.9 428.4 366.9
Others 4.1 3.8 3.2 12.5 10.6 9.1
Arms, ammunition; parts and accessories thereof 1.1 9.3 5.6 8.2 37.7 7.8
Miscellaneous manufactured articles thereof 290.2 285.9 247.8 225.8 203.1 175.7
Furniture, bedding and mattresses etc. 39.0 70.8 73.4 82.2 96.4 59.4
Toys, games and sports requisites etc. 228.7 189.7 160.3 29.4 31.0 29.1
Miscellaneous manufactured articles 22.5 25.5 14.1 114.2 75.7 87.3
Works of art , collectors pieces and antiques 1.2 0.8 1.0 4.7 5.6 11.2
Special classification provisions 1.0 0.7 … 4.5 5.1 0.2
Others 0.3 0.1 0.9 0.1 0.5 11.1
Source : Federal Bureau of Statistics
Balance of Payment and Foreign Trade
117
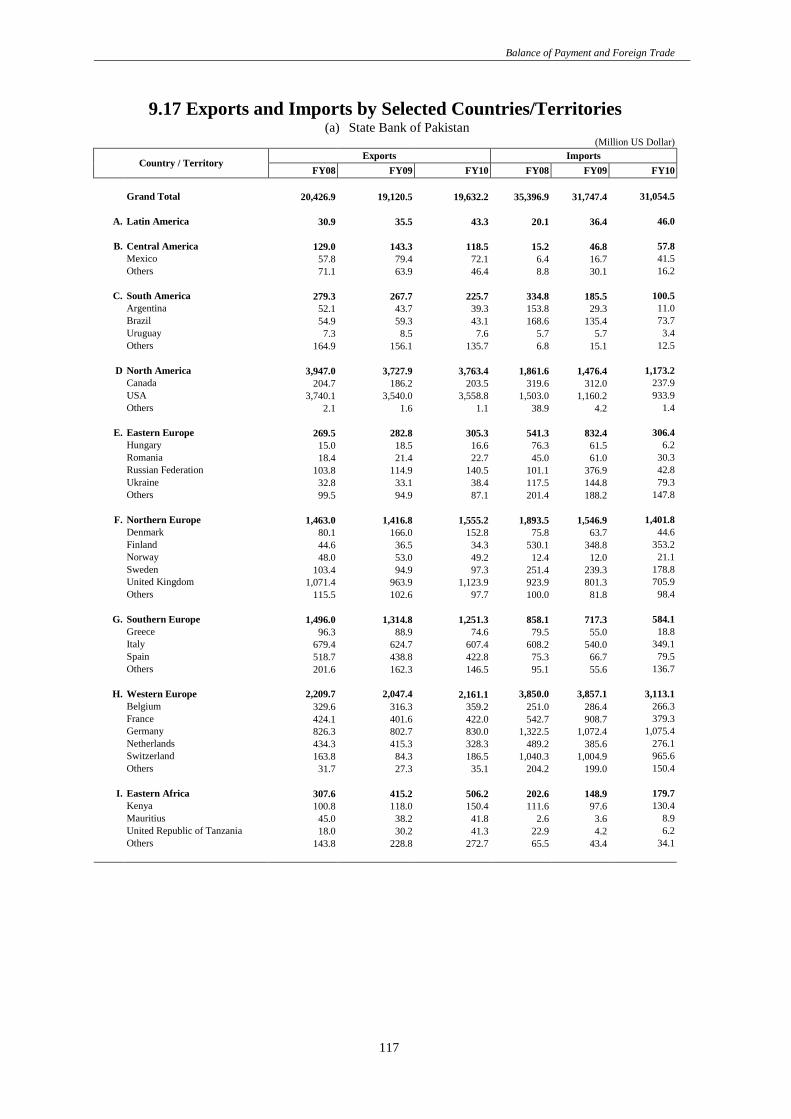
9.17 Exports and Imports by Selected Countries/Territories (a) State Bank of Pakistan
(Million US Dollar)
Country / Territory Exports Imports
FY08 FY09 FY10 FY08 FY09 FY10
Grand Total 20,426.9 19,120.5 19,632.2 35,396.9 31,747.4 31,054.5
A. Latin America 30.9 35.5 43.3 20.1 36.4 46.0
B. Central America 129.0 143.3 118.5 15.2 46.8 57.8
Mexico 57.8 79.4 72.1 6.4 16.7 41.5
Others 71.1 63.9 46.4 8.8 30.1 16.2
C. South America 279.3 267.7 225.7 334.8 185.5 100.5
Argentina 52.1 43.7 39.3 153.8 29.3 11.0
Brazil 54.9 59.3 43.1 168.6 135.4 73.7
Uruguay 7.3 8.5 7.6 5.7 5.7 3.4
Others 164.9 156.1 135.7 6.8 15.1 12.5
D North America 3,947.0 3,727.9 3,763.4 1,861.6 1,476.4 1,173.2
Canada 204.7 186.2 203.5 319.6 312.0 237.9
USA 3,740.1 3,540.0 3,558.8 1,503.0 1,160.2 933.9
Others 2.1 1.6 1.1 38.9 4.2 1.4
E. Eastern Europe 269.5 282.8 305.3 541.3 832.4 306.4
Hungary 15.0 18.5 16.6 76.3 61.5 6.2
Romania 18.4 21.4 22.7 45.0 61.0 30.3
Russian Federation 103.8 114.9 140.5 101.1 376.9 42.8
Ukraine 32.8 33.1 38.4 117.5 144.8 79.3
Others 99.5 94.9 87.1 201.4 188.2 147.8
F. Northern Europe 1,463.0 1,416.8 1,555.2 1,893.5 1,546.9 1,401.8
Denmark 80.1 166.0 152.8 75.8 63.7 44.6
Finland 44.6 36.5 34.3 530.1 348.8 353.2
Norway 48.0 53.0 49.2 12.4 12.0 21.1
Sweden 103.4 94.9 97.3 251.4 239.3 178.8
United Kingdom 1,071.4 963.9 1,123.9 923.9 801.3 705.9
Others 115.5 102.6 97.7 100.0 81.8 98.4
1
G. Southern Europe 1,496.0 1,314.8 1,251.3 858.1 717.3 584.1
Greece 96.3 88.9 74.6 79.5 55.0 18.8
Italy 679.4 624.7 607.4 608.2 540.0 349.1
Spain 518.7 438.8 422.8 75.3 66.7 79.5
Others 201.6 162.3 146.5 95.1 55.6 136.7
H. Western Europe 2,209.7 2,047.4 2,161.1 3,850.0 3,857.1 3,113.1
Belgium 329.6 316.3 359.2 251.0 286.4 266.3
France 424.1 401.6 422.0 542.7 908.7 379.3
Germany 826.3 802.7 830.0 1,322.5 1,072.4 1,075.4
Netherlands 434.3 415.3 328.3 489.2 385.6 276.1
Switzerland 163.8 84.3 186.5 1,040.3 1,004.9 965.6
Others 31.7 27.3 35.1 204.2 199.0 150.4
I. Eastern Africa 307.6 415.2 506.2 202.6 148.9 179.7
Kenya 100.8 118.0 150.4 111.6 97.6 130.4
Mauritius 45.0 38.2 41.8 2.6 3.6 8.9
United Republic of Tanzania 18.0 30.2 41.3 22.9 4.2 6.2
Others 143.8 228.8 272.7 65.5 43.4 34.1
SBP Annual Report-Statistical Supplement FY 10
118
9.17 Exports and Imports by Selected Countries/Territories (a) State Bank of Pakistan
(Million US Dollars)
Country / Territory Exports Imports
FY08 FY09 FY10 FY08 FY09 FY10
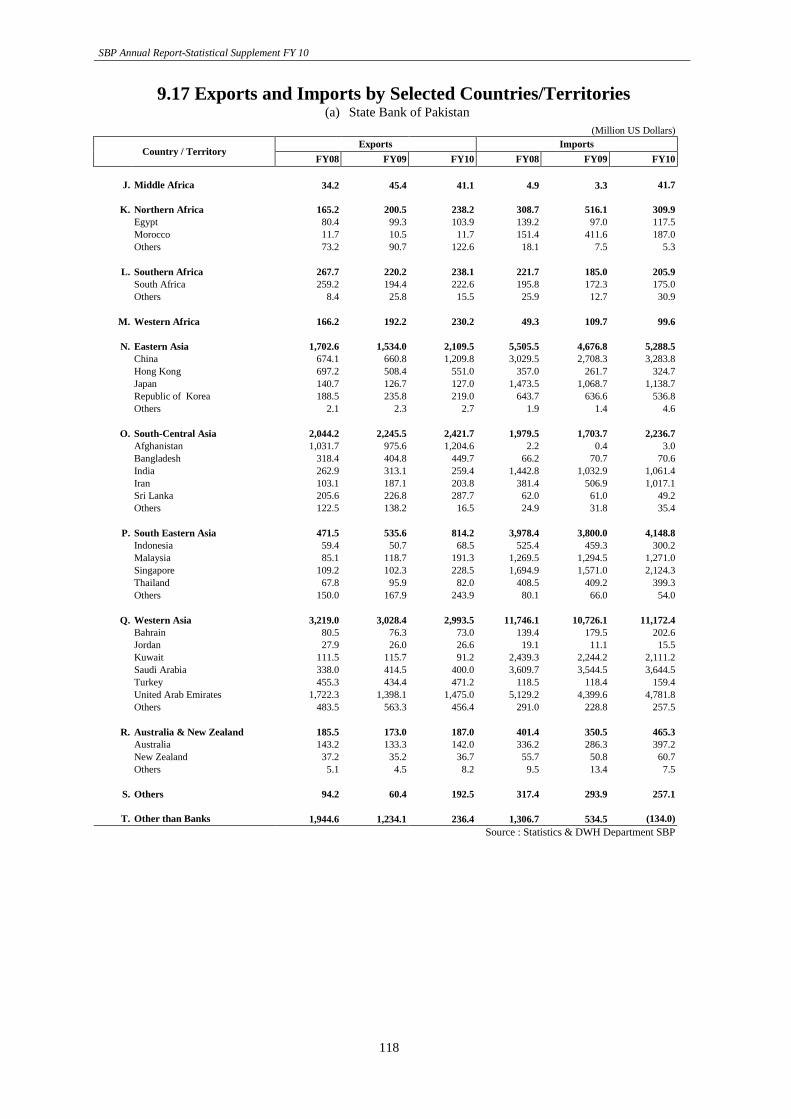
J. Middle Africa 34.2 45.4 41.1 4.9 3.3 41.7
K. Northern Africa 165.2 200.5 238.2 308.7 516.1 309.9
Egypt 80.4 99.3 103.9 139.2 97.0 117.5
Morocco 11.7 10.5 11.7 151.4 411.6 187.0
Others 73.2 90.7 122.6 18.1 7.5 5.3
L. Southern Africa 267.7 220.2 238.1 221.7 185.0 205.9
South Africa 259.2 194.4 222.6 195.8 172.3 175.0
Others 8.4 25.8 15.5 25.9 12.7 30.9
M. Western Africa 166.2 192.2 230.2 49.3 109.7 99.6
N. Eastern Asia 1,702.6 1,534.0 2,109.5 5,505.5 4,676.8 5,288.5
China 674.1 660.8 1,209.8 3,029.5 2,708.3 3,283.8
Hong Kong 697.2 508.4 551.0 357.0 261.7 324.7
Japan 140.7 126.7 127.0 1,473.5 1,068.7 1,138.7
Republic of Korea 188.5 235.8 219.0 643.7 636.6 536.8
Others 2.1 2.3 2.7 1.9 1.4 4.6
O. South-Central Asia 2,044.2 2,245.5 2,421.7 1,979.5 1,703.7 2,236.7
Afghanistan 1,031.7 975.6 1,204.6 2.2 0.4 3.0
Bangladesh 318.4 404.8 449.7 66.2 70.7 70.6
India 262.9 313.1 259.4 1,442.8 1,032.9 1,061.4
Iran 103.1 187.1 203.8 381.4 506.9 1,017.1
Sri Lanka 205.6 226.8 287.7 62.0 61.0 49.2
Others 122.5 138.2 16.5 24.9 31.8 35.4
P. South Eastern Asia 471.5 535.6 814.2 3,978.4 3,800.0 4,148.8
Indonesia 59.4 50.7 68.5 525.4 459.3 300.2
Malaysia 85.1 118.7 191.3 1,269.5 1,294.5 1,271.0
Singapore 109.2 102.3 228.5 1,694.9 1,571.0 2,124.3
Thailand 67.8 95.9 82.0 408.5 409.2 399.3
Others 150.0 167.9 243.9 80.1 66.0 54.0
Q. Western Asia 3,219.0 3,028.4 2,993.5 11,746.1 10,726.1 11,172.4
Bahrain 80.5 76.3 73.0 139.4 179.5 202.6
Jordan 27.9 26.0 26.6 19.1 11.1 15.5
Kuwait 111.5 115.7 91.2 2,439.3 2,244.2 2,111.2
Saudi Arabia 338.0 414.5 400.0 3,609.7 3,544.5 3,644.5
Turkey 455.3 434.4 471.2 118.5 118.4 159.4
United Arab Emirates 1,722.3 1,398.1 1,475.0 5,129.2 4,399.6 4,781.8
Others 483.5 563.3 456.4 291.0 228.8 257.5
R. Australia & New Zealand 185.5 173.0 187.0 401.4 350.5 465.3
Australia 143.2 133.3 142.0 336.2 286.3 397.2
New Zealand 37.2 35.2 36.7 55.7 50.8 60.7
Others 5.1 4.5 8.2 9.5 13.4 7.5
S. Others 94.2 60.4 192.5 317.4 293.9 257.1
T. Other than Banks 1,944.6 1,234.1 236.4 1,306.7 534.5 (134.0)
Source : Statistics & DWH Department SBP
Balance of Payment and Foreign Trade
119
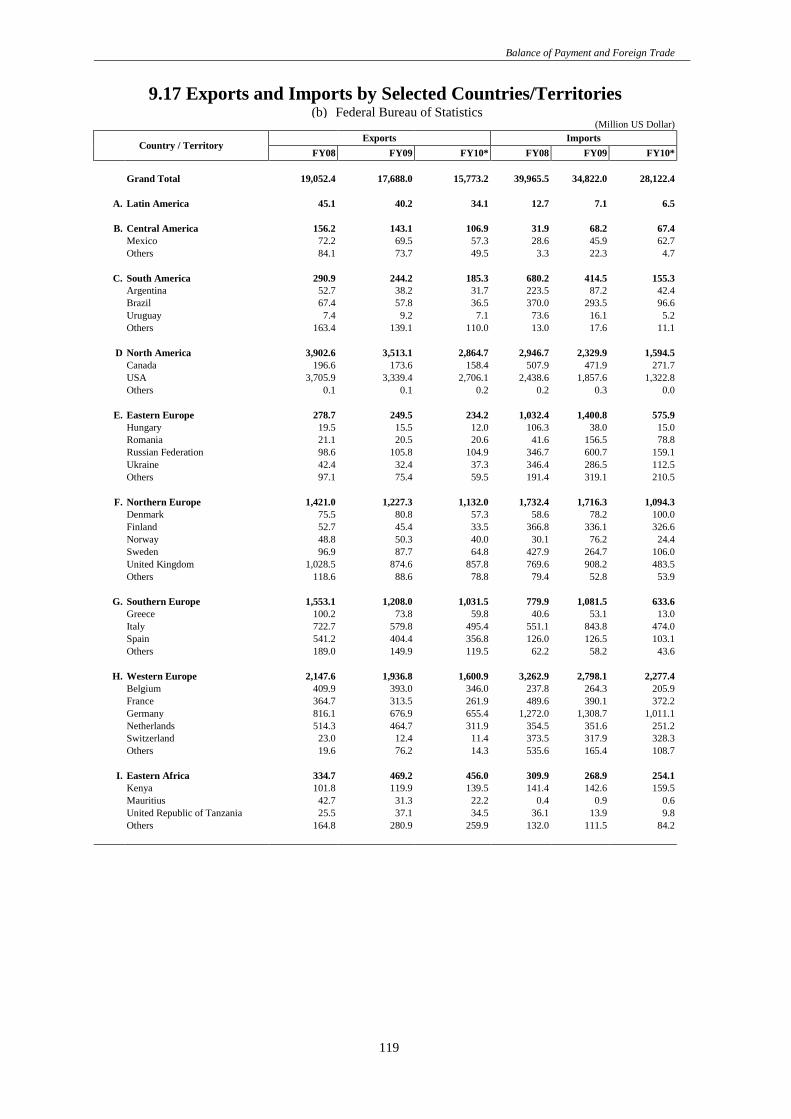
9.17 Exports and Imports by Selected Countries/Territories (b) Federal Bureau of Statistics
(Million US Dollar)
Country / Territory Exports Imports
FY08 FY09 FY10* FY08 FY09 FY10*
Grand Total 19,052.4 17,688.0 15,773.2 39,965.5 34,822.0 28,122.4
A. Latin America 45.1 40.2 34.1 12.7 7.1 6.5
B. Central America 156.2 143.1 106.9 31.9 68.2 67.4
Mexico 72.2 69.5 57.3 28.6 45.9 62.7
Others 84.1 73.7 49.5 3.3 22.3 4.7
C. South America 290.9 244.2 185.3 680.2 414.5 155.3
Argentina 52.7 38.2 31.7 223.5 87.2 42.4
Brazil 67.4 57.8 36.5 370.0 293.5 96.6
Uruguay 7.4 9.2 7.1 73.6 16.1 5.2
Others 163.4 139.1 110.0 13.0 17.6 11.1
D North America 3,902.6 3,513.1 2,864.7 2,946.7 2,329.9 1,594.5
Canada 196.6 173.6 158.4 507.9 471.9 271.7
USA 3,705.9 3,339.4 2,706.1 2,438.6 1,857.6 1,322.8
Others 0.1 0.1 0.2 0.2 0.3 0.0
E. Eastern Europe 278.7 249.5 234.2 1,032.4 1,400.8 575.9
Hungary 19.5 15.5 12.0 106.3 38.0 15.0
Romania 21.1 20.5 20.6 41.6 156.5 78.8
Russian Federation 98.6 105.8 104.9 346.7 600.7 159.1
Ukraine 42.4 32.4 37.3 346.4 286.5 112.5
Others 97.1 75.4 59.5 191.4 319.1 210.5
F. Northern Europe 1,421.0 1,227.3 1,132.0 1,732.4 1,716.3 1,094.3
Denmark 75.5 80.8 57.3 58.6 78.2 100.0
Finland 52.7 45.4 33.5 366.8 336.1 326.6
Norway 48.8 50.3 40.0 30.1 76.2 24.4
Sweden 96.9 87.7 64.8 427.9 264.7 106.0
United Kingdom 1,028.5 874.6 857.8 769.6 908.2 483.5
Others 118.6 88.6 78.8 79.4 52.8 53.9
1
G. Southern Europe 1,553.1 1,208.0 1,031.5 779.9 1,081.5 633.6
Greece 100.2 73.8 59.8 40.6 53.1 13.0
Italy 722.7 579.8 495.4 551.1 843.8 474.0
Spain 541.2 404.4 356.8 126.0 126.5 103.1
Others 189.0 149.9 119.5 62.2 58.2 43.6
H. Western Europe 2,147.6 1,936.8 1,600.9 3,262.9 2,798.1 2,277.4
Belgium 409.9 393.0 346.0 237.8 264.3 205.9
France 364.7 313.5 261.9 489.6 390.1 372.2
Germany 816.1 676.9 655.4 1,272.0 1,308.7 1,011.1
Netherlands 514.3 464.7 311.9 354.5 351.6 251.2
Switzerland 23.0 12.4 11.4 373.5 317.9 328.3
Others 19.6 76.2 14.3 535.6 165.4 108.7
I. Eastern Africa 334.7 469.2 456.0 309.9 268.9 254.1
Kenya 101.8 119.9 139.5 141.4 142.6 159.5
Mauritius 42.7 31.3 22.2 0.4 0.9 0.6
United Republic of Tanzania 25.5 37.1 34.5 36.1 13.9 9.8
Others 164.8 280.9 259.9 132.0 111.5 84.2
SBP Annual Report-Statistical Supplement FY 10
120
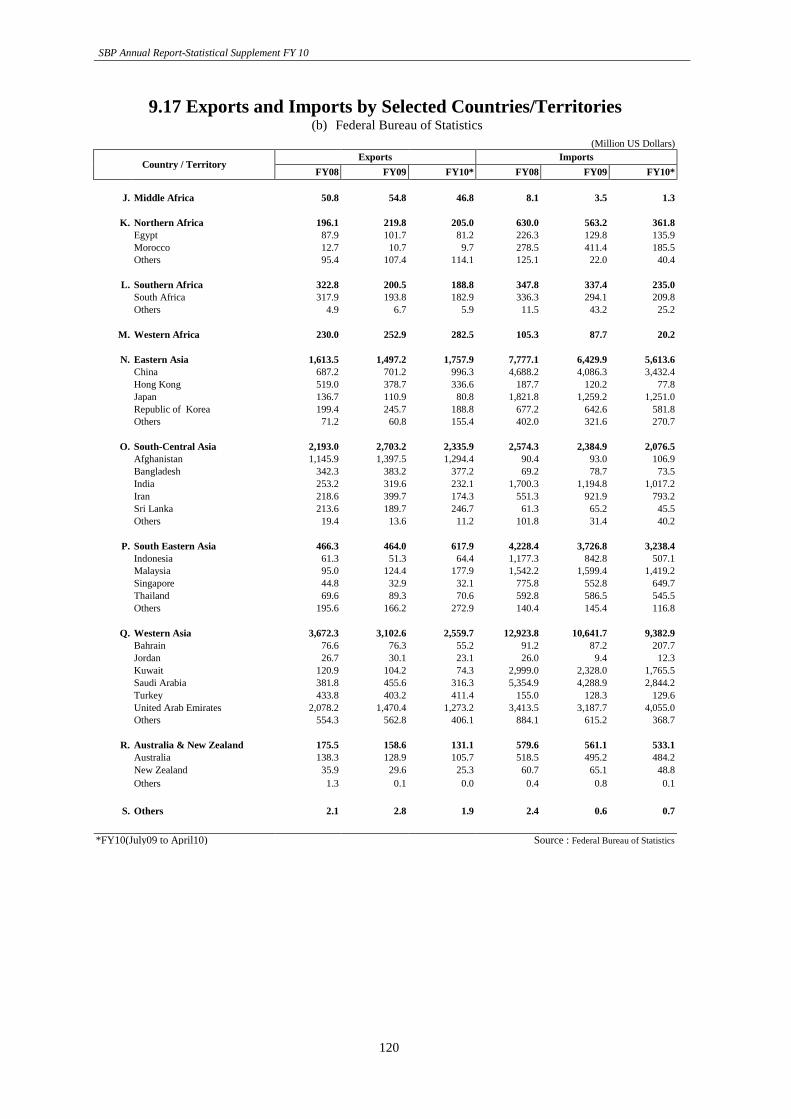
9.17 Exports and Imports by Selected Countries/Territories (b) Federal Bureau of Statistics
(Million US Dollars)
Country / Territory Exports Imports
FY08 FY09 FY10* FY08 FY09 FY10*
J. Middle Africa 50.8 54.8 46.8 8.1 3.5 1.3
K. Northern Africa 196.1 219.8 205.0 630.0 563.2 361.8
Egypt 87.9 101.7 81.2 226.3 129.8 135.9
Morocco 12.7 10.7 9.7 278.5 411.4 185.5
Others 95.4 107.4 114.1 125.1 22.0 40.4
L. Southern Africa 322.8 200.5 188.8 347.8 337.4 235.0
South Africa 317.9 193.8 182.9 336.3 294.1 209.8
Others 4.9 6.7 5.9 11.5 43.2 25.2
M. Western Africa 230.0 252.9 282.5 105.3 87.7 20.2
N. Eastern Asia 1,613.5 1,497.2 1,757.9 7,777.1 6,429.9 5,613.6
China 687.2 701.2 996.3 4,688.2 4,086.3 3,432.4
Hong Kong 519.0 378.7 336.6 187.7 120.2 77.8
Japan 136.7 110.9 80.8 1,821.8 1,259.2 1,251.0
Republic of Korea 199.4 245.7 188.8 677.2 642.6 581.8
Others 71.2 60.8 155.4 402.0 321.6 270.7
O. South-Central Asia 2,193.0 2,703.2 2,335.9 2,574.3 2,384.9 2,076.5
Afghanistan 1,145.9 1,397.5 1,294.4 90.4 93.0 106.9
Bangladesh 342.3 383.2 377.2 69.2 78.7 73.5
India 253.2 319.6 232.1 1,700.3 1,194.8 1,017.2
Iran 218.6 399.7 174.3 551.3 921.9 793.2
Sri Lanka 213.6 189.7 246.7 61.3 65.2 45.5
Others 19.4 13.6 11.2 101.8 31.4 40.2
P. South Eastern Asia 466.3 464.0 617.9 4,228.4 3,726.8 3,238.4
Indonesia 61.3 51.3 64.4 1,177.3 842.8 507.1
Malaysia 95.0 124.4 177.9 1,542.2 1,599.4 1,419.2
Singapore 44.8 32.9 32.1 775.8 552.8 649.7
Thailand 69.6 89.3 70.6 592.8 586.5 545.5
Others 195.6 166.2 272.9 140.4 145.4 116.8
Q. Western Asia 3,672.3 3,102.6 2,559.7 12,923.8 10,641.7 9,382.9
Bahrain 76.6 76.3 55.2 91.2 87.2 207.7
Jordan 26.7 30.1 23.1 26.0 9.4 12.3
Kuwait 120.9 104.2 74.3 2,999.0 2,328.0 1,765.5
Saudi Arabia 381.8 455.6 316.3 5,354.9 4,288.9 2,844.2
Turkey 433.8 403.2 411.4 155.0 128.3 129.6
United Arab Emirates 2,078.2 1,470.4 1,273.2 3,413.5 3,187.7 4,055.0
Others 554.3 562.8 406.1 884.1 615.2 368.7
R. Australia & New Zealand 175.5 158.6 131.1 579.6 561.1 533.1
Australia 138.3 128.9 105.7 518.5 495.2 484.2
New Zealand 35.9 29.6 25.3 60.7 65.1 48.8
Others 1.3 0.1 0.0 0.4 0.8 0.1
S. Others 2.1 2.8 1.9 2.4 0.6 0.7
*FY10(July09 to April10) Source : Federal Bureau of Statistics