appendix 9.1 - tamala park regional council
TRANSCRIPT

Appendix 9.1
Appendix page 1

P.A
.W.
P.A
.W.
P.A
.W.
P.A
.W.
CO
NN
OLLY D
RIVE
PublicOpenSpace
POSPOSPOSPOSPOS
Public OpenSpace & Drainage
STAGE 3
STAGE 1
STAGE 4
STAGE 6
STAGE 2
STAGE 5
STAGE 7
STAGE 8
STAGE 16
Public OpenSpace
POS
POS
STAGE 9
STAGE 10
STAGE 11
STAGE 13
STAGE 12
STAGE 14
STAGE 15
STAGE 17
STAGE 18
STAGE 19
STAGE 23STAGE 22
STAGE 24
STAGE 20
STAGE 21
BiodiversityConservation Area
POS
POS
POS
WESTSTAGE 3
WESTSTAGE 1
WESTSTAGE 2
plan no: 2228-242-01scale: 1:5000 @ A3
date: 31.10.2013This plan is current at the revised date & subject to approval, survey & engineering detail. This plan remains the property of CLE ©
T:(+618) 9382 1233 F:(+618) 9382 1127
www.cleplan.com.au
LEGEND
Subdivision Application Area
Staging Boundary*
Complete (298 lots)
Under Construction (62 lots)
2014 (193 lots)
2015 (359 lots)
*Staging boundaries are preliminary onlyand are subject to change.
All road carriageway detail depicted on this Plan including pavements, road treatments,medians and parking are for illustrative purposes only and are subject to final engineeringdesign and any relevant approvals. The detail reflects the intent of the road networkstandards preferred for this subdivision.
The lot yield within each western stage is based on a mathematical calculation. A 5%contingency has been applied to allow for POS contribution, engineering andenvironmental constraints etc. A refined yield can be provided following detailed design.
Appendix 9.1
Appendix page 2

Appendix 9.2
Appendix page 3

TAMALA PARK REGIONAL COUNCIL
STATEMENT OF FINANCIAL ACTIVITY
FOR THE PERIOD 1 JULY 2013 TO 31 JANUARY 2014
VariancesNOTE 31 Jan 31 Jan 2013/2014 Budget to
2014 2014 Adopted Actual
Operating Actual Y‐T‐D Budget Budget Y‐T‐D
$ $ $ %
Revenues 1,2
Interest Earnings 545,952 426,656 711,090 27.96%
Other Revenue 4,635 0 1,890 0.00%
550,587 426,656 712,980 29.05%
Expenses 1,2
Employee Costs (310,399) (391,029) (679,975) (20.62%)
Materials and Contracts
‐ Materials and Contracts Other (86,752) (129,819) (348,450) (33.17%)
‐ Professional/Consultant Fees (30,057) (71,250) 0 (57.81%)
Depreciation 0 (11,678) (20,489) (100.00%)
Utilities 0 0 (10,000) 0.00%
Insurance (23,848) (11,900) (11,900) 100.40%
Other Expenditure (46,254) (86,776) (161,050) (46.70%)
(497,310) (702,452) (1,231,864) (29.20%)
Adjustments for Non‐Cash
(Revenue) and Expenditure
Please refer to Compilation Report 2
(Revenue) and Expenditure
Depreciation on Assets 0 11,678 20,489 (100.00%)
Capital Revenue and (Expenditure)
Furniture and Equipment 3 (4,970) (4,970) (6,000) 0.00%
LESS MEMBERS EQUITY
Development of Land for Resale
Income Sale of Lots ‐ Subdivision 19,972,632 23,900,549 45,640,484 (16.43%)
Income Other Subdivisions 14,029 370,037 634,349 (96.21%)
Development Costs (14,889,043) (26,716,853) (45,800,319) (44.27%)
Contribution Refund (220,404) (233,333) (400,000) (5.54%)
Contribution Returned (3,999,996) (5,833,333) (10,000,000) (31.43%)
Change in Contributed Equity 6 877,218 (8,512,933) (9,925,486) (110.30%)
ADD Net Current Assets July 1 B/Fwd 7 26,068,417 26,069,508 26,069,508 (0.00%)
Net Current Assets Year to Date 7 26,993,942 17,287,487 15,639,627
This statement is to be read in conjunction with the accompanying notes.
Please refer to Compilation Report 2
Appendix 9.2
Appendix page 4

TAMALA PARK REGIONAL COUNCIL
NOTES TO AND FORMING PART OF THE STATEMENT OF FINANCIAL ACTIVITY
FOR THE PERIOD 1 JULY 2013 TO 31 JANUARY 2014
1. SIGNIFICANT ACCOUNTING POLICIES
The significant accounting policies which have been adopted in the preparation of this statement of
financial activity are:
(a) Basis of Accounting
This statement is a special purpose financial report, prepared in accordance with applicable Australian
Australian Accounting Standards, other mandatory professional reporting requirements and the Local
Government Act 1995 (as amended) and accompanying regulations (as amended).
(b) The Local Government Reporting Entity
All Funds through which the Council controls resources to carry on its functions have been
included in this statement.
In the process of reporting on the local government as a single unit, all transactions and balances
between those funds (for example, loans and transfers between Funds) have been eliminated.
The Council does not hold any monies in trust.
(c) Rounding Off Figures
All figures shown in this statement, other than a rate in the dollar, are rounded to the nearest dollar.
Please refer to Compilation Report 3
(d) Rates, Grants, Donations and Other Contributions
Rates, grants, donations and other contributions are recognised as revenues when the local
government obtains control over the assets comprising the contributions. Control over assets
acquired from rates is obtained at the commencement of the rating period or, where earlier, upon
receipt of the rates.
(e) Goods and Services Tax
In accordance with recommended practice, revenues, expenses and assets capitalised are stated net
of any GST recoverable. Receivables and payables are stated inclusive of applicable GST.
(f) Cash and Cash Equivalents
Cash and cash equivalents comprise cash at bank and in hand and short‐term deposits that are
readily convertible to known amounts of cash and which are subject to an insignificant risk of
changes in value.
For the purposes of the Cash Flow Statement, cash and cash equivalents consist of cash and
cash equivalents as defined above, net of outstanding bank overdrafts. Bank overdrafts are
included as short‐term borrowings in current liabilities.
Please refer to Compilation Report 3
Appendix 9.2
Appendix page 5

TAMALA PARK REGIONAL COUNCIL
NOTES TO AND FORMING PART OF THE STATEMENT OF FINANCIAL ACTIVITY
FOR THE PERIOD 1 JULY 2013 TO 31 JANUARY 2014
1. SIGNIFICANT ACCOUNTING POLICIES (Continued)
(g) Trade and Other Receivables
Trade Receiveables, which generally have 30‐90 day terms, are recognised initially at fair value and
subsequently measured at amortised cost using the effective interest rate method, less any allowance for
uncollectible amounts.
Collectibilty of trade receiveables is viewed on an ongoing basis. Debts that are known to be
uncollectible are written off when identified. An allowance for doubtful debts is raised when there is
object evidence that they will not be collectible.
(h) Inventories
GeneralInventories are valued at the lower of cost and net realisable value. Net realisablevalue is the estimated selling price in the ordinary course of business less the estimated costs of completion and the estimated costs necessary to make the sale.
Inventories held from trading are classified as current even if not expected to be realised in the next 12 months.
Land Held for ResaleLand purchased for development and/or resale is valued at the lower of cost and net realisable value. Cost includes the cost of acquisition, development and interest incurred on the financing of that land during its development. Interest and holding charges incurred after development is complete are recognised as
Please refer to Compilation Report 4
(i) Fixed AssetsAll assets are initially recognised at cost. Cost is determined as the fair value of the assets given asconsideration plus costs incidental to the acquisition. For assets acquired at no cost or for nominalconsideration, cost is determined as fair value at the date of acquisition. The cost of non‐current assetsconstructed by the Municipality includes the cost of all materials used in the construction, direct labouron the project and an appropriate proportion of variable and fixed overhead.
Certain asset classes may be revalued on a regular basis such that the carrying values are not materiallydifferent from fair value. Assets carried at fair value are to be revalued with sufficient regularity to ensurethe carrying amount does not differ materially from that determined using fair value at reporting date.
Effective from 1 July 2012, the Local Government (Financial Management) regulations were amendedand the measurement of non‐current assets at Fair Value became mandatory.
The regulations allow for the phasing in of fair value in relation to fixed assets over three years as follows: Plant and Equipment by June 30 2013 Plant and Equipment, Land and Buildings and Infrastructure by 30 June 2014, and All Assets by 30 June 2015.
Land purchased for development and/or resale is valued at the lower of cost and net realisable value. Cost includes the cost of acquisition, development and interest incurred on the financing of that land during its development. Interest and holding charges incurred after development is complete are recognised as expenses.
Revenue arising from the sale of property is recognised in the operating statement as at the time of signing a binding contract of sale.
Land held for resale is classified as current except where it is held as non-current based on Council’s intentions to release for sale.
Please refer to Compilation Report 4
Appendix 9.2
Appendix page 6

TAMALA PARK REGIONAL COUNCIL
NOTES TO AND FORMING PART OF THE STATEMENT OF FINANCIAL ACTIVITY
FOR THE PERIOD 1 JULY 2013 TO 31 JANUARY 2014
1. SIGNIFICANT ACCOUNTING POLICIES (Continued)
(j) Depreciation of Non‐Current AssetsAll non‐current assets having a limited useful life are systematically depreciated over their usefullives in a manner which reflects the consumption of the future economic benefits embodied inthose assets.
Depreciation is recognised on a straight‐line basis, using rates which are reviewed each reportingperiod. Major depreciation periods are:
Computer Equipment 4 yearsPrinters, Photocopiers and Scanners 5 yearsFurniture and Equipment 4 to 10 yearsFloor coverings 8 yearsPhones and Faxes 6 to 7 yearsPlant and Equipment 5 to 15 yearsInfrastructure 30 to 50 years
(k) Impairment
In accordance with Australian Accounting Standards the Council's assets, other than inventories, are
assessed at each reporting date to determine whether there is any indication they may be impaired.
Where such an indication exists, an estimate of the recoverable amount of the asset is made
in accordance with AASB 136 "Impairment of Assets" and appropriate adjustments made.
Please refer to Compilation Report 5
An impairment loss is recognised whenever the carrying amount of an asset or its cash‐generating
unit exceeds its recoverable amount. Impairment losses are recognised in the Income Statement.
For non‐cash generating assets such as roads, drains, public buildings and the like, value in use is
represented by the depreciated replacement cost of the asset.
At the time of preparing this report, it is not possible to estimate the amount of impairment losses
(if any) as at 30 June 2013.
In any event, an impairment loss is a non‐cash transaction and consequently, has no impact on
the Monthly Statement of Financial Position from a budgetary perspective.
(l) Trade and Other Payables
Trade and other payables are carried at amortised cost. They represent liabilities for goods and services
provided to the Municipality prior to the end of the financial year that are unpaid and arise when the
Municipality becomes obliged to make future payments in respect of the purchase of these goods and
services. The amounts are unsecured and are usually paid within 30 days of recognition.
(m) Employee Benefits
The provisions for employee benefits relates to amounts expected to be paid for long service
leave, annual leave, wages and salaries and are calculated as follows:
(i) Wages, Salaries, Annual Leave and Long Service Leave (Short‐term Benefits)
The provision for employees’ benefits to wages, salaries, annual leave and long service leave
expected to be settled within 12 months represents the amount the municipality has a present
obligation to pay resulting from employees services provided to balance date. The provision has
b l l d i l b d i h C ilbeen calculated at nominal amounts based on remuneration rates the Council expects to payPlease refer to Compilation Report 5
Appendix 9.2
Appendix page 7

and includes related on‐costs.
Please refer to Compilation Report 6Please refer to Compilation Report 6
Appendix 9.2
Appendix page 8

TAMALA PARK REGIONAL COUNCIL
NOTES TO AND FORMING PART OF THE STATEMENT OF FINANCIAL ACTIVITY
FOR THE PERIOD 1 JULY 2013 TO 31 JANUARY 2014
1. SIGNIFICANT ACCOUNTING POLICIES (Continued)
(m) Employee Benefits (Continued)
(ii) Annual Leave and Long Service Leave (Long‐term Benefits)
(n) Interest‐bearing Loans and Borrowings
All loans and borrowings are initially recognised at the fair value of the consideration received less
directly attributable transaction costs.
After initial recognition, interest‐bearing loans and borrowings are subsequently measured at amortised
cost using the effective interest method. Fees paid on the establishment of loan facilities that are
yield related are included as part of the carrying amount of the loans and borrowings.
Borrowings are classified as current liabilities unless the Council has an unconditional right to defer
The liability for long service leave is recognised in the provision for employee benefits and measured as the present value of expected future payments to be made in respect of services provided by employees up to the reporting date using the projected unit credit method. Consideration is given to expected future wage and salary levels, experience of employee departures and periods of service. Expected future payments are discounted using market yields at the reporting date on national government bonds with terms to maturity and currency that match as closely as possible, the estimated future cash outflows. Where Council does not have the unconditional right to defer settlement beyond 12 months, the liability is recognised as a current liability.
Please refer to Compilation Report 7
Borrowings are classified as current liabilities unless the Council has an unconditional right to defer
settlement of the liability for at least 12 months after the balance sheet date.
Borrowing Costs
Borrowing costs are recognised as an expense when incurred except where they are directly attributable
to the acquisition, construction or production of a qualifying asset. Where this is the case, they are
capitalised as part of the cost of the particular asset.
(o) Provisions
(p) Current and Non‐Current Classification
In the determination of whether an asset or liability is current or non-current, consideration is given to the time when each asset or liability is expected to be settled. The asset or liability is classified as current if it is expected to be settled within the next 12 months, being the Council’s operational cycle. In the case of liabilities where Council does not have the unconditional right to defer settlement beyond 12 months, such as vested long service leave, the liability is classified as current even if not expected to be settled within the next 12 months. Inventories held for trading are classified as current even if not expected to be realised in the next 12 months except for land held for resale where it is held as non-current based on
Provisions are recognised when: The council has a present legal or constructive obligation as a result of past events; it is more likely than not that an outflow of resources will be required to settle the obligation; and the amount has been reliably estimated. Provisions are not recognised for future operating losses.
Where there are a number of similar obligations, the likelihood that an outflow will be required in settlement is determined by considering the class of obligations as a whole. A provision is recognised even if the likelihood of an outflow with respect to any one item included in the same class of obligations may be small.
Please refer to Compilation Report 7
Appendix 9.2
Appendix page 9

TAMALA PARK REGIONAL COUNCIL
NOTES TO AND FORMING PART OF THE STATEMENT OF FINANCIAL ACTIVITY
FOR THE PERIOD 1 JULY 2013 TO 31 JANUARY 2014
2. STATEMENT OF OBJECTIVE
The Regional Council has a specific regional purpose which is:
a) To undertake, in accordance with the objectives, the rezoning, subdivision, development
marketing and sale of land comprising the developable portion of Lot 118 Mindarie
(now Lot 9504); and
b) To carry out and do all other acts and things which are reasonably necessary for the bringing
into effect of the matters referred to in paragraph a).
The objectives of the Regional Council are:
1. To develop and improve the value of the land;
2. To maximise, and with prudent risk parameters, the financial return to the Participants;
3. To balance economic, social and environmental issues; and
4. To produce a quality development demonstrating the best urban design and
development practice.
3. ACQUISITION OF ASSETS
31 Jan Adopted
The following assets are budgeted to be acquired 2014 2013/14
Please refer to Compilation Report 8
The following assets are budgeted to be acquired 2014 2013/14
during the year: Actual Budget
$ $
By Program
Other Property and Services
Photocopier 4,970 4,970
Other Office Equipment 0 1,030
4,970 6,000
By Class
Furniture and Equipment 4,970 6,000
4,970 6,000
4. DISPOSALS OF ASSETS
No assets have been disposed of during the period under review.
Please refer to Compilation Report 8
Appendix 9.2
Appendix page 10

TAMALA PARK REGIONAL COUNCIL
STATEMENT OF FINANCIAL ACTIVITY
FOR THE PERIOD 1 JULY 2013 TO 28 FEBRUARY 2014
VariancesNOTE 28 Feb 28 Feb 2013/2014 Budget to
2014 2014 Adopted Actual
Operating Actual Y‐T‐D Budget Budget Y‐T‐D
$ $ $ %
Revenues 1,2
Interest Earnings 627,670 455,100 711,090 37.92%
Other Revenue 4,635 0 1,890 0.00%
632,305 455,100 712,980 38.94%
Expenses 1,2
Employee Costs (349,968) (444,005) (679,975) (21.18%)
Materials and Contracts
‐ Materials and Contracts Other (75,713) (129,819) (348,450) (41.68%)
‐ Professional/Consultant Fees (46,876) (71,250) 0 (34.21%)
Depreciation 0 (13,317) (20,489) (100.00%)
Utilities 0 0 (10,000) 0.00%
Insurance (23,848) (11,900) (11,900) 100.40%
Other Expenditure (82,683) (91,265) (161,050) (9.40%)
(579,088) (761,556) (1,231,864) (23.96%)
Adjustments for Non‐Cash
(Revenue) and Expenditure
Please refer to Compilation Report 2
(Revenue) and Expenditure
Depreciation on Assets 0 13,317 20,489 (100.00%)
Capital Revenue and (Expenditure)
Furniture and Equipment 3 (6,968) (6,000) (6,000) 16.13%
LESS MEMBERS EQUITY
Development of Land for Resale
Income Sale of Lots ‐ Subdivision 30,794,348 24,359,755 45,640,484 26.41%
Income Other Subdivisions 14,029 370,037 634,349 (96.21%)
Development Costs (18,627,942) (30,533,546) (45,800,319) (38.99%)
Contribution Refund (220,404) (266,667) (400,000) (17.35%)
Contribution Returned (3,999,996) (6,666,667) (10,000,000) (40.00%)
Change in Contributed Equity 6 7,960,035 (12,737,087) (9,925,486) (162.49%)
ADD Net Current Assets July 1 B/Fwd 7 26,068,417 26,069,508 26,069,508 (0.00%)
Net Current Assets Year to Date 7 34,074,701 13,033,282 15,639,627
This statement is to be read in conjunction with the accompanying notes.
Please refer to Compilation Report 2
Appendix 9.2
Appendix page 11

TAMALA PARK REGIONAL COUNCIL
NOTES TO AND FORMING PART OF THE STATEMENT OF FINANCIAL ACTIVITY
FOR THE PERIOD 1 JULY 2013 TO 28 FEBRUARY 2014
1. SIGNIFICANT ACCOUNTING POLICIES
The significant accounting policies which have been adopted in the preparation of this statement of
financial activity are:
(a) Basis of Accounting
This statement is a special purpose financial report, prepared in accordance with applicable Australian
Australian Accounting Standards, other mandatory professional reporting requirements and the Local
Government Act 1995 (as amended) and accompanying regulations (as amended).
(b) The Local Government Reporting Entity
All Funds through which the Council controls resources to carry on its functions have been
included in this statement.
In the process of reporting on the local government as a single unit, all transactions and balances
between those funds (for example, loans and transfers between Funds) have been eliminated.
The Council does not hold any monies in trust.
(c) Rounding Off Figures
All figures shown in this statement, other than a rate in the dollar, are rounded to the nearest dollar.
Please refer to Compilation Report 3
(d) Rates, Grants, Donations and Other Contributions
Rates, grants, donations and other contributions are recognised as revenues when the local
government obtains control over the assets comprising the contributions. Control over assets
acquired from rates is obtained at the commencement of the rating period or, where earlier, upon
receipt of the rates.
(e) Goods and Services Tax
In accordance with recommended practice, revenues, expenses and assets capitalised are stated net
of any GST recoverable. Receivables and payables are stated inclusive of applicable GST.
(f) Cash and Cash Equivalents
Cash and cash equivalents comprise cash at bank and in hand and short‐term deposits that are
readily convertible to known amounts of cash and which are subject to an insignificant risk of
changes in value.
For the purposes of the Cash Flow Statement, cash and cash equivalents consist of cash and
cash equivalents as defined above, net of outstanding bank overdrafts. Bank overdrafts are
included as short‐term borrowings in current liabilities.
Please refer to Compilation Report 3
Appendix 9.2
Appendix page 12

TAMALA PARK REGIONAL COUNCIL
NOTES TO AND FORMING PART OF THE STATEMENT OF FINANCIAL ACTIVITY
FOR THE PERIOD 1 JULY 2013 TO 28 FEBRUARY 2014
1. SIGNIFICANT ACCOUNTING POLICIES (Continued)
(g) Trade and Other Receivables
Trade Receiveables, which generally have 30‐90 day terms, are recognised initially at fair value and
subsequently measured at amortised cost using the effective interest rate method, less any allowance for
uncollectible amounts.
Collectibilty of trade receiveables is viewed on an ongoing basis. Debts that are known to be
uncollectible are written off when identified. An allowance for doubtful debts is raised when there is
object evidence that they will not be collectible.
(h) Inventories
GeneralInventories are valued at the lower of cost and net realisable value. Net realisablevalue is the estimated selling price in the ordinary course of business less the estimated costs of completion and the estimated costs necessary to make the sale.
Inventories held from trading are classified as current even if not expected to be realised in the next 12 months.
Land Held for ResaleLand purchased for development and/or resale is valued at the lower of cost and net realisable value. Cost includes the cost of acquisition, development and interest incurred on the financing of that land during its development. Interest and holding charges incurred after development is complete are recognised as
Please refer to Compilation Report 4
(i) Fixed AssetsAll assets are initially recognised at cost. Cost is determined as the fair value of the assets given asconsideration plus costs incidental to the acquisition. For assets acquired at no cost or for nominalconsideration, cost is determined as fair value at the date of acquisition. The cost of non‐current assetsconstructed by the Municipality includes the cost of all materials used in the construction, direct labouron the project and an appropriate proportion of variable and fixed overhead.
Certain asset classes may be revalued on a regular basis such that the carrying values are not materiallydifferent from fair value. Assets carried at fair value are to be revalued with sufficient regularity to ensurethe carrying amount does not differ materially from that determined using fair value at reporting date.
Effective from 1 July 2012, the Local Government (Financial Management) regulations were amendedand the measurement of non‐current assets at Fair Value became mandatory.
The regulations allow for the phasing in of fair value in relation to fixed assets over three years as follows: Plant and Equipment by June 30 2013 Plant and Equipment, Land and Buildings and Infrastructure by 30 June 2014, and All Assets by 30 June 2015.
Land purchased for development and/or resale is valued at the lower of cost and net realisable value. Cost includes the cost of acquisition, development and interest incurred on the financing of that land during its development. Interest and holding charges incurred after development is complete are recognised as expenses.
Revenue arising from the sale of property is recognised in the operating statement as at the time of signing a binding contract of sale.
Land held for resale is classified as current except where it is held as non-current based on Council’s intentions to release for sale.
Please refer to Compilation Report 4
Appendix 9.2
Appendix page 13

TAMALA PARK REGIONAL COUNCIL
NOTES TO AND FORMING PART OF THE STATEMENT OF FINANCIAL ACTIVITY
FOR THE PERIOD 1 JULY 2013 TO 28 FEBRUARY 2014
1. SIGNIFICANT ACCOUNTING POLICIES (Continued)
(j) Depreciation of Non‐Current AssetsAll non‐current assets having a limited useful life are systematically depreciated over their usefullives in a manner which reflects the consumption of the future economic benefits embodied inthose assets.
Depreciation is recognised on a straight‐line basis, using rates which are reviewed each reportingperiod. Major depreciation periods are:
Computer Equipment 4 yearsPrinters, Photocopiers and Scanners 5 yearsFurniture and Equipment 4 to 10 yearsFloor coverings 8 yearsPhones and Faxes 6 to 7 yearsPlant and Equipment 5 to 15 yearsInfrastructure 30 to 50 years
(k) Impairment
In accordance with Australian Accounting Standards the Council's assets, other than inventories, are
assessed at each reporting date to determine whether there is any indication they may be impaired.
Where such an indication exists, an estimate of the recoverable amount of the asset is made
in accordance with AASB 136 "Impairment of Assets" and appropriate adjustments made.
Please refer to Compilation Report 5
An impairment loss is recognised whenever the carrying amount of an asset or its cash‐generating
unit exceeds its recoverable amount. Impairment losses are recognised in the Income Statement.
For non‐cash generating assets such as roads, drains, public buildings and the like, value in use is
represented by the depreciated replacement cost of the asset.
At the time of preparing this report, it is not possible to estimate the amount of impairment losses
(if any) as at 30 June 2013.
In any event, an impairment loss is a non‐cash transaction and consequently, has no impact on
the Monthly Statement of Financial Position from a budgetary perspective.
(l) Trade and Other Payables
Trade and other payables are carried at amortised cost. They represent liabilities for goods and services
provided to the Municipality prior to the end of the financial year that are unpaid and arise when the
Municipality becomes obliged to make future payments in respect of the purchase of these goods and
services. The amounts are unsecured and are usually paid within 30 days of recognition.
(m) Employee Benefits
The provisions for employee benefits relates to amounts expected to be paid for long service
leave, annual leave, wages and salaries and are calculated as follows:
(i) Wages, Salaries, Annual Leave and Long Service Leave (Short‐term Benefits)
The provision for employees’ benefits to wages, salaries, annual leave and long service leave
expected to be settled within 12 months represents the amount the municipality has a present
obligation to pay resulting from employees services provided to balance date. The provision has
b l l d i l b d i h C ilbeen calculated at nominal amounts based on remuneration rates the Council expects to payPlease refer to Compilation Report 5
Appendix 9.2
Appendix page 14

and includes related on‐costs.
Please refer to Compilation Report 6Please refer to Compilation Report 6
Appendix 9.2
Appendix page 15

TAMALA PARK REGIONAL COUNCIL
NOTES TO AND FORMING PART OF THE STATEMENT OF FINANCIAL ACTIVITY
FOR THE PERIOD 1 JULY 2013 TO 28 FEBRUARY 2014
1. SIGNIFICANT ACCOUNTING POLICIES (Continued)
(m) Employee Benefits (Continued)
(ii) Annual Leave and Long Service Leave (Long‐term Benefits)
(n) Interest‐bearing Loans and Borrowings
All loans and borrowings are initially recognised at the fair value of the consideration received less
directly attributable transaction costs.
After initial recognition, interest‐bearing loans and borrowings are subsequently measured at amortised
cost using the effective interest method. Fees paid on the establishment of loan facilities that are
yield related are included as part of the carrying amount of the loans and borrowings.
Borrowings are classified as current liabilities unless the Council has an unconditional right to defer
The liability for long service leave is recognised in the provision for employee benefits and measured as the present value of expected future payments to be made in respect of services provided by employees up to the reporting date using the projected unit credit method. Consideration is given to expected future wage and salary levels, experience of employee departures and periods of service. Expected future payments are discounted using market yields at the reporting date on national government bonds with terms to maturity and currency that match as closely as possible, the estimated future cash outflows. Where Council does not have the unconditional right to defer settlement beyond 12 months, the liability is recognised as a current liability.
Please refer to Compilation Report 7
Borrowings are classified as current liabilities unless the Council has an unconditional right to defer
settlement of the liability for at least 12 months after the balance sheet date.
Borrowing Costs
Borrowing costs are recognised as an expense when incurred except where they are directly attributable
to the acquisition, construction or production of a qualifying asset. Where this is the case, they are
capitalised as part of the cost of the particular asset.
(o) Provisions
(p) Current and Non‐Current Classification
In the determination of whether an asset or liability is current or non-current, consideration is given to the time when each asset or liability is expected to be settled. The asset or liability is classified as current if it is expected to be settled within the next 12 months, being the Council’s operational cycle. In the case of liabilities where Council does not have the unconditional right to defer settlement beyond 12 months, such as vested long service leave, the liability is classified as current even if not expected to be settled within the next 12 months. Inventories held for trading are classified as current even if not expected to be realised in the next 12 months except for land held for resale where it is held as non-current based on
Provisions are recognised when: The council has a present legal or constructive obligation as a result of past events; it is more likely than not that an outflow of resources will be required to settle the obligation; and the amount has been reliably estimated. Provisions are not recognised for future operating losses.
Where there are a number of similar obligations, the likelihood that an outflow will be required in settlement is determined by considering the class of obligations as a whole. A provision is recognised even if the likelihood of an outflow with respect to any one item included in the same class of obligations may be small.
Please refer to Compilation Report 7
Appendix 9.2
Appendix page 16

TAMALA PARK REGIONAL COUNCIL
NOTES TO AND FORMING PART OF THE STATEMENT OF FINANCIAL ACTIVITY
FOR THE PERIOD 1 JULY 2013 TO 28 FEBRUARY 2014
2. STATEMENT OF OBJECTIVE
The Regional Council has a specific regional purpose which is:
a) To undertake, in accordance with the objectives, the rezoning, subdivision, development
marketing and sale of land comprising the developable portion of Lot 118 Mindarie
(now Lot 9504); and
b) To carry out and do all other acts and things which are reasonably necessary for the bringing
into effect of the matters referred to in paragraph a).
The objectives of the Regional Council are:
1. To develop and improve the value of the land;
2. To maximise, and with prudent risk parameters, the financial return to the Participants;
3. To balance economic, social and environmental issues; and
4. To produce a quality development demonstrating the best urban design and
development practice.
3. ACQUISITION OF ASSETS
28 Feb Adopted
The following assets are budgeted to be acquired 2014 2013/14
Please refer to Compilation Report 8
The following assets are budgeted to be acquired 2014 2013/14
during the year: Actual Budget
$ $
By Program
Other Property and Services
Photocopier 4,970 4,970
Other Office Equipment 1,998 1,030
6,968 6,000
By Class
Furniture and Equipment 6,968 6,000
6,968 6,000
4. DISPOSALS OF ASSETS
No assets have been disposed of during the period under review.
Please refer to Compilation Report 8
Appendix 9.2
Appendix page 17

Appendix 9.3
Appendix page 18

Tamala Park Regional Council
Cheque Detail February 2014
Type Num Date Name Description Original Amount
Bill Pmt -Cheque CH-200363 28/02/2014 Davidson, Janet Elected member allowance Nov 2013 to Jan 2014 -2,500.00
Bill Chq-200363 28/02/2014 Elected member allowance Nov 2013 to Jan 2014 2,500.00
2,500.00
TOTAL $2,500.00
Appendix 9.3
Appendix page 19

Tamala Park Regional Council
Summary Payment List February 2014
Date Num Name Description Amount
03/02/2014 Feb Charges Westpac Bank Bank charges Cheque AC - February 2014 -48.35
03/02/2014 ET-2522 B Bhabra Investment Trust Lot 173 (4th instalment over 3 year period) -2,887.50
03/02/2014 ET-2523 James Paxman & Melissa Wieloch Lot 168 (4th instalment over 3 year period) -3,281.25
03/02/2014 ET-2524 Steel Test Pty Ltd Lot 41 (4th instalment over 3 year period) -2,887.50
05/02/2014 ET-2516 Australian Super VvS Superannuation for 26/12/13 - 22/01/14 -298.45
06/02/2014 ET-2517 Employee Costs Wages for period 23/01/14 - 05/02/14 -13,246.63
07/02/2014 ET-2506 LGIS Workcare Adjusted contribution for period 30/06/12 - 30/06/13 -1,006.72
07/02/2014 ET-2525 Atco Gas Relocate PVC at Marmion Ave (Final milestone) -37,967.60
07/02/2014 ET-2526 Cedar Homes Lease of Sales Unit 3 - Lot 1 McAllister Bvd (Feb 14) -1,100.00
07/02/2014 ET-2527 Emerge Associates Invoices 11024, 11025, 10608, 10934 & 11124 -16,500.00
07/02/2014 ET-2528 Ertech Marmion Ave Intersection Civil Works -601,375.46
07/02/2014 ET-2529 Homebuyers Centre Lot 74 Waste management rebate -990.00
07/02/2014 ET-2530 Imagesource Master Plan on Canvas -676.13
07/02/2014 ET-2531 LD Total Bore Works Stage 7 - Dec 2013 -41,609.30
07/02/2014 ET-2532 McMullen Nolan Surveyors Stage 9 Basic items & additional items -3,135.00
07/02/2014 ET-2533 R J Vincent & Co Civil works progress payments -924,480.09
07/02/2014 ET-2534 Sally Brothers Interior Design Sofa for Catalina display home -1,600.00
07/02/2014 ET-2535 Treacy Fencing Stage 4 Fencing - Lot 203 -3,463.02
07/02/2014 ET-2536 WALGA Invoices 6516-6518 -1,168.78
07/02/2014 ET-2537 Employee Costs Superannuation for period 23/01/14 - 05/02/14 -1,482.40
07/02/2014 ET-2587 City of Wanneroo - Supplier GST owing December 2013 -2,147.12
13/02/2014 ET-2540 Westpac Bank Payment CEO & EA credit cards February 2014 -1,923.74
14/02/2014 Bond Refund City of Wanneroo - Supplier Stage 2 Bond Refund 12,464.79
18/02/2014 ET-2541 Australian Taxation Office IAS payment January 2014 -13,950.00
19/02/2014 ET-2588 City of Joondalup - Supplier GST Oct & Dec 2013 -4,516.97
19/02/2014 ET-2589 City of Wanneroo - Supplier GST owing November 2013 -25,982.38
20/02/2014 ET-2558 Employee Costs Wages for period 06/02/14-19/02/14 -9,601.80
20/02/2014 ET-2542 Action Couriers Postage, Courier & Freight - 29/01/14 - 08/02/14 -157.27
20/02/2014 ET-2543 Allion Legal Easements Stage 7 -1,794.96
20/02/2014 ET-2544 Burgess Rawson Invoices 36743-60 & 36781-60 -1,925.00
20/02/2014 ET-2545 Cabcharge Account fee Jan 2014 -6.00
20/02/2014 ET-2546 Chappell Lambert Everett Invoices 4932 & 4933 -16,737.11
20/02/2014 ET-2547 Cossill & Webley Invoices 14686, 14771, 14769, 14768, 14765, 14763 -107,832.87
20/02/2014 ET-2548 DAH Properties Display home - Lot 166 -13,000.00
20/02/2014 ET-2549 Docushred Security Bin -51.70
20/02/2014 ET-2550 Driving Force Cleaning Services Sales office cleaning Jan 2014 -180.00
20/02/2014 ET-2551 Eco Logical Australia EPBC offset consultation -522.50
20/02/2014 ET-2552 Emerge Associates Invoices 11027-11029, 11153 & 11155 -10,450.00
20/02/2014 ET-2553 Ertech Marmion Ave Intersection Civil Works Dec 2013 -655,011.68
20/02/2014 ET-2554 Haines Norton TAM801 -1,914.00
20/02/2014 ET-2555 Homebuyers Centre Display village rebate - Lot 156 Oct 2013 -9,000.00
20/02/2014 ET-2556 Hull, LC Solar Panel Rebate -2,000.00
20/02/2014 ET-2557 J-Corp Pty Ltd Display home rebate - Lot 165 Oct 2013 -11,500.00
20/02/2014 ET-2590 LD Total Invoices 57514, 56103, 58028, 57486, 58683 & 5825 -29,146.40
20/02/2014 ET-2591 Loaded Invoices 1220, 1195 & 1233 -587.01
20/02/2014 ET-2592 Marketforce Invoices 11514, 11214, 10311 10699 & 11515 -5,077.67
20/02/2014 ET-2593 McMullen Nolan Surveyors Stage 4 Survey -3,025.00
Appendix 9.3
Appendix page 20

Tamala Park Regional Council
Summary Payment List February 2014
20/02/2014 ET-2594 New Great Cleaning Service TPRC office cleaning Jan 2014 -214.50
20/02/2014 ET-2595 Officeworks Office supplies -76.89
20/02/2014 ET-2596 Optimum Media Decisions Invoice 11398, 1630, 20124 & 20123 -4,313.49
20/02/2014 ET-2597 R J Vincent & Co Invoices 2889 & 2890 -890,782.32
20/02/2014 ET-2598 Replants Stage 9-11 grass trees -3,300.00
20/02/2014 ET-2599 Stantons International Invoices 52339, 52358 & 52416 -16,007.75
20/02/2014 ET-2600 Synergy 1 McAllister Bvd Nov 2013 - Jan 2014 -229.10
20/02/2014 ET-2601 Treacy Fencing Invoices 637034, 637032, 637431, 637432, 637031, 6 -32,493.01
20/02/2014 ET-2602 Water Corporation Water charges - 39 Aviator Bvd (Lot 170) -5.52
20/02/2014 ET-2603 Burgess Rawson Double payment -275.00
20/02/2014 ET-2604 Neverfail Bottled water -52.05
20/02/2014 ET-2605 Action Couriers Charges January 2014 -30.27
20/02/2014 ET-2606 Water Corporation Sales office Elsbury App (Jan - Feb 2014) -488.22
26/02/2014 ET-2563 Employee Costs Superannuation for period 06/02/14 - 19/02/14 -1,460.98
26/02/2014 ET-2561 McLeods Barristers & Solicitors Invoices 78138 & 78145 -4,943.21
28/02/2014 ET-2564 Telstra Network road works - Marmion Ave -196,835.74
28/02/2014 ET-2565 Carr, Louis Elected member allowance Nov 2013 - Jan 2014 -2,500.00
28/02/2014 ET-2566 Treby, Brett Elected member allowance Nov 2013 to Jan 2014 -2,500.00
28/02/2014 ET-2567 D Guise Elected member allowance Nov 2013 to Jan 2014 -2,500.00
28/02/2014 CH-200363 Davidson, Janet Elected member allowance Nov 2013 to Jan 2014 -2,500.00
28/02/2014 ET-2568 Italiano, Giovanni Chairman allowance Nov 2013 to Jan 2014 -8,500.00
28/02/2014 ET-2569 McLean, Tom Elected member allowance Nov 2013 to Jan 2014 -2,500.00
28/02/2014 ET-2570 Topelberg Joshua Elected member allowance Nov 2013 to Jan 2014 -2,500.00
28/02/2014 ET-2571 Tyzack, Terry Elected member allowance Nov 2013 to Jan 2014 -2,500.00
28/02/2014 ET-2572 Vaughan, Trevor Elected member allowance Nov 2013 to Jan 2014 -3,687.50
28/02/2014 ET-2573 Shan-Hao Yang & Xiuying Chen Lot 172 (4th instalment over 3 year period) -2,887.50
28/02/2014 ET-2575 City of Stirling GST Nov & Dec 2013 -56,258.99
28/02/2014 ET-2576 City of Vincent - Supplier GST Oct & Nov 2013 -14,176.11
28/02/2014 ET-2577 Town of Victoria Park - Supplier GST June - November 2013 -35,882.87
28/02/2014 ET-2578 City of Joondalup - Supplier GST owing January 2014 -1,528.62
28/02/2014 Bond Refund City of Wanneroo - Supplier Stage 5 Bond Refund 78,292.42
-3,788,417.79
Appendix 9.3
Appendix page 21

Appendix 9.4
Appendix page 22

Appendix 9.4
Appendix page 23

CATALINA - FINANCE REPORT
1.0
1.1 KEY STATISTICS
Lots Produced (titles) Sales SettlementsActual Budget Actual Budget Actual Budget Actual Budget
June 2013 June 2013 June 2013 June 2013
Prior Years 220 232 270 285 195 177 - -
Jul-2013 - - 24 5 6 30 - Aug-2013 14 - (1 ) 3 3 13 - Sep-2013 - 63 29 19 16 4 -
Sep-12 Qtr 14 63 52 27 25 47 - - Oct-2013 63 - 22 22 6 6 4,000,000 Nov-2013 - - 4 16 58 54 - Dec-2013 1 - (2 ) 20 5 5 4,000,000 -
Dec-12 Qtr 64 - 24 58 69 65 4,000,000 4,000,000 Jan-2014 53 - 37 9 2 2 - Feb-2014 - 53 8 23 48 2 - Mar-2014 - 19 20 -
Mar-13 Qtr 53 53 45 51 50 24 - - Apr-2014 10 20 21 4,000,000 May-2014 70 17 13 - Jun-2014 - 15 36 -
Jun-13 Qtr - 80 - 52 - 70 - 4,000,000
Full 2013/14 Year 131 196 121 188 144 206 4,000,000 8,000,000 PTD 351 348 391 402 339 293 4,000,000 4,000,000
2014/15 193 222 234 14,000,000
2015/16 253 200 168 18,000,000
-
1.2
48 lots settled in February 2014. The total settlements comprise of 1 lot each from Stages 2, 5 and 7, and 45 lots from stage 8.
Management Accounts - February 2014
Sales & Settlements
Distributions
MTH Act MTH Bgt YTD Act YTD Bgt PTD Act PTD Bgt
- Sales # 8 23 121 117 391 402 - Sales $ 2,008,000 5,530,364 27,931,500 26,637,693 86,680,500 88,517,804 - Sales $/lot 251,000 240,451 230,839 227,673 221,689 220,194
- Settlements # 48 2 144 116 339 293 - Settlements $ 10,996,000 419,206 31,249,500 24,689,792 74,475,500 63,552,346 - Settlements $/lot 229,083 209,603 217,010 212,843 219,692 216,902
- Spec. Site Sales # - - - - - - - Spec. Site Sales $ - 0 - (0 ) - (0 ) - Spec Site Sales $/lot - - - - - -
- Spec. Site Stlmts # - - - - - - - Spec. Site Stlmts $ - 0 - (0 ) - (0 )- Spec Site Stlmts $/lot - - - - - -
- Unsettled sales # 52 Unconditional 5 Titled - Unsettled sales $ 12,205,000 Conditional 47 351 - Unsettled sales $/lot 234,712
Appendix 9.4
Appendix page 24

CATALINA - FINANCE REPORT
1.3
MTD Act MTD Bgt Variance
Revenue 10,996,000 419,206 10,576,794 Margin GST (175,098 ) (36,315 ) (138,782 )Direct selling costs (495,170 ) (20,775 ) (474,394 )Interest Income 812 - 812 Forfeited Deposits - - - Other Income - 40,000 (40,000 )Rebate Allowance (126,793 ) (302,236 ) 175,443 -
10,199,752 99,879 10,099,873 Development costsLot production 1,460,247 2,133,157 672,910 Landscaping 27,500 123,298 95,798 - Consultants 15,691 61,971 46,280 - Infrastructure 1,399,981 20,508 (1,379,473 ) - Sales office building 1,455 50,418 48,964 - Sales & marketing 10,748 86,114 75,366 - Administration 38,730 53,111 14,381 . Finance 163,912 132,927 (30,985 )
3,118,263 2,661,504 (456,758 )
Cashflow 7,081,489 (2,561,625 ) 9,643,114
-
1.4
YTD Act YTD Bgt Variance
Revenue 31,249,500 24,689,792 6,559,708 Margin GST (446,579 ) (2,140,460 ) 1,693,880 Direct selling costs (1,407,961 ) (1,122,146 ) (285,815 )Interest Income 10,681 - 10,681
Cashflow - MTD Actuals to budget
Cashflow - YTD Actuals to budget
Actual margin scheme GST has been calculated under the concessional Item 4 basis for settlements.
Interest Income 10,681 - 10,681 Forfeited Deposits - - - Other Income - 40,000 (40,000 )Rebate Allowance (410,934 ) (947,731 ) 536,797 -
28,994,707 20,519,456 8,475,252 Development costsLot production 11,427,053 13,337,586 1,910,534 Landscaping 895,165 4,038,379 3,143,214 Consultants 250,842 585,667 334,826 Infrastructure 3,431,118 4,080,057 648,939 Sales office building 220,472 715,164 494,692 Sales & marketing 65,109 455,797 390,689 Administration 163,608 655,436 491,828 Finance 151,039 1,198,394 1,047,355
16,604,406 25,066,480 8,462,075
Cashflow 12,390,301 (4,547,025 ) 16,937,326
-
1.5
Last Year Last Month This Month
City of Wanneroo 589,904 1,065,096 982,589 589,904 1,065,096 982,589
The YTD revenue variance comprises:
$6.5m favourable to budget on 28 more residential settlements than YTD budget for FY2014.
Bonds
Bonds relate to Stage 2, 6C, 7 & 8 early clearances
Appendix 9.4
Appendix page 25

CATALINA - FINANCE REPORT
2.0
MTH Act MTH Bgt Var YTD Act YTD Bgt Var PTD Act PTD Bgt
- Revenue $ (Stlmts) 10,996,000 419,206 10,576,794 31,249,500 24,689,793 6,559,707 74,475,500 63,552,347 - Revenue $/lot 229,083 209,603 217,010 212,843 219,692 216,902
- Selling & GST $ 1,080,881 76,446 (1,004,435) 3,343,156 4,748,091 1,404,935 7,961,296 9,711,814 - Selling & GST $/lot 22,518 38,223 23,216 40,932 23,485 33,146
- Cost of sales $ 4,921,007 185,326 (4,735,681) 13,877,658 11,467,413 (2,410,245) 36,662,004 32,568,903 - Cost of sales $/lot 102,521 92,663 96,373 98,857 108,148 111,157
- Gross profit $ 4,994,112 157,434 4,836,678 14,028,687 8,474,289 5,554,397 29,852,200 21,271,630 - Gross profit $/lot 104,044 78,717 97,421 73,054 88,060 72,599 - Gross profit Mgn % 45.42% 37.56% 44.89% 34.32% 40.08% 33.47%
- Special Sites $ - - - - - - - -
- Other income $ 812 38,260 (37,448) 10,681 38,260 (27,579) 35,851 41,806
- Sales & Marketing $ 3,671 86,228 82,557 46,165 456,705 410,540 563,723 1,135,982 - Administration $ 46,984 74,790 27,807 207,595 571,495 363,900 730,073 964,736 - Finance $ - - - - 25,000 25,000 - 65,000 - Contingency $ - 135,193 135,193 20,364 1,193,653 1,173,289 20,364 1,636,846
- Net profit $ 4,944,270 (100,517) 5,044,788 13,765,245 6,265,697 7,499,548 28,573,892 17,510,872 - Net profit $/lot 103,006 (50,259) 95,592 54,015 #DIV/0! 84,289 59,764
PROFIT & LOSS
Gross profit is $5.6m ahead of budget due to favorable YTD settlements ($6.6m or 28 lots ahead of budget).FY14 YTD net profit is favourable against budget by $7.5m, mainly due to settlements being ahead of budget and unused contingency budget of $1.2m.
Appendix 9.4
Appendix page 26

CATALINA - FINANCE REPORT
2.1Actual
Stages Title Issue Date Revenue Revenue/lot
Direct Selling & COGS (incl.
GST) Direct Costs/lotActual Gross
ProfitActual Gross
Profit/lotActual Gross
Margin %Stage 1 17-Oct-12 8,558,000 244,514 6,347,237 181,350 2,210,763 63,165 25.83%Stage 2 7-Nov-12 8,157,500 220,473 5,948,705 160,776 2,208,795 59,697 27.08%Stage 3 14-Jan-13 7,465,000 173,605 5,240,653 121,876 2,224,347 51,729 29.80%Stage 6A 18-Jan-13 2,675,000 334,375 1,051,254 131,407 1,623,746 202,968 60.70%Stage 4 20-Mar-13 10,746,000 228,638 5,808,279 123,580 4,937,721 105,058 45.95%Stage 5 20-May-13 13,774,000 218,635 8,200,280 130,163 5,573,720 88,472 40.47%Stage 7 31-Oct-13 12,905,000 211,557 6,439,133 105,560 6,465,867 105,998 50.10%Stage 8 16-Jan-14 10,195,000 226,556 5,587,758 124,172 4,607,242 102,383 45.19%
74,475,500 44,623,300 29,852,200
Budget
Stages Budget Version Revenue Revenue/lot
Direct Selling & COGS (incl.
GST) Direct Costs/lotBudgeted
Gross ProfitBudgeted
Gross Profit/lotBudgeted
Gross Margin %Stage 1 May-12 8,531,000 243,743 6,122,735 174,935 2,408,265 68,808 28.23%Stage 2 May-12 8,223,999 216,421 6,255,430 164,617 1,968,569 51,804 23.94%Stage 3 May-12 7,417,500 172,500 5,455,644 126,875 1,961,856 45,625 26.45%Stage 6A May-12 2,405,291 300,661 1,226,975 153,372 1,178,316 147,290 48.99%Stage 4 May-12 10,714,354 227,965 6,331,008 134,702 4,383,346 93,263 40.91%Stage 5 May-12 14,066,809 216,412 9,808,883 150,906 4,257,926 65,507 30.27%Stage 7 Jun-13 13,205,000 209,603 8,178,150 129,812 5,026,850 79,791 38.07%Stage 8 Jun-13 11,725,000 221,226 7,988,239 150,721 3,736,761 70,505 31.87%
76,288,953 51,367,064 24,921,889
GROSS PROFIT ANALYSIS
200,000
250,000
0
50,000
100,000
150,000
Stage 1 Stage 2 Stage 3 Stage 6A Stage 4 Stage 5 Stage 7 Stage 8
Actual Gross Profit/lot
Budgeted Gross Profit/lot
0.00%
10.00%
20.00%
30.00%
40.00%
50.00%
60.00%
70.00%
Actual Gross Margin %
Budgeted Gross Margin %
0.00%
Stage 1 Stage 2 Stage 3 Stage 6A Stage 4 Stage 5 Stage 7 Stage 8
Appendix 9.4
Appendix page 27

Appendix 9.5
Appendix page 28

P.A
.W.
P.A
.W.
P.A
.W.
P.A
.W.
CO
NN
OLLY D
RIVE
PublicOpenSpace
POSPOSPOSPOSPOS
Public OpenSpace & Drainage
STAGE 3
STAGE 1
STAGE 4
STAGE 6
STAGE 2
STAGE 5
STAGE 7
STAGE 8
STAGE 16
Public OpenSpace
POS
POS
STAGE 9
STAGE 10
STAGE 11
STAGE 13
STAGE 12
STAGE 14
STAGE 15
STAGE 17
STAGE 18
STAGE 19
STAGE 23STAGE 22
STAGE 24
STAGE 20
STAGE 21
BiodiversityConservation Area
POS
POS
POS
WESTSTAGE 3
WESTSTAGE 1
WESTSTAGE 2
plan no: 2228-242-01scale: 1:5000 @ A3
date: 31.10.2013This plan is current at the revised date & subject to approval, survey & engineering detail. This plan remains the property of CLE ©
T:(+618) 9382 1233 F:(+618) 9382 1127
www.cleplan.com.au
LEGEND
Subdivision Application Area
Staging Boundary*
Complete (298 lots)
Under Construction (62 lots)
2014 (193 lots)
2015 (359 lots)
*Staging boundaries are preliminary onlyand are subject to change.
All road carriageway detail depicted on this Plan including pavements, road treatments,medians and parking are for illustrative purposes only and are subject to final engineeringdesign and any relevant approvals. The detail reflects the intent of the road networkstandards preferred for this subdivision.
The lot yield within each western stage is based on a mathematical calculation. A 5%contingency has been applied to allow for POS contribution, engineering andenvironmental constraints etc. A refined yield can be provided following detailed design.
Appendix 9.5
Appendix page 29

Appendix 9.6
Appendix page 30

Appendix 9.6
Appendix page 31

Appendix 9.6
Appendix page 32

Appendix 9.6
Appendix page 33

Appendix 9.6
Appendix page 34

Appendix 9.6
Appendix page 35

Appendix 9.6
Appendix page 36

Appendix 9.6
Appendix page 37

Appendix 9.6
Appendix page 38

Catalina Estate
Sustainability Initiatives
Phase 1
Review and Recommendations Report
17 September 2011
Appendix 9.6 - Recommendation Report
Page 1 of 28Appendix page 39

17 September 2011 Catalina Sustainability Initiatives Plan Phase 1 Report: Review and Recommendations
1
Executive Summary
This report provides a detailed analysis of the Catalina Sustainability Initiatives Plan (SIP), and
recommendations as to the feasibility of the SIP Initiatives to be implemented to address
EnviroDevelopment (ED) Standards, with the intention of achieving certification in selected
Elements.
The Catalina development area is under the control of the Tamala Park Regional Council (TPRC). The
Satterley Property Group (SGP) is the appointed Project Manager for the development delivery, sales
and marketing of the Catalina Estate.
On completion Catalina will comprise a predominately residential area with commercial, retail,
business, educational and community facilities, and with strong access to public transport and
regional facilities.
The TPRC has also committed to incorporating environment sustainability in the land, built form and
occupancy and use phases of development. These initiatives are described in the SIP.
This report provides an analysis of the 30 initiatives included in the SIP. A number of initiatives have
already been substantially addressed through the approved Local Structure Plan and Stage 1 sub-
division. The focus of this report is to provide an analysis of the initiatives in the context of ED with
particular emphasis on solar energy and a groundwater fed 3rd pipe water system.
The findings of this analysis show that five of six EnviroDevelopment Elements can be achieved,
contingent on addressing key recommendations. The five Elements selected are: Energy, Water,
Waste, Community and Ecosystem.
Listed below are the recommendations for each of the selected ED Elements.
EnviroDevelopment - Energy
Recommendations: (in addition to the supported initiatives listed in the SIP)
- Incorporate energy efficient lighting on streets and POS, as a minimum as a trial in Stage 1
- Mandate climate responsive passive solar design, such as living area orientation and cross-
flow ventilation
- Provide incentives for photovoltaic (PV) systems and direct load control devices
- Promote high efficiency appliances and fixtures through design guidelines
- Investigate potential for direct load control devices installed on household appliances and
linked to the local Western Power sub-station
- Implement a Sustainable Living and Behaviour Change Coaching program to address end-
user education, continuous improvement and verification of targets
EnviroDevelopment - Water
Recommendations: (in addition to the supported initiatives listed in the SIP)
- Implement a 3rd pipe scheme for garden irrigation requirements
- Investigate opportunities to extend the 3rd pipe scheme for in-house toilet and laundry uses
- Promote high efficiency fittings and fixtures through design guidelines
- Ensure open space and street planting is predominantly local native and drought resistant
- Implement a Sustainable Living and Behaviour Change Coaching program to address end-user
education, continuous improvement and verification of targets
Appendix 9.6 - Recommendation Report
Page 2 of 28Appendix page 40

17 September 2011 Catalina Sustainability Initiatives Plan Phase 1 Report: Review and Recommendations
2
EnviroDevelopment - Waste
Recommendations:
- Develop a detailed Waste Management Strategy through the services of a Waste
Management Specialist ensure on-site recycling activities through all three phases of
development
- Engage a Waste Management Recycler, with proven recycling credentials, to undertake on-
site waste management and recycling, including through a central recycling centre on-site for
reuse by residents and other builders
- Implement a Sustainable Living program to address end-user education
EnviroDevelopment - Community Recommendations / Actions: (in addition to the supported initiatives listed in the SIP)
- Promote the sustainability vision and apply community development and engagement
initiatives to create a strong vibrant and sustainable community
- Ensure community feedback has been considered and incorporated
- Undertake and maintain on-going community engagement, with a focus on sustainable living
- Develop a community education for sustainable living program – with a focus on direct
community engagement, behaviour change and demand management, data collection and
goal setting to achieve continuous improvement and verify targets
- Ensure inclusion of pedestrian and cycle options such as dedicated and connected paths,
secure bicycle park facilities, and public transport options
- Ensure provision of affordable housing product to 10percent of lots/dwellings
- Include indoor environment quality (IEQ) criteria in built form design guidelines
EnviroDevelopment - Ecosystem
Recommendations / Actions:
- Undertake a detailed assessment of all approvals (LSP, LWMS), design approaches and
initiatives against the ED Ecosystems standards to confirm compliance and proceed toward
certification
Design & Accreditation
Recommendation:
- Progress fulfilling the requirements for ED certification in Energy, Water, Waste, Community
and Ecosystem
Appendix 9.6 - Recommendation Report
Page 3 of 28Appendix page 41

17 September 2011 Catalina Sustainability Initiatives Plan Phase 1 Report: Review and Recommendations
3
Financial Incentives
Recommendations/Actions
Category /
Element
Objective Initiative Incentive
amount
Rebate Received
Water
20 percent
reduction in
potable water
consumption
Groundwater fed 3rd
pipe system $3,000 per lot
NA – installed
prior to purchase
Energy
20 percent
reduction in GHG
emissions
1.5kW PV system $3,000 on 50
percent of lots
Upon completion
of the home
Peak Load
reduction /
Behaviour Change
Coaching
Direct Load Control
Devices /
Behaviour Change
Demand Management
Coaching
$1,000 on 50
percent of lots
or $2,000 on
25percent of
lots
Upon occupancy
of the home
Appendix 9.6 - Recommendation Report
Page 4 of 28Appendix page 42

17 September 2011 Catalina Sustainability Initiatives Plan Phase 1 Report: Review and Recommendations
4
Contents
Executive Summary 1
Introduction 5
Scope of the Report 5
Context and Background 6
Sustainability Initiative Plan 7
Budget Allowance 9
EnviroDevelopment Standards 9
Analysis Review and Recommendations 10
Estate Energy / Housing Energy 10
ED Energy 11
Water Conservation 14
ED Water 15
Waste Management 18
ED Waste 18
Residents and Occupants 20
Transport 20
ED Community 20
ED – Ecosystem 23
Design & Accreditation 24
Financial Incentives 26
Appendix 9.6 - Recommendation Report
Page 5 of 28Appendix page 43

17 September 2011 Catalina Sustainability Initiatives Plan Phase 1 Report: Review and Recommendations
5
Introduction
ActiveSustainability has been appointed to provide sustainability consultancy services for the
Catalina development. This role is contracted to the Tamala Park Regional Council (TPRC), and
reports directly to the Satterley Property Group (SPG) as Project Manager for Catalina.
Scope of the Report
The TPRC requires an analysis of the current draft Sustainability Initiatives Plan (SIP) for the Tamala
Park Project, now marketed as Catalina, and recommendations as to their feasibility for
implementation to address EnviroDevelopment (ED) Standards with the intention of achieving
certification in selected categories or elements.
The full scope is to be developed in three phases:
- Phase 1: Review the draft Sustainability Initiatives Plan and provide recommendations
- Phase 2: Revised Sustainability Initiatives Plan
- Phase 3: EnviroDevelopment Certification
Phase 1 will be addressed in the report.
Key tasks for Phase 1 include:
o Review the draft SIP with particular emphasis on benefit of Solar Energy and 3rd Pipe
Water system
o Investigate minimisation of ecological & carbon impact by promoting initiatives in
water sensitive urban design, energy efficiency, recycling accessibility, planning &
building design in accordance with targets set in SIP
o Investigate use of alternative water supply
o Provide advice on implementation issues for selected sustainability initiatives and
the likely cost and market acceptance
An indicative timetable for the delivery of Phases 1, 2 and 3 to meet the Management Committee
timetable and the proposed project program is summarised as follows:
- Start Bulk Earthworks (subject to SEWPC & WAPC approvals) end August 2011
- Preliminary review of the draft SIP early September 2011
- Draft Revised Sustainability Initiatives Plan 13 September 2011
- Management Committee meeting 22 September 2011
- Start Stage 1 Civil Works early November 2011
- Preparation for EnviroDevelopment Certification October 2011-January 2012
- Stage 1 Titles May 2012
Appendix 9.6 - Recommendation Report
Page 6 of 28Appendix page 44

17 September 2011 Catalina Sustainability Initiatives Plan Phase 1 Report: Review and Recommendations
6
Context and Background
The Catalina development area is under the control of the Tamala Park Regional Council (TPRC)
which comprises the following participant local governments: Cities of Joondalup, Perth, Stirling and
Wanneroo; and Towns of Cambridge, Victoria Park and Vincent.
The TPRC vision for the development is ‘to create an urban center for choice, sustainability,
community and opportunity from the land.’ This vision is to be given effect through a number of key
principles, which are:
- Incorporate environmental responsibility
- Enable effective community development and wellbeing
- Foster local economic development and employment opportunities
- Enhance transport (including public transport) opportunities
- Facilitate efficient energy use and production
- Minimise waste and water consumption
- Provide healthy profits for its landowners
- Produce a quality development demonstrating the best urban design and development
practice
Located in the northern suburbs of Perth, Catalina is effectively an infill development area: to the
immediate north are Mindarie and Clarkson, and to the south Kinros and Burns Beach. The land is
bounded by Neerabup road to the north, the Mitchell Freeway reservation and Neerabup Regional
Park to the east, the Tamala Park landfill facility to the south and an existing coastal foreshore
reserve and the Indian Ocean to the west. This lends the estate immediate access to established
community services, amenities, transport routes and infrastructure which can be leveraged to the
advantage of the development. Significantly, the Ocean Keys District Centre and the Clarkson Transit
Centre are immediately to the north of the site.
The actual site presents good opportunities to address achievement of the project sustainability
objectives. As described in the Tamala Park Local Structure Plan the overall land-form supports good
community design as well the environment design outcomes in the form of lot shape and orientation
to achieve good northern solar access and to take advantage of cooling coastal breezes.
Availability of good quality groundwater for a third pipe system is another benefit which supports
Catalina being recognised as a leader in sustainable urban development.
The completed project will contain:
- Total lots approximately 2,200 lots
- Dwellings 2,600 dwellings
- Average density 14.5 dwellings/ha
- Population approximately 6,500
- Primary schools 1
- Local/ Village Centres 1
- Mixed use nodes 3
Appendix 9.6 - Recommendation Report
Page 7 of 28Appendix page 45

17 September 2011 Catalina Sustainability Initiatives Plan Phase 1 Report: Review and Recommendations
7
Sustainability Initiative Plan
SPG in its ‘Request for Proposal’ submission to the TPRC in May 2010, proposed a suite of
sustainability strategies and initiatives (developed by ActiveSustainability) that were consistent with
the objectives as described in the Tamala Park Local Structure Plan. The specific initiatives put
forward by SPG addressed the full development lifecycle by considering development planning and
design, civil works and building construction, and occupancy and use. The initiatives were
categorised into Estate Energy, Housing Energy, Water Conservation, Waste Management, Residents
& Occupants, Transport and Development Design Assessment & Rating.
The Sustainability Initiatives that were assessed for consideration are as follows:
Estate Energy:
1. Low energy long life LED lights for use in street lights and open space lighting
2. Uptake of solar energy produced from a proposed centralized solar collector on Mt Tamala
3. Geothermal energy for estate heating and cooling
4. Wind Farm
5. Landfill Methane Gas Extraction
Housing Energy:
6. Main living area orientation to the north to optimize winter solar penetration and natural
lighting
7. Floor plans and location of openings to optimize cross-flow ventilation
8. Target of 6 star AccuRate certification for all dwellings
9. Solar water heating with gas booster or heat pump systems
10. Min 1.5kW grid interactive photovoltaic (PV) array
Water Conservation:
11. Achieve the water consumption target of 100 kL/person/year, including not more than
60kL/person/year of scheme water
12. Implement a groundwater fed secondary 3rd pipe water scheme for non-potable uses such
as irrigation of public and private open space and extending to toilet flushing
13. Provide for future water policy changes to allow the reuse of treated wastewater through a
centralized managed aquifer re-charge scheme. In anticipation of this, SPG will ensure the
3rd pipe non-potable scheme is designed to allow easy connection to such a scheme
14. Landscaping and urban design to optimize at source direct storm-water infiltration for
groundwater recharge, achieving a net water balance across the development area
15. Best practice in water sensitive urban design such as minimizing hard stand and permeable
paving in open spaces, bio-filtration swales, and slotted pipes
16. Implementation of design criteria for ALL single residential dwellings – including minimum
2.5kl rainwater tank plumbed to laundry and also as a supplement to water heating, high
efficiency fittings and fixtures, toilets to be a minimum 6 star WELS rated and taps and
showers shall be min 3 star WELS rated
17. Waterwise garden and Waterwise controlled irrigation scheme
Waste Management:
18. Support that construction management criteria will be written into all contracts to ensure
resource efficiency, waste minimization, and reuse or recycling of excess materials
Appendix 9.6 - Recommendation Report
Page 8 of 28Appendix page 46

17 September 2011 Catalina Sustainability Initiatives Plan Phase 1 Report: Review and Recommendations
8
19. SPG to build upon existing relationships with building companies to ensure waste
management opportunities are optimised
Residents and Occupants:
20. The City of Wanneroo operates a verge side pick-up recycling programs that capture and
recycle >90percent of household wastes
21. Significant opportunities exist for residents and occupants to reduce their waste through a
number of localized and lot based initiatives such as composting of food and green waste for
re-use on private or community gardens
22. Establish community garden
23. Provide fiber to the home (FttH)
24. Cede Housing (affordable built form product)
Transport:
25. Examine the potential for light rail
26. Examine potential for community bus service
27. Plan for early provision of PTA services
Design and Accreditation:
28. Adopt the City of Wanneroo Smart Growth policy and tool, to satisfy all current planning and
policy requirements
29. Apply relevant development criteria of the EnviroDevelopment standard for Tamala Park
30. Identify areas within development that would benefit from Site Responsive Housing design
On selection as the successful proponent, the sustainability initiatives were further examined to
ensure they met the TPRC objectives for the project and to understand implications for
implementation and anticipated costs. All sustainability initiatives from the SPG RfP submission and
those included in the LSP were assessed to enable the TPRC to consider which initiatives could be
implemented, which were to be excluded and which initiatives require further investigation and
costing. This report resulted in the draft SIP which included recommendations and actions for all
initiatives.
All initiatives were evaluated and categorized to determine their feasibility for implementation. The
four categories used are:
1. Feasible within current development industry best practice
2. Feasible with financial support from the project
3. Require further detailed examination
4. Unfeasible or uneconomic
The results of this review are summarised as follows:
- A total of 30 sustainability initiatives were assessed
- 13 are considered to be feasible to be introduced through design and construction
- 10 can be implemented with financial support from the project
- 5 will require more detailed investigation and cost analysis
- 2 (wind farm & light rail) are not considered feasible for the project
The Tamala Park – Catalina Sustainability Initiatives Plan Report (March 2011) is included as
Appendix 1)
Appendix 9.6 - Recommendation Report
Page 9 of 28Appendix page 47

17 September 2011 Catalina Sustainability Initiatives Plan Phase 1 Report: Review and Recommendations
9
Budget Allowances
Subsequent to the draft SIP, the project cash flow budget provided a financial allowance for the
implementation of a number of environmental sustainability initiatives. This included the following:
- $5,000 per lot for general sustainability initiatives, such as 3rd pipe, rainwater tanks, PV etc
- $4,500 per lot for water wise landscape package to the front yard
- 2,453 per lot for fibre to the home (FTTH)
All proposed initiatives that require a financial incentive or rebate will need to be costed to fit within
the budgeted allowance of $5,000 per lot.
EnviroDevelopment (ED) Standards
The review of the draft SIP and recommendations for implementation will be framed in-line with ED
Standards with the intention of aiming for certification. This will have the benefit of enabling the
TPRC to focus on what initiatives to pursue in order to achieve the desired numbers of “leaves”.
ED represents the current industry preferred development
area or estate scale rating tool for WA. It is an independent,
voluntary certification system that provides accreditation to
land developments that aim to go beyond minimum
practice standards and promote more sustainable urban
developments. The ED system addresses performance
criteria and certification in six areas. These are: Ecosystem,
Waste, Energy, Materials, Water and Community.
ED sets the bar above current practice and targets the top 10-20 percent of urban development
projects. The objectives of ED are to provide consumer awareness on sustainability, promoting
adoption of sustainability principles in project planning, and to communicate sustainability.
As many of the proposed sustainability initiatives for Catalina are consistent with ED criteria, it
provides a useful framework by which to determine leading practice initiatives that can be
implemented to ensure Catalina is at the forefront of urban development in WA, and will be
recognised as such.
The preliminary analysis of the proposed sustainability initiatives against the ED Standards shows
that Catalina addresses and can potentially achieve certification in four of the six elements. The
Waste Element has potential to be achieved if some proposed initiatives are strengthened.
EnviroDevelopment Element Potential to achieve certification
Ecosystem High
Waste Medium
Energy High
Materials Low - Medium
Water High
Community High
Appendix 9.6 - Recommendation Report
Page 10 of 28Appendix page 48

17 September 2011 Catalina Sustainability Initiatives Plan Phase 1 Report: Review and Recommendations
10
The Stage 1 preliminary review will provide confirmation of this analysis and advice on required
initiatives to achieve certification against each respective Element.
Analysis Review and Recommendations
The following section provides the analysis of the 30 initiatives identified in the SIP against the
requirements of the ED Standards. This analysis is structured using the same categories and in the
same order as the initial SIP. These are:
- Estate Energy and Housing Energy
- Water Conservation
- Waste Management
- Residents & Occupants and Transport
- Development Design Assessment & Rating
This analysis provides a statement clarifying the relationship with the ED Standards, a summary of
the relevant ED Element, and a detailed discussion of the relevant initiative with regard to
addressing the ED performance targets and criteria. Key recommendations are then provided for
implementation to achieve ED certification.
ESTATE ENERGY
Sustainability Initiatives Plan Relationship to EnviroDevelopment
Initiative Recommended Action
1. Low energy long life LED street and open space lighting
Investigate with City of Wanneroo for application, possibly as a trial
Energy - Essential criteria is provision of efficient lighting in common areas. Incorporating energy efficient lighting on streets and POS will provide significant leadership in this area
2. Uptake of solar energy produced from the proposed centralized solar collector at Mindarie Regional Council facility (Mt Tamala)
Defer – no further action at this time
NA
3. Geothermal energy for estate heating and cooling
Defer – no further action at this time
NA
4. Wind Farm Not supported - no further action
NA
5. Landfill Methane Gas Extraction Commence discussion to determine possibility
NA
HOUSING ENERGY
6. Main living area orientation Supported - incorporate into DG’s
Energy - Key criteria in GHG reduction Community – Key criteria in Indoor Environment Quality
7. Optimise cross-flow ventilation
8. 6 Star AccuRate Supported - incorporate into DG’s
NA: 6 star building performance rating will be mandated in the Building Codes of Australia as at 1 May 2012
9. Solar water heating (SWH) with Incorporate into DG’s Energy - Key criteria in GHG reduction
Appendix 9.6 - Recommendation Report
Page 11 of 28Appendix page 49

17 September 2011 Catalina Sustainability Initiatives Plan Phase 1 Report: Review and Recommendations
11
gas booster or heat pump systems
w- incentive
10. Min 1.5kW grid interactive photovoltaic (PV) array
Incorporate into DG’s w- incentive
Energy - Key criteria in GHG reduction
EnviroDevelopment - Energy
TARGET: Implement measures that would optimise energy reduction and achieve 20 percent reduction in
greenhouse gas (GHG) production across the development over and above current regulatory requirements.
ESSENTIAL ACTIONS:
- Development must consider solar orientation of lots and solar access to buildings. - Development shows evidence that shielding from hot summer sun; ventilation and topography have
been considered and addressed. - Measures aimed at specifically reducing peak load, including use of off-peak loads at masterplanning
level - Efficient lighting in common areas, such as through utilising solar power or fluorescent fittings, etc - Demonstrate measures to assist with community education - Meet requirement for GHG reduction – through a range of options
Discussion:
The performance target for the ED Energy Element is to optimise energy reduction and achieve 20
percent reduction in greenhouse gas (GHG) production across the development over and above
current regulatory requirements. This includes measures at masterplanning, within the public
domain, peak loads and householder education.
A number of these requirements have been adequately addressed, either through planning design
and/or through SIP initiatives. These include solar orientation of lots through local structure planning
and in the Stage 1 sub-division design; and energy efficient lighting in the public domain – refer SIP
Initiative 1.
ED states the requirement for reduction in GHG emissions by 20 percent can be met through a range
of options such as renewable energy, energy efficient appliances and fixtures, climate responsive
design, and end-user education and demand/behaviour management. Importantly this 20 percent
reduction must be met through initiatives that are over and above current regulatory requirements,
such as 5 Star Plus which mandates energy efficient water heaters, and 6 star rated building
performance, which will become mandatory on 1 May 2012.
SIP Initiatives # 6, 7, 8, 9 and 10 all support improved energy efficiency and reduced GHG emissions
from the home, however these require closer scrutiny to determine the most effective initiatives to
achieve the 20 percent reduction.
The current average household energy consumption in Perth is approximately 14 - 17 kWh per day,
based on an average residential home in Perth of 270m2. 14.7 kWh is the baseline value used by
EnviroDevelopment. A 20 percent reduction is equal to ~3kWh per day.
A smaller 1 or 2 bed home, with an area of 170-190m2 may have a consumption of approximately 10
- 12 units per day. While house size is a key factor in reducing overall consumption, other factors
Appendix 9.6 - Recommendation Report
Page 12 of 28Appendix page 50

17 September 2011 Catalina Sustainability Initiatives Plan Phase 1 Report: Review and Recommendations
12
irrespective of house size are house design, efficiency of appliances and fixtures and lifestyle
behavioural habits.
The Catalina Stage 1 sub-division has lots ranging in size of 380-530m2 (average 455m2) for standard
residential lot to 225-350m2 (average 290m2) for narrow frontage cottage lots, which are
approximately 30 percent of the total. Based on these lot sizes and an average building footprint of
approximately 60 percent of lot area, the homes may vary from approximately 170m2 - >300m2.
The passive design features described in SIP Initiatives 6 and 7 will influence energy consumption
and demand within the home through reduced lighting and air-conditioning. These are however
greatly dependent on user behaviour: i.e. switching off lights and heaters. These passive design
features also have beneficial impact on indoor environment quality (IEQ) and occupant health and
wellbeing, which are features of the Community element.
There are significant opportunities to reduce energy consumption through high efficiency fixtures
and appliances. The table below shows electricity consumption by household appliance in 2000, and
projected consumption in 2020. This research found the ‘dramatic recent and forecast rise in energy
consumption by televisions represents the largest energy use and percent increase in energy, driven
by larger TV sizes, increased viewing hours and greater levels of ownership’ and that ‘further
sizeable increases are forecast in air-conditioning through 2010 – 2020.’
The continued increase in TV and air-conditioning use also impacts peak load demand, especially in
summer months. Peak load is discussed on the following page.
The SIP Initiatives which directly focus on GHG and energy reduction are PV and SWH systems.
Electricity consumption by major residential appliances in 2000
Forecast electricity consumption by major residential appliances in 2020
Building Our Savings: Reduced Infrastructure Costs from Improving Building Energy Efficiency,
Institute for Sustainable Futures & Energetics, 2010
Appendix 9.6 - Recommendation Report
Page 13 of 28Appendix page 51

17 September 2011 Catalina Sustainability Initiatives Plan Phase 1 Report: Review and Recommendations
13
A 1.5kW PV system, which is now the common average size, produces an average 6-8kWh/day over
a 12 month cycle, representing between 30 – 50 percent reductions in average household energy
use. This therefore implies if approximately 50 percent of homes install a 1.5kW PV array, the GHG
reduction of 20 percent across the development will be achieved.
The rapid uptake of roof-top PV in recent years - at the end of 2009/10 there were over 20,000 grid-
connected PV systems installed in WA - has been influenced by generous federal government
rebates, known as Renewable Energy Certificates (REC’s), and also state-sponsored feed-in tariffs.
REC’s, which amounted to approximately $8,000 of a 1.5kW PV system, allowed for the installation
of between $2,500 for an entry level standard to $4,500 for a higher quality system. Both REC’s and
the feed-in tariffs have recently been rolled back and the market is now readjusting. Even-so, there
are entry-level 1.5 kW systems being advertised for $3 – 3,500.
The average percentage of household energy use for water heating is estimated a 16 percent,
however this figure is difficult to verify due to an absence of recent data and SWH’s increased
market share in WA in recent years. Energy efficient hot water systems, including SHW’s are now
mandated in the BCA 5 Star Plus provisions. Other allowable systems are a 5-star rated gas hot water
system and a heat pump hot water system. The SWH’s have the lower GHG co-efficient compared to
the other allowable fossil fuelled hot water systems, and are therefore an important form of
renewable energy providing a significant benefit in reducing overall GHG emissions.
There are two other criteria to be addressed to meet the ED Energy requirements. These are
reductions in peak load demand and demand/behaviour management, both of which are inter-
related and are associated with end-user education and also verification of the target reduction.
Peak Load is a critical issue in the supply and cost of electrical energy in WA. Peak load refers to the
increased demand for electricity, mainly during peak summer daylight and evening hours, generally
3 – 9pm, which is when families are at home using multiple appliances, including air-conditioning
and TV’s in summer. This ‘peak’ demand requirement places significant strain on the electricity grid.
Western Power estimates the cost to meet peak load demand for a few hours per day in summer is
greater than 80percent of investment cost in supply. Further-more the peak load demand is
projected to increase due to increase in the use of TV’s and air-conditioners.
Strategies for peak load reduction in residential areas include implementing demand management
through direct load control devices fitted to fixtures and appliances such as air conditioners and pool
pumps and also end-use behaviour change education programs. The effectiveness of direct load
control devices are dependent on wireless transmitters installed on local electricity sub-stations,
which requires agreement with Western Power.
Existing successful models for end-use education or sustainable living programs include direct
community engagement programs such as Living Smart, and behaviour change coaching support to
address household living, energy, water, waste, gardens and healthy lifestyle, as well as data
collection and goal setting to achieve continuous improvement and verify targets.
Appendix 9.6 - Recommendation Report
Page 14 of 28Appendix page 52

17 September 2011 Catalina Sustainability Initiatives Plan Phase 1 Report: Review and Recommendations
14
The Behaviour Change Coaching programs, which are operated through a centralised tele-centre
using trained behaviour change coaches, provide an efficient cost effective mechanism to address
on-going ‘end-user’ education, including demand management, as well as verification of targets. The
verification is a critical ED component to provide sufficient empirical data for annual re-certification.
These are discussed in more detail below under Residents and Occupants / Community.
Recommendations: (in addition to the supported initiatives listed above)
- Incorporate energy efficient lighting on streets and POS, as a minimum as a trial in Stage 1
- Mandate climate responsive passive solar design, such as living area orientation and cross-
flow ventilation
- Provide incentives for PV and direct load control devices
- Promote high efficiency appliances and fixtures through design guidelines
- Investigate potential for direct load control devices installed on household appliances and
linked to the local Western Power substation
- Implement a Sustainable Living and Behaviour Change Coaching program to address end-use
education, continuous improvement and verification of targets
WATER CONSERVATION
Sustainability Initiatives Plan Relationship to EnviroDevelopment
Initiative Recommended Action
11. Achieve the water consumption target of 100 kL/person/year, including not more than 60 kL/person/year of scheme water
Target to be adopted, however cost impact to be assessed - linked to 12, 13, 16 & 17
Water – Essential criteria. ED requires a 20percent reduction in ‘in-lot’ potable water use beyond regulatory measures.
12. Implement a groundwater fed 3rd pipe water scheme for non-potable uses such as irrigation of public and private open space and extending to toilet flushing.
Cost impact to be assessed – linked to 16 & 17
13. Provide for future water policy changes to allow the reuse of treated wastewater through a centralized managed aquifer re-charge scheme.
In anticipation of this, SPG will ensure the 3rd pipe non-potable scheme is designed to allow easy connection to such a scheme
14. Landscaping and urban design to optimise at source direct storm-water infiltration for groundwater recharge
Supported – include in UWMS
Ecosystem – Essential criteria
15. Best practice in water sensitive urban design such as minimizing hard stand and permeable paving in open spaces, bio-
Appendix 9.6 - Recommendation Report
Page 15 of 28Appendix page 53

17 September 2011 Catalina Sustainability Initiatives Plan Phase 1 Report: Review and Recommendations
15
filtration swales, and slotted pipes
16. Minimum 2.5kl rainwater tank plumbed to laundry and water heating, high efficiency fittings and fixtures, toilets min 6 star and taps and showers min 3 star WELS rated.
Cost impact to be assessed – linked to 11, 12 & 13
Water – Essential criteria. Refer discussion
17. Waterwise garden and Waterwise controlled irrigation scheme
Water – Essential criteria require drought tolerant species, and where irrigation is required, that it is from a non-potable source. Refer discussion
EnviroDevelopment - Water
TARGET: Measures that would achieve at least a 20percent reduction in potable water use beyond
regulatory measures and have no potable water irrigation requirements.
ESSENTIAL ACTIONS:
- Reduce overall water use by 20 percent beyond regulatory means –water efficiency mechanisms. - Utilise alternative water sources - rainwater, stormwater, dual reticulation to meet irrigation demand
for public open space and common areas of the project or use drought tolerant species which require no
- End user education
Discussion:
The target for the ED water Element is ‘to incorporate measure to achieve at least a 20 percent
reduction in potable water use beyond regulatory measures and have no potable water irrigation
requirements.
The standards ED provides for addressing this reduction are based on a current household potable
water consumption of 559.2L/hh/day or 204kL/hh/year. A 20 percent improvement target therefore
equals 447kL/hh/day or 163Kl/hh/year (65kL/person/year).
Note that these targets are more onerous than Water Corporation consumption figures, but
generally consistent with the State Water Plan targets. The Perth Residential Water Use Study
(Water Corporation 2008/09) shows the current average annual residential potable water use is
277kL/hh/year (106kL/person/year). A 20percent reduction below this average equates to
222kL/hh/year, or 85kL/person/year.
Appendix 9.6 - Recommendation Report
Page 16 of 28Appendix page 54

17 September 2011 Catalina Sustainability Initiatives Plan Phase 1 Report: Review and Recommendations
16
Average water use per household, Perth Residential Water Use Study2008/09, Water Corporation
The State Water Plan has a target of 100kL/person/year, including not more than 40-60
kL/person/year scheme water (which is referred to in the LSP Section 13.0 LWMS), and a water
reuse/recycling target of 20 percent for fit-for-purpose uses, i.e. irrigation, toilet flushing.
The Water Corporation research also shows that on average 39 percent is consumed for irrigation
use, 16 percent for toilet flushing and laundry, and 32 percent for shower, taps, and dishwashing.
The remaining 13 percent is consumed for air-conditioning, leaking and hand watering – refer table
below.
Average water use by area, Perth Residential Water Use Study 2008/09, Water Corporation
The two key proposed initiatives that will be required to achieve the 20 percent reduction are either
a 3rd pipe system for irrigation, or a rainwater tank for laundry and toilet flushing.
A 3rd pipe irrigation system has a focus on reducing garden irrigation use through the controlled
supply of available groundwater. The system can supply the irrigation requirements for front and
rear gardens. This will therefore achieve up to a 39 percent reduction in potable water use, based on
Water Corporation figures.
The Stage 1 sub-division has a proposed 271 residential lots ranging in size of 380-530m2 for
standard residential lot to 225-290m2 for narrow frontage cottage lots, which are approximately 30
percent of the total. These lot sizes indicate a significant portion of lots will have quite sizeable
gardens with irrigation requirement. Based on these lots sizes and an average building footprint of
approximately 60 percent of lot area, the garden area may vary from approximately 120m2 -
>150m2.
There is also potential for the 3rd pipe system to be extended into the home for non-potable uses
including toilet flushing and cold-water laundry use. This approach will require negotiations with the
Department of Health to gain acceptance and approvals. It is also influenced by water quality,
specifically iron content, which can affect plumbing systems and discolouration of fixtures. If
approved, this will add an additional 16 percent reduction to the 39 percent gained from the garden
irrigation offset, equalling a potential 45 percent reduction in potable water use, or
48/kL/person/year.
Appendix 9.6 - Recommendation Report
Page 17 of 28Appendix page 55

17 September 2011 Catalina Sustainability Initiatives Plan Phase 1 Report: Review and Recommendations
17
Cost estimates for installation of the 3rd pipe system are $2,500 - $3,000/lot: The figures, provided
by Total Eden, are based on actual costs for full installation (including pipe work, bores, pumps,
weather station, and connection and meters to lots) at SPG’s developments at Brighton and
Evermore Heights respectively. Total Eden advice that the cost difference between the two estates is
due to the economies of scale – Evermore Heights is a 400 lot sub-division while Brighton has in
excess of 1000lots. As Catalina will have a projected 2,200 lots, similar economies of scale will be
available.
Rainwater in residential sub-division areas is mainly used for in-house use of toilet flushing and cold-
water laundry use. There is also potential to use the water as a supplement for water heating.
Approximately 80 percent of Perth’s average rainfall falls in winter months between May and
September, thereby reducing the amount of water saving over a 12 month cycle. Based on the
Water Corporate percentage of total water use, a plumbed rainwater tank will provide potable
water offset of less than 10 percent.
Currently Perth based contractors are installing domestic rainwater harvesting systems for cold
supply only in the range $2,500 to $5,000 for 2,500‐3,000‐litre systems with a typical cost of $3,500.
These costs are dependent on ease of connection and location within the lot.
Based on these cost estimates and the above water use percentages, the 3rd pipe system will achieve
and exceed the ED target at a cheaper cost than a rainwater tank. Furthermore, the installation of 3rd
pipe system will address SIP Initiative 13, which addresses future water policy changes to allow the
reuse of treated wastewater through a centralized managed aquifer re-charge scheme.
SIP Initiative 16 refers to high efficiency fittings and fixtures. The BCA 5 Star Plus standards currently
require WELS rated fixtures in the home. These are:
- All tap fittings (other than bath outlets and garden taps) minimum 4-star WELS rated
- All showerheads will be a minimum 3-star WELS rated
- All sanitary flushing systems will be a minimum dual-flush, 4-stars WELS rated.
There are opportunities to gain greater efficiencies through more efficient showerheads and toilets,
which combined account for 34 percent of water consumption.
The ED Water category requires drought-resistant native landscaping to open space and street
verges. This is not directly stated in the current initiatives, but is implied in SIP Initiatives 14 and 15.
ED also strongly supports native gardens within lots, which is addressed in SIP Initiative 17.
ED has a requirement for education of occupants/users, and the monitoring of initiatives to verify
targets.
The Education requirement is referenced in SIP Initiative # 20 and 21. This program will however
need to be extended beyond waste reduction education to a more holistic Sustainability Living
program.
Existing successful models for sustainable living include direct community engagement programs
such as Living Smart Workshops, and behaviour change coaching support to address household
living, energy, water, waste, gardens and healthy lifestyle, and include data collection and goal
setting to achieve continuous improvement and verify targets.
Appendix 9.6 - Recommendation Report
Page 18 of 28Appendix page 56

17 September 2011 Catalina Sustainability Initiatives Plan Phase 1 Report: Review and Recommendations
18
The Behaviour Change Coaching programs, which are operated through a centralised tele-centre
using trained behaviour change coaches, provide an efficient cost effective mechanism to address
on-going ‘end-user’ education, including demand management, as well as verification of targets. The
verification is a critical ED component to provide sufficient empirical data for annual re-certification.
These are discussed in more detail below under Residents and Occupants / Community.
Recommendations: (in addition to the supported initiatives listed above)
- Implement a 3rd pipe scheme for garden irrigation requirements
- Investigate opportunities to extend the 3rd pipe scheme for in-house toilet and laundry uses
- Promote high efficiency fittings and fixtures through design guidelines
- Ensure open space and street planting is predominantly local native and drought resistant
- Implement a Sustainable Living and Behaviour Change Coaching program to address end-user
education, continuous improvement and verification of targets
WASTE MANAGEMENT
Sustainability Initiatives Plan Relationship to EnviroDevelopment
Initiative Recommended Action
18. Construction management criteria will be written into all contracts to ensure resource efficiency, waste minimization, and reuse or recycling of excess materials
Supported – include in Construction management contracts for civil works and landscaping
Waste – Essential criteria. Requires achieving a 60 percent recycling rate
19. SPG to build upon existing relationships with building companies to ensure waste management opportunities are optimised
Supported – to be negotiated with builders
Waste – Essential criteria. Requires achieving a 60 percent recycling rate
EnviroDevelopment - WASTE
TARGET: Development that has implemented waste management procedures and practices which reduce
the amount of waste to landfill and facilitates recycling.
ESSENTIAL ACTIONS: Identify local recyclers, secondary product manufacturers and material streams
available to the site + achieve the following requirements:
- Pre-construction - Site waste management plan, reuse of existing materials, reuse or recycle demolition, land clearing, or civil works materials/products
- Construction – Strategies for waste minimisation practices and reuse/recycling waste, waste management plans and policies, on-site recycling facility
- Post-construction - Community education on reduce, reuse and recycle, on-site compost, reuse of construction materials by occupants
The essential requirement of the ED Waste Element is to identify local recyclers, secondary product
manufacturers and material streams available to the site to be used in the preconstruction and
construction phase.
Appendix 9.6 - Recommendation Report
Page 19 of 28Appendix page 57

17 September 2011 Catalina Sustainability Initiatives Plan Phase 1 Report: Review and Recommendations
19
Waste Management and recycling in the development sector is an area that is often cited as an
important sustainability objective, but often fails to achieve meaningful results. While there are
many points along the development cycle where failure can occur, the key issues result from not
having appropriate expertise to develop and manage a detailed Waste Management Strategy
(WMS). To adequately address ED Waste Element criteria requires the development of a detailed
WMS to be implemented in the civil works and building construction phases of development. This is
best achieved through the services of a Waste Management Specialist with expertise in the design of
the program, which would occur in liaison with the civil engineer, landscape architects, civil works
and landscape contractors and builders. The core features of the Waste Management Strategy
would include:
- For pre-construction civil works:
o design of a site waste management plan addressing handling, storing and collection
of waste and recyclables
o identification of the most suitable waste management skip/bin recycler
o communication and training requirements for site staff
o an audit estimate of potential land clearing or civil works materials to be recycled or
reused on site, and stockpiles of topsoil to be used to best advantage
- For Building Construction:
o planning, establishment and operation of an on-site waste management and
recycling, including through a central recycling centre on-site for reuse by residents
and other builders
o liaison with waste management skip/bin recycler to provide records and data
relating to material disposed of and/or recycled in a relevant format
o Liaison with suppliers to accept return of unused materials for re-use
ED also requires end-user and community education. This is discussed in more detail below under
Residents and Occupants.
Recommendations:
- Develop a detailed Waste Management Strategy through the services of a Waste
Management Specialist ensure on-site recycling activities through all three phases of
development
- Engage a Waste Management Recycler, with proven recycling credentials, to undertake and
on-site waste management and recycling, including through a central recycling centre on-site
for reuse by residents and other builders
- Implement a Sustainable Living program to address end-user education – refer Residents and
Occupants below
Appendix 9.6 - Recommendation Report
Page 20 of 28Appendix page 58

17 September 2011 Catalina Sustainability Initiatives Plan Phase 1 Report: Review and Recommendations
20
RESIDENTS AND OCCUPANTS
Sustainability Initiatives Plan Relationship to EnviroDevelopment
Initiative Recommended Action
20. The City of Wanneroo operates verge side recycling programs that capture and recycle >90percent of household wastes.
Supported – to be linked to SPG Community Development Program
Waste – Essential criteria for post-construction community education and engagement Community: Ongoing community engagement and governance; and Community: Place Making Implemented through SPG’s Community Development and Engagement Initiatives
21. Significant opportunities exist for residents and occupants to reduce their waste through a number of localized and lot based initiatives such as composting of food and green waste for re-use on private or community gardens
Supported – to be linked to SPG Community Development Program
22. Establish community garden
Discuss with City of Wanneroo
23. Provide fibre to the home (FttH) Supported Community: Transport – Work from Home criteria
24. Cede Housing (affordable built form product)
Supported – site to be identified in first stage
Community: Place Making criteria for 10 percent affordable house and land product interspersed through the development area
TRANSPORT
Sustainability Initiatives Plan Relationship to EnviroDevelopment
Initiative Recommended Action
25. Examine the potential for light rail
Not supported – not further action
NA
26. Examine potential for community bus service
Cost impact to be assessed
Community: Transport – included as an optional criteria Not considered essential due to the proximity of Catalina to existing transit centres and bus routes with 1km of the development area
27. Plan for early provision of PTA services
Commence discussion with PTA
Community: Transport. Not considered essential due to the proximity of Catalina to existing transit centres and bus routes with 1kn of the development area
EnviroDevelopment - Community TARGET: Development that encourages social capital, community spirit, sustainable local facilities, reduced
use of private motor vehicles, a sense of safety/security and accessible and flexible design that welcomes a
diversity of people and adapts to their changing needs.
ESSENTIAL ACTIONS: Project is driven by a clear vision, with defined environmental, economic and social
sustainability goals including measurable performance targets + achieve SIX of the following Eight options:
Appendix 9.6 - Recommendation Report
Page 21 of 28Appendix page 59

17 September 2011 Catalina Sustainability Initiatives Plan Phase 1 Report: Review and Recommendations
21
1. Community Consultation, Planning and Development
2. Ongoing Community Engagement and Governance 3. Transport 4. Place Making 5. Community Prosperity 6. Local Facilities 7. Safe, Accessible Communities 8. Indoor Environment Quality
The objective of the ED Community Element is to ensure strong, vibrant, prosperous, healthy and
sustainable communities. Addressing these criteria requires appropriate planning design responses,
community engagement and community development (CD), and built form design criteria.
The LSP includes planning design principles and describes various initiatives that address many of the
Community Element criteria. These include initiatives to address Transport, Place Making,
Community Prosperity, Local Facilities and Safe, Accessible Communities.
SPG’s CD and Engagement Program will also adequately address the criteria under Community Consultation, Planning and Development; and Ongoing Community Engagement and Governance. Listed below is a summary of the key aspects of the Community Element that have and/or will need to be addressed, and a rating of the likelihood to be achieved. Note ED only requires achievement of six of the following eight options.
ED Community Element Status relevant to ED Community Criteria Ability to be Achieved
Project Vision aligned to sustainability outcomes
Already addressed through TPRC vision and objectives. Will be enhanced and verified through ED certification
High
Community Consultation, Planning and Development
Already addressed through objectives of the TPRC and embedded through LSP processes Will require additional engagement to ensure community feedback has been considered and incorporated, specifically with regard to recognition of indigenous and post-European cultural heritage e.g. community art
High
Ongoing Community Engagement and Governance
To be addressed through SPG’s CD Program. Key activities may include:
- On-site CD Officer - Community grants - Engagement with and sponsorship of local
community and environment groups - Community education - specifically related to
sustainable living
High
Transport Addressed in the LSP Need to ensure inclusion of pedestrian and cycle options such as dedicated and connected paths, secure bicycle park facilities, and public transport options
High
Place Making Mostly addressed in the LSP through sub-division design, provision of community facilities, local shops, recreation and diversity of housing types and densities Need to ensure provision of affordable housing product
High
Appendix 9.6 - Recommendation Report
Page 22 of 28Appendix page 60

17 September 2011 Catalina Sustainability Initiatives Plan Phase 1 Report: Review and Recommendations
22
to 10 percent of lots, and recognition and incorporate local heritage, e.g. through community art
Community Prosperity Addressed in the LSP Need to incorporate a local community economic employment plan addressing socio-economic profiles, activities within the development e.g. retail, industrial, commercial, community based economic goals and priorities, employment targets and the job balance ratio
High
Local Facilities Addressed in the LSP High
Safe and Accessible Buildings
Some criteria are already addressed in the LSP Additional criteria will need to be addressed though built form design criteria
Low - Medium
Indoor Environment Quality Some criteria are already addressed in the SIP Initiatives 6 and 7 Additional criteria will need to be addressed though build form design criteria to achieve the IEQ criteria
Medium
Discussion:
Two key aspects of the ED Standards, which are related to all Elements, are the requirement for
education for sustainable living and behaviour change programs, and monitoring to verify
achievement of targets, specifically for energy, water and waste.
In effect this would constitute two distinct yet inter-related stages:
- Stage1: Sustainable Living Educational Workshops, conducted periodically (e.g. 1, 2 or 3
annually depending on staged releases and land sales) as part of the CD activities
- Stage 2: On-going Behaviour Change Coaching: direct phone coaching and support conducted
over a 2 - 3 year period for interested families, which incorporates data collection,
monitoring and verification
A Sustainable Living Workshops program can be developed as a key feature of the CD Program. SPG
have successfully trialled and run these program and activities in other developments. This includes
the facilitation of ‘Living Smart’ events at Evermore Heights. Living Smart, an award winning
sustainable living program, focuses on behaviour change education and includes specific goals
setting to achieve sustained change and monitor progress. A typical program runs for 6 – 7 weeks
and includes key focus areas, as listed below:
Week 1: Thinking Smart, Being Smart
Week 2: Power Smart
Week 3: Waste Smart
Week 4: Water and Gardening
Week 5: Healthy Homes Healthy You
Week 6: Move Smart and Building Community
Week 7: Excursion
The Behaviour Change Coaching Program component is a critical step in ensuring sustained
reductions in energy and water consumption. Typically these programs are operated through a
centralised tele-centre using trained behaviour change coaches, thereby providing an efficient cost
Appendix 9.6 - Recommendation Report
Page 23 of 28Appendix page 61

17 September 2011 Catalina Sustainability Initiatives Plan Phase 1 Report: Review and Recommendations
23
effective mechanism to address on-going ‘end-user’ education and behaviour change. The added
benefit of the Behaviour Change coaching is that they provide ready access to energy and water
consumption figures, which form the baseline data to monitor usage patterns and verify
achievement of targets. The verification component is critical to provide sufficient data for annual
re-certification. ED has identified the verification of targets as an essential component to be able to
qualify for re-certification on an annual basis.
While a costed model will need to be developed, the combined 2 stage approach will simultaneously
address key ED criteria.
Recommendations / Required Actions: (in addition to the supported initiatives listed in the SIP)
- Promote the sustainability vision and apply community development and engagement
initiatives to create a strong vibrant and sustainable community
- Ensure community feedback has been considered and incorporated
- Undertake and maintain on-going community engagement, with a focus on sustainable living:
- Develop a community education for sustainable living program – with a focus on direct
community engagement, behaviours change and demand management, data collection and
goals setting to achieve continuous improvement and verify targets
- Ensure inclusion of pedestrian and cycle options such as dedicated and connected paths,
secure bicycle park facilities, and public transport options
- Ensure provision of affordable housing product to 10 percent of lots/dwellings
- Include IEQ criteria in built form design guidelines
EnviroDevelopment - Ecosystem
TARGET: Development that aims to protect and enhance existing native ecosystems and encourages natural
systems and native biodiversity and rehabilitates degraded sites.
ESSENTIAL ACTIONS: Thorough site analysis completed to ascertain key features of relevance, including hydrological features, flora, fauna habitats, and landforms + achieve ALL the following requirements: - Aquatic Ecosystems - Water Sensitive Urban Design (WSUD) principles - Landform - Retain landform and/or locate on and remediate degraded and contaminated site - Flora – Site restoration and enhancement and encourage native vegetation communities, and open
space contribution - Fauna – Develop ecological corridors and facilitate native fauna habitation.
Discussion
The criteria of the Ecosystem Element have largely been addressed through and embedded in LSP
and therefore has a high likelihood of achieving certification.
The specific SIP initiatives relating to Ecosystem are SIP Initiative 14 and 15 which will largely address
the Aquatic Ecosystem / WSUD requirements.
Appendix 9.6 - Recommendation Report
Page 24 of 28Appendix page 62

17 September 2011 Catalina Sustainability Initiatives Plan Phase 1 Report: Review and Recommendations
24
Listed below is a summary of the key aspects of the Ecosystem Element that have and will need to
be addressed, and a rating of the likelihood to be achieved. In addition to the essential action, all
four categories are required to be achieved.
ED Ecosystem Element Status relevant to ED Ecosystem Criteria Ability to be Achieved
Essential Actions: Thorough site and environmental analysis
Already addressed through the LSP approval process (refer LSP Part Two – Section 13 and 14) High
Aquatic Ecosystems: including: - Protect natural surface and
groundwater - Water Sensitive Urban Design
(WSUD) principles
Already addressed through the LSP approval process, including the LWMS (refer LSP Part Two – Section 13), and referred to in SIP Initiatives 14 and 15
High
Land Form: including - Retain local and adjacent
natural landform - Reduction in cut and fill - Construction to minimise
disruption to landform and drainage
- Street layout designed and constructed to fit with topography
Already addressed through embedded in LSP approval process (refer LSP Part Two – Section 13 and 14) Will need to be confirmed through engineering drawings and specifications
High
Flora - Designate and protect sensitive
conservation areas - >90 percent of all plants are
locally native - maintenance of native flora
and habitat - Retention of the existing native
trees and locally native plants - Construction management plan
with - Contribute green space (POS)
in excess of the requirements
Already addressed through embedded in LSP approval process (refer LSP Part Two – Section 13 and 14) Will need to be confirmed through landscape design and engineering drawings
High
Fauna - Designate and protect
sensitive conservation areas - >90percent of all plants are
locally native - Maintenance of native flora
and habitat - Retention of the existing
native trees and locally native plants
- Construction management plan with
- Retain, enhance and link
Already addressed through embedded in LSP approval process (refer LSP Part Two – Section 13 and 14) Will need to be confirmed through landscape design and engineering drawings
High
Appendix 9.6 - Recommendation Report
Page 25 of 28Appendix page 63

17 September 2011 Catalina Sustainability Initiatives Plan Phase 1 Report: Review and Recommendations
25
native vegetation areas of ecological importance
- Contribute green space (POS) in excess of the requirements
Recommendations / Actions:
There are no specific recommendations for Ecosystem. Based on the above analysis, Catalina will
meet the criteria to gain ED Ecosystem certification.
- The key action is to undertake a detailed assessment of all approvals (LSP, LWMS), design
approaches and initiatives against the ED Ecosystems standards to confirm compliance and
proceed toward certification
DESIGN, & ACCREDITATION
Sustainability Initiatives Plan Relationship to EnviroDevelopment
Initiative Recommended Action
1. Apply relevant EnviroDevelopment standards for Tamala Park
Supported – need to determine which Elements for certification
This will be addressed through the scope of this report
2. Adopt the City of Wanneroo Smart Growth policy and tool, to satisfy all current planning and policy requirements.
Supported – planning consultant to be briefed
Relevant to all ED Elements Addressing the ED Elements will overwhelming satisfy the objectives of Smart Growth, which have also been addressed through the LSP
3. Identify areas within development that would benefit from Site Responsive Housing design
Cost impact to be assessed for land area west of Marmion Drive
Ecosystem: Landform criteria
Discussion:
No specific discussion is required as the process of certification is addressed though the scope of this
consultancy. The outcome is benchmarked and effectively measured by addressing the selected ED
Elements and achieving certification.
Recommendation:
Progress fulfilling the requirements for ED certification in Energy, Water, Waste, Community and
Ecosystem
Appendix 9.6 - Recommendation Report
Page 26 of 28Appendix page 64

17 September 2011 Catalina Sustainability Initiatives Plan Phase 1 Report: Review and Recommendations
26
Financial Incentives
The current project cash flow budget has allowed for a $5,000 allowance for the implementation of
selected environmental sustainability initiatives which will be required to support achieving ED
criteria, specifically for energy and water targets.
All proposed initiatives that require a financial incentive or rebate will need to be costed to fit within
the budgeted allowance of $5,000 per lot.
Based on the discussion and recommendations included in the Analysis Review and
Recommendations section, the following is recommended:
Category /
Element
Objective Initiative Incentive
amount
Rebate Received
Water
20 percent
reduction in
potable water
consumption
Groundwater fed 3rd
pipe system $3,000 per lot
NA – installed
prior to purchase
Energy
20 percent
reduction in GHG
emissions
1.5kW PV system $3,000 on 50
percent of lots
Upon completion
of the home
Peak Load
reduction /
Behaviour Change
Coaching
Load Control Devices /
Behaviour Change
Demand Management
Coaching
$1,000 on 50
percent of lots
or $2,000 on
25percent of
lots
Upon occupancy
of the home
Potable Water Reduction:
To address the Water target of a 20 percent reduction in potable water, the groundwater fed 3rd
pipe system it is recommended, as this system can achieve a 39 percent reduction (and a potential
45 percent reduction) below current averages.
Based on data from similar systems, an allowance of $3,000 per lot will be sufficient to cover cost of
installation to all lots in the development area.
GHG Reduction:
To address the Energy target of a 20 percent reduction in GHG emission, a 1.5kW PV system is
recommended. Based on the analysis in the Energy section, if 50 percent of lots/dwellings were to
install a 1.5kW PV system, the 20 percent target reduction in GHG emission can be achieved.
The logic for nominating 50 percent of lots is that this can allow a larger financial incentive - e.g. up
to $3,000 - than if 100 percent of lots were targeted which would only allow an incentive of $1,500.
The larger incentive will be critical in attaching a greater uptake of PV systems which is critical to
achieve the overall GHG reduction.
Appendix 9.6 - Recommendation Report
Page 27 of 28Appendix page 65

17 September 2011 Catalina Sustainability Initiatives Plan Phase 1 Report: Review and Recommendations
27
Peak Load Management and Behaviour Change Demand Management Coaching:
Direct Load Control Devices installed on selected appliances such as air-conditioners have been
identified as providing a significant peak load reduction, a key ED – Energy criteria.
Similarly Behaviour Change Coaching is a key initiative for supporting sustained behaviour change as
well as providing a simultaneous means of data collection to verify energy and water usage pattern
in the home.
An incentive of $1,000 on 50 percent of lots/dwellings (or $2,000 on 25 percent of lots/dwellings) for
the installation of load control devices as an enticement for attaching a sufficient number of new
occupants to a Behaviour Change Coaching program is recommended.
As stated above, the installation of direct load control devices will need to be negotiated with
Western Power; however the recommended approach provides a strong case to this agency, the
State Government, as well as the member councils of the TPRC to support an innovation approach to
energy and GHG reduction.
Appendix 9.6 - Recommendation Report
Page 28 of 28Appendix page 66

Appendix 9.7
Appendix page 67

Satterle Nigel SBrentonAnthea Hollie T
ey Team atterley – C
n Downing –Halliday –
Tucker – Pr
CEO – Project DiWA Marketroject Marke
A
irector ting Manageeting Manag
ANNUA
er ger
AL MA
C
ARKET
(M
CATAL
TING PMARCH 2
1
LINA
PLAN 2014)
Appendix 9.7
Appendix page 68

INTRO
This is t
The puractivity for this for Cataobjectivsales taCouncil
The An
ODUCTIO
the Annual
rpose of theand resultsperiod. The
alina Estateve of providargets. All ml (TPRC) an
nual Marke
1. 201
2. Key
3. Key
4. FYE
ON
Marketing P
e Annual Mas, and a strae activities oe which are ing sales w
marketing acnd the achie
eting Plan fo
3-14 Revie
y Marketing
y Marketing
E15 Market
Plan for Ca
arketing Plaategic overvoutlined in tto be achieith effectivectivities are evement of
or May 2014
w
Objectives
Activities
ing Budget
talina Estat
an is to provview and timhis docume
eved from Ae marketing
subject to athe project
4 –April 201
te dated Ap
vide a reviemeline of all ent relate to
April 2014 thactivity and
approval bytimeline.
15 includes:
ril 2014 – M
w of 2013-1marketing the key marough to Mad tools in ory the Tamal
March 2015
14 marketinactivities pl
arketing objarch 2015 wrder to meea Park Reg
2
.
ng anned ectives with the t FYE15
gional
Appendix 9.7
Appendix page 69

2013
– 14 MAARKETING ACTIV
VITY, ENQQUIRIES AAND SALES
3
Appendix 9.7
Appendix page 70

SALEThe ma2014 fofindings
In summ20km ra
*Results s
S SUMMap below is or Catalina. s and learn
mary, 44% oadius and 2
skewed by Build
ARY – Cbased on thAdditional Mof Catalina
of Purchase27% live 20k
ders and Depar
ATCHMEhe Land SaMarket Res’s buyers ci
ers live withkm or more
tment of Housi
ENT AREAles databas
search is proircumstance
hin a 10km r from Catal
ing Purchases.
A se of Purchaoposed for es.
radius of Caina.
asers from AFYE15 to fu
atalina, 29%
April 2013-urther profil
% live within
4
March e these
n a
Appendix 9.7
Appendix page 71

5
KEY MARKETING OBJECTIVES
Marketing Objectives
1. Lead Generation & Achieving Sales Targets: Generate qualified leads to the sales office with the objective of meeting the FYE15 sales target of 250. a. Provide high quality sales tools and assist in sales conversion communications b. Maintain presence in the market
2. Deliver and promote the opening of the Central Precinct Permanent Sales Office
3. Promotion of Display Village 1
4. Reinforce and capitalise on the strength of TPRC and Satterley partnership
5. Leverage strength of Satterley brand and unique marketing advantages
6. Maintain a presence in the competitive (northern corridor) marketplace
7. Leverage site assets: a. Coastal proximity b. Proximity to readily accessible infrastructure and amenities c. Wide choice of lots d. Sustainability e. Established and future public open spaces
8. Develop strategy and brand for the Western and Eastern cells
Key Initiatives Related Strategy Budget
1. Estate campaigns
a. Align with stage releases b. Maintain a presence in the market c. 24 home display village d. Permanent sales office – Central Precinct
The purpose of the Estate Campaigns is to raise the profile and increase awareness of Catalina Estate and its land releases by maintaining a presence in the marketplace.
Current sales at Catalina have proven successful, and therefore the frequency of marketing activity is recommended to be maintained. 2013 saw new competitors emerging in the Northern Suburbs and an increase in the frequency of marketing campaigns is recommended in the event that a reduction in lead generation and sales occurs.
Below lists the planned stage releases within the 12 month period April 2014 to March 2015:
Stage Date Number of Lots
12A May 14 23
12B July 14 23
6B Aug 14 Display Village
• Lead generation • Achieve sales targets • Positioning • Awareness • Catalina Brand
Advertising & Direct Marketing
Appendix 9.7
Appendix page 72

6
13 Builders Sept 14 26
13A Sept 14 29
13B Oct 14 28
14 Builders Dec 14 24
14 Dec 14 36
15A March 15 35
15B April 15 34
Public advertising is to occur a minimum of 7 days prior to a release, advising to the public that the release is to occur.
Media channels will be recommended at that time based on research and recommendations presented by the media buyer relative to Catalina’s target markets.
For each stage release it is recommended the following media channels are considered:
a. Local press advertising – targets areas surrounding the estate and demonstrated sales catchment is cost effective and provides good PR opportunities
b. Major press advertising – recommended for state‐wide reach. Targeted real estate features are recommended and have longevity
c. Online advertising – a growing market, which provides the ability to target specific suburbs and has shown increasingly effective results to date
d. EDM – to Catalina Registration of Interest database
2. Advertising Messaging Refresh
Refresh current advertising concept, to remain aligned with the current Catalina branding and style guide, however to ensure cut‐through.
New messaging to communicate Catalina’s current position to the marketplace, in line with the site assets listed in Marketing Objectives.
An update of the estate photography is highly recommended to take place as part of this advertising refresh.
• Lead generation • Meet sales targets • Positioning • Awareness • Catalina Brand
Advertising, Direct Marketing & Photography
3. Marketing collateral a. Brochure and presentation folder reprints
as required (aligned with new refreshed messages and photography)
b. Estate Map and Amenities flyer reprints
• Positioning • Satterley /TPRC Brand • Lead generation
Estate Brochures & Folders
Appendix 9.7
Appendix page 73

7
c. Sales map creative review
4. Display Village 1 a. Promote the Display Village b. Display Village Guide
• Positioning • Lead generation • Awareness • Catalina
Signage Advertising & Direct Marketing
5. Market Research
Catalina is at the stage where further market research is required in order to establish the following:
a. Review the catchment area to ensure the current areas for advertising are still applicable and whether there are any additional suburbs we should be targeting; and
b. Identify key demographics of Catalina’s purchasers and prospective purchasers and their reasons for purchasing.
Three recommended market research pieces that will be beneficial in establishing the above are:
a. Customer Tracker Buyers Research b. Geomapping Update and Analysis c. Profiling of Geographical Draw Area and
Analysis
Other optional market research pieces for consideration include:
a. Quarterly Sales Update b. Annual Sales Report c. Dashboards
• Targeting of marketing activity so as to achieve effective lead generation and sales targets.
• Required for Western and Eastern Cell Marketing Strategy development and branding activities to identify target markets and key demographics
Strategy, Research and Branding
6. Central Precinct Permanent Sales Office a. Interior Design and Fit‐out b. External and internal directional signage c. Promotion via EDM and website and new
address on any press advertising
• Positioning • Lead generation • Awareness • Catalina Brand
Sales Office & Builder Relations
Appendix 9.7
Appendix page 74

8
MARKETING EXPENDITURE Category Budget Plan
FYE 14
Description Budget
Brand
Development
Market Research
Photography
Customer Tracker set up, ongoing
management, buyer interviews
Geomapping update and analysis
Profiling of geomap draw areas
Quarterly Sales Update
Annual Sales Report
Marketsight Dashboards
Western & Eastern Cell
Commission research
Marketing strategy development
Branding development
Revised Estate Photography
Image Rights extension 24 months
$100,000
$52,000
$15,500
Sales Office
and Builder
Relations
Sales Office Fit‐out Interior Designers Fees (contingency for additional
scope of works)
$10,000
Sales Office Internal
Signage
Signage reskins$10,000
Builder Relations /
Events
Builders function for Recycling Program, Marketing
Contribution to Display Village Promotion $12,000
Estate
Brochures and
Folders
Sales Brochure
Reprints $30,000
Folders
$15,000
Display Village Guide
$12,00 rolled over from FY14 $20,000
Map & Amenities
Flyers Updates and reprinting as required $15,000
Sales Maps 250 lots at $70 per lot, $500 for 4 web plans
$20,000
Advertising
and Direct
Marketing
Estate Advertising Sales Release Media & Production
$70,000
Other media ‐
Special Features
Includes advertising in Weekend West or Sunday Times
Feature Lift outs including Land Report, Property
Report, River or Sea Feature, Coastal Living Feature,
First Home Buyers Feature ‐ such informative reports
$20,000
Appendix 9.7
Appendix page 75

9
are targeted and have longevity.
Other Advertising
Production
Production of additional advertising outside of the
release periods, for example special features, builder
release advertisements.
Including pre‐promotion and launch of Western Cell
which is scheduled for its first release in June 2015.
$20,000
Display Village
promotion ‐ media &
production
Advertising campaign inclusive of media and production
to advertise the display village and support builders.
Campaign may include major and local press advertising,
online advertising, and direct mail to catchment area.
$30,000
Signage Estate Signage Signage maintenance after implementation of signage
strategy in FY14. $20,000
Maintenance Signage maintenance after implementation of signage
strategy in FY14.‐ includes allowance for storm damage,
vandalism and general wear and tear to signs and
banner mesh requiring repairs, re‐skinning or
reattaching to fence; flag rotation quarterly
$30,000
Website Retainer $2,100
Promotions Special Promotions Rolled over from FY14 for estate promotions
$50,000
Public
Relations
Public Relations
PR Consultant Fees, Media Monitors, PR Photography
Allowance $10,000
Sales and
Marketing
Contingency
5% contingency on
all items
$27,580
Total $579,180
Appendix 9.7
Appendix page 76

10
APPENDICES SWOT ANALYSIS
Weaknesses Threats
Limited amenities within the estate Lack of beach access Difficulty in developing beach access Public transport is limited Landfill site in close proximity
Buyer perception of West vs. East Marmion Value comparisons in the area Risk averse project owners Threat of loss in advertising market share in
Northern Corridor due to many other competing estates
Market volatility - threat of future interest rate rises reducing affordability
Less migration to the area Negative perceptions of Clarkson area
transferred to Catalina High level of rental housing Environmental impacts from Tamala Park
landfill
Strengths Opportunities
Proximity to the beach Urban infill land, verses frontier development Access to surrounding amenities such as
Mindarie Marina, train station, Ocean Keys Future planned amenities Satterley brand association with the
development Innovations (once finalised) Great accessibility to Clarkson Train Station Proximity to Perth CBD (compared to other
northern corridor competitors).
Breadth of project creates diversity – 2.4km. Capitalise on the existing amenities in
surrounding suburbs Wide mix of housing density options “Bush Forever” to the south of the
development New sales office located near Marmion Ave FHB grant change Baby boomers moving into retirement More projects planned for the Catalina area
(Alkimos, Yanchep) - increase in both traffic and attention to area
Early establishment of neighbourhood activity centre, childcare site along with other community services
Trading Conditions –
Following strong sales results and price growth in 2013, the most recent release has shown the
market has softened in recent months. For example the stage 11 release in March 2014 received 13
registrations compared to 37 registrations received for the stage 10 release in February
2014. Notwithstanding the most recent sales result is still sound and would appear to indicate a
return to normal market conditions, following a shortage of supply in the northern corridor in the
preceding 12 month period.
Appendix 9.7
Appendix page 77

Out(ext
Affoyea Out
tlook for Restract from th
ordability coar and the tw
tlook for Res
The meSeptem
Overallfirst ho
Trade‐ulifted, wquarter
sidential Prohe Catalina S
ontinues to imwo further cu
sidential Pro
edian house pmber‐13.
, the highestme buyers m
up activity inwith the $600r
operty Affotrategic Mar
mprove in linuts made in M
operty – Wes
price in Pert
t percentagemaking up 29
the $450k ‐0k ‐ $700k ra
ordability rketing Plan
ne with interMay & July 2
stern Austra
h, excluding
e of sales ma9% in the hou
$700k priceange showin
2014 p.20 It
est rate cuts013.
alia
Mandurah/
de sit in the using market
e ranges showg a marked i
tem 3.2)
s made over
Murray, was
$400k – $45t.
ws consumerincrease sinc
the 2012 ca
s $508,000 a
50k price ran
r confidencece the March
11
lendar
s at
ge, with
e has h‐13
Appendix 9.7
Appendix page 78

12
Market Drivers – Western Australia
The market remains underpinned by ongoing investment in mining and energy, albeit this is starting to decline.
Population growth still robust at 82,600, driven by a 19% increase in overseas migration when compared to the previous year, and ongoing strong interstate migration.
Non‐mining investment is starting to decline of the highs in 2012.
Resource sector investment still strong, $142 billion worth of significant resource projects either under construction or awaiting a final investment decision (as at Sep‐13). Workforce requirements for the construction of these projects is expected to peak in 2014. From 2015, the decline in the construction workforce is expected to be partially offset by increased workforce requirements for operational staff.
State and Federal Government construction and infrastructure projects continue to boost the construction industry as a result of population growth.
Increased consumer confidence is set to underpin the WA economy, with consumer spending expected to increase by 5% over the 2013/14 financial (CCI media statement 24 Apr‐13).
Constrained land supply, slow state and federal development approvals and tight bank funding conditions resulting from Basel III compliance.
Residential land sales remain robust across all growth corridors and we are seeing a small increase in rental vacancy rates.
As a result of the above, buyers are becoming less cautious and are more willing to take on larger debt and purchase their own home. Catalina has seen this improvement in the market by the high level of enquiry and traffic to the sales office, which has resulted in a high level of sales and regular turnover of stock. The trading conditions are conducive to meeting budget realisations including the assumed escalation rates within the approved cashflow.
Appendix 9.7
Appendix page 79

Appendix 9.8
Appendix page 80

Satterley Property Group, Level 2, 18 Bowman St, South Perth WA 6151 (08 9368 9000) Page 1
TAMALA PARK – CATALINA
LOT SALE & RELEASE STRATEGY
MARCH 2014
Introduction In February 2013, the Council of the TPRC approved the Lot Sale and Release Strategy for Catalina which outlined a sales strategy for the remaining lots zoned Urban in the Central Cell and the initial stages of the Western Cell. Sales releases since February 2013 have included:
Sales directly to the public – online release process.
Builder allocation of medium density lots under put options – tender process.
The release of 2 group housing sites – tender process This document outlines the sales and lot release strategy proposed by the Satterley Property Group for approval by the TPRC for Stages 12 to 15 in the central cell and stage 25 in the Western Cell, being the sales releases planned up to 30 June 2015. We have not provided a strategy beyond this date as it is likely the strategy would change prior to implementation. Set out below is a recommended process for:
Future builder releases.
Future public releases.
Lot release and staging strategy up to June 2015. The strategy is contingent on timely development approvals, WAPC subdivision approval and sufficient sales being obtained. Medium Density Builders Allocation – Builder Release In February 2013 the TPRC Council approved the tender procedure for medium density lots. This process required suitably qualified building companies to tender for packages of medium density lots, with builders being ranked in accordance with the approved selection criteria with the highest ranked builder receiving the first selection. The tender procedure represents a fair and efficient methodology for the sale of medium density lots and has yielded good results for all releases that have occurred to date. It is recommended to continue with this procedure for future builder’s releases. It is proposed to use the previously approved selection criteria to assess tenders. Additionally where mandatory 2 storey lots are included as optional lots within an allocation it is proposed priority is given to builders who include the 2 storey lots in their allocation. In February 2013 the TPRC Council also approved that the option period be set at 12 weeks from approval of the allocation or the estimated date of titles, whichever is later. In December 2013 the TPRC Council amended the approved Put Option Period for mandatory 2 storey lots to 16 weeks from entering into the Put Option. Since February 2013 all lots allocated to builders were sold to the public
Appendix 9.8
Appendix page 81

Satterley Property Group, Level 2, 18 Bowman St, South Perth WA 6151 (08 9368 9000) Page 2
within the initial 12 week put option period. On this basis it is recommended the Put Option periods are maintained with a slight variation to the wording. It is recommended that the following Option Period is set for medium density lots:
- Put Option Commencement Date: 10 weeks following acceptance of the Put Option Agreement or issue of titles, whichever is the later.
- Put Option Expiry Date: 2 weeks following the Put Option Commencement Date It is recommended that the following Put Option Period is set for mandatory two storey lots:
- Put Option Commencement Date: 14 weeks following acceptance of the Put Option Agreement or issue of titles, whichever is the later.
- Put Option Expiry Date: 16 weeks following the Commencement Date The lots proposed to be sold under the medium density tender process have been selected in order to achieve a uniform streetscape in medium density precincts, and capitalise on the costs efficiencies of constructing multiple dwellings, leading to increased affordability to end users. Public Release The sale procedure – Private Purchaser Lots, was approved by the TPRC Council in February 2013 with amendment in April 2013 to revert to the online sales release process, due to the strong demand for the stage 7 release. A revised procedure was also approved by the TPRC in June 2013 for the stage 6C release which set a reserve price and allowed purchasers to submit a higher price for premium lots with ocean glimpses. To date all public releases have utilised the online release procedure which has yielded positive sales results. The procedure has also overcome the risk of purchasers camping out at the Catalina development during periods of high demand and is a transparent process that is easily audited. Many competitors are now using similar online release processes. It is proposed the internet release process continues in the following manner:
Public advertising to occur a minimum of 7 days prior to a release, advising the public that a release is to occur. Public advertising may utilise a variety of mediums, including state wide press, local press, website, direct mail or signage.
Registrants will be able to register online for a 48 hour period from the commencement of the release. Registrations will include the registrant nominating three preferred lots and whether they will be purchasing by cash offer or subject to finance;
Registrants will then be allocated a lot based:
o firstly by the finance status of the registration. Cash / unconditional offers will be given preference over offers subject to finance;
Appendix 9.8
Appendix page 82

Satterley Property Group, Level 2, 18 Bowman St, South Perth WA 6151 (08 9368 9000) Page 3
o secondly by the time of registration. The earlier the registration, the higher the preference.
Subject to availability registrants will be allocated a lot in accordance with their preferences;
Following the completion of allocations, any registrants who were not allocated a lot will be offered first preference of any remaining lots, before the remaining lots are released to the market;
Purchasers are required to sign an offer and acceptance within 7 days of being notified of their allocation.
Lot Sale & Release Plan
The lot release staging and sales method is represented on the attached plan (Annexure A) to provide an overview of the strategy to be employed.
A summary of this information is provided on a Stage basis as listed below. It is noted that detailed subdivision design has been completed over stages 6B, 12 & 13 only, with preliminary design available for the balance of the stage releases considered below. Release yields and lot typologies are therefore subject to detailed design and statutory approvals, which may lead to some variations in staging boundaries and yields.
Stage 12A
Date of Release May 2014
Forecast Stock 23 lots
Forecast Title Date December 2014
Method of Sale Public Release
Stage 12B
Date of Release July 2014
Forecast Stock 23 lots
Forecast Title Date December 2014
Method of Sale Public Release
Stage 6B (Second display village)
Date of Release August 2014
Forecast Stock 25 display home lots
Forecast Title Date January 2015
Appendix 9.8
Appendix page 83

Satterley Property Group, Level 2, 18 Bowman St, South Perth WA 6151 (08 9368 9000) Page 4
Method of Sale Public Tender – Details to be provided in separate recommendation.
Stage 13 Builder Release
Date of Release September 2014
Forecast Stock 26 lots, consisting of 14 rear loaded and 12 front loaded medium density lots
Forecast Title Date March 2015
Method of Sale Medium Density Builder Allocation Tender
Stage 13A Public Release
Date of Release September 2014
Forecast Stock 29 lots
Forecast Title Date March 2015
Method of Sale Public Release
Stage 13B Public Release
Date of Release October 2014
Forecast Stock 28 lots
Forecast Title Date March 2015
Method of Sale Public Release
Stage 14 Builder Release
Date of Release December 2014
Forecast Stock 24 lots
Forecast Title Date June 2015
Method of Sale Medium Density Builder Allocation Tender
Stage 14 Public Release
Appendix 9.8
Appendix page 84
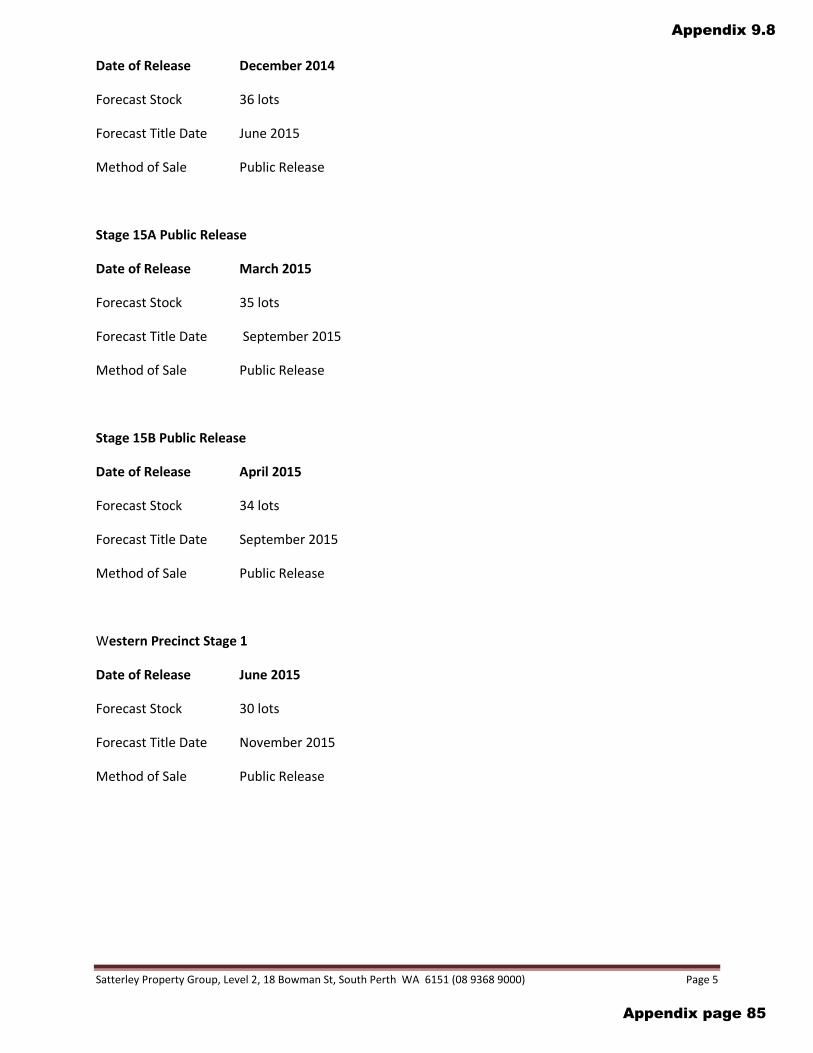
Satterley Property Group, Level 2, 18 Bowman St, South Perth WA 6151 (08 9368 9000) Page 5
Date of Release December 2014
Forecast Stock 36 lots
Forecast Title Date June 2015
Method of Sale Public Release
Stage 15A Public Release
Date of Release March 2015
Forecast Stock 35 lots
Forecast Title Date September 2015
Method of Sale Public Release
Stage 15B Public Release
Date of Release April 2015
Forecast Stock 34 lots
Forecast Title Date September 2015
Method of Sale Public Release
Western Precinct Stage 1
Date of Release June 2015
Forecast Stock 30 lots
Forecast Title Date November 2015
Method of Sale Public Release
Appendix 9.8
Appendix page 85

P.A
.W.
P.A
.W.
P.A
.W.
P.A
.W.
PublicOpenSpace
POSPOSPOSPOSPOS
Public OpenSpace & Drainage
STAGE 3
STAGE 1
STAGE 4
STAGE 2
Public OpenSpace
POS
POS
STAGE 9
STAGE 10
STAGE 11
STAGE 5
STAGE 7
STAGE 8
STAGE 16
STAGE13
STAGE12
STAGE14
STAGE15
STAGE 18
STAGE 17
NEERABUP ROAD
CO
NN
OLLY D
RIVE
MA
RMIO
N A
VENUE
STAGE6B
STAGE 6
POS
WESTERNPRECINCT STAGE 1(indicative only)
PREVIOUSRELEASES
plan no: 2228-272A-01scale: 1:5,000 @ A3
date: 03.04.2014This plan is current at the revised date & subject to approval, survey & engineering detail. This plan remains the property of CLE ©
T:(+618) 9382 1233 F:(+618) 9382 1127
www.cleplan.com.au
All road carriageway detail depicted on this Plan including pavements, road treatments,medians and parking are for illustrative purposes only and are subject to final engineeringdesign and any relevant approvals. The detail reflects the intent of the road networkstandards preferred for this subdivision.
Appendix 9.8
Appendix page 86