minimal mass transfer across dolomitic granular fault cores
TRANSCRIPT
Minimal mass transfer across dolomitic granular fault cores
Andrea Billi, Paolo Primavera, Michele Soligo, and Paola TuccimeiDipartimento di Scienze Geologiche, Universita ‘‘Roma Tre,’’ Largo S. L. Murialdo 1, I-00146 Rome, Italy([email protected])
[1] The role of chemical changes and mass transfer in the formation of granular fault cores across carbonatestrata is still unclear. Thirteen granular fault cores across strata of dolostone from Sperlonga, central Italy,are analyzed by chemical and physical methods. The analyzed faults are reverse or transpressional, up toabout 1 m thick, and flanked by a host rock affected by a widely developed solution cleavage. Grain sizedistributions of fault core rocks are determined by a sieving procedure for grains larger than 63 mm.Mechanisms of grain comminution are inferred by microscopic analyses on a set of thin sections obtainedfrom epoxy-impregnated fault rock samples. Concentrations of calcium and magnesium in the fault coresand in the adjacent host rock are determined by titrimetry. Results show that both the breccia and the gougeforming the fault cores show little evidence for mass transfer, regardless of the fault type and grain sizedistribution of fault rocks. We interpret these results as chiefly the effect, within the fault core, of a stronglyreduced permeability, which impeded significant mass transfer processes through solute transport. Itfollows that grain comminution occurred mostly by brittle processes such as crushing and abrasive wear.Previous work suggests that these results are rather generalizable; some exceptions, however, compelfurther research on the role of circulating fluids and mass transfer in the formation of carbonate fault rocks.
Components: 10,187 words, 10 figures, 5 tables.
Keywords: fault zones; fault breccia; gouge; pressure solution.
Index Terms: 8118 Tectonophysics: Dynamics and mechanics of faulting (8004); 8012 Structural Geology: High strain
deformation zones; 8030 Structural Geology: Microstructures; 5114 Physical Properties of Rocks: Permeability and porosity;
8045 Structural Geology: Role of fluids.
Received 11 July 2007; Revised 28 September 2007; Accepted 15 November 2007; Published 5 January 2008.
Billi, A., P. Primavera, M. Soligo, and P. Tuccimei (2008), Minimal mass transfer across dolomitic granular fault cores,
Geochem. Geophys. Geosyst., 9, Q01001, doi:10.1029/2007GC001752.
1. Introduction
[2] Fault cores consist of very fine-grained alteredfault rocks that reflect high shear deformation,extreme comminution, and, possibly, enhancedfluid-rock reactions [Chester et al., 1993; Caineet al., 1996; Evans et al., 1997]. In fault cores, anypreexisting rock fabric is usually obliterated by thefault-related shear deformation. Such deformationmay involve frictional-brittle mechanisms, such as
grain crushing and abrasive wear, or frictional-plastic/viscous and plastic/viscous mechanisms,such as ductile flow, frictional melting, and pres-sure solution [Sibson, 1986; Rutter et al., 2001].Knowledge of the tectonic mechanisms that oper-ated to form the fault core rocks is fundamental tounderstand the hydraulic [e.g., Antonellini andAydin, 1994; Jefferies et al., 2006; Micarelli etal., 2006] and seismic [e.g., Di Toro et al., 2006;Hirose and Shimamoto, 2005; Wibberley and
G3G3GeochemistryGeophysics
Geosystems
Published by AGU and the Geochemical Society
AN ELECTRONIC JOURNAL OF THE EARTH SCIENCES
GeochemistryGeophysics
Geosystems
Article
Volume 9, Number 1
5 January 2008
Q01001, doi:10.1029/2007GC001752
ISSN: 1525-2027
ClickHere
for
FullArticle
Copyright 2008 by the American Geophysical Union 1 of 18
Shimamoto, 2005; Yasuhara et al., 2005; Knuthand Marone, 2007; Han et al., 2007] properties offault cores. Significant mass removal and chemicalchanges accomplished via pressure solution pro-cesses, for instance, can occur only in the presenceof circulating fluids [e.g., Rutter, 1983; Kennedyand Logan, 1997]. In a fault core, therefore, therecognition of bulk mass removal and chemicalchanges may provide important insights into therole of circulating fluids during faulting [e.g.,Renard et al., 2000; Yasuhara et al., 2005].
[3] Distributed fracturing, crushing, and abrasivewear of grains have been recognized as the mainphysical processes driving the development ofgranular fault cores across strata of both limestoneand dolostone [Babaie et al., 1995; Storti et al.,2003, 2007; Micarelli et al., 2006; Agosta andAydin, 2006]. In contrast, despite the well-knownaptitude of carbonate rocks to dissolve under
tectonic stress [e.g., Alvarez et al., 1976], exceptingone study by Hadizadeh [1994], the role of chem-ical changes and mass transfer in the formation offault rocks across carbonate strata has not been sofar quantitatively established. This lack of knowl-edge significantly restrains the full comprehensionof the hydraulic and seismic properties of carbon-ate fault cores, which are known both as potentialhydraulic barriers or conduits in hydrocarbon andwater reservoirs [e.g., Celico et al., 2006], and aspotential foci for seismic faulting [e.g., Miller etal., 2004].
[4] The aim of this study is to determine theamount of mass (i.e., calcium and magnesium)transfer across granular fault cores developed instrata of dolostone and, subsequently, to infer therole of circulating fluids in the formation of thefault core rocks. To do so, we report and discussthe results from chemical and physical analyses
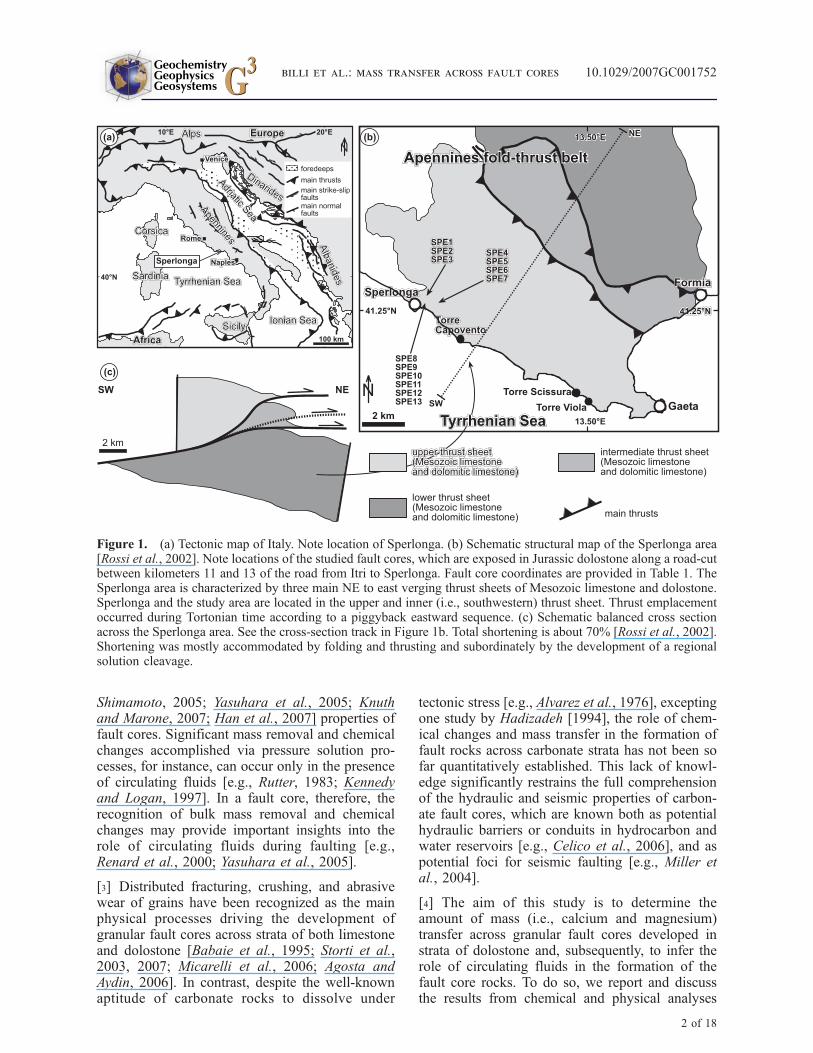
Figure 1. (a) Tectonic map of Italy. Note location of Sperlonga. (b) Schematic structural map of the Sperlonga area[Rossi et al., 2002]. Note locations of the studied fault cores, which are exposed in Jurassic dolostone along a road-cutbetween kilometers 11 and 13 of the road from Itri to Sperlonga. Fault core coordinates are provided in Table 1. TheSperlonga area is characterized by three main NE to east verging thrust sheets of Mesozoic limestone and dolostone.Sperlonga and the study area are located in the upper and inner (i.e., southwestern) thrust sheet. Thrust emplacementoccurred during Tortonian time according to a piggyback eastward sequence. (c) Schematic balanced cross sectionacross the Sperlonga area. See the cross-section track in Figure 1b. Total shortening is about 70% [Rossi et al., 2002].Shortening was mostly accommodated by folding and thrusting and subordinately by the development of a regionalsolution cleavage.
GeochemistryGeophysicsGeosystems G3G3
billi et al.: mass transfer across fault cores 10.1029/2007GC001752
2 of 18
done on 59 rock samples from 13 fault cores andadjacent host rocks exposed near the village ofSperlonga, central Italy (Figure 1 and Table 1). Thestudied exposures are located in the inner (i.e.,Tyrrhenian) sector of the east verging Apenninefold-thrust belt, which developed during Neogenetime within the framework of convergence betweenthe African and Eurasian plates [Malinverno andRyan, 1986]. We chose to analyze reverse andtranspressional faults within a fold-thrust belt be-cause these types of faults within such a tectonicenvironment are often associated with intense pres-sure solution processes principally occurring incarbonate rocks [e.g., Engelder, 1984].
2. Geological Setting
[5] The studied fault cores occur across strata ofJurassic, shallow-water, dolostone (see auxiliarymaterial1 Figure S1 for XRD analyses). This rockis hereafter named host rock and includes both theregionally deformed (i.e., dissolutionally cleaved)strata and the strata adjacent (i.e., within a maxi-mum of about 1 m) to the fault cores that containjoints and small faults connected with faulting andfault core development. The host rock is part of amore than 4-km-thick, late Triassic-middle Mio-cene, sedimentary succession of shallow-waterlimestone and dolostone [Accordi and Carbone,1986].
[6] The study area was involved in the orogen-related folding and thrusting during Tortonian time[Cosentino et al., 2002]. The contractional tecton-ics generated imbricate sheets bounded by NE toeast verging thrust, reverse, and transpressionalfaults [Rossi et al., 2002]. During contractionaldeformation, the host rock experienced thermo-baric conditions below the metamorphic regime(i.e., below a temperature of 200�C and a pressureof 200 MPa) as evidenced by the lack of metamor-phic rocks in the Sperlonga area and in the entirecentral Apennines [Accordi and Carbone, 1986;Bigi et al., 1992]. In the Sperlonga and adjacentareas, no evidence is known of thrust sheetsoverlying the thrust sheet, in which the studiedfault cores occur [Cosentino et al., 2002; Rossi etal., 2002]. It is therefore inferred that the studiedfault cores developed under a lithostatic maximumload imposed by a rock column of less than about3–4 km. For carbonate rocks, such a rock column(i.e., 4 km) corresponds to a lithostatic stress of
about 100 Mpa and, by assuming a geothermalgradient of 25�C km�1, to a temperature of about100�C.
[7] Sedimentary evidence and rock ages in theSperlonga and adjoining areas show that the exhu-mation of this sector of the Apennine belt started atthe end of Tortonian time and was mostly accom-plished by the end of Messinian time [Cipollariand Cosentino, 1995; Cosentino et al., 2002].
3. Methods and Results
3.1. Host Rock, Fault Cores, andEstimate of Fault Displacement
[8] The host rock and the structural architecture ofthe studied fault cores are conceptually schema-tized in Figure 2 and documented by the photo-graphs shown in Figures 3 and 4.
[9] The host rock is affected by a pervasive solu-tion cleavage defined by subvertical or high angle,closely spaced, solution surfaces (Figures 3 and 4)whose geometry and kinematics are consistent withthe regional contractional event that generated eastvergent thrust imbrications. Exposed fracture andcleavage surfaces in the host rock are often kar-stified (i.e., dissolutionally weathered [e.g., Billi etal., 2006]), whereas no evidence of karstificationoccurs in the fault cores (Figure 5). In approachingthe fault cores, the cleavage domains (i.e., rocklithons bounded by two adjacent and subparallelcleavage surfaces) are progressively affected byjoints. This shows that the formation of the solutioncleavage mostly predated that of the transversejoints as well as that of the fault cores [e.g., Salviniet al., 1999]. This is demonstrated by the occur-rence of lenses or slices of cleaved dolomiteincorporated within the granular fault cores(Figures 3c and 3d). The fault core SPE13, forinstance, incorporates a large slice of cleaveddolomite (Figures 3c and 3d). The cleavage attitudeis about the same in the fault core and in the faulthangingwall and footwall blocks (Figure 3e). In thefault core, a lesser dip (i.e., by about 15�) and aslightly rotated strike (i.e., by about 15�) of thecleavage surfaces with respect to the ones occur-ring in the hangingwall and footwall blocks ispresumably the effect of fault slip on the preexist-ing cleavage domains. In the SPE13 fault core, thecrosscutting relationship between the fault brecciaand the solution cleavage (i.e., the cleavage surfa-ces abut against the fault breccia; Figure 3d) showsthat the breccia developed from the cleaved dolo-1Auxiliary materials are available in the HTML. doi:10.1029/
2007GC001752.
GeochemistryGeophysicsGeosystems G3G3
billi et al.: mass transfer across fault cores 10.1029/2007GC001752billi et al.: mass transfer across fault cores 10.1029/2007GC001752
3 of 18
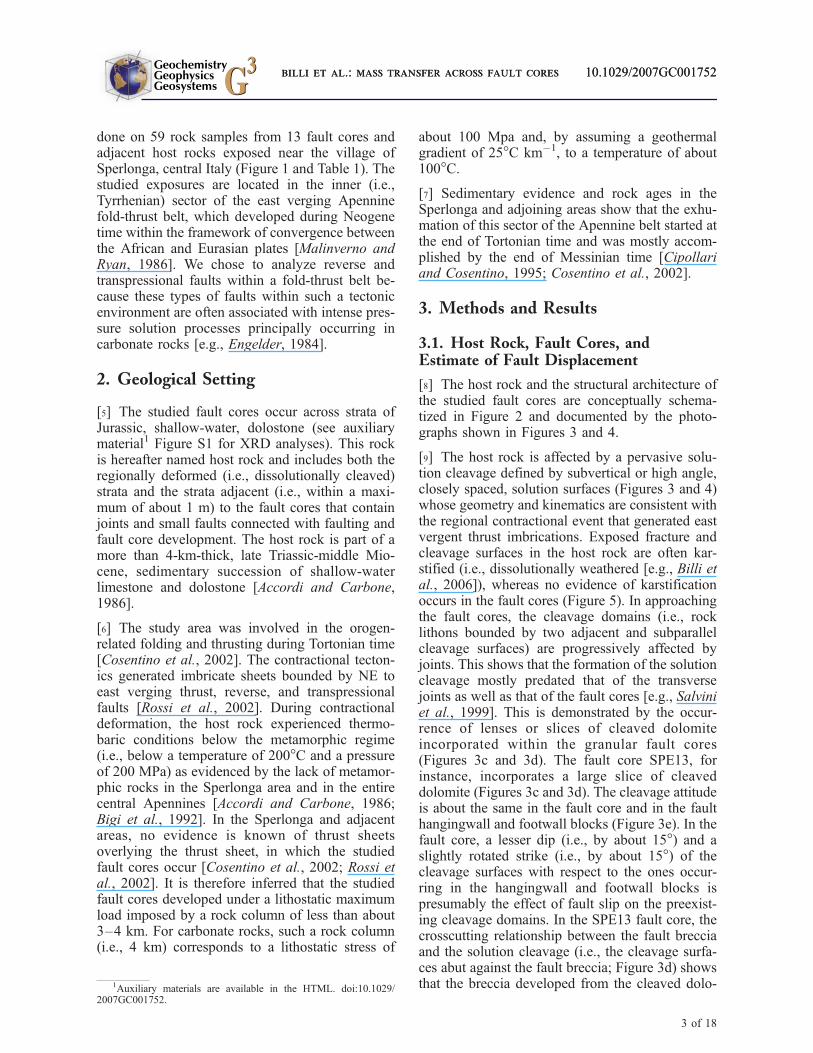
Table 1. Analyzed Fault Cores and Samplesa
Fault
Core Latitude N Longitude E
Fault
Kinematics Sample Sample Location
Sample
Weight, g
Type of
Analysis
SPE1 41�15033.0600 13�26022.7500 reverse SPE1a host rock (footwall) 112.33 C
SPE1 same as above same as above reverse SPE1b host rock (lens in fault core) 176.11 C
SPE1 same as above same as above reverse SPE1c gouge zone 631.05 C, GSD, OM
SPE1 same as above same as above reverse SPE1d breccia zone 1292.16 C, GSD, OM
SPE1 same as above same as above reverse SPE1f host rock (hangingwall) 98.74 C
SPE2 41�15032.9100 13�26023.0200 reverse SPE2a host rock (footwall) 142.21 C
SPE2 same as above same as above reverse SPE2b host rock (lens in fault core) 103.l6 C
SPE2 same as above same as above reverse SPE2d gouge zone 793.87 C, GSD, OM
SPE2 same as above same as above reverse SPE2e breccia zone 1186.27 C, GSD, OM
SPE2 same as above same as above reverse SPE2f host rock (hangingwall) 75.45 C
SPE3 41�15032.4500 13�26024.6300 transpressional SPE3a gouge zone 857.27 C, GSD, OM
SPE3 same as above same as above transpressional SPE3b gouge zone 610.5 C, GSD, OM
SPE3 same as above same as above transpressional SPE3c breccia zone 1720.87 C, GSD, OM
SPE3 same as above same as above transpressional SPE3d host rock (footwall) 118.4 C, XRD
SPE3 same as above same as above transpressional SPE3e host rock (hangingwall) 221.46 C
SPE4 41�15032.4500 13�26025.0600 transpressional SPE4a gouge zone 704.56 C, GSD, OM
SPE4 same as above same as above transpressional SPE4b breccia zone 1469.88 C, GSD, OM
SPE4 same as above same as above transpressional SPE4c host rock (footwall) 89.66 C, XRD
SPE4 same as above same as above transpressional SPE4d host rock (hangingwall) 104.78 C
SPE5 41�15032.6900 13�26026.1100 transpressional SPE5a gouge zone 1211.51 C, GSD, OM
SPE5 same as above same as above transpressional SPE5b breccia zone 958.36 C, GSD, OM
SPE5 same as above same as above transpressional SPE5c breccia zone 2503.39 GSD, OM
SPE5 same as above same as above transpressional SPE5d host rock (hangingwall) 109.75 C, XRD
SPE5 same as above same as above transpressional SPE5e host rock (footwall) 88.54 C
SPE6 41�15032.7100 13�26035.1300 transpressional SPE6a host rock (footwall) 119.17 C
SPE6 same as above same as above transpressional SPE6b gouge zone 1537.62 C, GSD, OM
SPE6 same as above same as above transpressional SPE6c breccia zone 1917.87 C, GSD, OM
SPE6 same as above same as above transpressional SPE6d host rock (hangingwall) 48.44 C
SPE7 41�15032.2500 13�26036.6000 transpressional SPE7a host rock (footwall) 278.54 C
SPE7 same as above same as above transpressional SPE7b gouge zone 2127.86 C, GSD, OM
SPE7 same as above same as above transpressional SPE7c breccia zone 1412.88 C, GSD, OM
SPE7 same as above same as above transpressional SPE7d host rock (hangingwall) 194.12 C
SPE7 same as above same as above transpressional SPE7e gouge zone 1840.62 GSD, OM
SPE8 41�15031.6100 13�26021.7600 reverse SPE8a host rock (hangingwall) 177.66 C
SPE8 same as above same as above reverse SPE8b gouge zone 1298.07 C, GSD, OM
SPE8 same as above same as above reverse SPE8c breccia zone 1590.72 C, GSD, OM
SPE8 same as above same as above reverse SPE8d host rock (footwall) 121.27 C
SPE9 41�15031.9000 13�26021.2300 transpressional SPE9a host rock (hangingwall) 93.33 C
SPE9 same as above same as above transpressional SPE9b gouge zone 58.71 C, OM
SPE9 same as above same as above transpressional SPE9c breccia zone 111.19 C, OM
SPE9 same as above same as above transpressional SPE9d host rock (footwall) 179.78 C
SPE10 41�15032.5800 13�26020.8100 transpressional SPE10a host rock (hangingwall) 212.34 C
SPE10 same as above same as above transpressional SPE10b gouge zone 65.78 C, OM
SPE10 same as above same as above transpressional SPE10c breccia zone 71.76 C, OM
SPE10 same as above same as above transpressional SPE10d host rock (footwall) 77.98 C
SPE11 41�15032.5800 13�26020.5200 transpressional SPE11a host rock (footwall) 248.65 C
SPE11 same as above same as above transpressional SPE11b gouge zone 55.71 C, OM
SPE11 same as above same as above transpressional SPE11c breccia zone 69.97 C, OM
SPE11 same as above same as above transpressional SPE11d gouge zone 49.76 C, OM
SPE11 same as above same as above transpressional SPE11e host rock (hangingwall) 101.32 C
SPE12 41�15032.9300 13�26020.1500 reverse SPE12a host rock (hangingwall) 85.87 C
SPE12 same as above same as above reverse SPE12b gouge zone 45.32 C, OM
SPE12 same as above same as above reverse SPE12c breccia zone 68.99 C, OM
SPE12 same as above same as above reverse SPE12d host rock (footwall) 135.41 C
SPE13 41�15033.4500 13�26021.9200 reverse SPE13a host rock (hangingwall) 202.11 C
SPE13 same as above same as above reverse SPE13b breccia zone 168.17 C
SPE13 same as above same as above reverse SPE13c host rock (lens in fault core) 198.56 C
SPE13 same as above same as above reverse SPE13d breccia zone 102.35 C
SPE13 same as above same as above reverse SPE13e host rock (footwall) 289.78 C
aC, chemical analysis; GSD, analysis of grain size distribution; OM, analysis of thin sections by optical microscope; XRD, X-ray diffraction.
GeochemistryGeophysicsGeosystems G3G3
billi et al.: mass transfer across fault cores 10.1029/2007GC001752
4 of 18
mitic rock. Collectively, these observations showthat the solution cleavage developed earlier thanthe fault cores, which subsequently developed fromand through the cleaved host rock (Figure 3c).
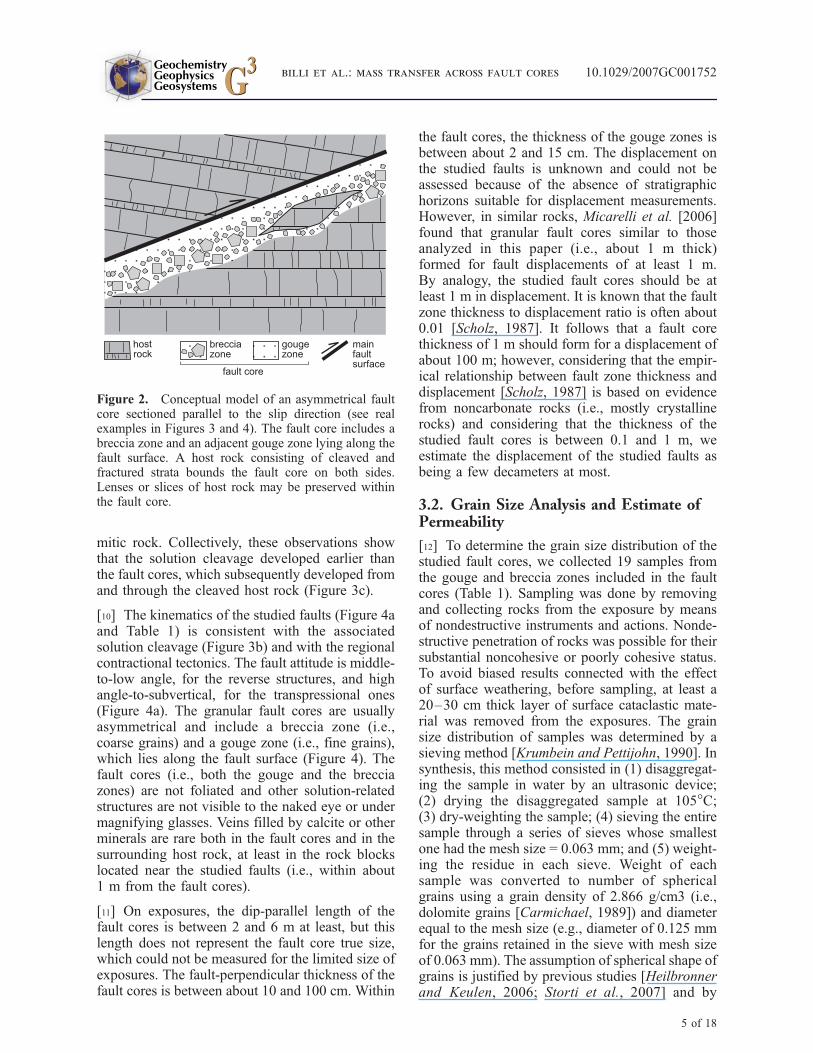
[10] The kinematics of the studied faults (Figure 4aand Table 1) is consistent with the associatedsolution cleavage (Figure 3b) and with the regionalcontractional tectonics. The fault attitude is middle-to-low angle, for the reverse structures, and highangle-to-subvertical, for the transpressional ones(Figure 4a). The granular fault cores are usuallyasymmetrical and include a breccia zone (i.e.,coarse grains) and a gouge zone (i.e., fine grains),which lies along the fault surface (Figure 4). Thefault cores (i.e., both the gouge and the brecciazones) are not foliated and other solution-relatedstructures are not visible to the naked eye or undermagnifying glasses. Veins filled by calcite or otherminerals are rare both in the fault cores and in thesurrounding host rock, at least in the rock blockslocated near the studied faults (i.e., within about1 m from the fault cores).
[11] On exposures, the dip-parallel length of thefault cores is between 2 and 6 m at least, but thislength does not represent the fault core true size,which could not be measured for the limited size ofexposures. The fault-perpendicular thickness of thefault cores is between about 10 and 100 cm. Within
the fault cores, the thickness of the gouge zones isbetween about 2 and 15 cm. The displacement onthe studied faults is unknown and could not beassessed because of the absence of stratigraphichorizons suitable for displacement measurements.However, in similar rocks, Micarelli et al. [2006]found that granular fault cores similar to thoseanalyzed in this paper (i.e., about 1 m thick)formed for fault displacements of at least 1 m.By analogy, the studied fault cores should be atleast 1 m in displacement. It is known that the faultzone thickness to displacement ratio is often about0.01 [Scholz, 1987]. It follows that a fault corethickness of 1 m should form for a displacement ofabout 100 m; however, considering that the empir-ical relationship between fault zone thickness anddisplacement [Scholz, 1987] is based on evidencefrom noncarbonate rocks (i.e., mostly crystallinerocks) and considering that the thickness of thestudied fault cores is between 0.1 and 1 m, weestimate the displacement of the studied faults asbeing a few decameters at most.
3.2. Grain Size Analysis and Estimate ofPermeability
[12] To determine the grain size distribution of thestudied fault cores, we collected 19 samples fromthe gouge and breccia zones included in the faultcores (Table 1). Sampling was done by removingand collecting rocks from the exposure by meansof nondestructive instruments and actions. Nonde-structive penetration of rocks was possible for theirsubstantial noncohesive or poorly cohesive status.To avoid biased results connected with the effectof surface weathering, before sampling, at least a20–30 cm thick layer of surface cataclastic mate-rial was removed from the exposures. The grainsize distribution of samples was determined by asieving method [Krumbein and Pettijohn, 1990]. Insynthesis, this method consisted in (1) disaggregat-ing the sample in water by an ultrasonic device;(2) drying the disaggregated sample at 105�C;(3) dry-weighting the sample; (4) sieving the entiresample through a series of sieves whose smallestone had the mesh size = 0.063 mm; and (5) weight-ing the residue in each sieve. Weight of eachsample was converted to number of sphericalgrains using a grain density of 2.866 g/cm3 (i.e.,dolomite grains [Carmichael, 1989]) and diameterequal to the mesh size (e.g., diameter of 0.125 mmfor the grains retained in the sieve with mesh sizeof 0.063 mm). The assumption of spherical shape ofgrains is justified by previous studies [Heilbronnerand Keulen, 2006; Storti et al., 2007] and by
Figure 2. Conceptual model of an asymmetrical faultcore sectioned parallel to the slip direction (see realexamples in Figures 3 and 4). The fault core includes abreccia zone and an adjacent gouge zone lying along thefault surface. A host rock consisting of cleaved andfractured strata bounds the fault core on both sides.Lenses or slices of host rock may be preserved withinthe fault core.
GeochemistryGeophysicsGeosystems G3G3
billi et al.: mass transfer across fault cores 10.1029/2007GC001752
5 of 18
microscopic observations (Figures 3 to 5). Grainsize distributions were plotted in log-log diagramsversus the corresponding size classes (Figure 6a)and scaling laws were determined. These data werefitted with the following power law regression:
logN ¼ �D log d þ A ð1Þ
where d is the grain size class (i.e., the diameter ofthe equivalent spherical grains), N is the number ofequivalent spherical grains, and A is a sample-specific constant. D is commonly identified as thefractal dimension. We henceforth use this term;however, this term, in this work, does not implythat the size distributions of the studied fault rockgrains has to be fractal over the entire size range
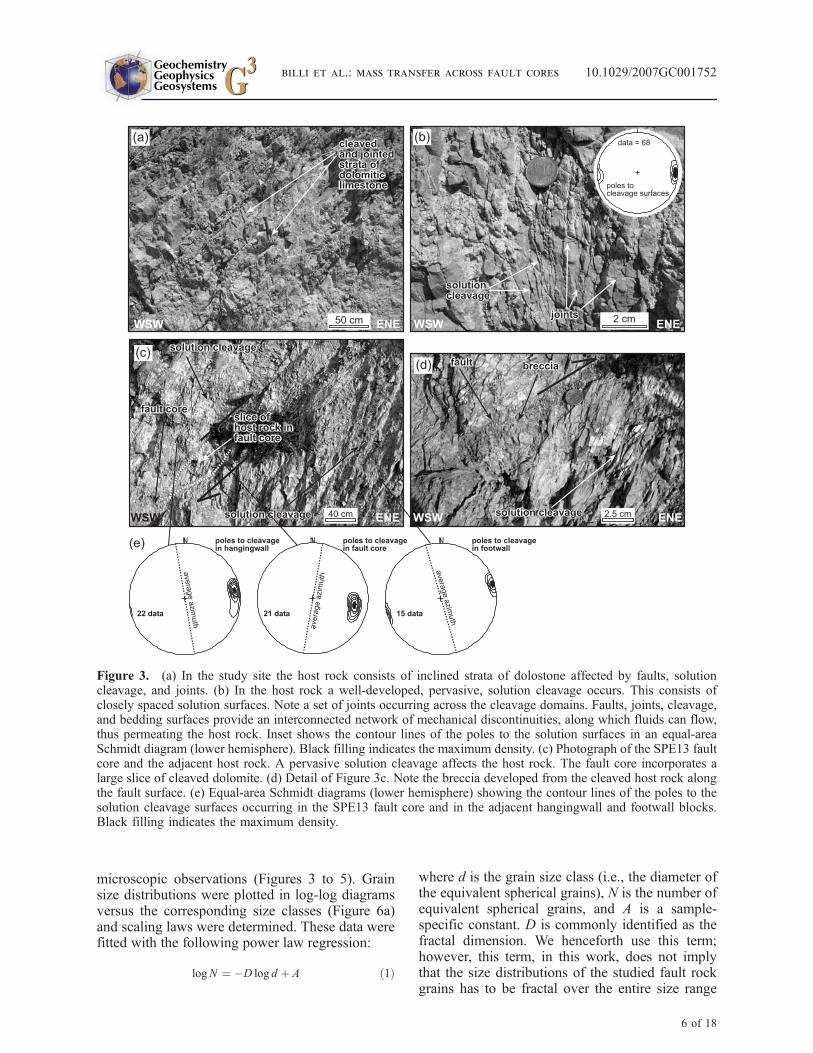
Figure 3. (a) In the study site the host rock consists of inclined strata of dolostone affected by faults, solutioncleavage, and joints. (b) In the host rock a well-developed, pervasive, solution cleavage occurs. This consists ofclosely spaced solution surfaces. Note a set of joints occurring across the cleavage domains. Faults, joints, cleavage,and bedding surfaces provide an interconnected network of mechanical discontinuities, along which fluids can flow,thus permeating the host rock. Inset shows the contour lines of the poles to the solution surfaces in an equal-areaSchmidt diagram (lower hemisphere). Black filling indicates the maximum density. (c) Photograph of the SPE13 faultcore and the adjacent host rock. A pervasive solution cleavage affects the host rock. The fault core incorporates alarge slice of cleaved dolomite. (d) Detail of Figure 3c. Note the breccia developed from the cleaved host rock alongthe fault surface. (e) Equal-area Schmidt diagrams (lower hemisphere) showing the contour lines of the poles to thesolution cleavage surfaces occurring in the SPE13 fault core and in the adjacent hangingwall and footwall blocks.Black filling indicates the maximum density.
GeochemistryGeophysicsGeosystems G3G3
billi et al.: mass transfer across fault cores 10.1029/2007GC001752
6 of 18
nor does it mean that the process of grainfragmentation was fractal [Heilbronner and Keulen,2006]. The reproducibility of results obtained by theabove-depicted analysis was positively tested in aprevious study [Storti et al., 2003].
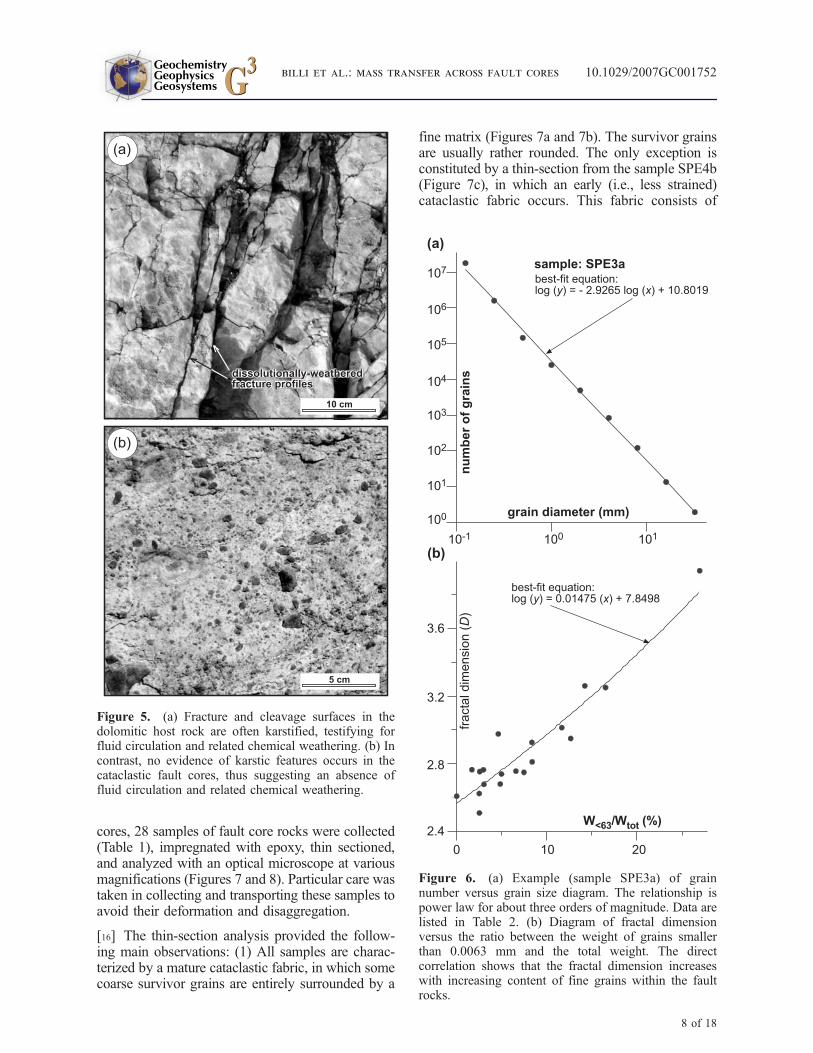
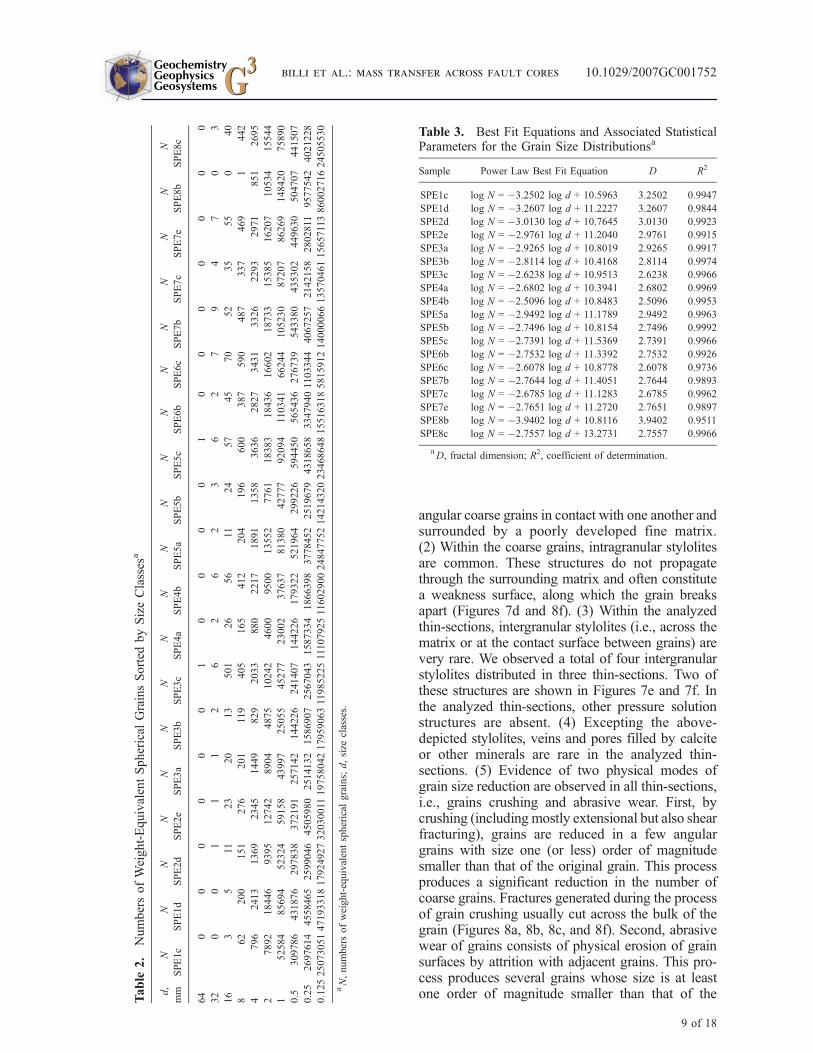
[13] The number of equivalent spherical grains(Table 2) plotted against the corresponding graindiameters on log-log graphs follow linear trendsand are well-fitted by equation (1) in the 64.000–0.125 mm size range [e.g., Babaie et al., 1995].Figure 6a shows the results for sample SPE3a, butthe other samples show similar grain size distribu-tions; their size distribution is listed in Table 3. Theassociated fractal dimension, D, varies betweenabout 2.60 and 3.94 (Table 3). In each fault core,D for the sample from the gouge zone is greaterthan D for the sample from the breccia zone.D-values correlate well with the correspondingweight of grains smaller than 0.063 mm as dividedby the total weight of the sample (i.e., W<63/Wtot inFigure 6b and Table 1). Specifically, for D � 2.8,
the weight of the material with grain size smallerthan 0.063 mm is about 5% of the sample totalweight, whereas for D > 3.2, the weight of thematerial with grain size smaller than 0.063 mm isgreater than 15% of the sample total weight and isabout 30% for D approaching 4.
[14] Agosta and Aydin [2006] and Agosta et al.[2007] showed that carbonate fault cores verysimilar to those analyzed in this paper and withapproximately the same grain size distributionshave permeability less than 10�20 m2 (i.e., atatmospheric pressure), which was the lower bound-ary of the analytical technique. The permeability ofthe fault cores were probably even lower at thedepth at which the fault cores developed. Byanalogy, we estimate the permeability of the stud-ied fault cores as lower than 10�20 m2.
3.3. Microscopic Analysis
[15] To study the physical and chemical processesof grain size reduction within the analyzed fault
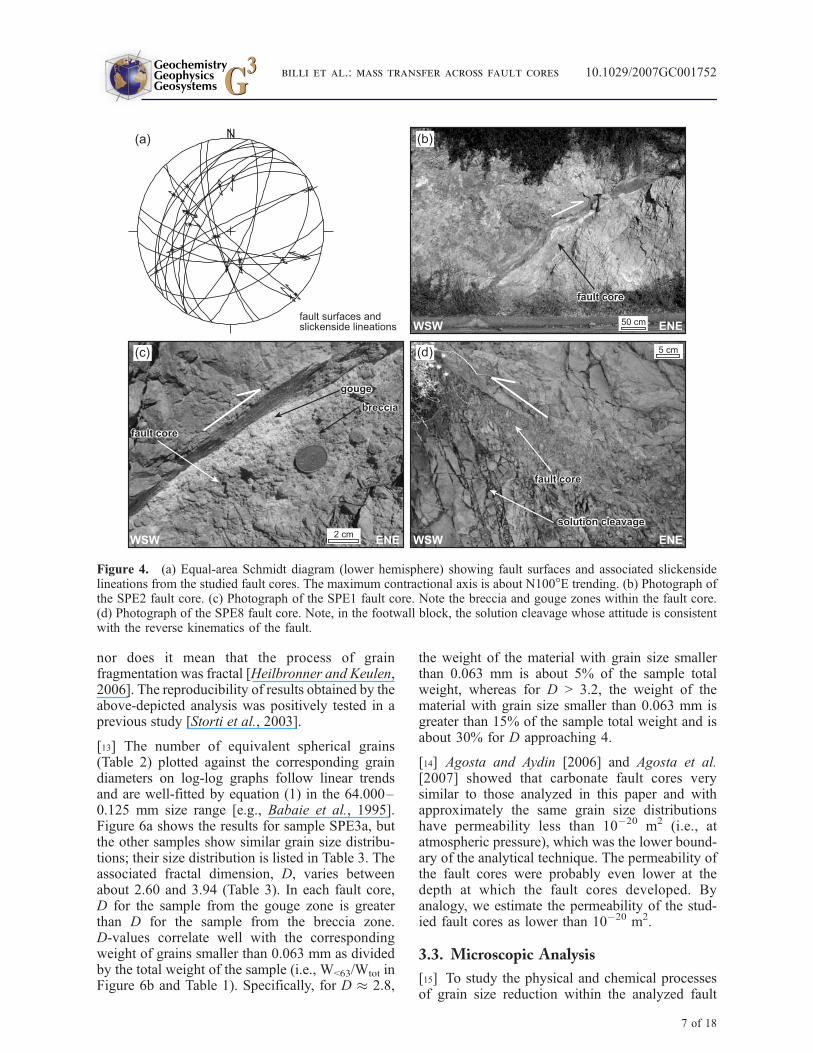
Figure 4. (a) Equal-area Schmidt diagram (lower hemisphere) showing fault surfaces and associated slickensidelineations from the studied fault cores. The maximum contractional axis is about N100�E trending. (b) Photograph ofthe SPE2 fault core. (c) Photograph of the SPE1 fault core. Note the breccia and gouge zones within the fault core.(d) Photograph of the SPE8 fault core. Note, in the footwall block, the solution cleavage whose attitude is consistentwith the reverse kinematics of the fault.
GeochemistryGeophysicsGeosystems G3G3
billi et al.: mass transfer across fault cores 10.1029/2007GC001752
7 of 18
cores, 28 samples of fault core rocks were collected(Table 1), impregnated with epoxy, thin sectioned,and analyzed with an optical microscope at variousmagnifications (Figures 7 and 8). Particular care wastaken in collecting and transporting these samples toavoid their deformation and disaggregation.
[16] The thin-section analysis provided the follow-ing main observations: (1) All samples are charac-terized by a mature cataclastic fabric, in which somecoarse survivor grains are entirely surrounded by a
fine matrix (Figures 7a and 7b). The survivor grainsare usually rather rounded. The only exception isconstituted by a thin-section from the sample SPE4b(Figure 7c), in which an early (i.e., less strained)cataclastic fabric occurs. This fabric consists of
Figure 5. (a) Fracture and cleavage surfaces in thedolomitic host rock are often karstified, testifying forfluid circulation and related chemical weathering. (b) Incontrast, no evidence of karstic features occurs in thecataclastic fault cores, thus suggesting an absence offluid circulation and related chemical weathering.
Figure 6. (a) Example (sample SPE3a) of grainnumber versus grain size diagram. The relationship ispower law for about three orders of magnitude. Data arelisted in Table 2. (b) Diagram of fractal dimensionversus the ratio between the weight of grains smallerthan 0.0063 mm and the total weight. The directcorrelation shows that the fractal dimension increaseswith increasing content of fine grains within the faultrocks.
GeochemistryGeophysicsGeosystems G3G3
billi et al.: mass transfer across fault cores 10.1029/2007GC001752
8 of 18
angular coarse grains in contact with one another andsurrounded by a poorly developed fine matrix.(2) Within the coarse grains, intragranular stylolitesare common. These structures do not propagatethrough the surrounding matrix and often constitutea weakness surface, along which the grain breaksapart (Figures 7d and 8f). (3) Within the analyzedthin-sections, intergranular stylolites (i.e., across thematrix or at the contact surface between grains) arevery rare. We observed a total of four intergranularstylolites distributed in three thin-sections. Two ofthese structures are shown in Figures 7e and 7f. Inthe analyzed thin-sections, other pressure solutionstructures are absent. (4) Excepting the above-depicted stylolites, veins and pores filled by calciteor other minerals are rare in the analyzed thin-sections. (5) Evidence of two physical modes ofgrain size reduction are observed in all thin-sections,i.e., grains crushing and abrasive wear. First, bycrushing (including mostly extensional but also shearfracturing), grains are reduced in a few angulargrains with size one (or less) order of magnitudesmaller than that of the original grain. This processproduces a significant reduction in the number ofcoarse grains. Fractures generated during the processof grain crushing usually cut across the bulk of thegrain (Figures 8a, 8b, 8c, and 8f). Second, abrasivewear of grains consists of physical erosion of grainsurfaces by attrition with adjacent grains. This pro-cess produces several grains whose size is at leastone order of magnitude smaller than that of theT
able
2.
NumbersofWeight-EquivalentSpherical
GrainsSorted
bySizeClasses
a
d,
mm
N
SPE1c
N
SPE1d
N
SPE2d
N
SPE2e
N
SPE3a
N
SPE3b
N
SPE3c
N
SPE4a
N
SPE4b
N
SPE5a
N
SPE5b
N
SPE5c
N
SPE6b
N
SPE6c
N
SPE7b
N
SPE7c
N
SPE7e
N
SPE8b
N
SPE8c
64
00
00
00
10
00
01
00
00
00
0
32
00
11
12
62
62
36
27
94
70
3
16
35
11
23
20
13
501
26
56
11
24
57
45
70
52
35
55
040
862
200
151
276
201
119
405
165
412
204
196
600
387
590
487
337
469
1442
4796
2413
1369
2345
1449
829
2033
880
2217
1891
1358
3636
2827
3431
3326
2293
2971
851
2695
27892
18446
9395
12742
8904
4875
10242
4600
9500
13552
7761
18383
18436
16602
18733
15385
16207
10534
15544
152584
85694
52324
59158
43997
25055
45277
23002
37637
81380
42777
92094
110341
66244
105230
87207
86269
148420
75890
0.5
309786
431876
297838
372191
257142
144226
241407
144226
179322
521964
299226
594450
565436
276739
543380
435302
449630
504707
441507
0.25
2697614
4558465
2599046
4505980
2514132
1586907
2567043
1587334
1866398
3778452
2519679
4318658
33479401103344
4067257
2142158
2802811
9577542
4021228
0.12525073051471933181792492732030011
19758042179590631198522511107925116029002484775214214320234686481551631858159121400006613570461156571138600271624505530
aN,numbersofweight-equivalentspherical
grains;d,size
classes.
Table 3. Best Fit Equations and Associated StatisticalParameters for the Grain Size Distributionsa
Sample Power Law Best Fit Equation D R2
SPE1c log N = �3.2502 log d + 10.5963 3.2502 0.9947
SPE1d log N = �3.2607 log d + 11.2227 3.2607 0.9844
SPE2d log N = �3.0130 log d + 10.7645 3.0130 0.9923
SPE2e log N = �2.9761 log d + 11.2040 2.9761 0.9915
SPE3a log N = �2.9265 log d + 10.8019 2.9265 0.9917
SPE3b log N = �2.8114 log d + 10.4168 2.8114 0.9974
SPE3c log N = �2.6238 log d + 10.9513 2.6238 0.9966
SPE4a log N = �2.6802 log d + 10.3941 2.6802 0.9969
SPE4b log N = �2.5096 log d + 10.8483 2.5096 0.9953
SPE5a log N = �2.9492 log d + 11.1789 2.9492 0.9963
SPE5b log N = �2.7496 log d + 10.8154 2.7496 0.9992
SPE5c log N = �2.7391 log d + 11.5369 2.7391 0.9966
SPE6b log N = �2.7532 log d + 11.3392 2.7532 0.9926
SPE6c log N = �2.6078 log d + 10.8778 2.6078 0.9736
SPE7b log N = �2.7644 log d + 11.4051 2.7644 0.9893
SPE7c log N = �2.6785 log d + 11.1283 2.6785 0.9962
SPE7e log N = �2.7651 log d + 11.2720 2.7651 0.9897
SPE8b log N = �3.9402 log d + 10.8116 3.9402 0.9511
SPE8c log N = �2.7557 log d + 13.2731 2.7557 0.9966
aD, fractal dimension; R2, coefficient of determination.
GeochemistryGeophysicsGeosystems G3G3
billi et al.: mass transfer across fault cores 10.1029/2007GC001752
9 of 18
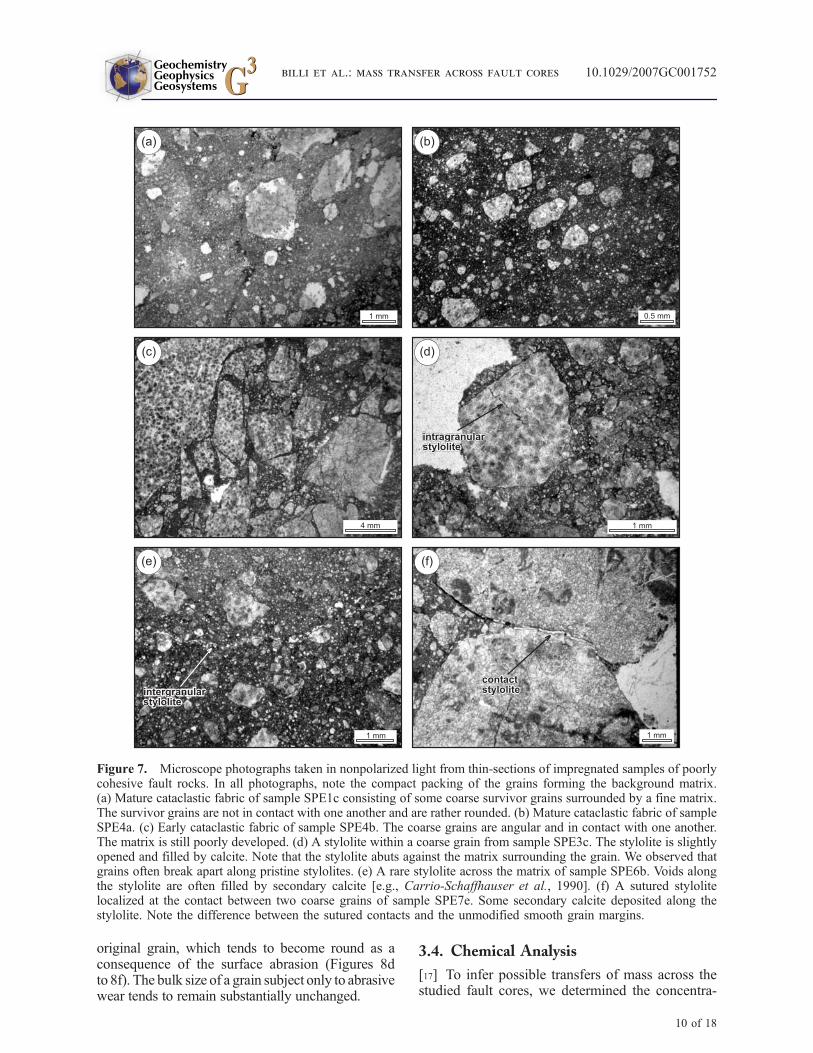
original grain, which tends to become round as aconsequence of the surface abrasion (Figures 8dto 8f). The bulk size of a grain subject only to abrasivewear tends to remain substantially unchanged.
3.4. Chemical Analysis
[17] To infer possible transfers of mass across thestudied fault cores, we determined the concentra-
Figure 7. Microscope photographs taken in nonpolarized light from thin-sections of impregnated samples of poorlycohesive fault rocks. In all photographs, note the compact packing of the grains forming the background matrix.(a) Mature cataclastic fabric of sample SPE1c consisting of some coarse survivor grains surrounded by a fine matrix.The survivor grains are not in contact with one another and are rather rounded. (b) Mature cataclastic fabric of sampleSPE4a. (c) Early cataclastic fabric of sample SPE4b. The coarse grains are angular and in contact with one another.The matrix is still poorly developed. (d) A stylolite within a coarse grain from sample SPE3c. The stylolite is slightlyopened and filled by calcite. Note that the stylolite abuts against the matrix surrounding the grain. We observed thatgrains often break apart along pristine stylolites. (e) A rare stylolite across the matrix of sample SPE6b. Voids alongthe stylolite are often filled by secondary calcite [e.g., Carrio-Schaffhauser et al., 1990]. (f) A sutured stylolitelocalized at the contact between two coarse grains of sample SPE7e. Some secondary calcite deposited along thestylolite. Note the difference between the sutured contacts and the unmodified smooth grain margins.
GeochemistryGeophysicsGeosystems G3G3
billi et al.: mass transfer across fault cores 10.1029/2007GC001752
10 of 18
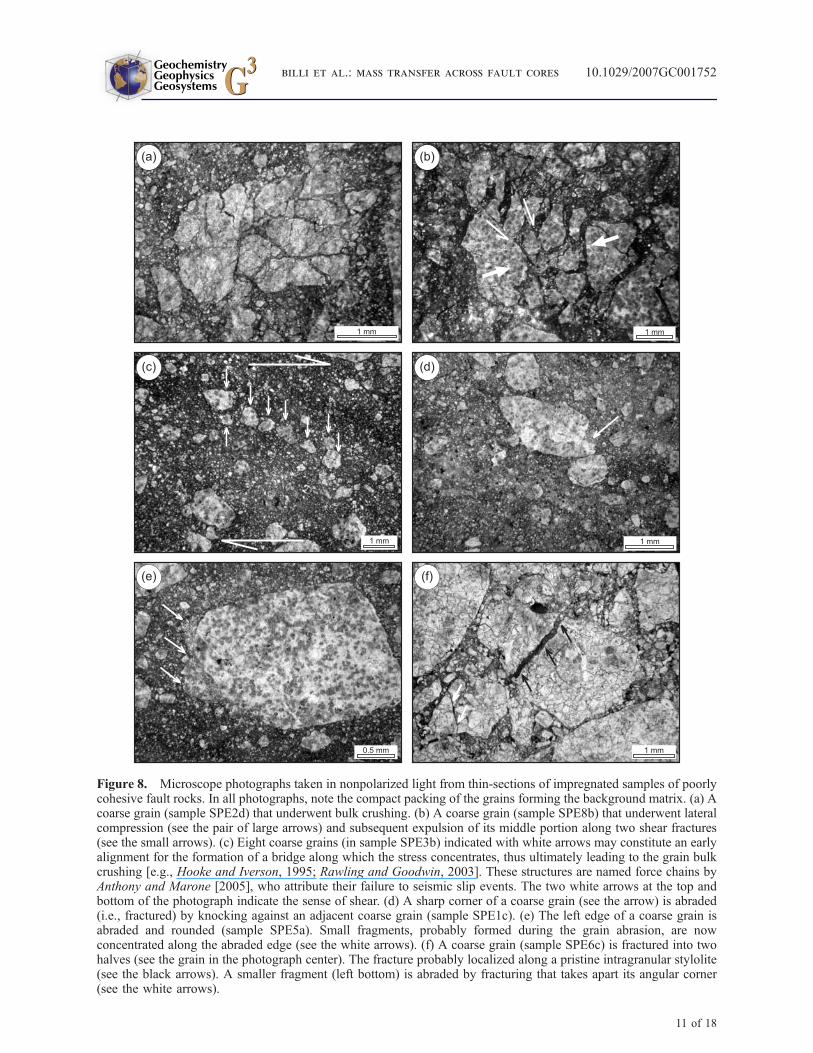
Figure 8. Microscope photographs taken in nonpolarized light from thin-sections of impregnated samples of poorlycohesive fault rocks. In all photographs, note the compact packing of the grains forming the background matrix. (a) Acoarse grain (sample SPE2d) that underwent bulk crushing. (b) A coarse grain (sample SPE8b) that underwent lateralcompression (see the pair of large arrows) and subsequent expulsion of its middle portion along two shear fractures(see the small arrows). (c) Eight coarse grains (in sample SPE3b) indicated with white arrows may constitute an earlyalignment for the formation of a bridge along which the stress concentrates, thus ultimately leading to the grain bulkcrushing [e.g., Hooke and Iverson, 1995; Rawling and Goodwin, 2003]. These structures are named force chains byAnthony and Marone [2005], who attribute their failure to seismic slip events. The two white arrows at the top andbottom of the photograph indicate the sense of shear. (d) A sharp corner of a coarse grain (see the arrow) is abraded(i.e., fractured) by knocking against an adjacent coarse grain (sample SPE1c). (e) The left edge of a coarse grain isabraded and rounded (sample SPE5a). Small fragments, probably formed during the grain abrasion, are nowconcentrated along the abraded edge (see the white arrows). (f) A coarse grain (sample SPE6c) is fractured into twohalves (see the grain in the photograph center). The fracture probably localized along a pristine intragranular stylolite(see the black arrows). A smaller fragment (left bottom) is abraded by fracturing that takes apart its angular corner(see the white arrows).
GeochemistryGeophysicsGeosystems G3G3
billi et al.: mass transfer across fault cores 10.1029/2007GC001752
11 of 18
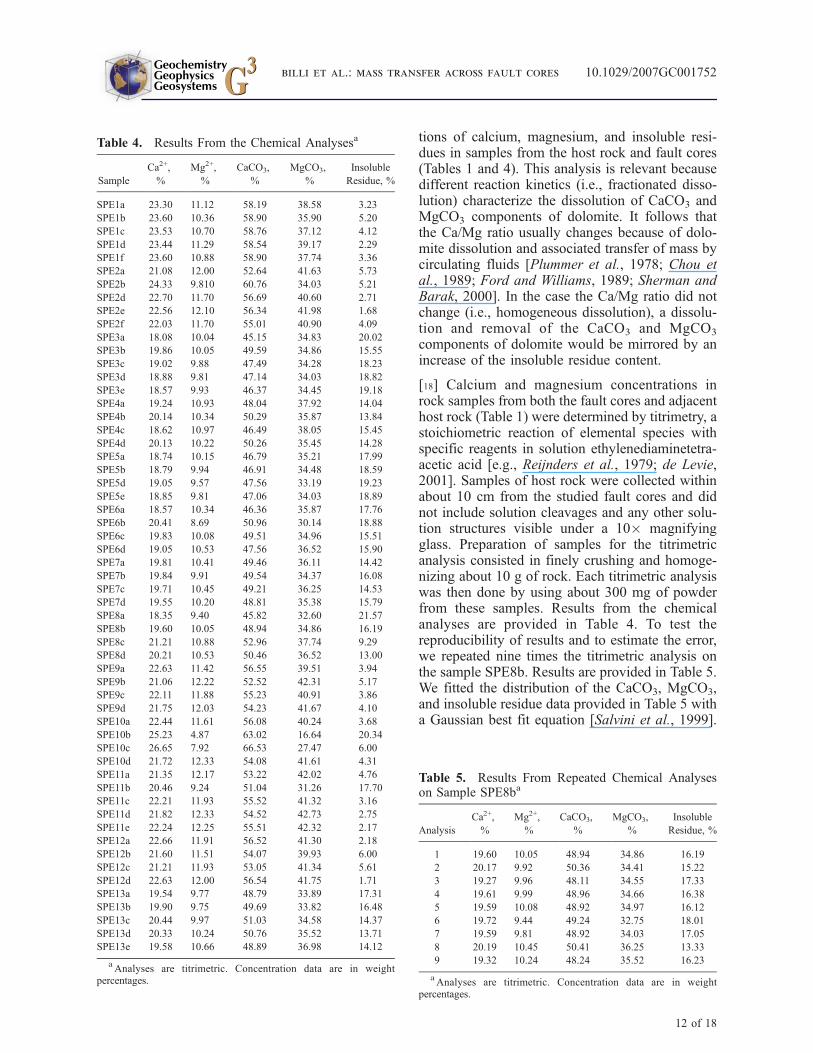
tions of calcium, magnesium, and insoluble resi-dues in samples from the host rock and fault cores(Tables 1 and 4). This analysis is relevant becausedifferent reaction kinetics (i.e., fractionated disso-lution) characterize the dissolution of CaCO3 andMgCO3 components of dolomite. It follows thatthe Ca/Mg ratio usually changes because of dolo-mite dissolution and associated transfer of mass bycirculating fluids [Plummer et al., 1978; Chou etal., 1989; Ford and Williams, 1989; Sherman andBarak, 2000]. In the case the Ca/Mg ratio did notchange (i.e., homogeneous dissolution), a dissolu-tion and removal of the CaCO3 and MgCO3
components of dolomite would be mirrored by anincrease of the insoluble residue content.
[18] Calcium and magnesium concentrations inrock samples from both the fault cores and adjacenthost rock (Table 1) were determined by titrimetry, astoichiometric reaction of elemental species withspecific reagents in solution ethylenediaminetetra-acetic acid [e.g., Reijnders et al., 1979; de Levie,2001]. Samples of host rock were collected withinabout 10 cm from the studied fault cores and didnot include solution cleavages and any other solu-tion structures visible under a 10� magnifyingglass. Preparation of samples for the titrimetricanalysis consisted in finely crushing and homoge-nizing about 10 g of rock. Each titrimetric analysiswas then done by using about 300 mg of powderfrom these samples. Results from the chemicalanalyses are provided in Table 4. To test thereproducibility of results and to estimate the error,we repeated nine times the titrimetric analysis onthe sample SPE8b. Results are provided in Table 5.We fitted the distribution of the CaCO3, MgCO3,and insoluble residue data provided in Table 5 witha Gaussian best fit equation [Salvini et al., 1999].
Table 4. Results From the Chemical Analysesa
Sample
Ca2+,
%
Mg2+,
%
CaCO3,
%
MgCO3,
%
Insoluble
Residue, %
SPE1a 23.30 11.12 58.19 38.58 3.23
SPE1b 23.60 10.36 58.90 35.90 5.20
SPE1c 23.53 10.70 58.76 37.12 4.12
SPE1d 23.44 11.29 58.54 39.17 2.29
SPE1f 23.60 10.88 58.90 37.74 3.36
SPE2a 21.08 12.00 52.64 41.63 5.73
SPE2b 24.33 9.810 60.76 34.03 5.21
SPE2d 22.70 11.70 56.69 40.60 2.71
SPE2e 22.56 12.10 56.34 41.98 1.68
SPE2f 22.03 11.70 55.01 40.90 4.09
SPE3a 18.08 10.04 45.15 34.83 20.02
SPE3b 19.86 10.05 49.59 34.86 15.55
SPE3c 19.02 9.88 47.49 34.28 18.23
SPE3d 18.88 9.81 47.14 34.03 18.82
SPE3e 18.57 9.93 46.37 34.45 19.18
SPE4a 19.24 10.93 48.04 37.92 14.04
SPE4b 20.14 10.34 50.29 35.87 13.84
SPE4c 18.62 10.97 46.49 38.05 15.45
SPE4d 20.13 10.22 50.26 35.45 14.28
SPE5a 18.74 10.15 46.79 35.21 17.99
SPE5b 18.79 9.94 46.91 34.48 18.59
SPE5d 19.05 9.57 47.56 33.19 19.23
SPE5e 18.85 9.81 47.06 34.03 18.89
SPE6a 18.57 10.34 46.36 35.87 17.76
SPE6b 20.41 8.69 50.96 30.14 18.88
SPE6c 19.83 10.08 49.51 34.96 15.51
SPE6d 19.05 10.53 47.56 36.52 15.90
SPE7a 19.81 10.41 49.46 36.11 14.42
SPE7b 19.84 9.91 49.54 34.37 16.08
SPE7c 19.71 10.45 49.21 36.25 14.53
SPE7d 19.55 10.20 48.81 35.38 15.79
SPE8a 18.35 9.40 45.82 32.60 21.57
SPE8b 19.60 10.05 48.94 34.86 16.19
SPE8c 21.21 10.88 52.96 37.74 9.29
SPE8d 20.21 10.53 50.46 36.52 13.00
SPE9a 22.63 11.42 56.55 39.51 3.94
SPE9b 21.06 12.22 52.52 42.31 5.17
SPE9c 22.11 11.88 55.23 40.91 3.86
SPE9d 21.75 12.03 54.23 41.67 4.10
SPE10a 22.44 11.61 56.08 40.24 3.68
SPE10b 25.23 4.87 63.02 16.64 20.34
SPE10c 26.65 7.92 66.53 27.47 6.00
SPE10d 21.72 12.33 54.08 41.61 4.31
SPE11a 21.35 12.17 53.22 42.02 4.76
SPE11b 20.46 9.24 51.04 31.26 17.70
SPE11c 22.21 11.93 55.52 41.32 3.16
SPE11d 21.82 12.33 54.52 42.73 2.75
SPE11e 22.24 12.25 55.51 42.32 2.17
SPE12a 22.66 11.91 56.52 41.30 2.18
SPE12b 21.60 11.51 54.07 39.93 6.00
SPE12c 21.21 11.93 53.05 41.34 5.61
SPE12d 22.63 12.00 56.54 41.75 1.71
SPE13a 19.54 9.77 48.79 33.89 17.31
SPE13b 19.90 9.75 49.69 33.82 16.48
SPE13c 20.44 9.97 51.03 34.58 14.37
SPE13d 20.33 10.24 50.76 35.52 13.71
SPE13e 19.58 10.66 48.89 36.98 14.12
aAnalyses are titrimetric. Concentration data are in weight
percentages.
Table 5. Results From Repeated Chemical Analyseson Sample SPE8ba
Analysis
Ca2+,
%
Mg2+,
%
CaCO3,
%
MgCO3,
%
Insoluble
Residue, %
1 19.60 10.05 48.94 34.86 16.19
2 20.17 9.92 50.36 34.41 15.22
3 19.27 9.96 48.11 34.55 17.33
4 19.61 9.99 48.96 34.66 16.38
5 19.59 10.08 48.92 34.97 16.12
6 19.72 9.44 49.24 32.75 18.01
7 19.59 9.81 48.92 34.03 17.05
8 20.19 10.45 50.41 36.25 13.33
9 19.32 10.24 48.24 35.52 16.23
aAnalyses are titrimetric. Concentration data are in weight
percentages.
GeochemistryGeophysicsGeosystems G3G3
billi et al.: mass transfer across fault cores 10.1029/2007GC001752
12 of 18
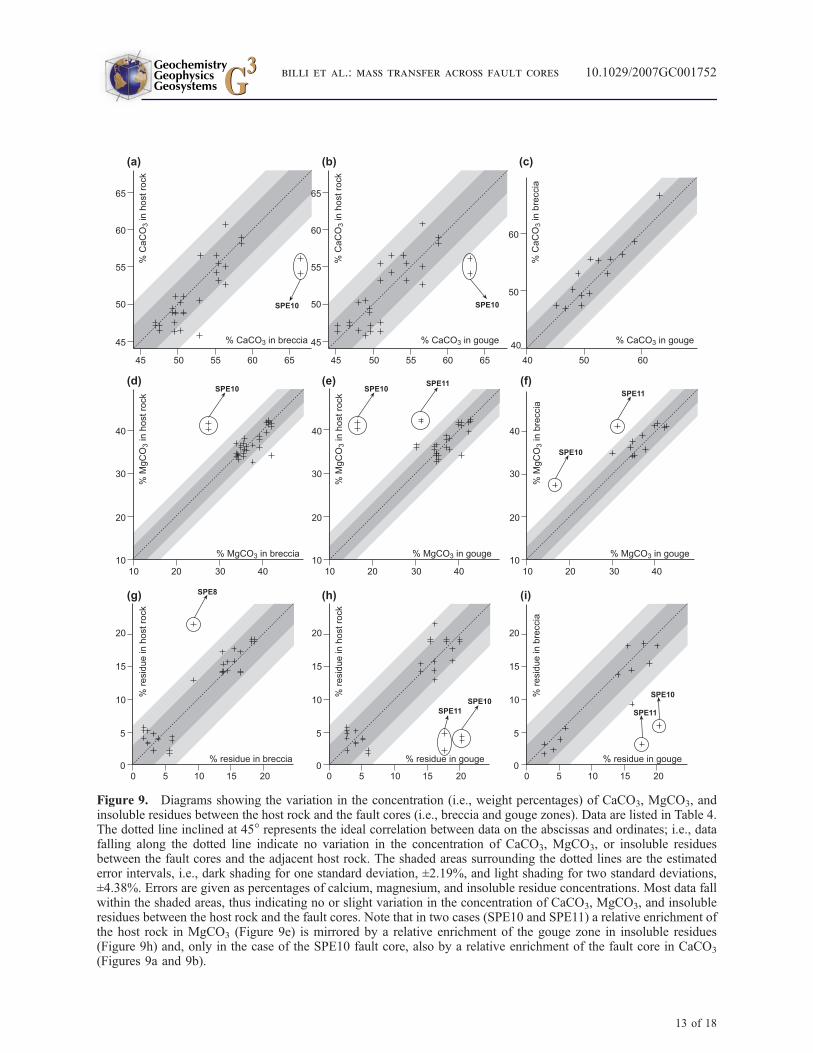
Figure 9. Diagrams showing the variation in the concentration (i.e., weight percentages) of CaCO3, MgCO3, andinsoluble residues between the host rock and the fault cores (i.e., breccia and gouge zones). Data are listed in Table 4.The dotted line inclined at 45� represents the ideal correlation between data on the abscissas and ordinates; i.e., datafalling along the dotted line indicate no variation in the concentration of CaCO3, MgCO3, or insoluble residuesbetween the fault cores and the adjacent host rock. The shaded areas surrounding the dotted lines are the estimatederror intervals, i.e., dark shading for one standard deviation, ±2.19%, and light shading for two standard deviations,±4.38%. Errors are given as percentages of calcium, magnesium, and insoluble residue concentrations. Most data fallwithin the shaded areas, thus indicating no or slight variation in the concentration of CaCO3, MgCO3, and insolubleresidues between the host rock and the fault cores. Note that in two cases (SPE10 and SPE11) a relative enrichment ofthe host rock in MgCO3 (Figure 9e) is mirrored by a relative enrichment of the gouge zone in insoluble residues(Figure 9h) and, only in the case of the SPE10 fault core, also by a relative enrichment of the fault core in CaCO3
(Figures 9a and 9b).
GeochemistryGeophysicsGeosystems G3G3
billi et al.: mass transfer across fault cores 10.1029/2007GC001752
13 of 18
The resulting standard deviations are as follows:2.12% for the CaCO3 data, 2.21% for the MgCO3
data, and 2.24% for the insoluble residue data. Thearithmetic mean of these standard deviations is2.19%, which we considered as the minimum errorof the data provided in Table 4 (i.e.,±2.19%).
[19] To determine possible changes in the concen-tration of CaCO3, MgCO3, and insoluble residuesacross the fault cores, we plotted the chemical datafrom the host rock and from the fault cores (i.e.,breccia and gouge zones) against each other in bi-dimensional diagrams having the horizontal andvertical axes with the same scale (Figure 9). Itfollows that data reflecting no changes in theconcentration of CaCO3, MgCO3, or insolubleresidues lie along a line inclined at 45� across thediagrams and passing through the origin of axes(Figure 9). In the diagrams, the error intervalsassociated with the correlation line inclined at 45�is indicated with shading as follows: dark shading isone standard deviation (i.e., 2.19%) and light shad-ing is two standard deviations (i.e., 4.38%).
[20] Figure 9 shows that most data lie along theline inclined at 45� or fall within the associatederror intervals. Two fault cores (SPE10 and SPE11)show some significant chemical changes. In bothfault cores, a loss of MgCO3 (Figures 9d, 9e, and9f) is accompanied by a gain of insoluble residues(Figures 9h and 9i) and, only in the SPE10 faultcore, also by a gain of CaCO3 (Figures 9a and 9b).
[21] The SPE8 fault core is characterized by a relativegain of insolubles in the host rock (Figure 9g).
4. Discussion
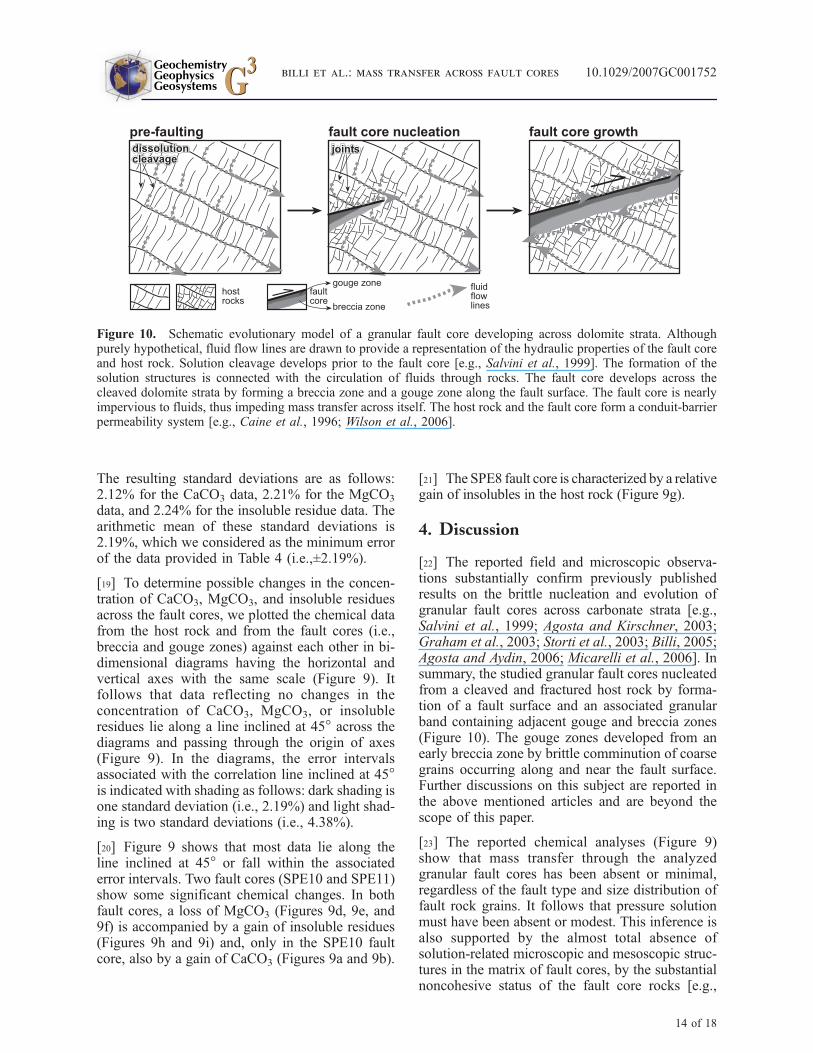
[22] The reported field and microscopic observa-tions substantially confirm previously publishedresults on the brittle nucleation and evolution ofgranular fault cores across carbonate strata [e.g.,Salvini et al., 1999; Agosta and Kirschner, 2003;Graham et al., 2003; Storti et al., 2003; Billi, 2005;Agosta and Aydin, 2006; Micarelli et al., 2006]. Insummary, the studied granular fault cores nucleatedfrom a cleaved and fractured host rock by forma-tion of a fault surface and an associated granularband containing adjacent gouge and breccia zones(Figure 10). The gouge zones developed from anearly breccia zone by brittle comminution of coarsegrains occurring along and near the fault surface.Further discussions on this subject are reported inthe above mentioned articles and are beyond thescope of this paper.
[23] The reported chemical analyses (Figure 9)show that mass transfer through the analyzedgranular fault cores has been absent or minimal,regardless of the fault type and size distribution offault rock grains. It follows that pressure solutionmust have been absent or modest. This inference isalso supported by the almost total absence ofsolution-related microscopic and mesoscopic struc-tures in the matrix of fault cores, by the substantialnoncohesive status of the fault core rocks [e.g.,
Figure 10. Schematic evolutionary model of a granular fault core developing across dolomite strata. Althoughpurely hypothetical, fluid flow lines are drawn to provide a representation of the hydraulic properties of the fault coreand host rock. Solution cleavage develops prior to the fault core [e.g., Salvini et al., 1999]. The formation of thesolution structures is connected with the circulation of fluids through rocks. The fault core develops across thecleaved dolomite strata by forming a breccia zone and a gouge zone along the fault surface. The fault core is nearlyimpervious to fluids, thus impeding mass transfer across itself. The host rock and the fault core form a conduit-barrierpermeability system [e.g., Caine et al., 1996; Wilson et al., 2006].
GeochemistryGeophysicsGeosystems G3G3
billi et al.: mass transfer across fault cores 10.1029/2007GC001752
14 of 18
Ngwenya et al., 2000], and by the absence of karstfeatures in the fault cores. The cause for the generallack of significant mass transfer across the ana-lyzed fault cores is probably connected with thelow porosity and permeability of the fault cores asinferred from the size distribution (Table 2 andFigure 6) and packing (Figures 7 and 8) of grains,and by analogy with recent permeability measure-ments in very similar fault cores [Agosta et al.,2007]. In two cases, however, changes in theconcentration of CaCO3, MgCO3, and insolubleresidues across the studied fault cores significantlyexceeded the error bars (i.e., SPE10 and SPE11;Figure 9). These chemical changes may beexplained by mass removal from the fault core(i.e., particularly theMgCO3 component; Figures 9d,9e, and 9f) and, at least in the case of the SPE10fault core (Figures 9a and 9b), by a permeation ofthis fault core by a Ca-rich solution coming fromthe adjacent host rock where the effects of pressuresolution processes are evident (Figure 3). Theremoval of mass (i.e., MgCO3) from the fault corescaused a relative enrichment in insolubles (Figures 9hand 9i). This process (i.e., mass transfer) may havebeen transient and connected, for instance, with slipevents [e.g., Zhang and Cox, 2000], during whichthe granular fault rock may have reached a porosityof even 10% [e.g.,Renard et al., 2000]. Alternatively,the cases showing significant chemical changesacross the studied fault cores (Figure 9) may beconnected with local heterogeneities in the chemicalcompositions of the host rock. In any case, theobserved cases of mass transfer (i.e., SPE10 andSPE11; Figure 9) do not pertain to one or moreparticular fault cores, to particular grain size distri-butions, or to particular tectonic situations. As such,they probably represent exceptions to the inferredminimalmass transfer through the studied fault cores.In particular, the physical and chemical evidencessuggest that matrix flow is not a likely process for thestudied fault cores. As explained above, the onlyviable mechanism for fluid flow may be a transient,channelized flow driven by fault deformation [e.g.,Oliver, 1996].
[24] The apparent enrichment in insolubles of thehost rock flanking the SPE8 fault core (Figure 9g)may be explained by a local composition of thehost rock particularly rich in insolubles or by masstransfer processes, which affected the host rockafter the development of the fault core (e.g.,karstification, Figure 5a).
[25] An important limit to the chemical resultsprovided in this paper is the missing, quantitative
estimate of possible effects of chemical weatheringon the analyzed samples. As mentioned above, toavoid such effect, we removed a significant layerof surficial rocks before sampling. Moreover, anincidental occurrence of chemical weathering onthe analyzed samples would strengthen our resultsin the direction of a minimal mass transferconnected with earlier tectonic processes.
[26] The absence or paucity of solution structures inthe matrix of fault cores (Figures 7 and 8) as well asthe absence of karstic features contrast with thedeformational pattern of the host rock (Figures 3band 3c), where a solution cleavage is widelydeveloped, and where karstic features are frequent(Figure 5). These contrasting observations can beexplained by a disparity in the permeability of thehost rock and fault cores (Figure 10). The hostrock fracture pattern (i.e., damage zone) is, in fact,notoriously an efficient diffusion pathway foraqueous solutions, which, in contrast, can barelypermeate the fault core rocks consisting of packedsmall grains [Caine et al., 1996; Ghisetti et al.,2001; Agosta and Kirschner, 2003; Agosta et al.,2007]. Micarelli et al. [2006], for instance, foundthat granular fault cores across carbonate stratahave permeabilities at least two orders of magni-tude smaller than permeabilities of the adjacenthost rock. These properties apply also to faultswith millimetric displacements [Micarelli et al.,2006].
[27] Except for a few data showing significantchemical changes, our results differ from those ofHadizadeh [1994], who found significant loss ofmagnesium and enrichment of calcium caused bypressure solution processes in fault zones devel-oped across dolostone. Hadizadeh [1994] pointedout the concurrence of cataclasis and pressuresolution mechanisms in the formation of faultzones and hypothesized that the cataclastic defor-mation provided pathways for fluid circulationand solution transfer in either cataclastic flow orshear and tensile failure modes to keep active andrenew the pressure solution process. The compo-sitional analyses by Hadizadeh [1994] are consis-tent with his microscopic and mesoscopicobservations of the fault cores, where he observedfrequent solution-related structures such as folia-tions. In contrast, these structures are substantiallyabsent in the fault cores analyzed in this paper,where, moreover, the fault rocks are noncohesiveor poorly cohesive. In recent papers on fault coresacross carbonate strata [Billi et al., 2002, 2003a,2003b; Agosta and Kirschner, 2003; Graham et
GeochemistryGeophysicsGeosystems G3G3
billi et al.: mass transfer across fault cores 10.1029/2007GC001752
15 of 18
al., 2003; Storti et al., 2003; Billi and Storti,2004; Billi, 2005; Agosta and Aydin, 2006;Agosta et al., 2007; Micarelli et al., 2006], only1 out of about 85 analyzed structures is affectedby solution-related foliations. Moreover, most ofthese fault cores consist of uncemented or poorlycemented granular rocks. Ghisetti et al. [2001]analyzed several foliated fault cores in the centralApennines, but most developed in marly lime-stones that are known to be prone to pressuresolution and to foliation development [e.g.,Alvarez et al., 1976; Engelder and Marshak,1985]. Kirschner and Kennedy [2001] observedthat most of the fault cores developed along fivemajor thrust faults in the Canadian Rockies arefoliated, but these faults also developed acrossdifferent rocks including carbonates and carbona-ceous shales. These observations suggest that, inalmost pure carbonate rocks, granular fault coresaffected by significant pressure solution and masstransfer processes (i.e., leading to the formation offoliations across the fault cores) are rare, probablybecause of their low permeability. In some of theabove mentioned fault cores, in fact, the rockpermeability was measured [Agosta et al., 2007]or inferred from geochemical data [Ghisetti et al.,2001; Kirschner and Kennedy, 2001; Agosta andKirschner, 2003] and, in all cases, the fault corerocks resulted substantially impervious to fluids.The only exceptions to this rule are some normalfaults analyzed by Ghisetti et al. [2001]. Insummary, most results from previous papers oncarbonate fault cores are consistent with themajority of our data; however, some partially con-trasting results from previous papers [Hadizadeh,1994; Newman and Mitra, 1994; Ghisetti et al.,2001; Kirschner and Kennedy, 2001] and fromthe analyses here presented (Figure 9) do notallow a full generalization of the concept of aminimal amount of mass transfer across dolomiticfault cores and compel further work on thissubject to obtain more generalizable models.Moreover, some of the above mentioned papersprovide results from large- or even crustal-scalefaults. The chemical processes affecting thesefaults may significantly differ from those affectingsmall-scale faults such as those analyzed in thispaper. In the core of some large-scale faults,however, the grain size distribution is very similarto that defined in this paper for small-scale faults[Billi and Storti, 2004; Agosta and Aydin, 2006;Agosta et al., 2007]. This evidence suggests thatfluid flow and associated chemical processesin small- and large-scale carbonate faults are
similar and therefore that a comparison betweenour results and those from large-scale faults issignificant.
5. Conclusions
[28] The knowledge of chemical processes occur-ring within carbonate fault cores is still limited.Results from this study contribute to fill this gapand provide the following main conclusions.
[29] 1. Mass transfer across the studied granularfault cores is for the most part minimal probablybecause of the low permeability that impeded fluidcirculation and associated solute transport.
[30] 2. Chemical and physical analyses showedthat the studied fault cores and adjacent host rockhave acted substantially as conduit-barrier perme-ability systems consistent with the classical faulthydraulic models [e.g., Caine et al., 1996].
[31] 3. Results from this paper and from previousones compel further research to obtain more gen-eralizable concepts about chemical changes andmass transfer through fault cores in carbonates. Inparticular, the analysis of different classes of faults(i.e., reverse, strike-slip, normal, and oblique-slip)within tectonic frameworks and boundary condi-tions different from those considered in this paper[e.g., Newman and Mitra, 1994; Ghisetti et al.,2001; Kirschner and Kennedy, 2001] will provideimportant data to compare with the data presentedhere.
Acknowledgments
[32] C. Collettini, L. Kennedy, C. Marone, and V. Salters are
thanked for suggestions and constructive reviews. F. Salvini is
thanked for providing the DAISY software for structural
analysis. L. Aldega and C. Giampaolo are thanked for their
kind help in the XRD analyses. A. Kotsakis is thanked for
kindly providing microscope facilities.
References
Accordi, G., and F. Carbone (Eds.) (1986), Lithofacies map ofLatium-Abruzzi and neighbouring areas, scale 1:250,000,1 sheet, Cons. Naz. delle Ric., Rome.
Agosta, F., and A. Aydin (2006), Architecture and deformationmechanism of a basin-bounding normal fault in Mesozoicplatform carbonates, central Italy, J. Struct. Geol., 28,1445–1467.
Agosta, F., andD. L.Kirschner (2003), Fluid conduits in carbonate-hosted seismogenic normal faults of central Italy, J. Geophys.Res., 108(B4), 2221, doi:10.1029/2002JB002013.
Agosta, F., M. Prasad, and A. Aydin (2007), Physical proper-ties of carbonate fault rocks, Fucino basin, central Italy:
GeochemistryGeophysicsGeosystems G3G3
billi et al.: mass transfer across fault cores 10.1029/2007GC001752
16 of 18
Implications for fault seal in platform carbonates, Geofluids,7, 19–32.
Alvarez, W., T. Engelder, and W. Lowrie (1976), Formation ofspaced cleavage and folds in brittle limestone by dissolution,Geology, 4, 698–701.
Anthony, J. L., and C. Marone (2005), Influence of particlecharacteristics on granular friction, J. Geophys. Res., 110,B08409, doi:10.1029/2004JB003399.
Antonellini, M., and A. Aydin (1994), Effect of faulting onfluid flow in porous sandstones: Petrophysical properties,AAPG Bull., 78, 355–377.
Babaie, H. A., J. Hadizadeh, and A. Babaei (1995), Self-simi-lar cataclasis in the Saltville thrust zone, Knoxville, Tennes-see, J. Geophys. Res., 100, 18,075–18,084.
Bigi, G., D. Cosentino, M. Parotto, R. Sartori, andP. Scandone (Eds.) (1992), Structural Model of Italy, scale1:500,000, SELCA, Florence, Italy.
Billi, A. (2005), Grain size distribution and thickness of brec-cia and gouge zones from thin (<1 m) strike-slip fault coresin limestone, J. Struct. Geol., 27, 1823–1837.
Billi, A., and F. Storti (2004), Fractal distribution of particlesize in carbonate cataclastic rocks from the core of a regionalstrike-slip fault zone, Tectonophysics, 384, 115–128.
Billi, A., F. Salvini, and F. Storti (2002), Petrophysical char-acterisation of fault zones in carbonate rocks: Implicationsfor the evolution of structural and permeability properties,Boll. Geofis. Teor. Appl., 42, 271–274.
Billi, A., F. Salvini, and F. Storti (2003a), The host rock-faultcore transition in carbonate rocks: Implications for faultgrowth, structure and permeability, J. Struct. Geol., 25,1779–1794.
Billi, A., F. Salvini, and F. Storti (2003b), Particle size distri-butions of fault rocks and fault transpression: Are they re-lated?, Terra Nova, 15, 61–66.
Billi, A., A. Valle, M. Brilli, C. Faccenna, and R. Funiciello(2006), Fracture-controlled fluid circulation and dissolu-tional weathering in sinkhole-prone carbonate rocks fromcentral Italy, J. Struct. Geol., 29, 385–395.
Caine, J. S., J. P. Evans, and C. B. Forster (1996), Fault zonearchitecture and permeability structure, Geology, 24, 1025–1028.
Carmichael, R. S. (Ed.) (1989), Practical Handbook of Physi-cal Properties of Rocks and Minerals, CRC Press, BocaRaton, Fla.
Carrio-Schaffhauser, E., S. Raynaud, H. J. Latiere, andF. Mazerolle (1990), Propagation and localization of stylo-lites in limestones, in Deformation Mechanisms, Rheology,and Tectonics, edited by R. J. Knipe and E. H. Rutter, Geol.Soc. Spec. Pub., 54, 193–199.
Celico, F., E. Petrella, and P. Celico (2006), Hydrogeologicalbehaviour of some fault zones in a carbonate aquifer ofSouthern Italy: An experimentally based model, Terra Nova,18, 308–313.
Chester, F. M., J. P. Evans, and R. L. Biegel (1993), Internalstructure and weakening mechanisms of the San Andreasfault, J. Geophys. Res., 98, 771–786.
Chou, L., R. M. Garrels, and R. Wollast (1989), Comparativestudy of the kinetics and mechanisms of dissolution of car-bonate minerals, Chem. Geol., 78, 269–282.
Cipollari, P., and D. Cosentino (1995), Miocene unconformi-ties in the central Apennines: Geodynamic significance andsedimentary basin evolution, Tectonophysics, 252, 375–389.
Cosentino, D., P. Cipollari, V. Di Donato, I. Sgrosso, andM. Sgrosso (2002), The Volsci range in the kinematic evolu-tion of the northern southern Apennine orogenic system,Boll. Geol. Soc. It., 1, special volume, 209–218.
de Levie, R. (2001), Aqueous Acid-Base Equilibria and Titra-tions, 96 pp., Oxford Univ. Press, New York.
Di Toro, G., T. Hirose, S. Nielsen, G. Pennacchioni, andT. Shimamoto (2006), Natural and experimental evidenceof melt lubrication of faults during earthquakes, Science,311, 647–649.
Engelder, T. (1984), The role of pore-water circulation duringthe deformation of foreland fold and thrust belts, J. Geophys.Res., 89, 4319–4325.
Engelder, T., and S. Marshak (1985), Disjunctive cleavageformed at shallow depths in sedimentary rocks, J. Struct.Geol., 7, 327–343.
Evans, J. P., C. B. Forster, and J. V. Goddard (1997), Perme-ability of fault-related rocks, and implications for hydraulicstructure of fault zones, J. Struct. Geol., 19, 1393–1404.
Ford, D., and P. Williams (1989), Karst Geomorphology andHydrology, p. 601, Chapman and Hall, London.
Ghisetti, F., D. L. Kirschner, L. Vezzani, and F. Agosta (2001),Stable isotope evidence for contrasting paleofluid circulationin thrust faults and normal faults of the central Apennines,Italy, J. Geophys. Res., 106(B5), 8811–8826.
Graham, B., M. Antonellini, and A. Aydin (2003), Formationand growth of normal faults in carbonates within a compres-sive environment, Geology, 31, 11–14.
Hadizadeh, J. (1994), Interaction of cataclasis and pressuresolution in a low-temperature carbonate shear zone, PureAppl. Geophys., 143, 255–280.
Han, R., T. Shimamoto, T. Hirose, J.-H. Ree, and J. Ando(2007), Ultralow friction of carbonate faults caused by ther-mal decomposition, Science, 316, 878–881.
Heilbronner, R., and N. Keulen (2006), Grain size and grainshape analysis of fault rocks, Tectonophysics, 427, 199–216.
Hirose, T., and T. Shimamoto (2005), Growth of molten zoneas a mechanism of slip weakening of simulated faults ingabbro during frictional melting, J. Geophys. Res., 110,B05202, doi:10.1029/2004JB003207.
Hooke, R. L., and N. R. Iverson (1995), Grain size distributionin deforming subglacial tills: Role of grain fracture, Geology,23, 57–60.
Jefferies, S. P., R. E. Holdsworth, C. A. J. Wibberley,T. Shimamoto, C. J. Spiers, A. R. Niemeijer, and G. E. Lloyd(2006), The nature and importance of phyllonites develop-ment in crustal scale fault cores: An example from the Med-ian Tectonic Line, Japan, J. Struct. Geol., 28, 220–235.
Kennedy, L. A., and J. M. Logan (1997), The role of veiningand dissolution in the evolution of fine-grained mylonites,J. Struct. Geol., 19, 785–797.
Kirschner, D. L., and L. A. Kennedy (2001), Limited syntec-tonic fluid flow in carbonate-hosted thrust faults of the FrontRanges, Canadian Rockies, inferred from stable isotope dataand structures, J. Geophys. Res., 106, 8827–8840.
Knuth, M., and C. Marone (2007), Friction of sheared granularlayers: Role of particle dimensionality, surface roughness,and material properties, Geochem. Geophys. Geosyst., 8,Q03012, doi:10.1029/2006GC001327.
Krumbein, W. C., and F. C. Pettijohn (1990), Manual of Sedi-mentary Petrography, SEPM Reprint Ser., vol. 13, 549 pp.,SEPM Soc. for Sediment. Geol., Tulsa, Okla.
Malinverno, A., and W. B. F. Ryan (1986), Extension in theTyrrhenian Sea and shortening in the Apennines as result ofarc migration driven by sinking of the lithosphere, Tectonics,5, 227–254.
Micarelli, L., A. Benedicto, and C. A. J. Wibberley (2006),Structural evolution and permeability of normal fault zonesin highly porous carbonate rocks, J. Struct. Geol., 28, 1214–1227.
GeochemistryGeophysicsGeosystems G3G3
billi et al.: mass transfer across fault cores 10.1029/2007GC001752
17 of 18
Miller, S. A., C. Collettini, L. Chiaraluce, M. Cocco, M. Barchi,and B. J. P. Kaus (2004), Aftershocks driven by a high-pressure CO2 source at depth, Nature, 427, 724–727.
Newman, J., and G. Mitra (1994), Fluid-influenced deforma-tion and recrystallization of dolomite at low temperaturesalong a natural fault zone, Mountain City window, Tennes-see, Geol. Soc. Am. Bull., 106, 1267–1280.
Ngwenya, B. T., S. C. Elphick, I. G. Main, and G. B. Shimmield(2000), Experimental constraints on the diagenetic self-sealing capacity of faults in high porosity rocks, Earth Planet.Sci. Lett., 183, 187–199.
Oliver, N. H. S. (1996), Review and classification of structuralcontrols on fluid flow during regional metamorphism,J. Metamorph. Geol., 14, 477–492.
Plummer, L. N., T. M. L. Wigley, and D. L. Parkhurst (1978),The kinetics of calcite dissolution in CO2–water systems at5� to 60�C and 0.0 to 1.0 atm CO2, Am. J. Sci., 278, 179–216.
Rawling, G. C., and L. B. Goodwin (2003), Cataclasis andparticulate flow in faulted, poorly lithified sediments,J. Struct. Geol., 25, 317–331.
Reijnders, H. F. R., J. J. van Staden, and B. Griepink (1979),Titrimetry in a continuous flow system III. Calcium determi-nation in environmental samples, Fresenius Z. Anal. Chem.,295, 409–410.
Renard, F., J-.P. Gratier, and B. Jamtveit (2000), Kinetics ofcrack-sealing, intergranular pressure solution, and compac-tion around active faults, J. Struct. Geol., 22, 1395–1407.
Rossi, D., S. Bigi, M. De Castello, and P. Di Manna (2002),The structure of the Aurunci Mountains (southern Lazio): Abalanced cross-section and its restoration, Boll. Geol. Soc.It., 1, special volume, 151–159.
Rutter, E. H. (1983), Pressure solution in nature, theory andexperiment, J. Geol. Soc. London, 140, 725–740.
Rutter, E. H., R. E. Holdsworth, and R. J. Knipe (2001), Thenature and tectonic significance of fault zone weakening: An
introduction, in The Nature and Tectonic Significance ofFault Zone Weakening, edited by R. E Holdsworth et al.,Geol. Soc. Spec. Publ., 186, 1–12.
Salvini, F., A. Billi, and D. U. Wise (1999), Strike-slip fault-propagation cleavage in carbonate rocks: The Mattinata Faultzone, J. Struct. Geol., 21, 1731–1749.
Scholz, C. H. (1987), Wear and gouge formation in brittlefaulting, Geology, 15, 493–495.
Sherman, L. A., and P. Barak (2000), Solubility and dissolu-tion kinetics of dolomite in Ca-Mg-HCO3/CO3 solutions at25�C and 0.1 Mpa carbon dioxide, Soil Sci. Soc. Am. J., 64,1959–1968.
Sibson, R. H. (1986), Brecciation processes in fault zones:Inferences from earthquake rupturing, Pure Appl. Geophys.,124, 159–176.
Storti, F., A. Billi, and F. Salvini (2003), Particle size distri-butions in natural carbonate fault rocks: Insights for non-self-similar cataclasis, Earth Planet. Sci. Lett., 206, 173–186.
Storti, F., F. Balsamo, and F. Salvini (2007), Particle shapeevolution in natural carbonate granular wear material, TerraNova, 19, 344–352.
Wibberley, C. A. J., and T. Shimamoto (2005), Earthquake slipweakening and asperities explained by thermal pressuriza-tion, Nature, 436, 689–692.
Wilson, J. E., L. B. Goodwin, and C. Lewis (2006), Diagenesisof deformation band faults: Record and mechanical conse-quences of vadose zone flow and transport in the BandelierTuff, Los Alamos, New Mexico, J. Geophys. Res., 111,B09201, doi:10.1029/2005JB003892.
Yasuhara, H., C. Marone, and D. Elsworth (2005), Fault zonerestrengthening and frictional healing: The role of pressuresolution, J. Geophys. Res., 110, B06310, doi:10.1029/2004JB003327.
Zhang, S., and S. F. Cox (2000), Enhancement of fluid perme-ability during shear deformation of a synthetic mud, J. Struct.Geol., 22, 1385–1393.
GeochemistryGeophysicsGeosystems G3G3
billi et al.: mass transfer across fault cores 10.1029/2007GC001752
18 of 18