ice cocktails in molecular cloud cores
TRANSCRIPT
A&A manuscript no.(will be inserted by hand later)Your thesaurus codes are:08.03.4; 08.06.2; 08.16.5; 09.04.1; 09.13.2 13.09.4 ASTRONOMYANDASTROPHYSICS10.11.1997Ice CO-cktails in molecular cloud coresT.C. Teixeira1, J.P. Emerson1, M.E.Palumbo21 Department of Physics, Queen Mary and West�eld College, Mile End Road, London E1 4NS, England.e-mail: [email protected] and [email protected] Osservatorio Astro�sico di Catania, V.le A. Doria 6, I-95125 Catania, Italy.e-mail: [email protected] Main Journal, Di�use Matter in Space. Received September 10 1996; Revised August 1997; accepted September 16 1997Abstract. Spectra of the 4.67�m (2140 cm�1) solid-COabsorption feature are presented, towards embedded lowmass Young Stellar Objects in nearby molecular cloudcores, mostly in Taurus. The likely composition of theCO-bearing ices is analysed by �tting the observationswith laboratory data and the statistical signi�cance of theresults is discussed. Excellent �ts to the nonpolar compo-nent of the CO-ices along the observed lines of sight areproduced with irradiated pure CO ices, as previously sug-gested by Palumbo & Strazzulla (1993). It does not seemto be possible, however, to constrain the composition ofthe polar component by analysis of the CO band only. Thepossible origin of the ion irradiation is discussed. The im-plications of the non-uniqueness of the �t on the determi-nation of the abundance ratio between nonpolar and polarCO-ices are noted. Future observations are suggested todiscriminate between the di�erent possibilities for the po-lar component. Predictions are made for the abundance ofCO2 and methanol in the mantles.Key words: circumstellar matter { Stars: formation {Stars: pre-main sequence { ISM: dust, extinction, { ISM:molecules { Infrared: ISM: lines and bands1. IntroductionThe study of the composition of the icy mantles thatform on dust grains in certain regions of the interstellarmedium, including star forming molecular cloud cores, isimportant for trying to understand the role of such man-tles in the chemistry of the interstellar medium, and in un-derstanding the abundances of gaseous species that mayfreeze out onto the grains, as well as in understanding theoptical properties of the grains for input into radiativetransfer models. We report observations of the solid COabsorption feature at 4.67�m and their interpretation inSend o�print requests to: J.P. Emerson
terms of the nature of the ices making up the grain man-tles.Spectroscopic studies of nearby molecular clouds haveestablished the presence of complex icy mantles on thedust grains in these regions. A variety of absorption bandsin infrared spectra of objects in or behind the cloudshave been identi�ed as the vibrational transitions of themolecules in the ices (Whittet 1993). Water-ice has beenfound to be the most abundant component of the ice man-tles (Whittet et al. 1988, Eiroa & Hodapp 1989, Tanakaet al. 1990, Tanaka et al. 1994). With an abundance of10 { 40% relative to the water-ice, CO has also been ob-served to be an important constituent of the ices (Tie-lens et al. 1991, Kerr et al. 1993, Tanaka et al. 1994,Chiar et al. 1994,1995). The presence of CO2 in signif-icant amounts in the grain mantles, originally reportedby d'Hendecourt & de Muizon (1989), has now been con-�rmed by ISO, reaching 10 - 20% of the abundance ofsolid-H2O (e.g. de Graauw et al. 1996, G�urtler et al. 1996).Methanol (CH3OH) has also been found to be abundantin the ice mantles towards some lines of sight (Grim et al.1991, Allamandola et al. 1992, Skinner et al. 1992, Tie-lens & Allamandola 1987, Schutte et al. 1996), but absenttowards the Taurus molecular cloud (Chiar et al. 1996),although its overall abundance in the ices remains uncer-tain. Other molecules have also been detected as moreminor constituents of the interstellar ices, but are not ofrelevance here. A recent review on the formation and evo-lution of the ice mantles can be found in Schutte (1996).CO is the most volatile of the main species observedin grain mantles. When dominant in a mantle, CO canonly survive sublimation for temperatures below � 17K,but it can remain in the ices at higher temperatures whentrapped in less volatile matrices (e.g. H2O). Observationsof solid CO towards protostellar cores can thus provide avaluable insight on the physical and chemical conditionsin the coolest, outer parts of a protostellar envelope (andperhaps in dense circumstellar discs). The �eld was re-cently reviewed by Whittet & Duley (1991).
2 T.C. Teixeira et al: Ice CO-cktails in molecular cloud coresSolid CO in grain mantles can be identi�ed by an ab-sorption band at 4.67�m (2140 cm�1), corresponding tothe fundamental stretching vibration of the molecule. Lab-oratory studies have shown that the pro�le (peak position,width and shape) of the band is sensitive to the compo-sition, structure and thermal and irradiation history ofthe ices containing the CO (Sandford et al. 1988, Schmittet al. 1989, Palumbo & Strazzulla 1993, Leto et al. 1996).The comparison of the CO-ice bands observed towards as-tronomical objects with laboratory astrophysical analogscan therefore be a powerful probe of the astrophysical en-vironment where those mantles exist, and of the historyof the grains (e.g. Tielens et al. 1991, Chiar et al. 1995).Observations of the CO feature towards varied linesof sight, mostly towards �eld stars or towards high massYSOs, have shown that its pro�le varies from source tosource. However, in most cases the feature consists of twodistinct components: a sharper dominant absorption at� 4.674�m (� 2140 cm�1), and an overlapping broaderand generally weaker one at � 4.681�m (� 2136 cm�1)appearing as a long-wavelength wing (Tielens et al. 1991,Kerr et al. 1993, Chiar et al. 1994,1995). These authorshave attempted to determine the likely composition ofthe CO-bearing ices by detailed comparison with labora-tory spectra, or by theoretical calculation using laboratorydetermined optical constants. They found the 4.674�mabsorption to be due to CO mixed in with nonpolar1molecules such as CO2 and O2 or due to relatively pureCO matrices, whilst the 4.681�m component seems to bedue to CO in H2O-dominated polar matrices. Alterna-tively, Palumbo& Strazzulla (1993) argued for an origin ofthe 4.674�m feature in a layer of ion irradiated pure solidCO, while CO produced by ion irradiation of H2O:CH3OHices would be responsible for the long-wavelength compo-nent. They envisaged that there would be an inner layerof ion irradiated H2O:CH3OH ices covered by a layer ofion irradiated pure CO, the latter evaporating if close toembedded massive YSOs. In all cases the �ts to the datawere reasonable, but a detailed quantitative study of theresults was not presented; in particular the problems ofthe goodness and, more importantly, of the uniqueness ofthe �ts were not addressed in detail. The non-uniquenessof the �t may not only hamper a conclusive identi�cationof the mantle constituents, but also induce an incorrectestimate of the relative abundance between the nonpolarand the polar CO-ices.Most previous work on analysing the solid-CO bandshas concentrated on observations of �eld stars or massiveYSOs, whereas here we concentrate on low mass YSOsembedded in dense cores. The CO in the environment ofthese low mass YSOs may be di�erent from that in lines of1 Polar molecules are those, such as H2O, NH3,CH3OH, H2Setc with a signi�cant permanent dipole moment, whereas non-polar molecules, such as CO, CO2, CH4, O2 have negligiblemoment.
sight to �eld stars or high mass YSOs, and may perhaps bedi�erently a�ected by proximity to the YSO itself, and itsradiation �eld. There may also be a contribution from COin the circumstellar discs that are known to be associatedwith these embedded YSOs (Myers et al. 1987).The main objective of this paper is to report observa-tions towards deeply embedded low mass YSOs in densecores, and to analyse the possibility of constraining thecomposition of the CO-bearing ices in these observed linesof sight. In future works we intend to address the implica-tions of these results for the envelopes of the YSOs, andthe �tting of the same laboratory spectra to CO absorp-tion observed towards �eld stars.2. ObservationsThe target sources were primarily objects included in My-ers et al. (1987) which show a signi�cant water-ice feature(�H2O > 0:25) (Sato et al. 1990, Emerson et al. in prepa-ration), and had not been included in previous studies ofsolid CO. Some more evolved objects showing the charac-teristics of FUor stars, and already optically visible, werealso included in the sample in order to monitor the e�ectsof the evolution of the central source on the envelope. Oursample (Table 1) includes 7 Class I YSOs (in the schemeof Lada (1987)), 1 Class II, 1 EXOr, 3 FUor stars and 1Herbig Ae Be star.SVS12 (originally named after its discoverers (Stromet al. 1976) but also sometimes known as SSV12) is a ClassI source of � 20 L� and is probably the exciting star forthe Herbig-Haro object HH12 in NGC1333 (Stapelfeldt etal. 1991, Stapelfeldt 1994); it has a water ice feature with�H2O = 2:9 (Sato et al. 1990). B5 IRS1 is a Class I sourceof � 9:6 L� in Perseus (Fuller et al. 1991), which showsvariability in the near-IR (Moore & Emerson, 1994) andhas a water ice feature with �H2O ' 1:1 (Sato et al. 1990,Charnley et al. 1990). L1489 is a Class I source of � 7L�which was modelled by Adams et al. (1987); it has awater ice feature with �H2O = 2:9 (Sato et al. 1990) andis associated with re ection nebulosity associated with anout ow driven cavity (Emerson & Moore 1996). L1524 isa Class I source of � 1:3 L�with a rich near IR emissionline spectrum and is the lowest luminosity YSO to exhibitgaseous CO overtone bands in emission (Greene & Lada1996). L1551NE is a Class I (or perhaps Class 0) object inTaurus discovered by Emerson et al. (1984). Its bolometricluminosity is � 6 L� , it is driving an out ow (Moriarty-Schieven et al. 1995), and the derived optical extinction is� 60 mag (Barsony & Chandler 1993). TMC1A is a Class Isource of � 2:4 L� (Myers et al. 1987) which was modelledby Adams, Lada & Shu (1987). Its environment and out- ow have been recently extensively studied by Chandleret al. (1996). Reipurth 50N is a Class I source of � 250L� associated with re ection nebulosity and HH objectsand is one of the more luminous objects in the L1641 re-gion (Colom�e et al. 1995); it has a water ice feature with
T.C. Teixeira et al: Ice CO-cktails in molecular cloud cores 3Table 1. Log of ObservationsObject IRAS name Type Region � (1950)1 � (1950)1 UT DateSVS12 Class I NGC1333 03 25 55.8 +31 10 02 3/10/94SVS13 03259+3105 EXor NGC1333 03 25 58.2 +31 05 46 4/10/94B5 IRS1 03445+3242 Class I Perseus 03 44 31.8 +32 42 34 3/12/92L1489 04016+2610 Class I Taurus 04 01 40.6 +26 10 47 2/10/94L1524 04239+2436 Class I Taurus 04 23 54.5 +24 36 55 4/10/94L1551NE Class I Taurus 04 28 50.5 +18 02 11 3/12/92L1536S 04303+2240 Class II Taurus 04 30 19.4 +22 40 17 3/12/92TMC1A 04365+2535 Class I Taurus 04 36 31.3 +25 35 53 3/12/92Re50N IRS1 05380{0728 Class I L1641 05 38 02.4 {07 29 00 3/12/92FUOri FUor Orion 05 42 37.7 +09 03 03 3/12/92RMon 06364+0846 HAeBe Monoceros 06 36 26.1 +08 46 53 4/12/92ZCMa 07013{1128 FUor Canis Major 07 01 22.5 {11 28 36 3/12/92Elias 1-12 21454+4718 FUor Cygnus 21 45 26.9 +47 18 08 3/12/921) coordinates from telescope pointing�H2O = 2:6 (Casali 1991). It has been suggested that thismay be an FUor type object (Strom & Strom 1993).L1536S (L1536B in the notation of Myers et al. 1987)is a Class II source associated with optical nebulosity andhas a water ice feature with �H2O = 0:7 (Sato et al. 1990).SVS13 (originally named after its discoverers (Strom etal. 1976) but also sometimes known as SSV13) is the excit-ing source of the Herbig Haro chain HH7-11 in NGC1333(Sandell et al. 1990) and underwent an EXor type opti-cal/infrared outburst (a scaled down FUor event) some-time between Dec 1988 and Sep 1990 (Eisl�o�el et al. 1991).Elias 1-12 (also known as V1735 Cyg) underwent an FUortype eruption and became visible (Kenyon & Hartmann1991); it has a water ice feature with �H2O = 0:7 (Satoet al. 1990). FUOri is the prototypical FUor type object(Kenyon & Hartmann 1991) and was modelled by AdamsLada & Shu (1987). ZCMa is sometimes classi�ed as aHerbig AeBe star, but more recently has been classi�edas an FUor type variable (Kenyon & Hartmann 1991) andfound to be a binary (Barth et al. 1994). RMon is a Her-big AeBe star situated at the apex of the cometary nebulaNGC2261, and is associated with an IR re ection nebulaand a disk (Yamashita et al 1989).2.1. General descriptionSpectroscopy in the 4.5{4.9 �m window was carried outat the United Kingdom Infrared Telescope (UKIRT) atMauna Kea in Hawaii, with the Cooled Grating Spec-trometer 4 (CGS4), in the course of two observing runs:1992 December 2,3 and 1994 October 1-4. In both runsthe detector was a SBRC InSb 58�62 pixels array, andthe spectra were obtained with an intermediate resolu-tion 75 lines/mm grating. The sky subtraction employedstandard chopping and nodding techniques (nodding wasdone along the slit so that the main and nodded spectraboth appeared on the chip). A chop throw of 15 00. 4 wasused throughout both runs, in the north-south direction
in December 1992 and east-west in October 1994. All spec-tra were fully sampled by shifting the detector over twopixels in steps of half a pixel (2�2 sampling). The can-cellation of atmospheric features was achieved by ratioingthe spectrum of each object by the spectrum of a stan-dard star observed at a similar airmass (generally within0.1) in the same region in the sky. Flux calibration wasnot attempted. A log of the observations is presented inTable 1, which lists Object and IRAS name, region of sky,1950 coordinates used, and UT date of observation.In December 1992, the short focal length (150 mm)camera was used giving a resolving power (�=��) of �760. The slit width (one pixel) corresponded to � 3 00.Thewavelength scales were calibrated relative to an argonlamp, and the calibration is accurate to � 0.0015 �m. Theweather was very unstable on both nights and most of theobjects were observed through clouds, resulting in largevariations of the ux level between consecutive integra-tions. The total integration time per object varied withthe brightness of the source and with the atmospheric con-ditions. The useful integration time per object was typi-cally 1 min. The useful wavelength coverage was found tobe 4.58{4.78 �m. All spectra were ratioed with the stan-dard BS1203 (B1 I). Because a standard was not avail-able closer than 0.3 in airmass, resulting in poor atmo-spheric cancellation, FUOri was taken as a standard forRe50N IRS1 and ZCMa (FUOri does not show evidenceof any features in its spectrum).In October 1994, the long focal length (300 mm) cam-era was used, and the resolving power was thus dou-bled to � 1500 and the spectral coverage was halved. Theslit width (one pixel) corresponded to � 1 00. 5. The wave-length calibration was done relative to an argon lampand to known atmospheric absorptions present in the ob-served wavelength range (4.58{4.78 �m), and is accurateto � 0.0005 �m. Observations were made of L1489, L1524,SVS13 and SVS12. An attempt was also made to observeB5 IRS1 again (to improve the 1992 data), but it was un-
4 T.C. Teixeira et al: Ice CO-cktails in molecular cloud coressuccessful as the object had faded in the M window, inagreement with the fading trend reported by Moore &Emerson (1994). The weather conditions were generallygood. The typical integration time per object was 8 min.The spectra of L1489, L1524 and SVS13 were ratioed withthe standard BS1543 (F6 V), and the spectrum of SVS12was ratioed with the standard BS1131 (B1 III).2.2. Data reductionThe data reduction was performed using the CGS4DR andFIGARO reduction packages from Starlink. For a detaileddescription of the data reduction procedure and of theterminology, the reader is referred to Puxley et al. (1992)and Daly (1995).Because of the large and rapid variations of the at-mosphere during the December 1992 run, the sky back-ground was not fully removed by chopping and nodding.In an attempt to recover as much signal as possible fromthe sources and to obtain a good estimate of the errorbars,the following procedure was applied to each object 'group'and each standard 'group'.First, the residual sky emission left in each noddedOBJECT-SKY pair was subtracted using POLYSKY.Then each pair was scaled to have the same ux in thecentral spectrum as the pair with the highest number ofcounts. Finally, all the pairs in each group were co-addedusing an iterative procedure to eliminate pairs that de-viated too much from the mean. The errorbars in eachspectrum were estimated by calculating the standard de-viation of the number of counts at each wavelength. Allspectra were optimally extracted following the algorithmdeveloped by Horne (1986) using OPTEXTRACT, andde-rippled when necessary.As a check, this procedure was applied not only to thesources observed through clouds, but also to the few thatwere not a�ected by clouds. As expected, for the lattersources the spectra resulting from the previously describedprocedure were identical to those obtained with CGS4DR.The better atmospheric stability in the October 1994run is re ected in the data reduction, which required muchless manipulation of the frames. The standard reductionprocedure was carried out, using CGS4DR (it was notnecessary to use POLYSKY or scaling). The spectra wereoptimally extracted and de-rippled when necessary.2.3. The spectraThe �nal spectra, in optical depth units, are presented inFigs. 1 and 2. To determine the continua for conversion ofthe spectra into optical depth units, a straight line �t wasperformed to the points either side of the band down to4.58�m and up to 4.78�m, using �2-minimization.Solid CO was clearly detected in seven of the thir-teen observed sources (6 out of 7 of the deeply embeddedClass I objects, and the EXor): SVS12, SVS13, B5 IRS1,
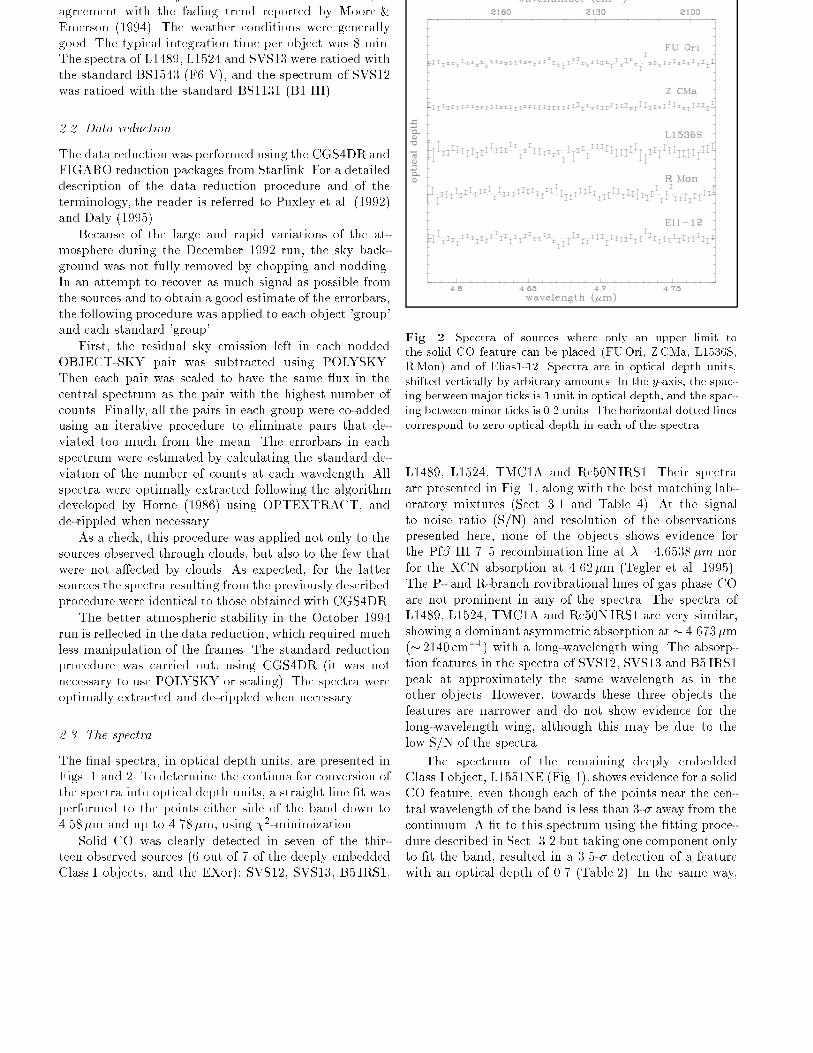
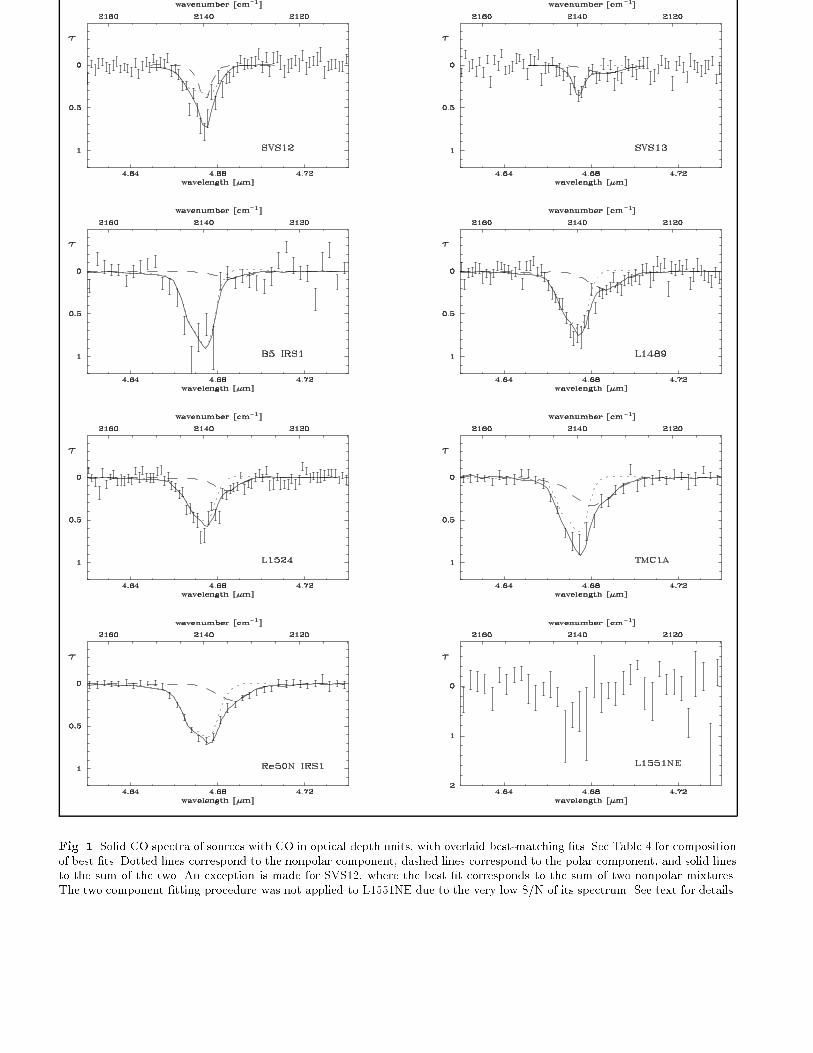
Fig. 2. Spectra of sources where only an upper limit tothe solid CO feature can be placed (FUOri, Z CMa, L1536S,RMon) and of Elias1-12. Spectra are in optical depth units,shifted vertically by arbitrary amounts. In the y-axis, the spac-ing between major ticks is 1 unit in optical depth, and the spac-ing between minor ticks is 0.2 units. The horizontal dotted linescorrespond to zero optical depth in each of the spectra.L1489, L1524, TMC1A and Re50N IRS1. Their spectraare presented in Fig. 1, along with the best matching lab-oratory mixtures (Sect. 3.1 and Table 4). At the signalto noise ratio (S/N) and resolution of the observationspresented here, none of the objects shows evidence forthe Pf� HI 7{5 recombination line at �= 4:6538�m norfor the XCN absorption at 4.62�m (Tegler et al. 1995).The P- and R-branch rovibrational lines of gas phase COare not prominent in any of the spectra. The spectra ofL1489, L1524, TMC1A and Re50N IRS1 are very similar,showing a dominant asymmetric absorption at � 4.673�m(� 2140 cm�1) with a long-wavelength wing. The absorp-tion features in the spectra of SVS12, SVS13 and B5 IRS1peak at approximately the same wavelength as in theother objects. However, towards these three objects thefeatures are narrower and do not show evidence for thelong-wavelength wing, although this may be due to thelow S/N of the spectra.The spectrum of the remaining deeply embeddedClass I object, L1551NE (Fig.1), shows evidence for a solidCO feature, even though each of the points near the cen-tral wavelength of the band is less than 3-� away from thecontinuum. A �t to this spectrum using the �tting proce-dure described in Sect. 3.2 but taking one component onlyto �t the band, resulted in a 3.5-� detection of a featurewith an optical depth of 0.7 (Table 2). In the same way,
T.C. Teixeira et al: Ice CO-cktails in molecular cloud cores 5
Fig. 1. Solid CO spectra of sources with CO in optical depth units, with overlaid best-matching �ts. See Table 4 for compositionof best �ts. Dotted lines correspond to the nonpolar component, dashed lines correspond to the polar component, and solid linesto the sum of the two. An exception is made for SVS12, where the best �t corresponds to the sum of two nonpolar mixtures.The two component �tting procedure was not applied to L1551NE due to the very low S/N of its spectrum. See text for details.
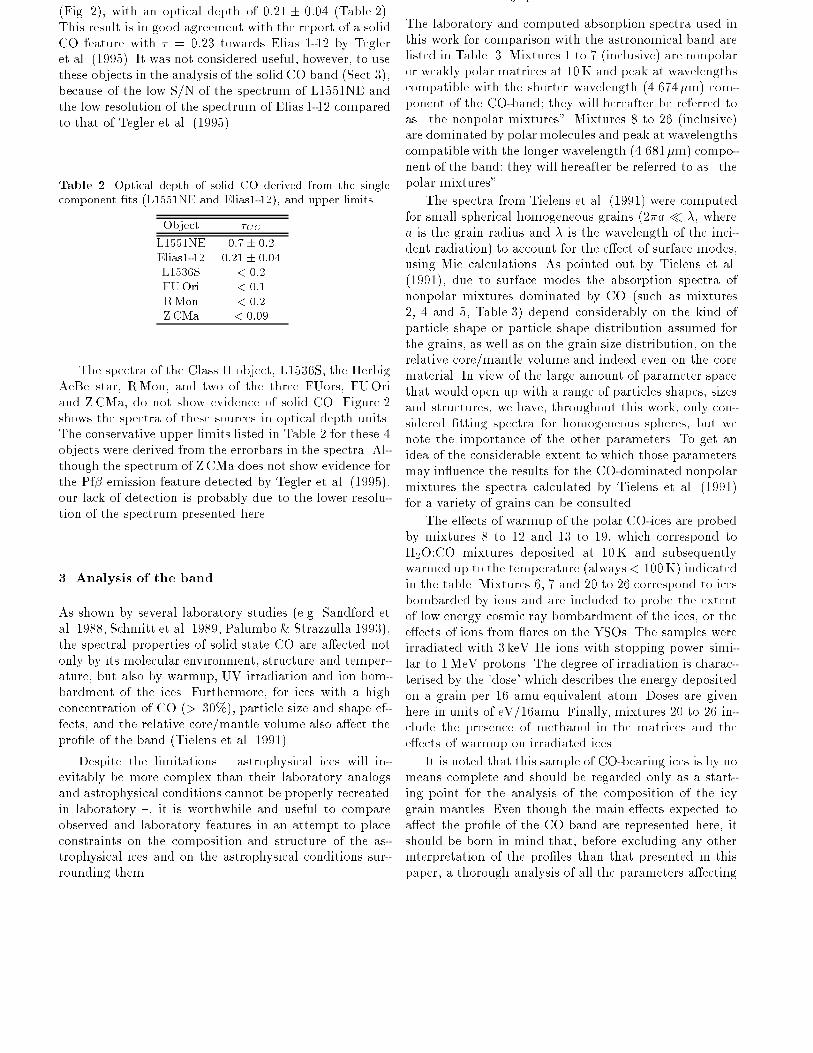
6 T.C. Teixeira et al: Ice CO-cktails in molecular cloud coresa weak feature was identi�ed towards the FUor Elias 1-12(Fig. 2), with an optical depth of 0:21 � 0:04 (Table 2).This result is in good agreement with the report of a solidCO feature with � = 0:23 towards Elias 1-12 by Tegleret al. (1995). It was not considered useful, however, to usethese objects in the analysis of the solid CO band (Sect.3),because of the low S/N of the spectrum of L1551NE andthe low resolution of the spectrum of Elias 1-12 comparedto that of Tegler et al. (1995).Table 2. Optical depth of solid CO derived from the singlecomponent �ts (L1551NE and Elias1-12), and upper limits.Object �COL1551NE 0:7� 0:2Elias1-12 0:21� 0:04L1536S < 0:2FUOri < 0:1RMon < 0:2ZCMa < 0:09The spectra of the Class II object, L1536S, the HerbigAeBe star, RMon, and two of the three FUors, FUOriand ZCMa, do not show evidence of solid CO. Figure 2shows the spectra of these sources in optical depth units.The conservative upper limits listed in Table 2 for these 4objects were derived from the errorbars in the spectra. Al-though the spectrum of ZCMa does not show evidence forthe Pf� emission feature detected by Tegler et al. (1995),our lack of detection is probably due to the lower resolu-tion of the spectrum presented here.3. Analysis of the bandAs shown by several laboratory studies (e.g. Sandford etal. 1988, Schmitt et al. 1989, Palumbo & Strazzulla 1993),the spectral properties of solid state CO are a�ected notonly by its molecular environment, structure and temper-ature, but also by warmup, UV irradiation and ion bom-bardment of the ices. Furthermore, for ices with a highconcentration of CO (> 30%), particle size and shape ef-fects, and the relative core/mantle volume also a�ect thepro�le of the band (Tielens et al. 1991).Despite the limitations { astrophysical ices will in-evitably be more complex than their laboratory analogsand astrophysical conditions cannot be properly recreatedin laboratory {, it is worthwhile and useful to compareobserved and laboratory features in an attempt to placeconstraints on the composition and structure of the as-trophysical ices and on the astrophysical conditions sur-rounding them.
3.1. The laboratory spectraThe laboratory and computed absorption spectra used inthis work for comparison with the astronomical band arelisted in Table 3. Mixtures 1 to 7 (inclusive) are nonpolaror weakly polar matrices at 10K and peak at wavelengthscompatible with the shorter wavelength (4.674�m) com-ponent of the CO-band; they will hereafter be referred toas \the nonpolar mixtures". Mixtures 8 to 26 (inclusive)are dominated by polar molecules and peak at wavelengthscompatible with the longer wavelength (4.681�m) compo-nent of the band; they will hereafter be referred to as \thepolar mixtures".The spectra from Tielens et al. (1991) were computedfor small spherical homogeneous grains (2�a � �, wherea is the grain radius and � is the wavelength of the inci-dent radiation) to account for the e�ect of surface modes,using Mie calculations. As pointed out by Tielens et al.(1991), due to surface modes the absorption spectra ofnonpolar mixtures dominated by CO (such as mixtures2, 4 and 5, Table 3) depend considerably on the kind ofparticle shape or particle shape distribution assumed forthe grains, as well as on the grain size distribution, on therelative core/mantle volume and indeed even on the corematerial. In view of the large amount of parameter spacethat would open up with a range of particles shapes, sizesand structures, we have, throughout this work, only con-sidered �tting spectra for homogeneous spheres, but wenote the importance of the other parameters. To get anidea of the considerable extent to which those parametersmay in uence the results for the CO-dominated nonpolarmixtures the spectra calculated by Tielens et al. (1991)for a variety of grains can be consulted.The e�ects of warmup of the polar CO-ices are probedby mixtures 8 to 12 and 13 to 19, which correspond toH2O:CO mixtures deposited at 10K and subsequentlywarmed up to the temperature (always< 100K) indicatedin the table. Mixtures 6, 7 and 20 to 26 correspond to icesbombarded by ions and are included to probe the extentof low energy cosmic ray bombardment of the ices, or thee�ects of ions from ares on the YSOs. The samples wereirradiated with 3 keV He ions with stopping power simi-lar to 1MeV protons. The degree of irradiation is charac-terised by the 'dose' which describes the energy depositedon a grain per 16 amu equivalent atom. Doses are givenhere in units of eV/16amu. Finally, mixtures 20 to 26 in-clude the presence of methanol in the matrices and thee�ects of warmup on irradiated ices.It is noted that this sample of CO-bearing ices is by nomeans complete and should be regarded only as a start-ing point for the analysis of the composition of the icygrain mantles. Even though the main e�ects expected toa�ect the pro�le of the CO band are represented here, itshould be born in mind that, before excluding any otherinterpretation of the pro�les than that presented in thispaper, a thorough analysis of all the parameters a�ecting
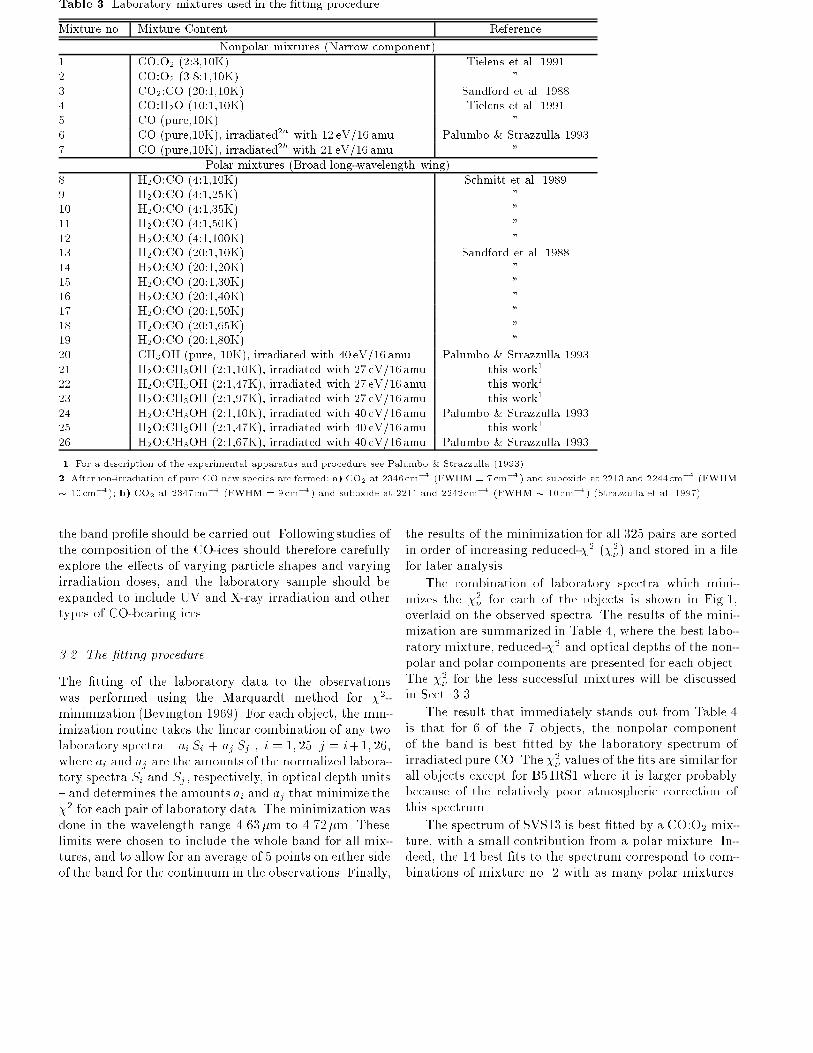
T.C. Teixeira et al: Ice CO-cktails in molecular cloud cores 7Table 3. Laboratory mixtures used in the �tting procedureMixture no. Mixture Content ReferenceNonpolar mixtures (Narrow component)1 CO:O2 (2:3,10K) Tielens et al. 19912 CO:O2 (3.8:1,10K) "3 CO2:CO (20:1,10K) Sandford et al. 19884 CO:H2O (10:1,10K) Tielens et al. 19915 CO (pure,10K) "6 CO (pure,10K), irradiated2a with 12 eV/16 amu Palumbo & Strazzulla 19937 CO (pure,10K), irradiated2b with 21 eV/16 amu "Polar mixtures (Broad long-wavelength wing)8 H2O:CO (4:1,10K) Schmitt et al. 19899 H2O:CO (4:1,25K) "10 H2O:CO (4:1,35K) "11 H2O:CO (4:1,50K) "12 H2O:CO (4:1,100K) "13 H2O:CO (20:1,10K) Sandford et al. 198814 H2O:CO (20:1,20K) "15 H2O:CO (20:1,30K) "16 H2O:CO (20:1,40K) "17 H2O:CO (20:1,50K) "18 H2O:CO (20:1,65K) "19 H2O:CO (20:1,80K) "20 CH3OH (pure, 10K), irradiated with 40 eV/16 amu Palumbo & Strazzulla 199321 H2O:CH3OH (2:1,10K), irradiated with 27 eV/16 amu this work122 H2O:CH3OH (2:1,47K), irradiated with 27 eV/16 amu this work123 H2O:CH3OH (2:1,97K), irradiated with 27 eV/16 amu this work124 H2O:CH3OH (2:1,10K), irradiated with 40 eV/16 amu Palumbo & Strazzulla 199325 H2O:CH3OH (2:1,47K), irradiated with 40 eV/16 amu this work126 H2O:CH3OH (2:1,67K), irradiated with 40 eV/16 amu Palumbo & Strazzulla 19931. For a description of the experimental apparatus and procedure see Palumbo & Strazzulla (1993).2. After ion-irradiation of pure CO new species are formed: a) CO2 at 2346cm�1 (FWHM = 7cm�1) and suboxide at 2213 and 2244cm�1 (FWHM� 10cm�1); b) CO2 at 2347cm�1 (FWHM = 9cm�1) and suboxide at 2211 and 2242cm�1 (FWHM � 10cm�1) (Strazzulla et al. 1997)the band pro�le should be carried out. Following studies ofthe composition of the CO-ices should therefore carefullyexplore the e�ects of varying particle shapes and varyingirradiation doses, and the laboratory sample should beexpanded to include UV and X-ray irradiation and othertypes of CO-bearing ices.3.2. The �tting procedureThe �tting of the laboratory data to the observationswas performed using the Marquardt method for �2-minimization (Bevington 1969). For each object, the min-imization routine takes the linear combination of any twolaboratory spectra { ai Si + aj Sj ; i = 1; 25 j = i+1; 26,where ai and aj are the amounts of the normalized labora-tory spectra Si and Sj , respectively, in optical depth units{ and determines the amounts ai and aj that minimize the�2 for each pair of laboratory data. The minimization wasdone in the wavelength range 4.63�m to 4.72�m. Theselimits were chosen to include the whole band for all mix-tures, and to allow for an average of 5 points on either sideof the band for the continuum in the observations. Finally,the results of the minimization for all 325 pairs are sortedin order of increasing reduced-�2 (�2�) and stored in a �lefor later analysis.The combination of laboratory spectra which mini-mizes the �2� for each of the objects is shown in Fig.1,overlaid on the observed spectra. The results of the mini-mization are summarized in Table 4, where the best labo-ratory mixture, reduced-�2 and optical depths of the non-polar and polar components are presented for each object.The �2� for the less successful mixtures will be discussedin Sect. 3.3.The result that immediately stands out from Table 4is that for 6 of the 7 objects, the nonpolar componentof the band is best �tted by the laboratory spectrum ofirradiated pure CO. The �2� values of the �ts are similar forall objects except for B5 IRS1 where it is larger probablybecause of the relatively poor atmospheric correction ofthis spectrum.The spectrum of SVS13 is best �tted by a CO:O2 mix-ture, with a small contribution from a polar mixture. In-deed, the 14 best �ts to the spectrum correspond to com-binations of mixture no. 2 with as many polar mixtures.
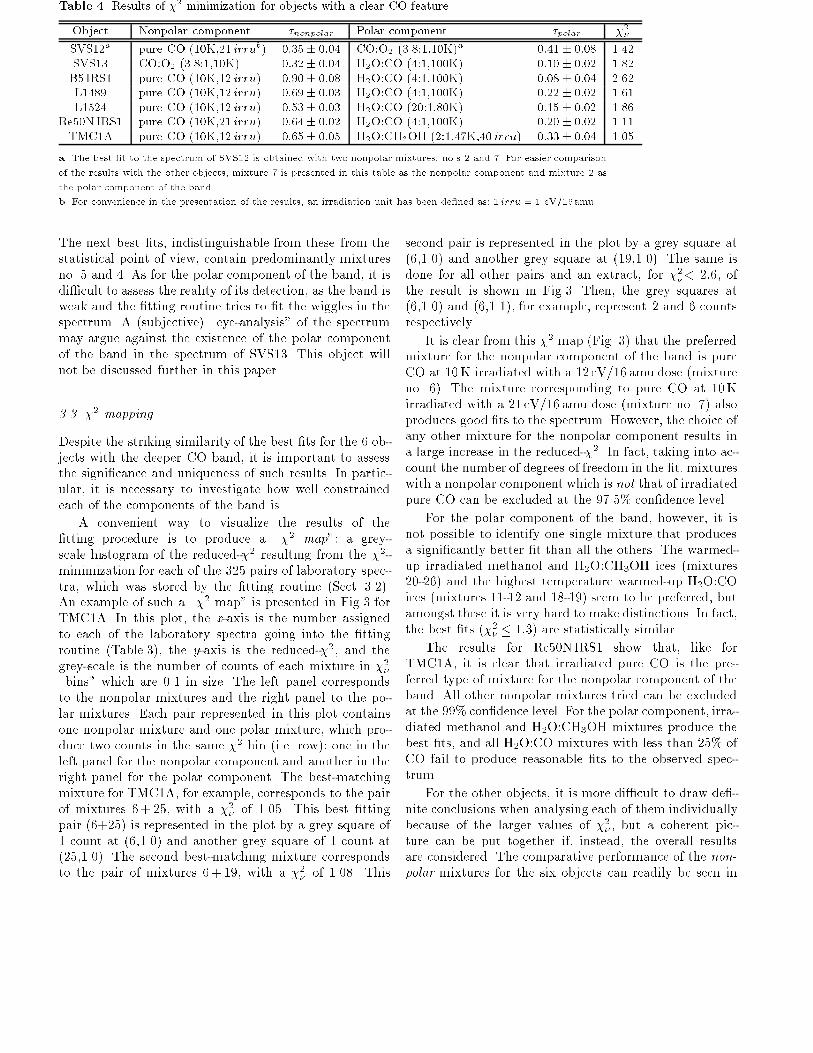
8 T.C. Teixeira et al: Ice CO-cktails in molecular cloud coresTable 4. Results of �2 minimization for objects with a clear CO featureObject Nonpolar component �nonpolar Polar component �polar �2�SVS12a pure CO (10K,21 irrub) 0:35� 0:04 CO:O2 (3.8:1,10K)a 0:41� 0:08 1.42SVS13 CO:O2 (3.8:1,10K) 0:32� 0:04 H2O:CO (4:1,100K) 0:10� 0:02 1.82B5 IRS1 pure CO (10K,12 irru) 0:90� 0:08 H2O:CO (4:1,100K) 0:08� 0:04 2.62L1489 pure CO (10K,12 irru) 0:69� 0:03 H2O:CO (4:1,100K) 0:22� 0:02 1.61L1524 pure CO (10K,12 irru) 0:53� 0:03 H2O:CO (20:1,80K) 0:15� 0:02 1.86Re50N IRS1 pure CO (10K,21 irru) 0:64� 0:02 H2O:CO (4:1,100K) 0:20� 0:02 1.11TMC1A pure CO (10K,12 irru) 0:65� 0:05 H2O:CH3OH (2:1,47K,40 irru) 0:33� 0:04 1.05a. The best �t to the spectrum of SVS12 is obtained with two nonpolar mixtures: no.s 2 and 7. For easier comparisonof the results with the other objects, mixture 7 is presented in this table as the nonpolar component and mixture 2 asthe polar component of the band.b. For convenience in the presentation of the results, an irradiation unit has been de�ned as: 1 irru = 1 eV/16amu.The next best �ts, indistinguishable from these from thestatistical point of view, contain predominantly mixturesno. 5 and 4. As for the polar component of the band, it isdi�cult to assess the reality of its detection, as the band isweak and the �tting routine tries to �t the wiggles in thespectrum. A (subjective) \eye-analysis" of the spectrummay argue against the existence of the polar componentof the band in the spectrum of SVS13. This object willnot be discussed further in this paper.3.3. �2 mappingDespite the striking similarity of the best �ts for the 6 ob-jects with the deeper CO band, it is important to assessthe signi�cance and uniqueness of such results. In partic-ular, it is necessary to investigate how well constrainedeach of the components of the band is.A convenient way to visualize the results of the�tting procedure is to produce a \�2 map": a grey-scale histogram of the reduced-�2 resulting from the �2-minimization for each of the 325 pairs of laboratory spec-tra, which was stored by the �tting routine (Sect. 3.2).An example of such a \�2 map" is presented in Fig.3 forTMC1A. In this plot, the x-axis is the number assignedto each of the laboratory spectra going into the �ttingroutine (Table 3), the y-axis is the reduced-�2, and thegrey-scale is the number of counts of each mixture in �2�\bins" which are 0.1 in size. The left panel correspondsto the nonpolar mixtures and the right panel to the po-lar mixtures. Each pair represented in this plot containsone nonpolar mixture and one polar mixture, which pro-duce two counts in the same �2 bin (i.e. row): one in theleft panel for the nonpolar component and another in theright panel for the polar component. The best-matchingmixture for TMC1A, for example, corresponds to the pairof mixtures 6+ 25, with a �2� of 1.05 . This best �ttingpair (6+25) is represented in the plot by a grey square of1 count at (6,1.0) and another grey square of 1 count at(25,1.0). The second best-matching mixture correspondsto the pair of mixtures 6+ 19, with a �2� of 1.08 . This
second pair is represented in the plot by a grey square at(6,1.0) and another grey square at (19,1.0). The same isdone for all other pairs and an extract, for �2�< 2:6, ofthe result is shown in Fig.3. Then, the grey squares at(6,1.0) and (6,1.1), for example, represent 2 and 6 countsrespectively.It is clear from this �2 map (Fig. 3) that the preferredmixture for the nonpolar component of the band is pureCO at 10K irradiated with a 12 eV/16 amu dose (mixtureno. 6). The mixture corresponding to pure CO at 10Kirradiated with a 21 eV/16 amu dose (mixture no. 7) alsoproduces good �ts to the spectrum. However, the choice ofany other mixture for the nonpolar component results ina large increase in the reduced-�2. In fact, taking into ac-count the number of degrees of freedom in the �t, mixtureswith a nonpolar component which is not that of irradiatedpure CO can be excluded at the 97.5% con�dence level.For the polar component of the band, however, it isnot possible to identify one single mixture that producesa signi�cantly better �t than all the others. The warmed-up irradiated methanol and H2O:CH3OH ices (mixtures20-26) and the highest temperature warmed-up H2O:COices (mixtures 11-12 and 18-19) seem to be preferred, butamongst these it is very hard to make distinctions. In fact,the best �ts (�2� � 1:3) are statistically similar.The results for Re50NIRS1 show that, like forTMC1A, it is clear that irradiated pure CO is the pre-ferred type of mixture for the nonpolar component of theband. All other nonpolar mixtures tried can be excludedat the 99% con�dence level. For the polar component, irra-diated methanol and H2O:CH3OH mixtures produce thebest �ts, and all H2O:CO mixtures with less than 25% ofCO fail to produce reasonable �ts to the observed spec-trum.For the other objects, it is more di�cult to draw de�-nite conclusions when analysing each of them individuallybecause of the larger values of �2� , but a coherent pic-ture can be put together if, instead, the overall resultsare considered. The comparative performance of the non-polar mixtures for the six objects can readily be seen in
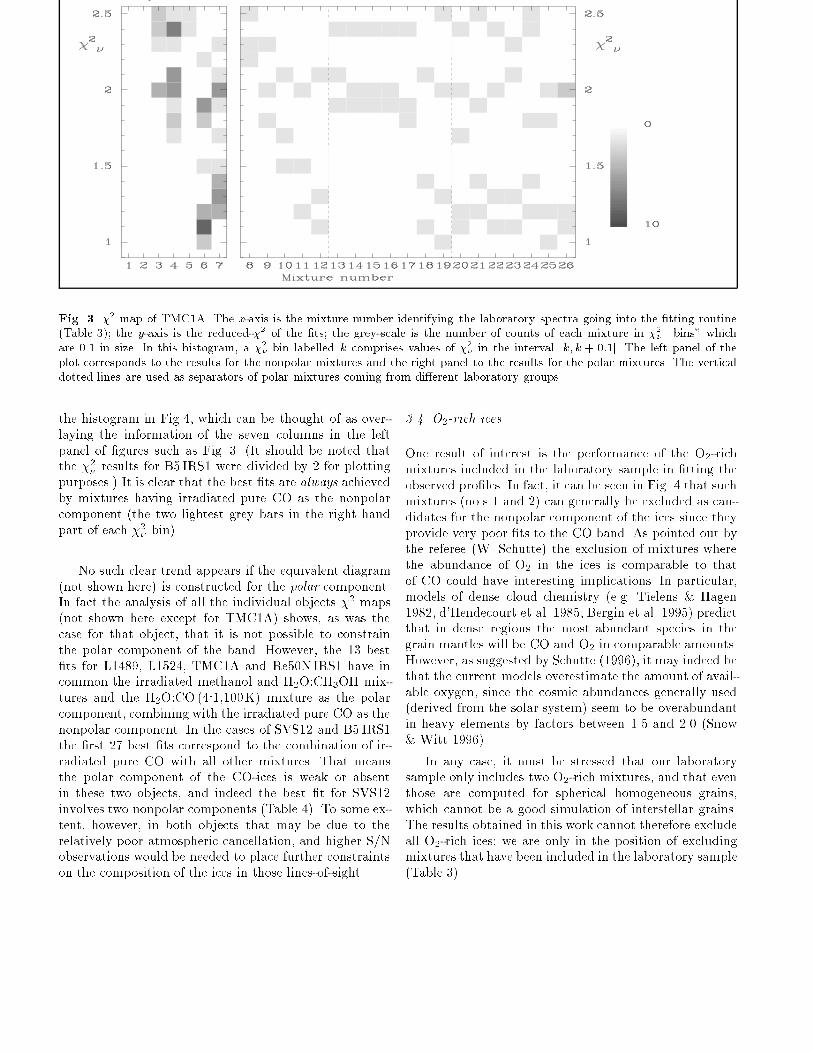
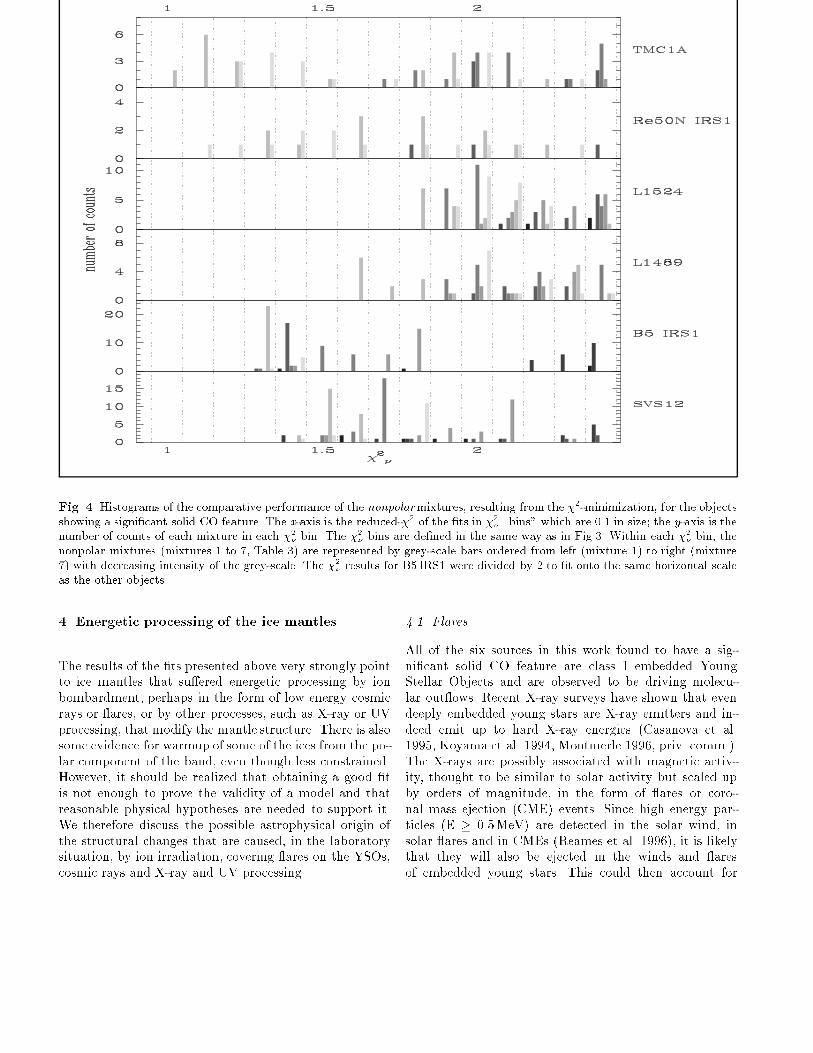
T.C. Teixeira et al: Ice CO-cktails in molecular cloud cores 9Fig. 3. �2 map of TMC1A. The x-axis is the mixture number identifying the laboratory spectra going into the �tting routine(Table 3); the y-axis is the reduced-�2 of the �ts; the grey-scale is the number of counts of each mixture in �2� \bins" whichare 0.1 in size. In this histogram, a �2� bin labelled k comprises values of �2� in the interval [k; k + 0:1[. The left panel of theplot corresponds to the results for the nonpolar mixtures and the right panel to the results for the polar mixtures. The verticaldotted lines are used as separators of polar mixtures coming from di�erent laboratory groups.the histogram in Fig.4, which can be thought of as over-laying the information of the seven columns in the leftpanel of �gures such as Fig. 3. (It should be noted thatthe �2� results for B5 IRS1 were divided by 2 for plottingpurposes.) It is clear that the best �ts are always achievedby mixtures having irradiated pure CO as the nonpolarcomponent (the two lightest grey bars in the right handpart of each �2� bin).No such clear trend appears if the equivalent diagram(not shown here) is constructed for the polar component.In fact the analysis of all the individual objects �2 maps(not shown here except for TMC1A) shows, as was thecase for that object, that it is not possible to constrainthe polar component of the band. However, the 13 best�ts for L1489, L1524, TMC1A and Re50N IRS1 have incommon the irradiated methanol and H2O:CH3OH mix-tures and the H2O:CO (4:1,100K) mixture as the polarcomponent, combining with the irradiated pure CO as thenonpolar component. In the cases of SVS12 and B5 IRS1the �rst 27 best �ts correspond to the combination of ir-radiated pure CO with all other mixtures. That meansthe polar component of the CO-ices is weak or absentin these two objects, and indeed the best �t for SVS12involves two nonpolar components (Table 4). To some ex-tent, however, in both objects that may be due to therelatively poor atmospheric cancellation, and higher S/Nobservations would be needed to place further constraintson the composition of the ices in those lines-of-sight.
3.4. O2-rich icesOne result of interest is the performance of the O2-richmixtures included in the laboratory sample in �tting theobserved pro�les. In fact, it can be seen in Fig. 4 that suchmixtures (no.s 1 and 2) can generally be excluded as can-didates for the nonpolar component of the ices since theyprovide very poor �ts to the CO band. As pointed out bythe referee (W. Schutte) the exclusion of mixtures wherethe abundance of O2 in the ices is comparable to thatof CO could have interesting implications. In particular,models of dense cloud chemistry (e.g. Tielens & Hagen1982, d'Hendecourt et al. 1985, Bergin et al. 1995) predictthat in dense regions the most abundant species in thegrain mantles will be CO and O2 in comparable amounts.However, as suggested by Schutte (1996), it may indeed bethat the current models overestimate the amount of avail-able oxygen, since the cosmic abundances generally used(derived from the solar system) seem to be overabundantin heavy elements by factors between 1.5 and 2.0 (Snow& Witt 1996).In any case, it must be stressed that our laboratorysample only includes two O2-rich mixtures, and that eventhose are computed for spherical homogeneous grains,which cannot be a good simulation of interstellar grains.The results obtained in this work cannot therefore excludeall O2-rich ices: we are only in the position of excludingmixtures that have been included in the laboratory sample(Table 3).
10 T.C. Teixeira et al: Ice CO-cktails in molecular cloud cores
Fig. 4. Histograms of the comparative performance of the nonpolarmixtures, resulting from the �2-minimization, for the objectsshowing a signi�cant solid CO feature. The x-axis is the reduced-�2 of the �ts in �2� \bins" which are 0.1 in size; the y-axis is thenumber of counts of each mixture in each �2� bin. The �2� bins are de�ned in the same way as in Fig.3. Within each �2� bin, thenonpolar mixtures (mixtures 1 to 7, Table 3) are represented by grey-scale bars ordered from left (mixture 1) to right (mixture7) with decreasing intensity of the grey-scale. The �2� results for B5 IRS1 were divided by 2 to �t onto the same horizontal scaleas the other objects.4. Energetic processing of the ice mantlesThe results of the �ts presented above very strongly pointto ice mantles that su�ered energetic processing by ionbombardment, perhaps in the form of low energy cosmicrays or ares, or by other processes, such as X-ray or UVprocessing, that modify the mantle structure. There is alsosome evidence for warmup of some of the ices from the po-lar component of the band, even though less constrained.However, it should be realized that obtaining a good �tis not enough to prove the validity of a model and thatreasonable physical hypotheses are needed to support it.We therefore discuss the possible astrophysical origin ofthe structural changes that are caused, in the laboratorysituation, by ion irradiation, covering ares on the YSOs,cosmic rays and X-ray and UV processing.4.1. FlaresAll of the six sources in this work found to have a sig-ni�cant solid CO feature are class I embedded YoungStellar Objects and are observed to be driving molecu-lar out ows. Recent X-ray surveys have shown that evendeeply embedded young stars are X-ray emitters and in-deed emit up to hard X-ray energies (Casanova et al.1995, Koyama et al. 1994, Montmerle 1996, priv. comm.).The X-rays are possibly associated with magnetic activ-ity, thought to be similar to solar activity but scaled upby orders of magnitude, in the form of ares or coro-nal mass ejection (CME) events. Since high energy par-ticles (E � 0.5MeV) are detected in the solar wind, insolar ares and in CMEs (Reames et al. 1996), it is likelythat they will also be ejected in the winds and aresof embedded young stars. This could then account for
T.C. Teixeira et al: Ice CO-cktails in molecular cloud cores 11the ion bombardment of the icy mantles around pro-tostellar objects. However, the ux of ions required toexplain the observations might be a problem. The spe-ci�c energy loss (stopping power, S) of a 1MeV protonin a typical grain containing heavy atoms (C,N,O,Si) isS ' 5�10�15 eV cm2/atom (Palumbo & Strazzulla 1993).The energy deposited on a grain per equivalent 16 amuatom (the 'dose') by 1MeV protons after an irradiationtime �t is given by S�J ��t, where J is the proton ux.For a dose of 12 eV/16 amu, over 2�105 yr (the freeze-outtimescale; Schutte 1996) the proton ux needed would be380 cm�2 s�1, while over 108 yr (lifetime of a dark cloud;Shu et al. 1987) only 0.8cm�2 s�1 would be required. Arough estimate of the number of protons expected from a are in a T-Tauri star shows that the available ux maybe too low. Observations have shown that pre-main se-quence stars undergo aring events which may be morethan 4 or 5 orders of magnitude more energetic thansolar ares. A multi-wavelength analysis of these aressupports the idea that they are solar-like, but scaled upby orders of magnitude (Gahm 1990; Haisch et al. 1991;Preibisch et al. 1995; Guenther & Emerson 1997). More-over, Haisch et al. (1991) suggest that proton beams maycarry the major fraction of the are energy. During a typ-ical solar are, the energy released in �MeV protons isof the order of 1031 erg. Assuming a typical solar arein an embedded YSO is 105 times more energetic thanthe corresponding solar one and lasts for � 3 hours, thenthe average proton ux at a representative distance2 of0.05pc is � 200 cm�2 s�1. If the aring activity in theyoung object maintained the proton ux constant at thislevel continually, then it would imply an irradiation timeof � 4 � 105 yr, which is of the order of the freeze-outtimescale. However, the current statistics of ares in T-Tauri stars point to signi�cant short-term variability dur-ing only 5% of the time (Gahm 1990; Guenther & Emer-son 1997). This raises the time interval to achieve the nec-essary irradiation dose to � 8 � 106 yr, more than one or-der of magnitude larger than the estimated age of class Iobjects (�105 yr; Cabrit 1994). It may be, of course, that aring activity is more frequent and/or more energetic inclass I objects than in T-Tauri stars, but that has not beendetected due to the high extinction to those objects. Thatcould reconcile the timescale for su�cient irradiation withthe age of the objects. If such a possibility is ruled out,then another source of high energy particles is required todeposit enough energy in the mantles.4.2. Low Energy Cosmic RaysThe ux of low energy cosmic rays (E � 1 MeV) in theinterstellar medium is very uncertain. Jenniskens et al.(1993) estimate the proton ux in the di�use medium to2 the radius of the core where the temperature drops to 10Kand therefore where the most volatile ices can survive is roughly0.05 pc.
be J(E � 1 MeV) ' 0.6 { 3 cm�2s�1. There is exten-sive evidence that molecular clouds are clumpy (Olanoet al. 1988, Stutzki & G�usten 1990, Meixner et al. 1992,Williams et al. 1995, Langer et al. 1995). Moreover, ithas been shown that interstellar UV radiation can pene-trate the molecular clouds because of their clumpy struc-ture (Howe et al. 1991, Spaans 1996). If, in the same way,low energy cosmic rays can penetrate the clouds, then thedust grains can be su�ciently irradiated provided thatthey can survive in a dense core with the CO mantles for� 107 � 108 yr. But this is also a problem: if the desorp-tion timescale for CO ice were as long as 107 yr, then therewould be little or no gas phase CO in dense clouds (sincethe freeze-out timescale is 10{100 times shorter), which isin disagreement with the observations. For this reason, lowenergy cosmic rays are unlikely to be a major contributorto the bombardment of the ices by high energy particles.4.3. UV and X-ray ProcessingAnother possibility might be, of course, that equally good�ts to the observations can be obtained with laboratorysamples with a smaller irradiation dose, or with othermixtures not subjected to ion bombardment. The prob-lem with the former is that a signi�cantly smaller irradi-ation dose might not broaden the CO feature su�cientlyto match the observations of the nonpolar component ofthe band. UV or X-ray irradiation of the samples mightbe an alternative to ion bombardment which will be pur-sued in a future study. In that case, however, far out inthe envelope, where the cold CO mantles are presumablyabundant, there will not be a contribution to the UV uxfrom the embedded object, as the UV photons are not ableto penetrate the thick envelope and are absorbed by thematerial close to the star. The UV �eld inside the cloudwill then be responsible for the processing of the grainmantles. But if that is so, irradiated CO samples shouldalso produce good �ts to the CO features observed to-wards �eld stars. Unfortunately, the detailed studies of thesolid-CO feature published so far (Kerr et al. 1993, Chiaret al. 1994,1995) did not include irradiated CO-ices as thenonpolar component of the band. It should, however, benoticed that Palumbo & Strazzulla (1993) attempted to�t the spectra of four �eld stars with irradiated pure COcombined with irradiated H2O:CH3OH ices and obtainedwhat looks to be good results, but because the goodnessand uniqueness of the �ts were not analysed in detail, it isdi�cult to draw conclusions at this stage. It is thereforevital to re-analyse the spectra of �eld stars observed todate including ion and UV irradiated laboratory spectrain the �tting procedure, and to study carefully the com-parative performance of the di�erent mixtures in the re-sults and relative to the results towards embedded YSOs.Only then will it be possible to make a direct comparisonbetween the results obtained in this work and the onespreviously published by other authors.
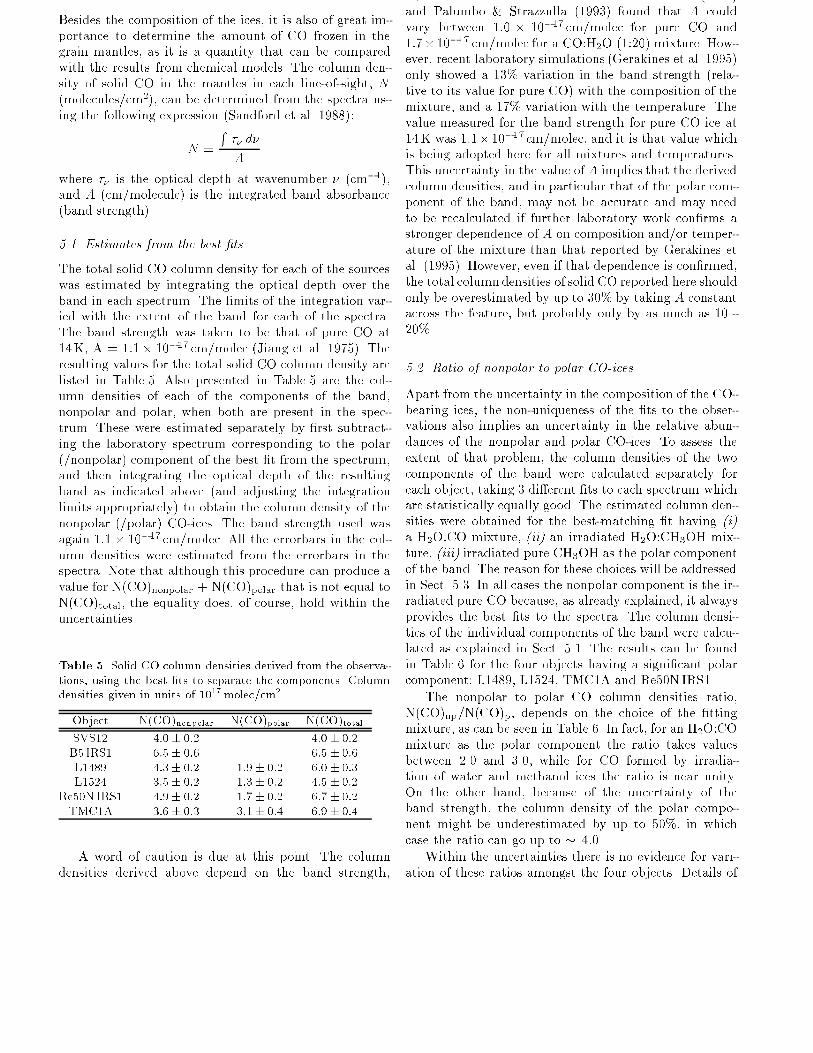
12 T.C. Teixeira et al: Ice CO-cktails in molecular cloud cores5. Column densitiesBesides the composition of the ices, it is also of great im-portance to determine the amount of CO frozen in thegrain mantles, as it is a quantity that can be comparedwith the results from chemical models. The column den-sity of solid CO in the mantles in each line-of-sight, N(molecules/cm2), can be determined from the spectra us-ing the following expression (Sandford et al. 1988):N = R �� d�Awhere �� is the optical depth at wavenumber � (cm�1),and A (cm/molecule) is the integrated band absorbance(band strength).5.1. Estimates from the best �tsThe total solid CO column density for each of the sourceswas estimated by integrating the optical depth over theband in each spectrum. The limits of the integration var-ied with the extent of the band for each of the spectra.The band strength was taken to be that of pure CO at14K, A = 1:1� 10�17 cm/molec (Jiang et al. 1975). Theresulting values for the total solid CO column density arelisted in Table 5. Also presented in Table 5 are the col-umn densities of each of the components of the band,nonpolar and polar, when both are present in the spec-trum. These were estimated separately by �rst subtract-ing the laboratory spectrum corresponding to the polar(/nonpolar) component of the best �t from the spectrum,and then integrating the optical depth of the resultingband as indicated above (and adjusting the integrationlimits appropriately) to obtain the column density of thenonpolar (/polar) CO-ices. The band strength used wasagain 1:1 � 10�17 cm/molec. All the errorbars in the col-umn densities were estimated from the errorbars in thespectra. Note that although this procedure can produce avalue for N(CO)nonpolar + N(CO)polar that is not equal toN(CO)total, the equality does, of course, hold within theuncertainties.Table 5. Solid CO column densities derived from the observa-tions, using the best �ts to separate the components. Columndensities given in units of 1017molec/cm2 .Object N(CO)nonpolar N(CO)polar N(CO)totalSVS12 4:0� 0:2 ... 4:0� 0:2B5 IRS1 6:5� 0:6 ... 6:5� 0:6L1489 4:3� 0:2 1:9� 0:2 6:0� 0:3L1524 3:5� 0:2 1:3� 0:2 4:5� 0:2Re50N IRS1 4:9� 0:2 1:7� 0:2 6:7� 0:2TMC1A 3:6� 0:3 3:1� 0:4 6:9� 0:4A word of caution is due at this point. The columndensities derived above depend on the band strength,
A, which is not well constrained. Sandford et al. (1988)and Palumbo & Strazzulla (1993) found that A couldvary between 1:0 � 10�17 cm/molec for pure CO and1:7�10�17 cm/molec for a CO:H2O (1:20) mixture. How-ever, recent laboratory simulations (Gerakines et al. 1995)only showed a 13% variation in the band strength (rela-tive to its value for pure CO) with the composition of themixture, and a 17% variation with the temperature. Thevalue measured for the band strength for pure CO ice at14K was 1:1�10�17 cm/molec, and it is that value whichis being adopted here for all mixtures and temperatures.This uncertainty in the value of A implies that the derivedcolumn densities, and in particular that of the polar com-ponent of the band, may not be accurate and may needto be recalculated if further laboratory work con�rms astronger dependence of A on composition and/or temper-ature of the mixture than that reported by Gerakines etal. (1995). However, even if that dependence is con�rmed,the total columndensities of solid CO reported here shouldonly be overestimated by up to 30% by taking A constantacross the feature, but probably only by as much as 10 -20%.5.2. Ratio of nonpolar to polar CO-icesApart from the uncertainty in the composition of the CO-bearing ices, the non-uniqueness of the �ts to the obser-vations also implies an uncertainty in the relative abun-dances of the nonpolar and polar CO-ices. To assess theextent of that problem, the column densities of the twocomponents of the band were calculated separately foreach object, taking 3 di�erent �ts to each spectrum whichare statistically equally good. The estimated column den-sities were obtained for the best-matching �t having (i)a H2O:CO mixture, (ii) an irradiated H2O:CH3OH mix-ture, (iii) irradiated pure CH3OH as the polar componentof the band. The reason for these choices will be addressedin Sect. 5.3. In all cases the nonpolar component is the ir-radiated pure CO because, as already explained, it alwaysprovides the best �ts to the spectra. The column densi-ties of the individual components of the band were calcu-lated as explained in Sect. 5.1. The results can be foundin Table 6 for the four objects having a signi�cant polarcomponent: L1489, L1524, TMC1A and Re50N IRS1.The nonpolar to polar CO column densities ratio,N(CO)np/N(CO)p, depends on the choice of the �ttingmixture, as can be seen in Table 6. In fact, for an H2O:COmixture as the polar component the ratio takes valuesbetween 2.0 and 3.0, while for CO formed by irradia-tion of water and methanol ices the ratio is near unity.On the other hand, because of the uncertainty of theband strength, the column density of the polar compo-nent might be underestimated by up to 50%, in whichcase the ratio can go up to � 4:0.Within the uncertainties there is no evidence for vari-ation of these ratios amongst the four objects. Details of
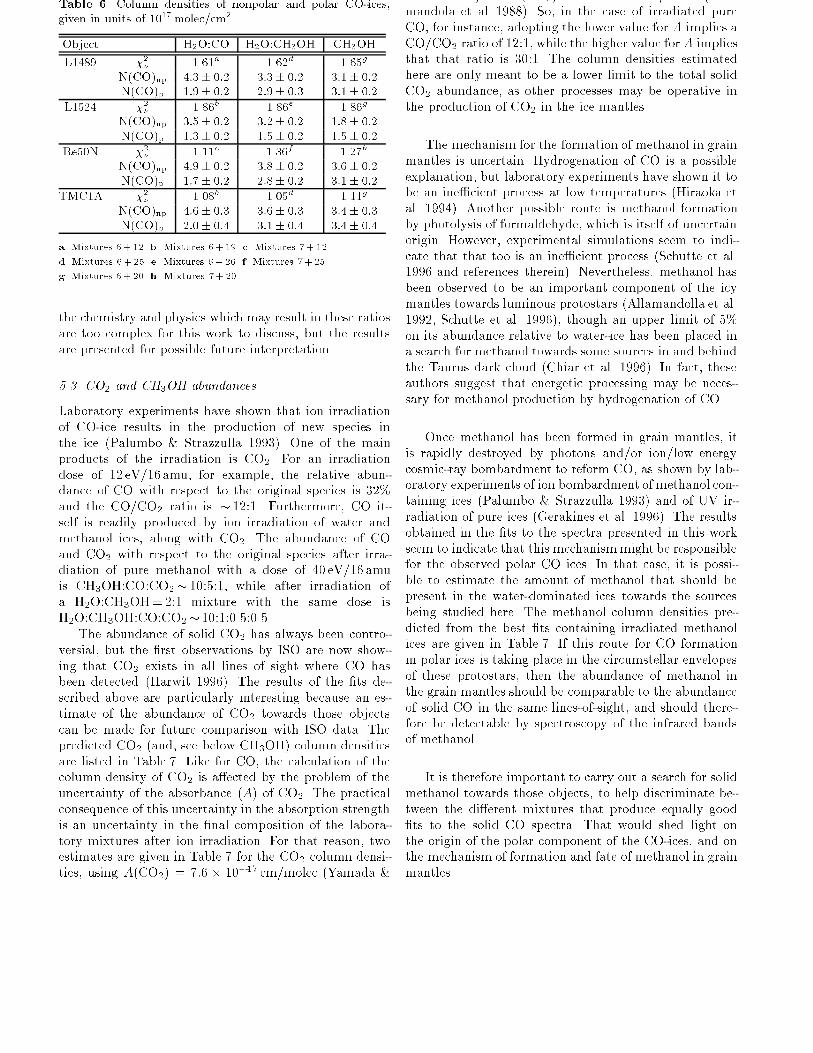
T.C. Teixeira et al: Ice CO-cktails in molecular cloud cores 13Table 6. Column densities of nonpolar and polar CO-ices,given in units of 1017molec/cm2.Object H2O:CO H2O:CH3OH CH3OHL1489 �2� 1.61a 1.62d 1.65gN(CO)np 4:3� 0:2 3:3� 0:2 3:1� 0:2N(CO)p 1:9� 0:2 2:9� 0:3 3:1� 0:2L1524 �2� 1.86b 1.86e 1.86gN(CO)np 3:5� 0:2 3:2� 0:2 1:8� 0:2N(CO)p 1:3� 0:2 1:5� 0:2 1:5� 0:2Re50N �2� 1.11c 1.36f 1.27hN(CO)np 4:9� 0:2 3:8� 0:2 3:6� 0:2N(CO)p 1:7� 0:2 2:8� 0:2 3:1� 0:2TMC1A �2� 1.08b 1.05d 1.11gN(CO)np 4:6� 0:3 3:6� 0:3 3:4� 0:3N(CO)p 2:0� 0:4 3:1� 0:4 3:4� 0:4a. Mixtures 6+ 12. b. Mixtures 6+ 19. c. Mixtures 7+ 12.d. Mixtures 6+ 25. e. Mixtures 6+ 26. f. Mixtures 7+ 25.g. Mixtures 6+ 20. h. Mixtures 7+ 20.the chemistry and physics which may result in these ratiosare too complex for this work to discuss, but the resultsare presented for possible future interpretation.5.3. CO2 and CH3OH abundancesLaboratory experiments have shown that ion irradiationof CO-ice results in the production of new species inthe ice (Palumbo & Strazzulla 1993). One of the mainproducts of the irradiation is CO2. For an irradiationdose of 12 eV/16amu, for example, the relative abun-dance of CO with respect to the original species is 32%and the CO/CO2 ratio is � 12:1 . Furthermore, CO it-self is readily produced by ion irradiation of water andmethanol ices, along with CO2. The abundance of COand CO2 with respect to the original species after irra-diation of pure methanol with a dose of 40 eV/16 amuis CH3OH:CO:CO2� 10:5:1, while after irradiation ofa H2O:CH3OH= 2:1 mixture with the same dose isH2O:CH3OH:CO:CO2� 10:1:0.5:0.5.The abundance of solid CO2 has always been contro-versial, but the �rst observations by ISO are now show-ing that CO2 exists in all lines of sight where CO hasbeen detected (Harwit 1996). The results of the �ts de-scribed above are particularly interesting because an es-timate of the abundance of CO2 towards those objectscan be made for future comparison with ISO data. Thepredicted CO2 (and, see below CH3OH) column densitiesare listed in Table 7. Like for CO, the calculation of thecolumn density of CO2 is a�ected by the problem of theuncertainty of the absorbance (A) of CO2. The practicalconsequence of this uncertainty in the absorption strengthis an uncertainty in the �nal composition of the labora-tory mixtures after ion irradiation. For that reason, twoestimates are given in Table 7 for the CO2 column densi-ties, using A(CO2) = 7:6 � 10�17 cm/molec (Yamada &
Person 1964) and A(CO2) = 20 � 10�17 cm/molec (Alla-mandola et al. 1988). So, in the case of irradiated pureCO, for instance, adopting the lower value for A implies aCO/CO2 ratio of 12:1, while the higher value for A impliesthat that ratio is 30:1. The column densities estimatedhere are only meant to be a lower limit to the total solidCO2 abundance, as other processes may be operative inthe production of CO2 in the ice mantles.The mechanism for the formation of methanol in grainmantles is uncertain. Hydrogenation of CO is a possibleexplanation, but laboratory experiments have shown it tobe an ine�cient process at low temperatures (Hiraoka etal. 1994). Another possible route is methanol formationby photolysis of formaldehyde, which is itself of uncertainorigin. However, experimental simulations seem to indi-cate that that too is an ine�cient process (Schutte et al.1996 and references therein). Nevertheless, methanol hasbeen observed to be an important component of the icymantles towards luminous protostars (Allamandolla et al.1992, Schutte et al. 1996), though an upper limit of 5%on its abundance relative to water-ice has been placed ina search for methanol towards some sources in and behindthe Taurus dark cloud (Chiar et al. 1996). In fact, theseauthors suggest that energetic processing may be neces-sary for methanol production by hydrogenation of CO.Once methanol has been formed in grain mantles, itis rapidly destroyed by photons and/or ion/low energycosmic-ray bombardment to reform CO, as shown by lab-oratory experiments of ion bombardment of methanol con-taining ices (Palumbo & Strazzulla 1993) and of UV ir-radiation of pure ices (Gerakines et al. 1996). The resultsobtained in the �ts to the spectra presented in this workseem to indicate that this mechanismmight be responsiblefor the observed polar CO ices. In that case, it is possi-ble to estimate the amount of methanol that should bepresent in the water-dominated ices towards the sourcesbeing studied here. The methanol column densities pre-dicted from the best �ts containing irradiated methanolices are given in Table 7. If this route for CO formationin polar ices is taking place in the circumstellar envelopesof these protostars, then the abundance of methanol inthe grain mantles should be comparable to the abundanceof solid CO in the same lines-of-sight, and should there-fore be detectable by spectroscopy of the infrared bandsof methanol.It is therefore important to carry out a search for solidmethanol towards those objects, to help discriminate be-tween the di�erent mixtures that produce equally good�ts to the solid CO spectra. That would shed light onthe origin of the polar component of the CO-ices, and onthe mechanism of formation and fate of methanol in grainmantles.
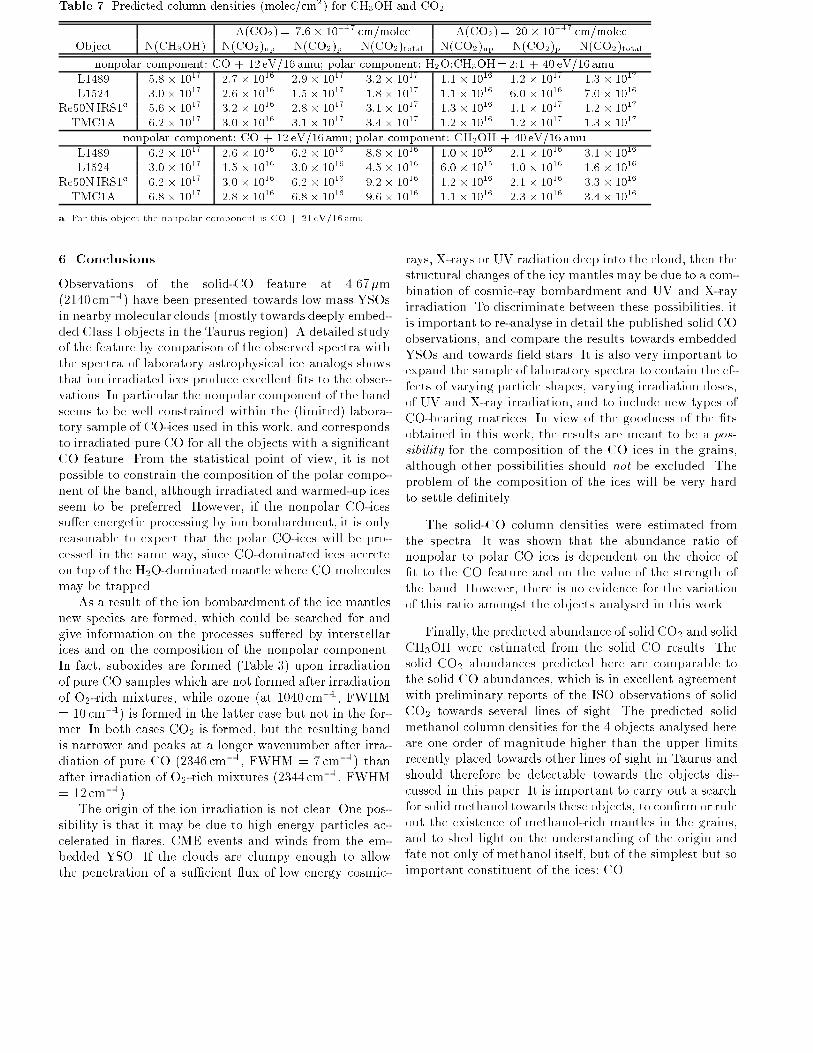
14 T.C. Teixeira et al: Ice CO-cktails in molecular cloud coresTable 7. Predicted column densities (molec/cm2) for CH3OH and CO2A(CO2)= 7:6� 10�17 cm/molec A(CO2) = 20� 10�17 cm/molecObject N(CH3OH) N(CO2)np N(CO2)p N(CO2)total N(CO2)np N(CO2)p N(CO2)totalnonpolar component: CO + 12 eV/16 amu; polar component: H2O:CH3OH=2:1 + 40 eV/16 amuL1489 5:8� 1017 2:7� 1016 2:9� 1017 3:2� 1017 1:1� 1016 1:2� 1017 1:3� 1017L1524 3:0� 1017 2:6� 1016 1:5� 1017 1:8� 1017 1:1� 1016 6:0� 1016 7:0� 1016Re50N IRS1a 5:6� 1017 3:2� 1016 2:8� 1017 3:1� 1017 1:3� 1016 1:1� 1017 1:2� 1017TMC1A 6:2� 1017 3:0� 1016 3:1� 1017 3:4� 1017 1:2� 1016 1:2� 1017 1:3� 1017nonpolar component: CO + 12 eV/16 amu; polar component: CH3OH + 40 eV/16 amuL1489 6:2� 1017 2:6� 1016 6:2� 1016 8:8� 1016 1:0� 1016 2:1� 1016 3:1� 1016L1524 3:0� 1017 1:5� 1016 3:0� 1016 4:5� 1016 6:0� 1015 1:0� 1016 1:6� 1016Re50N IRS1a 6:2� 1017 3:0� 1016 6:2� 1016 9:2� 1016 1:2� 1016 2:1� 1016 3:3� 1016TMC1A 6:8� 1017 2:8� 1016 6:8� 1016 9:6� 1016 1:1� 1016 2:3� 1016 3:4� 1016a. For this object the nonpolar component is CO + 21eV/16amu.6. ConclusionsObservations of the solid-CO feature at 4.67�m(2140 cm�1) have been presented towards low mass YSOsin nearby molecular clouds (mostly towards deeply embed-ded Class I objects in the Taurus region). A detailed studyof the feature by comparison of the observed spectra withthe spectra of laboratory astrophysical ice analogs showsthat ion irradiated ices produce excellent �ts to the obser-vations. In particular the nonpolar component of the bandseems to be well constrained within the (limited) labora-tory sample of CO-ices used in this work, and correspondsto irradiated pure CO for all the objects with a signi�cantCO feature. From the statistical point of view, it is notpossible to constrain the composition of the polar compo-nent of the band, although irradiated and warmed-up icesseem to be preferred. However, if the nonpolar CO-icessu�er energetic processing by ion bombardment, it is onlyreasonable to expect that the polar CO-ices will be pro-cessed in the same way, since CO-dominated ices accreteon top of the H2O-dominated mantle where CO moleculesmay be trapped.As a result of the ion bombardment of the ice mantlesnew species are formed, which could be searched for andgive information on the processes su�ered by interstellarices and on the composition of the nonpolar component.In fact, suboxides are formed (Table 3) upon irradiationof pure CO samples which are not formed after irradiationof O2-rich mixtures, while ozone (at 1040 cm�1, FWHM= 10 cm�1) is formed in the latter case but not in the for-mer. In both cases CO2 is formed, but the resulting bandis narrower and peaks at a longer wavenumber after irra-diation of pure CO (2346 cm�1, FWHM = 7 cm�1) thanafter irradiation of O2-rich mixtures (2344 cm�1, FWHM= 12cm�1).The origin of the ion irradiation is not clear. One pos-sibility is that it may be due to high energy particles ac-celerated in ares, CME events and winds from the em-bedded YSO. If the clouds are clumpy enough to allowthe penetration of a su�cient ux of low energy cosmic-
rays, X-rays or UV radiation deep into the cloud, then thestructural changes of the icy mantles may be due to a com-bination of cosmic-ray bombardment and UV and X-rayirradiation. To discriminate between these possibilities, itis important to re-analyse in detail the published solid COobservations, and compare the results towards embeddedYSOs and towards �eld stars. It is also very important toexpand the sample of laboratory spectra to contain the ef-fects of varying particle shapes, varying irradiation doses,of UV and X-ray irradiation, and to include new types ofCO-bearing matrices. In view of the goodness of the �tsobtained in this work, the results are meant to be a pos-sibility for the composition of the CO ices in the grains,although other possibilities should not be excluded. Theproblem of the composition of the ices will be very hardto settle de�nitely.The solid-CO column densities were estimated fromthe spectra. It was shown that the abundance ratio ofnonpolar to polar CO ices is dependent on the choice of�t to the CO feature and on the value of the strength ofthe band. However, there is no evidence for the variationof this ratio amongst the objects analysed in this work.Finally, the predicted abundance of solid CO2 and solidCH3OH were estimated from the solid CO results. Thesolid CO2 abundances predicted here are comparable tothe solid CO abundances, which is in excellent agreementwith preliminary reports of the ISO observations of solidCO2 towards several lines of sight. The predicted solidmethanol column densities for the 4 objects analysed hereare one order of magnitude higher than the upper limitsrecently placed towards other lines of sight in Taurus andshould therefore be detectable towards the objects dis-cussed in this paper. It is important to carry out a searchfor solid methanol towards these objects, to con�rm or ruleout the existence of methanol-rich mantles in the grains,and to shed light on the understanding of the origin andfate not only of methanol itself, but of the simplest but soimportant constituent of the ices: CO.
T.C. Teixeira et al: Ice CO-cktails in molecular cloud cores 15Acknowledgements. We thank the referee, Willem Schutte, forthe very helpful comments and suggestions, which resulted inan improved version of the paper. Tom Kerr is gratefully ac-knowledged for providing digitized versions of the laboratorymixtures 1 to 5 and 8 to 19. We thank A. Claudio Castorina forhelp in taking some of the laboratory spectra presented here.TCT wishes to thank Andy Adamson for useful advice on thedata reduction, the JACH for providing accommodation, andthe sta� at the JACH for all the discussions and friendlinessduring the stay there. The United Kingdom Infrared Telescopeis operated by the Observatories on behalf of the UK ParticlePhysics and Astronomy Research Council. We acknowledge useof Starlink hardware and software in our data analysis. TCTsupported by grants CIENCIA/BD/2095/92-RM and PRAXISXXI/BD/5622/95 from JNICT, Portugal.ReferencesAdams F.C., Lada C.J., Shu F.H., 1987, ApJ, 312, 788Allamandola L.J., Sandford S.A., Tielens A.G.G.M., HerbstT.M., 1992, ApJ, 399, 134Allamandola L.J., Sandford S.A., Valero G.J., 1988, Icarus, 76,225Barsony M., Chandler C.J., 1993, ApJ, 406, L71Barth W., Weigelt G., Zinnecker H., 1994, A&A, 291, 500Bergin E.A., Langer W.D., Goldsmith P.F., 1995, ApJ, 441,222Bevington P.R., 1969, Data Reduction and Error Analysis forthe Physical Sciences, McGraw-HillCabrit S, 1994, in Star Formation and Techniques in Infraredand mm-Wave Astronomy, eds T.P. Ray and S.V.W. Beck-with, p.1Casali M., 1991, MNRAS, 248, 229Casanova S., Montmerle T., Feigelson E.D., Andre P., 1995,ApJ, 439, 752Chandler C.J., Terebey S., Barsony M., Moore T.J.T., GautierT.N., 1996, ApJ, 471, 308Charnley S.B., Whittet D.C.B., Williams D.A., 1990, MNRAS245, 161Chiar J.E., Adamson A.J., Kerr T.H., Whittet, D.C.B., 1994,ApJ, 426, 240Chiar J.E., Adamson A.J., Kerr T.H., Whittet, D.C.B., 1995,ApJ, 455, 234Chiar J.E., Adamson A.J., Whittet, D.C.B., 1996, ApJ, 472,665Colom�e C., di Francesco J., Harvey P.M., 1996, ApJ, 461, 909Daly P.N., 1995, Starlink User Note 27, Starlink Project,CCLRCde Graauw Th., Whittet D.C.B., Gerakines P.A., et al., 1996,A&A, 315, L345Eiroa C., Hodapp K.W., 1989, A&A, 210, 345Eisl�o�el J., Guenther E., Hessman F.V., et al., 1991, ApJ, 383,219Emerson J.P., Harris S., Jennings R.E., et al., 1984, ApJ, 278,L49Emerson J.P., Moore T.J.T, 1996, in Polarimetry of the In-terstellar Medium, eds W.G. Roberge and D.C.B. Whittet,ASP Conference Series, 97, 350Fuller G.A., Myers P.C., Welch W.J., et al., 1991, ApJ, 376,135
Gahm G.F., 1990, in Flare Stars in Star Clusters, Associationsand the Solar Vicinity, IAU Symposium 137, eds Mirzoyan,L.V., Pettersen, Tsvestkov, M.K., Kluwer, p.193Gerakines P.A., Schutte W.A., Greenberg J.M., van DishoeckE.F., 1995, A&A, 296, 810Gerakines P.A., Schutte W.A., Ehrenfreund P., 1996, A&A,312, 289Greene T.P., Lada C.J., 1996, ApJ, 461, 345Grim R.J.A., Baas F., Geballe T.R., Greenberg J.M., SchutteW., 1991, A&A, 243, 473Guenther E.W., Emerson J.P., 1997, A&A, 321, 803G�urtler J., Henning Th., K�ompe C., et al., 1996, A&A, 315,L189Haisch B., Strong K.T., Rodon�o M., 1991, ARA&A, 29, 275Harwit M., 1996, ISO Info 9, 2d'Hendecourt L.B., de Muizon M.J., 1989, A&A, 223, L5d'Hendecourt L.B., Allamandola L.J., Greenberg J.M., 1985,A&A, 152, 130Hiraoka K., Ohashi N., Kilhare Y., Yamamoto K., YamashitaA., 1994, Chem. Phys. Lett., 229, 408Horne K., 1986, PASP, 98, 609Howe J.E., Ja�e D.T., Genzel R., Stacey G.J., 1991, ApJ, 373,158Jenniskens P., Baratta G.A., Kouchi A., et al., 1993, A&A,273, 583Jiang G.J., Person W.B., Brown K.G., 1975, J. Chem. Phys.,64, 1201Kenyon, S.J., Hartmann L.W., 1991, ApJ, 383, 664Kerr T.H., Adamson A.J., Whittet D.C.B., 1993, MNRAS,262, 1047Koyama K., Maeda Y., Ozaki M., et al., 1994, PASJ, 46, L125Lada C.J., 1987, in Star Forming Regions, eds M. Peimbertand J. Jugaku (Dordrecht:Reidel), p.1Langer W.D., Velusamy T., Kuiper T.B.H., et al., 1995, ApJ,453, 293Leto G., Palumbo M.E., Strazzulla G., 1996, Nuc. Instr. andMeth. in Phys. Res. section B, 116, 49Meixner M., Haas M.R., Tielens A.G.G.M., et al., 1992, ApJ,390, 499Moore T., Emerson J.P., 1994, MNRAS, 271, 243Moriarty-Schieven G.H., Butner H.M., Wannier P.G., 1995,ApJ, 445, L55Myers P.C., Fuller G.A., Mathieu R., et al., 1987, ApJ, 319,340Olano C.A., Walmsley C.M., Wilson T.L., 1988, A&A, 196,194Palumbo M.E., Strazzulla G., 1993, A&A, 269, 568Preibisch Th., Neuh�auser R., Alcal�a J.M., 1995, A&A, 304,L13Puxley P.J., Beard S.M., Ramsay S.K., 1992, Proceedings of4th ESO/ST-ECF Data Analysis Workshop, ed P. GrosboldReames D.V., Barbier L.M., Ng C.K., 1996, ApJ, 466, 473Sandell G., Aspin C., Duncan W.D., Robson E.I., DentW.R.F., 1990, A&A, 232, 347Sandford S.A., Allamandola L.J., Tielens A.G.G.M., ValeroL.J., 1988, ApJ, 329, 498Sato S., Nagata T., Tanaka M., Yamamoto T., 1990, ApJ, 359,192Schmitt B., Greenberg J.M., Grim R.J.A., 1989, ApJ, 340, L33Schutte W.A., 1996, in The Cosmic Dust Connection, ed. J.M.Greenberg, Kluwer Academic Publishers, 1
16 T.C. Teixeira et al: Ice CO-cktails in molecular cloud coresSchutte W.A., Gerakines P.A., Geballe T.R., van DishoeckE.F., Greenberg J.M., 1996, A&A, 309, 633Shu F.H., Adams F.C., Lizano S., 1987, ARA&A, 25,23Skinner C.J., Tielens A.G.G.M., Barlow M.J., Justannont K.,1992, ApJ, 399, L79Snow T.P., Witt A.N., 1996, ApJ, 468, L65Spaans M., 1996, A&A, 307, 271Stapelfeldt K.R., 1994, in Astronomy with Millimeter and Sub-millimeter Wave Interferometry, eds M. Ishiguro and W.J.Welch, ASP Conference Series, 59, 270Stapelfeldt K.R., Beichman C.A., Hester J.J., Scoville N.Z.,Gautier T.N., 1991, ApJ, 371, 226Strazzulla G., Brucato J.R., Palumbo M.E., Satorre M.A.,1997, A&A, 321, 618Strom S.E., Vrba F.J., Strom K.M., 1976, AJ, 81, 314Strom K.M., Strom S.E., 1993, ApJ, 412, L63Stutzki J., G�usten R., 1990, ApJ, 356, 513Tanaka M., Sato S., Nagata T., 1990, ApJ, 352, 724Tanaka M., Nagata T., Sato S., Yamamoto T. 1994, ApJ, 430,779Tegler S.C., Weintraub D.A, Rettig T.W., et al., 1995, ApJ,439, 279Tielens A.G.G.M., Allamandola L.J., 1987, in Physical pro-cesses in interstellar clouds, eds. G.E. Mor�ll and M. Sc-holer, Kluwer, p.333Tielens A.G.G.M., Hagen W., 1982, A&A, 114, 245Tielens A.G.G.M., Tokunaga A.T., Geballe T.R., Baas F.,1991, ApJ, 381, 181Whittet D.C.B., 1993, in Dust and chemistry in Astronomy,eds T.J. Millar and D.A. Williams, IOP Publ. Ltd., Bristol,p.1Whittet D.C.B., Bode M.F., Longmore A.J., Adamson A.J.,McFadzean A.D., 1988, MNRAS, 233, 321Whittet D.C.B., Duley, W.W., 1991, A&A Review, 2, 167Williams J., Blitz L., Stark A.A., 1995, ApJ, 451, 252Yamada H., Person W.B., 1964, J.Chem.Phys., 41, 2478Yamashita T., Sato S., Nagata T., et al., 1989, ApJ, 832, 837This article was processed by the author using Springer-VerlagLATEX A&A style �le L-AA version 3.