direct observation of josephson vortex cores
TRANSCRIPT

1
Josephson vortex cores: From direct imaging to an all-electronic
control
Dimitri Roditchev1,2
, Christophe Brun1, Lise Serrier-Garcia
1, Juan Carlos Cuevas
3, Vagner
Henrique Loiola Bessa4, Milorad Vlado Milosevic
4,5, François Debontridder
1, Vasily Stolyarov
1,
and Tristan Cren1*
1 Institut des Nanosciences de Paris, Université Pierre et Marie Curie (UPMC) and CNRS-UMR
7588, 4 place Jussieu, 75252 Paris, France
2 Laboratoire de Physique et d’Etude des Matériaux, ESPCI-ParisTech, CNRS and Université
Pierre et Marie Curie (UPMC)-UMR 8213, 10 rue Vauquelin, 75005 Paris, France
3Departamento de Física Teórica de la Materia Condensada and Condensed Matter Physics
Center (IFIMAC), Universidad Autónoma de Madrid, 28049 Madrid, Spain
4 Departamento de Física, Universidade Federal do Ceará, 60455-900 Fortaleza, Ceará, Brazil
5 Departement Fysica, Universiteit Antwerpen, Groenenborgerlaan 171, B-2020 Antwerpen,
Belgium
*e-mail: [email protected]
When a normal metal is brought into contact with a superconductor, Cooper pairs may
leak into the metal inducing genuine superconducting properties there, a phenomenon
generically referred to as proximity effect1. If a normal metal is sandwiched between two
superconductors, it can sustain the flow of dissipationless supercurrents2. When a magnetic
field is applied across such a Josephson junction, the maximum of the supercurrent
oscillates following a diffraction-like pattern3, each oscillation corresponding to the entry of
2
one Josephson vortex4. The on-demand generation and control of Josephson vortices is
crucial for building advanced quantum devices such as coherent THz generators5 or qubits
for quantum computing6. In contrast to Abrikosov vortices in type II superconductors
7, the
Josephson vortices are supposed to lack normal core and indeed, they have never been
observed. Here, we report the direct imaging of Josephson vortices inside proximity
junctions using scanning tunnelling microscopy. The Josephson vortex cores appear as
regions where the proximity gap is locally suppressed and the normal state is recovered8.
We demonstrate that the Josephson vortices are controlled by the edge supercurrents
circulating in the superconducting leads. On the basis of our observation we suggest a novel
method of generation and control of Josephson vortices by purely electrical means, which a
crucial step toward designing densely integrated superconducting quantum devices.
In 1963 Rowel3 observed the oscillations of the critical current in superconducting junctions
subject to a magnetic field. Since his pioneering discovery, the effect has been reported in
numerous superconductor - normal metal - superconductor (SNS) weak links4,9
, including many
examples in which the links were made of recently discovered materials like graphene10
and
topological insulators11,12
. This macroscopic quantum interference effect is commonly
interpreted as a sequence of Josephson vortices4 penetrating the junction. By analogy with the
Abrikosov vortices in type II superconductors5, Josephson vortices were historically defined as
regions with zero net circulating current and enclosing a magnetic flux quantum, .
Yet, the spectral fingerprint of these quantum objects and their spatial organization remained till
now undecided, and subject of controversy. The common wisdom is that Josephson vortices lack
specific spectral signature and therefore cannot be identified. By contrast, recent microscopic
calculations predicted that in diffusive SNS junctions Josephson vortices should be manifested as

3
a spatial modulation of the proximity mini-gap in the quasiparticle excitation spectrum of the
normal region of the junction8. Thus, Josephson vortices could probably have normal cores -
regions where the proximity-gap vanishes, making possible their detection and imaging by e.g.
scanning tunnelling microscopy, as is readily done for Abrikosov vortices in superconductors13
.
With this idea in mind, we created (see Methods) a lateral SNS network of superconducting
Pb nanocrystals (in yellow in Fig. 1a) linked together by an atomically thin metallic (normal) Pb-
wetting layer (appearing brown). The Pb-islands become superconducting below a critical
temperature 18
. The local tunnelling conductance spectra measured on top of the
superconducting islands at (see Methods) exhibit a superconducting gap
(a typical spectrum S1 is presented in Fig. 1d). The wetting layer is non-
superconducting, and the conductance spectra measured far from the islands show no
superconducting gap but a tiny dip centred at the Fermi level (a typical spectrum WL is
presented in Fig. 1d). This dip is a fingerprint of the Altshuler-Aronov zero-bias anomaly19
due
to electron-electron interaction in this two-dimensional diffusive metal20
. Very close to the
islands the superconducting correlations induce a small proximity gap in tunnelling spectra of the
wetting layer (see curve PR in Fig. 1d). In the zero-bias conductance map in Fig. 1b the
proximity gap appears as a bluish halo extending over a few tens of nanometres away from
islands20
. In locations where the edges of neighbouring islands get very close, this proximity halo
becomes reinforced and appears in deeper blue. The phenomenon reflects the overlap of
superconducting correlations induced by both islands21,22
, that enhances the proximity gap (Fig.
1d). This results in the formation of SNS Josephson junctions, as those seen in locations J1-J4.
We now follow the evolution of the proximity links in applied magnetic field. The
spectroscopic map acquired at shows the usual penetration of Abrikosov vortices in the
4
large islands, while the small ones remain in the vortex-free Meissner state18
(Fig. 1c). By
contrast, unusual features are revealed in proximity links inside the SNS junctions, and identified
as Josephson vortices. Precisely, while at zero field the proximity gap is observed in all three
locations A, B, C of the junction J1 (Fig. 1e), at no proximity gap is observed in B (Fig.
1f), but instead a normal state with its Altshuler-Aronov zero-bias dip is recovered. In the
neighbouring positions A and C however, the proximity gap persists (Fig. 1e & f). This
behaviour is confirmed by the conductance map in Fig. 1c where two clear Josephson links
remain at in locations A and C (in blue), while in B the proximity gap vanishes (high
conductance, in yellow-red). The normal region in B surrounded by gapped areas is thus indeed a
Josephson vortex core. The spectroscopic maps in Fig. 2a & b focus on junctions J2-J4 located in
the framed part of Fig. 1a. They show how Josephson vortex configurations change with
magnetic field. Both J2 and J3 junctions accept one Josephson vortex at (Fig. 2a) and
two at (Fig. 2b). The very short and narrow junction J4 does not accept any Josephson
vortex in its centre up to , but it is visually suggestive that one vortex is about to appear
on the left side of J4. In all studied SNS junctions, Josephson vortex cores are in the normal state,
as predicted8.
The interpretation of our observation in terms of Josephson vortex cores is fully
corroborated by numerical simulations in Fig. 2c & d; the calculation method is described in Fig.
3. We first calculated the Abrikosov vortex configurations in islands using Ginzburg-Landau
formalism (see S1). As an example, in Fig. 3a the Cooper-pair density map calculated at
reproduces the experimentally observed Abrikosov vortex configuration (Fig. 1c). In Fig. 3b the
corresponding phase portrait of the superconducting order parameter shows that the interplay
between Meissner and vortex currents results in a spatially evolving phase inside islands. At this

5
point, the physical origin of Josephson vortices is revealed, considering the gauge-invariant
local phase difference across the junction,
, where are local
phases of the order parameter at two island edges at positions (on opposite sides of a given
junction) and is the vector potential. At locations in which is , the
superconducting correlations induced by both islands are in phase, their constructive interference
resulting in a well-developed proximity gap. On the contrary, in locations where is
the superconducting correlations induced by both islands interfere destructively
and the proximity gap is suppressed24
. This situation corresponds to Josephson vortex cores.
Using we find a current circulating around Josephson vortices. As a rough approximation, the
Josephson current can be considered locally as simply proportional to . In the junction J1,
for instance, in locations between A and B, varies continuously from to , and
some net Josephson current flows locally from one island edge to the other one. In the opposite
case, from B to C the phase difference varies continuously from to , , and
the current flows in the opposite direction. Therefore, Josephson current circulates around the
point B, thus justifying the term ‘Josephson vortex’. The above phase considerations served as a
basis for numerical simulations. Starting from the phase portrait of Fig. 3b we calculated, for
each location inside the junctions, the strength of the superconducting correlations as
interference between two evanescent waves having a phase difference (see S2). The result of
these calculations is displayed in Fig. 3c, ideally reproducing the experimentally observed
position and extent of the Josephson vortex in the junction J1 (Fig. 1c). In the same manner the
correlation maps in Fig. 2c & d were calculated, matching again the experimental findings (Fig.
2a & b). The success of our method in simulating Josephson vortices clearly highlights that the
Josephson vortices in our system originate from nothing but quantum interference.

6
Next, we calculated the spatial evolution of the density of states inside the Josephson vortex
core, which cannot be obtained from correlation maps, but which we derived using the Usadel
microscopic approach8,25
(see S3). Fig. 4a shows the calculated map of the local density of states
at the Fermi energy for a junction similar to J1. The map demonstrates the suppression of the
proximity gap inside Josephson vortex cores8. This suppression is further detailed in Fig. 4b
where we show the local density of states as a function of energy at various distances from the
centre of a vortex. Using these results we generated the corresponding tunnelling conductance
spectra (Fig. 4c). In this calculation the Altshuler-Aronov zero-bias effect was taken into
account20
. As one can see, the Usadel approach reproduces qualitatively the observed vanishing
of the proximity gap in Figs. 1e & f.
In the present study, the gauge-invariant phase difference that generates Josephson vortices
was created with the help of an applied magnetic field. Equivalently, the gauge-invariant phase
differences may be generated by edge supercurrents circulating in S-electrodes. Indeed, in zero
magnetic field, taking the gauge , we get a simple current-phase expression,
,
where is the effective coherence length, and is the critical current in the electrode,
.
Therefore, if the superconducting electrodes of the junction carry oppositely directed currents
along the electrode edge, a gauge-invariant phase difference appears across the junction. It
evolves with the lateral position inside the junction as
, leading to formation of
Josephson vortex. To confirm this idea, we carried out calculations of the local density of states
in SNS junctions where currents flow inside S-leads along the junction edges but there is no
applied magnetic field (see S3 for details). We show in Fig. 4d a typical result for a junction
similar to J2, where we have assumed that opposite currents circulate along both interface edges.
7
As one can see, there appear Josephson vortices with normal cores, very similar to those induced
magnetically (see Fig. 4a). In this case, the density and size of generated Josephson vortices is
simply proportional to the intensity of circulating edge currents. Moreover, vortex generation
may also be achieved if only one superconducting lead carries a supercurrent, as we demonstrate
in Fig. 4e. By tuning intensities of supercurrents in leads one may pin vortices at one or other
edge. In a SNS device, like the one sketched in Fig. 4f, it should be possible to create Josephson
vortices by simply applying currents through superconducting leads. Such a method would open
new pathways for generation and control of quantum objects by purely electrical means, without
the need of any externally applied magnetic field.
Methods Summary
The 7×7 reconstructed n-Si(111) (n ≈ 1019
cm−3
) was prepared by direct current heating to
1200°C followed by annealing procedure between 900°C and 500°C. Subsequently, few atomic
layers of Pb were evaporated on the Si(111)-7×7 kept at room temperature, using an electron
beam evaporator calibrated with a quartz micro-balance. The resulted flat top (111) oriented
single nano-crystal of Pb are interconnected via disordered atomic wetting layer of Pb16,17, 20
. At
any stage of the sample preparation the pressure did not exceed P = 3×10⁻¹⁰
mbar. The sample
structure was controlled in both real and reciprocal space by scanning tunnelling microscopy and
Low Energy Electron Diffraction.
The scanning tunnelling spectroscopy measurements were performed in situ with a homemade
apparatus, at a base temperature of and in ultrahigh vacuum P < 3 × 10⁻¹¹
mbar; the
electron temperature was estimated to be . Mechanically sharpened Pt/Ir tips were used.
The bias voltage was applied to the sample with respect to the tip. Typical set-point parameters

8
for spectroscopy are at . The tunneling conductance curves dI(V)/dV were
numerically derivated from raw I(V) experimental data. Each conductance map is extracted from
a set of data consisting of spectroscopic I(V) curves measured at each point of a 512x512 grid,
acquired simultaneously with the topographic image. The magnetic field was applied
perpendicular to the sample surface.
The frameworks for the theoretical simulations in this paper are the phenomenological Ginzburg-
Landau (GL) theory4 and microscopic Usadel modelisation
8,25. The GL simulations were
implemented on a Cartesian grid for the exact geometry of the islands and expected electron
mean-free path in the samples (see S1), using STM mapping from the experiment, with grid
spacing of 1 nm. The equations were solved self-consistently in 3D and contain higher order
derivatives; for this demanding computation we have used GPU parallel computing. The
description of the local density of states and tunnelling spectra of the SNS junctions was carried
out using the Usadel approach as explained in detail in S3 of the Supplementary Information.
References and Notes:
1 de Gennes, P. G. Boundary effects in superconductors. Rev. Mod. Phys. 36, 225 (1964).
2 Josephson, B. D. Possible new effects in superconductive tunnelling, Phys. Lett. 1, 251
(1962).
3 Rowell, J. M. Magnetic field dependence of the Josephson tunnel current. Phys. Rev. Lett.
11, 200 (1963).
4 Tinkham, M. Introduction to Superconductivity (McGraw Hill, New York, 1996).
5 Ulrich Welp, U., Kadowaki K., and Kleiner, R. Superconducting emitters of THz
radiation. Nature Photonics 7, 702–710 (2013), and refs. 18-25 therein
6 Devoret, M. et al. Macroscopic quantum effects in the current-biased Josephson junction
in "Quantum Tunneling in Condensed Media", edited by Y. Kagan, and A.J. Leggett. (Elsevier
Science Publishers,1992) pp. 313-345; Devoret, M., and Schoelkopf, R. Superconducting
Circuits for Quantum Information: An Outlook. Science 339, 6124, 1169-1174 (2013)
7 Abrikosov, A. A. On the magnetic properties of superconductors of the second group.
Sov. Phys. JETP 5, 1174 (1957).
8 Cuevas, J. C. & Bergeret, F. S. Magnetic interference patterns and vortices in diffusive
SNS junctions. Phys. Rev. Lett. 99, 217002 (2007).

9
9 Barone, A. & Paterno, G. Physics and Applications of the Josephson Effect (Wiley, New
York, 1982).
10 Heersche, H. B., Jarrillo-Herrero, P., Oostinga, O. O., Vandersypen, L. M. K. &
Morpurgo, A. F. Bipolar supercurrent in graphene. Nature 446, 56 (2007).
11 Veldhorst, M. et al. Josephson supercurrent through a topological insulator surface state.
Nature Mat. 11, 417 (2012).
12 Williams, J. R. et al. Unconventional Josephson effect in hybrid superconductor-
topological insulator devices. Phys. Rev. Lett. 109, 056803 (2012).
13 Hess, H. F., Robinson, R. B., Dynes, R. C., Valles, J. M. & Waszczak, J. V. Scanning-
tunneling-microscope observation of the Abrikosov flux lattice and the density of states near and
inside a fluxoid. Phys. Rev. Lett. 62, 214 (1989).
14 Eom, D. Qin, S. Chou, M.-Y. & Shih, C. K. Persistent superconductivity in ultrathin Pb
films: a scanning tunneling spectroscopy study. Phys. Rev. Lett. 96, 027005 (2006).
15 Nishio, T. et al., Superconducting Pb Island Nanostructures Studied by Scanning
Tunneling Microscopy and Spectroscopy. Phys. Rev. Lett. 101, 167001 (2008).
16 Cren, T., Fokin, D., Debontridder, F. Dubost, F. & Roditchev, D. Phys. Rev. Lett. 102,
127005 (2009).
17 Brun, C. et al. Reduction of the superconducting gap of ultrathin Pb islands grown on
Si(111). Phys. Rev. Lett. 102, 207002 (2009).
18 Cren, T., Serrier-Garcia, L., Debontridder, F. & Roditchev, D. Vortex fusion and giant
vortex states in confined superconducting condensates. Phys. Rev. Lett. 107, 097202 (2011).
19 Altshuler, B. L. & Aronov, A. G. in Electron-Electron Interactions in Disordered
Systems, edited by A. L. Efros and M. Pollak (Elsevier Science Publisher B. V., Amsterdam,
1985).
20 Serrier-Garcia, L. et al. Scanning tunneling spectroscopy study of the proximity effect in
a disordered two-dimensional metal. Phys. Rev. Lett. 110, 157003 (2013).
21 Golubov, A. A. & Kupriyanov, M. Yu. Theoretical investigation of Josephson tunnel
junctions with spatially inhomogeneous superconducting electrodes. J. Low Temp. Phys. 70, 83
(1988).
22 Belzig, W. et al., Local density of states in a dirty normal metal connected to a
superconductor. Phys. Rev. B 54, 9443 (1996).
23 Kim, J., Chua, V., Fiete, G. A., Nam, H., MacDonald, A. H. & Shih, C.-K. Visualization
of geometric influences on proximity effects in heterogeneous superconductor thin films. Nat.
Phys. 8, 464 (2012).
24 le Sueur, H., Joyez, P., Pothier, H., Urbina, C. & Esteve, D. Phase controlled
superconducting proximity effect probed by tunneling spectroscopy. Phys. Rev. Lett. 100,
197002 (2008).
25 Usadel, K.D. Generalized diffusion equation for superconducting alloys. Phys. Rev. Lett.
25, 507 (1970).
Supplementary Information is available in the online version of the paper.
Acknowledgements
10
T.C., C.B., F.D., V.S. and D.R. acknowledge financial support from the French ANR project
ELECTROVOREX. The authors also thank Dr. V. Vinokur (Argonne national Laboratory, IL
USA) and Prof. A. Buzdin (University of Bordeaux 1, France) for stimulating discussions.
J.C.C. acknowledges financial support from the Spanish MICINN (Contract No. FIS2011-28851-
C1). M.V.M. acknowledges support from FWO-Vlaanderen and CAPES Brazil.
Author Contributions
The experiments were conceived by D.R., T.C., and F.D. The experiments were performed by
C.B., D.R., L.S.G., T.C.,V.S., and F.D. Theoretical support was provided by J.C.C., H.L.B., and
M.V.M. Correlation maps were calculated by T.C. The manuscript was written by D.R., J.C.C.
and T.C. with comments and inputs from all authors.
Author Information Reprints and permissions information is available at
www.nature.com/reprints. The authors declare no competing financial interests. Correspondence
and requests for materials should be addressed to T.C. ([email protected]).

11
FIGURES
Figure 1 | Josephson vortices imaged by scanning tunnelling spectroscopy at 0.3 K. a
Topographic STM image of a 1000nm x 1000nm area of the sample. 12-14 monoatomic layer-
thick Pb islands appear in yellow, surrounded by an atomically thin Pb wetting layer – in brown.
Bottom panel gives a schematic cross-section view of the sample. Superconducting proximity
junctions are formed between closest edges of adjacent Pb islands, such as the one denoted J1, in
which three selected locations, A, B, C, are indicated by white crosses. Three other junctions are
denoted J2, J3, J4 in the dashed-line delimited region (they are further studied in Fig. 2). b-c
Colour-coded tunnelling conductance maps dI(V)/dV(X,Y) at zero-bias of the same
sample area acquired in zero (b) and (c) perpendicular magnetic field. In zero field
junction J1 shows rather homogeneous proximity effect, however at 60 mT (map c) a single
Josephson vortex appears inside the proximity area of J1 as a bright yellow spot located in point
B. d Characteristic local tunnelling conductance spectra of: superconducting Pb islands (curve
S1 obtained in the location S1 in a), the non-superconducting wetting layer far from islands
(curve WL), the wetting layer in the proximity region 10 nm away from the island edge (curve
PR), and the wetting layer inside the junction J2 (curve J2). e-f Proximity-gap tunnelling spectra
in locations A, B, C of the junction J1 at zero (e) and (f) magnetic field. As a Josephson
vortex sets in, the proximity gap in its core vanishes (red curve B).

12
Figure 2 | Josephson vortex formation and evolution wih magnetic field. a Colour-coded
tunnelling conductance map of the selected region 400nm x 400nm (Fig. 1a) showing Josephson
vortex formation in three SNS junctions J2-J4 at 120 mT. Josephson vortex cores are detected in
the normal part of the junctions J2 and J3 as bright spots (locally destroyed mini-gap) surrounded
by proximity regions. The shortest junction J4 contains no Josephson vortices. b The
conductance map of the same area at 180 mT. The comparison between maps (a) and (b)
evidences the evolution of Josephson vortices with magnetic field. c-d Correlation maps at 120
mT and 180 mT make appearing Josephson vortices. The maps were numerically generated on
the basis of the suggested phase-rotated model (see Fig. 3 and explanations in the text). Note that
the simulation perfectly reproduces number, spatial extent, and position of Josephson vortices
inside the junctions.

13
Figure 3 | Simulation of Josephson vortex maps. a 1000nm x 1000nm colour-coded spatial
distribution of the Cooper-pair density in the studied sample at calculated in the
framework of the Ginzburg-Landau approach (see Supplementary Information). The
superconducting areas appear in orange, the normal ones – in dark brown. The proximity effect
between nano-islands is neglected. Note the match with the experimentally observed Abrikosov
vortex positions in Fig. 1c. b Colour-coded phase portrait corresponding to the situation in (a)
and calculated in the central gauge . c The correlation map at
numerically generated using (a-b) and the gauge-invariant phase difference model developed
here (see Supplementary Information S2 and explanations in the text). Note the detailed
agreement with the experimental result in Fig. 1c.
14
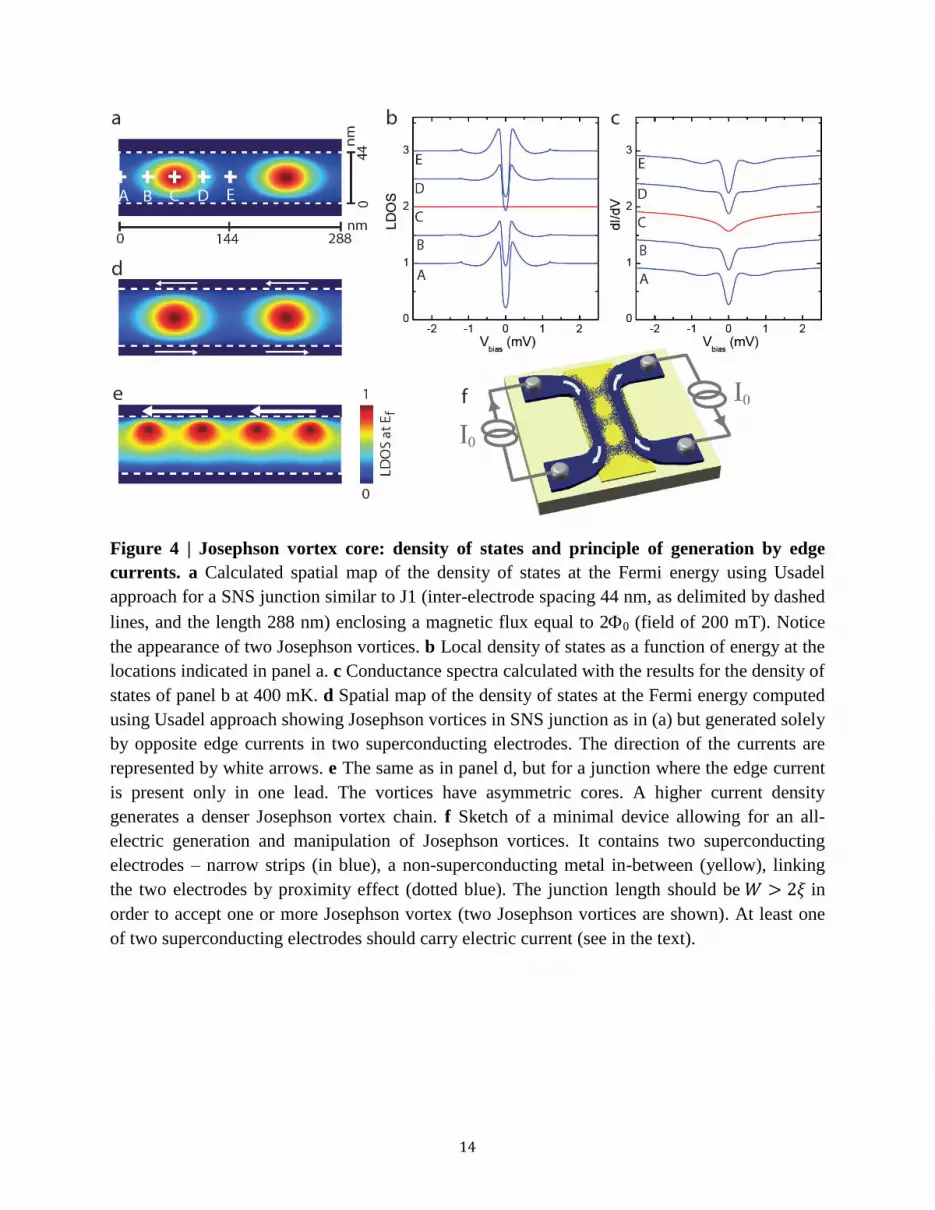
Figure 4 | Josephson vortex core: density of states and principle of generation by edge
currents. a Calculated spatial map of the density of states at the Fermi energy using Usadel
approach for a SNS junction similar to J1 (inter-electrode spacing 44 nm, as delimited by dashed
lines, and the length 288 nm) enclosing a magnetic flux equal to 20 (field of 200 mT). Notice
the appearance of two Josephson vortices. b Local density of states as a function of energy at the
locations indicated in panel a. c Conductance spectra calculated with the results for the density of
states of panel b at 400 mK. d Spatial map of the density of states at the Fermi energy computed
using Usadel approach showing Josephson vortices in SNS junction as in (a) but generated solely
by opposite edge currents in two superconducting electrodes. The direction of the currents are
represented by white arrows. e The same as in panel d, but for a junction where the edge current
is present only in one lead. The vortices have asymmetric cores. A higher current density
generates a denser Josephson vortex chain. f Sketch of a minimal device allowing for an all-
electric generation and manipulation of Josephson vortices. It contains two superconducting
electrodes – narrow strips (in blue), a non-superconducting metal in-between (yellow), linking
the two electrodes by proximity effect (dotted blue). The junction length should be in
order to accept one or more Josephson vortex (two Josephson vortices are shown). At least one
of two superconducting electrodes should carry electric current (see in the text).