phosphate adsorption onto granular ferric hydroxide (gfh
TRANSCRIPT
P H O S P H AT E A D S O R P T I O N O N T O G R A N U L A R F E R R I CH Y D R O X I D E ( G F H ) F O R WA S T E WAT E R R E U S E
vorgelegt vonDiplom-Ingenieur
Alexander Sperlichaus Berlin
von der Fakultät III - Prozesswissenschaften -der Technischen Universität Berlin
zur Erlangung des akademischen GradesDoktor der Ingenieurwissenschaften
- Dr.-Ing. -
genehmigte Dissertation
Promotionsausschuss:
Vorsitzender: Prof. Dr. rer. nat. Wolfgang RotardBerichter: Prof. Dr.-Ing. Martin JekelBerichter: Prof. Dr. rer. nat. Eckhard Worch
Tag der wissenschaftlichen Aussprache: 08. Juli 2010
Berlin 2010
D 83

A C K N O W L E D G E M E N T S
The research presented here was carried out in projects funded by the German Fed-eral Ministry of Education and Research (BMBF) and the European Commissionunder the 6th Framework Programme, which is gratefully acknowledged.
Prof. Dr.-Ing. Martin Jekel was the supervisor of this work and has alwayssupported me during this research. I thank him for giving me the opportunity towork in his group and opening up many possibilities for me. I was glad to haveProf. Dr. rer. nat. Eckhard Worch in my committee. With his profound knowledgeof adsorption, he was always available for discussions on adsorption modeling.Thanks also to Prof. Dr. rer. nat. Wolfgang Rotard for taking over the chair of thethesis committee.
I would also like to thank Sebastian Schimmelpfennig for his enthusiasm andprogramming skills which resulted in the software FAST. I have fond memoriesof the time we spent improving FAST, understanding and comparing adsorptionmodels and completing our joint paper. Carsten Bahr and Dr.-Ing. Xing Zheng areacknowledged for making the considerable amount of time we spent sharing thesame office very enjoyable. With Carsten, I was fortunate to have a co-worker whowas also researching GFH adsorption and always willing to help me out in thelab or by providing the necessary carbohydrates (Gummibärchen etc.) or just bycheering me up. Working with Xing Zheng, I spent some weeks in China and Ithank him for making this an unforgettable time for me and for overcoming anyproblems with the pilot plant in Beijing.
This work would not have been possible without the hard-working and excellentstudents which I had the pleasure to work with (in alphabetical order): SabrinaBahnmüller, Benno Baumgarten, Jin Chen, Benito J. Martín Cuevas, Tanja Ratuzny,Mathias Riechel, Alrun Schneider, Stefan Schulz, David Warschke and ChristineWegmann.
In the very beginning of this research, I “inherited” all the experimental setup foradsorption experiments from Dr.-Ing. Arne Genz. I thank him for introducing meto this research and the group, his help and willingness to discuss my results evenyears after completing his own research. As the project leader, Dr.-Ing. MathiasErnst has always been covering my back in the research projects and helped me alot. I always enjoyed the discussions on this work with Prof. Dr. Gary Amy. Hiscomments, suggestions and thought-provoking questions proved very helpful tome. I also wish to thank Anja Sandersfeld and Sebastian Aust for making theFSP-WIB office a very pleasant working environment.
Concentrating on experimental work and modeling was only possible withthe help of the hard-working and reliable laboratory staff. Angelika Kersten andKatrin Noack have to be mentioned for the great number of samples which wereanalyzed for phosphate, but I also wish to thank all the other helping hands in thelab.
For proof-reading the manuscript I especially thank Anja Sandersfeld and Han-nelore Meingast. Also, both of them and Karin von Nordheim were of great helpsolving any administrative issue. I greatly appreciated the help of Werner Däum-
iii

ler, Hans Rietdorf, Thomas Thele and Wolfgang Wichmann whenever somethingneeded to be constructed, repaired or any computer issue needed to be solved.
Dr.-Ing. Wolfgang Driehaus and Wilhelm Depping (GEH Wasserchemie) isthanked for a steady supply with GFH material and helpful discussions onadsorber design and practice. I appreciated the support of Prof. Dr. Zhao Xuanand Dr. Cheng Chuzhou during my stay at Tsinghua University. Thanks also toBerliner Wasserbetriebe for supplying secondary effluent. Many thanks also toStephan Costabel from the Chair of Applied Geophysics for his help with the BETsurface measurements.
Finally, I wish to express my gratitude to all of my co-workers at the Chair ofWater Quality Control, who create this special atmosphere which makes workingthere very enjoyable. The last five years have been a very good time for me. Thankyou all very much.
iv
A B S T R A C T
Adsorption onto Granular Ferric Hydroxide (GFH), a commercially available,synthetic adsorbent is studied as treatment process for phosphorus removal fromwastewater. The objective is to evaluate the suitability of this process alternativefor advanced wastewater treatment and reuse. Within this scope, the presentwork focusses on quantification of competitive adsorption of phosphate anddevelopment of a regeneration process that allows multiple application of GFH.Furthermore, breakthrough prediction of GFH fixed-bed columns is assessed.
Adsorption of phosphate in artificial model solutions, natural and waste watersonto GFH was studied in batch and fixed-bed column experiments. Equilibriumisotherms and adsorption edges show that phosphate adsorption is strongly pHdependent. High capacities of up to 24 mg/g P (at pH 6 and an equilibriumconcentration of 2 mg/L P) can be reached. Presence of calcium is shown toimprove adsorption of phosphate. This is supposed to be the reason for highercapacities in waste and drinking water as compared to DI water and membraneconcentrates. The diffuse double layer model can in principle be used to describephosphate adsorption onto GFH, but fails to describe simultaneous adsorption ofphosphate and calcium.
Whereas generally effective for phosphate removal from NF concentrates, GFHadsorption cannot be recommended for membrane concentrate treatment. Sincemembrane concentrates are often supersaturated with respect to calcium carbonateand/ or calcium phosphate compounds, this can lead to scaling and head loss inthe fixed-bed column. Chemical precipitation can effectively remove phosphateand calcium ions and thus reduce the scaling potential of membrane concentrates.This may allow for higher recoveries in the NF/ RO process.
Rapid small-scale column tests (RSSCTs) were shown to be a useful tool forsimulation of fixed-bed columns. Isotherm results can be used to provide a roughestimation of operation time, i.e. the ideal breakthrough point of a fixed-bedcolumn, but are of limited use due to the strong influence of mass transfer on theshape of the breakthrough curve. RSSCTs using different empty-bed contact timesshow that phosphate adsorption kinetics onto GFH are very slow and result inasymptotically shaped breakthrough curves. Analysis of breakthrough data provesthat operation of two GFH beds in series can contribute to a more efficient use ofthe adsorbent.
Breakthrough curves were modeled using the homogeneous surface diffusionmodel (HSDM) and two of its derivatives, the constant pattern homogeneoussurface diffusion model (CPHSDM) and the linear driving force model (LDF). Inputparameters, the Freundlich isotherm constants, and mass transfer coefficients forliquid- and solid-phase diffusion were determined and analysed for their influenceon the shape of the breakthrough curve. HSDM simulation results predict thebreakthrough of phosphate, and the also investigated adsorbates arsenate, salicylicacid, and DOC satisfactorily. Due to a very slow intraparticle diffusion and hencehigher Biot numbers, LDF and CPHSDM could not describe arsenate breakthroughcorrectly. Based on this observation, limits of applicability were defined for LDF
v
and CPHSDM. When designing fixed-bed adsorbers, model selection based onknown or estimated Biot and Stanton numbers is possible.
GFH is stable at high pH and can be efficiently regenerated using 1 M NaOH.Approximately 80 % of the initially bound phosphate can be eluated. However,the incomplete desorption leads to decreasing capacities with each additionaluse. Multiple uses are thus limited, but at least three operation cycles are feasible.GFH desorption is fast and most of the desorbable phosphate could be eluatedusing 4 - 6 bed volumes of regenerant. A reuse of the regenerant solution ispossible. Despite high phosphate concentrations in the regenerate, 61 - 85 % of thebound phosphate could be desorbed. Phosphate can be recovered from the highlyconcentrated regenerant stream (up to 3.5 g/L P). Precipitation with lime waterresulted in 90 % P removal and a plant available precipitate which might be usedas a fertilizer. Regeneration and multiple use of GFH can significantly increaseoperation times of fixed-bed adsorbers and be an economically favourable optioncompared to single use.
Laboratory results were confirmed in pilot-scale experiments in Beijing, Chinawhich show that selective nutrient removal by adsorption onto GFH after amembrane bioreactor (MBR) can maintain a total phosphorus concentration of< 0.03 mg L−1 P, thus preventing eutrophication of artificial lakes.
In conclusion, GFH adsorption is an effective and promising treatment tech-nique to remove phosphorus from waste and surface waters. Economic use islimited to special applications where near zero effluent concentrations are required.Regeneration and serial operation prolonge operation times of fixed-bed columnsand decrease the specific adsorbent costs.
vi
Z U S A M M E N FA S S U N G
Gegenüber den herkömmlichen Verfahren zur Phosphatentfernung kann es bei bes-timmten Fragestellungen der Abwasserwiederverwendung sinnvoll sein, Phosphatbis auf ganz geringe Restkonzentrationen zu entfernen. Dies kann beispielsweisebei der Wiederverwendung von Abwasser in Landschaft gestaltenden künstlichenGewässern der Fall sein. Dass Eisenhydroxide hohe Adsorptionskapazitäten fürPhosphat zeigen, ist seit langem bekannt.
Ziel der vorliegenden Arbeit ist es, die Phosphatadsorption an kommerziellverfügbare Adsorbentien auf Eisenbasis hinsichtlich der Eignung für die weitest-gehende Abwasserreinigung und Abwasserwiederverwendung zu bewerten. ImMittelpunkt der Untersuchungen steht Granuliertes Eisenhydroxid (GEH), dasvor allem in der Arsenentfernung eingesetzt wird. Zentrale Fragestellung ist dieQuantifizierung der konkurrierenden Adsorption von Abwasserinhaltsstoffen undder damit einhergehenden Kapazitätsverluste und die Entwicklung eines Regener-ationsverfahrens, dass die Wiedernutzung des Adsorbens ermöglicht. Schließlichsoll eine Methodik zur Vorhersage des Durchbruchs von Festbettadsorbern mittelsmathematischer Modelle erarbeitet werden.
Laborversuche mit Abwasser, natürlichen Wässern und Modelllösungen zeigeneine starke pH-Abhängigkeit der Adsorption von Phosphat an GEH. Hohe Be-ladungen von bis zu 24 mg/g P (bei pH 6 und einer Gleichgewichtskonzentrationvon 2 mg/L P) werden erreicht. In Abwasser und Trinkwasser werden höhereBeladungen beobachtet als im reinen System (vollentsalztes Wasser). Als Grundwird die Anwesenheit von Calcium vermutet, die die Adsorption von Phosphat anGEH deutlich verbessert. Eine modellhafte Beschreibung der Adsorption mittelsdes Doppelschichtmodells ist prinzipiell möglich, eine Simulation der simultanenAdsorption von Phosphat und Calcium gelingt jedoch nicht.
Obwohl mittlere Phosphatbeladungen im Membrankonzentrat beobachtet wer-den, ist die Adsorption an GEH nicht geeignet für die Aufbereitung von Mem-brankonzentrat. Übersättigte Konzentratlösungen führen zu Ausfällungen undDruckverlust in den Festbettfiltern. Mittels chemischer Fällung können Phosphatund Calcium effektiv entfernt und das Scalingpotential deutlich verringert werden,was eine Erhöhung der Ausbeute in der Hochdruckmembranfiltration ermöglicht.
Kleinfilterversuche (Rapid small-scale column tests - RSSCT) sind ein wichtigesHilfsmittel zur Simulation von Festbettadsorbern. Mittels Isothermenversuchenkann der ideale Durchbruch von Festbettfiltern berechnet werden, dessen Aus-sagekraft jedoch aufgrund des großen Einflusses der Kinetik auf die Form derDurchbruchskurve begrenzt ist. Kleinfilterversuche zeigen, dass die Kinetik derAdsorption von Phosphat an GEH sehr langsam ist und zu asymptotisch geformtenDruchbruchskurven führt. Anhand von Durchbruchsdaten konnte zudem gezeigtwerden, dass die Reihen-Wechsel-Schaltung von Festbettadsorbern eine bessereAusnutzung des Adsorbens ermöglicht.
Experimentell aufgenommene Durchbruchskurven lassen sich mit dem Ober-flächendiffusionsmodell (HSDM) und zwei abgeleiteten Modellen, CPHSDM undLDF, darstellen. Der Einfluss der experimentell bestimmten Modelleingabepa-rameter wie der Freundlich-Isothermenkonstanten und der Stoffübergangskoef-
vii
fizienten der Film- und Korndiffusion auf die Form der Durchbruchskurve wurdeanalysiert. Der Durchbruch von Phosphat und den ebenfalls untersuchten Adsor-baten Arsenat, Salicylsäure und DOC konnte mit dem HSDM zufriedenstellendwiedergegeben werden. Durch den sehr langsamen inneren Stofftransport tretenhöhere Biot-Zahlen auf, bei denen LDF und CPHSDM den Durchbruch nichtkorrekt vorhersagen können, wie für Arsenat beobachtet wurde. Anhand dieserErgebnisse wurden Anwendungsgrenzen für LDF und CPHSDM definiert undgezeigt, dass eine Modellauswahl mittels bekannter oder abgeschätzter Biot- undStanton-Zahlen möglich ist.
GEH ist auch bei hohen pH-Werten stabil und eine Regeneration mittels NaOHist möglich. Etwa 80 % des anfangs adsorbierten Phosphats können eluiert werden.Die unvollständige Desorption führt zu Kapazitätsverlusten mit jeder Wieder-nutzung, deren Anzahl dadurch begrenzt ist. Es sind mindestens drei Betrieb-szyklen ohne Wechsel des Materials möglich. Die Desorption von Phosphat istschnell und der Hauptteil des gebundenen Phosphats kann innerhalb der ersten4 - 6 Bettvolumen eluiert werden. Die gebrauchte Natronlauge kann wiederver-wendet werden. Trotz dadurch auftretender hoher Phosphatkonzentrationen in derRegeneratlösung, können 61 - 85 % des gebundenen Phosphats desorbiert werden.Eine Phosphorrückgewinnung aus der konzentrierten Lauge (bis zu 3.5 g/L P) istmöglich: mittels chemischer Fällung durch Zugabe von Kalkmilch können ca. 90 %des Phosphats entfernt werden. Das Präzipitat ist pflanzenverfügbar und kann alsDünger genutzt werden. Die Regeneration und Mehrfachnutzung von GEH erhöhtdie Standzeiten der Adsorber deutlich und ermöglicht einen kostengünstigerenEinsatz des Verfahrens.
Die Ergebnisse der Laborexperimente zur Adsorption und Regeneration wur-den durch Pilotversuche auf einer Kläranlage in Peking (China) bestätigt. Durchselektive Nährstoffentfernung mittels Adsorption an GEH anschließend an einenMembranbioreaktor kann eine Ablaufkonzentration von< 0.03 mg L−1 P Gesamt-phosphor sicher eingehalten werden. Dadurch kann die Eutrophierung künstlicherSeen verhindert werden.
Zusammenfassend ist festzustellen, dass die Adsorption an GEH für die Phos-phorentfernung aus Abwasser und Oberflächenwasser geeignet ist. Ein ökonomischsinnvoller Einsatz beschränkt sich auf Anwendungen, in denen sehr geringeRestkonzentrationen benötigt werden. Regeneration und Reihen-Wechsel-Schaltungverlängern die Standzeiten der Adsorber und verringern die spezifischen Materi-alkosten.
viii
C O N T E N T S
1 general introduction 1
2 literature review 3
2.1 Chemistry, occurrence and environmental relevance of phospho-rus 3
2.2 Adsorption of phosphate onto ferric hydroxide surfaces 10
2.3 Breakthrough prediction of fixed-bed adsorbers 13
2.4 Regeneration 19
3 phosphate adsorption onto granular ferric hydroxide : isotherm
and fixed-bed column studies 21
3.1 Introduction 21
3.2 Materials and Methods 24
3.3 Results and Discussion 26
3.4 Conclusions 34
4 surface complexation modeling 35
4.1 Introduction 35
4.2 Methodology 35
4.3 Results and Discussion 37
4.4 Conclusions 41
5 treatment of membrane concentrates : phosphate removal
and reduction of scaling potential 43
5.1 Introduction 43
5.2 Methods 44
5.3 Results and Discussion 46
5.4 Conclusions 48
6 predicting anion breakthrough in granular ferric hydrox-ide (gfh) adsorption filters 51
6.1 Introduction 51
6.2 Models 52
6.3 Parameter Estimation 55
6.4 Materials and Methods 56
6.5 Results 58
6.6 Conclusions 64
7 regeneration of granular ferric hydroxide adsorption fil-ters for trace phosphate removal 65
7.1 Introduction 65
7.2 Materials and Methods 66
7.3 Results and Discussion 70
7.4 Conclusions 80
8 an integrated wastewater reuse concept combining natu-ral reclamation techniques , membrane filtration and metal
oxide adsorption 81
8.1 Introduction 81
8.2 Methods 82
8.3 Results and Discussion 84
8.4 Conclusions 87
ix
x contents
9 general discussion 91
9.1 GFH-phosphate adsorption equilibria in different water matri-ces 91
9.2 Adsorber design - from water quality analysis to breakthroughprediction 92
9.3 Operation of GFH fixed-bed columns 93
9.4 Regeneration of GFH 94
9.5 Final remarks 94
Appendix 99
a summary of phosphorus adsorbents and their properties 101
b hsdm simulation results depending on st and bi 103
c gfh fixed-bed column operation data from wwtp beixiaohe 109
bibliography 111
L I S T O F F I G U R E S
Figure 1 Geological and biological phosphorus cycle 3
Figure 2 Phosphorus forms 4
Figure 3 Aqueous speciation of phosphorus as function of pH 6
Figure 4 Mass transfer zone and breakthrough curve 14
Figure 5 Operation of two beds in series 23
Figure 6 Specific surface area and mass fraction of different grainsize fractions 27
Figure 7 Density, water content and bed porosity for different GFHgrain size fractions 28
Figure 8 GFH batch isotherms 30
Figure 9 Phosphate breakthrough in GFH fixed-bed columns oper-ated in different water matrices and corresponding isothermprediction 32
Figure 10 Calculated specific throughput for operation of two GFHfixed-beds in series 33
Figure 11 Adsorption equilibrium data and DDL model prediction 1 38
Figure 12 Adsorption equilibrium data and DDL model prediction 2 39
Figure 13 Adsorption equilibrium data and DDL model prediction 3 40
Figure 14 Interaction between calcium and phosphate adsorption 41
Figure 15 Investigated treatment scheme 45
Figure 16 Phosphate adsorption equilibrium isotherms for NF con-centrate 47
Figure 17 Removal of dissolved ions by chemical precipitation usingdifferent amounts of NaOH 48
Figure 18 Calculated solubility index for calcium carbonate in themembrane concentrate solution prior and after treatment 49
Figure 19 Precipitation kinetics; calcium and phosphate concentrationdecrease after addition of NaOH 50
Figure 20 Phosphate removal in a calcite fixed-bed column crystalliserfor different empty-bed contact times 50
Figure 21 Categories defined by Hand et al. [64] and correspondingmodel simulations (St=5, n=0.2) 59
Figure 22 Breakthrough curves and model simulations for a) arsenate,b) phosphate, c) DOC and d) salicylic acid 61
Figure 23 Match (1−∆X̄) between HSDM and LDF model simula-tions in dependence of Biot and Stanton numbers, n=0.2,a)-d) experimental data according to Figure (22) 62
Figure 24 Match (1−∆X̄) between HSDM and CPHSDM model sim-ulations in dependence of Biot and Stanton numbers, n=0.2,a)-d) experimental data according to Figure (22) 63
xi
xii List of Figures
Figure 25 Desorption strength of different regenerant solutions (2hregeneration using 200 mL regenerant 71
Figure 26 Desorption of phosphorus adsorbed onto GFH and Fer-rosorp using 1 M NaOH of different initial phosphate con-centrations as a regenerant 72
Figure 27 Solid-phase concentration reached and desorbed phosphateduring operation and regeneration of DCBR tests usingGFH and FerroSorp 73
Figure 28 Breakthrough of a RSSCT column operated in three sequen-tial operation phases and regenerated with one, reusedbatch of 1 M NaOH 74
Figure 29 Specific throughput until breakthrough of a RSSCT columnoperated in three sequential operation phases 75
Figure 30 Phosphorus mass balance for three sequential adsorption/regeneration phases of a RSSCT column: solid-phase con-centration achieved in the adsorption step, remaining afterregeneration and desorption of phosphate during regenera-tion 76
Figure 31 Phosphate elution curve of a laboratory-scale column re-generated with 1 M NaOH 77
Figure 32 Phosphorus removal by precipitation as calcium phosphate(CP), struvite (MAP) and potassium struvite (KMP) frommodel regenerate solutions and citrate solubility of theprecipitate 78
Figure 33 Phosphorus removal by precipitation as calcium phosphatefrom DCBR regenerates 79
Figure 34 Wastewater reclamation and reuse scheme 83
Figure 35 Breakthrough curve of GFH pilot columns at WWTP Beixi-aohe 85
Figure 36 Phosphate desorption using 1 M NaOH as regenerant forfixed-bed GFH columns in WWTP Beixiaohe 86
Figure 37 Trans-membrane pressure development during the experi-ment period in WWTP Beixiaohe 88
Figure 38 LC-OCD diagram of lake water, effluent after limestone andsand filtration and ultrafiltration permeate 88
Figure 39 Biopolymer peak of tertiary effluent, slow sand filtrates andUF permeate of tertiary effluent 89
Figure 40 Biopolymer removal at different filtration rates 89
Figure 41 Procedure for breakthrough prediction 97
Figure 42 HSDM simulation results for different values of Bi, St,n 104
Figure 43 HSDM simulation results for different values of Bi, St,n 105
Figure 44 HSDM simulation results for different values of Bi, St,n 106
Figure 45 HSDM simulation results for different values of Bi, St,n 107
Figure 46 Daily operation time, phosphate influent concentration, andpH during pilot operation of two GFH fixed-columns at theWWTP Beixiaohe 109
L I S T O F TA B L E S
Table 1 Typical effluent concentration ranges after wastewater treat-ment 8
Table 2 Application and choice of adsorbents 9
Table 3 Fixed-bed adsorption models 15
Table 4 Batch isotherm experiments 25
Table 5 GFH fixed-bed column studies 26
Table 6 Physical characterization of GFH 29
Table 7 Isotherm model parameter 31
Table 8 Surface complexation constants 38
Table 9 Water quality data of membrane concentrates used in thisstudy 45
Table 10 Adsorption equilibrium 58
Table 11 Adsorption Kinetics 59
Table 12 Model input parameters 60
Table 13 Regeneration of GFH fixed-bed columns 69
Table 14 Operating cost assessment for a full-scale GFH adsorber 80
Table 15 Operational parameters of two GFH fixed-bed columns atWWTP Beixiaohe 84
Table 16 Water quality after treatment steps (average values) andcomparison to Chinese urban reuse water standards 87
Table 17 Summary of phosphorus adsorbents and their properties 101
xiii
xiv acronyms
A C R O N Y M S
atp Adenosine Triphosphate
bes N,N-Bis(2-hydroxyethyl)-2-aminoethanesulfonic Acid
bet Brunauer-Emmett-Teller Isotherm
bf Bank Filtration
bnr Biological Nutrient Removal
bod5 Biological Oxygen Demand
btc Breakthrough Curve
bv Bed Volumes
bxh Beixiaohe
cas Conventional Activated Sludge
cd Constant Diffusivity Approach
cd-music Charge Distribution and Mult-Site Complexation Model
cmbr Completely-mixed Batch Reactor
cod Chemical Oxygen Demand
dcbr Differential Column Batch Reactor
ddl Diffuse Double Layer Model
dfhsdm Dispersed-flow Homogeneous Surface Diffusion Model
dfpsdm Dispersed-flow Pore and Surface Diffusion Model
di De-ionized Water
dna Desoxyribonucleic Acid
doc Dissolved Organic Carbon
dw Drinking Water
ebct Empty-bed Contact Time
ebpr Enhanced Biological Phosphorus Removal
acronyms xv
exafs Extended X-ray Absorption Fine-structure Spectroscopy
fast Fixed-bed Adsorption Simulation Tool
fs FerroSorp
ft-ir Fourier Transformed Infrared Spectroscopy
gac Granular Activated Carbon
gfh Granular Ferric Hydroxide
gw Ground Water
hlr Hydraulic Loading Rate
hsdm (Plug-flow) Homogeneous Surface Diffusion Model
kmp Potassium Magnesium Phosphate
lc Laboratory-scale Column
lc-ocd Liquid Chromatography with Organic Carbon Detection
lem Local Equilibrium Model
ldf Linear Driving Force Model
map Magnesium Ammonium Phosphate
mbr Membrane Bioreactor
mes 2-(N-morpholino)ethanesulfonic Acid
mwco Molecular Weight Cut-off
nf Nanofiltration
nom Natural Organic Matter
oecd Organisation for Economic Co-operation and Development
p Phosphorus
pac Poly-aluminium Chloride
pd Proportional Diffusivity Approach
pde Partial Differential Equation
pest Parameter Estimation Tool
psdm (Plug-flow) Pore and Surface Diffusion Model
ro Reverse Osmosis
rssct Rapid Small-scale Column Test
scm Surface Complexation Model
sfbr Short Fixed-bed Reactor
sp Soluble Phosphorus
ssf Slow Sand Filtration
srp Soluble Reactive Phosphorus
sup Soluble Unreactive Phosphorus
taps (N-Tris(hydroxymethyl)methyl-3-aminopropanesulfonic Acid
tdp Total Dissolved Phosphorus
tds Total Dissolved Solids
tmp Trans-membrane Pressure
tp Total Phosphorus
uf Ultrafiltration
u.s . epa United States Environmental Protection Agency
uv254/436 UV Absorption at 254/ 436 nm
wcf Water Conversion Factor
wwtp Wastewater Treatment Plant
L I S T O F N O TAT I O N
A0..4 coefficients of CPHSDM -
Bi Biot number, Bi = kLrPc0/(DSρPqo) -
c liquid-phase concentration M/L3
c0 influent liquid-phase concentration M/L3
c∗ liquid-phase concentration at exterior adsorbent sur-face
M/L3
Dg solute distribution parameter,Dg = ρBq0/(εBc0)
-
DS surface diffusion coefficient L2/t
EBCT empty-bed contact time,EBCT =m/(ρBQ)
t
xvi
list of notation xvii
Ed diffusivity modulus, Ed = St/Bi -
KF Freundlich isotherm coefficient (L3/M)n
kL liquid-phase mass transfer coefficient L/t
L length of fixed-bed L
m mass of adsorbent M
n Freundlich isotherm exponent -
N number of simulated data points -
q solid-phase concentration M/M
q0 solid-phase concentration in equilibrium with influentliquid-phase concentration,q0 = KF · c0n
M/M
q∗ solid-phase concentration at exterior adsorbent sur-face
M/M
q̄ average solid-phase concentration M/M
Q fluid flow rate L3/t
r radial coordinate L
rP radius of adsorbent grain L
R dimensionless radial coordinate, R = r/rP -
∆R discretisation grid width for dimensionless radial co-ordinate
-
St modified Stanton number,St = kLm/(rPρPQ)
-
Stmin minimum Stanton number required to establish con-stant pattern
-
t time coordinate t
T dimensionless time coordinate,T = t/(EBCTεBDg)
-
∆T discretisation grid width for dimensionless time coor-dinate
-
vF superficial filter velocity, hydraulic loading rate (HLR) L/t
X dimensionless liquid-phase concentration,X = c/c0
-
X∗ dimensionless liquid-phase concentration at exterioradsorbent surface
-
∆X̄ arithmetic mean of absolute differences betweenmodel simulations
-
Y dimensionless solid-phase concentration,Y = q/q0
-
Y∗ dimensionless solid-phase concentration at exterioradsorbent surface
-
xviii list of notation
z axial coordinate L
Z dimensionless axial coordinate, Z = z/L -
∆Z discretisation grid width for dimensionless axial co-ordinate
-
α Courant number of filter PDE (6.3),α =Dg∆T/∆Z
-
β numerical stability number of filter PDE (6.3),β = 3StDg∆T
-
γ Courant number of intraparticle PDE (6.6),γ = Ed∆T/∆R2
-
εB bed porosity -
ρP density of adsorbent grain M/L3
τ packed-bed (effective) contact time,τ = EBCT/εB
t
Subscribes
i index of grid cell for time coordinate -
j index of grid cell for axial coordinate -
k index of grid cell for radial coordinate -
1G E N E R A L I N T R O D U C T I O N
Advanced phosphorus removal to near zero levels cannot be achieved by tra-ditional biological nutrient removal and chemical precipitation processes, butwill become increasingly important for a number of different applications suchas wastewater reuse in artificial lakes, advanced wastewater treatment due toincreasingly stringent regulation on phosphorus discharge, as well as restorationof eutrophic surface water bodies.
In this study, phosphate adsorption onto Granular Ferric Hydroxide (GFH), acommercially available ferric hydroxide adsorbent was investigated for its suitabil-ity in wastewater reuse applications. GFH has been developed 1990-1994 and ismainly applied for removal of arsenic from water [36, 35, 38]. Given that ferric hy-droxides have been known for high affinities for phosphate adsorption, phosphatewas identified as a major competitor for arsenic adsorption and the potential useof GFH for phosphate removal was proposed.
As early as 1997, GFH was used in the restoration of Lake Plötzensee [63, 70].In pilot-scale operation, severe problems due to algae growth on the adsorbentmaterial occured. As a consequence, high head loss was observed and frequentbackwash was required, which led to abrasion because of the low mechanicalstrength of the adsorbent. In these very early trials, the GFH production processwas still under development and an increase of the mechnical strength wastargeted.
In 2002, a screening of several commercial adsorbents for phosphorus removal infresh and sea water aquariums was done, and the GFH-based product RowaPhosshowed the highest adsorption capacities [75].
Within the framework of a larger research project on decentralized wastewatertreatment using membrane bio-reactors (MBR), GFH and activated alumina weretested as a polishing step for MBR filtrates in laboratory-scale [57, 61]. Resultsshowed pH-dependent high phosphate adsorption capacities for GFH and nosignificant effect of competition by other organic or inorganic compounds. In con-clusion, pilot operation was recommended to study breakthrough characteristicsand GFH fixed-bed operation in larger scale.
The present study was initiated through the joint Chinese-German project"Sustainable water concept and its application for the Olympic Games 2008".Within this project, GFH phosphate removal from wastewater and subsequentwater reuse in an artificial lake was tested. Next to this pilot study, extensivelaboratory studies were done to quantify competitive adsorption of phosphate andwastewater constituents and its effect on operation times of fixed-bed adsorbers. Aregeneration process for GFH which enables the multiple application of GFH hasbeen investigated. Using mathematical models, a methodology for breakthroughprediction of fixed-bed adsorbers has been developed.
In chapter 2, available literature on phosphate adsorption onto ferric hydrox-ide surfaces is reviewed. An overview is given on phosphorus chemistry andoccurrence, the fundamentals of adsorption, modeling of fixed-bed systems, andregeneration.
1
2 general introduction
The equilibrium of the adsorption of phosphate onto GFH is investigated inchapter 3. The influence of water composition and competition of drinking waterand wastewater constituents is assessed in isotherm experiments. For compar-ison, two alternative adsorbents are tested. Column experiments are used tosimulate breakthrough of fixed-bed adsorbers under different water qualitity andoperational conditions.
In chapter 4, the diffuse double layer (DDL) model is tested to describe theadsorption equilibrium data. Formation of three mononuclear phosphate surfacecomplexes is hypothesized and equilibrum constant are determined. The interac-tion of phosphate and calcium adsorption is investigated and description by theDDL model tested.
In chapter 5, focus is shifted towards the treatment of membrane concentrates.Due to the rejection of polyvalent anions by nanofiltration and reverse osmosismembranes, high concentrations of phosphate occur in membrane concentrates.Treatment to i) increase the recovery of the membrane filtration and minimizethe volume of the concentrate stream, and ii) increase the concentrate quality toenable discharge into surface water bodies are evaluated. Within the latter scope,GFH adsorption is tested as a polishing step for membrane concentrates.
Breakthrough prediction of GFH fixed-bed filters is addressed in chapter 6. Ad-sorbate and matrix specific constants describing adsorption equilibrium and masstransfer are determined for arsenate, phosphate, salicylic acid, and groundwaterDOC. Breakthrough curves are experimentally determined and modeled usingthe homogeneous surface diffusion model (HSDM) and two of its derivatives,the constant pattern homogeneous surface diffusion model (CPHSDM) and thelinear driving force model (LDF). The input parameters are analyzed for theirinfluence on the shape of the breakthrough curve and limits of model applicabilityare determined.
Chapter 7 provides a detailed evaluation of regeneration and multiple appli-cation of GFH and comparison to an alternative adsorbent. Due to the potentialcreation of a toxic and hardly disposable concentrate stream, regeneration ofarsenic loaden adsorbent material is neither investigated nor desired. However, ifGFH adsorption is used for phosphate or DOC removal, regeneration can increaseoperation time and cost effectiveness. A regenerant solution containing phosphateis not toxic and could be safely disposed off. The main objective of this study is toquantify the efficiency of phosphate desorption and address the question whethermultiple application results in a loss of adsorption capacity. Kinetics of desorptionand recovery of phosphorus from the regenerate stream is also evaluated.
Chapter 8 focusses on pilot-scale operation of GFH adsorption columns foradvanced wastewater treatment and reuse. A sustainable water concept developedfor different applications of municipal water reuse is tested in a pilot-scale study inBeijing’s wastewater treatment plant Beixiaohe. The selective phosphate removalfrom a membrane bio-reactor effluent and reuse in an artificial lake is investigated.
2L I T E R AT U R E R E V I E W
2.1 chemistry, occurrence and environmental relevance of phos-phorus
2.1.1 Chemistry and natural occurrence
Phosphorus (P), having the atomic number 15 and an atomic weight 0f 30.97376
is the eleventh most abundant element in the earth’s crust and widely presentin rocks, soils, waters and in living organisms. Phosphorus compounds playa crucial role in life processes, forming the backbone of the DNA and beinginvolved in metabolic energy transfer as ATP and related compounds, yet arealso among the most toxic substances known, used as chemical warfare agentsand as pesticides. There are more than 100,000 known phosphorus compoundsof which the majority contain linkages to oxygen, carbon, nitrogen and metals.Under most conditions, naturally occuring phosphorus is exclusively combinedwith four oxygen molecules, forming the phosphate oxyanion [18].
������������������������������������������������
����������������� ������ ������ ������ ���������������������
�� ������ ��� ������ ��� ������ ��� ������ �
����������������� ������ ������ ������ �
���������������������������� ��� ��� ��� ���
��������������������������������
���� ����� ����� ����� ���������������������
������������������������
� ����!����� � ����!����� � ����!����� � ����!�����
"��� ����"��� ����"��� ����"��� �������� ���� ���� ���� ����������������
# ����# ����# ����# ����
����������������������������������������������������
������ ��������� ��������� ��������� ���
�������������������������������� ����$�����$�����$�����$�
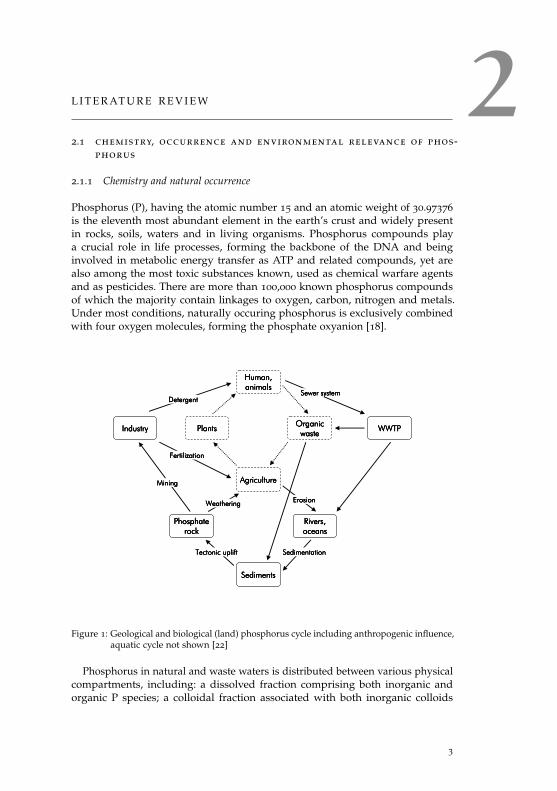
Figure 1: Geological and biological (land) phosphorus cycle including anthropogenic influence,aquatic cycle not shown [22]
Phosphorus in natural and waste waters is distributed between various physicalcompartments, including: a dissolved fraction comprising both inorganic andorganic P species; a colloidal fraction associated with both inorganic colloids
3
4 literature review
such as clays and organic macromolecules including humic and fulvic acids; aparticulate component including P species adsorbed to particle surfaces or retainedin the particle matrix and also a biological constituent associated with aquaticorganisms such as algae or bacteria [30].
In nature, phosphorus passes through several interconnected cycles. The geolog-ical cycle of phosphorus includes erosion, transport to the oceans, sedimentation,tectonic uplift and alteration of phosphate-containing rocks into plant-availablephosphate in soils. The cycle time is several million years [22, 50, 118]. Besidesthe geological cycle, phosphorus is cycled as part of the food chain on land andin aquatic systems, with cycle times ranging between a few weeks and up to oneyear [22, 118]. The global P cycle has been modified extensively with modernhuman (agricultural, urban and industrial) practices. As a result, fluxes of P havedoubled during the past several centuries [118] due to a high rate of extraction ofP from mineral deposits followed by widespread use in fertilizers and detergents.Figure 1 illustrates the geological and biological phosphorus cycles includinganthropogenic influences.
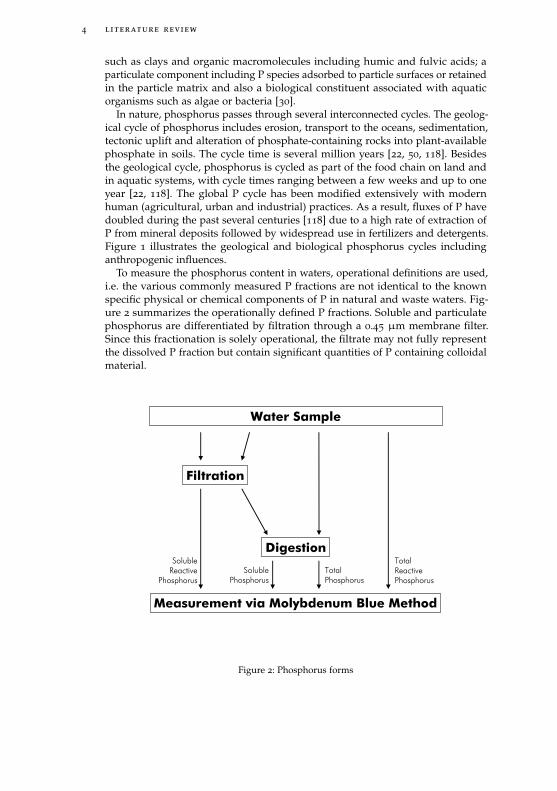
To measure the phosphorus content in waters, operational definitions are used,i.e. the various commonly measured P fractions are not identical to the knownspecific physical or chemical components of P in natural and waste waters. Fig-ure 2 summarizes the operationally defined P fractions. Soluble and particulatephosphorus are differentiated by filtration through a 0.45 µm membrane filter.Since this fractionation is solely operational, the filtrate may not fully representthe dissolved P fraction but contain significant quantities of P containing colloidalmaterial.
����� �����
�������
��������
��������� � ���������� �� ����������
�������������
���������
������� ���������
���� ���������
���������� ���������
Figure 2: Phosphorus forms
2.1 chemistry, occurrence and environmental relevance of phosphorus 5
Soluble Reactive Phosphorus (SRP) is measured by reacting with acidic molyb-date to form 12-phosphomolybdic acid, which on reduction forms the stronglycoloured phosphomolybdenum blue species which can be determined spectropho-tometrically. SRP consists largely of the inorganic orthophosphate and is thefraction of total phosphorus which is directly available for uptake by bacteria andalgae. Historically, SRP has been called dissolved inorganic phosphate or simplyorthophosphate. The term reactive is used to indicate that the phosphorus in theSRP fraction is not solely inorganic, but could include any other form of phos-phorus that reacts with the reagents. Some organic P forms have been found tohydrolize and react with ammonium molybdate, while (inorganic) polyphosphatesdo not react. Nevertheless, the commonly used term orthophosphate is used forSRP in the experimental part of this work.
Soluble Phosphorus (SP) is measured after digestion of the sample, usually byacid oxidation (e.g., using potassium persulfate [1]), to decompose the dissolvedand some colloidal P species to inorganic monomeric phosphate. SP is also termedTotal Dissolved Phosphorus (TDP).
The difference between SRP and SP concentrations is known as Soluble Unre-active Phosphorus (SUP). This fraction contains filterable phosphorus forms thatdo not react with the phosphorus reagents under the time and conditions of thetest. The compounds in the SUP fraction are mainly organic forms of phosphorusand chains of inorganic phosphorus molecules, i.e. polyphosphates. The organicfraction is reported to be hard to remove during wastewater treatment [108].
The Total Phosphorus (TP) fraction incorporates all filterable and particulateforms and is the variable that should be studied for biomass management insurface waters [20]. There exists a correlation between TP and chlorophyll, i.e.biomass, and several models have been developed to predict phytoplanktondensity in surface waters. A widely used statistical model has been establishedby Vollenweider and Kerekes [120] and allows classifications of natural lakesaccording to their trophic status.
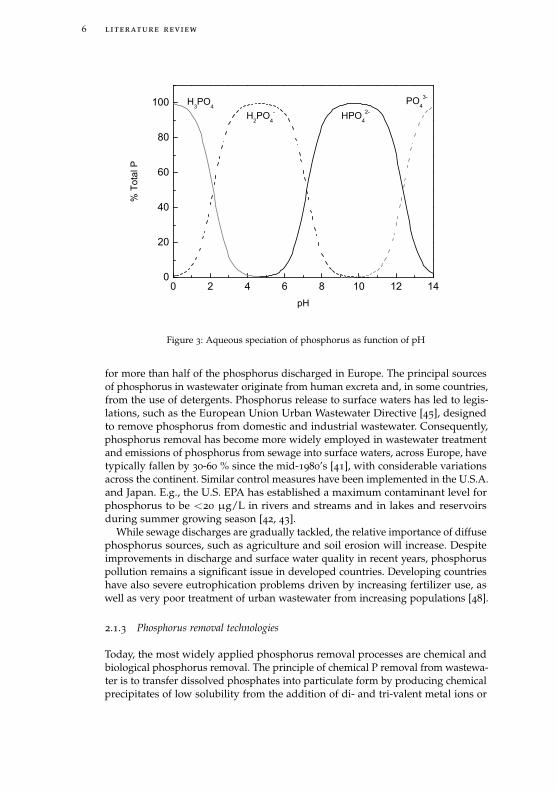
Figure 3 shows the aqueous speciation of phosphoric acid (orthophosphate). Inthe pH range of most natural waters and wastewaters (pH 6 - 9.5), the monovalent(H2PO−
4 ) and the divalent (HPO2−4 ) form are the dominating species. For thedissociation of phosphoric acid, the equilibrium constants are pKa1 = 2.12,pKa2 = 7.21, and pKa3 = 12.67 (ionic strength of zero, T=25°C). Speciationand charge of the anionic adsorbate phosphate influence the adsorption onto metaloxide surfaces, i.e. phosphate removal is pH dependent.
2.1.2 Eutrophication
The pollution of surface waters by phosphates is the main cause for eutrophi-cation and was recognized as a problem in the middle of the twentieth century.Phosphorus is an essential plant nutrient and excess quantities of it result inextensive growth of phytoplankton, macroalgae, and higher plants. In some cases,this includes harmful algal blooms and depletion of dissolved oxygen that sub-sequently results in the decline of aquatic life [48, 20]. A survey on the extent ofthe problem on a global level has found that in Europe 53 % of lakes and reser-voirs are eutrophic. The proportions for Africa, South East Asia, North and Southamerica are 28 %, 54 %, 48 %, and 41 %, respectively [73]. Point sources (e.g., frommunicipal wastewater treatment plants, industrial and some agricultural) account
6 literature review
0 2 4 6 8 1 0 1 2 1 40
2 0
4 0
6 0
8 0
1 0 0H 2 P O 4
- H P O 42 -
P O 43 -
% To
tal P
p H
H 3 P O 4
Figure 3: Aqueous speciation of phosphorus as function of pH
for more than half of the phosphorus discharged in Europe. The principal sourcesof phosphorus in wastewater originate from human excreta and, in some countries,from the use of detergents. Phosphorus release to surface waters has led to legis-lations, such as the European Union Urban Wastewater Directive [45], designedto remove phosphorus from domestic and industrial wastewater. Consequently,phosphorus removal has become more widely employed in wastewater treatmentand emissions of phosphorus from sewage into surface waters, across Europe, havetypically fallen by 30-60 % since the mid-1980’s [41], with considerable variationsacross the continent. Similar control measures have been implemented in the U.S.A.and Japan. E.g., the U.S. EPA has established a maximum contaminant level forphosphorus to be <20 µg/L in rivers and streams and in lakes and reservoirsduring summer growing season [42, 43].
While sewage discharges are gradually tackled, the relative importance of diffusephosphorus sources, such as agriculture and soil erosion will increase. Despiteimprovements in discharge and surface water quality in recent years, phosphoruspollution remains a significant issue in developed countries. Developing countrieshave also severe eutrophication problems driven by increasing fertilizer use, aswell as very poor treatment of urban wastewater from increasing populations [48].
2.1.3 Phosphorus removal technologies
Today, the most widely applied phosphorus removal processes are chemical andbiological phosphorus removal. The principle of chemical P removal from wastewa-ter is to transfer dissolved phosphates into particulate form by producing chemicalprecipitates of low solubility from the addition of di- and tri-valent metal ions or
2.1 chemistry, occurrence and environmental relevance of phosphorus 7
lime. The formed precipitates and particulate phosphates are usually removed bysolid separation processes such as sedimentation, flotation or filtration [108, 21].Polyphosphates and organic phosphorus may take part in adsorption reactions,but only to a limited extent and thus represent the partly removable phosphorusfraction. The proportions of easily vs. partly removable phosphorus fractionsinfluences process performance and achievable levels of residual phosphorus inthe effluent, which are also governed by the raw water quality, type and dose ofprecipitant, location of dose application, chemical speciation, mixing conditions,process configuration, and the target water quality. The process is robust andflexible and phosphorus removal of more than 90 % is achievable under optimizedconditions. Extensive information in this subject area is available [108, 92] andtherefore only briefly covered in this work.
The phenomenon of biological phosphate removal was first recognized byGreenberg et al. [62] who proposed that under certain conditions activated sludgehad the ability to accumulate phosphate in excess of that required for balancedmicrobial growth. In later years, this was frequently referred to as ’luxury’ phos-phate uptake and its exploitation appeared to provide the basis of a biologicalalternative to chemical precipitation for phosphate removal from wastewater. Ulti-mately, this led to the development of the enhanced biological phosphate removal(EBPR) process. EBPR can be achieved through the activated sludge process byrecirculating sludge through anaerobic and aerobic conditions. This is achieved byconfiguring the treatment system such that an anaerobic zone is added upstreamof the traditional aerobic phase. A specialized group of microorganisms known aspolyphosphate accumulating organisms is able to gain a selective advantage bytaking up carbon sources such as volatile fatty acids under anaerobic conditionsand storing them intracellularly as carbon polymers. The energy required for thesebiotransformations is mainly generated by the cleavage of polyphosphate, whichis intracellularly stored. Ultimate phosphate removal from the system is achievedby the wastage of phosphate-rich excess sludge. Many different process configura-tions exist where both P and nitrogen removal are combined, which is also referredto as biological nutrient removal [108]. When operated successfully, the EBPRprocess is a relatively inexpensive and environmentally sustainable option forphosphate removal. However, the stability and reliability of EBPR can be a prob-lem and disturbances and prolonged periods of insufficient P removal have beenobserved at full-scale plants [13, 114]. Research is underway to overcome theseproblems and to gain a more detailed process understanding. Recent advanceshave been discussed by Oehmen et al. [87]. When operated under favourableconditions, EPBR plants are able to remove 80-90 % of influent phosphate. Table 1
shows typical effluent concentration ranges after different stages of wastewater
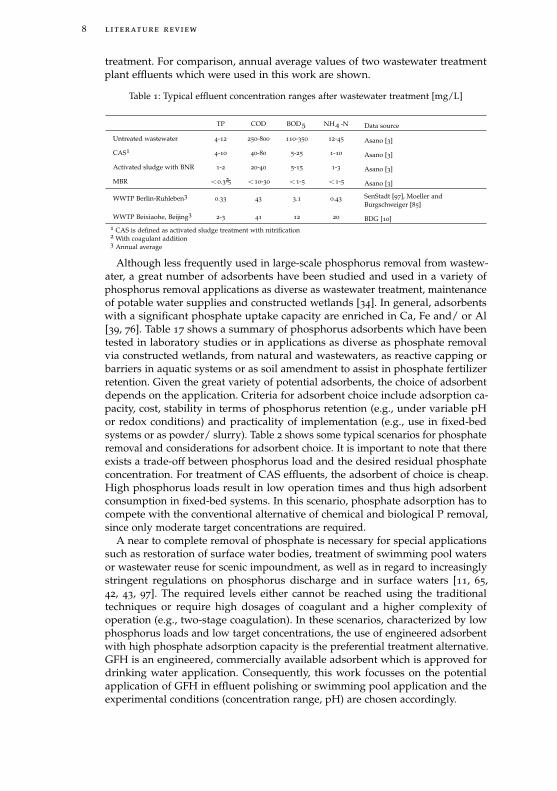
8 literature review
treatment. For comparison, annual average values of two wastewater treatmentplant effluents which were used in this work are shown.
Table 1: Typical effluent concentration ranges after wastewater treatment [mg/L]
TP COD BOD5 NH4-N Data source
Untreated wastewater 4-12 250-800 110-350 12-45 Asano [3]
CAS14-10 40-80 5-25 1-10 Asano [3]
Activated sludge with BNR 1-2 20-40 5-15 1-3 Asano [3]
MBR <0.32-5 <10-30 <1-5 <1-5 Asano [3]
WWTP Berlin-Ruhleben30.33 43 3.1 0.43
SenStadt [97], Moeller andBurgschweiger [85]
WWTP Beixiaohe, Beijing32-3 41 12 20 BDG [10]
1 CAS is defined as activated sludge treatment with nitrification2 With coagulant addition3 Annual average
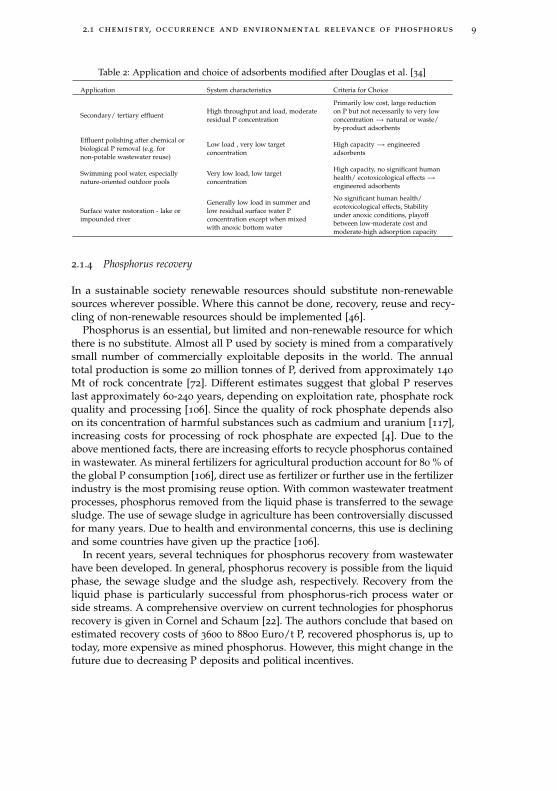
Although less frequently used in large-scale phosphorus removal from wastew-ater, a great number of adsorbents have been studied and used in a variety ofphosphorus removal applications as diverse as wastewater treatment, maintenanceof potable water supplies and constructed wetlands [34]. In general, adsorbentswith a significant phosphate uptake capacity are enriched in Ca, Fe and/ or Al[39, 76]. Table 17 shows a summary of phosphorus adsorbents which have beentested in laboratory studies or in applications as diverse as phosphate removalvia constructed wetlands, from natural and wastewaters, as reactive capping orbarriers in aquatic systems or as soil amendment to assist in phosphate fertilizerretention. Given the great variety of potential adsorbents, the choice of adsorbentdepends on the application. Criteria for adsorbent choice include adsorption ca-pacity, cost, stability in terms of phosphorus retention (e.g., under variable pHor redox conditions) and practicality of implementation (e.g., use in fixed-bedsystems or as powder/ slurry). Table 2 shows some typical scenarios for phosphateremoval and considerations for adsorbent choice. It is important to note that thereexists a trade-off between phosphorus load and the desired residual phosphateconcentration. For treatment of CAS effluents, the adsorbent of choice is cheap.High phosphorus loads result in low operation times and thus high adsorbentconsumption in fixed-bed systems. In this scenario, phosphate adsorption has tocompete with the conventional alternative of chemical and biological P removal,since only moderate target concentrations are required.
A near to complete removal of phosphate is necessary for special applicationssuch as restoration of surface water bodies, treatment of swimming pool watersor wastewater reuse for scenic impoundment, as well as in regard to increasinglystringent regulations on phosphorus discharge and in surface waters [11, 65,42, 43, 97]. The required levels either cannot be reached using the traditionaltechniques or require high dosages of coagulant and a higher complexity ofoperation (e.g., two-stage coagulation). In these scenarios, characterized by lowphosphorus loads and low target concentrations, the use of engineered adsorbentwith high phosphate adsorption capacity is the preferential treatment alternative.GFH is an engineered, commercially available adsorbent which is approved fordrinking water application. Consequently, this work focusses on the potentialapplication of GFH in effluent polishing or swimming pool application and theexperimental conditions (concentration range, pH) are chosen accordingly.
2.1 chemistry, occurrence and environmental relevance of phosphorus 9
Table 2: Application and choice of adsorbents modified after Douglas et al. [34]
Application System characteristics Criteria for Choice
Secondary/ tertiary effluentHigh throughput and load, moderateresidual P concentration
Primarily low cost, large reductionon P but not necessarily to very lowconcentration→ natural or waste/by-product adsorbents
Effluent polishing after chemical orbiological P removal (e.g. fornon-potable wastewater reuse)
Low load , very low targetconcentration
High capacity→ engineeredadsorbents
Swimming pool water, especiallynature-oriented outdoor pools
Very low load, low targetconcentration
High capacity, no significant humanhealth/ ecotoxicological effects→engineered adsorbents
Surface water restoration - lake orimpounded river
Generally low load in summer andlow residual surface water Pconcentration except when mixedwith anoxic bottom water
No significant human health/ecotoxicological effects, Stabilityunder anoxic conditions, playoffbetween low-moderate cost andmoderate-high adsorption capacity
2.1.4 Phosphorus recovery
In a sustainable society renewable resources should substitute non-renewablesources wherever possible. Where this cannot be done, recovery, reuse and recy-cling of non-renewable resources should be implemented [46].
Phosphorus is an essential, but limited and non-renewable resource for whichthere is no substitute. Almost all P used by society is mined from a comparativelysmall number of commercially exploitable deposits in the world. The annualtotal production is some 20 million tonnes of P, derived from approximately 140
Mt of rock concentrate [72]. Different estimates suggest that global P reserveslast approximately 60-240 years, depending on exploitation rate, phosphate rockquality and processing [106]. Since the quality of rock phosphate depends alsoon its concentration of harmful substances such as cadmium and uranium [117],increasing costs for processing of rock phosphate are expected [4]. Due to theabove mentioned facts, there are increasing efforts to recycle phosphorus containedin wastewater. As mineral fertilizers for agricultural production account for 80 % ofthe global P consumption [106], direct use as fertilizer or further use in the fertilizerindustry is the most promising reuse option. With common wastewater treatmentprocesses, phosphorus removed from the liquid phase is transferred to the sewagesludge. The use of sewage sludge in agriculture has been controversially discussedfor many years. Due to health and environmental concerns, this use is decliningand some countries have given up the practice [106].
In recent years, several techniques for phosphorus recovery from wastewaterhave been developed. In general, phosphorus recovery is possible from the liquidphase, the sewage sludge and the sludge ash, respectively. Recovery from theliquid phase is particularly successful from phosphorus-rich process water orside streams. A comprehensive overview on current technologies for phosphorusrecovery is given in Cornel and Schaum [22]. The authors conclude that based onestimated recovery costs of 3600 to 8800 Euro/t P, recovered phosphorus is, up totoday, more expensive as mined phosphorus. However, this might change in thefuture due to decreasing P deposits and political incentives.
10 literature review
2.2 adsorption of phosphate onto ferric hydroxide surfaces
2.2.1 Fundamentals of adsorption
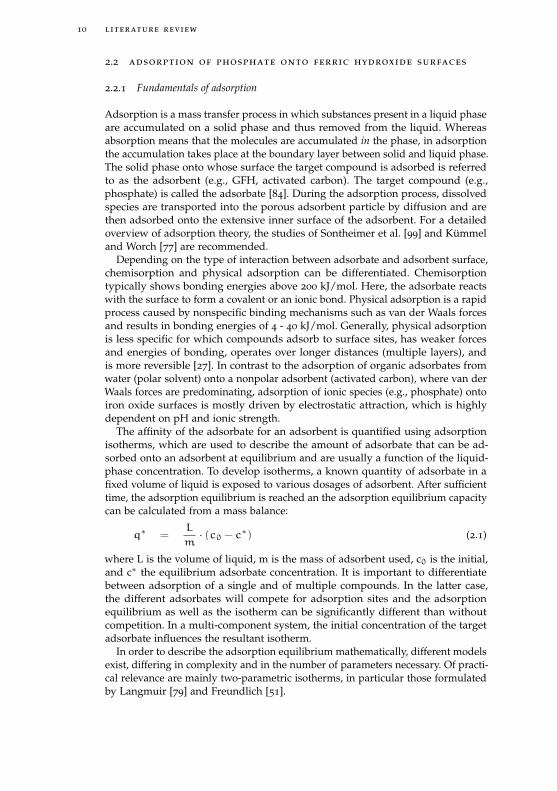
Adsorption is a mass transfer process in which substances present in a liquid phaseare accumulated on a solid phase and thus removed from the liquid. Whereasabsorption means that the molecules are accumulated in the phase, in adsorptionthe accumulation takes place at the boundary layer between solid and liquid phase.The solid phase onto whose surface the target compound is adsorbed is referredto as the adsorbent (e.g., GFH, activated carbon). The target compound (e.g.,phosphate) is called the adsorbate [84]. During the adsorption process, dissolvedspecies are transported into the porous adsorbent particle by diffusion and arethen adsorbed onto the extensive inner surface of the adsorbent. For a detailedoverview of adsorption theory, the studies of Sontheimer et al. [99] and Kümmeland Worch [77] are recommended.
Depending on the type of interaction between adsorbate and adsorbent surface,chemisorption and physical adsorption can be differentiated. Chemisorptiontypically shows bonding energies above 200 kJ/mol. Here, the adsorbate reactswith the surface to form a covalent or an ionic bond. Physical adsorption is a rapidprocess caused by nonspecific binding mechanisms such as van der Waals forcesand results in bonding energies of 4 - 40 kJ/mol. Generally, physical adsorptionis less specific for which compounds adsorb to surface sites, has weaker forcesand energies of bonding, operates over longer distances (multiple layers), andis more reversible [27]. In contrast to the adsorption of organic adsorbates fromwater (polar solvent) onto a nonpolar adsorbent (activated carbon), where van derWaals forces are predominating, adsorption of ionic species (e.g., phosphate) ontoiron oxide surfaces is mostly driven by electrostatic attraction, which is highlydependent on pH and ionic strength.
The affinity of the adsorbate for an adsorbent is quantified using adsorptionisotherms, which are used to describe the amount of adsorbate that can be ad-sorbed onto an adsorbent at equilibrium and are usually a function of the liquid-phase concentration. To develop isotherms, a known quantity of adsorbate in afixed volume of liquid is exposed to various dosages of adsorbent. After sufficienttime, the adsorption equilibrium is reached an the adsorption equilibrium capacitycan be calculated from a mass balance:
q∗ =L
m· (c0 − c∗) (2.1)
where L is the volume of liquid, m is the mass of adsorbent used, c0 is the initial,and c∗ the equilibrium adsorbate concentration. It is important to differentiatebetween adsorption of a single and of multiple compounds. In the latter case,the different adsorbates will compete for adsorption sites and the adsorptionequilibrium as well as the isotherm can be significantly different than withoutcompetition. In a multi-component system, the initial concentration of the targetadsorbate influences the resultant isotherm.
In order to describe the adsorption equilibrium mathematically, different modelsexist, differing in complexity and in the number of parameters necessary. Of practi-cal relevance are mainly two-parametric isotherms, in particular those formulatedby Langmuir [79] and Freundlich [51].
2.2 adsorption of phosphate onto ferric hydroxide surfaces 11
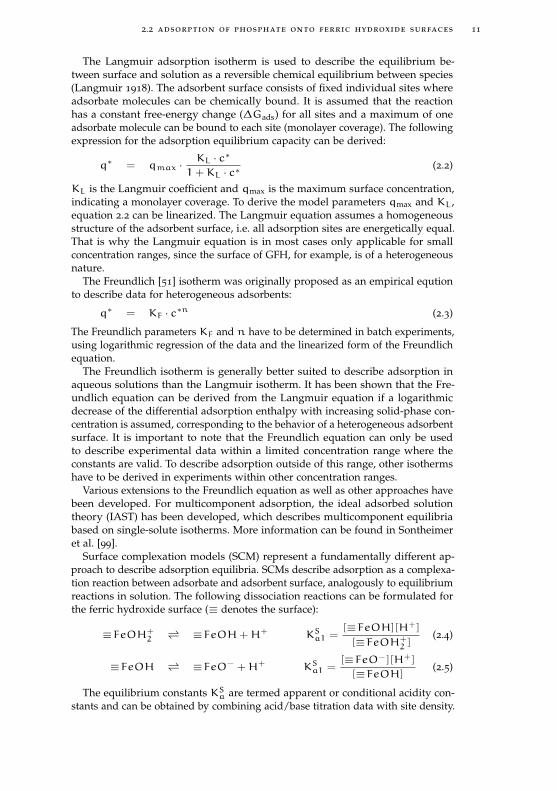
The Langmuir adsorption isotherm is used to describe the equilibrium be-tween surface and solution as a reversible chemical equilibrium between species(Langmuir 1918). The adsorbent surface consists of fixed individual sites whereadsorbate molecules can be chemically bound. It is assumed that the reactionhas a constant free-energy change (∆Gads) for all sites and a maximum of oneadsorbate molecule can be bound to each site (monolayer coverage). The followingexpression for the adsorption equilibrium capacity can be derived:
q∗ = qmax ·KL · c∗
1+KL · c∗(2.2)
KL is the Langmuir coefficient and qmax is the maximum surface concentration,indicating a monolayer coverage. To derive the model parameters qmax and KL,equation 2.2 can be linearized. The Langmuir equation assumes a homogeneousstructure of the adsorbent surface, i.e. all adsorption sites are energetically equal.That is why the Langmuir equation is in most cases only applicable for smallconcentration ranges, since the surface of GFH, for example, is of a heterogeneousnature.
The Freundlich [51] isotherm was originally proposed as an empirical equtionto describe data for heterogeneous adsorbents:
q∗ = KF · c∗n (2.3)
The Freundlich parameters KF and n have to be determined in batch experiments,using logarithmic regression of the data and the linearized form of the Freundlichequation.
The Freundlich isotherm is generally better suited to describe adsorption inaqueous solutions than the Langmuir isotherm. It has been shown that the Fre-undlich equation can be derived from the Langmuir equation if a logarithmicdecrease of the differential adsorption enthalpy with increasing solid-phase con-centration is assumed, corresponding to the behavior of a heterogeneous adsorbentsurface. It is important to note that the Freundlich equation can only be usedto describe experimental data within a limited concentration range where theconstants are valid. To describe adsorption outside of this range, other isothermshave to be derived in experiments within other concentration ranges.
Various extensions to the Freundlich equation as well as other approaches havebeen developed. For multicomponent adsorption, the ideal adsorbed solutiontheory (IAST) has been developed, which describes multicomponent equilibriabased on single-solute isotherms. More information can be found in Sontheimeret al. [99].
Surface complexation models (SCM) represent a fundamentally different ap-proach to describe adsorption equilibria. SCMs describe adsorption as a complexa-tion reaction between adsorbate and adsorbent surface, analogously to equilibriumreactions in solution. The following dissociation reactions can be formulated forthe ferric hydroxide surface (≡ denotes the surface):
≡FeOH+2
⇀↽ ≡FeOH+H+ KSa1 =[≡FeOH][H+]
[≡FeOH+2 ]
(2.4)
≡FeOH ⇀↽ ≡FeO− +H+ KSa1 =[≡FeO−][H+]
[≡FeOH](2.5)
The equilibrium constants KSa are termed apparent or conditional acidity con-stants and can be obtained by combining acid/base titration data with site density.
12 literature review
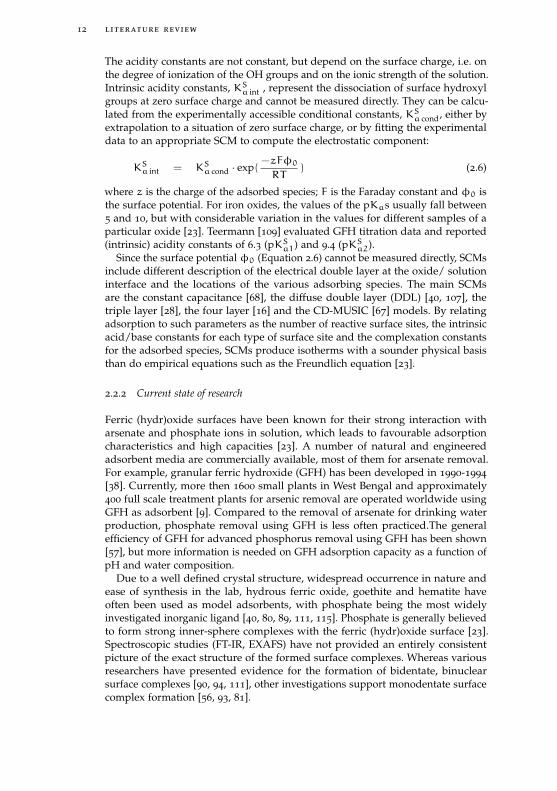
The acidity constants are not constant, but depend on the surface charge, i.e. onthe degree of ionization of the OH groups and on the ionic strength of the solution.Intrinsic acidity constants, KSa int , represent the dissociation of surface hydroxylgroups at zero surface charge and cannot be measured directly. They can be calcu-lated from the experimentally accessible conditional constants, KSa cond, either byextrapolation to a situation of zero surface charge, or by fitting the experimentaldata to an appropriate SCM to compute the electrostatic component:
KSa int = KSa cond · exp(−zFφ0RT
) (2.6)
where z is the charge of the adsorbed species; F is the Faraday constant and φ0 isthe surface potential. For iron oxides, the values of the pKas usually fall between5 and 10, but with considerable variation in the values for different samples of aparticular oxide [23]. Teermann [109] evaluated GFH titration data and reported(intrinsic) acidity constants of 6.3 (pKSa1) and 9.4 (pKSa2).
Since the surface potentialφ0 (Equation 2.6) cannot be measured directly, SCMsinclude different description of the electrical double layer at the oxide/ solutioninterface and the locations of the various adsorbing species. The main SCMsare the constant capacitance [68], the diffuse double layer (DDL) [40, 107], thetriple layer [28], the four layer [16] and the CD-MUSIC [67] models. By relatingadsorption to such parameters as the number of reactive surface sites, the intrinsicacid/base constants for each type of surface site and the complexation constantsfor the adsorbed species, SCMs produce isotherms with a sounder physical basisthan do empirical equations such as the Freundlich equation [23].
2.2.2 Current state of research
Ferric (hydr)oxide surfaces have been known for their strong interaction witharsenate and phosphate ions in solution, which leads to favourable adsorptioncharacteristics and high capacities [23]. A number of natural and engineeredadsorbent media are commercially available, most of them for arsenate removal.For example, granular ferric hydroxide (GFH) has been developed in 1990-1994
[38]. Currently, more then 1600 small plants in West Bengal and approximately400 full scale treatment plants for arsenic removal are operated worldwide usingGFH as adsorbent [9]. Compared to the removal of arsenate for drinking waterproduction, phosphate removal using GFH is less often practiced.The generalefficiency of GFH for advanced phosphorus removal using GFH has been shown[57], but more information is needed on GFH adsorption capacity as a function ofpH and water composition.
Due to a well defined crystal structure, widespread occurrence in nature andease of synthesis in the lab, hydrous ferric oxide, goethite and hematite haveoften been used as model adsorbents, with phosphate being the most widelyinvestigated inorganic ligand [40, 80, 89, 111, 115]. Phosphate is generally believedto form strong inner-sphere complexes with the ferric (hydr)oxide surface [23].Spectroscopic studies (FT-IR, EXAFS) have not provided an entirely consistentpicture of the exact structure of the formed surface complexes. Whereas variousresearchers have presented evidence for the formation of bidentate, binuclearsurface complexes [90, 94, 111], other investigations support monodentate surfacecomplex formation [56, 93, 81].
2.3 breakthrough prediction of fixed-bed adsorbers 13
Due to the specific binding at the ferric (hydr)oxide surface, phosphate is astrong competitor for other anions. Phosphate has been shown to suppress theadsorption of arsenate [69, 82], sulfate [54] and NOM [56]. The presence of cationsin solution may affect phosphate adsorption i) directly, through the formation ofternary surface complexes and ii) indirectly by changing the electrostatic propertiesof the surface. Calcium has been shown to improve phosphate adsorption ontoferric (hydr)oxide surfaces. Yao and Millero [129] used the triple layer model todescribe adsorption of phosphate on manganese dioxide in seawater. The enhancedphosphate adsorption in the presence of calcium could not be described withthe model and the postulated surface complexes. It was concluded that calcium-phosphate species might be adsorbed at the surface and ternary surface complexeswere suggested. Gao and Mucci [53] reported that competitive adsorption ofphosphate in seawater could be predicted using the constant capacitance modelwith the inclusion of ternary complexes. The addition of calcium was found toincrease adsorption on the goethite surface, slightly at pH < 8.5 and extensivelyat pH > 9. However, there is no consensus about the formation of ternary calciumphosphate surface complexes. Rietra et al. [94] studied the simultaneous adsorptionof phosphate and calcium on goethite and modeled the data with CD-MUSIC.They conclude that no ternary complexes were formed, but that the increase wasdue to electrostatic effects.
Despite the abundance of literature on phosphate adsorption onto ferric hydrox-ide surfaces, only very few studies are available on akaganeite or GFH. Chitrakaret al. [19] studied adsorption from seawater onto synthetic akaganeite and goethiteand reported high affinities and selectivity towards phosphate. The formation ofinner-sphere complexes was concluded. Deliyanni et al. [29] synthesized nanocrys-talline akaganeite and reported high capacities for phosphate. FT-IR spectroscopyrevealed the inner-sphere complex formation and indications for a monodentate,mononuclear Fe-P surface complex. Recently, Genz [56] proposed to describephosphate adsorption onto GFH by three mononuclear surface complexes, whichhad earlier been proposed for the adsorption of phosphate onto goethite [93]:
≡FeOH+PO3−4 + 3H+ ⇀↽ ≡FePO4H2 +H2O (2.7)
≡FeOH+PO3−4 + 2H+ ⇀↽ ≡FePO4H− +H2O (2.8)
≡FeOH+PO3−4 +H+ ⇀↽ ≡FePO2−4 +H2O (2.9)
Whereas the phosphate adsorption capacity is essentially the same per unitsurface area for synthetic and natural goethites, there is no clear correlationbetween surface area and phosphate adsorption capacity for hematite. It has beenfound that adsorption capacity depends on crystal morphology [23]. Given the factthat GFH is a commercial adsorbent media and only poorly crystallized, variationsin capacity due to material inhomogeneity cannot be ruled out.
2.3 breakthrough prediction of fixed-bed adsorbers
In water and wastewater treatment, granular adsorbents are commonly appliedin fixed-bed columns. One critical aspect of the design of a fixed-bed adsorberinvolves characterization of the effluent concentration profile as a function ofthroughput (i.e., the volume processed or the time of operation). This profile, com-monly termed the breakthrough curve (BTC), represents the specific combination
14 literature review
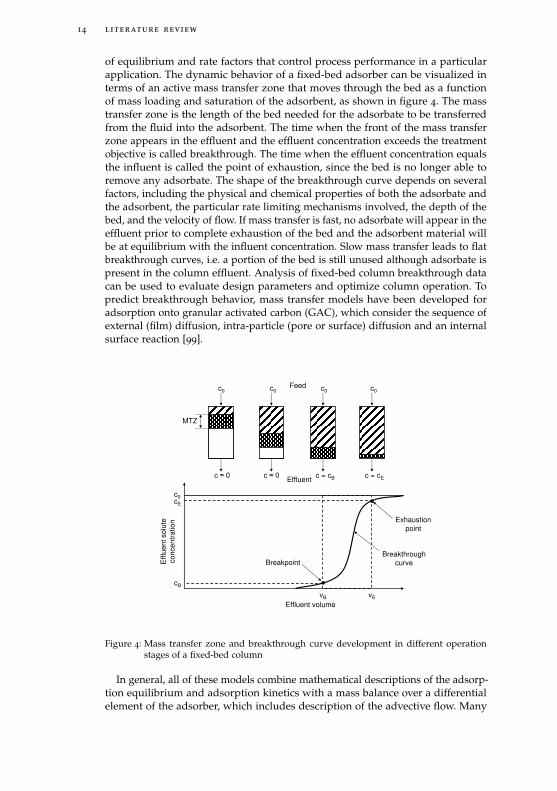
of equilibrium and rate factors that control process performance in a particularapplication. The dynamic behavior of a fixed-bed adsorber can be visualized interms of an active mass transfer zone that moves through the bed as a functionof mass loading and saturation of the adsorbent, as shown in figure 4. The masstransfer zone is the length of the bed needed for the adsorbate to be transferredfrom the fluid into the adsorbent. The time when the front of the mass transferzone appears in the effluent and the effluent concentration exceeds the treatmentobjective is called breakthrough. The time when the effluent concentration equalsthe influent is called the point of exhaustion, since the bed is no longer able toremove any adsorbate. The shape of the breakthrough curve depends on severalfactors, including the physical and chemical properties of both the adsorbate andthe adsorbent, the particular rate limiting mechanisms involved, the depth of thebed, and the velocity of flow. If mass transfer is fast, no adsorbate will appear in theeffluent prior to complete exhaustion of the bed and the adsorbent material willbe at equilibrium with the influent concentration. Slow mass transfer leads to flatbreakthrough curves, i.e. a portion of the bed is still unused although adsorbate ispresent in the column effluent. Analysis of fixed-bed column breakthrough datacan be used to evaluate design parameters and optimize column operation. Topredict breakthrough behavior, mass transfer models have been developed foradsorption onto granular activated carbon (GAC), which consider the sequence ofexternal (film) diffusion, intra-particle (pore or surface) diffusion and an internalsurface reaction [99].
Effl
uent
solu
teco
ncen
trat
ion
Effluent volume
c0cE
cB
vEvB
Breakpoint
Exhaustionpoint
Breakthroughcurve
c0c0 c0c0
c = cEc = cBc ≈ 0c ≈ 0
Feed
Effluent
MTZ
Figure 4: Mass transfer zone and breakthrough curve development in different operationstages of a fixed-bed column
In general, all of these models combine mathematical descriptions of the adsorp-tion equilibrium and adsorption kinetics with a mass balance over a differentialelement of the adsorber, which includes description of the advective flow. Many

2.3 breakthrough prediction of fixed-bed adsorbers 15
of these models describe adsorption kinetics as a combination of external filmdiffusion and intra-particle diffusion and are hence called dual-resistance models.Usually, fixed-bed models consist of a set of partial differential equations which,depending on their complexity, have to be solved either analytically or numerically.Table 3 shows available models to describe the dynamic behavior of fixed-bedcolumns and their main characteristics. According to Sontheimer et al. [99], theplug-flow homogeneous surface diffusion model (HSDM) is the most appropriatechoice for single components of small molecular weight, since pore diffusion isusually a small part of the intraparticle mass transport flux and axial dispersion isunimportant for typical adsorber operation. In this work, the HSDM and two of itsderivatives, the constant pattern homogeneous surface diffusion model (CPHSDM)and the linear driving force model (LDF) are tested on their applicability forbreakthrough prediction of GFH fixed-bed adsorbers. These models were chosenfor their good documentation, reports on successful breakthrough curve modelingas well as for available simulation software [99, 64, 127]. The HSDM neglectsdispersion as relevant mass-transfer step, which is reasonable considering flowrates of 5 - 20 m/h in GFH application [122]. For intraparticle diffusion, onlysurface diffusion was included for the sake of simplicity. The PSDM, which incontrast to HSDM, describes intra-particle diffusion in the liquid-filled pores (porediffusion) and not adsorbed onto the solid-phase (surface diffusion) might also besuited to describe a GFH fixed-bed system, but is not investigated in this work.
Table 3: Fixed-bed adsorption models that describe adsorber dynamics and their specific masstransfer mechanisms modified after Sontheimer et al. [99]
Model ab-breviation
Model name Filmtrans-fer
Dis-per-sion
Surfacediffu-sion
Porediffu-sion
Other comments
HSDM(Plug-flow)Homogeneous surfacediffusion model
X X
CPHSDMConstant patternhomogeneous surfacediffusion model
X X
HSDM model solutions areapproximated;Assumptions: fullyestablished mass transferzone, favorable adsorption
HSDM/LDF
Linear driving forcemodel
X XIntraparticle diffusion isdescribed as linearrelationship
PDMPlug-flow porediffusion model
X X
PSDMPlug-flow pore andsurface diffusionmodel
X X X
DFPSDMDispersed-flow poreand surface diffusionmodel
X X X X
DFHSDMDispersed-flowhomogeneous surfacediffusion model
X X X
LEMLocal equilibriummodel
Negligible mass transferresistances; only advectionis described
16 literature review
2.3.1 Homogeneous surface diffusion model
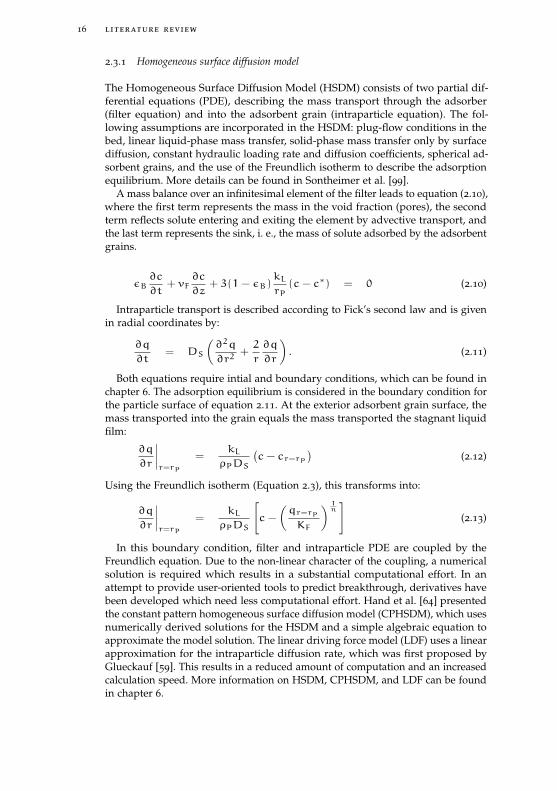
The Homogeneous Surface Diffusion Model (HSDM) consists of two partial dif-ferential equations (PDE), describing the mass transport through the adsorber(filter equation) and into the adsorbent grain (intraparticle equation). The fol-lowing assumptions are incorporated in the HSDM: plug-flow conditions in thebed, linear liquid-phase mass transfer, solid-phase mass transfer only by surfacediffusion, constant hydraulic loading rate and diffusion coefficients, spherical ad-sorbent grains, and the use of the Freundlich isotherm to describe the adsorptionequilibrium. More details can be found in Sontheimer et al. [99].
A mass balance over an infinitesimal element of the filter leads to equation (2.10),where the first term represents the mass in the void fraction (pores), the secondterm reflects solute entering and exiting the element by advective transport, andthe last term represents the sink, i. e., the mass of solute adsorbed by the adsorbentgrains.
εB∂c
∂t+ vF
∂c
∂z+ 3(1−εB)
kLrP
(c− c∗) = 0 (2.10)
Intraparticle transport is described according to Fick’s second law and is givenin radial coordinates by:
∂q
∂t= DS
(∂2q
∂r2+2
r
∂q
∂r
). (2.11)
Both equations require intial and boundary conditions, which can be found inchapter 6. The adsorption equilibrium is considered in the boundary condition forthe particle surface of equation 2.11. At the exterior adsorbent grain surface, themass transported into the grain equals the mass transported the stagnant liquidfilm:
∂q
∂r
∣∣∣∣r=rP
=kLρPDS
(c− cr=rP
)(2.12)
Using the Freundlich isotherm (Equation 2.3), this transforms into:
∂q
∂r
∣∣∣∣r=rP
=kLρPDS
[c−
(qr=rPKF
) 1n
](2.13)
In this boundary condition, filter and intraparticle PDE are coupled by theFreundlich equation. Due to the non-linear character of the coupling, a numericalsolution is required which results in a substantial computational effort. In anattempt to provide user-oriented tools to predict breakthrough, derivatives havebeen developed which need less computational effort. Hand et al. [64] presentedthe constant pattern homogeneous surface diffusion model (CPHSDM), which usesnumerically derived solutions for the HSDM and a simple algebraic equation toapproximate the model solution. The linear driving force model (LDF) uses a linearapproximation for the intraparticle diffusion rate, which was first proposed byGlueckauf [59]. This results in a reduced amount of computation and an increasedcalculation speed. More information on HSDM, CPHSDM, and LDF can be foundin chapter 6.
2.3 breakthrough prediction of fixed-bed adsorbers 17
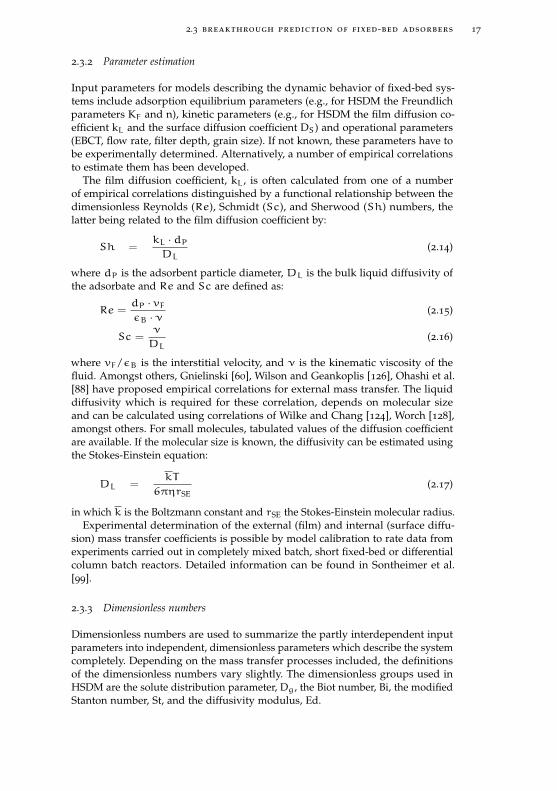
2.3.2 Parameter estimation
Input parameters for models describing the dynamic behavior of fixed-bed sys-tems include adsorption equilibrium parameters (e.g., for HSDM the Freundlichparameters KF and n), kinetic parameters (e.g., for HSDM the film diffusion co-efficient kL and the surface diffusion coefficient DS) and operational parameters(EBCT, flow rate, filter depth, grain size). If not known, these parameters have tobe experimentally determined. Alternatively, a number of empirical correlationsto estimate them has been developed.
The film diffusion coefficient, kL, is often calculated from one of a numberof empirical correlations distinguished by a functional relationship between thedimensionless Reynolds (Re), Schmidt (Sc), and Sherwood (Sh) numbers, thelatter being related to the film diffusion coefficient by:
Sh =kL ·dPDL
(2.14)
where dP is the adsorbent particle diameter,DL is the bulk liquid diffusivity ofthe adsorbate and Re and Sc are defined as:
Re =dP · vFεB ·ν
(2.15)
Sc =ν
DL(2.16)
where vF/εB is the interstitial velocity, and ν is the kinematic viscosity of thefluid. Amongst others, Gnielinski [60], Wilson and Geankoplis [126], Ohashi et al.[88] have proposed empirical correlations for external mass transfer. The liquiddiffusivity which is required for these correlation, depends on molecular sizeand can be calculated using correlations of Wilke and Chang [124], Worch [128],amongst others. For small molecules, tabulated values of the diffusion coefficientare available. If the molecular size is known, the diffusivity can be estimated usingthe Stokes-Einstein equation:
DL =kT
6πηrSE(2.17)
in which k is the Boltzmann constant and rSE the Stokes-Einstein molecular radius.Experimental determination of the external (film) and internal (surface diffu-
sion) mass transfer coefficients is possible by model calibration to rate data fromexperiments carried out in completely mixed batch, short fixed-bed or differentialcolumn batch reactors. Detailed information can be found in Sontheimer et al.[99].
2.3.3 Dimensionless numbers
Dimensionless numbers are used to summarize the partly interdependent inputparameters into independent, dimensionless parameters which describe the systemcompletely. Depending on the mass transfer processes included, the definitionsof the dimensionless numbers vary slightly. The dimensionless groups used inHSDM are the solute distribution parameter, Dg, the Biot number, Bi, the modifiedStanton number, St, and the diffusivity modulus, Ed.
18 literature review
The solute distribution parameter, Dg, is defined as the ratio of the mass ofadsorbate in the solid phase to the mass of adsorbate in the liquid phase underequilibrium conditions:
Dg =ρBq0εBc0
(2.18)
The Biot number compares the external mass transfer rate to the internal masstransfer rate:
Bi =kLrPc0DSρPqo
(2.19)
The Stanton number relates the solute liquid phase mass transfer rate to thesolute mass transfer rate by advection:
St =kLm
rPρPQ(2.20)
The diffusivity modulus, Ed, is equal to the ratio of St to Bi and represents theratio of the solute transfer rate by intraparticle diffusion to the solute transfer rateby advection:
Ed =St
Bi=DSDgτ
r2P(2.21)
where τ is the packed-bed contact time of the column. For constant patternconditions, the mass transfer zone will remain constant in shape as it movesthrough the fixed-bed after it is established. In this case, Ed and St can be viewedas measures of bed length relative to the length of the mass transfer zone [64].
2.3.4 Rapid small-scale column tests
An alternative procedure to predict breakthrough curves are rapid small-scalecolumn tests (RSSCT), which have been developed for the adsorption of organicmicropollutants onto GAC [26, 25, 24]. In the RSSCT concept, the dispersed-flowhomogeneous pore surface diffusion model (Table 3) is used to scale down thefull-scale adsorber to a RSSCT and maintain perfect similarity between RSSCT andfull-scale performance, i.e. identical breakthrough curves. This can be achieved bysetting the dimensionless groups that describe mass transfer and adsorption inthe small-scale column equal to those for the large scale column.
The relationship between the empty-bed contact time of the full-scale column(EBCTLC) and the empty-bed contact time of the RSSCT column (EBCTSC) isobtained by equating the diffusivity modulus of the full-scale column and theRSSCT:
EdSC = EdLC (2.22)
Using the dimensionless number definition (Equation 2.21), this equation canbe solved for the ratio of the packed-bed contact times of full-scale and RSSCTcolumn, τSC/τLC:
τSCτLC
=
(rP,SC
rP,LC
)2·(DS,LC
DS,SC
)(2.23)
2.4 regeneration 19
Under the assumption that the adsorption capacity and physical properties of theadsorbents and bed do not depend on particle size, the RSSCT scaling equationsfor EBCT can be obtained. Specifically, the solute distribution parameter, Dg,is assumed to be constant in the RSSCT and full-scale processes, which is onlyvalid if equilibirum capacity, bed void fractions, particle densities, and influentconcentrations are equal. Different scaling equations are used, depending on whichassumption is made about the effective surface diffusivity. The constant diffusivity(CD) approach is used when the effective surface diffusivity is independent ofparticle size, and hence identical for full-scale and RSSCT columns and it follows:
EBCTSCEBCTLC
=τSC/ε
τLC/ε=
(rP,SC
rP,LC
)2(2.24)
The proportional diffusivity (PD) approach assumes that the effective surfacediffusivity is linearly proportional to the particle radius, and surface diffusion isthe controlling mechanism. The scaling equation is:
EBCTSCEBCTLC
=rP,SC
rP,LC(2.25)
The scaling equation for hydraulic loading is obtained by equating the Stantonnumbers of the full-scale column and the RSSCT, which leads to:
vF,SC
vF,LC=
rP,LC
rP,SC(2.26)
If the PD approach is used, the from equation 2.26 resulting design requires thelength of the RSSCT to be equal to the length of the full-scale process, whichmight be undesirable in terms of head-loss and necessary total influent volume. Alower hydraulic loading rate can be chosen, as long as the effects of dispersionsare limited, which is the case if Re · Sc is in the mechanical dispersion regionfrom 200 to 200,000 [26]. The resulting scaling equation is:
vF,SC
vF,LC=
rP,LC
rP,SC·ReSC, min
ReLC(2.27)
Since RSSCTs use a smaller adsorbent grain size and column diameter it ispossible to perform RSSCTs in a fraction of the time, and with a fraction of thewater used in pilot studies. It has been shown that RSSCTs provide a powerfulalternative to both modeling as well as time-consuming laboratory and pilotstudies of GFH fixed-bed columns. The CD approach has been found to be moresuitable for GFH adsorption than the alternative proportional diffusivity approach[101].
2.4 regeneration
If adsorption is thought of as surface complexation reaction (Equation 2.7- 2.9),a high concentration of OH− ions shifts the equilibrium so that less adsorbate isbound to the surface. Also the surface acid/base reaction is shifted more towardsnegatively charged species, which hinders adsorption of anions such as phosphate.Consequently, a pH increase due to the use of caustic agents such as NaOH shiftsthe adsorption equilibrium and can result in desorption of the adsorbed solute.If the adsorption capacity can be regained in this process, the adsorbent will beregenerated.
20 literature review
In several studies, sodium hydroxide (NaOH) solution has been shown assuitable regenerant for metal oxide adsorbents as well as hybrid anion exchangeresins: Donnert and Salecker [33] reported regeneration of activated aluminafor phosphate adsorption by 0.5 M NaOH. Zhu and Jyo [131] used a zirconiumloaded phosphoric acid chelating resin for phosphate removal. More than 90 %of the removed phosphate could be eluted within 20 bed volumes using 0.5 MNaOH. Phosphate adsorption behaviour was not adversely affected by repeatedadsorption/desorption cycles. Chitrakar et al. [19] used synthetic akaganeitefor selective phosphate adsorption from seawater and regenerated with 0.1 MNaOH. Almost no loss in capacity after up to 12 adsorption/ desorption cycleswas reported. Recently developed hybrid anion exchangers containing hydratedferric oxide nanoparticles were reported to remove phosphate and showed muchhigher capacities than the parent material [14, 83]. Solutions of 2 - 4 % (0.5 - 1 M)NaOH and 2 % NaCl were found very effective to desorb phosphate and > 95 %phosphate was desorbed after 12 bed volumes of regenerant [83]. Genz et al.[57] studied phosphate adsorption from MBR effluents onto GFH and activatedalumina followed by regeneration with 0.6 M NaOH and reported no decreasein capacity after three adsorption/ desorption cycles. A high regenerant to bedvolume ratio (100 : 1) was used and a non-desorbable P fraction was supposed inlong-term operation.
3P H O S P H AT E A D S O R P T I O N O N T O G R A N U L A R F E R R I CH Y D R O X I D E : I S O T H E R M A N D F I X E D - B E D C O L U M NS T U D I E S
Alexander Sperlich1 and Martin Jekel1
as prepared for Water Science & Technology
abstract
Adsorption of phosphate in artificial model solutions, natural and waste watersonto granular ferric hydroxide (GFH) was studied in batch and fixed-bed columnexperiments. Physical characterization and grain size analysis of the adsorbentmedia reveal high specific surface areas independent of grain size and variationsof density and water content over the different grain size fractions. Equilibriumisotherms show that phosphate adsorption is strongly pH dependent. High capaci-ties of up to 24 mg/g P (at pH 6 and an equilibrium concentration of 2 mg/L P) canbe reached. Presence of calcium was shown to improve adsorption of phosphate.This is supposed to be the reason for higher capacities in waste and drinking wateras compared to DI water and membrane concentrates. Two alternative commer-cially available adsorbents (FerroSorp and Bayoxide E33) were tested and showedapprox. only 50 % of the capacity of GFH at pH 7. Rapid small-scale column tests(RSSCTs) were shown to be a useful tool for simulation of fixed-bed columns.Isotherm results can be used to provide a rough estimation of operation time, i.e.the ideal breakthrough point of a fixed-bed column, but are of limited use dueto the strong influence of mass transfer on the shape of the breakthrough curve.RSSCT using different empty-bed contact times show that phosphate adsorptionkinetics onto GFH are very slow and result in asymptotically shaped breakthroughcurves. Analysis of breakthrough data proves that operation of two GFH beds inseries can contribute to a more efficient use of the adsorbent.
3.1 introduction
3.1.1 Aim of the study
Ferric (hydr)oxide surfaces have been known for their strong interaction witharsenate and phosphate ions in solution, which leads to favourable adsorptioncharacteristics and high capacities [23]. A number of natural and engineeredadsorbent media are commercially available, most of them for arsenate removal.For example, granular ferric hydroxide (GFH) has been developed in 1990 - 1994
[38]. Currently, more then 1600 small plants in West Bengal and approximately400 full scale treatment plants for arsenic removal are operated worldwide usingGFH as adsorbent [9]. Compared to the removal of arsenate for drinking water
1 Technische Universität Berlin
21
22 paper 1 , prepared for water science & technology
production, phosphate removal using GFH is less often practiced. Phosphorusneeds to be removed from waste waters to prevent the eutrophication of thereceiving surface water bodies. Therefore techniques such as chemical precipitationand biological phosphorus removal are employed in most cases. Compared to thesetechniques, adsorption might be used to reach very low effluent concentrations inspecial applications, where sufficient dilution of the water cannot be guaranteed(e.g., water reuse applications, surface water restoration). The general efficiencyof GFH for advanced phosphorus removal has been shown [57, 104], but moreinformation is needed on GFH adsorption capacity as a function of pH and watercomposition. The objective of this study is to quantify the adsorption capacity ofGFH for phosphate removal, to assess the competitive adsorption in natural watersand waste waters and to identify the major functions of adsorption capacity.
3.1.2 Fixed-bed column studies
The effluent concentration profile of a fixed-bed column is known as breakthroughcurve and provides information on operation time and thus adsorption equilibrium.However, the shape of the breakthrough curve is influenced by mass transfer. Ifmass transfer is fast, no adsorbate will appear in the effluent prior to completeexhaustion of the bed and the adsorbent material will be at equilibrium with theinfluent concentration. Slow mass transfer leads to flat breakthrough curves, i.e.a portion of the bed is still unused although adsorbate is present in the columneffluent. Analysis of fixed-bed column breakthrough data can be used to evaluatedesign parameters and optimize column operation.
To predict breakthrough behavior, mass transfer models have been developedfor adsorption onto granular activated carbon (GAC), which consider the sequenceof external (film) diffusion, intra-particle (pore or surface) diffusion and an internalsurface reaction [99]. It has been shown that these models can be used for GFHadsorption [103]. Besides isotherm parameters such as the Freundlich constants(KF and n), these models require the input of mass transfer coefficients, which haveto be experimentally determined. Intra-particle diffusion into the GFH grains wasfound to be very slow, resulting in an asymptotic shape of the breakthrough curveand limited applicability of simplified mass transfer models [103]. An alternativeprocedure to predict breakthrough curves are rapid small-scale column tests(RSSCT), which have been developed for the adsorption of organic micropollutantsonto GAC [26]. In the RSSCT concept, mathematical models are used to scale downthe full-scale adsorber to a RSSCT and maintain perfect similarity between RSSCTand full-scale performance, i.e. identical breakthrough curves. This can be achievedby setting the dimensionless groups that describe mass transfer and adsorption inthe small-scale column equal to those for the large scale column. Since RSSCTsuse a smaller adsorbent grain size and column diameter it is possible to performRSSCTs in a fraction of the time, and with a fraction of the water used in pilotstudies. It has been shown that RSSCTs provide a powerful alternative to bothmodeling as well as time-consuming laboratory and pilot studies of GFH fixed-bedcolumns [101]. In this study, RSSCTs were used to test the breakthrough behaviorof phosphate in different model waters and waste waters. RSSCTs were also usedto evaluate specific design variables, such as empty-bed contact time (EBCT) andbed operation in series. For scaling RSSCTs, the effective surface diffusivity wasassumed to be independent of particle size. This constant diffusivity approach
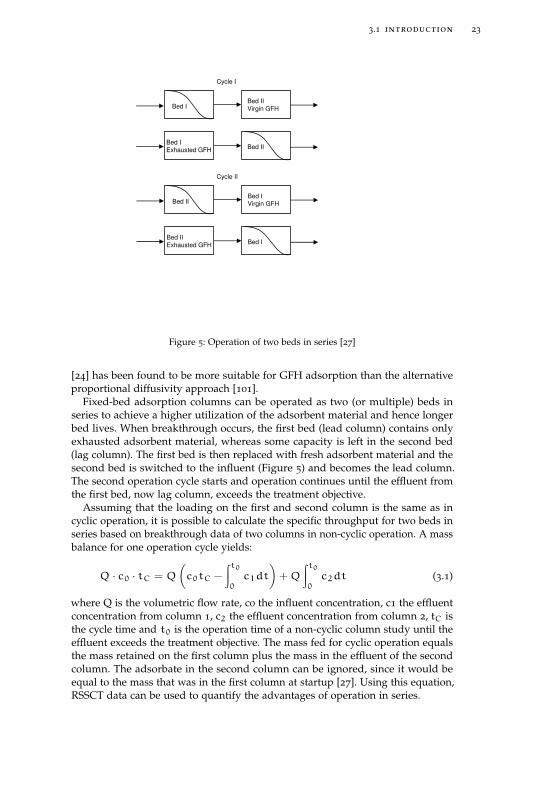
3.1 introduction 23
Bed IBed IIVirgin GFH
Bed IExhausted GFH Bed II
Bed IIBed IVirgin GFH
Bed IIExhausted GFH Bed I
Cycle I
Cycle II
Figure 5: Operation of two beds in series [27]
[24] has been found to be more suitable for GFH adsorption than the alternativeproportional diffusivity approach [101].
Fixed-bed adsorption columns can be operated as two (or multiple) beds inseries to achieve a higher utilization of the adsorbent material and hence longerbed lives. When breakthrough occurs, the first bed (lead column) contains onlyexhausted adsorbent material, whereas some capacity is left in the second bed(lag column). The first bed is then replaced with fresh adsorbent material and thesecond bed is switched to the influent (Figure 5) and becomes the lead column.The second operation cycle starts and operation continues until the effluent fromthe first bed, now lag column, exceeds the treatment objective.
Assuming that the loading on the first and second column is the same as incyclic operation, it is possible to calculate the specific throughput for two beds inseries based on breakthrough data of two columns in non-cyclic operation. A massbalance for one operation cycle yields:
Q · c0 · tC =Q
(c0tC −
∫t00c1dt
)+Q
∫t00c2dt (3.1)
where Q is the volumetric flow rate, c0 the influent concentration, c1 the effluentconcentration from column 1, c2 the effluent concentration from column 2, tC isthe cycle time and t0 is the operation time of a non-cyclic column study until theeffluent exceeds the treatment objective. The mass fed for cyclic operation equalsthe mass retained on the first column plus the mass in the effluent of the secondcolumn. The adsorbate in the second column can be ignored, since it would beequal to the mass that was in the first column at startup [27]. Using this equation,RSSCT data can be used to quantify the advantages of operation in series.
24 paper 1 , prepared for water science & technology
3.2 materials and methods
3.2.1 Adsorbent media
GFH was obtained from the producer (GEH Wasserchemie, Osnabrück, Germany).GFH is a poorly crystallized iron(III) oxide-hydroxide and consists predominantlyof akaganeite (β-FeOOH). The pHPZC (point of zero charge) is reported to bebetween 7.5 and 8.0 [96, 109]. The water content was determined to be approx.45 %. A grain size distribution analysis as well as bed density measurementwas conducted according to EN 12902. Virgin GFH material was sieved in wetconditions using a set of standard testing sieves (0.2 - 2.0 mm). Particle densitywas measured by adding small amounts of GFH into a cylinder and measuringthe displacement of DI water.
FerroSorp Plus, supplied by Zeolith Umwelttechnik GmbH (Waldsassen, Ger-many), is a granular adsorbent media based on ferric hydroxide. Manufacturer’s(HeGo Biotec GmbH, Berlin, Germany) data specify a grain size range of 0.5 -2.0 mm and a water content of 10 - 15 %. An adsorption capacity for phosphate tobe reached under optimal operational conditions of 12 - 16 g/kg P is stated by themanufacturer.
Bayoxide E33 (Lanxess AG, Leverkusen, Germany) is a synthetic ferric hydrox-ide, which is goethite (β-FeOOH). Manufacturer’s specifications indicate a grainsize range of 0.5 - 2.0 mm, a water content of 20 %. A specific surface area of120 - 200 m2/g is reported.
All results are presented on a dry mass basis after drying at 105°Cfor 12 h andsubsequent cooling in a desiccator.
3.2.2 Surface area measurements
Specific surface area was determined with a Micromeritics Gemini 2360 surfacearea analyzer (Micromeritics, Norcross, GA, USA) using the BET method [17]. Allsamples were dried and degassed before analysis. The statistical measurementuncertainty was 0.5 %.
3.2.3 Batch experiments
3.2.3.1 Isotherms
Adsorption isotherms were developed using< 63 µm (ground) GFH. The air-driedmaterial which was used had a water content of approx. 22 %. For comparison,two isotherms were developed using air-dried, ground FerroSorp (water content7.3 %) and Bayoxide E33 material (water content 4.8 %).
Model solutions were prepared using de-ionized (DI) water and NaCl to set anionic strength of 10 mmol/L. Different concentrations of phosphate were set byadding KH2PO4 (analytical reagent grade chemicals).
To study the pH dependence of phosphate adsorption, different initial con-centrations (0.5 - 4 mg/L P) were used. The liquid-to-mass ratio varied in therange of 3-25 L/g. Since competitive adsorption can be neglected in these systems,variation of the L/m-ratio should lead to the same results as using different initialconcentrations. Constant pH-conditions were achieved by adding 2 mM of one
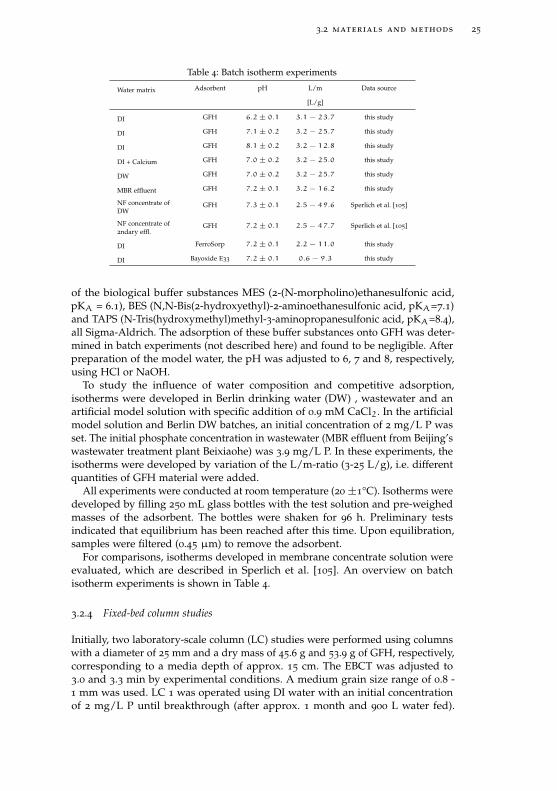
3.2 materials and methods 25
Table 4: Batch isotherm experiments
Water matrix Adsorbent pH L/m Data source
[L/g]
DI GFH 6.2±0.1 3.1 − 23.7 this study
DI GFH 7.1±0.2 3.2 − 25.7 this study
DI GFH 8.1±0.2 3.2 − 12.8 this study
DI + Calcium GFH 7.0±0.2 3.2 − 25.0 this study
DW GFH 7.0±0.2 3.2 − 25.7 this study
MBR effluent GFH 7.2±0.1 3.2 − 16.2 this study
NF concentrate ofDW
GFH 7.3±0.1 2.5 − 49.6 Sperlich et al. [105]
NF concentrate of2ndary effl.
GFH 7.2±0.1 2.5 − 47.7 Sperlich et al. [105]
DI FerroSorp 7.2±0.1 2.2 − 11.0 this study
DI Bayoxide E33 7.2±0.1 0.6 − 9.3 this study
of the biological buffer substances MES (2-(N-morpholino)ethanesulfonic acid,pKA = 6.1), BES (N,N-Bis(2-hydroxyethyl)-2-aminoethanesulfonic acid, pKA=7.1)and TAPS (N-Tris(hydroxymethyl)methyl-3-aminopropanesulfonic acid, pKA=8.4),all Sigma-Aldrich. The adsorption of these buffer substances onto GFH was deter-mined in batch experiments (not described here) and found to be negligible. Afterpreparation of the model water, the pH was adjusted to 6, 7 and 8, respectively,using HCl or NaOH.
To study the influence of water composition and competitive adsorption,isotherms were developed in Berlin drinking water (DW) , wastewater and anartificial model solution with specific addition of 0.9 mM CaCl2. In the artificialmodel solution and Berlin DW batches, an initial concentration of 2 mg/L P wasset. The initial phosphate concentration in wastewater (MBR effluent from Beijing’swastewater treatment plant Beixiaohe) was 3.9 mg/L P. In these experiments, theisotherms were developed by variation of the L/m-ratio (3-25 L/g), i.e. differentquantities of GFH material were added.
All experiments were conducted at room temperature (20±1°C). Isotherms weredeveloped by filling 250 mL glass bottles with the test solution and pre-weighedmasses of the adsorbent. The bottles were shaken for 96 h. Preliminary testsindicated that equilibrium has been reached after this time. Upon equilibration,samples were filtered (0.45 µm) to remove the adsorbent.
For comparisons, isotherms developed in membrane concentrate solution wereevaluated, which are described in Sperlich et al. [105]. An overview on batchisotherm experiments is shown in Table 4.
3.2.4 Fixed-bed column studies
Initially, two laboratory-scale column (LC) studies were performed using columnswith a diameter of 25 mm and a dry mass of 45.6 g and 53.9 g of GFH, respectively,corresponding to a media depth of approx. 15 cm. The EBCT was adjusted to3.0 and 3.3 min by experimental conditions. A medium grain size range of 0.8 -1 mm was used. LC 1 was operated using DI water with an initial concentrationof 2 mg/L P until breakthrough (after approx. 1 month and 900 L water fed).
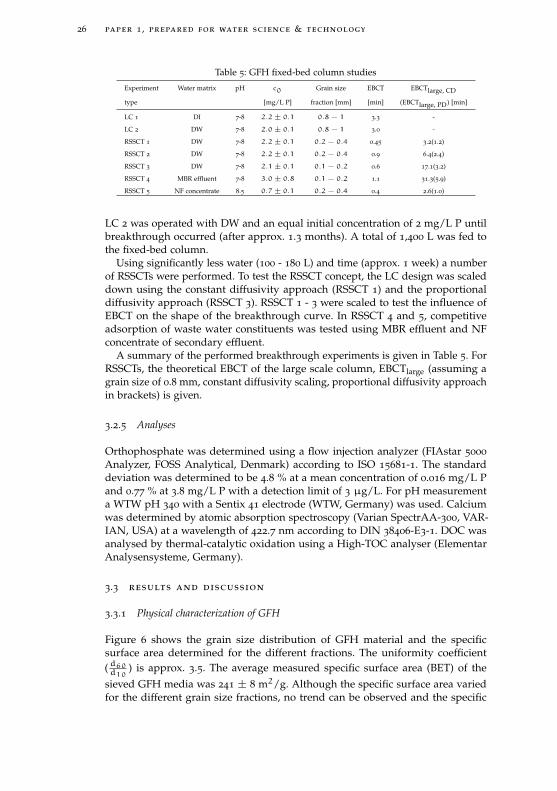
26 paper 1 , prepared for water science & technology
Table 5: GFH fixed-bed column studies
Experiment Water matrix pH c0 Grain size EBCT EBCTlarge, CD
type [mg/L P] fraction [mm] [min] (EBCTlarge, PD) [min]
LC 1 DI 7-8 2.2±0.1 0.8 − 1 3.3 -
LC 2 DW 7-8 2.0±0.1 0.8 − 1 3.0 -
RSSCT 1 DW 7-8 2.2±0.1 0.2 − 0.4 0.45 3.2(1.2)
RSSCT 2 DW 7-8 2.2±0.1 0.2 − 0.4 0.9 6.4(2.4)
RSSCT 3 DW 7-8 2.1±0.1 0.1 − 0.2 0.6 17.1(3.2)
RSSCT 4 MBR effluent 7-8 3.0±0.8 0.1 − 0.2 1.1 31.3(5.9)
RSSCT 5 NF concentrate 8.5 0.7±0.1 0.2 − 0.4 0.4 2.6(1.0)
LC 2 was operated with DW and an equal initial concentration of 2 mg/L P untilbreakthrough occurred (after approx. 1.3 months). A total of 1,400 L was fed tothe fixed-bed column.
Using significantly less water (100 - 180 L) and time (approx. 1 week) a numberof RSSCTs were performed. To test the RSSCT concept, the LC design was scaleddown using the constant diffusivity approach (RSSCT 1) and the proportionaldiffusivity approach (RSSCT 3). RSSCT 1 - 3 were scaled to test the influence ofEBCT on the shape of the breakthrough curve. In RSSCT 4 and 5, competitiveadsorption of waste water constituents was tested using MBR effluent and NFconcentrate of secondary effluent.
A summary of the performed breakthrough experiments is given in Table 5. ForRSSCTs, the theoretical EBCT of the large scale column, EBCTlarge (assuming agrain size of 0.8 mm, constant diffusivity scaling, proportional diffusivity approachin brackets) is given.
3.2.5 Analyses
Orthophosphate was determined using a flow injection analyzer (FIAstar 5000
Analyzer, FOSS Analytical, Denmark) according to ISO 15681-1. The standarddeviation was determined to be 4.8 % at a mean concentration of 0.016 mg/L Pand 0.77 % at 3.8 mg/L P with a detection limit of 3 µg/L. For pH measurementa WTW pH 340 with a Sentix 41 electrode (WTW, Germany) was used. Calciumwas determined by atomic absorption spectroscopy (Varian SpectrAA-300, VAR-IAN, USA) at a wavelength of 422.7 nm according to DIN 38406-E3-1. DOC wasanalysed by thermal-catalytic oxidation using a High-TOC analyser (ElementarAnalysensysteme, Germany).
3.3 results and discussion
3.3.1 Physical characterization of GFH
Figure 6 shows the grain size distribution of GFH material and the specificsurface area determined for the different fractions. The uniformity coefficient(d60d10
) is approx. 3.5. The average measured specific surface area (BET) of thesieved GFH media was 241 ± 8 m2/g. Although the specific surface area variedfor the different grain size fractions, no trend can be observed and the specific
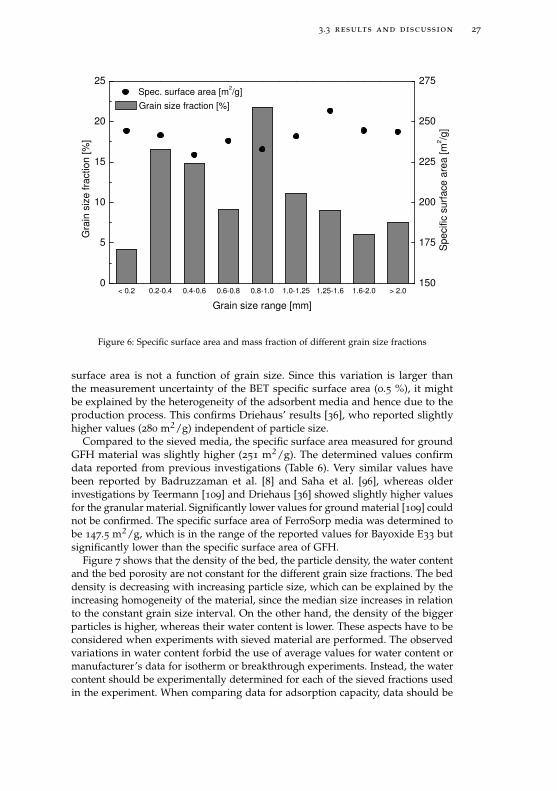
3.3 results and discussion 27
150
175
200
225
250
275
< 0.2 0.2-0.4 0.4-0.6 0.6-0.8 0.8-1.0 1.0-1.25 1.25-1.6 1.6-2.0 > 2.00
5
10
15
20
25G
rain
siz
e fr
actio
n [%
]
Grain size range [mm]
Grain size fraction [%]
Spe
cific
sur
face
are
a [m
2 /g]
Spec. surface area [m2/g]
Figure 6: Specific surface area and mass fraction of different grain size fractions
surface area is not a function of grain size. Since this variation is larger thanthe measurement uncertainty of the BET specific surface area (0.5 %), it mightbe explained by the heterogeneity of the adsorbent media and hence due to theproduction process. This confirms Driehaus’ results [36], who reported slightlyhigher values (280 m2/g) independent of particle size.
Compared to the sieved media, the specific surface area measured for groundGFH material was slightly higher (251 m2/g). The determined values confirmdata reported from previous investigations (Table 6). Very similar values havebeen reported by Badruzzaman et al. [8] and Saha et al. [96], whereas olderinvestigations by Teermann [109] and Driehaus [36] showed slightly higher valuesfor the granular material. Significantly lower values for ground material [109] couldnot be confirmed. The specific surface area of FerroSorp media was determined tobe 147.5 m2/g, which is in the range of the reported values for Bayoxide E33 butsignificantly lower than the specific surface area of GFH.
Figure 7 shows that the density of the bed, the particle density, the water contentand the bed porosity are not constant for the different grain size fractions. The beddensity is decreasing with increasing particle size, which can be explained by theincreasing homogeneity of the material, since the median size increases in relationto the constant grain size interval. On the other hand, the density of the biggerparticles is higher, whereas their water content is lower. These aspects have to beconsidered when experiments with sieved material are performed. The observedvariations in water content forbid the use of average values for water content ormanufacturer’s data for isotherm or breakthrough experiments. Instead, the watercontent should be experimentally determined for each of the sieved fractions usedin the experiment. When comparing data for adsorption capacity, data should be
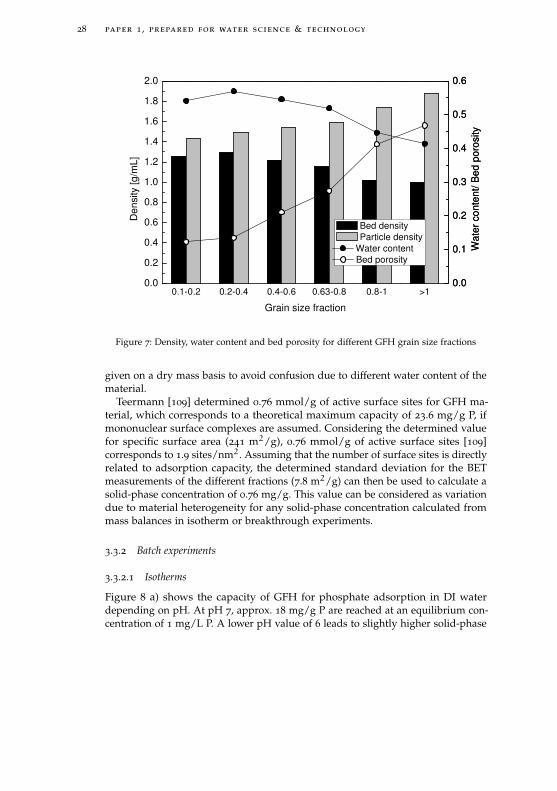
28 paper 1 , prepared for water science & technology
0.0
0.1
0.2
0.3
0.4
0.5
0.6
0.0
0.1
0.2
0.3
0.4
0.5
0.6
0.1-0.2 0.2-0.4 0.4-0.6 0.63-0.8 0.8-1 >10.0
0.2
0.4
0.6
0.8
1.0
1.2
1.4
1.6
1.8
2.0
Den
sity
[g/m
L]
Grain size fraction
Bed density Particle density
Wat
er c
onte
nt/ B
ed p
oros
ity
Bed porosity
Wat
er c
onte
nt/ B
ed p
oros
ity
Water content
Figure 7: Density, water content and bed porosity for different GFH grain size fractions
given on a dry mass basis to avoid confusion due to different water content of thematerial.
Teermann [109] determined 0.76 mmol/g of active surface sites for GFH ma-terial, which corresponds to a theoretical maximum capacity of 23.6 mg/g P, ifmononuclear surface complexes are assumed. Considering the determined valuefor specific surface area (241 m2/g), 0.76 mmol/g of active surface sites [109]corresponds to 1.9 sites/nm2. Assuming that the number of surface sites is directlyrelated to adsorption capacity, the determined standard deviation for the BETmeasurements of the different fractions (7.8 m2/g) can then be used to calculate asolid-phase concentration of 0.76 mg/g. This value can be considered as variationdue to material heterogeneity for any solid-phase concentration calculated frommass balances in isotherm or breakthrough experiments.
3.3.2 Batch experiments
3.3.2.1 Isotherms
Figure 8 a) shows the capacity of GFH for phosphate adsorption in DI waterdepending on pH. At pH 7, approx. 18 mg/g P are reached at an equilibrium con-centration of 1 mg/L P. A lower pH value of 6 leads to slightly higher solid-phase
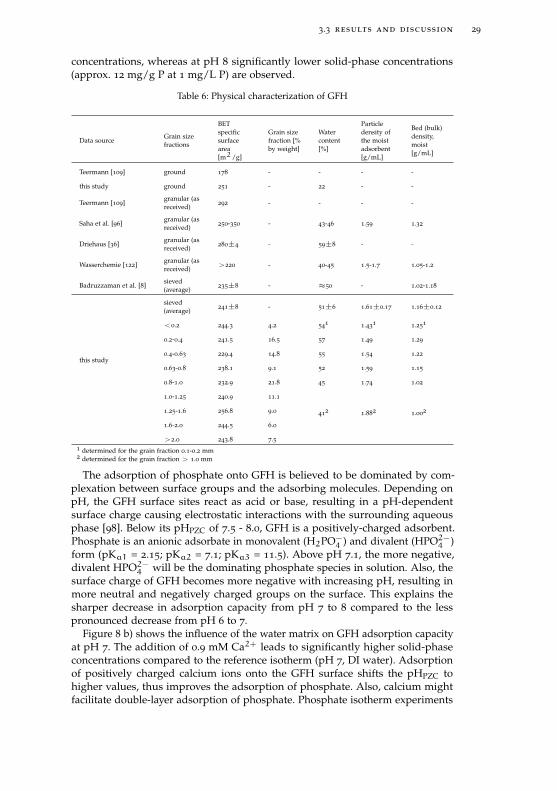
3.3 results and discussion 29
concentrations, whereas at pH 8 significantly lower solid-phase concentrations(approx. 12 mg/g P at 1 mg/L P) are observed.
Table 6: Physical characterization of GFH
Data sourceGrain sizefractions
BETspecificsurfacearea[m2/g]
Grain sizefraction [%by weight]
Watercontent[%]
Particledensity ofthe moistadsorbent[g/mL]
Bed (bulk)density,moist[g/mL]
Teermann [109] ground 178 - - - -
this study ground 251 - 22 - -
Teermann [109]granular (asreceived)
292 - - - -
Saha et al. [96]granular (asreceived)
250-350 - 43-46 1.59 1.32
Driehaus [36]granular (asreceived)
280±4 - 59±8 - -
Wasserchemie [122]granular (asreceived)
>220 - 40-45 1.5-1.7 1.05-1.2
Badruzzaman et al. [8]sieved(average)
235±8 - ≈50 - 1.02-1.18
this study
sieved(average)
241±8 - 51±6 1.61±0.17 1.16±0.12
<0.2 244.3 4.2 541
1.431
1.251
0.2-0.4 241.5 16.5 57 1.49 1.29
0.4-0.63 229.4 14.8 55 1.54 1.22
0.63-0.8 238.1 9.1 52 1.59 1.15
0.8-1.0 232.9 21.8 45 1.74 1.02
1.0-1.25 240.9 11.1
412
1.882
1.0021.25-1.6 256.8 9.0
1.6-2.0 244.5 6.0
>2.0 243.8 7.51 determined for the grain fraction 0.1-0.2 mm2 determined for the grain fraction > 1.0 mm
The adsorption of phosphate onto GFH is believed to be dominated by com-plexation between surface groups and the adsorbing molecules. Depending onpH, the GFH surface sites react as acid or base, resulting in a pH-dependentsurface charge causing electrostatic interactions with the surrounding aqueousphase [98]. Below its pHPZC of 7.5 - 8.0, GFH is a positively-charged adsorbent.Phosphate is an anionic adsorbate in monovalent (H2PO−
4 ) and divalent (HPO2−4 )form (pKa1 = 2.15; pKa2 = 7.1; pKa3 = 11.5). Above pH 7.1, the more negative,divalent HPO2−4 will be the dominating phosphate species in solution. Also, thesurface charge of GFH becomes more negative with increasing pH, resulting inmore neutral and negatively charged groups on the surface. This explains thesharper decrease in adsorption capacity from pH 7 to 8 compared to the lesspronounced decrease from pH 6 to 7.
Figure 8 b) shows the influence of the water matrix on GFH adsorption capacityat pH 7. The addition of 0.9 mM Ca2+ leads to significantly higher solid-phaseconcentrations compared to the reference isotherm (pH 7, DI water). Adsorptionof positively charged calcium ions onto the GFH surface shifts the pHPZC tohigher values, thus improves the adsorption of phosphate. Also, calcium mightfacilitate double-layer adsorption of phosphate. Phosphate isotherm experiments
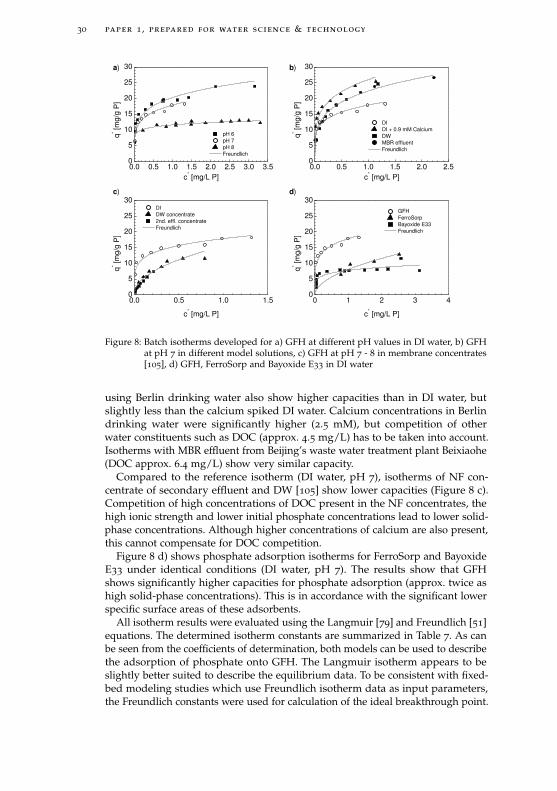
30 paper 1 , prepared for water science & technology
0.0 0.5 1.0 1.5 2.0 2.5 3.0 3.50
5
10
15
20
25
30
0.0 0.5 1.0 1.5 2.0 2.50
5
10
15
20
25
30
0.0 0.5 1.0 1.50
5
10
15
20
25
30
0 1 2 3 40
5
10
15
20
25
30c) d)
b)a)
pH 6 pH 7 pH 8 Freundlich
q* [mg/
g P
]
c* [mg/L P]
DI DI + 0.9 mM Calcium DW MBR effluent Freundlich
q* [mg/
g P
]
c* [mg/L P]
DI DW concentrate 2nd. effl. concentrate Freundlich
q* [mg/
g P
]
c* [mg/L P]
GFH FerroSorp Bayoxide E33 Freundlich
q* [mg/
g P
]
c* [mg/L P]
Figure 8: Batch isotherms developed for a) GFH at different pH values in DI water, b) GFHat pH 7 in different model solutions, c) GFH at pH 7 - 8 in membrane concentrates[105], d) GFH, FerroSorp and Bayoxide E33 in DI water
using Berlin drinking water also show higher capacities than in DI water, butslightly less than the calcium spiked DI water. Calcium concentrations in Berlindrinking water were significantly higher (2.5 mM), but competition of otherwater constituents such as DOC (approx. 4.5 mg/L) has to be taken into account.Isotherms with MBR effluent from Beijing’s waste water treatment plant Beixiaohe(DOC approx. 6.4 mg/L) show very similar capacity.
Compared to the reference isotherm (DI water, pH 7), isotherms of NF con-centrate of secondary effluent and DW [105] show lower capacities (Figure 8 c).Competition of high concentrations of DOC present in the NF concentrates, thehigh ionic strength and lower initial phosphate concentrations lead to lower solid-phase concentrations. Although higher concentrations of calcium are also present,this cannot compensate for DOC competition.
Figure 8 d) shows phosphate adsorption isotherms for FerroSorp and BayoxideE33 under identical conditions (DI water, pH 7). The results show that GFHshows significantly higher capacities for phosphate adsorption (approx. twice ashigh solid-phase concentrations). This is in accordance with the significant lowerspecific surface areas of these adsorbents.
All isotherm results were evaluated using the Langmuir [79] and Freundlich [51]equations. The determined isotherm constants are summarized in Table 7. As canbe seen from the coefficients of determination, both models can be used to describethe adsorption of phosphate onto GFH. The Langmuir isotherm appears to beslightly better suited to describe the equilibrium data. To be consistent with fixed-bed modeling studies which use Freundlich isotherm data as input parameters,the Freundlich constants were used for calculation of the ideal breakthrough point.

3.3 results and discussion 31
In summary, GFH adsorption is pH dependent, resulting in a significant de-crease in capacity in the relevant pH range between 6 and 8 (DI water). Comparedto the theoretical maximum capacity of 23.6 mg/g P calculated from surface areaand assuming mononuclear surface complex formation, adsorption capacity atpH 6 is in the range of this value, indicating that the maximum capacity mighthave been reached. Adsorption of phosphate from DW and waste water (MBReffluent) is improved compared to the single adsorbate system. This can be at-tributed to the presence of calcium which outweighs competition of DOC andcould indicate multilayer coverage or formation of ternary surface complexes(e.g., calcium-phosphate surface complexes). At pH 7, equilibrium solid-phaseconcentrations in the range of the theoretical maximum capacity are observed.Adsorption of phosphate from NF concentrate is decreased compared to the singleadsorbate system.
Table 7: Isotherm model parameter: Freundlich and Langmuir coefficients
Water matrix Adsorbent pH Freundlich parameters Langmuir parameters
KF n R2 qm KL R2
* [-] [mg/g] [L/mg]
DI GFH 6.2±0.1 20.3 0.20 0.91 23.9 9.3 0.99
DI GFH 7.1±0.2 17.9 0.19 0.93 18.4 18.9 0.99
DI GFH 8.1±0.2 11.6 0.09 0.81 13.0 10.3 0.99
DI + Calcium GFH 7.0±0.2 26.0 0.23 0.91 25.7 20.2 0.99
DW GFH 7.0±0.2 24.2 0.35 0.98 26.7 6.3 0.99
MBR effluent GFH 7.2±0.1 22.4 0.25 0.99 28.5 5.4 1.00
NF concentrate of DW GFH 7.3±0.1 15.6 0.48 0.94 13.9 7.2 0.99
NF concentrate of 2ndaryeffl.
GFH 7.2±0.1 18.9 0.62 0.98 10.1 9.6 0.91
DI FerroSorp 7.2±0.1 8.1 0.52 0.87 20.1 0.7 0.92
DI Bayoxide E33 7.2±0.1 7.8 0.17 0.69 8.7 14.9 0.96
* [Ln/(g×mgn−1)]
3.3.3 Fixed-bed column studies
Phosphate breakthrough curves for GFH adsorption in different water matricesare shown in Figure 9. The ideal (stoichiometric) breakthrough was calculatedfrom Freundlich isotherm constants and is shown for comparison (Table 4).
Figure 9 a) shows phosphate breakthrough in identically scaled laboratory-scalecolumns for DI water and DW. The lower capacities observed in isotherms usingDI water are confirmed by the column results. The stoichiometric breakthroughaccording to isotherm results matches quite well.
Figure 9 b) compares laboratory-scale DW data to DW RSSCT operated withdifferent EBCTs. Obviously, breakthrough data of RSSCT 1 (corresponding EBCTusing constant diffusivity scaling) capture the shape of the laboratory-scale break-through curve quite well, although the breakthrough occurs slightly later. RSSCT 3,which was scaled using the proportional diffusivity approach, shows a steeper,more sigmoidal breakthrough curve which does not follow the laboratory-scalebreakthrough curve (LC 2). In conclusion, the constant diffusivity scaling is better
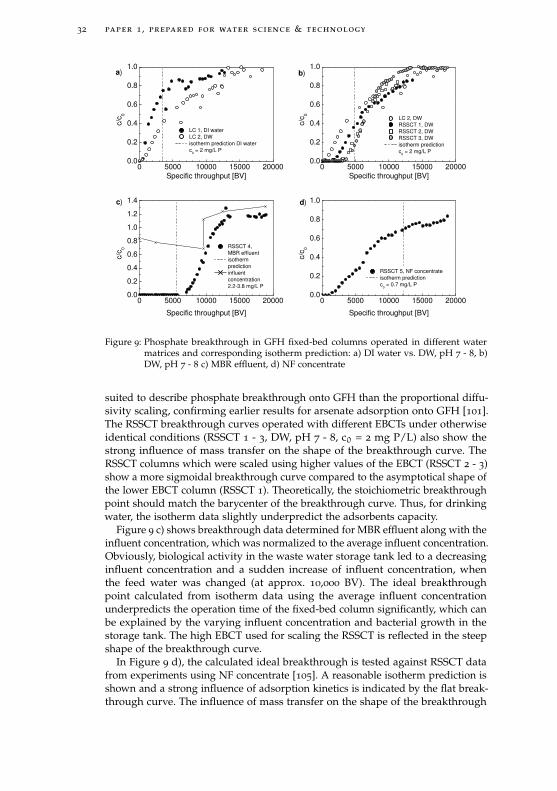
32 paper 1 , prepared for water science & technology
0 5000 10000 15000 200000.0
0.2
0.4
0.6
0.8
1.0
0 5000 10000 15000 200000.0
0.2
0.4
0.6
0.8
1.0
0 5000 10000 15000 200000.0
0.2
0.4
0.6
0.8
1.0
1.2
1.4
0 5000 10000 15000 200000.0
0.2
0.4
0.6
0.8
1.0
LC 1, DI water LC 2, DW isotherm prediction DI water c
0 = 2 mg/L P
c/c 0
Specific throughput [BV]
LC 2, DW RSSCT 1, DW RSSCT 2, DW RSSCT 3, DW isotherm prediction c
0 = 2 mg/L P
c/c 0
Specific throughput [BV]
RSSCT 4, MBR effluent isotherm prediction influent concentration 2.2-3.8 mg/L P
c/c 0
Specific throughput [BV]
c)
b)
d)
a)
RSSCT 5, NF concentrate isotherm prediction c
0 = 0.7 mg/L P
c/c 0
Specific throughput [BV]
Figure 9: Phosphate breakthrough in GFH fixed-bed columns operated in different watermatrices and corresponding isotherm prediction: a) DI water vs. DW, pH 7 - 8, b)DW, pH 7 - 8 c) MBR effluent, d) NF concentrate
suited to describe phosphate breakthrough onto GFH than the proportional diffu-sivity scaling, confirming earlier results for arsenate adsorption onto GFH [101].The RSSCT breakthrough curves operated with different EBCTs under otherwiseidentical conditions (RSSCT 1 - 3, DW, pH 7 - 8, c0 = 2 mg P/L) also show thestrong influence of mass transfer on the shape of the breakthrough curve. TheRSSCT columns which were scaled using higher values of the EBCT (RSSCT 2 - 3)show a more sigmoidal breakthrough curve compared to the asymptotical shape ofthe lower EBCT column (RSSCT 1). Theoretically, the stoichiometric breakthroughpoint should match the barycenter of the breakthrough curve. Thus, for drinkingwater, the isotherm data slightly underpredict the adsorbents capacity.
Figure 9 c) shows breakthrough data determined for MBR effluent along with theinfluent concentration, which was normalized to the average influent concentration.Obviously, biological activity in the waste water storage tank led to a decreasinginfluent concentration and a sudden increase of influent concentration, whenthe feed water was changed (at approx. 10,000 BV). The ideal breakthroughpoint calculated from isotherm data using the average influent concentrationunderpredicts the operation time of the fixed-bed column significantly, which canbe explained by the varying influent concentration and bacterial growth in thestorage tank. The high EBCT used for scaling the RSSCT is reflected in the steepshape of the breakthrough curve.
In Figure 9 d), the calculated ideal breakthrough is tested against RSSCT datafrom experiments using NF concentrate [105]. A reasonable isotherm prediction isshown and a strong influence of adsorption kinetics is indicated by the flat break-through curve. The influence of mass transfer on the shape of the breakthrough
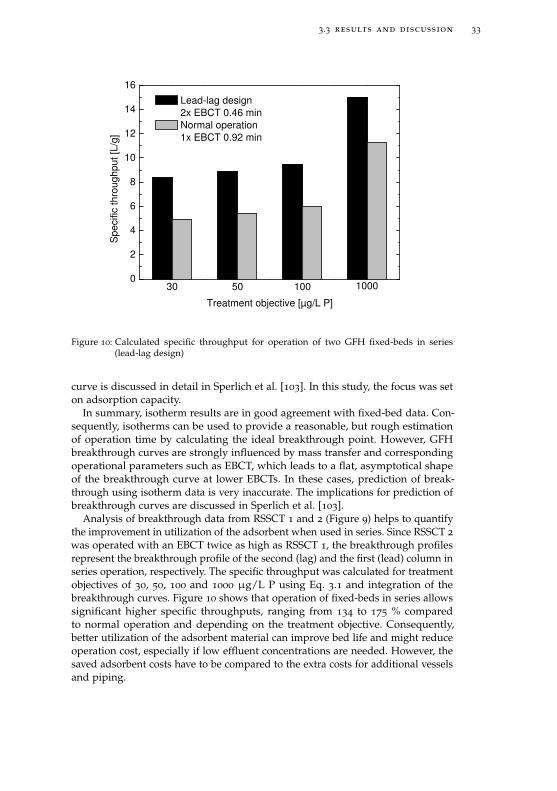
3.3 results and discussion 33
0
2
4
6
8
10
12
14
16
10001005030
Spe
cific
thro
ughp
ut [L
/g]
Treatment objective [µg/L P]
Lead-lag design 2x EBCT 0.46 min Normal operation 1x EBCT 0.92 min
Figure 10: Calculated specific throughput for operation of two GFH fixed-beds in series(lead-lag design)
curve is discussed in detail in Sperlich et al. [103]. In this study, the focus was seton adsorption capacity.
In summary, isotherm results are in good agreement with fixed-bed data. Con-sequently, isotherms can be used to provide a reasonable, but rough estimationof operation time by calculating the ideal breakthrough point. However, GFHbreakthrough curves are strongly influenced by mass transfer and correspondingoperational parameters such as EBCT, which leads to a flat, asymptotical shapeof the breakthrough curve at lower EBCTs. In these cases, prediction of break-through using isotherm data is very inaccurate. The implications for prediction ofbreakthrough curves are discussed in Sperlich et al. [103].
Analysis of breakthrough data from RSSCT 1 and 2 (Figure 9) helps to quantifythe improvement in utilization of the adsorbent when used in series. Since RSSCT 2
was operated with an EBCT twice as high as RSSCT 1, the breakthrough profilesrepresent the breakthrough profile of the second (lag) and the first (lead) column inseries operation, respectively. The specific throughput was calculated for treatmentobjectives of 30, 50, 100 and 1000 µg/L P using Eq. 3.1 and integration of thebreakthrough curves. Figure 10 shows that operation of fixed-beds in series allowssignificant higher specific throughputs, ranging from 134 to 175 % comparedto normal operation and depending on the treatment objective. Consequently,better utilization of the adsorbent material can improve bed life and might reduceoperation cost, especially if low effluent concentrations are needed. However, thesaved adsorbent costs have to be compared to the extra costs for additional vesselsand piping.

34 paper 1 , prepared for water science & technology
3.4 conclusions
• Physical characterization of GFH shows a high specific surface area of241 ±8 m2/g independent of grain size.
• Variations of particle density, bed density and water content were observedfor different grain size fractions and have to be considered when sievedmaterial is used.
• High capacities for phosphate adsorption onto GFH were determined. Underthe chosen experimental conditions (pH 7, DI water) GFH outperforms thealternative adsorbents FerroSorp and Bayoxide E33 by a factor of approxi-mately two.
• GFH is suitable to remove phosphate from waste water. Capacities in drink-ing and waste water are approximately 25 % higher than in DI water (at pH7 - 8, c∗ = 1 mg/L P).
• Competitive adsorption of DOC is compensated by the presence of calciumwhich improves phosphate adsorption.
• Batch equilibrium data are in agreement with capacities observed in fixed-bed column experiments and can provide a rough estimation of columnbreakthrough.
• RSSCT account for slow mass transfer and can simulate larger pilot andlaboratory scale columns experiments.
• Analysis of column breakthrough data shows that operation of two GFHcolumns in series results in a 134 - 175 % more efficient use of the adsorbentas compared to single column operation.
4S U R FA C E C O M P L E X AT I O N M O D E L I N G
4.1 introduction
SCMs can be used to describe the adsorption equilibrium. Their advantage overisotherm models is that they can be used to predict adsorption equilibria underdifferent pH, water quality, and experimental (e.g., liquid-to-mass ratio used)conditions, if the model is valid and the surface complexation constants known.Ideally, this allows the calculation of isotherms based on water quality data.Despite this enormous potential, SCMs are still more a topic of scientific debate,rather than applied in practice, due to a number of problems. First, the equilibriumconstants for surface complexes formed by any adsorbate/adsorbent combinationhave to be known. For complex waters the number of complexes formed in solutionand at the surface is much higher than in artificial model solutions. Up to now,most studies have been on simpler, artificial systems. Usually, the formed surfacecomplexes are hypothesized and batch equilibrium data are fitted to derive theconstants. Evidence for the formation of a specific surface complex can only beprovided by spectroscopic methods. Nevertheless, information about phosphatesurface complex formation on iron oxide surfaces varies widely in both the specificcomplexes formed and the constants determined [23]. Furthermore, a number ofdifferent SCMs exist and there is no consensus about their applicability [23, 81].
Genz [56] proposed to describe phosphate adsorption onto GFH by threemononuclear surface complexes, which had earlier been proposed for the ad-sorption of phosphate onto goethite (Equation 2.7). The description of adsorptionedges recorded in this study was succesfull, but the model was not able to predictisotherm data determined under different experimental conditions.
To clearly identify the formed phosphate surface complexes at the GFH surfaceand the most suitable SCM is beyond the scope of this research. Instead, thesurface complexes proposed by Genz [56] for phosphate adsorption onto GFHwill be evaluated for their validity for the experimental data determined in thisstudy. For simplicity and to enable comparison with Genz [56], the DDL modelwas chosen to describe phosphate and calcium adsorption onto GFH and testedagainst experimental equilibrium data. Ultimately, the aim is to predict adsorptioncapacity based on water quality analysis only, in order to improve the design offixed-bed treatment systems.
4.2 methodology
4.2.1 pH adsorption edge
A series of one-point isotherms developed at different pH values are also termedadsorption edge. Although limited to a fixed initial liquid-phase concentration,adsorption edges provide valuable information about the pH dependency ofadsorption. Adsorption edges have been frequently used in combination withsurface complexation models (SCMs) to derive surface complexation constants,
35
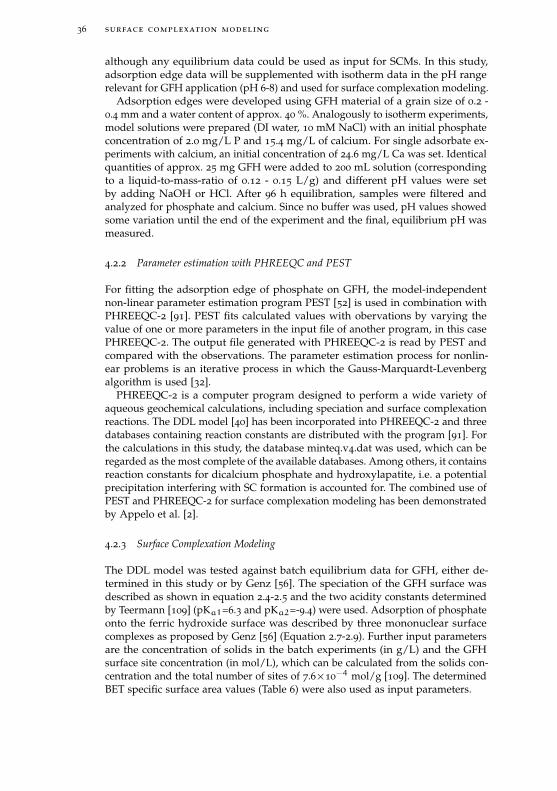
36 surface complexation modeling
although any equilibrium data could be used as input for SCMs. In this study,adsorption edge data will be supplemented with isotherm data in the pH rangerelevant for GFH application (pH 6-8) and used for surface complexation modeling.
Adsorption edges were developed using GFH material of a grain size of 0.2 -0.4 mm and a water content of approx. 40 %. Analogously to isotherm experiments,model solutions were prepared (DI water, 10 mM NaCl) with an initial phosphateconcentration of 2.0 mg/L P and 15.4 mg/L of calcium. For single adsorbate ex-periments with calcium, an initial concentration of 24.6 mg/L Ca was set. Identicalquantities of approx. 25 mg GFH were added to 200 mL solution (correspondingto a liquid-to-mass-ratio of 0.12 - 0.15 L/g) and different pH values were setby adding NaOH or HCl. After 96 h equilibration, samples were filtered andanalyzed for phosphate and calcium. Since no buffer was used, pH values showedsome variation until the end of the experiment and the final, equilibrium pH wasmeasured.
4.2.2 Parameter estimation with PHREEQC and PEST
For fitting the adsorption edge of phosphate on GFH, the model-independentnon-linear parameter estimation program PEST [52] is used in combination withPHREEQC-2 [91]. PEST fits calculated values with obervations by varying thevalue of one or more parameters in the input file of another program, in this casePHREEQC-2. The output file generated with PHREEQC-2 is read by PEST andcompared with the observations. The parameter estimation process for nonlin-ear problems is an iterative process in which the Gauss-Marquardt-Levenbergalgorithm is used [32].
PHREEQC-2 is a computer program designed to perform a wide variety ofaqueous geochemical calculations, including speciation and surface complexationreactions. The DDL model [40] has been incorporated into PHREEQC-2 and threedatabases containing reaction constants are distributed with the program [91]. Forthe calculations in this study, the database minteq.v4.dat was used, which can beregarded as the most complete of the available databases. Among others, it containsreaction constants for dicalcium phosphate and hydroxylapatite, i.e. a potentialprecipitation interfering with SC formation is accounted for. The combined use ofPEST and PHREEQC-2 for surface complexation modeling has been demonstratedby Appelo et al. [2].
4.2.3 Surface Complexation Modeling
The DDL model was tested against batch equilibrium data for GFH, either de-termined in this study or by Genz [56]. The speciation of the GFH surface wasdescribed as shown in equation 2.4-2.5 and the two acidity constants determinedby Teermann [109] (pKa1=6.3 and pKa2=-9.4) were used. Adsorption of phosphateonto the ferric hydroxide surface was described by three mononuclear surfacecomplexes as proposed by Genz [56] (Equation 2.7-2.9). Further input parametersare the concentration of solids in the batch experiments (in g/L) and the GFHsurface site concentration (in mol/L), which can be calculated from the solids con-centration and the total number of sites of 7.6×10
−4 mol/g [109]. The determinedBET specific surface area values (Table 6) were also used as input parameters.
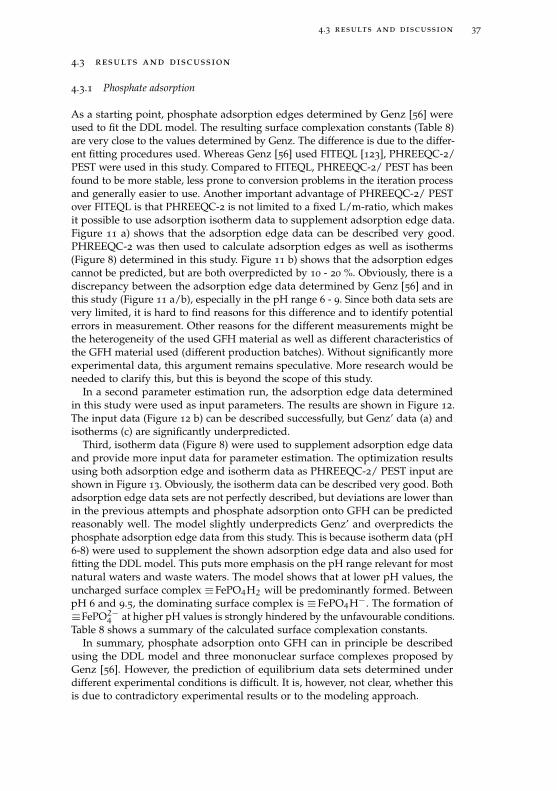
4.3 results and discussion 37
4.3 results and discussion
4.3.1 Phosphate adsorption
As a starting point, phosphate adsorption edges determined by Genz [56] wereused to fit the DDL model. The resulting surface complexation constants (Table 8)are very close to the values determined by Genz. The difference is due to the differ-ent fitting procedures used. Whereas Genz [56] used FITEQL [123], PHREEQC-2/PEST were used in this study. Compared to FITEQL, PHREEQC-2/ PEST has beenfound to be more stable, less prone to conversion problems in the iteration processand generally easier to use. Another important advantage of PHREEQC-2/ PESTover FITEQL is that PHREEQC-2 is not limited to a fixed L/m-ratio, which makesit possible to use adsorption isotherm data to supplement adsorption edge data.Figure 11 a) shows that the adsorption edge data can be described very good.PHREEQC-2 was then used to calculate adsorption edges as well as isotherms(Figure 8) determined in this study. Figure 11 b) shows that the adsorption edgescannot be predicted, but are both overpredicted by 10 - 20 %. Obviously, there is adiscrepancy between the adsorption edge data determined by Genz [56] and inthis study (Figure 11 a/b), especially in the pH range 6 - 9. Since both data sets arevery limited, it is hard to find reasons for this difference and to identify potentialerrors in measurement. Other reasons for the different measurements might bethe heterogeneity of the used GFH material as well as different characteristics ofthe GFH material used (different production batches). Without significantly moreexperimental data, this argument remains speculative. More research would beneeded to clarify this, but this is beyond the scope of this study.
In a second parameter estimation run, the adsorption edge data determinedin this study were used as input parameters. The results are shown in Figure 12.The input data (Figure 12 b) can be described successfully, but Genz’ data (a) andisotherms (c) are significantly underpredicted.
Third, isotherm data (Figure 8) were used to supplement adsorption edge dataand provide more input data for parameter estimation. The optimization resultsusing both adsorption edge and isotherm data as PHREEQC-2/ PEST input areshown in Figure 13. Obviously, the isotherm data can be described very good. Bothadsorption edge data sets are not perfectly described, but deviations are lower thanin the previous attempts and phosphate adsorption onto GFH can be predictedreasonably well. The model slightly underpredicts Genz’ and overpredicts thephosphate adsorption edge data from this study. This is because isotherm data (pH6-8) were used to supplement the shown adsorption edge data and also used forfitting the DDL model. This puts more emphasis on the pH range relevant for mostnatural waters and waste waters. The model shows that at lower pH values, theuncharged surface complex ≡FePO4H2 will be predominantly formed. BetweenpH 6 and 9.5, the dominating surface complex is ≡FePO4H−. The formation of≡FePO2−4 at higher pH values is strongly hindered by the unfavourable conditions.Table 8 shows a summary of the calculated surface complexation constants.
In summary, phosphate adsorption onto GFH can in principle be describedusing the DDL model and three mononuclear surface complexes proposed byGenz [56]. However, the prediction of equilibrium data sets determined underdifferent experimental conditions is difficult. It is, however, not clear, whether thisis due to contradictory experimental results or to the modeling approach.
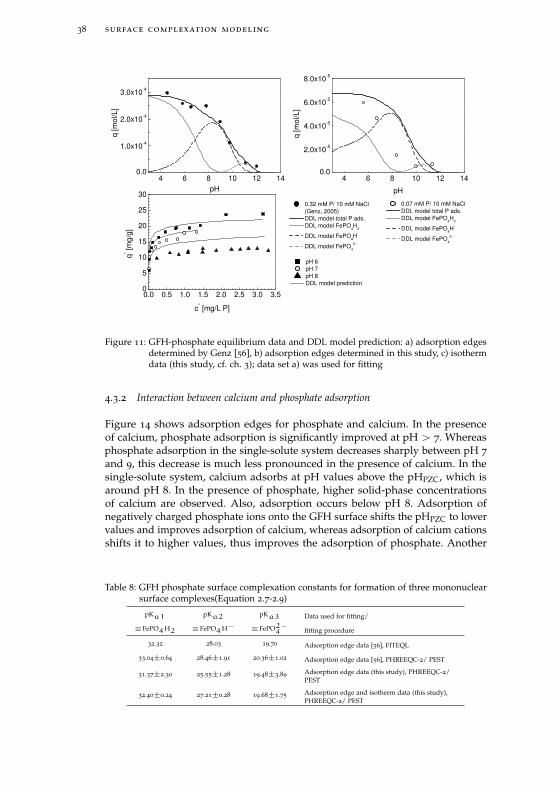
38 surface complexation modeling
4 6 8 10 12 140.0
1.0x10⁻⁴
2.0x10⁻⁴
3.0x10⁻⁴
4 6 8 10 12 140.0
2.0x10⁻⁵
4.0x10⁻⁵
6.0x10⁻⁵
8.0x10⁻⁵
0.0 0.5 1.0 1.5 2.0 2.5 3.0 3.50
5
10
15
20
25
30
q [m
ol/L
]
pH
0.32 mM P/ 10 mM NaCl (Genz, 2005) DDL model total P ads. DDL model FePO
4H
2
DDL model FePO4H-
DDL model FePO4
2-
q [m
ol/L
]
pH
0.07 mM P/ 10 mM NaCl DDL model total P ads. DDL model FePO
4H
2
DDL model FePO4H-
DDL model FePO4
2-
pH 6 pH 7 pH 8 DDL model prediction
q* [mg/
g]
c* [mg/L P]
Figure 11: GFH-phosphate equilibrium data and DDL model prediction: a) adsorption edgesdetermined by Genz [56], b) adsorption edges determined in this study, c) isothermdata (this study, cf. ch. 3); data set a) was used for fitting
4.3.2 Interaction between calcium and phosphate adsorption
Figure 14 shows adsorption edges for phosphate and calcium. In the presenceof calcium, phosphate adsorption is significantly improved at pH > 7. Whereasphosphate adsorption in the single-solute system decreases sharply between pH 7
and 9, this decrease is much less pronounced in the presence of calcium. In thesingle-solute system, calcium adsorbs at pH values above the pHPZC, which isaround pH 8. In the presence of phosphate, higher solid-phase concentrationsof calcium are observed. Also, adsorption occurs below pH 8. Adsorption ofnegatively charged phosphate ions onto the GFH surface shifts the pHPZC to lowervalues and improves adsorption of calcium, whereas adsorption of calcium cationsshifts it to higher values, thus improves the adsorption of phosphate. Another
Table 8: GFH phosphate surface complexation constants for formation of three mononuclearsurface complexes(Equation 2.7-2.9)
pKa1 pKa2 pKa3 Data used for fitting/
≡FePO4H2 ≡FePO4H− ≡FePO2−4 fitting procedure
32.32 28.03 19.70 Adsorption edge data [56], FITEQL
33.04±0.64 28.46±1.91 20.36±1.02 Adsorption edge data [56], PHREEQC-2/ PEST
31.37±2.30 25.55±1.28 19.48±3.89Adsorption edge data (this study), PHREEQC-2/PEST
32.40±0.24 27.21±0.28 19.68±1.75Adsorption edge and isotherm data (this study),PHREEQC-2/ PEST
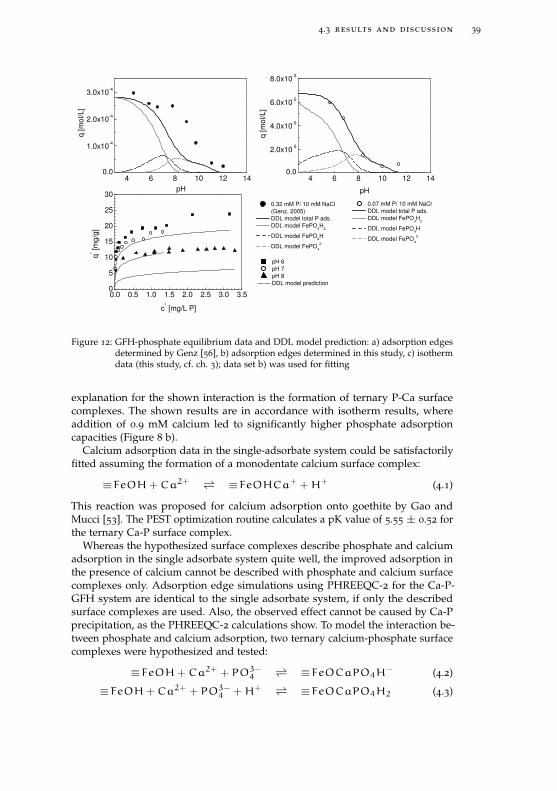
4.3 results and discussion 39
4 6 8 10 12 140.0
1.0x10⁻⁴
2.0x10⁻⁴
3.0x10⁻⁴
4 6 8 10 12 140.0
2.0x10⁻⁵
4.0x10⁻⁵
6.0x10⁻⁵
8.0x10⁻⁵
0.0 0.5 1.0 1.5 2.0 2.5 3.0 3.50
5
10
15
20
25
30
q [m
ol/L
]
pH
0.32 mM P/ 10 mM NaCl (Genz, 2005) DDL model total P ads. DDL model FePO
4H
2
DDL model FePO4H-
DDL model FePO4
2-
q [m
ol/L
]
pH
0.07 mM P/ 10 mM NaCl DDL model total P ads. DDL model FePO
4H
2
DDL model FePO4H-
DDL model FePO4
2-
pH 6 pH 7 pH 8 DDL model prediction
q* [mg/
g]
c* [mg/L P]
Figure 12: GFH-phosphate equilibrium data and DDL model prediction: a) adsorption edgesdetermined by Genz [56], b) adsorption edges determined in this study, c) isothermdata (this study, cf. ch. 3); data set b) was used for fitting
explanation for the shown interaction is the formation of ternary P-Ca surfacecomplexes. The shown results are in accordance with isotherm results, whereaddition of 0.9 mM calcium led to significantly higher phosphate adsorptioncapacities (Figure 8 b).
Calcium adsorption data in the single-adsorbate system could be satisfactorilyfitted assuming the formation of a monodentate calcium surface complex:
≡FeOH+Ca2+ ⇀↽ ≡FeOHCa+ +H+ (4.1)
This reaction was proposed for calcium adsorption onto goethite by Gao andMucci [53]. The PEST optimization routine calculates a pK value of 5.55 ± 0.52 forthe ternary Ca-P surface complex.
Whereas the hypothesized surface complexes describe phosphate and calciumadsorption in the single adsorbate system quite well, the improved adsorption inthe presence of calcium cannot be described with phosphate and calcium surfacecomplexes only. Adsorption edge simulations using PHREEQC-2 for the Ca-P-GFH system are identical to the single adsorbate system, if only the describedsurface complexes are used. Also, the observed effect cannot be caused by Ca-Pprecipitation, as the PHREEQC-2 calculations show. To model the interaction be-tween phosphate and calcium adsorption, two ternary calcium-phosphate surfacecomplexes were hypothesized and tested:
≡FeOH+Ca2+ +PO3−4⇀↽ ≡FeOCaPO4H− (4.2)
≡FeOH+Ca2+ +PO3−4 +H+ ⇀↽ ≡FeOCaPO4H2 (4.3)
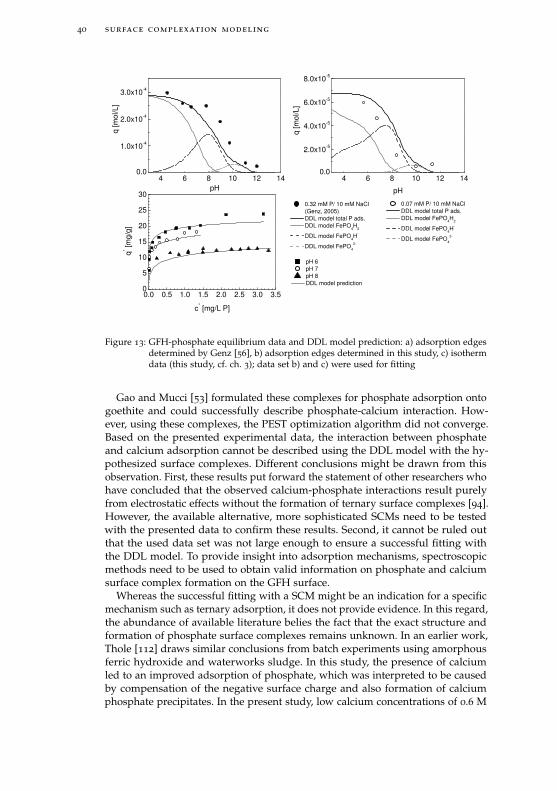
40 surface complexation modeling
4 6 8 10 12 140.0
1.0x10⁻⁴
2.0x10⁻⁴
3.0x10⁻⁴
4 6 8 10 12 140.0
2.0x10⁻⁵
4.0x10⁻⁵
6.0x10⁻⁵
8.0x10⁻⁵
0.0 0.5 1.0 1.5 2.0 2.5 3.0 3.50
5
10
15
20
25
30
q [m
ol/L
]
pH
0.32 mM P/ 10 mM NaCl (Genz, 2005) DDL model total P ads. DDL model FePO
4H
2
DDL model FePO4H-
DDL model FePO4
2-
q [m
ol/L
]
pH
0.07 mM P/ 10 mM NaCl DDL model total P ads. DDL model FePO
4H
2
DDL model FePO4H-
DDL model FePO4
2-
pH 6 pH 7 pH 8 DDL model prediction
q* [mg/
g]
c* [mg/L P]
Figure 13: GFH-phosphate equilibrium data and DDL model prediction: a) adsorption edgesdetermined by Genz [56], b) adsorption edges determined in this study, c) isothermdata (this study, cf. ch. 3); data set b) and c) were used for fitting
Gao and Mucci [53] formulated these complexes for phosphate adsorption ontogoethite and could successfully describe phosphate-calcium interaction. How-ever, using these complexes, the PEST optimization algorithm did not converge.Based on the presented experimental data, the interaction between phosphateand calcium adsorption cannot be described using the DDL model with the hy-pothesized surface complexes. Different conclusions might be drawn from thisobservation. First, these results put forward the statement of other researchers whohave concluded that the observed calcium-phosphate interactions result purelyfrom electrostatic effects without the formation of ternary surface complexes [94].However, the available alternative, more sophisticated SCMs need to be testedwith the presented data to confirm these results. Second, it cannot be ruled outthat the used data set was not large enough to ensure a successful fitting withthe DDL model. To provide insight into adsorption mechanisms, spectroscopicmethods need to be used to obtain valid information on phosphate and calciumsurface complex formation on the GFH surface.
Whereas the successful fitting with a SCM might be an indication for a specificmechanism such as ternary adsorption, it does not provide evidence. In this regard,the abundance of available literature belies the fact that the exact structure andformation of phosphate surface complexes remains unknown. In an earlier work,Thole [112] draws similar conclusions from batch experiments using amorphousferric hydroxide and waterworks sludge. In this study, the presence of calciumled to an improved adsorption of phosphate, which was interpreted to be causedby compensation of the negative surface charge and also formation of calciumphosphate precipitates. In the present study, low calcium concentrations of 0.6 M
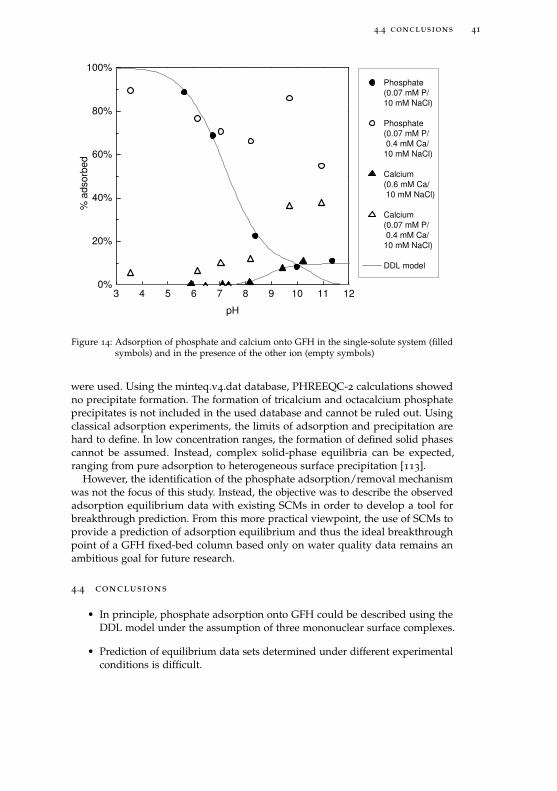
4.4 conclusions 41
3 4 5 6 7 8 9 10 11 120%
20%
40%
60%
80%
100%
Phosphate (0.07 mM P/ 10 mM NaCl)
Phosphate (0.07 mM P/ 0.4 mM Ca/ 10 mM NaCl)
Calcium (0.6 mM Ca/ 10 mM NaCl)
Calcium (0.07 mM P/ 0.4 mM Ca/ 10 mM NaCl)
DDL model
% a
dsor
bed
pH
Figure 14: Adsorption of phosphate and calcium onto GFH in the single-solute system (filledsymbols) and in the presence of the other ion (empty symbols)
were used. Using the minteq.v4.dat database, PHREEQC-2 calculations showedno precipitate formation. The formation of tricalcium and octacalcium phosphateprecipitates is not included in the used database and cannot be ruled out. Usingclassical adsorption experiments, the limits of adsorption and precipitation arehard to define. In low concentration ranges, the formation of defined solid phasescannot be assumed. Instead, complex solid-phase equilibria can be expected,ranging from pure adsorption to heterogeneous surface precipitation [113].
However, the identification of the phosphate adsorption/removal mechanismwas not the focus of this study. Instead, the objective was to describe the observedadsorption equilibrium data with existing SCMs in order to develop a tool forbreakthrough prediction. From this more practical viewpoint, the use of SCMs toprovide a prediction of adsorption equilibrium and thus the ideal breakthroughpoint of a GFH fixed-bed column based only on water quality data remains anambitious goal for future research.
4.4 conclusions
• In principle, phosphate adsorption onto GFH could be described using theDDL model under the assumption of three mononuclear surface complexes.
• Prediction of equilibrium data sets determined under different experimentalconditions is difficult.

42 surface complexation modeling
• An interaction between phosphate and calcium adsorption onto GFH wasobserved: presence of calcium significantly improved phosphate adsorptionand vice-versa.
• Whereas the hypothesized surface complexes describe phosphate and cal-cium adsorption in the single adsorbate system quite well, the interactionbetween phosphate and calcium adsorption cannot be described using theDDL, not even using hypothesized ternary Ca-P complexes.
5T R E AT M E N T O F M E M B R A N E C O N C E N T R AT E S :P H O S P H AT E R E M O VA L A N D R E D U C T I O N O F S C A L I N GP O T E N T I A L
Alexander Sperlich1, David Warschke1, Christine Wegmann1, Mathias Ernst1 andMartin Jekel1
Water Science & Technology 2010, 61(2), 301-306.
abstract
The widespread application of nanofiltration (NF) and reverse osmosis (RO)membranes in wastewater reuse inevitably generates a concentrate stream. Due tohigh concentrations of phosphate and salts, disposal of membrane concentrates is aproblem which seriously constrains the application of this technology, especially ininland applications. There is a need for technologies which facilitate an affordableand environmentally-safe disposal of membrane concentrates. The objectives ofthis study are to investigate appropriate treatment techniques to 1) increase therecovery of the membrane filtration thus minimising the volume of the concentratestream, and 2) increase the concentrate quality to enable discharge into surfacewater bodies. The results show that both adsorption onto granular ferric hydroxide(GFH) and chemical precipitation are generally effective for phosphate removalfrom NF concentrates. Chemical precipitation by dosing of sodium hydroxidesolution is rapid and removes more than 90 % of phosphate and calcium ions. Bythe removal of calcium ions, chemical precipitation can significantly reduce thescaling potential of NF and RO concentrates. This may allow for higher recoveriesin the NF/ RO process.
5.1 introduction
The reuse of treated municipal wastewater is already practiced in many parts ofthe world and continues to gain importance. The necessary advanced wastewatertreatment for reclamation includes membrane filtration processes, which canprovide an excellent barrier for pathogens and contaminants. However, highpressure membrane processes will inevitably generate a concentrate stream of5 - 25 % of the feed volume. Management and disposal of membrane concentratesis a problem which might seriously constrain the application of this technology ininland communities [86], and also the widely practiced discharge into seawaterhas caused environmental concerns [116]. For inland applications, treatmentoptions for membrane concentrates include discharge into surface water bodies,discharge into wastewater treatment plants, and deep-well injection. Due to therejection of polyvalent anions by nanofiltration (NF) and reverse osmosis (RO)membranes, high concentrations of phosphate occur in membrane concentrates.
1 Technische Universität Berlin
43
44 water science & technology 61 (2010) 301-306
Since even small phosphate concentrations can cause eutrophication, phosphorus-rich concentrate streams cannot be discharged into small to medium-sized surfacewater bodies. Consequently, both discharge into surface water and deep-wellinjection are difficult due to severe restrictions by water authorities. From aresource perspective, a potential recovery of nutrients from the concentrate streammight also be an interesting option. Discharge into the sewer system is not alwayspossible and results in high costs. There is a need for technologies which facilitatean affordable and environmentally safe concentrate disposal. Where the abovedisposal options are not feasible, the alternative is zero liquid discharge (ZLD).In ZLD desalination, the concentrate is treated to produce desalinated water andessentially dry salts, which can be achieved by thermal desalination or evaporationponds. This results in high energy or large land area demands [15].
The objectives of this study are to investigate appropriate treatment techniquesto 1) increase the recovery of the membrane filtration and minimise the volume ofthe concentrate stream, and 2) increase the concentrate quality to enable dischargein surface water bodies (Figure 15). Volume minimisation requires the removalof scaling components, e. g. calcium ions. Chemical precipitation/ softening hasbeen reported to be a potential treatment option for this purpose [66]. Sincemost concentrate brines are supersaturated with respect to calcium phosphatecompounds, induced crystallisation of calcium phosphates using an appropriateseed material such as calcite [33] or tobermorite [12] might be another treatmentoption. The second objective could be met by the removal of phosphorus frommembrane concentrates. Granular ferric hydroxide (GFH) has shown high capaci-ties for arsenate and phosphate [44, 103] adsorption from aqueous solutions. Thisstudy investigates the suitability of GFH adsorption and chemical precipitationfor phosphate removal from membrane concentrates and the reduction of scalingpotential.
5.2 methods
5.2.1 Materials and model solutions
Granular ferric hydroxide (GFH) was obtained from the producer (GEH Wasser-chemie, Osnabrück). GFH is predominantly akaganeite (β-FeOOH), a poorlycrystallised iron oxide with a specific surface area of approx. 250 m2/g [110, 96].Calcite was obtained from Rheinkalk Akdolit (Pelm, Germany). The commercialproduct has a grain size range of 0.5 - 3.15 mm.
Membrane concentrate was produced from filtered secondary effluent andBerlin tap water using a nanofiltration pilot plant. A DOW NF270 membrane wasoperated in cross-flow mode with a water conversion factor (WCF) of 0.7 - 0.8.NF concentrate of filtered secondary effluent and tap water concentrate wereproduced discontinuously in a 200 L feed tank. NF concentrate was recycled tothe feed tank, NF permeate was discarded.
To study the effect of concentrate water quality, RO concentrate from a full-scale RO application (the Torreele facility in Wulpen, Belgium) was also used. ROpermeate of ultra-filtered secondary effluent is used for infiltration and reclamation[119]. The RO plant is operated using DOW Filmtec 30LE membranes at a WCF ofapprox. 0.75. Table 9 shows water quality data for the used concentrate solutions.
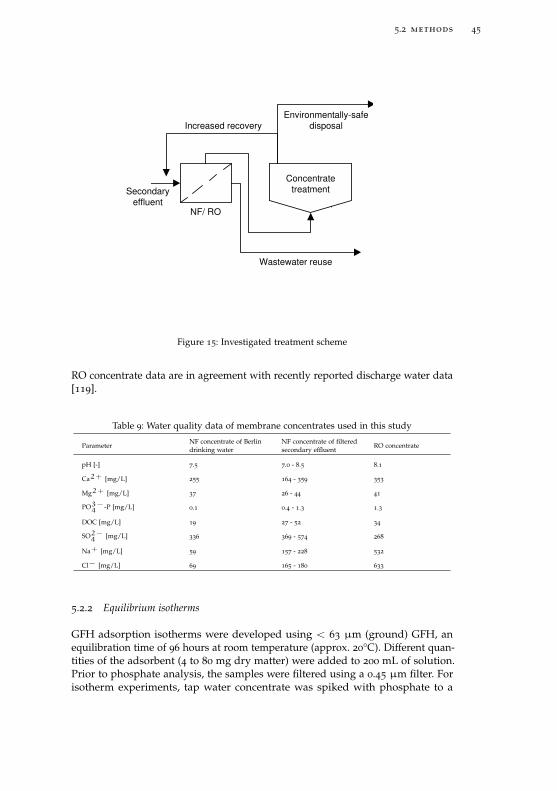
5.2 methods 45
Wastewater reuse
NF/ RO
Concentratetreatment
Environmentally-safedisposalIncreased recovery
Secondaryeffluent
Figure 15: Investigated treatment scheme
RO concentrate data are in agreement with recently reported discharge water data[119].
Table 9: Water quality data of membrane concentrates used in this study
ParameterNF concentrate of Berlindrinking water
NF concentrate of filteredsecondary effluent
RO concentrate
pH [-] 7.5 7.0 - 8.5 8.1
Ca2+ [mg/L] 255 164 - 359 353
Mg2+ [mg/L] 37 26 - 44 41
PO3−4
-P [mg/L] 0.1 0.4 - 1.3 1.3
DOC [mg/L] 19 27 - 52 34
SO2−4
[mg/L] 336 369 - 574 268
Na+ [mg/L] 59 157 - 228 532
Cl− [mg/L] 69 165 - 180 633
5.2.2 Equilibrium isotherms
GFH adsorption isotherms were developed using < 63 µm (ground) GFH, anequilibration time of 96 hours at room temperature (approx. 20°C). Different quan-tities of the adsorbent (4 to 80 mg dry matter) were added to 200 mL of solution.Prior to phosphate analysis, the samples were filtered using a 0.45 µm filter. Forisotherm experiments, tap water concentrate was spiked with phosphate to a
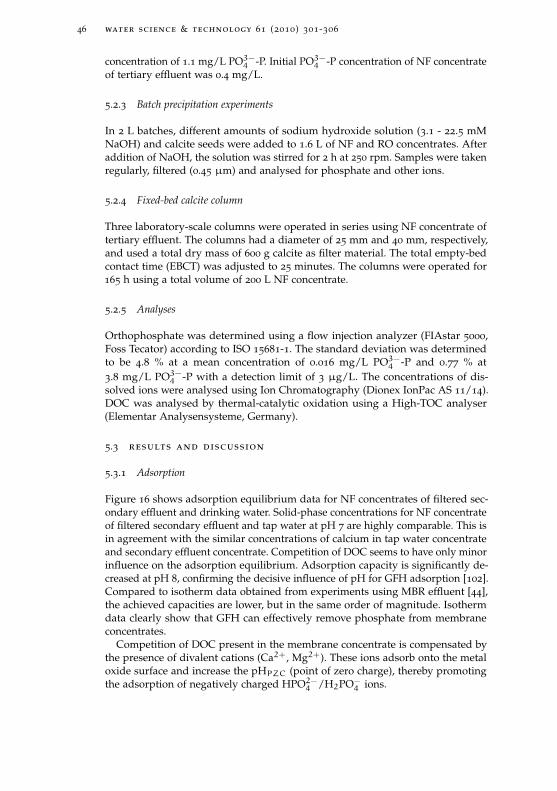
46 water science & technology 61 (2010) 301-306
concentration of 1.1 mg/L PO3−4 -P. Initial PO3−4 -P concentration of NF concentrateof tertiary effluent was 0.4 mg/L.
5.2.3 Batch precipitation experiments
In 2 L batches, different amounts of sodium hydroxide solution (3.1 - 22.5 mMNaOH) and calcite seeds were added to 1.6 L of NF and RO concentrates. Afteraddition of NaOH, the solution was stirred for 2 h at 250 rpm. Samples were takenregularly, filtered (0.45 µm) and analysed for phosphate and other ions.
5.2.4 Fixed-bed calcite column
Three laboratory-scale columns were operated in series using NF concentrate oftertiary effluent. The columns had a diameter of 25 mm and 40 mm, respectively,and used a total dry mass of 600 g calcite as filter material. The total empty-bedcontact time (EBCT) was adjusted to 25 minutes. The columns were operated for165 h using a total volume of 200 L NF concentrate.
5.2.5 Analyses
Orthophosphate was determined using a flow injection analyzer (FIAstar 5000,Foss Tecator) according to ISO 15681-1. The standard deviation was determinedto be 4.8 % at a mean concentration of 0.016 mg/L PO3−4 -P and 0.77 % at3.8 mg/L PO3−4 -P with a detection limit of 3 µg/L. The concentrations of dis-solved ions were analysed using Ion Chromatography (Dionex IonPac AS 11/14).DOC was analysed by thermal-catalytic oxidation using a High-TOC analyser(Elementar Analysensysteme, Germany).
5.3 results and discussion
5.3.1 Adsorption
Figure 16 shows adsorption equilibrium data for NF concentrates of filtered sec-ondary effluent and drinking water. Solid-phase concentrations for NF concentrateof filtered secondary effluent and tap water at pH 7 are highly comparable. This isin agreement with the similar concentrations of calcium in tap water concentrateand secondary effluent concentrate. Competition of DOC seems to have only minorinfluence on the adsorption equilibrium. Adsorption capacity is significantly de-creased at pH 8, confirming the decisive influence of pH for GFH adsorption [102].Compared to isotherm data obtained from experiments using MBR effluent [44],the achieved capacities are lower, but in the same order of magnitude. Isothermdata clearly show that GFH can effectively remove phosphate from membraneconcentrates.
Competition of DOC present in the membrane concentrate is compensated bythe presence of divalent cations (Ca2+, Mg2+). These ions adsorb onto the metaloxide surface and increase the pHPZC (point of zero charge), thereby promotingthe adsorption of negatively charged HPO2−4 /H2PO−
4 ions.
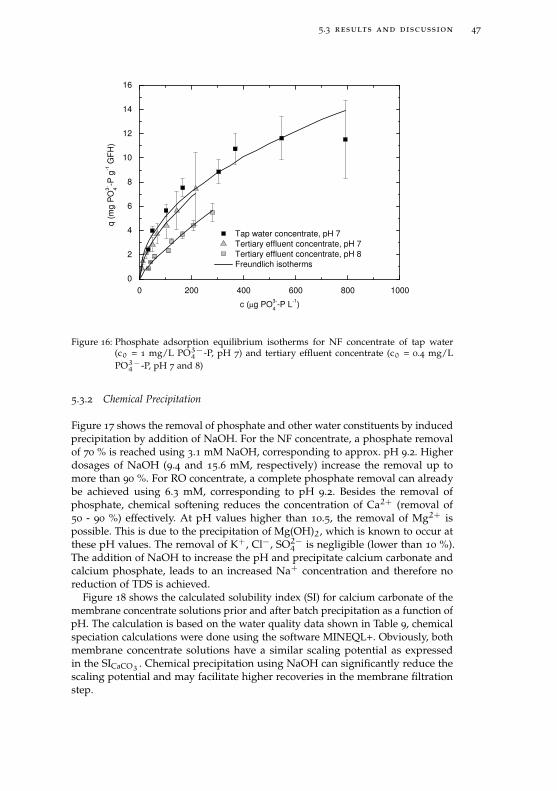
5.3 results and discussion 47
0 200 400 600 800 10000
2
4
6
8
10
12
14
16
Tap water concentrate, pH 7 Tertiary effluent concentrate, pH 7 Tertiary effluent concentrate, pH 8 Freundlich isotherms
q (m
g P
O3- 4-P
g-1 G
FH
)
c (µg PO3-
4-P L-1)
Figure 16: Phosphate adsorption equilibrium isotherms for NF concentrate of tap water(c0 = 1 mg/L PO3−
4 -P, pH 7) and tertiary effluent concentrate (c0 = 0.4 mg/LPO3−
4 -P, pH 7 and 8)
5.3.2 Chemical Precipitation
Figure 17 shows the removal of phosphate and other water constituents by inducedprecipitation by addition of NaOH. For the NF concentrate, a phosphate removalof 70 % is reached using 3.1 mM NaOH, corresponding to approx. pH 9.2. Higherdosages of NaOH (9.4 and 15.6 mM, respectively) increase the removal up tomore than 90 %. For RO concentrate, a complete phosphate removal can alreadybe achieved using 6.3 mM, corresponding to pH 9.2. Besides the removal ofphosphate, chemical softening reduces the concentration of Ca2+ (removal of50 - 90 %) effectively. At pH values higher than 10.5, the removal of Mg2+ ispossible. This is due to the precipitation of Mg(OH)2, which is known to occur atthese pH values. The removal of K+, Cl−, SO2−4 is negligible (lower than 10 %).The addition of NaOH to increase the pH and precipitate calcium carbonate andcalcium phosphate, leads to an increased Na+ concentration and therefore noreduction of TDS is achieved.
Figure 18 shows the calculated solubility index (SI) for calcium carbonate of themembrane concentrate solutions prior and after batch precipitation as a function ofpH. The calculation is based on the water quality data shown in Table 9, chemicalspeciation calculations were done using the software MINEQL+. Obviously, bothmembrane concentrate solutions have a similar scaling potential as expressedin the SICaCO3
. Chemical precipitation using NaOH can significantly reduce thescaling potential and may facilitate higher recoveries in the membrane filtrationstep.
48 water science & technology 61 (2010) 301-306
0
20
40
60
80
100
Rem
oval
[%]
NF concentrate 3.4 mM NaOH 9.4 mM NaOH 15.6 mM NaOH
RO concentrate 6.3 mM NaOH 10.5 mM NaOH 22.5 mM NaOH
����
����
��
���
� �
��
�����
0
40
80
120
160
200
Sod
ium
con
cent
ratit
ion
incr
ease
[%]
Figure 17: Removal of dissolved ions by chemical precipitation using different amounts ofNaOH
Figure 19 shows the kinetics of the precipitation reaction. Phosphate and cal-cium removal is rapid, more than 90 % removal is reached within 0.5 minutes.The lowest dosage of 3.1 mM NaOH corresponding to pH 9.2 is not sufficientto achieve a comparable removal of phosphate and calcium. After an initial con-centration decrease, a slight increase is observed after 5 to 10 minutes, before aslow concentration decrease can be observed until the end of the experiment. Thismight be explained by the kinetics of the precipitation reaction, which results inpH changes.
Calcite can provide a condensation surface for the precipitation of hydroxylapatite. If calcite seeding material is added without addition of NaOH, phosphateand calcium removal can also be observed, but the precipitation is kineticallyinhibited. After 30 h batch operation, only 40 % removal was observed (datanot shown). These observations were confirmed by results from operation ofa calcite fixed-bed column. Figure 20 shows an initially increased removal ofphosphate, probably due to adsorption onto the calcite surface. After 70 h ofoperation, a steady state is reached. For an EBCT of 25 minutes the influentphosphate concentration of 600 µg/L PO3−4 -P was reduced to 350 µg/L PO3−4 -P,corresponding to a PO3−4 -P removal of 37 %. A higher EBCT can most likelyimprove phosphate removal.
5.4 conclusions
• Both adsorption onto GFH and chemical precipitation have been shown tobe generally effective for phosphate removal from NF concentrates.
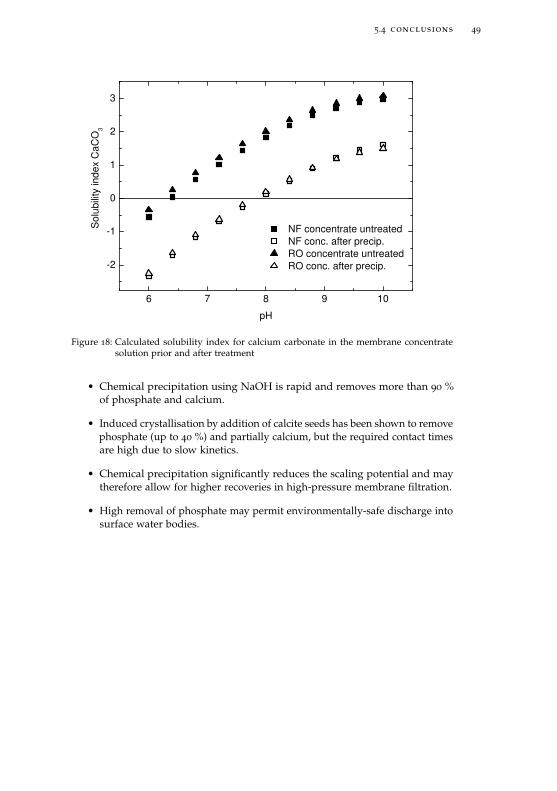
5.4 conclusions 49
6 7 8 9 10
-2
-1
0
1
2
3
NF concentrate untreated NF conc. after precip. RO concentrate untreated RO conc. after precip.
Sol
ubili
ty in
dex
CaC
O3
pH
Figure 18: Calculated solubility index for calcium carbonate in the membrane concentratesolution prior and after treatment
• Chemical precipitation using NaOH is rapid and removes more than 90 %of phosphate and calcium.
• Induced crystallisation by addition of calcite seeds has been shown to removephosphate (up to 40 %) and partially calcium, but the required contact timesare high due to slow kinetics.
• Chemical precipitation significantly reduces the scaling potential and maytherefore allow for higher recoveries in high-pressure membrane filtration.
• High removal of phosphate may permit environmentally-safe discharge intosurface water bodies.
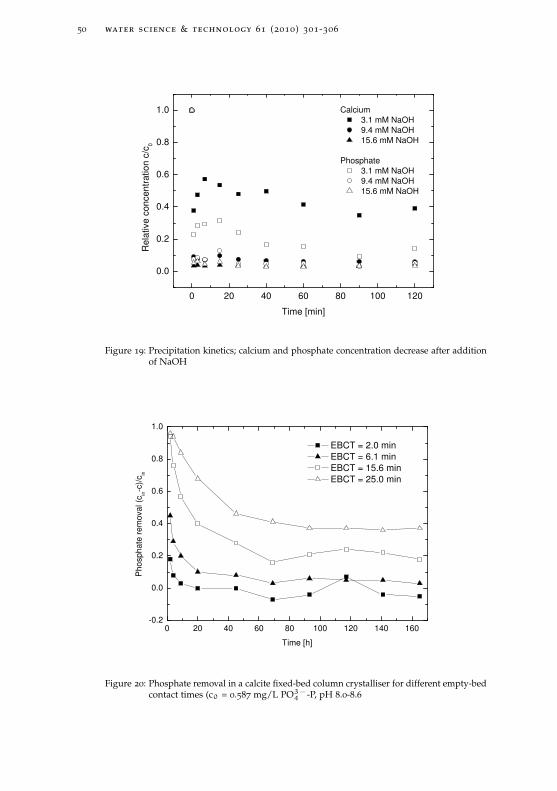
50 water science & technology 61 (2010) 301-306
0 20 40 60 80 100 120
0.0
0.2
0.4
0.6
0.8
1.0
Calcium 3.1 mM NaOH 9.4 mM NaOH 15.6 mM NaOH
Phosphate 3.1 mM NaOH 9.4 mM NaOH 15.6 mM NaOH
Rel
ativ
e co
ncen
trat
ion
c/c 0
Time [min]
Figure 19: Precipitation kinetics; calcium and phosphate concentration decrease after additionof NaOH
0 20 40 60 80 100 120 140 160-0.2
0.0
0.2
0.4
0.6
0.8
1.0
EBCT = 2.0 min EBCT = 6.1 min EBCT = 15.6 min EBCT = 25.0 min
Pho
spha
te r
emov
al (
c in-c
)/c in
Time [h]
Figure 20: Phosphate removal in a calcite fixed-bed column crystalliser for different empty-bedcontact times (c0 = 0.587 mg/L PO3−
4 -P, pH 8.0-8.6
6P R E D I C T I N G A N I O N B R E A K T H R O U G H I N G R A N U L A RF E R R I C H Y D R O X I D E ( G F H ) A D S O R P T I O N F I LT E R S
Alexander Sperlich1, Sebastian Schimmelpfennig1, Benno Baumgarten1, ArneGenz1, Gary Amy2, Eckhard Worch3 and Martin Jekel1
Water Research 2008, 42, 2073-2082.
abstract
Adsorption of arsenate, phosphate, salicylic acid, and groundwater DOC ontogranular ferric hydroxide (GFH) was studied in batch and column experiments.Breakthrough curves were experimentally determined and modeled using thehomogeneous surface diffusion model (HSDM) and two of its derivatives, theconstant pattern homogeneous surface diffusion model (CPHSDM) and the lineardriving force model (LDF). Input parameters, the Freundlich isotherm constants,and mass transfer coefficients for liquid- and solid-phase diffusion were deter-mined and analysed for their influence on the shape of the breakthrough curve.HSDM simulation results predict the breakthrough of all investigated substancessatisfactorily, but LDF and CPHSDM could not describe arsenate breakthroughcorrectly. This is due to a very slow intraparticle diffusion and hence higher Biotnumbers. Based on this observation, limits of applicability were defined for LDFand CPHSDM. When designing fixed-bed adsorbers, model selection based onknown or estimated Biot and Stanton numbers is possible.
6.1 introduction
Granular ferric hydroxide is an effective adsorbent for removal of arsenate fromgroundwater (GW) [36]. Its suitability for the removal of various anions, e.g.,phosphate and organic acids, is under current research [57, 58]. Investigatedanions show a non-uniform behaviour during breakthrough in fixed-bed columns,resulting in different shapes of the breakthrough curves. From an engineeringpoint of view, models are helpful for the appropriate design of fixed-bed filters.Surface complexation models are widely used to describe adsorption [40] in a stateof equilibrium, but cannot predict the dynamic process of breakthrough of fixed-bed filters. For this purpose, models combining adsorption equilibrium data withmass transport are required. In this study, anion breakthrough is predicted usingmodels which already have been established for trace organics adsorption ontogranular activated carbon and are commonly available as PC software. Dependingon the respective anion and the operational conditions, model selection anddetermination of input parameters are discussed.
1 Technische Universität Berlin2 UNESCO-IHE, Delft3 Technische Universität Dresden
51
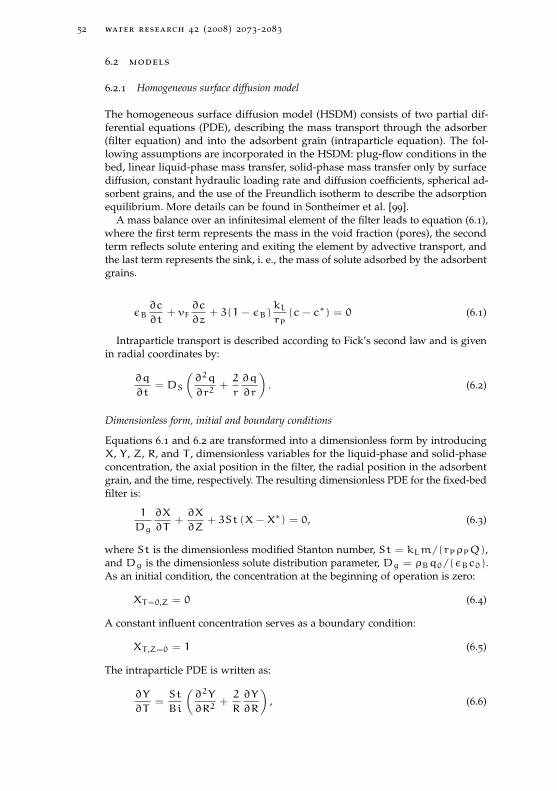
52 water research 42 (2008) 2073-2083
6.2 models
6.2.1 Homogeneous surface diffusion model
The homogeneous surface diffusion model (HSDM) consists of two partial dif-ferential equations (PDE), describing the mass transport through the adsorber(filter equation) and into the adsorbent grain (intraparticle equation). The fol-lowing assumptions are incorporated in the HSDM: plug-flow conditions in thebed, linear liquid-phase mass transfer, solid-phase mass transfer only by surfacediffusion, constant hydraulic loading rate and diffusion coefficients, spherical ad-sorbent grains, and the use of the Freundlich isotherm to describe the adsorptionequilibrium. More details can be found in Sontheimer et al. [99].
A mass balance over an infinitesimal element of the filter leads to equation (6.1),where the first term represents the mass in the void fraction (pores), the secondterm reflects solute entering and exiting the element by advective transport, andthe last term represents the sink, i. e., the mass of solute adsorbed by the adsorbentgrains.
εB∂c
∂t+ vF
∂c
∂z+ 3(1−εB)
kLrP
(c− c∗) = 0 (6.1)
Intraparticle transport is described according to Fick’s second law and is givenin radial coordinates by:
∂q
∂t=DS
(∂2q
∂r2+2
r
∂q
∂r
). (6.2)
Dimensionless form, initial and boundary conditions
Equations 6.1 and 6.2 are transformed into a dimensionless form by introducingX, Y, Z, R, and T , dimensionless variables for the liquid-phase and solid-phaseconcentration, the axial position in the filter, the radial position in the adsorbentgrain, and the time, respectively. The resulting dimensionless PDE for the fixed-bedfilter is:
1
Dg
∂X
∂T+∂X
∂Z+ 3St (X−X∗) = 0, (6.3)
where St is the dimensionless modified Stanton number, St = kLm/(rPρPQ),and Dg is the dimensionless solute distribution parameter, Dg = ρBq0/(εBc0).As an initial condition, the concentration at the beginning of operation is zero:
XT=0,Z = 0 (6.4)
A constant influent concentration serves as a boundary condition:
XT ,Z=0 = 1 (6.5)
The intraparticle PDE is written as:
∂Y
∂T=St
Bi
(∂2Y
∂R2+2
R
∂Y
∂R
), (6.6)
6.2 models 53
where Bi is the dimensionless Biot number, Bi = kLrPc0/(DSρPqo). Initially,the solid-phase concentration is zero:
YT=0,Z,R = 0 (6.7)
The boundary condition for the particle center is symmetry:
∂Y
∂R
∣∣∣∣R=0
= 0 (6.8)
At the exterior adsorbent grain surface, the mass transported into the grain equalsthe mass transported through the stagnant liquid film. The resulting boundarycondition for the particle surface is:
∂Y
∂R
∣∣∣∣R=1
= Bi (X−X∗) , (6.9)
which includes the description of the adsorption equilibrium by the Freundlich[51] equation:
YR=1 = X∗n, (6.10)
where n is the dimensionless Freundlich exponent.
Numerical solution
The finite differences method was applied to solve the set of partial differentialequations in three steps:
1. Choice of grid (Discretization)
2. Substitute differential quotients by differences quotients
3. Solve resulting equations with regard to initial and boundary conditionsand iteration to ensure that both PDEs are solved simultaneously
For the filter PDE (6.3), an explicit calculation scheme is derived using forwarddifferences for temporal derivatives and backward differences for spatial deriva-tives, since mass transport in the filter is governed by advection. This methodis also known as Forward Time Backward Space (FTBS). The resulting explicitecalculation scheme for the dimensionless liquid-phase concentration is shown inEquation (6.11):
Xi+1,j = Xi,j −α[Xi,j −Xi,j−1
]−β
[Xi,j −X
∗i,j]
, (6.11)
with α = Dg∆T/∆Z and β = 3StDg∆T . For the intraparticle equation, for-ward differences substitute the temporal derivatives, whereas central differencesare used for the spatial derivatives (Forward Time Central Space-FTCS). Thismethod is appropriate when the mass transport is thought to be mainly diffu-sion. The resulting explicite calculation scheme for the dimensionless solid-phaseconcentration then follows:
Yi+1,k = Yi,k +γ ·[(1+
1
R
)Yi,k+1 − 2Yi,k +
(1−
1
R
)Yi,k−1
], (6.12)
54 water research 42 (2008) 2073-2083
with γ = Ed∆T/∆R2. The boundary conditions (Eqs. 6.8 and 6.9) are trans-formed accordingly using a ghost-point method. The stability of the numericalalgorithms strongly depends on the model parameters Bi, St, n, and the chosengrid width ∆Z, ∆T , and ∆R. To guarantee the stability and consistency of thenumerical solution, the following criteria have to be met:
α < 1.0, (6.13)
β < 0.3, (6.14)
γ < 0.5. (6.15)
Using these equations, the optimal grid width can be calculated for every combi-nation of the model parameters. For the HSDM calculations the software FAST 2.0(Fixed-bed Adsorption Simulation Tool) was developed. For comparison, thesoftware package AdDesignS 1.0 (Adsorption Design Software, Michigan Techno-logical University) was used.
6.2.2 Constant pattern homogeneous surface diffusion model
In an attempt to provide an user-oriented tool to predict the breakthrough, Handet al. [64] presented the constant pattern homogeneous surface diffusion model(CPHSDM). Using numerically derived solutions for the HSDM, a simple algebraicequation was used to approximate the model solution:
T(Bi,n,Stmin) =A0 +A1 ·XA2 +A3
1.01−XA4(6.16)
The coefficients Ai used in Eq. 6.16 were published in data tables [64]. TheCPHSDM offers a high calculation speed. As a trade-off, the model simulationsdo not represent true results of the HSDM and might differ substantially fromthose. Advances in the power of personal computers have made it possible touse the HSDM also in engineering practise, therefore reducing the need forapproximations such as CPHSDM. CPHSDM calculations were performed usingMS Excel and AdDesignS.
6.2.3 Linear driving force model
In order to reduce the amount of computation and increase the calculation speed,it is possible to simplify Eq. (6.2), e.g., by using approximations for the intraparticlediffusion rate. The most widely used approximation is a linear one, referred to aslinear driving force (LDF), derived by Glueckauf [59]:
∂q
∂t=15DSr2P
· (q∗ −q), (6.17)
6.3 parameter estimation 55
where q represents the average solid-phase concentration in the adsorbent grain.This approximation is only valid forDS · t/r2P > 0.1 [59]. In dimensionless form,this equation can be written as:
∂Y
∂T= 3St (X−X∗) = 15Ed (Y∗ −Y) (6.18)
XT=0,Z = 0;YT=0,Z = 0 (6.19)
XT ,Z=0 = 1 (6.20)
LDF model calculations were performed using the software LDF 1.3 (EckhardWorch) and FAST 2.0.
6.3 parameter estimation
To predict breakthrough of fixed-bed systems, the model input parameters haveto be known. These values are either easily accessible (outer model parameters)or must be determined indirectly from accordingly designed experiments (innermodel parameters). Since the parameters do not act independently to influenceadsorber performance, they can be summarized in dimensionless groups (essentialmodel parameters) to reduce the number of influencing parameters.
6.3.1 Outer model parameters
Outer model parameters, in contrast to inner model parameters, are usuallyknown or can be determined easily. They represent operational conditions and/oradsorber geometry. Outer model parameters include the grain size, grain density,volumetric flow rate, influent concentration, adsorbent mass, and density of theadsorber bed. Although these parameters can be measured easily, some of themare not constant over the adsorber column. Hence, average values have to be used.
6.3.2 Inner model parameters
Inner model parameters cannot be easily measured but have to be determined inespecially designed experiments. They can also be determined by empirical corre-lations from the literature or derived from column data. Adsorption equilibriumparameters, Freundlich n and KF, the liquid-phase mass transfer coefficient kL,and the surface diffusion coefficientDS fall in this category. Adsorption equilib-rium parameters were derived in two ways. First, batch equilibrium isothermsusing ground material were performed. The smaller grain size allows for a shortequilibration time. The resulting isotherm data were described by the Freundlich[51] equation. Second, breakthrough curves were evaluated: integration of a com-plete BTC provided a reliable isotherm point for the fraction used in the columnexperiment. Assuming a value for n, KF can be determined. This approach islegitimate if the influence of n on the BTC is small or n is known from previousexperiments.
56 water research 42 (2008) 2073-2083
Film diffusion coefficients were estimated by the Gnielinski [60] correlation. Tovalidate this approach, kL was determined using differential column batch reactor(DCBR) tests and the results were compared. In DCBR experiments operated atdifferent HLRs of 14 to 75 m h−1, it was also shown that external mass transfer isnot predominant. The concentration decrease in the DCBR was independent fromthe chosen HLR. Also, variation of the film diffusion coefficient in the numericalapplication of the HSDM did not show differences in the resulting kinetic andbreakthrough curves.
Surface diffusion coefficients were determined both independently from separateDCBR tests, as well as derived from laboratory-scale column experiments. In bothcases, a best-fitDS was determined by comparing HSDM model simulations toexperimental data.
6.3.3 Essential model parameters/ dimensionless numbers
The influence of the dimensionless groups on the form of the BTC has beenthoroughly investigated [99]. Hand et al. [64] successfully applied the HSDMfor over 100 adsorbate-adsorbent (organic pollutant - activated carbon) systems.The 10 inner and outer input parameters defining the shape of the BTC canbe transformed into four remaining dimensionless groups, Bi, St, Dg, and n.Therefore, these parameters are decisive when discussing model attributes orshortcomings.
6.3.4 General (non-model) parameters
General (non-model) parameters are not directly considered in the model equa-tions, but influence the value of inner and outer model parameters and thusindirectly influence the breakthrough. Examples are the type of adsorbate, tem-perature, ionic strength and pH. In the investigated systems, pH is especiallyimportant. Previous studies have found that the adsorption equilibrium is stronglydependent on pH [58]. Literature suggests that surface diffusivity is a functionof pH. Investigations on intraparticle diffusion of metal contaminants in microp-orous adsorbents [7] showed a decrease in DS with increasing pH, attributed to areduced metal affinity for the oxide and surface site density.
6.4 materials and methods
6.4.1 GFH and water composition
GFH was obtained from the producer (GEH Wasserchemie, Osnabrück). GFH ispredominately akaganeite, a poorly crystallised iron oxide. The specific surfacearea is reported to be 280 m2 g−1 and its pHPZC (point of zero charge) is between7.5 and 8.0 [110]. More recent investigations determined a pHPZNPC (point of zeronet proton charge) of 5.7 and a pHIEP (iso electric point) of 7.5 and comparablevalues for the specific surface area [96]. The commercially available material hasa grain size range of 0.32 - 2.0 mm [38]. Different artificial model waters wereprepared by adding either arsenate, phosphate or salicylic acid and NaCl (10 mmolL−1) to deionized (DI) water or Berlin drinking (DW) water (pH 7.5, [DOC]=4.5mg L−1, [Ca2+]=2.5 mmol L−1), respectively. In the column experiments con-
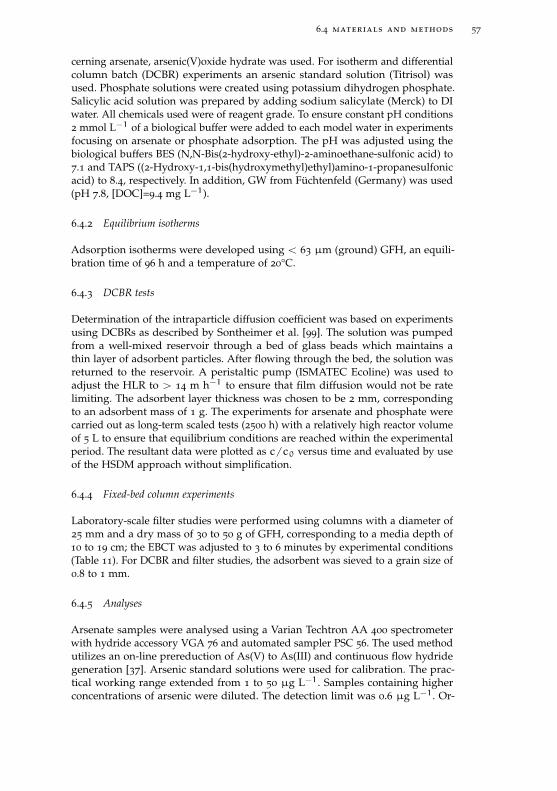
6.4 materials and methods 57
cerning arsenate, arsenic(V)oxide hydrate was used. For isotherm and differentialcolumn batch (DCBR) experiments an arsenic standard solution (Titrisol) wasused. Phosphate solutions were created using potassium dihydrogen phosphate.Salicylic acid solution was prepared by adding sodium salicylate (Merck) to DIwater. All chemicals used were of reagent grade. To ensure constant pH conditions2 mmol L−1 of a biological buffer were added to each model water in experimentsfocusing on arsenate or phosphate adsorption. The pH was adjusted using thebiological buffers BES (N,N-Bis(2-hydroxy-ethyl)-2-aminoethane-sulfonic acid) to7.1 and TAPS ((2-Hydroxy-1,1-bis(hydroxymethyl)ethyl)amino-1-propanesulfonicacid) to 8.4, respectively. In addition, GW from Füchtenfeld (Germany) was used(pH 7.8, [DOC]=9.4 mg L−1).
6.4.2 Equilibrium isotherms
Adsorption isotherms were developed using < 63 µm (ground) GFH, an equili-bration time of 96 h and a temperature of 20°C.
6.4.3 DCBR tests
Determination of the intraparticle diffusion coefficient was based on experimentsusing DCBRs as described by Sontheimer et al. [99]. The solution was pumpedfrom a well-mixed reservoir through a bed of glass beads which maintains athin layer of adsorbent particles. After flowing through the bed, the solution wasreturned to the reservoir. A peristaltic pump (ISMATEC Ecoline) was used toadjust the HLR to > 14 m h−1 to ensure that film diffusion would not be ratelimiting. The adsorbent layer thickness was chosen to be 2 mm, correspondingto an adsorbent mass of 1 g. The experiments for arsenate and phosphate werecarried out as long-term scaled tests (2500 h) with a relatively high reactor volumeof 5 L to ensure that equilibrium conditions are reached within the experimentalperiod. The resultant data were plotted as c/c0 versus time and evaluated by useof the HSDM approach without simplification.
6.4.4 Fixed-bed column experiments
Laboratory-scale filter studies were performed using columns with a diameter of25 mm and a dry mass of 30 to 50 g of GFH, corresponding to a media depth of10 to 19 cm; the EBCT was adjusted to 3 to 6 minutes by experimental conditions(Table 11). For DCBR and filter studies, the adsorbent was sieved to a grain size of0.8 to 1 mm.
6.4.5 Analyses
Arsenate samples were analysed using a Varian Techtron AA 400 spectrometerwith hydride accessory VGA 76 and automated sampler PSC 56. The used methodutilizes an on-line prereduction of As(V) to As(III) and continuous flow hydridegeneration [37]. Arsenic standard solutions were used for calibration. The prac-tical working range extended from 1 to 50 µg L−1. Samples containing higherconcentrations of arsenic were diluted. The detection limit was 0.6 µg L−1. Or-
58 water research 42 (2008) 2073-2083
thophosphate was determined using a flow injection analyzer (FIAstar 5000, FossTecator) according to ISO 15681-1. The standard deviation was determined tobe 4.8 % at a mean concentration of 0.016 mg L−1 P and 0.77 % at 3.8 mg L−1
with a detection limit of 3 µg L−1. Salicylic acid concentrations were determinedphotometrically at 230 nm using a Pharmacia Biotech Ultrospec 3000. pH wasmeasured by a WTW pH 340-meter using a Sentix 41-electrode (WTW). DOC wasanalysed by thermal-catalytic oxidation using a High-TOC analyser (ElementarAnalysensysteme, Germany).
6.5 results
6.5.1 Adsorption equilibrium
The investigated anions show different affinities to the GFH surface and corre-sponding equilibrium solid-phase concentrations (Table 10). GFH shows highcapacities for arsenate and phosphate adsorption. DOC and salicylic acid alsoadsorb onto GFH, but show a comparatively poorer affinity to GFH. For arsenateand phosphate, equilibrium data from batch isotherm experiments were comparedto the equilibrium data point calculated from the integration of the breakthroughcurve. The corresponding Freundlich parameters were calculated assuming thesame value of n. For phosphate, the calculated solid-phase concentrations matchthe data from isotherm experiments, whereas for arsenate, the isotherm dataunderestimate the breakthrough. DOC adsorption of GW NOM from Fuechtenfeldshows a non-adsorbable fraction of 1.45 mg L−1. This fraction must be consideredseparately during subsequent modelling.
Table 10: Adsorption equilibrium for different adsorbates
Adsorbate Water pH Adsorption equilibrium constants Data source
matrix KF [Ln mg mg−n g−1] n [-]
Arsenate DW 8.0 32.3 0.29 Integration BTC
Arsenate DW 8.4 23.4 0.29 Isotherm experiment
Phosphate DW 7.7 14.9 0.19 Isotherm experiment
Phosphate DW 8.2 14.9 0.19 Integration BTC
DOC GW 7.8 8.0 0.62 Genz et al. [58]
Salicylic acid DI 7.0 4.3 0.52 Sperlich et al. [101]
6.5.2 Adsorption kinetics
In Table 11, the determined surface diffusion coefficients are shown. Generally,diffusion coefficients are in the order of 10
−14 to 10−15 m2 s−1, indicating a very
slow intraparticle diffusion compared to values known from activated carbon.Although surface diffusivity is assumed to be constant in the equations of thetransport models, it has been shown that DS is a function of liquid- and solid-phase adsorbate concentration and also particle size [99]. DS values from theliterature can therefore only be used for identical adsorbate/ adsorbent pairs,particle size and initial concentration. Regarding the GFH/ arsenate system, fewauthors have published DS values [8, 101].
6.5 results 59
Table 11: Adsorption kinetics for different adsorbates
Adsorbate Water pH Intraparticle diffusion coefficient Data source
matrix DS [m2 s−1]
Arsenate DI 8.4 3·10−15 DCBR
Arsenate DW 8.0 8·10−15 Best-fit BTC
Phosphate DI 8.4 2·10−15 DCBR
Phosphate DW 8.2 2·10−14 Best-fit BTC
DOC GW 7.8 4·10−14 DCBR
DOC GW 7.8 3·10−14 Best-fit BTC
Salicylic acid DI 7.0 5·10−13 DCBR
Salicylic acid DI 7.0 2·10−13 Best-fit BTC
Badruzzaman et al. [8] found DS values of approx. 6.4·10−15 m2 s−1 for a
10 x 30 mesh (0.6 - 2 mm) fraction of GFH and a corresponding Biot number of 19 intheir experiments. This agrees well with theDS values found in this study, whichare slightly lower, but in the same order of magnitude. The determined valuesalso fit in the range of surface diffusivities from 10
−16 to 10−10 m2 s−1 reported
in the literature [7]. In another recent study [49] the GFH surface diffusivity forNOM was determined to be between 4 and 8·10
−15 m2 s−1. DCBR tests [58] showvalues of the same magnitude. The column data presented here appear to showslightly higher diffusivities (Table 11). Compared to arsenate and phosphate, DOCand salicyclic acid are less strongly bound to the adsorbent surface, which resultsin higher diffusivities. In comparison to salicylic acid which shows comparablecapacities, DOC represents a complex mixture of organic macromolecules and themolecular size might cause slower surface diffusion.
0.0 0.5 1.0 1.5 2.00.0
0.2
0.4
0.6
0.8
1.0
0.0 0.5 1.0 1.5 2.00.0
0.2
0.4
0.6
0.8
1.0
0.0 0.5 1.0 1.5 2.00.0
0.2
0.4
0.6
0.8
1.0
0.0 0.5 1.0 1.5 2.0
3rd category: Bi > 30solid-phase mass transfer ratecontrols the adsorption process
2nd category: 0.5 < Bi ≤ 30liquid-phase and solid-phasemass transfer rate controls theadsorption process
c/c 0
T
1st category: Bi ≤ 0.5liquid-phase mass transfer rate controls the adsorption process
CPHSDMLDFHSDMBi=0.5
CPHSDMLDFHSDMBi=10c/
c 0
T
Bi=100
CPHSDM
c/c 0
T
LDF
HSDM
T
Figure 21: Categories defined by Hand et al. [64] and corresponding model simulations (St=5,n=0.2)
6.5.3 Breakthrough Curves and Simulations
Dimensionless groups analysis shows important differences between the per-formed breakthrough experiments, resulting in different breakthrough characteris-tics. According to Hand et al. [64], three categories of breakthrough curves weredefined (Figure 21), corresponding to different Biot numbers. Whereas the BTCsfor salicylic acid (Bi=16, St=7) and DOC (Bi=23, St=4) are in category 2, arsenicand phosphate breakthrough experiments were performed with higher Bi values
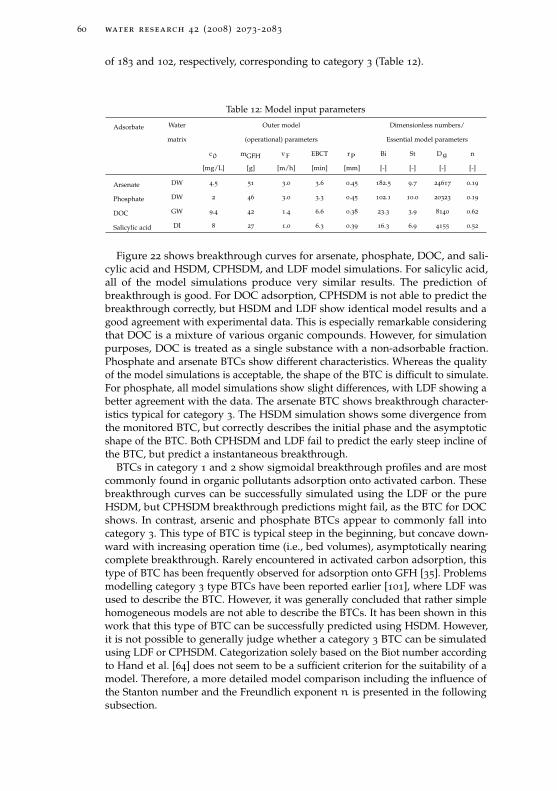
60 water research 42 (2008) 2073-2083
of 183 and 102, respectively, corresponding to category 3 (Table 12).
Table 12: Model input parameters
Adsorbate Water Outer model Dimensionless numbers/
matrix (operational) parameters Essential model parameters
c0 mGFH vF EBCT rP Bi St Dg n
[mg/L] [g] [m/h] [min] [mm] [-] [-] [-] [-]
Arsenate DW 4.5 51 3.0 3.6 0.45 182.5 9.7 24617 0.19
Phosphate DW 2 46 3.0 3.3 0.45 102.1 10.0 20323 0.19
DOC GW 9.4 42 1.4 6.6 0.38 23.3 3.9 8140 0.62
Salicylic acid DI 8 27 1.0 6.3 0.39 16.3 6.9 4155 0.52
Figure 22 shows breakthrough curves for arsenate, phosphate, DOC, and sali-cylic acid and HSDM, CPHSDM, and LDF model simulations. For salicylic acid,all of the model simulations produce very similar results. The prediction ofbreakthrough is good. For DOC adsorption, CPHSDM is not able to predict thebreakthrough correctly, but HSDM and LDF show identical model results and agood agreement with experimental data. This is especially remarkable consideringthat DOC is a mixture of various organic compounds. However, for simulationpurposes, DOC is treated as a single substance with a non-adsorbable fraction.Phosphate and arsenate BTCs show different characteristics. Whereas the qualityof the model simulations is acceptable, the shape of the BTC is difficult to simulate.For phosphate, all model simulations show slight differences, with LDF showing abetter agreement with the data. The arsenate BTC shows breakthrough character-istics typical for category 3. The HSDM simulation shows some divergence fromthe monitored BTC, but correctly describes the initial phase and the asymptoticshape of the BTC. Both CPHSDM and LDF fail to predict the early steep incline ofthe BTC, but predict a instantaneous breakthrough.
BTCs in category 1 and 2 show sigmoidal breakthrough profiles and are mostcommonly found in organic pollutants adsorption onto activated carbon. Thesebreakthrough curves can be successfully simulated using the LDF or the pureHSDM, but CPHSDM breakthrough predictions might fail, as the BTC for DOCshows. In contrast, arsenic and phosphate BTCs appear to commonly fall intocategory 3. This type of BTC is typical steep in the beginning, but concave down-ward with increasing operation time (i.e., bed volumes), asymptotically nearingcomplete breakthrough. Rarely encountered in activated carbon adsorption, thistype of BTC has been frequently observed for adsorption onto GFH [35]. Problemsmodelling category 3 type BTCs have been reported earlier [101], where LDF wasused to describe the BTC. However, it was generally concluded that rather simplehomogeneous models are not able to describe the BTCs. It has been shown in thiswork that this type of BTC can be successfully predicted using HSDM. However,it is not possible to generally judge whether a category 3 BTC can be simulatedusing LDF or CPHSDM. Categorization solely based on the Biot number accordingto Hand et al. [64] does not seem to be a sufficient criterion for the suitability of amodel. Therefore, a more detailed model comparison including the influence ofthe Stanton number and the Freundlich exponent n is presented in the followingsubsection.
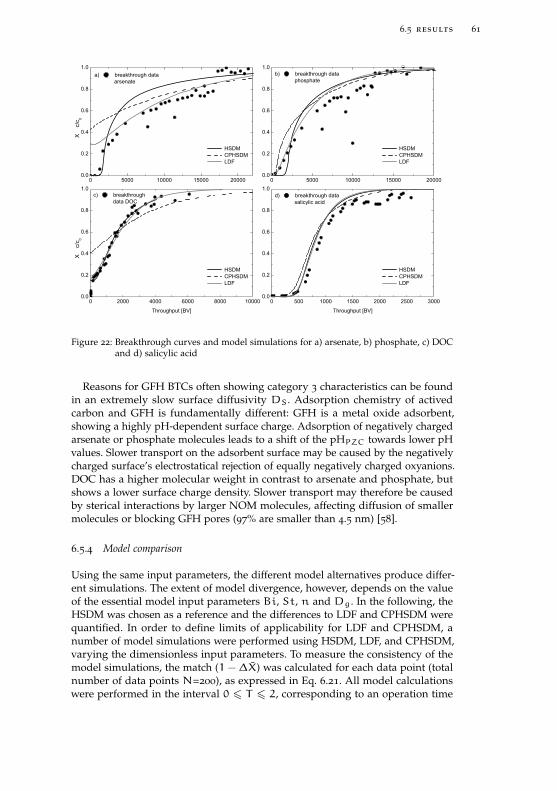
6.5 results 61
0 5000 10000 15000 200000.0
0.2
0.4
0.6
0.8
1.0
0 5000 10000 15000 200000.0
0.2
0.4
0.6
0.8
1.0
0 500 1000 1500 2000 2500 30000.0
0.2
0.4
0.6
0.8
1.0
0 2000 4000 6000 8000 100000.0
0.2
0.4
0.6
0.8
1.0
HSDM CPHSDM LDF
X
c/c
0b) breakthrough data phosphate
HSDM CPHSDM LDF
d) breakthrough data salicylic acid
HSDM CPHSDM LDF
Throughput [BV]
X
c/c
0
c) breakthrough data DOC
a) breakthrough data arsenate
HSDM CPHSDM LDF
Throughput [BV]
Figure 22: Breakthrough curves and model simulations for a) arsenate, b) phosphate, c) DOCand d) salicylic acid
Reasons for GFH BTCs often showing category 3 characteristics can be foundin an extremely slow surface diffusivity DS. Adsorption chemistry of activedcarbon and GFH is fundamentally different: GFH is a metal oxide adsorbent,showing a highly pH-dependent surface charge. Adsorption of negatively chargedarsenate or phosphate molecules leads to a shift of the pHPZC towards lower pHvalues. Slower transport on the adsorbent surface may be caused by the negativelycharged surface’s electrostatical rejection of equally negatively charged oxyanions.DOC has a higher molecular weight in contrast to arsenate and phosphate, butshows a lower surface charge density. Slower transport may therefore be causedby sterical interactions by larger NOM molecules, affecting diffusion of smallermolecules or blocking GFH pores (97% are smaller than 4.5 nm) [58].
6.5.4 Model comparison
Using the same input parameters, the different model alternatives produce differ-ent simulations. The extent of model divergence, however, depends on the valueof the essential model input parameters Bi, St, n and Dg. In the following, theHSDM was chosen as a reference and the differences to LDF and CPHSDM werequantified. In order to define limits of applicability for LDF and CPHSDM, anumber of model simulations were performed using HSDM, LDF, and CPHSDM,varying the dimensionless input parameters. To measure the consistency of themodel simulations, the match (1−∆X̄) was calculated for each data point (totalnumber of data points N=200), as expressed in Eq. 6.21. All model calculationswere performed in the interval 0 6 T 6 2, corresponding to an operation time
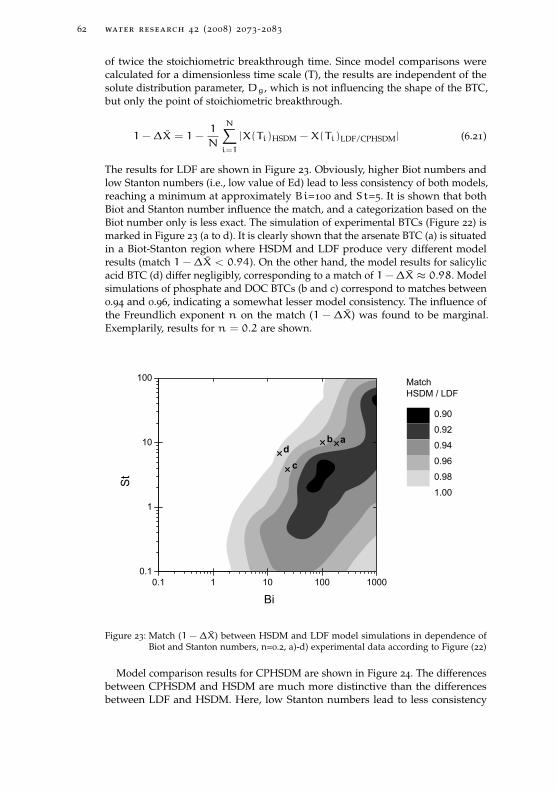
62 water research 42 (2008) 2073-2083
of twice the stoichiometric breakthrough time. Since model comparisons werecalculated for a dimensionless time scale (T), the results are independent of thesolute distribution parameter, Dg, which is not influencing the shape of the BTC,but only the point of stoichiometric breakthrough.
1−∆X̄ = 1−1
N
N∑i=1
|X(Ti)HSDM −X(Ti)LDF/CPHSDM| (6.21)
The results for LDF are shown in Figure 23. Obviously, higher Biot numbers andlow Stanton numbers (i.e., low value of Ed) lead to less consistency of both models,reaching a minimum at approximately Bi=100 and St=5. It is shown that bothBiot and Stanton number influence the match, and a categorization based on theBiot number only is less exact. The simulation of experimental BTCs (Figure 22) ismarked in Figure 23 (a to d). It is clearly shown that the arsenate BTC (a) is situatedin a Biot-Stanton region where HSDM and LDF produce very different modelresults (match 1−∆X̄ < 0.94). On the other hand, the model results for salicylicacid BTC (d) differ negligibly, corresponding to a match of 1−∆X̄ ≈ 0.98. Modelsimulations of phosphate and DOC BTCs (b and c) correspond to matches between0.94 and 0.96, indicating a somewhat lesser model consistency. The influence ofthe Freundlich exponent n on the match (1−∆X̄) was found to be marginal.Exemplarily, results for n = 0.2 are shown.
0.1 1 10 100 10000.1
1
10
100
ab
cd
0.90
0.92
0.94
0.96
0.98
1.00
MatchHSDM / LDF
Bi
St
Figure 23: Match (1−∆X̄) between HSDM and LDF model simulations in dependence ofBiot and Stanton numbers, n=0.2, a)-d) experimental data according to Figure (22)
Model comparison results for CPHSDM are shown in Figure 24. The differencesbetween CPHSDM and HSDM are much more distinctive than the differencesbetween LDF and HSDM. Here, low Stanton numbers lead to less consistency
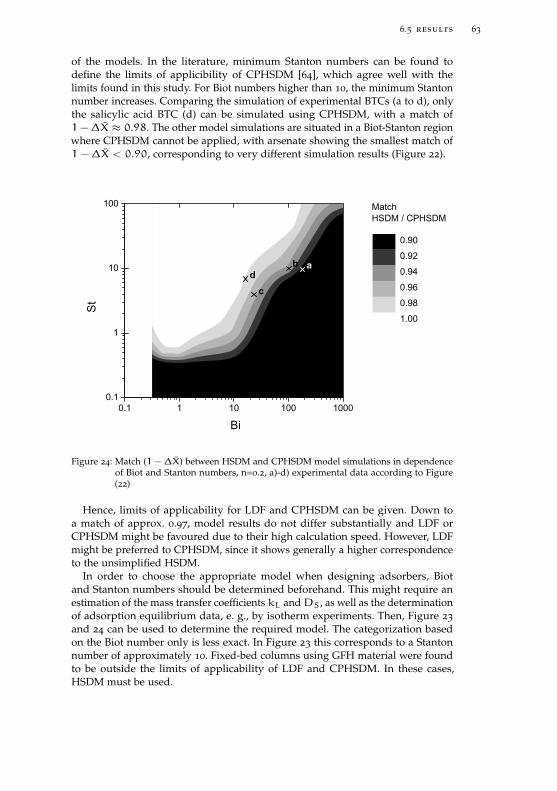
6.5 results 63
of the models. In the literature, minimum Stanton numbers can be found todefine the limits of applicibility of CPHSDM [64], which agree well with thelimits found in this study. For Biot numbers higher than 10, the minimum Stantonnumber increases. Comparing the simulation of experimental BTCs (a to d), onlythe salicylic acid BTC (d) can be simulated using CPHSDM, with a match of1−∆X̄ ≈ 0.98. The other model simulations are situated in a Biot-Stanton regionwhere CPHSDM cannot be applied, with arsenate showing the smallest match of1−∆X̄ < 0.90, corresponding to very different simulation results (Figure 22).
0.1 1 10 100 10000.1
1
10
100
b
cd
a
0.90
0.92
0.94
0.96
0.98
1.00
MatchHSDM / CPHSDM
Bi
St
Figure 24: Match (1−∆X̄) between HSDM and CPHSDM model simulations in dependenceof Biot and Stanton numbers, n=0.2, a)-d) experimental data according to Figure(22)
Hence, limits of applicability for LDF and CPHSDM can be given. Down toa match of approx. 0.97, model results do not differ substantially and LDF orCPHSDM might be favoured due to their high calculation speed. However, LDFmight be preferred to CPHSDM, since it shows generally a higher correspondenceto the unsimplified HSDM.
In order to choose the appropriate model when designing adsorbers, Biotand Stanton numbers should be determined beforehand. This might require anestimation of the mass transfer coefficients kL andDS, as well as the determinationof adsorption equilibrium data, e. g., by isotherm experiments. Then, Figure 23
and 24 can be used to determine the required model. The categorization basedon the Biot number only is less exact. In Figure 23 this corresponds to a Stantonnumber of approximately 10. Fixed-bed columns using GFH material were foundto be outside the limits of applicability of LDF and CPHSDM. In these cases,HSDM must be used.

64 water research 42 (2008) 2073-2083
6.6 conclusions
• Breakthrough curves for the adsorption of arsenate, phosphate, DOC, andsalicylic acid onto granular ferric hydroxide (GFH) can be predicted usingthe HSDM.
• The applicability of LDF and CPHSDM (HSDM simplifications) is limitedand depends on the values of the dimensionless Biot and Stanton numbers.Arsenate adsorption onto GFH shows very slow surface diffusion coefficients,leading to high Biot numbers. In most cases, LDF and CPHSDM are not ableto describe arsenate breakthrough in GFH fixed-bed filters.
• Limits of applicability for LDF and CPHSDM were defined. When designingfixed-bed adsorbers, model selection based on known or estimated Biot andStanton numbers is possible.
7R E G E N E R AT I O N O F G R A N U L A R F E R R I C H Y D R O X I D EA D S O R P T I O N F I LT E R S F O R T R A C E P H O S P H AT E R E M O VA L
Alexander Sperlich1, Mathias Riechel1 and Martin Jekel1
as prepared for Water Research
abstract
The regeneration and multiple use of Granular Ferric Hydroxide (GFH) whichhas shown high capacities for phosphate removal was investigated and comparedto an alternative iron based adsorbent media (FerroSorp Plus, FS). Batch andfixed-bed column studies show that GFH is stable at high pH and can be effi-ciently regenerated using 1 M NaOH. Approximately 80 % of the initially boundphosphate can be eluated. However, the incomplete desorption leads to decreasingcapacities with each additional use. Multiple uses are thus limited, but at leastthree operation cycles are feasible. FS shows lower total capacities than GFHand similarly decreasing desorption efficiency and capacity. Indications for theinstability of FS at high pH and desorption of phosphate and organic matter fromthe unused adsorbent were observed. GFH desorption is fast and most of thedesorbable phosphate could be eluated using 4 - 6 bed volumes of regenerant. Areuse of the regenerant solution is possible. Despite high phosphate concentrationsin the regenerate, 61 - 85 % of the bound phosphate could be desorbed. A recoveryof phosphate from the highly concentrated regenerant stream (up to 3.5 g/L P)is possible. Precipitation with lime water resulted in 90 % P removal and a plantavailable precipitate which might be used as a fertilizer. These results suggest thatregeneration and multiple use of GFH can significantly increase operation timesof fixed-bed adsorbers and be an economically favourable option compared tosingle use.
7.1 introduction
Due to the adverse environmental impacts of phosphate discharges into surfacewaters and the increasing scarcity of mineral phosphate reserves, the developmentof appropriate techniques for phosphate removal and recovery has become anissue of common interest. Unlike traditional biological nutrient removal andchemical precipitation processes, fixed-bed adsorption onto metal oxides canreduce dissolved phosphate to near zero levels. This might be a requirementfor advanced wastewater treatment due to increasingly stringent regulations onphosphorus discharge [11, 65] as well as for restoration of surface water bodies.Granular ferric hydroxide (GFH) is an effective adsorbent for removal of arsenatefrom groundwater [35]. Also, its suitability for the removal of phosphate [57, 104]and DOC has been investigated. An alternative iron based adsorbent (FerroSorp
1 Technische Universität Berlin
65
66 paper 4 , prepared for water research
Plus, FS) which has also been shown to remove phosphate, arsenate and otheranions [55, 100] was used for comparison in this study. Due to the potential creationof a toxic and hardly disposable concentrate stream, regeneration of arsenic loadenadsorbent material is neither investigated nor desired. However, if metal oxideadsorption is used for phosphate or DOC removal, regeneration can increaseoperation time and cost effectiveness. A regenerant solution containing phosphateis not toxic and could be safely disposed off, e. g., to wastewater treatment plants.Moreover, most phosphate removed from the (waste) water is concentrated in arelatively small volume of spent regenerant and might be converted into a solidfertilizer by precipitation. In several studies, sodium hydroxide (NaOH) solutionhas been shown as suitable regenerant for metal oxide adsorbents as well as hybridanion exchange resins:
Donnert and Salecker [33] tested regeneration of activated alumina for phos-phate adsorption by 0.5 M NaOH and recovery of phosphate by precipitation withCa(OH)2. In this study, 90 % of the phosphate was precipitated as calcium phos-phate and the sludge contained 10 - 15 % P. Zhu and Jyo [131] used a zirconiumloaded phosphoric acid chelating resin for phosphate removal. More than 90 %of the removed phosphate could be eluted within 20 bed volumes using 0.5 MNaOH. Phosphate adsorption behaviour was not adversely affected by repeatedadsorption/ desorption cycles. Chitrakar et al. [19] used synthetic akaganeitefor selective phosphate adsorption from seawater and regenerated with 0.1 MNaOH. Almost no loss in capacity after up to 12 adsorption/ desorption cycleswas reported. Recently developed hybrid anion exchangers containing hydratedferric oxide nanoparticles were reported to remove phosphate and showed muchhigher capacities than the parent material [14, 83]. Solutions of 2 - 4 % (0.5 - 1 M)NaOH and 2 % NaCl were found very effective to desorb phosphate and > 95 %phosphate was desorbed after 12 bed volumes of regenerant. An economic assess-ment showed that the value of recovered phosphorus could not cover resin andregenerant costs, but potentially make adsorption and P recovery a favourableeconomic option compared to alternative treatments [83]. Genz et al. [57] studiedphosphate adsorption from MBR effluents onto GFH and activated alumina fol-lowed by regeneration with 0.6 M NaOH and reported no decrease in capacityafter three adsorption/ desorption cycles. A high regenerant to bed volume ratio(100 : 1) was used and a non-desorbable P fraction was supposed in long-termoperation. In pilot-scale operation using tertiary effluent, NaOH has been appliedsuccessfully to regenerate GFH adsorption filters [104].
This work’s objective was to study the regeneration and multiple application ofGFH along with an economic use of the regenerant. Desorption and adsorptioncapacity were quantified over several consecutive adsorption/ desorption cycles.Precipitation of the desorbed phosphate and recovery of a plant-available P-fertilizer was also investigated.
7.2 materials and methods
7.2.1 Adsorbent media
GFH was obtained from the producer (GEH Wasserchemie, Osnabrück, Germany).It is a synthetic, poorly crystallized iron(III) oxide-hydroxide and consists pre-dominantly of akaganeite (β-FeOOH). The moisture content is approx. 50 %. The
7.2 materials and methods 67
pHPZC (point of zero charge) is reported to be between 7.5 and 8.0 [109, 96]. In agrain size distribution analysis, the media was shown to contain particles rangingfrom < 0.2 mm to > 2 mm. The uniformity coefficient (d60/d10) was approx. 3.5,the effective grain size was 0.7 mm [100]. In the same study, the specific surfacearea was determined to be approx. 240 m2/g, whereas earlier studies reportedsomewhat higher values of 280 m2/g [38].
FerroSorp Plus, supplied by Zeolith Umwelttechnik GmbH (Waldsassen, Ger-many), is a granular adsorbent media based on ferric hydroxide. Manufacturer’s(HeGo Biotec GmbH, Berlin, Germany) data specify a grain-size range of 0.5 -2.0 mm and a water content of 10 - 15 %. An adsorption capacity for phosphateto be reached under optimal operational conditions of 12 - 16 g/kg P is stated. Aspecific surface area of 148 m2/g was determined [100].
All results are presented on a dry mass basis after drying at 105°Cfor 12 h andcooling in a desiccator.
7.2.2 Solutions
Model waters
Model solutions for batch experiments and differential column-batch reactor(DCBR) tests were prepared using de-ionized (DI) water and NaCl to ensure anionic strength of 10 mmol/L. Different concentrations of phosphate were set usingKH2PO4. The pH was adjusted to 7.1 using 2 mmol/L of the biological buffer BES(N,N-Bis(2-hydroxy-ethyl)-2-amino-ethane-sulfonic acid), which was shown to notinterfere with phosphorus adsorption in previous studies. The model solution forthe rapid small-scale column test (RSSCT) was prepared using drinking water(pH ≈ 8) without buffer addition but spiked with KH2PO4 to set a phosphateconcentration of 2 mg/L P.
Regenerants
For the regeneration of the exhausted adsorbents, 1 M sodium hydroxide solutionwas used. In DCBR tests, the columns were regenerated with fresh NaOH aftereach adsorption step. In batch experiments, the NaOH solution contained KH2PO4at concentrations of 0, 5, 10 and 20 mg/L P to simulate the regenerant’s reuse. Ina RSSCT, fresh NaOH was used for the first regeneration cycle and was reused forthe following regenerations, initially containing 432 and 832 mg/L P.
Precipitants and citric acid
Different precipitants were used for phosphorus recovery directly out of theregenerant. Lime water (10 % calcium hydroxide solution) was used to precipitatecalcium phosphate while solutions of magnesium chloride (MgCl2 · 6H2O) andammonium chloride (NH4Cl) were used to precipitate magnesium ammoniumphosphate (struvite) and potassium magnesium phosphate (potassium struvite),respectively. To determine the plant availability of the precipitated solid phosphatesa 2 % citric acid solution (pH 2.5) was used.
68 paper 4 , prepared for water research
7.2.3 Single-point batch isotherms
GFH and FS adsorption isotherms were developed using various samples ofground material of a grain size < 63 µm. Each sample was shaken with 200 mLof the model phosphate solution (DI water, ionic strength = 10 mmol/L, pH 7.1,c = 6 mg/L) for an equilibration time of 96 hours at room temperature (approx.20° C). After 96 hours, the sample was filtered over a 0.45 µm filter. Each sample ofloaded adsorbent was regenerated with 50 mL of 1 M sodium hydroxide solutionbeing shaken for two hours.
7.2.4 Differential column-batch reactor (DCBR) tests
Choice of regenerant
In a preliminary test, spent GFH material used in column experiments withphosphate spiked DI water was tested with NaOH solutions of different strengthand DI water. DCBRs containing approx. 1 g moist GFH media were operatedusing DI water and 0.01 M, 0.1 M and 1 M NaOH solution. After 2 h, the regeneratesolution was neutralized and analyzed for phosphate.
Adsorption/ desorption tests
A set of six DCBRs were operated using GFH (grain size range of 0.8 to 1 mm) andFS (grain size range of 0.5 - 1 mm). Whereas for two pairs of duplicate columns ofGFH and FS, a phosphate model solution (DI water, ionic strength 10 mmol/L,pH 7.1, c = 2 mg/L P) was used, a third pair of duplicates was operated usingFS and DI water. The columns were operated for 144 h in the first and 96 h inthe following two adsorption steps, each followed by a regeneration step using200 mL of fresh, phosphate-free NaOH.
7.2.5 Column experiments
Rapid small-scale column test (RSSCT)
A fixed-bed filter of GFH material with a grain size range of 0.1 - 0.2 mm wasoperated with a phosphate solution (drinking water, pH ≈ 8.0, c = 2 mg/L P,EBCT = 0.6 min) until complete breakthrough. The column’s output was dis-charged. After complete breakthrough, the column was regenerated with 200 mLof 1 M NaOH for one hour at a volumetric flow rate of 3.3 mL/min. To assess theefficiency of desorption and the capacity of regenerated GFH, the column wasoperated three times being regenerated with the same sample of NaOH after eachbreakthrough.
Desorption kinetics
Two GFH laboratory-scale columns (EBCT ≈ 3 min, 45 g dry matter of GFH)were operated using phosphate spiked Berlin drinking water (c ≈ 2 mg/L P). Thebreakthrough experiment is described in detail in Sperlich and Jekel [100]. Aftercomplete breakthrough, the columns were regenerated with 1 M NaOH solutionat a volumetric flow rate of 10 and 2.5 mL/min, respectively.
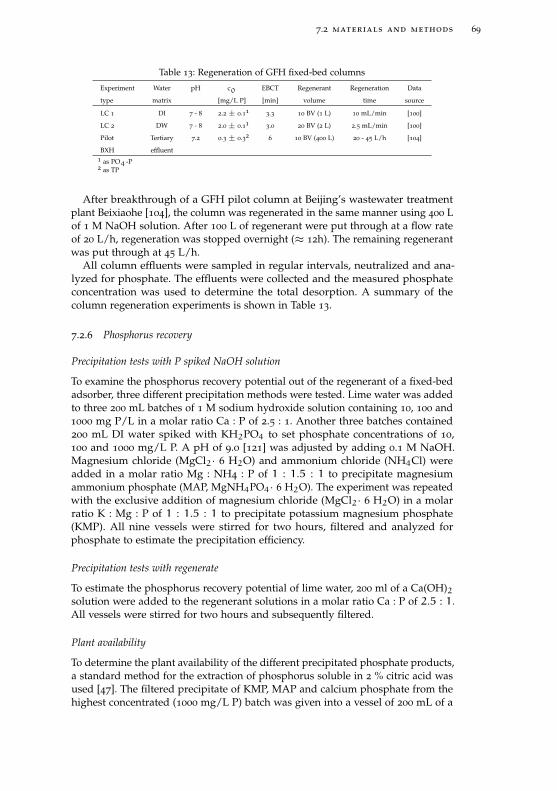
7.2 materials and methods 69
Table 13: Regeneration of GFH fixed-bed columns
Experiment Water pH c0 EBCT Regenerant Regeneration Data
type matrix [mg/L P] [min] volume time source
LC 1 DI 7 - 8 2.2± 0.113.3 10 BV (1 L) 10 mL/min [100]
LC 2 DW 7 - 8 2.0± 0.113.0 20 BV (2 L) 2.5 mL/min [100]
Pilot Tertiary 7.2 0.3± 0.326 10 BV (400 L) 20 - 45 L/h [104]
BXH effluent1 as PO4-P2 as TP
After breakthrough of a GFH pilot column at Beijing’s wastewater treatmentplant Beixiaohe [104], the column was regenerated in the same manner using 400 Lof 1 M NaOH solution. After 100 L of regenerant were put through at a flow rateof 20 L/h, regeneration was stopped overnight (≈ 12h). The remaining regenerantwas put through at 45 L/h.
All column effluents were sampled in regular intervals, neutralized and ana-lyzed for phosphate. The effluents were collected and the measured phosphateconcentration was used to determine the total desorption. A summary of thecolumn regeneration experiments is shown in Table 13.
7.2.6 Phosphorus recovery
Precipitation tests with P spiked NaOH solution
To examine the phosphorus recovery potential out of the regenerant of a fixed-bedadsorber, three different precipitation methods were tested. Lime water was addedto three 200 mL batches of 1 M sodium hydroxide solution containing 10, 100 and1000 mg P/L in a molar ratio Ca : P of 2.5 : 1. Another three batches contained200 mL DI water spiked with KH2PO4 to set phosphate concentrations of 10,100 and 1000 mg/L P. A pH of 9.0 [121] was adjusted by adding 0.1 M NaOH.Magnesium chloride (MgCl2· 6 H2O) and ammonium chloride (NH4Cl) wereadded in a molar ratio Mg : NH4 : P of 1 : 1.5 : 1 to precipitate magnesiumammonium phosphate (MAP, MgNH4PO4· 6 H2O). The experiment was repeatedwith the exclusive addition of magnesium chloride (MgCl2· 6 H2O) in a molarratio K : Mg : P of 1 : 1.5 : 1 to precipitate potassium magnesium phosphate(KMP). All nine vessels were stirred for two hours, filtered and analyzed forphosphate to estimate the precipitation efficiency.
Precipitation tests with regenerate
To estimate the phosphorus recovery potential of lime water, 200 ml of a Ca(OH)2solution were added to the regenerant solutions in a molar ratio Ca : P of 2.5 : 1.All vessels were stirred for two hours and subsequently filtered.
Plant availability
To determine the plant availability of the different precipitated phosphate products,a standard method for the extraction of phosphorus soluble in 2 % citric acid wasused [47]. The filtered precipitate of KMP, MAP and calcium phosphate from thehighest concentrated (1000 mg/L P) batch was given into a vessel of 200 mL of a
70 paper 4 , prepared for water research
2 % citric acid solution (pH 2.5). The vessels were stirred for 30 min to dissolvethe solid phosphates before filtering the solutions using a 0.45 µm filter. Finally,the fraction of soluble phosphate was calculated to assess the plant availability ofcalcium phosphate, magnesium ammonium phosphate and potassium magnesiumphosphate.
7.2.7 Analyses
Orthophosphate was determined using a flow injection analyzer (FIAstar 5000
Analyzer, FOSS Analytical, Denmark) according to ISO 15681-1. The standarddeviation was determined to be 4.8 % at a mean concentration of 0.016 mg/L Pand 0.77 % at 3.8 mg/L P with a detection limit of 3 µg/L. For pH measurementa WTW pH 340 with a Sentix 41 electrode (WTW, Germany) was used. Dissolvediron was determined by atomic absorption spectroscopy (Varian SpectrAA-300,VARIAN, USA) according to DIN 38 406-1. DOC was analysed by thermal-catalyticoxidation using a High-TOC analyser (Elementar Analysensysteme, Germany).UV absorption (254 nm) and color (436 nm) were determined using a Lambda 12
UV/VIS-spectrophotometer (Perkin-Elmer) with cuvettes of 1 cm length.
7.3 results and discussion
7.3.1 Capacity of the virgin adsorbent
As a prerequisite to assess the regeneration of the adsorbent media, the capacity ofthe unused, virgin material needed to be determined. Single-point batch isothermexperiments using ground material aimed at complete use of the adsorptioncapacity. After an equilibration time of 96 h, adsorption capacity of GFH and FSwas determined by a mass balance. For GFH, an average solid-phase concentrationof 13.3 ± 0.4 mg/g P at an equilibrium concentration of 3.4 ± 0.1 mg/L P couldbe determined. FS showed a similar performance with 12.1 ± 0.3 mg/g P at anequilibrium concentration of 3.4± 0.1 mg/L P. Isotherm data for GFH and FS [100]show comparable values, although no direct comparison is possible since theseisotherms were developed in a lower concentration range. In this range, capacitiesof FS are significantly lower than of GFH, which is much less pronounced athigher initial concentrations. A parallel control batch without adsorbent showedno concentration change.
DCBRs were operated using adsorbent material of 0.8 - 1.0 mm (GFH) and0.5 - 2 mm (FS) grain size and thus would have needed a longer equilibration timeto reach adsorption equilibrium. A solid-phase concentration of 7.4± 0.01 mg/g Pfor GFH was observed. For FS, the calculated solid-phase concentration was3.6 ± 0.3 mg/g P. These values are significantly lower than the single-pointisotherm data and do not represent adsorption equilibrium.
RSSCTs provide breakthrough data and allow direct assessment of operationtime or throughput until breakthrough. For the described column, breakthrough,defined as an effluent concentration of > 30 µg/L P, was reached after approx.3600 bed volumes (BV). By integrating the breakthrough curve, the correspondingsolid-phase concentration of 23.7 mg/g P was estimated. These significantly highercapacities are caused by the drinking water matrix. Very similar capacities were
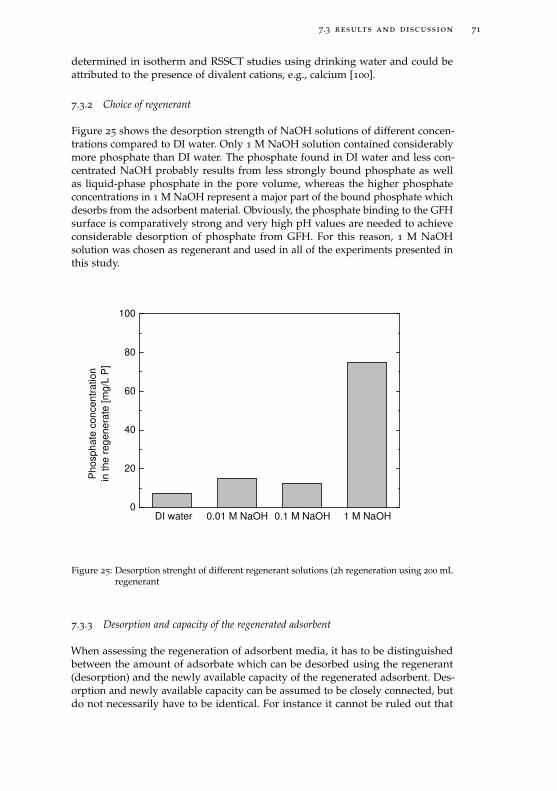
7.3 results and discussion 71
determined in isotherm and RSSCT studies using drinking water and could beattributed to the presence of divalent cations, e.g., calcium [100].
7.3.2 Choice of regenerant
Figure 25 shows the desorption strength of NaOH solutions of different concen-trations compared to DI water. Only 1 M NaOH solution contained considerablymore phosphate than DI water. The phosphate found in DI water and less con-centrated NaOH probably results from less strongly bound phosphate as wellas liquid-phase phosphate in the pore volume, whereas the higher phosphateconcentrations in 1 M NaOH represent a major part of the bound phosphate whichdesorbs from the adsorbent material. Obviously, the phosphate binding to the GFHsurface is comparatively strong and very high pH values are needed to achieveconsiderable desorption of phosphate from GFH. For this reason, 1 M NaOHsolution was chosen as regenerant and used in all of the experiments presented inthis study.
DI water 0.01 M NaOH 0.1 M NaOH 1 M NaOH0
20
40
60
80
100
Pho
spha
te c
once
ntra
tion
in th
e re
gene
rate
[mg/
L P
]
Figure 25: Desorption strenght of different regenerant solutions (2h regeneration using 200 mLregenerant
7.3.3 Desorption and capacity of the regenerated adsorbent
When assessing the regeneration of adsorbent media, it has to be distinguishedbetween the amount of adsorbate which can be desorbed using the regenerant(desorption) and the newly available capacity of the regenerated adsorbent. Des-orption and newly available capacity can be assumed to be closely connected, butdo not necessarily have to be identical. For instance it cannot be ruled out that
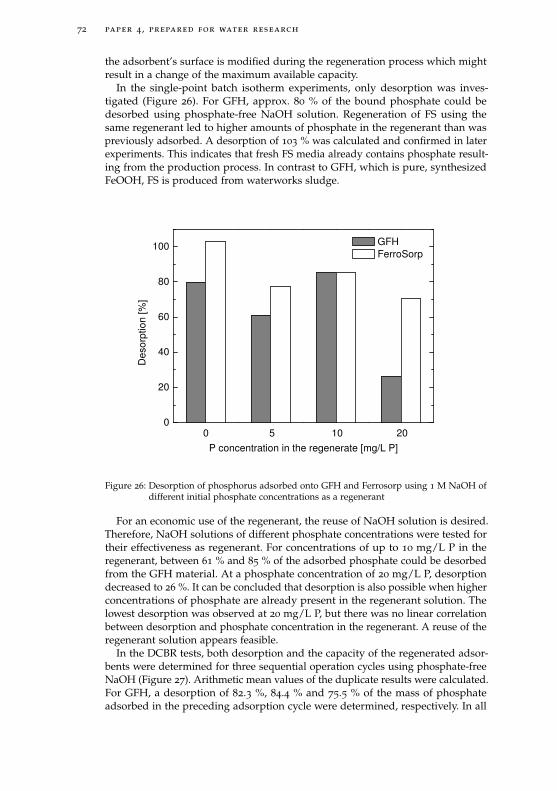
72 paper 4 , prepared for water research
the adsorbent’s surface is modified during the regeneration process which mightresult in a change of the maximum available capacity.
In the single-point batch isotherm experiments, only desorption was inves-tigated (Figure 26). For GFH, approx. 80 % of the bound phosphate could bedesorbed using phosphate-free NaOH solution. Regeneration of FS using thesame regenerant led to higher amounts of phosphate in the regenerant than waspreviously adsorbed. A desorption of 103 % was calculated and confirmed in laterexperiments. This indicates that fresh FS media already contains phosphate result-ing from the production process. In contrast to GFH, which is pure, synthesizedFeOOH, FS is produced from waterworks sludge.
0
20
40
60
80
100
201050
Des
orpt
ion
[%]
P concentration in the regenerate [mg/L P]
GFH FerroSorp
Figure 26: Desorption of phosphorus adsorbed onto GFH and Ferrosorp using 1 M NaOH ofdifferent initial phosphate concentrations as a regenerant
For an economic use of the regenerant, the reuse of NaOH solution is desired.Therefore, NaOH solutions of different phosphate concentrations were tested fortheir effectiveness as regenerant. For concentrations of up to 10 mg/L P in theregenerant, between 61 % and 85 % of the adsorbed phosphate could be desorbedfrom the GFH material. At a phosphate concentration of 20 mg/L P, desorptiondecreased to 26 %. It can be concluded that desorption is also possible when higherconcentrations of phosphate are already present in the regenerant solution. Thelowest desorption was observed at 20 mg/L P, but there was no linear correlationbetween desorption and phosphate concentration in the regenerant. A reuse of theregenerant solution appears feasible.
In the DCBR tests, both desorption and the capacity of the regenerated adsor-bents were determined for three sequential operation cycles using phosphate-freeNaOH (Figure 27). Arithmetic mean values of the duplicate results were calculated.For GFH, a desorption of 82.3 %, 84.4 % and 75.5 % of the mass of phosphateadsorbed in the preceding adsorption cycle were determined, respectively. In all
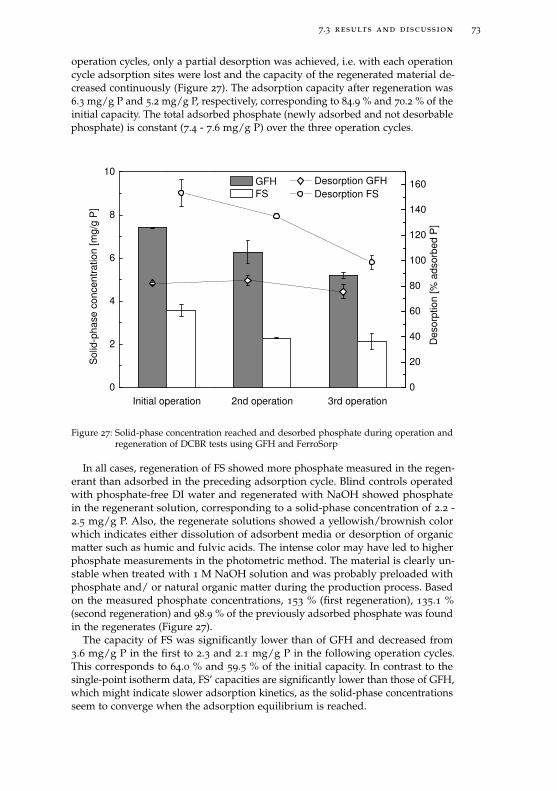
7.3 results and discussion 73
operation cycles, only a partial desorption was achieved, i.e. with each operationcycle adsorption sites were lost and the capacity of the regenerated material de-creased continuously (Figure 27). The adsorption capacity after regeneration was6.3 mg/g P and 5.2 mg/g P, respectively, corresponding to 84.9 % and 70.2 % of theinitial capacity. The total adsorbed phosphate (newly adsorbed and not desorbablephosphate) is constant (7.4 - 7.6 mg/g P) over the three operation cycles.
0
20
40
60
80
100
120
140
160
Initial operation 2nd operation 3rd operation0
2
4
6
8
10
Sol
id-p
hase
con
cent
ratio
n [m
g/g
P]
GFH FS
Desorption GFH
Des
orpt
ion
[% a
dsor
bed
P]
Desorption FS
Figure 27: Solid-phase concentration reached and desorbed phosphate during operation andregeneration of DCBR tests using GFH and FerroSorp
In all cases, regeneration of FS showed more phosphate measured in the regen-erant than adsorbed in the preceding adsorption cycle. Blind controls operatedwith phosphate-free DI water and regenerated with NaOH showed phosphatein the regenerant solution, corresponding to a solid-phase concentration of 2.2 -2.5 mg/g P. Also, the regenerate solutions showed a yellowish/brownish colorwhich indicates either dissolution of adsorbent media or desorption of organicmatter such as humic and fulvic acids. The intense color may have led to higherphosphate measurements in the photometric method. The material is clearly un-stable when treated with 1 M NaOH solution and was probably preloaded withphosphate and/ or natural organic matter during the production process. Basedon the measured phosphate concentrations, 153 % (first regeneration), 135.1 %(second regeneration) and 98.9 % of the previously adsorbed phosphate was foundin the regenerates (Figure 27).
The capacity of FS was significantly lower than of GFH and decreased from3.6 mg/g P in the first to 2.3 and 2.1 mg/g P in the following operation cycles.This corresponds to 64.0 % and 59.5 % of the initial capacity. In contrast to thesingle-point isotherm data, FS’ capacities are significantly lower than those of GFH,which might indicate slower adsorption kinetics, as the solid-phase concentrationsseem to converge when the adsorption equilibrium is reached.
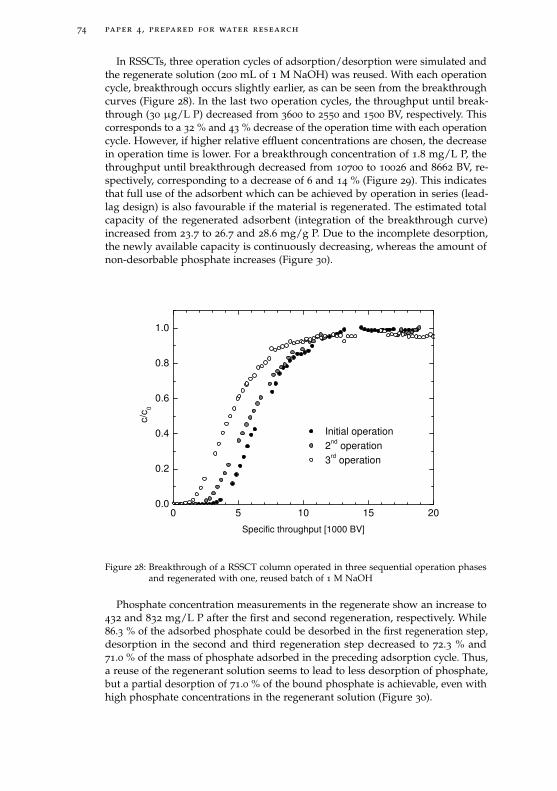
74 paper 4 , prepared for water research
In RSSCTs, three operation cycles of adsorption/desorption were simulated andthe regenerate solution (200 mL of 1 M NaOH) was reused. With each operationcycle, breakthrough occurs slightly earlier, as can be seen from the breakthroughcurves (Figure 28). In the last two operation cycles, the throughput until break-through (30 µg/L P) decreased from 3600 to 2550 and 1500 BV, respectively. Thiscorresponds to a 32 % and 43 % decrease of the operation time with each operationcycle. However, if higher relative effluent concentrations are chosen, the decreasein operation time is lower. For a breakthrough concentration of 1.8 mg/L P, thethroughput until breakthrough decreased from 10700 to 10026 and 8662 BV, re-spectively, corresponding to a decrease of 6 and 14 % (Figure 29). This indicatesthat full use of the adsorbent which can be achieved by operation in series (lead-lag design) is also favourable if the material is regenerated. The estimated totalcapacity of the regenerated adsorbent (integration of the breakthrough curve)increased from 23.7 to 26.7 and 28.6 mg/g P. Due to the incomplete desorption,the newly available capacity is continuously decreasing, whereas the amount ofnon-desorbable phosphate increases (Figure 30).
0 5 10 15 200.0
0.2
0.4
0.6
0.8
1.0
Initial operation 2nd operation 3rd operation
c/c 0
Specific throughput [1000 BV]
Figure 28: Breakthrough of a RSSCT column operated in three sequential operation phasesand regenerated with one, reused batch of 1 M NaOH
Phosphate concentration measurements in the regenerate show an increase to432 and 832 mg/L P after the first and second regeneration, respectively. While86.3 % of the adsorbed phosphate could be desorbed in the first regeneration step,desorption in the second and third regeneration step decreased to 72.3 % and71.0 % of the mass of phosphate adsorbed in the preceding adsorption cycle. Thus,a reuse of the regenerant solution seems to lead to less desorption of phosphate,but a partial desorption of 71.0 % of the bound phosphate is achievable, even withhigh phosphate concentrations in the regenerant solution (Figure 30).
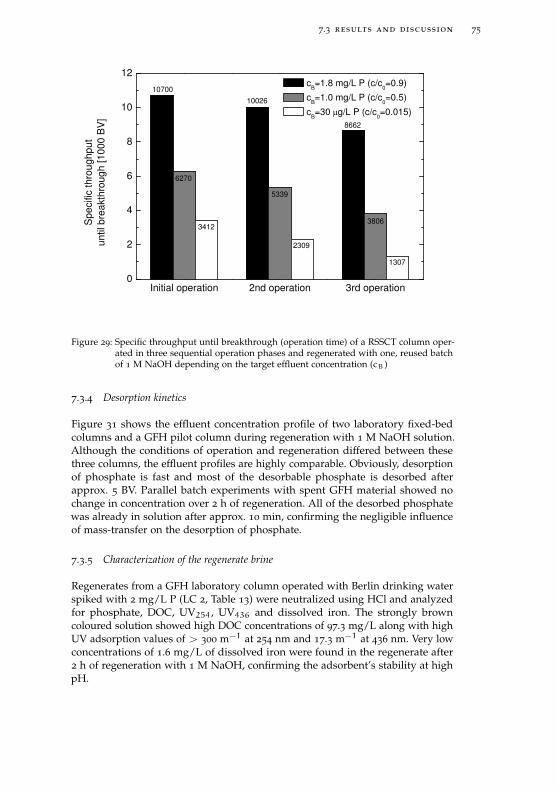
7.3 results and discussion 75
Initial operation 2nd operation 3rd operation0
2
4
6
8
10
12
3806
8662
5339
10026
6270
10700
1307
2309
3412
Spe
cific
thro
ughp
utun
til b
reak
thro
ugh
[100
0 B
V]
cB=1.8 mg/L P (c/c
0=0.9)
cB=1.0 mg/L P (c/c
0=0.5)
cB=30 µg/L P (c/c
0=0.015)
Figure 29: Specific throughput until breakthrough (operation time) of a RSSCT column oper-ated in three sequential operation phases and regenerated with one, reused batchof 1 M NaOH depending on the target effluent concentration (cB)
7.3.4 Desorption kinetics
Figure 31 shows the effluent concentration profile of two laboratory fixed-bedcolumns and a GFH pilot column during regeneration with 1 M NaOH solution.Although the conditions of operation and regeneration differed between thesethree columns, the effluent profiles are highly comparable. Obviously, desorptionof phosphate is fast and most of the desorbable phosphate is desorbed afterapprox. 5 BV. Parallel batch experiments with spent GFH material showed nochange in concentration over 2 h of regeneration. All of the desorbed phosphatewas already in solution after approx. 10 min, confirming the negligible influenceof mass-transfer on the desorption of phosphate.
7.3.5 Characterization of the regenerate brine
Regenerates from a GFH laboratory column operated with Berlin drinking waterspiked with 2 mg/L P (LC 2, Table 13) were neutralized using HCl and analyzedfor phosphate, DOC, UV254, UV436 and dissolved iron. The strongly browncoloured solution showed high DOC concentrations of 97.3 mg/L along with highUV adsorption values of > 300 m−1 at 254 nm and 17.3 m−1 at 436 nm. Very lowconcentrations of 1.6 mg/L of dissolved iron were found in the regenerate after2 h of regeneration with 1 M NaOH, confirming the adsorbent’s stability at highpH.
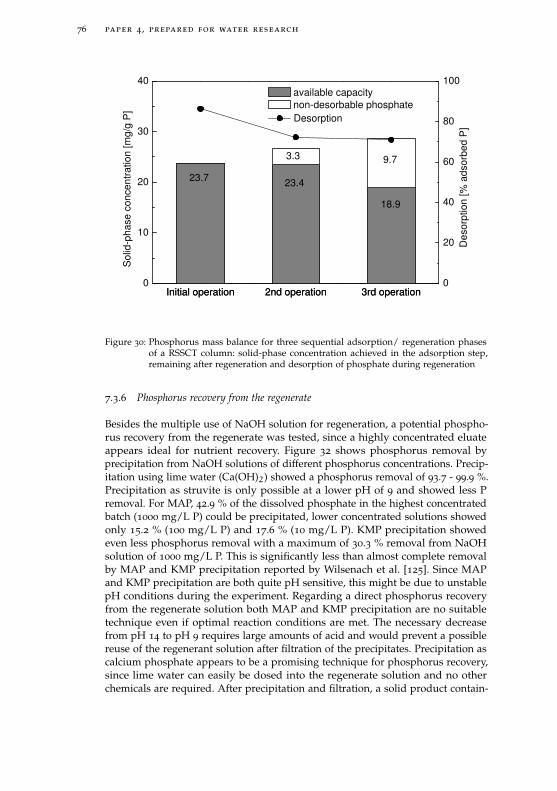
76 paper 4 , prepared for water research
Initial operation 2nd operation 3rd operation0
20
40
60
80
100
Initial operation 2nd operation 3rd operation0
10
20
30
40
18.9
9.7
23.4
3.3
23.7
Sol
id-p
hase
con
cent
ratio
n [m
g/g
P]
available capacity non-desorbable phosphate
Des
orpt
ion
[% a
dsor
bed
P]
Desorption
Figure 30: Phosphorus mass balance for three sequential adsorption/ regeneration phasesof a RSSCT column: solid-phase concentration achieved in the adsorption step,remaining after regeneration and desorption of phosphate during regeneration
7.3.6 Phosphorus recovery from the regenerate
Besides the multiple use of NaOH solution for regeneration, a potential phospho-rus recovery from the regenerate was tested, since a highly concentrated eluateappears ideal for nutrient recovery. Figure 32 shows phosphorus removal byprecipitation from NaOH solutions of different phosphorus concentrations. Precip-itation using lime water (Ca(OH)2) showed a phosphorus removal of 93.7 - 99.9 %.Precipitation as struvite is only possible at a lower pH of 9 and showed less Premoval. For MAP, 42.9 % of the dissolved phosphate in the highest concentratedbatch (1000 mg/L P) could be precipitated, lower concentrated solutions showedonly 15.2 % (100 mg/L P) and 17.6 % (10 mg/L P). KMP precipitation showedeven less phosphorus removal with a maximum of 30.3 % removal from NaOHsolution of 1000 mg/L P. This is significantly less than almost complete removalby MAP and KMP precipitation reported by Wilsenach et al. [125]. Since MAPand KMP precipitation are both quite pH sensitive, this might be due to unstablepH conditions during the experiment. Regarding a direct phosphorus recoveryfrom the regenerate solution both MAP and KMP precipitation are no suitabletechnique even if optimal reaction conditions are met. The necessary decreasefrom pH 14 to pH 9 requires large amounts of acid and would prevent a possiblereuse of the regenerant solution after filtration of the precipitates. Precipitation ascalcium phosphate appears to be a promising technique for phosphorus recovery,since lime water can easily be dosed into the regenerate solution and no otherchemicals are required. After precipitation and filtration, a solid product contain-
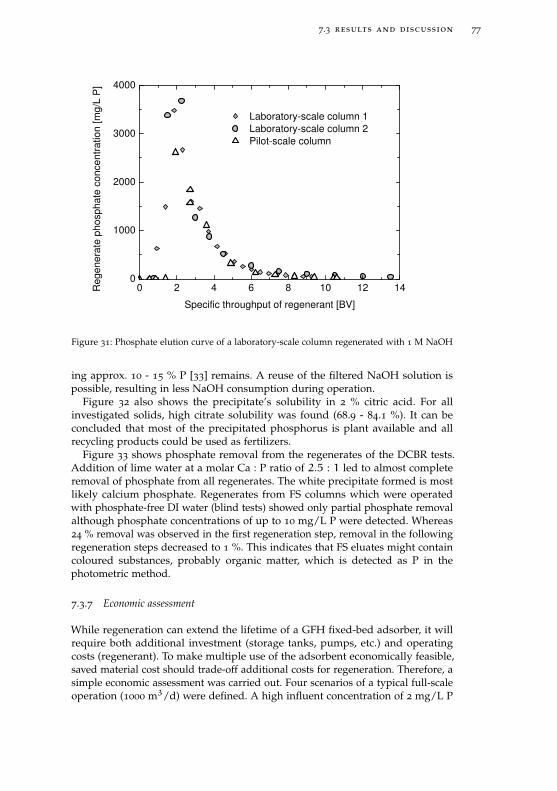
7.3 results and discussion 77
0 2 4 6 8 10 12 140
1000
2000
3000
4000
Laboratory-scale column 1 Laboratory-scale column 2 Pilot-scale column
Reg
ener
ate
phos
phat
e co
ncen
trat
ion
[mg/
L P
]
Specific throughput of regenerant [BV]
Figure 31: Phosphate elution curve of a laboratory-scale column regenerated with 1 M NaOH
ing approx. 10 - 15 % P [33] remains. A reuse of the filtered NaOH solution ispossible, resulting in less NaOH consumption during operation.
Figure 32 also shows the precipitate’s solubility in 2 % citric acid. For allinvestigated solids, high citrate solubility was found (68.9 - 84.1 %). It can beconcluded that most of the precipitated phosphorus is plant available and allrecycling products could be used as fertilizers.
Figure 33 shows phosphate removal from the regenerates of the DCBR tests.Addition of lime water at a molar Ca : P ratio of 2.5 : 1 led to almost completeremoval of phosphate from all regenerates. The white precipitate formed is mostlikely calcium phosphate. Regenerates from FS columns which were operatedwith phosphate-free DI water (blind tests) showed only partial phosphate removalalthough phosphate concentrations of up to 10 mg/L P were detected. Whereas24 % removal was observed in the first regeneration step, removal in the followingregeneration steps decreased to 1 %. This indicates that FS eluates might containcoloured substances, probably organic matter, which is detected as P in thephotometric method.
7.3.7 Economic assessment
While regeneration can extend the lifetime of a GFH fixed-bed adsorber, it willrequire both additional investment (storage tanks, pumps, etc.) and operatingcosts (regenerant). To make multiple use of the adsorbent economically feasible,saved material cost should trade-off additional costs for regeneration. Therefore, asimple economic assessment was carried out. Four scenarios of a typical full-scaleoperation (1000 m3/d) were defined. A high influent concentration of 2 mg/L P
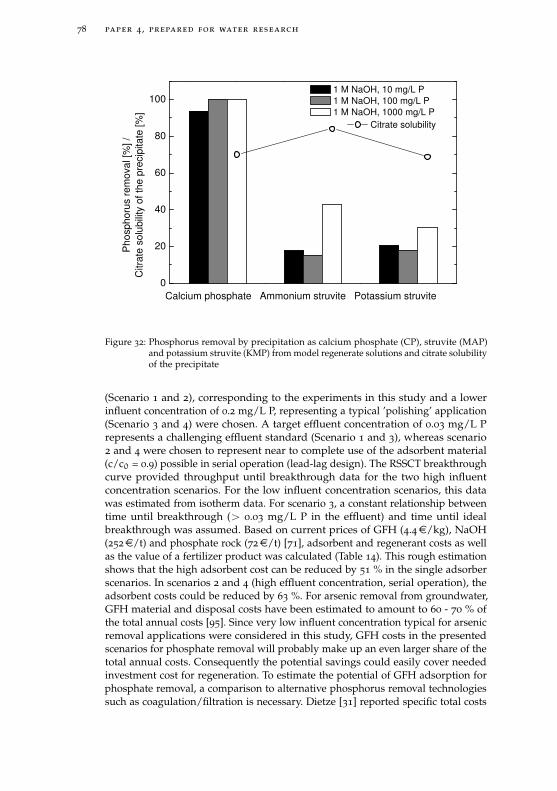
78 paper 4 , prepared for water research
0
20
40
60
80
100
Pho
spho
rus
rem
oval
[%] /
Citr
ate
solu
bilit
y of
the
prec
ipita
te [%
]
1 M NaOH, 10 mg/L P 1 M NaOH, 100 mg/L P 1 M NaOH, 1000 mg/L P
Calcium phosphate Ammonium struvite Potassium struvite
Citrate solubility
Figure 32: Phosphorus removal by precipitation as calcium phosphate (CP), struvite (MAP)and potassium struvite (KMP) from model regenerate solutions and citrate solubilityof the precipitate
(Scenario 1 and 2), corresponding to the experiments in this study and a lowerinfluent concentration of 0.2 mg/L P, representing a typical ’polishing’ application(Scenario 3 and 4) were chosen. A target effluent concentration of 0.03 mg/L Prepresents a challenging effluent standard (Scenario 1 and 3), whereas scenario2 and 4 were chosen to represent near to complete use of the adsorbent material(c/c0 = 0.9) possible in serial operation (lead-lag design). The RSSCT breakthroughcurve provided throughput until breakthrough data for the two high influentconcentration scenarios. For the low influent concentration scenarios, this datawas estimated from isotherm data. For scenario 3, a constant relationship betweentime until breakthrough (> 0.03 mg/L P in the effluent) and time until idealbreakthrough was assumed. Based on current prices of GFH (4.4e/kg), NaOH(252e/t) and phosphate rock (72e/t) [71], adsorbent and regenerant costs as wellas the value of a fertilizer product was calculated (Table 14). This rough estimationshows that the high adsorbent cost can be reduced by 51 % in the single adsorberscenarios. In scenarios 2 and 4 (high effluent concentration, serial operation), theadsorbent costs could be reduced by 63 %. For arsenic removal from groundwater,GFH material and disposal costs have been estimated to amount to 60 - 70 % ofthe total annual costs [95]. Since very low influent concentration typical for arsenicremoval applications were considered in this study, GFH costs in the presentedscenarios for phosphate removal will probably make up an even larger share of thetotal annual costs. Consequently the potential savings could easily cover neededinvestment cost for regeneration. To estimate the potential of GFH adsorption forphosphate removal, a comparison to alternative phosphorus removal technologiessuch as coagulation/filtration is necessary. Dietze [31] reported specific total costs
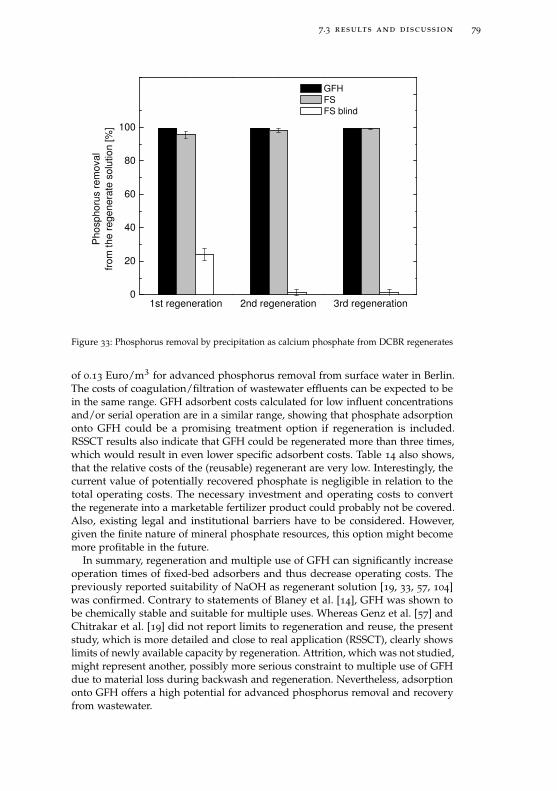
7.3 results and discussion 79
1st regeneration 2nd regeneration 3rd regeneration0
20
40
60
80
100
Pho
spho
rus
rem
oval
from
the
rege
nera
te s
olut
ion
[%]
GFH FS FS blind
Figure 33: Phosphorus removal by precipitation as calcium phosphate from DCBR regenerates
of 0.13 Euro/m3 for advanced phosphorus removal from surface water in Berlin.The costs of coagulation/filtration of wastewater effluents can be expected to bein the same range. GFH adsorbent costs calculated for low influent concentrationsand/or serial operation are in a similar range, showing that phosphate adsorptiononto GFH could be a promising treatment option if regeneration is included.RSSCT results also indicate that GFH could be regenerated more than three times,which would result in even lower specific adsorbent costs. Table 14 also shows,that the relative costs of the (reusable) regenerant are very low. Interestingly, thecurrent value of potentially recovered phosphate is negligible in relation to thetotal operating costs. The necessary investment and operating costs to convertthe regenerate into a marketable fertilizer product could probably not be covered.Also, existing legal and institutional barriers have to be considered. However,given the finite nature of mineral phosphate resources, this option might becomemore profitable in the future.
In summary, regeneration and multiple use of GFH can significantly increaseoperation times of fixed-bed adsorbers and thus decrease operating costs. Thepreviously reported suitability of NaOH as regenerant solution [19, 33, 57, 104]was confirmed. Contrary to statements of Blaney et al. [14], GFH was shown tobe chemically stable and suitable for multiple uses. Whereas Genz et al. [57] andChitrakar et al. [19] did not report limits to regeneration and reuse, the presentstudy, which is more detailed and close to real application (RSSCT), clearly showslimits of newly available capacity by regeneration. Attrition, which was not studied,might represent another, possibly more serious constraint to multiple use of GFHdue to material loss during backwash and regeneration. Nevertheless, adsorptiononto GFH offers a high potential for advanced phosphorus removal and recoveryfrom wastewater.
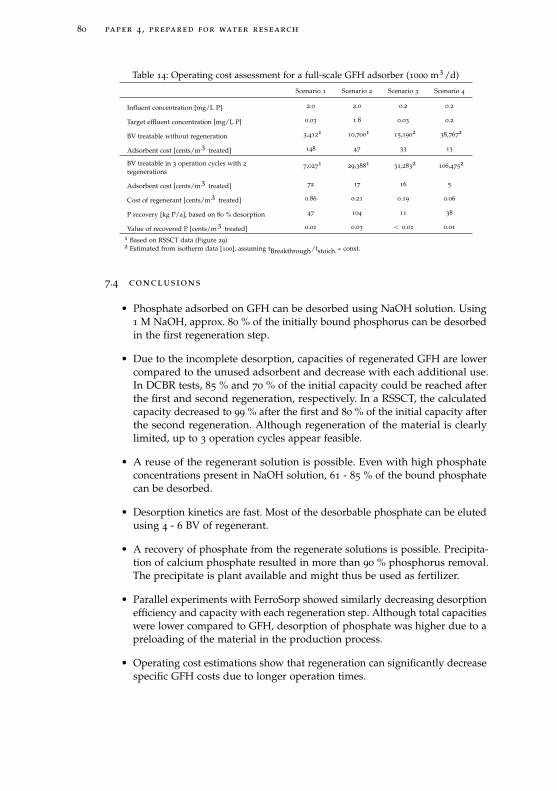
80 paper 4 , prepared for water research
Table 14: Operating cost assessment for a full-scale GFH adsorber (1000 m3/d)
Scenario 1 Scenario 2 Scenario 3 Scenario 4
Influent concentration [mg/L P] 2.0 2.0 0.2 0.2
Target effluent concentration [mg/L P] 0.03 1.8 0.03 0.2
BV treatable without regeneration 3,4121
10,7001
15,1902
38,7672
Adsorbent cost [cents/m3 treated] 148 47 33 13
BV treatable in 3 operation cycles with 2
regenerations7,027
129,388
131,283
2106,475
2
Adsorbent cost [cents/m3 treated] 72 17 16 5
Cost of regenerant [cents/m3 treated] 0.86 0.21 0.19 0.06
P recovery [kg P/a], based on 80 % desorption 47 104 11 38
Value of recovered P [cents/m3 treated] 0.01 0.03 < 0.01 0.01
1 Based on RSSCT data (Figure 29)2 Estimated from isotherm data [100], assuming tBreakthrough/tstoich.= const.
7.4 conclusions
• Phosphate adsorbed on GFH can be desorbed using NaOH solution. Using1 M NaOH, approx. 80 % of the initially bound phosphorus can be desorbedin the first regeneration step.
• Due to the incomplete desorption, capacities of regenerated GFH are lowercompared to the unused adsorbent and decrease with each additional use.In DCBR tests, 85 % and 70 % of the initial capacity could be reached afterthe first and second regeneration, respectively. In a RSSCT, the calculatedcapacity decreased to 99 % after the first and 80 % of the initial capacity afterthe second regeneration. Although regeneration of the material is clearlylimited, up to 3 operation cycles appear feasible.
• A reuse of the regenerant solution is possible. Even with high phosphateconcentrations present in NaOH solution, 61 - 85 % of the bound phosphatecan be desorbed.
• Desorption kinetics are fast. Most of the desorbable phosphate can be elutedusing 4 - 6 BV of regenerant.
• A recovery of phosphate from the regenerate solutions is possible. Precipita-tion of calcium phosphate resulted in more than 90 % phosphorus removal.The precipitate is plant available and might thus be used as fertilizer.
• Parallel experiments with FerroSorp showed similarly decreasing desorptionefficiency and capacity with each regeneration step. Although total capacitieswere lower compared to GFH, desorption of phosphate was higher due to apreloading of the material in the production process.
• Operating cost estimations show that regeneration can significantly decreasespecific GFH costs due to longer operation times.
8A N I N T E G R AT E D WA S T E WAT E R R E U S E C O N C E P TC O M B I N I N G N AT U R A L R E C L A M AT I O N T E C H N I Q U E S ,M E M B R A N E F I LT R AT I O N A N D M E TA L O X I D EA D S O R P T I O N
Alexander Sperlich1, Xing Zheng1, Mathias Ernst1 and Martin Jekel1
Water Science & Technology 2008, 57(6), 909-914.
preface
The following chapter presents research carried out within the project "Sustainablewater concept and its application for the Olympic Games 2008" funded by theGerman Federal Ministry of Education and Research (BMBF). Research in thisproject focussed around two major questions: 1) selective phosphorus removal byadsorption onto GFH, and 2) membrane fouling control by biofiltration prior toultrafiltration. The latter aspects are not part of this thesis, but were included inthe following article and are printed for completeness.
abstract
In a Sino-German research project, a sustainable water reclamation concept wasdeveloped for different applications of municipal water reuse at the OlympicGreen 2008 in Beijing, China. Results from pilot-scale experiments in Beijingand Berlin show that selective nutrient removal by adsorption onto granularferric hydroxide (GFH) after a membrane bioreactor (MBR) can maintain a totalphosphorus concentration of < 0.03 mg L−1 P, thus preventing eutrophicationof artificial lakes. Operation time of GFH adsorption columns can be extendedby regeneration using sodium hydroxide solution. A subsequent ultrafiltration(UF) membrane after bank filtration creates an additional barrier for pathogensand allows for further urban reuse applications such as toilet flushing. Short termbank/ bio-filtration prior to UF is shown to effectively remove biopolymers andreduce membrane fouling.
8.1 introduction
The 2008 Summer Olympics will be held in Beijing, China. Green Olympics isone concept of the Beijing Olympic Games and states the determination andambition for environmental protection. However, the environmental problems ofthe mega-city Beijing are still tremendous. Above all the water sector is strugglingwith quality problems and declining groundwater levels. As a consequence theCity of Beijing is striving for long term solutions for wastewater treatment andits reuse with a challenging and Olympic-oriented water program. The Olympic
1 Technische Universität Berlin
81
82 water science & technology 57 (2008) 909-914
Green is intended to serve as a demonstration area for innovative, sustainablewastewater treatment and reuse technologies. The Park covers a total area of1,215 ha, located north of the city centre. An area of 60 ha of constructed artificiallakes and channels will be filled with treated wastewater in the northern area ofthe Park. In the central area, a smaller lake of 15 ha with superior water qualitywill be operated with fountains; all waters supplied will be advanced treatedmunicipal wastewaters. Further reuse applications are envisaged, including waterfor irrigation (not only in the Park, but also in neighboring areas) and urban waterapplications like toilet flushing and washing waters.
The present study summarizes the results of the Sino-German research cooper-ation project on a sustainable water concept and its application for the OlympicGames 2008 in the subproject "wastewater treatment and reuse". Project part-ners are the Beijing Drainage Group, the Tsinghua University in Beijing and theTechnical University of Berlin. Moreover, a German small and medium-sizedenterprise (SME) and a consulting company are involved. A combination of ad-vanced wastewater treatment and nature-orientated technologies were realizedin pilot-scale at the Beijing wastewater treatment plant (WWTP) Beixiaohe. Themain objectives included advanced nutrient removal and eutrophication control ofscenic impoundments, reuse for irrigation and urban reuse.
Based on the plans for the Olympic Green and the extension of the WWTPBeixiaohe, a reuse concept has been developed [44], including multiple barriersfor contaminants and pathogens. Effluent of a membrane bio-reactor (MBR) within-situ P-precipitation will be treated to two different qualities, depending onthe use. In a first treatment step, phosphate as essential nutrient is removed byadsorption onto granular ferric hydroxide (GFH) and the water is pumped into anartificial lake. Here, the water is used for scenic impoundment, but also furthertreated by biological processes. Finally, lake bank filtration (BF) further removesorganic compounds and serves as an additional pathogen barrier and effective pre-treatment step for a subsequently operated membrane filtration. An ultrafiltration(UF) ensures a sufficient water quality for safe non-potable (urban) reuse.
Research on the developed treatment scheme focussed around two major ques-tions. First, selective phosphorus removal by adsorption onto GFH and eutrophi-cation control in the artificial lake was studied intensively. In previous laboratory-scale experiments, GFH has shown high capacities for phosphate removal fromMBR filtrates [57] and wastewater effluents [44], despite potential competitionby other wastewater constituents. A particle free influent and the goal of verylow phosphorus concentrations in the effluent favors adsorption compared toother options of phosphorus removal, e.g. coagulation. Second, fouling of theultrafiltration membrane and its control by biofiltration was investigated. Foulingis generally acknowledged as one of the main problems restraining the applica-tion of membrane filtration [6]. Polysaccharides and proteins have been foundto be major foulants [74, 78]. Removal of these substances by biofiltration mighttherefore significantly reduce membrane fouling.
8.2 methods
The developed treatment scheme (Figure 34) was realized in pilot-scale at theBeijing WWTP Beixioahe. Effluent of a pilot membrane bioreactor, operated by theTsinghua University, was used as influent for two GFH fixed-bed columns. Since

8.2 methods 83
MBR + in-situP-removal
Polishing: GFH P-Adsorption
Artificial lake Bankfiltration
Ultrafiltration(dead-end)
Figure 34: Wastewater reclamation and reuse scheme
MBR effluent P concentrations varied substantially, a flocculation step using poly-aluminium chloride (PAC, dosage of 8 - 16 mg L−1 Al) followed by sedimentationand rapid sand filtration was introduced before GFH adsorption. In large-scaleapplication, this step could be substituted by in-situ precipitation or biological Premoval in the MBR. The resulting modified treatment scheme for pilot operationin Beijing consisted of MBR effluent - flocculation/ sedimentation - rapid sandfiltration - GFH adsorption - artificial lake - bank filtration - ultrafiltration.
To achieve effluent concentrations of less than 30 µg L−1 P, two fixed-bedadsorption columns were operated. Operational conditions and parameters aregiven in Table 15. To simulate the Olympic Lakes, a 30 m2 large artificial lake wasconstructed and operated. At start-up, the lake was filled with 95 % drinking water,supplemented by 5 % secondary effluent. In order to facilitate the settlement ofplanktonic organisms, plankton samples were taken from four lakes in Beijing andthe lake was inoculated. The dimensions of the lake were 5.5 m × 5.5 m × 2.5 m,the applied filtration materials were sand (d = 2 - 4 mm) and limestone (d = 3 -6 mm) which were set up in two separated containers to form embankments. Onthe surface of each bank, a layer of textile was situated to ensure stability. TheBF was operated with a filtration passage 1.7 m in depth, a filtration velocity of1.55 m d−1 and a travelling time of about 1.1 to 1.5 days.
An UF pilot plant (W.E.T., Germany) was operated with a membrane module(INGE, Germany, membrane material: PESM, MWCO: 100 kD, dead-end filtration,membrane surface 4.5 m2, operational flux: 60 - 140 L m2 h−1).
Following the pilot experiments in Beijing, a similar set-up was realized inBerlin’s WWTP Ruhleben, Germany. Here, fine-screened secondary effluent was
84 water science & technology 57 (2008) 909-914
Table 15: Operational parameters of two GFH fixed-bed columns at WWTP Beixiaohe
Parameter Operation in series
Flow rate [m3 d−1] 9
Empty bed contact time [min] 2×6
Empty bed volume [m3] 2×0.038
Column diameter [m] 2×0.25
Bed depth [m] 2×0.76
Filtration rate [m h−1] 7.6
Backwash
Filtration rate [m h−1] 25
Flow rate [m3 h−1] 1.2
Volume [BV/m3] 2/0.075
applied directly to four biofilters (slow sand filtration), operated at differenthydraulic loading rates between 0.02 and 0.5 m h−1. The filtration area was 0.018,1 and 2 m2, respectively. Filter height was approximately 0.72 m. As filter material,sand was chosen. The subsequently operated UF pilot plant was the one operatedin Beijing before.
Water quality analysis included pH, turbidity, ammonia, total phosphorus, totalcoliforms, UV absorption at 254 and 436 nm, respectively. All analyses wereperformed according to standard methods [5]. Dissolved organic carbon in thewater was characterized by size exclusion chromatography (LC-OCD with DOC/UVA online detection).
8.3 results and discussion
Operation of the pilot adsorption columns was not constant during the operationperiod (July 28th to October 31st 2005). Start-up of the MBR pilot unit upstreamresulted in strong variations of the influent concentration as well as shut-downperiods. The measured effluent concentrations show a reliable and almost completeremoval of phosphate by adsorption onto GFH. Despite highly variable influentconcentrations (between 0.008 and 1.62 ppm P), the average effluent concentrationwas 0.023 ppm P, but always below 0.07 ppm P. After approximately 12,000 BV,breakthrough of the adsorber occurs (Figure 35). Following this, the first of twoin series operated adsorbers was regenerated using 1 molar sodium hydroxidesolution, thereby extending the operation time to more than 16,000 BV or 96 days,respectively. For regeneration, 400 L, equivalent to 10 bed volumes, of 1 molarsodium hydroxide solution were used. After a throughput of 100 L regenerant at20 L h−1, regeneration was paused for 12 h. The remaining 300 L regenerant wereapplied at 45 L h−1. Figure 36 shows that after four bed volumes the major partof the bound phosphate is already desorbed. A total of 10.5 g P per kg dry matterGFH material could be desorbed. Corresponding lab-scale batch experiments showan average regeneration efficiency of 86 %, and marginal influence of operationaltime and pH.
By the effective removal of phosphate, which is the limiting nutrient for micro-bial growth, eutrophication of the artificial lake could be prevented. The meanconcentrations in the operation period for chlorophyll A and total phosphorus
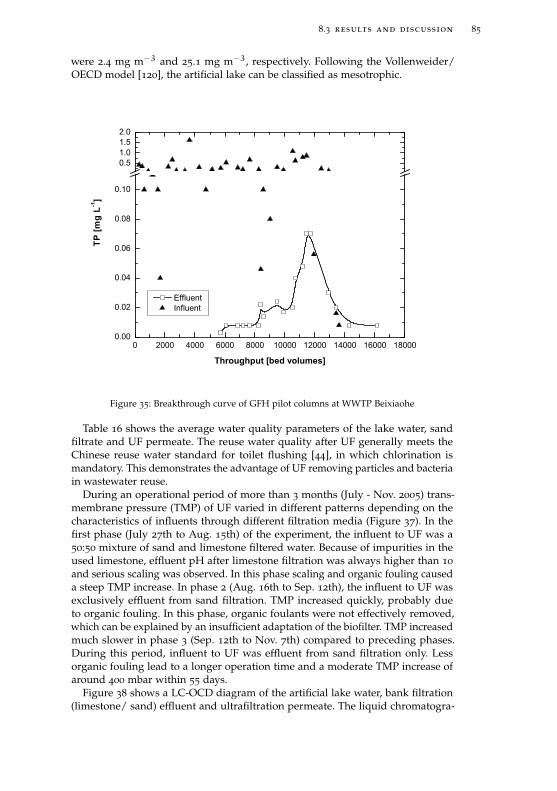
8.3 results and discussion 85
were 2.4 mg m−3 and 25.1 mg m−3, respectively. Following the Vollenweider/OECD model [120], the artificial lake can be classified as mesotrophic.
0 2 0 0 0 4 0 0 0 6 0 0 0 8 0 0 0 1 0 0 0 0 1 2 0 0 0 1 4 0 0 0 1 6 0 0 0 1 8 0 0 00 . 0 0
0 . 0 2
0 . 0 4
0 . 0 6
0 . 0 8
0 . 1 0
0 . 51 . 01 . 52 . 0
E f f l u e n t I n f l u e n t
TP [m
g L-1 ]
T h r o u g h p u t [ b e d v o l u m e s ]
Figure 35: Breakthrough curve of GFH pilot columns at WWTP Beixiaohe
Table 16 shows the average water quality parameters of the lake water, sandfiltrate and UF permeate. The reuse water quality after UF generally meets theChinese reuse water standard for toilet flushing [44], in which chlorination ismandatory. This demonstrates the advantage of UF removing particles and bacteriain wastewater reuse.
During an operational period of more than 3 months (July - Nov. 2005) trans-membrane pressure (TMP) of UF varied in different patterns depending on thecharacteristics of influents through different filtration media (Figure 37). In thefirst phase (July 27th to Aug. 15th) of the experiment, the influent to UF was a50:50 mixture of sand and limestone filtered water. Because of impurities in theused limestone, effluent pH after limestone filtration was always higher than 10
and serious scaling was observed. In this phase scaling and organic fouling causeda steep TMP increase. In phase 2 (Aug. 16th to Sep. 12th), the influent to UF wasexclusively effluent from sand filtration. TMP increased quickly, probably dueto organic fouling. In this phase, organic foulants were not effectively removed,which can be explained by an insufficient adaptation of the biofilter. TMP increasedmuch slower in phase 3 (Sep. 12th to Nov. 7th) compared to preceding phases.During this period, influent to UF was effluent from sand filtration only. Lessorganic fouling lead to a longer operation time and a moderate TMP increase ofaround 400 mbar within 55 days.
Figure 38 shows a LC-OCD diagram of the artificial lake water, bank filtration(limestone/ sand) effluent and ultrafiltration permeate. The liquid chromatogra-
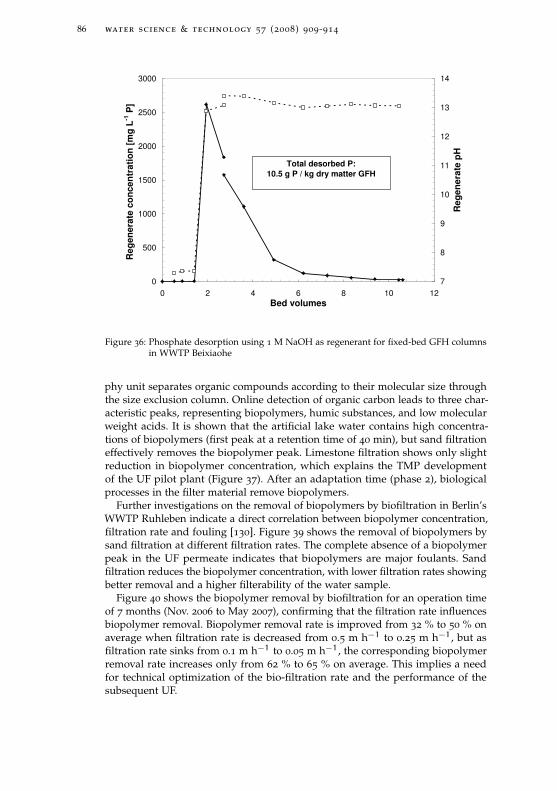
86 water science & technology 57 (2008) 909-914
0
500
1000
1500
2000
2500
3000
0 2 4 6 8 10 12Bed volumes
Reg
ener
ate
con
cen
trat
ion
[m
g L
-1 P
]
7
8
9
10
11
12
13
14
Reg
ener
ate
pH
Total desorbed P: 10.5 g P / kg dry matter GFH
Figure 36: Phosphate desorption using 1 M NaOH as regenerant for fixed-bed GFH columnsin WWTP Beixiaohe
phy unit separates organic compounds according to their molecular size throughthe size exclusion column. Online detection of organic carbon leads to three char-acteristic peaks, representing biopolymers, humic substances, and low molecularweight acids. It is shown that the artificial lake water contains high concentra-tions of biopolymers (first peak at a retention time of 40 min), but sand filtrationeffectively removes the biopolymer peak. Limestone filtration shows only slightreduction in biopolymer concentration, which explains the TMP developmentof the UF pilot plant (Figure 37). After an adaptation time (phase 2), biologicalprocesses in the filter material remove biopolymers.
Further investigations on the removal of biopolymers by biofiltration in Berlin’sWWTP Ruhleben indicate a direct correlation between biopolymer concentration,filtration rate and fouling [130]. Figure 39 shows the removal of biopolymers bysand filtration at different filtration rates. The complete absence of a biopolymerpeak in the UF permeate indicates that biopolymers are major foulants. Sandfiltration reduces the biopolymer concentration, with lower filtration rates showingbetter removal and a higher filterability of the water sample.
Figure 40 shows the biopolymer removal by biofiltration for an operation timeof 7 months (Nov. 2006 to May 2007), confirming that the filtration rate influencesbiopolymer removal. Biopolymer removal rate is improved from 32 % to 50 % onaverage when filtration rate is decreased from 0.5 m h−1 to 0.25 m h−1, but asfiltration rate sinks from 0.1 m h−1 to 0.05 m h−1, the corresponding biopolymerremoval rate increases only from 62 % to 65 % on average. This implies a needfor technical optimization of the bio-filtration rate and the performance of thesubsequent UF.
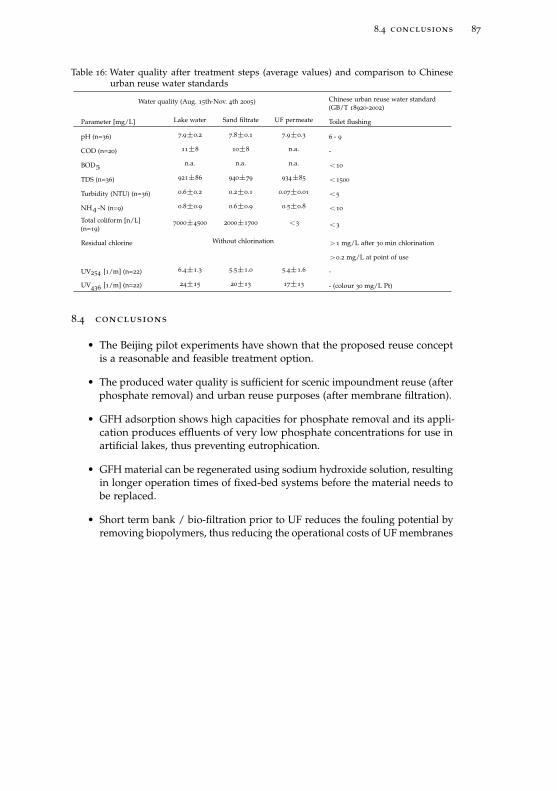
8.4 conclusions 87
Table 16: Water quality after treatment steps (average values) and comparison to Chineseurban reuse water standards
Water quality (Aug. 15th-Nov. 4th 2005) Chinese urban reuse water standard(GB/T 18920-2002)
Parameter [mg/L] Lake water Sand filtrate UF permeate Toilet flushing
pH (n=36) 7.9±0.2 7.8±0.1 7.9±0.36 - 9
COD (n=20) 11±8 10±8 n.a. -
BOD5n.a. n.a. n.a. <10
TDS (n=36) 921±86 940±79 934±85 <1500
Turbidity (NTU) (n=36) 0.6±0.2 0.2±0.1 0.07±0.01 <5
NH4-N (n=9) 0.8±0.9 0.6±0.9 0.5±0.8 <10
Total coliform [n/L](n=19)
7000±4500 2000±1700 <3 <3
Residual chlorine Without chlorination >1 mg/L after 30 min chlorination
>0.2 mg/L at point of use
UV254 [1/m] (n=22) 6.4±1.3 5.5±1.0 5.4±1.6 -
UV436
[1/m] (n=22) 24±15 20±13 17±13 - (colour 30 mg/L Pt)
8.4 conclusions
• The Beijing pilot experiments have shown that the proposed reuse conceptis a reasonable and feasible treatment option.
• The produced water quality is sufficient for scenic impoundment reuse (afterphosphate removal) and urban reuse purposes (after membrane filtration).
• GFH adsorption shows high capacities for phosphate removal and its appli-cation produces effluents of very low phosphate concentrations for use inartificial lakes, thus preventing eutrophication.
• GFH material can be regenerated using sodium hydroxide solution, resultingin longer operation times of fixed-bed systems before the material needs tobe replaced.
• Short term bank / bio-filtration prior to UF reduces the fouling potential byremoving biopolymers, thus reducing the operational costs of UF membranes
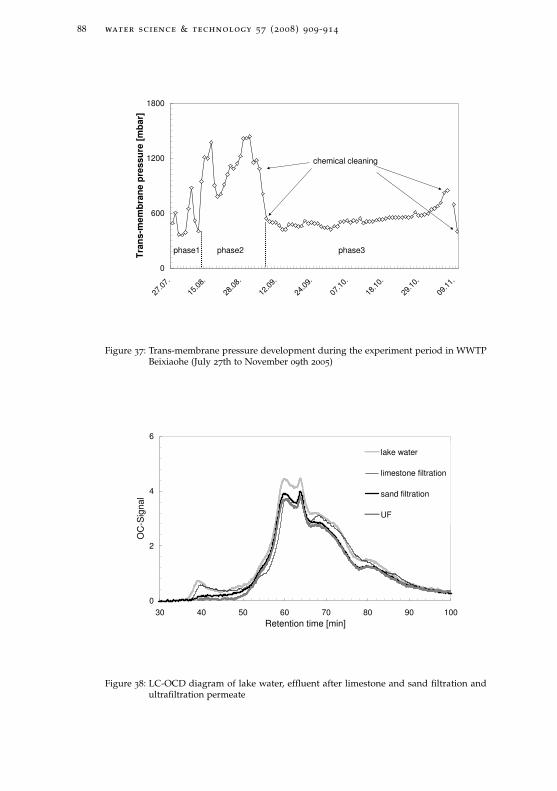
88 water science & technology 57 (2008) 909-914
0
600
1200
1800
27.0
7.
15.0
8.
28.0
8.
12.0
9.
24.0
9.
07.1
0.
18.1
0.
29.1
0.
09.1
1.
Tra
ns-
mem
bra
ne
pre
ssu
re [
mb
ar]
chemical cleaning
phase1 phase2 phase3
Figure 37: Trans-membrane pressure development during the experiment period in WWTPBeixiaohe (July 27th to November 09th 2005)
0
2
4
6
30 40 50 60 70 80 90 100Retention time [min]
OC
-Sig
nal
lake water
limestone filtration
sand filtration
UF
Figure 38: LC-OCD diagram of lake water, effluent after limestone and sand filtration andultrafiltration permeate
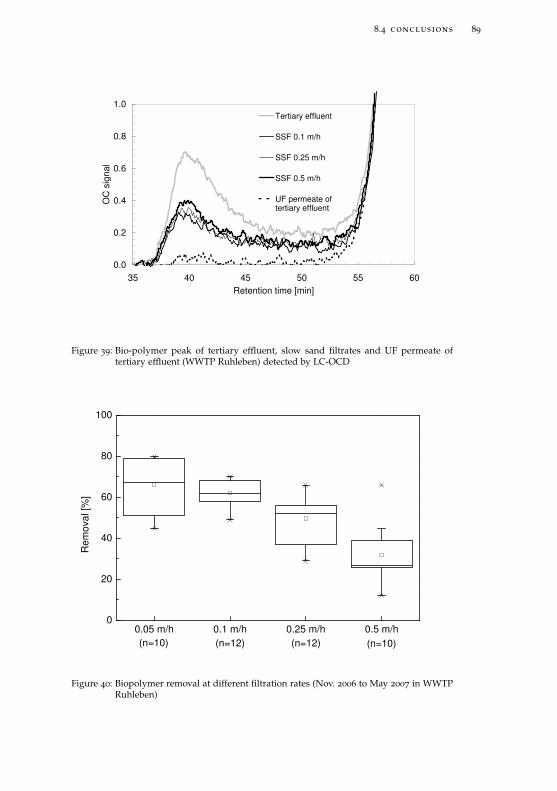
8.4 conclusions 89
0.0
0.2
0.4
0.6
0.8
1.0
35 40 45 50 55 60Retention time [min]
OC
sig
nal
Tertiary effluent
SSF 0.1 m/h
SSF 0.25 m/h
SSF 0.5 m/h
UF permeate oftertiary effluent
Figure 39: Bio-polymer peak of tertiary effluent, slow sand filtrates and UF permeate oftertiary effluent (WWTP Ruhleben) detected by LC-OCD
0.05 m/h 0.1 m/h 0.25 m/h 0.5 m/h0
20
40
60
80
100
(n=10)(n=12)(n=12)(n=10)
Rem
oval
[%]
Figure 40: Biopolymer removal at different filtration rates (Nov. 2006 to May 2007 in WWTPRuhleben)

9G E N E R A L D I S C U S S I O N
In the following, the results of the previous chapters are discussed in regardto their significance for the use of GFH adsorption as a treatment process forphosphate removal during advanced wastewater treatment. In this context, thesuitability and the limits of this process alternative will be evaluated. Furthermore,a general procedure for the design of fixed-bed adsorbers will be developed anddiscussed.
9.1 gfh-phosphate adsorption equilibria in different water matri-ces
Adsorption of phosphate onto GFH was studied and has shown high capacities ofup to 24 mg/g P in the treatment relevant pH range 6-8. Phosphate adsorption ontoGFH is strongly pH dependent: when pH was increased from 6 to 8, the observedcapacities were approximately halved. This is typical for the adsorption of anionsonto iron oxide surfaces near the pHPZC [23]. Genz [56] observed phosphateadsorption onto GFH at pH values above the pHPZC which confirms the strongaffinity of phosphate to iron oxide surfaces, which has been described as ligandexchange [98]. This strong interaction is associated with a low influence of ionicstrength on the adsorption equilibrium. These characteristics and hence the specificcharacter of adsorption is confirmed by the significantly higher capacities observedin drinking and waste water as compared to DI water. Obviously, competitiveadsorption of waste water constituents such as DOC is compensated by thepresence of divalent cations which improves adsorption. The presence of calciumhas been shown to strongly improve adsorption capacity and is supposed tobe the main reason for higher capacities in drinking and waste water. Calciummay affect phosphate adsorption i) directly, through the formation of ternarysurface complexes and ii) indirectly by changing the electrostatic properties ofthe surface, i.e. shifting the pHPZC to higher values [23]. Regarding the natureof the interaction between phosphate and calcium adsorption onto iron oxidesas well as the form of the phosphate surface complex, there is still debate in thescientific community [23, 81, 93, 94]. For clarification, studies involving advancedspectroscopic methods (FT-IR, EXAFS) are needed. However, the results of thisstudy clearly show that phosphate adsorption onto GFH is a suitable process foradvanced wastewater treatment and the wastewater matrix will not result in lowcapacities.
GFH phosphate adsorption from membrane concentrates shows lower capacitiesas compared to DI water. Competition of higher concentrations of DOC presentin the membrane concentrate, the high ionic strength and lower initial phosphateconcentrations lead to lower solid-phase concentrations. Although higher concen-trations of calcium are also present, this cannot compensate for DOC competition.Since membrane concentrates are often supersaturated with respect to calciumcarbonate and/or calcium phosphate compounds, this can lead to scaling and headloss in the fixed-bed column and GFH adsorption cannot be recommended for
91
92 general discussion
membrane concentrate treatment. Chemical precipitation can effectively removephosphorus and calcium ions and thus reduce the scaling potential of membraneconcentrates. This may allow for higher recoveries in the NF/RO process.
9.2 adsorber design - from water quality analysis to breakthrough
prediction
From an engineering point of view, a reliable prediction of operation time andthus breakthrough of GFH adsorbers based on easily accessible data is needed todesign GFH fixed-bed columns. In figure 41, a general procedure for breakthroughprediction is shown. The traditional approach is a sequence of laboratory-scaleexperiments to determine the adsorption equilibrium (isotherm experiments)and mass transfer coefficients (DCBR/SFBR/CMBR experiments). Ultimately, thebreakthrough of a GFH fixed-bed column can be predicted using mass transfermodels, such as the homogeneous surface diffusion model (HSDM). In this study,breakthrough of arsenate, phosphate, salicylic acid and groundwater DOC couldbe predicted using models which already have been established for trace organicadsorption onto granular activated carbon. Breakthrough curves were experimen-tally determined and modeled using the HSDM and two of its derivatives, theconstant pattern homogeneous surface diffusion model (CPHSDM) and the lineardriving force model (LDF). Input parameters, the Freundlich isotherm constants,and mass transfer coefficients for liquid- and solid-phase diffusion were deter-mined and analized for their influence on the shape of the breakthrough curve.HSDM simulation results predict the breakthrough of all investigated substancessatisfactorily, but LDF and CPHSDM could not describe arsenate breakthroughcorrectly. This is due to a very slow intraparticle diffusion and hence higher Biotnumbers. Based on this observation, limits of applicability were defined for LDFand CPHSDM. When designing fixed-bed adsorbers, model selection based onknown or estimated Biot and Stanton numbers is possible. In addition, the deter-mined isotherm data and mass transfer coefficients form the basis of a data basewhich can be used in future model simulations.
The knowledge of adsorption equilibrium data (isotherm constants or surfacecomplexation constants) allows the calculation of the ideal (stoichiometric) break-through point, which describes the breakthrough if no mass transfer was present.It could be shown in this study that this procedure is viable for GFH adsorptionand the determined ideal breakthrough points match the barycenters of experi-mentally determined breakthrough curves. Although GFH material was groundfor isotherm experiments, batch equilibrium data are in agreement with capacitiesobserved in fixed-bed column experiments and can provide a rough estimationof the breakthrough curve. The main drawback of this approach is the very slowmass transfer into the GFH particles which results in non-uniformely shapedbreakthrough curves which deviate strongly from the ideal ones. It is possible toimprove this prediction method by the determination of a correction factor basedon dimensionless numbers which describes the deviation of the real BTC from theideal BTC. In appendix B, the determination of these correction factors is shown.
Further research should aim on reducing the number of input parameters whichhave to be experimentally determined. A combination of models and databaseinformation for adsorbent, adsorbate, adsorption equilibrium data as well as masstransfer coefficients could enable prediction based on a water quality analysis for
9.3 operation of gfh fixed-bed columns 93
the water to be treated, i.e. without experimental study. Surface complexationmodels are already used to describe the adsorption equilibrium of phosphate ontoiron oxides. The diffused double layer model can in principle be used to describephosphate adsorption onto GFH, but fails to describe simultaneous adsorptionof phosphate and calcium. A number of more advanced SC models are availableand further research is needed to improve surface complexation modeling ofcompetitive adsorption of phosphate onto GFH. Kinetic parameters determined inthis work could be used as the basis for a mass transfer coefficient database forGFH. Their validity under different conditions (pH, water matrix, etc.) has to beconfirmed.
Future work should be directed to integrate SCM approaches into mass-transfermodels (e.g., HSDM). Given the availability of mass transfer coefficients or theirreliable estimation using known relationships, an integrated model could describebreakthrough curves using water quality data as input. The HSDM uses Freundlichisotherm coefficients as input parameters and the two partial differential equationsin the HSDM are coupled by the Freundlich equation. Due to the non-linearcoupling, an analytical solution is not available, but the equations have to besolved numerically. Introducing SCMs into the model would allow to eliminate thisnon-linearity and an analytical solution could be found, which would significantlyreduce the calculation effort.
RSSCTs represent an alternative method to predict breakthrough of fixed-bedcolumns and have been shown to capture the shape of the breakthrough curvequite well. The constant diffusivity approach [24] has been found to be better suitedto describe phosphate breakthrough in GFH adsorbers. In regard to a generalprocedure to design fixed-bed adsorbers, RSSCTs provide a powerful alternative,but require a significantly higher volume of water and time to produce results thanbatch isotherms. Given the limited breakthrough prediction strength of isothermsand the substantial experimental work to determine the input parameters for masstransfer models, RSSCTs might provide the preferred method for breaktroughprediction of GFH fixed-bed columns to date. Improved models could makebreakthrough prediction less time consuming in the future.
9.3 operation of gfh fixed-bed columns
Operation of two fixed-bed adsorbers at Beijing’s wastewater treatment plant Beix-iaohe was the first demonstration of GFH adsorption for phosphate removal fromwastewater at larger than laboratory scale. In three months of pilot plant operation,a stable phosphate removal to less than 30 µg/L P was observed, despite veryunstable influent concentrations and non-constant operation times. Appendix Cshows strong variations of influent concentration and various shut-down periods.Nevertheless, effluent phosphate concentration were not detectable for ≈ 5000 BVand afterwards increased until breakthrough was reached at ≈ 12000 BV. Shortlyafter successfull regeneration, influent phosphate concentration decreased intothe range of the target concentration due to operational changes in the WWTPplant. Due to the varying operational conditions, the pilot plant results cannotbe compared to batch isotherm results or used for breakthrough simulation. Al-though influenced by operational problems upstream of the fixed-bed system,GFH operation was very stable and reliable. In GFH pilot tests for the surfacewater restoration of Lake Plötzensee [63, 70], algae growth on the adsorption
94 general discussion
material caused head-loss of the filters and serious operational problems. In Beix-iaohe, the adsorption columns were housed in a container, thus protected fromlight and similar problems were not observed. Also, the influent was filtered(turbidity ≈ 0.25 NTU) and a reduction by the GFH columns was not observed.The adsorbent material was backwashed after the initial filling of the columns,but did not require additional backwash in more than two months of operationuntil regeneration. During backwash, the low material strength of GFH led toabrasion and fine GFH particles were washed out. To avoid material loss, backwashof GFH fixed-bed columns should only be performed if head-loss is observed.If a low-turbidity influent is used, GFH adsorbers can be operated for severalmonths. Handling of GFH adsorbers is easy and stable operation requires almostno maintenance. This is an advantage over phosphate precipitation where chemicaladdition, mixing, and solids separation make operation more complex. Furtherextended pilot-scale studies could provide more information about operationallimits of GFH adsorption.
Operation of two GFH colums in series results in a more efficient use of the ad-sorbent. In RSSCT studies, 134 - 175 % higher specific throughputs were calculatedfor lead-lag design as compared to single adsorber design. A potential problemfor GFH fixed-bed columns are anoxic conditions which might lead to dissolutionof the material. Less relevant for wastewater applications, this problem might bemore frequently encountered when GFH is used for surface water restoration.During pilot operation in Beixiaohe, no redox problems were observed. In theLake Plötzensee pilot plant, high H2S concentrations in the deep water of the lakeled to formation of hardly soluble FeS2 [70].
9.4 regeneration of gfh
Regeneration and multiple application of GFH was investigated and shown tosignificantly increase operation times of fixed-bed adsorbers. GFH is stable athigh pH and can be efficiently regenerated using 1 M NaOH. Batch and fixed-bedcolumn studies show that approximately 80 % of the initially bound phosphate canbe eluated. However, the incomplete desorption leads to decreasing capacities witheach additional use. Multiple uses are thus limited, but at least three operationcycles are feasible. GFH desorption is fast and most of the desorbable phosphatecould be eluated using 4 - 6 bed volumes of regenerant. A reuse of the regenerantsolution is possible. Despite high phosphate concentrations in the regenerate, 61 -85 % of the bound phosphate could be desorbed. A recovery of phosphate from thehighly concentrated regenerant stream (up to 3.5 g/L P) is possible. Precipitationwith lime water resulted in 90 % P removal and a plant available precipitate whichmight be used as a fertilizer. These results suggest that regeneration and multipleapplication of GFH can be an economically favourable option compared to singleuse.
9.5 final remarks
The selection of the most suitable treatment process for a specific application isan engineering challenge and will always depend on the specific conditions ofthe application in question. Nonetheless, some general conclusions can be drawnregarding the suitability of GFH for phosphate removal. The main criteria for
9.5 final remarks 95
process selection are costs, stability in terms of P retention and practicability ofimplementation.
GFH is an engineered, high-performance adsorbent, which is relatively expen-sive and offers high phosphate adsorption capacities. Competing phosphorusremoval technologies include chemical precipitation, EBPR, and the use of low-cost adsorbents. The specific advantage of any fixed-bed adsorption processes isthe ability to remove the target compound to near zero concentrations. In treat-ment scenarios which combine low influent concentrations and very low requiredeffluent concentrations, GFH adsorption is the preferential treatment alternative.Low influent concentrations result in long operation times of GFH fixed-bedcolumns and thus lower adsorbent costs, which typically make up the majorityof the total annual costs [95]. Operating cost estimations (Table 14) show that inlow influent concentration (0.2 mg/L P) scenarios, GFH material costs amount toapprox. 33 cents/ m3. This is still considerably more than specific total costs ofapprox. 13 cents/ m3 estimated for advanced P removal from surface waters bychemical precipitation/ filtration in Berlin [31]. Costs of chemical precipitation/filtration of wastewater effluents are probably similar. Higher loads of influentphosphorus result in shorter operation times and thus higher adsorbent costs. Intheses cases, chemical or biological phosphorus removal or the use of low-costadsorbents will be the preferential alternative.
It was also shown that regeneration can increase operation times and reduceadsorbent costs to approx. 16 cents/ m3 with almost negligible specific NaOHcosts. However, operation complexity and investment costs will increase if storagetanks for NaOH as well as neutralization of spent caustic is considered. Operationof fixed-bed columns in series results in a more efficient use of the adsorbent. Inlow influent concentration scenarios with lead-lag design and regneration of spentmaterial, specific adsorbent costs as low as 5 cents/ m3 were estimated.
Other aspects to be considered when evaluating GFH adsorption as phosphateremoval process include water quality parameters such as pH, redox potential,saturation, and turbidity. Lower pH values generally result in higher capacitiesand benefit GFH application. Although not relevant for treatment of most naturaland waste waters, the limit is set at approx. pH 2, below which dissolution of GFHoccurs. Adjustment of pH to improve capacities is possible but most probably notjustified by the higher effort and costs needed for acid addition.
Instability under reducing conditions limits GFH application which especiallyhas to be considered for surface water restoration applications, since anoxic condi-tions are frequently encountered in deep waters of eutrophic lakes. Supersaturatedinfluents such as membrane concentrates can cause precipitation and head loss inthe GFH filters and limit GFH application for this purpose. As for any adsorptionprocess, low turbidity influents should be used for GFH fixed-bed systems. Forwastewater applications, a conventional or membrane filtration step is thereforerecommended prior to GFH adsorption.
These considerations limit potential application fields of GFH fixed-bed adsorp-tion for phosphorus removal. GFH adsorption is not suited for use in municipalwastewater treatment plants to replace the widely used chemical precipitation andEBPR processes, since phosphorus influent concentrations and turbidity are high.However, the process is well suited to be used as a polishing step for effluents orside streams which require phosphorus removal to very low effluent concentra-tions. Chemical precipitation/ filtration prior to GFH polishing can ensure both
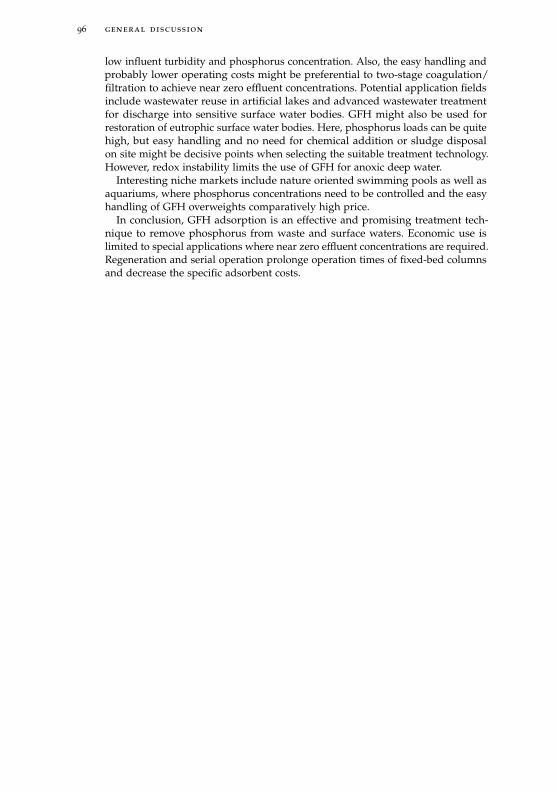
96 general discussion
low influent turbidity and phosphorus concentration. Also, the easy handling andprobably lower operating costs might be preferential to two-stage coagulation/filtration to achieve near zero effluent concentrations. Potential application fieldsinclude wastewater reuse in artificial lakes and advanced wastewater treatmentfor discharge into sensitive surface water bodies. GFH might also be used forrestoration of eutrophic surface water bodies. Here, phosphorus loads can be quitehigh, but easy handling and no need for chemical addition or sludge disposalon site might be decisive points when selecting the suitable treatment technology.However, redox instability limits the use of GFH for anoxic deep water.
Interesting niche markets include nature oriented swimming pools as well asaquariums, where phosphorus concentrations need to be controlled and the easyhandling of GFH overweights comparatively high price.
In conclusion, GFH adsorption is an effective and promising treatment tech-nique to remove phosphorus from waste and surface waters. Economic use islimited to special applications where near zero effluent concentrations are required.Regeneration and serial operation prolonge operation times of fixed-bed columnsand decrease the specific adsorbent costs.
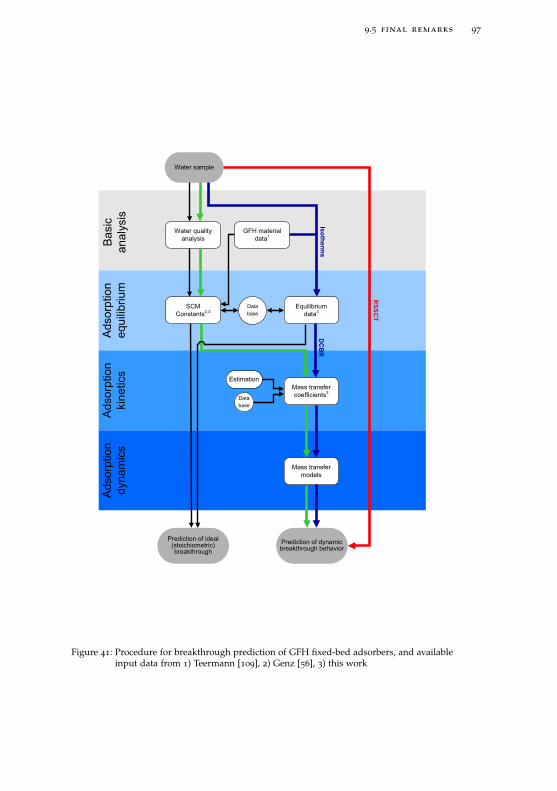
9.5 final remarks 97
�����
��������
��� �����
�����������
��� �����
��������
��� �����
�������
��������������
��������
�����������
����
������������
����
���
��������� !�
��������� ��
����������"���
���""��������
����������"���
�����
#����������" �������������$���%$ ��$�&���
����������
'����
����
#����������" �����(�����$��������)������$���%$
'���
����
���������
��
��
Figure 41: Procedure for breakthrough prediction of GFH fixed-bed adsorbers, and availableinput data from 1) Teermann [109], 2) Genz [56], 3) this work


A P P E N D I X
99

AS U M M A RY O F P H O S P H O R U S A D S O R B E N T S A N D T H E I RP R O P E RT I E S
Table 17: Summary of phosphorus adsorbents and their properties modified after Douglaset al. [34]
Adsorbent Chemistry/ mineralogy Occurrence Phosphate uptake Cost
HydrotalcitesDouble layer hydroxides,usually Mg and Al or Fe
Soils,syntheticallyprepared
High but with a strongpH dependence
Moderate tohigh
Allophane/imogolite
Amorphous Al and Siwith Al:Si ratio of approx.1 : 1 - 2 : 1
Soils,syntheticallyprepared
High - strong pHdependence
Low (soils)to moderate(synthetic)
Iron oxidesOxides/ hydrous oxides,e.g. goethite, ferrihydrite
Soils,synthetic,industrialwaste
Low to high, dependingon mineralogy
Low (wastematerial) tohigh (com-merciallyproduced)
Granular FerricHydroxide1
AkaganeiteCommerciallyproduced
HighModerate tohigh
Activated alumina Al-oxide (Al2O3)Commerciallyproduced
High
High -synthesisandmodification
Soils, sand, gravelsGenerally contain Ca-, Fe-or Al-bearing minerals
Naturallyoccurring
Low to high dependingon chemistry/mineralogy
Generallylow
Red mudComplex Fe and Aloxides/ oxyhydroxides,hydrotalcites if modified
Wasteproduct ofaluminarefining
Low to high, but dependson form andpretreatment
Low tomoderate ifpre-treated
Fly ashMullite, aluminosilicateglasses, zeolite,hydrotalcites if modified
Wasteproduct ofcoalcombustion
Low to moderatedepending on chemistryand modification
Low tomoderate ifpre-treated
Expanded clayaggregates
Illitic clays and calcinedcarbonates
Industriallyprepared bycalcination
Low to moderate, relatedto Ca, Fe concentration
Moderate -industrialprocess
Blast/ arc furnaceslag
Complex mineralogy ofCa, Fe oxides
Industrial(waste)by-product
Low to high, related toCa, Fe concentration
Low aswastematerial
Rare earthmodified clay
REE exchanged into highCEC clay
Syntheticallypreparedslurry
Moderate to high,depending on clay CEC
Moderate tohigh
CarbonatesCalcite, aragonite,dolomite etc.
Naturallyand asindustrialby-product
Low to high dependingon form, surface area, etc.
Low(natural) tomoderate(synthetic)
1 this study
101

BH S D M S I M U L AT I O N R E S U LT S D E P E N D I N G O N S T A N D B I
In the following, selected HSDM simulation results for different values of thedimensionless numbers Bi, St, and the Freundlich exponent n are shown. Simulatedbreakthrough curves are plotted as normalized effluent concentration c/c0 vs.the dimensionless time coordinate T. Stoichiometric breakthrough corresponds toT = 1, thus correction factors for breakthrough prediction based on isotherm datacan be derived as follows:
1. Estimation of St, Bi, and n for the adsorber to be designed,
2. Definition of a target breakthrough concentration c/c0,
3. Determination of the value of T at the specific breakthrough concentrationin the corresponding HSDM simulation.
The determined value of the dimensionless time coordinate value T can be directlyused as a correction factor for stoichiometric breakthrough estimates.
Moreover, the plots show the influence of Bi, St, and n on the shape of thebreakthrough curve and can thus be helpful when designing fixed-bed columns.
103

104 hsdm simulation results depending on st and bi
Bi=1 St=0.1
0
0.2
0.4
0.6
0.8
1
0 0.5 1 1.5 2
0.01
0.1
0.2
0.4
0.7
1
Bi=10 St=0.1
0
0.2
0.4
0.6
0.8
1
0 0.5 1 1.5 2
0.01
0.1
0.2
0.4
0.7
1
Bi=1 St=0.5
0
0.2
0.4
0.6
0.8
1
0 0.5 1 1.5 2
0.01
0.1
0.2
0.4
0.7
1
Bi=10 St=0.5
0
0.2
0.4
0.6
0.8
1
0 0.5 1 1.5 2
0.01
0.1
0.2
0.4
0.7
1
Bi=1 St=1
0
0.2
0.4
0.6
0.8
1
0 0.5 1 1.5 2
0.01
0.1
0.2
0.4
0.7
1
Bi=10 St=1
0
0.2
0.4
0.6
0.8
1
0 0.5 1 1.5 2
0.01
0.1
0.2
0.4
0.7
1
c/c0
T
c/c0
c/c0
c/c0
c/c0
c/c0
T
TT
TT
Figure 42: HSDM simulation results for Bi (1,10), St (0.1,0.5,1), and n (0.01,0.1,0.2,0.4,0.7,1)
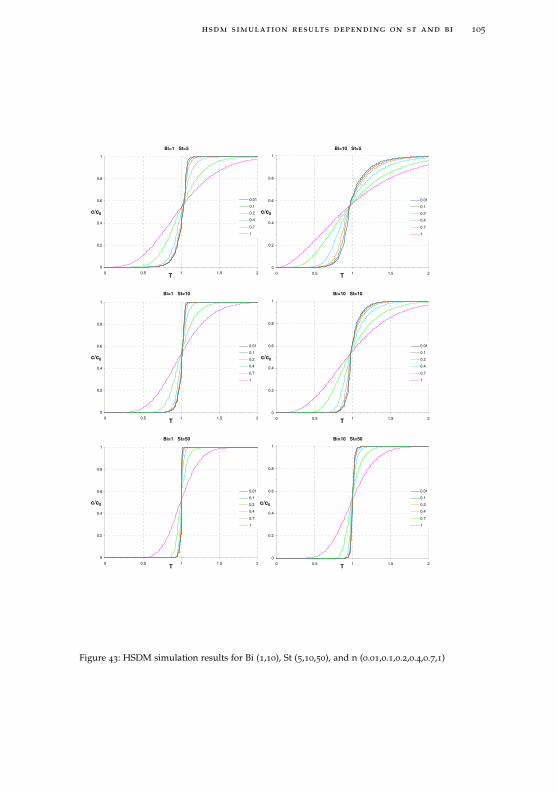
hsdm simulation results depending on st and bi 105
Bi=1 St=5
0
0.2
0.4
0.6
0.8
1
0 0.5 1 1.5 2
0.01
0.1
0.2
0.4
0.7
1
Bi=10 St=5
0
0.2
0.4
0.6
0.8
1
0 0.5 1 1.5 2
0.01
0.1
0.2
0.4
0.7
1
Bi=1 St=10
0
0.2
0.4
0.6
0.8
1
0 0.5 1 1.5 2
0.01
0.1
0.2
0.4
0.7
1
Bi=10 St=10
0
0.2
0.4
0.6
0.8
1
0 0.5 1 1.5 2
0.01
0.1
0.2
0.4
0.7
1
Bi=1 St=50
0
0.2
0.4
0.6
0.8
1
0 0.5 1 1.5 2
0.01
0.1
0.2
0.4
0.7
1
Bi=10 St=50
0
0.2
0.4
0.6
0.8
1
0 0.5 1 1.5 2
0.01
0.1
0.2
0.4
0.7
1
c/c0
T
c/c0
c/c0
c/c0
c/c0
c/c0
T
TT
TT
Figure 43: HSDM simulation results for Bi (1,10), St (5,10,50), and n (0.01,0.1,0.2,0.4,0.7,1)
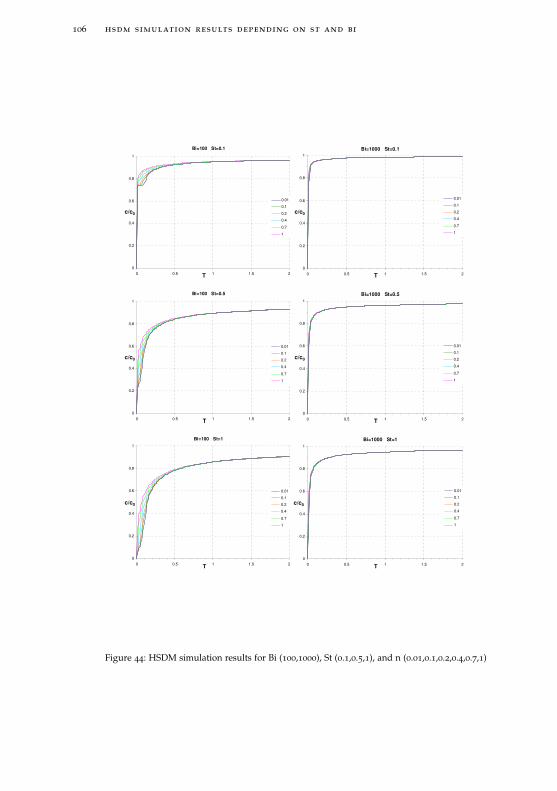
106 hsdm simulation results depending on st and bi
Bi=100 St=0.1
0
0.2
0.4
0.6
0.8
1
0 0.5 1 1.5 2
0.01
0.1
0.2
0.4
0.7
1
Bi=1000 St=0.1
0
0.2
0.4
0.6
0.8
1
0 0.5 1 1.5 2
0.01
0.1
0.2
0.4
0.7
1
Bi=100 St=0.5
0
0.2
0.4
0.6
0.8
1
0 0.5 1 1.5 2
0.01
0.1
0.2
0.4
0.7
1
Bi=1000 St=0.5
0
0.2
0.4
0.6
0.8
1
0 0.5 1 1.5 2
0.01
0.1
0.2
0.4
0.7
1
Bi=100 St=1
0
0.2
0.4
0.6
0.8
1
0 0.5 1 1.5 2
0.01
0.1
0.2
0.4
0.7
1
Bi=1000 St=1
0
0.2
0.4
0.6
0.8
1
0 0.5 1 1.5 2
0.01
0.1
0.2
0.4
0.7
1
c/c0
T
c/c0
c/c0
c/c0
c/c0
c/c0
T
TT
TT
Figure 44: HSDM simulation results for Bi (100,1000), St (0.1,0.5,1), and n (0.01,0.1,0.2,0.4,0.7,1)
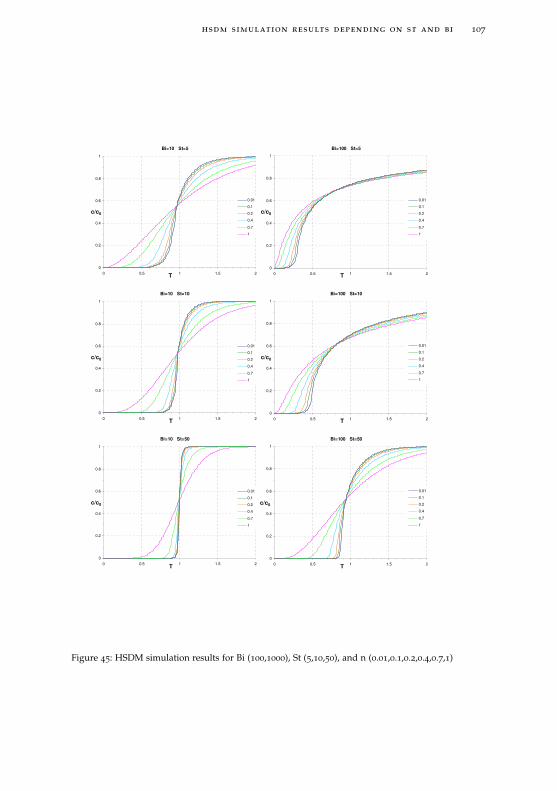
hsdm simulation results depending on st and bi 107
Bi=10 St=5
0
0.2
0.4
0.6
0.8
1
0 0.5 1 1.5 2
0.01
0.1
0.2
0.4
0.7
1
Bi=100 St=5
0
0.2
0.4
0.6
0.8
1
0 0.5 1 1.5 2
0.01
0.1
0.2
0.4
0.7
1
Bi=10 St=10
0
0.2
0.4
0.6
0.8
1
0 0.5 1 1.5 2
0.01
0.1
0.2
0.4
0.7
1
Bi=100 St=10
0
0.2
0.4
0.6
0.8
1
0 0.5 1 1.5 2
0.01
0.1
0.2
0.4
0.7
1
Bi=10 St=50
0
0.2
0.4
0.6
0.8
1
0 0.5 1 1.5 2
0.01
0.1
0.2
0.4
0.7
1
Bi=100 St=50
0
0.2
0.4
0.6
0.8
1
0 0.5 1 1.5 2
0.01
0.1
0.2
0.4
0.7
1
c/c0
T
c/c0
c/c0
c/c0
c/c0
c/c0
T
TT
TT
Figure 45: HSDM simulation results for Bi (100,1000), St (5,10,50), and n (0.01,0.1,0.2,0.4,0.7,1)

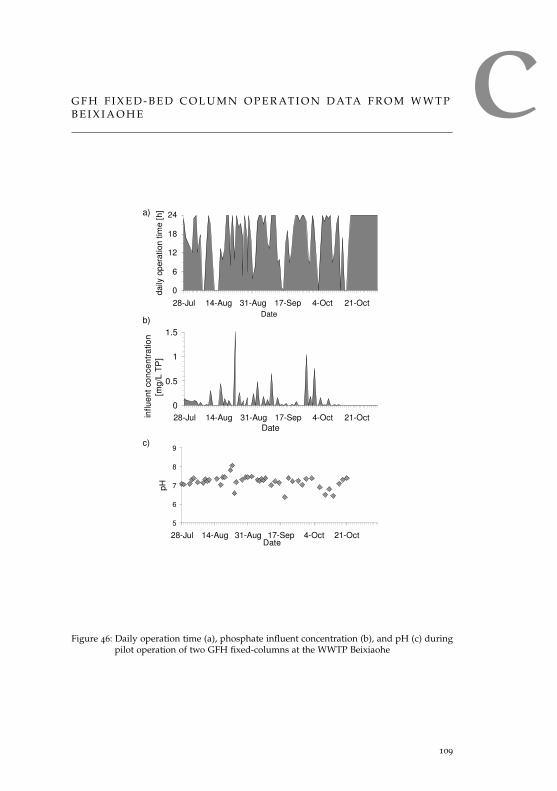
CG F H F I X E D - B E D C O L U M N O P E R AT I O N D ATA F R O M W W T PB E I X I A O H E
5
6
7
8
9
28-Jul 14-Aug 31-Aug 17-Sep 4-Oct 21-OctDate
pH
0
0.5
1
1.5
28-Jul 14-Aug 31-Aug 17-Sep 4-Oct 21-OctDate
influ
ent c
once
ntra
tion
[mg/
L T
P]
0
6
12
18
24
28-Jul 14-Aug 31-Aug 17-Sep 4-Oct 21-OctDate
daily
ope
ratio
n tim
e [h
]a)
b)
c)
Figure 46: Daily operation time (a), phosphate influent concentration (b), and pH (c) duringpilot operation of two GFH fixed-columns at the WWTP Beixiaohe
109

B I B L I O G R A P H Y
[1] EN ISO 15681-1. Water quality - Determination of orthophosphate and totalphosphorus contents by flow analysis (FIA and CFA) - Part 1: Method byflow injection analysis (FIA) (ISO 15681-1:2003), 2004.
[2] C. A. J. Appelo, M. J. J. Van der Weiden, C. Tournassat, and L. Charlet.Surface complexation of ferrous iron and carbonate on ferrihydrite and themobilization of arsenic. Environmental Science & Technology, 36(14):3096–3103,2002.
[3] Takashi Asano. Water reuse issues, technologies, and applications. McGraw-Hill,New York, 2007.
[4] ATV-DVWK. Bericht der ATV-DVWK Arbeitsgruppe Ak-1.1 Phosphorrück-gewinnung. Korrespondenz Abwasser, 6, 2003.
[5] AWWA. Standards Methods for the Examination of Water and Wastewater. 20thedition, 1998.
[6] AWWA. Membrane Processes, AWWA Membrane Technology ResearchCommittee Report. Journal American Water Works Association, 90(6):91–105,1998.
[7] L. Axe and P. Trivedi. Intraparticle surface diffusion of metal contaminantsand their attenuation in microporous amorphous Al, Fe, and Mn oxides.Journal Of Colloid And Interface Science, 247(2):259–265, 2002.
[8] M. Badruzzaman, P. Westerhoff, and D. R. U. Knappe. Intraparticle diffusionand adsorption of arsenate onto granular ferric hydroxide (GFH). WaterResearch, 38(18):4002–4012, 2004.
[9] C. Bahr. GEH Wasserchemie, Personal Communication, 2010.
[10] BDG. Research on environment safety and technology of reclaimed watersupply for Olympic Park. Technical report, Beijing Drainage Group CO.,LTD, 2005.
[11] H. Behrendt, D. Opitz, and M. Klein. Zielvorgaben für die Nährstoffbe-lastung von Spree und Havel aus gewässerökologischer Sicht. Archives ofNature Conservation and Landscape Research, 35:329–347, 1997.
[12] U. Berg, D. Donnert, P. G. Weidler, E. Kaschka, G. Knoll, and R. Nueesch.Phosphorus removal and recovery from wastewater by tobermorite-seededcrystallisation of calcium phosphate. Water Science and Technology, 53(3):131–138, 2006.
111
112 bibliography
[13] L. L. Blackall, G. Crocetti, A. M. Saunders, and P. L. Bond. A review andupdate of the microbiology of enhanced biological phosphorus removal inwastewater treatment plants. Antonie Van Leeuwenhoek International Journal ofGeneral and Molecular Microbiology, 81(1-4):681–691, 2002.
[14] L. M. Blaney, S. Cinar, and A. K. SenGupta. Hybrid anion exchanger fortrace phosphate removal from water and wastewater. Water Research, 41(7):1603–1613, 2007.
[15] R. Bond. Desalination with Zero Liquid Discharge. In AWWA Water QualityTechnology Conference, Denver, 2006.
[16] J. W. Bowden, S. Nagarajah, N. J. Barrow, A. M. Posner, and J. P. Quirk.Describing the Adsorption of Phosphate, Citrate and Selenite on a Variable-Charge Mineral Surface. Australian Journal of Soil Research, 18(1):49–60, 1980.
[17] Stephen Brunauer, P. H. Emmett, and Edward Teller. Adsorption of Gasesin Multimolecular Layers. J. Am. Chem. Soc., 60(2):309–319, 1938.
[18] D. Bryant. The Chemistry of phosphorus. In E. Valsami-Jones, editor,Phosphorus in Environmental Technology. IWA Publishing, London, 2004.
[19] Ramesh Chitrakar, Satoko Tezuka, Akinari Sonoda, Kohji Sakane, KentaOoi, and Takahiro Hirotsu. Phosphate adsorption on synthetic goethite andakaganeite. Journal of Colloid and Interface Science, 298(2):602, 2006.
[20] Ingrid Chorus and Jamie Bartram. Toxic cyanobacteria in water: a guide to theirpublic health consequences, monitoring, and management. E & FN Spon, London; New York, 1999.
[21] P. Cooper, M. Day, and V. Thomas. Process Options for Phosphorus andNitrogen Removal from Waste-Water. Journal of the Institution of Water andEnvironmental Management, 8(1):84–92, 1994.
[22] P. Cornel and C. Schaum. Phosphorus recovery from wastewater: needs,technologies and costs. Water Science and Technology, 59(6):1069–1076, 2009.
[23] R. M. Cornell and Udo Schwertmann. The iron oxides: structure, properties,reactions, occurrences, and uses. Wiley-VCH, Weinheim, 2nd, completely rev.and extended edition, 2003.
[24] J. C. Crittenden, J. K. Berrigan, and D. W. Hand. Design Of Rapid Small-Scale Adsorption Tests For A Constant Diffusivity. Journal Water PollutionControl Federation, 58(4):312–319, 1986.
[25] J. C. Crittenden, J. K. Berrigan, D. W. Hand, and B. Lykins. Design OfRapid Fixed-Bed Adsorption Tests For Nonconstant Diffusivities. Journal OfEnvironmental Engineering-Asce, 113(2):243–259, 1987.
[26] J.C. Crittenden, P.S. Reddy, H. Arora, J. Trynoski, D.W. Hand, D.L. Perram,and R.S. Summers. Predicting GAC performance with rapid small-scalecolumn tests. Journal American Water Works Association, 83(1):77–87, 1991.
bibliography 113
[27] John C. Crittenden and Montgomery Watson Harza (Firm). Water treatmentprinciples and design. John Wiley, Hoboken, N.J., 2nd edition, 2005.
[28] J. A. Davis and J. O. Leckie. Surface Ionization and Complexation at Oxide-Water Interface .2. Surface Properties of Amorphous Iron Oxyhydroxide andAdsorption of Metal-Ions. Journal of Colloid and Interface Science, 67(1):90–107,1978.
[29] E. A. Deliyanni, E. N. Peleka, and N. K. Lazaridis. Comparative study ofphosphates removal from aqueous solutions by nanocrystalline akaganeiteand hybrid surfactant-akaganeite. Separation And Purification Technology, 52
(3):478–486, 2007.
[30] F. H. Denison, P. M. Haygarth, W. A. House, and A. W. Bristow. Themeasurement of dissolved phosphorus compounds: Evidence for hydrolysisduring storage and implications for analytical definitions in environmentalanalysis. International Journal of Environmental Analytical Chemistry, 69(2):111–123, 1998.
[31] A. Dietze. Oberflächenwasseraufbereitung durch Membranfiltration. Dissertation,Technische Universität Berlin, 2003.
[32] John Doherty. PEST - Model-Independent Parameter Estimation, 2004.
[33] D. Donnert and M. Salecker. Elimination of phosphorus from municipal andindustrial waste water. Water Science and Technology, 40(4-5):195–202, 1999.
[34] G.B. Douglas, M.S. Robb, D.N. Coad, and P.W. Ford. A review of solidphase adsorbents for the removal of phosphorus from natural and wastewaters. In E. Valsami-Jones, editor, Phosphorus in Environmental Technology.IWA Publishing, London, 2004.
[35] W. Driehaus. Arsenic removal - Experience with the GEH process in Ger-many. Water Supply, 2(2):275–280, 2002.
[36] W. Driehaus. Arsenentfernung mit Mangandioxid und Eisenhydroxid in derTrinkwasseraufbereitung. Dissertation. VDI Fortschrittsberichte Reihe 15 Nr.133, Dissertation, Technische Universität Berlin, 1994.
[37] W. Driehaus and M. Jekel. Determination of As(III) and total inorganicarsenic by on-line pretreatment in hydride generation atomic absorptionspectrometry. Fresenius J Anal Chem, 343:352–356, 1992.
[38] W. Driehaus, M. Jekel, and U. Hildebrandt. Granular ferric hydroxide - anew adsorbent for the removal of arsenic from natural water. Journal ofWater Supply Research and Technology-Aqua, 47(1):30–35, 1998.
[39] A. Drizo, C. A. Frost, J. Grace, and K. A. Smith. Physico-chemical screeningof phosphate-removing substrates for use in constructed wetland systems.Water Research, 33(17):3595–3602, 1999.
[40] D. A. Dzombak and F. M. Morel. Surface complexation modeling: hydrous ferricoxide. John Wiley & Sons, New York, 1990.
114 bibliography
[41] EEA. Europe’s environment: the second assessment. Technical report, 1998.
[42] U.S. EPA. Nutrient Criteria Technical Guidance Manual: Rivers and Streams,2000.
[43] U.S. EPA. Nutrient Criteria Technical Guidance Manual: Lakes and Reser-voirs, 2000.
[44] M. Ernst, A. Sperlich, X. Zheng, Y. Gan, J. Hu, X. Zhao, J. Wang, and M. Jekel.An integrated wastewater treatment and reuse concept for the Olympic Park2008, Beijing. Desalination, 202(1-3):293, 2007.
[45] EU. Council Directive (91/271/EEC) concerning urban waste-water treat-ment, 1991.
[46] EU. Council Directive (99/31/EC) on the landfill of waste, 1999.
[47] EU. Regulation (EC) No 2003/2003 of the European Parliament and of theCouncil of 13 October 2003 relating to fertilisers, OJ L 304, p. 123, 2003.
[48] A.M. Farmer. Phosphate pollution: a global overview of the problem. InE. Valsami-Jones, editor, Phosphorus in Environmental Technology. IWA Pub-lishing, London, 2004.
[49] J. Fettig. Modelling the uptake of natural organic matter (NOM) by differentgranular sorbent media. Journal Of Water Supply Research And Technology-Aqua, 54(2):83–93, 2005.
[50] G.M. Filipelli. The Global Phosphorus Cycle. In M.J. Kohn, editor, Phosphates- Geochemical, Geobiological, and Materials Importance, volume 48. MineralogicalSociety of America, Washington, DC, 2002.
[51] H. Freundlich. Über die Adsorption in Lösungen. Zeitschrift für physik.Chemie, 57:385–470, 1906.
[52] Mark Gallagher and John Doherty. Parameter estimation and uncertaintyanalysis for a watershed model. Environmental Modelling & Software, 22(7):1000–1020, 2007.
[53] Yan Gao and Alfonso Mucci. Individual and competitive adsorption ofphosphate and arsenate on goethite in artificial seawater. Chemical Geology,199(1-2):91, 2003.
[54] J. S. Geelhoed, T. Hiemstra, and W. H. Van Riemsdijk. Phosphate and sulfateadsorption on goethite: Single anion and competitive adsorption. Geochim.Cosmochim. Acta, 61(12):2389–2396, 1997.
[55] Hülya Genç-Fuhrman, Peng Wu, Yushan Zhou, and Anna Ledin. Removal ofAs, Cd, Cr, Cu, Ni and Zn from polluted water using an iron based sorbent.Desalination, 226(1-3):357–370, 2008.
[56] A. Genz. Entwicklung einer neuen Adsorptionstechnik zur Entfernung natürlicherOrganika mit granuliertem Eisenhydroxid. Dissertation, Technische UniversitätBerlin, 2005.
bibliography 115
[57] A. Genz, A. Kornmüller, and M. Jekel. Advanced phosphorus removalfrom membrane filtrates by adsorption on activated aluminium oxide andgranulated ferric hydroxide. Water Research, 38(16):3523–3530, 2004.
[58] A. Genz, B. Baumgarten, M. Goernitz, and M. Jekel. NOM removal byadsorption onto granular ferric hydroxide: Equilibrium, kinetics, filter andregeneration studies . Water Research, 42(1-2):238–248, 2008.
[59] E. Glueckauf. Theory of Chromatography .10. Formulae for Diffusioninto Spheres and Their Application to Chromatography. Transactions of theFaraday Society, 51(11):1540–1551, 1955.
[60] V. Gnielinski. Gleichungen zur Berechnung des Wärme- und Stoffaus-tausches in durchströmten ruhenden Kugelschüttungen bei mittleren undgroßen Pecletzahlen. Verfahrenstechnik, 12(6):363–367, 1978.
[61] R. Gnirss, B. Lesjean, C. Adam, and H. Buisson. Cost effective and advancedphosphorus removal in membrane bioreactors for a decentralised wastewatertechnology. Water Science And Technology, 47(12):133–139, 2003.
[62] A. E. Greenberg, G. Klein, and W. J. Kaufman. Effect of Phosphorus on theActivated Sludge Process. Sewage and Industrial Wastes, 27(3):277–282, 1955.
[63] D. Güssbacher and M. Klein. Nachhaltige Sanierung eines übernutztenBadegewässers am Beispiel Plötzensee in Berlin-Wedding. WasserwirtschaftWassertechnik, 1:29–35, 1997.
[64] D. W. Hand, J. C. Crittenden, and W. E. Thacker. Simplified Models For De-sign Of Fixed-Bed Adsorption Systems. Journal Of Environmental Engineering-Asce, 110(2):440–456, 1984.
[65] B. Hansen. Long-term plan seeks to reduce phosphorus in Spokane River.Civil Engineering, 76(10):24–25, 2006.
[66] S. G. J. Heijman, H. Guo, S. Li, and J. C. van Dijk. Zero liquid discharge: 99
In 7. Aachener Tagung Wasser und Membranen (AWM), Aachen, 2007.
[67] T. Hiemstra and W. H. VanRiemsdijk. A surface structural approach toion adsorption: The charge distribution (CD) model. Journal of Colloid andInterface Science, 179(2):488–508, 1996.
[68] Herbert Hohl and Werner Stumm. Interaction of Pb2+ with hydrous[gamma]-Al2O3. Journal of Colloid and Interface Science, 55(2):281, 1976.
[69] Z. Hongshao and R. Stanforth. Competitive adsorption of phosphate andarsenate on goethite. Environ. Sci. Technol., 35:4753–4757, 2001.
[70] M. Hupfer and B. Scharf. Seentherapie: Interne Maßnahmen zur Vermin-derung der Phosphorkonzentration. In Steinberg, Calmano, Klapper, andWilken, editors, Handbuch Angewandte Limnologie/, pages 1–67. ecomed-Verlag, Landsberg, 2002.
116 bibliography
[71] ICIS. ICIS pricing chemical price reports (January 29th, 2010), February22nd, 2010 2010.
[72] IFA. Fertilizer Consumption Statistics. Technical report, 2002.
[73] ILEC/Lake Biwa Research Institute. Survey of the State of the World’sLakes. Technical report, International Lake Environment Committee, Otsuand United Nations Environment Programme, 1988-1993.
[74] C. Jarusutthirak, G. Amy, and D. Foss. Potable reuse of wastewater effluentthrough an integrated soil aquifer treatment (SAT) - membrane system.Water Science and Technology: Water Supply, 3(3):25–33, 2003.
[75] M. Jekel, A. Genz, and U. Stindt. Studies on phosphorus removal from freshand sea water by commercial sorbents. Technical report, TU Berlin, Chair ofWater Quality Control., 2002.
[76] L. Johansson. Industrial by-products and natural substrata as phosphorussorbents. Environmental Technology, 20(3):309–316, 1999.
[77] R. Kümmel and E. Worch. Adsorption aus wässrigen Lösungen. Dt. Verl. fürGrundstoffindustrie, Leipzig, 1. aufl. edition, 1990.
[78] C. N. Laabs, G. L. Amy, and M. Jekel. Understanding the Size and Characterof Fouling-Causing Substances from Effluent Organic Matter (EfOM) inLow-Pressure Membrane Filtration. Environ. Sci. Technol., 40(14):4495–4499,2006.
[79] Irving Langmuir. The adsorption of gases on plane surfaces of glass, micaand platinum. Journal of the American Chemical Society, 40(9):1361–1403, 1918.
[80] L. Li and R. Stanforth. Distinguishing adsorption and surface precipitationof phosphate on goethite (a-FeOOH). J. Colloid Interface Sci., 230:12–21, 2000.
[81] J. S. Loring, M. H. Sandstrom, K. Noren, and P. Persson. Rethinking ArsenateCoordination at the Surface of Goethite. Chemistry-a European Journal, 15(20):5063–5072, 2009.
[82] B. A. Manning and S. Goldberg. Modeling competitive adsorption of arsen-ate with phosphate and molybdate on oxide minerals. Soil Science Society ofAmerica Journal, 60(1):121–131, 1996.
[83] B. D. Martin, S. A. Parsons, and B. Jefferson. Removal and recovery ofphosphate from municipal wastewaters using a polymeric anion exchangerbound with hydrated ferric oxide nanoparticles. Water Science and Technology,60(10):2637–2645, 2009.
[84] M. Maurer and M. Boller. Modelling of phosphorus precipitation in wastew-ater treatment plants with enhanced biological phosphorus removal. WaterScience And Technology, 39(1):147–163, 1999.
bibliography 117
[85] K. Moeller and J. Burgschweiger. Wasserversorgungskonzept für Berlin undfür das von den Berliner Wasserbetrieben versorgte Umland (Entwicklungbis 2040). Technical report, Berliner Wasserbetriebe, 2008.
[86] M. M. Nederlof, J. A. M. van Paassen, and R. Jong. Nanofiltration concentratedisposal: experiences in The Netherlands. Desalination, 178(1-3):303, 2005.
[87] Adrian Oehmen, Paulo C. Lemos, Gilda Carvalho, Zhiguo Yuan, Jürg Keller,Linda L. Blackall, and Maria A. M. Reis. Advances in enhanced biologicalphosphorus removal: From micro to macro scale. Water Research, 41(11):2271–2300, 2007.
[88] H. Ohashi, T. Sugawara, K. Kikuchi, and H. Konno. Correlation of Liquid-Side Mass-Transfer Coefficient for Single Particles and Fixed-Beds. Journal ofChemical Engineering of Japan, 14(6):433–438, 1981.
[89] R. L. Parfitt and R. J. Atkinson. Phosphate Adsorption on Goethite (Alpha-FeOOH). Nature, 264(5588):740–742, 1976.
[90] R. L. Parfitt, R. J. Atkinson, and R. S. C. Smart. Mechanism of PhosphateFixation by Iron Oxides. Soil Science Society of America Journal, 39(5):837–841,1975.
[91] D. L. Parkhurst and C. A. J. Appelo. User’s guide to PHREEQC (Version2) - A computer program for speciation, batch-reaction, one-dimensionaltransport, and inverse geochemical calculations. Technical report, 1999.
[92] S. A. Parsons and T. Berry. Chemical phosphorus removal. In E. Valsami-Jones, editor, Phosphorus in Environmental Technology. IWA Publishing, Lon-don, 2004.
[93] P. Persson and L. Lövgren. Potentiometric and spectroscopic studies ofsulfate complexation at the goethite-water interface. Geochim. Cosmochim.Acta, 60(15):2789–2799, 1996.
[94] Rene P. J. J. Rietra, Tjisse Hiemstra, and Willem H. van Riemsdijk. Interactionbetween Calcium and Phosphate Adsorption on Goethite. EnvironmentalScience & Technology, 35(16):3369–3374, 2001.
[95] A. Ruhland and M. Jekel. Concept for an integrated evaluation of arsenicremoval technologies: demonstrated in a case study. In 2nd World WaterCongress: Drinking Water Treatment, volume 2 of Water Science and Technology:Water Supply, pages 267–274. IWA Publishing, London, 2002.
[96] B. Saha, R. Bains, and F. Greenwood. Physicochemical characterizationof granular ferric hydroxide (GFH) for arsenic(V) sorption from water.Separation Science and Technology, 40(14):2909–2932, 2005.
[97] SenStadt. Abwasserbeseitigungsplan Berlin. Technical report, Senatsverwal-tung für Stadtentwicklung Berlin, 2001.
118 bibliography
[98] L. Sigg and W. Stumm. The interactions of anions and weak acids withthe hydrous goethite (a-FeOOH) surface. Colloids and Surfaces, 2(2):101–117,1981.
[99] H. Sontheimer, J.C. Crittenden, and R.S. Summers. Activated Carbon for WaterTreatment. DVGW-Forschungsstelle am Engler-Bunte-Institut der UniversitätKarlsruhe, Karlsruhe, 1988.
[100] A. Sperlich and M. Jekel. Phosphate adsorption onto granular ferric hydrox-ide: isotherm and fixed-bed column studies. Water Science and Technology(submitted), 2010.
[101] A. Sperlich, A. Werner, A. Genz, G. Amy, E. Worch, and M. Jekel. Break-through behavior of granular ferric hydroxide (GFH) fixed-bed adsorptionfilters: modeling and experimental approaches. Water Research, 39(6):1190–1198, 2005.
[102] A. Sperlich, B. Baumgarten, A. Genz, M. Ernst, and M. Jekel. Kinetic Aspectsof Arsenate and Phosphate Adsorption onto Granular Ferric Hydroxide(GFH). In The 2nd International Conference on Environmental Science andTechnology, Houston, Texas, USA, 2006.
[103] A. Sperlich, S. Schimmelpfennig, B. Baumgarten, A. Genz, G. Amy, E. Worch,and M. Jekel. Predicting anion breakthrough in granular ferric hydroxide(GFH) adsorption filters. Water Research, 42(8-9):2073–2082, 2008.
[104] A. Sperlich, X. Zheng, M. Ernst, and M. Jekel. An integrated wastewaterreuse concept combining natural reclamation techniques, membrane filtra-tion and metal oxide adsorption. Water Science and Technology, 57(6):909–914,2008.
[105] A. Sperlich, D. Warschke, C. Wegmann, M. Ernst, and M. Jekel. Treatmentof membrane concentrates: phosphate removal and reduction of scalingpotential. Water Science and Technology, 61(2):301–306, 2010.
[106] I. Steén. Phosphorus recovery in the context of industrial use. In E. Valsami-Jones, editor, Phosphorus in Environmental Technology. IWA Publishing, Lon-don, 2004.
[107] W. Stumm, C. P. Huang, and S. R. Jenkins. Specific Chemical InteractionAffecting Stability of Dispersed Systems. Croatica Chemica Acta, 42(2):223–245,1970.
[108] George Tchobanoglous, Franklin L. Burton, H. David Stensel, and Metcalf &Eddy. Wastewater engineering: treatment and reuse. McGraw-Hill, Boston, 4th/ edition, 2003.
[109] I. Teermann. Untersuchungen zur Huminstoffadsorption an ß-Eisenoxidhydrat.Dissertation, Technische Universität Berlin, 2000.
[110] I. Teermann and M. Jekel. Adsorption of humic substances onto ß-FeOOHand its chemical regeneration. Wat. Sci. Tech., 40(9):199–206, 1999.
bibliography 119
[111] I. Tejedor-Tejedor and A. M. Anderson. Protonation of phosphate on thesurface of goethite as studied by CIR-FTIR and electrophoretic mobility.Langmuir, 6:602–611, 1989.
[112] S. Thole. Verwertung von eisenhaltigen Wasserwerksschlämmen zur Phosphate-limination aus kommunalem Abwasser. Dissertation. VDI Fortschritts-BerichteReihe 15 Nr. 117, Dissertation, Technische Universität Berlin, 1993.
[113] S. Thole, M. Borho, G. Voswinckel, and M. Jekel. Einfluß der Wasserma-trix auf die Adsorption von Phospat an Eisenhydroxid und Wasserwerkss-chlamm. Vom Wasser, 79:313–321, 1992.
[114] M. Thomas, P. Wright, L. Blackall, V. Urbain, and J. Keller. Optimisationof Noosa BNR plant to improve performance and reduce operating costs.Water Science and Technology, 47(12):141–148, 2003.
[115] J. Torrent, V. Barron, and U. Schwertmann. Phosphate Adsorption andDesorption by Goethites Differing in Crystal Morphology. Soil ScienceSociety of America Journal, 54(4):1007–1012, 1990.
[116] G. A. Tularam and M. Ilahee. Environmental concerns of desalinatingseawater using reverse osmosis. Journal Of Environmental Monitoring, 9(8):805–813, 2007.
[117] UBA. Grundsätze und Maßnahmen für eine vorsorgeorientierte Begrenzung vonSchadstoffeinträgen in landbaulich genutzten Böden. Umweltbundesamt Texte59-01. Berlin, 2001.
[118] E. Valsami-Jones. The geochemistry and mineralogy of phosphorus. InE. Valsami-Jones, editor, Phosphorus in Environmental Technology. IWA Pub-lishing, London, 2004.
[119] E. Van Houtte and J. Verbauwhede. Operational experience with indirectpotable reuse at the Flemish Coast. Desalination, 218(1-3):198–207, 2008.
[120] R. Vollenweider and J. Kerekes. Eutrophication of waters, monitoring, as-sessment, control. Technical report, Organisation for Economic Co-operationand Development (OECD), 1982.
[121] Jiansen Wang, Yonghui Song, Peng Yuan, Jianfeng Peng, and MaohongFan. Modeling the crystallization of magnesium ammonium phosphate forphosphorus recovery. Chemosphere, 65(7):1182–1187, 2006.
[122] GEH Wasserchemie. GEH 102 - Technical Information 1, 2008.
[123] J. Westall and W. Schecher. MINEQL+ 4.50, 2001.
[124] C. R. Wilke and P. Chang. Correlation of Diffusion Coefficients in DiluteSolutions. Aiche Journal, 1(2):264–270, 1955.
[125] J. A. Wilsenach, C. A. H. Schuurbiers, and M. C. M. van Loosdrecht. Phos-phate and potassium recovery from source separated urine through struviteprecipitation. Water Research, 41(2):458–466, 2007.
120 bibliography
[126] E. J. Wilson and C. J. Geankoplis. Liquid mass transfer at very low Reynoldsnumbers in packed beds. Ind. Eng. Chem. Fundamentals, 5:126–129, 1966.
[127] E. Worch. Fixed-bed adsorption in drinking water treatment: a critical reviewon models and parameter estimation. Journal Of Water Supply Research AndTechnology-Aqua, 57(3):171–183, 2008.
[128] E. Worch. Eine neue Gleichung zur Berechnung von Diffusionskoeffizientengelöster Stoffe. Vom Wasser, 18:289–297, 1993.
[129] W. S. Yao and F. J. Millero. Adsorption of phosphate on manganese dioxidein seawater. Environmental Science & Technology, 30(2):536–541, 1996.
[130] X. Zheng, R. Mehrez, M. Jekel, and M. Ernst. Bio-filtration of treateddomestic wastewater as a pre-treatment to ultrafiltration: effects on proteinand polysaccharide related fouling. In 4th IWA International MembranesConference, Harrogate, UK, 2007.
[131] X. P. Zhu and A. Jyo. Column-mode phosphate removal by a novel highlyselective adsorbent. Water Research, 39(11):2301–2308, 2005.