microwave dielectric behavior of wet soil-part 1: empirical models and experimental observations
TRANSCRIPT
IEEE TRANSACTIONS ON GEOSCIENCE AND REMOTE SENSING, VOL. GE-23, NO. 1, JANUARY 1985
Microwave Dielectric Behavior of Wet Soil-Part 1:Empirical Models and Experimental Observations
MARTTI T. HALLIKAINEN, MEMBER, IEEE, FAWWAZ T. ULABY, FELLOW, IEEE,
MYRON C. DOBSON, MEMBER, IEEE, MOHAMED A. EL-RAYES, AND
LIN-KUN WU, STUDENT MEMBER, IEEE
Abstract-This is the first paper in a two-part sequence that evaluatesthe microwave dielectric behavior of soil-water mixtures as a functionof water content, temperature, and soil textural composition. Part Ipresents the results of dielectric constant measurements conducted forfive different soil types at frequencies between 1.4 and 18 GHz.
Soil texture is shown to have an effect on dielectric behavior over theentire frequency range and is most pronounced at frequencies below 5GHz. In addition, the dielectric properties of frozen soils suggest thata fraction of the soil water component remains liquid even at tempera-tures of -240C. The dielectric data as measured at room temperatureare summarized at each frequency by polynomial expressions dependentupon both the volumetric moisture content mu and the percentage ofsand and clay contained in the soil; separate polynomial expressions aregiven for the real and imaginary parts of the dielectric constant.
In Part II, two dielectric mixing models will be presented to accountfor the observed behavior: 1) a semiempirical refractive mixing modelthat accurately describes the data and requires only volumetric moistureand soil texture as inputs, and 2) a theoretical four-component mixingmodel that explicitly accounts for the presence of bound water.
I. INTRODUCTION
A WET SOIL MEDIUM is a mixture of soil particles, airvoids, and liquid water. The water contained in the soil
usually is divided into two fractions: 1) bound water and 2)free water. Bound water refers to the water molecules containedin the first few molecular layers surrounding the soil particles;these are tightly held by the soil particles due to the influenceof matric and osmotic forces [1] . Because the matric forcesacting on a water molecule decrease rapidly with distanceaway from the soil-particle surface, water molecules locatedseveral molecular layers away from soil particles are able tomove within the soil medium with relative ease, and hence arereferred to as "free." Dividing the water into bound and freefractions describes only approximately the actual distributionof water molecules within the soil medium and is based on asomewhat arbitrary criterion for the transition point between
Manuscript received January 13, 1983; revised April 11, 1984. Thiswork was supported by the Army Research Office, Research TrianglePark, NC, under Grant DAAG29-81-K-0142.M. T. Hallikainen is with the Helsinki University of Technology,
Espoo, Finland.F. T. Ulaby was with the Remote Sensing Laboratory, University of
Kansas Center for Research, Inc., Lawrence, KS 66045. He is now withthe Radiation Laboratory and the Department of Electrical and Com-puter Engineering, University of Michigan, Ann Arbor, MI 48109.M. C. Dobsori, M. El-Rayes, and L. K. Wu are with the Remote Sensing
Laboratory, University of Kansas Center for Research, Inc., Lawrence,KS 66045.
bound and free water layers. The amount of water containedin the first molecular layer adjoining the soil particles is directlyproportional to the total surface area of the soil particles con-tained in a unit volume. The total surface area of the particlesis, in turn, a function of the soil particle size distribution andmineralogy. A soil usually is assigned to a textural class on thebasis of its particle-size distribution.
Electromagnetically, a soil medium is, in general, a four-component dielectric mixture consisting of air, bulk soil,bound water, and free water. Due to the high intensity of theforces acting upon it, a bound water molecule interacts withan incident electromagnetic wave in a manner dissimilar tothat of a free water molecule, thereby exhibiting a dielectricdispersion spectrum that is very different from that of freewater. The complex dielectric constants of bound and freewater are each functions of the electromagnetic frequency f,the physical temperature T, and the salinity S. Hence, thedielectric constant of the soil mixture is, in general, a functionof: 1)f, T, and S, 2) the total volumetric water content mu, 3)the relative fractions of bound and free water, which are relatedto the soil surface area per unit volume, 4) the bulk soil densityPb, 5) the shape of the soil particles, and 6) the shape of thewater inclusions.
Several experimental programs have been conducted over thepast several years in order to determine the dielectric behaviorof soil-water mixtures in the microwave region [2] - [16], [221.Additionally, several attempts have been made to model thisdielectric behavior [51, [6], [16], [17] through the use ofdielectric mixing formulas. A close examination of these in-vestigations leads to the following observations:
1) Inconsistencies exist between experimental measurementsreported by different investigators, both in terms of the abso-lute level of the relative dielectric constant e (versus water con-tent) for similar soil textures and in terms of the dependenceof e on soil texture. Hoekstra and Delaney [5] and Davis etal.[14], for example, conclude that on the basis of their respec-tive measurements, soil textural composition has a very minorinfluence on the dielectric constant of wet soil. In contrast,the data reported by other investigators, particularly those ofWang [16], Lundien [8], and Newton [7], show significantdifferences in the magnitude of e for different soil types (atthe same volumetric moisture content). Experimental differ-ences in sample composition, sample preparation, and measure-ment procedures make it difficult to reconcile these incon-sistencies in the data.
0196-2892/84/0001-0025$01.00 © 1984 IEEE
25
IEEE TRANSACTIONS ON GEOSCIENCE AND REMOTE SENSING, VOL. GE-23, NO. 1, JANUARY 1985
2) Although each of the reported experimental data setsshows that e exhibits an upward trend with increasing soilmoisture content mu, most of the data exhibit a fair amountof scattering about the best-fit curve. This data scattering isattributable to measurement errors in e and mu. Additionally,some of the reported results [131 indicate that the curve forthe real part of the complex dielectric constant e', as a func-tion of increasing mv, has a tendency to level off for large valuesof mV. This behavior has been attributed by Wang [23] toleakage of soil water from the apparatus when the water con-tent approaches the porosity of the soil sample.3) None of the existing microwave dielectric models for soil-
water mixtures is capable of fitting experimental data on thebasis of soil physical parameters. In the only model in whichsome provision to account for the dependence of e on soiltype is included [16], dependence is established by selectingappropriate values for two free parameters in order to fit theexperimental data.The present study was motivated by the limitations previously
outlined upon the current understanding of the microwavedielectric behavior of soil-water mixtures. Its objectives were1) to conduct dielectric constant measurements with a highdegree of accuracy and precision over the 1- to 18-GHz regionfor several soil types, and 2) to develop a dielectric-constantmodel based on specific soil physical characteristics. Realiza-tion of the first objective is the subject of this paper, which re-ports experimental measurements in the range from 1.4 to18 GHz; the second objective is realized in Part II.
II. MEASUREMENT TECHNIQUES
The overall objective of this program was to measure the di-electric properties of soil-water mixtures at several frequenciesin the 1- to 18-GHz range. Two measurement techniques werechosen. The first is a waveguide transmission technique, whichwas used for the 1-2 and 4-6-GHz bands, and the second is afree-space transmission technique, which was used for measure-ments at 8 frequencies between 4 and 18 GHz. The waveguidetechnique is the easier ofthe two to use, but at frequencies aboveabout 6 GHz sample preparation became difficult because ofthe small size of the waveguide. Conversely, the free-spacetransmission technique is difficult to use at low frequenciesbecause of the need for a large structure and large amounts ofsoil to be used as samples. The data presented herein wereobtained with the waveguide technique at 1.4 GHz and 4-6GHz and with the free-space transmission technique at 4-18GHz in 2-GHz increments. In order to test the comparativeaccuracy and precision of the two measurement techniques,soil samples were measured using both techniques at 6 GHzand then compared. After a brief description of each of themeasurement techniques, the results of the comparison testare given in the following.
H P 8350 ASweep
Coax lacHtrroe ~~~~~~~Reference Arm|
Oh20-dB nce HP 841Ne kna
solatorSection
Neoltwork Anayze
Waveguilde HP 8411I Phase-GainTransition Harmonic ndicator
Isolator Isolator Attenuator FrequencyI' * Converter
Sample Arm
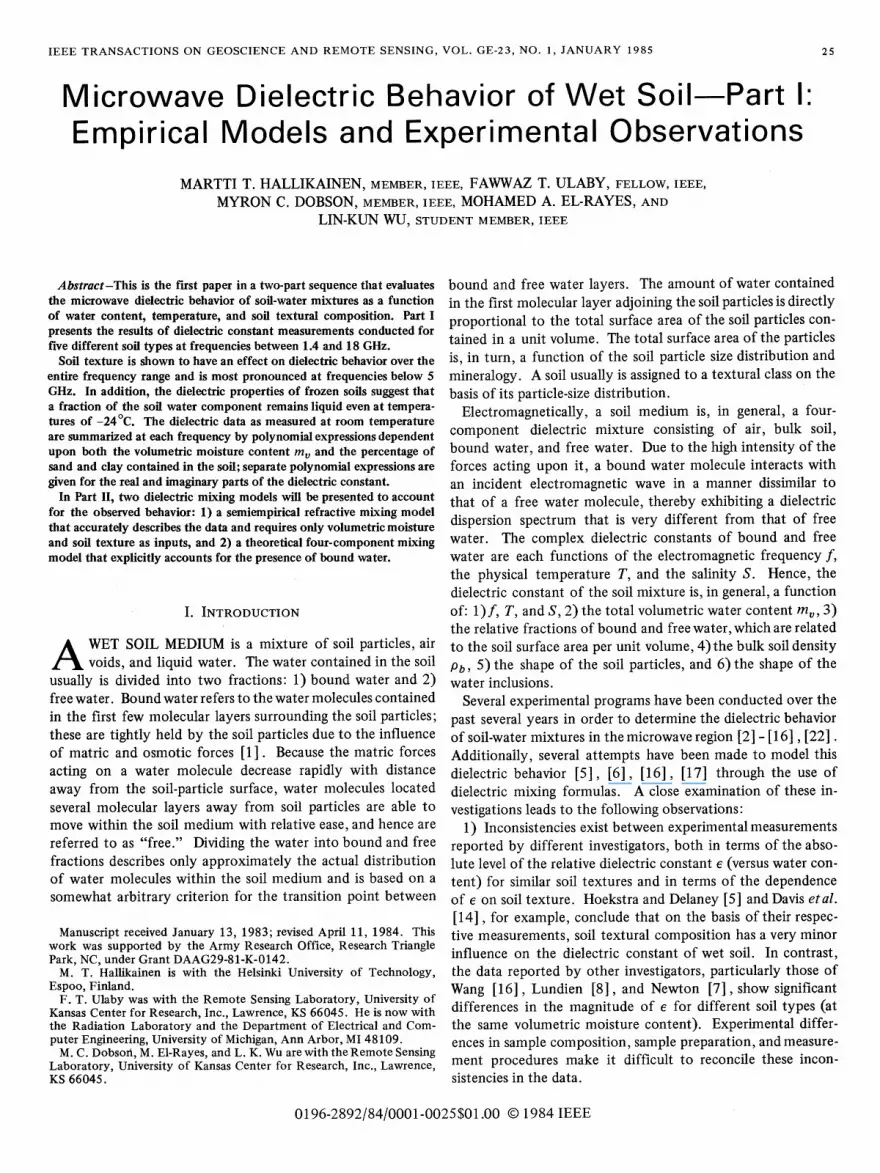
Fig. 1. Block diagram of the 4- to 6-GHz waveguide dielectric measure-ment system.
ings ofthe network-analyzer/phase-gain indicator for the sampleholder when it is empty and when it is filled with a soil sample.Thus the measured quantities are Tm,1 the magnitude of thefield transmission coefficient (which is determined from power-loss measurements), and @m, the phase of Tm.1) Transmission Coefficient: With isolators placed on both
sides of the dielectric-filled waveguide (sample holder), thetransmission coefficient Tm may be computed using transmis-sion-line formulations, or may be obtained by modifying thesolution for a dielectric slab. In either case, the result is
Tm = ITm I e (1 _R2 e-2L1-RJ? e2' (1)
where y, the propagation constant of the dielectric-filled wave-guide, is defined in terms of the attenuation coefficient a andthe phase factor (3 as
y = a + jo3. (2)The field reflection coefficient R is given in terms of ZO, thecharacteristic impedance of the waveguides connected to theinput and output ports of the dielectric-f~iled waveguide, andZ is the characteristic impedance of the dielectric-filled wave-guide
Z- L o
Z+ZO-
These impedances are given by
I&=jwIo - 27r7?o (3(1 + ja /()Y Xo a2 +g2
jo= Iwio 21T1noYO X0 go
(3)
(4)
(5)
where w = 2irf, po is the permeability of free space, X0 is thefree-space wavelength, O = (,io/e0)1/2 is the intrinsic imped-ance of free space, and yo = j1o is the propagation constant inthe air-filled waveguides connected to the dielectric-filled wave-guide. The propagation constants 300 and y = a +j3 are givenby
A. Waveguide Transmission TechniqueThe block diagram shown in Fig. 1 is a standard arrangement
for measuring the amplitude and phase of the TE1o modetransmission coefficient for a dielectric sample of length L.This is obtained by comparing the amplitude and phase read-
X0 [ Xc)
a + jo == 27 (o)_
(6)
(7)
26

HALLIKAINEN et al.: MICROWAVE DIELECTRIC BEHAVIOR OF WET SOIL-PART I
where Xc = a12 is the cutoff wavelength ofthe guide with widtha for the TE1o mode, and e is the relative complex dielectricconstant of the sample
I . .,e =e - 16 (8)
In summary, the field transmission coefficient Tm is determinedby the guidewidth a, the free-space wavelength XO, and therelative complex dielectric constant e.2) Computing the Dielectric Constant e: According to
(1) through (6), 1 Tm |= T|m (a), f) and Okm = Om (a, 3). Thusin principle, given measured values for ITm I and Om, the quan-tities oa and : can be determined uniquely. Once these quantitiesare determined, c' and e" can be computed using
(2 a) [( (a)6 = (Xo)(2[(2 )
rr (2a4
,)Flexible Cable
Transmitting Horn
E.otAbsorbingSample Holder Sheets(Styrofoam)
/ Receiving Horn
y Flexible Cable
(9)
(10)
which were obtained by inverting (7).The problem is that the expressions for IT!I and 'km are
coupled nonlinear functions of a and 1; therefore, it is not pos-sible to compute a and 13 from T, I and (km directly. Thesolution is to use an iterative procedure. The expression forthe field transmission coefficient given by (1) accounts for re-flection losses due to mismatch at the two boundaries of thedielectric-filled waveguide and for dielectric losses. The latteris represented by the factor e-(L in the numerator. Dielectricloss can be made to be the major loss factor if sample length ischosen appropriately. In the first step of the iteration proce-dure, an initial estimate of the transmission coefficient is madeby taking R = 0 in (1). This estimate is designated T1 and isgiven by
tjosI, m L -jp31LT=ITIe =|m|e es -e I (11)which provides initial estimates for a and 13, designated a, and1, respectively. These are given by
011 - Ion ( I TM |)/L (12)a1 =lnM(Lm) (13)
The second step uses the preceding values of az1 and ,1 tocompute I T2 l and O2 using the exact expression given by (1)and all the other associated expressions, (2) through (6). Thethird step involves an evaluation of the errors A T= T2 | -| Tm! and Afi = 02 - (m . On the basis of these errors, newestimates for oa and 13, designated a2 and 132, are selected. Theiteration process is then continued until IA TI and IAk f| con-verge to those values specified for the network-analyzer/phase-gain indicator system. In the present investigation, the iterationprocess was terminated when I A T! < 0.1 dB and I AO | < 0.02radians were achieved.
B. Free-Space Transmission TechniqueThe free-space transmission system shown in Fig. 2 is basically
similar to the waveguide system except that instead of using adielectric-filled waveguide, the free-space system uses twosmall horn antennas and a soil dielectric slab. The antenna
Fig. 2. Block diagram of the 4- to 18-GHz free-space measurementsystem.
separation is 23 cm and the sample diameter is 30 cm. Twomethods are used to account for multiple reflections. A pulleysystem is used to vary the sample location between the hornantennas during measurement of the phase shift, and sweptfrequency loss measurements are used to record and averagereflections [191, [20]. Additionally, measurements are re-peated for several different sample thicknesses and then aver-aged. The latter is especially useful for low-loss conditionssuch as those represented by dry soils at low frequencies.For normal incidence, all the expressions given in the pre-
vious section for the waveguide system are equally applicableto the free-space system if we set 1 /X, = 0 in (6), (7), and (9).Also, the iterative procedure is equally applicable to the free-space technique.
C. MeasurementAccuracyandPrecisionMeasurement accuracy and precision are dependent upon
both the dielectric measurement technique used and the sample-preparation method. An error analysis was conducted for thewaveguide and free-space transmission techniques as well as forthe sample-preparation procedure.1) Waveguide Transmission Technique: An error analysis
was conducted to compute the relative measurement errors,A e/e' and Ae"/e", on the basis of the precision specificationsof the network-analyzer/phase-gain indicator. The results werefound to be in good agreement with the standard-deviation-to-mean ratio calculated from repeated measurements for thesame dielectric material. These tests were conducted for a siltyloam soil (Field 3 of Table I) at each of three levels of soil-moisture content (0.006, 0.331, and 0.461 cm3 * cm-3) andfor pure water, the latter being chosen because its dielectricproperties are known with a good degree of accuracy. Theresults may be summarized as follows: 1) Ae' .0.15 andAe" < 0.17 for all samples tested, 2) (A e/e') < 0.9 percent at
27

IEEE TRANSACTIONS ON GEOSCIENCE AND REMOTE SENSING, VOL. GE-23, NO. 1, JANUARY 1985
TABLE ISOIL TEXTURE SAMPLES AND FREQUENCIES AT WHICH DIELECTRIC
MEASUREMENTS WERE OBTAINED
Soil Texture (%) CationSoil Specific Exchange
No.* Designation Soil Type Sand Silt Clay Surface, m2/g Capacity
1 Field 1 Sandy Loam 51.51 35.06 13.43 52 8.2
2 Field 2 Loam 41.96 49.51 8.53 49 7.6
3 Field 3 Silt Loam 30.63 55.89 13.48 66 11.4
4 Field 4 Silt Loam 17.16 63.84 19.00 119 20.5
5 Field 5 Silty Clay 5.02 47.60 47.38 252 34.8
Waveguide Transmission System: 1.4, 4.0, 4.5, 5.0, 5.5, 6.0 GHz
Free-Space Transmission System: 4.0, 6.0, 8.0, 10.0, 12.0, 14.0, 16.0, 18.0 GHz
6
f 5
41-
30
1 2up
100
50
w
LO 40
30(v
B 0
:-: o
40
~~~~~~~~mv 0-33 cm3 cmi3d = 12 mm
\ ~~~~~~~~mv = 0.33 cm3 c -3
d 1
v = 0.22 cm3 cm3
0v=°.33 cm d 20m
dv = 0.019cm3 cm3d = 50mm
4 8 12Frequency f (GHz)
(a)
16 20
35F
30
, 25
3 20
m 15
- - Waveguide Techniquem- Free-Space TechniqueFrequency: 6 GHzField 2: Loam
10-
5
\m, = 0.019 cm3 crri3~~ \<~ ~~d =50 mm
\ ~ ~~~~~mv = 0.33 cm 3 crm3\ /~~~~d= 12mm
_ \ a/ ,mv~~~~~~m= 0.22 cnm3 crm3
mV = 0.33 cm- scm3 d =20MM
_( d =35rnrn / 3,_ ~~mv = 0.33 cm3 c -3
_~~~~~~~~~~~~ = 8m
0 4 8 12Frequency f (GHz)
(b)
16 20
Fig. 3. Calculated worst case error bounds for (a) the dielectric constante and (b) the dielectric loss factor e"if as a function of frequency, volu-metric wetness, and sample thickness. Errors resulting from both theequipment and the sample are included.
1.4 GHz and <0.7 percent at 5 GHz for all samples tested,3) (Ae"/e") decreases from 37 percent for m, = 0.006 cm3
cm 3 to 6 percent for mu >0.331 cm3 cm3 at 1.4 GHz;somewhat smaller values apply at 5 GHz. In other words, allthe measurements of e' are highly accurate, both in -the abso-lute and the relative senses, as are the measurements of e",except for low soil-moisture situations. The 37-percent rela-tive precision for mu = 0.006 cm3 cm3 is due to the fact
that for such a low moisture content, eit is very small. Themean value for e" was measured to be e" =0.060 and thestandard deviation was calculated to be A e" = 0.022. Thuseven though the relative precision Aec/e"I is large, the absoluteprecision A c" is small.2) Free-Space Transmission Technique: The total calculated
worst case error bounds for the measurement of moist soil are
shown in Fig. 3 for various combinations of sample thickness
& A
m d a
A e t3,0.1 0.2 0.3 0.4 0.5
Volumetric Moisture m, (cm3 cm-3)
Fig. 4. Comparison of soil dielectric measurements made by the wave-guide and free-space techniques at 6 GHz.
and moisture content. These error bounds include uncertain-ties, both in the free-space transmission equipment and insample preparation. Extensive test measurements of materialsranging from polymethyl methacrylate (a low-loss material) towater (a high-loss material) produced smaller errors than theworst case bounds [20]. In general, the accuracy of the mea-surements increases with increasing frequency, moisture con-tent, and sample thickness.The 4- to 6-GHz region is common to both dielectric measure-
ment techniques. A comparison of the results obtained by thetwo techniques is shown in Fig. 4. The good agreement achievedfor both e' and e" over the range of m, indicated supportsconfidence in the results of this measurement program.3) Sample Preparation: Prior to measuring the dielectric
constant of a soil sample, the sample was first dried in an ovenat I 10"C for 24 h. The sample was then allowed to cool in adessicator, thereby avoiding any water absorption from the air.The cooled dry sample was then ground to destroy any soil
28
"I
HALLIKAINEN et al.: MICROWAVE DIELECTRIC BEHAVIOR OF WET SOIL-PART I
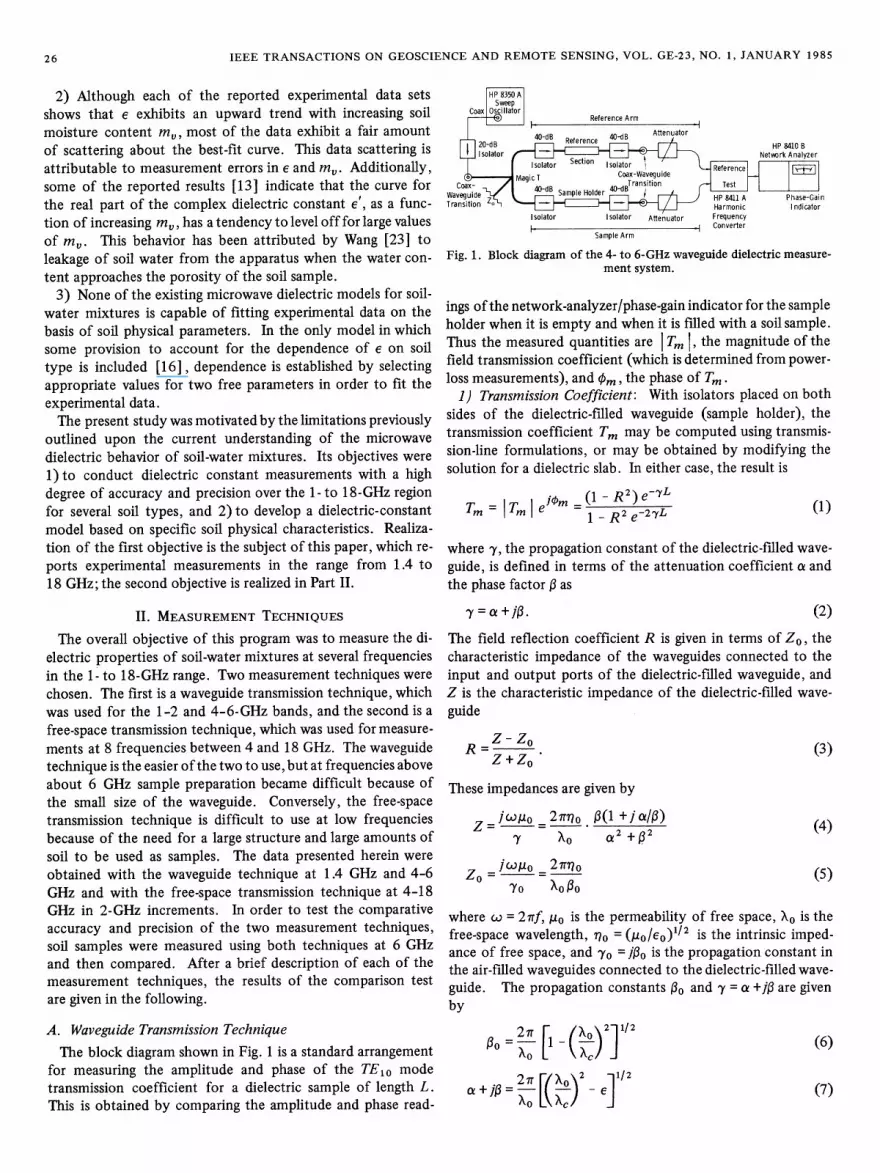
TABLE IICOEFFICIENTS OF POLYNOMIAL EXPRESSIONS AND PREDICTION ACCURACY
cc = (a aS + a2C) + (b0 +b15 b2C)m + (c1 +c1S +c2C)m 2 AC I C c cm a A + B £Frequency, GHz a8 al 2 b b1 b2 C0 c1 C2 IC SD A B r2 SEE N
1.4 2.862 -0.012 0.001 3.803 0.462 -0.341 119.006 -0.500 0.633 -0.101 0.662 0.227 0.967 0.993 0.620 534 2.927 -0.012 -0.001 5.505 0.371 0.062 114.826 -0.389 -0.547 -0.022 0.852 0.112 0.989 0.986 0.855 706 1.993 0.002 0.015 38.086 -0.176 -0.633 10.720 1.256 1.522 -0.128 0.907 0.031 0.987 0.983 0.908 73-8 1.997 0.002 0.018 25.579 -0.017 -0.412 39.793 0.723 0.941 -0.075 0.739 0.038 0.990 0.987 0.742 74
10 2.502 -0.003 -0.003 10.101 0.221 -0.004 77.482 -0.061 -0.135 -0.042 0.723 0.072 0.989 0.986 0.725 7712 2.200 -0.001 0.012 26.473 0.013 -0.523 34.333 0.284 1.062 -0.103 0.857 0.015 0.989 0.976 0.860 8914 2.301 0.001 0.009 17.918 0.084 -0.282 50.149 0.012 0.387 -0.073 0.612 0.065 0.984 0.987 0.612 62
a 16 2.237 0.002 0.009 15.505 0.076 -0.217 48.260 0.168 0.289 -0.080 0.706 0.096 0.979 0.983 0.704 5018 1.912 0.007 0.021 29.123 -0.190 -0.545 6.960 0.822 1.195 -0.107 0.621 0.066 0.978 0.984 0.616 88All -0.082 0.751 0.068 0.986 0.986 0.y46 636
1.4 0.356 -0.003 -0.008 5.507 0.044 -0.002 17.753 -0.313 0.206 0.079 0.350 -0.304 1.179 0.981 0.239 534 0.004 0.001 0.002 0.951 0.005 -0.010 16.759 0.192 0.290 0.419 0.637 0.049 1.211 0.884 0.578 70
- 6 -0.123 0.002 0.003 7.502 -0.058 -0.116 2.942 0.452 0.543 0.271 0.580 -0.088 1.160 0.926 0.525 73-8 -0.201 0.003 0.003 11.266 -0.085 -0.155 0.194 0.584 0.581 0.139 0.568 -0.138 1.097 0.945 0.537 7410 -0.070 0.000 0.001 6.620 0.015 -0.081 21.578 0.293 0.332 0.090 0.411 -0.100 1.056 0.979 0.389 77
,, 12 -0.142 0.001 0.003 11.868 -0.059 -0.225 7.817 0.570 0.801 0.137 0.774 -0.276 1.105 0.936 0.732 892 14 -0.096 0.001 0.002 8.583 -0.005 -0.153 28.707 0.297 0.357 -0.191 0.326 -0.14? 0.987 0.990 0.326 62
16 -0.027 -0.001 0.003 6.179 0.074 -0.086 34.126 0.143 0.206 -0.114 0.306 -0.073 0.989 0.992 0.306 50C
18 -0.071 0.000 0.003 6.938 0.029 -0.128 29.945 0.275 0.377 -0.041 0.340 -0.116 1.021 0.990 0.335 88All 0.097 0.544 0.000 1.032 0.961 0.538 636
clods that might exist. Finally, a predetermined amount ofdistilled water was added to a soil sample of known weight,the combination was mixed well, and then stored in a sealedcontainer in order to cure for another 24 h. By knowing theweight of the dry soil sample Wd and the weight of the wateradded to the sample Ww, the gravimetric moisture contentmg = WWlWd can be determined. The volumetric moisturecontent is given by m, = Pbmg, where Pb is the bulk densityof the dry soil. For a known volume V of the sample holder,Pb = WdI V. Based on an analysis of the errors involved in thedetermination of Pb and the errors in mg resulting fromchanges in water content (due to evaporation) from the be--ginning to the completion of a dielectric measurement, therelative measurement precision of mu is estimated to be Am,/m 6 percent. The moisture was also determined gravimet-rically for a portion of each sample upon completion of thedielectric measurements.
All dielectric measurements were conducted at 22 ± -20C.In addition, special attention was given to producing a smoothupper-surface boundary when the soil samples were beingpacked for the free-space technique.
III. RESULTS
The dielectric measurements were conducted for five soilswith different textural compositions obtained from agriculturalfields in the vicinity of Lawrence, Kansas. The textural com-positions of all five soil types in terms of sand, silt, and claypercentages are given in Table I. These compositions are basedon the U.S. Department of Agriculture's classification system[181, which considers soil particles of diameters d>0.005mm as sand, 0.002 mm<d < 0.05 mm as silt, and d. 0.002mm as clay. The values given in Table II were obtained bymechanical fractionation and sedimentation techniques, andthe soil types represented cover a wide range of values in termsof sand and clay contents.
weE
~sa
0
30Field 1: Sandy Loam_Frequency: 5GH z E l
25-
20 for £r2 =0. 975
A SEE =1. 5815
10 A
C0
000 01 02 03 0400 0.1I.2 03 0.~Q0. 0.1 0.2 0. 3 0.4 0.0 0.1 0.2 0.3 0.4
Gravimetric Moisture m9 Volumetric Moisture m,
(a) (b)
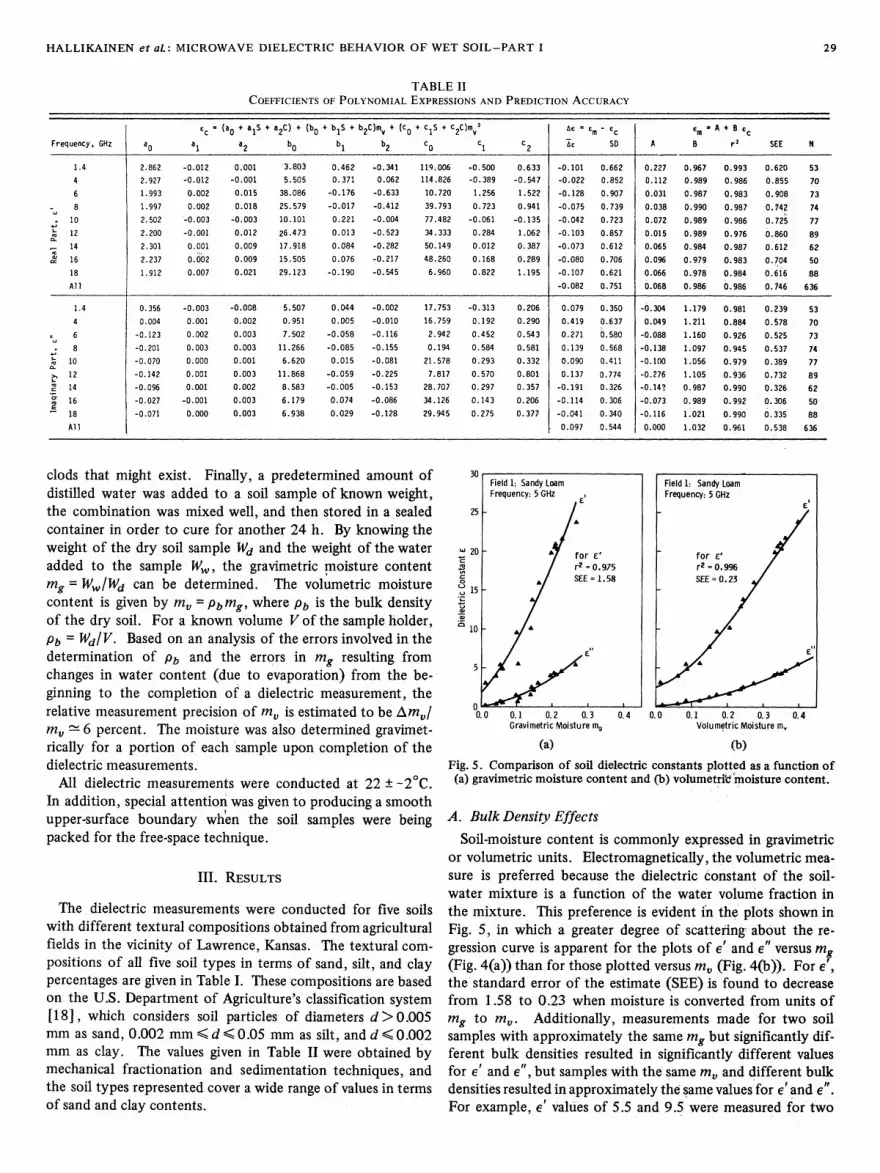
Fig. 5. Comparison of soil dielectric constants plotted as a function of(a) gravimetric moisture content and (b) volumetriV moisture content.
A. Bulk Density EffectsSoil-moisture content is commonly expressed in gravimetric
or volumetric units. Electromagnetically, the volumetric mea-sure is preferred because the dielectric constant of the soil-water mixture is a function of the water volume fraction inthe mixture. This preference is evident in the plots shown inFig. 5, in which a greater degree of scattering about the re-gression curve is apparent for the plots of E' and e" versus mg(Fig. 4(a)) than for those plotted versus mu (Fig. 4(b)). For e',the standard error of the estimate (SEE) is found to decreasefrom 1.58 to 0.23 when moisture is converted from units ofmg to mu. Additionally, measurements made for two soilsamples with approximately the same mg but significantly dif-ferent bulk densities resulted in significantly different valuesfor e' and e", but samples with the same m, and different bulkdensities resulted in approximately the same values for e' and e".For example, c' values of 5.5 and 9.5 were measured for two
29
an

IEEE TRANSACTIONS ON GEOSCIENCE AND REMOTE SENSING, VOL. GE-23, NO. 1, JANUARY 1985
40
35
30
, 25
c 20Co
= 15
10i 5
10
0.
35
30
25
.4J
20
U 15
(a)
Volumetric Moisture m,
(C)
Volumetric Moisture m,
(b)
o0.0 0.1 0.2 0.3 0.4 0.5 0.6
Volumetric Moisture m.(d)
Fig. 6. Measured dielectric constant for five soils (see Table I for tex-tural composition of the indicated soil types) at (a) 1.4 GHz, (b) 5GHz, (c) 10 GHz, and (d) 18 GHz.
samples with the same mg (about 0.1) but with bulk densitiesof 1.18 g _ cm-3 for the first and 1.72 g - cm-3 for the second.
B. Soil Texture EffectsPlots similar to those in Fig. 5 were generated for each soil
and frequency combination and then fitted with polynomialexpressions dependent upon volumetric moisture as discussedin Section IV, with the distribution of data points about thefitted curve being similar to that shown in Fig. 5(b).The effects of soil textural composition are most readily
seen by comparing the polynomial curves at each frequency.
Fig. 6 shows the moisture dependence ofthe dielectric constantfor each soil at frequencies of 1.4, 5, 10, and 18 GHz. Theindicated moisture range for each soil extends between mu -
0 and the highest moisture content that can be supported bythat soil type without drainage taking place. At each frequency,all the curves for e' and similarly for e" have approximatelythe same intercept at mV =0 and exhibit the same generalshape but have different curvatures for different soil types.At any given moisture content and at all frequencies, c' was
found to be roughly proportional to sand content (and inverselyproportional to clay content). Thus was shown to be soil-
a, 2c
L-
4J1or 15w
a
30
11-
c
.a,
HALLIKAINEN et al.: MICROWAVE DIELECTRIC BEHAVIOR OF WET SOIL-PART I
w 204-1
U /
U, 151
4-
F3 10
Volumetric Moisture my (cm3cm-3)
(a)
U.mI U.Z U.) U.c
Vo lumeet ric ho ist ure my (CM3 CM-3)
(b)
30
25
w 20
4.1 15
;G o
510
- Field 5
46Hz
O/10GHz
as / 8 GHzX act 18 GHz
_ / ,10GHz
7 - -~~~~~- // -~~~~~4~
0.0 0.1 0.2 0.3 0.4Volumetric Moisture m. (cm3cn-3)
(C)
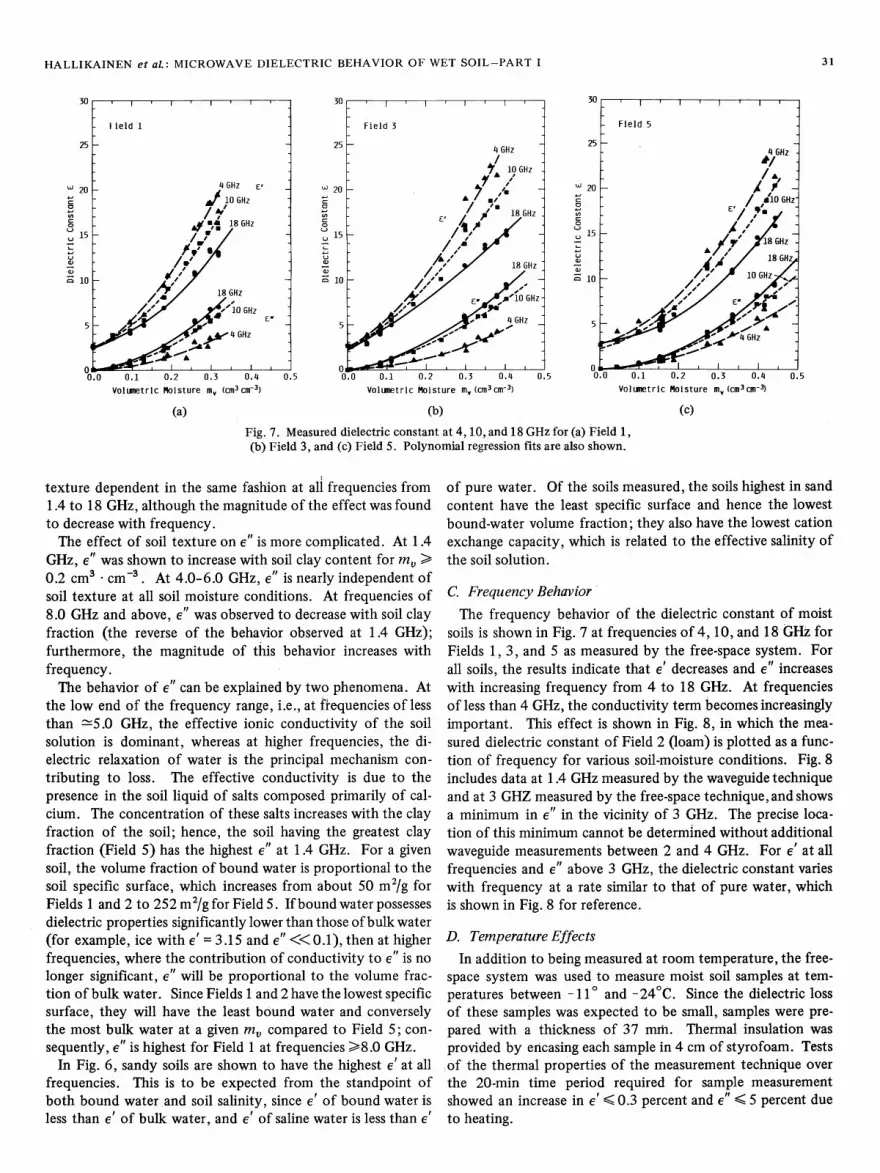
Fig. 7. Measured dielectric constant at 4, 10, and 18 GHz for (a) Field 1,(b) Field 3, and (c) Field 5. Polynomial regression fits are also shown.
texture dependent in the same fashion at all frequencies from1.4 to 18 GHz, although the magnitude of the effect was foundto decrease with frequency.The effect of soil texture on e" is more complicated. At 1.4
GHz, e" was shown to increase with soil clay content for mi >0.2 cm3 * cm-3. At 4.0-6.0 GHz, e" is nearly independent ofsoil texture at all soil moisture conditions. At frequencies of8.0 GHz and above, e" was observed to decrease with soil clayfraction (the reverse of the behavior observed at 1.4 GHz);furthermore, the magnitude of this behavior increases withfrequency.The behavior of e" can be explained by two phenomena. At
the low end of the frequency range, i.e., at frequencies of lessthan -5.0 GHz, the effective ionic conductivity of the soilsolution is dominant, whereas at higher frequencies, the di-electric relaxation of water is the principal mechanism con-
tributing to loss. The effective conductivity is due to thepresence in the soil liquid of salts composed primarily of cal-cium. The concentration of these salts increases with the clayfraction of the soil; hence, the soil having the greatest clayfraction (Field 5) has the highest e" at 1.4 GHz. For a given
soil, the volume fraction of bound water is proportional to thesoil specific surface, which increases from about 50 m2/g forFields 1 and 2 to 252 m2/g for Field 5. If bound water possesses
dielectric properties significantly lower than those ofbulk water(for example, ice with e' = 3.15 and e" <<0.1), then at higherfrequencies, where the contribution of conductivity to e" is nolonger significant, e" will be proportional to the volume frac-tion of bulk water. Since Fields 1 and 2 have the lowest specificsurface, they will have the least bound water and conversely
the most bulk water at a given mv compared to Field 5; con-
sequently, e" is highest for Field 1 at frequencies >8.0 GHz.In Fig. 6, sandy soils are shown to have the highest e' at all
frequencies. This is to be expected from the standpoint ofboth bound water and soil salinity, since e' of bound water isless than e' of bulk water, and e' of saline water is less than e'
of pure water. Of the soils measured, the soils highest in sandcontent have the least specific surface and hence the lowestbound-water volume fraction; they also have the lowest cationexchange capacity, which is related to the effective salinity ofthe soil solution.
C. Frequency Behavior
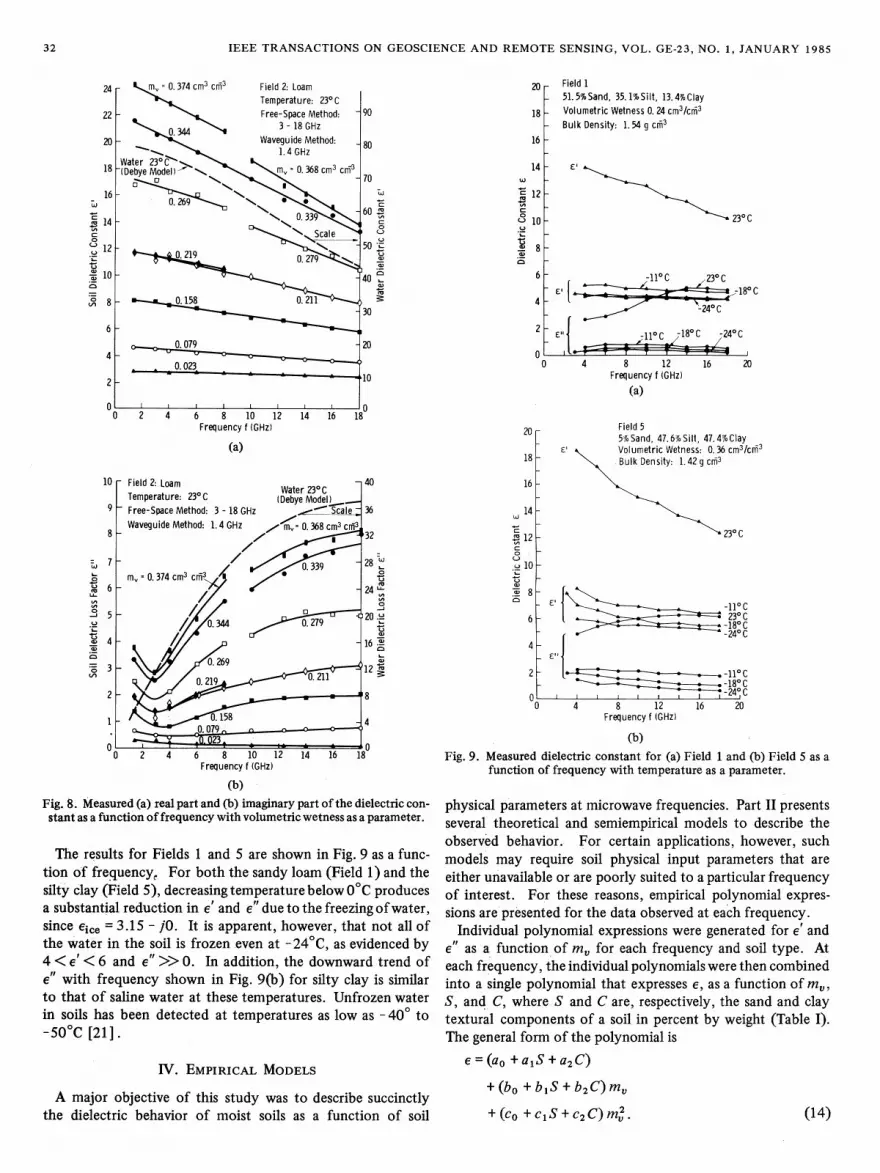
The frequency behavior of the dielectric constant of moistsoils is shown in Fig. 7 at frequencies of 4, 10, and 18 GHz forFields 1, 3, and 5 as measured by the free-space system. Forall soils, the results indicate that e' decreases and e" increaseswith increasing frequency from 4 to 18 GHz. At frequenciesof less than 4 GHz, the conductivity term becomes increasinglyimportant. This effect is shown in Fig. 8, in which the mea-
sured dielectric constant of Field 2 (loam) is plotted as a func-tion of frequency for various soil-moisture conditions. Fig. 8includes data at 1.4 GHz measured by the waveguide techniqueand at 3 GHZ measured by the free-space technique, and showsa minimum in e" in the vicinity of 3 GHz. The precise loca-tion of this minimum cannot be determined without additionalwaveguide measurements between 2 and 4 GHz. For e' at allfrequencies and e" above 3 GHz, the dielectric constant varies
with frequency at a rate similar to that of pure water, whichis shown in Fig. 8 for reference.
D. Temperature EffectsIn addition to being measured at room temperature, the free-
space system was used to measure moist soil samples at tem-peratures between - 110 and -240C. Since the dielectric lossof these samples was expected to be small, samples were pre-
pared with a thickness of 37 mm. Thermal insulation was
provided by encasing each sample in 4 cm of styrofoam. Testsof the thermal properties of the measurement technique over
the 20-min time period required for sample measurementshowed an increase in e' < 0.3 percent and e" < 5 percent dueto heating.
0.5as H e
31
w4-1
C:lI.,
0L-)
I
uZ-1u.2!
IEEE TRANSACTIONS ON GEOSCIENCE AND REMOTE SENSING, VOL. GE-23, NO. 1, JANUARY 1985
16 F
14
' 12
10u 10.L-9 8W,
or ~~i
4-
2 -
oL0
Field 151.596Sand, 35.1%oSilt, 13.4%ClayVolumetric Wetness 0. 24 cm3/ck3Bulk Density: 1. 54 g cr3
230 C
-11C 230C£l 7.=-180 C
-24° C
El''- CiOC j18 C -240C
4 8 12Frequency f (GHz)
(a)
16 20
(a)
L-
'A
.r41
(._
Frequency f (GHz)
(b)Fig. 8. Measured (a) real part and (b) imaginary part ofthe dielectric con-stant as a function offrequency with volumetric wetness as a parameter.
The results for Fields 1 and 5 are shown in Fig. 9 as a func-tion of frequency, For both the sandy loam (Field 1) and thesilty clay (Field 5), decreasing temperature below0C producesa substantial reduction in e' and e" due to the freezing ofwater,since eice = 3.15 - jO. It is apparent, however, that not all ofthe water in the soil is frozen even at - 240C, as evidenced by4 < e' < 6 and e" >> 0. In addition, the downward trend ofe" with frequency shown in Fig. 9(b) for silty clay is similarto that of saline water at these temperatures. Unfrozen waterin soils has been detected at temperatures as low as - 400 to-500C [21].
IV. EMPIRICAL MODELS
A major objective of this study was to describe succinctlythe dielectric behavior of moist soils as a function of soil
20
18
16
14w
X3 12'A
ok
Li 10
6)
. 8-is
6-
Field 55% Sand, 47.6YSilt, 47. 4%Clay
'a Volumetric Wetness: 0.36 cm3/ci3Bulk Density: 1.42 g cm3
230 C
El -110C
230 C180 C
_ £" 2 *-* -- *- F . ~~~~~-11° C-180 C
~-240C0 4 8 12 16 20
Frequency f (GHz)
(b)Fig. 9. Measured dielectric constant for (a) Field 1 and (b) Field 5 as a
function of frequency with temperature as a parameter.
physical parameters at microwave frequencies. Part II presentsseveral theoretical and semiempirical models to describe theobserved behavior. For certain applications, however, suchmodels may require soil physical input parameters that are
either unavailable or are poorly suited to a particular frequencyof interest. For these reasons, empirical polynomial expres-sions are presented for the data observed at each frequency.Individual polynomial expressions were generated for e' and
e" as a function of ma for each frequency and soil type. Ateach frequency, the individual polynomials were then combinedinto a single polynomial that expresses e, as a function of mu,S, and C, where S and C are, respectively, the sand and claytextural components of a soil in percent by weight (Table I).The general form of the polynomial is
e=(ao +ajS+a2C)
+(bo +bjS+b2C)mV
w
m 14c
Q' 12
aM 10
(O 8
6
c
._
a)
32
20-
18
+ (CO + C, S + C2 C) MV2. (14)

HALLIKAINEN et al.: MICROWAVE DIELECTRIC BEHAVIOR OF WET SOIL-PART I
Table II provides a listing of all the constants for e' and e" ateach frequency. The goodness of fit of each of these poly-nomials was evaluated by comparing the measured Em andpredicted e, dielectric constant for each individual soil type.The excellent agreement found in each case is shown by thelinear correlation coefficients between em and ec given inTable II. Examples of these polynomial expressions are shownin Figs. 5 and 7.
V. CONCLUSIONS
The experimental measurements presented in this paper leadto the following major conclusions:
1) The dielectric constant of a soil-water mixture is a func-tion of its volumetric moisture content and of the soil's texturalcomposition over the 1.4- to 18-GHz range.For a given volumetric moisture, a) e' decreases with increas-
ing clay content between 1.4 and 18 GHz, b) e" increases withincreasing clay content for mu > 0.2 cm3 * cm-3 below 5 GHzdue to salinity effects, and c) e" increases with increasing sandcontent above 5 GHz due to the ratio of free water to boundwater, which is greater for sandy soils than for clays.2) If density effects are controlled, the dielectric constant of
dry soil is essentially independent of soil texture and frequency.3) The frequency behavior of c' for wet soils is similar in
form but reduced in magnitude when compared to that forwater between 1.4 and 18 GHz. For e", a minimum value isobtained in the vicinity of 2-4 GHz due to salinity effects atlower frequencies, and a maximum value is obtained at ap-proximately 17 GHz due to the relaxation of water at roomtemperature.4) Both c' and e" decrease with decreasing temperature
below 0C. Because of the freezing of most of the water inthe soil, the frequency dependence of e' and e" is considerablysmaller than it is at room temperature. The magnitudes ofE' and e" at temperatures of -240C and the downward trend ine with increasing frequency, however, indicate the presenceof an unfrozen saline solution in the soil.5) The data presented herein compare favorably with those
measured by other investigators for texturally similar soils [5],[8], [9], [11], [13], [16], [22] withthefollowingexceptions[24]: at 1.4 GHz especially, the values of c' and e" obtainedfor silty clay (Field 5) are considerably lower than those ob-tained by Hoekstra and Delaney [51 for Goodrich clay at similarmoisture contents. This may be related to differences in themineralogy of the clay fraction, which may have a profoundeffect on the nature and quantity of bound water. The valuesobtained for sandy loam (Field 1) are similar to those observedby Njoku and Kong [22] for sand except at 1.4 GHz, whereField 1 exhibits a higher E". This difference can be attributedto differences in soil clay content and mineralogy. At 5 GHz,Fields 1 and 5, which are texturally similar to soils F2 and theHarlingen clay observed by Wang [9], [13], do not displaythe saturation of e' at high m% observed by Wang, whichhas been attributed to free drainage of the samples producingerroneous determinations of mu. In addition, e" measured forFields 1 and 5 is much greater than that observed for soilsF2 and Harlingen clay at ma > 0.2 cm3 - cm-3. Based upon
our observations of soil textural effects at 5 GHz, this differ-ence cannot be readily ascribed to a given soil property.
REFERENCES[1] L. D. Baver, W. H. Gardner, andW. R. Gardner, SoilPhysics. New
York: Wiley, 1977.[2] M. L. Weibe, "Laboratory measurements of the complex dielectric
constant of soils," Texas A & M Univ., College Station, TX, Tech.Rep. RSC-23, Oct. 1971.
[3] Y. I. Leschanskiy, G. N. Lebedeva, and V. D. Schumilin, "Elec-trical parameters of sandy and loamy soils in the range of centi-meter, decimeter and meter wavelength," Izv. Vyss. Ucheb. Zaved.Radiofiz., vol. 14, no. 4, pp. 562-569, 1971.
[4] F. E. Geiger and D. Williams, "Dielectric constants of soils atmicrowave frequencies," Nat. Aeronautics and Space Admin.Rep. NASA TMS-65987, Apr. 1972.
[51 P. Hoekstra and A. Delaney, "Dielectric properties of soils at UHFand microwave frequencies," J. Geophys. Res., vol. 79, pp. 1699-1708, 1974.
[6] J. E. Hipp, "Soil electromagnetic parameters as a function of fre-quency, soil density and soil moisture," Proc. IEEE, vol. 62, pp.98-103, 1974.
[71 R. W. Newton, "Microwave remote sensing and its application tosoil moisture detection," Texas A & M Univ., College Station, TX,Tech. Rep. RSC-81, Jan. 1977.
[8] J. R. Lundien, "Terrain analysis by electromagnetic means," U.S.Army Engineer Waterways Experiment Station, Vicksburg, MS,Tech. Rep. 3-727, Feb. 1971.
[91 J. Wang, T. Schmugge, and D. Williams, "Dielectric constants ofsoils at microwave frequencies-II, Nat. Aeronautics and SpaceAdmin., NASA Tech. Paper 1238, May 1978.
[10] T. Schmugge, T. Wilheit, W. Webster, Jr., and P. Gloersen, "Re-mote sensing of soil moisture with microwave radiometers-II,"Nat. Aeronautics and Space Admin., NASA Tech. Note D-8321,Sept. 1976.
[11] R. E. Newton, and W. R. McClellan, "Permittivity measurementsof soils at L-band," Texas A &M Univ., College Station, TX, Tech.Rep. RSC-58, June 1975.
[121 G. Poe, A. Stogryn, and A. T. Edgerton, "Determination of soilmoisture content using microwave radiometry," Aerojet GeneralCorp., Microwave Div., El Monte, CA, Final Rep. 1684FR-1,DOC Contract 0-35239, 1971.
[13] J. R. Wang, and T. J. Schmugge, "An empirical model for thecomplex dielectric permittivity of soils as a function of watercontent," IEEE Trans. Geosci. Remote Sensing, vol. GE-18, pp.288-295, 1980.
[14] J. L. Davis, G. C. Topp, and A. D. Annan, "Electromagnetic de-tection of soil water content, progress report II," in WorkshopProc. Remote Sensing of Soil Moisture and Groundwater (RoyalYork Hotel, Toronto, Canada), 1976.
[151 G. A. Poe, "Remote sensing of the near-surface moisture profileof specular soils with multi-frequency microwave radiometry,"in Proc. SPIE Seminar on Remote Sensing of Earth Resourcesand the Environ. (Palo Alto, CA), pp. 135-145, 1971.
[16] J. R. Wang, "The dielectric properties of soil-water mixtures atmicrowave frequencies," Radio Sci., vol. 15, pp. 977-985, 1980.
[17] D. Wobschall, "A theory of the complex dielectric permittivity ofsoil containing water, the semidisperse model," IEEE Trans. Geo-sci. Electron., vol. GE-15, no. 1, pp. 49-58, 1977.
[18] P. W. Birkeland, Pedology, Weathering and GeomorphologicalResearch. New York: Oxford University Press, 1974.
[19] M. Hallikainen and F. T. Ulaby, "A free-space system for dielectricmeasurements in the 3-18 GHz frequency range," Univ. of KansasCenter for Research, Inc., Lawrence, KS, RSL Tech. Rep. 545-3,1983.
[20 ,"Interpretation of dielectric free-space transmission measure-ments," Univ. of Kansas Center for Research, Inc., Lawrence, KS,RSL Tech. Rep. 545-4, 1983.
[21 1 D. M. Anderson and A. R. Tice, "Low-temperature phases ofinter-facial water in clay-water systems," Soil Sci. Soc. Amer. Proc.,vol. 35, p. 47, 1971.
[22] E. G. Njoku and J. A. Kong, "Theory for passive microwave re-mote sensing of near-surface soil moisture," J. Geophys. Res., vol.82, no. 20, pp. 3109-3118, 1977.
[231 J. R. Wang, personal communication, NASA/Goddard Space FlightCenter, Greenbelt, MD, Mar. 1982.
33

IEEE TRANSACTIONS ON GEOSCIENCE AND REMOTE SENSING, VOL. GE-23, NO. 1, JANUARY 1985
[24] M. Hallikainen, F. T. Ulaby, M. El-Rayes, and C. Dobson, "Micro-wave dielectric behavior of soil, Part III: The effects of frequency,soil texture, and temperature," Remote Sensing Laboratory, Univ.of Kansas Center for Research, Inc., Lawrence, KS, RSL Tech.Rep. 545-5, 1984.
*
Martti T. Hallikainen (M'83) was born on January 29,1946 in Savonlinna,Finland. He received the Engineering Diploma and the Doctor of Tech-nology degree from the Helsinki University of Technology in 1971 and1980, respectively.He was a Post-Doctoral Fellow at the University of Kansas Remote
Sensing Laboratory in Lawrence, KS, from 1981 to 1983, where hisresearch involved microwave remote sensing and the application of micro-wave techniques. He is currently Manager of the Remote Sensing Groupat the Helsinki University of Technology Radio Laboratory, where hisinterests include measuring and modeling the microwave dielectricproperties of ice and snow.
*
S _a Fawwaz T. Ulaby (M'68-SM'74-F'80) was bornW" i__jN in Damascus, Syria, on February 4, 1943. He
received the B.S. degree in physics from theAmerican University of Beirut, Lebanon, in
1964 and the M.S.E.E. and Ph.D. degrees inelectrical engineering from the University ofTexas, Austin, in 1966 and 1968, respectively.From 1968 to 1984, he was with the Electri-
cal Engineering Department at the University ofKansas, where he was the J. L. Constant Distin-guished Professor, and the University of Kansas
Center for Research, where he was Director of the Remote SensingLaboratory. He is currently with the Radiation Laboratory and theDepartment of Electrical and Computer Engineering, University ofMichigan, Ann Arbor. His current research interests involve microwavepropagation and active and passive microwave remote sensing. Alongwith R. K. Moore and A. K. Fung, he is a coauthor of the three-volumeseries Microwave Remote Sensing: Active and Passive, Reading, MA:Addison-Wesley. In addition, he is coeditor of the Manual of RemoteSensing, 2nd ed., vol. I, American Society of Photogrammetry.
Dr. Ulaby is a member of Eta Kappa Nu, Tau Beta Pi, and Sigma Xi.He has been named the Executive Editor for IEEE TRANSACTIONS ON GEO-SCIENCE AND REMOTE SENSING, 1984-1985, and was the Geoscience andRemote Sensing Society's Distinguished Lecturer for 1984. He was namedan IEEE Fellow in 1980 "for contributions to the application of radar toremote sensing for agriculture and hydrology," received the GRS Soci-ety's Outstanding Service Award in 1982, and its Distinguished ServiceAward in 1983. In 1984, he also received a Presidential Citation for Meri-torious service from the American Service of Photogrammetry. He re-ceived the University of Kansas Chancellor's Award for Excellence inTeaching in 1980, the University of Kansas Gould Award for "distin-
guished service to higher education" in 1973, and the Eta Kappa Nu Mac-Donald Award as an "outstanding electrical engineering professor in theUnited States of America" in 1975.
*
Myron C. Dobson (M'83) was born in Rochester,NY, on October 25, 1951. He received the B.A.degree in both geology and anthropology fromthe University of Pennsylvania in 1973 and theMA. degree in geography from the Universityof Kansas in 1981.In 1975. he joined the Remote Sensing Lab-
oratory at the University of Kansas Center forResearch, where he is currently the ProjectManager of the soil-moisture-sensing program.His research interests are in the areas of micro-
wave remote sensing, target-sensor interaction physics, image processingand simulation, and renewable-resource management. His ongoing proj-ects include satellite image simulations and the measurement of soil di-electric properties.
*
Mohamed A. El-Rayes was born in Cairo, Egypt,on November 4, 1952. He received the B.S. de-
> _ gree in electrical engineering from Ain ShamsinL _ University, Cairo, Egypt, in 1975 and the M.S.- "m _ degree in microwave engineering in 1979 from
Kent University, Canterbury, England. Since_ _ 1~~981, he has been working toward the Ph.D . de-
gree at the University of Kansas Remote Sens-ing Laboratory in Lawrence, KS. His researchinvolves the measurement and modeling of veg-etation materials at microwave frequencies.
*
Lin-Kun Wu (S'81) was born in Hsin-Chu,Taiwan, Republic of China, on November 1,1958. He received the Diploma in electricalengineering from the Taiwan Provincial TaipeiInstitute of Technology, Taipei, Taiwan, Re-public of China, in 1978 and the M.S. degreein electrical engineering from the Universityof Kansas, Lawrence, in 1982. He is currently
jag; ;i veworr~kting toward the Ph.D. degree at the Uni-versity of Kansas.He has been with the Remote Sensing Lab-
oratory at the University of Kansas since 1981 and has participated inresearch concerning soil dielectric measurements. He is currently aGraduate Research Assistant and is working on the determination ofthe sources of radar scattering from vegetation canopies.
34