an overview of microwave processing and dielectric properties of agri-food materials
TRANSCRIPT

Biosystems Engineering (2004) 88 (1), 1–18doi:10.1016/j.biosystemseng.2004.01.007
Available online at www.sciencedirect.com
PH}Postharvest Technology
REVIEW PAPER
An Overview of Microwave Processing and Dielectric Properties ofAgri-food Materials
M.S. Venkatesh1; G.S.V. Raghavan2
1Department of Agricultural and Bioresource Engineering, University of Saskatchewan, 57 Campus Drive, Saskatoon, SK, Canada S7N 5A9;e-mail of corresponding author: [email protected]
2Department of Bioresources Engineering, Macdonald Campus of McGill University, Ste-Anne-de-Bellevue, Qu!eebec, Canada H9X 3V9;e-mail: [email protected]
(Received 2 August 2002; accepted in revised form 30 January 2004; published online 1 April 2004)
Microwave measurements and the dielectric properties of materials are finding increasing application, as newelectro-technology is adapted for use in agriculture and food processing industries. The interest in dielectricproperties of materials has historically been associated with the design of electrical equipment, where variousdielectrics are used for insulating conductors and other components of electric equipment. Although directheating by microwaves can offer advantages over conventional heat transfer, the different mechanism ofenergy transfer in microwave heating has led to new processing challenges. This paper is the outcome of anextensive and comprehensive literature review in the area and mainly summarises several microwaveprocessing aspects and its usefulness in understanding the microwave–material interaction and the role ofdielectric properties.# 2004 Silsoe Research Institute. All rights reserved
Published by Elsevier Ltd
1. Microwave processing: fundamentals and application
In North America, only four microwave and threeradio frequencies are permitted by the Federal Com-munications Commission (FCC) for dielectric heatingapplications (Decareau, 1985). The allotted microwavefrequencies are 915, 2450, 5800MHz and the radiofrequencies are 13�56, 27�12, and 40�68MHz. Althoughboth North and South America permit 915MHz, mostof the commercial microwave processing equipment isdesigned for operation at 2450MHz, which reflectscommercial emphasis on home microwave ovens. InEurope, other frequencies have been allocated forcommercial use in the radio-frequency region of thespectrum. During the past century, materials researchhas provided many new dielectric materials for applica-tion in electronics. As the use of higher and higherfrequencies came into practice, new materials, suitablefor use in the radio-frequency, microwave, and milli-metre wave regions of the electromagnetic spectrum,have been developed. The dielectric properties of thesematerials are important in the design of electrical andelectronics equipment, and suitable techniques for
measuring the dielectric properties of various materialsapplications have been developed, as they were needed.
The interest in the dielectric properties of agriculturalmaterials and products has been principally for predict-ing heating rates describing the behaviour of materialswhen subjected to high-frequency or microwave electricfields in dielectric heating applications and as indicatorsin their use for rapid methods of moisture content in thedevelopment of rapid techniques for moisture determi-nation. The influence of the dielectric properties on theheating of materials by absorption of energy throughradio-frequency dielectric heating, whether at highfrequencies or microwave frequencies, has been wellknown for a long time, and many potential applicationshave been investigated (Brown et al., 1947; Metaxas &Meredith, 1983). With the advent of commercialmicrowave heating and the wide acceptance of micro-wave ovens for the home, the concepts of dielectricheating have become more popular.
The use of dielectric properties for measuring themoisture content of products such as cereal grains hasbeen recognised for at least 75 years and has been incommon use for more than 48 years (Nelson, 1973,
ARTICLE IN PRESS
1537-5110/$30.00 1 # 2004 Silsoe Research Institute. All rights reserved
Published by Elsevier Ltd

1991). However, the first dielectric properties for grainwere not reported until 45 years ago (Nelson et al.,1965). Since then, much data and information on thedielectric properties of grain and other agriculturalproducts have become available (Nelson, 1965, 1973;ASAE Standards, 1988; Tinga & Nelson, 1973; Kent,1987; Datta et al., 1995), and the influence of importantvariables on these dielectric properties has been eval-uated (Nelson, 1991; Mudgett, 1985).
In the past 20 years, the microwave oven has becomean essential appliance in most kitchens. Faster cookingtimes and energy savings over conventional cookingmethods are the primary benefits. Although the use ofmicrowaves for cooking food is widespread, theapplication of this technology to the processing ofmaterials is a relatively new development. The use ofmicrowave energy for processing materials has thepotential to offer similar advantages in reduced proces-sing times and energy savings (Thostenson & Chou,1999).
In conventional thermal processing, energy is trans-ferred to the material through convection, conduction,and radiation of heat from the surfaces of the material.In contrast, microwave energy is delivered directly tomaterials through molecular interaction with the elec-tromagnetic field. In conventional methods, energy istransferred due to thermal gradients, but microwaveheating is the conversion transfer of electromagneticenergy to thermal energy through direct interaction ofthe incident radiation with the molecules of the targetmaterial. The difference in the way energy is deliveredcan result in many potential advantages to usingmicrowaves for processing of materials. As microwavescan penetrate materials and deposit energy, heat can begenerated throughout the volume of the material. Thetransfer of energy does not rely on diffusion of heat fromthe surfaces, and it is possible to achieve rapid anduniform heating of relatively thicker materials. Intraditional heating, the cycle time is often dominatedby slow heating rates that are chosen to minimise steepthermal gradients that result in process-induced stress.For polymers and ceramics, which are materials withlow thermal conductivity, this can result in significantlyreduced processing times. Thus, there is a balancebetween processing time and product quality in conven-tional processing (this is also true of microwaveheating). As microwaves can transfer energy throughoutthe volume of the material, the potential exists to reduceprocessing time and enhance overall quality (Thosten-son & Chou, 1999).
In addition to volumetric heating, energy transfer at amolecular level can have some additional advantages.Microwaves can be utilised for selective handling ofmaterials. The molecular structure affects the ability of
the microwaves to interact with materials and transferenergy. When materials in contact have different di-electric properties, microwaves will selectively couplewith the higher lossy material. This phenomenon ofselective heating can be used for a number of purposes.In conventional joining of ceramics or polymers,considerable time and energy is wasted in heating upthe interface by conduction through the substrates. Withmicrowaves, the joint interface can be heated in situ byincorporating a higher lossy material at the interface. Inmultiple phase materials, some phases may couple morereadily with microwaves. Thus, it may be possible toprocess materials with new or unique microstructures byselectively heating distinct phases. Microwaves may alsobe able to initiate chemical reactions not possible inconventional processing through selective heating ofreactants. Thus, new materials may be created.
2. Microwave–material interaction aspects
When microwaves are directed towards a material,part of the energy is reflected, part is transmittedthrough the surface, and of this latter quantity, part ofit is absorbed. The proportions of energy, which fall intothese three categories, have been defined in terms of thedielectric properties. The fundamental electrical prop-erty through which the interactions are described is thecomplex relative permittivity of the material e*. It ismathematically expressed as:
e� ¼ e0 � je00 ð1Þ
where e0 is the dielectric constant and e00 the dielectricloss factor. The absolute permittivity of a vacuum is eo
and it is determined by the speed of light Co and themagnetic constant mo, which are linked together by:
Comoeo ¼ 1 ð2Þ
The numerical value for eo is about 8�854 pFm�1 andfor mo is 1�26 mHm�1. In other media (solid, liquid andgaseous), the permittivity has higher values and it isusually expressed relative to the value in vacuum(Nyfors & Vainikainen, 1989). The relative permittivityer of a material is equal to eabs=eo, where eabs is theabsolute permittivity of material. Materials which donot contain magnetic components respond only to theelectric field.
The dielectric properties of materials dictate, to alarge extent, the behaviour of the materials whensubjected to radio-frequency (RF) or microwave fieldfor the purposes of heating, drying or processing thematerials. The characterisation of dielectric properties isvital for understanding the response of a material tomicrowaves, since most useful quantities needed in the
ARTICLE IN PRESSM.S. VENKATESH; G.S.V. RAGHAVAN2

design of microwave thermal processes can be describedin terms of them. The equations relating dielectricproperties to thermal processing parameters are pre-sented in the following section.
3. Quantities expressed in terms of dielectric properties
The proportion of reflected energy Pr is a function ofthe dielectric constant e0 and the angle of incidence. Foran angle of incidence of 908, it is simply:
Prð90Þ ¼
ffiffiffie0
p� 1
� �2
ffiffiffie0
pþ 1
� �2ð3Þ
For example, the value for e0 of water is 78 at roomtemperature. The reflectivity is therefore greater than0�64. However, the reflected energy will also reflect fromthe walls of the chamber and impinge on the water overand over again, resulting in a specific reflectivity ofabout 0�20. Thus, the target material absorbs about 80%of the incident energy and the rest is absorbed anddissipated by the walls of the microwave chamber. Thevalue for e0 of moist foods is usually in the range of50–70.
The power transmitted to the material is simplyPtrans ¼ ð1� PrÞ. The power absorbed and then gener-ated as heat is directly related to e00 (lossiness) of thematerial, and can be calculated using the relation:
Pabs ¼ 5�56 10�4f e00E2 ð4Þ
where: Pabs is the absorbed power in Wcm�3; E is theroot mean square value of the electric field intensity inV cm�1 inside given volume; f is the frequency in Hz;and e00 is the dielectric loss factor of the food or otherproduct.
The penetration depth dp is usually defined as thedepth into a sample where the microwave power hasdropped to 1=e or 36�8% of its transmitted value.Sometimes, dp is defined as the distance at which themicrowave power has been attenuated to 50% of Ptrans.The penetration depth is a function of e0 and e00:
dp ¼lo
ffiffiffie0
p2pe00
ð5Þ
where lo is the free space microwave wavelength (for2�45GHz, lo¼ 12�2 cm). The most common foodproducts have e00525, which implies a dp of 0�6–1�0 cm. Although dielectric properties of some foodscan be found in the literature, data are mostly limited topure foods and food components. As the wave travelsthrough a material that has significant dielectric loss, itsenergy will be attenuated. If the attenuation is high inthe material, the dielectric heating will taper off quickly
as the wave penetrates the material. Attenuation is oftenexpressed in decibels per unit length in metres (dBm�1).In terms of power densities and electric field intensityvalues, this can be expressed as:
10 log10Po
PðzÞ
� �¼ 20 log10
Eo
EðzÞ
� �¼ 8�686aðzÞ ð6Þ
where: Po is the power level at a point of reference; PðzÞis the power level at distance z from the reference point;and a is the attenuation in nepers per metre (Npm�1).
The power dissipated inside a material is proportionalto e00. The ratio, e00=e0, called the loss tangent ordissipation factor, a descriptive dielectric parameter, isalso used as an index of the material’s ability to generateheat (Mudgett, 1986).
The rate of heating can be expressed by the powerequation:
Pv ¼ 2pf eoe00 Ej j2 ð7Þ
where: Pv is the energy developed per unit volume inWm�3, f is the frequency in Hz; and jEj is the electricfield strength inside the load in Vm�1.
The electric field inside the load is determined by thedielectric properties and the geometry of the load, andby the oven configuration. Therefore, this equation isgenerally impractical since the determination of theelectric field distribution is very complex (Buffler, 1993).The heating effect in agri-food materials is the result oftwo mechanisms, dipolar rotation and ionic conduction.The dipole most responsible for heating is water, whichis a major constituent of most agri-food materials. Theresponse of dipoles to an oscillating field is an increase inrotational and vibrational energies, depending on thedegree of symmetry of the molecule, with a resultingfrictional generation of heat. Molecules that are non-polar but that are asymmetrically charged may behaveas dipoles in an electrical field; however, their responsesto microwave energy are usually about an order ofmagnitude less than that of water.
The other heating mechanism is ionic conduction. Theelectrical field causes dissolved ions of positive andnegative charge to migrate towards oppositely chargedregions. This results in multiple billiard-ball-like colli-sions and disruption of hydrogen bonds with water,both of which result in the generation of heat. Ionicconduction has a larger influence on e00 than on e0, andtherefore decreases the penetration depth. This beha-viour was predicted by the Hasted–Debye relations foraqueous electrolytic solutions (Hasted et al., 1948).There is a depression of e0 due to depletion of free waterby dissolved ions and an increase in e00 due to an increasein the free charge density (Kudra et al., 1992). Magneticfield interactions are negligible, since foods contain only
ARTICLE IN PRESSMICROWAVE PROCESSING AND DIELECTRIC PROPERTIES OF MATERIALS 3
trace amounts of magnetic minerals such as nickel,cobalt, and iron.
The temperature profile and heating rate developedduring exposure to electromagnetic radiation dependson the distribution and nature of susceptors, therelationships between the dielectric properties withmoisture and temperature and frequency, as well as onthe thermo-physical properties (thermal conductivity,thermal diffusivity, specific heat, etc.) of the otherconstituents. A detailed description of the temperatureprofile of a complex agri-food material is thereforeextremely difficult to obtain.
It is important to recognise that the dielectricproperties are not unique for a given material. Theyare specific only for a given frequency and state of thematerial. Thus, in a processing situation, they aretransient since the state of the material is not constantin time. Therefore, it is necessary to establish therelationships between e0 and e00 with state variables atthe processing frequency(ies). The principal state vari-ables that influence the dielectric properties at a givenfrequency are temperature and moisture content. Therelationships between these factors, composition and thedielectric properties of agri-food materials are reviewedin the following sections.
4. Factors influencing dielectric properties at a givenfrequency
4.1. Temperature and moisture content dependencies
The dielectric properties of most materials vary withseveral different factors. In hygroscopic materials suchas agri-foods, the amount of water in the material isgenerally a dominant factor. The dielectric propertiesdepend on the frequency of the applied alternating
electric field, the temperature of the material, and on thedensity, composition, and structure of the material. Ingranular or particulate materials, the bulk density of theair–particle mixture is another factor that influences thedielectric properties. Of course, the dielectric propertiesof materials are dependent on their chemical composi-tion and especially on the permanent dipole momentsassociated with water and any other molecules makingup the material of interest. With the exception of someextremely low-loss materials, i.e., materials that absorbessentially no energy from RF and microwave fields, thedielectric properties of most materials vary considerablywith the frequency of the applied electric fields. Animportant phenomenon contributing to the frequencydependence of the dielectric properties is the polarisa-tion arising from the orientation with the imposedelectric field, of molecules, which have permanent dipolemoments.
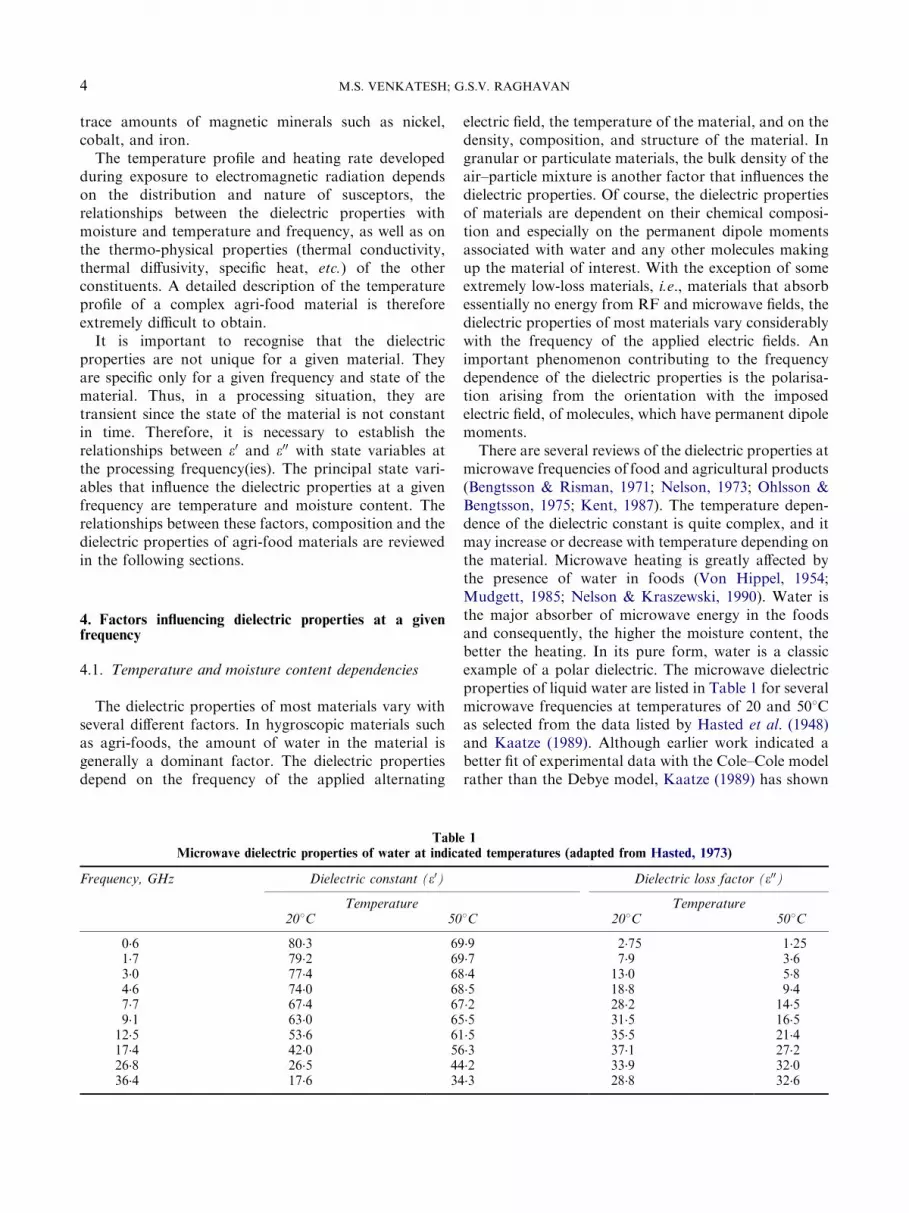
There are several reviews of the dielectric properties atmicrowave frequencies of food and agricultural products(Bengtsson & Risman, 1971; Nelson, 1973; Ohlsson &Bengtsson, 1975; Kent, 1987). The temperature depen-dence of the dielectric constant is quite complex, and itmay increase or decrease with temperature depending onthe material. Microwave heating is greatly affected bythe presence of water in foods (Von Hippel, 1954;Mudgett, 1985; Nelson & Kraszewski, 1990). Water isthe major absorber of microwave energy in the foodsand consequently, the higher the moisture content, thebetter the heating. In its pure form, water is a classicexample of a polar dielectric. The microwave dielectricproperties of liquid water are listed in Table 1 for severalmicrowave frequencies at temperatures of 20 and 508Cas selected from the data listed by Hasted et al. (1948)and Kaatze (1989). Although earlier work indicated abetter fit of experimental data with the Cole–Cole modelrather than the Debye model, Kaatze (1989) has shown
ARTICLE IN PRESS
Table 1
Microwave dielectric properties of water at indicated temperatures (adapted from Hasted, 1973)
Frequency, GHz Dielectric constant (e0) Dielectric loss factor (e00)
Temperature Temperature208C 508C 208C 508C
0�6 80�3 69�9 2�75 1�251�7 79�2 69�7 7�9 3�63�0 77�4 68�4 13�0 5�84�6 74�0 68�5 18�8 9�47�7 67�4 67�2 28�2 14�59�1 63�0 65�5 31�5 16�512�5 53�6 61�5 35�5 21�417�4 42�0 56�3 37�1 27�226�8 26�5 44�2 33�9 32�036�4 17�6 34�3 28�8 32�6
M.S. VENKATESH; G.S.V. RAGHAVAN4

that the dielectric spectra for pure water can besufficiently well represented by the Debye model whenusing the relaxation parameters given in Table 2. Therelaxation frequency, ð2pTÞ�1, is also provided in Table2 along with the static and high frequency values of thedielectric constant, es and e1, for water at temperaturesfrom 0 to 608C. These values can be used to provideclose estimates for the dielectric properties of water overa wide range of frequencies and temperatures. Also,water is a strong, broad-band absorber of microwavesand is therefore used for selective heating during foodprocessing. The amount of free moisture in a substancegreatly affects its dielectric constant since that of freewater is high (�78 at room temperature and 2�45GHz).That of container materials, such as Teflon, is of theorder of 2. The moisture relationship is consistent inthat higher moisture leads to higher values of both thedielectric constant and the loss factor. This relationshipis temperature dependent. However, water in its pureliquid state appears in food products very rarely. Mostoften, it has dissolved constituents, is physicallyabsorbed in material capillaries or cavities, or ischemically bound to other molecules of water. Dielectricrelaxations of absorbed water take place at frequencieslower than the relaxation of free water (Hasted et al.,1948), which occurs at about 19�5GHz for water at258C. Depending on the material structure, there may bevarious forms of bound water, differing in terms ofenergy of binding and dielectric properties. Moistmaterial, in practice, is usually an inhomogeneousmixture, often containing more than one substance withunknown dielectric properties. Thus, it becomes verydifficult to understand and predict the dielectricbehaviour of such materials at different frequencies,temperatures, or hydration levels. At present, very littleis known about the dielectric properties of moistmaterials of different structures containing water atvarious levels of binding. However, a complete under-standing is not always necessary for the solution ofpractical problems.
The dielectric properties of materials are quitedependent on temperature, and the nature of thatdependence is a function of the dielectric relaxationprocesses operating under the particular conditionsexisting and the frequency being used. As temperatureincreases, the relaxation time decreases, and the loss-factor peak will shift to higher frequencies. Thus, in aregion of dispersion, the dielectric constant will increasewith increasing temperature, whereas the loss factor mayeither increase or decrease, depending on whether theoperating frequency is higher or lower than therelaxation frequency. Below and above the region ofdispersion, the dielectric constant decreases with in-creasing temperature. Distribution functions can beuseful in expressing the temperature dependence ofdielectric properties but the frequency- and temperature-dependent behaviour of the dielectric properties of mostmaterials is complicated and can perhaps best bedetermined by measurement at the frequencies andunder the conditions of interest.
Dielectric constants and loss factors of fresh fruitsand vegetables have been explored by several researchers(Tran et al., 1984; Nelson et al., 1994). Examplesof the frequency dependence observed for 24 differentfruits and vegetables are illustrated. The dielectricconstant exhibits the expected monotonic decrease invalue with frequency in the 0�2–20GHz range. Inall the fruits and vegetables measured, the lossfactor decreases as frequency increases from 0�2GHz,reaches a broad minimum in the region between 1 and3GHz, and then increases as frequency approaches20GHz. This behaviour is dominated by ionicconductivity at lower frequencies, by bound waterrelaxation, and by free water relaxation near thetop of the frequency range. The dielectric propertiesof these fresh fruits and vegetables at 915MHzand 2�45GHz are shown in Table 3 along with otherdescriptive information. Table 4 shows thepermittivity values of milk and its constituents (Kudraet al., 1992).
ARTICLE IN PRESS
Table 2Debye dielectric relaxation parameters for water (adapted from Hasted, 1973)
Temperature 8C Dielectric constant Relaxation time, 10�12 s Relaxation frequency, GHz
Static es High frequency e1
0�0 87�9 5�7 17�67 9�00710�0 83�9 5�5 12�68 12�55220�0 80�2 5�6 9�36 17�00430�0 76�6 5�2 7�28 21�86240�0 73�2 3�9 5�82 27�34650�0 69�9 4�0 4�75 33�50660�0 66�7 4�2 4�01 39�690
MICROWAVE PROCESSING AND DIELECTRIC PROPERTIES OF MATERIALS 5

The dielectric properties of powdered potato starch(Sx 920, Matheson, Coleman & Bell), locust bean gum(Germantown Manufacturing Co.) and carrageenan(product specification no. 160, type Seakem CM 514,lot no. 340807, marine colloids division, FMC corp.)were found to increase regularly with moisture content
in the range of 0–20% wet basis, at 2�45GHz (Nelson,1991). The dielectric properties of these hydro-colloidswere also found to increase with temperature over therange 20–1008C, and the temperature difference in-creased markedly as the moisture content increased(Nelson, 1991).
ARTICLE IN PRESS
Table 3Permittivities of fresh fruits and vegetables at 238C (adapted from Nelson et al., 1994)
Fruit/vegetable MC, %(w.b.) Tissue density, g cm�3 Dielectric constant (e0) Dielectric loss factor (e00)Frequency Frequency
915 MHz 2�45 MHz 915 MHz 2�45 MHz
Apple 88 0�76 57 54 8 10Avocado 71 0�99 47 45 16 12Banana 78 0�94 64 60 19 18Cantaloupe 92 0�93 68 66 14 13Carrot 87 0�99 59 56 18 15Cucumber 97 0�85 71 69 11 12Grape 82 1�10 69 65 15 17Grapefruit 91 0�83 75 73 14 15Honeydew 89 0�95 72 69 18 17Kiwifruit 87 0�99 70 66 18 17Lemon 91 0�88 73 71 15 14Lime 90 0�97 72 70 18 15Mango 86 0�96 64 61 13 14Onion 92 0�97 61 64 12 14Orange 87 0�92 73 69 14 16Papaya 88 0�96 69 67 10 14Peach 90 0�92 70 67 12 14Pear 84 0�94 67 64 11 13Potato 79 1�03 62 57 22 17Radish 96 0�76 68 67 20 15Squash 95 0�70 63 62 15 13Strawberry 92 0�76 73 71 14 14Sweet potato 80 0�95 55 52 16 14Turnip 92 0�89 63 61 13 12
MC, moisture content; w.b. wet basis.
Table 4
Dielectric properties of milk and its constituents at 2.45GHz and 208C (adapted from Kudra et al., 1992)
Description Fat, % Protein, % Lactose, % Moisture, % Dielectric constant Dielectric loss factor
1% Milk 0�94 3�31 4�93 90�11 70�6 17�63�25% Milk 3�17 3�25 4�79 88�13 68�0 17�6Water + lactose I 0 0 4�0 96�0 78�2 13�8Water + lactose II 0 0 7�0 93�00 77�3 14�4Water + lactose III 0 0 10�0 90�0 76�3 14�9Water + sodium 0 3�33 0 96�67 74�6 15�5caseinate IWater + sodium 0 6�48 0 93�62 73�0 15�7caseinate IIWater + sodium 0 8�71 0 91�29 71�4 15�9caseinate IIILactose (solid) 0 0 100 0 1�9 0�0Sodium caseinate (solid) 0 100 0 0 1�6 0�0Milk fat (solid) 100 0 0 0 2�6 0�2Water (distilled) 0 0 0 100 78�0 13�4
M.S. VENKATESH; G.S.V. RAGHAVAN6
It is important to note that food electrical andphysical properties, which affect microwave heating,change dramatically at temperatures below freezingpoint. Ohlsson et al. (1974) found that e0 and e00
increased significantly with falling frequency for mostfoods tested, and in most cases, dielectric propertiesincreased sharply with temperature during the transitionfrom �10 to 08C (thawing). In preliminary studies of thedielectric properties of Tylose at different salt concen-trations, Venkatesh (1996) observed a sharp increase inthe loss factor from �20 to �158C, with trendsthereafter dependent on salt concentration.
4.2. Influence of composition
The dielectric properties of food products are alsodetermined by their chemical composition. The influenceof water and salt (or ash) content depends to a largeextent on the manner in which they are bound orrestricted in their movement by the other foodcomponents. This complicates the prediction, based ondata for single ingredients, of the dielectric properties ofa mixture. The organic constituents of food aredielectrically inert (e053 and e0050�1) and, comparedto aqueous ionic fluids or water, may be consideredtransparent to energy (Mudgett, 1985). Only at very lowmoisture levels, when the remaining traces of water arebound and unaffected by the rapidly changing MW field,do the components of low specific heat become themajor factors in heating.
Ohlsson et al. (1974) found that, for many foods, theinfluence of different water and salt content on dielectricproperties was significantly large, especially at 450 and900MHz. It was also found that at temperatures above608C, e0 decreased gently with temperature, whereas e00
increased, particularly at lower frequencies for saltyfoods (Bengtsson & Risman, 1971). The dielectricproperties of some foods as a function of temperature,at 2�8GHz, are documented by Bengtsson and Risman(1971). A food map of some foods at 2�45GHz and 20–258C has been illustrated by Buffler and Stanford (1991).
In the case of high carbohydrate foods and syrups, thedissolved sugars (in water) are the main MW susceptors(Mudgett, 1986). Dielectric properties of aqueous sugarsolutions of different concentrations have been mea-sured and compared with those of grapes of similarmoisture concentrations (Tulasidas et al., 1995a). In thecase of high moisture in grapes, the dielectric constantand loss factor decreased with an increase of tempera-ture and a reversed trend was observed in the lowermoisture range (Tulasidas et al., 1995b).
While alcohols and dissolved carbohydrates are activeingredients in some foods and beverages, their effects are
negligible in most food products, except for highcarbohydrate foods, such as bakery products or syrups,and alcoholic beverages. The effects are related tostabilisation of hydrogen bonding patterns throughhydroxyl–water interaction (Kudra et al., 1992). Theeffects of pH are not believed to be significant per se, atthe pH levels typical in foods (Ohlsson et al., 1974;Mudgett, 1986; Nyfors & Vainikainen, 1989).
The effect of fat on dielectric properties appears to bethat of dilution (more fat, less water). The heating rateseems to have no effect per se on the dielectricproperties, unless water and juices are lost. At lowerfrequencies (450 and 900MHz), the relationships appearto be similar (Bengtsson & Risman, 1971; Ohlsson et al.,1974).
The microwave heating characteristics of extractionmixtures consisting of rosemary or peppermint leavessuspended in hexane, ethanol and hexane plus ethanolmixtures were reported and it was found that thetemperature rises were found to be dependent on thedielectric properties of the solvents and the leaves inquestion (Chen & Spiro, 1994).
There have been several attempts to develop relation-ships between the dielectric properties and composition,based on weighted averages of the dielectric propertiesof individual components (e.g. Sun et al., 1995; Kudraet al., 1992). However, these studies imply that theapproach is incomplete due to possible synergisticand loss effects. Essentially, cross-binding of compo-nents in the parent material seems to play a role thatcannot be easily accounted for when measurements aredone on the components individually. The dielectricproperties and loss factor of four different processedcheeses of four different compositions are shown inTable 5 for temperatures of 20 and 708C (Datta andNelson, 2000). At higher moisture and lower fatcontents, the loss factor increased somewhat withtemperature.
4.3. Physical structure of target material
Dielectric properties vary with a number of physicalattributes including bulk density, particle size, andhomogeneity. Nelson (1992) developed relations forthe dielectric properties of whole and powdered grains atdifferent bulk densities, moisture content and frequency.Bulk density has been identified as a major source ofvariation for e0 and e00 (Kent, 1977; Nelson, 1983, 1984;Kent & Kress-Rogers, 1986; Nelson & You, 1989). Thedensity dependence of the dielectric properties ofmaterials must be accounted for in elaborating functionsdetermining grain moisture content (Meyer & Schilz,1980). This relation could also be used in the control ofcontinuous on-line processing of the grain.
ARTICLE IN PRESSMICROWAVE PROCESSING AND DIELECTRIC PROPERTIES OF MATERIALS 7

4.4. Density dependence
Since the influence of a dielectric material dependson the amount of mass interacting with the electro-magnetic fields, the mass per unit volume, or density,will have an effect on the dielectric properties(Nelson, 1992). This is especially notable with particu-late dielectrics such as pulverised or granular materials.In understanding the nature of the density dependenceof the dielectric properties of particulate materials,relationships between the dielectric properties of solidmaterials and those of air–particle mixtures, such asgranular or pulverised samples of such solids, areuseful. In some instances, the dielectric properties of asolid may be needed when particulate samples are theonly available form of the material. This was true forcereal grains, where kernels were too small for thedielectric sample holders used for measurements(Nelson & You, 1989) and in the case of pure mineralsthat had to be pulverised for purification. For somematerials, fabrication of samples to exact dimensionsrequired for dielectric properties measurement is diffi-cult, and measurements on pulverised materials aremore easily performed. In such instances, provenrelationships for converting dielectric properties ofparticulate samples to those for the solid material areimportant. Several well-known dielectric mixture equa-tions have been considered for this purpose (Nelson &You, 1989).
The notation used below applies to two-componentmixtures, where e represents the effective permittivityof the mixture, e1 is the permittivity of the mediumin which particles of permittivity e2 are dispersed,and o1 and o2 are the volume fractions of therespective components, where o1 þ o2 ¼ 1. Two of themixture equations found to be particularly useful forcereal grains were the complex refractive index mixtureequation (Nelson, 1992):
ðeÞ1=2 ¼ o1ðe1Þ1=2 þ o2ðe2Þ
1=2 ð8Þ
and the Landau and Lifshitz, Looyenga equation(Nelson, 1992):
ðeÞ1=3 ¼ o1ðe1Þ1=3 þ o2ðe2Þ
1=3 ð9Þ
To use these standard equations to determine e2, oneneeds to know the dielectric properties (permittivity) ofthe pulverised sample at its bulk density (air–particlemixture density), and the specific gravity or density ofthe solid material. Nelson (1992) has reported that thecomplex refractive index and the Landau and Lifshitz,Looyenga relationships provided a relatively reliablemethod for adjusting the dielectric properties ofgranular and powdered materials with characteristicslike grain products from known values at one bulkdensity to corresponding values for a different bulkdensity.
The differences due to bulk density follow expecta-tions due to differences in the air-occupied volume.Nelson (1991) reported that the dielectric properties ofthe solid material of various hydro-colloids were greaterthan of the powdered materials. Although manyresearchers are of the opinion that there is no theoreticalbasis for a pure particle size effect, studies on instantcoffee and milk powder implied that such an effect ispossible (Kent & Kress-Rogers, 1986). Measurementson various sieve fractions of powdered or crushed grainsobtained by Venkatesh et al. (1998) also indicated thepossibility of a particle size effect. Essentially, when amaterial is crushed or powdered, one may expectchanges in the surface characteristics, and it is thereforepossible that the proportion of energy transmittedchanges. This would be reflected by a change in thedielectric constant, without necessarily a change in theloss factor. However, Kent and Kress-Rogers (1986) donot agree with this explanation. One of the problems inconcluding particle size effects is to ensure that themoisture content and compositions of the variousparticle size fractions are the same and that there areno changes due to heating during grinding. If there is a‘pure’ particle size effect, it appears to be so small
ARTICLE IN PRESS
Table 5Dielectric properties of processed cheese at 2.45GHz as related to composition and temperatures 208C & 708C (Datta, 1999)
Composition Dielectric constant (e0) Dielectric loss factor (e00)
Temperature TemperatureFat, % Moisture, % 208C 708C 208C 708C
0 67 43 29 43 3712 55 30 21 32 2324 43 20 14 22 1736 31 14 8 13 9
M.S. VENKATESH; G.S.V. RAGHAVAN8

compared to the influence of bulk density and otherfactors that only very thorough and precise experimen-tation will prove or disprove its existence.
5. Applications of dielectric properties of measurements
As mentioned in the introduction, the dielectricproperties of materials depend on many factors,including some that are related to chemical composition.Once fundamental data on the relationships between thedielectric properties and other factors have beenestablished, the rapidity with which the dielectricproperties can be measured, and the non-destructivenessof the methods, can lead to better methods of qualityanalysis or monitoring of relevant properties or states,before, during or after processing. There are manyexamples of such applications in the literature of whichonly a few have been listed below.
5.1. Quality of agri-food material
These properties and the quality of a substance can becorrelated, for example, either high frequency or lowerfrequencies can be used to measure the quality of fishand meat (Kent & Kress-Rogers, 1986).
5.1.1. Edible oils/fats
Consumption of oil- and fat-based foods has rapidlyincreased in recent years. To guarantee an effectivequality control for used frying fats, simple and rapidmethods for the measurement of thermal abuse areneeded. Some of the tests that are reported includeheating several frying oils with and without food stuffand estimating the change of polar parts, acid number,colour, specific absorption and dielectric properties withprolonged heating time. However, it is reported thatthese routine analyses may not always be sufficient tocharacterise heated frying oils and fats. In recentreports, food-oil sensors (Hein et al., 1998; US andGerman patented) have been reported to be useful toolsin determining heat abuse for frying fats and oils. So far,there is neither much information nor simple techniquesthat are available to understand the deteriorating natureof the heated edible oils, which are ubiquitous in anyfood processing industry or operation. Consumers andfood catering units continue to use and reuse the fryingoils to meet everyday demands and quench.
The dielectric constant was found to be the mostsignificant indicator for quality control in commercialdeep fat frying operations and it was also concluded thatpolymer content and changes in dielectric constant areuseful for monitoring frying oil quality (Paul & Mittal,1996). It is reported that the measurements of the
dielectric properties of edible oils were compared toconventional methods of analysis (viscosity, refractiveindex, iodine value, peroxide value, and the fatty acids)for evaluating the frying quality of a blend of cottonseed and sunflower oils and also for predictingdeterioration occurring during heating of the oil, as alarge portion of edible oil is consumed in frying of foods(El-Shami et al., 1992). For fats and oils, the values forboth e0 and e00 are very low. For some oils, tallow andlard, e0 is between 2�4 and 2�7 and the physical state isnot important for the values; however, it is moreimportant for the e00 values. These values vary from0�035 (lard at 108C) to 0�172 (maize oil at 608C, impure)at 2�8GHz. The value of e00 increases with temperatureand with transition from the solid to the liquid phase.
Venkatesh and Raghavan (2000) reported the summa-ries of various recent studies related to heated edible oilsand their characteristics in an effort to establish compara-tive standards used in deep frying operations in routinefood services and processing scenarios. Conventionalanalytical and chemical techniques have been identifiedand compared with recent methods including microwave-based sensors and instrumentation. The food oil sensor(FOS) is reported to be the most useful and helpful tool toinvestigate the characteristics of the oil/fats characteristicsand to assess their quality and for monitoring purposes.Since the technology is patented in Germany and theUSA, the details of the design and development of FOS isdifficult to access in reported literature. It is identified thatedible oils and fats are thermally altered during fryingoperations and whether or not there will be a residualeffect on human consumption is yet to be fully justified.One has to understand the interaction mechanisms of oil/fat molecules subjected to MW radiation at a broad rangeof approved frequencies and temperature ranges. Theadvent of MW chemistry techniques will answer manyissues related to quality sensing of used heated edible oils.On the other hand, dielectric properties’ measurement andits simplicity in analysis needs more research as well. Thisresearch study has attempted to integrate the need forchemical analyses and microwave techniques to addressthis challenging task of assessing quality of the mostsensory and culinary element of human food and diet.
5.2. Water quality detection
Raveendranath and Mathew (1995) have adapted themicrowave technique to study and assess water qualityaspects. They suggested that the dielectric behaviour ofartificially polluted water and polluted water collectedfrom various industrial locations, after careful analysis& experimentation, could be related in the use of aneffective technique for detecting the pollutants in water
ARTICLE IN PRESSMICROWAVE PROCESSING AND DIELECTRIC PROPERTIES OF MATERIALS 9

at microwave frequencies (2�685GHz) based on themeasurement of complex permittivity of polluted waterat 278C. This may be useful for the study of oil–watermixtures for both food and soil applications usingmicrowaves.
5.3. Dielectric behaviour of agri-food products
Dielectric properties vary considerably among differ-ent kinds of grain, crop and weed seed. In general, thevalues for e0 and e00 are greater for grain and seedsamples of higher bulk densities and higher equilibriummoisture contents. The main interest in the dielectricproperties of agricultural products is for the determina-tion of moisture content. Mathematical models for the e0
versus density r of cereal grains have been developed(Chugh et al., 1973; Nelson, 1973, 1987). Recent studieson (Trabelsi et al., 1997) measurement of dielectricproperties have indicated that measurement of dielectricproperties has a promising potential in estimatingcertain engineering properties such as mass, density,thickness, fat content, etc.
5.3.1. Baked food products and flours
Microwave and radio-frequency heating have alsobeen used for baking processes. Microwave permittiv-ities of bread dough were measured over the frequencyrange from 600MHz to 2�4GHz by Zuercher et al.(1990) as a function of water–flour composition, proof-ing time, and baking time. The dielectric constant andthe loss factor both decreased as the water content andbaking time was reduced. Permittivity of cracker dough,starch and gluten was measured over the 0�2–20GHzfrequency range by Haynes and Locke (1995) who alsostudied the dielectric relaxation in this frequency range.They identified two relaxation regions, one for doughsbelow 35% moisture associated with bound water, andanother for moisture contents above the level associatedwith free water. The dielectric constant and loss factorof baked dough, as a function of temperature andmoisture, were reported at 27MHz. The dielectricconstant gradually increased with moisture contentand temperature. Temperature also affected the di-electric loss factor beyond this point. The ionicconductivity and the bound water relaxation areconsidered the dominant loss mechanisms in the bakeddough at this frequency. Seras et al. (1987) measured thepermittivity during heating of different flours withvarying water contents. The increase in the value of e0
before reaching 1008C, for dry flour, or with 10% watercontent, shows that the water interacts with thepolysaccharide matrix and thus is unfreezable. Whenwater evaporates, the value of e0 decreases to a stable
level in a dry product. Dielectric properties for breadand flour have been measured mostly at high frequen-cies. Although the value of e00 varies with moisture, ascan be expected, temperature has only a minor effect.
5.3.2. Dairy products
Dielectric properties of dairy products are relativelyscarce. Properties of whey and skim milk powders havebeen measured by Rzepecka and Pereira (1974). Thoseof aqueous solutions of non-fat dried milk weremodelled by Mudgett et al. (1974, 1980). Representativedielectric properties of milk and its constituents at2�45GHz are given by Kudra et al. (1992). For butter,measurements between 30Hz and 5MHz were reportedby Sone et al. (1970). The dielectric constant and lossfactor of butter at 2�45GHz as functions of temperaturewere measured by Rzepecka and Pereira (1974). Theirresults revealed that the permittivity of bound water at2�45GHz had a positive temperature coefficient, whilethe permittivity of free water decreased with tempera-ture. At temperatures below the freezing point, freewater crystallises, and its permittivity decreased rapidlyto very small values, so the behaviour appears to resultfrom the influence of bound water. The rapid increase inthe permittivity of butter above 30oC may be caused bythe disintegration of the emulsion. Over a small range ofmoisture content, Prakash and Armstrong (1970)showed a linear increase in dielectric constant withmoisture content. Seasonal variation in dielectricproperties of butter showed no significant changes(O’Connor & Synnot, 1982).
To et al. (1974) used aqueous non-fat dry milksolutions as model systems and found that the milk saltsdo not dissociate completely. Bound salts (about 33% ofmilk fats) do not exhibit the same dielectric behaviour asfreely dissociated salts in solution. The dielectric proper-ties of milk, based on the total ash content, are lowerthan expected from the chemical composition alone.
5.3.3. Fish, seafood and meat
Dielectric properties of codfish were measured atfrequencies from 10 to 200MHz at temperatures from�25 to 108C (Bengtsson & Risman, 1971). An abruptchange in the dielectric constant was noted in the regionof freezing temperatures, which became slightly moregradual as the frequency decreased. At temperaturesbelow the freezing point, dielectric constants increasedslightly from values below 10 to values between 10 and20 before the abrupt increase, on thawing, to valuesbetween 60 and 90, depending on the frequency. At10GHz, dielectric properties of fish meal were studied byKent (1970, 1972) as functions of the temperature andmoisture content. Both the dielectric constant and lossfactor increased non-linearly with moisture content.
ARTICLE IN PRESSM.S. VENKATESH; G.S.V. RAGHAVAN10

They also increased with temperature in a relativelylinear manner. Kent also examined the complexpermittivity of fish meal in relation to changes intemperature, density, and moisture content (Kent,1977), and concluded that at high moisture contentsand temperatures, the dependence of the permittivity ondensity was similar in nature to its dependence ontemperature and moisture content.
Kent and Anderson (1996) have reported the abilityto distinguish differences in scallops from those soakedin water and also those soaked in polyphosphatesolutions by microwave spectra of the dielectric proper-ties taken between 200MHz and 12GHz with datasubsequently subjected to principal component analysis.
Zheng et al. (1998) recently reported dielectricproperties at 915MHz and 2�45GHz on raw non-marinated and marinated catfish and shrimp at tem-peratures from about 10 to 908C. Measurements showedthat marination increased both the dielectric constantand loss factor. The dielectric constant generallydecreased with increasing temperature whereas the lossfactor increased with temperature. The dielectric proper-ties of tuna fish at 2450 and 915MHz and from �30 to608C are reported elsewhere. The dielectric constant andloss factor varied with the composition of a substanceand the temperature. The values of dielectric propertieswere small at temperatures below the freezing point. Asharp increase in dielectric properties was observedaround the freezing point. The dielectric constant andloss factor increased with increased water content atconstant temperature; the dielectric constant and lossfactor of lean tuna were larger than those of fatty tuna.
Ohlsson et al. (1974) studied meat emulsions at 900and 2800MHz and concluded that correlation withdielectric data for fat and protein content was complex.Bengtsson and Risman (1971) reported dielectric prop-erties data for a large variety of foods, measured at2�8GHz with a resonant cavity as a function oftemperature, including both raw and cooked meats. Ingeneral, both the dielectric constant and loss factorincreased with increasing moisture content. Whentemperature increased through the freezing point, sharpincreases were noted in both the dielectric constant andloss factor. They found no significant differences indielectric properties between ground and whole meat.Although moisture content is dominant, both ash andprotein content can also affect meat dielectric properties.For beef products, the values for both e0 and e00 increasewith falling frequency at constant temperature; however,the value for e0 decreases and the value for e00 increaseswith increasing temperature at constant frequency. Thevalue for e00 of turkey is higher than that of beef, which ismainly due to the moisture content. The values for bothe0 and e00 are small for frozen meat, under 10 and 2,
respectively. Both the permittivity and loss factor forcooked beef are about 60% of those for raw beef (Kent,1987).
When dielectric property data for many differenttypes of foods (meats, fruits, and vegetables) areconsidered together, they showed very little correlationwith composition (Sun et al., 1995). This was attributedto variability in sample composition and measurementerrors, and the general unavailability of detailedcomposition data. To et al. (1974) reported statisticalcorrelations of data at 2�45GHz from a restricted setcontaining about 25 data points for raw beef, beef juice,raw turkey, and turkey juice, with composition datataken from the USDA Handbook (USDA, 1976). Theirstudy revealed significant relationships between both thedielectric constant and loss factor and the water and ashcontents and temperature (Sun et al., 1995). Theaddition of terms for components such as protein,carbohydrates, and fat did not improve the correlationsignificantly. Also, it is reported elsewhere that highwater content foods, such as potato, agar gels, and milk,had similar relaxation times, which they attributed tothe availability of free water in the foods. Thus, since themoisture content of all the meats and meat productsused in the correlation (Datta & Nelson, 2000) wasgreater than 60%, the free water should be the dominantcomponent governing the overall dielectric behaviour ofthese foods.
The ash content was taken to be a good indicator ofthe total salts in these foods. Increased ash contentserved to elevate the dielectric constant in the foods,which agreed with the experimental data reported byBengtsson and Risman (1971), in contrast to thebehaviour of aqueous salt solutions, which exhibit areduction in the dielectric constant with increasing saltconcentration. In the range of temperatures studied (Sunet al., 1995) the ash content elevated the dielectric loss,indicating that increased salt adds conductive chargecarriers that increase the loss of the system as a result ofcharge migration.
The dielectric loss of aqueous solutions at microwavefrequencies may be divided into effects of dipole rotationand ionic charge migration. As discussed by Mudgettet al. (1980), the dipole loss component decreases astemperature increases, while the ionic componentincreases with temperature. Furthermore, if the ashcontent in the food is sufficiently high, the ioniccomponent may dominate the dipole loss, resulting inan increase in the dielectric loss with temperature.Results of Sun et al. (1995) showed that for salt contentsgreater than 2%, the predicted dielectric loss increasedwith temperature, which is in accord with the behaviourof aqueous salt solutions. As discussed by Ohlsson et al.(1974), the high temperature dependence of the ionic
ARTICLE IN PRESSMICROWAVE PROCESSING AND DIELECTRIC PROPERTIES OF MATERIALS 11

conductivity explains the rise in the dielectric loss withtemperature.
5.3.4. Water mixtures of sugars and starches
Kent and Kress-Rogers (1986) measured the dielectricproperties of sucrose, glucose and syrup. Complexpermittivity varied with frequency and concentration.The values measured at 2�8GHz differed greatly fromthose at 3�05GHz. Prakash et al. (1992) have studied thedielectric properties of potato starch, sucrose, glucose,ethanol and glycerol, at 1 and 3GHz and 258C. Atintermediate water concentration, gelatinised potatostarch has higher values for e0 and e00 values than starchin the granular form. Carbohydrates do not showappreciable dipole polarisation at microwave frequen-cies. Exclusion of water by the carbohydrate is, there-fore, important for the dielectric properties of acarbohydrate–water mixture. Mladek and Komarek(1974) studied potato and wheat starches containingup to 40% water. At 10GHz, the value for e0 of potatostarch is higher than that of wheat starch; however, thevalue for e00 of potato starch is lower. The losses are dueto relaxation of hydroxyl groups in a dry starchmolecule. The dielectric properties of chemically mod-ified and some unmodified starches have been studied byMiller et al. (1991). The values of e00 for most starchesgenerally decreased during heating; however, it re-mained constant within the temperature range asso-ciated with the thermal transition of starch. The type ofchemical modification seems to have a strong influenceon the dielectric behaviour.
5.3.5. Salt solutions
Many agricultural and food materials contain wateras the major constituent. Also, salt ions can affect thedielectric properties significantly, especially the dielectricloss factor. Thus, it is useful to study the dielectricproperties of salt solutions (Sun et al., 1995; Hastedet al., 1948) which are relatively simple systems and theymay suggest trends in the dielectric behaviour of somefood materials. The dielectric properties of salinesolutions have been studied in detail and models forcalculating these properties as functions of temperatureand salinity have been developed and tested againstexperimental data from the reported literature. Thedielectric constants of the salt solutions decreased astemperature increased. However, the sign of thetemperature coefficient of the dielectric loss factordepends on the concentration for the range of tempera-tures selected.
5.3.6. Broth, gravy, soup and salad cream
The temperature dependence of broth, gravy andsoup seems to be similar to that of water and other
foods (Bengtsson & Risman, 1971). Laursen (1987)found that the permittivity curves for salad creamchanged considerably during extended storage at roomtemperature; the droplet size had no effect.
5.3.7. Water activity
The ‘mobility’ of water within the structure of a hostmaterial may vary widely from highly mobile ‘free’water, to ‘bound’ water that is somehow kineticallyconstrained. Mobility is linked to water activity aw,which describes the contribution of water to the supportof bacteria and fungi. Quantifying water activity aw isthe key to research on food preservation and safety. Thedielectric measurements are a unique research tool inunderstanding aqueous solutions, water activity, foodpreservation, shelf life, hydration phenomena, andphase transitions. Properly designed and calibratedelectrical instruments are used to quickly determine themoisture content.
5.3.8. Food dielectric properties at freezing and sterilising
temperatures
Accurate knowledge of dielectric properties in par-tially frozen material is critical to determining the ratesand uniformity of heating in microwave thawing. As theice in the material melts, absorption of microwaveenergy increases tremendously. Thus, the portions ofmaterial that thaw first absorb significantly more energyand heat at increasing rates that can lead to localisedboiling temperatures while other areas are still frozen.Dielectric properties of frozen food materials have beenreported in the literature (Bengtsson & Risman, 1971;Kent, 1987) and these properties can be heavilyinfluenced by composition, particularly total water andsalt content. Salt affects the situation through freezingpoint depression, leaving more water unfrozen at a giventemperature in this range. Salt also increases the ioniccontent and consequently the interaction with themicrowave fields.
Chamchong (1997) reported dielectric properties at2�45GHz of TyloseTM, a food analogue, covering thefrozen range. For complex and formulated foods such asTyloseTM, the dielectric properties must be measured orestimated (Buffler & Stanford; 1991, Venkatesh, 1996).Both the dielectric constant and loss factor decreasedsignificantly as more water was frozen. Since thefraction of unfrozen water is a non-linear function oftemperature, the increase in dielectric properties of thepartially frozen material is also non-linear with tem-perature. Above the freezing range, the dielectricconstant of TyloseTM decreased linearly with tempera-ture. With the addition of salt, the dielectric constantdecreased while the dielectric loss factor increased.
ARTICLE IN PRESSM.S. VENKATESH; G.S.V. RAGHAVAN12

Dielectric properties at high temperatures, useful formicrowave pasteurisation and sterilisation, have beenscarce (Datta & Nelson, 2000). In addition to tempera-ture effects per se, physical and chemical changes such asgelatinisation of starch (Miller et al., 1991) anddenaturation of protein causing release of water andshrinkage (Li & Barringer, 1997) at higher temperaturescan significantly change dielectric properties. Severalauthors have published equations to predict the di-electric properties as a function of water, salt andtemperature. These equations work best for foods wherea large number of related samples have been reported inthe literature. For foods where little has been published,the accuracy of the models decreases, in some casesdramatically.
The dielectric properties of simple systems such aswater or salt water are linear with respect to tempera-ture. Liquid foods, such as broth and gravy, are alsotypically linear with temperature. More complex foodsystems, such as meats, are not linear. One reason maybe due to phase changes, such as protein denaturationand starch gelatinisation. Protein denaturation changesthe water and salt binding capacity of the food, expelswater, and changes the dielectric properties. Forhigh-salt products such as ham, the change in dielectricproperties at the denaturation temperature isstrongly a function of salt content. The dielectricproperties of several powdered hydrocolloids, includingpotato starch, locust bean gum, gum arabic, carragee-nan and carboxymethylcellulose, were measured at2�45GHz as functions of temperature (20–1008C) andmoisture content between 0 and 30%, wet basis(Prakash et al., 1992, Nelson, 1991). The dielectricconstants and loss factors of all hydrocolloids increasedwith moisture content and with temperature indicating arelaxation frequency below 2�45GHz at all moisturecontents and temperatures. The degree of temperaturedependence of all five hydrocolloids increased asmoisture content increased but to a lesser extent inpotato starch and a much lesser extent in locust beangum.
5.3.9. Dielectric properties of nuts
Dielectric properties of nuts are quite limited. Di-electric constants and loss factors for peanuts have beenreported for the 1–50MHz frequency range (Nelson,1973) showing the expected variation with frequencyand moisture content. More detailed information isavailable for chopped pecans (Nelson, 1991), and thesedata are reported for the frequency range from 50 kHzto 12GHz over the moisture range from 3 to 9%, wetbasis, at 228C. The temperature dependence at 0–40oCof the dielectric constant and loss factor were deter-mined for the frequency range from 100 kHz to
110MHz over a similar range of moisture contents(Lawrence et al., 1992, 1998). Both the dielectricconstant and loss factor increased regularly withmoisture content at all frequencies and decreasedas the frequency increased. At low moisturecontents, the temperature dependence was minimal,but both the dielectric constant and loss factorincreased rapidly with temperature at high moisturelevels.
6. Dielectric behaviour of soils
Important factors in the behaviour of soils exposedto microwaves are the dielectric properties of thecomponents of the soil. Only limited information isavailable on these properties in the literature, particu-larly at microwave frequencies. Hoekstra andDelaney (1974) studied the dielectric properties of afine sand, a silt, a silty clay and a clay soil(f ¼ 100MHz–26GHz). Their data revealed thefollowing general relationships: the values for e0 increasewith an increase in temperature, but the value for e00
remains fairly constant as temperature increases, thevalue for e00 goes through a relaxation point; astemperature decreases the frequency (at which relaxa-tion occurs) increases; the values for both e0 and e00
increase with an increase in water content; thefrequency at which relaxation occurs increases with adecrease in water content; and the value for e0 decreaseswith frequency and decreases more sharply after therelaxation frequency. In general, the value for e0 ofsoils varies from 2 to 3 for dry soils to up to 20 forsoils with a moisture in the range of 0�3 g cm�3. Thevalues for e00 vary from 0�5 for dry soils to approximately4 for high moisture soils. Soils with concentratedorganic compounds have higher electrical conductivitiesthan soils permeated with the same amount of water.Also, if the compound has a low value for e0 and ispresent in a high concentration, clay particles will tendto flocculate.
6.1. Dielectric behaviour of organic solvent mixtures
Very little information is available on the dielectricproperties of solvents and solvent mixtures at micro-wave frequencies. Knowledge of these properties isrequired to understand how soil/solvent mixturesbehave when exposed to microwaves. The testing ofsolvent mixtures is essential as it is found necessary touse a mixture of solvents in compounds. Certain selectedsolvents and their mixtures have been tested in thisstudy.
ARTICLE IN PRESSMICROWAVE PROCESSING AND DIELECTRIC PROPERTIES OF MATERIALS 13

6.2. Microwave-assisted Process
The Microwave-assisted Process (MAPTM) is anenhanced extraction technology patented by Environ-ment Canada that uses microwaves to rapidly transfertarget compounds from one phase to another byselectively heating the phase containing the targetcompounds (Pare et al., 1994). The MAPTM technolo-gies use microwaves to assist in physical or chemicalprocesses. The use of this technology for the solventextraction of organic contaminants from soil has provensuccessful in the area of analytical sample preparationand has penetrated various areas of research includingquality control: pharmaceutical, food products, foodsafety, nutritional verification; environmental sampleseparation: contaminated soil, contaminated water,waste streams, contaminated animal tissues, pesticideresidues in plants and in forensic sciences}drugs intissues.
7. Summary of industrial, scientific, medical and domestic(ISM & D) applications
7.1. Agriculture
Recently, there have been relatively few attempts toapply microwave power to agriculture; more investiga-tions were carried out in the late 1960s and the early1970s. The areas of application include drying of grains(Bhartia et al., 1973; Copson, 1962; Fanslow & Saul,1971; Rzepecka et al., 1972; Wesley et al., 1974), insectcontrol (Nelson, 1973; Nelson et al., 1974), and seedgermination (Jolly & Tate, 1971). Such exotic uses ofmicrowave energy as protection of plants form coldwere also suggested (Bosisio et al., 1970; Bosisio &Barthakur, 1969). The main limitation of these applica-tions is economics. Insect control and seed germinationare more likely candidates for economic use of micro-wave power than grain drying.
Insect control is achieved by heating the insects for asufficient period to a sufficiently high temperature,preferably without heating the host material. Thedifference in the heating rate of the insects and graindepends on the dielectric properties of the two and theirsize and shape (Nelson, 1973; Nelson et al., 1974). Thedielectric properties of various grains were measured ina broad range of frequencies, temperatures, and typicalmoisture contents (Chugh et al., 1973; Nelson, 1983,1984; Nelson et al., 1974).
Seeds of many legumes present a germinationproblem owing to a large number of hard seeds. Whilethese seeds are viable, an impermeable seed coatprevents the entry of moisture necessary to initiate
germination, and consequently the seeds germinate andgrow late and may not have sufficient time to mature bythe harvest time. Such seeds, when heated to anappropriate temperature, show greatly improved germi-nation without any other undesirable side effects.Extensive studies were conducted of alfalfa seedgermination after treatment at various frequencies(Nelson, 1991). Also, germination of clover, acacia,Douglas fir, pine and spruce was investigated (Tran &Cavanagh, 1979).
7.2. Food
Application of microwave power to numerous foodprocesses has been investigated on a laboratory scale,and a few successful industrial processes are presently inoperation (Bengtsson & Risman, 1971; Freedman, 1973;Thourel, 1979). The processes studied include drying(Ryynanen, 1995; Maurer et al., 1971; Rzepecka et al.,1972; Rzepecka & Pereira, 1974; Sobiech, 1980; Suzuki& Oshima, 1973), freeze-drying (Decareau, 1985; Ma &Peltre, 1975; Sunderland, 1982), preheating, thawing(Bialod, 1980; Phan, 1977; Priou et al., 1978), sterilisa-tion (Decareau, 1985; Jaynes, 1975; Kenyon et al.,1971; Lin & Li, 1971), enzyme inactivation (Arefet al., 1972; Goldblith et al., 1968), meat tempering(Meisel, 1973; Schiffmann, 1973, 1995), blanching(Avisse & Varoguaux, 1977; Chen et al., 1971, 1982),and cooking (Decareau, 1985; Goldblith et al., 1968;May, 1969; Nykvist & Decareau, 1976; Suzuki &Oshima, 1973).
In the baking industry one of the most successfulapplications developed on a commercial scale is themicrowave doughnut proofing. The systems developedby DCA Food Industries, Inc. in the USA operates at2�45GHz, with an output power between 2�5 and 10 kW.Another microwave application in baking, also devel-oped by the same company (DCA), was the doughnutfryer (Schiffmann, 1973).
A highly successful system for meat tempering wasdeveloped by Raytheon Company (USA) (Schiffmann,1973). One of the most important factors in tempering isto ensure that the product enters the microwave tunnelat a uniform temperature without any incipient thawing.Thawing is understandable in view of the difference inthe dielectric properties of frozen foods and foods attemperatures close to 08C. The high loss factor of thethawed part of the food is responsible for overheatingand thermal runaway. The meat-tempering systemoperates at 915MHz.
Drying of pasta products is another example of success-ful commercial-scale application of microwave power. Thesystem developed by the Microdry Corporation (USA)
ARTICLE IN PRESSM.S. VENKATESH; G.S.V. RAGHAVAN14

operated at 915MHz with a power of 30 or 60kW(Schiffmann, 1995).
The growth of applications of microwave power infood industry in Europe has paralleled, if not outrun,that in the United States (Meisel, 1973). Temperingtunnels developed by LMI in France are used for beef,lamb and ham. They operate at 2�45GHz with anoutput power of 2�5 or 5 kW.
Two interesting systems were developed by Thomsonat CSF (France) and Nestle Company (Switzerland),and Thomson and Japanese companies (Nittan FoodsCo., and Shimada Raka Kogyo Co.) (Meisel, 1973). Themicrowave power of 5 kW is supplied at 2�45GHz.Various systems are in use operating at 915MHz and2�45GHz with an output power ranging from 1�4 to30 kW (Kase, 1973; Ogura et al., 1978). Puffing anddrying of snack foods is another popular application,and some products have been developed specifically formicrowave processing, e.g. puffed rice cake and sea-weeds. In China, microwave power is used to drychocolate powder and milk cake, and to age wine andspirits (Chen et al., 1982).
Recent interest in microwave processing of materialsis highlighted in a number of recent symposia that havebeen dedicated to microwave processing of materials. Todate, the Material Research Society (MRS), the Inter-national Microwave Power Institute in association withthe Institution of Electrical and Electronic Engineers(IMPI/IEEE), and the American Ceramic Society (ACS)have held a number of symposia that have focused onmicrowave processing of materials. The recent researchin microwave equipment design, microwave/materialsinteractions, dielectric properties measurement andmaterials processing continues to expand interest inmicrowave techniques.
8. Conclusions
In this study, an attempt was made to capture thepotential of electromagnetic energy-based processingthrough an extensive and comprehensive literatureoverview in the subject area as it mainly summarisesseveral microwave processing aspects and its usefulnessin understanding the microwave energy–material inter-action and the role of dielectric properties. Thiscomprehensive coverage of the knowledge will be usefulfor academic, scientific and industrial community withrespect to treating and applying the facts in developing/testing new processes and products, based on electro-magnetic energy application.
Several agricultural and food materials have beeninvestigated for their functional relationships with theprocessing parameters such as applied microwave
frequency, temperature, composition, density, and otherphysico-chemical attributes.
As materials are processed, they often undergophysical and structural transformations that affect thedielectric properties. Thus, the ability of microwaves togenerate thermal energy varies during the process. Sharptransformations in the ability of microwaves to generateheat can cause difficulties with the process modellingand control. Understanding the generation, propaga-tion, and interaction of microwaves with materials iscritical. As the processing equipment determines theelectromagnetic field, the design of microwave equip-ment is particularly important. The governing propertiesof the electromagnetic field, chemical composition of thematerial being processed, structural changes that occurduring processing, size and shape of the object beingheated, and the physics of the microwave/materialsinteraction all complicate microwave processing.
Acknowledgements
The authors thank Mr. P. Alvo for editorial assistanceand the Natural Science and Engineering Council ofCanada (NSERC) for the financial support.
References
Aref M M; Noel J G; Miller H (1972). Inactivation of alpha-amylase in wheat flour with microwaves. Journal ofMicrowave Power, 7, 215–222
ASAE Standards (1988). American Society of AgriculturalEngineers. St Joseph, MI, USA
Avisse C; Varaquaux P (1977). Microwave blanching ofpeaches. Journal of Microwave Power, 12(1), 73–77
Bengtsson N E; Risman P O (1971). Dielectric properties offood at 3GHz as determined by a cavity perturbationtechnique.II. Measurements on food materials. Journal ofMicrowave Power, 6(2), 107–123
Bhartia P; Stuchly S S; Hamid M A K (1973). Experimentalresults for combinatorial microwave and hot air drying.Journal of Microwave Power, 8(3–4), 245–252
Bialod D (1980). Electromagnetic Waves in Industrial High-frequency Ovens. Model Simulation of a Periodic StructureContaining a Heterogeneous Charge. Electricite de France,Bulletin de la Direction des Etudes et Recherches, Serie B:Reseaux Electriques, Materiels Electriques. Electr Fr BullDir Etud Ser B, 2, 55–73
Bosisio R G; Bharthakur N (1969). Microwave protection ofplants from the cold. Journal of Microwave Power, 4(3),190–193
Bosisio R G; Bharthakur N; Spooner J (1970). Microwaveprotection of a field crop against cold. Journal of Micro-wave Power, 5, 47–52
Brown G H; Hoyler C N; Bierworth R A (1947). Theory andApplications of Radio Frequency Heating. Van Nostrand,New York, USA
ARTICLE IN PRESSMICROWAVE PROCESSING AND DIELECTRIC PROPERTIES OF MATERIALS 15

Buffler C R (1993). Microwave Cooking and Processing. VanNostrand Reinhold, New York, USA
Buffler C R; Stanford M A (1991). Effects of dielectric andthermal properties on the microwave heating of foods.Microwave World, 12(4), 15–23
Chamchong M (1997). Microwave thawing of foods: effect ofpower levels, dielectric properties, and sample geometry.PhD Thesis, Cornell University, Ithaca, New York, USA
Chen S C; Collins J L; Mccarty I E; Johnston M R (1971).Blanching of white potatoes by microwave energy followedby boiling water. Journal of Food Science, 36, 742–3
Chen H K; Shen Z Y; Fu C S; Wu D (1982). The developmentof microwave power applications in China. Journal ofMicrowave Power, 17, 11–15
Chen S S; Spiro M (1994). Study of microwave extraction ofessential oil constituents from plant materials. Journalof Microwave Power and Electromagnetic Energy, 29(4),231–241
Chugh R K; Stuchly S S; Rzepecka M A (1973). Dielectricproperties of wheat at microwave frequencies. MicrowaveWorld, 12(2), 6–15
Copson D A (1962). Microwave Heating. AVI Publishing Co.,USA
Datta A K (1999). Personal correspondence. Cornell Uni-versity, Ithaca, New York. Unpublished data.
Datta A K; Sun E; Solis A (1995). Food dielectric propertydata and their composition-based prediction. In: Engineer-ing Properties of Foods (Rao M A; Rizvi S S, eds), Chapter9, 457–494. Marcel Dekker, Inc., New York
Datta A K; Nelson S O (2000). Fundamental Physical Aspectsof Microwave Absorption and Heating in Handbook ofMicrowave Technology for Food Applications. CHIPSPublications, USA
Decareau R V (1985). Microwaves in the Food ProcessingIndustry. Academic Press, Orlando, FL, USA
El-Shami S M; Selim I Z; El-Anwar I M; Hassan M M (1992).Dielectric properties for monitoring the quality of heatedoils. Journal of the American Oil Chemists’ Society(JAOCS), 69(9), 872–875
Fanslow G E; Saul R A (1971). Drying field corn withmicrowave power and unheated air. Journal of MicrowavePower, 6(3), 229–235
Freedman G (1973). The future of microwave heatingequipment in the food industries. Journal of MicrowavePower, 8(2), 161–166
Goldblith S A; Tannenbaum G F; Wang D I C (1968). Thermaland 2450MHz microwave energy effect on the destruction ofthiamine. Journal of Food Technology, 22, 64–66
Hasted J B (1973). Aqueous Dielectric. Chapman and Hall,London.
Hasted J B; Ritson D M; Collie C H (1948). Dielectricproperties of aqueous ionic solutions. Parts I and II. Journalof Chemical Physics, 16(1), 21
Haynes L C; Locke J P (1995). Microwave permittivities ofcracker dough, starch and gluten. Journal of MicrowavePower and Electromagnetic Energy, 30(2), 124–131
Hein M; Henning H; Isengard H D (1998). Determination oftotal polar parts with new methods for the quality survey offrying fats and oils. Talanta, 47, 447–454
Hoekstra P; Delaney D (1974). Dielectric properties of soils atUHF and MW frequencies. Journal of Geophysics Re-search, 79, 1699–1708
Jaynes H O (1975). Microwave pasteurization of milk. Journalof Milk Food Technology, 38, 386–7
Jolly J A; Tate R L (1971). Douglas- fir tree seed germinationenhancement using microwave energy. Journal of Micro-wave Power, 6(2), 125–130
Kaatze U (1989). Complex permittivity of water as a functionof frequency and temperature. Journal of Chemical En-gineering Data, 34, 371–374
Kase Y (1973). Microwave food applications in Japan:domestic microwave ovens. Journal of Microwave Power,8(2), 133–136
Kent M (1970). Complex permittivity of white fish meal in themicrowave region as a function of temperature andmoisture content. Journal of Physics, D-Applied Physics,3, 1275–1283
Kent M (1972). Microwave dielectric properties of fishmeal.Journal of Microwave Power, 7(2), 109–116
Kent M (1977). Complex permittivity of fish meal: a generaldiscussion of temperature, density and moisture dependence.Journal of Microwave Power, 12(4), 341–345
Kent M (1987). Electrical & Dielectric Properties of FoodMaterials. Science and Technology Publishers, Hornchurch,UK
Kent M; Anderson D (1996). Dielectric studies of added waterin poultry meat and scallops. Journal of Food Engineering,28, 239–259
Kent M; Kress-Rogers E (1986). Microwave moisture anddensity measurements in particulate solids. Transactions ofInstrumentation, Measurement and Control, 8(3), 167–168
Kenyon E M; Westcott D E; La Casse P; Gould J W (1971). Asystem for continuous thermal processing of food pouchesusing microwave energy. Journal of Food Science, 36,
389–293Kudra T; Raghavan G S V; Akyel C; Bosisio R; van de Voort F
R (1992). Electromagnetic properties of milk and itsconstituents at 2�45MHz. International Microwave PowerInstitute Journal, 27(4), 199–204
Laursen I (1987). Microwave properties of some food liquids.In: Physical Properties of Foods, 2. COST 90ibis FinalSeminar Proceedings (Jowitt R; Escher F; Kent M;McKenna B; Roques M, eds), pp 213–16. Elsevier AppliedScience, London
Lawrence K C; Nelson S O; Bartley Jr P G (1998). Coaxialdielectric sensor for cereal grains. Institute of Electrical andElectronics Engineers, IEEE IMTC Proceedings, 1, 541–546
Lawrence K S; Nelson S O; Kraszewski A W (1992).Temperature dependence of the dielectric properties ofpecans. Transactions of the ASAE, 35(1), 251–255
Li A; Barringer S A (1997). Effect of salt on the dielectricproperties of ham at sterilization temperatures. Institute ofFood Technologist’s Annual meeting abstracts, 55, p 5
Lin C C; Li C F (1971). Microwave sterilization of oranges inglass pack. Journal of Microwave Power, 6,45–48
Ma Y H; Peltre P R (1975). Freeze dehydration by microwaveenergy. AICHE Journal, 21, 335–350
Maurer R L; Trembley M R; Chadwick E A (1971). Use ofmicrowave energy in drying alimentary pastes. MicrowavePower Symposium Proceedings, Monterey, CA
May K N (1969). Applications of microwave energy inpreparation of poultry convenience foods. Journal ofMicrowave Power, 4, 54–58
Meisel N (1973). Microwave applications to food processingand systems in Europe. Journal of Microwave Power, 8,
143–148Metaxas A C; Meredith R (1983). Industrial MicrowaveHeating. Peter Peregrinus, Steveago
ARTICLE IN PRESSM.S. VENKATESH; G.S.V. RAGHAVAN16

Meyer W; Schilz W (1980). A microwave method for densityindependent determination of the moisture content of solids.Journal of Physics D-Applied Physics, 13, 1823–1830
Miller L A; Gordon J; Davis E A (1991). Dielectric and thermaltransition properties of chemically modified starches duringheating. Cereal Chemistry, 68(5), 441–448
Mladek V J; Komarek K (1974). Die dielektrischen Eigenschaf-ten der starke im Mikrowellenbereich als Grundlage diefeuchtigkeitsbestimming [The dielectric properties and theireffect on the field strength in a microwave band as a basis forthe humidity regulation]. Die Starke, 26(5), 160–164
Mudgett R (1985). Dielectric properties of foods. Microwavesin the Food Processing Industries, pp 15–37. AcademicPress, New York
Mudgett R E (1986). Electrical properties of foods. In:Engineering Properties of Foods (Rao M A; Rizvi S S H,eds), pp 329–90. Marcel Dekker, New York
Mudgett R E; Goldblith S A; Wang D I C; Westphal W B
(1980). Dielectric behaviour of a semi-solid food at low,intermediate and high moisture contents. Journal ofMicrowave Power, 15(1), 27–36
Mudgett R E; Smith A C; Wang D I C; Goldblith S A (1974).Prediction of dielectric properties in non-fat milk atfrequencies and temperatures of interest in microwaveprocessing. Journal of Food Science, 39, 52–54
Nelson S O (1965). Dielectric properties of grain and seed inthe 1 to 50-mc range. Transactions of the ASAE, 8(1), 38–48
Nelson S O (1973). Electrical properties of agriculturalproducts}a critical review. Transactions of the ASAE,16(2), 384–400
Nelson S O (1983). Density dependence of the dielectricproperties of particulate materials pulverized coal, flour,wheat samples. Transactions of the ASAE, 26(6), 1823–1825,1829
Nelson S O (1984). Moisture, frequency, and density depen-dence of the dielectric constant of shelled, yellow-dent fieldcorn. Transactions of the ASAE, 30(5), 1573–1578,1585
Nelson S O (1987). Models for the dielectric constants of cerealgrains and soybeans. Journal of Microwave Power, 22,
35–39Nelson S O (1991). Dielectric properties of agriculturalproducts}measurements and applications. IEEE Transac-tions on Electrical Insulation, 26(5), 845–869
Nelson, S O (1992). Estimation of permittivities of solids frommeasurements on pulverized or granular materials, Chapter6, Dielectric Properties of Heterogeneous Materials (PriouA, ed.), Vol. 6, Progress in Electromagnetics Research(Kong J A, ch. ed.). Elsevier Science Publishing Co., NewYork, USA
Nelson S O; Forbus Jr W R; Lawrence K C (1994). Microwavepermittivities of fresh fruits and vegetables from 0�2 to20GHz. Transactions of the ASAE, 37(1), 183–189
Nelson S O; Kraszewski A W (1990). Grain moisture contentdetermination by microwave measurements. Transactions ofthe ASAE, 33(4), 1303–7
Nelson S O; Stetson L E; Schlaphoff C W (1974). A generalcomputer program for precise calculation of dielectricproperties from short-circuited wave-guide measurements.IEEE Transactions of Instrumentation and Measurement,23(4), 455–460
Nelson S O; You T S (1989). Microwave dielectric properties ofcorn and wheat kernels and soybeans. Transactions of theASAE, 32(1), 242–249
Nyfors E; Vainikainen P (1989). Industrial Microwave Sensors,Chapter 2. Artech House, Norwood
Nykvist W E; Decareau R V (1976). Microwave meat roasting.Journal of Microwave Power, 11(1), 3–24
O’ Connor J F; Synnot E C (1982). Seasonal variation indielectric properties of butter at 15MHz and 48C. Journal ofFood Science and Technology, 6, 49–59
Ogura K; Takahashi H; Koinuma T; Tashiro N (1978). Designproblems in magnetrons for microwave ovens. Journal ofMicrowave Power, 13(4), 357–361
Ohlsson T; Bengtsson N E (1975). Dielectric food data for MWsterilization processing. Journal of Microwave Power, 10(1),93–108
Ohlsson T; Bengtsson N E; Risman P O (1974). The frequencyand temperature dependence of dielectric food data asdetermined by a cavity perturbation technique. Journal ofMicrowave Power, 9(2), 129–145
Pare J R J; Belanger J M R; Strafford S S (1994). Microwave-Assisted Process (MAPTM): a new tool for the analyticallaboratory. Trends in Analytical Chemistry, 13(4), 176–184
Paul S; Mittal G S (1996). Dynamics of fat/oil degradationduring frying based on physical properties. Journal of FoodProcess Engineering, 19, 201–221
Phan P A (1977). Microwave thawing of peaches}a compara-tive study of various thawing processes. Journal of Micro-wave Power, 12(4), 261–271
Prakash S; Armstrong J G (1970). Measurement of thedielectric constant of butter. Dairy Industries, 35(10),688–689
Prakash A; Nelson S O; Mangino M E; Hansen P M T (1992).Variation of microwave dielectric properties of hydrocol-loids with moisture content, temperature and stochiometriccharge. Food Hydrocolloids, 63, 315–322
Priou A; Fournet-Fayas C; Deficis A; Gimonet E (1978).Microwave thawing of larger pieces of beef. Proceedings of8th European Microwave Conference, Paris, France, pp589–593
Raveendranath U; Mathew KT (1995). Microwave techniquefor water pollution study. Journal of Microwave Power andElectromagnetic Energy, 30(3), 188–194
Ryynanen S (1995). The electromagnetic properties of foodmaterials: a review of the basic principles. Journal of FoodEngineering, 26(4), 409–429
Rzepecka M A; Pereira M 1974. Permittivity of some dairyproducts at 2450MHz. Journal of Microwave Power, 9(4),277–288
Rzepecka M A; Stuchly S S; Hamid M A K (1972).Applications for microwave treatment of granular materialsin agriculture. International Microwave Power Institute(IMPI), Technical Report Series, TR-72 (1)-35
Schiffmann R F (1973). The applications of microwaves in thefood industry in the USA. Journal of Microwave Power,8(2), 137–142
Schiffmann R F (1995). Microwave and dielectric drying.Handbook of Industrial Drying, 1, 345–371
Seras M; Courtois B; Quinquenet S; Ollivon M (1987).Measurement of the complex permittivity of dielectricsduring microwave heating: study of flours and starches. In:Physical Properties of Foods. 2. COST 90bis Final Seminaron flours and starches, Final Seminar Proceedings (Jowitt R;Escher F; Kent M; McKenna B; Roques M, eds), pp 217–23.Elsevier Applied Science, London
Sobiech W (1980). Microwave-vacuum drying of sliced parsleyroot. Journal of Microwave Power, 15(3), 143–154
ARTICLE IN PRESSMICROWAVE PROCESSING AND DIELECTRIC PROPERTIES OF MATERIALS 17
Sone T; Taneya S; Handa M (1970). Dielectric properties ofbutter and their application for measuring moisture contentduring continuous processing. 18th International DairyCongress. IE:221 (Food Science and Technology Abstract12P1690 2 (12))
Sun E; Datta A; Lobo S (1995). Composition-Based predictionof dielectric properties of foods. Journal of MicrowavePower and Electromagnetic Energy, 30(4), 205–212
Sunderland J E (1982). An economic study of microwave freezedrying. Journal of Food Technology, 361: 50–55
Suzuki T; Oshima K (1973). Applications of microwave powerto the food industry in Japan. Journal of Microwave Power,8(2), 149–159
Thostenson E T; Chou T W (1999). Microwave process-ing: fundamentals and applications. Composites A 30,
1055–1071Thourel L (1979). Uses of electromagnetic waves (agricultureand food industry). Review of General Electricity, 88,
851–857Tinga W R; Nelson S O (1973). Dielectric properties ofmaterials for microwave processing}Tabulated. Journal ofMicrowave Power, 8(1), 24–65
To E C; Mudgett R E; Wang D I C; Goldblith S A; Decareau RV (1974). Dielectric properties of food materials. Journal ofMicrowave Power, 9, 303–315
Trabelsi S; Kraszewski A W; Nelson S O (1997). A new density-independent function for microwave moisture contentdetermination in particulate materials. IEEE Instrumenta-tion and Measurement Technology Conference, Ottawa,Canada, 19–21 May
Tran V N; Cavanagh A K (1979). Effects of microwave energyon acacia longifolia. Journal of Microwave Power, 14(1),21–27
Tran V N; Stuchly S S; Kraszewski A W (1984). Dielectricproperties of selected vegetables and fruits 0�1–10GHz.Journal of Microwave Power, 19(4), 251–258
Tulasidas T N; Raghavan G S V; van de Voort F Girard R
(1995a). Dielectric properties of grapes and sugar solutions
at 2�45GHz. Journal of Microwave Power and Electro-magnetic Energy, 30(2), 117–123
Tulasidas T N; Raghavan G S V; Mujumdar A S (1995b).Microwave drying of grapes in a single mode cavity at2450MHz}II: quality and energy aspects. Drying Technol-ogy, 13(8–9), 1973–1992
USDA (1976). Composition of foods: raw, processed, pre-pared. Agricultural Handbook No. 8, Agriculture ResearchService, USDA
Venkatesh M S (1996). Cavity perturbation technique formeasurement of dielectric properties of some agri-foodmaterials. MSc Thesis, McGill University, MacdonaldCampus, Canada
Venkatesh M S; Raghavan G S V (2000). Effect of microwaveradiation on quality of heated edible oils. Microwave2000}III Chinese MW chemistry Symposium, Tianjin,China, 07–10 May
Venkatesh M S; Raghavan G S V; Sotocinal S A (1998).Development of a permittivity analyzer to operate at 915and 2450MHz using Cavity perturbation Technique. Paper# 98-315, presented at the CSAE annual meeting, AIC’98,UBC, Vancouver, Canada, 4–8 July
Von Hippel A (1954). Dielectric Materials and Applications.MIT Press, Cambridge, MA
Wesley R A; Lyons D W; Garner T H; Garner W E (1974).Some effects of microwave drying on cottonseed. Journal ofMicrowave Power, 9(4), 329–340
Zheng M; Huang Y W; Nelson S O; Bartley P G; Gates K W
(1998). Dielectric properties and thermal conductivity ofmarinated shrimp and channel catfish. Journal of FoodScience, 63(4), 668–672
Zuercher J L; Hoppie R; Lade S; Srinivasan; Misra D (1990).Measurement of the complex permittivity of bread dough byan open-ended coaxial line method at ultra-high frequencies.Journal of Microwave Power Electromagnetic Energy,25(3), 161–167
ARTICLE IN PRESSM.S. VENKATESH; G.S.V. RAGHAVAN18