micromechanics-based prediction of creep failure of hard rock for long-term safety of high-level...
TRANSCRIPT

Micromechanics-based prediction of creep failure of hardrock for long-term safety of high-level radioactive
waste disposal system
Kazuhiko Miura a, Yoshiaki Okui b,*, Hideyuki Horii c
a Radioactive Waste Management Funding and Research Center, 2-8-10 Toranomon, Minato-ku, Tokyo 105-0011, Japanb Department of Civil and Environmental Engineering, Saitama University, 255 Shimo-Ookubo, Saitama 338-8570, Japan
c Department of Civil Engineering, University of Tokyo, 7-3-1 Hongo, Bunkyou-ku, Tokyo 113-8656, Japan
Received 15 June 2001; received in revised form 22 January 2002
Abstract
A high-level radioactive waste disposal project is under way in Japan. Isolation of the radioactive waste in a rock
formation at great depth is considered as one of the promising disposal methods. Before proceeding with the disposal
project, however, assessment of the long-term stability of rock mass surrounding waste packages is necessary. This
paper presents a micromechanics-based model for predicting the creep failure of hard rock under compression. The
subcritical crack growth due to stress corrosion cracking and interaction effects between cracks are considered as the
main mechanisms of creep failure. An evolution problem of two interacting cracks is formulated and creep failure
following tertiary creep is represented as unstable extension of the interacting cracks in the present model. The time to
failure is calculated for different values of axial stress, confining pressure, and environmental conditions such as
temperature and presence of water. The effects of water, temperature, and stress states on the long-term behavior are
also included in the proposed model.
� 2002 Elsevier Science Ltd. All rights reserved.
Keywords: Creep; Subcritical crack growth; Granite; Crack interaction
1. Introduction
For disposal of high-level radioactive waste,isolating it in rock formations at great depths has
been considered one of the most effective methods.
Research and development on durable disposal
methods has been carried out worldwide, and the
validity of the methods has been presented through
environmental impact assessments in such coun-tries as the United States, Canada and Finland.
In Japan, there are 52 commercial nuclear
power plants, which produce about one third of
the total electricity production. The Japanese
government supports nuclear power as one of the
very important sources from the viewpoints of
stable energy supply and low environmental im-
pact. For disposal of radioactive waste, the Japan
*Corresponding author. Tel.: +81-48-858-3552; fax: +81-48-
858-7374.
E-mail address: [email protected] (Y. Okui).
0167-6636/03/$ - see front matter � 2002 Elsevier Science Ltd. All rights reserved.
PII: S0167-6636 (02 )00286-7
Mechanics of Materials 35 (2003) 587–601
www.elsevier.com/locate/mechmat

Nuclear Cycle Development Institute (1999) re-
ported that host rock that is fully stable over a
long period of time exists in Japan, and that it is
possible to build geological disposal systems that
can guarantee long-term safety. The Nuclear
Waste Management Organization of Japan startedthe process of selecting a repository site in 2000.
Under the current concept of radioactive waste
disposal, wastes are buried in a vault excavated in
rock formations at depths of 500–1000 m below
ground level. It is important to grasp the long-term
behavior of rock masses surrounding the vault
from the following viewpoints:
• The safety of disposal facilities should be as-
sessed for a period of about 10,000 years.
Changes in the near-field environment during
the period need to be predicted. We must there-
fore examine the time-dependent behavior of
near-field rock masses and its effect on excava-
tion damage development. The near-field rock
masses are expected to act as a natural barrieragainst diffusion of radioactive substances.
Hence expansion of the damage zone can be re-
garded as deterioration of the performance of
the natural barrier.
• No timing is fixed for backfilling the vault after
the storage of radioactive waste. There is an al-
ternative of not backfilling for about 300 years
while continuing maintenance (US Departmentof Energy, 1998). Hence, it should be verified
whether or not the safety of the vault may be
jeopardized due to the creep of the rock sub-
jected to high stresses during the period.
• High-level radioactive waste produces heat,
which combines with groundwater and acceler-
ates the creep of rock. It is therefore necessary
to study the effects of heat and groundwateron the creep of rock.
In Canada, Atomic Energy of Canada Limited
(AECL) constructed the underground research
laboratory (URL) in the Lac du Bonnet batholith
to conduct in situ experiments on the long-term
behavior of heated rock masses (Read et al., 1997).
Furthermore, as a part of the investigation, Lajtaiet al. carried out a series of creep and crack ve-
locity tests of intact Lac du Bonnet granite to in-
vestigate the effects of water and temperature on
the long-term behavior (Lajtai et al., 1987).
Over the past decades, a considerable number
of constitutive models for the time-dependent be-
havior of rocks have been proposed (see Cristescu
and Hunsche, 1998 for a review) The constitutivemodels are based either on a phenomenologi-
cal approach or on a micromechanics-based ap-
proach. In most phenomenological models, since
model structures are contrived to fit the experi-
mental data, the models have an empirical char-
acter. This causes, however, great uncertainties in
the extrapolation to the distant future and to
conditions not covered in existing data. Therefore,the physical deformation mechanisms for creep
must be included in reliable models for long-term
predictions.
For crystalline rocks, nucleation of microcracks
and their subcritical crack growth due to stress
corrosion have been considered to be domi-
nant mechanisms of deformation in primary and
steady-state creep (Atkinson, 1984; Atkinson andMeredith, 1981, 1987; Kranz, 1979, 1980; Swan-
son, 1984; Wilkins et al., 1984; Meredith and At-
kinson, 1985). Tertiary creep and eventual creep
failure have been ascribed to effects of interaction
between microcracks and coalescence of micro-
cracks.
Okui et al. (1993) proposed a micromechanics-
based continuum theory for short- and long-termbehavior of hard rocks under compression (Okui
et al., 1993; Okui and Horii, 1997). The continuum
theory, called interaction field theory (IFT), is
formulated by homogenization of an elastic solid
with many cracks. Two mechanisms of crack
growth are considered, namely stress-induced
crack growth based on linear elastic fracture me-
chanics and stress corrosion cracking. In the crackgrowth criterion, the effects of interaction among
cracks are taken into account, which leads to
formulation of an integral equation that deter-
mines the interaction effects. IFT can reproduce
the behavior from primary to tertiary creep, and
accordingly can evaluate time to failure under
long-term loading. In order to obtain a solution of
the theory, however, one has to simultaneouslysolve a set of differential equations such as an
equilibrium equation as well as the integral equa-
588 K. Miura et al. / Mechanics of Materials 35 (2003) 587–601

tion by using the finite element method. Thus, it
may not be suitable to use IFT for parametric
studies to investigate long-term strength.
In this study, we propose a simple mechanism-
based model for predicting the creep failure of
rocks under compression. In this model, essentiallythe same mechanisms of crack growth as those in
IFT are considered, and by assuming a uniform
stress state, the continuum theory is reduced to an
evolution problem of two interacting cracks.
After introduction of a micromechanical model
of flaws inside hard rocks under compression, a
simple analytical model is presented for predicting
short-term strength and time to failure under long-term constant load. Then, the validity of the pre-
sent model is examined through a parametric
study and comparison with reported experimental
data.
2. Sliding crack model and its simplification
The sliding crack model shown in Fig. 1(a) has
been employed by many researchers as a reason-
able model of flaws in rocks under compression
(Brace and Bombolakis, 1963; Horii and Nemat-
Nasser, 1985a,b). The sliding crack model consists
of the initial defect of length 2c0 and two tensilecracks. The maximum compressive stress r22makes the surfaces of the initial defect come intocontact and slide. The frictional sliding of the
initial defect produces the tensile cracks from the
tips of the initial defects.
An evolution problem of the sliding crack
model can be solved analytically with the method
of distribution of dislocations. However, an ex-
plicit solution is not available, and the procedure
of the solution is complicated. Hence, further
simplified models have been proposed (Horii andNemat-Nasser, 1986; Nemat-Nasser and Obata,
1988). In this study, we employ a simplified model
shown in Fig. 1(b) as a microstructural model of a
crack. The tensile crack is assumed to be parallel
to the maximum compressive stress r22 on thebasis of microscopic observation of rocks (Kranz,
1979). The effect of the frictional sliding on the
tensile crack is modeled with a concentrated forceF . The magnitude of the concentrated force isgiven by
F ¼ 2c0h�s� þ lr�i sin h ¼ c0hk2r11 � k1r22i; ð1Þwhere h i denotes the positive part of the argu-ment,
k1 ¼ sin hfsin 2h � lð1� cos 2hÞg;k2 ¼ sin hfsin 2h þ lð1þ cos 2hÞg;
ð2Þ
and h is the inclined angle to the direction of themaximum compressive stress, r� and s� are thenormal and shear stresses on the initial defect re-spectively, and l is the friction coefficient.Note that the mode I stress intensity factor
(SIF) of the model is given by
KI ¼ffiffiffiffiffipl
pr11 þ
c0hk2r11 � k1r22iffiffiffiffiffipl
p : ð3Þ
This expression will be used in formulation of the
evolution problem in Section 5.
3. Interacting crack model
In order to develop a theoretical model for
creep of hard rocks, an evolution problem of manysimplified crack models embedded in an elastic
medium is probably the most suitable. Okui et al.
(1993) investigated this problem by transforming
the problem into a continuum theory. In this
paper, however, the evolution problem of two in-
teracting cracks is discussed for simplicity. Fig.
2(a) shows the considered problem, in which the
simplified crack models shown in Fig. 1(b) are
2C0
θ
-σ11
-σ22
-σ11
-σ22
-σ11
-σ22
-σ11
-σ22
F F 2l2C
θ
-σ11
-σ22
-σ11
-σ22
-σ11
-σ22
-σ11
-σ22
F F 2l
(a) (b)
Fig. 1. Microcrack model under compression: (a) sliding crack
model; (b) simplified model.
K. Miura et al. / Mechanics of Materials 35 (2003) 587–601 589

embedded in the elastic body, and the principal
stresses r11 and r22 are applied to the body at in-finity.
Major reasons for this simplification are as
follows:
• In reality, many cracks grow while interactingwith one another. Interaction between two ad-
jacent cracks is, however, actually most pre-
dominant, and distant cracks have little effect.
Solution of the evolution problem of two cracks
would therefore capture the essence of the prob-
lem.
• In fact, under IFT, interaction of many cracks
is represented by an integral equation for cracksthat are distributed continuously with a certain
density. When solving the equation by discretiz-
ing it by a finite element method, the structure
of the discretized equations is basically identical
to that of the governing equations in the evolu-
tion problem of two cracks.
For evaluating crack interaction, the pseudo-traction method was used (Horii and Nemat-
Nasser, 1985a,b). The original problem involving
two cracks was decomposed into a homogeneous
problem and two subproblems as shown in Fig. 2.
In the homogeneous problem there is no crack and
the same stresses as the original problem are ap-
plied at infinity, while in each subproblem a single
crack is contained without far-field stresses.In the subproblem a, �ðr22 þ rPa
22 Þ must be ap-plied to the surface of the crack a in order to
satisfy the stress free condition on crack surfaces in
the original problem, where r22 is the stress in thehomogeneous problem, and rPa
22 denotes the stress
at the position of the crack a in the subproblem b.
Since rPa22 is the stress caused by the other crack in
the other problem, the following consistency con-
dition must be satisfied:
rPa ¼ cabðr þ rPbÞ; ð4Þ
where r ¼ fr11; r22;r12gT; rPa ¼ frPa11 ; r
Pa22 ; r
Pa12g
T,
and cab is a 3 by 3 matrix whose components are
the stresses at the position of the crack a in thesubproblem b caused by application of a unit
stress to the crack b.Assuming that the pseudotractions are constant
on the crack surface and neglecting higher order
terms of ðlb=dÞ, the analytical expression of cab is
obtained by Okui et al. (1993),
cab ¼ 12
lbd
� �2 b1a1 �b2a1 a4b1a2 �b2a2 a5b1a3 �b2a3 a6
24
35 ð5Þ
with
a1 ¼ 2 cos 2/ab � cos 4/ab; b1 ¼ 1þ 2k2c0=ðplbÞ;a2 ¼ a6 ¼ cos 4/ab; b2 ¼ 2k1c0=ðplbÞ;a3 ¼ a4 ¼ sin 2/ab � sin 4/ab;
a5 ¼ sin 2/ab þ sin 4/ab;
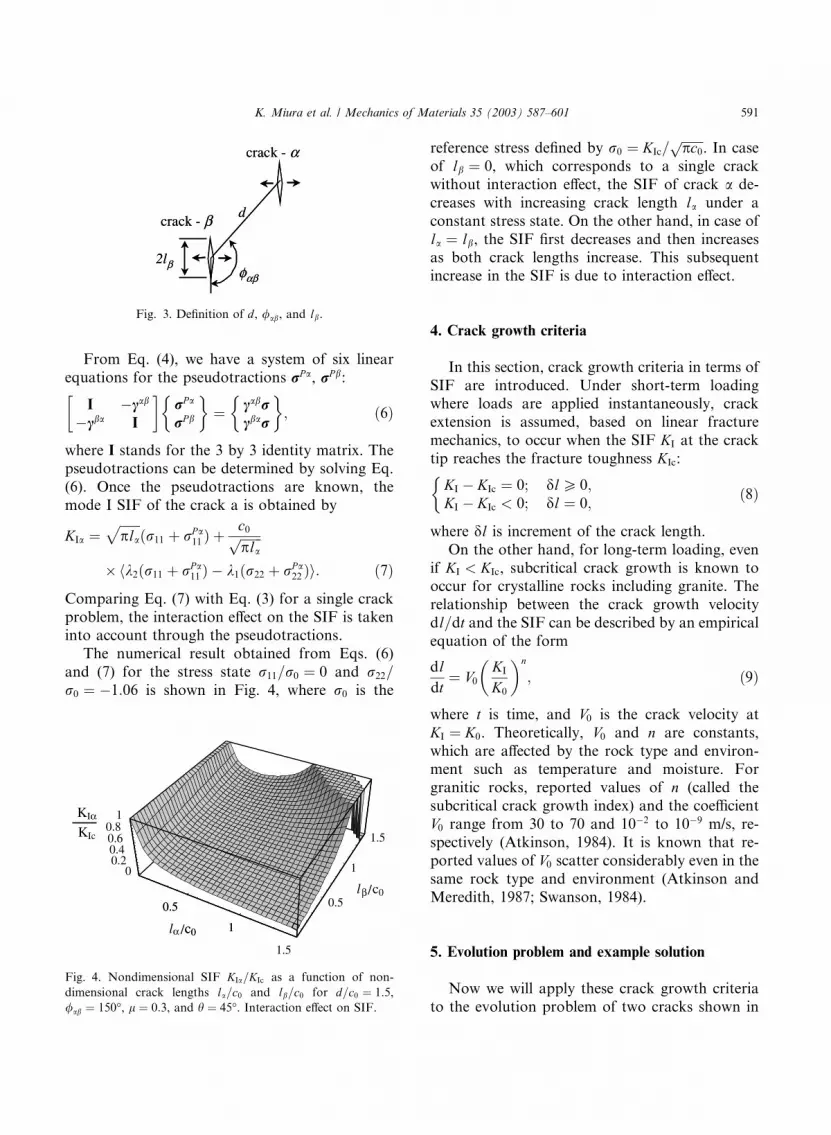
where the definitions of d, /ab, and lb are shown inFig. 3.
σ11
σ22
=
σ11
σ22
+ +
σ11
σ22
=
σ11
σ22
(a) Original Problem (b) Homogeneous Problem (c) Subproblem β (d) Subproblem α
crack α
crack β
- -
- -
Fig. 2. Decomposition of (a) original evolution problem into (b) homogeneous problem and (c,d) subproblems.
590 K. Miura et al. / Mechanics of Materials 35 (2003) 587–601
From Eq. (4), we have a system of six linear
equations for the pseudotractions rPa, rPb:
I �cab
�cba I
� rPa
rPb
�¼ cabr
cbar
�; ð6Þ
where I stands for the 3 by 3 identity matrix. Thepseudotractions can be determined by solving Eq.
(6). Once the pseudotractions are known, the
mode I SIF of the crack a is obtained by
KIa ¼ffiffiffiffiffiffiffipla
pðr11 þ rPa
11 Þ þc0ffiffiffiffiffiffiffipla
p
hk2ðr11 þ rPa11 Þ � k1ðr22 þ rPa
22 Þi: ð7Þ
Comparing Eq. (7) with Eq. (3) for a single crack
problem, the interaction effect on the SIF is takeninto account through the pseudotractions.
The numerical result obtained from Eqs. (6)
and (7) for the stress state r11=r0 ¼ 0 and r22=r0 ¼ �1:06 is shown in Fig. 4, where r0 is the
reference stress defined by r0 ¼ KIc=ffiffiffiffiffiffiffipc0
p. In case
of lb ¼ 0, which corresponds to a single crackwithout interaction effect, the SIF of crack a de-creases with increasing crack length la under aconstant stress state. On the other hand, in case of
la ¼ lb, the SIF first decreases and then increasesas both crack lengths increase. This subsequent
increase in the SIF is due to interaction effect.
4. Crack growth criteria
In this section, crack growth criteria in terms of
SIF are introduced. Under short-term loadingwhere loads are applied instantaneously, crack
extension is assumed, based on linear fracture
mechanics, to occur when the SIF KI at the cracktip reaches the fracture toughness KIc:
KI � KIc ¼ 0; dlP 0;KI � KIc < 0; dl ¼ 0;
ð8Þ
where dl is increment of the crack length.On the other hand, for long-term loading, even
if KI < KIc, subcritical crack growth is known tooccur for crystalline rocks including granite. The
relationship between the crack growth velocity
dl=dt and the SIF can be described by an empiricalequation of the form
dldt
¼ V0KIK0
� �n
; ð9Þ
where t is time, and V0 is the crack velocity atKI ¼ K0. Theoretically, V0 and n are constants,which are affected by the rock type and environ-ment such as temperature and moisture. For
granitic rocks, reported values of n (called thesubcritical crack growth index) and the coefficient
V0 range from 30 to 70 and 10�2 to 10�9 m/s, re-
spectively (Atkinson, 1984). It is known that re-
ported values of V0 scatter considerably even in thesame rock type and environment (Atkinson and
Meredith, 1987; Swanson, 1984).
5. Evolution problem and example solution
Now we will apply these crack growth criteria
to the evolution problem of two cracks shown in
0.5
1
1.5
l c0
0.5
1
1.5
lβ/
/
c0
00.20.40.60.8
1KIα
KIc
0.5
1α c0
Fig. 4. Nondimensional SIF KIa=KIc as a function of non-dimensional crack lengths la=c0 and lb=c0 for d=c0 ¼ 1:5,/ab ¼ 150�, l ¼ 0:3, and h ¼ 45�. Interaction effect on SIF.
crack - α
crack - β
φαβ
2lβ
d
crack - α
crack - β
φαβ
2lβ
d
Fig. 3. Definition of d, /ab, and lb.
K. Miura et al. / Mechanics of Materials 35 (2003) 587–601 591
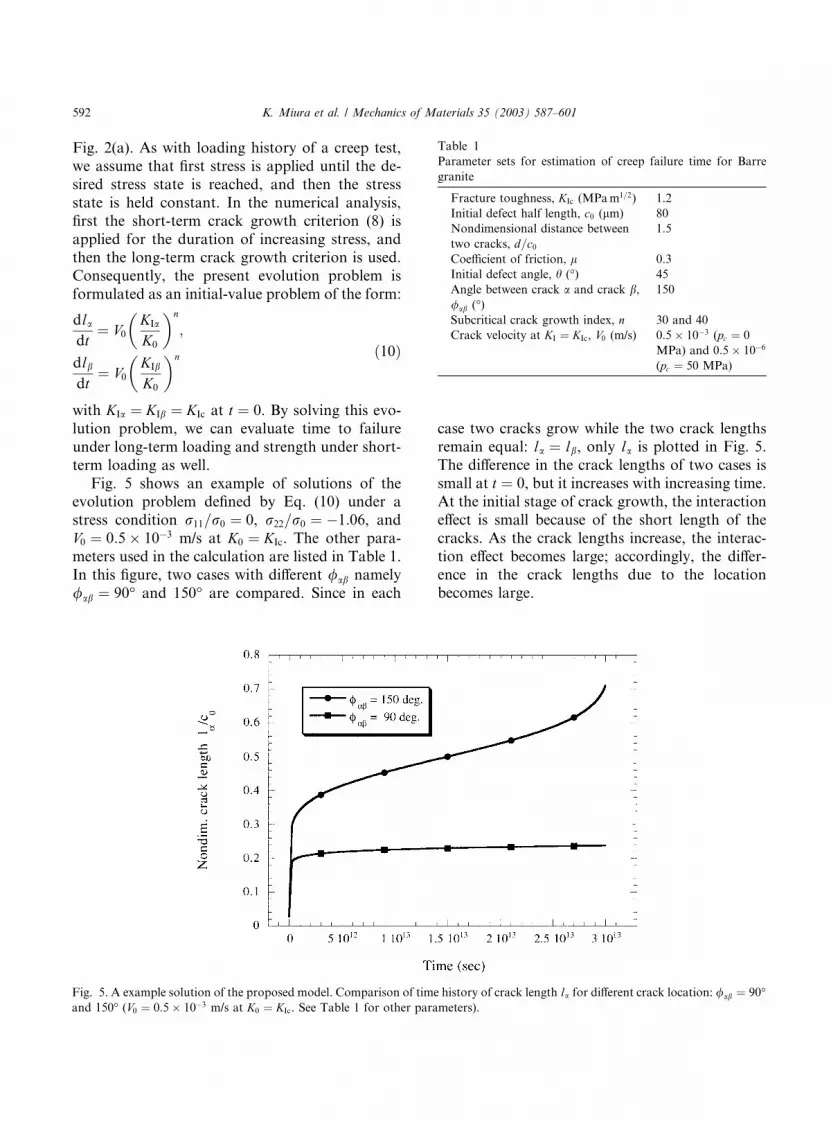
Fig. 2(a). As with loading history of a creep test,
we assume that first stress is applied until the de-
sired stress state is reached, and then the stress
state is held constant. In the numerical analysis,
first the short-term crack growth criterion (8) is
applied for the duration of increasing stress, andthen the long-term crack growth criterion is used.
Consequently, the present evolution problem is
formulated as an initial-value problem of the form:
dladt
¼ V0KIaK0
� �n
;
dlbdt
¼ V0KIbK0
� �n ð10Þ
with KIa ¼ KIb ¼ KIc at t ¼ 0. By solving this evo-lution problem, we can evaluate time to failure
under long-term loading and strength under short-
term loading as well.
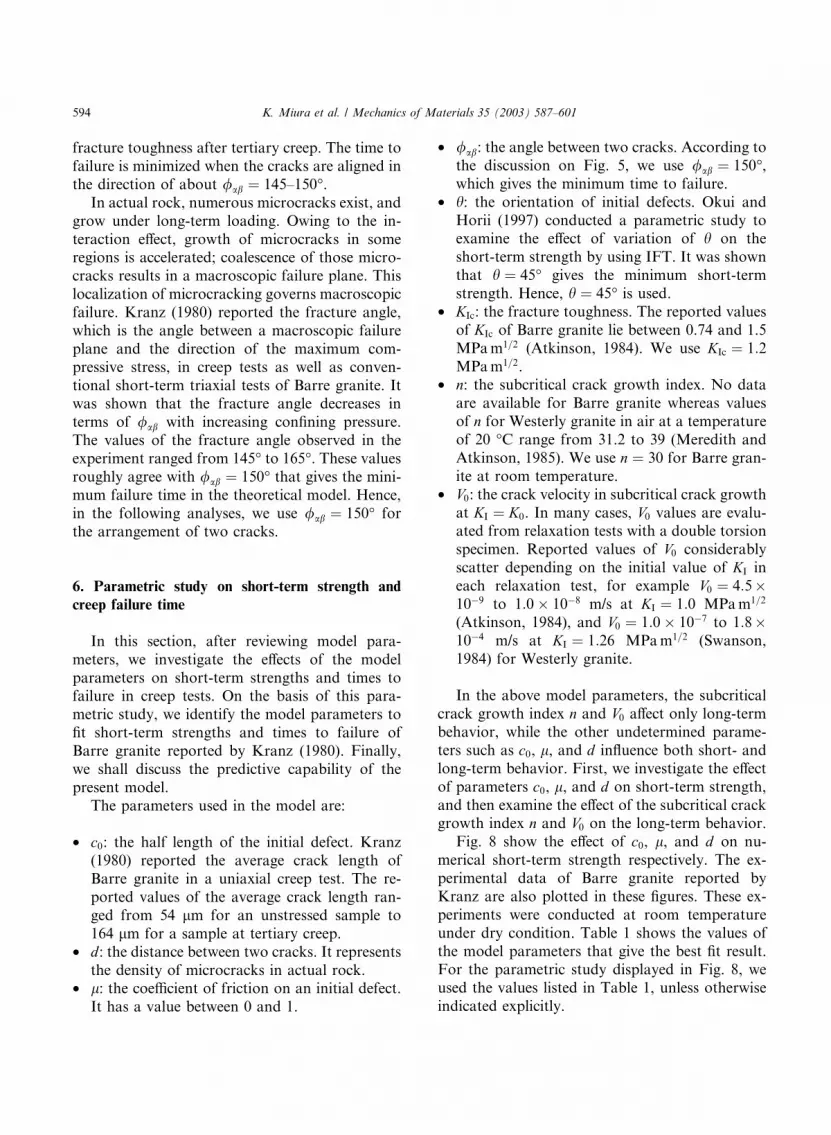
Fig. 5 shows an example of solutions of theevolution problem defined by Eq. (10) under a
stress condition r11=r0 ¼ 0, r22=r0 ¼ �1:06, andV0 ¼ 0:5 10�3 m/s at K0 ¼ KIc. The other para-meters used in the calculation are listed in Table 1.
In this figure, two cases with different /ab namely
/ab ¼ 90� and 150� are compared. Since in each
case two cracks grow while the two crack lengthsremain equal: la ¼ lb, only la is plotted in Fig. 5.The difference in the crack lengths of two cases is
small at t ¼ 0, but it increases with increasing time.At the initial stage of crack growth, the interaction
effect is small because of the short length of the
cracks. As the crack lengths increase, the interac-
tion effect becomes large; accordingly, the differ-
ence in the crack lengths due to the locationbecomes large.
Fig. 5. A example solution of the proposed model. Comparison of time history of crack length la for different crack location: /ab ¼ 90�and 150� (V0 ¼ 0:5 10�3 m/s at K0 ¼ KIc. See Table 1 for other parameters).
Table 1
Parameter sets for estimation of creep failure time for Barre
granite
Fracture toughness, KIc (MPam1=2) 1.2
Initial defect half length, c0 (lm) 80
Nondimensional distance between
two cracks, d=c01.5
Coefficient of friction, l 0.3
Initial defect angle, h (�) 45
Angle between crack a and crack b,/ab (�)
150
Subcritical crack growth index, n 30 and 40
Crack velocity at KI ¼ KIc, V0 (m/s) 0:5 10�3 (pc ¼ 0MPa) and 0:5 10�6(pc ¼ 50 MPa)
592 K. Miura et al. / Mechanics of Materials 35 (2003) 587–601

In the case of /ab ¼ 90�, almost no crack
growth is observed subsequently to rapid increase
in the crack length just after t ¼ 0. For the presentcrack model shown in Fig. 1(b), the SIF at the
crack tip decreases with increasing crack length
under a constant stress state as mentioned before.
This results in transition from primary to second-
ary creep. On the other hand, in the case of/ab ¼ 150�, the cracks grow at a constant velocity,and finally the velocity reaches infinity. The even-
tual rapid increase in the crack length can be in-
terpreted as creep failure subsequently to tertiary
creep.
Fig. 6 shows the relationship between the non-
dimensional SIF KIa=KIc and the nondimensionalcrack length la=c0 of crack a under the same con-dition as case /ab ¼ 150� of Fig. 5 along with twoincreased stress states: jr22=r0j ¼ 3:32 and 2.00. Inthis figure, short-term crack growth takes place
along KIa=KIc ¼ 1, while subcritical crack growthoccurs in the region KIa=KIc < 1. The subcriticalcrack growth starts from point A, moves through
point B, and ends at point C. If the applied com-
pressive stress in a creep test increases to jr22=r0j ¼2:00, then short-term crack growth from point A
to point D takes place, and the time to failure
becomes shorter than that in the original loading
case. Furthermore, the applied stress attains
jr22=r0j ¼ 3:32, the starting point coincides with
the end point at point E. This leads to tf ¼ 0, andhence the applied stress proves to be strength in
short-term loading.
In order to illustrate anisotropy in the interac-
tion effect, the logarithms of times to failure tf inseconds are plotted in Fig. 7 for different /ab
keeping the same distance between two cracks:
d=c0 ¼ 1:5. In the analysis, the time to failureis defined as the time when the SIF attains the
0.2 0.4 0.6 0.8 1 1.2 1.4
0.2
0.4
0.6
0.8
1
Nondim. crack length lα/c0
Non
dim
. SIF
K
Iα/K
Ic
|σ22/σ0|= 3.32 2.00 1.06
Subcritical crack growth
Short-term crack growtht=tft=0
A
B
CD E
Fig. 6. Relationship between nondimensional SIF and nondimensional crack length for three stress states.
11 12 13 14 15φαβ=90˚
120˚
150˚
180˚
Log(tf) [sec]
Fig. 7. Logarithm of failure time tf as a function of /ab with a
constant crack distance d=c0 ¼ 1:5.
K. Miura et al. / Mechanics of Materials 35 (2003) 587–601 593
fracture toughness after tertiary creep. The time to
failure is minimized when the cracks are aligned in
the direction of about /ab ¼ 145–150�.In actual rock, numerous microcracks exist, and
grow under long-term loading. Owing to the in-
teraction effect, growth of microcracks in someregions is accelerated; coalescence of those micro-
cracks results in a macroscopic failure plane. This
localization of microcracking governs macroscopic
failure. Kranz (1980) reported the fracture angle,
which is the angle between a macroscopic failure
plane and the direction of the maximum com-
pressive stress, in creep tests as well as conven-
tional short-term triaxial tests of Barre granite. Itwas shown that the fracture angle decreases in
terms of /ab with increasing confining pressure.
The values of the fracture angle observed in the
experiment ranged from 145� to 165�. These valuesroughly agree with /ab ¼ 150� that gives the mini-mum failure time in the theoretical model. Hence,
in the following analyses, we use /ab ¼ 150� forthe arrangement of two cracks.
6. Parametric study on short-term strength and
creep failure time
In this section, after reviewing model para-
meters, we investigate the effects of the model
parameters on short-term strengths and times tofailure in creep tests. On the basis of this para-
metric study, we identify the model parameters to
fit short-term strengths and times to failure of
Barre granite reported by Kranz (1980). Finally,
we shall discuss the predictive capability of the
present model.
The parameters used in the model are:
• c0: the half length of the initial defect. Kranz(1980) reported the average crack length of
Barre granite in a uniaxial creep test. The re-
ported values of the average crack length ran-
ged from 54 lm for an unstressed sample to
164 lm for a sample at tertiary creep.
• d: the distance between two cracks. It representsthe density of microcracks in actual rock.
• l: the coefficient of friction on an initial defect.It has a value between 0 and 1.
• /ab: the angle between two cracks. According to
the discussion on Fig. 5, we use /ab ¼ 150�,which gives the minimum time to failure.
• h: the orientation of initial defects. Okui andHorii (1997) conducted a parametric study toexamine the effect of variation of h on the
short-term strength by using IFT. It was shown
that h ¼ 45� gives the minimum short-term
strength. Hence, h ¼ 45� is used.• KIc: the fracture toughness. The reported valuesof KIc of Barre granite lie between 0.74 and 1.5MPam1=2 (Atkinson, 1984). We use KIc ¼ 1:2MPam1=2.
• n: the subcritical crack growth index. No dataare available for Barre granite whereas values
of n for Westerly granite in air at a temperatureof 20 �C range from 31.2 to 39 (Meredith and
Atkinson, 1985). We use n ¼ 30 for Barre gran-ite at room temperature.
• V0: the crack velocity in subcritical crack growthat KI ¼ K0. In many cases, V0 values are evalu-ated from relaxation tests with a double torsion
specimen. Reported values of V0 considerablyscatter depending on the initial value of KI ineach relaxation test, for example V0 ¼ 4:5 10�9 to 1:0 10�8 m/s at KI ¼ 1:0 MPam1=2
(Atkinson, 1984), and V0 ¼ 1:0 10�7 to 1:8 10�4 m/s at KI ¼ 1:26 MPam1=2 (Swanson,
1984) for Westerly granite.
In the above model parameters, the subcritical
crack growth index n and V0 affect only long-termbehavior, while the other undetermined parame-
ters such as c0, l, and d influence both short- andlong-term behavior. First, we investigate the effect
of parameters c0, l, and d on short-term strength,and then examine the effect of the subcritical crackgrowth index n and V0 on the long-term behavior.Fig. 8 show the effect of c0, l, and d on nu-
merical short-term strength respectively. The ex-
perimental data of Barre granite reported by
Kranz are also plotted in these figures. These ex-
periments were conducted at room temperature
under dry condition. Table 1 shows the values of
the model parameters that give the best fit result.For the parametric study displayed in Fig. 8, we
used the values listed in Table 1, unless otherwise
indicated explicitly.
594 K. Miura et al. / Mechanics of Materials 35 (2003) 587–601

Among theoretical short-term strengths shown
in Fig. 8, the strength with c0 ¼ 40 lm, l ¼ 0:3,and d=c0 ¼ 1:5 is in best agreement with the ex-perimental data for confining pressures of 20–100
MPa. However, despite employing these best fitparameters, theoretical short-term strengths devi-
ate from the experimental ones with the increase
of confining pressure. This is ascribable to brittle-
ductile transition of macroscopic failure mode.
While the confining pressure is small, mode I crack
growth is dominant; almost all cracks are parallel
to the direction of the maximum compression. As
the confining pressure increases, mode II crackgrowth with frictional sliding becomes important.
In the range of confining pressure less than about
50 MPa, however, it seems possible to use the
present model to prediction of short-term strength
as shown in Fig. 9.
Next, we proceed to examine the effects of thesubcritical crack growth index n and V0 on time tofailure in creep tests. Fig. 10 shows a comparison
of time to failure with experimental data reported
by Kranz (1980) for uniaxial stress state pc ¼ 0 anda confining pressure of pc ¼ 53 MPa. The hori-zontal axes denote the normalized stress difference,
in which r1 is the axial compression stress appliedin a creep test, and the denominator ðr1 � pcÞmax isthe maximum stress difference obtained from a
Fig. 8. Comparison of short-term strength with experimental data of Barre granite by Kranz (1980); (a) effect of initial defect length,
(b) effect of friction coefficient, and (c) effect of crack distance on short-term strength.
K. Miura et al. / Mechanics of Materials 35 (2003) 587–601 595

short-term fracture test. In numerical analyses,
two values of the subcritical crack growth index nare used, namely 30 and 40, which approximately
correspond to the minimum and maximum values
observed in experiments of Westerly granite
(Meredith and Atkinson, 1985).
Since t0 ¼ c0=V0 is a reference time for the pre-sent formulation, if the value of V0 is doubled withkeeping c0 constant then the time to failure ishalved. The values of V0 used in Fig. 10 are de-
termined by fitting the numerical results to experi-
mental ones. Thus, the value of V0 required to fitexperimental data depends on confining pressure.
Variation of V0 with pressure has been observedin experiments as well. Meredith and Atkinson
(1985) conducted a series of subcritical crackgrowth tests of Westerly granite and Black gabbro
under water vapor pressures. They reported that
increasing water vapor pressures from 0.6 to 15
kPa results in approximately 30 times higher crack
growth rate for Westerly granite at room tem-
perature. However, the present numerical results
show an opposite tendency for the dependence of
V0 on confining pressure: the best-fit values of V0decrease with increasing confining pressure. One
possible explanation for this discrepancy is that,
for triaxial compression tests, increasing confining
pressure decreases crack opening inside specimens
and hence delays stress corrosion crack propaga-
tion by hindering the access of reactive species to
crack tips. On the other hand, for subcritical crack
growth tests with a double torsion specimen, watervapor pressure applies directly to the crack tip in
the specimen without any obstacles, and hence
reactive species are injected into the newly created
crack tip as the stress corrosion crack propagates.
However, since the range of water vapor pressures
used in tests by Meredith and Atkinson (1985) is
considerably smaller than the confining pressure in
0
100
200
300
400
500
0 10 20 30 40 50
Exp. [Kranz, 1980]
Present modelStr
ess
diffe
renc
e (M
Pa)
Confining Pressure (MPa)
Short-term fracture testBarre granite
Fig. 9. Close-up view of comparison of short-term strength
with best-fit parameters.
Fig. 10. Creep failure time vs. normalized stress difference: (a) uniaxial compression case pc ¼ 0; and (b) confining pressure pc ¼ 53MPa. (r1 � pc) is the stress difference at creep test; ðr1 � pcÞmax is the maximum stress difference at short-term test. Experimental datafrom Kranz (1980).
596 K. Miura et al. / Mechanics of Materials 35 (2003) 587–601

creep tests by Kranz (1980), subcritical crack
growth data under higher confining pressures are
necessary to clarify the influence of pressure on
subcritical crack growth.
7. Effects of temperature and water
Lajtai et al. (1987) conducted a series of me-
chanical tests on Lac du Bonnet granite, including
conventional short-term uniaxial compression
tests, fracture toughness tests, uniaxial creep tests,
and subcritical crack growth tests. These tests were
carried out under three environmental conditions:room temperature and humidity (designated here
as ‘‘dry 25 �C’’), room temperature with the
specimen saturated with water (wet 25 �C), and at90 �C with the specimen in water (wet 90 �C). Theyverified that creep accelerates, subcritical crack
growth index n decreases and V0 increases, whenthe specimen is under the wet 90 �C condition ascompared with the dry 25 �C condition. In this
section, we simulate these creep tests to investigate
the ability of the present model to predict envi-
ronmental effects.
First, we use the reported average values of
uniaxial strength and fracture toughness under the
dry 25 �C condition for analysis of creep tests
under the three environments. We neglect the ef-fects of environments on these parameters, because
Fig. 11. Creep failure time vs. uniaxial stress under different conditions; (a) dry 25 �C, (b) wet 25 �C, and (c) wet 90 �C.
K. Miura et al. / Mechanics of Materials 35 (2003) 587–601 597

the reduction in these parameters due to temper-
ature increase and introduction of water is less
than 5% (Lajtai et al., 1987). Second, initial defect
length c0, friction coefficient l, and distance be-tween cracks d are determined to fit the averageuniaxial strength of 225 MPa reported by Lajtaiet al. (1987). Experimental data on compressive
strength under different confining pressures are not
available. The values of these three parameters are
somewhat arbitrary, since we may have other
combinations of these parameters to fit the uni-
axial strength.
Times to failure in creep tests under the three
environments are calculated using the values of nand V0 obtained by subcritical crack growth tests,and compared with creep test results as shown in
Fig. 11. The parameters used in the analysis are
listed in Table 2. In Fig. 11, the horizontal axis
represents the stress applied in a creep test r1 afternormalization by uniaxial compression strength
rmax. The solid line in each figure indicates creepfailure time when the value of V0 obtained bysubcritical crack growth tests is used. Test results
are well reflected when the value of V0 is changedby several orders of magnitude. Such uncertainty
of V0 has been reported by Lajtai et al. (1987) andby Atkinson (1984).
In a subcritical crack growth test, a load is ap-
plied to a specimen so that the SIF at the crack tip
may be held below the fracture toughness. Lajtai
et al. (1987) pointed out that the value of V0 variesdepending on the initial SIF in a subcritical crack
growth test. Hence, they reported values of V0 lis-ted in Table 2 as approximated values with the
same initial SIF of about 2.27 MPam1=2. On the
other hand, Atkinson (1984) explained that a fac-
Table 2
Parameter sets for estimation of creep failure time for Lac du
Bonnet granite
Fracture toughness,� KIc(MPam1=2)
2.46
Initial defect half length, c0 (lm) 300
Nondimensional distance between
two cracks, d=c01.4
Coefficient of friction, l 0.2
Initial defect angle, h (�) 45
Angle between crack aand crack b, /ab (�)
150
Subcritical crack
growth index,� n96 (dry 25 �C); 54 (wet25 �C); 23 (wet 90 �C)
Crack velocity at KI ¼ 1:0MPam1=2,� V0 (m/s)
1:82 10�35 (dry 25�C); 5:90 10�25 (wet25 �C); 6:97 10�12(wet 90 �C)
*Data from Lajtai et al. (1987).
0 0.025 0.05 0.075 0.1 0.125 0.15Confining pressure Uniaxial strength
0.2
0.3
0.4
0.5
0.6
0.7
0.8
0.9
Axi
alst
ress
/ Uni
axia
lstr
engt
h
LDB granite, Dry 25o C
Uniaxial strength = 225 MPa
106104
100
108 yr
1
/
(a) Dry 25 ºC
0 0.025 0.05 0.075 0.1 0.125 0.15Confining pressure/Uniaxial strength
0.2
0.3
0.4
0.5
0.6
0.7
0.8
0.9
Axi
alst
ress
/Uni
axia
lstr
engt
h
LDB granite, Wet 90o C
Uniaxial strength = 225 MPa
108 yr106
104
100
1 yr
(b) Wet 90ºC
Fig. 12. Creep failure time under different stress conditions for
Lac du Bonnet granite; (a) dry 25 �C, (b) wet 90 �C.
598 K. Miura et al. / Mechanics of Materials 35 (2003) 587–601

tor significantly affecting V0 is not fully controlledin tests although the factor remains unknown. For
candidate factors, the specimen size, the shape of
groove in the specimen, and the effect of loading
method such as load relaxation are reviewed. In
conclusion, none of the candidates can immedi-ately explain uncertainty. Some basic problems
may be involved.
Finally, creep failure time is calculated for each
stress state using the identified parameters as
shown in Fig. 12. It is very important to assess the
creep failure times under different stress states and
environmental conditions, as we examine long-
term stability of facilities for radioactive waste.The assumption confirmed in the previous section
that the value of V0 would decrease with increas-ing confining pressure was ignored as being con-
servative because no relevant test results were
available. The value of V0 is determined so thatagreement can be achieved with the creep test re-
sults shown in Fig. 11. It is evident that creep
failure time accelerated owing to the effects ofwater and temperature, and thus contours shifted
rightward. Temperature and water have substan-
tial influence on creep failure time.
8. Some considerations for heated failure test
conducted by AECL
AECL conducted heated failure tests (HFT) in
the URL at a depth of 420 m below ground level
from 1993 to 1996 (Read et al., 1997). The effects
of thermal loading on progressive failure and on
excavation damage development were investi-
gated. In this study, the observed breakout phe-
nomena and reported results of stress analysis for
the observation borehole HFT1 in stage 1 are in-vestigated. The borehole HFT1 was drilled prior
to heating the rock mass. The temperature was
raised up to 85 �C. Fig. 13 shows breakouts ob-served in the borehole HFT1. Fig. 14 shows the
depths of the borehole bottom and the ends (top
and bottom) of the observed breakouts. When the
borehole was drilled up to 1.95 m, the SW break-
out was initiated at a depth of 1.90 m. On the otherhand, the NE breakout started at a depth of 1.45
m when the borehole was drilled completely up to
4.15 m. The NE breakout gradually expanded
before heating, and accelerated when the temper-
ature was raised. After the temperature reached
50 �C, the SW borehole started to expand. When
the target temperature of 85 �C was reached, bothbreakouts expanded from about 1 to 3 m.Here we consider the state of a depth of 3.0 m,
where the breakout was not observed before the
temperature was raised up to 68 �C. AECL carriedout the thermal–mechanical analysis with finite
difference and boundary element methods. The
stress state near the borehole surface where the
breakout occurs is under uniaxial compression.
The values of the maximum compressive stress atNE and SW breakouts at the depth of 3.0 m were
read from the report figures, and are shown in
Table 3. Time to failure is computed by the
method presented in previous sections for the
condition of the HFT. Table 4 shows the com-
puted time to failure under uniaxial compression
Fig. 13. Breakouts in Borehole HFT; (a) NE breakout, (b) SW
breakout. Courtesy of Ontario Power Generation Inc.
K. Miura et al. / Mechanics of Materials 35 (2003) 587–601 599

with axial stresses of 160, 170, 180, and 190 MPafor wet 25 �C and wet 90 �C. In this calculation, weuse the parameters for Lac du Bonnet granite lis-
ted in Table 2 except for V0. For values of V0, weuse V0 ¼ 5:90 10�24 and 6:97 10�12 m/s for wet25 �C and wet 90 �C, respectively on the basis offitting times to failure to the experimental results
as shown in Fig. 11.
The effect of heating is understood to increasethe axial stress due to thermal expansion and to
accelerate the creep phenomena. When the axial
stress is high and close to the compressive strength,
the creep failure time is short and the effect of
temperature is small. On the other hand, the
temperature effect is remarkable when the axial
stress is relatively low.
The axial stress in the heating failure test is highand close to the compressive strength. Hence the
comparison between the observed phenomena and
results of the current creep analysis does not pro-
vide characteristic information. However, if the
test was conducted with smaller axial stress, it is
possible to have a situation in which the breakout
cannot be explained unless the creep law at the
increased temperature is used. For example, withan axial stress of 150 MPa, the creep failure time
is 221 days at 25 �C, while it is only 3.2 hours at90 �C. If tests similar to HFT are planned, suchconditions are recommended by the present study
to validate the approach presented in this study.
9. Concluding remarks
A simple mechanism-based model has been
proposed to estimate creep failure of hard rocks
under compression. In the proposed model, both
Fig. 14. Breakout advance and temperature for Borehole HFT1 with time in AECL�s HFT. Depth of hole bottom, terminuses ofbreakouts, and temperature vs. time. Data from Read et al. (1997).
Table 3
Effect of thermal loading on the maximum compressive stress
on NE and SW sides of borehole HFT1 at a depth of 3.0 m in
Stage 1
Temperature (�C) Stress (MPa)
NE side SW side
15 171 169
32.5 176 173
50 181 181
67.5 186 184
85 191 188
Table 4
Failure time under different stress conditions
Stress (MPa) Creep failure time
Wet 25 �C Wet 90 �C
150 221 days 3.2 h
160 6.7 days 44 min
170 6.1 h 11 min
180 17 min 2.9 min
190 53 s 50 s
600 K. Miura et al. / Mechanics of Materials 35 (2003) 587–601
instantaneous and time-dependent crack growth
are taken into account. Subcritical crack growth
due to stress corrosion and crack interaction are
considered to be the main mechanism of time-
dependent behavior in steady state creep and in
tertiary creep, respectively. It is found that creepfailure time under different stress states can be
calculated by the present model. Furthermore, the
effects of water and elevated temperature on creep
acceleration are also considered in the model.
For safety evaluation of high-level waste re-
positories, it is necessary to predict creep beha-
vior over a period on the order of 10,000 years.
Although the model presented here capturesseveral essential features of creep failure of hard
rocks, the predicted results largely depend on
parameters used in the calculation. In particular,
parameters for subcritical crack growth (n andV0) are crucial for prediction of failure times. Inorder to improve the reliability of the model results,
experiments are necessary to investigate subcriti-
cal crack growth under high confining pressure,and to clarify the cause of uncertainty in sub-
critical crack tests.
References
Atkinson, B.K., 1984. Subcritical crack growth in geological
materials. J. Geophys. Res. 89, 4077–4114.
Atkinson, B.K., Meredith, P.G., 1981. Stress corrosion crack-
ing of quartz: a note on the influence of chemical environ-
ment. Tectonophysics 77, 1–11.
Atkinson, B.K., Meredith, P.G., 1987. The Theory of Subcri-
tical Crack Growth with Applications to Minerals and
Rocks. In: Fracture Mechanics of Rocks. Academic Press.,
pp. 111–166.
Brace, W.F., Bombolakis, E.G., 1963. A note on brittle crack
growth in compression. J. Geophys. Res 68 (12), 3709–
3713.
Cristescu, N.D., Hunsche, U., 1998. Time-Effects in Rock
Mechanics. Wiley, England.
Horii, H., Nemat-Nasser, S., 1985a. Compression-induced
microcrack growth in brittle solid: axial splitting and shear
failure. J. Geophys. Res 90, 3105–3125.
Horii, H., Nemat-Nasser, S., 1985b. Elastic fields of interacting
inhomogeneities. Int. J. Solids Struct. 21, 731–745.
Horii, H., Nemat-Nasser, S., 1986. Brittle failure in compres-
sion: Splitting, faulting and brittle–ductile transition. Philos.
Trans. R. Soc. Lond., A 319, 337–374.
Japan Nuclear Cycle Development Institute, 1999. H12 project
to establish the scientific and technical basis for HLW
disposal in Japan, H12 project overview report.
Kranz, R.L., 1979. Crack Growth and Development During
Creep of Barre Granite. Int. J. Rock Mech. Min. Sci.
Geomech. Abstr. 16, 23–35.
Kranz, R.L., 1980. The effect of confining pressure and stress
difference on static fatigue of granite. J. Geophys. Res. 85
(B4), 1854–1866.
Lajtai, E.Z., Schmidtke, R.H., Bielus, L.P., 1987. The effect of
water on the time-dependent deformation and fracture of
a granite. Int. J. Rock Mech. Min. Sci. Geomech. Abstr.
24 (4), 247–255.
Meredith, P.G., Atkinson, B.K., 1985. Fracture toughness and
subcritical crack growth during high-temperature tensile
deformation of Westerly granite and black gabbro. Phys.
Earth Planet. Interior. 39, 33–51.
Nemat-Nasser, S., Obata, M., 1988. A microcrack model of
dilatancy in brittle materials. J. Appl. Mech. 55, 24–35.
Okui, Y., Horii, H., Akiyama, N., 1993. A continuum theory
for solids containing microdefects. Int. J. Eng. Sci. 31 (5),
735–749.
Okui, Y., Horii, H., 1997. Stress and time-dependent failure of
brittle rocks under compression: a theoretical prediction.
J. Geophys. Res. 102 (B7), 14869–14881.
Read, R.S., Martino, J.B., Dzik, E.J., Oliver, S., Falls, S.,
Young, 1997. R.P., Analysis and interpretation of AECL�sheated failure tests, Report no. 06819-REP-01200-0070
R00, Atomic Energy of Canada Limited.
Swanson, P.L., 1984. Subcritical crack growth and other time-
and environment-dependent behavior in crustal rocks.
J. Geophys. Res. 89, 4137–4152.
US Department of Energy, 1998. Office of Civilian Radioactive
Waste Management, Yucca Mountain Site Characterization
Office, Viability Assessment of a Repository at Yucca
Mountain.
Wilkins, B.J.S, Reich, A.R., 1984. Wallace W.R., Slow micro-
cracking in plutonic rocks, TR-264, Atomic Energy of
Canada Limited.
K. Miura et al. / Mechanics of Materials 35 (2003) 587–601 601