active fault creep variations at chihshang, taiwan, revealed by creep meter monitoring, 1998–2001
TRANSCRIPT

Active fault creep variations at Chihshang, Taiwan, revealed by
creep meter monitoring, 1998–2001
Jian-Cheng Lee,1 Jacques Angelier,2 Hao-Tsu Chu,3 Jyr-Ching Hu,4 Fu-Shu Jeng,5
and Ruey-Juin Rau6
Received 7 January 2003; revised 25 August 2003; accepted 4 September 2003; published 15 November 2003.
[1] The daily creep meter data recorded at Chihshang in 1998–2001 are presented. TheChihshang creep meter experiment was set up across the Chihshang thrust fault, the mostactive segment of the Longitudinal Valley Fault, which is the present-day plate suturebetween the Eurasian and the Philippine Sea plates in eastern Taiwan. Near-continuousdata recording at two sites revealed different surface fault motions yet similar annualshortening rates: 16.2 mm at the Tapo site (comprising two connected creep meters) and15.0 mm at the Chinyuan site (three creep meters straddling parallel fault branches). Fourof the five creep meters showed a seasonal variation, with the fault moving steadily duringthe rainy season from April to October, and remaining quiescent during the rest of theyear. The only exception was recorded by the creep meter located on a melange-composedhillslope, where local gravitational landsliding played an additional role other thantectonic faulting. Through comparison with daily precipitation data, we inferred thatmoderate rainfall suffices to trigger or facilitate slippage on the surface fault, during thetransition period of the dry/wet season. During the observation period from 1998 to 2001,the subsurface seismicity exhibited clusters of microearthquakes on the Chihshang Fault atdepths of 10–25 km. Recurrent earthquakes occurred regardless of whether the seasonwas wet or dry, indicating that the stress relaxation associated with seismicity in theseismogenic zone did not transfer immediately up to the surface. The accumulated strainon the Chihshang Fault at shallow surface levels was released through creep during thewet season. In addition to these short-term seasonal variations, an apparent decrease in theannual slipping rate on the Chihshang Fault during the last few years deserves furtherinvestigation in order to mitigate against seismic hazard. INDEX TERMS: 1206 Geodesy and
Gravity: Crustal movements—interplate (8155); 7223 Seismology: Seismic hazard assessment and prediction;
8102 Tectonophysics: Continental contractional orogenic belts; 8107 Tectonophysics: Continental
neotectonics; 8150 Tectonophysics: Plate boundary—general (3040); KEYWORDS: active fault, creep meter,
creep, seasonal variation, Taiwan
Citation: Lee, J.-C., J. Angelier, H.-T. Chu, J.-C. Hu, F.-S. Jeng, and R.-J. Rau, Active fault creep variations at Chihshang, Taiwan,
revealed by creep meter monitoring, 1998–2001, J. Geophys. Res., 108(B11), 2528, doi:10.1029/2003JB002394, 2003.
1. Introduction
[2] The Chihshang Fault, located in eastern Taiwan, is a20-km-long segment of the Longitudinal Valley Fault (LVF)(Figure 1), a plate-suture boundary fault between theEurasian continental margin and the Philippine Sea Plate.It has been undergoing rapid creep motion with a rate of
about 20–30 mm/yr at least for the last 16 years (1985–2001) in the absence of major earthquakes. The creepmotion across the Chihshang Fault has been measured bytechniques on different scales of time and space. Thesetechniques included geodetic distance measurements(EDM) within trilateration networks [Yu and Liu, 1989; Yuet al., 1990], displacement kinematic analysis in outcropsand cultural features [Chu et al., 1994; Lee, 1994; Angelieret al., 1997, 2000], records of creep meters straddling thefault [Lee et al., 2000, 2001], and global positioning system(GPS) measurements [Yu et al., 1997b; Yu and Kuo, 2001].In the early stage, based on annual surveys, a rather steadycreeping rate was identified along the Chihshang Fault.More recently, the accumulated data from more frequentsurveys, together with biannual in-site measurements andespecially the daily creep meter measurements discussedherein, revealed a seasonal variation in the creep activity ofthe Chihshang Fault. We present and discuss the new creep
JOURNAL OF GEOPHYSICAL RESEARCH, VOL. 108, NO. B11, 2528, doi:10.1029/2003JB002394, 2003
1Institute of Earth Sciences, Academia Sinica, Taipei, Taiwan.2Seismology and Tectonophysics, European Space Agency 7072,
University of Pierre and Marie Curie, Paris, France.3Central Geological Survey, Taipei, Taiwan.4Department of Geosciences, National Taiwan University, Taipei,
Taiwan.5Department of Civil Engineering, National Taiwan University, Taipei,
Taiwan.6Department of Earth Sciences, National Cheng-Kung University,
Tainan, Taiwan.
Copyright 2003 by the American Geophysical Union.0148-0227/03/2003JB002394$09.00
ETG 4 - 1

data, in order to better understand the slip behavior in thisactive segment of the Longitudinal Valley Fault.[3] The Longitudinal Valley Fault is a plate-boundary
fault created by the oblique convergence between theEurasian and Philippine Sea plates. Around the Taiwanarea, this oblique plate convergence began about 5–7 Myrago and is still ongoing at the present time [Ho, 1975, 1986;Suppe, 1981; Tsai, 1986; Kao et al., 2000]. The presentplate convergence occurs in Taiwan in the NW-SE directionat a shortening rate of 85 mm/yr as revealed by the recentGPS measurements across the 200-km-wide island [Yu etal., 1997b]. Although this shortening is widespread acrossthe Taiwan collision zone, most of it is accommodated inseveral well-identified major deformation zones within theisland. For instance, about one fourth to one third of thetotal convergence rate, amounting to 20–30 mm/yr, isabsorbed across the plate suture of the 150-km-long Lon-gitudinal Valley. At present, earthquake activity is quitehigh to the north of the Longitudinal Valley (the northern tipof the Philippine Sea Plate), where the regional structure iscomplex. In contrast, earthquake activity is relatively mod-
erate in the middle and southern portions of the Longitudi-nal Valley, including the Chihshang area (i.e., the study areain this paper). During the last century, two historic majorearthquakes struck the Longitudinal Valley area. The largestearthquakes of the 1951 sequence had magnitudes 7.1, 6.2,6.9, and 5.4 and occurred from north to south along thevalley in a time span of 1 month [Taiwan Weather Bureau,1952]; and the 1972 Juisui earthquake of magnitude 6.8occurred in the middle of the valley. Significant surfaceruptures occurred along the Longitudinal Valley Fault atseveral places during the events. There is therefore a greatconcern for seismic hazard along the Longitudinal Valley,considering its historic record and the present high short-ening rate.[4] The Longitudinal Valley Fault also provides a good
opportunity for studying on-land plate-suture thrusts with arapid shortening rate. Along the well-studied San AndreasFault system in California, rapid displacement rates aremostly accommodated on several strike-slip faults, forinstance, 14–17 mm/yr of dextral-lateral movement on theCalaveras Fault [Galehouse, 1995], 4–5 mm/yr dextral
Figure 1. (a) Tectonic setting of Taiwan. (b) General geology of the Coastal Range. The Coastal Rangeis thrust over the Longitudinal Valley and the Central Range along the active Longitudinal Valley Fault(LVF, thick line with triangles). (c) General geology in the Chihshang area. Geological units of theCoastal Range: 1, Touluanshan Formation; 2, Takangkou Formation; 3, Lichi Melange; and 4, Quaternaryterrace. The Chihshang Fault is situated on the western margin of the Coastal Range. The two starsindicate the sites of creep meters. Three dots indicate the site of cultural feature measurements.(d) General cross section of the Longitudinal Valley at Chihshang.
ETG 4 - 2 LEE ET AL.: CHIHSHANG CREEP VARIATIONS

creep on the Hayward Fault [Lienkaemper et al., 2001], and21.3 mm/yr of right-lateral slip on the San Andreas Fault atParkfield [Langbein et al., 1990; Roeloffs, 2001]. However,there is little documentation of high creep rate thrust faultsin the literature. As one of the most active segments of theLongitudinal Valley Fault, the Chihshang Fault provides akey to understand the slip behavior of thrust faults (althoughwith some strike-slip components) in a plate suture, espe-cially in terms of creep activity and its relationship withseismicity.[5] The seasonal variations in creep rate deserve partic-
ular attention, as they may introduce bias in estimatesobtained for periods lasting from days to months. Throughcomparisons between meteorological data and creep mea-surements, we will show that the effect of seasonal precip-itation is a first-order factor in explaining the near-surfaceslip seasonal variations. The influence of lithology atshallow crustal levels also deserves consideration. In thefollowing sections, we begin by summarizing the geologicaland structural setting of the Chihshang Fault and its generalfeatures of surface rupturing and creeping. We then presentand describe our measurements and analysis of the 1998–2001 data obtained from the creep meters across theChihshang Fault, which requires a brief presentation ofthe instruments and their deployment. On the basis of thesedata, we characterize and quantify the creep variations,including the seasonal rainfall effect, and discuss the pos-sible causes. Then we touch upon the local effect of thegravitational landslide at one site. We will also discuss therelationship between the shallow crust level near-surfacecreep and the deeper subsurface seismic activity, whichexhibits a decoupled behavior on the Chihshang Fault at thedifferent crustal levels.
2. Geological and Structural Setting of theActive Chihshang Fault
[6] The NNE-trending Chihshang Fault is located in themiddle southern portion of the Longitudinal Valley(Figure 1b). The pre-Tertiary metamorphic basement ofthe Chinese continental margin and the overlying Mioceneslate (the Central Range) crop out to the west of the valley,and the Miocene volcanic arc and the overlying Plio-Pleistocene forearc turbidities and melange (the CoastalRange) are exposed to the east [Hsu, 1976; Teng and Wang,1981]. The Longitudinal Valley, situated between these tworanges with a remarkable physiographic linear expression, iscovered by Holocene recent alluvium deposits.[7] Geologically, the Chihshang Fault represents a major
boundary, along which the Coastal Range is thrust west-ward over the Longitudinal Valley and the Central Range(Figure 1d). At one outcrop near Fuli, a vertical exposureclearly reveals this structural pattern: the Lichi Melange ofthe Coastal Range is thrust with a left-lateral strike-slipcomponent at a high dip angle, about 60�, onto the recentfluvial deposits of the Longitudinal Valley [Angelier et al.,2000]. In the present paper we paid particular attention tothe central segment of the Chihshang Fault (Figure 1c),where studies of the fault displacement have been doneduring the last 10 years on a yearly or twice-a-year basis[Chu et al., 1994; Lee, 1994; Angelier et al., 1997, 2000].The surface trace of the Chihshang Fault closely follows
the geomorphic escarpment that bounds the Coastal Rangeto the east. Furthermore, a large sag pond situated in thevalley near the Chihshang town, immediately west of theChihshang Fault (Figure 1c), also illustrates a typicalgeomorphic feature in the footwall of an active reversefault, with a marked footwall subsidence close to the faultline.
3. Active Movement of the Chihshang Fault
[8] The Chihshang Fault ruptured during the 1951 M6.2(or more likely minutes later M6.8) earthquake and pro-duced surface breaks with scarps tens of centimeters highextending for tens of kilometers [Hsu, 1955; Bonilla, 1975;Cheng et al., 1996; Yu et al., 1997a; Chung et al., 2002].Later, this fault showed clear evidence of active creep at thesurface, at least during the last 20 years, when scientificobservations were made. The surface creep on the Chih-shang Fault may have occurred earlier but was not recog-nized until the observations by Barrier and Chu [1984] onthe retaining wall near the Tapo village. It generatednumerous ruptures and surface breaks, mainly along the1951 historical earthquake surface fault trace. Differentkinds of deformation structures have been observed inculture features, such as fractures and offsets in concretewalls, pressure ridges on top of concrete surfaces, tiltedwater wells, and so on. In particular, not only did the thrust-type fractures in the concrete retaining walls of large waterchannels reveal compressive deformation structures but theyalso allowed quantification of the fault movement [Chu etal., 1994; Lee, 1994; Angelier et al., 1997]. Annual surveysincluding fault slip quantification were performed since theearly 1990s and showed displacements with a rather steadyannual slip rate on the surface ruptures of the ChihshangFault. The shortening concentrated inside a 30–120 m widefault zone (deformation zone) at an estimated rate of 2–3 cm/yr and was accommodated by one or up to threebranches of oblique reverse faults depending on the locality[Angelier et al., 1997, 2000].[9] Different regional-scale instrumental measurements
across the Chihshang Fault have been performed duringthe past 15 years, including trilateration networks, leveling,and GPS measurements. The first systematic geodeticmeasurement across the Longitudinal Valley was done inthe ‘‘Chihshang trilateration network,’’ which included11 stations deployed during the period 1985–1988 [Yu andLiu, 1989] (Figure 2a). Surveys were carried out annuallywithin this network and similar ones to the north and to thesouth (Figure 2a). At the same time, a leveling survey lineacross the valley was also carried out. Significant horizontalshortening and vertical movement were thus documentedacross the Chihshang Fault [Yu and Liu, 1989; Yu et al.,1990]. Later on, Lee and Angelier [1993] showed thatthese geodetic data were consistent with a rigid block modelof reverse faulting with minor left-lateral component ontheChihshang Fault. According to this reconstruction, theCoastal Range was moving at a rate of 20 mm/yr in theN321�E direction with respect to the Longitudinal Valley inthe Chihshang area (Figure 3). The annually surveyed GPSmeasurements during the last 10 years (1992–1999) indi-cated a higher rate of convergence [Yu and Kuo, 2001], with31mm/yr shortening across the Longitudinal Valley based on
LEE ET AL.: CHIHSHANG CREEP VARIATIONS ETG 4 - 3

consideration of neighboring stations on both sides of thevalley near Chihshang (Figure 2b).[10] Both the above cultural feature measurements and
regional-scale geodetic measurements consistently revealedthe active creeping Chihshang Fault moving at a rapidsteady rate, about 2–3 cm/yr during the past 15 years.However, detailed creep data did not become available untilthe recent installation of creep meters. Five rod-type creepmeters were installed straddling the surface traces of theChihshang Fault in 1998 [Lee et al., 2000]. The results ofthe first year of measurements with these five creep metersshowed a 19.4- and 17.3-mm shortening at the two sites,Tapo and Chinyuan, respectively (Figure 4). The studyduring the first year also revealed that the preliminaryresults were consistent with other measurements, and thecreep meters could be considered reliable and robust [Lee etal., 2001]. In the present paper, we show and discuss thecreep meter data obtained during the 1998–2001 period,which are more representative than those solely from thefirst year and thus allow further analysis of the creep
Figure 2. Relative displacement across the Longitudinal Valley Fault derived from geodeticmeasurements. The Longitudinal Valley Fault and the 1951 surface ruptures have been drawn as thebold lines in the maps. (a) Trilateration networks measured in 1983–1988 across the central and southernLongitudinal Valley. Axes of maximum and minimum shortening are shown by pairs of convergentarrows with double and single arrowheads, respectively, with lengths proportional to principal strainvalues [data from Lee and Angelier, 1993]. (b) Displacement vectors deduced from GPS measurementsacross the central and southern Longitudinal Valley (GPS data after Yu and Kuo [2001]). Seven stationsnear the valley in the Coastal Range (triangles) and seven stations near the valley in the Central Range(circles) have been plotted. Each vector represents the annual displacement vectors (1992–1999) for eachstation relative to the Paisha station situated in the Taiwan Strait (west of Taiwan). Among them, threepairs of GPS stations near Chihshang (bold arrows) have been selected for determination of thedisplacement across the valley in the Chihshang area.
Figure 3. 3-D schematic reconstruction of the Long-itudinal Valley Fault. (a) Illustration of oblique slip,showing the reverse and left-lateral components of motion.(b) Quantification of present-day fault slip components,based on fault geometry (strike and dip) and results ofgeodetic surveys near Chihshang.
ETG 4 - 4 LEE ET AL.: CHIHSHANG CREEP VARIATIONS

behavior of the Chihshang Fault, in particular the seasonalvariations.
4. Instrumentation, Data Collection, and SiteDescription
[11] Our rod-type creep meter is designed for measuringthe relative movement across well-defined active faults onthe surface (Figure 5). The creep meter measures displace-ments between two anchored piers on opposite sides acrossthe active fault. The piers were mounted on 60 cm � 60 cmwide concrete bases. While located on the soil surface, anextra 0.5-m-deep cavity was dug for each pier and filledwith pebbles, concrete, and iron bars, which were implantedmore than 1 m deep. The instrument itself is composed oftwo parallel Invar rods, which are attached to each pier via auniversal connector and are supported by the rollers fixedon a U-shaped steel cover-and-support system (Figure 5).
The relative movement of two Invar rods can be measuredby a mechanical dial-gauge sensor. The resolution of thedial-gauge is 0.01 mm with a range of 50 mm. The data ofthe creep meters were manually read on the dial-gauge andrecorded once a day. The technical characteristics of theinstrument have been described elsewhere [Lee et al., 2000],so that we will not present them here in detail.[12] Five creep meters were installed at two sites, Tapo
and Chinyuan, in 1998. These two sites are located 2 kmfrom each other along the Chihshang Fault (Figure 4).Two connected creep meters were installed at the Taposite, where the fault zone appears to be less than 10 mwide (Figure 6). In contrast, three creep meters wereinstalled separately at the Chinyuan site because thepresent-day fault motion is distributed into three branchesof surface ruptures. These three fault strands accommo-date most of the deformation within a zone about 100 mwide (Figure 7).
Figure 4. (a) The 40-m DEM shaded relief map of the Chihshang area. (b) Contour map showing thetopographic features at the creep meter sites in the Chihshang area. The surface trace of the ChihshangFault closely follows the edge of the hills of the Coastal Range. The two stars indicate the sites of creepmeters. Three dots indicate the sites of cultural feature measurements.
LEE ET AL.: CHIHSHANG CREEP VARIATIONS ETG 4 - 5

[13] Here we present the data and results of the creepmeter study during the first 3 years following the installa-tion (that is, from August 1998 to the end of 2001). Thepresented data on amounts of shortening, which have beenrecorded by creep meters, are subequal to or slightly lessthan the actual shortening of the surface fault because theorientations of the creep meters were set up to be approx-imately parallel to the vectors of fault motions. As we showin a later section, it is therefore possible to calculate theactual horizontal displacement of fault creep if we introduce
a geometric relationship between the orientations of thefault and that of the creep meters as well as the slip vector ofthe fault [Lee et al., 2001]. This correction is minor becausethe instruments were properly oriented, and it is not requiredhere because the main purpose of this paper is to address thecreep variations through time, especially the seasonal slipvariation. So we simply use and compare the apparentshortening amounts, as directly recorded by the creepmeters. In this respect, it is worth noting that the motionvectors across the Chihshang Fault are still subject to some
Figure 5. Schematic representation of the rod-type creep meter across an active fault, rupturing theconcrete wall on the surface. For a description of the instrumentation, see the text.
Figure 6. Photograph of the rod-type creep meter. The creep meters CHIH001 (the lower one) andCHIH002, with a common pier in the middle, cross the active fault zone and are aligned nearlyperpendicular to the fault strike at the foot of rugged hills of the Coastal Range at the Tapo School.
ETG 4 - 6 LEE ET AL.: CHIHSHANG CREEP VARIATIONS

angular uncertainties. This provides an additional reason toignore the minor angular corrections, which remain smallwith respect to these uncertainties.
5. Thermal-Elastic Calibration
[14] The two parallel rods of the creep meter are adoptedby material with a low thermal expansion coefficient (Invaralloy), in order to minimize the effects of the variations intemperature. It was, however, necessary to determine theinfluence of the thermal effect on the length measurementsdone with the creep meters. Furthermore, the steel piers atthe two ends of the creep meter appeared to show non-negligible thermal-elastic effect. Thus we carried out in-site
temperature calibrations. We considered not only the ther-mal expansion of the Invar rod but also the thermal effect onthe whole creep meter system. The calibrations were donefor each instrument, because thermal effects on the twodifferent parts of the instrument (Invar rod and steel piers)did not necessarily exert the same comparative influence forall the creep meters.[15] In practice, the temperature effects on the creep
meters have been evaluated at two different timescales.The short-term scale involved the thermal fluctuation duringa day, from day to night, and the long-term scale involvedthe seasonal thermal effect, from summer to winter. For theshort-term effect, we carried out twice hourly measure-ments, each during a time span of 30 hours for the
Figure 7. (a) Photograph and (b) location map of the creep meters at the Chinyuan site. Three creepmeters (CHIH003, CHIH004, and CHIH005) were installed on the wall of the water channel where threesurface ruptures of the active Chihshang Fault have been observed within about an 80-m-wide zone.
LEE ET AL.: CHIHSHANG CREEP VARIATIONS ETG 4 - 7

temperature fluctuation in the creep meter [Lee et al., 2000].The daily thermal fluctuation causes a length variation of0.4–0.8 mm on the records of the creep meters in a localtypical temperature difference of 13�–15�C between thelowest and highest temperature in a day. For the seasonaleffect, we took the effect of temperature seasonal variationsinto account during each single year. The seasonal thermalvariation shows the average lowest temperature of 15�C inwinter and the highest 32�C in summer (the daily measuredtime is basically in the afternoon before sunset). This seasonaltemperature variation yielded a length variation of 2.0–2.2 mm on the creep meters in a year. The derived thermal-elastic coefficients for each creep meter were taken as thebasis of the temperature calibration. This calibration processwas essential in that it allowed reliable data collection in termsof thermal-free shortening. Our daily measurements includedboth the length variation of the Invar rods and the tempera-ture, which allowed for accurate correction of the data.
6. Precipitation and Groundwater Data
[16] Since we observed a time coincidence between therapid creep periods on the creep meters and the rainyseasons, we also present the data from precipitation andgroundwater level in order to better understand their rela-tionships. The precipitation in the Chihshang area here ispresented as rainfall data, which were obtained from twosources. The rainfall measurements have been carried outdaily at Tapo by the Tapo elementary school since January
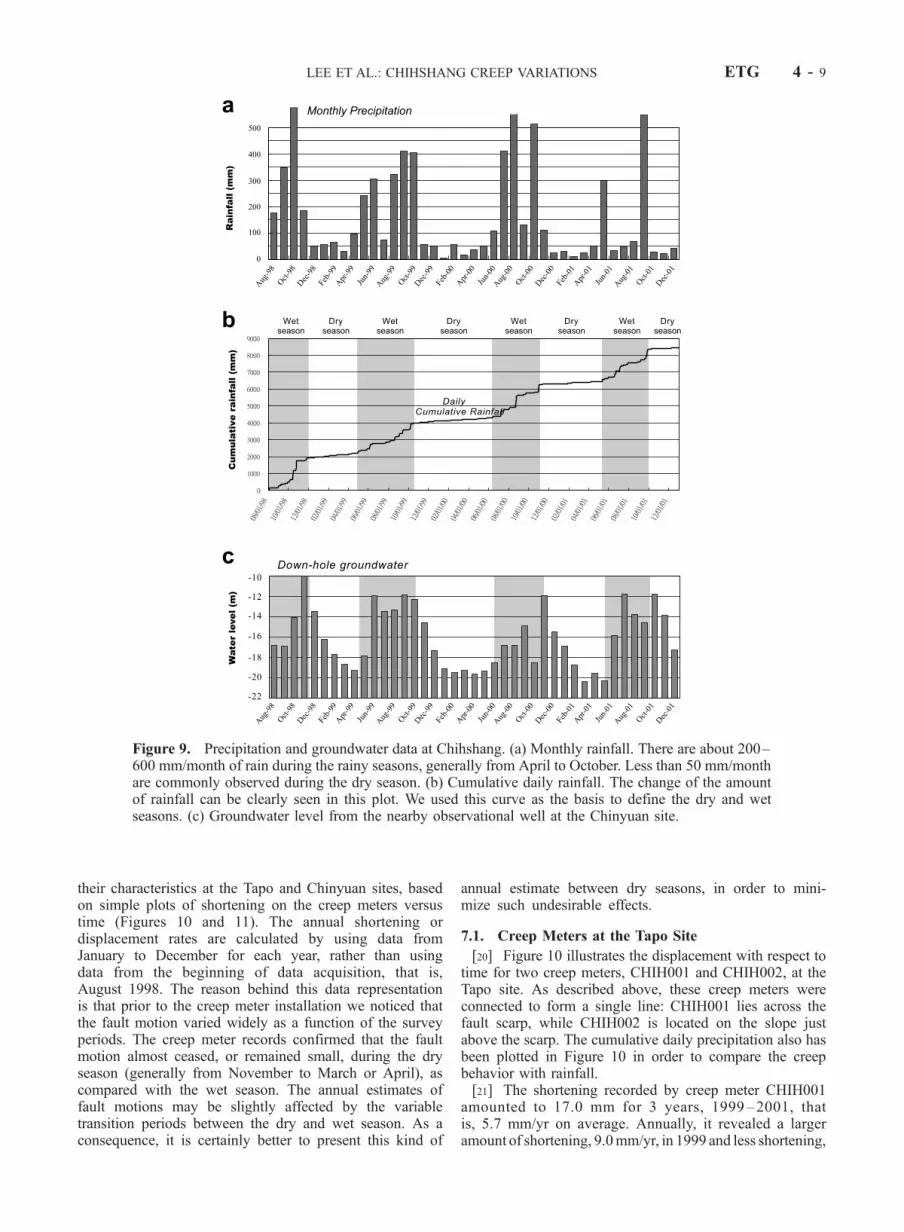
2000. In order to complete the rainfall record during thewhole period of the creep meter measurements, we adopteddata from two nearby meteorological stations of the CentralWeather Bureau (CWB) at Taitung and Chengkung (forlocation, see Figure 1). Comparing the daily rainfall atChihshang with the averaged rainfall at the two CWBstations during the 2 years, 2000 and 2001, we found avery good agreement between the two data sets (Figure 8).We therefore have confidence in using the average rainfallof Taitung and Chengkung from CWB as representativerainfall data for the earlier 1998–1999 period. Thesecombined data of the monthly precipitation from 1998 to2001 are presented in Figure 9a. Furthermore, we alsocalculated the daily cumulative rainfall from installation ofthe creep meters on 1 August 1998 (Figure 9b).[17] In summary, the wet season in the Chihshang area is
generally from May to October; however, it varies slightlyeach year. Not uncommonly, monthly precipitation rangesfrom 100 to 600 mm (normal variation between 200 and400 mm) during the wet season. In contrast, the dry season,generally from November through April, shows monthlyprecipitation less than 60 mm. From the plot of daily cumu-lative rainfall, we are able to define thewet/dry seasons for theperiod of the observation (Figure 9b): (1) from August 1998to November 1998 as wet season; (2) fromDecember 1998 toApril 1999 (5 months) as dry season; (3) from May 1999 toOctober 1999 (6 months) as wet season; (4) from November1999 to June 2000 (7.5 months) as dry season; (5) from June2000 to October 2000 (4.5 months) as wet season; (6) fromNovember 2000 to April 2001 (6 months) as dry season; and(7) from May 2001 to September 2001 (5 months) as wetseason. Note that there is usually a 1-month transition periodbetween the wet and dry season with precipitation around100 mm/month.[18] The data of the groundwater level presented here were
obtained from a monthly measured observation well, main-tained by Water Resource Agency. This well is located nearthe Chinyuan creep meter site. The groundwater level duringthe period of 1998–2001 (Figure 9c) indicates that it roserapidly from the lowest level of about 20 m deep up to a highlevel of about 12–15 m deep in the early rainy season andgenerally attended its highest level of about 10–12 m deep atthe end of the rainy season. The groundwater droppedgradually from its highest level to the low level through thedry season and generally attained its lowest level near the endof the dry season around March/April. In summary, the levelof the groundwater corresponds to the rainy/dry season at firstapproximation. However, a difference does exist betweenthese two data: the groundwater rose sensitively and rapidlydue to heavy rain in the early wet season, but it droppedretardatively and slowly in the dry season. As we willillustrate in the following section, the fault creep shows agood correlation with the dry/rainy season, but the slowdownin the rate of dropping of groundwater level did not show anysignificant effect on the creep data. Therefore we concludethat groundwater did not have a direct impact on the creepmotion of the surface fault.
7. Creep Data: 1998–2001
[19] In the following sections, we present data from thecreep meters and discuss the behavior of fault motions and
Figure 8. Comparison of the daily precipitation of 2000–2001 recorded at the stations of CWB in the nearby cities,(a) Chengkung and Taitung and (b) the station inChihshang. There is a generally good agreement betweenthese two data sets.
ETG 4 - 8 LEE ET AL.: CHIHSHANG CREEP VARIATIONS
their characteristics at the Tapo and Chinyuan sites, basedon simple plots of shortening on the creep meters versustime (Figures 10 and 11). The annual shortening ordisplacement rates are calculated by using data fromJanuary to December for each year, rather than usingdata from the beginning of data acquisition, that is,August 1998. The reason behind this data representationis that prior to the creep meter installation we noticed thatthe fault motion varied widely as a function of the surveyperiods. The creep meter records confirmed that the faultmotion almost ceased, or remained small, during the dryseason (generally from November to March or April), ascompared with the wet season. The annual estimates offault motions may be slightly affected by the variabletransition periods between the dry and wet season. As aconsequence, it is certainly better to present this kind of
annual estimate between dry seasons, in order to mini-mize such undesirable effects.
7.1. Creep Meters at the Tapo Site
[20] Figure 10 illustrates the displacement with respect totime for two creep meters, CHIH001 and CHIH002, at theTapo site. As described above, these creep meters wereconnected to form a single line: CHIH001 lies across thefault scarp, while CHIH002 is located on the slope justabove the scarp. The cumulative daily precipitation also hasbeen plotted in Figure 10 in order to compare the creepbehavior with rainfall.[21] The shortening recorded by creep meter CHIH001
amounted to 17.0 mm for 3 years, 1999–2001, thatis, 5.7 mm/yr on average. Annually, it revealed a largeramount of shortening, 9.0mm/yr, in 1999 and less shortening,
Figure 9. Precipitation and groundwater data at Chihshang. (a) Monthly rainfall. There are about 200–600 mm/month of rain during the rainy seasons, generally from April to October. Less than 50 mm/monthare commonly observed during the dry season. (b) Cumulative daily rainfall. The change of the amountof rainfall can be clearly seen in this plot. We used this curve as the basis to define the dry and wetseasons. (c) Groundwater level from the nearby observational well at the Chinyuan site.
LEE ET AL.: CHIHSHANG CREEP VARIATIONS ETG 4 - 9

Figure 10. Data of the creep meters at Tapo school site. Two creep meters, (a) CHIH001 and(b) CHIH002, are connected together to measure the displacement in a 10–15 m wide active fault zonesituated at the foot of a small hill. (c) Sum of the data of two creep meters represents the total shorteningamount. For each plot of the creep meter data, we also provided the daily cumulative precipitation ascomparison on the seasonal variation.
Figure 11. (opposite) Data of the creep meters in Chinyuan. Three creep meters, (a) CHIH003, (b) CHIH004, and(c) CHIH005, are located individually on the surface traces in a 100-m-wide active fault zone. Note that the periods of therapid shortening rates correspond well to the periods of the wet season for each year. For each plot of the creep meter data,we also provided (d) the daily cumulative precipitation as comparison on the seasonal variation.
ETG 4 - 10 LEE ET AL.: CHIHSHANG CREEP VARIATIONS

LEE ET AL.: CHIHSHANG CREEP VARIATIONS ETG 4 - 11

4.0 mm/yr, in 2000 and 2001. Furthermore, the curveshortening-versus-time for creep meter CHIH001(Figure 10a) clearly shows a seasonal variation of creepmotion. Relatively rapid creeping occurred during the wetseason (summer-autumn), interspersed with very slow creepmotion during the dry season (winter-spring). The onlyexception is revealed by a short period of rapid motionduring the second half of February 1999. This probably isdue to moderate precipitation during January and February1999 (57 and 64 mm, respectively). The creep rates,converted to millimeter per year for consistency, were asfollows for the rapid creeping seasons from 1998 to 2001:(1) 23.3 mm/yr from August (beginning of data recording)to mid-November 1998, (2) 13.7 mm/yr from May to earlyNovember 1999, (3) 15.0 mm/yr from the end of June toearly November 2000, and (4) 8.6 mm/yr from early Maythrough November 2001. In contrast, the creep rates duringthe slow creep dry seasons averaged 0–1 mm/yr, except forthe short period in February 1999 mentioned above.[22] The shortening of the creep meter CHIH002 is
31.5 mm for the 3 years, 1999–2001, that is, 10.5 mm/yron average, approximately twice as large as that recorded bythe lower creep meter. The shortening amounts for 1999,2000, and 2001 are 8.5, 14.0, and 9.0 mm, respectively.Creep meter CHIH002 shows movements throughout the3 observation years, regardless of season. This motion,however, cannot be regarded as steady state except to firstapproximation. There exist weeks-to-months-long periodswith abrupt pulses (or surges) of displacement at least onceper year, for instance, March/April 1999, April–July 2000,February–May 2001, and August 2001. One can notice thatthe abrupt pulses, with amplitudes of displacement up to 6–8 mm, are characterized by first dramatically shortening andthen lengthening. Each of these abrupt pulses correspond toevents of rapid or abrupt surface movements, which do notcorrespond to a general simple fault motion. In fact, thesepulses of displacements suggest that complicated surfacedeformation is involved, which we interpreted to be mainlydue to rotation of the pier caused by either fault or smallgravitational landslides along the slope as discussed in alater section of this paper. It is also worthy to note that foreach year the abrupt pulsing periods basically occurredduring the second half (or near the end) of the dry seasonand the beginning of the wet season. This behavior differsfrom that of the other creep meter stations.[23] We attributed the total shortening across the surface
breaks of the Chihshang Fault at the Tapo site to the sum ofthe individual shortening on the two connected creep metersCHIH001 and CHIH002. Combining data from these twocreepmeters, the curve of the summed creep data (Figure 10c)reveals a continuous shortening motion with a surprisinglyrather steady rate, except for some pulses of abrupt move-ment already noticed in the CHIH002 record. We thusobtain the combining total shortening of 48.5 mm in 3 yearsfrom 1999 to 2001, that is, 16.2 mm/yr on average. Forindividual years, the annual creeping rates are 17.5 mm/yr(1999), 18 mm/yr (2000), and 13 mm/yr (2001). Note thatthe two connected creep meters, CHIH001 and CHIH002,moved in a general complementary way and sometimeseven in opposite-sense movements. Before the beginning ofeach wet season, and without exception during the 3 years ofobservation, the creep meters started to move, in particular,
CHIH002 (the upper one) crept dramatically. While theupper creep meter recorded a dramatic shortening, andthe lower one (CHIH001) revealed a small amount ofunexpected lengthening. Then the upper creep meterexhibited a rapid but small lengthening while the lowerone began to be shortened. After moving abruptly with afew similar pulses, this upper creep meter became inactivefor an unspecified time, while the lower creep metercontinued creeping with shortening throughout the wetseason. We kept in mind that it was necessary to installthese Tapo creep meters on a slope, unlike the other creepmeters that could be installed on flat land. This particularbehavior deserves discussion in light of the possiblepresence of other fault strands and local gravity sliding.We will discuss this in detail, in a later section.
7.2. Creep Meters at the Chinyuan Site
[24] The creep data at the Chinyuan site are illustrated inFigure 11 by plots of shortening (in mm) versus time (inmonths) for three creep meters across three individualsurface breaks within a 100-m-wide deformation zone ofthe N-S trending Chihshang Fault.[25] First, the westernmost creep meter CHIH003 reveals
a displacement (shortening) of 15.5 mm in 1999–2001, thatis, 5.2 mm/yr on average. Annually, the creep rates on creepmeter CHIH003 are quite steady, although slightly decreas-ing: 6.0, 5.0, and 4.5 mm/yr for each year from 1999 to2001. The shortening data also reveal a seasonal variation,which also exists for the other two creep meters at theChinyuan site. This seasonal variation is characterized by arelatively rapid creep rate during the wet season and a slowcreep rate during the dry season.[26] The creep meter CHIH004, located across the middle
branch fault in the deformation zone, exhibits a 3-yeartotal displacement (shortening) of 9.0 mm in 1999–2001(Figure 11b), that is, 3.0 mm/yr on average. For each of the3 years, the shortening is 3.5, 3.0, and 2.5 mm, respectively.The plot of shortening for creep meter CHIH004, like theother two creep meters at Chinyuan, also shows a clearseasonal variation in the movement of surface faults. Inaddition to rapid shortening in the wet season, a uniquecharacteristic of fault movement was observed at creepmeter CHIH004. Large variations occur on timescales of afew days or weeks (and certainly less than 1 month). Thesevariations result in a narrow sawteeth appearance of thecurve (Figure 11b). Their amplitude is generally about 1–2 mm. The reason for these variations remains unclear.Concerning the relation between the creep rate and therainfall, we observe that the shortening periods at the creepmeter CHIH004 approximately correspond to the rainyperiods, although they were not perfectly correlated. Theonset of creep from quiescence period to shortening periodoccurred generally a few days to 1 month before thebeginning of the rainy season. This implies that moderaterainfall during the transition period from the dry season tothe wet season is enough to trigger rapid creeping atCHIH004. We will discuss more in detail the onset of rapidcreep in terms of daily precipitation data in a later section.[27] The easternmost creep meter CHIH005 displays a
total shortening of 20.5 mm in 3 years, that is, 6.8 mm/yr onaverage (Figure 11c). For each individual year, the short-ening rates are 8.0, 6.0, and 6.5 mm/yr, respectively, from
ETG 4 - 12 LEE ET AL.: CHIHSHANG CREEP VARIATIONS

1999 to 2001. The creep meter CHIH005 reveals the mostobvious seasonal variation in fault motion. Whereas verylimited motion occurred during the dry seasons, rapid creepand shortening prevailed during the wet seasons. Again, therapid creep generally started during the transition periodfrom the dry season to the rainy season, especially in 1999.[28] To obtain the total deformation record at the Chi-
nyuan site, we simply sum the shortening amounts of thethree creep meters to obtain the total shortening of thesurface motion on the Chihshang Fault. The three creepmeters revealed a total shortening of 45.0 mm in 3 years from1999 to 2001, that is, 15.0 mm/yr on average (Figure 11d).For each of the 3 years, the annual total shortening was 17.5,14.0, and 13.5 mm, respectively.[29] Hereafter we summarize the creep history of the
creep meters at the Chinyuan site as the typical pattern ofseasonal creep at the Chihshang Fault. From November1998 to mid-February 1999, no significant displacementoccurred. Then the fault started to move with shortening of18.5 mm in 7.5 months (creep rate 29.6 mm/yr) from mid-February to September 1999. This was followed by thesecond annual cycle of seasonal variations, a quiet periodwith very little shortening of about 1.5 mm (creep rate2.6 mm/yr), which occurred during 7 months of the dryseason, from October 1999 to April 2000. The fault movedagain at a relatively rapid rate and showed a shortening of11 mm in 6 months (that is, a creeping rate of about22 mm/yr), from May to October 2000. Finally, we havethe third annual cycle with a quiet period of 5.5 monthsduring the dry season, from November 2000 to mid-April2001, followed by a period of relatively rapid shortening(13.9 mm in 6 months, that is, a creep rate of 27 mm/yr)during the wet season from mid-April to mid-October2001.[30] The surface creep exhibited a relatively higher rate in
1999 and slightly lower ones in 2000 and 2001. With onlythese creep meter data, we are not able to conclude whetherthe fault creep displacement underwent a significantdecrease with time from 1999 to 2001, using shorteningrates calculated at the annual timescale. We shall discussthis aspect in more detail by comparing other availableinformation in later sections. In detail, comparison of thebehaviors among the three creep meters reveals a distinctbehavior related to the seasonal variation. This behaviorinvolves fast creeping that started from the late dry seasonand continued throughout almost the whole wet season (thatis, for about 6 months) and very little motion during the dryseason (for about the 6 remaining months). During the fastcreeping periods, relatively higher creep rates prevailed inthe first half of the wet seasons and relatively lower creeprates occurred in the second half of the wet seasons. Slightdifferences in creep behavior could also be recognizedamong the creep meters. An intriguing case is that of creepmeter CHIH004 (the middle one), which revealed system-atic short-term variations.
7.3. Comparison Between the Tapo and Chinyuan Sites
[31] To compare the shortening amounts determined atthe two sites, Tapo and Chinyuan (Figures 10 and 11), wefirst depict the first-order difference in creep behaviorbetween the two sites: a steady motion with clear seasonalvariation (moving in the wet season and dormant in the dry
season) in Chinyuan and a more continuous creep regardlessof the season (and with a few abrupt movements) in Tapo.Note, however, that separate consideration of the two in-lineTapo creep meters revealed season dependency as pointedout before. We infer that these differences mainly resultfrom the location of the creep meters. The creep meters atthe Tapo site were installed in the 20�–30� inclined hill-slope made of Lichi Melange, above the active fault.Because of this slope and the mechanical weakness of themelange, the gravitational effect is enhanced at the Taposite. The creep meters at the Chinyuan site, on the otherhand, are situated in a rather flat area with thick alluvialdeposits of the recent Quaternary, where no significantgravitational effect or landsliding occurs.[32] Despite this contrast, we obtained similar amounts of
annual shortening from 1999 to 2001 in the Tapo andChinyuan sites: 17.5 mm at both Tapo and Chinyuan in1999, 18.0 mm at Tapo and 14.0 mm at Chinyuan in 2000,and 13.0 mm at Tapo and 13.5 mm at Chinyuan in 2001.The reason why a slight discrepancy in the shorteningamounts between the sites of Tapo and Chinyuan arose in2000 remains unclear and arguable. However, we tend tointerpret it as a result of the irregularity in motion at Tapo’screep meters, particularly CHIH002. The sudden increase indisplacement recorded by this creep meter in June 2000accounts for the abnormally high shortening amount in the2000 season (Figure 10b), as compared with the measure-ments from the other four creep meters. It is worth notingthat the creep meter CHIH002 returned to its former trendafter this sudden increase in the rate of shortening. We thinkthat this abrupt jump of displacement can be explained bygravitational landsliding that possibly occurred in June2000, in addition to the tectonic faulting. We will discussthe complicated creep behavior at the Tapo site in a latersection. Because of unclear effects at the Tapo site, we usedthe data from creep meters at the Chinyuan site for therepresentative surface creep in the Chihshang Fault zone,that is, a shortening of 17.5 mm in 1999, 14 mm in 2000,and 13.5 mm in 2001. The average shortening rate is15.0 mm/yr, which forms the basis for the amount of creepin later discussions.
8. Discussion
8.1. Surface Deformation at the Outcrop andRegional Scales
[33] From the 1998–2001 creep meters data at theChinyuan sites, we obtained an average shortening rate of15.0 mm/yr for the Chihshang Fault. This estimate ofhorizontal displacement is a minimum due to the obliquityof the creep meter orientations relative to the slip vector, aswell as to the limited coverage of the creep meters installedwithin the multibranch fault zone. For instance, the creepmeters at Tapo are at an angle of about 40� to the slip vectorof the fault, whereas the creep meters at Chinyuan are at anangle of 10�–30� [Lee et al., 2001]. The previous analyses[Angelier et al., 2000] indicated that the actual surfacedisplacement vectors of the Chihshang Fault are N156�Eat Tapo and N145�E at Chinyuan, with a fault trend ofN18�E. On the basis of these geometric relationships, wereconstructed the actual horizontal component of the faultcreep. The geometric correction yields a fault creep rate of
LEE ET AL.: CHIHSHANG CREEP VARIATIONS ETG 4 - 13

16.5 mm/yr at the Chinyuan site (21.5 mm/yr at the Taposite) in 1999–2001.[34] The previous culture feature measurements at the
three sites in Chihshang indicated a rather stable rate ofhorizontal shortening of 22 mm/yr from 1990 to 1997, whichresulted from average rates of 19 mm/yr at the Chinyuan site,27 mm/yr near the Tapo site, and 21 mm/yr at the third sitebetween Tapo and Chinyuan [Lee, 1994; Angelier et al.,1997, 2000]. The shortening rate of creep meters atChinyuan (i.e., 16.5 mm/yr, 1998–2001), though a decreas-ing trend, is considered to be of the same order of magnitudecompared with culture feature measurements of 19 mm/yr atChinyuan since 1990.[35] The creep meter data are also compatible, in spite of
slightly smaller creep rates, with the results of the geodetictrilateration network surveyed in 1986–1988 [Yu and Liu,1989]. These earlier determinations yielded a horizontaldisplacement of 20 mm/yr on the Chihshang Fault, basedon a rigid-block-model analysis [Lee and Angelier, 1993]. Itshould be noted, however, that these earlier data and resultscame from an integration of the displacements across thewhole Longitudinal Valley (location see Figure 2a) andconsequently are not necessarily comparable to the creepmeter data, which reflect local near-fault displacement.Although this observation does not invalidate our generalconclusions about a recent decrease in shortening with time,it certainly diminishes the significance of these conclusions.In any case, the data from the 1986–1988 geodetic networksuggested that the surface deformation concentrated in anarrow zone with substantial horizontal shortening, whichbasically reflects the activity of the Chihshang thrust fault[Yu and Liu, 1989; Lee and Angelier, 1993].[36] Three pairs of GPS stations on both sides of the
Longitudinal Valley were deployed to survey the Chih-shang area from 1992 to 1999 (location see Figure 2b),yielding a displacement rate of 31 mm/yr [Yu and Kuo,2001], which is significantly larger than the 22 mm/yr rateobtained from culture feature measurements for roughlythe same years, and the 16–17 mm/yr rate obtained fromour Chinyuan creep meter data in 1998–2001. The expla-nation of these discrepancies is multifold. First, it could bethat the shortening rate has actually been decreasingduring recent years, as noted before. To substantiate thisargument, we need to obtain the updated GPS results forrecent years. Second, the horizontal shortening on thecreep meters across the surface faults could exhibit asmaller amount than the shortening measured by conven-tional geodesy and GPS covering the entire 5–7 km widevalley. This suggests that additional deformation from GPSmeasurements might exist in locations other than along themost obvious surface ruptures. It also might be caused bythe obliquity of the creep meter orientation to the actualslip vector. Although previous studies have estimated thedisplacement vectors of the Chihshang Fault, large uncer-tainties still remain on the determinations of the actualslip vectors for each fault branch at the Chinyuan site[Angelier et al., 2000]. The third possibility is that thestrike-slip component is significant on the surface fault atthe Chinyuan site. Our preliminary results of a local near-fault geodetic network at Chinyuan indeed indicate a slipvector of N150�–160�E for the Chihshang Fault [Lee etal., 2003]. With this local deviation of fault slip, one
would expect a more important strike-slip component andthus a lesser amount of shortening on the Chihshang Faultat the Chinyuan site. This would give an explanation forthe discrepancy between the regional cross-valley GPSmeasurements and the local near-fault creep meter andcultural feature measurements.
8.2. Rainfall Versus Surface Creep
[37] In this section, we summarize the close relationshipbetween seasonal precipitation and fault creep behavior andalso discuss the probable effects of rainfall on surface faultmovements. Four of our five creep meters, CHIH001 atTapo and CHIH003, CHIH004, and CHIH005 at Chinyuan,show a strong correlation between the creeping and rainyperiods in each year from 1998 to 2001. These four creepmeters indicate that the fault crept at a relatively high rateduring the wet season, whereas the movement nearly ceasedduring the dry season. In more detail, however, it seems thateach year the fault had begun to move during the transitionmonths between the dry and the wet seasons, that is, about1 month before the onset of heavy rains.[38] In order to examine the relationships between the
onset of rapid creep and rainfall, we compared the curvesof the creep data with the daily precipitation during the dry/wet transition periods for each of the years, 1999–2001(Figure 12). The combined creep data from the shorteningof the three creep meters at the Chinyuan site have beenselected for this comparison because of their general agree-ment with the rainy seasonal variation. Because the dailyprecipitation measurements at Chihshang were begun in2000, we restricted the discussions on the transition periodsto 2000 and 2001 (Figures 12b and 12c). The plot of 1999(Figure 12a), which shows the daily precipitation derivedfrom averaging the two nearby CWB metrological stations,was also presented for comparison.[39] We found that we can roughly divide the onset of
creep into two steps during the dry/wet transition period.In the first step, the fault started to creep from quiescenceat a rather slow rate. This step seemingly began after amoderate rain in the middle of the dry season. Forexample, a 20-mm-rain dropped on 6 February 2000 anda moderate rain occurred later in a time span of about aweek with daily precipitation of 2–10 mm in late Febru-ary, resulting in a significant monthly precipitation of56 mm. The creep data at Chinyuan indicated that thefault began to move at a slow pace around the end ofFebruary 2000 (Figure 12b). The similar onset of creepfollowed by a moderate rain can also be observed inFebruary 2001 (Figure 12c). We thus infer that the onsetof this low-rate surface slip was possibly triggered by amoderate rain in the middle of the dry season.[40] The second step involved rapid fault creep. In the
case of year 2000, surface creep accelerated after a week-long moderate rain in late April to early May and acceler-ated again after a 22-mm-rain on 21 May 2000 (Figure 12b).In 2001, the rapid creep started after a moderate rain, whichlasted for 2 weeks with maximum daily precipitation of18 mm in April (Figure 12c). We infer that the onset of thesurface rapid creep was strongly related to the moderate rainin April/May. It is worth noting that there is no significantdifference in the amount of precipitation between themoderate rains in February and those in April/May. The
ETG 4 - 14 LEE ET AL.: CHIHSHANG CREEP VARIATIONS

surface creep rate is apparently not in a linear relationshipwith the precipitation. Further investigation is needed inorder to understand this likely more complex relationshipbetween creep rate and rain.[41] It appears that the duration of the wet season also
prolonged the surface fault motion. The durations of the wetseason varied for each year from 1999 to 2001: lasting morethan 6 months in 1999, only 5 months in 2000, and 5–6 months in 2001. The duration of the rapid creeping periodseems to be proportional to the duration of the wet season(Figures 10 and 11). In contrast, the shortening amountsrecorded by the creep meters did not show obvious rela-tionship with the amount of precipitation. The annualprecipitations are 2119, 2287, and 2149 mm for 1999,2000, and 2001, respectively, and the shortening amountsare 17.5, 18, and 13 mm at Tapo and 17.5, 14, and 13.5 mmat Chinyuan for the same years. Quantitatively, we cannotdiscern any relationship between the amounts of rainfall andthe amounts of fault creep, partly because no significant
variations existed for either the annual precipitation or theamount of fault shortening in these 3 years.
8.3. Fault Motion and Landslide at Tapo
[42] The landsliding or gravitational phenomenon cannotplay any role at Chinyuan, where the fault trace runs acrossflat land. In contrast, it may significantly affect creep meterrecords at Tapo, because there the connected creep metersCHIH001 and CHIH002 were installed on a hill flank with aslope of 20�–30�. This suspicion arises from the creepbehavior of the creep meter CHIH002, which revealedseveral sudden pulses of displacement.[43] Field observations at this site show that the main
fault plane of the Chihshang Fault emerges at the surfaceunder the lower situated creep meter CHIH001. This loca-tion of the surface fault trace, which is characterized by asharp slip surface with the Lichi Melange mudstone in thehangingwall and the alluvium deposits in the footwall, hasbeen identified from an earlier excavation [Chu et al.,
Figure 12. Detailed creep data at the Chinyuan site with daily precipitation during the transition periodof the dry/wet season for each year: (a) 1999, (b) 2000, and (c) 2001. The onsets of rapid creep revealed aclose relationship with the onsets of the moderate rainfall. Details are given in the text.
LEE ET AL.: CHIHSHANG CREEP VARIATIONS ETG 4 - 15

1998]. As a consequence, we anticipated that a large part ofthe fault creep should have been recorded by the lowercreep meter rather than the upper one. However, in our data,near-continuous creeps on the upper creep meter suggestthat at least one slip surface emerged under the upper creepmeter CHIH002. Recent field observation indicates that afew surface breaks are developing under CHIH002 and alsonear the middle connected pier. Two interpretations arepossible. First we consider the new surface breaks as smallgravitational landslide surfaces based on its surface feature.Also, evidence of ancient significant landsliding can beobserved tens of meters south of the creep meter site. Infact, landslides and gravitational cracks are not uncommonon the hangingwall hills along the Chihshang Fault. Thisapparently is also due to the nature of the material com-prising the hillslope, known as the Lichi Melange, whichprovides little mechanical friction when water content ishigh. However, another possibility that the main ChihshangFault might branch out to rupture the surface underCHIH002 cannot be excluded. In this case, at least onerupture under CHIH002 is a fault surface instead of land-slide or gravitational slip breaks, so that a significant part ofthe displacements recorded on the creep meter CHIH002could be attributed to slipping on a tectonic fault surface. Todistinguish between these two possibilities, a careful exam-ination of the creep curves of the creep meters has beencarried out.[44] First, one can observe that the creep rate recorded on
the lower creep meter CHIH001 has decreased after the firstyear. In addition, the average creep rate of 5.7 mm/yr onCHIH001 is only one third of the representative creep rateof 15–20 mm/yr on the Chihshang Fault. Although earlierfield evidence had indicated that the location of the mainfault was under CHIH001, it is obvious that part of theactive fault surface creep was being transferred to anotherplace, probably to a slip surface under the upper creep meterCHIH002, which revealed a creep rate of 10.5 mm/yr.Furthermore, the total shortening rate of 16.2 mm/yr onthe two creep meters at Tapo is comparable, though a bitlarger, to the rate of 15.0 mm/yr at Chinyuan. As a result,
the landslide probably plays a limited role, and a moreimportant part of the active surface fault creep could beattributed to slipping on a fault strand under the upperCHIH002, rather than to the main fault surface under thelower CHIH001. While summarizing the overall motions onthe connected creep meters CHIH001 and CHIH002, wefound that the total shortening proceeded at a rather steadycreep rate (Figure 10c). This also suggests that the tectonicfault motion played a bigger role than the possible land-sliding on the overall displacements. Otherwise, the creep-ing rate would be rather irregular. We also found that thetwo creep meters moved in a complementary manner: thelower creep meter CHIH001 moved steadily during the wetseason; the upper CHIH002 crept rapidly during the dryseason considering the general trend. This complementarycreep behavior implies that the individual slip surfacesunder the two creep meters have merged downward into amain fault surface probably at a very shallow depth.[45] One can notice that the two creep meters often
moved in a curious opposing sense during the periods ofabrupt pulses. While the upper creep meter CHIH002accelerated its rate of creep with a dramatic shorteningwhen pulses began, the lower creep meter CHIH001remained dormant or even moved by lengthening(Figure 13). Whenever the upper creep meter exhibited asubsequent small amount of rapid lengthening, the lowercreep meter revealed, in contrast, a slight shortening duringthe same period. We speculate that these opposing motionsbetween the upper and lower creep meters might be partlydue to the rotation of the shared pier, which connects thetwo creep meters. We observed lately that this connectedshared pier had indeed tilted slightly toward the uphilldirection for slightly less than half a degree after more than3 years of installation. Geometrically, the tilt of the middleconnected pier would yield opposing motions on the twocreep meters with a larger displacement on the upper creepmeter and a smaller displacement on the lower creep meter,by supposing that the slip surface occurred on the base ofthe pier or below it. We thus infer that there exists a slipsurface, fault, or landslide, along or near the base of the
Figure 13. Detailed creep data at the Tapo site and daily precipitation in 2000 and 2001. The onsets ofthe rapid creep and the beginning of the abrupt pulses on the upper creep meter CHIH002 showed a closerelationship with a moderate amount of rainfall in the dry/wet transition periods. Details are given in thetext.
ETG 4 - 16 LEE ET AL.: CHIHSHANG CREEP VARIATIONS

middle pier. An intriguing point, which can be inferred fromthe plots of the creep data is that a relatively larger tilttoward uphill occurred first, followed by an opposing-sensesmaller tilt toward downhill. We tend to interpret thisforward-and-backward tilt of the pier as a balance ofmechanics within the whole system of the connected creepmeters.[46] The tilt of the middle pier is not the only possible
cause, though it might be the major one, for the abruptpulses. Landsliding, for example, under CHIH002 couldproduce pulses. A dilation of abundant clay minerals in thefault zone during the period of high water content could alsopossibly produce the effect of pulses. As discussed above,the overall creep behavior and shortening amount suggestthat the tectonic fault motion played a significant role, andthe local landslide played a limited but not ignorable role.Thus we consider the series of abrupt pulses of displace-ments to be a result of a combination of tectonic faultsurface creep and local gravitational landslide. The land-slide was restricted mainly to the upper part of the creepmeter, based on the creep behavior of the lower creep meter.The lower creep meter CHIH001 revealed a steady creep inthe wet season and quiescence in the dry season. Thissuggests that the contribution of landslide on the lowercreep meter was very limited. In the curve of the summedcreep data (Figure 10c), jumps on shortening amount can beobserved during the pulses of displacement, compared tothe general trend of the creep rate. We interpret these jumpsof shortening, ranging from 1 to 3 mm, as the amount ofshortening caused mainly by landsliding.[47] We have also plotted the creep curves of the two
creep meters at Tapo together with the daily precipitation(Figure 13). The series of abrupt pulses of displacement,which occurred generally after a few months of quiescence,started annually in the dry/wet transition. Considering therainfall data, it seems that a moderate amount of rain isenough to induce movement of rapid creep near creep meterCHIH002. For instance, a major pulse began soon after a22-mm-rainfall on 21 May 2000, and a similar pulseoccurred after a 17-mm-rainfall on 27 January 2001(Figure 13). Open fissures located adjacent to the CHIH002on the clayey hillslope could effectively bring the rain intothe ground and enhance the prompt response of the surfacecreep in the upper creep meter.[48] Further detailed investigation is required, including
borehole analyses and measurements, in order to define thefault strands and landslide surfaces, to quantitatively charac-terize the faultmotion and landsliding, and to understand theirbehaviors and their responses to the rainfall or groundwater.However, this is beyond the scope of the present paper.
8.4. Surface Creep Locking Depth andSubsurface Seismicity
[49] Several clues indicate that the creep motion took placeonly at very shallow crustal level on the Chihshang Fault.First, an elastic half-space dislocation model based on the1983–1988 cross-valley trilateration networks has yielded arather shallow locking depth of 1.5 km for the LongitudinalValley Fault in themiddle part of the valley nearYuli [Yu et al.,1990]. In addition, as discussed above, the surface creep onthe creep meters responded promptly to the rainfall near theend of the dry season. Moderate rainfall seemed to trigger
creeping in only a few days. This implies that the creep zone isprobably shallow. As a consequence, we consider the season-ally varying surface creep of the Chihshang Fault to be a faultmotion confined to a shallow crustal level and maybe abovethe water table. However, the creep meter data do not offermuch insight into the depth of creep. The locking depth of thesurface seasonal creep of the Chihshang Fault could not beprecisely defined until further investigations, such as strain-meter measurement and dense geodetic networks includingGPS measurements across the fault zone, are carried out.[50] Figure 14 shows the seismicity recorded by Central
Weather Bureau (CWB) seismic network from 1998 to2001, which coincides with the observation period of thecreep meter. This map reveals a cluster of seismicity withfocal depths in the range 10–25 km close to the eastern sideof the Chihshang Fault. To first approximation, this clusterof seismicity corresponds to the earthquake activity onthe Chihshang Fault, as shown by both the location of theseismicity and the geometry of the fault, although theuncertainty of location ranges between 1 and 5 km in depth.The cluster falls on an east-dipping curved surface, withdense seismicity from 12 to 22 km in depth (Figure 14b).The upward extension of this seismogenic feature closelycoincides with the surface location of the Chihshang Fault.This fault patch exhibits a listric geometric surface with aneastward inclination of 60�–65� in the upper 10 km, whichdecreases gradually to about 45� around 15-km depth andbecomes nearly flat at about 10� at 20–25 km in depth. Twomoderate earthquake sequences of magnitude 5 occurred onthis fault patch in 1992 and 1995. The 1992 earthquakesequence, with M = 5.2 main shock and numerous after-shocks, took place 3–10 km northeast of Chihshang. The1995 earthquake sequence, with M = 5.4 main shock andaftershocks, occurred 2–15 km east of Chihshang. A recentstudy with detailed relocation [Chen and Rau, 2002] indi-cated that these two earthquake sequences reveal verysimilar listric fault geometry and more concentrated clusterson the fault (Figure 14c), compared with the seismic clusterof 1998–2001.[51] Between 1998 and 2001, the Chihshang Fault zone
experienced a period with steady repeated microearth-quakes. No earthquake sequences of magnitude greaterthan 5, however, occurred. We noticed that seismic activityoccurred every month throughout the year, without signif-icant seasonal variation from 1998 to 2001 (Figure 15). Anaverage of 20–30 recorded earthquakes occurred along theChihshang Fault each month, with few exceptions. In otherwords, when the surface creep meters showed little or nofault motion during the dry seasons, microearthquakes werestill occurring in the deeper part of the Chihshang Fault.With rapid creep recorded on the surface creep metersduring the wet seasons, no significant increase or decreasein deeper seismic activity could be noticed. Therefore nodirect correlation can be established between creep activitynear the surface and seismic activity at crustal depths of10–25 km. This discrepancy of temporal occurrencebetween surface creeping and subsurface seismicity onthe Chihshang Fault leads to the following interpretations.[52] The Chihshang Fault moved in a basically steady
way at least during recent years; however, different behav-iors took place at different depths. Repeated microearth-quakes ruptured on the deep part of the fault, especially
LEE ET AL.: CHIHSHANG CREEP VARIATIONS ETG 4 - 17

around 10–25 km depths, suggesting that crustal stress wasreleased in a rather constant manner through time at thislevel. The slip corresponding to these repeated microearth-quakes did not propagate immediately up to the surface
level; otherwise, the surface motion recorded by creepmeters would not have ceased during each dry season.The stress accumulated at the upper crust levels did notreach a critical condition during the dry season and hence
Figure 14. (a) Map of seismicity in Chihshang and the surrounding areas. Open circles designateseismicity from August 1998 to December 2001; solid circles designate the main shock and theaftershocks of the 1995M5.4 earthquake. (b) Cross-sectional view of the 1998–2001 seismicity, showinga cluster of repeated microearthquakes occurring around the Chihshang Fault at depths of about 10–25 km. (c) Cross-sectional view of the seismicity of the 1995 M5.4 earthquake sequence. The lengths ofthe cross indicate the standard error of the location of the earthquakes.
Figure 15. Numbers of earthquakes which occurred along the Chihshang Fault zone each month fromAugust 1998 to December 2001. The seismicity remained generally steady, though slightly varied, exceptfor 2 months quiescence after the Chi-Chi earthquake occurred on 21 September 1999.
ETG 4 - 18 LEE ET AL.: CHIHSHANG CREEP VARIATIONS

could not induce large surface slip. The accumulated stresswas largely released, if not completely, when the wet seasoncame. We infer that the rainfall played an important role intriggering or facilitating fault creep near the surface, wherethe hangingwall of the Chihshang Fault is mainly composedof soft recent deposits and the melange mudstones asindicated by local geological studies [e.g., Page and Suppe,1981; Chang et al., 2000].[53] It may seem surprising that no major effect of the
21 September 1999, Mw 7.6, Chi-Chi earthquake of westernTaiwan could be found in the records of the creep meters atChihshang in eastern Taiwan. Nevertheless, the Chi-Chiearthquake did influence the seismicity of the ChihshangFault, which experienced a period of quiescence for morethan 1 month after the main shock (Figure 15). Theseismicity began to return to normal rates about 2 monthsafter the Chi-Chi earthquake. Indeed, a study of Coulombstress change [Hu and Ma, 2001] indicated that the Chi-Chiearthquake has induced a minor stress relaxation in easternTaiwan. Consequently, there has been a very slight stressdrop for the Longitudinal Valley Fault, consistent with2 months of quiescence after the Chi-Chi earthquake. TheChi-Chi earthquake was able to release a much greateramount of stress accumulated in the Taiwan mountain belt,including that accumulated in the Chihshang area. Thus norupturing of microearthquakes occurred on the ChihshangFault for some time after the Chi-Chi earthquake. On theother hand, this temporary quiescence in the deeper seismo-genic zone did not immediately affect the surface creepzone, which still kept a steady creep near the end of wetseason in 1999.
8.5. Comparison With Other Creeping Faults
[54] Seasonal, precipitation-induced variations of creepbehavior have also been observed elsewhere on activefaults. For instance, the creep meters at Parkfield acrossthe San Andreas Fault recorded higher creep rates morefrequently during the wet season than during the dry season[Schulz, 1989; Langbein et al., 1990; Roeloffs, 2001].Roeloffs [2001] showed that rainfall effects on creep arecomplex in that each local individual creep meter may havea unique way of responding to rain. After removing sea-sonal variations and the obvious heavy rainfall-inducedcreep, high creep rates are still more likely during the wetseason than during the dry season [Roeloffs, 2001]. Thusseasonal variations with high creep rates during the wetseason appear to be a common behavior for a reverse faultlike the Longitudinal Valley Fault as well as a strike-slipfault like the San Andreas Fault. The clearly rainfall-induced seasonal variation on all creep meters in theChihshang area (excepting those subjected to landslide-induced movements) indicates that the rainfalls certainlyplayed an important role in affecting the creep rate of thefault, in good agreement with the regional lithology andgeological condition already mentioned.[55] Again in the San Andreas system, the Hayward Fault
revealed a surface creep rate of about 5 mm/yr, that could beexplained by the configuration of a creeping zone from thesurface down to 5 km depth, a locked zone of 5–10 kmdepth, and an aseismical slip below 10 km [Burgmann et al.,1998; Lienkaemper et al., 2001; Simpson et al., 2001].Using a three-dimensional (3-D) dislocation model Simpson
et al. [2001] suggested that varied locking depths from 4 to12 km for the Hayward Fault could explain variations increep rate. In contrast, the Chihshang Fault exhibitsa seismogenic zone with abundant microearthquakes(10–25 km in depth) between the lower ductile aseismicslip zone and the upper surface creep zone. Despite the lackof precise data, the reverse Chihshang Fault in easternTaiwan exhibits a shallower creeping zone (probably1.5 km or less as mentioned above), compared to thestrike-slip Hayward Fault.[56] Savage and Lisowski [1993] pointed out that the
surface creep rate of the Hayward Fault should be influ-enced by the aseismic slip at depth on the Hayward Faultand other faults in the San Francisco Bay area, although thesurface creeping zone is separated by a locked region fromthe aseismic slip at depth. If this is correct, surface creep canserve as monitors of deformation at depth on the main faultand on other nearby faults. As for the Chihshang Fault, eventhough the surface creeping zone and the deep slipping zoneare not connected, the long-term changes in surface creeprate might also be due to changes of slip, seismic, andaseismic, at depth. This tentative interpretation, which maywell account for the apparently decreasing creep rate on theChihshang Fault during the last few years, has obviousimplications in terms of increasing earthquake hazard, andshould take precedence over our forthcoming studies.
9. Conclusions
[57] The daily data from creep meters across the Chih-shang thrust fault from 1998 to 2001 has led to thefollowing results and interpretations.[58] 1. Two sites about 2 km apart showed different
behaviors but similar annual shortening rates across theChihshang Fault. The Tapo site revealed shortening of 17.5,18, and 13 mm for 1999, 2000, and 2001, respectively. TheChinyuan site exhibited 17.5, 14.0, and 13.5 mm of short-ening, for the same years, respectively.[59] 2. Four of the five creep meters indicate a seasonal
variation of fault creep rates, showing a close relationshipwith precipitation: relatively rapid shortening during thewet season and very low creep rates during the dry season.That is, most of the surface fault creep occurred during 5–6 months from April/May through October for each year. Inaddition, only a moderate amount of rain is enough totrigger fault surface movement during the transition periodfrom dry to wet season in February–April.[60] 3. Abrupt pulses of displacement on the creep
meters at Tapo, particularly the upper creep meter(CHIH002), are mainly attributed to rotation of the middleconnected pier, caused by fault branching and/or localgravitational landsliding. Although this unexpected effectof pier tilting at Tapo appeared to be limited, we consideredthe creep data at the Chinyuan site, which is located in alandslide-free flat area, as the most representative data formotion on the Chihshang Fault.[61] 4. The average annual displacements recorded on the
Chinyuan creep meters (15.0 or 16.5 mm/yr with correc-tions for the obliquity of creep meter and fault motion) issimilar to, or slightly less than, those from the culturalfeature measurements of 1986–1997, which in turn aresmaller by 14–15 mm than annual displacements from the
LEE ET AL.: CHIHSHANG CREEP VARIATIONS ETG 4 - 19

GPS across-valley measurements of 1992–1999. We inter-pret this discrepancy to mean that either the fault creep ratehas been significantly decreasing during the last few yearsor that additional shortening occurred in places other thanthe observed surface ruptures of the Chihshang Fault.[62] 5. The crustal seismicity, which occurs on the
Chihshang Fault zone at depths of 10–25 km, has noobvious seasonal variation. As a consequence, we concludethat the energy/strain released by earthquake ruptures in theseismogenic zone did not transfer immediately up to thesurface along the Chihshang Fault and that most ofthe stress accumulated in the near surface was released ascreep along the fault during the rainy seasons. This revealsmechanical decoupling of stress/strain release between thenear-surface creeping zone and the seismogenic zone atdepth.[63] 6. Although the surface creeping zone of the Chih-
shang Fault and the deep slipping zone are not connected, it ispossible that changes in surface creep rates might be affectedby slip at depth. The decrease in the fault surface creep rateduring the last few years could indicate slip deficit at depth,thus causing an increase in seismic hazard on the ChihshangFault zone. Further investigation is thus warranted.
[64] Acknowledgments. This study was conducted under the auspicesof the France-Taiwan cooperation framework (Institut Francais a Taipei andNational Science Council of Taiwan). It was also supported by Institute ofEarth Sciences, Academia Sinica, Central Geological Survey, NationalTaiwan University, and National Science Council grants NSC90-2116-M047-002 and NSC92-2116-M001-005. We gratefully thank the formerprincipal of Tapo elementary school, Shern-Hsiung Chang, as well as Guo-Chang Jiang, Yin-Peng Tsao, and Miss Mei-Chi Lu, who made a continuouseffort to record data and provided numerous local facilities. Wen-BinCheng’s assistance in accessing the CWB daily rainfall data and Chin-HueiKuo and Tze-Lung Chang of the 8th River Management Bureau, WaterResource Agency, for kindly providing the local groundwater data aregratefully acknowledged. Helpful reviews including constructive commentsand English editing by Evelyn Roeloffs, Robert Simpson, and Cliff Thurberhave greatly improved the manuscript. Jacob Chu has made great efforts toimprove the English language. This is a contribution of Institute of EarthSciences, Academia Sinica, IESAS913.
ReferencesAngelier, J., H. T. Chu, and J. C. Lee, Shear concentration in a collisionzone: Kinematics of the active Chihshang Fault, Longitudinal Valley,eastern Taiwan, Tectonophysics, 274, 117–144, 1997.
Angelier, J., H. T. Chu, J. C. Lee, and J. C. Hu, Active faulting and earth-quake risk: The Chihshang Fault case, Taiwan, J. Geodyn., 29, 151–185,2000.
Barrier, E., and H. T. Chu, Field trip guide to the Longitudinal Valley andthe Coastal Range in eastern Taiwan, in Field Guidebook of Sino-FrenchColloquium, pp. 27–49, Natl. Sci. Coun., Taipei, 1984.
Bonilla, M. G., A review of recently active faults in Taiwan, U.S. Geol.Surv. Open File Rep., 75-41, 72 pp., 1975.
Burgmann, R., E. Fielding, and J. Sukhatme, Slip along the Hayward Fault,California, estimated from space-based synthetic aperture radar interfero-metry, Geology, 26, 559–562, 1998.
Chang, C. P., J. Angelier, and C. Y. Huang, Origin and evolution of amelange: The active plate boundary and suture zone of the LongitudinalValley, Taiwan, Tectonophysics, 325, 43–62, 2000.
Chen, H., and R. Rau, Earthquake locations and style of faulting in anactive arc-continent plate boundary: The Chihshang Fault of eastern Tai-wan, Eos Trans. AGU, 83(47), Fall Meet. Suppl., Abstract T61B-1277,2002.
Cheng, S. N., Y. T. Yeh, and M. S. Yu, The 1951 Taitung earthquake inTaiwan, J. Geol. Soc. China, 39(3), 267–285, 1996.
Chu, H. T., J. C. Lee, and J. Angelier, Non-seismic rupture of the Tapo andthe Chinyuan area on the southern segment of the Huatung LongitudinalValley Fault, eastern Taiwan, paper presented at the Annual Meeting,Geol. Soc. of China, Taipei, 1994.
Chu, H. T., J. Angelier, and J. C. Lee, Field trip guide to the active Chih-shang Fault: A non-seismic rupture of the Tapo and the Chinyuan area onthe southern segment of the Longitudinal Valley Fault, eastern Taiwan, inField Guidebook of Western Pacific Geophysics Meeting, edited by H. T.Chu and J. C. Lee, pp. 1–11, Geol. Soc. of China, Taipei, 1998.
Chung, L., J. Shyu, Y. Chen, J. Lee, and J. Hu, Surface rupture reevaluation ofthe 1951 earthquake sequence and neotectonic implication of east Taiwan,Eos Trans. AGU, 83(47), Fall Meet. Suppl., Abstract T62D-11, 2002.
Galehouse, J. S., Theodolite measurements of creep rates on San FranciscoBay region faults, U.S. Geol. Surv. Open File Rep., 95-210, pp. 335–346,1995.
Ho, C. S., An Introduction to the Geology of Taiwan: Explanatory Text ofthe Geologic Map of Taiwan, Minist. of Econ. Affairs, Taipei, 1975.
Ho, C. S., A synthesis of the geologic evolution of Taiwan, Tectonophysics,125, 1–16, 1986.
Hsu, T. L., The earthquakes of Taiwan (in Chinese), Q. J. Bank Taiwan, 7,39–63, 1955.
Hsu, T. L., Neotectonics of the Longitudinal Valley, eastern Taiwan, Bull.Geol. Surv. Taiwan, 25, 43–53, 1976.
Hu, J. C., and K. F. Ma, Coseismic deformation and static stress changesfollowing the Chi-Chi earthquake in Taiwan, Eos Trans. AGU, 82(47),Fall Meet. Suppl., Abstract T32A-0870, 2001.
Kao, H., G.-C. Huang, and C.-S. Liu, Transition from oblique subduction tocollision in the northern Luzon arc-Taiwan region: Constraints frombathymetry and seismic observations, J. Geophys. Res., 105, 3059–3079, 2000.
Langbein, J. O., R. O. Burford, and L. E. Slater, Variations in fault slip andstrain accumulation at Parkfield, California: Initial results using two-colorgeodimeter measurements, 1984–1988, J. Geophys. Res., 95, 2533–2552, 1990.
Lee, J. C., Structure et deformation active d’un orogene: Taiwan, Mem. Sc.Terre 94-17 thesis, 281 pp., Univ. Pierre et Marie Curie, Paris, 1994.
Lee, J. C., and J. Angelier, Location of active deformation and geodetic dataanalyses: An example of the Longitudinal Valley Fault, Taiwan, Bull.Soc. Geol. Fr., 164(4), 533–570, 1993.
Lee, J. C., F. S. Jeng, H. T. Chu, J. Angelier, and J. C. Hu, A rod-typecreepmeter for measurement of displacement in active fault zone, EarthPlanets Space, 52(5), 321–328, 2000.
Lee, J. C., J. Angelier, H. T. Chu, J. C. Hu, and F. S. Jeng, Continuousmonitoring of an active fault in a plate-suture zone: A creepmeter studyof the Chihshang active fault, eastern Taiwan, Tectonophysics, 333, 219–240, 2001.
Lee, J. C., J. Angelier, H. Chen, H. T. Chu, and J. C. Hu, 3-D kinematicsanalysis of surface ruptures on an active creeping fault at Chihshang,eastern Taiwan, Eos Trans. AGU, 84(47), Fall Meet. Suppl., AbstractT11F-05, 2003.
Lienkaemper, J. J., J. S. Galehouse, and R. W. Simpson, Long-term mon-itoring of creep rate along the Hayward fault and evidence for a lastingcreep response to 1989 Loma Prieta earthquake, Geophys. Res. Lett.,28(11), 2265–2268, 2001.
Page, B. M., and J. Suppe, The Pliocene Lichi melange of Taiwan: Its plate-tectonic and olistostromal origin, Am. J. Sci., 281(3), 193–227, 1981.
Roeloffs, E. A., Creep rate changes at Parkfield, California 1966–1999:Seasonal, precipitation induced, and tectonic, J. Geophys. Res., 106,16,525–16,547, 2001.
Savage, J. C., and M. Lisowski, Inferred depth of creep on the Haywardfault, central California, J. Geophys. Res., 98, 787–793, 1993.
Schulz, S. S., Catalog of creep meter measurements in California from 1966through 1988, U.S. Geol. Surv. Open File Rep., 89-650, 193 pp., 1989.
Simpson, R. W., J. J. Lienkaemper, and J. S. Galehouse, Variations in creeprate along the Hayward Fault, California, interpreted as changes in depthof creep, Geophys. Res. Lett., 28(11), 2269–2272, 2001.
Suppe, J., Mechanics of mountain building in Taiwan, Mem. Geol. Soc.China, 4, 67–89, 1981.
Teng, L. S., and Y. Wang, Island arc system of the Coastal Range, easternTaiwan, Proc. Geol. Soc. China, 24, 99–112, 1981.
Tsai, Y. B., Seismotectonics of Taiwan, Tectonophysics, 125, 17–38, 1986.Taiwan Weather Bureau, Earthquake Report 1951 (in Chinese), Taipei,1952.
Yu, S. B., and L. C. Kuo, Present-day crustal motion along the LongitudinalValley Fault, eastern Taiwan, Tectonophysics, 333, 199–217, 2001.
Yu, S. B., and C. C. Liu, Fault creep on the central segment of the long-itudinal valley Fault, eastern Taiwan, Proc. Geol. Soc. China, 32, 209–231, 1989.
Yu, S. B., D. D. Jackson, G. K. Yu, and C. C. Liu, Dislocation model forcrustal deformation in the Longitudinal Valley area, eastern Taiwan, Tec-tonophysics, 183, 97–109, 1990.
Yu, M. S., H. T. Chu, and C. L. Hsiao, On the geomorphic and recentfaulting deformation in the Tapo-Wanan area, eastern Taiwan, Trans.Jpn. Geomorphol. Union, 18, 152–153, 1997a.
ETG 4 - 20 LEE ET AL.: CHIHSHANG CREEP VARIATIONS

Yu, S. B., H. Y. Chen, and L. C. Kuo, Velocity field of GPS stations in theTaiwan area, Tectonophysics, 274, 41–59, 1997b.
�����������������������J. Angelier, Seismotectonique et Tectonophysique, ESA 7072, Universite
Pierre et Marie Curie, F-75252 Paris Cedex 05, France. ([email protected])H.-T. Chu, Central Geological Survey, P.O. Box 968, Taipei 235, Taiwan.
J.-C. Hu, Department of Geosciences, National Taiwan University,1 Section 4, Roosevelt Road, Taipei 106, Taiwan. ([email protected])F.-S. Jeng, Department of Civil Engineering, National Taiwan
University, 1 Roosevelt Road, Section 4, Taipei 106, Taiwan.([email protected])J.-C. Lee, Institute of Earth Sciences, Academia Sinica, P.O. Box 1-55,
Nankang, Taipei, Taiwan. ([email protected])R.-J. Rau, Department of Earth Sciences, National Cheng-Kung
University, 1 University Road, Tainan, Taiwan. ([email protected])
LEE ET AL.: CHIHSHANG CREEP VARIATIONS ETG 4 - 21