creep and creep-fatigue crack growth mechanisms in alloy
TRANSCRIPT
Creep and Creep-Fatigue Crack Growth Mechanisms in Alloy 709
Reactor Concepts Research Development and Demonstration (RCRD&D)
Afsaneh RabieiNorth Carolina State University
Sue Lesica, Federal POCSam Sham, Technical POC
Project No. 15-8308
Creep and Creep-Fatigue Crack Growth Mechanisms in Alloy709 - NEUP RC-3.2
Final report
Department of Mechanical and Aerospace Engineering, North Carolina State University,
911, Oval Drive, Raleigh, NC 27695-7910 USA
Principle Investigator: Professor Afsaneh Rabiei
Team of graduate students and post docs:
Amrita Lall, Siddhartha Sarkar, Swathi Upadhyay
School of Metallurgy and Materials, The University of Birmingham Edgbaston, Birmingham B15 2TT, UK
Principle Investigator: Professor Paul Bowen
Team of graduate students and post docs and researchers:
Suyang Yu, Jin Yan, Rengen Ding, Hangyue Li
i
Table of Contents
Table of Contents .................................................................................................. i List of Figures ...................................................................................................... vi 1 Introduction and overview ............................................................................. 22
1.1 Introduction ............................................................................................................ 22
1.2 Overview ................................................................................................................ 22
1.3 List of participants ................................................................................................. 25
2 Microstructure of Alloy709 ............................................................................ 27
2.1 Results and discussion ........................................................................................... 28
2.1.1 Microstructure of as-received sample ............................................................. 28
2.1.2 Microstructural evolution during aging .......................................................... 30
2.2 Conclusion ............................................................................................................. 51
3 In-situ tensile tests of alloy 709 at various temperatures ............................ 52
3.1 Introduction ............................................................................................................ 53
3.2 Experimental Setup ................................................................................................ 54
3.3 Results .................................................................................................................... 57
3.3.1 Microstructural Characterization .................................................................... 57
3.3.2 Tensile Experiments ........................................................................................ 58
3.4 Discussion .............................................................................................................. 64
3.5 Conclusions ............................................................................................................ 73
4 Tensile properties and deformation mechanisms of Alloy 709 on larger samples ...................................................................................................................................... 74
4.1 Material and experimental procedures ................................................................... 75
4.2 Results and discussion ........................................................................................... 75
4.2.1 Tensile ............................................................................................................. 75
4.2.2 Deformation microstructure at different temperatures .................................... 79
ii
4.2.3 Microstructural evolution of as-received alloy during tensile tests ................ 83
4.2.4 Fractography and failure mechanism .............................................................. 86
4.3 Conclusion ............................................................................................................. 91
5 In-Situ SEM study on creep behavior and deformation mechanisms of Alloy 709 ...................................................................................................................................... 93
5.1 Introduction ............................................................................................................ 94
5.2 Material and Experimental setup ........................................................................... 95
5.2.1 Specimen preparation ...................................................................................... 95
5.2.2 In-situ heating and loading stage .................................................................... 96
5.2.3 Determination of gauge length ........................................................................ 97
5.2.4 Test methods ................................................................................................. 104
5.2.5 In-situ SEM imaging ..................................................................................... 104
5.3 Results .................................................................................................................. 105
5.3.1 Creep rupture tests at 750 °C ........................................................................ 105
Microstructure evolution of as-received sample under creep at 750 °C ................ 105
Creep-rupture curves .............................................................................................. 107
In-situ SEM imaging during creep experiment at 750C ........................................ 112
5.3.2 Creep-rupture test at 850 °C ......................................................................... 122
Creep-rupture curve ............................................................................................... 122
Deformation mechanisms: ..................................................................................... 123
................................................................................................................................ 127
................................................................................................................................ 127
Fractography of test at 850 °C ............................................................................... 127
5.4 Summary .............................................................................................................. 127
6 Creep behaviour of Alloy 709 ....................................................................... 129
6.1 Experimental ........................................................................................................ 130
6.2 Results .................................................................................................................. 130
iii
7 Creep crack growth in Alloy709 .................................................................. 133
7.1 Experimental ........................................................................................................ 134
7.2 Results and Discussion ........................................................................................ 135
7.2.1 Creep crack growth at 550°C ........................................................................ 135
7.2.2 Creep crack growth at 650°C ........................................................................ 137
7.2.3 Creep crack growth at 750°C ........................................................................ 139
7.2.4 Validity of results .......................................................................................... 140
7.2.5 Creep crack growth resistance ...................................................................... 141
8 High temperature fatigue crack growth in Alloy709 ................................. 144
8.1 Experimental ........................................................................................................ 145
8.2 Results and Discussion ........................................................................................ 147
8.2.1 Fatigue crack growth resistance .................................................................... 147
8.2.2 Fractography ................................................................................................. 150
9 Creep-Fatigue crack growth behaviour of Alloy 709 under various dwell times using in Situ SEM ............................................................................................................... 154
9.1 In-situ SEM Creep-Fatigue tests on flat dog-bone samples in vacuum ............... 155
9.1.1 Testing methods and surface preparation ...................................................... 155
9.1.2 In-Situ SEM Observation .............................................................................. 156
9.1.3 Coincident lattice site (CSL) boundary mapping .......................................... 157
9.1.4 Experimental test parameters ........................................................................ 158
9.1.5 TEM Observation .......................................................................................... 160
9.2 Results and Discussion ........................................................................................ 161
9.2.1 1-second dwell loading ................................................................................. 163
9.2.2 1-minute dwell .............................................................................................. 169
9.2.3 1-hour dwell .................................................................................................. 172
9.3 Factors influencing crack-growth ........................................................................ 183
9.3.1 Effect of dwell time ....................................................................................... 183
iv
9.3.2 Grain boundary character .............................................................................. 187
9.4 Conclusions .......................................................................................................... 191
10 Dwell-fatigue crack growth in Alloy709 .................................................... 193
10.1 Experimental ...................................................................................................... 194
10.2 Results ................................................................................................................ 196
10.2.1 Dwell fatigue crack growth ......................................................................... 196
10.2.2 Dwell fatigue vs baseline fatigue ................................................................ 200
10.2.3 Baseline fatigue crack growth after dwell fatigue loading ......................... 200
10.3 Crack growth mechanisms ................................................................................. 201
10.3.1 Optical microscopy ..................................................................................... 201
10.3.2 SEM fractography ....................................................................................... 202
10.3.3 Cross-section views .................................................................................... 206
10.4 Discussion .......................................................................................................... 209
10.4.1 On the role of the environment ................................................................... 209
10.4.2 Creep-fatigue interaction ............................................................................ 210
10.4.3 On the role of temperature .......................................................................... 214
10.4.4 Influence of dwell fatigue loading on subsequent fatigue crack growth .... 216
11 Comparison between Alloy 709 and 316H ................................................ 217
11.1 Materials and microstructure ............................................................................. 218
11.2 Crack growth resistance ..................................................................................... 219
12 Effects of ageing on the mechanical properties of Alloy 709 ................... 221
12.1 Experimental ...................................................................................................... 222
12.2 Results ................................................................................................................ 223
12.2.1 Influence of ageing on impact toughness .................................................... 223
12.2.2 Influence of ageing on creep crack growth resistance ................................ 224
13 Conclusions .................................................................................................. 227 14 Future work ................................................................................................. 230
v
15 Outcomes ..................................................................................................... 231
15.1 Education at North Carolina State University ................................................... 231
15.1.1 Master student research program ................................................................ 231
15.1.2 PhD Research Program ............................................................................... 231
15.2 Education at University of Birmingham ............................................................ 231
15.2.1 Undergraduate final year program .............................................................. 231
15.2.2 Master student research program ................................................................ 231
15.2.3 PhD research program ................................................................................. 231
15.3 Dissemination .................................................................................................... 232
15.3.1 Journal papers ............................................................................................. 232
15.3.2 Conferences ................................................................................................. 232
16 References .................................................................................................... 233
vi
List of Figures
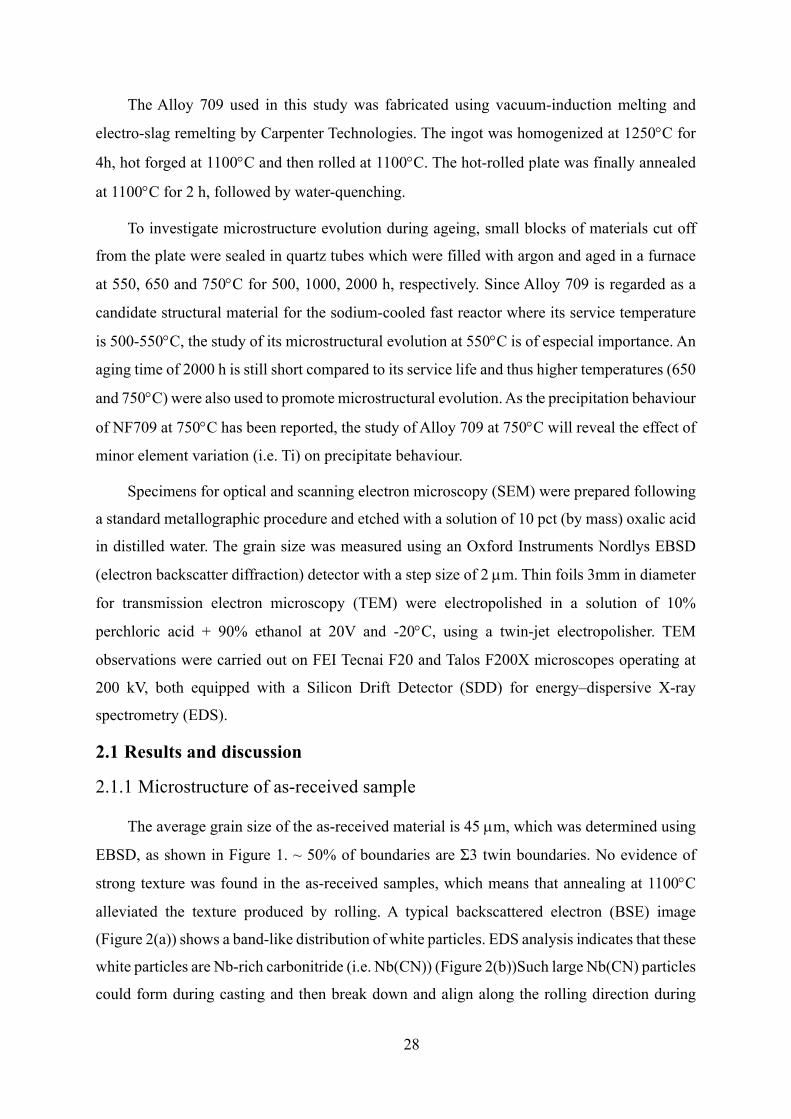
Figure 1 (a) Inverse Pole Figure (IPF) EBSD map of as-received Alloy 709, (b) EBSD
grain boundary map showing high angle grain boundaries in black, Σ3 twin boundaries in red
and low angle grain boundaries in green and (c) a profile of misorientation angles showing ~50%
Σ3 (twin) boundaries. ............................................................................................................... 29
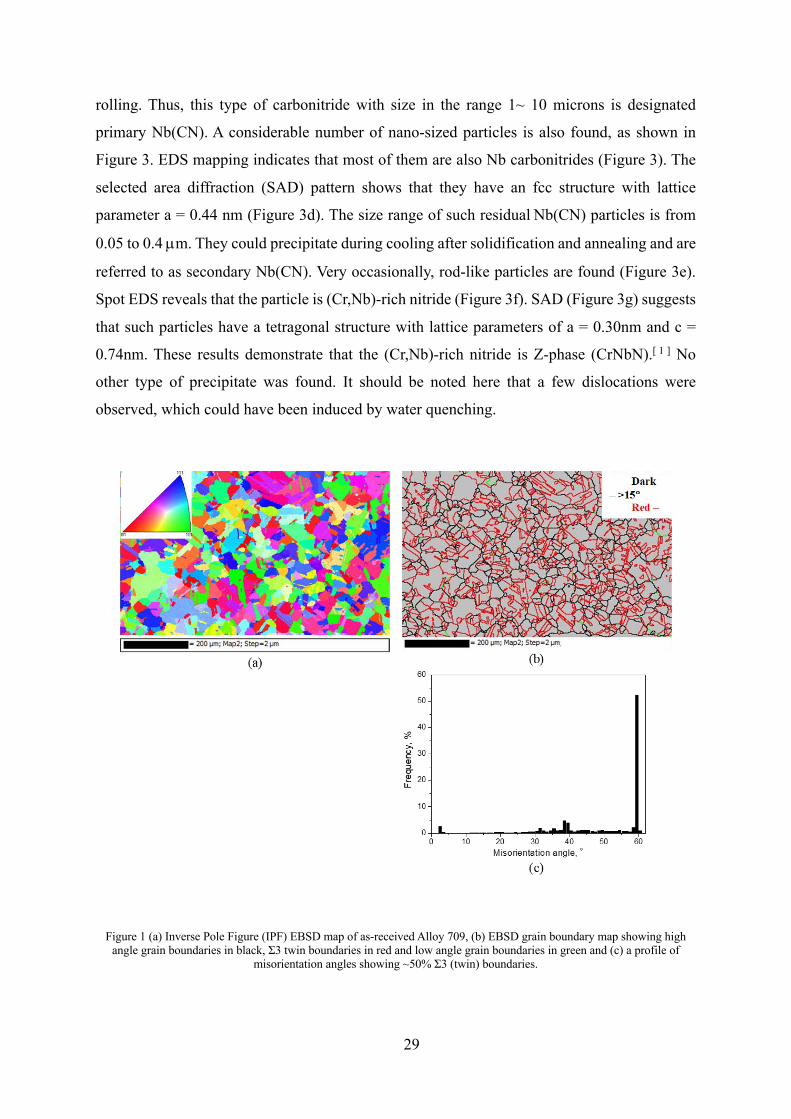
Figure 2 (a) A typical BSE image of as-received Alloy 709 showing a band-like
distribution of white particles, (b) the EDS spectrum shows that those white particles are Nb-
rich carbonitride. Note: RD – rolling direction ........................................................................ 30
Figure 3 (a) Bright field (BF) scanning transmission electron microscopy (STEM) image
and (b) high angle annular dark field (HAADF) STEM image of the as-received material show
nano-sized precipitates. (c) EDS mapping suggests that these particles are Nb carbonitrides, (d)
selected area diffraction patterns (SAD) recorded along 111 from a Nb(CN) precipitate, (e)
HAADF –STEM image of rod shaped Z-phase, (f) EDS spectrum from the Z-phase and (g)
SAD pattern taken along [010] zone axis from the Z-phase. ................................................... 31
Figure 4 BF-STEM images taken from the samples aged at 550�C for (a) 500 h and (b)
2000 h, showing that aging did not cause the formation of other particles beyond the already
present Nb(CN). (c) EDS linescan across a grain boundary revealing that aging promotes the
segregation of Cr and Mo to the grain boundary. .................................................................... 32
Figure 5 (a) BF and (b) HAADF STEM images taken from the sample aged at 650°C for
500h, showing the nearly continuous films on the grain boundaries and a large number of small
globular particles and plate shaped particles in the grain interiors. (c) Higher magnification
image of the GBs in Figure 5a and (d) higher magnification image of the twin in Figure 5a
illustrating that plate shaped particles formed particularly at the incoherent twin boundary. The
arrowed particle is analysed in Figure 6. ................................................................................. 33
Figure 6 (a) HAADF-STEM image of the sample aged at 650°C for 500h and the
corresponding EDS maps showing that the GB particles are (Cr,Mo)-rich carbides with some
fine Nb-rich phases, while the particles in the grain interior include Nb(CN), composite
particles with a Nb(CN) core and a shell of (Cr,Mo)-rich carbide, and plate shaped (Cr,Mo)-
rich carbide. SADs were recorded along (b) [101], (c) [121] and (d) [011] from the M23C6
vii
carbide (arrowed in Figure 5c), showing that this GB’s M23C6 carbide has a cube to cube
orientation relationship with matrix at upper side of the GB. .................................................. 34
Figure 7 (a) A HAADF-STEM image illustrating that Nb(CN) acts as a nucleation site for
other particles and EDS maps showing those particles are (Cr,Mo)-rich carbides, (b) BF-TEM
image of the particle on the left side of the HAADF image showing the formation of (Cr,Mo)-
rich carbides on the surface of Nb(CN), (c) high resolution TEM image of part of the composite
particle and (d) composite SADs from the MX - Nb(CN), M23C6 and matrix in Figure 7b
revealing the orientation relationship between those three phases. Note: the sample drift caused
distortion of the EDS maps. ..................................................................................................... 35
Figure 8 (a) A BF-STEM image taken from the sample aged at 650°C for 500h showing
globular and plate shaped particles, (b) EDS linescan across a plate revealing that the particle
is (Cr,Mo)-rich carbide and (c) SAD taken along [112] from the matrix and the particle
confirming that it is M23C6 and (d) high magnification image of the dislocation (arrowed in
Figure 8a) showing Z-phases, Nb(CN) and (CrMo)23C6 on the dislocation. ........................... 36
Figure 9 (a) A HAADF-STEM image taken from the plate shaped particles at the
incoherent twin boundary in Figure 5d and the corresponding EDS maps. (b) [011] SAD from
the matrix and the particles in the matrix, (c) [011] SAD from the twin and the particles in the
twin, (d) [011] SAD from the boundary and particles on both sides and (e) schematic diagram
of Figure 9d showing the orientation relationship between the carbides in the twin and the
matrix, and between the carbides in the matrix and the twin. Note: small diffraction spots are
from the carbides, in Figure 9d, ts – twin side, ms – matrix side. ........................................... 37
Figure 10 BF-STEM images of the sample aged at 650°C for 1000h show (a) a nearly
continuous distribution of the particles including Si-rich q phase at the grain boundaries and
(b) the formation of plate shaped particles at the ITB but with no evidence of the particles on
the CTB, (c) EDS maps for the marked area in Figure 10a revealing that most of the particles
at GBs are M23C6 with a new Si-rich q phase. (d) More Z-phase particles nucleated on
dislocations compared with the sample aged at 650°C for 500h (d) ....................................... 38
Figure 11 (a) BF-STEM image of particles at grain boundaries (GBs) in the sample aged
at 650°C for 2000h, (b) corresponding EDS maps, showing that most GB particles are M23C6
carbides along with some Si-rich q phases, (c) a superposition of Si and Cr-EDS maps shows
that some q phases grew from the globular M23C6 carbides (white arrow) and from the M23C6
viii
plates (black arrow) (c). Note: the holes at the upper left side of the image are due to preferential
etching of the particles during twin-jet polishing. ................................................................... 39
Figure 12 (a) The plate-like particles formed on the CTBs in the sample aged at 650°C
for 2000h, (b) EDS linescan across a particle revealing that the particle is (Cr,Mo)-rich carbide
(i.e., M23C6), (c) confirmation by HRTEM and (d) very fine particles have nucleated on the
M23C6 plate (inset is high magnification image of the arrowed plate of Z-phase). ................. 40
Figure 13 (a) BF and (b) HAADF STEM images of particles at GBs in the sample aged
at 750°C for 500h, (c) corresponding EDS maps showing that most GB’s particles are M23C6
carbides with some Si-rich q phases. ....................................................................................... 42
Figure 14 (a) A BF-TEM image of GB q phase in the sample aged at 750°C for 500h, (b)
spot EDS spectrum from matrix and the q phase revealing that the q phase is (Cr,Ni,Si,Mo)-
rich nitride, (c) composite SAD patterns from grain 1 and q phase were recorded along [114]
(c), [101] (d) and [001] (e) revealing that the q phase has a diamond-cubic structure and a cube-
to-cube orientation relationship with the matrix. ..................................................................... 43
Figure 15 (a) HAADF-STEM image from the sample aged at 750C° for 1000h shows
plates at CTB, (b) high magnification image of the plate at CTB in fig. 2.15a revealing different
contrast for different segments and (c) EDS maps of the marked region in fig. 2.15b indicate
that the dark segment is the q phase while the bright part is the M23C6 carbide and that Z phase
had nucleated on the M23C6 plate. ............................................................................................ 44
Figure 16 (a) HAADF-STEM image of the sample aged at 750C° for 2000h shows plates
at twin boundaries, (b) EDS map of the marked region in Fig. 2.16a indicates the formation of
q phase at twin boundaries and in the twin interior and (c) a superposition of Si and Cr-EDS
maps reveals that the plate shaped particle at the CTB is a complex particle containing M23C6
and q phase ............................................................................................................................... 45
Figure 17 (a) A HAADF-STEM image from the sample aged at 750C° for 2000h shows
some composite particles, (b) EDS maps of the region marked in Fig. 2.17a and (c) a
superposition of Nb, Cr and Si-EDS maps revealing that some q phases grew on the composite
particles. ................................................................................................................................... 46
Figure 18 (a) A BF-STEM image taken from the sample aged at 750°C for 500h shows
many Z phase particles on the dislocations, (b) EDS maps and (c) spot EDS spectra (c)
confirmed that they are (Cr,Nb)-rich nitrides (Z phase), (d) BF-TEM image from the sample
ix
aged at 750°C for 2000h shows the Z phase on the M23C6 carbide, (e) HRTEM image of the Z-
phase and (f) FFT of the HRTEM image reveal an OR between the Z-phase and the matrix of
(100)Z//(110)g and [001]Z //[001]g) .......................................................................................... 47
Figure 19 (a) HAADF-STEM images and (b) EDS linescans along the lines shown in the
images taken from samples aged at 650°C for 500h (1), 1000 (2) and 2000h (3). Depletion of
Cr and Mo near the grain boundaries was observed. The grain boundary Cr content gradually
increases with increasing aging time. Note: two troughs (arrowed) in fig. 2.19(b1) are because
the linescan crosses two M23C6 particles; the dashed line in fig. 2.19 (3b) represents the Cr
content in the matrix without Cr depletion. ............................................................................. 49
Figure 20 (a) HAADF-STEM image taken from the sample aged at 750°C for 500h and
(b) EDS linescan along the line in fig. 2.20a, showing that the depletion of Cr and Mo has
nearly disappeared. Note: two small peaks (arrowed) in fig. 2.20b are due to the linescan
passing across two M23C6 particles. The dashed line in fig. 20b represents the Cr content in the
matrix without the Cr depletion. .............................................................................................. 50
Figure 21 Shows schematically the region of Cr depletion. Note: A1- integral above the
depletion curve, A2- integral below the depletion curve. ........................................................ 50
Figure 22 (a) Image of the In-situ SEM setup- (b) Sample clamped with the heater
underneath. ............................................................................................................................... 55
Figure 23 Dimensions (in mm) of the tensile sample. ..................................................... 55
Figure 24 a) EBSD Euler maps showing microstructure of as polished samples. b) Room
temperature SEM with Backscatter Electron (BSE) image of clusters of Nb rich precipitates
along Rolling Direction (RD). c) Isolated Nb rich precipitates. Table showing the compositions
generated by EDS. Circled-nanoscale Nb-rich precipitates. ................................................... 58
Figure 25. Test-pieces under tension at 550, 650, 750, 850 and 950°C. .......................... 59
Figure 26. (a) Engineering stress-strain curve of Alloy 709 under tension at 25°C-950°C
along RD. (b) Zoom in of the elastic region of the same. (c) Engineering stress-strain curve of
sample at 800° at 2.61×10⁻⁴ /min strain rate. ........................................................................... 59
Figure 27. (a) Engineering stress-strain curve of Alloy 709 under tension at 750°C along
RD and TD. (b) Zoom in of the elastic region of the same. ..................................................... 61
x
Figure 28. Type A and Type B serrations at 550°C ,650°C. Insets showing a zoom in of
the engineering stress-strain curve at different strains. ............................................................ 62
Figure 29. Type A and Type C serrations 750 °C at 5.021×10⁻³ /min and at 800 °C at
2.608×10⁻⁴ /min. Insets showing a zoom in of the engineering stress-strain curve at different
strains. ...................................................................................................................................... 63
Figure 30.(a) and (b) Surface of sample at 550 °C showing slip bands at 8.6 and 25%
strain (c), (d) and (e). IPF maps (parallel to ND) showing elongation and color gradation within
grains (circled region) with increasing strain. (f) Intergranular crack initiation (at 35.4% strain)
and (g) Corresponding region in the fracture surface. (h) and (i) Dimpled fracture surface of
sample under tensile at 550 °Cand 650 °C. ............................................................................. 65
Figure 31. (a) & (b). Surface of sample at 750 °C at 8.9% and 20% strain showing a shift
from void nucleation and coalescence to slip bands. (c) and (d): fractographic images of the
samples along rolling and transverse direction. ....................................................................... 66
Figure 32. (a). In-situ SEM images of sample under tensile at 850 °C – showing cracks
growing into grain boundary into the grains; and (b) 950 °C-showing loss of crystallinity
around the crack propagation. (c) & (d): IPF (parallel to normal direction) of Alloy 709 sample
at 950 °C. (e) & (f): Fractographic images of samples at 850 and 950 °C. ............................. 68
Figure 33. Grain boundary and transgranular precipitation growth observed in Alloy 709
sample under tension at 950°C. ............................................................................................... 69
Figure 34. (a) & (b): SEM images comparing cracks growing from grain boundary into
grains at 800°C (2.61×10⁻⁴ /min) and 850°C (5.02×10⁻³ /min). (c) Plastic separation of grain
boundaries ahead of the crack tip. (d) Fracture surface of the sample. ................................... 70
Figure 35. SEM images binarized using MATLAB highlighting grain boundary void
nucleation and coalescence leading to cracking and plastic separation (c) at 800°C, 2.61×10⁻⁴
/min. ......................................................................................................................................... 71
Figure 36. Summary of the In-situ SEM tensile experiments. Low temperatures: 550-
650 °C. High temperature: 750-950 °C. .................................................................................. 72
Figure 37. SEM fractographs of a cylindrical testpiece after testing at 750°C: (a) cup and
cone fracture surface appearance; and (b) details of the microvoids formed in the center of the
testpiece. ................................................................................................................................... 73
xi
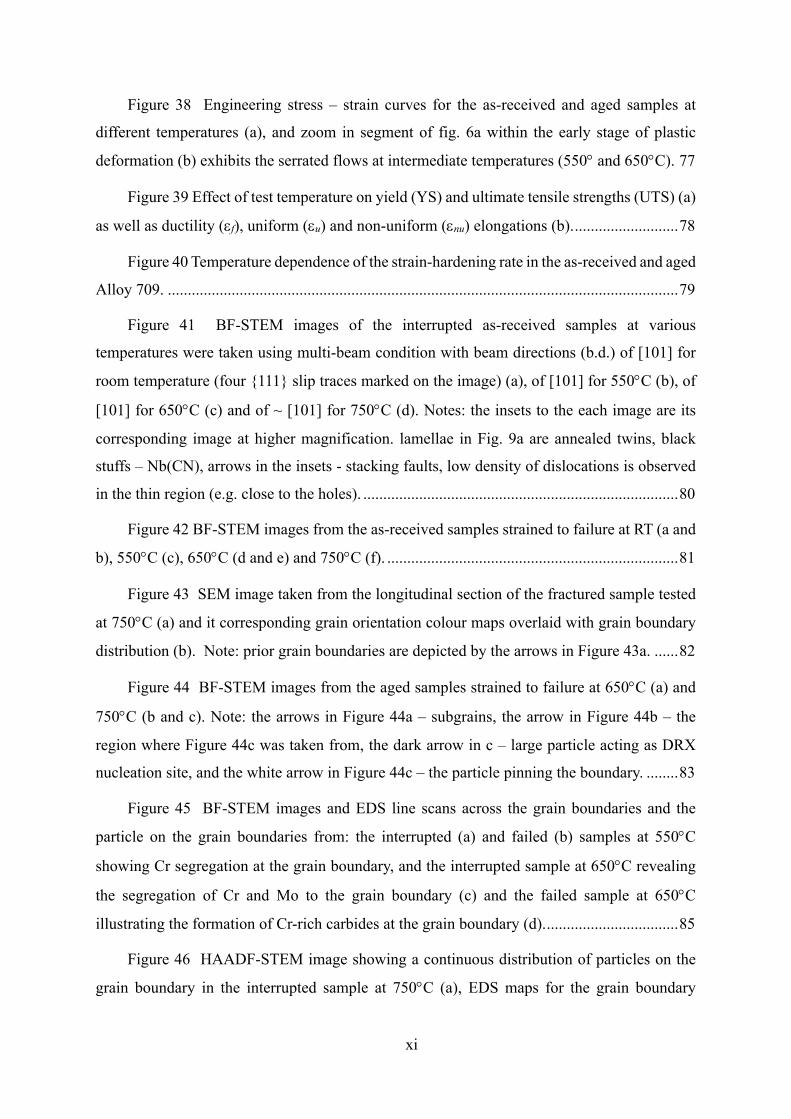
Figure 38 Engineering stress – strain curves for the as-received and aged samples at
different temperatures (a), and zoom in segment of fig. 6a within the early stage of plastic
deformation (b) exhibits the serrated flows at intermediate temperatures (550° and 650°C). 77
Figure 39 Effect of test temperature on yield (YS) and ultimate tensile strengths (UTS) (a)
as well as ductility (ef), uniform (eu) and non-uniform (enu) elongations (b). .......................... 78
Figure 40 Temperature dependence of the strain-hardening rate in the as-received and aged
Alloy 709. ................................................................................................................................ 79
Figure 41 BF-STEM images of the interrupted as-received samples at various
temperatures were taken using multi-beam condition with beam directions (b.d.) of [101] for
room temperature (four {111} slip traces marked on the image) (a), of [101] for 550°C (b), of
[101] for 650°C (c) and of ~ [101] for 750°C (d). Notes: the insets to the each image are its
corresponding image at higher magnification. lamellae in Fig. 9a are annealed twins, black
stuffs – Nb(CN), arrows in the insets - stacking faults, low density of dislocations is observed
in the thin region (e.g. close to the holes). ............................................................................... 80
Figure 42 BF-STEM images from the as-received samples strained to failure at RT (a and
b), 550°C (c), 650°C (d and e) and 750°C (f). ......................................................................... 81
Figure 43 SEM image taken from the longitudinal section of the fractured sample tested
at 750°C (a) and it corresponding grain orientation colour maps overlaid with grain boundary
distribution (b). Note: prior grain boundaries are depicted by the arrows in Figure 43a. ...... 82
Figure 44 BF-STEM images from the aged samples strained to failure at 650°C (a) and
750°C (b and c). Note: the arrows in Figure 44a – subgrains, the arrow in Figure 44b – the
region where Figure 44c was taken from, the dark arrow in c – large particle acting as DRX
nucleation site, and the white arrow in Figure 44c – the particle pinning the boundary. ........ 83
Figure 45 BF-STEM images and EDS line scans across the grain boundaries and the
particle on the grain boundaries from: the interrupted (a) and failed (b) samples at 550°C
showing Cr segregation at the grain boundary, and the interrupted sample at 650°C revealing
the segregation of Cr and Mo to the grain boundary (c) and the failed sample at 650°C
illustrating the formation of Cr-rich carbides at the grain boundary (d). ................................. 85
Figure 46 HAADF-STEM image showing a continuous distribution of particles on the
grain boundary in the interrupted sample at 750°C (a), EDS maps for the grain boundary
xii
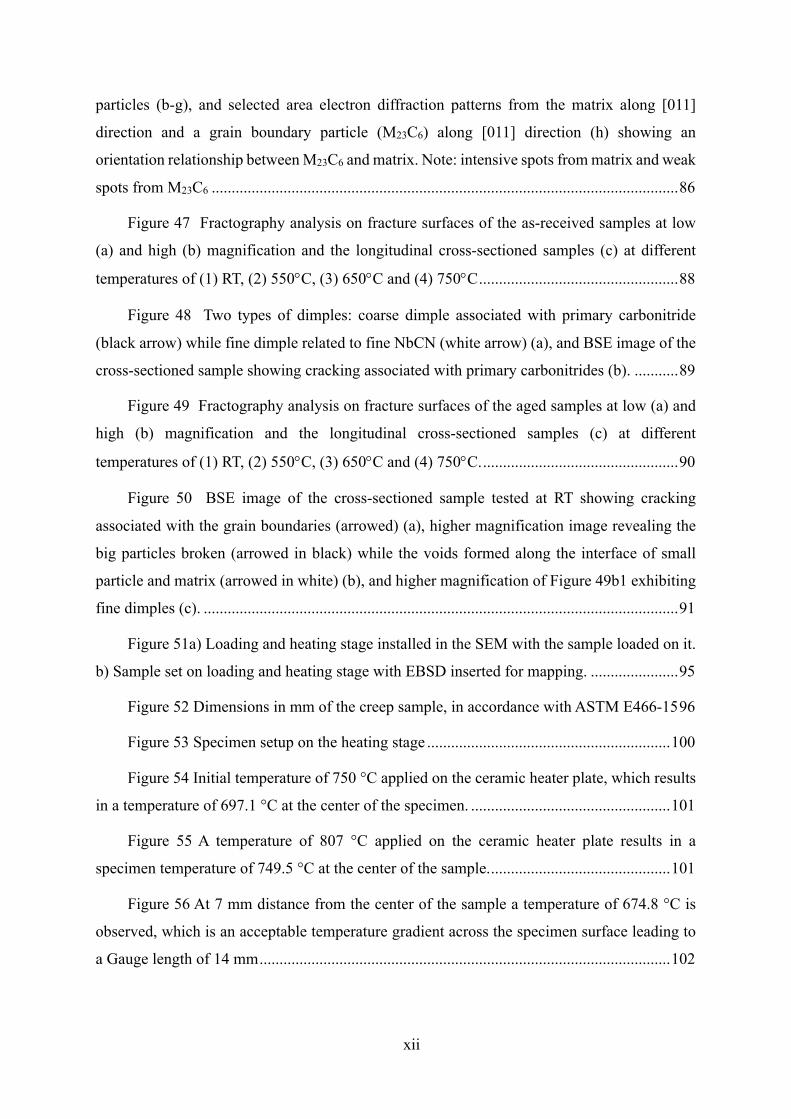
particles (b-g), and selected area electron diffraction patterns from the matrix along [011]
direction and a grain boundary particle (M23C6) along [011] direction (h) showing an
orientation relationship between M23C6 and matrix. Note: intensive spots from matrix and weak
spots from M23C6 ..................................................................................................................... 86
Figure 47 Fractography analysis on fracture surfaces of the as-received samples at low
(a) and high (b) magnification and the longitudinal cross-sectioned samples (c) at different
temperatures of (1) RT, (2) 550°C, (3) 650°C and (4) 750°C .................................................. 88
Figure 48 Two types of dimples: coarse dimple associated with primary carbonitride
(black arrow) while fine dimple related to fine NbCN (white arrow) (a), and BSE image of the
cross-sectioned sample showing cracking associated with primary carbonitrides (b). ........... 89
Figure 49 Fractography analysis on fracture surfaces of the aged samples at low (a) and
high (b) magnification and the longitudinal cross-sectioned samples (c) at different
temperatures of (1) RT, (2) 550°C, (3) 650°C and (4) 750°C. ................................................. 90
Figure 50 BSE image of the cross-sectioned sample tested at RT showing cracking
associated with the grain boundaries (arrowed) (a), higher magnification image revealing the
big particles broken (arrowed in black) while the voids formed along the interface of small
particle and matrix (arrowed in white) (b), and higher magnification of Figure 49b1 exhibiting
fine dimples (c). ....................................................................................................................... 91
Figure 51a) Loading and heating stage installed in the SEM with the sample loaded on it.
b) Sample set on loading and heating stage with EBSD inserted for mapping. ...................... 95
Figure 52 Dimensions in mm of the creep sample, in accordance with ASTM E466-15 96
Figure 53 Specimen setup on the heating stage ............................................................. 100
Figure 54 Initial temperature of 750 °C applied on the ceramic heater plate, which results
in a temperature of 697.1 °C at the center of the specimen. .................................................. 101
Figure 55 A temperature of 807 °C applied on the ceramic heater plate results in a
specimen temperature of 749.5 °C at the center of the sample. ............................................. 101
Figure 56 At 7 mm distance from the center of the sample a temperature of 674.8 °C is
observed, which is an acceptable temperature gradient across the specimen surface leading to
a Gauge length of 14 mm ....................................................................................................... 102
xiii
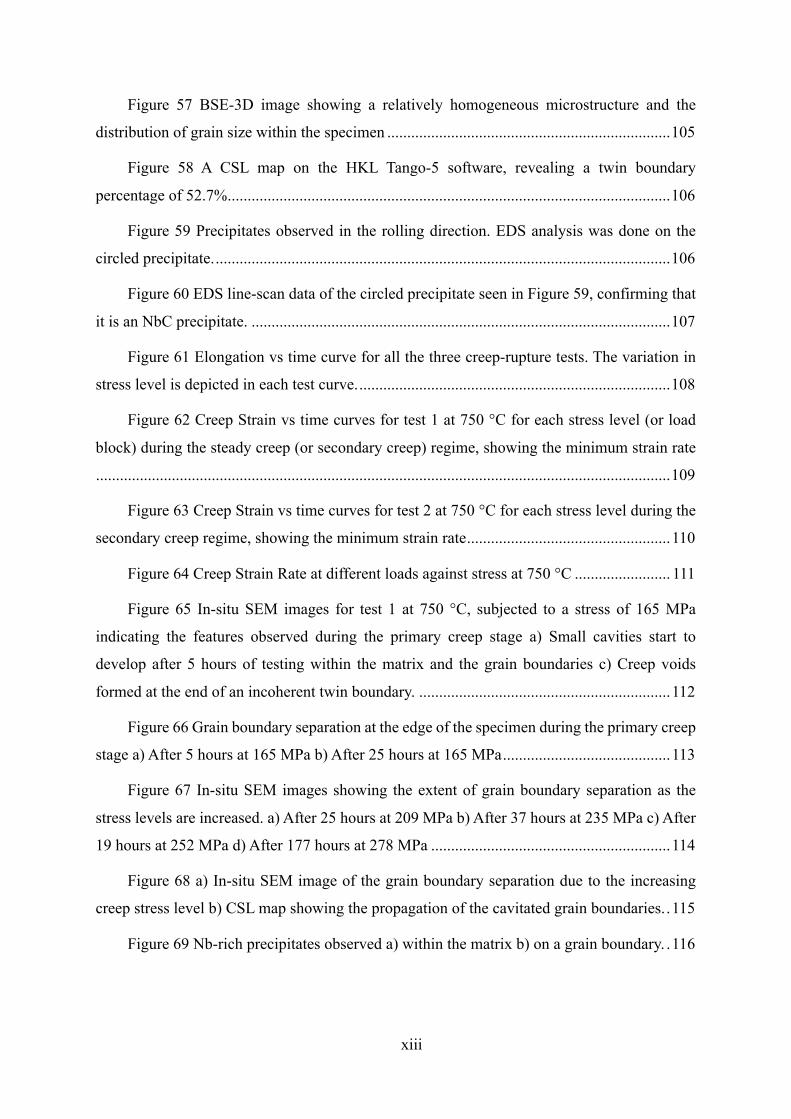
Figure 57 BSE-3D image showing a relatively homogeneous microstructure and the
distribution of grain size within the specimen ....................................................................... 105
Figure 58 A CSL map on the HKL Tango-5 software, revealing a twin boundary
percentage of 52.7% ............................................................................................................... 106
Figure 59 Precipitates observed in the rolling direction. EDS analysis was done on the
circled precipitate. .................................................................................................................. 106
Figure 60 EDS line-scan data of the circled precipitate seen in Figure 59, confirming that
it is an NbC precipitate. ......................................................................................................... 107
Figure 61 Elongation vs time curve for all the three creep-rupture tests. The variation in
stress level is depicted in each test curve. .............................................................................. 108
Figure 62 Creep Strain vs time curves for test 1 at 750 °C for each stress level (or load
block) during the steady creep (or secondary creep) regime, showing the minimum strain rate
................................................................................................................................................ 109
Figure 63 Creep Strain vs time curves for test 2 at 750 °C for each stress level during the
secondary creep regime, showing the minimum strain rate ................................................... 110
Figure 64 Creep Strain Rate at different loads against stress at 750 °C ........................ 111
Figure 65 In-situ SEM images for test 1 at 750 °C, subjected to a stress of 165 MPa
indicating the features observed during the primary creep stage a) Small cavities start to
develop after 5 hours of testing within the matrix and the grain boundaries c) Creep voids
formed at the end of an incoherent twin boundary. ............................................................... 112
Figure 66 Grain boundary separation at the edge of the specimen during the primary creep
stage a) After 5 hours at 165 MPa b) After 25 hours at 165 MPa .......................................... 113
Figure 67 In-situ SEM images showing the extent of grain boundary separation as the
stress levels are increased. a) After 25 hours at 209 MPa b) After 37 hours at 235 MPa c) After
19 hours at 252 MPa d) After 177 hours at 278 MPa ............................................................ 114
Figure 68 a) In-situ SEM image of the grain boundary separation due to the increasing
creep stress level b) CSL map showing the propagation of the cavitated grain boundaries. . 115
Figure 69 Nb-rich precipitates observed a) within the matrix b) on a grain boundary. . 116
xiv
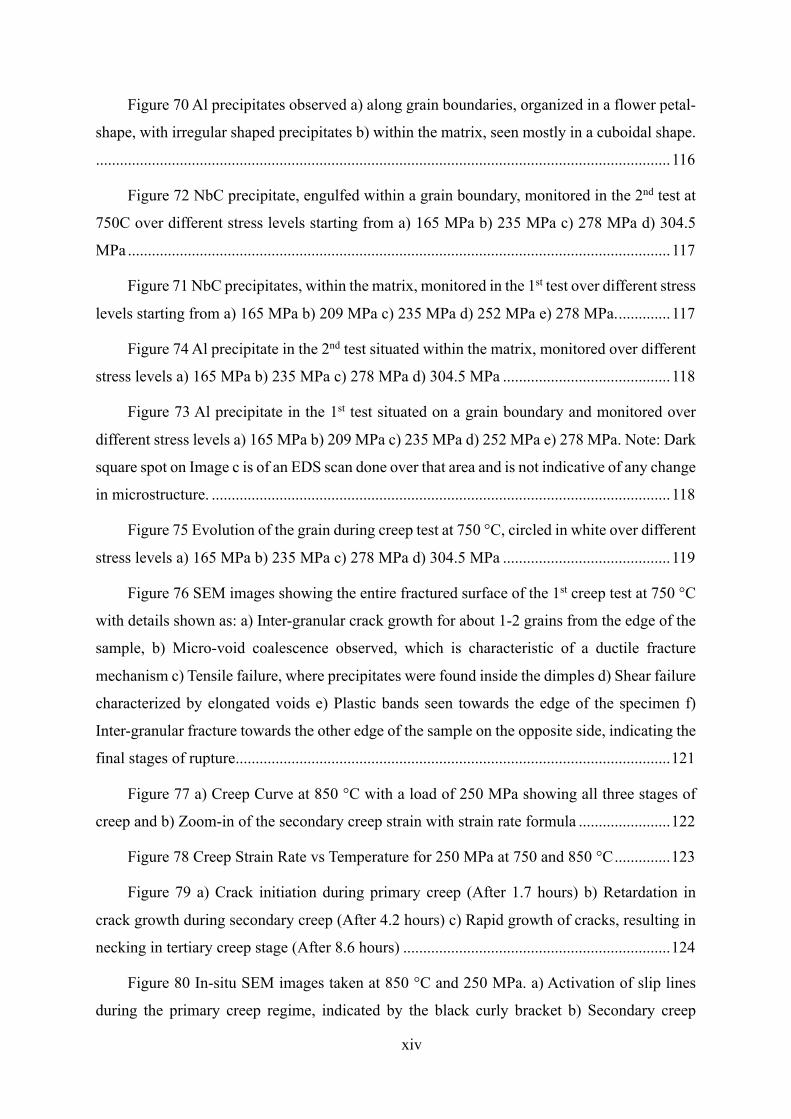
Figure 70 Al precipitates observed a) along grain boundaries, organized in a flower petal-
shape, with irregular shaped precipitates b) within the matrix, seen mostly in a cuboidal shape.
................................................................................................................................................ 116
Figure 72 NbC precipitate, engulfed within a grain boundary, monitored in the 2nd test at
750C over different stress levels starting from a) 165 MPa b) 235 MPa c) 278 MPa d) 304.5
MPa ........................................................................................................................................ 117
Figure 71 NbC precipitates, within the matrix, monitored in the 1st test over different stress
levels starting from a) 165 MPa b) 209 MPa c) 235 MPa d) 252 MPa e) 278 MPa. ............. 117
Figure 74 Al precipitate in the 2nd test situated within the matrix, monitored over different
stress levels a) 165 MPa b) 235 MPa c) 278 MPa d) 304.5 MPa .......................................... 118
Figure 73 Al precipitate in the 1st test situated on a grain boundary and monitored over
different stress levels a) 165 MPa b) 209 MPa c) 235 MPa d) 252 MPa e) 278 MPa. Note: Dark
square spot on Image c is of an EDS scan done over that area and is not indicative of any change
in microstructure. ................................................................................................................... 118
Figure 75 Evolution of the grain during creep test at 750 °C, circled in white over different
stress levels a) 165 MPa b) 235 MPa c) 278 MPa d) 304.5 MPa .......................................... 119
Figure 76 SEM images showing the entire fractured surface of the 1st creep test at 750 °C
with details shown as: a) Inter-granular crack growth for about 1-2 grains from the edge of the
sample, b) Micro-void coalescence observed, which is characteristic of a ductile fracture
mechanism c) Tensile failure, where precipitates were found inside the dimples d) Shear failure
characterized by elongated voids e) Plastic bands seen towards the edge of the specimen f)
Inter-granular fracture towards the other edge of the sample on the opposite side, indicating the
final stages of rupture ............................................................................................................. 121
Figure 77 a) Creep Curve at 850 °C with a load of 250 MPa showing all three stages of
creep and b) Zoom-in of the secondary creep strain with strain rate formula ....................... 122
Figure 78 Creep Strain Rate vs Temperature for 250 MPa at 750 and 850 °C .............. 123
Figure 79 a) Crack initiation during primary creep (After 1.7 hours) b) Retardation in
crack growth during secondary creep (After 4.2 hours) c) Rapid growth of cracks, resulting in
necking in tertiary creep stage (After 8.6 hours) ................................................................... 124
Figure 80 In-situ SEM images taken at 850 °C and 250 MPa. a) Activation of slip lines
during the primary creep regime, indicated by the black curly bracket b) Secondary creep
xv
regime characterized by out-of-plane grain boundary sliding indicated by the black arrow,
meanwhile ledge formation is shown by white arrows c) Tertiary creep regime shows extensive
grain boundary sliding, as indicated by the white arrow. ...................................................... 125
Figure 81 EDS results show that the precipitate is in fact an Al oxide .......................... 125
Figure 82 In-situ SEM images of the precipitate captured a) After 0.25 hours b) 1.35 hours
c) 4.9 hours d) 8.25 hours ...................................................................................................... 126
Figure 83 In-situ SEM images of the precipitate captured a) After 0.25 hours (primary
creep region), b) 1.35 hours (secondary creep) c) 4.9 hours (secondary creep) and d) 8.25 hours
(tertiary creep) ........................................................................................................................ 126
Figure 84 SEM image of the fractured surface of the specimen tested under 850 °C and
250 MPa loading with zoomed in areas showed as. a) Inter-granular initiation of the crack at
the edge of the sample, b) Deep dimples and plasticity within the sample and c) Micro-void
coalescence along with shear failure d) Intergranular fracture indicative of tertiary creep
towards the other edge of the sample. .................................................................................... 127
Figure 85 Schematic drawing of creep testpieces used. ................................................ 130
Figure 86 Creep curves of Alloy 709 tested at elevated temperatures. .......................... 131
Figure 87 Plot of minimum creep rates against stress measured in Alloy 709 at elevated
temperature. ........................................................................................................................... 132
Figure 96 Drawing of compact tension testpiece (CT) for creep crack growth tests. The
right graph shows how does an extensometer is attached on to the testpiece. ....................... 134
Figure 97 Experimental data (crack length and CMOD) from creep crack growth test in
Alloy 709 at 550°C. ............................................................................................................... 136
Figure 98 Optical and SEM fractographs of the creep crack growth test in Alloy 709 tested
at 550°C. Arrows in (a) indicate the location of each creep loading sessions. ...................... 137
Figure 99 Experimental data (crack length and CMOD) from creep crack growth test in
Alloy 709 at 650 and 750°C. ................................................................................................. 138
Figure 100 Optical and SEM fractographs of the creep crack growth test in Alloy 709
tested at 650°C. ...................................................................................................................... 139
Figure 101 Optical and SEM fractographs of the creep crack growth test in Alloy 709
tested at 750°C. ...................................................................................................................... 140
xvi
Figure 102 Creep crack growth resistance curve of Alloy 709 in the form of da/dt-K. 142
Figure 103 Creep crack growth resistance curve of Alloy 709 in the form of da/dt-C*.
................................................................................................................................................ 142
Figure 88 Drawing of Compact Tension (CT) testpiece for high temperature fatigue crack
growth resistance study (left) and a wiring method for direct current potential drop technique
(right). .................................................................................................................................... 145
Figure 89 Comparison of fatigue crack growth rates in Alloy 709 with different orientation.
................................................................................................................................................ 148
Figure 90 Fatigue crack growth resistance curves of Alloy 709 tested at different
temperatures. .......................................................................................................................... 149
Figure 91 Fatigue crack growth resistance curves of Alloy 709 tested in different
environments (air and vacuum). ............................................................................................ 149
Figure 92 Representative optical micrographs of failed Alloy 709 CT testpiece after
fatigeu crack growth testing. .................................................................................................. 150
Figure 93 SEM fratographs of fatigue crack growth at DK = 22 MPaÖm in Alloy 709.
................................................................................................................................................ 151
Figure 94 SEM fratographs of fatigue crack growth at DK = 30 MPaÖm in Alloy 709.
................................................................................................................................................ 152
Figure 95 SEM fratographs of fatigue crack growth at DK > 50 MPaÖm in Alloy 709.
................................................................................................................................................ 153
Figure 104 a) Loading and heating stage installed in the SEM with the sample loaded on
it. b) Sample set on loading and heating stage with EBSD inserted for mapping. ................ 155
Figure 105 EBSD map of pre-crack area introduced under cyclic loading at room
temperature a) IM 16 b) IM 26 c) IM 18 d) IM 19 ................................................................ 161
Figure 106 SEM images of the small crack-tip opening in all the samples tested a) IM 16
b) IM 26 c) IM 18 d) IM 19. The white arrows indicate the location of the crack-tip, whereas
the black arrows indicate the loading direction, which is the same in all the tests carried out.
................................................................................................................................................ 162
Figure 107 A) SEM images of the sample IM18, subjected to creep fatigue with 1-second
hold time at 95% of Yield stress tested at 750 °C showing the crack tip area at various delta K
xvii
values. B) Stitched CSL maps, displaying the entire crack path (using arrow heads) through the
sample surface and its interactions with various grain- and twin- boundaries. Figure 107-a-i
shows crack making an angle with slip planes while Figure 107-a-ii shows crack growth
parallel to slip plane both at lower delta K values. Figure 107-a-iii and Figure 107-a-iv show
transgranular crack growth at medium to high delta K values. ............................................. 164
Figure 108 An in-situ SEM image from the surface of sample IM18 subjected to creep
fatigue with a hold period of 1-second at maximum load tested at 750C, which shows the extent
of grain boundary cavitation at higher values of ΔK. The black arrow shows the location of the
crack-tip and the white arrows show the cavitated grain boundaries around the crack tip. .. 166
Figure 109 Crack growth rate da/dn vs ΔK for all samples undergoing creep fatigue with
different dwell time ................................................................................................................ 167
Figure 110 A) SEM image of the fractured surface of sample tested with 1 second dwell
fatigue test at 750 C showing: i), iii) and v) SEM images taken from the top surface of the
sample during the 1-second dwell fatigue revealing the transgranular crack growth and ii), iv)
and vi) fractographs from the same locations of the crack tip, but further down in the middle
of the sample as shown in the top image confirming the transgranular crack growth during the
1-second dwell fatigue test with some striations indicating stable crack growth in vi). ....... 168
Figure 111 A) SEM images of the sample IM26, subjected to creep fatigue with 1-minute
hold time at 95% of Yield stress tested at 750 °C showing the crack tip area at various delta K
values. B) Stitched CSL maps, displaying the entire crack path (using arrow heads) through the
sample surface and its interactions with various grain- and twin- boundaries. Inset (i) in Figure
111-b shows void nucleation at grain boundary. Inset (ii) in Figure 111-b shows crack arrest as
it is surrounded by twin boundaries and insets (iii) and (iv) in Figure 111-b show areas where
crack becomes transgranular to avoid twin boundary. ........................................................... 171
Figure 112 A) SEM image of the fractured surface of sample tested with 1-minute dwell
fatigue at 750 C showing different regimes of the crack propagation. i), iii) and v) SEM images
taken from the top surface of the sample during the 1-minute dwell fatigue showing i) area just
ahead of the pre-crack where the crack started to grow transgranular for a few grains and
became intergranular after that, iii) intergranular crack growth, v) transgranular crack growth
and ii), iv) and vi) SEM fractographs from the same locations of the crack tip, but further down
in the middle of the sample as shown in image (A) confirming the mixed mode crack growth
observation from the surface with ii) and iv) showing intergranular crack growth on the
xviii
fractured surface and vi) shows striations on the fractured surface. Well defined grains are
visible in the intergranular crack growth area. ΔK is 16 to 24 MPa√m ................................. 172
Figure 113 A) SEM and corresponding CSL maps of the sample IM19, subjected to creep
fatigue with alternate hold times of 1-second and 1-hour at 95% of YS at 750 °C. B) Stitched
CSL maps, displaying the entire crack path (using arrow heads) through the sample surface and
its interactions with various grain- and twin- boundaries for a ΔK range of 25-35. Inset (i) in
Figure 113-b shows grain boundary separation, inset (ii) shows transgranular crack growth and
flaky oxide layer on the surface and inset (iii) shows crack tip blunting due to major plasticity
occurring at high temperature and long holding times. ......................................................... 174
Figure 114A) SEM and corresponding CSL maps of the sample IM19, subjected to creep
fatigue with alternate hold times of 1-second and 1-hour at 95% of YS at 750 °C. B) Stitched
CSL maps, displaying the entire crack path (using arrow heads) through the sample surface and
its interactions with various grain- and twin- boundaries for a ΔK range of 25-35. Interesting
phenomenon have been boxed and enlarged in the form of in-situ SEM images in Figure 114-
a. Inset (i) in Figure 114-b shows grain boundary separation. inset (ii) shows transgranular
crack growth and flaky oxide layer and inset (iii) in Figure 114-b shows crack tip blunting 176
Figure 115 Crack length vs testing time for alloy 709 during In-situ SEM creep fatigue
test at 750 C with 1 hour and 1 second mixed hold time at maximum load. Pie charts show the
mode of crack growth for each load cycle block ................................................................... 177
Figure 116 Oxide layer characterization of Sample IM19, subjected to alternate hold
periods of 1-second and 1-hour, a) SEM image showing the 1st position where TEM foil was
lifted-out, b) SEM image of the TEM foil, c) Bright field scanning transmission electron
microscopy (BF-STEM) image of TEM foil. ........................................................................ 179
Figure 117 Oxide layer characterization of Sample IM19, subjected to alternate hold
periods of 1-second and 1-hour, a) SEM image showing the 2nd position where the TEM foil
was lifted-out, b) SEM image of TEM foil, c) BF-STEM image of the TEM foil. ............... 180
Figure 118 EDS maps of the oxide layer on sample IM19 subjected to alternate 1-second
and 1-hour hold periods, shows that the oxide layer is Cr-rich while there is a thin Si-rich oxide
between the Cr oxide layer and the base alloy. ...................................................................... 181
Figure 119 A) SEM image of the fractured surface of sample tested with blocks of loading
of 1-second and 1-hour dwell fatigue tested at 750 C showing different regimes of the crack
propagation. i), and v) show SEM images taken from the top surface of the sample during the
xix
1-hour dwell and iii) shows SEM image taken during 1 second dwell fatigue showing i) mixed
mode crack growth, iii) transgranular crack growth, and v) intergranular crack path. Figures ii),
iv) and vi) show SEM fractographs from the same locations of the crack tip, but further down
in the middle of the sample as shown image (A) confirming the mixed mode crack growth
observation in the initial 1-hour dwell fatigue loading, ii) showing mixed mode on the fractured
surface and iv) transgranular crack path during the 1-second dwell fatigue loading and vi)
intergranular crack growth during the final 1-hour dwell fatigue loading on the fractured
surface. Well defined grains are visible in the intergranular crack growth area. All white arrows
show transgranular crack path whereas white arrows show intergranular crack path. .......... 182
Figure 120 Crack length vs testing time for Alloy 709 during In-situ SEM creep fatigue
test at 750 C with varying hold time at maximum load ......................................................... 184
Figure 121 A comparison of pre and post-testing CSL maps of IM19 subjected to alternate
hold periods of 1-minute and 1-hour, at a higher ΔK range ~35 MPa m1/2, a) CSL map generated
before testing, showing a few interesting locations and the CSL maps of same location after the
crack growth on the left (b) and right (c) side of the crack. All twin boundaries are unchanged
while the main crack grew through the grain boundaries. ..................................................... 189
Figure 122 Twin boundary characterization of Sample IM19, subjected to alternate hold
periods of 1-second and 1-hour, a) SEM image showing the position at which the TEM foil
was lifted-out, b) SEM images of the TEM foil. Note: Some voids (e.g. as seen in Figure b)
below the oxide layer and at boundaries, came from Kirkendall effect. But further milling leads
those voids getting bigger ...................................................................................................... 190
Figure 123 BF-STEM image of the TEM foil of Sample IM19 shown in Figure 15, where
Selected area diffraction patterns (SAD) from the twin boundary have been marked by a white
circle (note: small spots are from the twin boundary precipitate). ........................................ 191
Figure 124 Testing procedure of dwell fatigue crack growth. ....................................... 194
Figure 125 Schematic drawing of 1-3600-1-1 dwell fatigue loading waveform and 0.25Hz
sinusoidal fatigue waveform. ................................................................................................. 195
Figure 126 Dwell fatigue and fatigue crack growth resistance curves of Alloy 709 tested
at 550°C. ................................................................................................................................ 197
Figure 127 Dwell fatigue and fatigue crack growth resistance curves of Alloy 709 tested
at 650°C. ................................................................................................................................ 198
xx
Figure 128 Dwell fatigue and fatigue crack growth resistance curves of Alloy 709 tested
at 750°C. ................................................................................................................................ 199
Figure 129 TEM micrographs of Alloy 709 after dwell fatigue crack growth testing under
650°C. .................................................................................................................................... 200
Figure 130 Optical micrographs of failed Alloy 709 CT testpiece after dwell fatigue crack
growth testing at different temperatures. The red arrows indicate different dwell fatigue loading
segments. ................................................................................................................................ 202
Figure 131 SEM fractographs of crack growth under the 2nd 1-3600-1-1 dwell fatigue
loading block in Alloy 709 CT-4 tested at 650°C and the 0.25Hz baseline fatigue crack growth
regions before and after the dwell fatigue loading block. ...................................................... 203
Figure 132 SEM fractographs showing transgranular failure mechanism during the 1st 1-
3600-1-1 dwell fatigue loading block in Alloy 709 CT-4 tested under 650°C. ..................... 204
Figure 133 SEM fractographs of intergranular failure mechanism under 1-3600-1-1 dwell
fatigue loading. (a) and (b): 2nd dwell fatigue block of Alloy709 CT-4 tested at 650°C in air; (c)
and (d): 1st dwell fatigue block of 316H tested at 650°C in air. ............................................. 204
Figure 134 SEM fractographs showing transition from transgranular to intergranular
failure during 3rd 1-3600-1-1 dwell fatigue loading block in Alloy 709 CT-1 tested at 550 ˚C in
air. ........................................................................................................................................... 205
Figure 135 SEM fractographs showing ductile fracture failure mechanism during (a) the
3rd1-3600-1-1 dwell fatigue loading block in Alloy 709 CT-4 tested at 650 °C in air; and (b)
Alloy709 CT-5 tested at 750°C in air. .................................................................................... 206
Figure 136 Secondary electron image (a), EBSD image quality map (b), inverse pole
figure map (c) and local misorientation map (d) of Alloy 709 CT-1 2nd dwell ΔK~36 MPa√m.
................................................................................................................................................ 207
Figure 137 Secondary electron image and EBSD maps of a secondary crack at ΔK~36
MPa√m during the 2nd 1-3600-1-1 dwell fatigue loading block in Alloy 709 CT-4 tested at
650°C in air. (a) SEM image; (b) band contrast map with arrows indicating intergranular
cracking; (c) Inverse Pole Figure map; and (d) Local Misorientation map. .......................... 208
Figure 138 Secondary electron image and EBSD maps of a secondary crack at ΔK~50
MPa√m during the 3rd 1-3600-1-1 dwell fatigue loading block in Alloy 709 CT-4 tested at
xxi
650°C in air. (a) SEM image; (b) band contrast map; (c) Inverse Pole Figure map; and (d) Local
Misorientation map. ............................................................................................................... 209
Figure 139 Mechanism map showing the failure mechanisms of creep-fatigue crack
growth in Alloy 709. .............................................................................................................. 212
Figure 140 Crack growth resistance curves under 1-3600-1-1 dwell fatigue loading for
Alloy 709 tested at different temperatures. ............................................................................ 214
Figure 141 Optical image of etched samples showing the microstructure of (a) and (b)
Alloy 709 and (c) and (d) 316H. ............................................................................................ 218
Figure 142 Comparison of creep crack growth resistance of Alloy 709 and 316H at 650°C
................................................................................................................................................ 219
Figure 143 Comparison of the dwell fatigue and fatigue crack growth resistance of Alloy
709 and 316H at 650°C. ......................................................................................................... 220
Figure 144 Schematic drawing of the notched bar testpiece used for Charpy impact testing.
................................................................................................................................................ 222
Figure 145 Optical fractographs of failed Charpy impact tests, (a) as-received Alloy 709;
(b) Alloy 709 aged at 650°C for 2000 hours. ......................................................................... 223
Figure 146 SEM fractographs of Charpy impact tests. (a) and (b) showing a ductile failure
mechanism in the as-received Alloy 709; (c) and (d) showing a brittle failure mechanism. . 224
Figure 147 Creep crack growth resistance curves tested in as-received and aged Alloy 709.
................................................................................................................................................ 225
Figure 148 Optical and SEM fractographs showing the failure mechanism of creep crack
growth in aged Aloy709. ........................................................................................................ 226
22
1 Introduction and overview
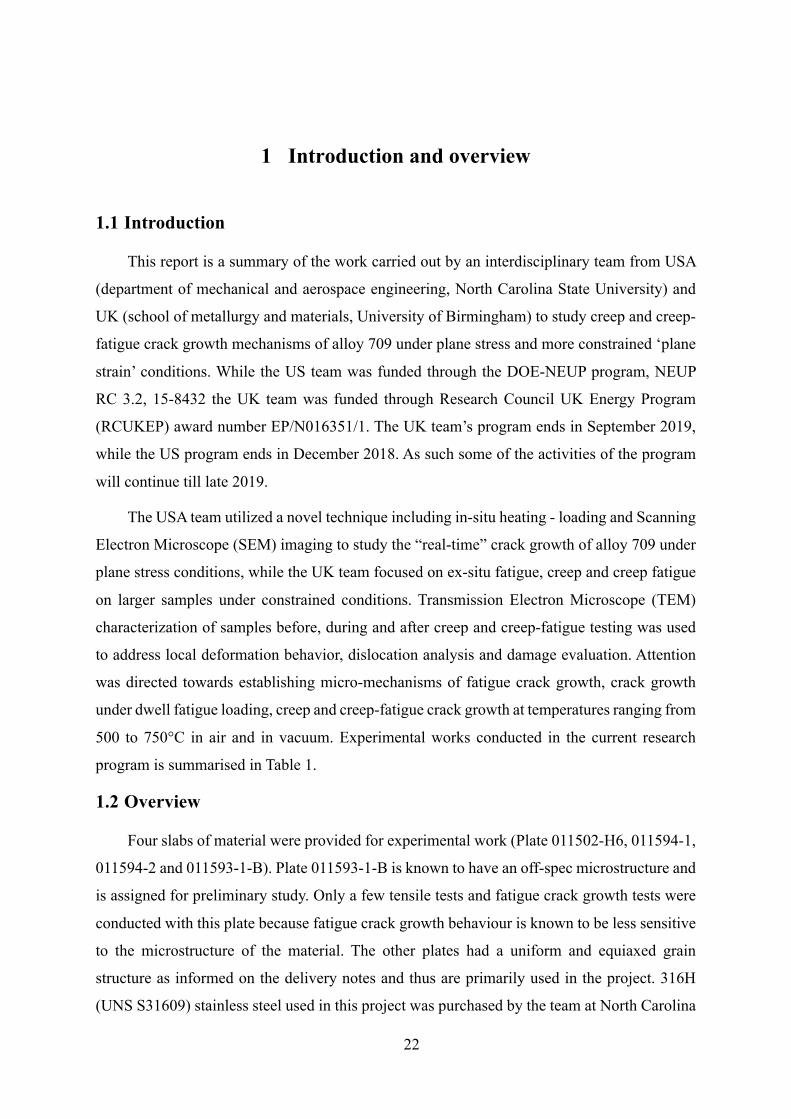
1.1 Introduction
This report is a summary of the work carried out by an interdisciplinary team from USA
(department of mechanical and aerospace engineering, North Carolina State University) and
UK (school of metallurgy and materials, University of Birmingham) to study creep and creep-
fatigue crack growth mechanisms of alloy 709 under plane stress and more constrained ‘plane
strain’ conditions. While the US team was funded through the DOE-NEUP program, NEUP
RC 3.2, 15-8432 the UK team was funded through Research Council UK Energy Program
(RCUKEP) award number EP/N016351/1. The UK team’s program ends in September 2019,
while the US program ends in December 2018. As such some of the activities of the program
will continue till late 2019.
The USA team utilized a novel technique including in-situ heating - loading and Scanning
Electron Microscope (SEM) imaging to study the “real-time” crack growth of alloy 709 under
plane stress conditions, while the UK team focused on ex-situ fatigue, creep and creep fatigue
on larger samples under constrained conditions. Transmission Electron Microscope (TEM)
characterization of samples before, during and after creep and creep-fatigue testing was used
to address local deformation behavior, dislocation analysis and damage evaluation. Attention
was directed towards establishing micro-mechanisms of fatigue crack growth, crack growth
under dwell fatigue loading, creep and creep-fatigue crack growth at temperatures ranging from
500 to 750°C in air and in vacuum. Experimental works conducted in the current research
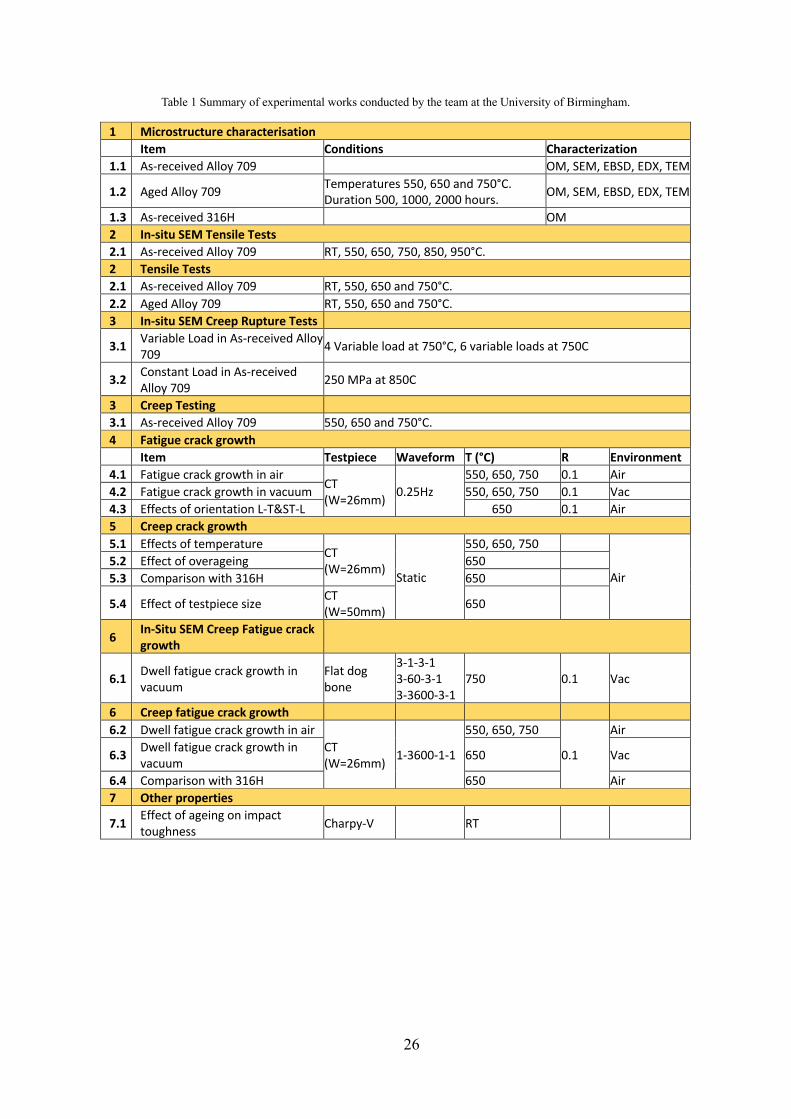
program is summarised in Table 1.
1.2 Overview
Four slabs of material were provided for experimental work (Plate 011502-H6, 011594-1,
011594-2 and 011593-1-B). Plate 011593-1-B is known to have an off-spec microstructure and
is assigned for preliminary study. Only a few tensile tests and fatigue crack growth tests were
conducted with this plate because fatigue crack growth behaviour is known to be less sensitive
to the microstructure of the material. The other plates had a uniform and equiaxed grain
structure as informed on the delivery notes and thus are primarily used in the project. 316H
(UNS S31609) stainless steel used in this project was purchased by the team at North Carolina
23
State University from SIJ Acroni Steel to compare the properties of alloy 709 with 316H. Brief
introductions to each part of the program are listed below.
• Microstructure characterization (grain size and precipitates) have been conducted on
Alloy 709 in its as-received condition and after several different thermal exposure
conditions (ageing) using both SEM and TEM. The thermal exposure temperature ranged
from 550 to 750°C for various periods of time ranged from 500 to 2000 hours. The aim of
the latter is to investigate the microstructural evolution during service.
• In-situ SEM tensile tests on flat dog-bone samples in vacuum. In-situ tensile tests were
conducted on flat dog-bone samples in their as-received condition at room temperature,
550˚C, 650˚C, 750˚C, 850˚C and 950˚C. Surface deformation observations were made
using SEM imaging and EBSD analysis during loading and heating. This was accompanied
by post failure fractographic analysis. At 750˚C, tensile tests were performed on samples
with and without pre-crack along rolling direction and transverse to the rolling direction. A
tensile test at 850˚C and at a slow displacement rate of 0.1um/s or strain rate of 2.608e-4
/min was performed on their as-received condition, on sample without precrack.
Fractographic analysis was performed.
• Tensile tests on cylindrical samples were conducted on Alloy 709 in its as-received
condition and after a thermal exposure at 650°C for 2000 hours. The experiments were
conducted at room temperature, 550, 650 and 750°C. Young’s modulus, yield stress and
Ultimate Tensile Stress (UTS) were evaluated for each condition. Another set of tests were
interrupted at a nominal strain of ~2%, which allowed the investigation of deformation
mechanism using TEM.
• Fatigue crack growth behaviour of Alloy 709 was tested using compact tension (CT)
testpieces at 550, 650 and 750°C in both air and vacuum environments using a sinusoidal
loading waveform with a frequency of 0.25 Hz. Linear elastic fracture mechanics parameter
stress intensity factor range, ΔK, was used to correlate the crack growth rates. Failure
mechanism under fatigue was studied using Scanning Electron Microscopes. Effects of
temperature and environment were analysed. Such results set a baseline for creep-fatigue
crack growth of Alloy 709.
• Creep properties of Alloy 709 were tested on cylindrical testpieces in a commercial test
house. Only Alloy 709 in its as-received condition was investigated. Tests were conducted
at 550, 650 and 750°C. Since creep properties at 650 and 750°C were already available
within Oak Ridge National Laboratory, the emphasis was put on 550°C, the aim of which
24
was to acquire the creep exponent at this temperature. This efforts continue till September
2019, when the UK program will wrap up.
• In-situ SEM creep-rupture tests of alloy 709 in its as-received condition were conducted
on flat testpieces with a continuously reducing cross-section. Tests were conducted at
750°C and 850°C. Creep properties such as stress exponent and activation energy were
found. This efforts will continue till September 2019 by the US team, when the UK program
will wrap up.
• Creep crack growth resistance of Alloy 709 was also tested using CT testpieces but the
design is slightly different. This type of CT testpieces contains knife edges along the load
line for the clip-on gauge to mount on. The clip-on gauge, therefore, measures the crack
mouth opening displacement which is used to calculate the elastic-plastic fracture
mechanics parameter C*. Such creep crack growth tests were mainly conducted on as-
received Alloy 709 at 550, 650 and 750°C in air. Majority of the creep crack growth tests
used CT specimens with a width of 26 mm and a thickness of 12 mm. To investigate the
potential influence of constrain on creep crack growth, a larger CT testpiece with a width
of 50 mm and a thickness of 20 mm was also tested.
• Creep-fatigue crack growth behaviour of Alloy 709 was tested using CT testpiece similar
to the one used for fatigue crack growth. A trapezoidal waveform with a 1-hour dwell
period at the peak load has been used here to evaluate the influence of dwell on crack
growth mechanisms. The tests were conducted at 550, 650 and 750°C in air. A limited
number of tests were conducted in a vacuum to isolate any contribution from air
environment. After testing, the fracture surface of each testpiece was examined using SEM.
Metallographic sections were made on some testpieces which allow SEM observations and
EBSD mapping to be performed to help with identification of the failure mechanism.
• In-situ SEM creep fatigue test on flat dog-bone samples in vacuum with slow loading
rate and various dwell times from one second to one minute and one hour at peak tensile
load were conducted at 750C on samples in their as-received condition. A combination of
“real-time” insitu-SEM fracture behavior observation along with fractography, TEM
observation and EBSD mapping utilized to assess the failure mechanisms.
• Alloy 316H was also investigated in the current project to compare with Alloy 709. Except
for tensile and creep properties, fatigue, creep and creep-fatigue crack growth behaviour
was tested using the testpieces and testing conditions similar to those used for Alloy 709 at
650°C.
25
• Effects of ageing on the mechanical properties of Alloy 709 was studied with the
microstructural evaluation and comparison before and after thermal exposure of 2000 hours
at 650°C. The investigation was made on tensile properties, Charpy impact toughness and
creep crack growth.
1.3 List of participants
North Carolina State University:
• Professor Afsaneh Rabiei, Principal Investigator,
• Dr. John Durham, Research Fellow,
• Ms. Amrita Lall, PhD candidate,
• Mr. Siddhartha Sarkar, PhD candidate,
• Ms. Swathi Upadhyay, Masters Student graduated
University of Birmingham:
• Professor Paul Bowen, Principal Investigator,
• Dr Hangyue Li, Senior Research Fellow,
• Dr Rengen Ding, Senior Research Fellow,
• Dr Suyang Yu, Research Fellow,
• Dr Steven Street, Research Fellow,
• Miss Jin Yan, PhD candidate,
• Mr Conor Fraser, Master student,
• Mr Serge Ngaboyisonga, Undergraduate student,
• Mr Zak Viney, Undergraduate student,
26
Table 1 Summary of experimental works conducted by the team at the University of Birmingham.
1 Microstructure characterisation Item Conditions Characterization 1.1 As-received Alloy 709 OM, SEM, EBSD, EDX, TEM
1.2 Aged Alloy 709 Temperatures 550, 650 and 750°C. Duration 500, 1000, 2000 hours. OM, SEM, EBSD, EDX, TEM
1.3 As-received 316H OM 2 In-situ SEM Tensile Tests 2.1 As-received Alloy 709 RT, 550, 650, 750, 850, 950°C. 2 Tensile Tests 2.1 As-received Alloy 709 RT, 550, 650 and 750°C. 2.2 Aged Alloy 709 RT, 550, 650 and 750°C. 3 In-situ SEM Creep Rupture Tests
3.1 Variable Load in As-received Alloy 709 4 Variable load at 750°C, 6 variable loads at 750C
3.2 Constant Load in As-received Alloy 709 250 MPa at 850C
3 Creep Testing 3.1 As-received Alloy 709 550, 650 and 750°C. 4 Fatigue crack growth Item Testpiece Waveform T (°C) R Environment 4.1 Fatigue crack growth in air
CT (W=26mm) 0.25Hz
550, 650, 750 0.1 Air 4.2 Fatigue crack growth in vacuum 550, 650, 750 0.1 Vac 4.3 Effects of orientation L-T&ST-L 650 0.1 Air 5 Creep crack growth 5.1 Effects of temperature
CT (W=26mm) Static
550, 650, 750
Air 5.2 Effect of overageing 650 5.3 Comparison with 316H 650
5.4 Effect of testpiece size CT (W=50mm) 650
6 In-Situ SEM Creep Fatigue crack growth
6.1 Dwell fatigue crack growth in vacuum
Flat dog bone
3-1-3-1 3-60-3-1 3-3600-3-1
750 0.1 Vac
6 Creep fatigue crack growth 6.2 Dwell fatigue crack growth in air
CT (W=26mm) 1-3600-1-1
550, 650, 750
0.1
Air
6.3 Dwell fatigue crack growth in vacuum 650 Vac
6.4 Comparison with 316H 650 Air 7 Other properties
7.1 Effect of ageing on impact toughness Charpy-V RT

27
2 Microstructure of Alloy709
(The content of this chapter has been submitted as a journal article to Material Science
and Engineering A in March 2019 as:
Authors-Rengen Ding, Jin Yan, Hangyue Li, Suyang Yu, Afsaneh Rabiei and Paul Bowen.
Title- “Microstructural evolution of Alloy 709 during aging”, Submitted to Materials
Science and Engineering A in March 2019.)
28
The Alloy 709 used in this study was fabricated using vacuum-induction melting and
electro-slag remelting by Carpenter Technologies. The ingot was homogenized at 1250°C for
4h, hot forged at 1100°C and then rolled at 1100°C. The hot-rolled plate was finally annealed
at 1100°C for 2 h, followed by water-quenching.
To investigate microstructure evolution during ageing, small blocks of materials cut off
from the plate were sealed in quartz tubes which were filled with argon and aged in a furnace
at 550, 650 and 750°C for 500, 1000, 2000 h, respectively. Since Alloy 709 is regarded as a
candidate structural material for the sodium-cooled fast reactor where its service temperature
is 500-550°C, the study of its microstructural evolution at 550°C is of especial importance. An
aging time of 2000 h is still short compared to its service life and thus higher temperatures (650
and 750°C) were also used to promote microstructural evolution. As the precipitation behaviour
of NF709 at 750°C has been reported, the study of Alloy 709 at 750°C will reveal the effect of
minor element variation (i.e. Ti) on precipitate behaviour.
Specimens for optical and scanning electron microscopy (SEM) were prepared following
a standard metallographic procedure and etched with a solution of 10 pct (by mass) oxalic acid
in distilled water. The grain size was measured using an Oxford Instruments Nordlys EBSD
(electron backscatter diffraction) detector with a step size of 2 µm. Thin foils 3mm in diameter
for transmission electron microscopy (TEM) were electropolished in a solution of 10%
perchloric acid + 90% ethanol at 20V and -20°C, using a twin-jet electropolisher. TEM
observations were carried out on FEI Tecnai F20 and Talos F200X microscopes operating at
200 kV, both equipped with a Silicon Drift Detector (SDD) for energy–dispersive X-ray
spectrometry (EDS).
2.1 Results and discussion
2.1.1 Microstructure of as-received sample
The average grain size of the as-received material is 45 µm, which was determined using
EBSD, as shown in Figure 1. ~ 50% of boundaries are Σ3 twin boundaries. No evidence of
strong texture was found in the as-received samples, which means that annealing at 1100°C
alleviated the texture produced by rolling. A typical backscattered electron (BSE) image
(Figure 2(a)) shows a band-like distribution of white particles. EDS analysis indicates that these
white particles are Nb-rich carbonitride (i.e. Nb(CN)) (Figure 2(b))Such large Nb(CN) particles
could form during casting and then break down and align along the rolling direction during
29
rolling. Thus, this type of carbonitride with size in the range 1~ 10 microns is designated
primary Nb(CN). A considerable number of nano-sized particles is also found, as shown in
Figure 3. EDS mapping indicates that most of them are also Nb carbonitrides (Figure 3). The
selected area diffraction (SAD) pattern shows that they have an fcc structure with lattice
parameter a = 0.44 nm (Figure 3d). The size range of such residual Nb(CN) particles is from
0.05 to 0.4 µm. They could precipitate during cooling after solidification and annealing and are
referred to as secondary Nb(CN). Very occasionally, rod-like particles are found (Figure 3e).
Spot EDS reveals that the particle is (Cr,Nb)-rich nitride (Figure 3f). SAD (Figure 3g) suggests
that such particles have a tetragonal structure with lattice parameters of a = 0.30nm and c =
0.74nm. These results demonstrate that the (Cr,Nb)-rich nitride is Z-phase (CrNbN).[ 1 ] No
other type of precipitate was found. It should be noted here that a few dislocations were
observed, which could have been induced by water quenching.
Figure 1 (a) Inverse Pole Figure (IPF) EBSD map of as-received Alloy 709, (b) EBSD grain boundary map showing high angle grain boundaries in black, Σ3 twin boundaries in red and low angle grain boundaries in green and (c) a profile of
misorientation angles showing ~50% Σ3 (twin) boundaries.
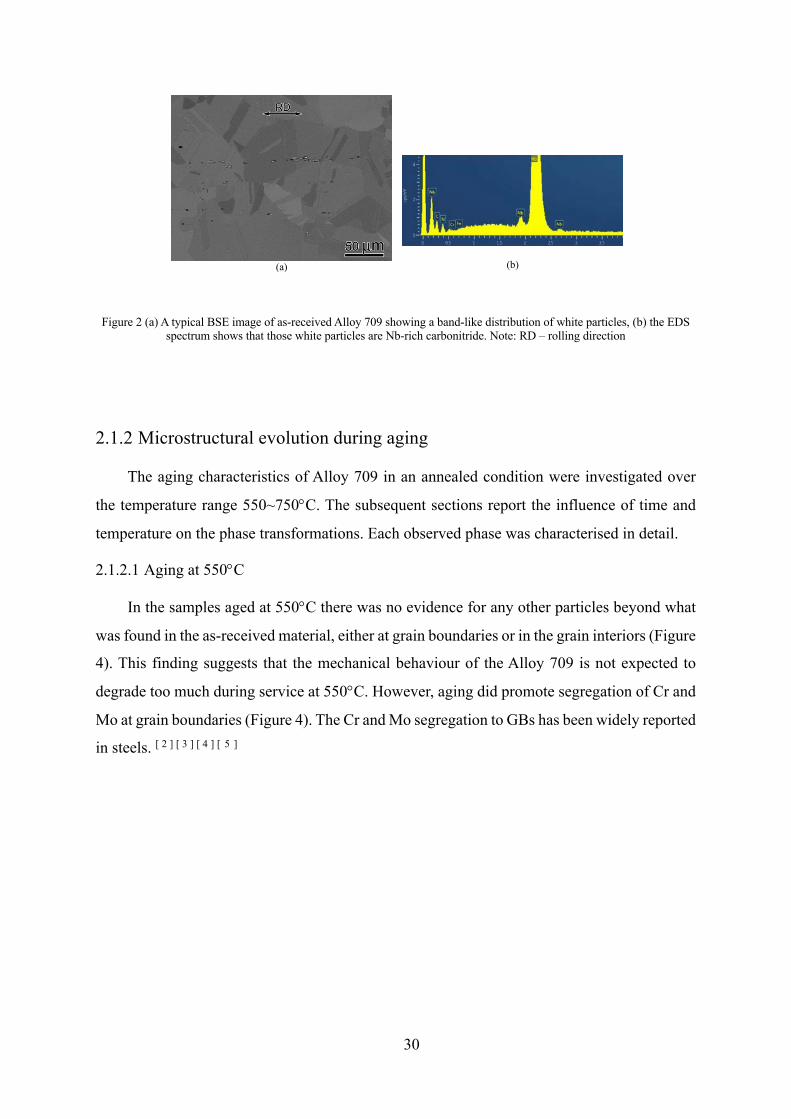
30
Figure 2 (a) A typical BSE image of as-received Alloy 709 showing a band-like distribution of white particles, (b) the EDS spectrum shows that those white particles are Nb-rich carbonitride. Note: RD – rolling direction
2.1.2 Microstructural evolution during aging
The aging characteristics of Alloy 709 in an annealed condition were investigated over
the temperature range 550~750°C. The subsequent sections report the influence of time and
temperature on the phase transformations. Each observed phase was characterised in detail.
2.1.2.1 Aging at 550°C
In the samples aged at 550°C there was no evidence for any other particles beyond what
was found in the as-received material, either at grain boundaries or in the grain interiors (Figure
4). This finding suggests that the mechanical behaviour of the Alloy 709 is not expected to
degrade too much during service at 550°C. However, aging did promote segregation of Cr and
Mo at grain boundaries (Figure 4). The Cr and Mo segregation to GBs has been widely reported
in steels. [ 2 ] [ 3 ] [ 4 ] [ 5 ]
(a)
(b)
31
Figure 3 (a) Bright field (BF) scanning transmission electron microscopy (STEM) image and (b) high angle annular dark field (HAADF) STEM image of the as-received material show nano-sized precipitates. (c) EDS mapping suggests that these particles are Nb carbonitrides, (d) selected area diffraction patterns (SAD) recorded along [1#11] from a Nb(CN) precipitate,
(e) HAADF –STEM image of rod shaped Z-phase, (f) EDS spectrum from the Z-phase and (g) SAD pattern taken along [010] zone axis from the Z-phase.
(a)
(b)
(c)
(d)
(e)
(f)
(g)
0 1 2 3 4 5 6 7 80
1000
2000
3000
4000Nb
NiFe
Fe
Fe
Cr
Cr
Cr
Cou
nts
keV
N
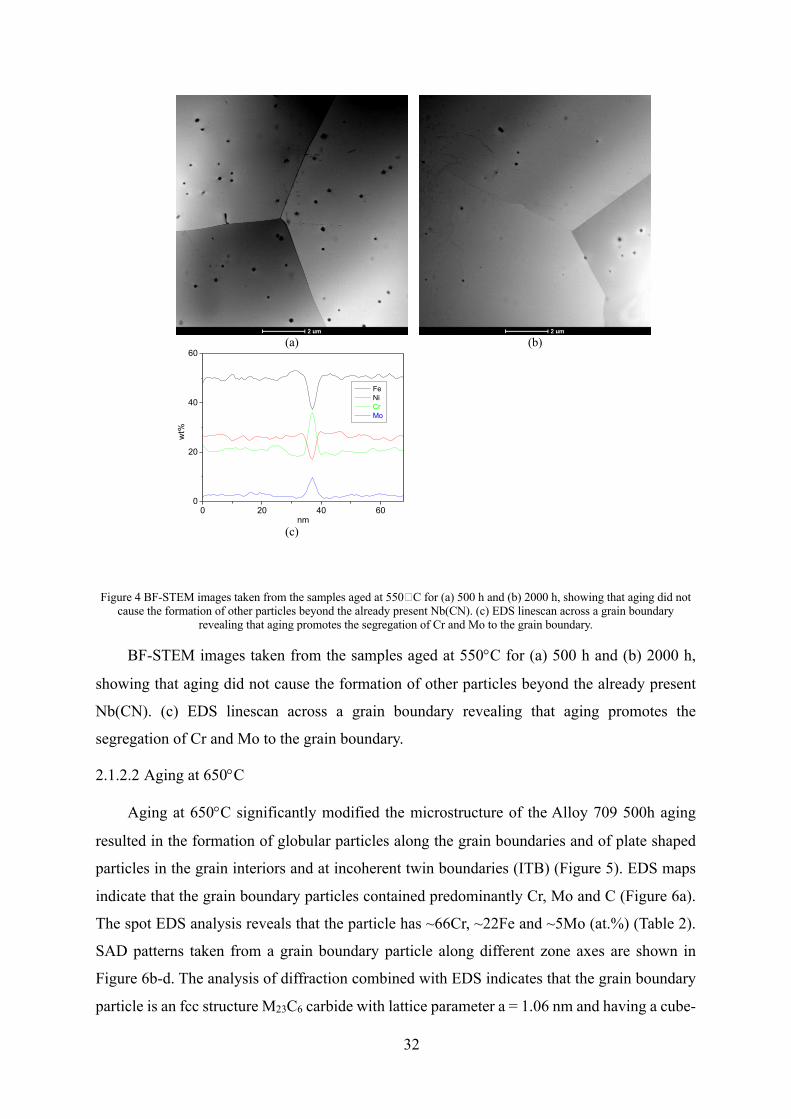
32
Figure 4 BF-STEM images taken from the samples aged at 550�C for (a) 500 h and (b) 2000 h, showing that aging did not cause the formation of other particles beyond the already present Nb(CN). (c) EDS linescan across a grain boundary
revealing that aging promotes the segregation of Cr and Mo to the grain boundary.
BF-STEM images taken from the samples aged at 550°C for (a) 500 h and (b) 2000 h,
showing that aging did not cause the formation of other particles beyond the already present
Nb(CN). (c) EDS linescan across a grain boundary revealing that aging promotes the
segregation of Cr and Mo to the grain boundary.
2.1.2.2 Aging at 650°C
Aging at 650°C significantly modified the microstructure of the Alloy 709 500h aging
resulted in the formation of globular particles along the grain boundaries and of plate shaped
particles in the grain interiors and at incoherent twin boundaries (ITB) (Figure 5). EDS maps
indicate that the grain boundary particles contained predominantly Cr, Mo and C (Figure 6a).
The spot EDS analysis reveals that the particle has ~66Cr, ~22Fe and ~5Mo (at.%) (Table 2).
SAD patterns taken from a grain boundary particle along different zone axes are shown in
Figure 6b-d. The analysis of diffraction combined with EDS indicates that the grain boundary
particle is an fcc structure M23C6 carbide with lattice parameter a = 1.06 nm and having a cube-
(a)
(b)
(c)
0 20 40 600
20
40
60
wt%
nm
Fe Ni Cr Mo
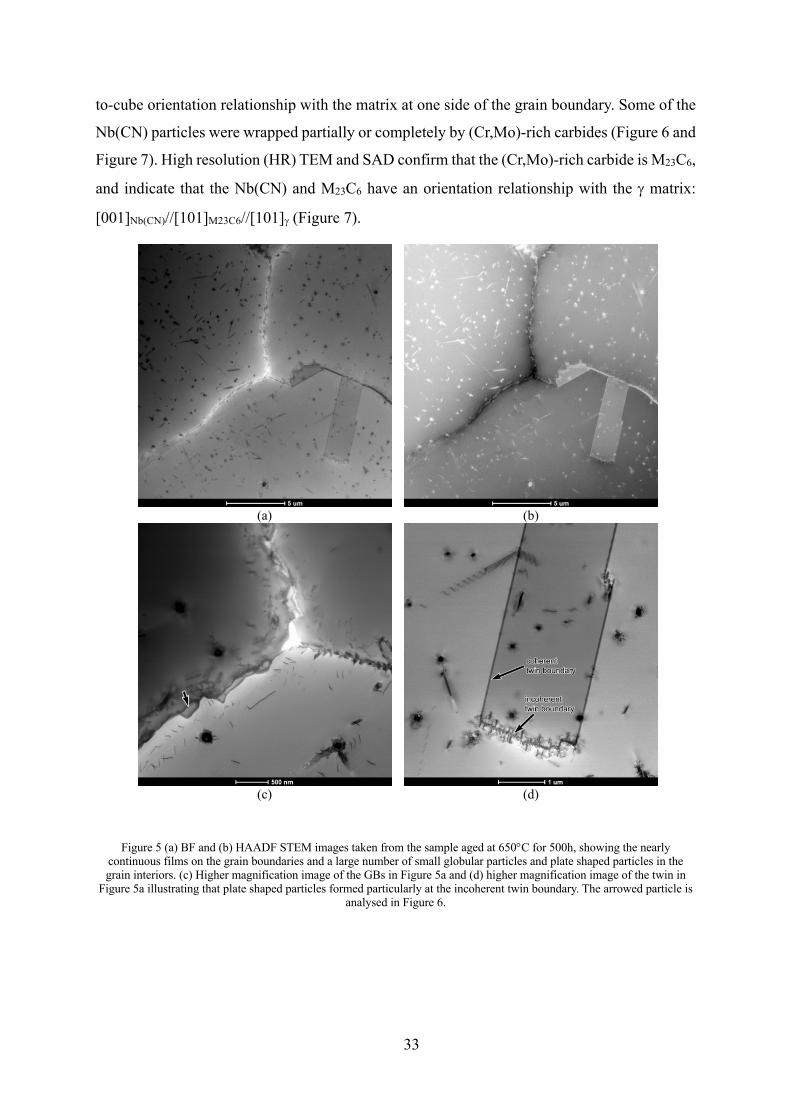
33
to-cube orientation relationship with the matrix at one side of the grain boundary. Some of the
Nb(CN) particles were wrapped partially or completely by (Cr,Mo)-rich carbides (Figure 6 and
Figure 7). High resolution (HR) TEM and SAD confirm that the (Cr,Mo)-rich carbide is M23C6,
and indicate that the Nb(CN) and M23C6 have an orientation relationship with the g matrix:
[001]Nb(CN)//[101]M23C6//[101]g (Figure 7).
Figure 5 (a) BF and (b) HAADF STEM images taken from the sample aged at 650°C for 500h, showing the nearly
continuous films on the grain boundaries and a large number of small globular particles and plate shaped particles in the grain interiors. (c) Higher magnification image of the GBs in Figure 5a and (d) higher magnification image of the twin in
Figure 5a illustrating that plate shaped particles formed particularly at the incoherent twin boundary. The arrowed particle is analysed in Figure 6.
(a)
(b)
(c)
(d)
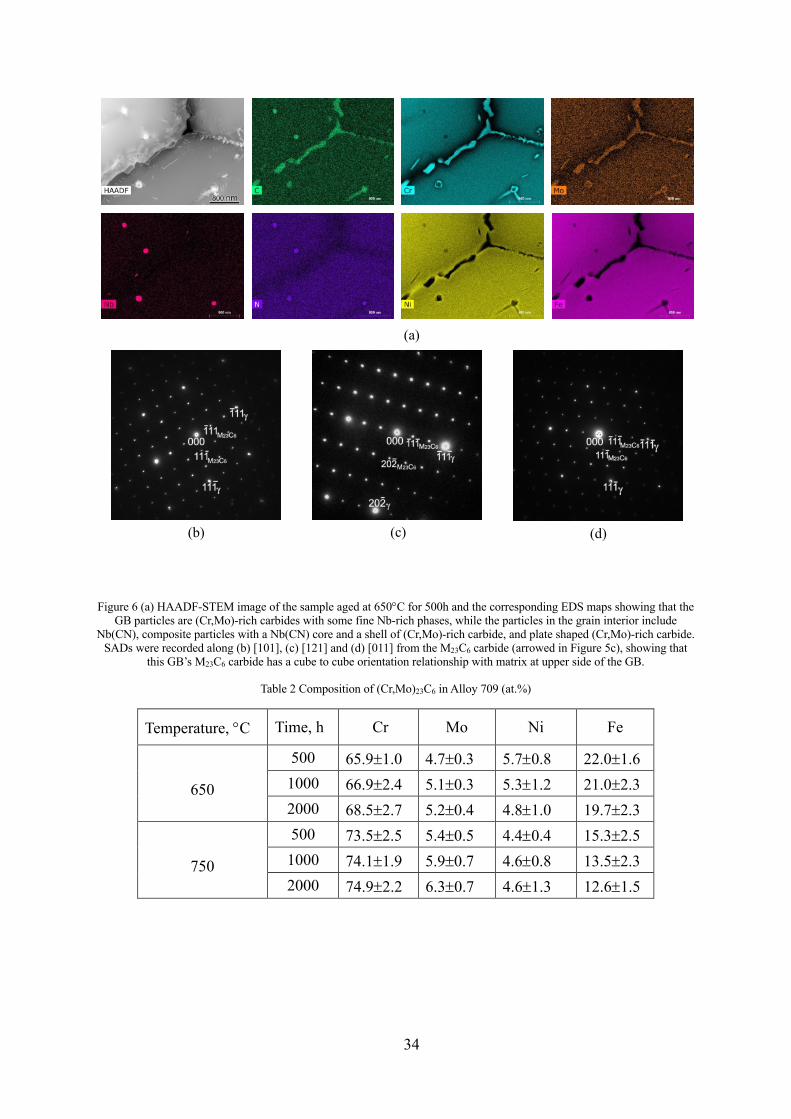
34
Figure 6 (a) HAADF-STEM image of the sample aged at 650°C for 500h and the corresponding EDS maps showing that the
GB particles are (Cr,Mo)-rich carbides with some fine Nb-rich phases, while the particles in the grain interior include Nb(CN), composite particles with a Nb(CN) core and a shell of (Cr,Mo)-rich carbide, and plate shaped (Cr,Mo)-rich carbide.
SADs were recorded along (b) [101], (c) [121] and (d) [011] from the M23C6 carbide (arrowed in Figure 5c), showing that this GB’s M23C6 carbide has a cube to cube orientation relationship with matrix at upper side of the GB.
Table 2 Composition of (Cr,Mo)23C6 in Alloy 709 (at.%)
Temperature, °C Time, h Cr Mo Ni Fe
650
500 65.9±1.0 4.7±0.3 5.7±0.8 22.0±1.6 1000 66.9±2.4 5.1±0.3 5.3±1.2 21.0±2.3 2000 68.5±2.7 5.2±0.4 4.8±1.0 19.7±2.3
750
500 73.5±2.5 5.4±0.5 4.4±0.4 15.3±2.5 1000 74.1±1.9 5.9±0.7 4.6±0.8 13.5±2.3 2000 74.9±2.2 6.3±0.7 4.6±1.3 12.6±1.5
(a)
(b)
(c)
(d)
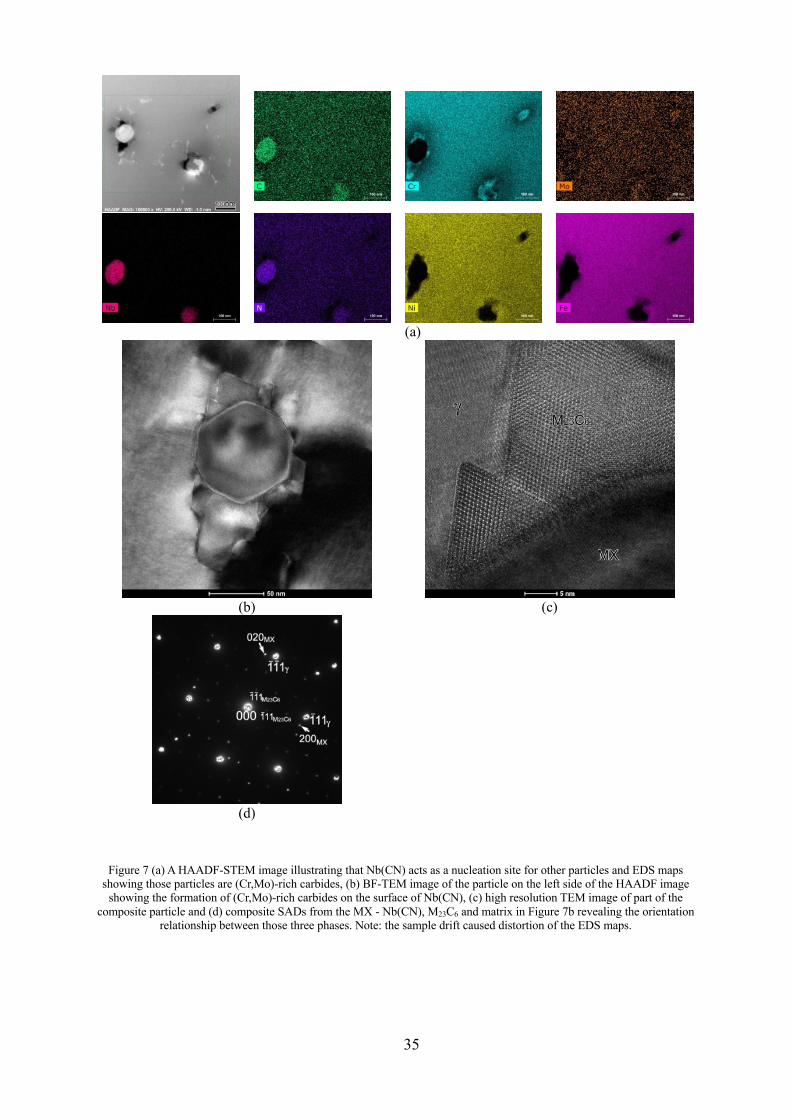
35
Figure 7 (a) A HAADF-STEM image illustrating that Nb(CN) acts as a nucleation site for other particles and EDS maps
showing those particles are (Cr,Mo)-rich carbides, (b) BF-TEM image of the particle on the left side of the HAADF image showing the formation of (Cr,Mo)-rich carbides on the surface of Nb(CN), (c) high resolution TEM image of part of the
composite particle and (d) composite SADs from the MX - Nb(CN), M23C6 and matrix in Figure 7b revealing the orientation relationship between those three phases. Note: the sample drift caused distortion of the EDS maps.
(a)
(b)
(c)
(d)
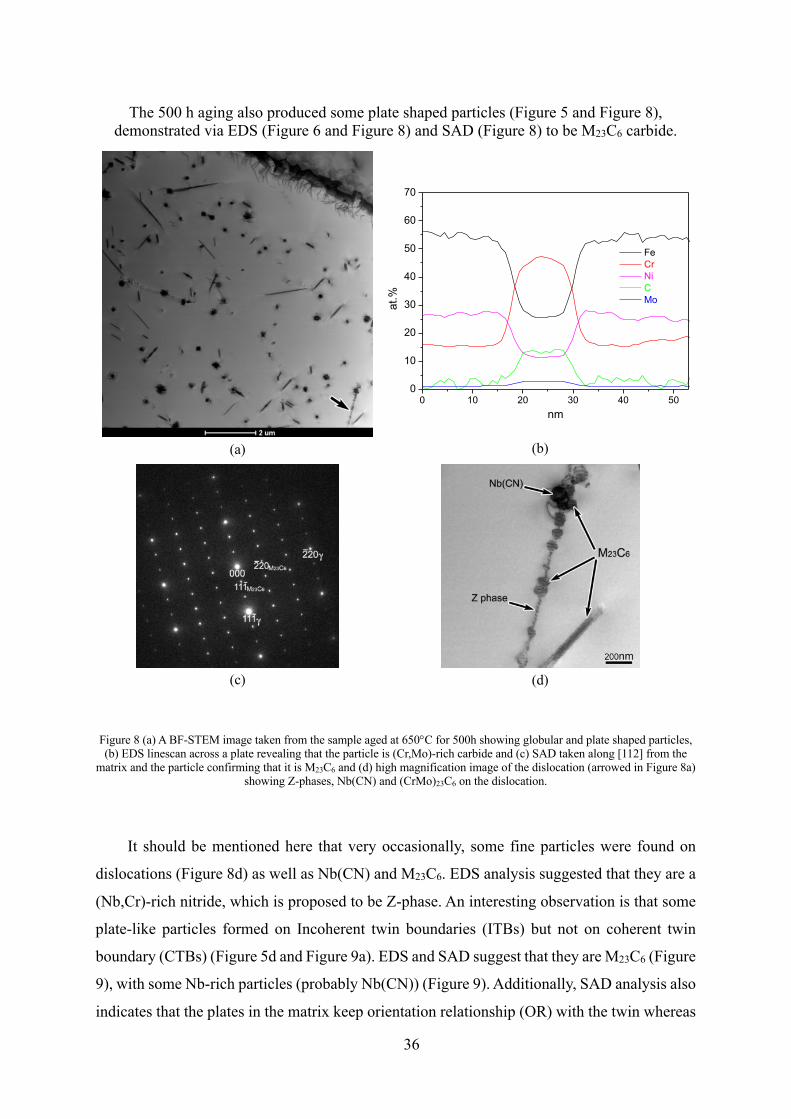
36
The 500 h aging also produced some plate shaped particles (Figure 5 and Figure 8), demonstrated via EDS (Figure 6 and Figure 8) and SAD (Figure 8) to be M23C6 carbide.
Figure 8 (a) A BF-STEM image taken from the sample aged at 650°C for 500h showing globular and plate shaped particles, (b) EDS linescan across a plate revealing that the particle is (Cr,Mo)-rich carbide and (c) SAD taken along [112] from the
matrix and the particle confirming that it is M23C6 and (d) high magnification image of the dislocation (arrowed in Figure 8a) showing Z-phases, Nb(CN) and (CrMo)23C6 on the dislocation.
It should be mentioned here that very occasionally, some fine particles were found on
dislocations (Figure 8d) as well as Nb(CN) and M23C6. EDS analysis suggested that they are a
(Nb,Cr)-rich nitride, which is proposed to be Z-phase. An interesting observation is that some
plate-like particles formed on Incoherent twin boundaries (ITBs) but not on coherent twin
boundary (CTBs) (Figure 5d and Figure 9a). EDS and SAD suggest that they are M23C6 (Figure
9), with some Nb-rich particles (probably Nb(CN)) (Figure 9). Additionally, SAD analysis also
indicates that the plates in the matrix keep orientation relationship (OR) with the twin whereas
(a)
(b)
(c)
(d)
0 10 20 30 40 500
10
20
30
40
50
60
70
Fe Cr Ni C Mo
at.%
nm
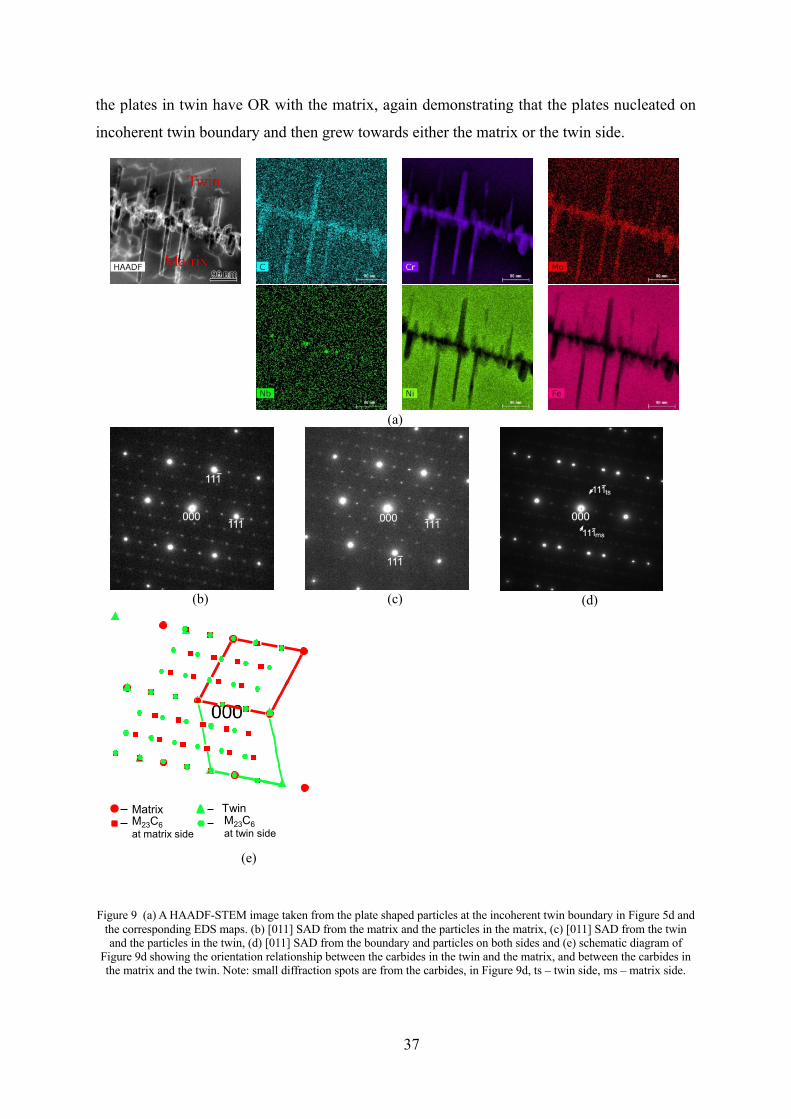
37
the plates in twin have OR with the matrix, again demonstrating that the plates nucleated on
incoherent twin boundary and then grew towards either the matrix or the twin side.
Figure 9 (a) A HAADF-STEM image taken from the plate shaped particles at the incoherent twin boundary in Figure 5d and
the corresponding EDS maps. (b) [011] SAD from the matrix and the particles in the matrix, (c) [011] SAD from the twin and the particles in the twin, (d) [011] SAD from the boundary and particles on both sides and (e) schematic diagram of
Figure 9d showing the orientation relationship between the carbides in the twin and the matrix, and between the carbides in the matrix and the twin. Note: small diffraction spots are from the carbides, in Figure 9d, ts – twin side, ms – matrix side.
(a)
(b)
(c)
(d)
(e)
Matrix TwinM23C6at matrix side
M23C6at twin side
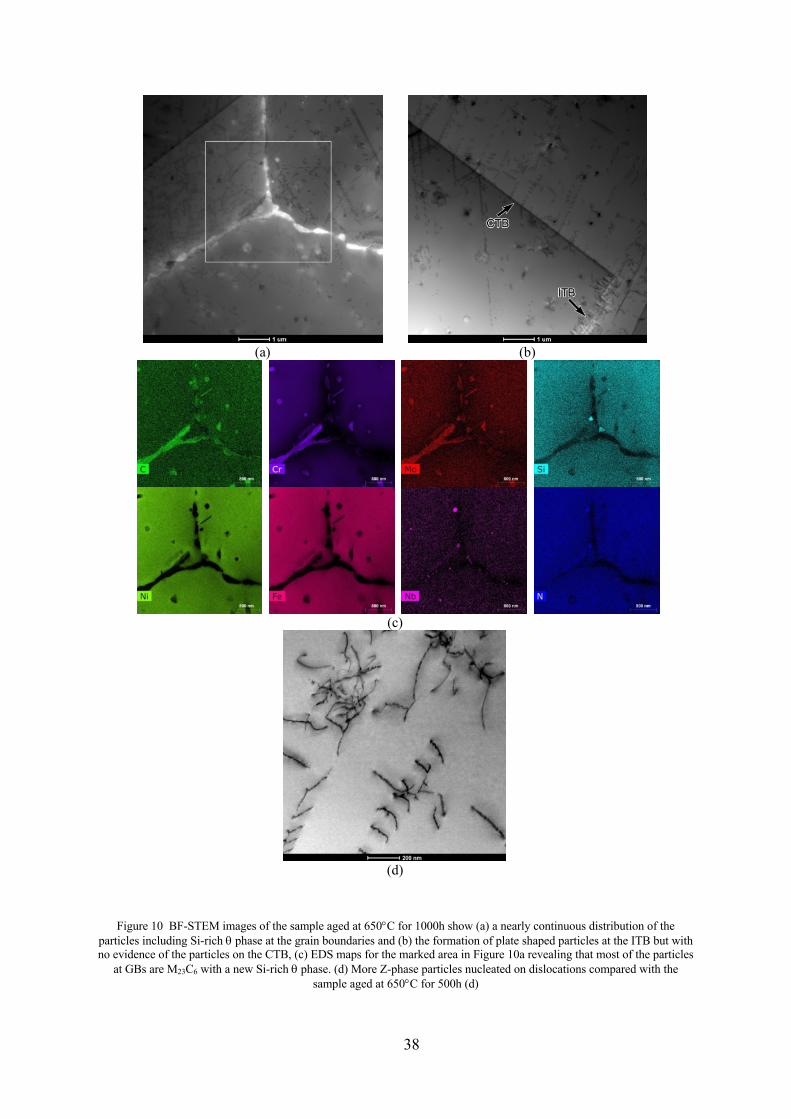
38
Figure 10 BF-STEM images of the sample aged at 650°C for 1000h show (a) a nearly continuous distribution of the
particles including Si-rich q phase at the grain boundaries and (b) the formation of plate shaped particles at the ITB but with no evidence of the particles on the CTB, (c) EDS maps for the marked area in Figure 10a revealing that most of the particles
at GBs are M23C6 with a new Si-rich q phase. (d) More Z-phase particles nucleated on dislocations compared with the sample aged at 650°C for 500h (d)
(a)
(b)
(c)
(d)
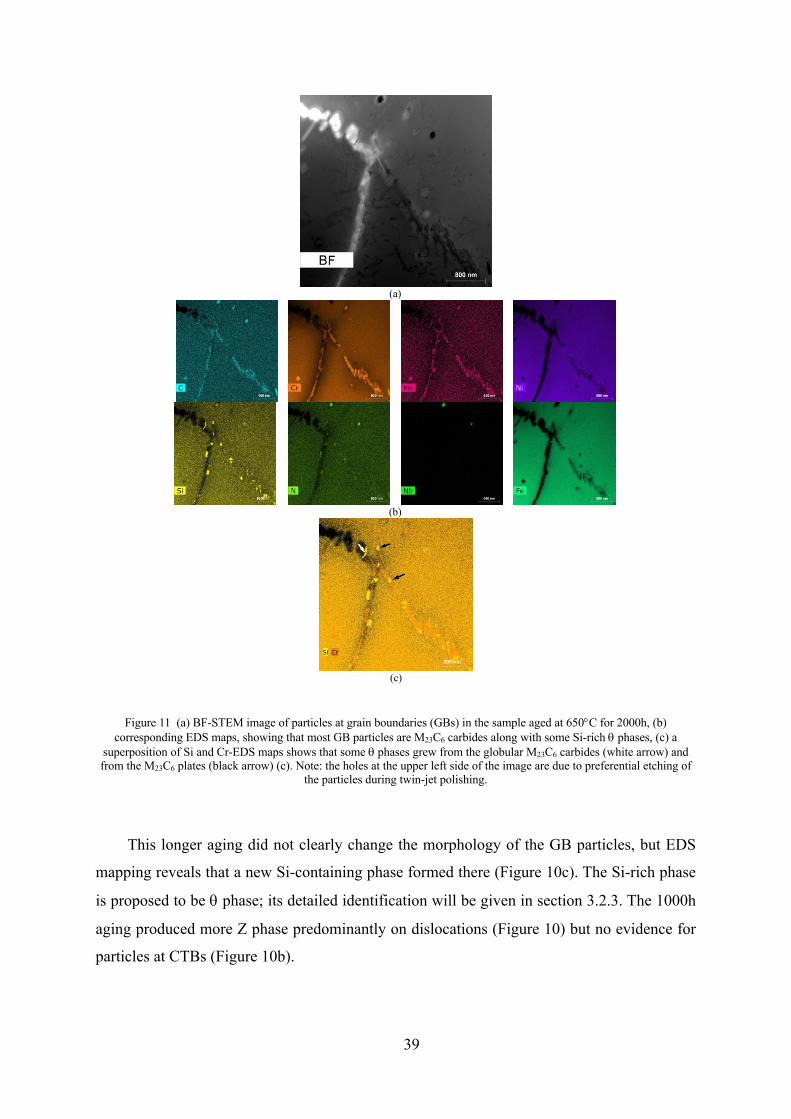
39
Figure 11 (a) BF-STEM image of particles at grain boundaries (GBs) in the sample aged at 650°C for 2000h, (b)
corresponding EDS maps, showing that most GB particles are M23C6 carbides along with some Si-rich q phases, (c) a superposition of Si and Cr-EDS maps shows that some q phases grew from the globular M23C6 carbides (white arrow) and from the M23C6 plates (black arrow) (c). Note: the holes at the upper left side of the image are due to preferential etching of
the particles during twin-jet polishing.
This longer aging did not clearly change the morphology of the GB particles, but EDS
mapping reveals that a new Si-containing phase formed there (Figure 10c). The Si-rich phase
is proposed to be q phase; its detailed identification will be given in section 3.2.3. The 1000h
aging produced more Z phase predominantly on dislocations (Figure 10) but no evidence for
particles at CTBs (Figure 10b).
(a)
(b)
(c)
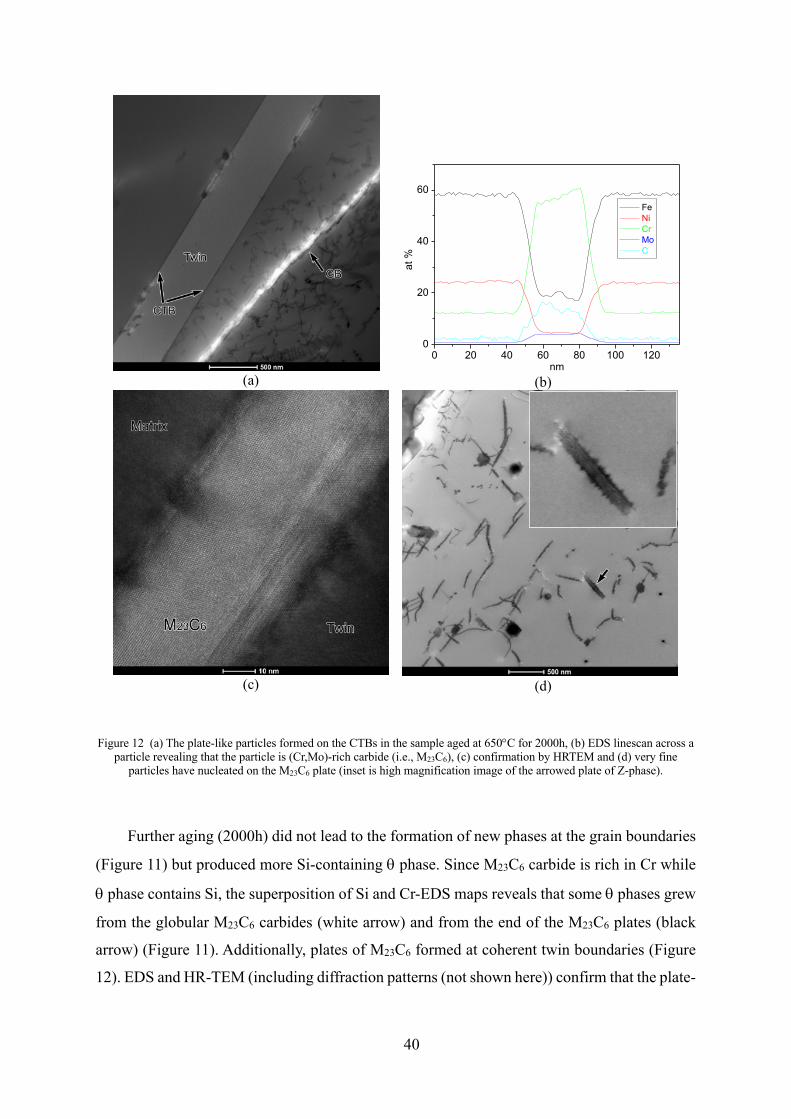
40
Figure 12 (a) The plate-like particles formed on the CTBs in the sample aged at 650°C for 2000h, (b) EDS linescan across a
particle revealing that the particle is (Cr,Mo)-rich carbide (i.e., M23C6), (c) confirmation by HRTEM and (d) very fine particles have nucleated on the M23C6 plate (inset is high magnification image of the arrowed plate of Z-phase).
Further aging (2000h) did not lead to the formation of new phases at the grain boundaries
(Figure 11) but produced more Si-containing q phase. Since M23C6 carbide is rich in Cr while
q phase contains Si, the superposition of Si and Cr-EDS maps reveals that some q phases grew
from the globular M23C6 carbides (white arrow) and from the end of the M23C6 plates (black
arrow) (Figure 11). Additionally, plates of M23C6 formed at coherent twin boundaries (Figure
12). EDS and HR-TEM (including diffraction patterns (not shown here)) confirm that the plate-
(a)
(b)
(c)
(d)
0 20 40 60 80 100 1200
20
40
60
at %
nm
Fe Ni Cr Mo C
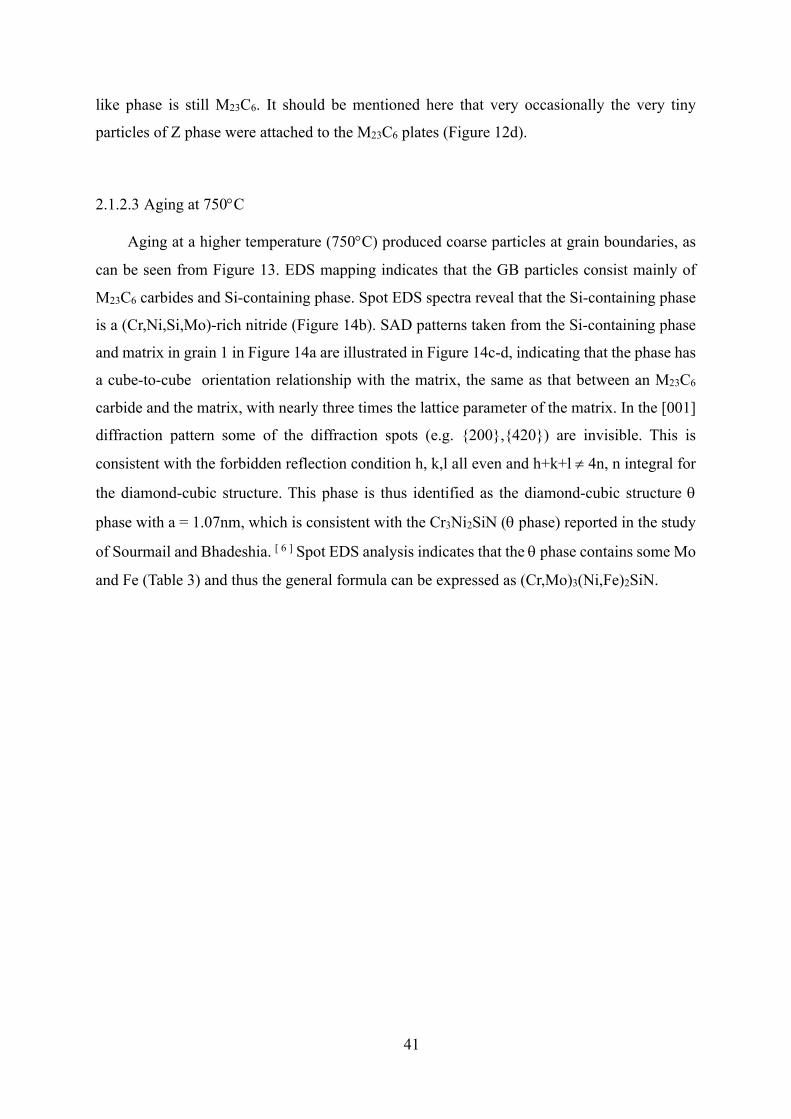
41
like phase is still M23C6. It should be mentioned here that very occasionally the very tiny
particles of Z phase were attached to the M23C6 plates (Figure 12d).
2.1.2.3 Aging at 750°C
Aging at a higher temperature (750°C) produced coarse particles at grain boundaries, as
can be seen from Figure 13. EDS mapping indicates that the GB particles consist mainly of
M23C6 carbides and Si-containing phase. Spot EDS spectra reveal that the Si-containing phase
is a (Cr,Ni,Si,Mo)-rich nitride (Figure 14b). SAD patterns taken from the Si-containing phase
and matrix in grain 1 in Figure 14a are illustrated in Figure 14c-d, indicating that the phase has
a cube-to-cube orientation relationship with the matrix, the same as that between an M23C6
carbide and the matrix, with nearly three times the lattice parameter of the matrix. In the [001]
diffraction pattern some of the diffraction spots (e.g. {200},{420}) are invisible. This is
consistent with the forbidden reflection condition h, k,l all even and h+k+l ¹ 4n, n integral for
the diamond-cubic structure. This phase is thus identified as the diamond-cubic structure q
phase with a = 1.07nm, which is consistent with the Cr3Ni2SiN (q phase) reported in the study
of Sourmail and Bhadeshia. [ 6 ] Spot EDS analysis indicates that the q phase contains some Mo
and Fe (Table 3) and thus the general formula can be expressed as (Cr,Mo)3(Ni,Fe)2SiN.
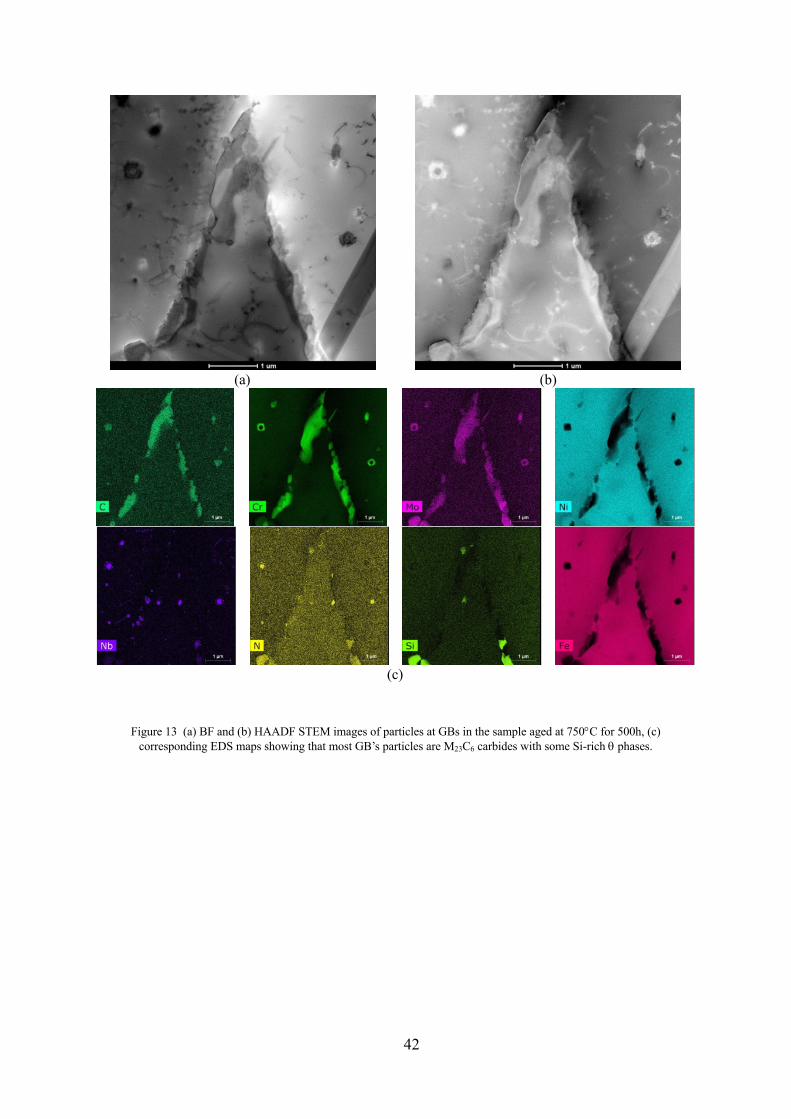
42
Figure 13 (a) BF and (b) HAADF STEM images of particles at GBs in the sample aged at 750°C for 500h, (c)
corresponding EDS maps showing that most GB’s particles are M23C6 carbides with some Si-rich q phases.
(a)
(b)
(c)
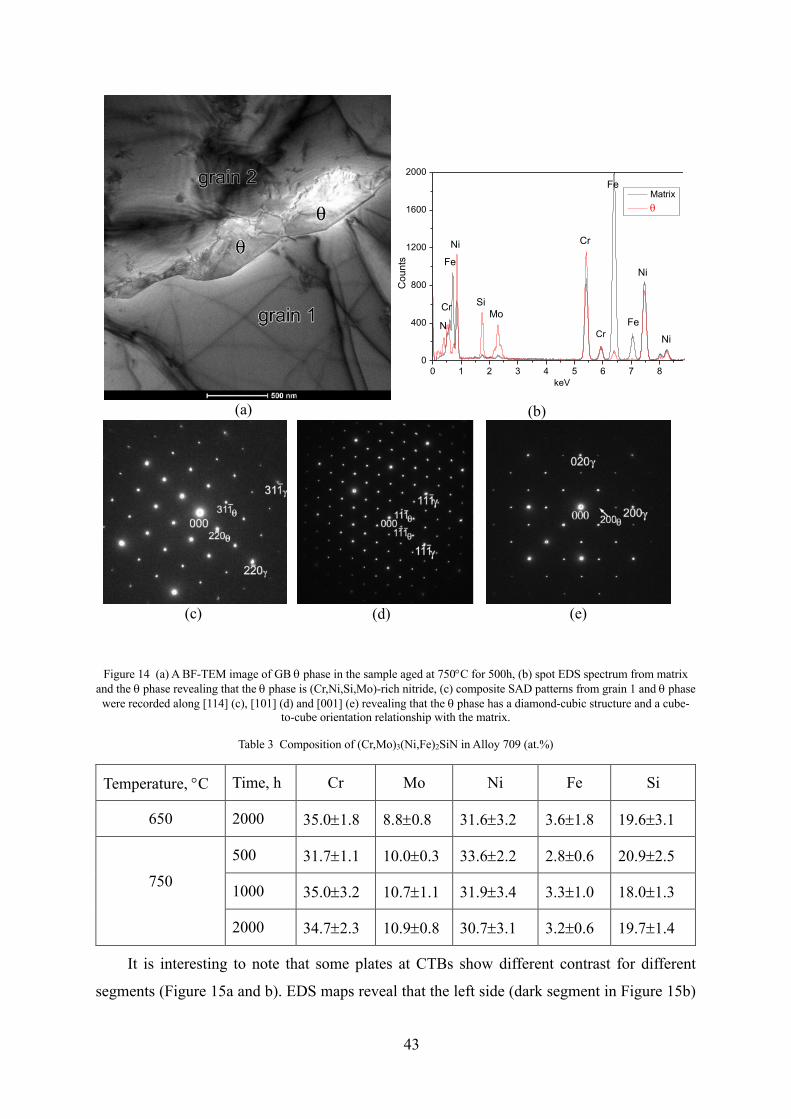
43
Figure 14 (a) A BF-TEM image of GB q phase in the sample aged at 750°C for 500h, (b) spot EDS spectrum from matrix
and the q phase revealing that the q phase is (Cr,Ni,Si,Mo)-rich nitride, (c) composite SAD patterns from grain 1 and q phase were recorded along [114] (c), [101] (d) and [001] (e) revealing that the q phase has a diamond-cubic structure and a cube-
to-cube orientation relationship with the matrix.
Table 3 Composition of (Cr,Mo)3(Ni,Fe)2SiN in Alloy 709 (at.%)
Temperature, °C Time, h Cr Mo Ni Fe Si
650 2000 35.0±1.8 8.8±0.8 31.6±3.2 3.6±1.8 19.6±3.1
750
500 31.7±1.1 10.0±0.3 33.6±2.2 2.8±0.6 20.9±2.5
1000 35.0±3.2 10.7±1.1 31.9±3.4 3.3±1.0 18.0±1.3
2000 34.7±2.3 10.9±0.8 30.7±3.1 3.2±0.6 19.7±1.4
It is interesting to note that some plates at CTBs show different contrast for different
segments (Figure 15a and b). EDS maps reveal that the left side (dark segment in Figure 15b)
(a)
(b)
(c)
(d)
(e)
0 1 2 3 4 5 6 7 8 90
400
800
1200
1600
2000
Ni
Ni
Fe
Matrix q
Si
N
Ni
Cr
Fe
Fe
Cr
Mo
Cou
nts
keV
Cr
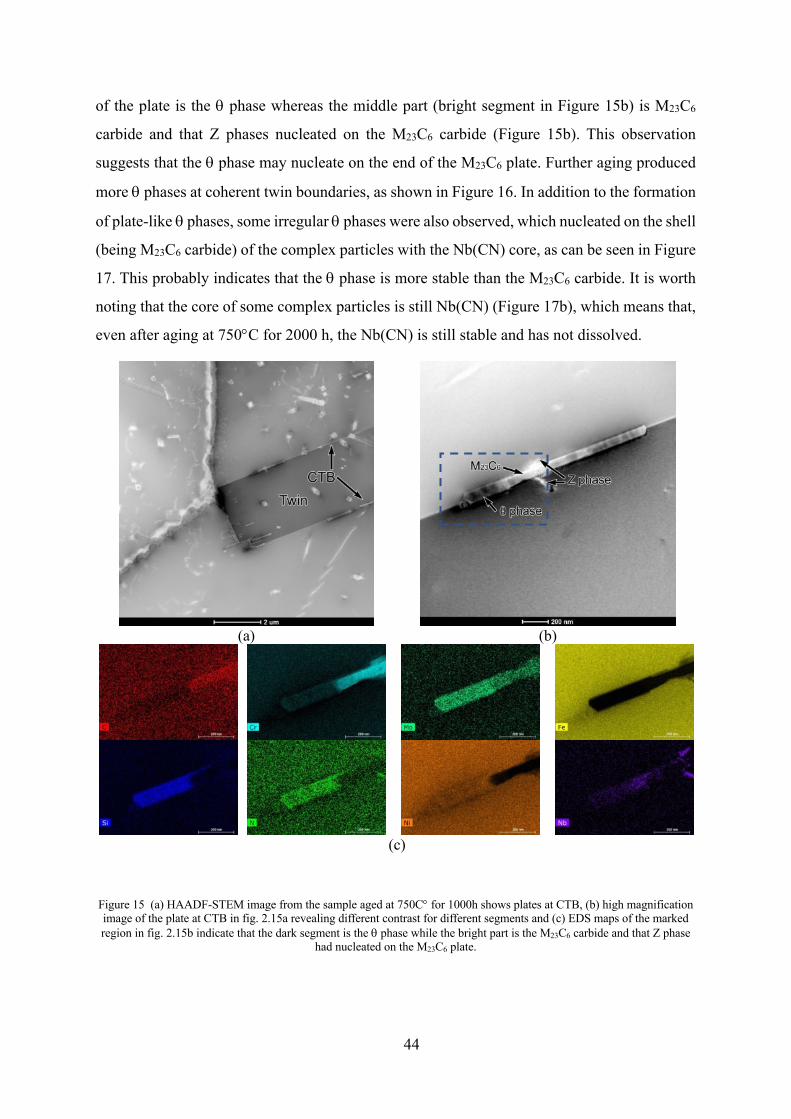
44
of the plate is the q phase whereas the middle part (bright segment in Figure 15b) is M23C6
carbide and that Z phases nucleated on the M23C6 carbide (Figure 15b). This observation
suggests that the q phase may nucleate on the end of the M23C6 plate. Further aging produced
more q phases at coherent twin boundaries, as shown in Figure 16. In addition to the formation
of plate-like q phases, some irregular q phases were also observed, which nucleated on the shell
(being M23C6 carbide) of the complex particles with the Nb(CN) core, as can be seen in Figure
17. This probably indicates that the q phase is more stable than the M23C6 carbide. It is worth
noting that the core of some complex particles is still Nb(CN) (Figure 17b), which means that,
even after aging at 750°C for 2000 h, the Nb(CN) is still stable and has not dissolved.
Figure 15 (a) HAADF-STEM image from the sample aged at 750C° for 1000h shows plates at CTB, (b) high magnification image of the plate at CTB in fig. 2.15a revealing different contrast for different segments and (c) EDS maps of the marked region in fig. 2.15b indicate that the dark segment is the q phase while the bright part is the M23C6 carbide and that Z phase
had nucleated on the M23C6 plate.
(a)
(b)
(c)
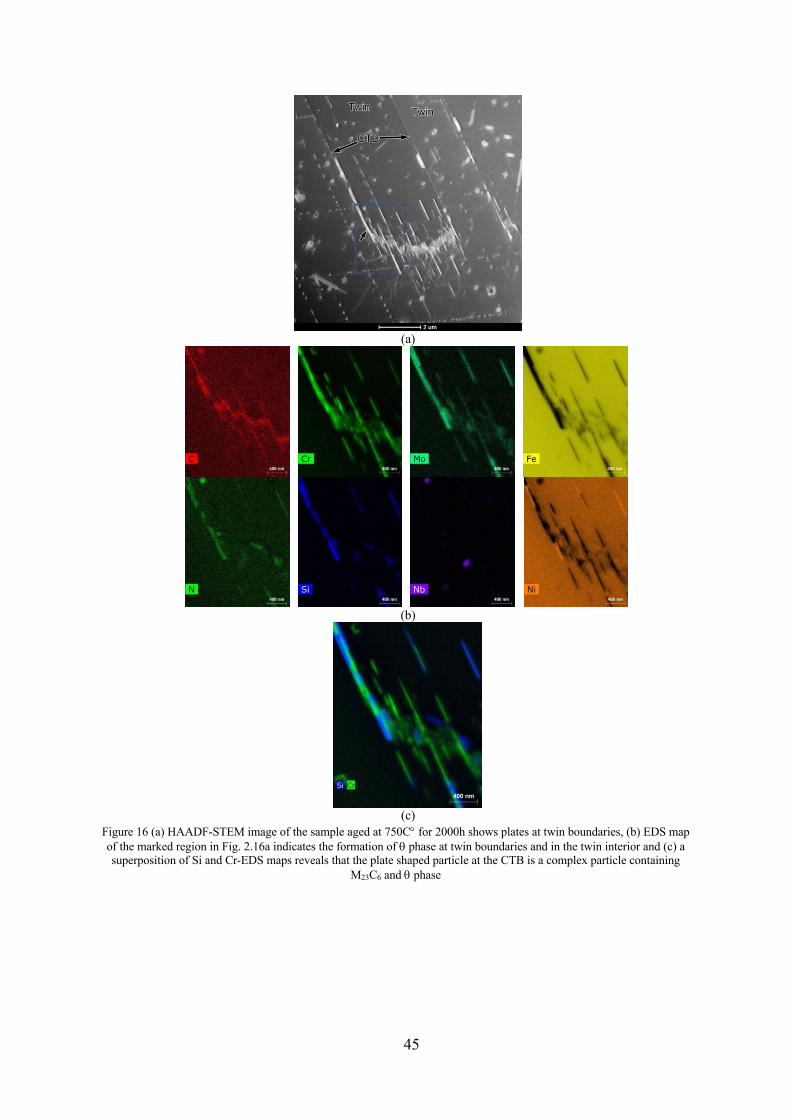
45
Figure 16 (a) HAADF-STEM image of the sample aged at 750C° for 2000h shows plates at twin boundaries, (b) EDS map of the marked region in Fig. 2.16a indicates the formation of q phase at twin boundaries and in the twin interior and (c) a superposition of Si and Cr-EDS maps reveals that the plate shaped particle at the CTB is a complex particle containing
M23C6 and q phase
(a)
(b)
(c)
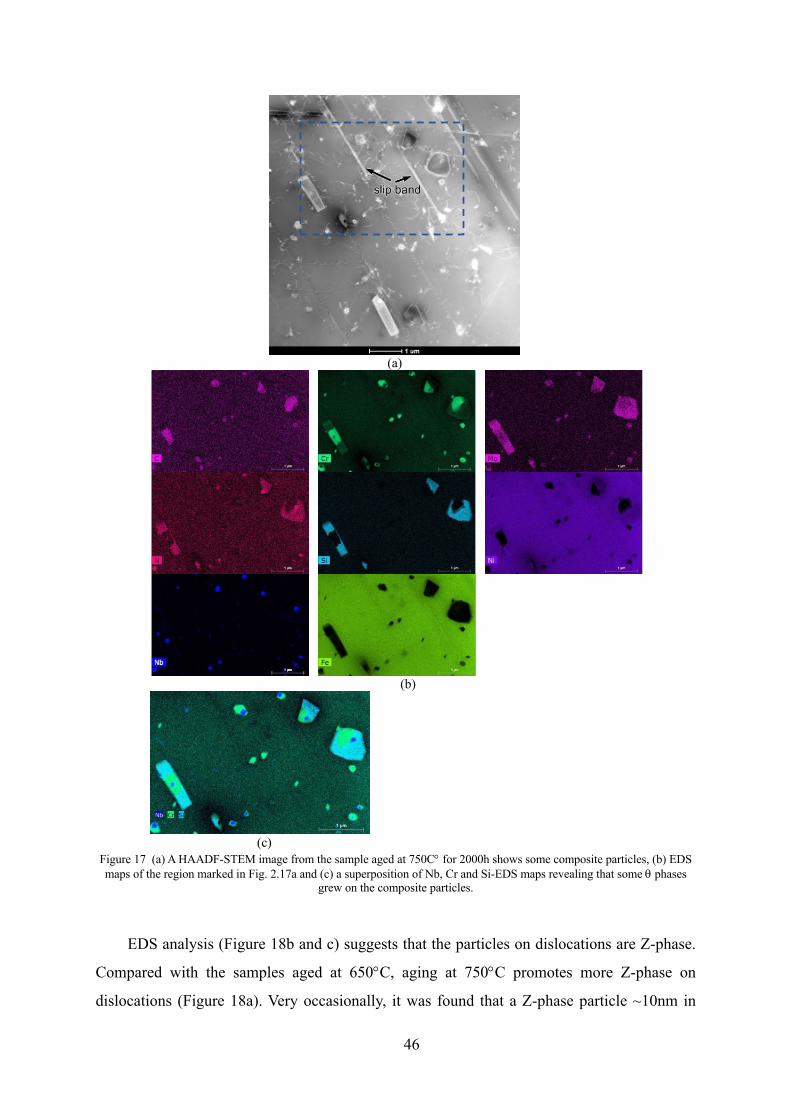
46
Figure 17 (a) A HAADF-STEM image from the sample aged at 750C° for 2000h shows some composite particles, (b) EDS maps of the region marked in Fig. 2.17a and (c) a superposition of Nb, Cr and Si-EDS maps revealing that some q phases
grew on the composite particles.
EDS analysis (Figure 18b and c) suggests that the particles on dislocations are Z-phase.
Compared with the samples aged at 650°C, aging at 750°C promotes more Z-phase on
dislocations (Figure 18a). Very occasionally, it was found that a Z-phase particle ~10nm in
(a)
(b)
(c)
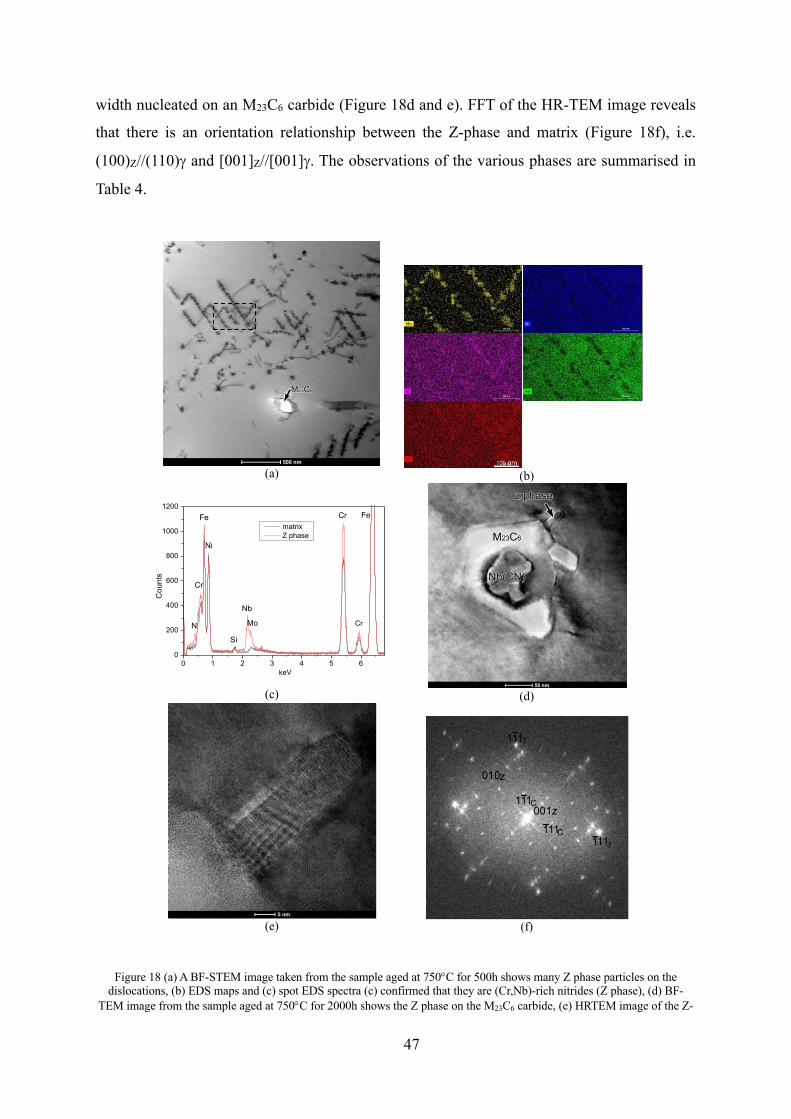
47
width nucleated on an M23C6 carbide (Figure 18d and e). FFT of the HR-TEM image reveals
that there is an orientation relationship between the Z-phase and matrix (Figure 18f), i.e.
(100)Z//(110)g and [001]Z//[001]g. The observations of the various phases are summarised in
Table 4.
Figure 18 (a) A BF-STEM image taken from the sample aged at 750°C for 500h shows many Z phase particles on the
dislocations, (b) EDS maps and (c) spot EDS spectra (c) confirmed that they are (Cr,Nb)-rich nitrides (Z phase), (d) BF-TEM image from the sample aged at 750°C for 2000h shows the Z phase on the M23C6 carbide, (e) HRTEM image of the Z-
(a)
(b)
(c)
(d)
(e)
(f)
0 1 2 3 4 5 60
200
400
600
800
1000
1200
matrix Z phase
Si
N
Ni
Cr
Fe Fe
CrMo
Nb
Cou
nts
keV
Cr
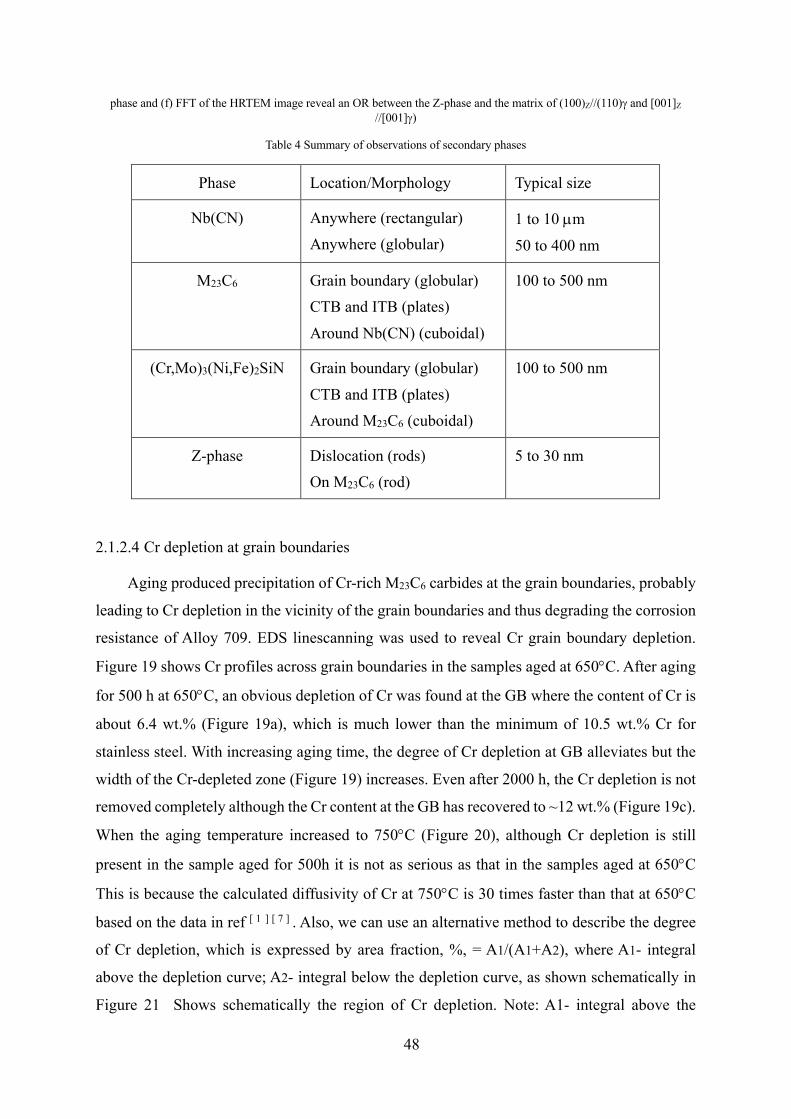
48
phase and (f) FFT of the HRTEM image reveal an OR between the Z-phase and the matrix of (100)Z//(110)g and [001]Z //[001]g)
Table 4 Summary of observations of secondary phases
Phase Location/Morphology Typical size
Nb(CN) Anywhere (rectangular) Anywhere (globular)
1 to 10 µm 50 to 400 nm
M23C6 Grain boundary (globular) CTB and ITB (plates) Around Nb(CN) (cuboidal)
100 to 500 nm
(Cr,Mo)3(Ni,Fe)2SiN Grain boundary (globular) CTB and ITB (plates) Around M23C6 (cuboidal)
100 to 500 nm
Z-phase Dislocation (rods) On M23C6 (rod)
5 to 30 nm
2.1.2.4 Cr depletion at grain boundaries
Aging produced precipitation of Cr-rich M23C6 carbides at the grain boundaries, probably
leading to Cr depletion in the vicinity of the grain boundaries and thus degrading the corrosion
resistance of Alloy 709. EDS linescanning was used to reveal Cr grain boundary depletion.
Figure 19 shows Cr profiles across grain boundaries in the samples aged at 650°C. After aging
for 500 h at 650°C, an obvious depletion of Cr was found at the GB where the content of Cr is
about 6.4 wt.% (Figure 19a), which is much lower than the minimum of 10.5 wt.% Cr for
stainless steel. With increasing aging time, the degree of Cr depletion at GB alleviates but the
width of the Cr-depleted zone (Figure 19) increases. Even after 2000 h, the Cr depletion is not
removed completely although the Cr content at the GB has recovered to ~12 wt.% (Figure 19c).
When the aging temperature increased to 750°C (Figure 20), although Cr depletion is still
present in the sample aged for 500h it is not as serious as that in the samples aged at 650°C
This is because the calculated diffusivity of Cr at 750°C is 30 times faster than that at 650°C
based on the data in ref [ 1 ] [ 7 ] . Also, we can use an alternative method to describe the degree
of Cr depletion, which is expressed by area fraction, %, = A1/(A1+A2), where A1- integral
above the depletion curve; A2- integral below the depletion curve, as shown schematically in
Figure 21 Shows schematically the region of Cr depletion. Note: A1- integral above the
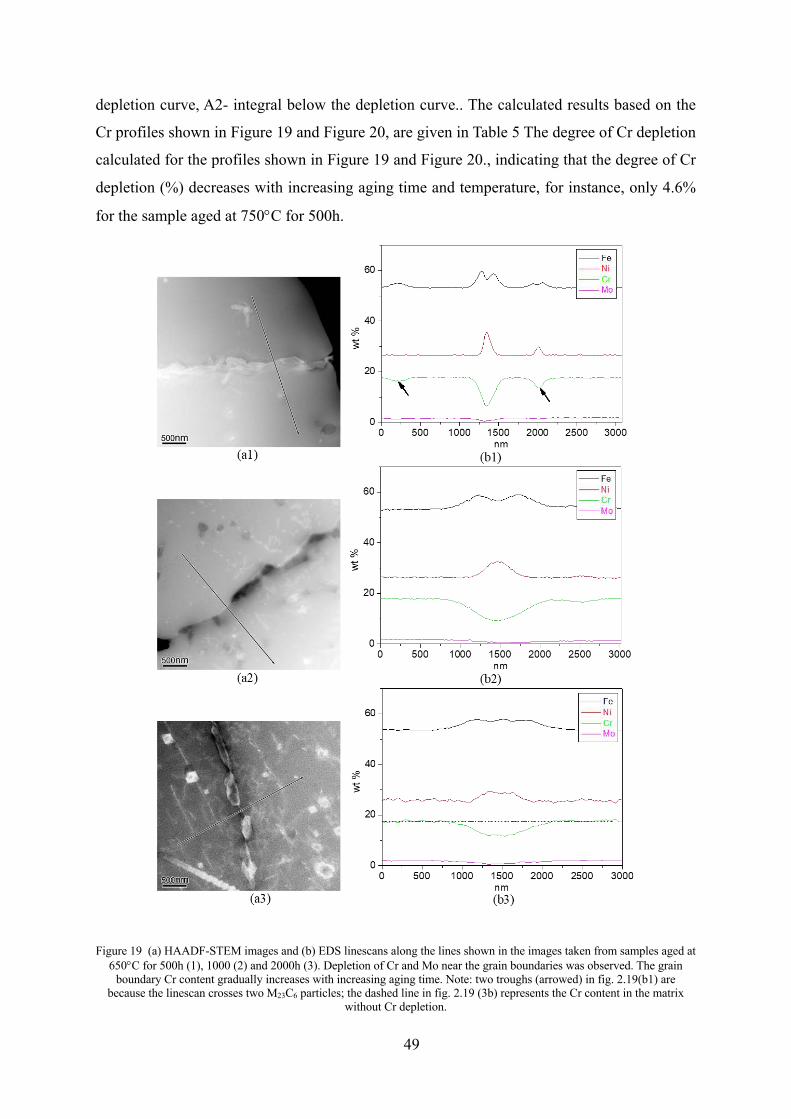
49
depletion curve, A2- integral below the depletion curve.. The calculated results based on the
Cr profiles shown in Figure 19 and Figure 20, are given in Table 5 The degree of Cr depletion
calculated for the profiles shown in Figure 19 and Figure 20., indicating that the degree of Cr
depletion (%) decreases with increasing aging time and temperature, for instance, only 4.6%
for the sample aged at 750°C for 500h.
Figure 19 (a) HAADF-STEM images and (b) EDS linescans along the lines shown in the images taken from samples aged at
650°C for 500h (1), 1000 (2) and 2000h (3). Depletion of Cr and Mo near the grain boundaries was observed. The grain boundary Cr content gradually increases with increasing aging time. Note: two troughs (arrowed) in fig. 2.19(b1) are
because the linescan crosses two M23C6 particles; the dashed line in fig. 2.19 (3b) represents the Cr content in the matrix without Cr depletion.
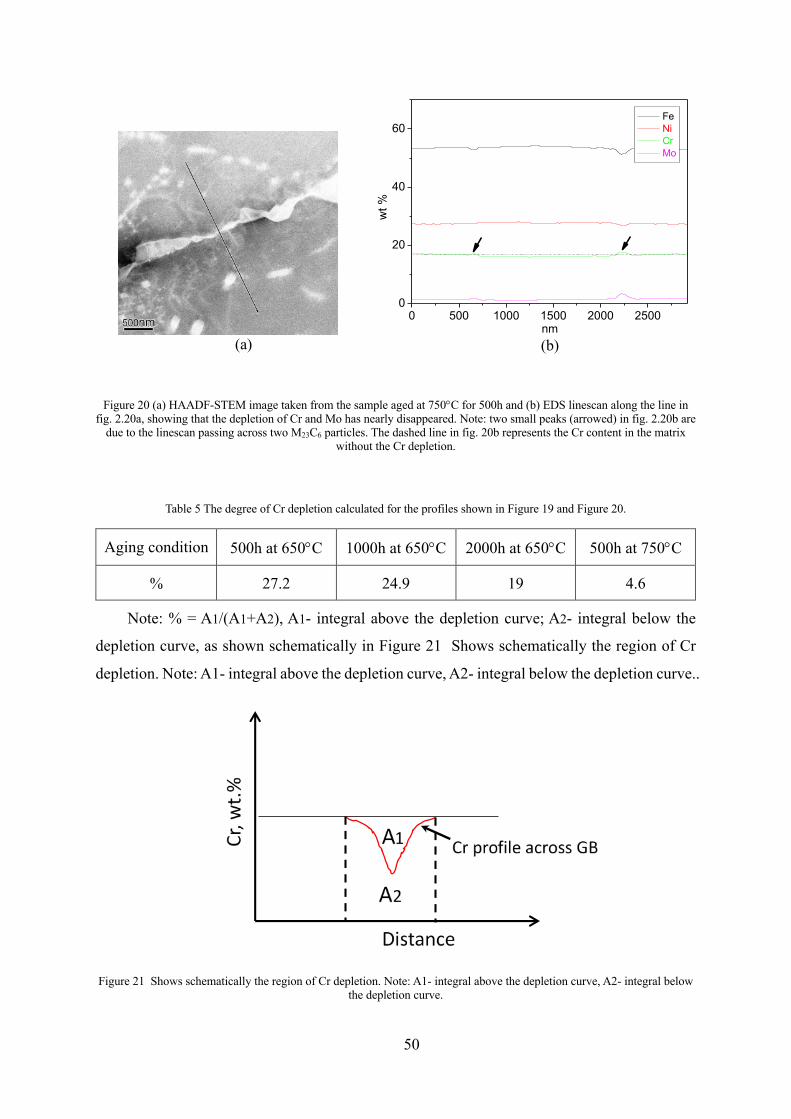
50
Figure 20 (a) HAADF-STEM image taken from the sample aged at 750°C for 500h and (b) EDS linescan along the line in
fig. 2.20a, showing that the depletion of Cr and Mo has nearly disappeared. Note: two small peaks (arrowed) in fig. 2.20b are due to the linescan passing across two M23C6 particles. The dashed line in fig. 20b represents the Cr content in the matrix
without the Cr depletion.
Table 5 The degree of Cr depletion calculated for the profiles shown in Figure 19 and Figure 20.
Aging condition 500h at 650°C 1000h at 650°C 2000h at 650°C 500h at 750°C
% 27.2 24.9 19 4.6
Note: % = A1/(A1+A2), A1- integral above the depletion curve; A2- integral below the
depletion curve, as shown schematically in Figure 21 Shows schematically the region of Cr
depletion. Note: A1- integral above the depletion curve, A2- integral below the depletion curve..
Figure 21 Shows schematically the region of Cr depletion. Note: A1- integral above the depletion curve, A2- integral below
the depletion curve.
(a)
(b)
0 500 1000 1500 2000 25000
20
40
60
wt %
nm
Fe Ni Cr Mo
51
2.2 Conclusion
The results of microstructural observations indicated that:
1. The prominent precipitate in as-received alloy 709 is Nb(CN). Very occasionally, the
rod-shape Z phase (CrNbN) was found.
2. No significant change in microstructure was observed at 550°C even after aging up to
2000h but the segregation of Cr and Mo at grain boundaries was found. Lack of
microstructural evolution upon aging means that alloy 709 is fairly stable at 550°C.
3. Aging at 650°C produced a nearly continuous distribution of globular M23C6 phases at
grain boundaries, rod-like M23C6 phases at twin boundaries and in grain interior, and
block M23C6 phases being nucleated on Nb(CN). Fine dispersoid Z phases on
dislocations were observed after aging for 500h, its amounts increases with aging time.
4. q ((Cr,Mo)3(Ni,Fe)2SiN) phase was formed at grain boundaries after aging 1000h at
650°C. After aging at 750°C, q phase is nucleated on M23C6 carbides, and the evidence
for the transformation of M23C6 to q phase was observed, which suggests that q phase
is the more stable phase.
52
3 In-situ tensile tests of alloy 709 at various temperatures
(The results presented in this chapter has been submitted to Material Science and
Engineering A for publication and the article is published in 2018:
Authors: Swathi Upadhayay, Hangyue Li, Paul Bowen and Afsaneh Rabiei
Title: “A study on tensile properties of Alloy 709 at various temperatures”, Materials
Science and Engineering: A, Volume 733, 22 August 2018, Pages 338-349)
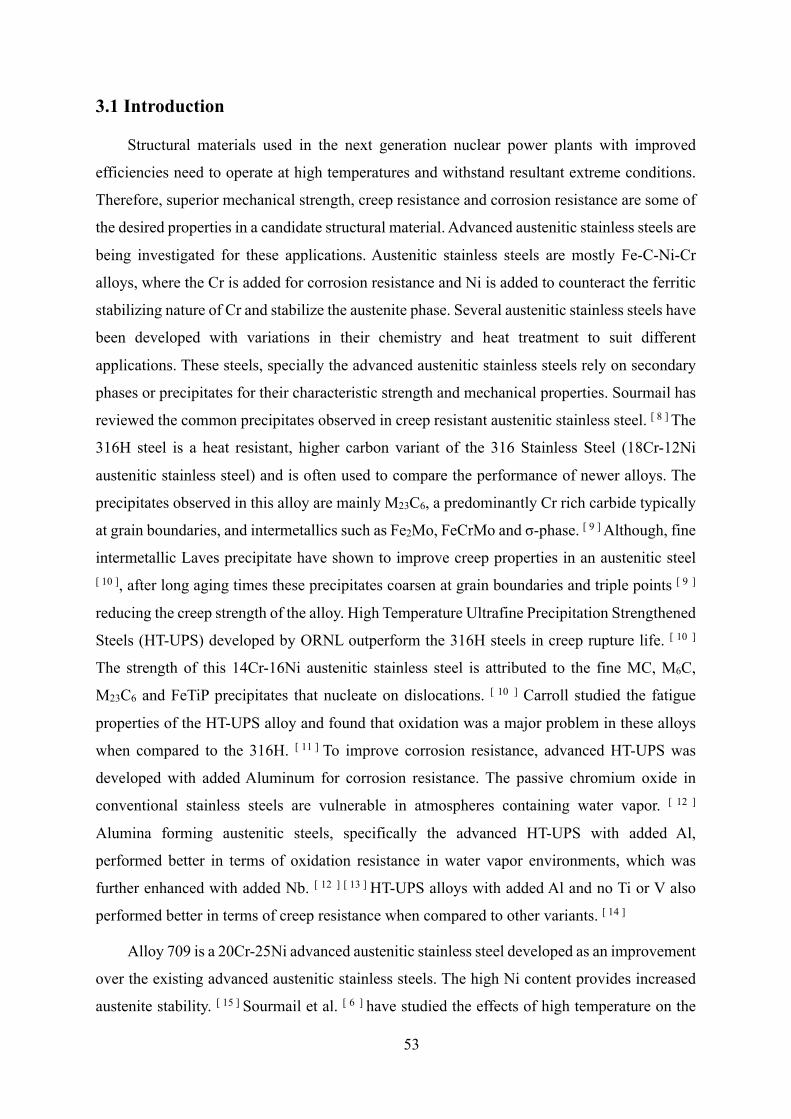
53
3.1 Introduction
Structural materials used in the next generation nuclear power plants with improved
efficiencies need to operate at high temperatures and withstand resultant extreme conditions.
Therefore, superior mechanical strength, creep resistance and corrosion resistance are some of
the desired properties in a candidate structural material. Advanced austenitic stainless steels are
being investigated for these applications. Austenitic stainless steels are mostly Fe-C-Ni-Cr
alloys, where the Cr is added for corrosion resistance and Ni is added to counteract the ferritic
stabilizing nature of Cr and stabilize the austenite phase. Several austenitic stainless steels have
been developed with variations in their chemistry and heat treatment to suit different
applications. These steels, specially the advanced austenitic stainless steels rely on secondary
phases or precipitates for their characteristic strength and mechanical properties. Sourmail has
reviewed the common precipitates observed in creep resistant austenitic stainless steel. [ 8 ] The
316H steel is a heat resistant, higher carbon variant of the 316 Stainless Steel (18Cr-12Ni
austenitic stainless steel) and is often used to compare the performance of newer alloys. The
precipitates observed in this alloy are mainly M23C6, a predominantly Cr rich carbide typically
at grain boundaries, and intermetallics such as Fe2Mo, FeCrMo and σ-phase. [ 9 ] Although, fine
intermetallic Laves precipitate have shown to improve creep properties in an austenitic steel [ 10 ], after long aging times these precipitates coarsen at grain boundaries and triple points [ 9 ]
reducing the creep strength of the alloy. High Temperature Ultrafine Precipitation Strengthened
Steels (HT-UPS) developed by ORNL outperform the 316H steels in creep rupture life. [ 10 ]
The strength of this 14Cr-16Ni austenitic stainless steel is attributed to the fine MC, M6C,
M23C6 and FeTiP precipitates that nucleate on dislocations. [ 10 ] Carroll studied the fatigue
properties of the HT-UPS alloy and found that oxidation was a major problem in these alloys
when compared to the 316H. [ 11 ] To improve corrosion resistance, advanced HT-UPS was
developed with added Aluminum for corrosion resistance. The passive chromium oxide in
conventional stainless steels are vulnerable in atmospheres containing water vapor. [ 12 ]
Alumina forming austenitic steels, specifically the advanced HT-UPS with added Al,
performed better in terms of oxidation resistance in water vapor environments, which was
further enhanced with added Nb. [ 12 ] [ 13 ] HT-UPS alloys with added Al and no Ti or V also
performed better in terms of creep resistance when compared to other variants. [ 14 ]
Alloy 709 is a 20Cr-25Ni advanced austenitic stainless steel developed as an improvement
over the existing advanced austenitic stainless steels. The high Ni content provides increased
austenite stability. [ 15 ] Sourmail et al. [ 6 ] have studied the effects of high temperature on the

54
microstructure and secondary phases in the NF709 alloy. The NF709 alloy reported 0.05 wt.%
Ti content while the Alloy 709 studied in this paper contains <0.01 wt.% Ti. The authors found
coarse undissolved nitrides, carbides and carbonitrides such as M23C6 and (Nb,Ti)CN, in the
NF709, after aging. [ 6 ] This precipitate evolution was also simulated by Shim et al. [16 ] NF709
possesses highest creep rupture strength amongst the austenitic steels. Preliminary studies
performed indicated that Alloy 709 is superior to the HT-UPS alloys in tensile strength, thermal
stability, creep-fatigue, sodium compatibility and weldability. [ 15 ] The excellent creep
resistance and corrosion resistance of the Alloy 709 has made it the ideal candidate for next
generation nuclear power plants.
In this study, in-situ scanning electron microscope (SEM) tensile tests were conducted on
Alloy 709 to establish its yield and ultimate tensile stress at various temperatures from room
temperature to 1000 °C. To characterize the behavior of the material and dominant deformation
mechanisms at different temperatures and strain rates, electron backscatter diffraction (EBSD)
was used to observe microstructural evolution and phase changes in the alloy.
3.2 Experimental Setup
A 400-pound ingot of Alloy 709 was fabricated using vacuum-induction melting (VIM)
and electro-slag remelting (ESR) processes. 203 mm diameter round ingot out of the VIM was
homogenized at 1250°C for 4 hours. Half of this ingot was forged to a 203mm × 34.9 mm bar.
1/3 of the hot-forged bar was rolled to 102mm × 20.3 mm at 1100°C. The hot- rolled bar was
finally annealed at 1100°C for 2 hours, followed by water quenching. The composition of the
alloy is shown in Table 6. Preliminary observations by the manufacturer indicated that the
microstructure consists of uniform equiaxed grain structure with the ASTM GS# 4 to 6 (44 µm
to 80 µm) Vickers hardness is found to be 176 ± 7.
Table 6. Composition of the as received alloy, post Electro Slag Remelting (ESR).
Elements
C Mn Si P S Cr Ni Mo N Ti Nb B Fe
Wt%
0.063 0.88 0.28 <0.005 <0.001 19.69 25.00 1.46 0.14 <0.01 0.23 0.0022 Balance
Tensile samples were extracted from the supplied plates with the longitudinal of the
samples parallel to the rolling direction and the transverse directions respectively, using electro
discharge machining (EDM). The dimensions of the samples designed for in-situ SEM
experimentation had to adhere to the constraints imposed by the in-situ heating and loading
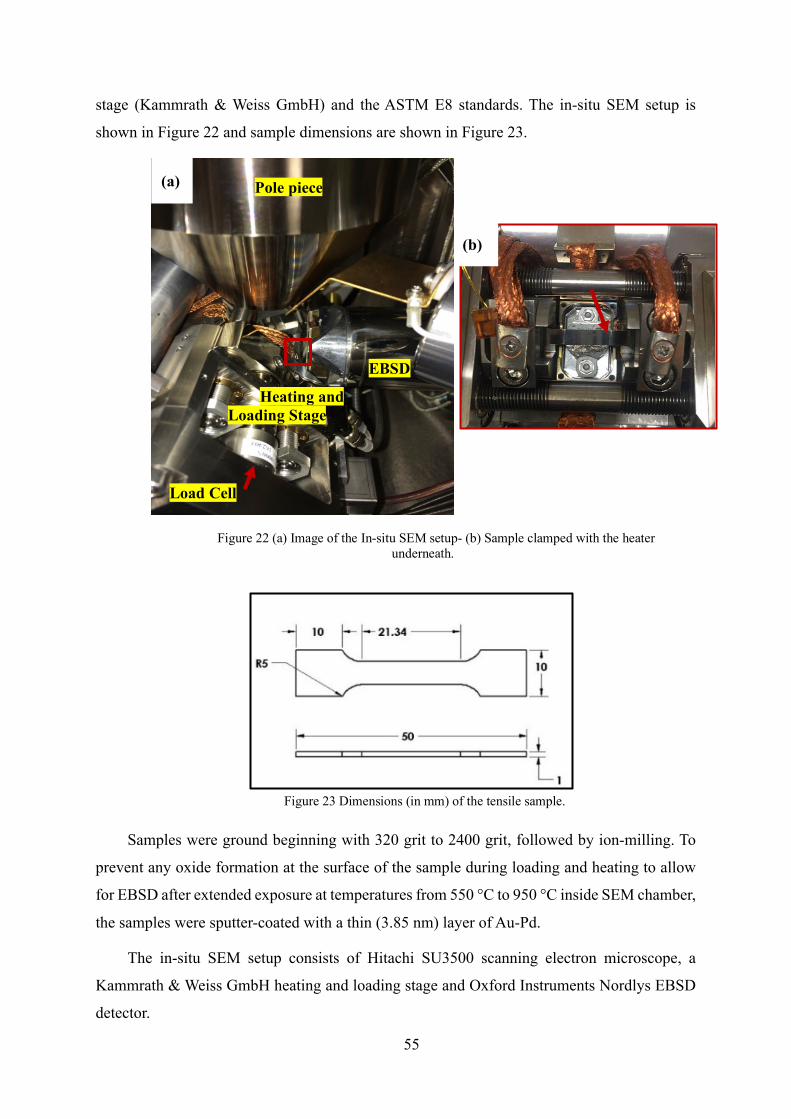
55
stage (Kammrath & Weiss GmbH) and the ASTM E8 standards. The in-situ SEM setup is
shown in Figure 22 and sample dimensions are shown in Figure 23.
Samples were ground beginning with 320 grit to 2400 grit, followed by ion-milling. To
prevent any oxide formation at the surface of the sample during loading and heating to allow
for EBSD after extended exposure at temperatures from 550 °C to 950 °C inside SEM chamber,
the samples were sputter-coated with a thin (3.85 nm) layer of Au-Pd.
The in-situ SEM setup consists of Hitachi SU3500 scanning electron microscope, a
Kammrath & Weiss GmbH heating and loading stage and Oxford Instruments Nordlys EBSD
detector.
Figure 22 (a) Image of the In-situ SEM setup- (b) Sample clamped with the heater underneath.
Pole piece
EBSD
Heating and Loading Stage
Load Cell
(a)
Sample
(b)
Figure 23 Dimensions (in mm) of the tensile sample.
56
The heating and loading stage is mounted in the SEM vacuum chamber and can uniaxially
load the sample while heating it. The stage is fitted with a load cell of maximum load
specification of 10,000 N. Samples are loaded by the means of the leadscrews. The front and
the rear yoke move along the leadscrew simultaneously upon loading, ensuring both sides of
the samples are loaded equally to prevent shifting of the viewed region during in-situ testing.
Elongation of the sample is measured using a linear variable differential transformer (LVDT)
and the output is recorded live and displayed on the DDS32 software. The 140 mm diameter
ceramic heater plate is located right underneath the tensile specimen that can be controlled via
the heater controller either manually or via the DDS software. This heater can heat the sample
to a maximum temperature of 300 °C under atmospheric pressure and a maximum temperature
of 1000 °C under vacuum. Sample temperature is monitored by a thermocouple placed right
under the sample. The displacement rate of the loading can be adjusted on the motor control
settings in the DDS software and can range from 0.1 μm/s to 20 μm/s. The loading is interrupted
at certain intervals by turning the motor off, while capturing SEM images or performing EBSD
mapping.
To ensure the safety of the critical components on stage and within the SEM chamber,
the temperatures at various points are monitored using additional thermocouples and kept
within acceptable temperature limits by a cooling system.
Energy dispersive X-ray spectrometer (EDS) on a FEI Verios 460L field-emission
scanning electron microscope (FESEM) was used on polished samples to identify the
precipitates and phases in Alloy 709 samples. The in- situ SEM uniaxial tensile tests were
performed at room temperature, 550, 650, 750, 850 and 950 °C. All samples were tested along
the rolling direction, except 4 samples tested at 750 °C – 2 of which were loaded along the
rolling direction and 2 along the transverse direction. During in-situ SEM loading, sample was
heated at the rate of 25 K/min, first to 100 °C and then to the target temperature of 550, 650,
750, 850 or 950 °C. Before heating is begun, the sample loaded to a constant preload of 25 N,
to ensure only tensile loads on the sample. All the tensile tests were performed at the strain rate
of 5.02×10⁻³ /min as per ASTM E21 standard for tensile tests at elevated temperature. One
tensile test was performed at a strain rate of 2.61×10⁻⁴ /min to study the effect of strain rate.
Note that fractography was performed on selected samples to assist the interpretation of
deformation mechanisms.
The test matrix is presented in Table 7. During the test, in addition to SEM images, EBSD
mapping was performed to observe changes in microstructure. The results obtained from these
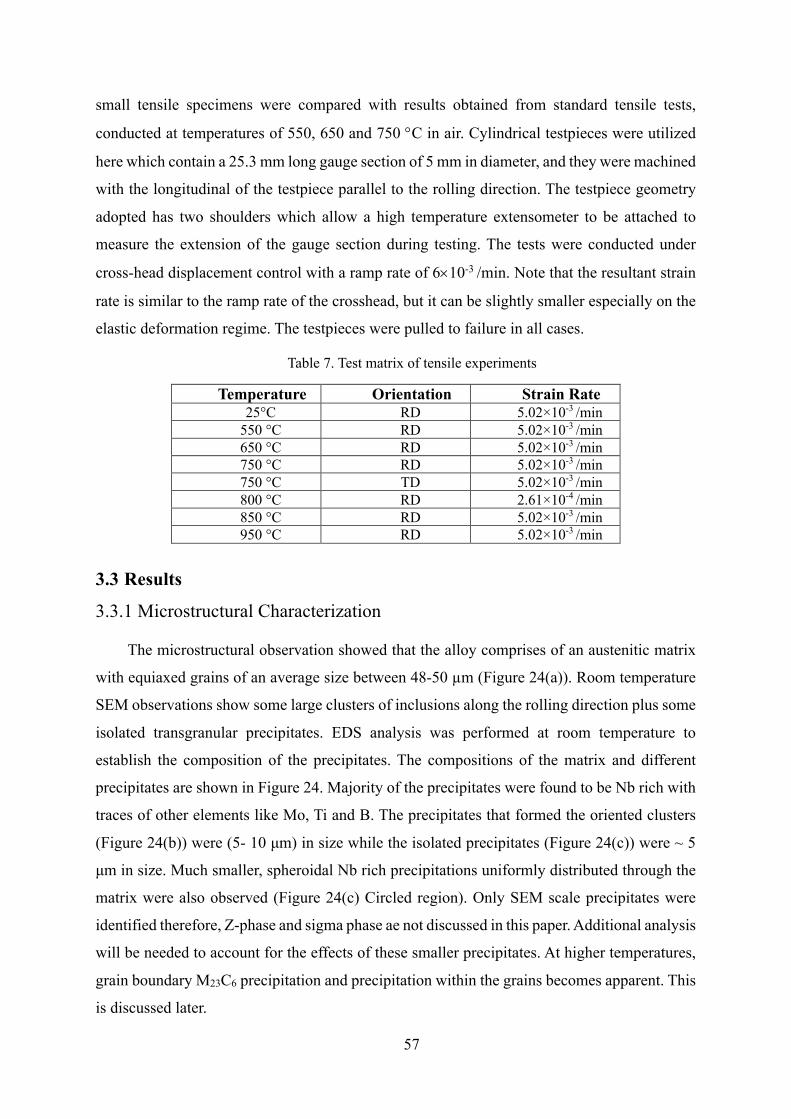
57
small tensile specimens were compared with results obtained from standard tensile tests,
conducted at temperatures of 550, 650 and 750 °C in air. Cylindrical testpieces were utilized
here which contain a 25.3 mm long gauge section of 5 mm in diameter, and they were machined
with the longitudinal of the testpiece parallel to the rolling direction. The testpiece geometry
adopted has two shoulders which allow a high temperature extensometer to be attached to
measure the extension of the gauge section during testing. The tests were conducted under
cross-head displacement control with a ramp rate of 6´10-3 /min. Note that the resultant strain
rate is similar to the ramp rate of the crosshead, but it can be slightly smaller especially on the
elastic deformation regime. The testpieces were pulled to failure in all cases.
Table 7. Test matrix of tensile experiments
3.3 Results
3.3.1 Microstructural Characterization
The microstructural observation showed that the alloy comprises of an austenitic matrix
with equiaxed grains of an average size between 48-50 µm (Figure 24(a)). Room temperature
SEM observations show some large clusters of inclusions along the rolling direction plus some
isolated transgranular precipitates. EDS analysis was performed at room temperature to
establish the composition of the precipitates. The compositions of the matrix and different
precipitates are shown in Figure 24. Majority of the precipitates were found to be Nb rich with
traces of other elements like Mo, Ti and B. The precipitates that formed the oriented clusters
(Figure 24(b)) were (5- 10 μm) in size while the isolated precipitates (Figure 24(c)) were ~ 5
μm in size. Much smaller, spheroidal Nb rich precipitations uniformly distributed through the
matrix were also observed (Figure 24(c) Circled region). Only SEM scale precipitates were
identified therefore, Z-phase and sigma phase ae not discussed in this paper. Additional analysis
will be needed to account for the effects of these smaller precipitates. At higher temperatures,
grain boundary M23C6 precipitation and precipitation within the grains becomes apparent. This
is discussed later.
Temperature Orientation Strain Rate 25°C RD 5.02×10⁻³ /min
550 °C RD 5.02×10⁻³ /min 650 °C RD 5.02×10⁻³ /min 750 °C RD 5.02×10⁻³ /min 750 °C TD 5.02×10⁻³ /min 800 °C RD 2.61×10⁻⁴ /min 850 °C RD 5.02×10⁻³ /min 950 °C RD 5.02×10⁻³ /min
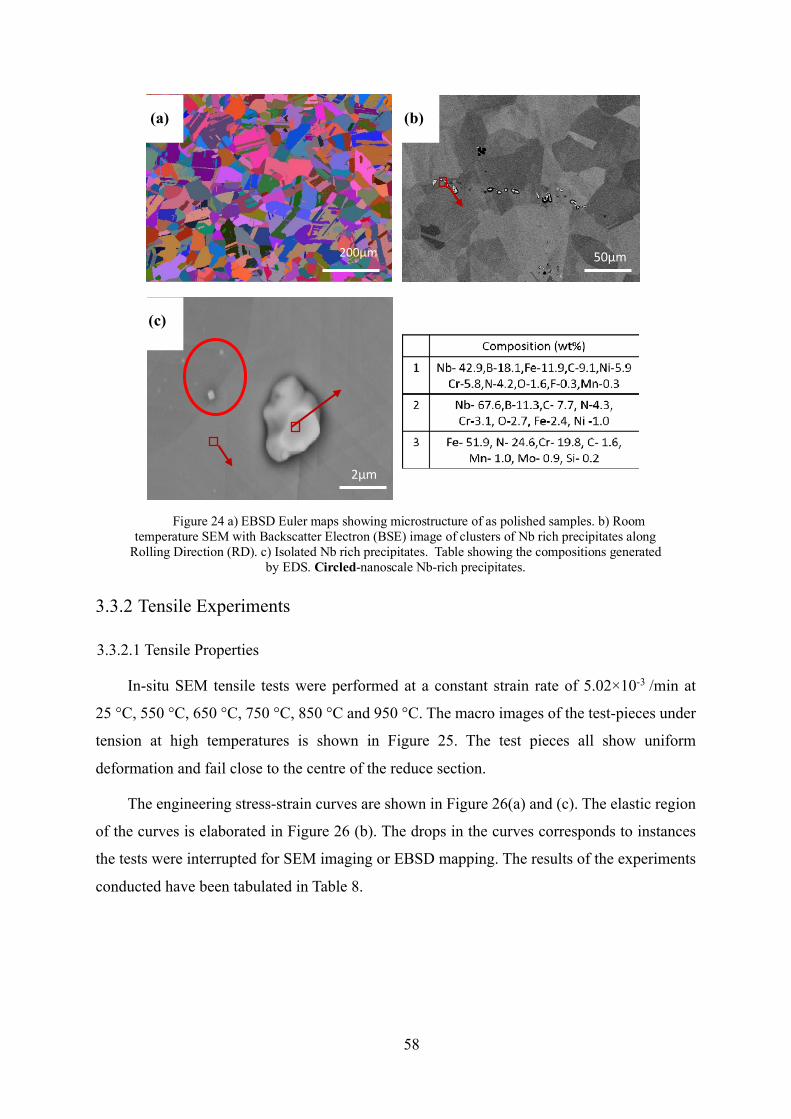
58
3.3.2 Tensile Experiments
3.3.2.1 Tensile Properties
In-situ SEM tensile tests were performed at a constant strain rate of 5.02×10⁻³ /min at
25 °C, 550 °C, 650 °C, 750 °C, 850 °C and 950 °C. The macro images of the test-pieces under
tension at high temperatures is shown in Figure 25. The test pieces all show uniform
deformation and fail close to the centre of the reduce section.
The engineering stress-strain curves are shown in Figure 26(a) and (c). The elastic region
of the curves is elaborated in Figure 26 (b). The drops in the curves corresponds to instances
the tests were interrupted for SEM imaging or EBSD mapping. The results of the experiments
conducted have been tabulated in Table 8.
Figure 24 a) EBSD Euler maps showing microstructure of as polished samples. b) Room temperature SEM with Backscatter Electron (BSE) image of clusters of Nb rich precipitates along
Rolling Direction (RD). c) Isolated Nb rich precipitates. Table showing the compositions generated by EDS. Circled-nanoscale Nb-rich precipitates.
200µm
(a)
50µm
(b)
2µm
(c)
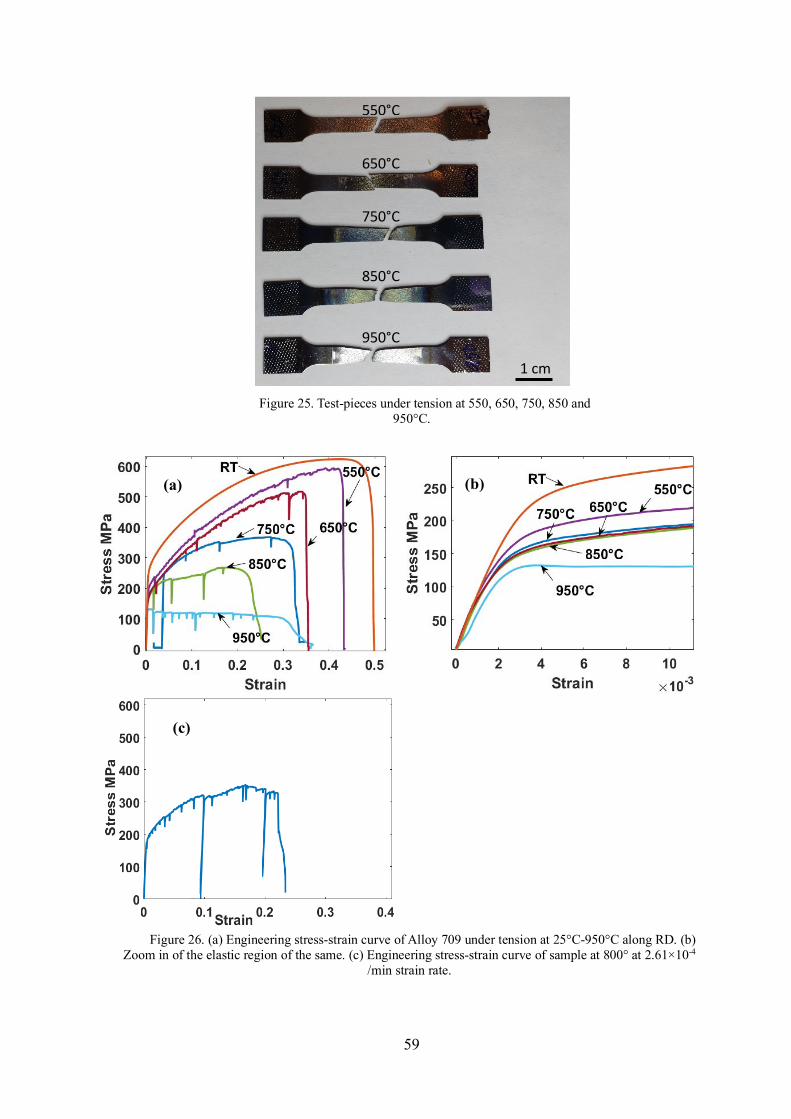
59
Figure 25. Test-pieces under tension at 550, 650, 750, 850 and 950°C.
550°C
650°C
750°C
850°C
950°C
1 cm
(a) (b)
(c)
Figure 26. (a) Engineering stress-strain curve of Alloy 709 under tension at 25°C-950°C along RD. (b) Zoom in of the elastic region of the same. (c) Engineering stress-strain curve of sample at 800° at 2.61×10⁻⁴
/min strain rate.
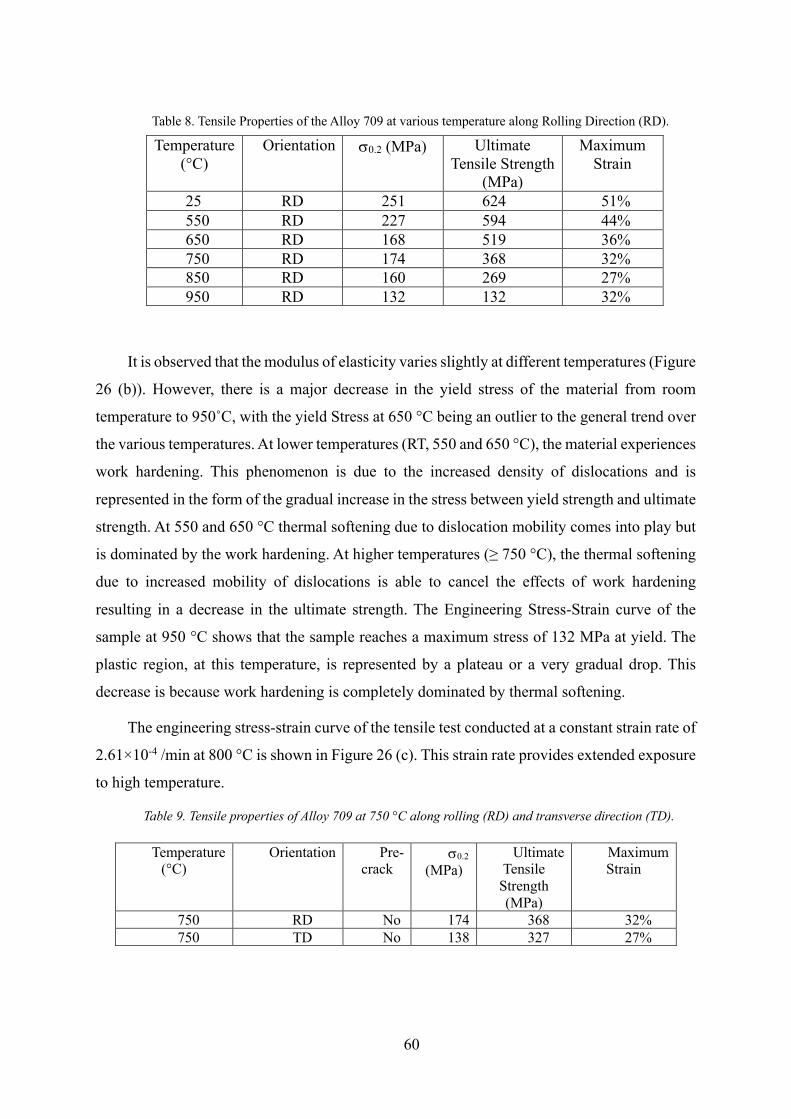
60
Table 8. Tensile Properties of the Alloy 709 at various temperature along Rolling Direction (RD).
It is observed that the modulus of elasticity varies slightly at different temperatures (Figure
26 (b)). However, there is a major decrease in the yield stress of the material from room
temperature to 950˚C, with the yield Stress at 650 °C being an outlier to the general trend over
the various temperatures. At lower temperatures (RT, 550 and 650 °C), the material experiences
work hardening. This phenomenon is due to the increased density of dislocations and is
represented in the form of the gradual increase in the stress between yield strength and ultimate
strength. At 550 and 650 °C thermal softening due to dislocation mobility comes into play but
is dominated by the work hardening. At higher temperatures (≥ 750 °C), the thermal softening
due to increased mobility of dislocations is able to cancel the effects of work hardening
resulting in a decrease in the ultimate strength. The Engineering Stress-Strain curve of the
sample at 950 °C shows that the sample reaches a maximum stress of 132 MPa at yield. The
plastic region, at this temperature, is represented by a plateau or a very gradual drop. This
decrease is because work hardening is completely dominated by thermal softening.
The engineering stress-strain curve of the tensile test conducted at a constant strain rate of
2.61×10⁻⁴ /min at 800 °C is shown in Figure 26 (c). This strain rate provides extended exposure
to high temperature.
Table 9. Tensile properties of Alloy 709 at 750 °C along rolling (RD) and transverse direction (TD).
Temperature (°C)
Orientation s0.2 (MPa) Ultimate Tensile Strength
(MPa)
Maximum Strain
25 RD 251 624 51% 550 RD 227 594 44% 650 RD 168 519 36% 750 RD 174 368 32% 850 RD 160 269 27% 950 RD 132 132 32%
Temperature (°C)
Orientation Pre-crack
s0.2 (MPa)
Ultimate Tensile
Strength (MPa)
Maximum Strain
750 RD No 174 368 32% 750 TD No 138 327 27%
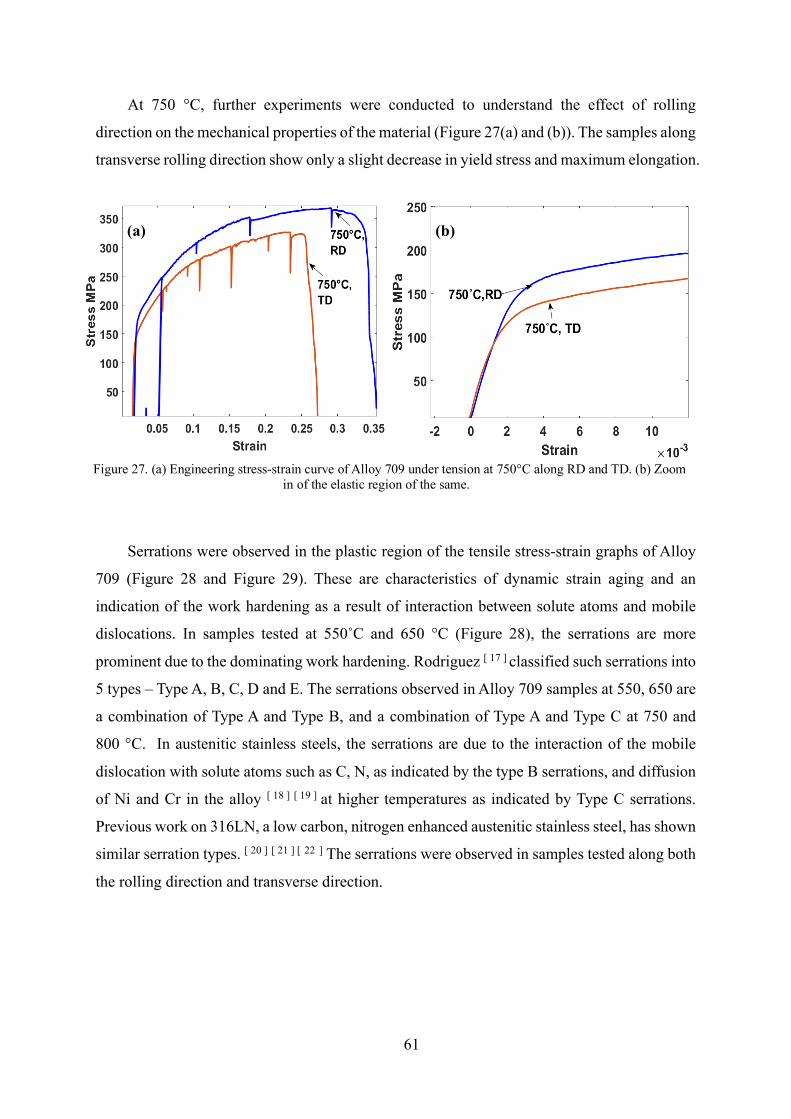
61
At 750 °C, further experiments were conducted to understand the effect of rolling
direction on the mechanical properties of the material (Figure 27(a) and (b)). The samples along
transverse rolling direction show only a slight decrease in yield stress and maximum elongation.
Serrations were observed in the plastic region of the tensile stress-strain graphs of Alloy
709 (Figure 28 and Figure 29). These are characteristics of dynamic strain aging and an
indication of the work hardening as a result of interaction between solute atoms and mobile
dislocations. In samples tested at 550˚C and 650 °C (Figure 28), the serrations are more
prominent due to the dominating work hardening. Rodriguez [ 17 ] classified such serrations into
5 types – Type A, B, C, D and E. The serrations observed in Alloy 709 samples at 550, 650 are
a combination of Type A and Type B, and a combination of Type A and Type C at 750 and
800 °C. In austenitic stainless steels, the serrations are due to the interaction of the mobile
dislocation with solute atoms such as C, N, as indicated by the type B serrations, and diffusion
of Ni and Cr in the alloy [ 18 ] [ 19 ] at higher temperatures as indicated by Type C serrations.
Previous work on 316LN, a low carbon, nitrogen enhanced austenitic stainless steel, has shown
similar serration types. [ 20 ] [ 21 ] [ 22 ] The serrations were observed in samples tested along both
the rolling direction and transverse direction.
(a) (b)
Figure 27. (a) Engineering stress-strain curve of Alloy 709 under tension at 750°C along RD and TD. (b) Zoom in of the elastic region of the same.
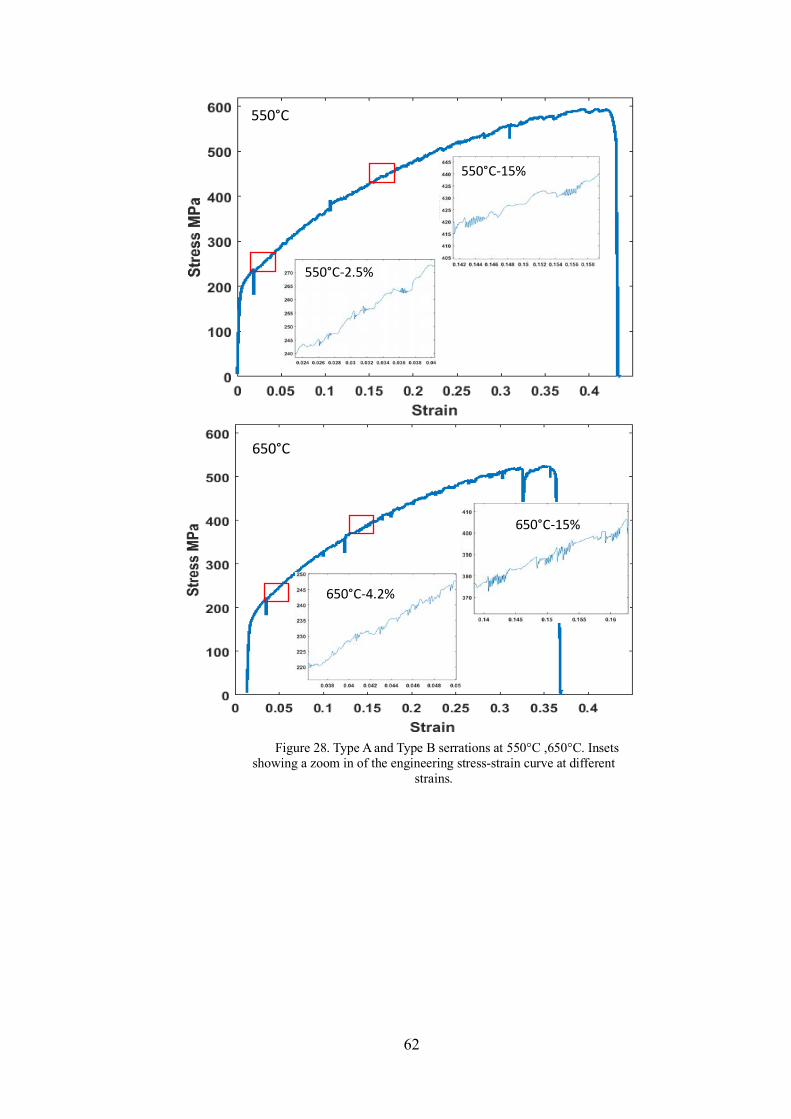
62
Figure 28. Type A and Type B serrations at 550°C ,650°C. Insets showing a zoom in of the engineering stress-strain curve at different
strains.
550°C
550°C-2.5%
550°C-15%
650°C
650°C-15%
650°C-4.2%
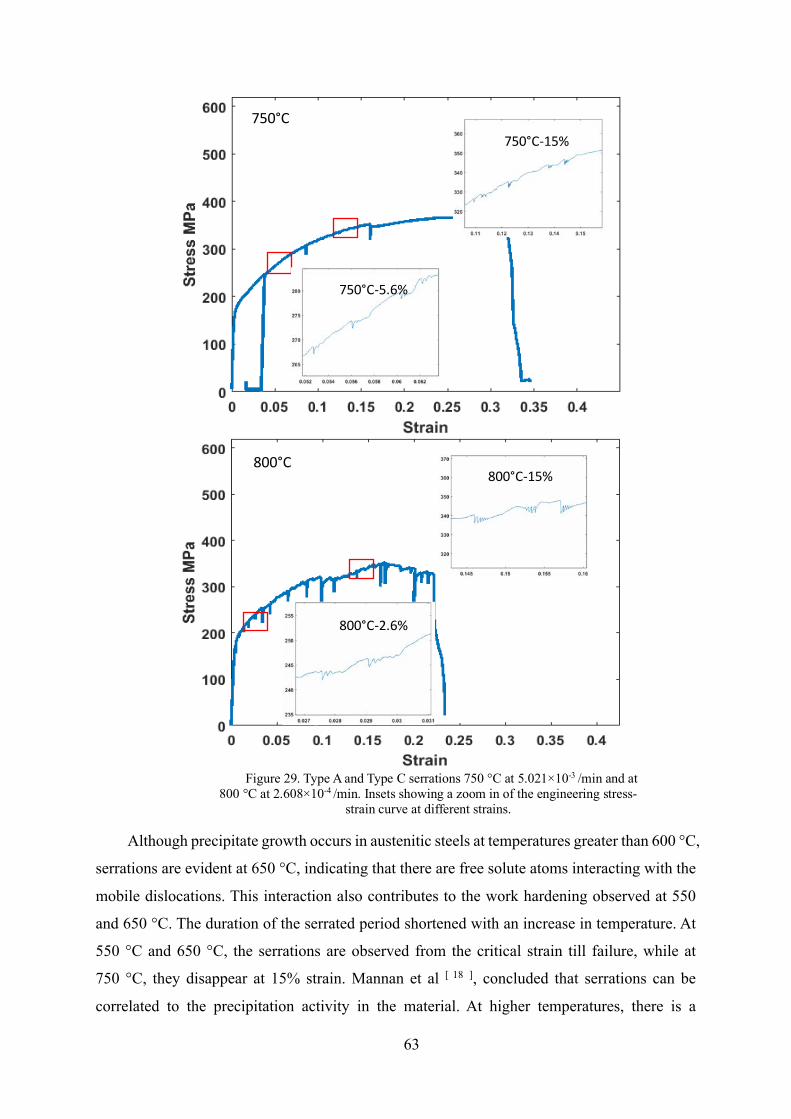
63
Although precipitate growth occurs in austenitic steels at temperatures greater than 600 °C,
serrations are evident at 650 °C, indicating that there are free solute atoms interacting with the
mobile dislocations. This interaction also contributes to the work hardening observed at 550
and 650 °C. The duration of the serrated period shortened with an increase in temperature. At
550 °C and 650 °C, the serrations are observed from the critical strain till failure, while at
750 °C, they disappear at 15% strain. Mannan et al [ 18 ], concluded that serrations can be
correlated to the precipitation activity in the material. At higher temperatures, there is a
800°C
800°C-2.6%
800°C-15%
750°C
750°C-5.6%
750°C-15%
Figure 29. Type A and Type C serrations 750 °C at 5.021×10⁻³ /min and at 800 °C at 2.608×10⁻⁴ /min. Insets showing a zoom in of the engineering stress-
strain curve at different strains.
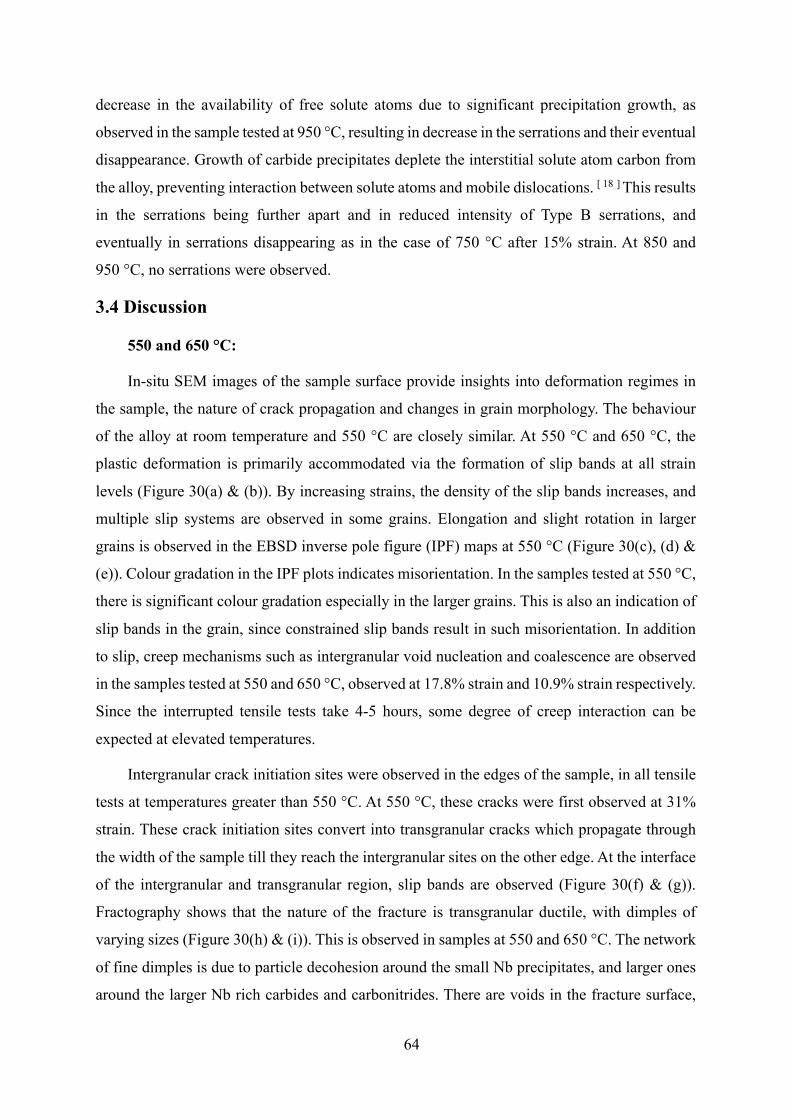
64
decrease in the availability of free solute atoms due to significant precipitation growth, as
observed in the sample tested at 950 °C, resulting in decrease in the serrations and their eventual
disappearance. Growth of carbide precipitates deplete the interstitial solute atom carbon from
the alloy, preventing interaction between solute atoms and mobile dislocations. [ 18 ] This results
in the serrations being further apart and in reduced intensity of Type B serrations, and
eventually in serrations disappearing as in the case of 750 °C after 15% strain. At 850 and
950 °C, no serrations were observed.
3.4 Discussion
550 and 650 °C:
In-situ SEM images of the sample surface provide insights into deformation regimes in
the sample, the nature of crack propagation and changes in grain morphology. The behaviour
of the alloy at room temperature and 550 °C are closely similar. At 550 °C and 650 °C, the
plastic deformation is primarily accommodated via the formation of slip bands at all strain
levels (Figure 30(a) & (b)). By increasing strains, the density of the slip bands increases, and
multiple slip systems are observed in some grains. Elongation and slight rotation in larger
grains is observed in the EBSD inverse pole figure (IPF) maps at 550 °C (Figure 30(c), (d) &
(e)). Colour gradation in the IPF plots indicates misorientation. In the samples tested at 550 °C,
there is significant colour gradation especially in the larger grains. This is also an indication of
slip bands in the grain, since constrained slip bands result in such misorientation. In addition
to slip, creep mechanisms such as intergranular void nucleation and coalescence are observed
in the samples tested at 550 and 650 °C, observed at 17.8% strain and 10.9% strain respectively.
Since the interrupted tensile tests take 4-5 hours, some degree of creep interaction can be
expected at elevated temperatures.
Intergranular crack initiation sites were observed in the edges of the sample, in all tensile
tests at temperatures greater than 550 °C. At 550 °C, these cracks were first observed at 31%
strain. These crack initiation sites convert into transgranular cracks which propagate through
the width of the sample till they reach the intergranular sites on the other edge. At the interface
of the intergranular and transgranular region, slip bands are observed (Figure 30(f) & (g)).
Fractography shows that the nature of the fracture is transgranular ductile, with dimples of
varying sizes (Figure 30(h) & (i)). This is observed in samples at 550 and 650 °C. The network
of fine dimples is due to particle decohesion around the small Nb precipitates, and larger ones
around the larger Nb rich carbides and carbonitrides. There are voids in the fracture surface,
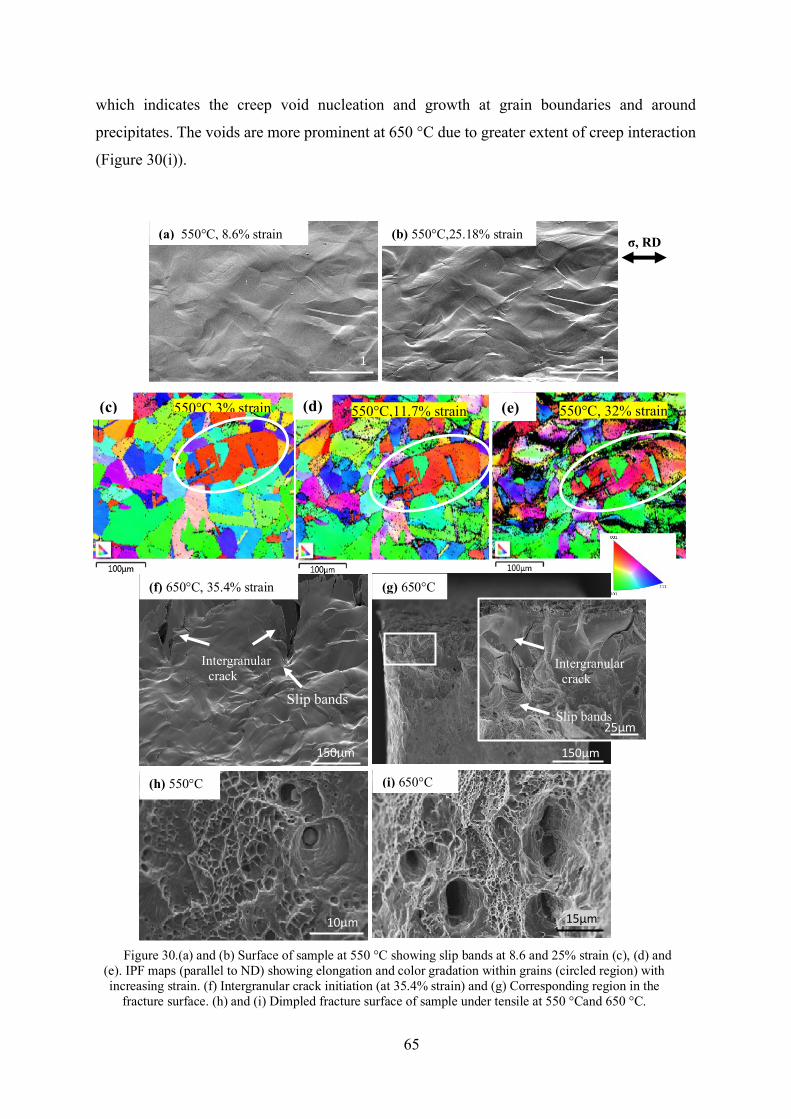
65
which indicates the creep void nucleation and growth at grain boundaries and around
precipitates. The voids are more prominent at 650 °C due to greater extent of creep interaction
(Figure 30(i)).
Figure 30.(a) and (b) Surface of sample at 550 °C showing slip bands at 8.6 and 25% strain (c), (d) and (e). IPF maps (parallel to ND) showing elongation and color gradation within grains (circled region) with increasing strain. (f) Intergranular crack initiation (at 35.4% strain) and (g) Corresponding region in the
fracture surface. (h) and (i) Dimpled fracture surface of sample under tensile at 550 °Cand 650 °C.
σ, RD
100µm,
(a) 550°C, 8.6% strain
100µm,
(b) 550°C,25.18% strain
(h) 550°C
10µm
(i) 650°C
15µm
550°C,3% strain (c) 550°C,11.7% strain (d) 550°C, 32% strain (e)
150µm
Slip bands
Intergranular crack
(f) 650°C, 35.4% strain
150µm 25µm
Slip bands
Intergranular crack
(g) 650°C
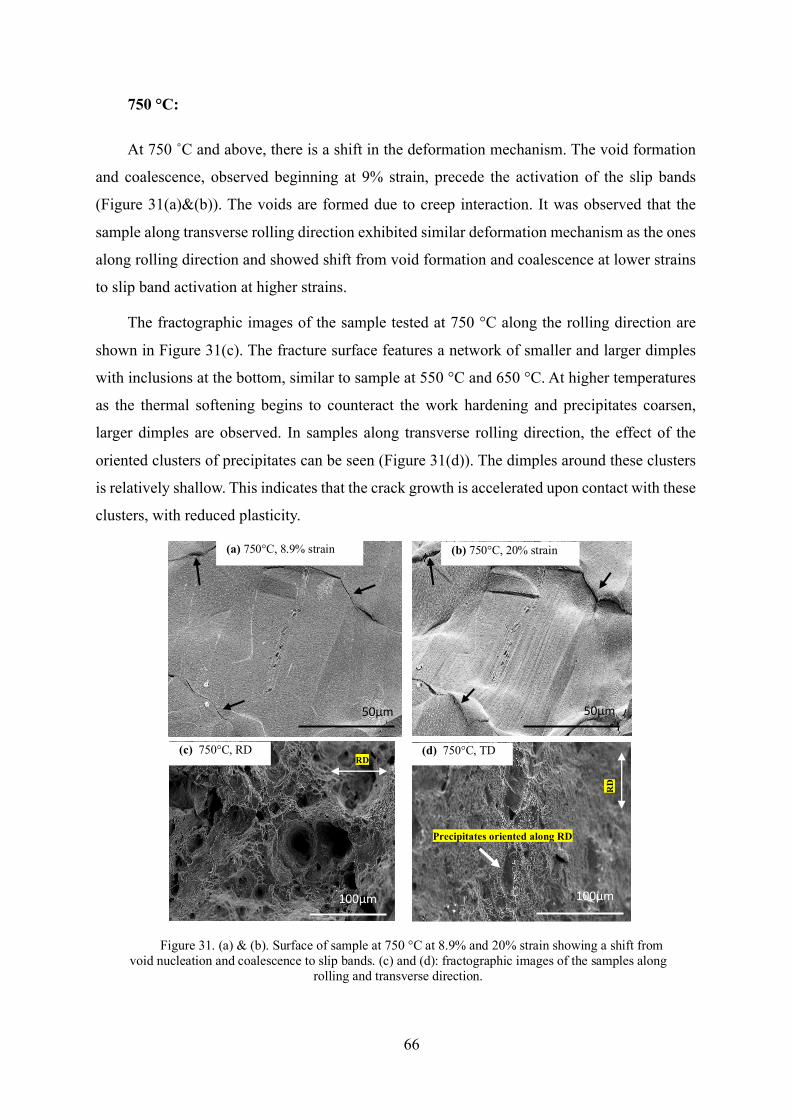
66
750 °C:
At 750 ˚C and above, there is a shift in the deformation mechanism. The void formation
and coalescence, observed beginning at 9% strain, precede the activation of the slip bands
(Figure 31(a)&(b)). The voids are formed due to creep interaction. It was observed that the
sample along transverse rolling direction exhibited similar deformation mechanism as the ones
along rolling direction and showed shift from void formation and coalescence at lower strains
to slip band activation at higher strains.
The fractographic images of the sample tested at 750 °C along the rolling direction are
shown in Figure 31(c). The fracture surface features a network of smaller and larger dimples
with inclusions at the bottom, similar to sample at 550 °C and 650 °C. At higher temperatures
as the thermal softening begins to counteract the work hardening and precipitates coarsen,
larger dimples are observed. In samples along transverse rolling direction, the effect of the
oriented clusters of precipitates can be seen (Figure 31(d)). The dimples around these clusters
is relatively shallow. This indicates that the crack growth is accelerated upon contact with these
clusters, with reduced plasticity.
Figure 31. (a) & (b). Surface of sample at 750 °C at 8.9% and 20% strain showing a shift from void nucleation and coalescence to slip bands. (c) and (d): fractographic images of the samples along
rolling and transverse direction.
100µm
(c) 750°C, RD
100µm
RD
Precipitates oriented along RD
(d) 750°C, TD
50µm
(a) 750°C, 8.9% strain (b) 750°C, 20% strain
50µm
RD
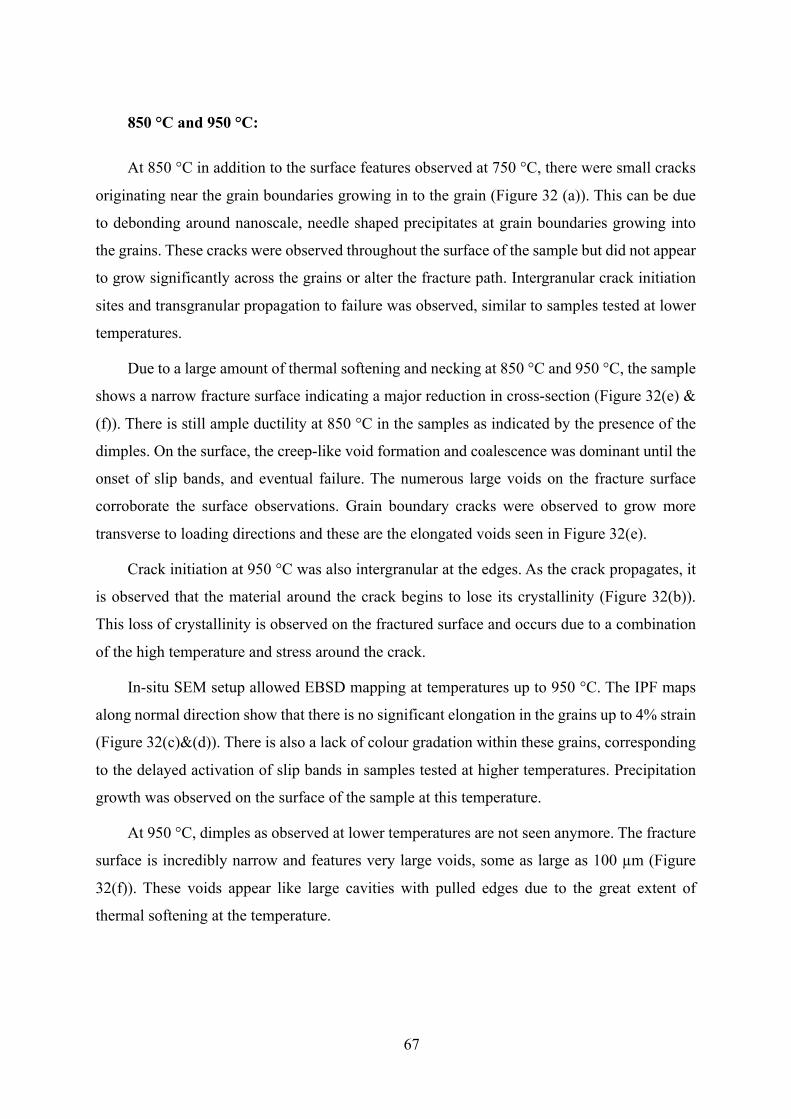
67
850 °C and 950 °C:
At 850 °C in addition to the surface features observed at 750 °C, there were small cracks
originating near the grain boundaries growing in to the grain (Figure 32 (a)). This can be due
to debonding around nanoscale, needle shaped precipitates at grain boundaries growing into
the grains. These cracks were observed throughout the surface of the sample but did not appear
to grow significantly across the grains or alter the fracture path. Intergranular crack initiation
sites and transgranular propagation to failure was observed, similar to samples tested at lower
temperatures.
Due to a large amount of thermal softening and necking at 850 °C and 950 °C, the sample
shows a narrow fracture surface indicating a major reduction in cross-section (Figure 32(e) &
(f)). There is still ample ductility at 850 °C in the samples as indicated by the presence of the
dimples. On the surface, the creep-like void formation and coalescence was dominant until the
onset of slip bands, and eventual failure. The numerous large voids on the fracture surface
corroborate the surface observations. Grain boundary cracks were observed to grow more
transverse to loading directions and these are the elongated voids seen in Figure 32(e).
Crack initiation at 950 °C was also intergranular at the edges. As the crack propagates, it
is observed that the material around the crack begins to lose its crystallinity (Figure 32(b)).
This loss of crystallinity is observed on the fractured surface and occurs due to a combination
of the high temperature and stress around the crack.
In-situ SEM setup allowed EBSD mapping at temperatures up to 950 °C. The IPF maps
along normal direction show that there is no significant elongation in the grains up to 4% strain
(Figure 32(c)&(d)). There is also a lack of colour gradation within these grains, corresponding
to the delayed activation of slip bands in samples tested at higher temperatures. Precipitation
growth was observed on the surface of the sample at this temperature.
At 950 °C, dimples as observed at lower temperatures are not seen anymore. The fracture
surface is incredibly narrow and features very large voids, some as large as 100 µm (Figure
32(f)). These voids appear like large cavities with pulled edges due to the great extent of
thermal softening at the temperature.
68
Grain boundary M23C6 precipitates, Nb rich precipitates within the grains were seen very
prominently on the surface Figure 33(a). Some extent of debonding at the precipitate-matrix
was observed (Figure 33(b)) but did not appear to grow significantly before sample failure.
Phase changes in the Alloy 709 during heating and loading are also observed using in-situ SEM
and EBSD. There is an increase in BCC ferrite content at elevated temperatures, as shown in
Table 10. The increase in the BCC ferrite is significantly larger at 950 °C when compared
to 650 °C, even at lower strains. Such ferrite formation at the grain boundaries have been
observed in 316H and were found to be associated with creep cavitation. [ 23 ]
Figure 32. (a). In-situ SEM images of sample under tensile at 850 °C – showing cracks growing into grain boundary into the grains; and (b) 950 °C-showing loss of crystallinity around the crack propagation. (c) & (d): IPF (parallel to normal direction) of Alloy 709 sample at 950 °C. (e) & (f): Fractographic images of samples at
850 and 950 °C.
50µm 50µm
(d) 950°C,3.9% strain
(c) RT, 0 strain
σ, RD
15µm
(a) 850°C
15µm
(b) 950°C
(e) 850°C, RD (f) 950°C,3.9% strain
Cracks originating at grain boundaries. Directed into grains
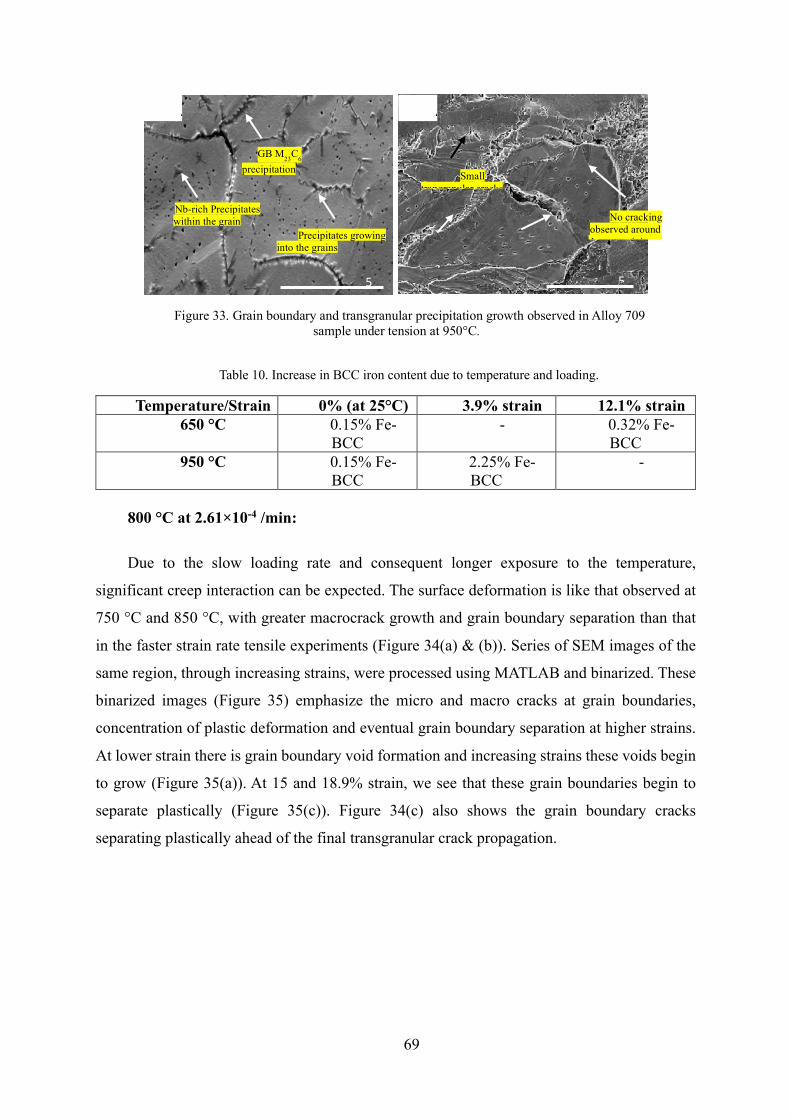
69
Table 10. Increase in BCC iron content due to temperature and loading.
Temperature/Strain 0% (at 25°C) 3.9% strain 12.1% strain 650 °C 0.15% Fe-
BCC - 0.32% Fe-
BCC 950 °C 0.15% Fe-
BCC 2.25% Fe-BCC
-
800 °C at 2.61×10⁻⁴ /min:
Due to the slow loading rate and consequent longer exposure to the temperature,
significant creep interaction can be expected. The surface deformation is like that observed at
750 °C and 850 °C, with greater macrocrack growth and grain boundary separation than that
in the faster strain rate tensile experiments (Figure 34(a) & (b)). Series of SEM images of the
same region, through increasing strains, were processed using MATLAB and binarized. These
binarized images (Figure 35) emphasize the micro and macro cracks at grain boundaries,
concentration of plastic deformation and eventual grain boundary separation at higher strains.
At lower strain there is grain boundary void formation and increasing strains these voids begin
to grow (Figure 35(a)). At 15 and 18.9% strain, we see that these grain boundaries begin to
separate plastically (Figure 35(c)). Figure 34(c) also shows the grain boundary cracks
separating plastically ahead of the final transgranular crack propagation.
(
Nb-rich Precipitates within the grain
GB M23C6 precipitation
Precipitates growing into the grains
5
No cracking observed around these precipitates
Small trangranular cracks
5
(
Figure 33. Grain boundary and transgranular precipitation growth observed in Alloy 709 sample under tension at 950°C.
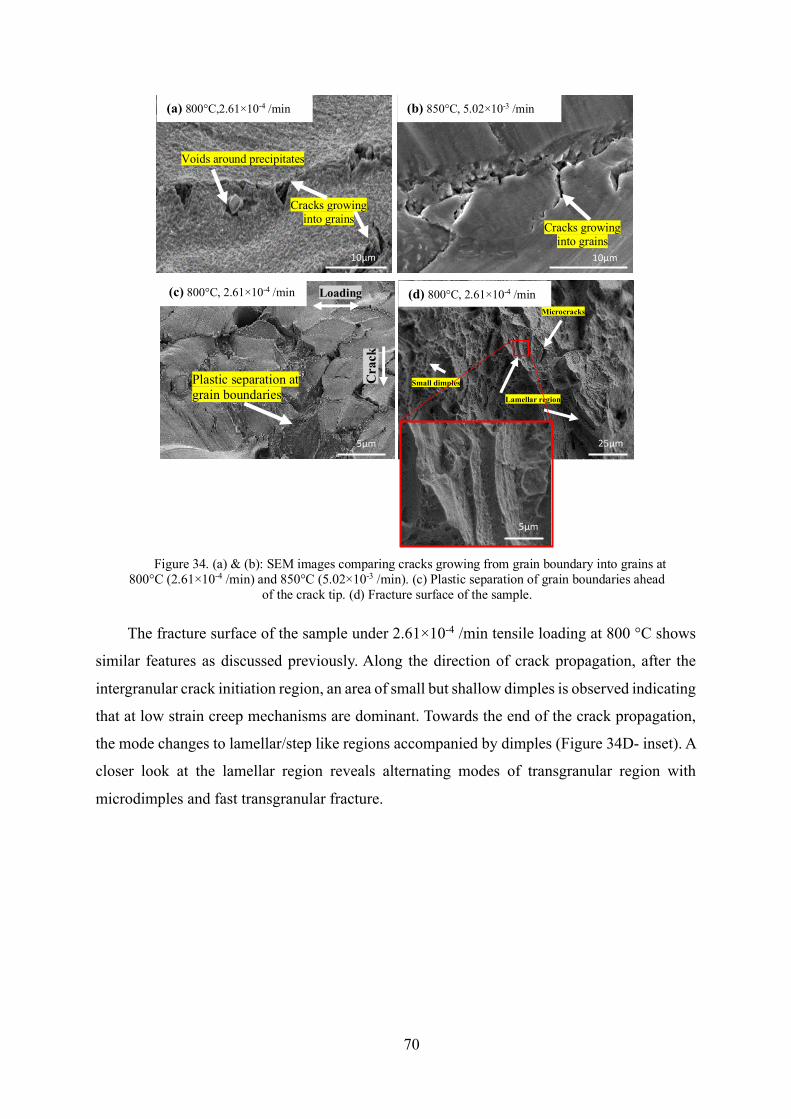
70
The fracture surface of the sample under 2.61×10⁻⁴ /min tensile loading at 800 °C shows
similar features as discussed previously. Along the direction of crack propagation, after the
intergranular crack initiation region, an area of small but shallow dimples is observed indicating
that at low strain creep mechanisms are dominant. Towards the end of the crack propagation,
the mode changes to lamellar/step like regions accompanied by dimples (Figure 34D- inset). A
closer look at the lamellar region reveals alternating modes of transgranular region with
microdimples and fast transgranular fracture.
Figure 34. (a) & (b): SEM images comparing cracks growing from grain boundary into grains at 800°C (2.61×10⁻⁴ /min) and 850°C (5.02×10⁻³ /min). (c) Plastic separation of grain boundaries ahead
of the crack tip. (d) Fracture surface of the sample.
Cra
ck
Loading
Plastic separation at grain boundaries
5µm
(c) 800°C, 2.61×10⁻⁴ /min
Cracks growing into grains
Voids around precipitates
(a) 800°C,2.61×10-4 /min
10µm
Lamellar region
Microcracks
25µm
Small dimples
(d) 800°C, 2.61×10⁻⁴ /min
5µm
10µm
(b) 850°C, 5.02×10⁻³ /min
Cracks growing into grains
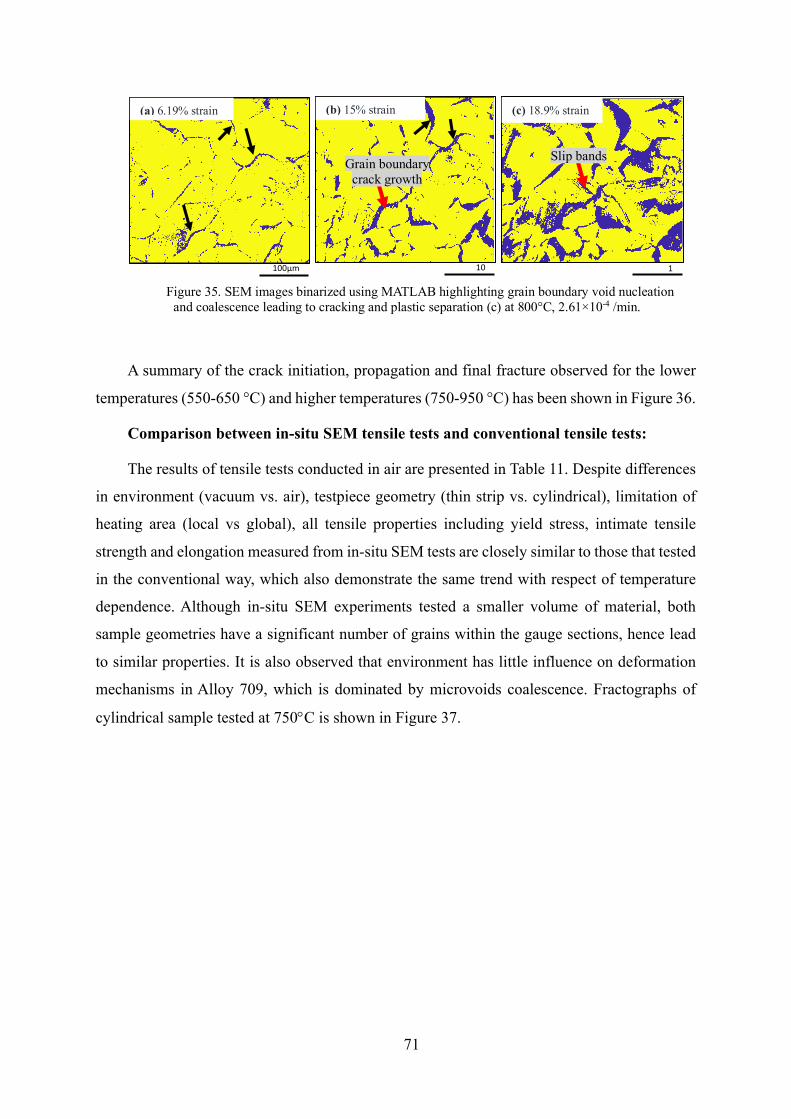
71
A summary of the crack initiation, propagation and final fracture observed for the lower
temperatures (550-650 °C) and higher temperatures (750-950 °C) has been shown in Figure 36.
Comparison between in-situ SEM tensile tests and conventional tensile tests:
The results of tensile tests conducted in air are presented in Table 11. Despite differences
in environment (vacuum vs. air), testpiece geometry (thin strip vs. cylindrical), limitation of
heating area (local vs global), all tensile properties including yield stress, intimate tensile
strength and elongation measured from in-situ SEM tests are closely similar to those that tested
in the conventional way, which also demonstrate the same trend with respect of temperature
dependence. Although in-situ SEM experiments tested a smaller volume of material, both
sample geometries have a significant number of grains within the gauge sections, hence lead
to similar properties. It is also observed that environment has little influence on deformation
mechanisms in Alloy 709, which is dominated by microvoids coalescence. Fractographs of
cylindrical sample tested at 750°C is shown in Figure 37.
Figure 35. SEM images binarized using MATLAB highlighting grain boundary void nucleation and coalescence leading to cracking and plastic separation (c) at 800°C, 2.61×10⁻⁴ /min.
(a) 6.19% strain
100µm
(b) 15% strain
Grain boundary crack growth
100µm
(c) 18.9% strain
Slip bands
100µm
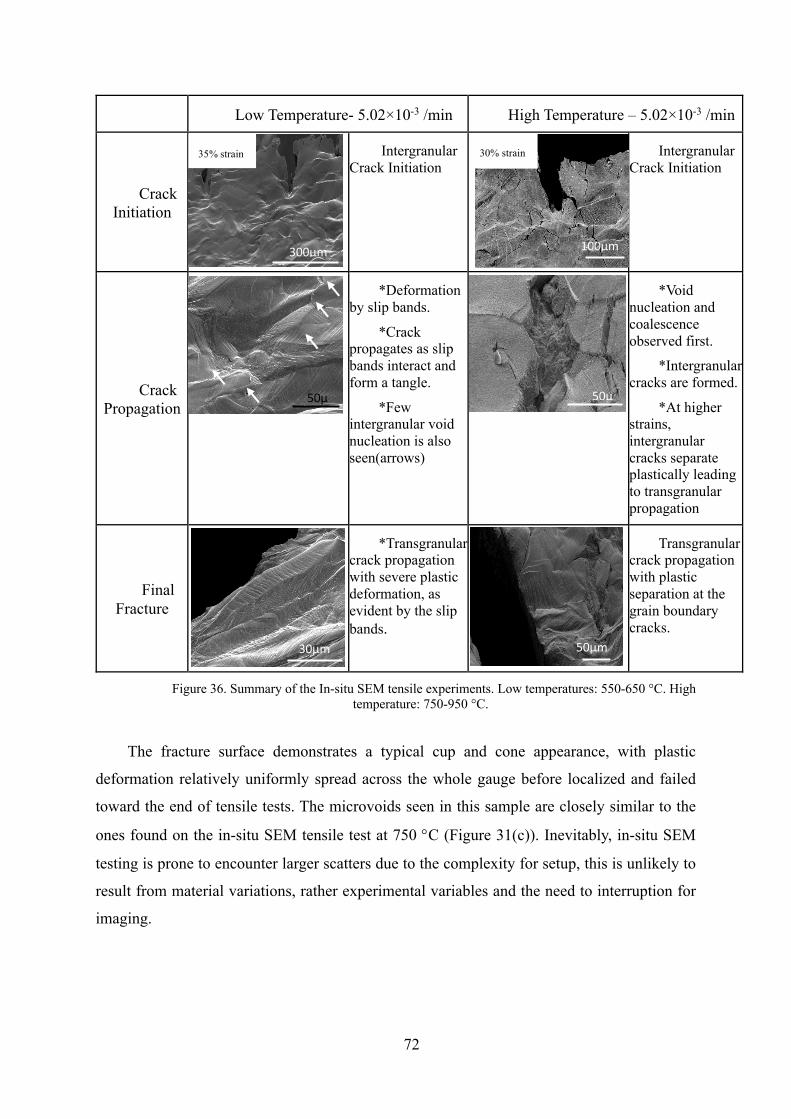
72
Low Temperature- 5.02×10⁻³ /min High Temperature – 5.02×10⁻³ /min
Crack Initiation
Intergranular Crack Initiation
Intergranular Crack Initiation
Crack Propagation
*Deformation by slip bands.
*Crack propagates as slip bands interact and form a tangle.
*Few intergranular void nucleation is also seen(arrows)
*Void nucleation and coalescence observed first.
*Intergranular cracks are formed.
*At higher strains, intergranular cracks separate plastically leading to transgranular propagation
Final Fracture
*Transgranular crack propagation with severe plastic deformation, as evident by the slip bands.
Transgranular crack propagation with plastic separation at the grain boundary cracks.
The fracture surface demonstrates a typical cup and cone appearance, with plastic
deformation relatively uniformly spread across the whole gauge before localized and failed
toward the end of tensile tests. The microvoids seen in this sample are closely similar to the
ones found on the in-situ SEM tensile test at 750 °C (Figure 31(c)). Inevitably, in-situ SEM
testing is prone to encounter larger scatters due to the complexity for setup, this is unlikely to
result from material variations, rather experimental variables and the need to interruption for
imaging.
Figure 36. Summary of the In-situ SEM tensile experiments. Low temperatures: 550-650 °C. High temperature: 750-950 °C.
300µm
35% strain
100µm
30% strain
50µm
30µm
50µm
50µm
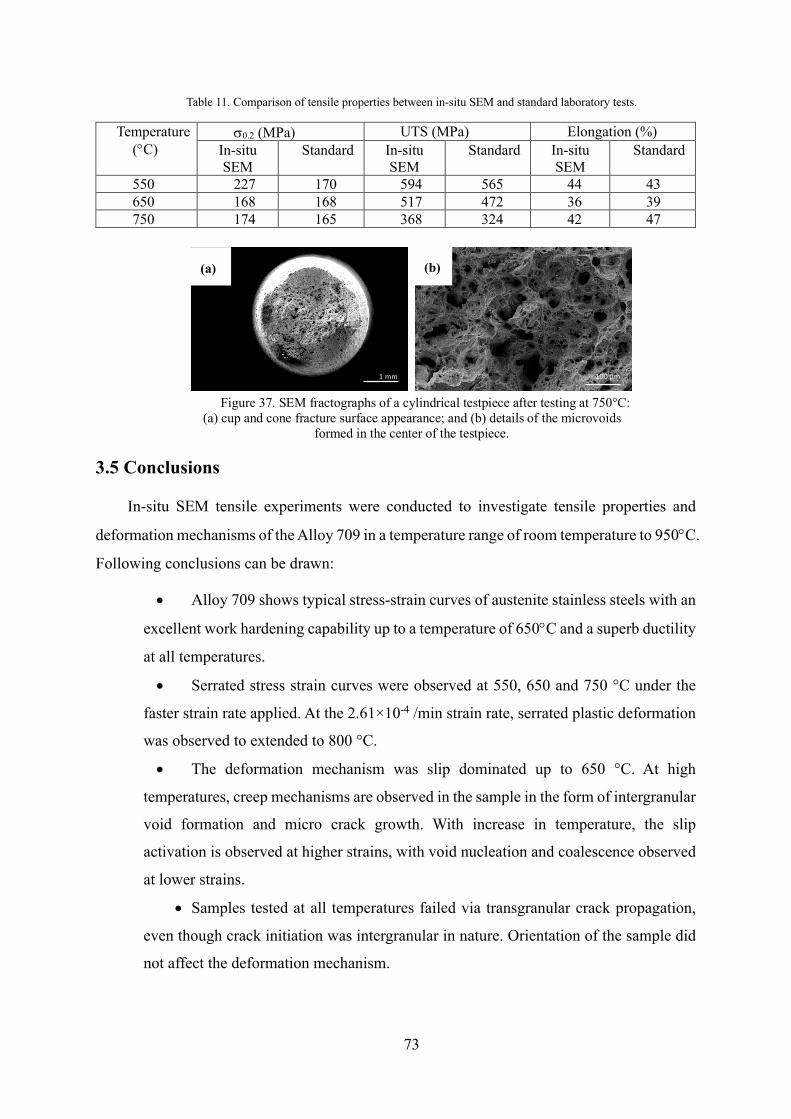
73
Table 11. Comparison of tensile properties between in-situ SEM and standard laboratory tests.
Temperature (°C)
s0.2 (MPa) UTS (MPa) Elongation (%) In-situ SEM
Standard In-situ SEM
Standard In-situ SEM
Standard
550 227 170 594 565 44 43 650 168 168 517 472 36 39 750 174 165 368 324 42 47
3.5 Conclusions
In-situ SEM tensile experiments were conducted to investigate tensile properties and
deformation mechanisms of the Alloy 709 in a temperature range of room temperature to 950°C.
Following conclusions can be drawn:
• Alloy 709 shows typical stress-strain curves of austenite stainless steels with an
excellent work hardening capability up to a temperature of 650°C and a superb ductility
at all temperatures.
• Serrated stress strain curves were observed at 550, 650 and 750 °C under the
faster strain rate applied. At the 2.61×10⁻⁴ /min strain rate, serrated plastic deformation
was observed to extended to 800 °C.
• The deformation mechanism was slip dominated up to 650 °C. At high
temperatures, creep mechanisms are observed in the sample in the form of intergranular
void formation and micro crack growth. With increase in temperature, the slip
activation is observed at higher strains, with void nucleation and coalescence observed
at lower strains.
• Samples tested at all temperatures failed via transgranular crack propagation,
even though crack initiation was intergranular in nature. Orientation of the sample did
not affect the deformation mechanism.
Figure 37. SEM fractographs of a cylindrical testpiece after testing at 750°C: (a) cup and cone fracture surface appearance; and (b) details of the microvoids
formed in the center of the testpiece.
1 mm 100 µm
(b) (a)
74
4 Tensile properties and deformation mechanisms of Alloy 709
on larger samples
(The content of this chapter has been submitted as a journal article to Material
& Design in March 2019 for publication.
Authors-Rengen Ding, Jin Yan, Hangyue Li, Suyang Yu, Afsaneh Rabiei and
Paul Bowen.
Title- “Deformation microstructure and tensile properties of Alloy 709 at
different temperatures”, Submitted to Materials & Design in March 2019.)
75
4.1 Material and experimental procedures
In order to investigate the effect of aging on tensile properties of the Alloy 709, the as-
received block was aged at 650°C for 2000 h in a vacuum furnace to simulate microstructure
evolution during service. Tensile samples with a gage section diameter of 5 mm and a reduced
section length of 25.3 mm were machined from the as-received and aged materials. The tensile
tests were conducted using a Zwick mechanical testing machine at room temperature, 550, 650
and 750°C in air under a nominal strain rate of 1×10⁻⁴/s. The temperature was maintained
within ± 2°C and the soaking time for each sample was kept at 30 min for test at each
temperature. To study the effect of temperature on deformation mechanism, some tests were
interrupted at a nominal strain of ~2%. This means that the testing time for the interrupted
samples is ~ 3 mins. Thus, the total time for the interrupted samples is about 33 mins at the
target temperatures. The strain-hardening of the Alloy 709 was analysed. A standard approach [ 24 ] was adopted for measuring stress values from the stress-strain curves showing serrated
flow.
To understand the influence of precipitates induced by aging on the mechanical behaviour
and plastic deformations, microstructure including precipitates was investigated using TEM
before and after tensile test. The discs with 3mm in diameter were cut perpendicularly from the
gauge length of the tensile samples, and then mechanically ground to 100 µm in thickens,
followed by electropolishing in a solution of 10% perchloric acid + 90% ethanol at 20V and -
20°C. TEM observation was carried out on a FEI Talos F200X microscope equipped with
Super-X energy dispersive X-ray spectroscope (EDS) operating at 200 kV.
In order to explore fracture mechanism, longitudinal sections of fractured testpieces and
fracture surfaces were examined on FEI Quanta 3D and Helios dual-beam scanning electron
microscopes (SEM). Grain size was measured using Oxford Instruments Nordlys EBSD
(electron backscatter diffraction) detector with step size of 1 µm for the as-received material.
To reveal the formation of subgrains during tension testing, however, the step size of 50 nm
was used in the sectioned samples.
4.2 Results and discussion
4.2.1 Tensile
Typical engineering stress - strain curves of the as-received and aged samples at various
temperatures are shown in Figure 38. As can be seen, Alloy 709 shows serrated flow during
76
tensile deformation at intermediate temperatures depending on heat treatment (Figure 38b). For
example, the as-received sample shows serration at 650°C while the aged sample does not
exhibit serration at the same temperature. At 550°C, the serrated flow commences after a
critical strain (e.g. 1.6% for as-received sample) and continues until fracture occurs but it only
occurs at strains ranging from 1.2% to 2.5% at 650°C for the as-received sample. The
occurrence of serrated flow is attributed to DSA effect, which is generally believed to be caused
by pining or unpinning processes between interstitials/solute atoms and mobile dislocations. [ 25 ] [ 26 ] [ 27 ] Additionally, Suzuki segregation can also play an important role in the DSA effect
due to interactions between solute atoms and stacking faults. [ 28 ] It is known that at low
temperatures, the interstitials/solute atoms are immobile with respect to the moving
dislocations and thus could not impede dislocation motion. At high temperatures, the mobility
of solute atoms is high enough to follow the dislocations without any drag or disruption. Very
recently, Alomari et al. [ 29 ] reported that the DSA regime of Alloy 709 to be within 250 ~ 650°C
at a strain of 10-4/s, which is consistent with the observations reported for various austenitic
stainless steels. For instance, Choudhary et al. suggested that DSA in a type of 316 LN stainless
steel is caused by the diffusion of interstitials (C+N) in the low temperature regime (250-325°C)
and by substitutional solutes in the high temperature regime (400-600°C). [ 30 ]
The variations of 0.2% offset yield strength (YS) and the ultimate tensile strength (UTS)
of the two investigated materials (as-received and aged Alloy 709) with temperature are
illustrated in Figure 39. As can be seen, the as-received material shows ~300 MPa YS at room
temperature. The yield strength reduces to ~200 MPa at 550°C but does not decrease
significantly with further increasing of temperature. However, the UTS decreases consistently
with increasing testing temperature. The aged material shows higher yield stress and lower
UTS but has a similar variation with testing temperature to the as-received material. This means
that aging leads to reduction in ductility, as shown in Figure 39b. Temperature effect on
ductility of this alloy can be defined as a function of the elongation-to-fracture, ef , uniform
elongation, eu (i.e. elongation up to maximum stress in a true stress-strain curve) and non-
uniform elongation, enu (i.e. post-uniform elongation or necking strain, or enu = ef - eu). The enu
for the as-received material at 550°C is close to zero (Figure 39), which means that almost no
necking occurs. Aging enhances non-uniform elongation of the Alloy 709 at elevated
temperatures (Figure 39b).
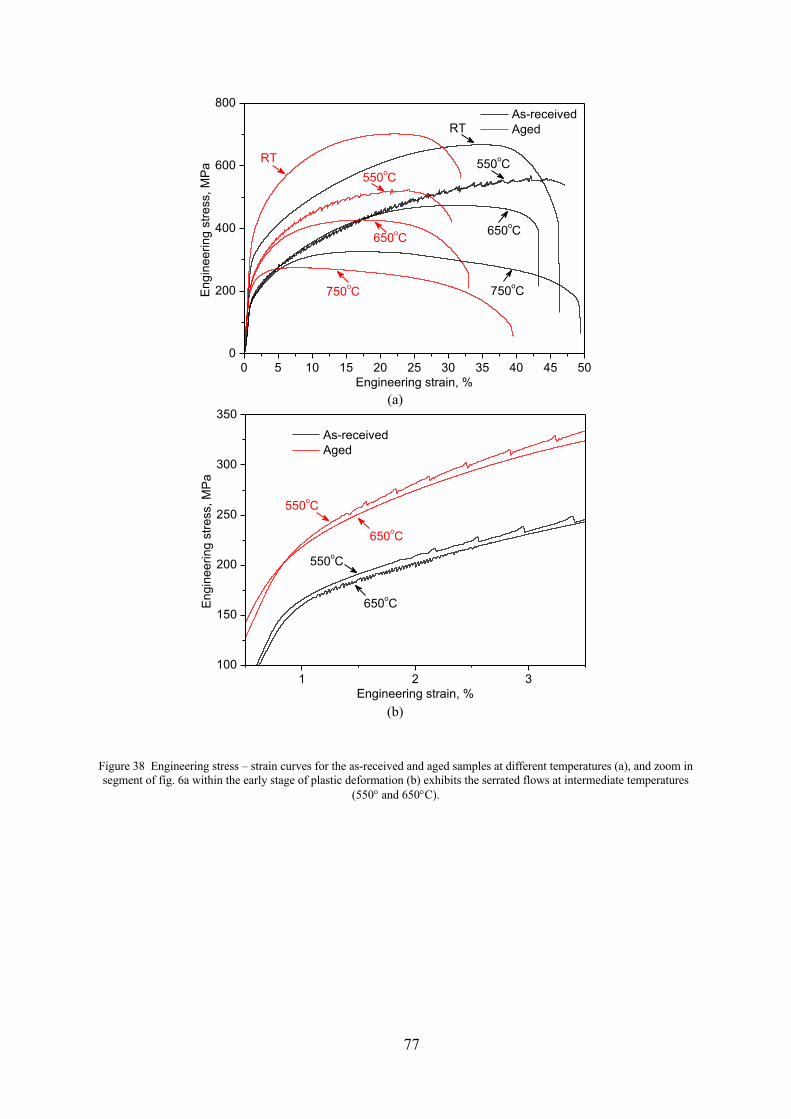
77
Figure 38 Engineering stress – strain curves for the as-received and aged samples at different temperatures (a), and zoom in segment of fig. 6a within the early stage of plastic deformation (b) exhibits the serrated flows at intermediate temperatures
(550° and 650°C).
(a)
(b)
0 5 10 15 20 25 30 35 40 45 500
200
400
600
800
RT
750oC
RT
750oC
550oC
650oC 650oC
As-received Aged
Engi
neer
ing
stre
ss, M
Pa
Engineering strain, %
550oC
1 2 3100
150
200
250
300
350
550oC
650oC
650oC
As-received Aged
Engi
neer
ing
stre
ss, M
Pa
Engineering strain, %
550oC
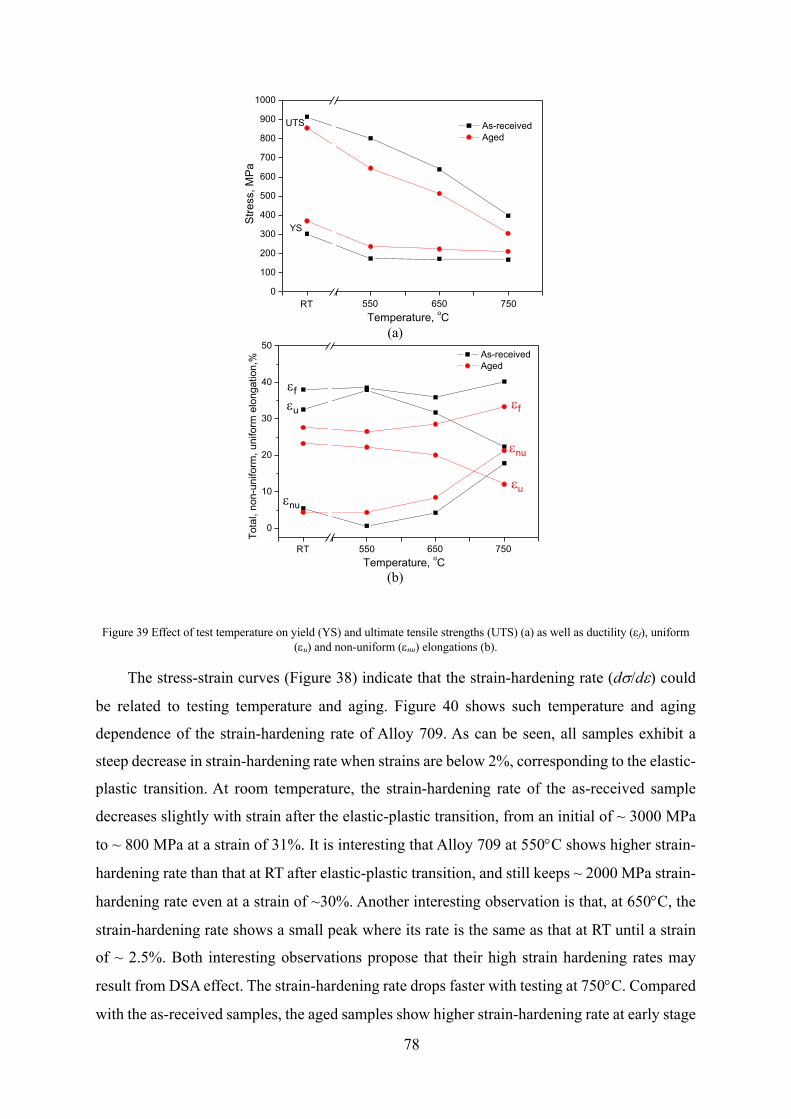
78
Figure 39 Effect of test temperature on yield (YS) and ultimate tensile strengths (UTS) (a) as well as ductility (ef), uniform
(eu) and non-uniform (enu) elongations (b).
The stress-strain curves (Figure 38) indicate that the strain-hardening rate (ds/de) could
be related to testing temperature and aging. Figure 40 shows such temperature and aging
dependence of the strain-hardening rate of Alloy 709. As can be seen, all samples exhibit a
steep decrease in strain-hardening rate when strains are below 2%, corresponding to the elastic-
plastic transition. At room temperature, the strain-hardening rate of the as-received sample
decreases slightly with strain after the elastic-plastic transition, from an initial of ~ 3000 MPa
to ~ 800 MPa at a strain of 31%. It is interesting that Alloy 709 at 550°C shows higher strain-
hardening rate than that at RT after elastic-plastic transition, and still keeps ~ 2000 MPa strain-
hardening rate even at a strain of ~30%. Another interesting observation is that, at 650°C, the
strain-hardening rate shows a small peak where its rate is the same as that at RT until a strain
of ~ 2.5%. Both interesting observations propose that their high strain hardening rates may
result from DSA effect. The strain-hardening rate drops faster with testing at 750°C. Compared
with the as-received samples, the aged samples show higher strain-hardening rate at early stage
(a)
(b)
0
100
200
300
400
500
600
700
800
900
1000
750650550
YS
As-received Aged
Stre
ss, M
Pa
Temperature, oC
UTS
RT
0
10
20
30
40
50
enu
eu
ef
As-received Aged
Temperature, oC750650550RT
ef eu
Tota
l, no
n-un
iform
, uni
form
elo
ngat
ion,
%
enu
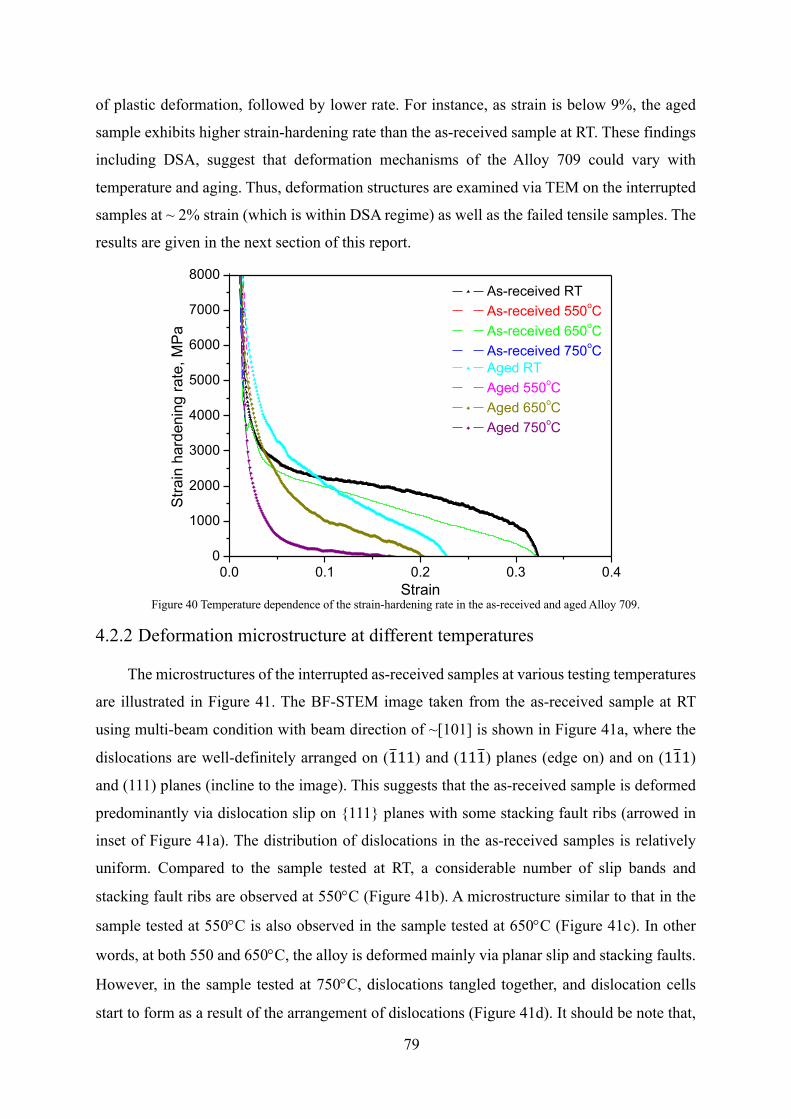
79
of plastic deformation, followed by lower rate. For instance, as strain is below 9%, the aged
sample exhibits higher strain-hardening rate than the as-received sample at RT. These findings
including DSA, suggest that deformation mechanisms of the Alloy 709 could vary with
temperature and aging. Thus, deformation structures are examined via TEM on the interrupted
samples at ~ 2% strain (which is within DSA regime) as well as the failed tensile samples. The
results are given in the next section of this report.
Figure 40 Temperature dependence of the strain-hardening rate in the as-received and aged Alloy 709.
4.2.2 Deformation microstructure at different temperatures
The microstructures of the interrupted as-received samples at various testing temperatures
are illustrated in Figure 41. The BF-STEM image taken from the as-received sample at RT
using multi-beam condition with beam direction of ~[101] is shown in Figure 41a, where the
dislocations are well-definitely arranged on (1#11) and (111#) planes (edge on) and on (11#1)
and (111) planes (incline to the image). This suggests that the as-received sample is deformed
predominantly via dislocation slip on {111} planes with some stacking fault ribs (arrowed in
inset of Figure 41a). The distribution of dislocations in the as-received samples is relatively
uniform. Compared to the sample tested at RT, a considerable number of slip bands and
stacking fault ribs are observed at 550°C (Figure 41b). A microstructure similar to that in the
sample tested at 550°C is also observed in the sample tested at 650°C (Figure 41c). In other
words, at both 550 and 650°C, the alloy is deformed mainly via planar slip and stacking faults.
However, in the sample tested at 750°C, dislocations tangled together, and dislocation cells
start to form as a result of the arrangement of dislocations (Figure 41d). It should be note that,
0.0 0.1 0.2 0.3 0.40
1000
2000
3000
4000
5000
6000
7000
8000 As-received RT As-received 550oC As-received 650oC As-received 750oC Aged RT Aged 550oC Aged 650oC Aged 750oC
Stra
in h
arde
ning
rate
, MPa
Strain
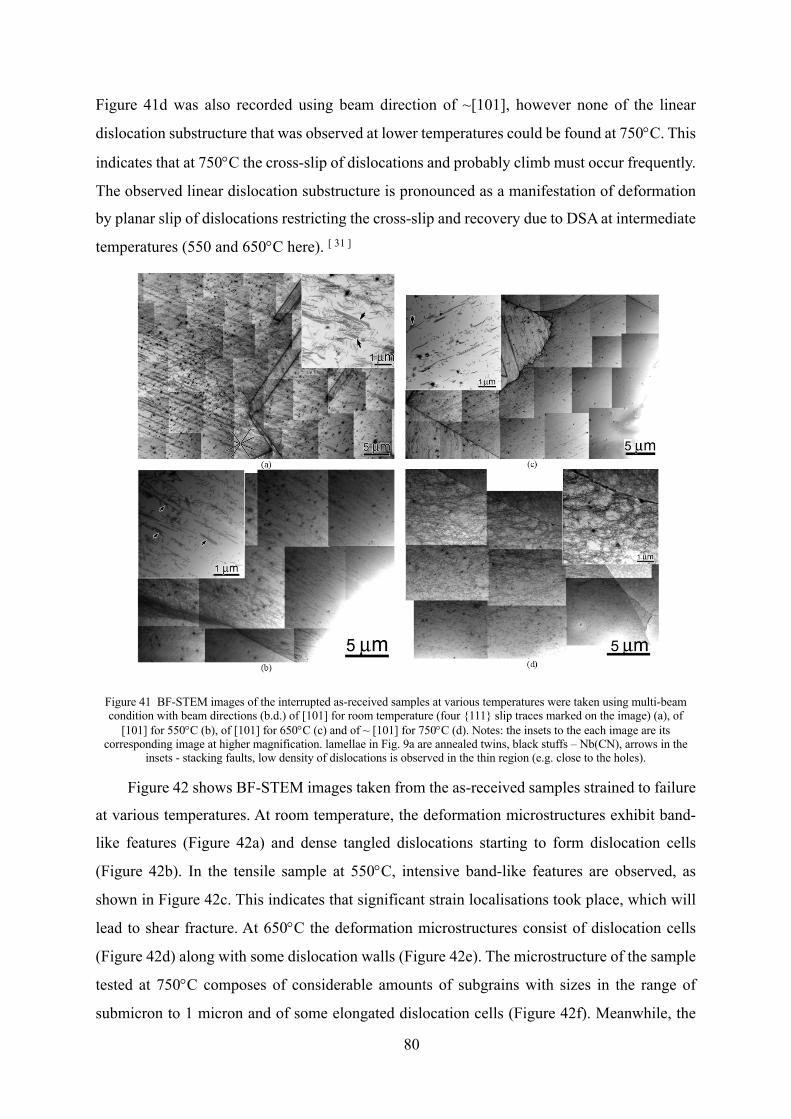
80
Figure 41d was also recorded using beam direction of ~[101], however none of the linear
dislocation substructure that was observed at lower temperatures could be found at 750°C. This
indicates that at 750°C the cross-slip of dislocations and probably climb must occur frequently.
The observed linear dislocation substructure is pronounced as a manifestation of deformation
by planar slip of dislocations restricting the cross-slip and recovery due to DSA at intermediate
temperatures (550 and 650°C here). [ 31 ]
Figure 41 BF-STEM images of the interrupted as-received samples at various temperatures were taken using multi-beam condition with beam directions (b.d.) of [101] for room temperature (four {111} slip traces marked on the image) (a), of
[101] for 550°C (b), of [101] for 650°C (c) and of ~ [101] for 750°C (d). Notes: the insets to the each image are its corresponding image at higher magnification. lamellae in Fig. 9a are annealed twins, black stuffs – Nb(CN), arrows in the
insets - stacking faults, low density of dislocations is observed in the thin region (e.g. close to the holes).
Figure 42 shows BF-STEM images taken from the as-received samples strained to failure
at various temperatures. At room temperature, the deformation microstructures exhibit band-
like features (Figure 42a) and dense tangled dislocations starting to form dislocation cells
(Figure 42b). In the tensile sample at 550°C, intensive band-like features are observed, as
shown in Figure 42c. This indicates that significant strain localisations took place, which will
lead to shear fracture. At 650°C the deformation microstructures consist of dislocation cells
(Figure 42d) along with some dislocation walls (Figure 42e). The microstructure of the sample
tested at 750°C composes of considerable amounts of subgrains with sizes in the range of
submicron to 1 micron and of some elongated dislocation cells (Figure 42f). Meanwhile, the
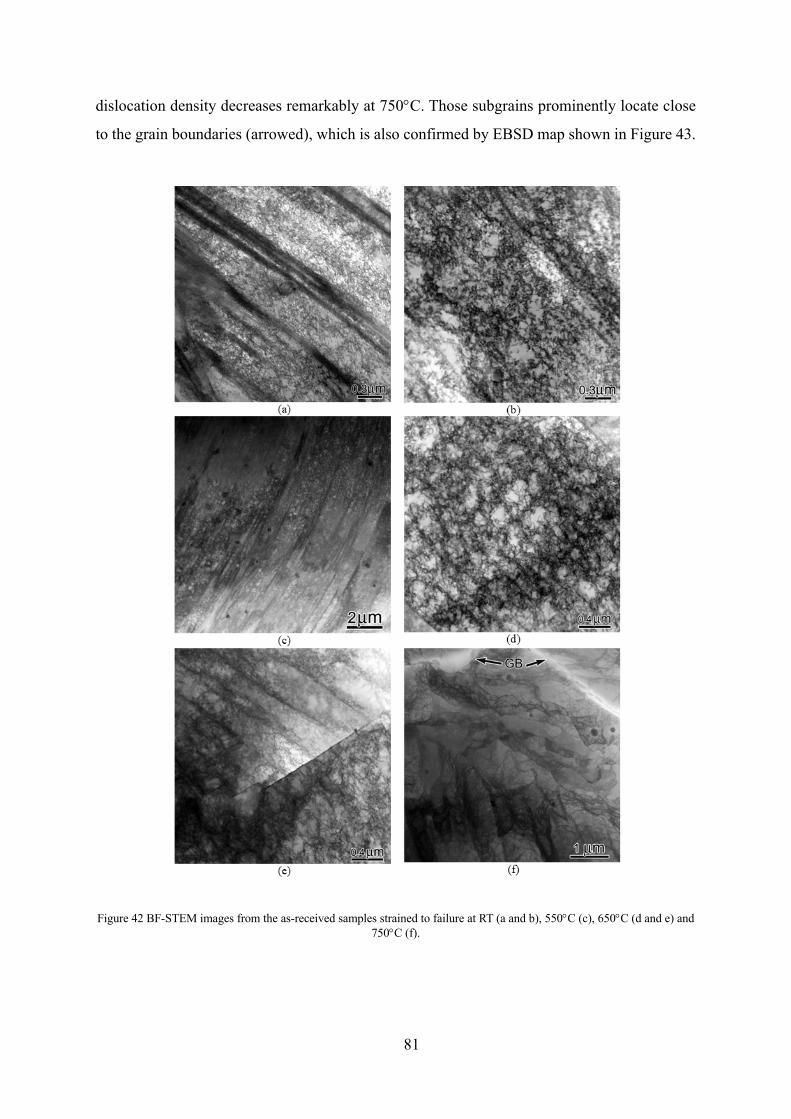
81
dislocation density decreases remarkably at 750°C. Those subgrains prominently locate close
to the grain boundaries (arrowed), which is also confirmed by EBSD map shown in Figure 43.
Figure 42 BF-STEM images from the as-received samples strained to failure at RT (a and b), 550°C (c), 650°C (d and e) and
750°C (f).
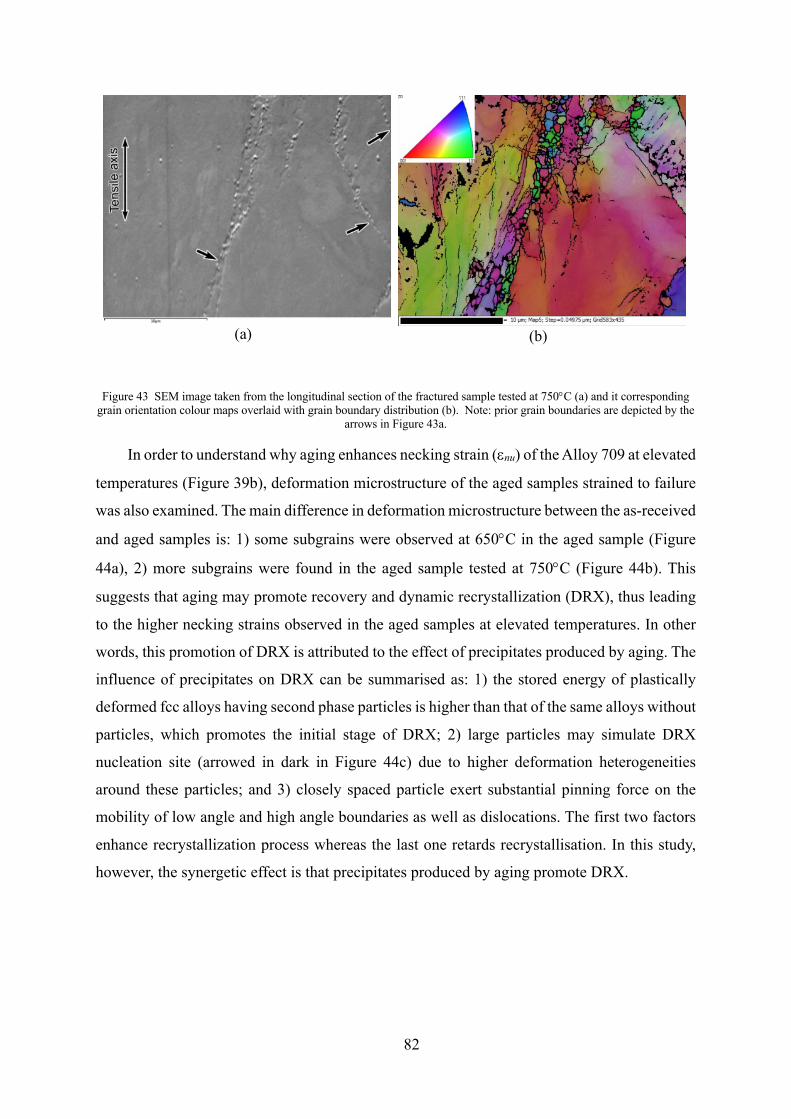
82
Figure 43 SEM image taken from the longitudinal section of the fractured sample tested at 750°C (a) and it corresponding
grain orientation colour maps overlaid with grain boundary distribution (b). Note: prior grain boundaries are depicted by the arrows in Figure 43a.
In order to understand why aging enhances necking strain (enu) of the Alloy 709 at elevated
temperatures (Figure 39b), deformation microstructure of the aged samples strained to failure
was also examined. The main difference in deformation microstructure between the as-received
and aged samples is: 1) some subgrains were observed at 650°C in the aged sample (Figure
44a), 2) more subgrains were found in the aged sample tested at 750°C (Figure 44b). This
suggests that aging may promote recovery and dynamic recrystallization (DRX), thus leading
to the higher necking strains observed in the aged samples at elevated temperatures. In other
words, this promotion of DRX is attributed to the effect of precipitates produced by aging. The
influence of precipitates on DRX can be summarised as: 1) the stored energy of plastically
deformed fcc alloys having second phase particles is higher than that of the same alloys without
particles, which promotes the initial stage of DRX; 2) large particles may simulate DRX
nucleation site (arrowed in dark in Figure 44c) due to higher deformation heterogeneities
around these particles; and 3) closely spaced particle exert substantial pinning force on the
mobility of low angle and high angle boundaries as well as dislocations. The first two factors
enhance recrystallization process whereas the last one retards recrystallisation. In this study,
however, the synergetic effect is that precipitates produced by aging promote DRX.
(a)
(b)
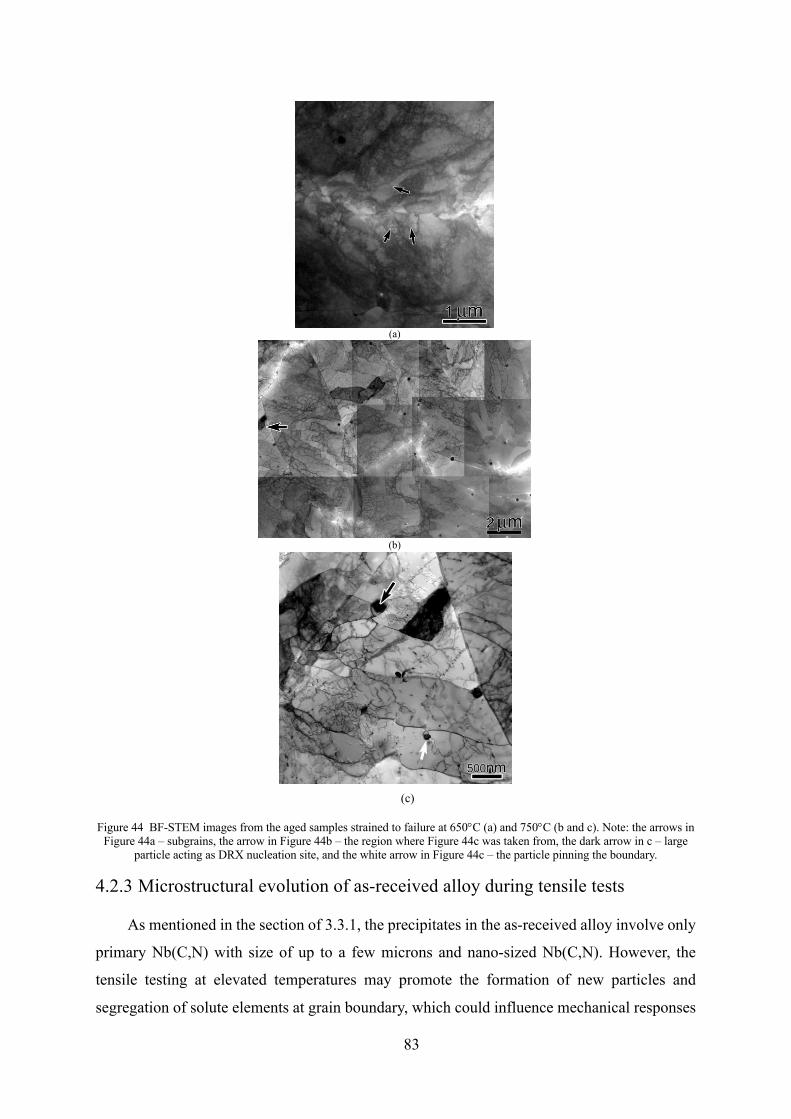
83
Figure 44 BF-STEM images from the aged samples strained to failure at 650°C (a) and 750°C (b and c). Note: the arrows in
Figure 44a – subgrains, the arrow in Figure 44b – the region where Figure 44c was taken from, the dark arrow in c – large particle acting as DRX nucleation site, and the white arrow in Figure 44c – the particle pinning the boundary.
4.2.3 Microstructural evolution of as-received alloy during tensile tests
As mentioned in the section of 3.3.1, the precipitates in the as-received alloy involve only
primary Nb(C,N) with size of up to a few microns and nano-sized Nb(C,N). However, the
tensile testing at elevated temperatures may promote the formation of new particles and
segregation of solute elements at grain boundary, which could influence mechanical responses
(c)
(a)
(b)
84
of the Alloy 709. This investigation could, thus, be beneficial to explain variation in mechanical
behaviours at different temperatures. TEM examination shows almost no change in Nb(C,N)
precipitates during tensile testing at elevated temperatures. At 550°C no evidence of the
formation of new precipitate is found but Cr enrichment at grain boundaries is observed in the
interrupted or failed samples (Figure 45). This may indicate that the mobility of Cr at 550°C is
already high enough to follow the dislocations with drag, thus DSA effect is observed until the
sample fails. At 650°C, in the interrupted sample no new precipitates are observed but Cr
segregation at grain boundaries occurred (Figure 45). However, the formation of new
precipitates at grain boundaries are found (Figure 45) in the failed sample. EDS analysis shows
that the grain boundary precipitates are Cr-rich carbide. The formation of such carbides will
lead to reduction in Cr content within the matrix and thus reducing the contraction of Cr atoms
to pin mobile dislocations. As a consequence, the DSA effect is suppressed. This may be the
reason that DSA phenomenon disappears after ~ 2.5% strain at 650°C (Figure 38). At 750°C,
even in the interrupted sample (only soaked for ~ 33 mins), a continuous distribution of
carbides has formed at grain boundary (Figure 46), which also results in Cr depletion at grain
boundaries and in the regions close to the carbides. EDS and selected area electron diffraction
(SAD) pattern confirm that they are M23Cr6 (Figure 46). The carbides grow into the matrix on
one side, usually having a cube-to-cube orientation relationship (Figure 46h). A previous study
shows that M23Cr6 precipitates preferentially at GBs in short time during service at 600-1000°C.
Sourmail observed the formation of M23Cr6 after very short aging times (e.g. 30 min) at 750°C
in a stabilized stainless steel. [ 8 ] The TTP curve of M23Cr6 in TP310 stainless steel exhibits a
C-shape with a nose temperature of ~ 750°C. [ 32 ] These findings are in accordance with our
observation of a continuous distribution of M23Cr6 on GBs in the interrupted tensile sample at
750°C.
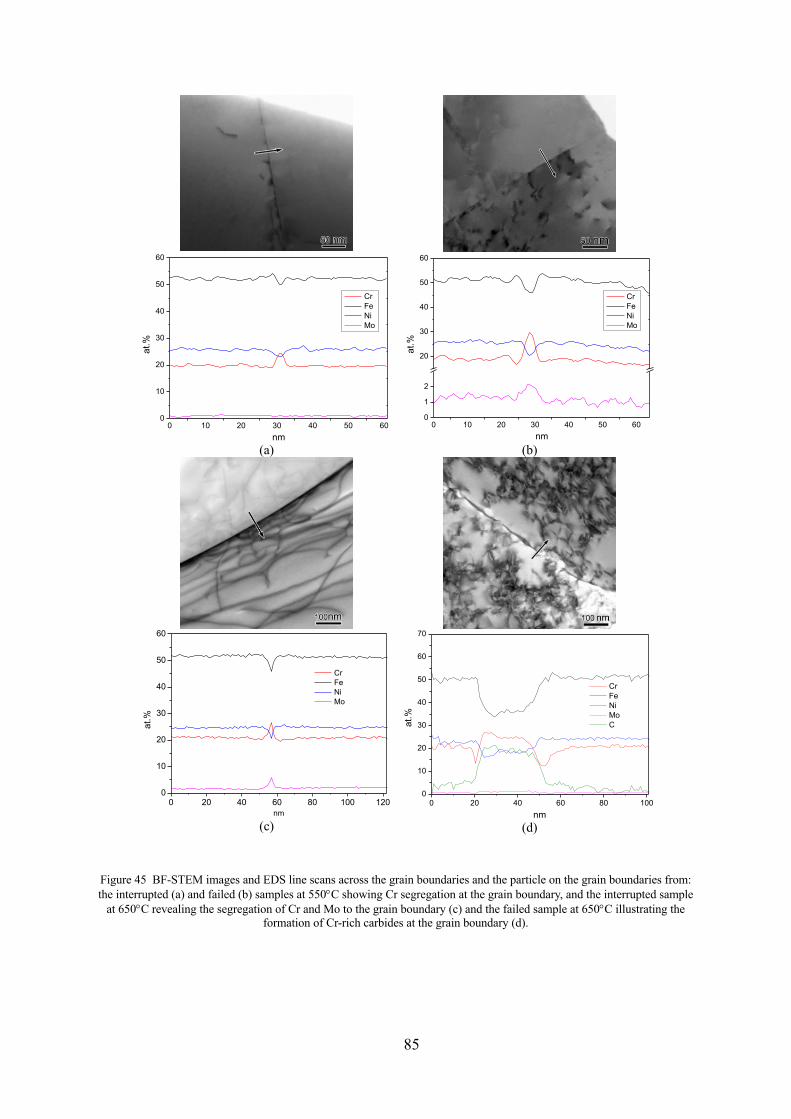
85
Figure 45 BF-STEM images and EDS line scans across the grain boundaries and the particle on the grain boundaries from: the interrupted (a) and failed (b) samples at 550°C showing Cr segregation at the grain boundary, and the interrupted sample
at 650°C revealing the segregation of Cr and Mo to the grain boundary (c) and the failed sample at 650°C illustrating the formation of Cr-rich carbides at the grain boundary (d).
(a)
(b)
(c)
(d)
0 10 20 30 40 50 600
10
20
30
40
50
60
at.%
nm
Cr Fe Ni Mo
0 10 20 30 40 50 600
1
2
20
30
40
50
60
at.%
nm
Cr Fe Ni Mo
0 20 40 60 80 100 1200
10
20
30
40
50
60
Cr Fe Ni Mo
at.%
nm0 20 40 60 80 100
0
10
20
30
40
50
60
70
Cr Fe Ni Mo C
at.%
nm
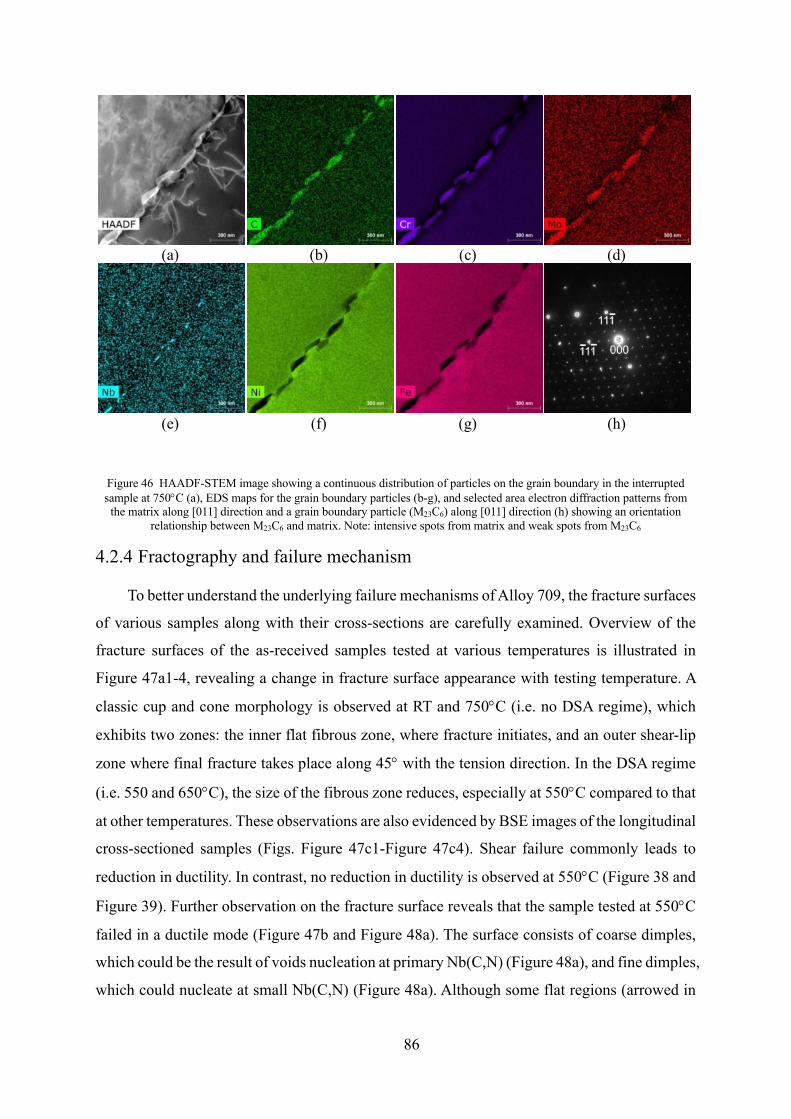
86
Figure 46 HAADF-STEM image showing a continuous distribution of particles on the grain boundary in the interrupted sample at 750°C (a), EDS maps for the grain boundary particles (b-g), and selected area electron diffraction patterns from
the matrix along [011] direction and a grain boundary particle (M23C6) along [011] direction (h) showing an orientation relationship between M23C6 and matrix. Note: intensive spots from matrix and weak spots from M23C6
4.2.4 Fractography and failure mechanism
To better understand the underlying failure mechanisms of Alloy 709, the fracture surfaces
of various samples along with their cross-sections are carefully examined. Overview of the
fracture surfaces of the as-received samples tested at various temperatures is illustrated in
Figure 47a1-4, revealing a change in fracture surface appearance with testing temperature. A
classic cup and cone morphology is observed at RT and 750°C (i.e. no DSA regime), which
exhibits two zones: the inner flat fibrous zone, where fracture initiates, and an outer shear-lip
zone where final fracture takes place along 45° with the tension direction. In the DSA regime
(i.e. 550 and 650°C), the size of the fibrous zone reduces, especially at 550°C compared to that
at other temperatures. These observations are also evidenced by BSE images of the longitudinal
cross-sectioned samples (Figs. Figure 47c1-Figure 47c4). Shear failure commonly leads to
reduction in ductility. In contrast, no reduction in ductility is observed at 550°C (Figure 38 and
Figure 39). Further observation on the fracture surface reveals that the sample tested at 550°C
failed in a ductile mode (Figure 47b and Figure 48a). The surface consists of coarse dimples,
which could be the result of voids nucleation at primary Nb(C,N) (Figure 48a), and fine dimples,
which could nucleate at small Nb(C,N) (Figure 48a). Although some flat regions (arrowed in
(a)
(b)
(c)
(d)
(e)
(f)
(g)
(h)
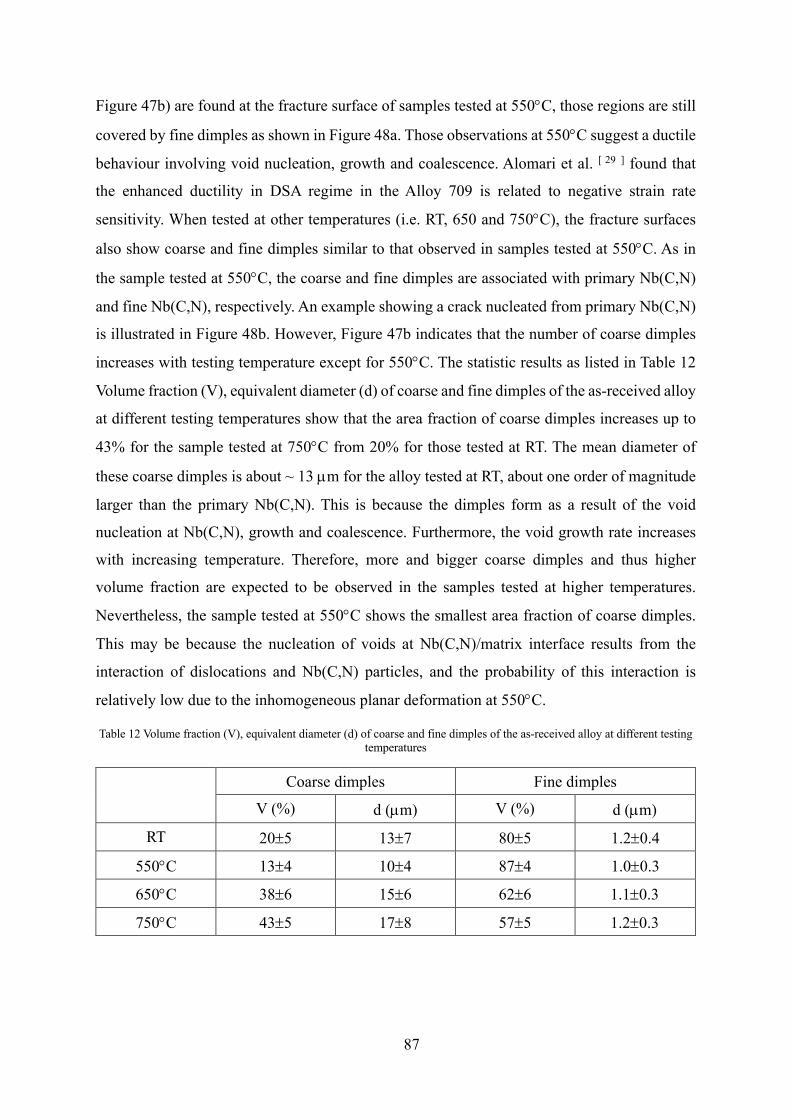
87
Figure 47b) are found at the fracture surface of samples tested at 550°C, those regions are still
covered by fine dimples as shown in Figure 48a. Those observations at 550°C suggest a ductile
behaviour involving void nucleation, growth and coalescence. Alomari et al. [ 29 ] found that
the enhanced ductility in DSA regime in the Alloy 709 is related to negative strain rate
sensitivity. When tested at other temperatures (i.e. RT, 650 and 750°C), the fracture surfaces
also show coarse and fine dimples similar to that observed in samples tested at 550°C. As in
the sample tested at 550°C, the coarse and fine dimples are associated with primary Nb(C,N)
and fine Nb(C,N), respectively. An example showing a crack nucleated from primary Nb(C,N)
is illustrated in Figure 48b. However, Figure 47b indicates that the number of coarse dimples
increases with testing temperature except for 550°C. The statistic results as listed in Table 12
Volume fraction (V), equivalent diameter (d) of coarse and fine dimples of the as-received alloy
at different testing temperatures show that the area fraction of coarse dimples increases up to
43% for the sample tested at 750°C from 20% for those tested at RT. The mean diameter of
these coarse dimples is about ~ 13 µm for the alloy tested at RT, about one order of magnitude
larger than the primary Nb(C,N). This is because the dimples form as a result of the void
nucleation at Nb(C,N), growth and coalescence. Furthermore, the void growth rate increases
with increasing temperature. Therefore, more and bigger coarse dimples and thus higher
volume fraction are expected to be observed in the samples tested at higher temperatures.
Nevertheless, the sample tested at 550°C shows the smallest area fraction of coarse dimples.
This may be because the nucleation of voids at Nb(C,N)/matrix interface results from the
interaction of dislocations and Nb(C,N) particles, and the probability of this interaction is
relatively low due to the inhomogeneous planar deformation at 550°C.
Table 12 Volume fraction (V), equivalent diameter (d) of coarse and fine dimples of the as-received alloy at different testing temperatures
Coarse dimples Fine dimples V (%) d (µm) V (%) d (µm)
RT 20±5 13±7 80±5 1.2±0.4
550°C 13±4 10±4 87±4 1.0±0.3
650°C 38±6 15±6 62±6 1.1±0.3
750°C 43±5 17±8 57±5 1.2±0.3
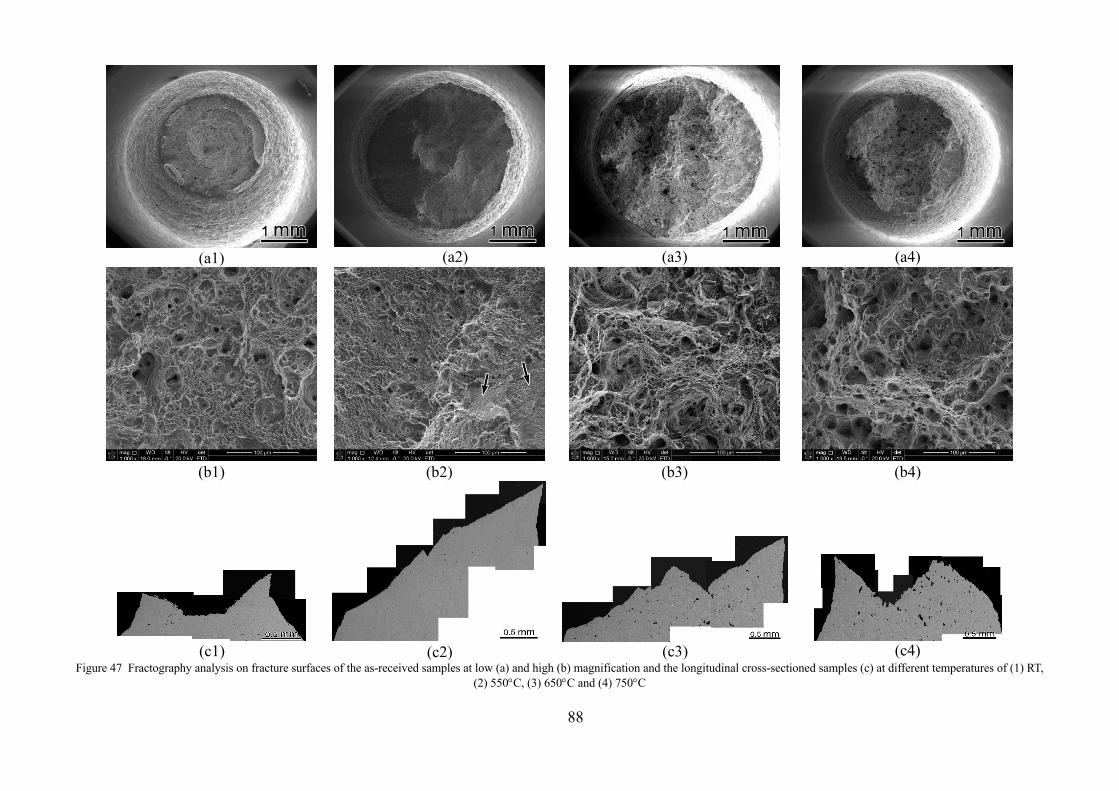
88
(a1)
(a2)
(a3)
(a4)
(b1)
(b2)
(b3)
(b4)
(c1)
(c2)
(c3)
(c4)
Figure 47 Fractography analysis on fracture surfaces of the as-received samples at low (a) and high (b) magnification and the longitudinal cross-sectioned samples (c) at different temperatures of (1) RT, (2) 550°C, (3) 650°C and (4) 750°C
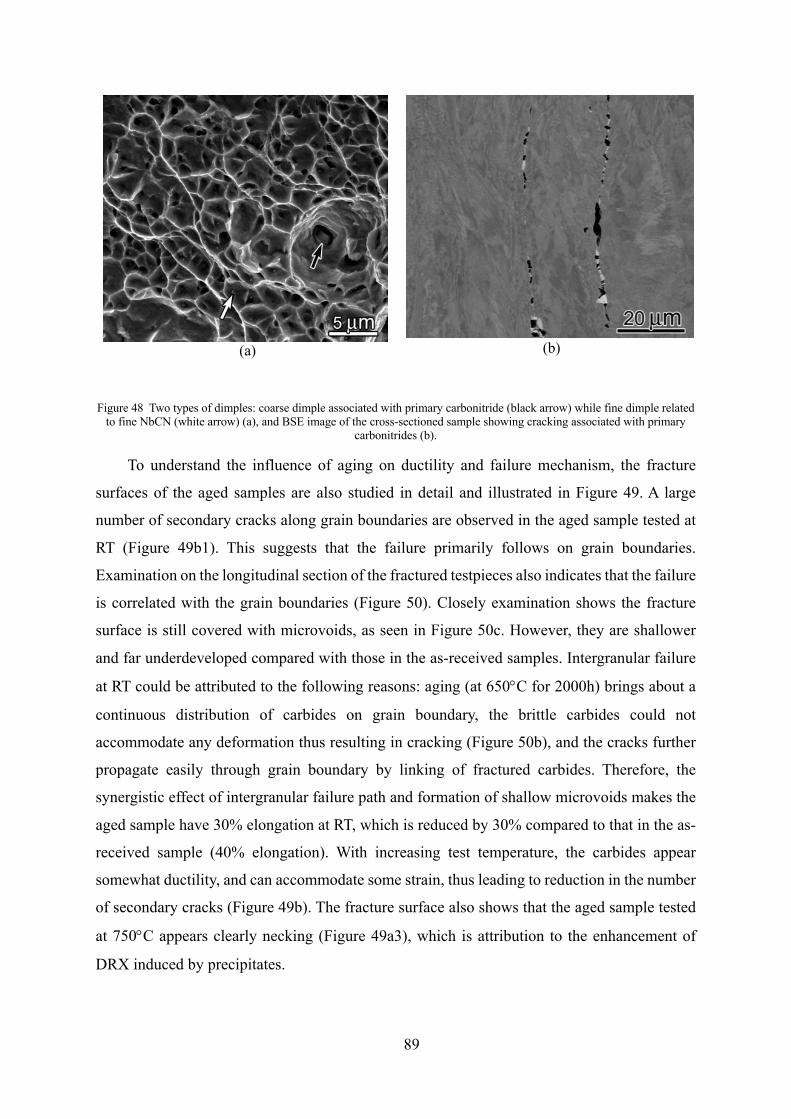
89
Figure 48 Two types of dimples: coarse dimple associated with primary carbonitride (black arrow) while fine dimple related
to fine NbCN (white arrow) (a), and BSE image of the cross-sectioned sample showing cracking associated with primary carbonitrides (b).
To understand the influence of aging on ductility and failure mechanism, the fracture
surfaces of the aged samples are also studied in detail and illustrated in Figure 49. A large
number of secondary cracks along grain boundaries are observed in the aged sample tested at
RT (Figure 49b1). This suggests that the failure primarily follows on grain boundaries.
Examination on the longitudinal section of the fractured testpieces also indicates that the failure
is correlated with the grain boundaries (Figure 50). Closely examination shows the fracture
surface is still covered with microvoids, as seen in Figure 50c. However, they are shallower
and far underdeveloped compared with those in the as-received samples. Intergranular failure
at RT could be attributed to the following reasons: aging (at 650°C for 2000h) brings about a
continuous distribution of carbides on grain boundary, the brittle carbides could not
accommodate any deformation thus resulting in cracking (Figure 50b), and the cracks further
propagate easily through grain boundary by linking of fractured carbides. Therefore, the
synergistic effect of intergranular failure path and formation of shallow microvoids makes the
aged sample have 30% elongation at RT, which is reduced by 30% compared to that in the as-
received sample (40% elongation). With increasing test temperature, the carbides appear
somewhat ductility, and can accommodate some strain, thus leading to reduction in the number
of secondary cracks (Figure 49b). The fracture surface also shows that the aged sample tested
at 750°C appears clearly necking (Figure 49a3), which is attribution to the enhancement of
DRX induced by precipitates.
(a)
(b)
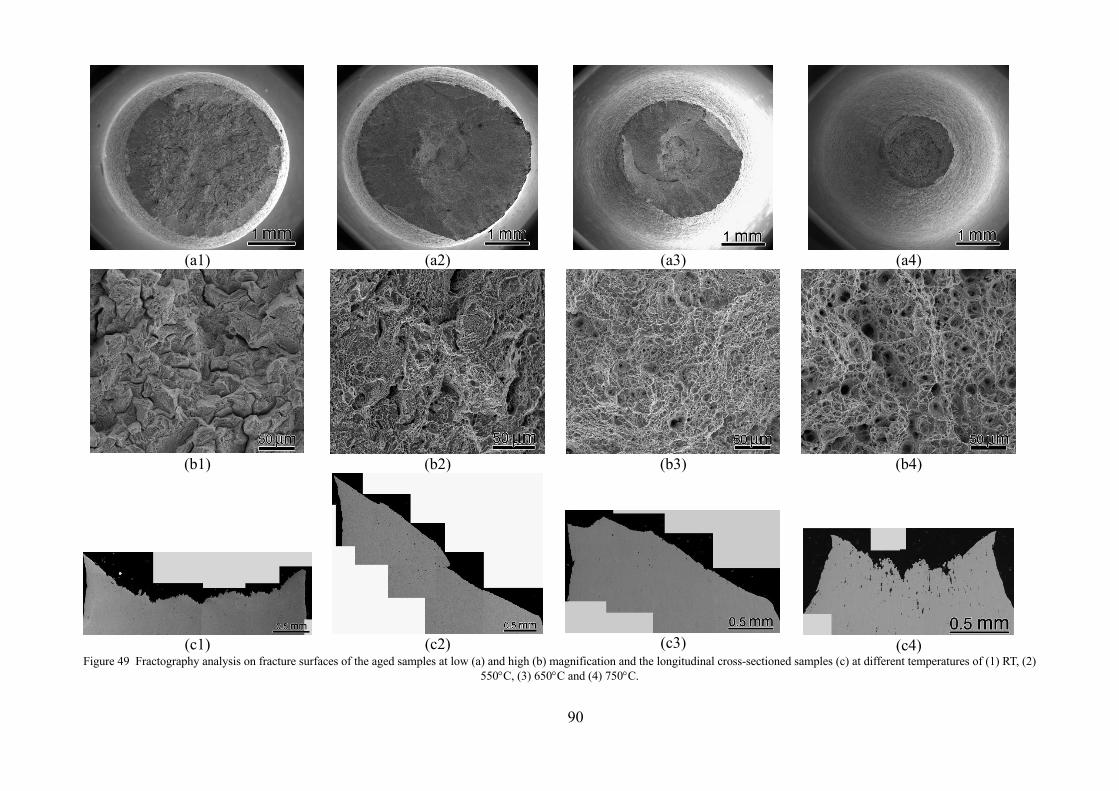
90
(a1)
(a2)
(a3)
(a4)
(b1)
(b2)
(b3)
(b4)
(c1)
(c2)
(c3)
(c4)
Figure 49 Fractography analysis on fracture surfaces of the aged samples at low (a) and high (b) magnification and the longitudinal cross-sectioned samples (c) at different temperatures of (1) RT, (2) 550°C, (3) 650°C and (4) 750°C.
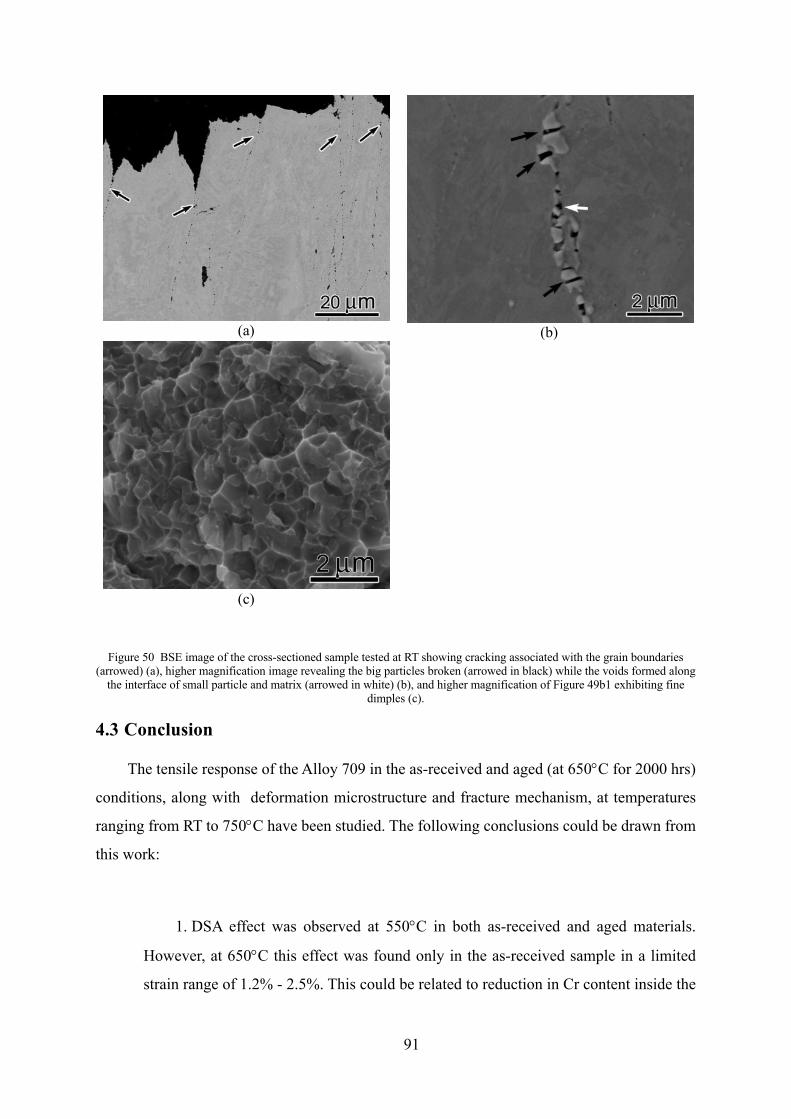
91
Figure 50 BSE image of the cross-sectioned sample tested at RT showing cracking associated with the grain boundaries
(arrowed) (a), higher magnification image revealing the big particles broken (arrowed in black) while the voids formed along the interface of small particle and matrix (arrowed in white) (b), and higher magnification of Figure 49b1 exhibiting fine
dimples (c).
4.3 Conclusion
The tensile response of the Alloy 709 in the as-received and aged (at 650°C for 2000 hrs)
conditions, along with deformation microstructure and fracture mechanism, at temperatures
ranging from RT to 750°C have been studied. The following conclusions could be drawn from
this work:
1. DSA effect was observed at 550°C in both as-received and aged materials.
However, at 650°C this effect was found only in the as-received sample in a limited
strain range of 1.2% - 2.5%. This could be related to reduction in Cr content inside the
(a)
(b)
(c)
92
grains due to the formation of Cr-rich carbide at GBs during testing for the as-received
material at 650°C.
2. For the as-received material, the yield strength reduces with increasing
temperature. At the temperature range of 550-750°C, however, no clear reduction in the
yield strength is found, which could be associated with the formation of M23C6 during
tension testing at 650 and 750°C. Higher strain-hardening rate was observed at 550°C
than that at RT, which is correlated with the DSA effect. At 750°C the elongation
increases clearly due to the dynamic recovery and recrystallization.
3. Aging increases the yield strength at all testing temperatures, which is
contributed to dispersoid strengthening induced by M23C6 and Z-phase. Reduction in
the ultimate tensile strength and ductility is due to the formation of brittle M23C6 at
grain boundaries.
93
5 In-Situ SEM study on creep behavior and deformation mechanisms of Alloy 709
(The results presented in this chapter will be submitted for publication in summer 2019:
Authors: Siddhartha Sarkar, Amrita Lall, Paul Bowen and Afsaneh Rabiei
Title: “A study on creep performance of Alloy 709 using In-Situ SEM observation”)
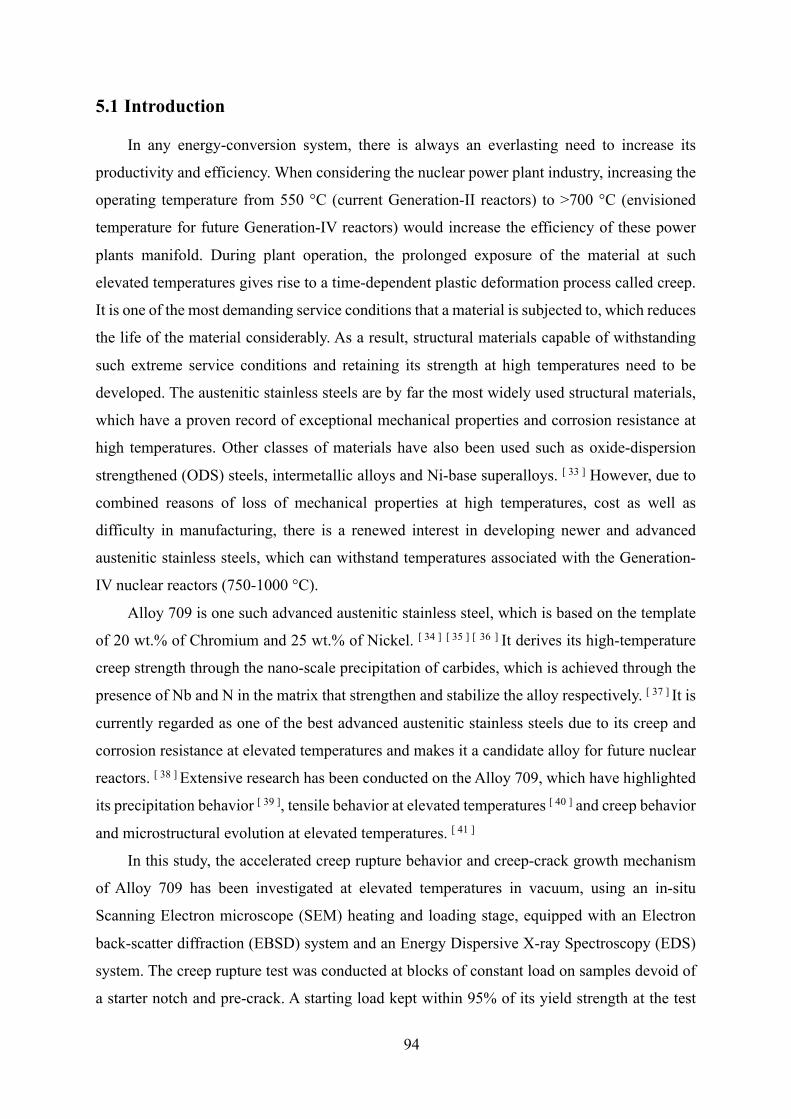
94
5.1 Introduction
In any energy-conversion system, there is always an everlasting need to increase its
productivity and efficiency. When considering the nuclear power plant industry, increasing the
operating temperature from 550 °C (current Generation-II reactors) to >700 °C (envisioned
temperature for future Generation-IV reactors) would increase the efficiency of these power
plants manifold. During plant operation, the prolonged exposure of the material at such
elevated temperatures gives rise to a time-dependent plastic deformation process called creep.
It is one of the most demanding service conditions that a material is subjected to, which reduces
the life of the material considerably. As a result, structural materials capable of withstanding
such extreme service conditions and retaining its strength at high temperatures need to be
developed. The austenitic stainless steels are by far the most widely used structural materials,
which have a proven record of exceptional mechanical properties and corrosion resistance at
high temperatures. Other classes of materials have also been used such as oxide-dispersion
strengthened (ODS) steels, intermetallic alloys and Ni-base superalloys. [ 33 ] However, due to
combined reasons of loss of mechanical properties at high temperatures, cost as well as
difficulty in manufacturing, there is a renewed interest in developing newer and advanced
austenitic stainless steels, which can withstand temperatures associated with the Generation-
IV nuclear reactors (750-1000 °C).
Alloy 709 is one such advanced austenitic stainless steel, which is based on the template
of 20 wt.% of Chromium and 25 wt.% of Nickel. [ 34 ] [ 35 ] [ 36 ] It derives its high-temperature
creep strength through the nano-scale precipitation of carbides, which is achieved through the
presence of Nb and N in the matrix that strengthen and stabilize the alloy respectively. [ 37 ] It is
currently regarded as one of the best advanced austenitic stainless steels due to its creep and
corrosion resistance at elevated temperatures and makes it a candidate alloy for future nuclear
reactors. [ 38 ] Extensive research has been conducted on the Alloy 709, which have highlighted
its precipitation behavior [ 39 ], tensile behavior at elevated temperatures [ 40 ] and creep behavior
and microstructural evolution at elevated temperatures. [ 41 ]
In this study, the accelerated creep rupture behavior and creep-crack growth mechanism
of Alloy 709 has been investigated at elevated temperatures in vacuum, using an in-situ
Scanning Electron microscope (SEM) heating and loading stage, equipped with an Electron
back-scatter diffraction (EBSD) system and an Energy Dispersive X-ray Spectroscopy (EDS)
system. The creep rupture test was conducted at blocks of constant load on samples devoid of
a starter notch and pre-crack. A starting load kept within 95% of its yield strength at the test
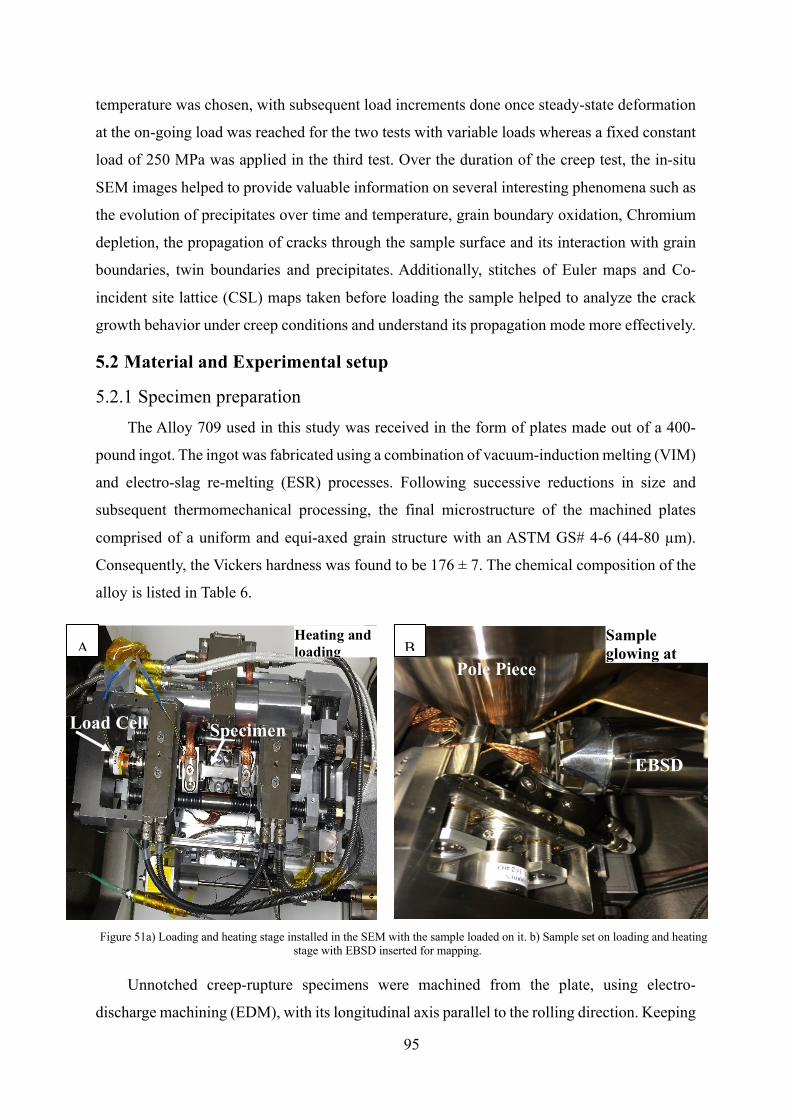
95
temperature was chosen, with subsequent load increments done once steady-state deformation
at the on-going load was reached for the two tests with variable loads whereas a fixed constant
load of 250 MPa was applied in the third test. Over the duration of the creep test, the in-situ
SEM images helped to provide valuable information on several interesting phenomena such as
the evolution of precipitates over time and temperature, grain boundary oxidation, Chromium
depletion, the propagation of cracks through the sample surface and its interaction with grain
boundaries, twin boundaries and precipitates. Additionally, stitches of Euler maps and Co-
incident site lattice (CSL) maps taken before loading the sample helped to analyze the crack
growth behavior under creep conditions and understand its propagation mode more effectively.
5.2 Material and Experimental setup
5.2.1 Specimen preparation The Alloy 709 used in this study was received in the form of plates made out of a 400-
pound ingot. The ingot was fabricated using a combination of vacuum-induction melting (VIM)
and electro-slag re-melting (ESR) processes. Following successive reductions in size and
subsequent thermomechanical processing, the final microstructure of the machined plates
comprised of a uniform and equi-axed grain structure with an ASTM GS# 4-6 (44-80 µm).
Consequently, the Vickers hardness was found to be 176 ± 7. The chemical composition of the
alloy is listed in Table 6.
Unnotched creep-rupture specimens were machined from the plate, using electro-
discharge machining (EDM), with its longitudinal axis parallel to the rolling direction. Keeping
Figure 51a) Loading and heating stage installed in the SEM with the sample loaded on it. b) Sample set on loading and heating stage with EBSD inserted for mapping.
Load Cell
Heating and loading Stage
Sample glowing at 750 °C Pole Piece
EBSD
Specimen
A B
96
in mind the constraints imposed by the in-situ heating and loading stage (by Kammrath and
Weiss GmbH), the specimen design followed the ASTM E466-15 standard with the reduced
gauge section dimensions of 2 mm wide by 1 mm thick. The total length of the sample with
reducing cross-section area was 15mm. The constantly reducing cross-section or hour glass
shape of the sample was utilized to ensure that the failure would occur at the center of specimen
and therefore the creep deformation and fracture features could be captured by the in-situ SEM
imaging. The in-situ SEM setup can be seen in Figure 51, while the specimen dimensions are
shown in Figure 52.
Figure 52 Dimensions in mm of the creep sample, in accordance with ASTM E466-15
To obtain useful EBSD maps and in-situ SEM images, it is imperative that the specimens
were prepared to a near-perfect surface finish. As such, they were ground and polished
progressively from 320 to 2400 grit size, using SiC sandpaper. Following this procedure, the
samples were ion-milled at 60 ° for 6 minutes and then at 80 ° for 10 minutes, which resulted
in acceptable grain contrast and no surface topography.
5.2.2 In-situ heating and loading stage
The heating-loading stage (by Kammrath & Weiss GmbH) is mounted inside the SEM
(Hitachi SU3500) chamber and has 2 main functions: to induce uni-axial loads and heat . The
first function of the stage is made possible by a load cell, which can uni-axially load the
specimen up to a maximum capacity of 10 kN. The specimen is loaded by the means of
leadscrews and the front and rear yokes move along it simultaneously, ensuring both sides of
the specimen are loaded equally and to observe the same area while loading. The elongation of
the sample is measured using an elongation gauge, which is mounted on one side of the stage.
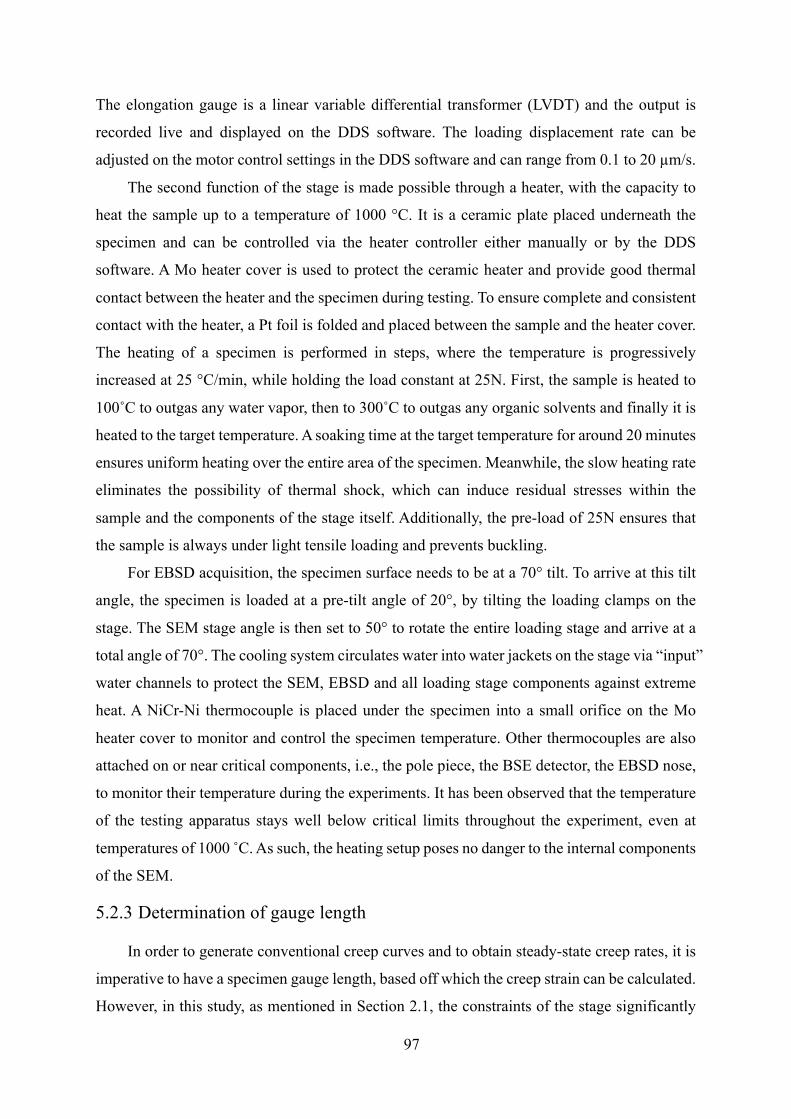
97
The elongation gauge is a linear variable differential transformer (LVDT) and the output is
recorded live and displayed on the DDS software. The loading displacement rate can be
adjusted on the motor control settings in the DDS software and can range from 0.1 to 20 µm/s.
The second function of the stage is made possible through a heater, with the capacity to
heat the sample up to a temperature of 1000 °C. It is a ceramic plate placed underneath the
specimen and can be controlled via the heater controller either manually or by the DDS
software. A Mo heater cover is used to protect the ceramic heater and provide good thermal
contact between the heater and the specimen during testing. To ensure complete and consistent
contact with the heater, a Pt foil is folded and placed between the sample and the heater cover.
The heating of a specimen is performed in steps, where the temperature is progressively
increased at 25 °C/min, while holding the load constant at 25N. First, the sample is heated to
100˚C to outgas any water vapor, then to 300˚C to outgas any organic solvents and finally it is
heated to the target temperature. A soaking time at the target temperature for around 20 minutes
ensures uniform heating over the entire area of the specimen. Meanwhile, the slow heating rate
eliminates the possibility of thermal shock, which can induce residual stresses within the
sample and the components of the stage itself. Additionally, the pre-load of 25N ensures that
the sample is always under light tensile loading and prevents buckling.
For EBSD acquisition, the specimen surface needs to be at a 70° tilt. To arrive at this tilt
angle, the specimen is loaded at a pre-tilt angle of 20°, by tilting the loading clamps on the
stage. The SEM stage angle is then set to 50° to rotate the entire loading stage and arrive at a
total angle of 70°. The cooling system circulates water into water jackets on the stage via “input”
water channels to protect the SEM, EBSD and all loading stage components against extreme
heat. A NiCr-Ni thermocouple is placed under the specimen into a small orifice on the Mo
heater cover to monitor and control the specimen temperature. Other thermocouples are also
attached on or near critical components, i.e., the pole piece, the BSE detector, the EBSD nose,
to monitor their temperature during the experiments. It has been observed that the temperature
of the testing apparatus stays well below critical limits throughout the experiment, even at
temperatures of 1000 C. As such, the heating setup poses no danger to the internal components
of the SEM.
5.2.3 Determination of gauge length
In order to generate conventional creep curves and to obtain steady-state creep rates, it is
imperative to have a specimen gauge length, based off which the creep strain can be calculated.
However, in this study, as mentioned in Section 2.1, the constraints of the stage significantly
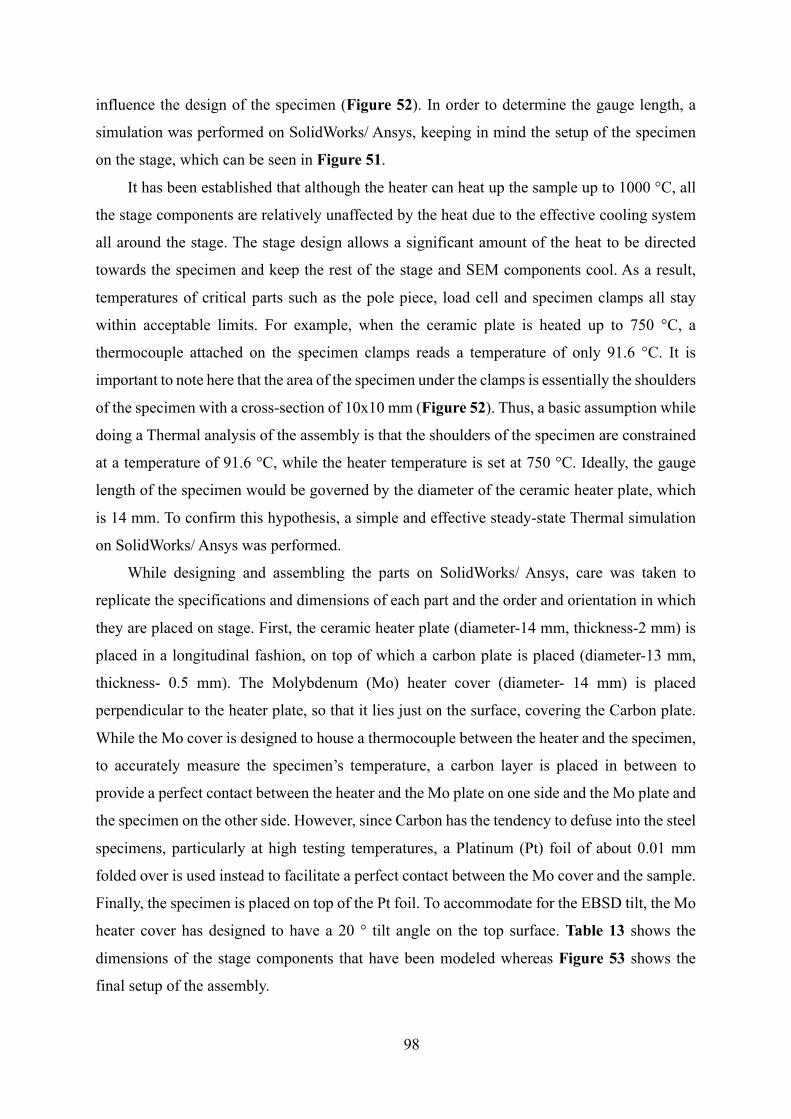
98
influence the design of the specimen (Figure 52). In order to determine the gauge length, a
simulation was performed on SolidWorks/ Ansys, keeping in mind the setup of the specimen
on the stage, which can be seen in Figure 51.
It has been established that although the heater can heat up the sample up to 1000 °C, all
the stage components are relatively unaffected by the heat due to the effective cooling system
all around the stage. The stage design allows a significant amount of the heat to be directed
towards the specimen and keep the rest of the stage and SEM components cool. As a result,
temperatures of critical parts such as the pole piece, load cell and specimen clamps all stay
within acceptable limits. For example, when the ceramic plate is heated up to 750 °C, a
thermocouple attached on the specimen clamps reads a temperature of only 91.6 °C. It is
important to note here that the area of the specimen under the clamps is essentially the shoulders
of the specimen with a cross-section of 10x10 mm (Figure 52). Thus, a basic assumption while
doing a Thermal analysis of the assembly is that the shoulders of the specimen are constrained
at a temperature of 91.6 °C, while the heater temperature is set at 750 °C. Ideally, the gauge
length of the specimen would be governed by the diameter of the ceramic heater plate, which
is 14 mm. To confirm this hypothesis, a simple and effective steady-state Thermal simulation
on SolidWorks/ Ansys was performed.
While designing and assembling the parts on SolidWorks/ Ansys, care was taken to
replicate the specifications and dimensions of each part and the order and orientation in which
they are placed on stage. First, the ceramic heater plate (diameter-14 mm, thickness-2 mm) is
placed in a longitudinal fashion, on top of which a carbon plate is placed (diameter-13 mm,
thickness- 0.5 mm). The Molybdenum (Mo) heater cover (diameter- 14 mm) is placed
perpendicular to the heater plate, so that it lies just on the surface, covering the Carbon plate.
While the Mo cover is designed to house a thermocouple between the heater and the specimen,
to accurately measure the specimen’s temperature, a carbon layer is placed in between to
provide a perfect contact between the heater and the Mo plate on one side and the Mo plate and
the specimen on the other side. However, since Carbon has the tendency to defuse into the steel
specimens, particularly at high testing temperatures, a Platinum (Pt) foil of about 0.01 mm
folded over is used instead to facilitate a perfect contact between the Mo cover and the sample.
Finally, the specimen is placed on top of the Pt foil. To accommodate for the EBSD tilt, the Mo
heater cover has designed to have a 20 ° tilt angle on the top surface. Table 13 shows the
dimensions of the stage components that have been modeled whereas Figure 53 shows the
final setup of the assembly.
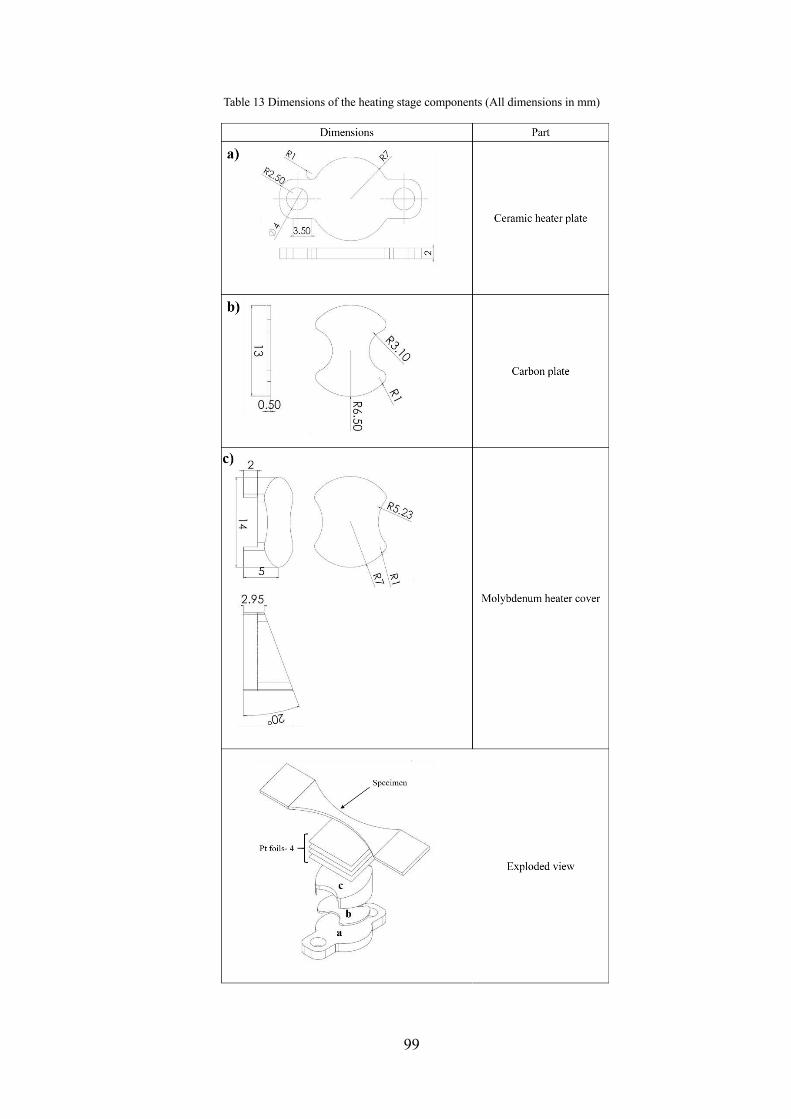
99
Table 13 Dimensions of the heating stage components (All dimensions in mm)
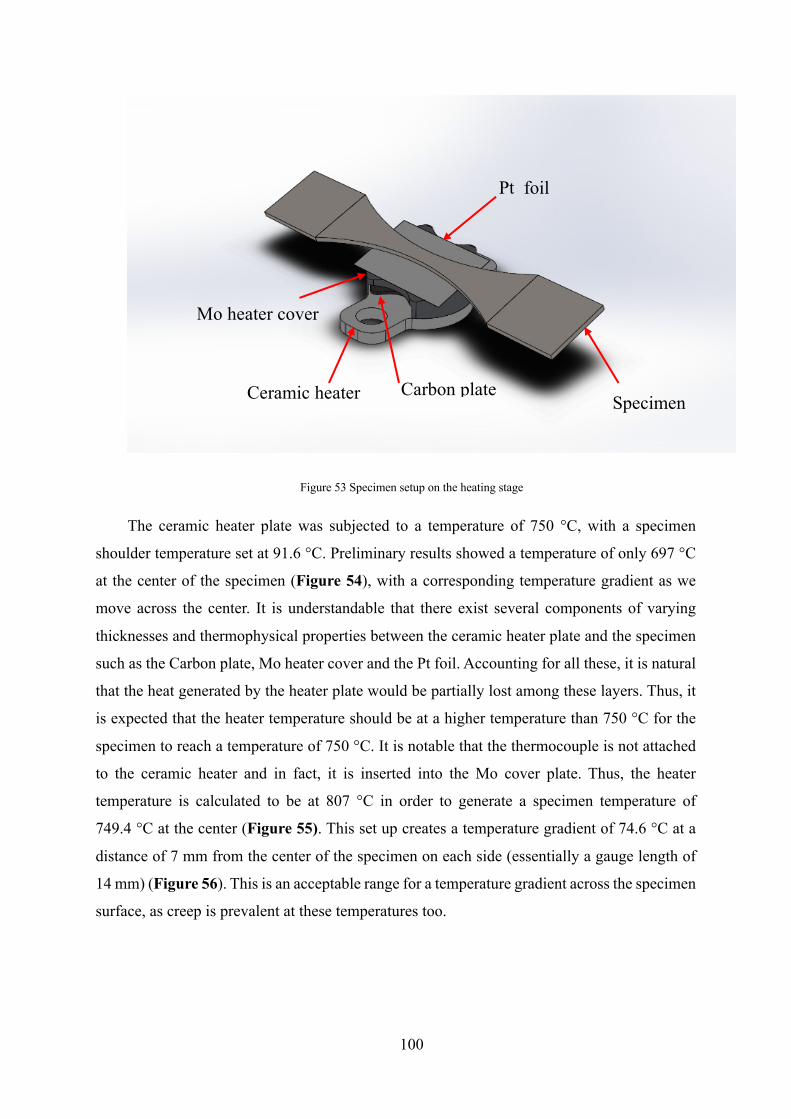
100
Figure 53 Specimen setup on the heating stage
The ceramic heater plate was subjected to a temperature of 750 °C, with a specimen
shoulder temperature set at 91.6 °C. Preliminary results showed a temperature of only 697 °C
at the center of the specimen (Figure 54), with a corresponding temperature gradient as we
move across the center. It is understandable that there exist several components of varying
thicknesses and thermophysical properties between the ceramic heater plate and the specimen
such as the Carbon plate, Mo heater cover and the Pt foil. Accounting for all these, it is natural
that the heat generated by the heater plate would be partially lost among these layers. Thus, it
is expected that the heater temperature should be at a higher temperature than 750 °C for the
specimen to reach a temperature of 750 °C. It is notable that the thermocouple is not attached
to the ceramic heater and in fact, it is inserted into the Mo cover plate. Thus, the heater
temperature is calculated to be at 807 °C in order to generate a specimen temperature of
749.4 °C at the center (Figure 55). This set up creates a temperature gradient of 74.6 °C at a
distance of 7 mm from the center of the specimen on each side (essentially a gauge length of
14 mm) (Figure 56). This is an acceptable range for a temperature gradient across the specimen
surface, as creep is prevalent at these temperatures too.
Pt foil
Mo heater cover
Carbon plate Specimen Ceramic heater
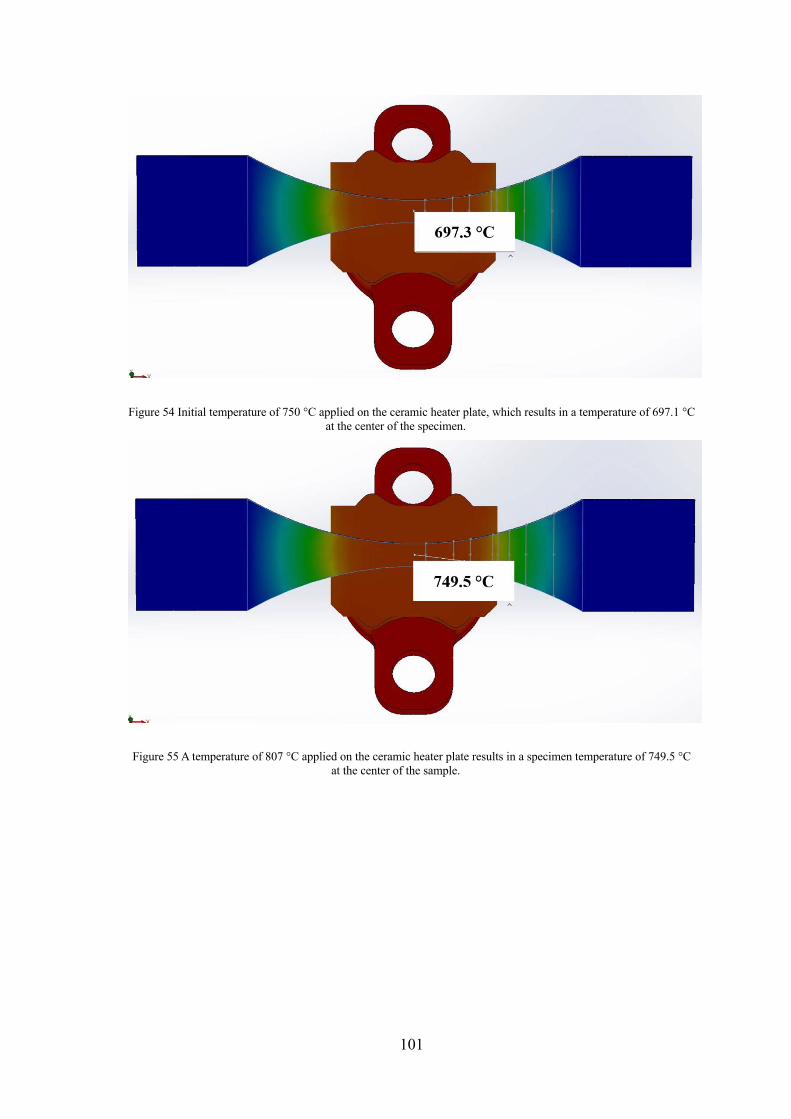
101
Figure 54 Initial temperature of 750 °C applied on the ceramic heater plate, which results in a temperature of 697.1 °C at the center of the specimen.
Figure 55 A temperature of 807 °C applied on the ceramic heater plate results in a specimen temperature of 749.5 °C at the center of the sample.
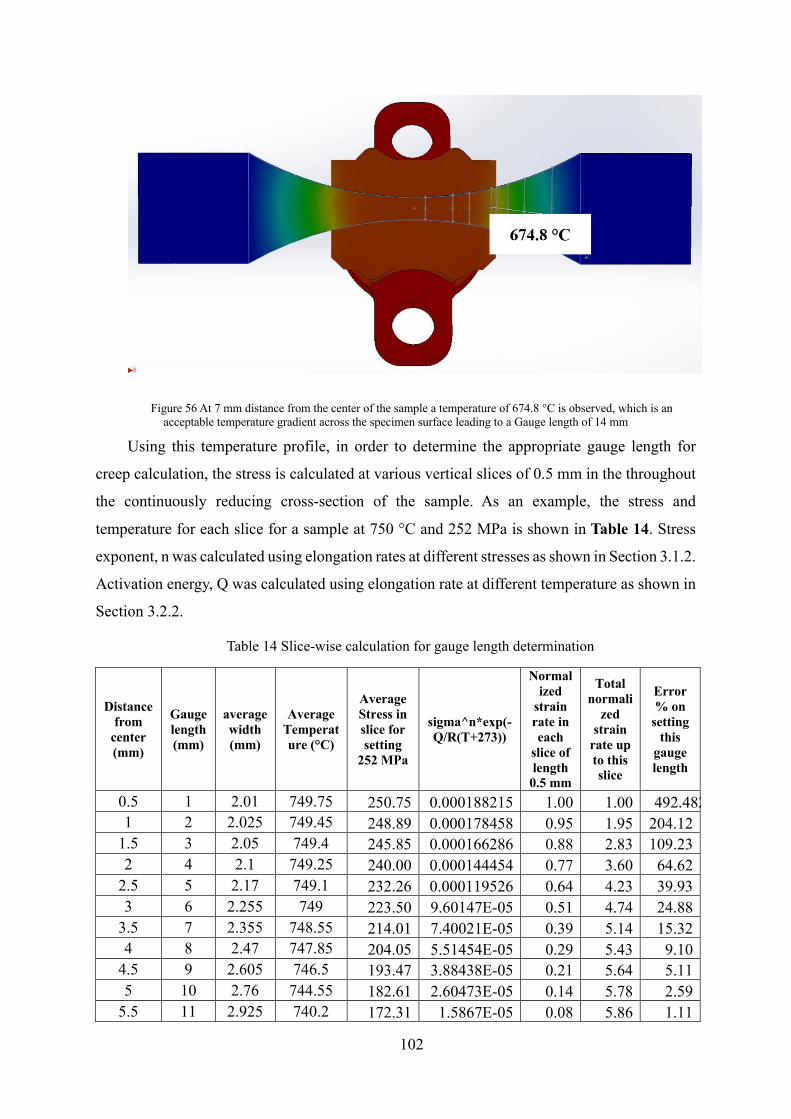
102
Figure 56 At 7 mm distance from the center of the sample a temperature of 674.8 °C is observed, which is an acceptable temperature gradient across the specimen surface leading to a Gauge length of 14 mm
Using this temperature profile, in order to determine the appropriate gauge length for
creep calculation, the stress is calculated at various vertical slices of 0.5 mm in the throughout
the continuously reducing cross-section of the sample. As an example, the stress and
temperature for each slice for a sample at 750 °C and 252 MPa is shown in Table 14. Stress
exponent, n was calculated using elongation rates at different stresses as shown in Section 3.1.2.
Activation energy, Q was calculated using elongation rate at different temperature as shown in
Section 3.2.2.
Table 14 Slice-wise calculation for gauge length determination
Distance from
center (mm)
Gauge length (mm)
average width (mm)
Average Temperature (°C)
Average Stress in slice for setting
252 MPa
sigma^n*exp(-Q/R(T+273))
Normalized
strain rate in each
slice of length 0.5 mm
Total normali
zed strain
rate up to this slice
Error % on
setting this
gauge length
0.5 1 2.01 749.75 250.75 0.000188215 1.00 1.00 492.482.48 1 2 2.025 749.45 248.89 0.000178458 0.95 1.95 204.12
1.5 3 2.05 749.4 245.85 0.000166286 0.88 2.83 109.23 2 4 2.1 749.25 240.00 0.000144454 0.77 3.60 64.62
2.5 5 2.17 749.1 232.26 0.000119526 0.64 4.23 39.93 3 6 2.255 749 223.50 9.60147E-05 0.51 4.74 24.88
3.5 7 2.355 748.55 214.01 7.40021E-05 0.39 5.14 15.32 4 8 2.47 747.85 204.05 5.51454E-05 0.29 5.43 9.10
4.5 9 2.605 746.5 193.47 3.88438E-05 0.21 5.64 5.11 5 10 2.76 744.55 182.61 2.60473E-05 0.14 5.78 2.59
5.5 11 2.925 740.2 172.31 1.5867E-05 0.08 5.86 1.11
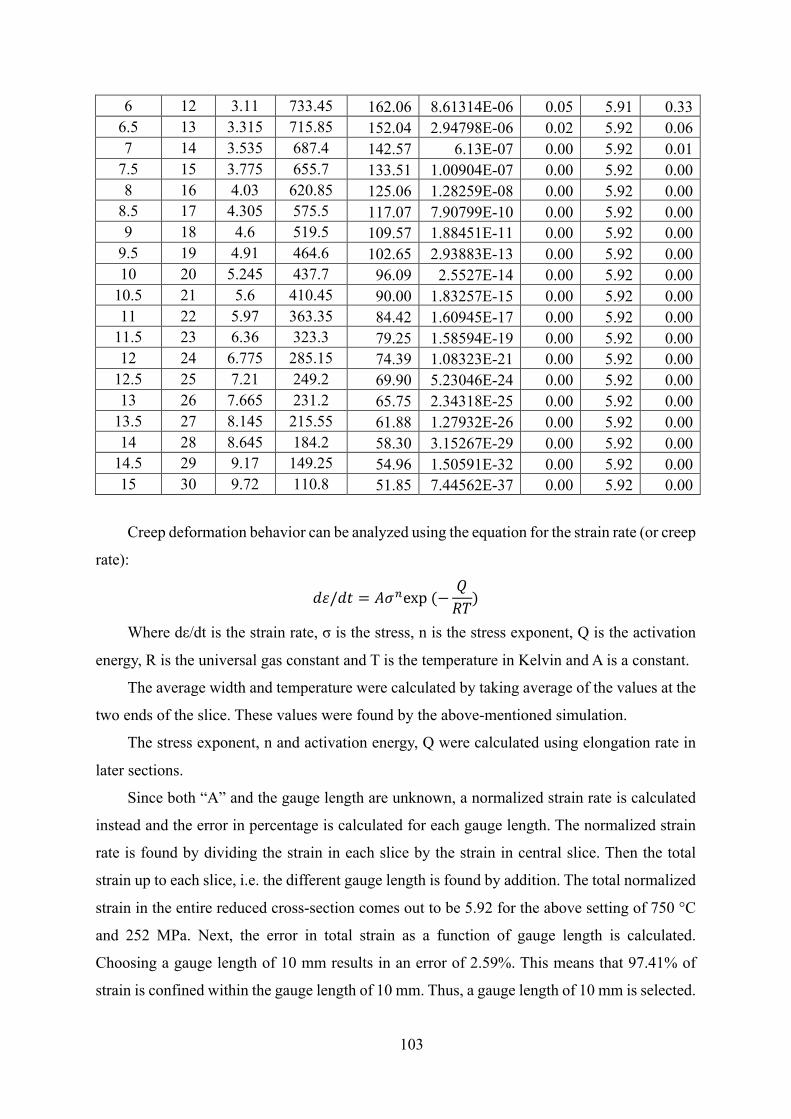
103
6 12 3.11 733.45 162.06 8.61314E-06 0.05 5.91 0.33 6.5 13 3.315 715.85 152.04 2.94798E-06 0.02 5.92 0.06 7 14 3.535 687.4 142.57 6.13E-07 0.00 5.92 0.01
7.5 15 3.775 655.7 133.51 1.00904E-07 0.00 5.92 0.00 8 16 4.03 620.85 125.06 1.28259E-08 0.00 5.92 0.00
8.5 17 4.305 575.5 117.07 7.90799E-10 0.00 5.92 0.00 9 18 4.6 519.5 109.57 1.88451E-11 0.00 5.92 0.00
9.5 19 4.91 464.6 102.65 2.93883E-13 0.00 5.92 0.00 10 20 5.245 437.7 96.09 2.5527E-14 0.00 5.92 0.00
10.5 21 5.6 410.45 90.00 1.83257E-15 0.00 5.92 0.00 11 22 5.97 363.35 84.42 1.60945E-17 0.00 5.92 0.00
11.5 23 6.36 323.3 79.25 1.58594E-19 0.00 5.92 0.00 12 24 6.775 285.15 74.39 1.08323E-21 0.00 5.92 0.00
12.5 25 7.21 249.2 69.90 5.23046E-24 0.00 5.92 0.00 13 26 7.665 231.2 65.75 2.34318E-25 0.00 5.92 0.00
13.5 27 8.145 215.55 61.88 1.27932E-26 0.00 5.92 0.00 14 28 8.645 184.2 58.30 3.15267E-29 0.00 5.92 0.00
14.5 29 9.17 149.25 54.96 1.50591E-32 0.00 5.92 0.00 15 30 9.72 110.8 51.85 7.44562E-37 0.00 5.92 0.00
Creep deformation behavior can be analyzed using the equation for the strain rate (or creep
rate):
!"/!$ = &'(exp(−/01)
Where dε/dt is the strain rate, σ is the stress, n is the stress exponent, Q is the activation
energy, R is the universal gas constant and T is the temperature in Kelvin and A is a constant.
The average width and temperature were calculated by taking average of the values at the
two ends of the slice. These values were found by the above-mentioned simulation.
The stress exponent, n and activation energy, Q were calculated using elongation rate in
later sections.
Since both “A” and the gauge length are unknown, a normalized strain rate is calculated
instead and the error in percentage is calculated for each gauge length. The normalized strain
rate is found by dividing the strain in each slice by the strain in central slice. Then the total
strain up to each slice, i.e. the different gauge length is found by addition. The total normalized
strain in the entire reduced cross-section comes out to be 5.92 for the above setting of 750 °C
and 252 MPa. Next, the error in total strain as a function of gauge length is calculated.
Choosing a gauge length of 10 mm results in an error of 2.59%. This means that 97.41% of
strain is confined within the gauge length of 10 mm. Thus, a gauge length of 10 mm is selected.
104
5.2.4 Test methods
Accelerated creep tests, by means of testing at higher temperatures and greater stresses
than the expected service conditions, is necessary to generate a significant amount of data in a
reasonable amount of time. [ 38 ] The subsequent test results are then extrapolated to the expected
service conditions. In this study, constant load uni-axial creep-rupture tests were conducted in
vacuum at test temperatures of 750 and 850 °C in an in-situ SEM setup (see Table 14).
For each test, a starting load of 95% of the yield strength at each test temperature was
chosen to facilitate accelerated rupture of the specimens. The yield strength of the specimens
was obtained from prior experiments, using in-situ SEM tensile tests performed at various
temperatures on similar samples and testing set up. [ 40 ] At a test temperature of 750 °C, the
yield strength was deduced to be 174 MPa. The tests were conducted at blocks of constant load,
where the load was increased as soon as steady-state deformation at the on-going load was
achieved. This type of expedited testing method helps obtain multiple data points from the
same test.
To eliminate the problem of surface oxidation, which may result due to each test taking at
least a month to finish, the in-situ SEM chamber was purged with 99.999% pure N2 gas. The
chamber is purged with N2 at a pressure of 650 Pa for a duration of 2-2.5 hours and was
performed whenever a new specimen was loaded, or the SEM chamber had to be opened for
service or tungsten filament replacement. The purging procedure was followed by evacuating
the chamber to Vacuum state for a duration of 0.5 h, before the heating and loading started.
Moreover, as the test was conducted in-situ and each test required multiple days or weeks to
be completed, the loading and heating had to be stopped at the end of each day and resumed
the next day.
5.2.5 In-situ SEM imaging
The in-situ SEM imaging technique used in this study is a unique approach that helps to
understand the deformation behavior of the material at elevated temperatures and delineate the
various crack growth mechanisms that take place during deformation. Prior to heating and
loading, once the specimen is loaded onto the stage, the smallest cross-sectional area is
determined by measuring the sample width within the SEM. This measurement is necessary
for un-notched or un-pre-cracked samples subjected to creep, as there is no defined location
through which failure can occur and thus it is expected that the main crack shall propagate
through the smallest cross-sectional area of the specimen. Once the cross-sectional area is
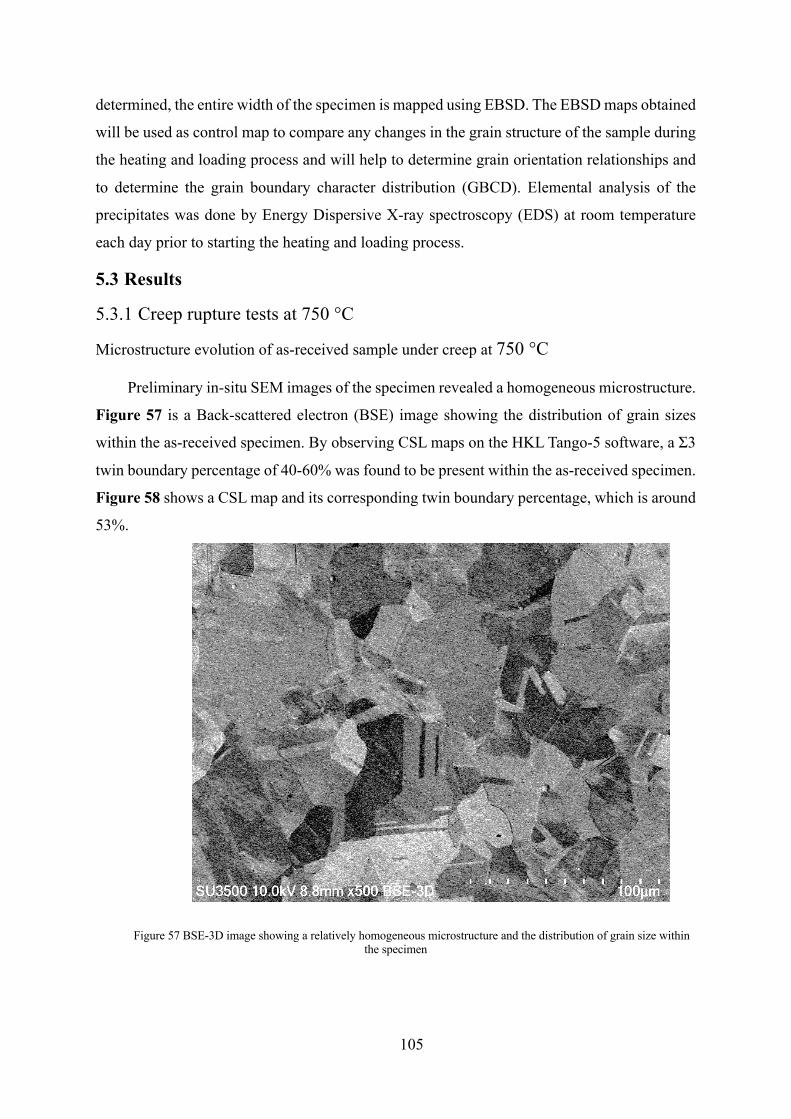
105
determined, the entire width of the specimen is mapped using EBSD. The EBSD maps obtained
will be used as control map to compare any changes in the grain structure of the sample during
the heating and loading process and will help to determine grain orientation relationships and
to determine the grain boundary character distribution (GBCD). Elemental analysis of the
precipitates was done by Energy Dispersive X-ray spectroscopy (EDS) at room temperature
each day prior to starting the heating and loading process.
5.3 Results
5.3.1 Creep rupture tests at 750 °C
Microstructure evolution of as-received sample under creep at 750 °C
Preliminary in-situ SEM images of the specimen revealed a homogeneous microstructure.
Figure 57 is a Back-scattered electron (BSE) image showing the distribution of grain sizes
within the as-received specimen. By observing CSL maps on the HKL Tango-5 software, a Σ3
twin boundary percentage of 40-60% was found to be present within the as-received specimen.
Figure 58 shows a CSL map and its corresponding twin boundary percentage, which is around
53%.
Figure 57 BSE-3D image showing a relatively homogeneous microstructure and the distribution of grain size within the specimen
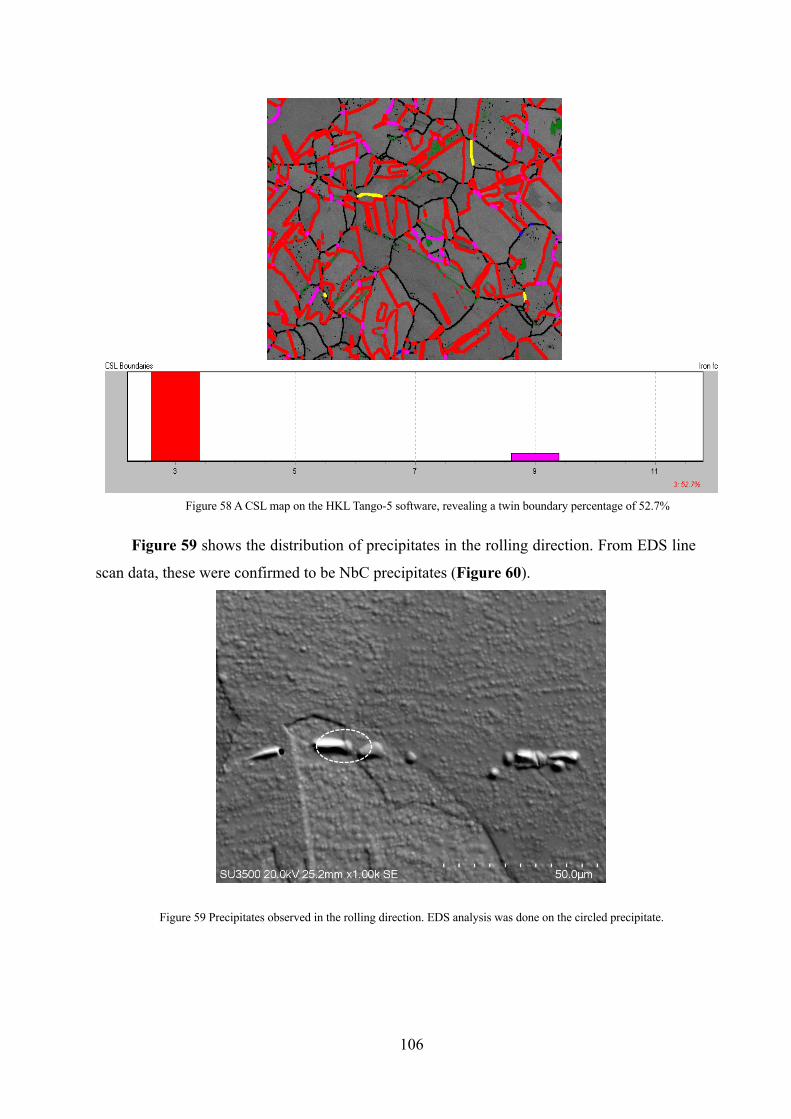
106
Figure 59 shows the distribution of precipitates in the rolling direction. From EDS line
scan data, these were confirmed to be NbC precipitates (Figure 60).
Figure 59 Precipitates observed in the rolling direction. EDS analysis was done on the circled precipitate.
Figure 58 A CSL map on the HKL Tango-5 software, revealing a twin boundary percentage of 52.7%
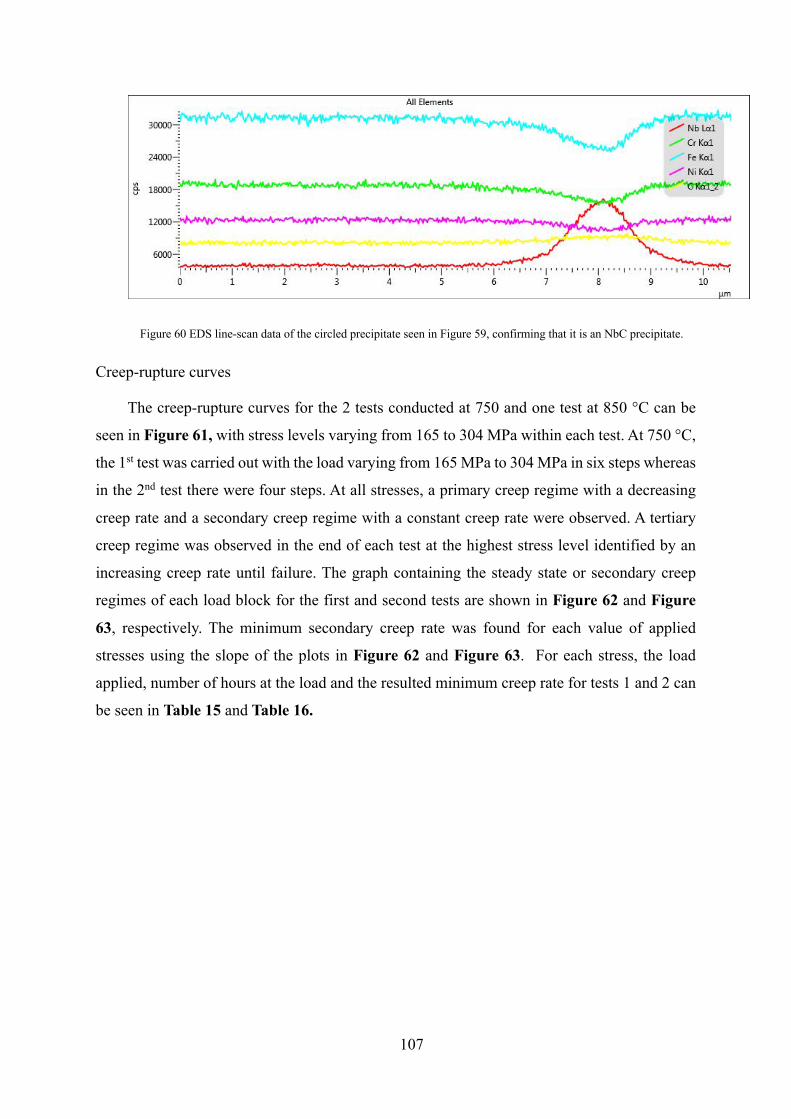
107
Figure 60 EDS line-scan data of the circled precipitate seen in Figure 59, confirming that it is an NbC precipitate.
Creep-rupture curves
The creep-rupture curves for the 2 tests conducted at 750 and one test at 850 °C can be
seen in Figure 61, with stress levels varying from 165 to 304 MPa within each test. At 750 °C,
the 1st test was carried out with the load varying from 165 MPa to 304 MPa in six steps whereas
in the 2nd test there were four steps. At all stresses, a primary creep regime with a decreasing
creep rate and a secondary creep regime with a constant creep rate were observed. A tertiary
creep regime was observed in the end of each test at the highest stress level identified by an
increasing creep rate until failure. The graph containing the steady state or secondary creep
regimes of each load block for the first and second tests are shown in Figure 62 and Figure
63, respectively. The minimum secondary creep rate was found for each value of applied
stresses using the slope of the plots in Figure 62 and Figure 63. For each stress, the load
applied, number of hours at the load and the resulted minimum creep rate for tests 1 and 2 can
be seen in Table 15 and Table 16.
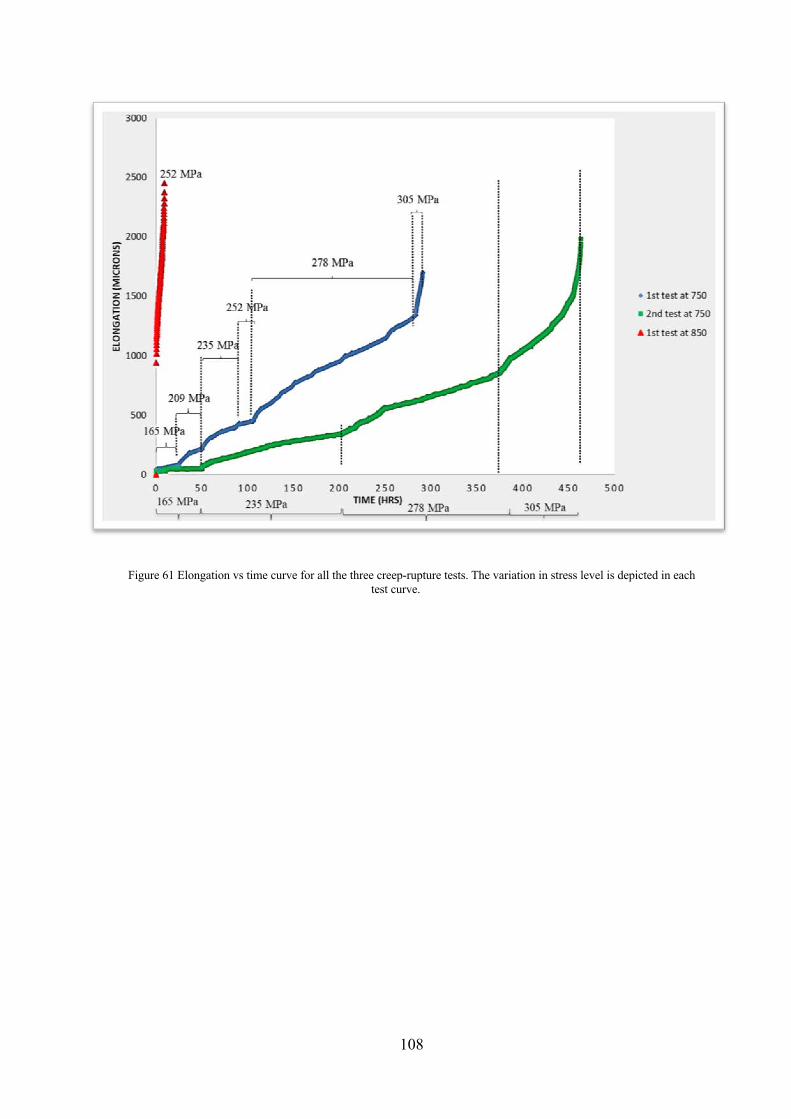
108
Figure 61 Elongation vs time curve for all the three creep-rupture tests. The variation in stress level is depicted in each test curve.
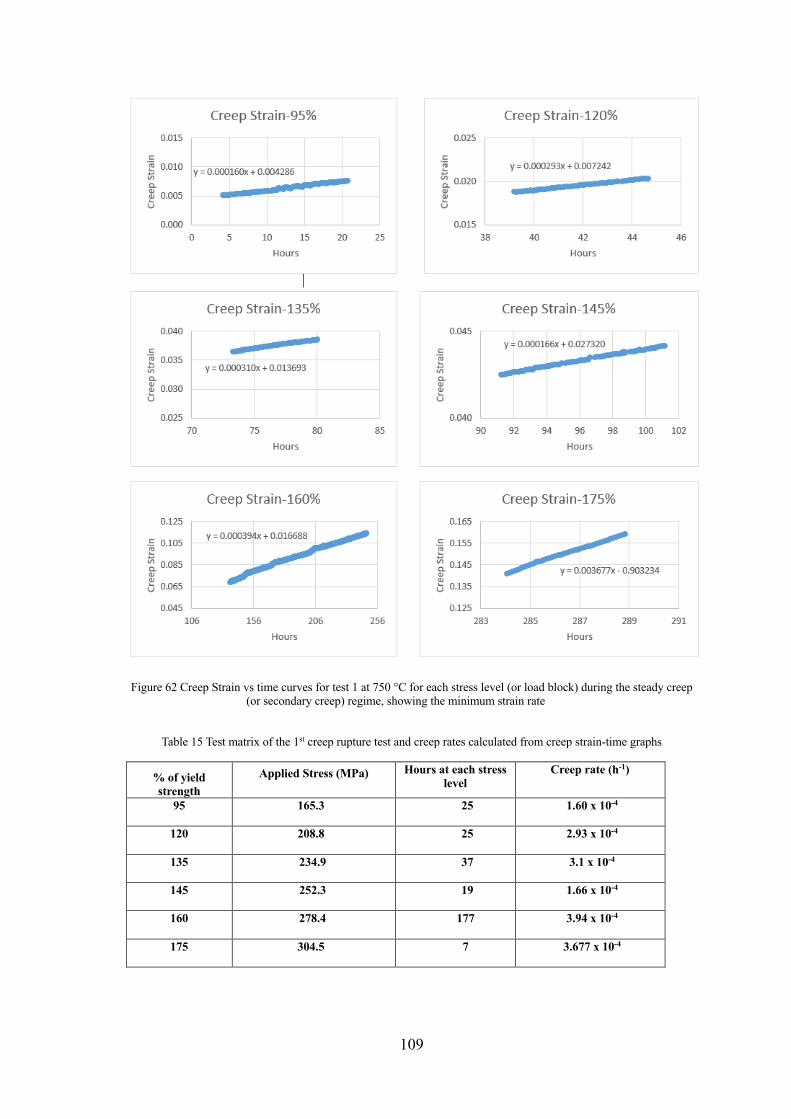
109
Figure 62 Creep Strain vs time curves for test 1 at 750 °C for each stress level (or load block) during the steady creep (or secondary creep) regime, showing the minimum strain rate
Table 15 Test matrix of the 1st creep rupture test and creep rates calculated from creep strain-time graphs
% of yield strength
Applied Stress (MPa) Hours at each stress level
Creep rate (h-1)
95 165.3 25 1.60 x 10⁻⁴
120 208.8 25 2.93 x 10⁻⁴
135 234.9 37 3.1 x 10⁻⁴
145 252.3 19 1.66 x 10⁻⁴
160 278.4 177 3.94 x 10⁻⁴
175 304.5 7 3.677 x 10⁻⁴
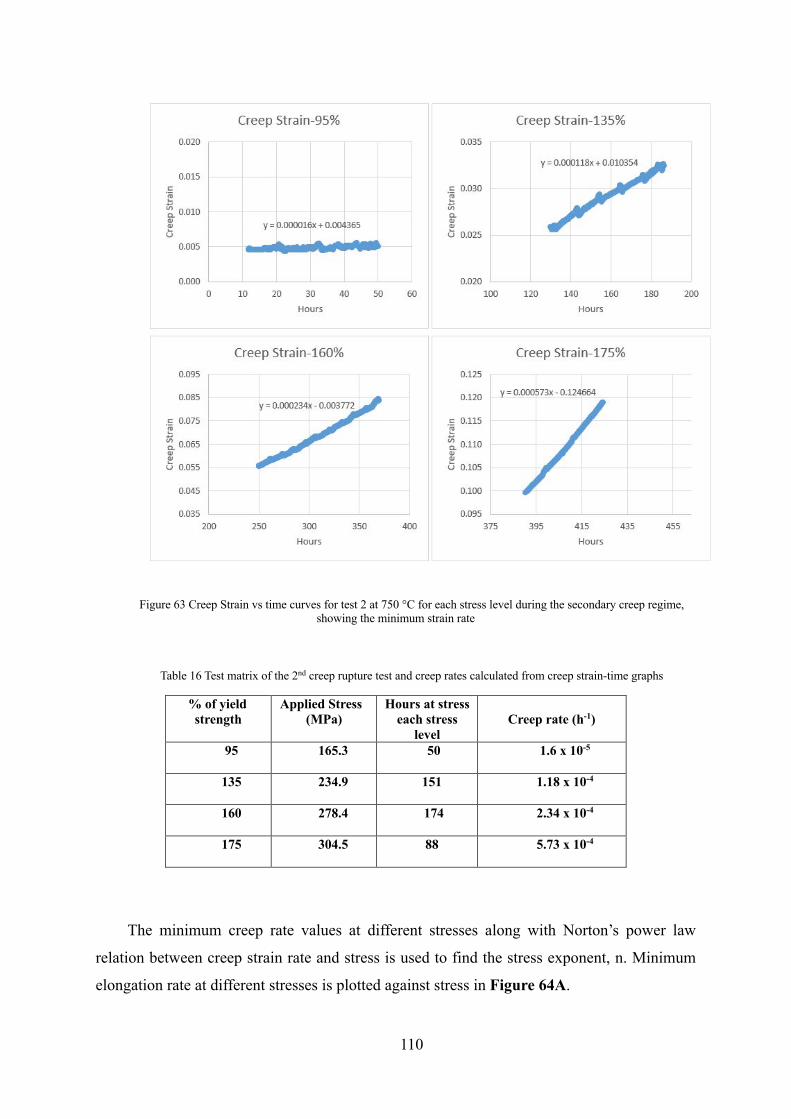
110
Figure 63 Creep Strain vs time curves for test 2 at 750 °C for each stress level during the secondary creep regime, showing the minimum strain rate
Table 16 Test matrix of the 2nd creep rupture test and creep rates calculated from creep strain-time graphs
% of yield strength
Applied Stress (MPa)
Hours at stress each stress
level
Creep rate (h-1)
95 165.3 50 1.6 x 10⁻⁵
135 234.9 151 1.18 x 10⁻⁴
160 278.4 174 2.34 x 10⁻⁴
175 304.5 88 5.73 x 10⁻⁴
The minimum creep rate values at different stresses along with Norton’s power law
relation between creep strain rate and stress is used to find the stress exponent, n. Minimum
elongation rate at different stresses is plotted against stress in Figure 64A.
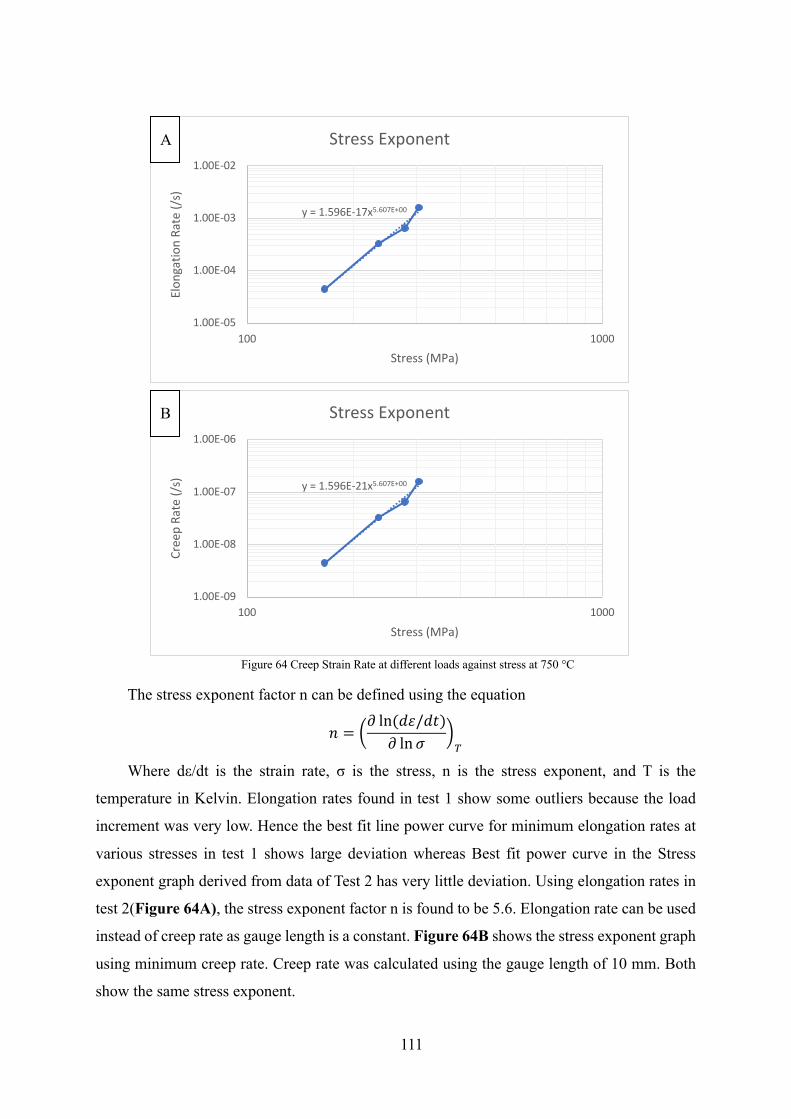
111
Figure 64 Creep Strain Rate at different loads against stress at 750 °C
The stress exponent factor n can be defined using the equation
3 = 45 ln(!"/!$)5 ln '
89
Where dε/dt is the strain rate, σ is the stress, n is the stress exponent, and T is the
temperature in Kelvin. Elongation rates found in test 1 show some outliers because the load
increment was very low. Hence the best fit line power curve for minimum elongation rates at
various stresses in test 1 shows large deviation whereas Best fit power curve in the Stress
exponent graph derived from data of Test 2 has very little deviation. Using elongation rates in
test 2(Figure 64A), the stress exponent factor n is found to be 5.6. Elongation rate can be used
instead of creep rate as gauge length is a constant. Figure 64B shows the stress exponent graph
using minimum creep rate. Creep rate was calculated using the gauge length of 10 mm. Both
show the same stress exponent.
y = 1.596E-17x5.607E+00
1.00E-05
1.00E-04
1.00E-03
1.00E-02
100 1000
Elon
gatio
n Ra
te (/
s)
Stress (MPa)
Stress ExponentA
y = 1.596E-21x5.607E+00
1.00E-09
1.00E-08
1.00E-07
1.00E-06
100 1000
Cree
p Ra
te (/
s)
Stress (MPa)
Stress ExponentB
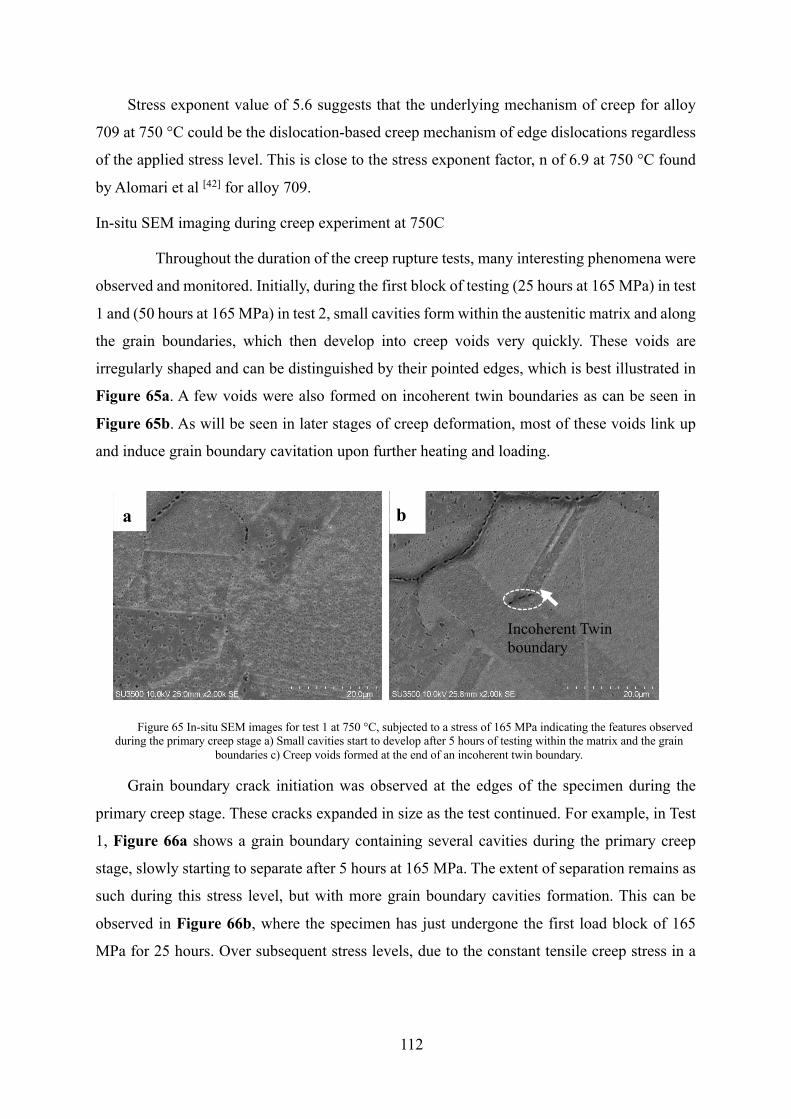
112
Stress exponent value of 5.6 suggests that the underlying mechanism of creep for alloy
709 at 750 °C could be the dislocation-based creep mechanism of edge dislocations regardless
of the applied stress level. This is close to the stress exponent factor, n of 6.9 at 750 °C found
by Alomari et al [42] for alloy 709.
In-situ SEM imaging during creep experiment at 750C
Throughout the duration of the creep rupture tests, many interesting phenomena were
observed and monitored. Initially, during the first block of testing (25 hours at 165 MPa) in test
1 and (50 hours at 165 MPa) in test 2, small cavities form within the austenitic matrix and along
the grain boundaries, which then develop into creep voids very quickly. These voids are
irregularly shaped and can be distinguished by their pointed edges, which is best illustrated in
Figure 65a. A few voids were also formed on incoherent twin boundaries as can be seen in
Figure 65b. As will be seen in later stages of creep deformation, most of these voids link up
and induce grain boundary cavitation upon further heating and loading.
Grain boundary crack initiation was observed at the edges of the specimen during the
primary creep stage. These cracks expanded in size as the test continued. For example, in Test
1, Figure 66a shows a grain boundary containing several cavities during the primary creep
stage, slowly starting to separate after 5 hours at 165 MPa. The extent of separation remains as
such during this stress level, but with more grain boundary cavities formation. This can be
observed in Figure 66b, where the specimen has just undergone the first load block of 165
MPa for 25 hours. Over subsequent stress levels, due to the constant tensile creep stress in a
Figure 65 In-situ SEM images for test 1 at 750 °C, subjected to a stress of 165 MPa indicating the features observed during the primary creep stage a) Small cavities start to develop after 5 hours of testing within the matrix and the grain
boundaries c) Creep voids formed at the end of an incoherent twin boundary.
a b
Incoherent Twin boundary
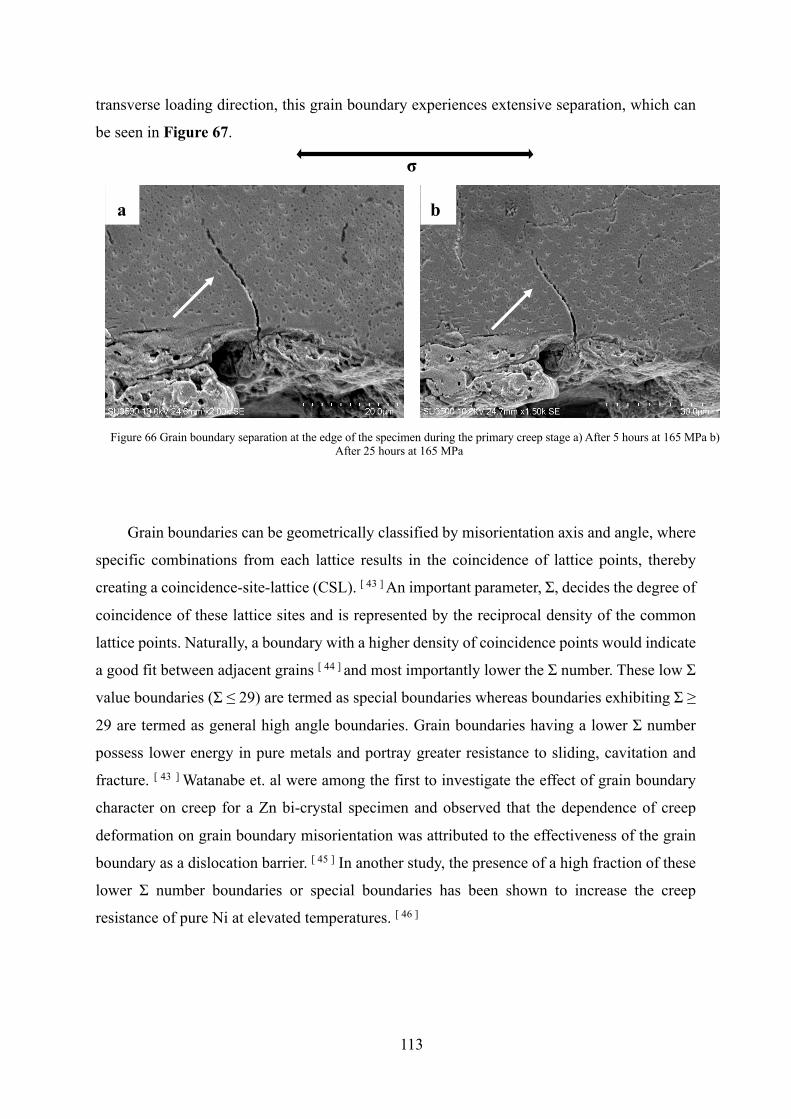
113
transverse loading direction, this grain boundary experiences extensive separation, which can
be seen in Figure 67.
Grain boundaries can be geometrically classified by misorientation axis and angle, where
specific combinations from each lattice results in the coincidence of lattice points, thereby
creating a coincidence-site-lattice (CSL). [ 43 ] An important parameter, Σ, decides the degree of
coincidence of these lattice sites and is represented by the reciprocal density of the common
lattice points. Naturally, a boundary with a higher density of coincidence points would indicate
a good fit between adjacent grains [ 44 ] and most importantly lower the Σ number. These low Σ
value boundaries (Σ ≤ 29) are termed as special boundaries whereas boundaries exhibiting Σ ≥
29 are termed as general high angle boundaries. Grain boundaries having a lower Σ number
possess lower energy in pure metals and portray greater resistance to sliding, cavitation and
fracture. [ 43 ] Watanabe et. al were among the first to investigate the effect of grain boundary
character on creep for a Zn bi-crystal specimen and observed that the dependence of creep
deformation on grain boundary misorientation was attributed to the effectiveness of the grain
boundary as a dislocation barrier. [ 45 ] In another study, the presence of a high fraction of these
lower Σ number boundaries or special boundaries has been shown to increase the creep
resistance of pure Ni at elevated temperatures. [ 46 ]
Figure 66 Grain boundary separation at the edge of the specimen during the primary creep stage a) After 5 hours at 165 MPa b) After 25 hours at 165 MPa
a b
σ
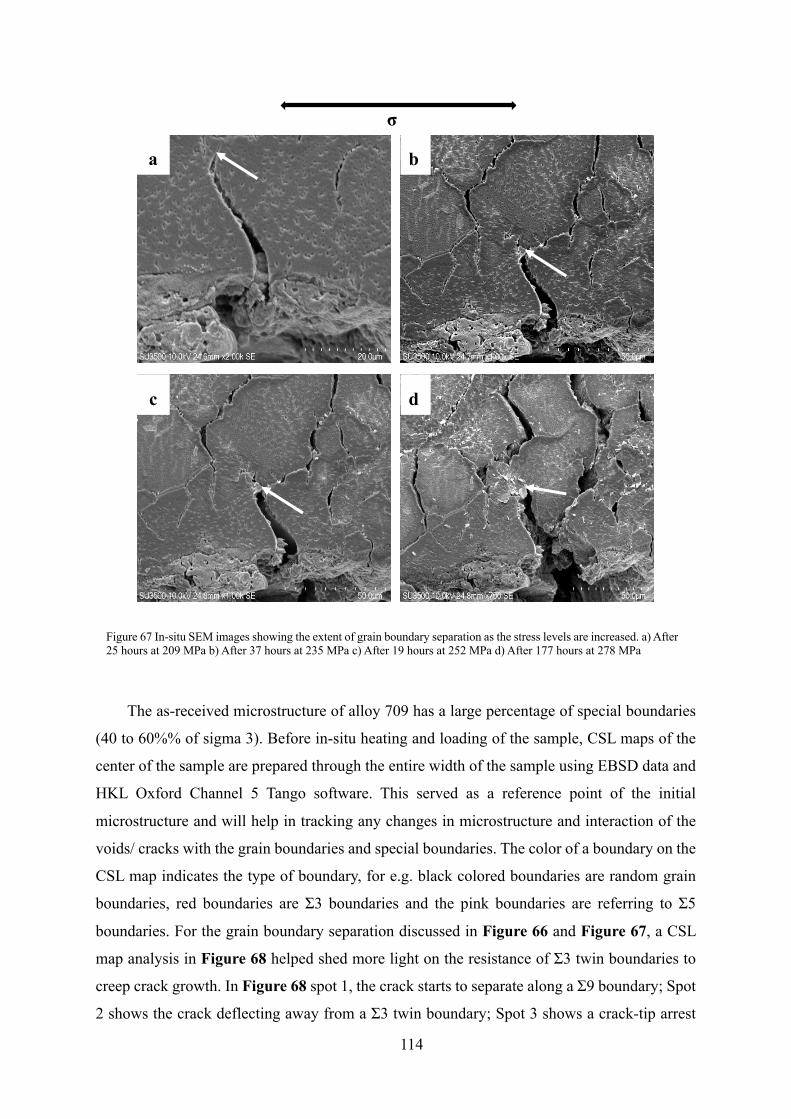
114
The as-received microstructure of alloy 709 has a large percentage of special boundaries
(40 to 60%% of sigma 3). Before in-situ heating and loading of the sample, CSL maps of the
center of the sample are prepared through the entire width of the sample using EBSD data and
HKL Oxford Channel 5 Tango software. This served as a reference point of the initial
microstructure and will help in tracking any changes in microstructure and interaction of the
voids/ cracks with the grain boundaries and special boundaries. The color of a boundary on the
CSL map indicates the type of boundary, for e.g. black colored boundaries are random grain
boundaries, red boundaries are Σ3 boundaries and the pink boundaries are referring to Σ5
boundaries. For the grain boundary separation discussed in Figure 66 and Figure 67, a CSL
map analysis in Figure 68 helped shed more light on the resistance of Σ3 twin boundaries to
creep crack growth. In Figure 68 spot 1, the crack starts to separate along a Σ9 boundary; Spot
2 shows the crack deflecting away from a Σ3 twin boundary; Spot 3 shows a crack-tip arrest
a b
c d
σ
Figure 67 In-situ SEM images showing the extent of grain boundary separation as the stress levels are increased. a) After 25 hours at 209 MPa b) After 37 hours at 235 MPa c) After 19 hours at 252 MPa d) After 177 hours at 278 MPa
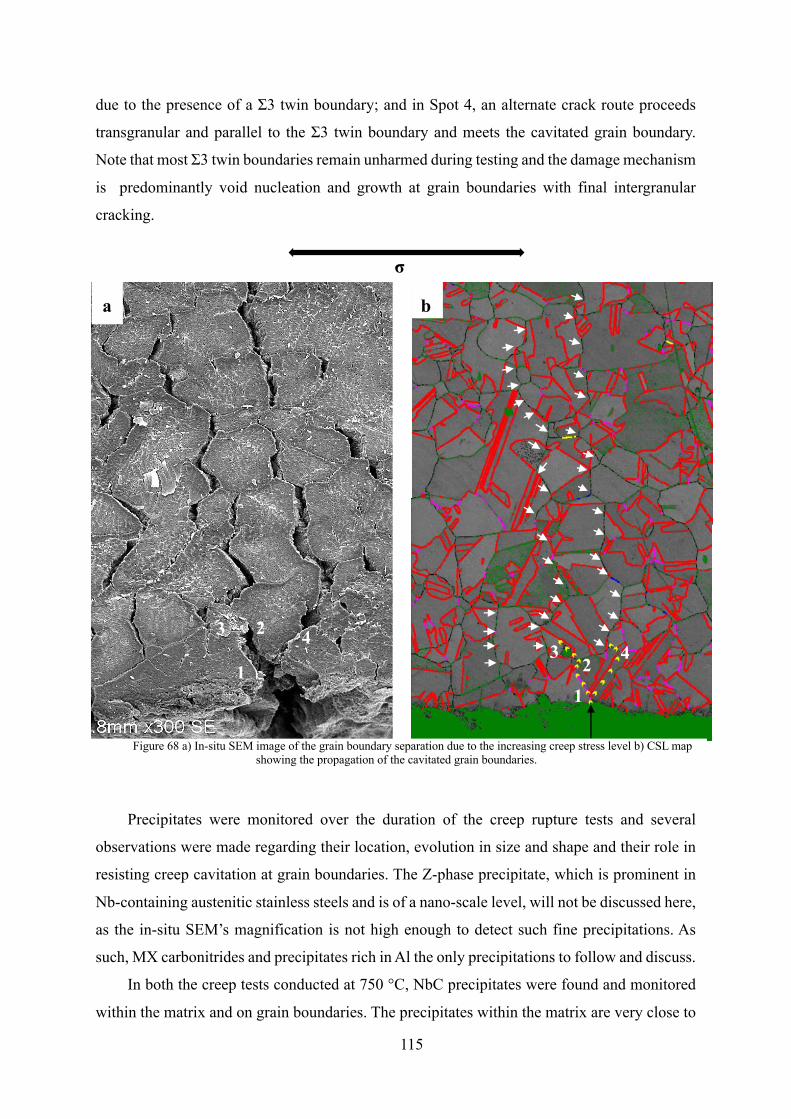
115
due to the presence of a Σ3 twin boundary; and in Spot 4, an alternate crack route proceeds
transgranular and parallel to the Σ3 twin boundary and meets the cavitated grain boundary.
Note that most Σ3 twin boundaries remain unharmed during testing and the damage mechanism
is predominantly void nucleation and growth at grain boundaries with final intergranular
cracking.
Precipitates were monitored over the duration of the creep rupture tests and several
observations were made regarding their location, evolution in size and shape and their role in
resisting creep cavitation at grain boundaries. The Z-phase precipitate, which is prominent in
Nb-containing austenitic stainless steels and is of a nano-scale level, will not be discussed here,
as the in-situ SEM’s magnification is not high enough to detect such fine precipitations. As
such, MX carbonitrides and precipitates rich in Al the only precipitations to follow and discuss.
In both the creep tests conducted at 750 °C, NbC precipitates were found and monitored
within the matrix and on grain boundaries. The precipitates within the matrix are very close to
1
1
2
2
3
3 4
4
a c b
Figure 68 a) In-situ SEM image of the grain boundary separation due to the increasing creep stress level b) CSL map showing the propagation of the cavitated grain boundaries.
σ
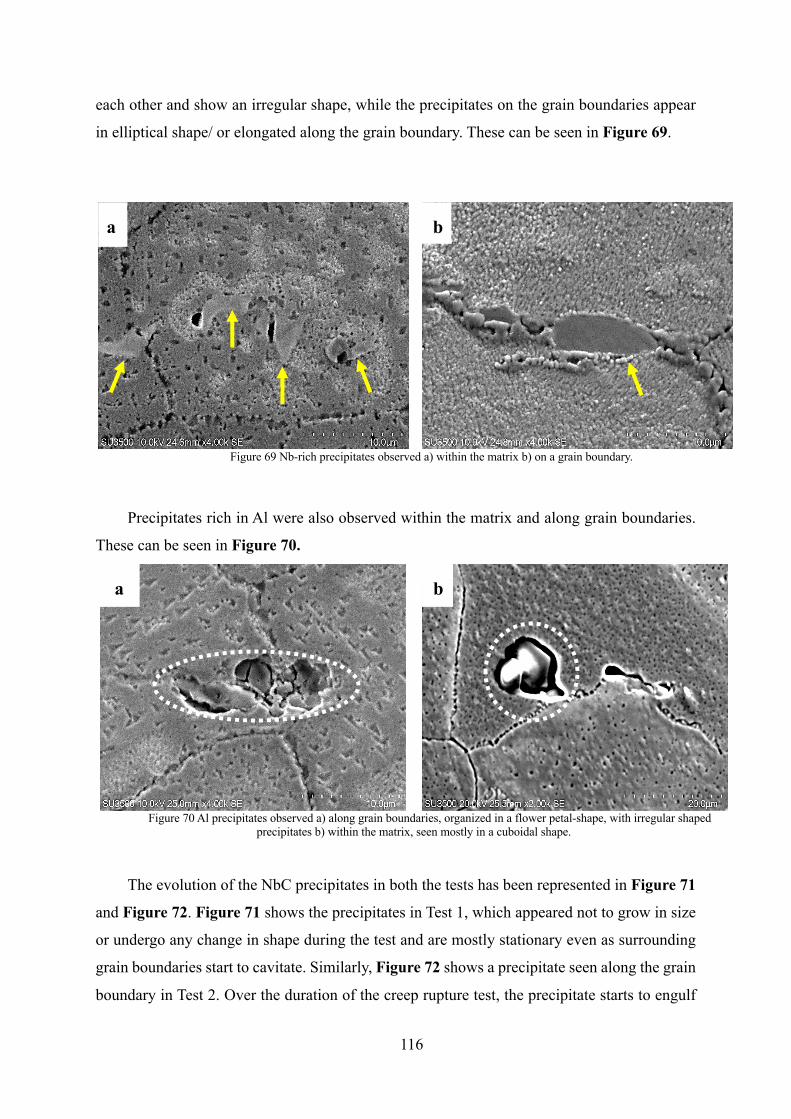
116
each other and show an irregular shape, while the precipitates on the grain boundaries appear
in elliptical shape/ or elongated along the grain boundary. These can be seen in Figure 69.
Precipitates rich in Al were also observed within the matrix and along grain boundaries.
These can be seen in Figure 70.
The evolution of the NbC precipitates in both the tests has been represented in Figure 71
and Figure 72. Figure 71 shows the precipitates in Test 1, which appeared not to grow in size
or undergo any change in shape during the test and are mostly stationary even as surrounding
grain boundaries start to cavitate. Similarly, Figure 72 shows a precipitate seen along the grain
boundary in Test 2. Over the duration of the creep rupture test, the precipitate starts to engulf
a b
a b
Figure 69 Nb-rich precipitates observed a) within the matrix b) on a grain boundary.
Figure 70 Al precipitates observed a) along grain boundaries, organized in a flower petal-shape, with irregular shaped precipitates b) within the matrix, seen mostly in a cuboidal shape.
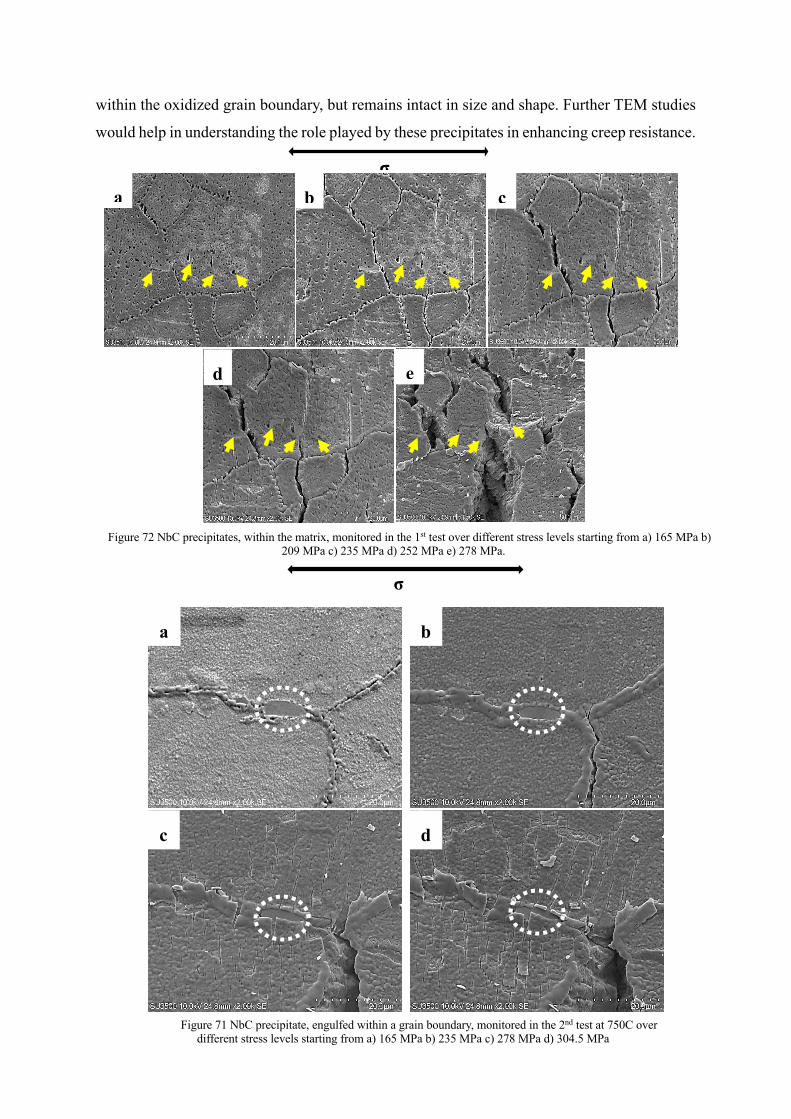
117
within the oxidized grain boundary, but remains intact in size and shape. Further TEM studies
would help in understanding the role played by these precipitates in enhancing creep resistance.
Figure 72 NbC precipitates, within the matrix, monitored in the 1st test over different stress levels starting from a) 165 MPa b)
209 MPa c) 235 MPa d) 252 MPa e) 278 MPa.
Figure 71 NbC precipitate, engulfed within a grain boundary, monitored in the 2nd test at 750C over different stress levels starting from a) 165 MPa b) 235 MPa c) 278 MPa d) 304.5 MPa
a
σ
b
c d
a a
σ b c
d e
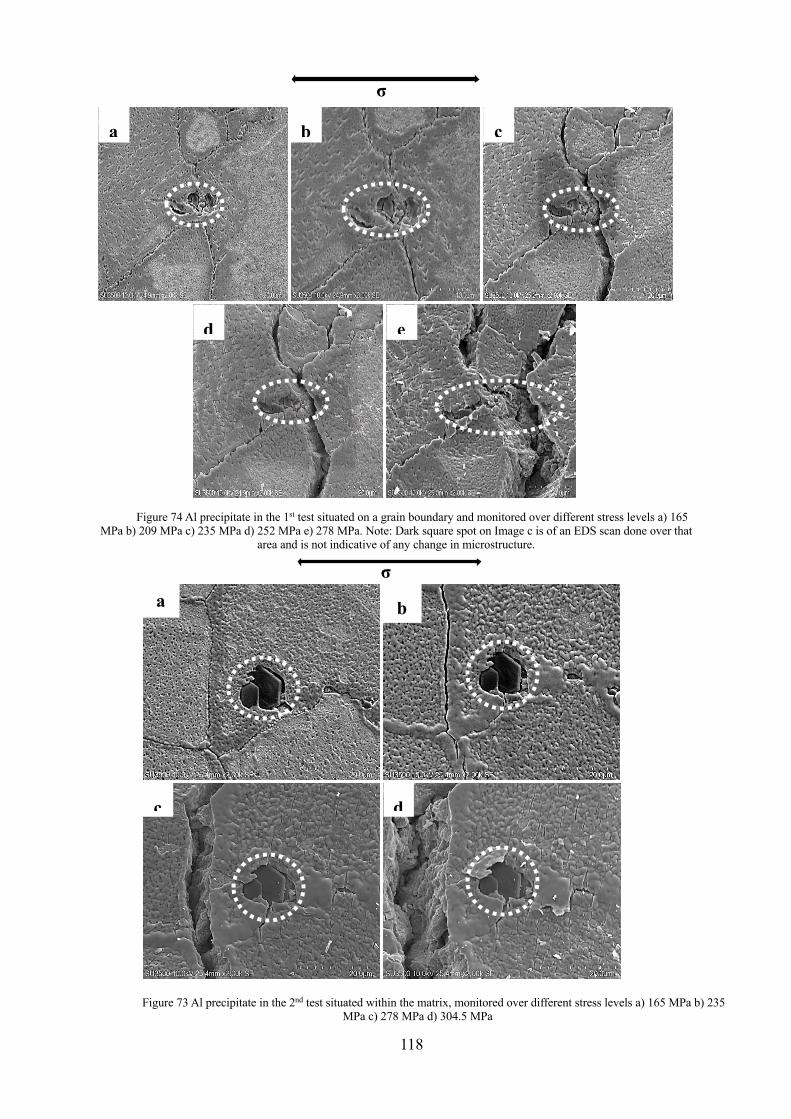
118
Figure 74 Al precipitate in the 1st test situated on a grain boundary and monitored over different stress levels a) 165 MPa b) 209 MPa c) 235 MPa d) 252 MPa e) 278 MPa. Note: Dark square spot on Image c is of an EDS scan done over that
area and is not indicative of any change in microstructure.
Figure 73 Al precipitate in the 2nd test situated within the matrix, monitored over different stress levels a) 165 MPa b) 235 MPa c) 278 MPa d) 304.5 MPa
a
σ
b
c d
a
σ
b c
d e
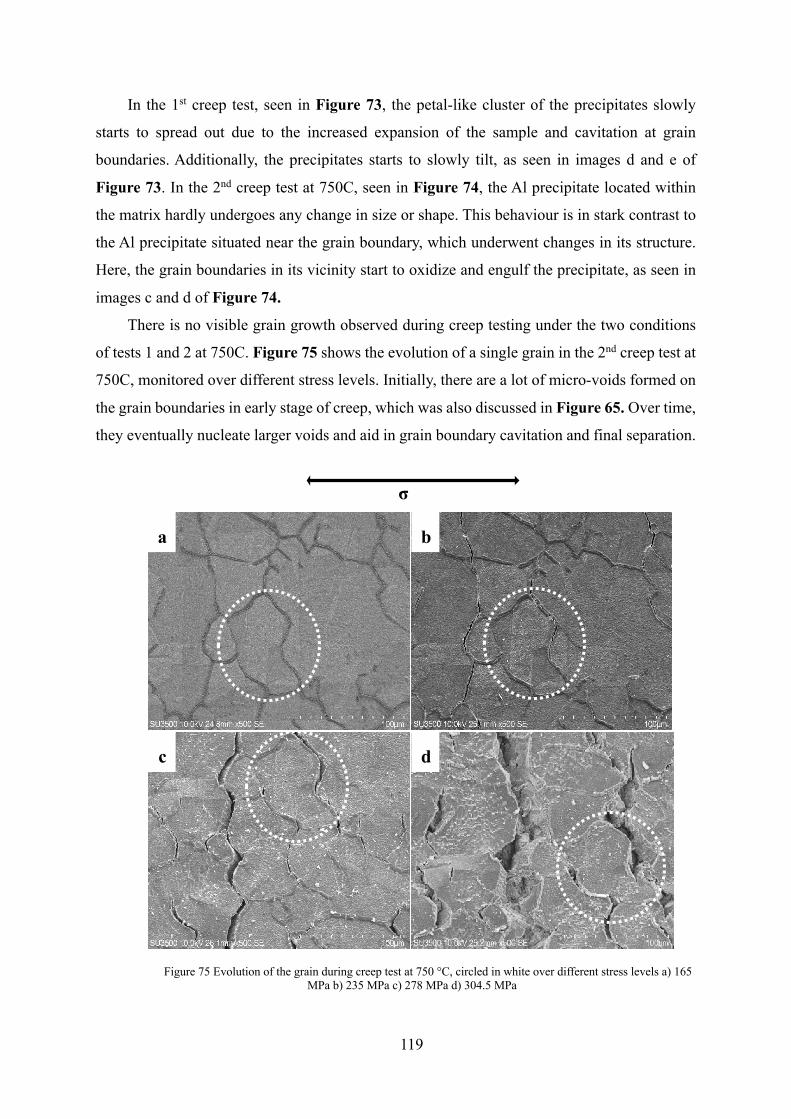
119
In the 1st creep test, seen in Figure 73, the petal-like cluster of the precipitates slowly
starts to spread out due to the increased expansion of the sample and cavitation at grain
boundaries. Additionally, the precipitates starts to slowly tilt, as seen in images d and e of
Figure 73. In the 2nd creep test at 750C, seen in Figure 74, the Al precipitate located within
the matrix hardly undergoes any change in size or shape. This behaviour is in stark contrast to
the Al precipitate situated near the grain boundary, which underwent changes in its structure.
Here, the grain boundaries in its vicinity start to oxidize and engulf the precipitate, as seen in
images c and d of Figure 74.
There is no visible grain growth observed during creep testing under the two conditions
of tests 1 and 2 at 750C. Figure 75 shows the evolution of a single grain in the 2nd creep test at
750C, monitored over different stress levels. Initially, there are a lot of micro-voids formed on
the grain boundaries in early stage of creep, which was also discussed in Figure 65. Over time,
they eventually nucleate larger voids and aid in grain boundary cavitation and final separation.
Figure 75 Evolution of the grain during creep test at 750 °C, circled in white over different stress levels a) 165 MPa b) 235 MPa c) 278 MPa d) 304.5 MPa
a
σ
b
c d
120
Considering the high temperature and stress levels, there is a rapid growth in the extent of
grain boundary cavitation. However, the grain shape and size does not change. There is
obviously a slight tilt in grain orientation as the test wears on and that is mainly due to the
transverse loading direction with respect to the grain orientation.
Fractography
After failure, the fractured surface (Figure 76) was observed under the SEM to understand
the mechanism of the fast failure towards the end of the test. The two edges of the sample show
intergranular crack initiation within about 1 or 2 grains (Figure 76a and Figure 76f), that
corresponds to the grain boundary crack initiation during primary and secondary regimes of
creep. As the crack propagation proceeds, a cup-and-cone pattern is observed (Figure 76b). It
caused by a mechanism known as micro-void coalescence and is characteristic of a ductile
fracture mechanism towards the end of secondary and within the tertiary creep loading. Several
deep dimples were observed with precipitates at the bottom of them (Figure 76c). Areas with
plastic bands were observed near the dimples and in the region where the intergranular crack
initiation changes to transgranular rupture (Figure 76e) that is observed in the final stage of
tertiary creep.
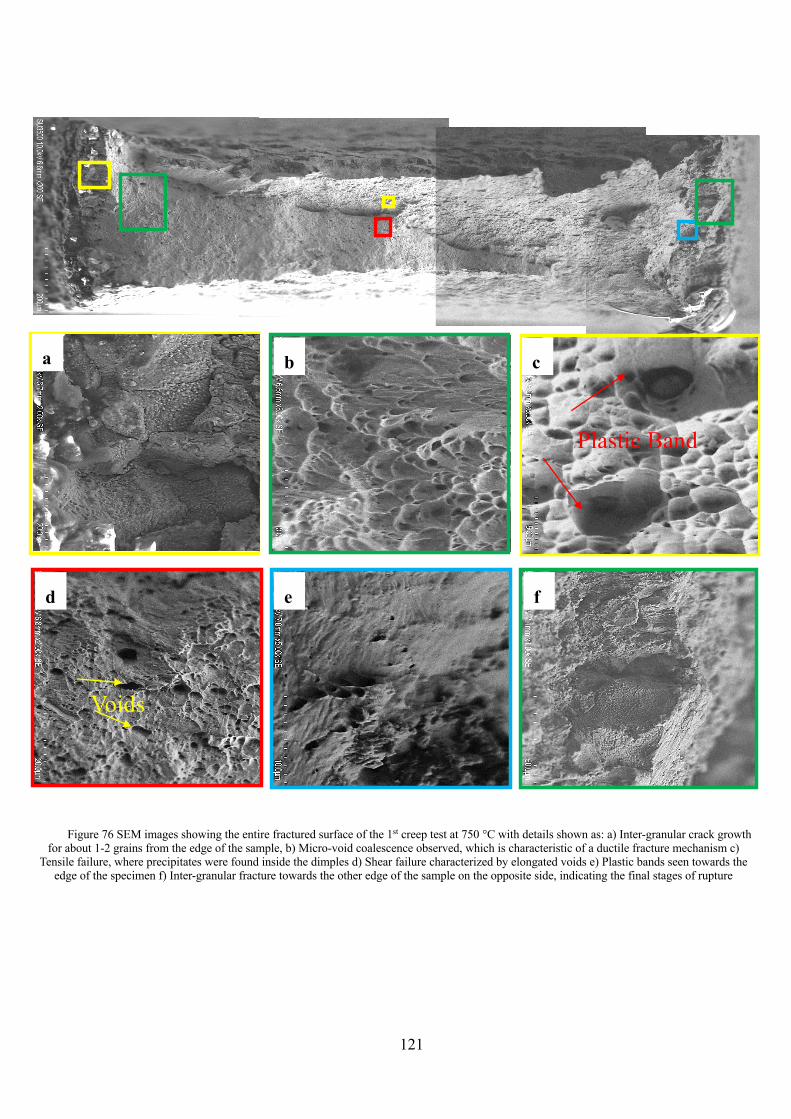
121
Top
Bottom
a
b c d e
f
Figure 76 SEM images showing the entire fractured surface of the 1st creep test at 750 °C with details shown as: a) Inter-granular crack growth for about 1-2 grains from the edge of the sample, b) Micro-void coalescence observed, which is characteristic of a ductile fracture mechanism c)
Tensile failure, where precipitates were found inside the dimples d) Shear failure characterized by elongated voids e) Plastic bands seen towards the edge of the specimen f) Inter-granular fracture towards the other edge of the sample on the opposite side, indicating the final stages of rupture
Fractured surface
a
Plastic Band
Voids
b c
d e f
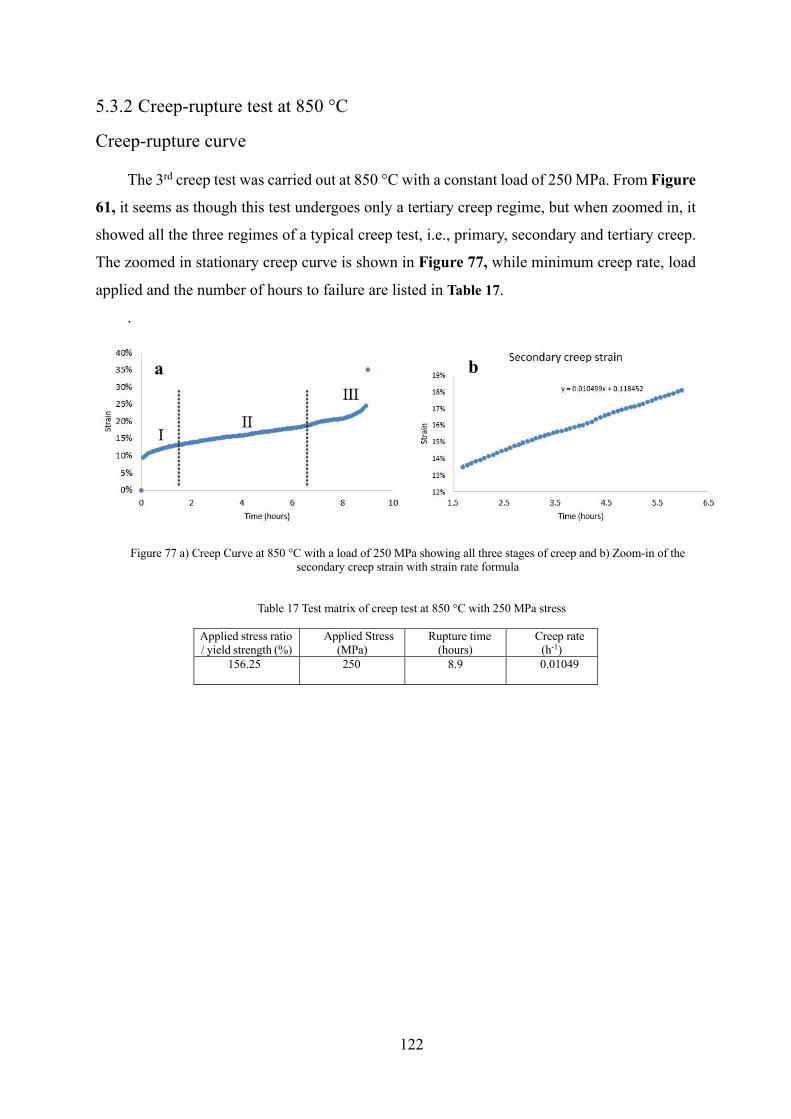
122
5.3.2 Creep-rupture test at 850 °C
Creep-rupture curve
The 3rd creep test was carried out at 850 °C with a constant load of 250 MPa. From Figure
61, it seems as though this test undergoes only a tertiary creep regime, but when zoomed in, it
showed all the three regimes of a typical creep test, i.e., primary, secondary and tertiary creep.
The zoomed in stationary creep curve is shown in Figure 77, while minimum creep rate, load
applied and the number of hours to failure are listed in Table 17.
.
Figure 77 a) Creep Curve at 850 °C with a load of 250 MPa showing all three stages of creep and b) Zoom-in of the secondary creep strain with strain rate formula
Table 17 Test matrix of creep test at 850 °C with 250 MPa stress
Applied stress ratio / yield strength (%)
Applied Stress (MPa)
Rupture time (hours)
Creep rate (h-1)
156.25 250 8.9 0.01049
a b
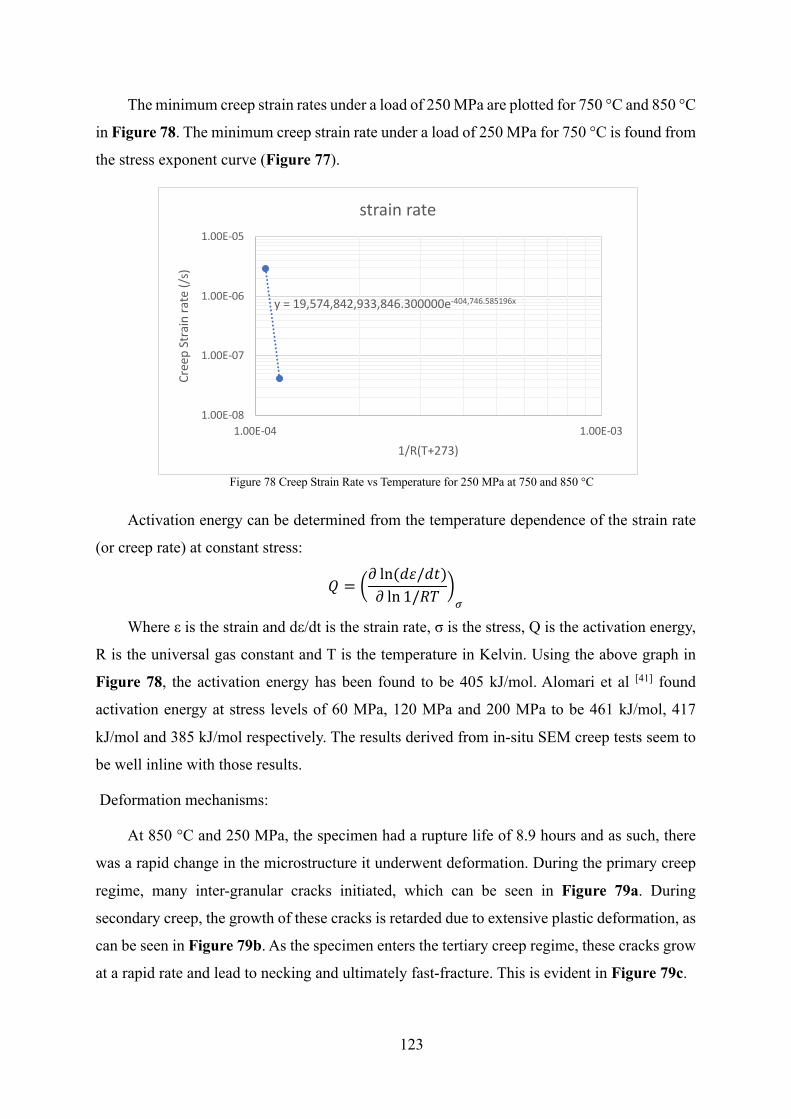
123
The minimum creep strain rates under a load of 250 MPa are plotted for 750 °C and 850 °C
in Figure 78. The minimum creep strain rate under a load of 250 MPa for 750 °C is found from
the stress exponent curve (Figure 77).
Figure 78 Creep Strain Rate vs Temperature for 250 MPa at 750 and 850 °C
Activation energy can be determined from the temperature dependence of the strain rate
(or creep rate) at constant stress:
/ = 45 ln(!"/!$)5 ln 1/01
8;
Where ε is the strain and dε/dt is the strain rate, σ is the stress, Q is the activation energy,
R is the universal gas constant and T is the temperature in Kelvin. Using the above graph in
Figure 78, the activation energy has been found to be 405 kJ/mol. Alomari et al [41] found
activation energy at stress levels of 60 MPa, 120 MPa and 200 MPa to be 461 kJ/mol, 417
kJ/mol and 385 kJ/mol respectively. The results derived from in-situ SEM creep tests seem to
be well inline with those results.
Deformation mechanisms:
At 850 °C and 250 MPa, the specimen had a rupture life of 8.9 hours and as such, there
was a rapid change in the microstructure it underwent deformation. During the primary creep
regime, many inter-granular cracks initiated, which can be seen in Figure 79a. During
secondary creep, the growth of these cracks is retarded due to extensive plastic deformation, as
can be seen in Figure 79b. As the specimen enters the tertiary creep regime, these cracks grow
at a rapid rate and lead to necking and ultimately fast-fracture. This is evident in Figure 79c.
y = 19,574,842,933,846.300000e-404,746.585196x
1.00E-08
1.00E-07
1.00E-06
1.00E-05
1.00E-04 1.00E-03
Cree
p St
rain
rate
(/s)
1/R(T+273)
strain rate
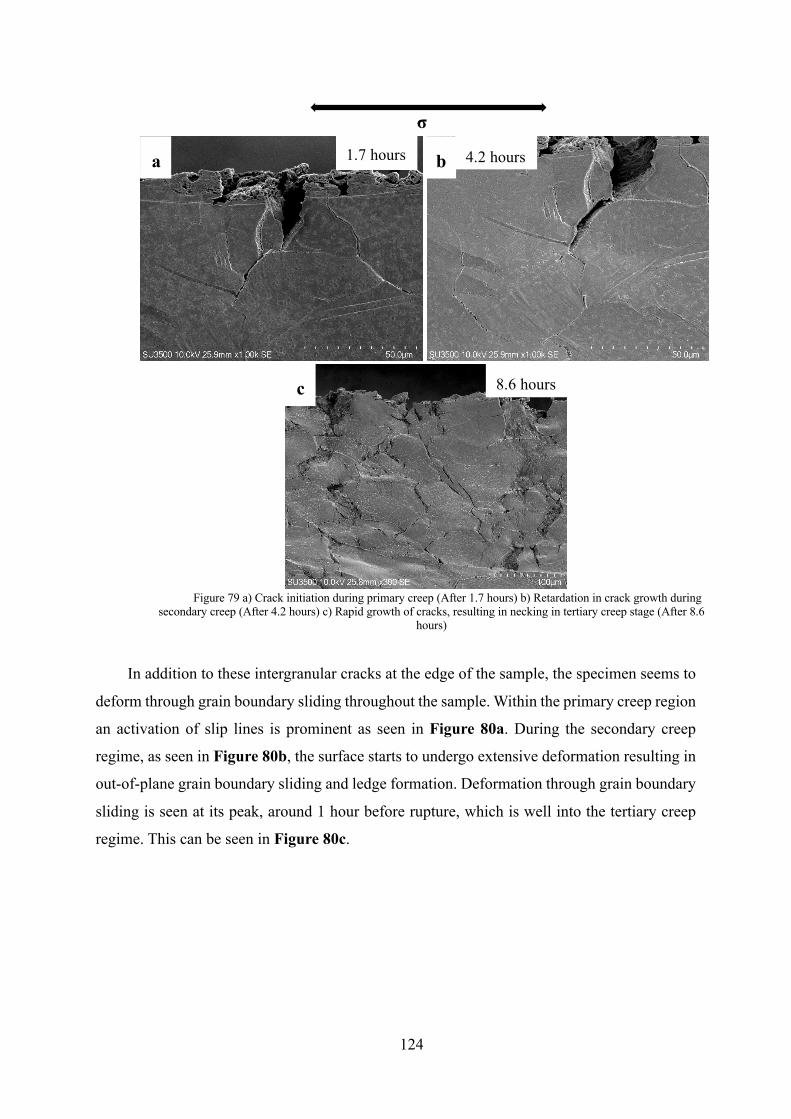
124
In addition to these intergranular cracks at the edge of the sample, the specimen seems to
deform through grain boundary sliding throughout the sample. Within the primary creep region
an activation of slip lines is prominent as seen in Figure 80a. During the secondary creep
regime, as seen in Figure 80b, the surface starts to undergo extensive deformation resulting in
out-of-plane grain boundary sliding and ledge formation. Deformation through grain boundary
sliding is seen at its peak, around 1 hour before rupture, which is well into the tertiary creep
regime. This can be seen in Figure 80c.
Figure 79 a) Crack initiation during primary creep (After 1.7 hours) b) Retardation in crack growth during secondary creep (After 4.2 hours) c) Rapid growth of cracks, resulting in necking in tertiary creep stage (After 8.6
hours)
a
σ
b
c
1.7 hours 4.2 hours
8.6 hours
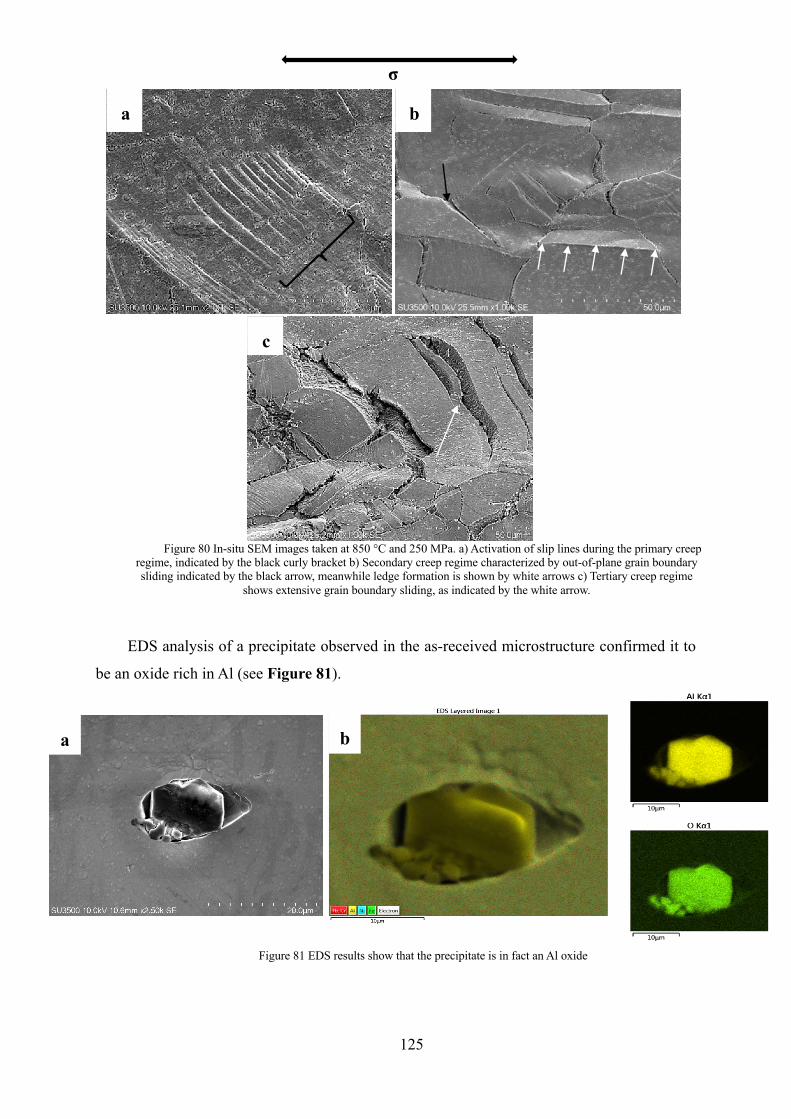
125
EDS analysis of a precipitate observed in the as-received microstructure confirmed it to
be an oxide rich in Al (see Figure 81).
Figure 80 In-situ SEM images taken at 850 °C and 250 MPa. a) Activation of slip lines during the primary creep regime, indicated by the black curly bracket b) Secondary creep regime characterized by out-of-plane grain boundary sliding indicated by the black arrow, meanwhile ledge formation is shown by white arrows c) Tertiary creep regime
shows extensive grain boundary sliding, as indicated by the white arrow.
Figure 81 EDS results show that the precipitate is in fact an Al oxide
a
σ
b
c
a b
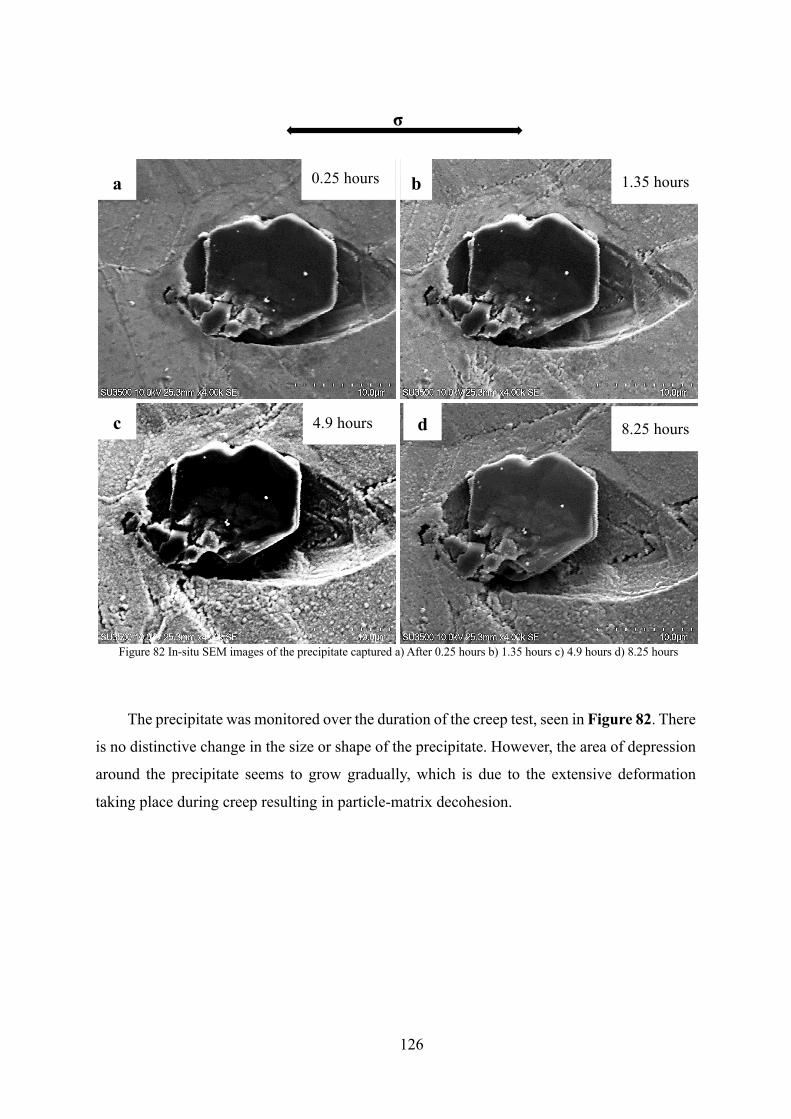
126
The precipitate was monitored over the duration of the creep test, seen in Figure 82. There
is no distinctive change in the size or shape of the precipitate. However, the area of depression
around the precipitate seems to grow gradually, which is due to the extensive deformation
taking place during creep resulting in particle-matrix decohesion.
a
σ
b
c d
0.25 hours 1.35 hours
4.9 hours 8.25 hours
Figure 82 In-situ SEM images of the precipitate captured a) After 0.25 hours b) 1.35 hours c) 4.9 hours d) 8.25 hours
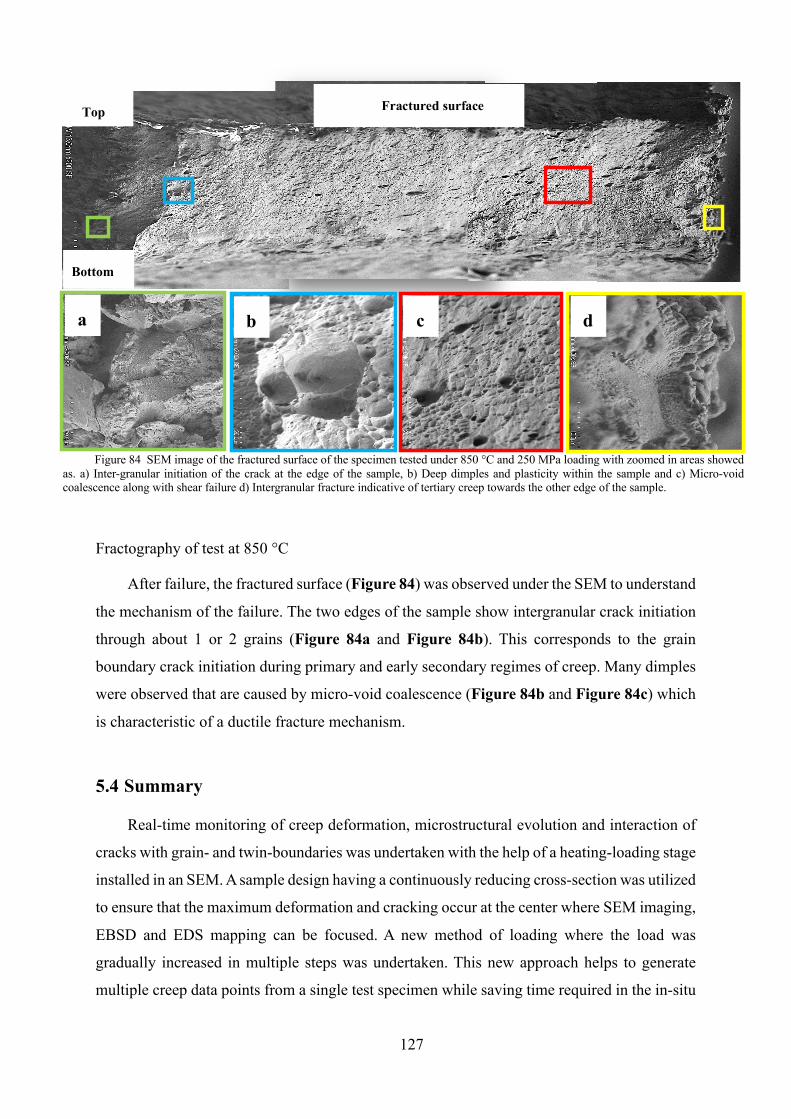
127
Fractography of test at 850 °C
After failure, the fractured surface (Figure 84) was observed under the SEM to understand
the mechanism of the failure. The two edges of the sample show intergranular crack initiation
through about 1 or 2 grains (Figure 84a and Figure 84b). This corresponds to the grain
boundary crack initiation during primary and early secondary regimes of creep. Many dimples
were observed that are caused by micro-void coalescence (Figure 84b and Figure 84c) which
is characteristic of a ductile fracture mechanism.
5.4 Summary
Real-time monitoring of creep deformation, microstructural evolution and interaction of
cracks with grain- and twin-boundaries was undertaken with the help of a heating-loading stage
installed in an SEM. A sample design having a continuously reducing cross-section was utilized
to ensure that the maximum deformation and cracking occur at the center where SEM imaging,
EBSD and EDS mapping can be focused. A new method of loading where the load was
gradually increased in multiple steps was undertaken. This new approach helps to generate
multiple creep data points from a single test specimen while saving time required in the in-situ
Figure 84 SEM image of the fractured surface of the specimen tested under 850 °C and 250 MPa loading with zoomed in areas showed as. a) Inter-granular initiation of the crack at the edge of the sample, b) Deep dimples and plasticity within the sample and c) Micro-void coalescence along with shear failure d) Intergranular fracture indicative of tertiary creep towards the other edge of the sample.
a
Top
Bottom
b d c
Fractured surface

128
loading heating SEM. Minimum creep rate, Stress Exponent Factor “n” was found to be 5.6
and activation energy was found to be 366 kJ/mol. These findings are well in line with those
seen in the literature. Hence proving that the setup, sample design and loading method are very
suitable for conducting creep tests. These results will be further polished for publication soon.
129
6 Creep behaviour of Alloy 709
(The creep experiments on alloy 709 on larger samples are presented in chapters 6 and 7
of this report and some additional tests are still ongoing in UK and should wrap up before the
end of their program in September 2019. The final results along with those presented in
chapters 6 and 7 of this report will be submitted for publication as one or two papers with
potential arrangement as: Authors: Suyang Yu, Jin Yan, Rengen Ding, Hangyue Li, Afsaneh
Rabiei and Paul Bowen. Title: Creep behaviour of an advanced austenitic stainless steel for
nuclear application)
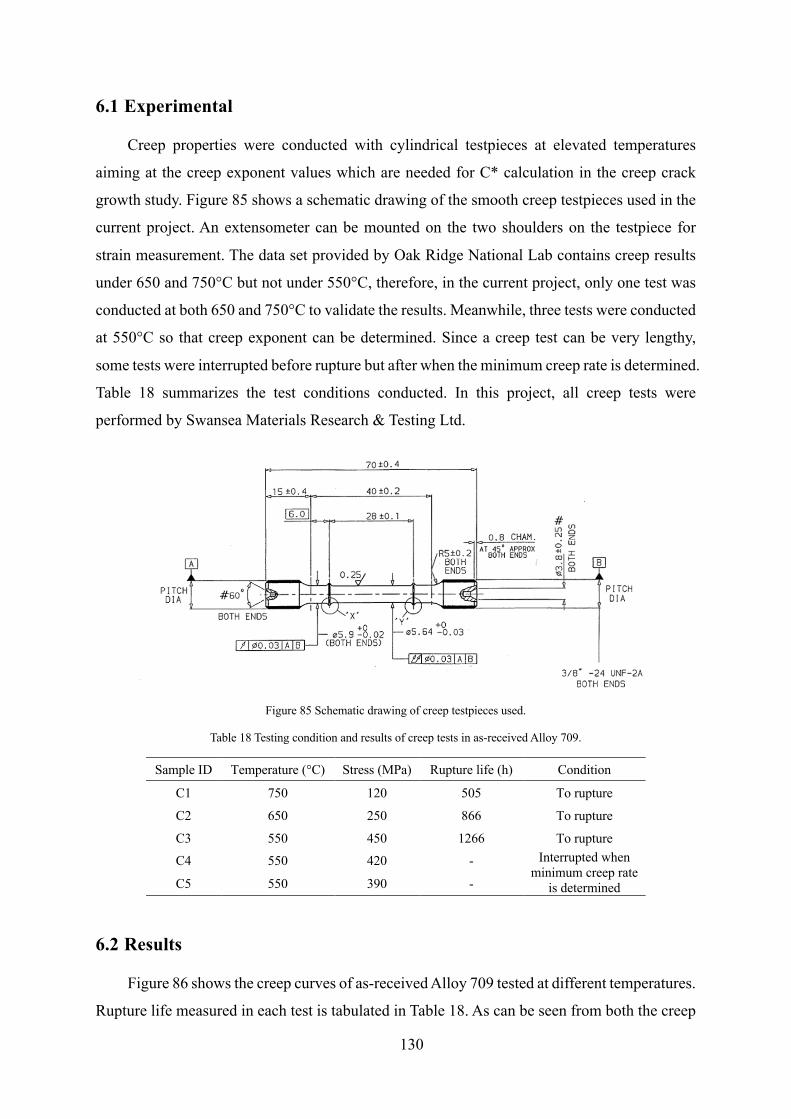
130
6.1 Experimental
Creep properties were conducted with cylindrical testpieces at elevated temperatures
aiming at the creep exponent values which are needed for C* calculation in the creep crack
growth study. Figure 85 shows a schematic drawing of the smooth creep testpieces used in the
current project. An extensometer can be mounted on the two shoulders on the testpiece for
strain measurement. The data set provided by Oak Ridge National Lab contains creep results
under 650 and 750°C but not under 550°C, therefore, in the current project, only one test was
conducted at both 650 and 750°C to validate the results. Meanwhile, three tests were conducted
at 550°C so that creep exponent can be determined. Since a creep test can be very lengthy,
some tests were interrupted before rupture but after when the minimum creep rate is determined.
Table 18 summarizes the test conditions conducted. In this project, all creep tests were
performed by Swansea Materials Research & Testing Ltd.
Figure 85 Schematic drawing of creep testpieces used.
Table 18 Testing condition and results of creep tests in as-received Alloy 709.
Sample ID Temperature (°C) Stress (MPa) Rupture life (h) Condition
C1 750 120 505 To rupture
C2 650 250 866 To rupture
C3 550 450 1266 To rupture C4 550 420 - Interrupted when
minimum creep rate is determined C5 550 390 -
6.2 Results
Figure 86 shows the creep curves of as-received Alloy 709 tested at different temperatures.
Rupture life measured in each test is tabulated in Table 18. As can be seen from both the creep
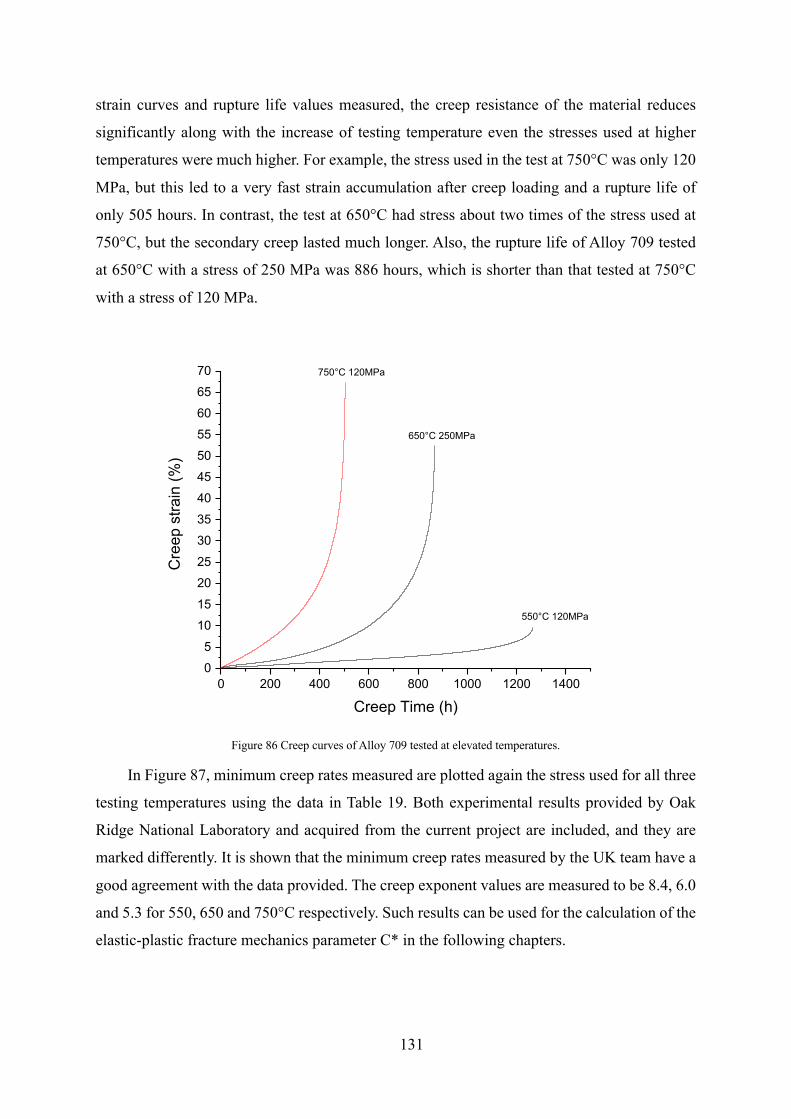
131
strain curves and rupture life values measured, the creep resistance of the material reduces
significantly along with the increase of testing temperature even the stresses used at higher
temperatures were much higher. For example, the stress used in the test at 750°C was only 120
MPa, but this led to a very fast strain accumulation after creep loading and a rupture life of
only 505 hours. In contrast, the test at 650°C had stress about two times of the stress used at
750°C, but the secondary creep lasted much longer. Also, the rupture life of Alloy 709 tested
at 650°C with a stress of 250 MPa was 886 hours, which is shorter than that tested at 750°C
with a stress of 120 MPa.
Figure 86 Creep curves of Alloy 709 tested at elevated temperatures.
In Figure 87, minimum creep rates measured are plotted again the stress used for all three
testing temperatures using the data in Table 19. Both experimental results provided by Oak
Ridge National Laboratory and acquired from the current project are included, and they are
marked differently. It is shown that the minimum creep rates measured by the UK team have a
good agreement with the data provided. The creep exponent values are measured to be 8.4, 6.0
and 5.3 for 550, 650 and 750°C respectively. Such results can be used for the calculation of the
elastic-plastic fracture mechanics parameter C* in the following chapters.
0 200 400 600 800 1000 1200 140005
10152025303540455055606570
Cre
ep s
train
(%)
Creep Time (h)
750°C 120MPa
650°C 250MPa
550°C 120MPa
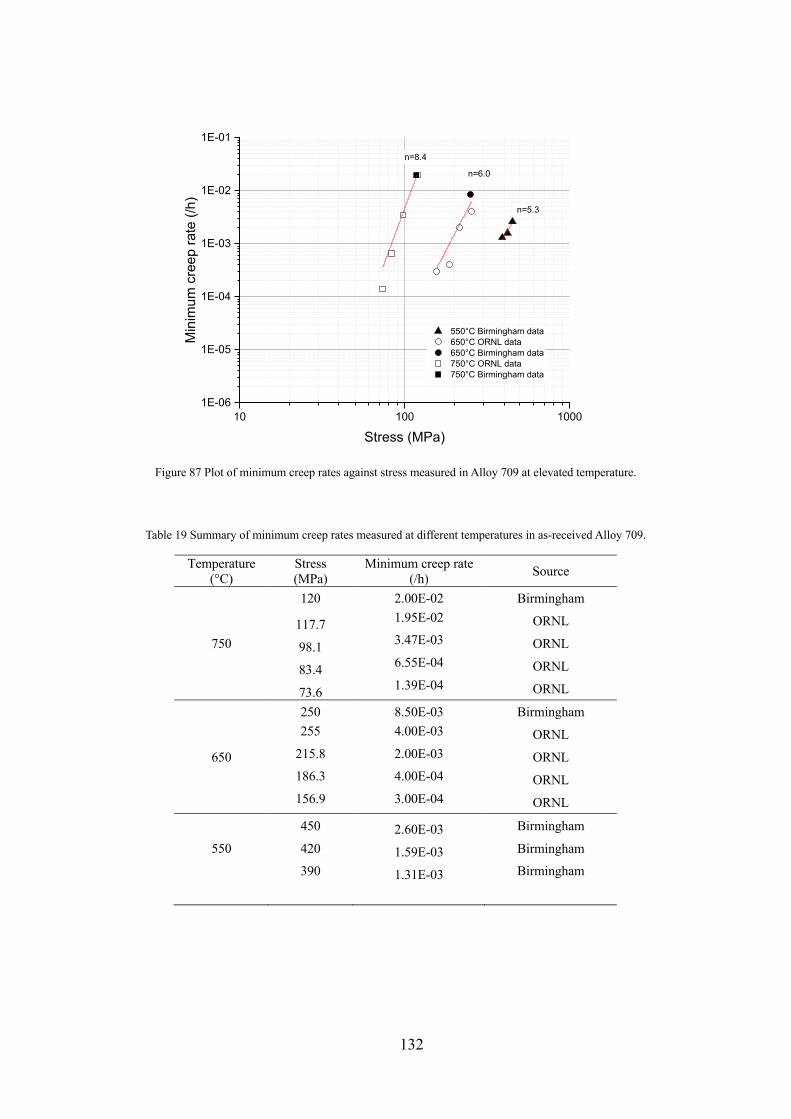
132
Figure 87 Plot of minimum creep rates against stress measured in Alloy 709 at elevated temperature.
Table 19 Summary of minimum creep rates measured at different temperatures in as-received Alloy 709.
Temperature (°C)
Stress (MPa)
Minimum creep rate (/h) Source
750
120 2.00E-02 Birmingham
117.7 1.95E-02 ORNL
98.1 3.47E-03 ORNL
83.4 6.55E-04 ORNL
73.6 1.39E-04 ORNL
650
250 8.50E-03 Birmingham 255 4.00E-03 ORNL
215.8 2.00E-03 ORNL 186.3 4.00E-04 ORNL 156.9 3.00E-04 ORNL
550
450 2.60E-03 Birmingham
420 1.59E-03 Birmingham 390 1.31E-03 Birmingham
10 100 10001E-06
1E-05
1E-04
1E-03
1E-02
1E-01
n=5.3
550°C Birmingham data 650°C ORNL data 650°C Birmingham data 750°C ORNL data 750°C Birmingham data
Min
imum
cre
ep ra
te (/
h)
Stress (MPa)
n=8.4
n=6.0
133
7 Creep crack growth in Alloy709
(The creep experiments on alloy 709 on larger samples are presented in chapters 6 and 7
of this report and some additional tests are still ongoing in UK and should wrap up before the
end of their program in September 2019. The final results along with those presented in
chapters 6 and 7 of this report will be submitted for publication as one or two papers with
potential arrangement as: Authors: Suyang Yu, Jin Yan, Rengen Ding, Hangyue Li, Afsaneh
Rabiei and Paul Bowen. Title: Creep behaviour of an advanced austenitic stainless steel for
nuclear application)
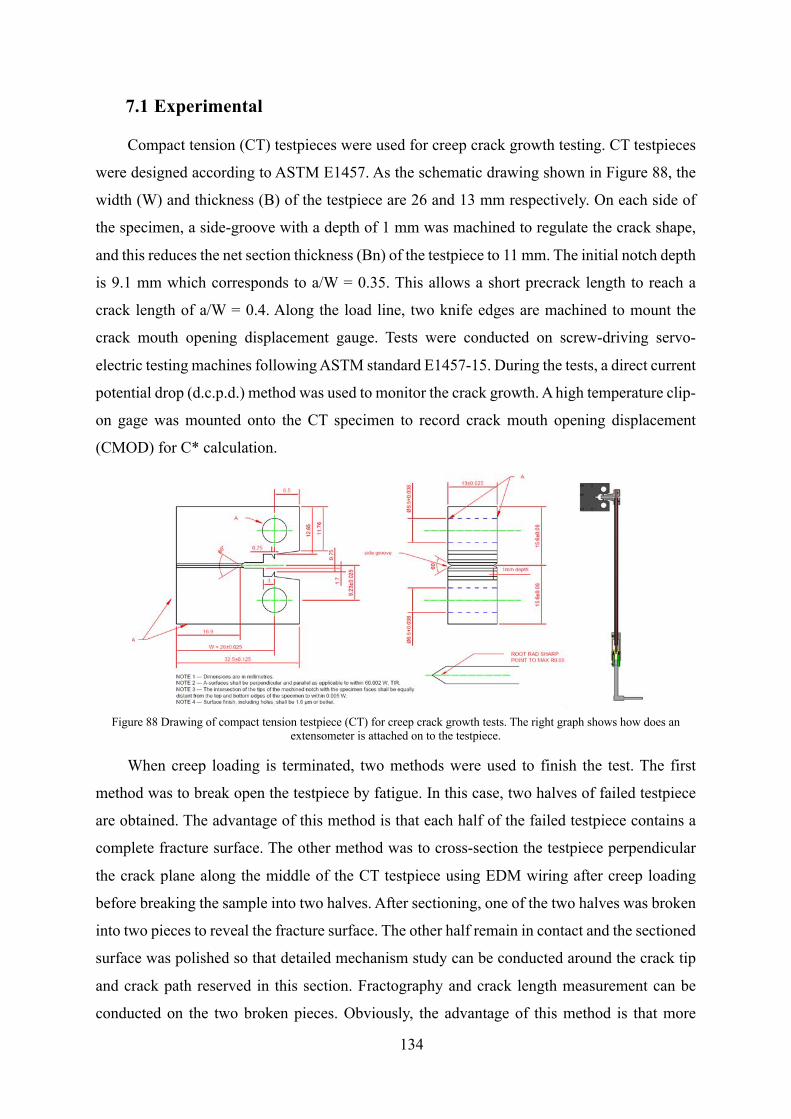
134
7.1 Experimental
Compact tension (CT) testpieces were used for creep crack growth testing. CT testpieces
were designed according to ASTM E1457. As the schematic drawing shown in Figure 88, the
width (W) and thickness (B) of the testpiece are 26 and 13 mm respectively. On each side of
the specimen, a side-groove with a depth of 1 mm was machined to regulate the crack shape,
and this reduces the net section thickness (Bn) of the testpiece to 11 mm. The initial notch depth
is 9.1 mm which corresponds to a/W = 0.35. This allows a short precrack length to reach a
crack length of a/W = 0.4. Along the load line, two knife edges are machined to mount the
crack mouth opening displacement gauge. Tests were conducted on screw-driving servo-
electric testing machines following ASTM standard E1457-15. During the tests, a direct current
potential drop (d.c.p.d.) method was used to monitor the crack growth. A high temperature clip-
on gage was mounted onto the CT specimen to record crack mouth opening displacement
(CMOD) for C* calculation.
Figure 88 Drawing of compact tension testpiece (CT) for creep crack growth tests. The right graph shows how does an
extensometer is attached on to the testpiece.
When creep loading is terminated, two methods were used to finish the test. The first
method was to break open the testpiece by fatigue. In this case, two halves of failed testpiece
are obtained. The advantage of this method is that each half of the failed testpiece contains a
complete fracture surface. The other method was to cross-section the testpiece perpendicular
the crack plane along the middle of the CT testpiece using EDM wiring after creep loading
before breaking the sample into two halves. After sectioning, one of the two halves was broken
into two pieces to reveal the fracture surface. The other half remain in contact and the sectioned
surface was polished so that detailed mechanism study can be conducted around the crack tip
and crack path reserved in this section. Fractography and crack length measurement can be
conducted on the two broken pieces. Obviously, the advantage of this method is that more
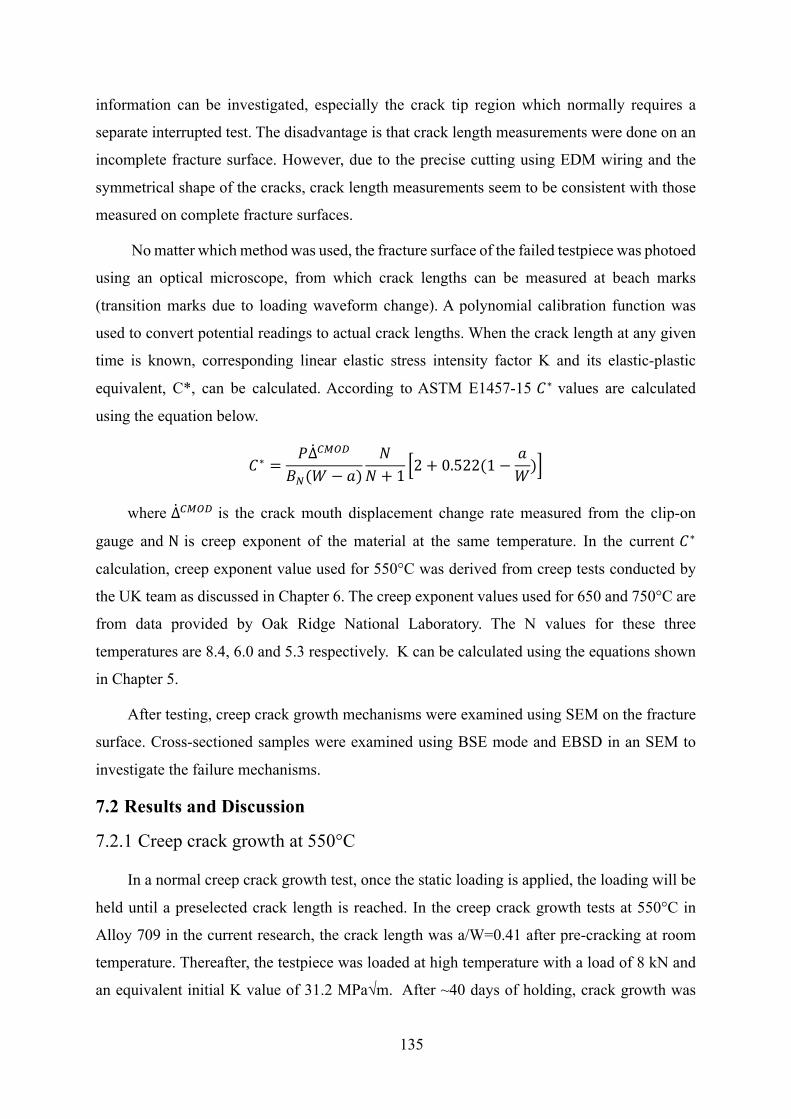
135
information can be investigated, especially the crack tip region which normally requires a
separate interrupted test. The disadvantage is that crack length measurements were done on an
incomplete fracture surface. However, due to the precise cutting using EDM wiring and the
symmetrical shape of the cracks, crack length measurements seem to be consistent with those
measured on complete fracture surfaces.
No matter which method was used, the fracture surface of the failed testpiece was photoed
using an optical microscope, from which crack lengths can be measured at beach marks
(transition marks due to loading waveform change). A polynomial calibration function was
used to convert potential readings to actual crack lengths. When the crack length at any given
time is known, corresponding linear elastic stress intensity factor K and its elastic-plastic
equivalent, C*, can be calculated. According to ASTM E1457-15 <∗ values are calculated
using the equation below.
<∗ =>ΔABCD
EF(G − H)I
I + 1K2 + 0.522(1 −
HG)P
where ΔABCD is the crack mouth displacement change rate measured from the clip-on
gauge and N is creep exponent of the material at the same temperature. In the current <∗
calculation, creep exponent value used for 550°C was derived from creep tests conducted by
the UK team as discussed in Chapter 6. The creep exponent values used for 650 and 750°C are
from data provided by Oak Ridge National Laboratory. The N values for these three
temperatures are 8.4, 6.0 and 5.3 respectively. K can be calculated using the equations shown
in Chapter 5.
After testing, creep crack growth mechanisms were examined using SEM on the fracture
surface. Cross-sectioned samples were examined using BSE mode and EBSD in an SEM to
investigate the failure mechanisms.
7.2 Results and Discussion
7.2.1 Creep crack growth at 550°C
In a normal creep crack growth test, once the static loading is applied, the loading will be
held until a preselected crack length is reached. In the creep crack growth tests at 550°C in
Alloy 709 in the current research, the crack length was a/W=0.41 after pre-cracking at room
temperature. Thereafter, the testpiece was loaded at high temperature with a load of 8 kN and
an equivalent initial K value of 31.2 MPa√m. After ~40 days of holding, crack growth was
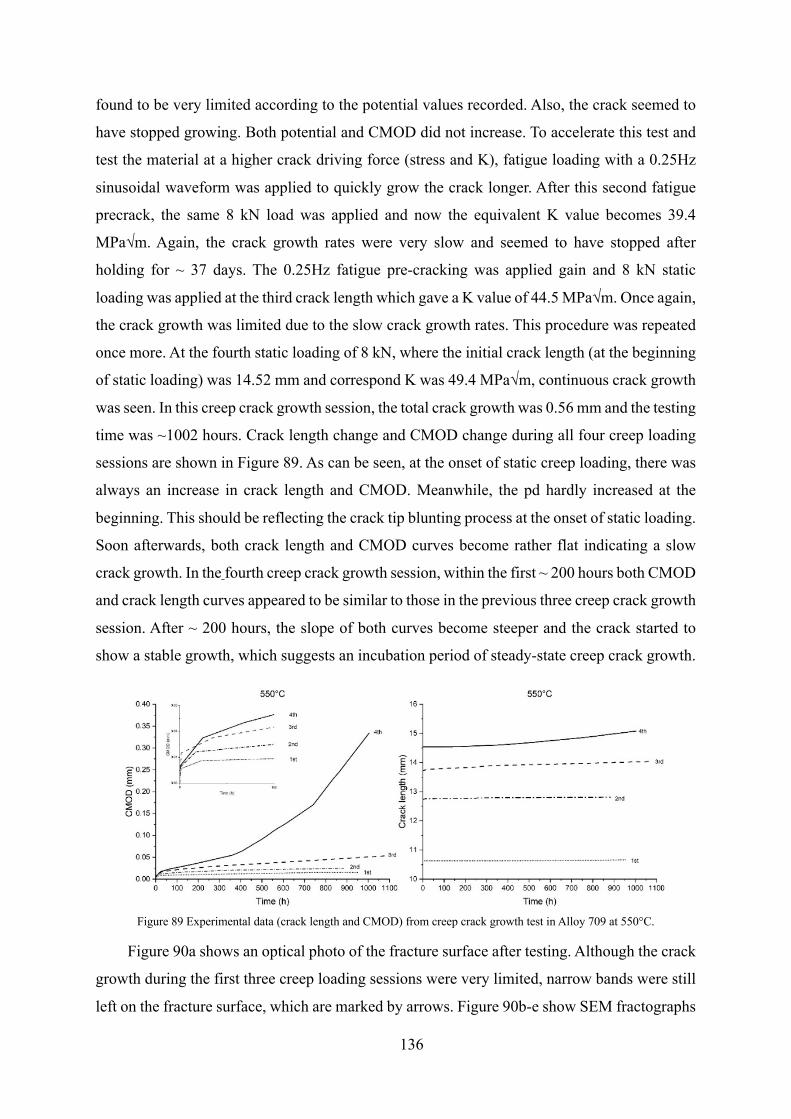
136
found to be very limited according to the potential values recorded. Also, the crack seemed to
have stopped growing. Both potential and CMOD did not increase. To accelerate this test and
test the material at a higher crack driving force (stress and K), fatigue loading with a 0.25Hz
sinusoidal waveform was applied to quickly grow the crack longer. After this second fatigue
precrack, the same 8 kN load was applied and now the equivalent K value becomes 39.4
MPa√m. Again, the crack growth rates were very slow and seemed to have stopped after
holding for ~ 37 days. The 0.25Hz fatigue pre-cracking was applied gain and 8 kN static
loading was applied at the third crack length which gave a K value of 44.5 MPa√m. Once again,
the crack growth was limited due to the slow crack growth rates. This procedure was repeated
once more. At the fourth static loading of 8 kN, where the initial crack length (at the beginning
of static loading) was 14.52 mm and correspond K was 49.4 MPa√m, continuous crack growth
was seen. In this creep crack growth session, the total crack growth was 0.56 mm and the testing
time was ~1002 hours. Crack length change and CMOD change during all four creep loading
sessions are shown in Figure 89. As can be seen, at the onset of static creep loading, there was
always an increase in crack length and CMOD. Meanwhile, the pd hardly increased at the
beginning. This should be reflecting the crack tip blunting process at the onset of static loading.
Soon afterwards, both crack length and CMOD curves become rather flat indicating a slow
crack growth. In the fourth creep crack growth session, within the first ~ 200 hours both CMOD
and crack length curves appeared to be similar to those in the previous three creep crack growth
session. After ~ 200 hours, the slope of both curves become steeper and the crack started to
show a stable growth, which suggests an incubation period of steady-state creep crack growth.
Figure 89 Experimental data (crack length and CMOD) from creep crack growth test in Alloy 709 at 550°C.
Figure 90a shows an optical photo of the fracture surface after testing. Although the crack
growth during the first three creep loading sessions were very limited, narrow bands were still
left on the fracture surface, which are marked by arrows. Figure 90b-e show SEM fractographs
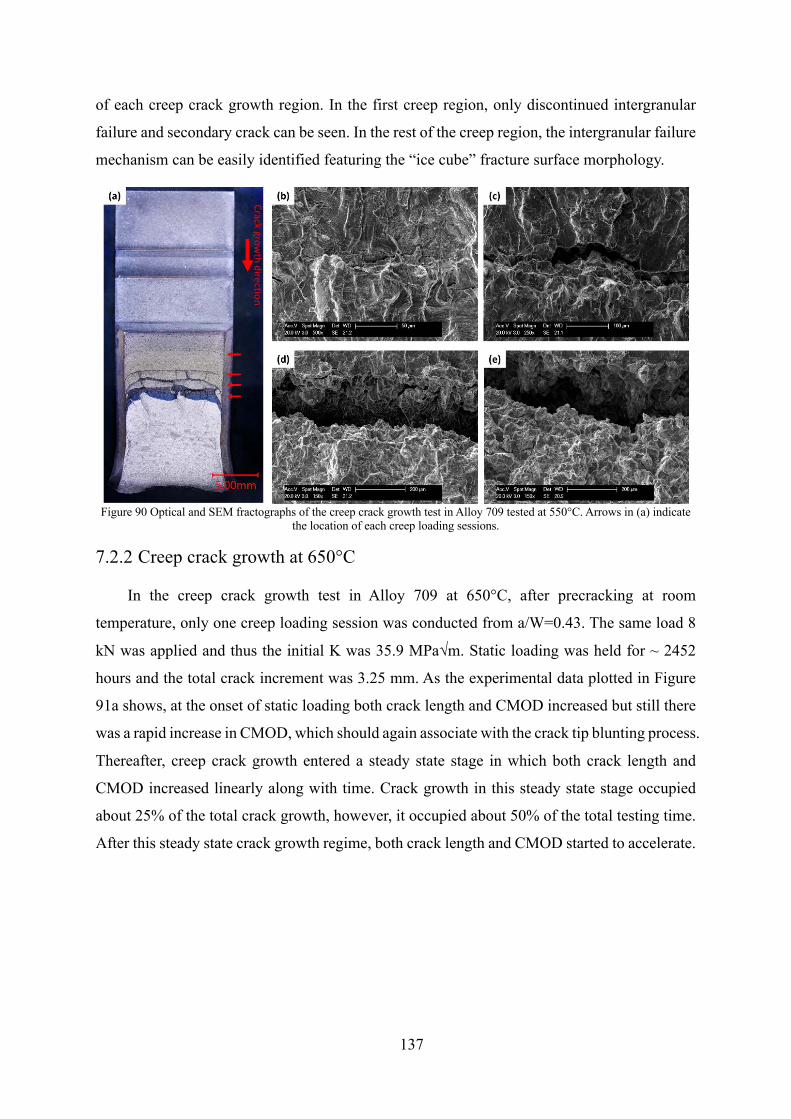
137
of each creep crack growth region. In the first creep region, only discontinued intergranular
failure and secondary crack can be seen. In the rest of the creep region, the intergranular failure
mechanism can be easily identified featuring the “ice cube” fracture surface morphology.
Figure 90 Optical and SEM fractographs of the creep crack growth test in Alloy 709 tested at 550°C. Arrows in (a) indicate
the location of each creep loading sessions.
7.2.2 Creep crack growth at 650°C
In the creep crack growth test in Alloy 709 at 650°C, after precracking at room
temperature, only one creep loading session was conducted from a/W=0.43. The same load 8
kN was applied and thus the initial K was 35.9 MPa√m. Static loading was held for ~ 2452
hours and the total crack increment was 3.25 mm. As the experimental data plotted in Figure
91a shows, at the onset of static loading both crack length and CMOD increased but still there
was a rapid increase in CMOD, which should again associate with the crack tip blunting process.
Thereafter, creep crack growth entered a steady state stage in which both crack length and
CMOD increased linearly along with time. Crack growth in this steady state stage occupied
about 25% of the total crack growth, however, it occupied about 50% of the total testing time.
After this steady state crack growth regime, both crack length and CMOD started to accelerate.
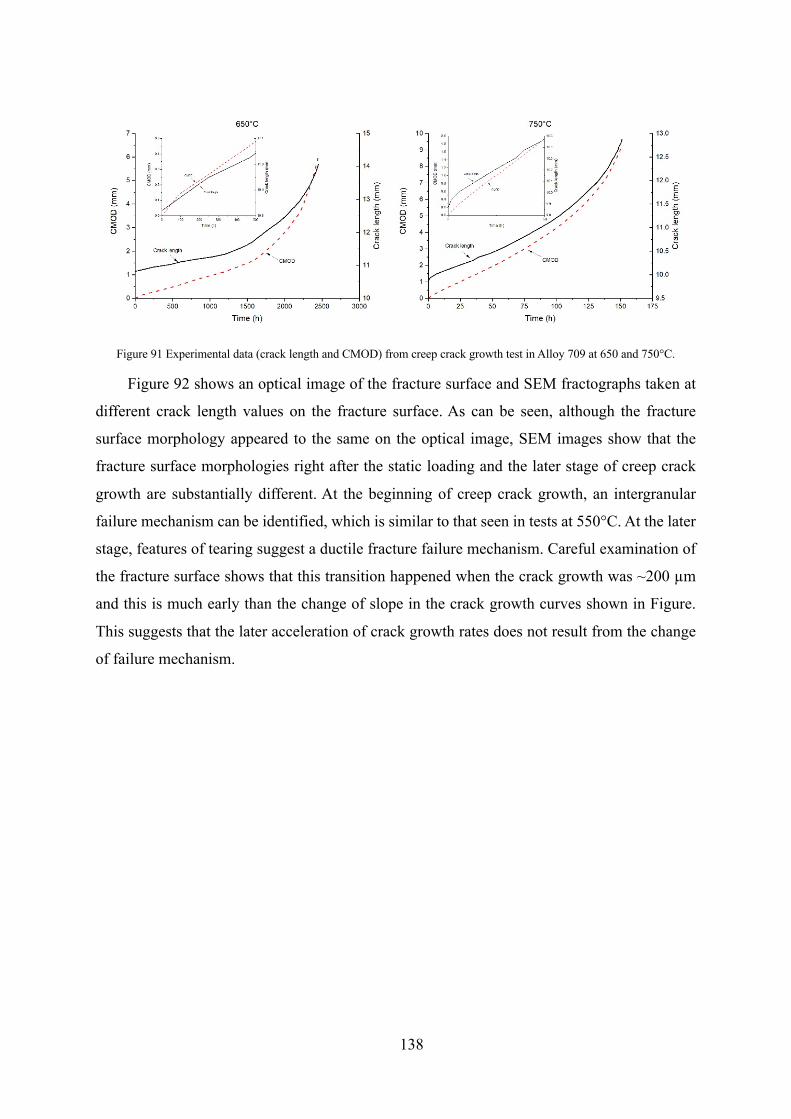
138
Figure 91 Experimental data (crack length and CMOD) from creep crack growth test in Alloy 709 at 650 and 750°C.
Figure 92 shows an optical image of the fracture surface and SEM fractographs taken at
different crack length values on the fracture surface. As can be seen, although the fracture
surface morphology appeared to the same on the optical image, SEM images show that the
fracture surface morphologies right after the static loading and the later stage of creep crack
growth are substantially different. At the beginning of creep crack growth, an intergranular
failure mechanism can be identified, which is similar to that seen in tests at 550°C. At the later
stage, features of tearing suggest a ductile fracture failure mechanism. Careful examination of
the fracture surface shows that this transition happened when the crack growth was ~200 µm
and this is much early than the change of slope in the crack growth curves shown in Figure.
This suggests that the later acceleration of crack growth rates does not result from the change
of failure mechanism.
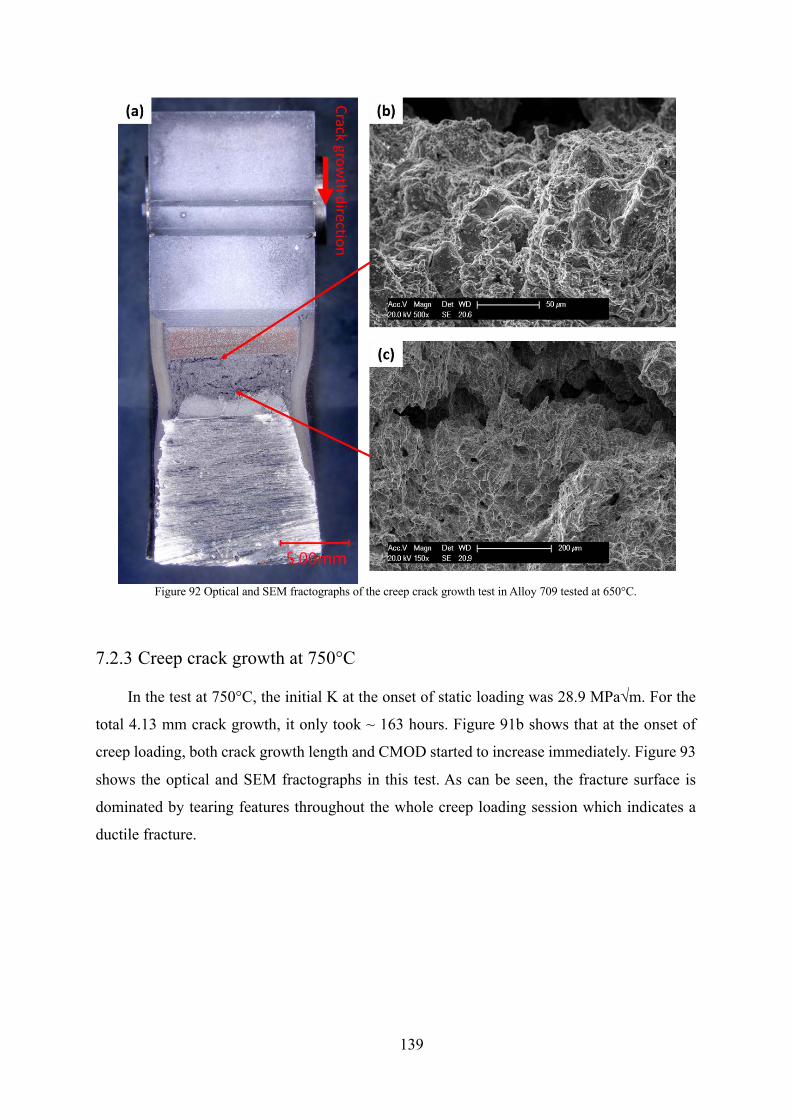
139
Figure 92 Optical and SEM fractographs of the creep crack growth test in Alloy 709 tested at 650°C.
7.2.3 Creep crack growth at 750°C
In the test at 750°C, the initial K at the onset of static loading was 28.9 MPa√m. For the
total 4.13 mm crack growth, it only took ~ 163 hours. Figure 91b shows that at the onset of
creep loading, both crack growth length and CMOD started to increase immediately. Figure 93
shows the optical and SEM fractographs in this test. As can be seen, the fracture surface is
dominated by tearing features throughout the whole creep loading session which indicates a
ductile fracture.
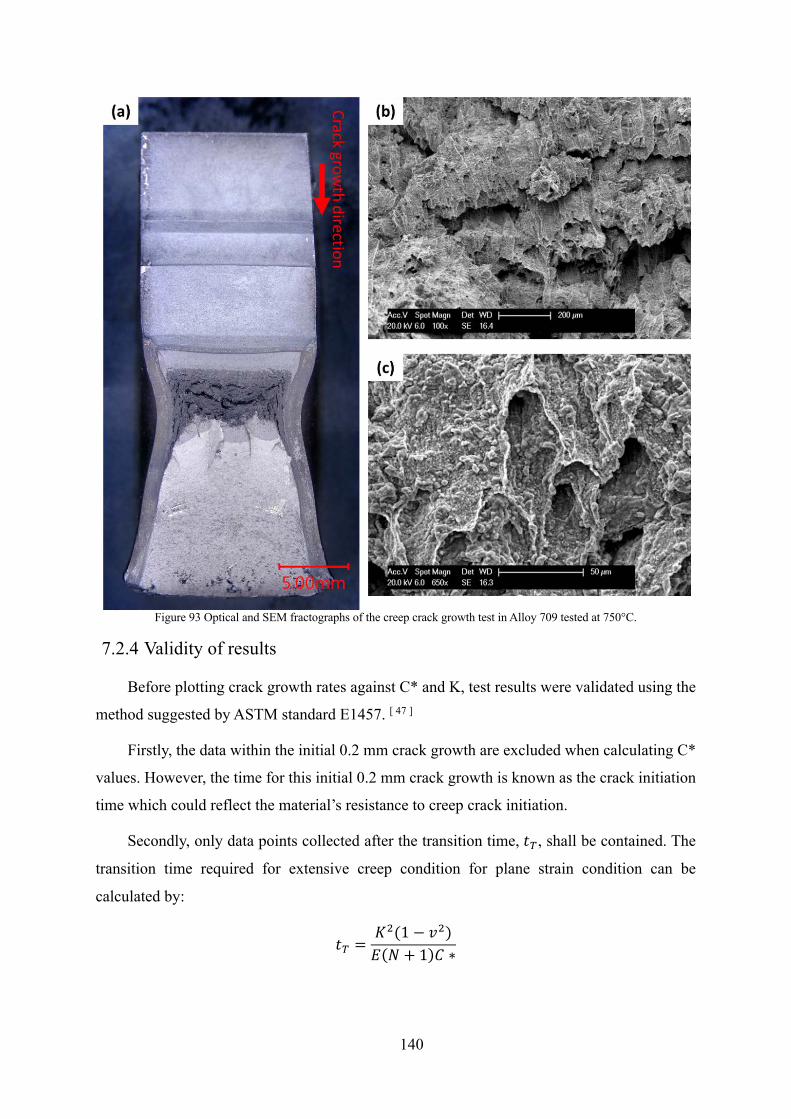
140
Figure 93 Optical and SEM fractographs of the creep crack growth test in Alloy 709 tested at 750°C.
7.2.4 Validity of results
Before plotting crack growth rates against C* and K, test results were validated using the
method suggested by ASTM standard E1457. [ 47 ]
Firstly, the data within the initial 0.2 mm crack growth are excluded when calculating C*
values. However, the time for this initial 0.2 mm crack growth is known as the crack initiation
time which could reflect the material’s resistance to creep crack initiation.
Secondly, only data points collected after the transition time, $9, shall be contained. The
transition time required for extensive creep condition for plane strain condition can be
calculated by:
$9 =RS(1 − TS)U(I + 1)< ∗
141
whereU is the elastic modulus and T is the Poisson’s ratio of the material. This equation
is used to calculate $9 for each C* value and $9is then the largest value of $9 in the entire data
set. By conducting this calculation, it is found that $9 may not have reached the maximum for
during the 1st, 2nd and 3rd creep in the test at 550°C. This means that an extensive creep
condition was established during these creep loading segments. Such a situation should result
from the limited time given and consequent limited crack growth. However, the 4th creep
segment was found to have reached extensive creep condition, so it was for the tests at 650 and
750°C.
Lastly, the validity of using C* is evaluated. The total crack mouth opening displacement
rate (∆) in a test contains an instantaneous elastic part, ∆W, and a time-dependent part ∆X. The
latter is associated with the accumulation of creep deformation. The elastic part can be derived
by:
∆W =HE>Y2RS
U′[
where H is crack growth rate, U′ is the elastic constraint modulus. For the plane strain
condition studies in this research, U′ equals to U/(1 − TS).
By using the equation described above, it is found that the contribution of elasticity to the
total CMOD is less than 10% in the test at 550°C and less than 3% in the tests at 650 and 750°C.
This means the majority of CMOD results from creep deformation. It also means that the small-
scale yielding assumption in the linear elastic fracture mechanics does not exist here in the
creep crack growth tests in the materials studied here. Therefore, C* shall be used to correlate
with the crack growth rates measured.
7.2.5 Creep crack growth resistance
Although the calculation above indicates that K is not valid for these two tests conducted,
a da/dt–K plot is still shown here in Figure 94 to compare with the da/dt–C* plots in Figure 95.
Note that in these plots, data prior $9 (extensive creep) are also shown but in different symbols.
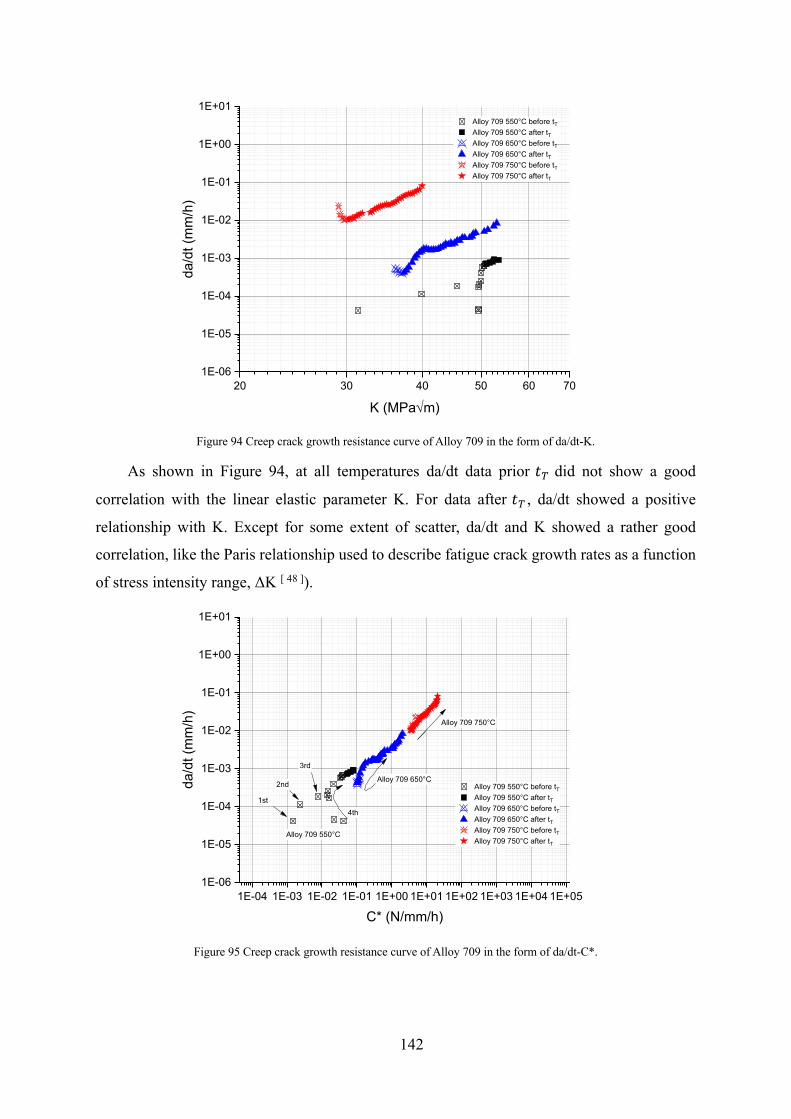
142
Figure 94 Creep crack growth resistance curve of Alloy 709 in the form of da/dt-K.
As shown in Figure 94, at all temperatures da/dt data prior $9 did not show a good
correlation with the linear elastic parameter K. For data after $9 , da/dt showed a positive
relationship with K. Except for some extent of scatter, da/dt and K showed a rather good
correlation, like the Paris relationship used to describe fatigue crack growth rates as a function
of stress intensity range, ΔK [ 48 ]).
Figure 95 Creep crack growth resistance curve of Alloy 709 in the form of da/dt-C*.
20 30 40 50 60 701E-06
1E-05
1E-04
1E-03
1E-02
1E-01
1E+00
1E+01
da/d
t (m
m/h
)
K (MPaÖm)
Alloy 709 550°C before tT Alloy 709 550°C after tT Alloy 709 650°C before tT Alloy 709 650°C after tT Alloy 709 750°C before tT Alloy 709 750°C after tT
1E-04 1E-03 1E-02 1E-01 1E+00 1E+01 1E+02 1E+03 1E+04 1E+051E-06
1E-05
1E-04
1E-03
1E-02
1E-01
1E+00
1E+01
Alloy 709 750°C
Alloy 709 650°C
4th
2nd
3rd
da/d
t (m
m/h
)
C* (N/mm/h)
Alloy 709 550°C before tT Alloy 709 550°C after tT Alloy 709 650°C before tT Alloy 709 650°C after tT Alloy 709 750°C before tT Alloy 709 750°C after tT
1st
Alloy 709 550°C
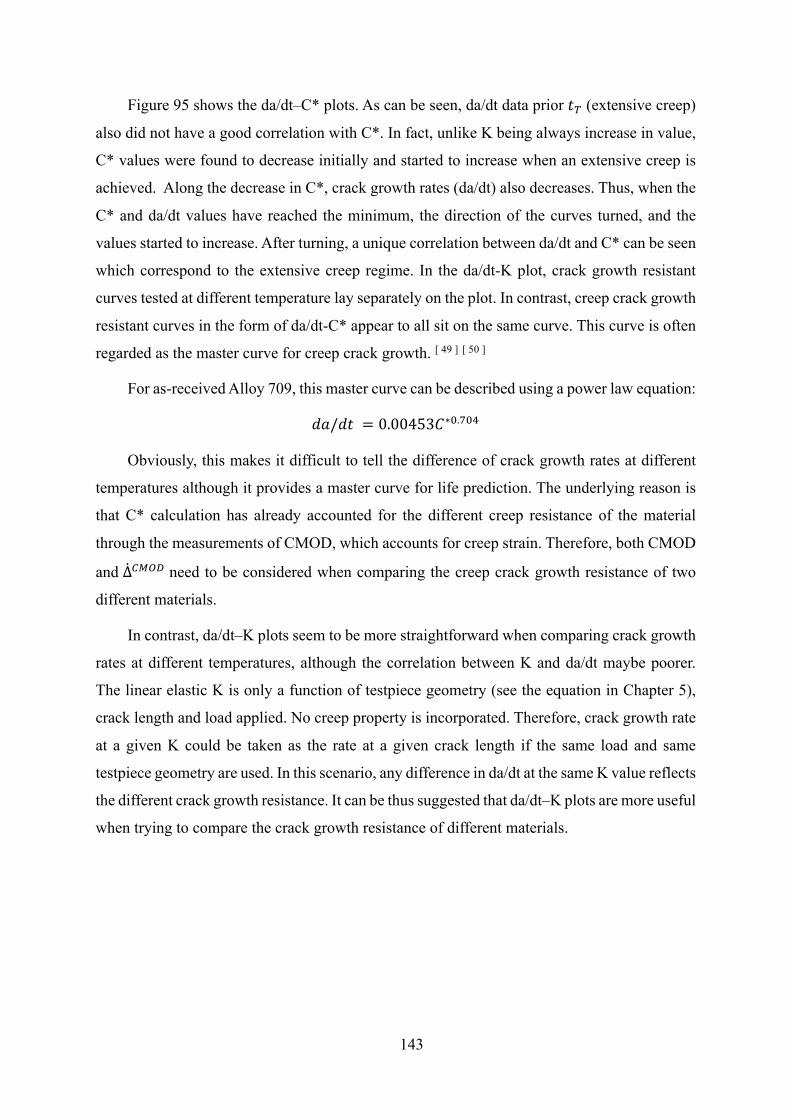
143
Figure 95 shows the da/dt–C* plots. As can be seen, da/dt data prior $9 (extensive creep)
also did not have a good correlation with C*. In fact, unlike K being always increase in value,
C* values were found to decrease initially and started to increase when an extensive creep is
achieved. Along the decrease in C*, crack growth rates (da/dt) also decreases. Thus, when the
C* and da/dt values have reached the minimum, the direction of the curves turned, and the
values started to increase. After turning, a unique correlation between da/dt and C* can be seen
which correspond to the extensive creep regime. In the da/dt-K plot, crack growth resistant
curves tested at different temperature lay separately on the plot. In contrast, creep crack growth
resistant curves in the form of da/dt-C* appear to all sit on the same curve. This curve is often
regarded as the master curve for creep crack growth. [ 49 ] [ 50 ]
For as-received Alloy 709, this master curve can be described using a power law equation:
!H/!$ = 0.00453<∗^._^`
Obviously, this makes it difficult to tell the difference of crack growth rates at different
temperatures although it provides a master curve for life prediction. The underlying reason is
that C* calculation has already accounted for the different creep resistance of the material
through the measurements of CMOD, which accounts for creep strain. Therefore, both CMOD
and ΔABCD need to be considered when comparing the creep crack growth resistance of two
different materials.
In contrast, da/dt–K plots seem to be more straightforward when comparing crack growth
rates at different temperatures, although the correlation between K and da/dt maybe poorer.
The linear elastic K is only a function of testpiece geometry (see the equation in Chapter 5),
crack length and load applied. No creep property is incorporated. Therefore, crack growth rate
at a given K could be taken as the rate at a given crack length if the same load and same
testpiece geometry are used. In this scenario, any difference in da/dt at the same K value reflects
the different crack growth resistance. It can be thus suggested that da/dt–K plots are more useful
when trying to compare the crack growth resistance of different materials.

144
8 High temperature fatigue crack growth in Alloy709
(The results presented in this chapter is in process to be submitted as a journal
article:
Authors: Suyang Yu, Jin Yan, Rengen Ding, Hangyue Li, Afsaneh Rabiei and
Paul Bowen.
Title- “Fatigue crack growth of an advanced austenitic stainless steel for nuclear
application” To be submitted.)
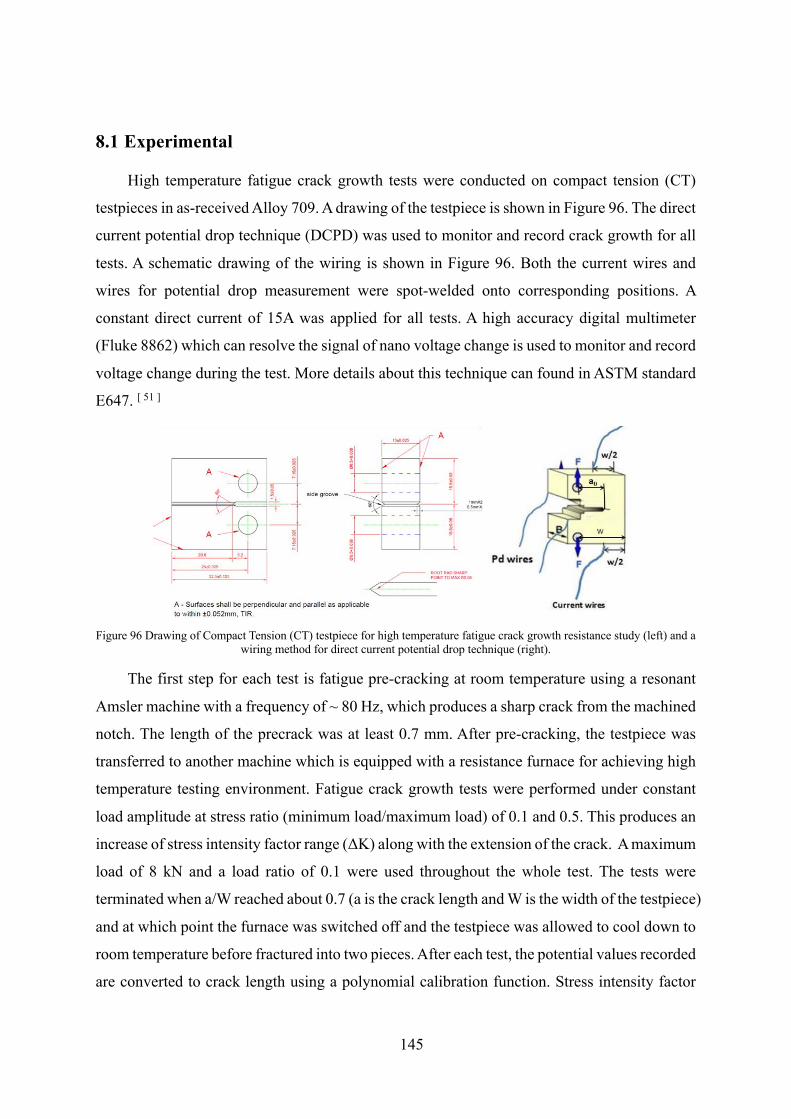
145
8.1 Experimental
High temperature fatigue crack growth tests were conducted on compact tension (CT)
testpieces in as-received Alloy 709. A drawing of the testpiece is shown in Figure 96. The direct
current potential drop technique (DCPD) was used to monitor and record crack growth for all
tests. A schematic drawing of the wiring is shown in Figure 96. Both the current wires and
wires for potential drop measurement were spot-welded onto corresponding positions. A
constant direct current of 15A was applied for all tests. A high accuracy digital multimeter
(Fluke 8862) which can resolve the signal of nano voltage change is used to monitor and record
voltage change during the test. More details about this technique can found in ASTM standard
E647. [ 51 ]
Figure 96 Drawing of Compact Tension (CT) testpiece for high temperature fatigue crack growth resistance study (left) and a
wiring method for direct current potential drop technique (right).
The first step for each test is fatigue pre-cracking at room temperature using a resonant
Amsler machine with a frequency of ~ 80 Hz, which produces a sharp crack from the machined
notch. The length of the precrack was at least 0.7 mm. After pre-cracking, the testpiece was
transferred to another machine which is equipped with a resistance furnace for achieving high
temperature testing environment. Fatigue crack growth tests were performed under constant
load amplitude at stress ratio (minimum load/maximum load) of 0.1 and 0.5. This produces an
increase of stress intensity factor range (ΔK) along with the extension of the crack. A maximum
load of 8 kN and a load ratio of 0.1 were used throughout the whole test. The tests were
terminated when a/W reached about 0.7 (a is the crack length and W is the width of the testpiece)
and at which point the furnace was switched off and the testpiece was allowed to cool down to
room temperature before fractured into two pieces. After each test, the potential values recorded
are converted to crack length using a polynomial calibration function. Stress intensity factor
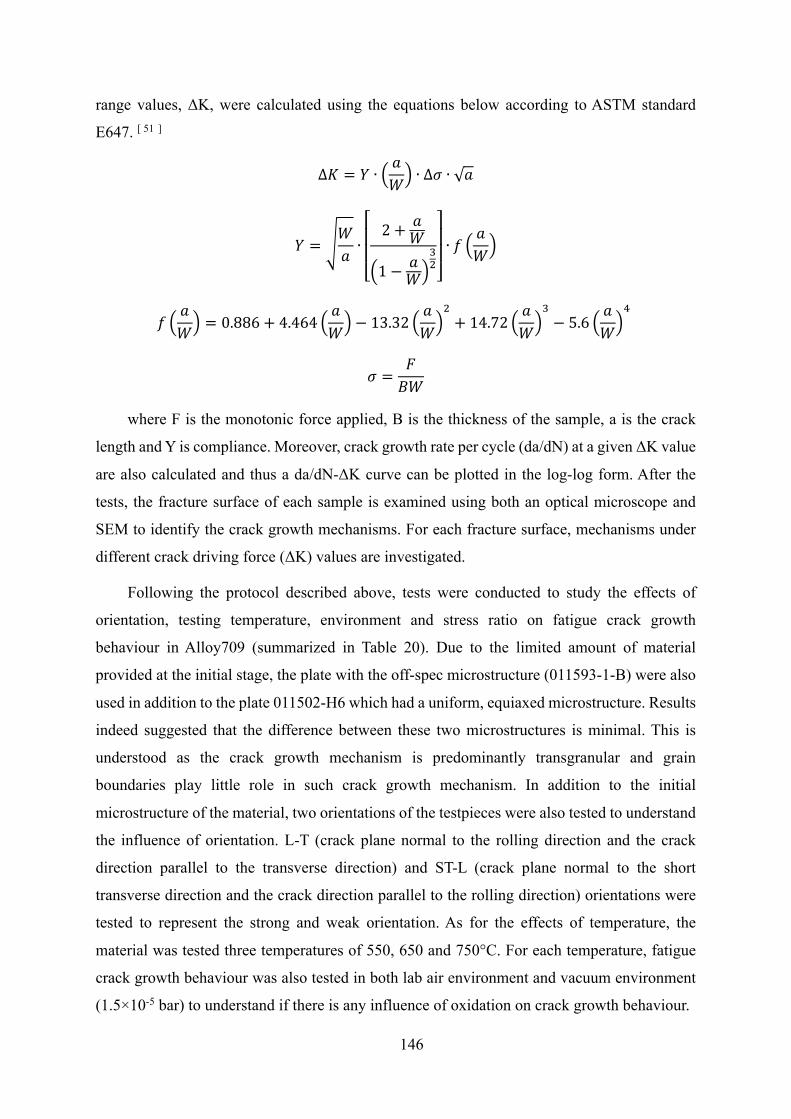
146
range values, ΔK, were calculated using the equations below according to ASTM standard
E647. [ 51 ]
∆R = a ∙ cHGd ∙ ∆' ∙ √H
a = fGH∙
⎣⎢⎢⎡ 2 + H
G
c1 −HGd
jS⎦⎥⎥⎤∙ n c
HGd
n cHGd = 0.886 + 4.464 c
HGd − 13.32 c
HGdS+ 14.72 c
HGdj− 5.6 c
HGd`
' =rEG
where F is the monotonic force applied, B is the thickness of the sample, a is the crack
length and Y is compliance. Moreover, crack growth rate per cycle (da/dN) at a given ΔK value
are also calculated and thus a da/dN-ΔK curve can be plotted in the log-log form. After the
tests, the fracture surface of each sample is examined using both an optical microscope and
SEM to identify the crack growth mechanisms. For each fracture surface, mechanisms under
different crack driving force (ΔK) values are investigated.
Following the protocol described above, tests were conducted to study the effects of
orientation, testing temperature, environment and stress ratio on fatigue crack growth
behaviour in Alloy709 (summarized in Table 20). Due to the limited amount of material
provided at the initial stage, the plate with the off-spec microstructure (011593-1-B) were also
used in addition to the plate 011502-H6 which had a uniform, equiaxed microstructure. Results
indeed suggested that the difference between these two microstructures is minimal. This is
understood as the crack growth mechanism is predominantly transgranular and grain
boundaries play little role in such crack growth mechanism. In addition to the initial
microstructure of the material, two orientations of the testpieces were also tested to understand
the influence of orientation. L-T (crack plane normal to the rolling direction and the crack
direction parallel to the transverse direction) and ST-L (crack plane normal to the short
transverse direction and the crack direction parallel to the rolling direction) orientations were
tested to represent the strong and weak orientation. As for the effects of temperature, the
material was tested three temperatures of 550, 650 and 750°C. For each temperature, fatigue
crack growth behaviour was also tested in both lab air environment and vacuum environment
(1.5×10⁻⁵ bar) to understand if there is any influence of oxidation on crack growth behaviour.
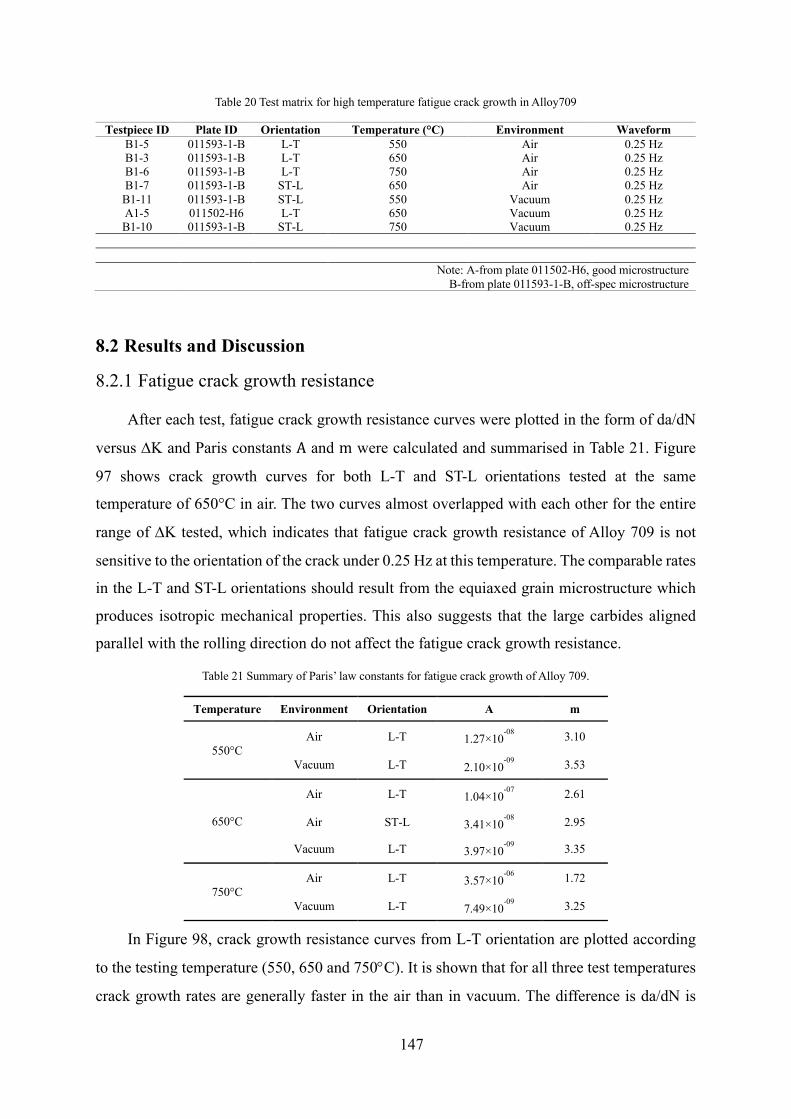
147
Table 20 Test matrix for high temperature fatigue crack growth in Alloy709
Testpiece ID Plate ID Orientation Temperature (°C) Environment Waveform B1-5 011593-1-B L-T 550 Air 0.25 Hz B1-3 011593-1-B L-T 650 Air 0.25 Hz B1-6 011593-1-B L-T 750 Air 0.25 Hz B1-7 011593-1-B ST-L 650 Air 0.25 Hz B1-11 011593-1-B ST-L 550 Vacuum 0.25 Hz A1-5 011502-H6 L-T 650 Vacuum 0.25 Hz B1-10 011593-1-B ST-L 750 Vacuum 0.25 Hz
Note: A-from plate 011502-H6, good microstructure B-from plate 011593-1-B, off-spec microstructure
8.2 Results and Discussion
8.2.1 Fatigue crack growth resistance
After each test, fatigue crack growth resistance curves were plotted in the form of da/dN
versus DK and Paris constants A and m were calculated and summarised in Table 21. Figure
97 shows crack growth curves for both L-T and ST-L orientations tested at the same
temperature of 650°C in air. The two curves almost overlapped with each other for the entire
range of DK tested, which indicates that fatigue crack growth resistance of Alloy 709 is not
sensitive to the orientation of the crack under 0.25 Hz at this temperature. The comparable rates
in the L-T and ST-L orientations should result from the equiaxed grain microstructure which
produces isotropic mechanical properties. This also suggests that the large carbides aligned
parallel with the rolling direction do not affect the fatigue crack growth resistance.
Table 21 Summary of Paris’ law constants for fatigue crack growth of Alloy 709.
Temperature Environment Orientation A m
550°C Air L-T 1.27×10
-08 3.10
Vacuum L-T 2.10×10-09
3.53
650°C
Air L-T 1.04×10-07
2.61
Air ST-L 3.41×10-08
2.95
Vacuum L-T 3.97×10-09
3.35
750°C Air L-T 3.57×10
-06 1.72
Vacuum L-T 7.49×10-09
3.25
In Figure 98, crack growth resistance curves from L-T orientation are plotted according
to the testing temperature (550, 650 and 750°C). It is shown that for all three test temperatures
crack growth rates are generally faster in the air than in vacuum. The difference is da/dN is
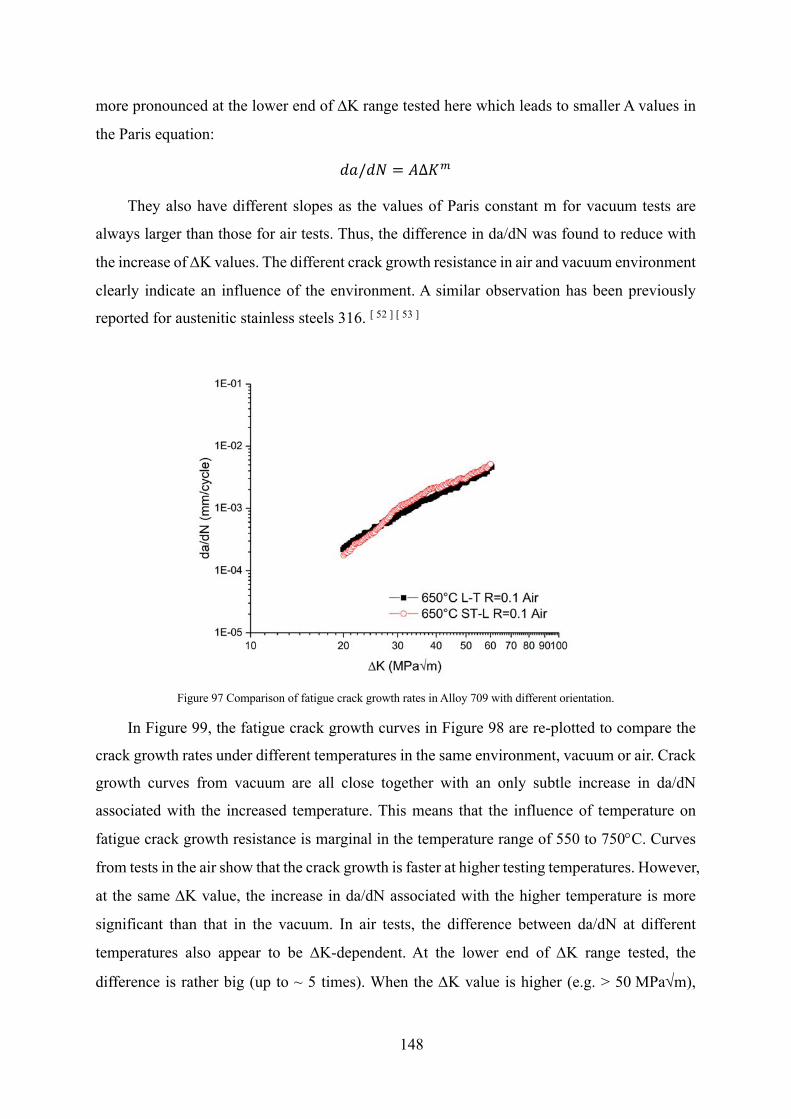
148
more pronounced at the lower end of DK range tested here which leads to smaller A values in
the Paris equation:
!H/!I = &∆Ru
They also have different slopes as the values of Paris constant m for vacuum tests are
always larger than those for air tests. Thus, the difference in da/dN was found to reduce with
the increase of DK values. The different crack growth resistance in air and vacuum environment
clearly indicate an influence of the environment. A similar observation has been previously
reported for austenitic stainless steels 316. [ 52 ] [ 53 ]
Figure 97 Comparison of fatigue crack growth rates in Alloy 709 with different orientation.
In Figure 99, the fatigue crack growth curves in Figure 98 are re-plotted to compare the
crack growth rates under different temperatures in the same environment, vacuum or air. Crack
growth curves from vacuum are all close together with an only subtle increase in da/dN
associated with the increased temperature. This means that the influence of temperature on
fatigue crack growth resistance is marginal in the temperature range of 550 to 750°C. Curves
from tests in the air show that the crack growth is faster at higher testing temperatures. However,
at the same DK value, the increase in da/dN associated with the higher temperature is more
significant than that in the vacuum. In air tests, the difference between da/dN at different
temperatures also appear to be DK-dependent. At the lower end of DK range tested, the
difference is rather big (up to ~ 5 times). When the DK value is higher (e.g. > 50 MPaÖm),
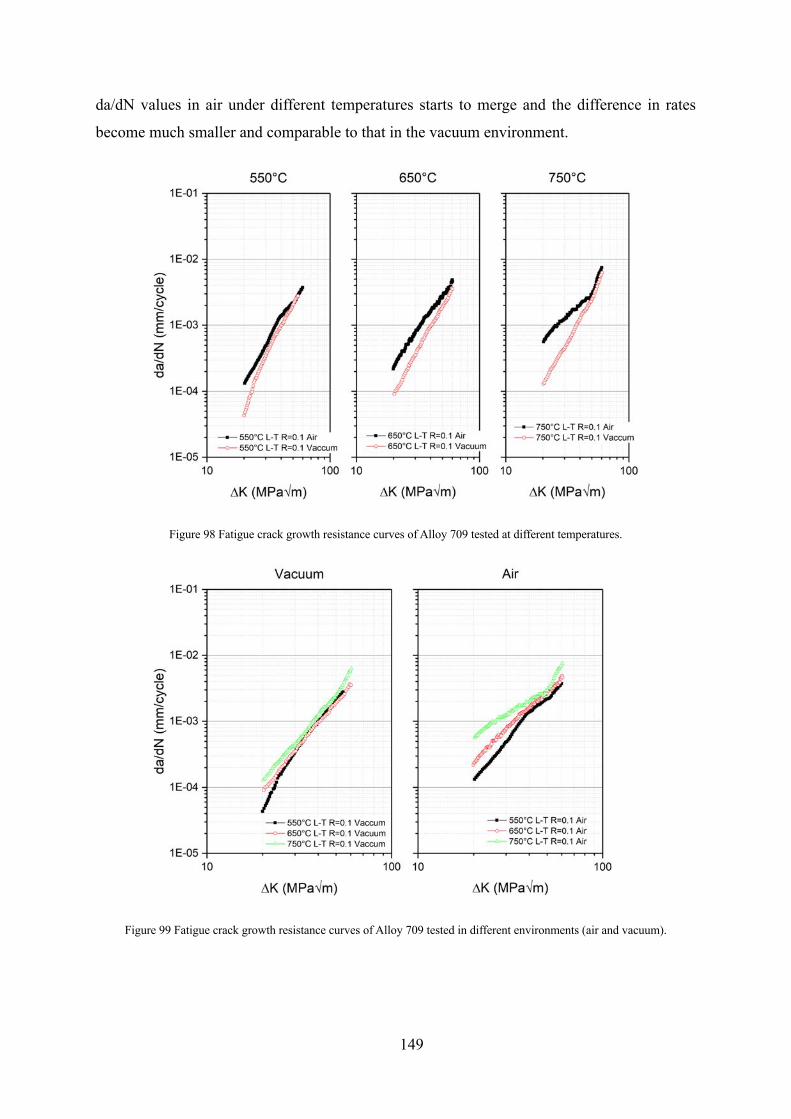
149
da/dN values in air under different temperatures starts to merge and the difference in rates
become much smaller and comparable to that in the vacuum environment.
Figure 98 Fatigue crack growth resistance curves of Alloy 709 tested at different temperatures.
Figure 99 Fatigue crack growth resistance curves of Alloy 709 tested in different environments (air and vacuum).
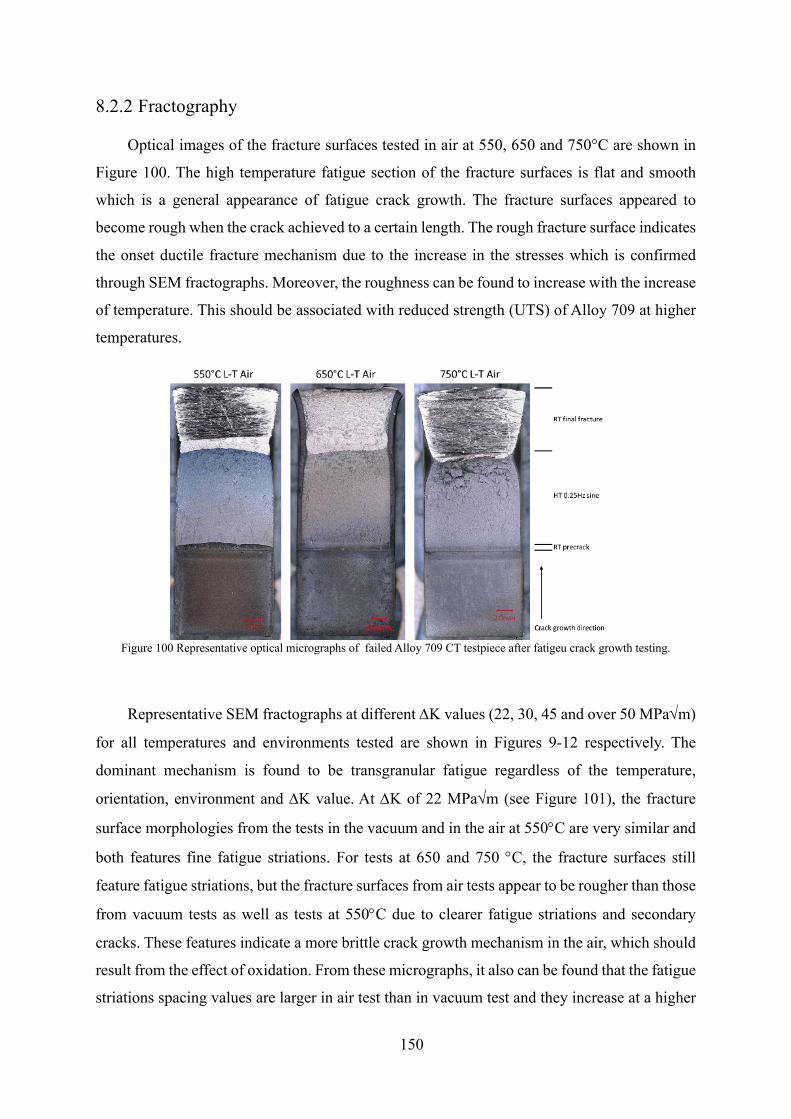
150
8.2.2 Fractography
Optical images of the fracture surfaces tested in air at 550, 650 and 750°C are shown in
Figure 100. The high temperature fatigue section of the fracture surfaces is flat and smooth
which is a general appearance of fatigue crack growth. The fracture surfaces appeared to
become rough when the crack achieved to a certain length. The rough fracture surface indicates
the onset ductile fracture mechanism due to the increase in the stresses which is confirmed
through SEM fractographs. Moreover, the roughness can be found to increase with the increase
of temperature. This should be associated with reduced strength (UTS) of Alloy 709 at higher
temperatures.
Figure 100 Representative optical micrographs of failed Alloy 709 CT testpiece after fatigeu crack growth testing.
Representative SEM fractographs at different DK values (22, 30, 45 and over 50 MPaÖm)
for all temperatures and environments tested are shown in Figures 9-12 respectively. The
dominant mechanism is found to be transgranular fatigue regardless of the temperature,
orientation, environment and DK value. At DK of 22 MPaÖm (see Figure 101), the fracture
surface morphologies from the tests in the vacuum and in the air at 550°C are very similar and
both features fine fatigue striations. For tests at 650 and 750 °C, the fracture surfaces still
feature fatigue striations, but the fracture surfaces from air tests appear to be rougher than those
from vacuum tests as well as tests at 550°C due to clearer fatigue striations and secondary
cracks. These features indicate a more brittle crack growth mechanism in the air, which should
result from the effect of oxidation. From these micrographs, it also can be found that the fatigue
striations spacing values are larger in air test than in vacuum test and they increase at a higher
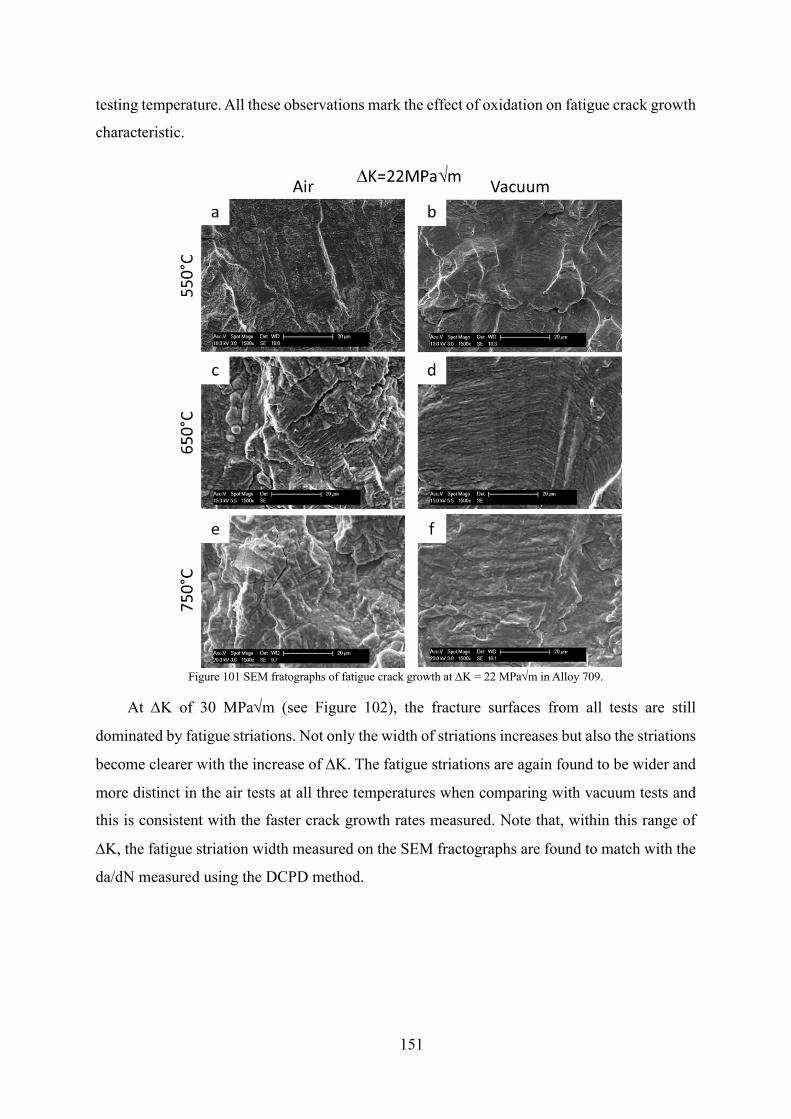
151
testing temperature. All these observations mark the effect of oxidation on fatigue crack growth
characteristic.
Figure 101 SEM fratographs of fatigue crack growth at DK = 22 MPaÖm in Alloy 709.
At DK of 30 MPaÖm (see Figure 102), the fracture surfaces from all tests are still
dominated by fatigue striations. Not only the width of striations increases but also the striations
become clearer with the increase of DK. The fatigue striations are again found to be wider and
more distinct in the air tests at all three temperatures when comparing with vacuum tests and
this is consistent with the faster crack growth rates measured. Note that, within this range of
DK, the fatigue striation width measured on the SEM fractographs are found to match with the
da/dN measured using the DCPD method.
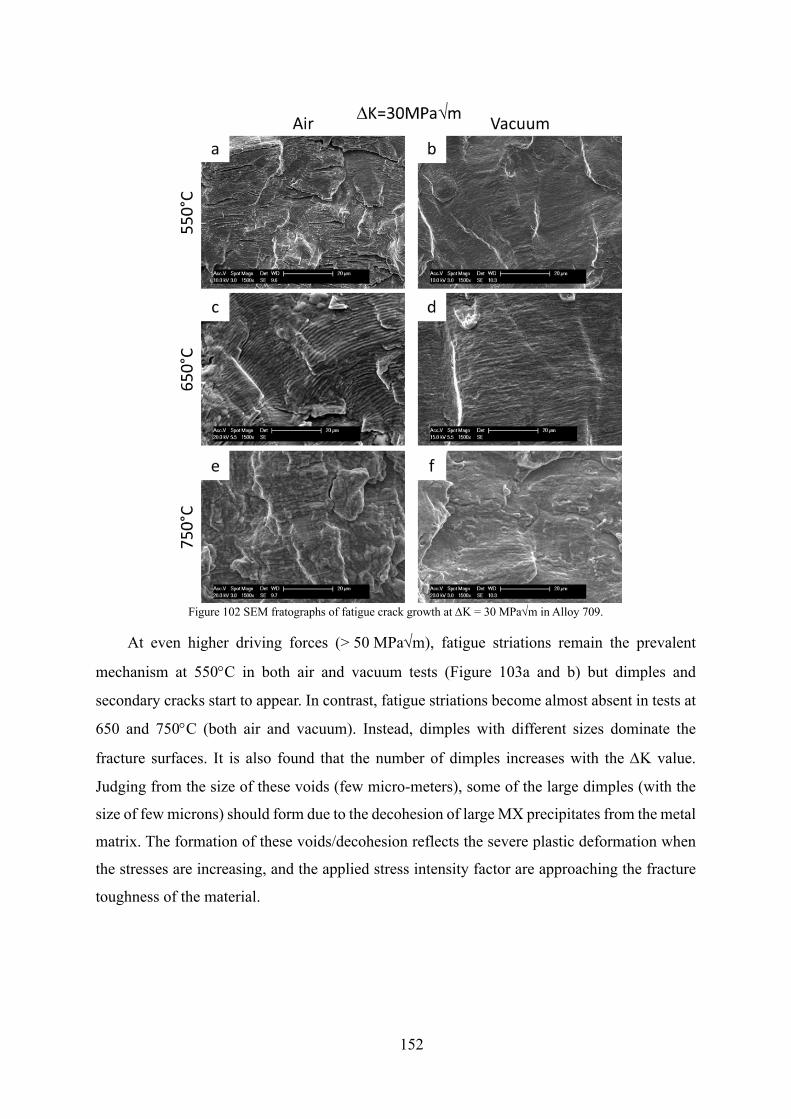
152
Figure 102 SEM fratographs of fatigue crack growth at DK = 30 MPaÖm in Alloy 709.
At even higher driving forces (> 50 MPaÖm), fatigue striations remain the prevalent
mechanism at 550°C in both air and vacuum tests (Figure 103a and b) but dimples and
secondary cracks start to appear. In contrast, fatigue striations become almost absent in tests at
650 and 750°C (both air and vacuum). Instead, dimples with different sizes dominate the
fracture surfaces. It is also found that the number of dimples increases with the DK value.
Judging from the size of these voids (few micro-meters), some of the large dimples (with the
size of few microns) should form due to the decohesion of large MX precipitates from the metal
matrix. The formation of these voids/decohesion reflects the severe plastic deformation when
the stresses are increasing, and the applied stress intensity factor are approaching the fracture
toughness of the material.
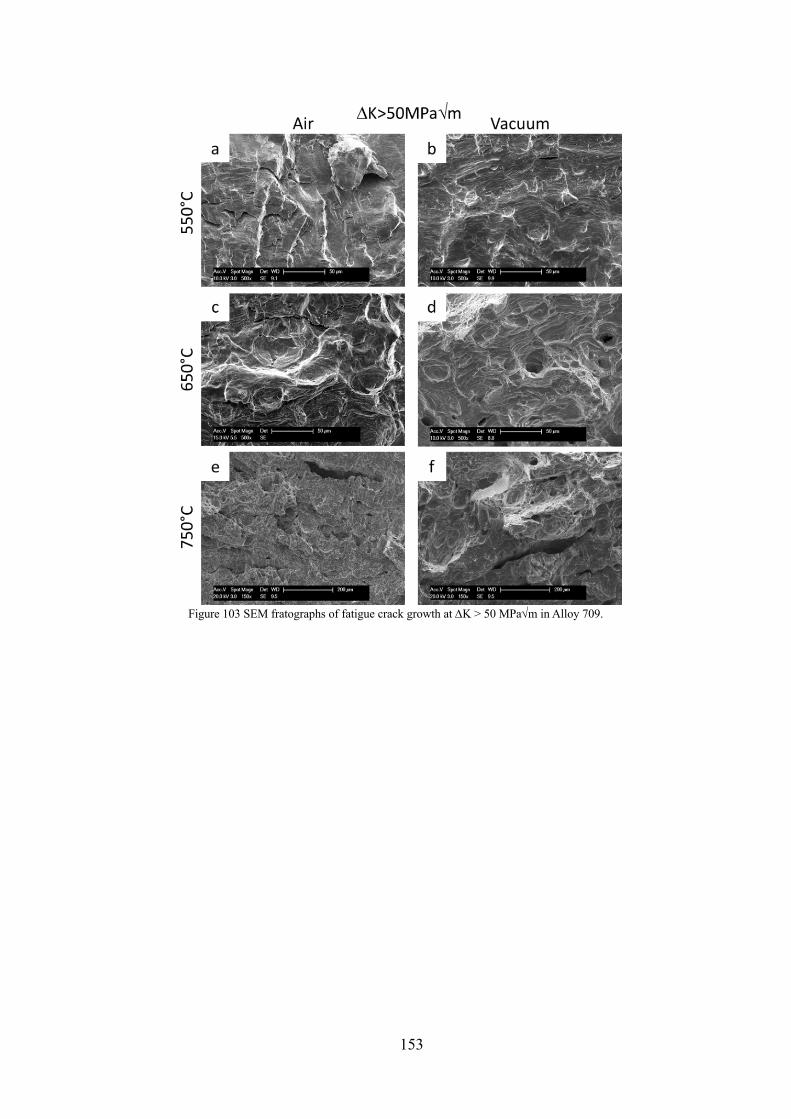
153
Figure 103 SEM fratographs of fatigue crack growth at DK > 50 MPaÖm in Alloy 709.
154
9 Creep-Fatigue crack growth behaviour of Alloy 709 under
various dwell times using in Situ SEM
(The results presented in this chapter has been submitted to Material Science and
Engineering A for publication.
Authors: Amrita Lall, Siddhartha Sarkar, Rengen Ding, Paul Bowen and Afsaneh Rabiei
Title: “Performance of alloy 709 under Creep-Fatigue at Various Dwell Times”,
submitted.)
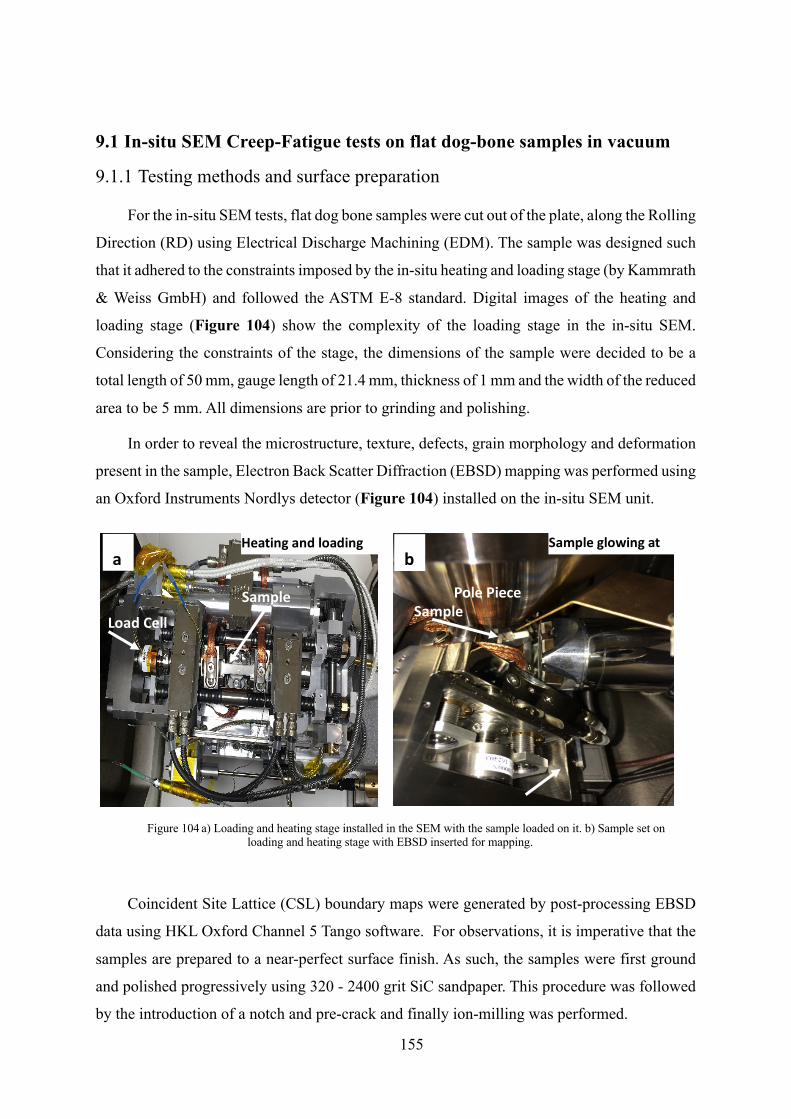
155
9.1 In-situ SEM Creep-Fatigue tests on flat dog-bone samples in vacuum
9.1.1 Testing methods and surface preparation
For the in-situ SEM tests, flat dog bone samples were cut out of the plate, along the Rolling
Direction (RD) using Electrical Discharge Machining (EDM). The sample was designed such
that it adhered to the constraints imposed by the in-situ heating and loading stage (by Kammrath
& Weiss GmbH) and followed the ASTM E-8 standard. Digital images of the heating and
loading stage (Figure 104) show the complexity of the loading stage in the in-situ SEM.
Considering the constraints of the stage, the dimensions of the sample were decided to be a
total length of 50 mm, gauge length of 21.4 mm, thickness of 1 mm and the width of the reduced
area to be 5 mm. All dimensions are prior to grinding and polishing.
In order to reveal the microstructure, texture, defects, grain morphology and deformation
present in the sample, Electron Back Scatter Diffraction (EBSD) mapping was performed using
an Oxford Instruments Nordlys detector (Figure 104) installed on the in-situ SEM unit.
Coincident Site Lattice (CSL) boundary maps were generated by post-processing EBSD
data using HKL Oxford Channel 5 Tango software. For observations, it is imperative that the
samples are prepared to a near-perfect surface finish. As such, the samples were first ground
and polished progressively using 320 - 2400 grit SiC sandpaper. This procedure was followed
by the introduction of a notch and pre-crack and finally ion-milling was performed.
Load Cell
Heating and loading Stage
Sample glowing at 750 C
Pole Piece Sample
Sample
EBSD
a b
Figure 104 a) Loading and heating stage installed in the SEM with the sample loaded on it. b) Sample set on loading and heating stage with EBSD inserted for mapping.
156
A small notch of 0.7-0.85 mm (Table 22) was introduced by machining followed by a pre-crack
that was introduced at the tip of the notch using high frequency cyclic loading at room
temperature. The length of the complete starter pre-crack with the notch varied between 1.1-
1.3 mm for different samples (Table 22).
Following grinding, polishing and introduction of the notch and pre-crack, the sample
surface was ion-milled to achieve the required surface finish for EBSD mapping. Samples
were ion milled at 60° for 6 minutes and then at 80° for 10 minutes. This resulted in acceptable
grain contrast and no surface topography. This protocol was utilized for all samples tested with
the in-situ SEM loading and heating stage.
In preliminary in-situ experiments, it was observed that an oxide layer formed over the
surface of the sample at high temperatures. This affected the surface finish of the sample and
the potential for precise EBSD mapping. To address this issue, samples were sputter-coated
with a very thin layer (3.85 nm) of Au-Pd. This is selected as the optimum layer of thickness
that would protect the surface against oxidation, during exposure to elevated temperatures
inside the SEM, while at the same time not impeding the EBSD acquisition.
Since these tests took at least 3 to 4 weeks, and in some cases a few months, of exposure
to high temperature, the samples were still able to develop a thin layer of oxide on their surface.
Therefore, it was decided to purge the chamber with 99.999% pure Nitrogen gas. After loading
the sample on the stage, the SEM chamber was purged with Nitrogen for 2-2.5 hours. This was
followed by evacuating the chamber to vacuum state for 30 minutes before the loading and
heating started. The problem of surface oxidation was resolved after Nitrogen purging and the
platinum sputter-coating technique was discontinued in later tests (Table 22).
9.1.2 In-Situ SEM Observation
The heating-loading stage (Kammrath & Weiss GmbH) is mounted in the SEM (Hitachi
SU3500) chamber and can uni-axially load the sample up to a load of 10 kN while heating it
up to 1000C. The stage is fitted with a load cell having a maximum load capacity of 10,000 N.
Samples are loaded by means of leadscrews. The front and the rear yokes move along the
leadscrew simultaneously upon loading, ensuring both sides of the samples are loaded equally
and to keep the same area in view during loading. Elongation of the sample is measured using
the gauge mounted on one side of the stage. The elongation gauge is a linear variable
differential transformer (LVDT) and the output is recorded live and displayed on the DDS
software. The heater is a ceramic plate underneath the centre of the tensile specimen (Figure
157
104) that can be controlled via the Heater Controller either manually or by the DDS software.
A Molybdenum heater cover is used to protect the ceramic heater and provide good thermal
contact between the heater and the sample during the experiment. To ensure complete contact
with the heater always, a Pt foil is folded and placed between the sample and the heater cover.
The displacement rate can be adjusted on the motor control settings in the DDS software and
can range from 0.1 to 20 μm/s.
The heating of a sample is performed in steps, where the temperature is progressively
increased at 25 °C/min, while holding the load constant at 25N. First, the sample is heated to
100˚C to outgas any water vapor, then to 300˚C to outgas any organic solvents and finally it is
heated to the target temperature. This slow heating rate eliminates the possibility of thermal
shock, which can induce residual stresses within the sample and the components of the stage
itself. The pre-load of 25N ensures that the sample is always under light tensile loading and
prevents its buckling.
For EBSD acquisition, the sample surface needs to be at a 70° tilt. To arrive at this tilt
angle, the samples are loaded at a pre-tilt angle of 20° by tilting the loading clamps on the stage.
The SEM stage angle is then set to 50° to rotate the entire loading stage and arrive at a total
angle of 70°. The cooling system circulates water into water jackets on the stage via “input”
water channel to protect the SEM, EBSD and all loading stage components against extreme
heat. A NiCr-Ni thermocouple is placed under the sample into a small orifice on the
Molybdenum heater cover to monitor and control the sample temperature. Other thermocouples
are also attached on or near critical components, i.e., the pole piece, the BSE detector, the
EBSD nose to monitor their temperature during the experiments. It has been observed that the
temperature of the testing apparatus stays well below critical limits throughout the experiment,
even at temperatures of 1000˚C. This confirms that the heating setup poses no danger to the
internal components of the SEM.
9.1.3 Coincident lattice site (CSL) boundary mapping
According to CSL theory, grain boundaries are classified into two categories, based on
relative orientation relationship between the two adjacent grains. The first category is the co-
incidence boundary, which fulfil the CSL criteria of sharing some lattice sites. [ 56 ] The CSL
boundaries are denoted by Σ, which is the reciprocal density of coincident points in the CSL
formed by the two crystal lattices adjacent at the boundary. [ 54 ] Meanwhile, the second category
is non-co-incidence or general random boundaries, where the number of shared lattice points
158
is much less (less than 1 out of 29 lattice sites) to produce any “special” properties. [ 56 ] At a
Σ3 boundary, 1 out of 3 sites are coincident. Similarly, at a Σ5 boundary, 1 out of 5 sites are
coincident. A low CSL number arises when two adjacent grain boundaries possess a high
degree of lattice matching. [ 55 ] As the sigma number decreases, more sites become coincident
or shared between the two adjacent grains. When more sites are coincident, the energy level of
the boundary decreases as the number of broken bonds decreases. Hence, lower Σ number
boundaries are more stable. [ 56 ]
Before in-situ heating and loading of the sample, CSL maps ahead of the pre-crack through
the entire width of the sample were generated using EBSD data and HKL Oxford Channel 5
Tango software. This serves as a reference point of the initial microstructure and helps in
tracking any change in microstructure, the crack path and interaction of the grain boundaries
and CSL boundaries with the crack. The colour of a boundary on the CSL map indicates the
type of boundary, for e.g. black coloured boundaries are random grain boundaries, red
boundaries are Σ3 boundaries and the pink boundaries are Σ5 boundaries. These Σ boundaries,
or “special” boundaries, can change the original crack-growth directions and sometimes
transform transgranular into intergranular crack growth [ 57 ] [ 58 ] and vice versa.
9.1.4 Experimental test parameters
Careful analysis of the ex-situ fatigue experiments on alloy 709 indicated that there is no
major difference in fatigue behaviour of alloy 709 within a temperature range of 550 °C-750 °C
in vacuum. [ 59 ] Therefore, in-situ SEM testing conducted at 750 °C is used to represent the
behaviour of the alloy for all temperatures between 550 °C-750 °C in vacuum. To make sure
that the plastic deformation can be attributed to time-dependent creep and fatigue, the
maximum stress during the creep-fatigue test is kept within the elastic range. Additionally, to
expedite creep-fatigue interaction, the maximum stress has been kept at 95% of yield stress. [ 60 ] The yield stress of the pre-cracked samples was obtained from prior experiments, using in-
situ SEM tensile tests performed at various temperatures on similar alloy 709 samples. [ 61 ] The
yield strength of the pre-cracked sample at 750 °C was observed to be 214 MPa. As such, the
maximum stress in the fatigue cycle was calculated to be 202 MPa, while the load ratio R was
set to 0.1. In order to calculate the stress intensity factor, ΔK, an equation derived from linear
elastic fracture mechanics (LEFM) is used. This equation is applicable for a single-edge crack
in tension and where the ratio of crack length to total width is less than 0.6. [ 62 ]
It is given by,
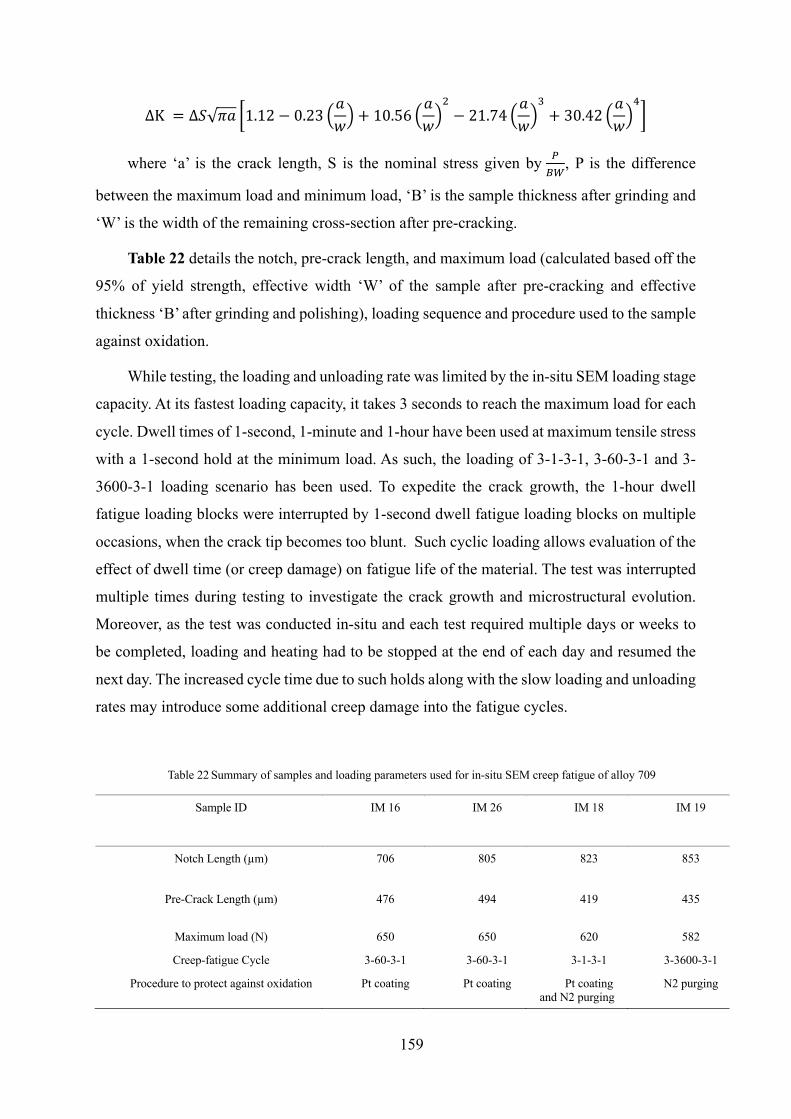
159
ΔK = Δw√xH y1.12 − 0.23 cHzd + 10.56 c
HzdS− 21.74 c
Hzdj+ 30.42 c
Hzd`{
where ‘a’ is the crack length, S is the nominal stress given by |}~
, P is the difference
between the maximum load and minimum load, ‘B’ is the sample thickness after grinding and
‘W’ is the width of the remaining cross-section after pre-cracking.
Table 22 details the notch, pre-crack length, and maximum load (calculated based off the
95% of yield strength, effective width ‘W’ of the sample after pre-cracking and effective
thickness ‘B’ after grinding and polishing), loading sequence and procedure used to the sample
against oxidation.
While testing, the loading and unloading rate was limited by the in-situ SEM loading stage
capacity. At its fastest loading capacity, it takes 3 seconds to reach the maximum load for each
cycle. Dwell times of 1-second, 1-minute and 1-hour have been used at maximum tensile stress
with a 1-second hold at the minimum load. As such, the loading of 3-1-3-1, 3-60-3-1 and 3-
3600-3-1 loading scenario has been used. To expedite the crack growth, the 1-hour dwell
fatigue loading blocks were interrupted by 1-second dwell fatigue loading blocks on multiple
occasions, when the crack tip becomes too blunt. Such cyclic loading allows evaluation of the
effect of dwell time (or creep damage) on fatigue life of the material. The test was interrupted
multiple times during testing to investigate the crack growth and microstructural evolution.
Moreover, as the test was conducted in-situ and each test required multiple days or weeks to
be completed, loading and heating had to be stopped at the end of each day and resumed the
next day. The increased cycle time due to such holds along with the slow loading and unloading
rates may introduce some additional creep damage into the fatigue cycles.
Table 22 Summary of samples and loading parameters used for in-situ SEM creep fatigue of alloy 709
Sample ID IM 16 IM 26 IM 18 IM 19
Notch Length (µm) 706 805 823 853
Pre-Crack Length (µm) 476 494 419 435
Maximum load (N) 650 650 620 582
Creep-fatigue Cycle 3-60-3-1 3-60-3-1 3-1-3-1 3-3600-3-1
Procedure to protect against oxidation Pt coating Pt coating Pt coating and N2 purging
N2 purging
160
Upon the failure of the sample, fractography was performed to correlate the crack growth
at the surface of the sample to that of the cross section and evaluate the failure mechanism of
the material.
9.1.5 TEM Observation
After the completion of the 1-hour dwell test, a TEM study was conducted to investigate
the microstructure and chemical composition evolution of the material due to loading and
heating and interaction of the crack path with grain/ twin boundaries. TEM foils were extracted
from two interesting regions: grain boundaries (2 TEM foils) and twin boundaries (1 TEM foil).
Both regions have been marked with white boxes in Figure 113a-ii and Figure 113a-iii.
Site-specific TEM specimens were prepared from the two regions using a dual-beam FEI
Quanta 3D Focus Ion Beam microscope (FIB) and the in-situ lift-out technique. A Pt coating
was used to protect the top surface following milling and an in-situ lift-out technique. The
initial stages of foil preparation used a 30 keV ion beam with the probe current reduced
successively throughout the procedure with a final polishing/cleaning performed at 5 keV.
TEM samples were examined in a FEI Talos F200 equipped with super-X detectors at
operating voltage of 200 kV.
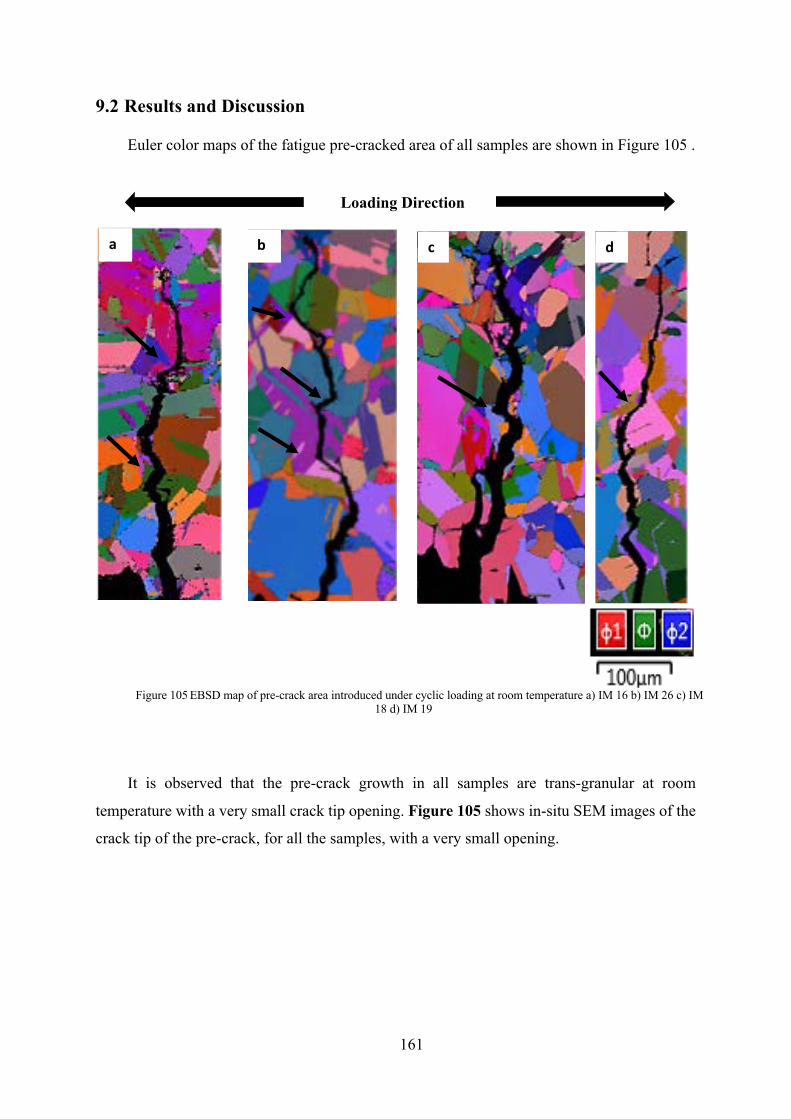
161
9.2 Results and Discussion
Euler color maps of the fatigue pre-cracked area of all samples are shown in Figure 105 .
It is observed that the pre-crack growth in all samples are trans-granular at room
temperature with a very small crack tip opening. Figure 105 shows in-situ SEM images of the
crack tip of the pre-crack, for all the samples, with a very small opening.
a
Loading Direction
b c d
Figure 105 EBSD map of pre-crack area introduced under cyclic loading at room temperature a) IM 16 b) IM 26 c) IM 18 d) IM 19
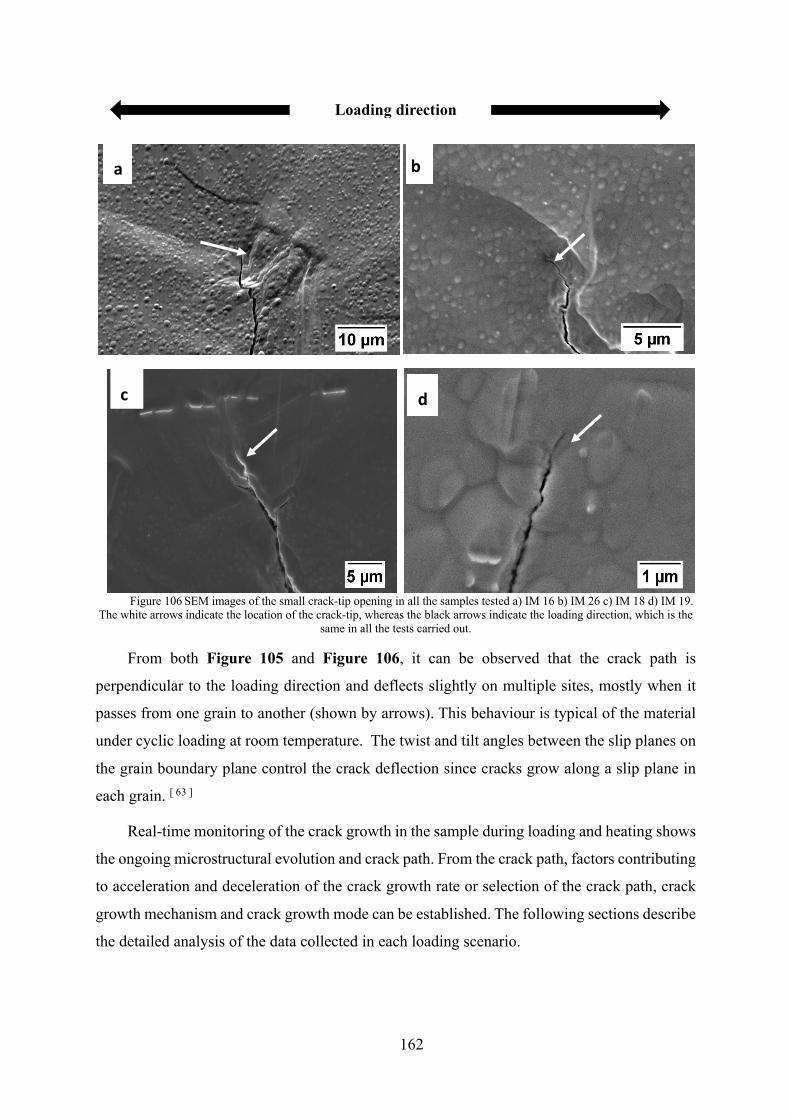
162
Figure 106 SEM images of the small crack-tip opening in all the samples tested a) IM 16 b) IM 26 c) IM 18 d) IM 19. The white arrows indicate the location of the crack-tip, whereas the black arrows indicate the loading direction, which is the
same in all the tests carried out.
From both Figure 105 and Figure 106, it can be observed that the crack path is
perpendicular to the loading direction and deflects slightly on multiple sites, mostly when it
passes from one grain to another (shown by arrows). This behaviour is typical of the material
under cyclic loading at room temperature. The twist and tilt angles between the slip planes on
the grain boundary plane control the crack deflection since cracks grow along a slip plane in
each grain. [ 63 ]
Real-time monitoring of the crack growth in the sample during loading and heating shows
the ongoing microstructural evolution and crack path. From the crack path, factors contributing
to acceleration and deceleration of the crack growth rate or selection of the crack path, crack
growth mechanism and crack growth mode can be established. The following sections describe
the detailed analysis of the data collected in each loading scenario.
a
d c
b
Loading direction
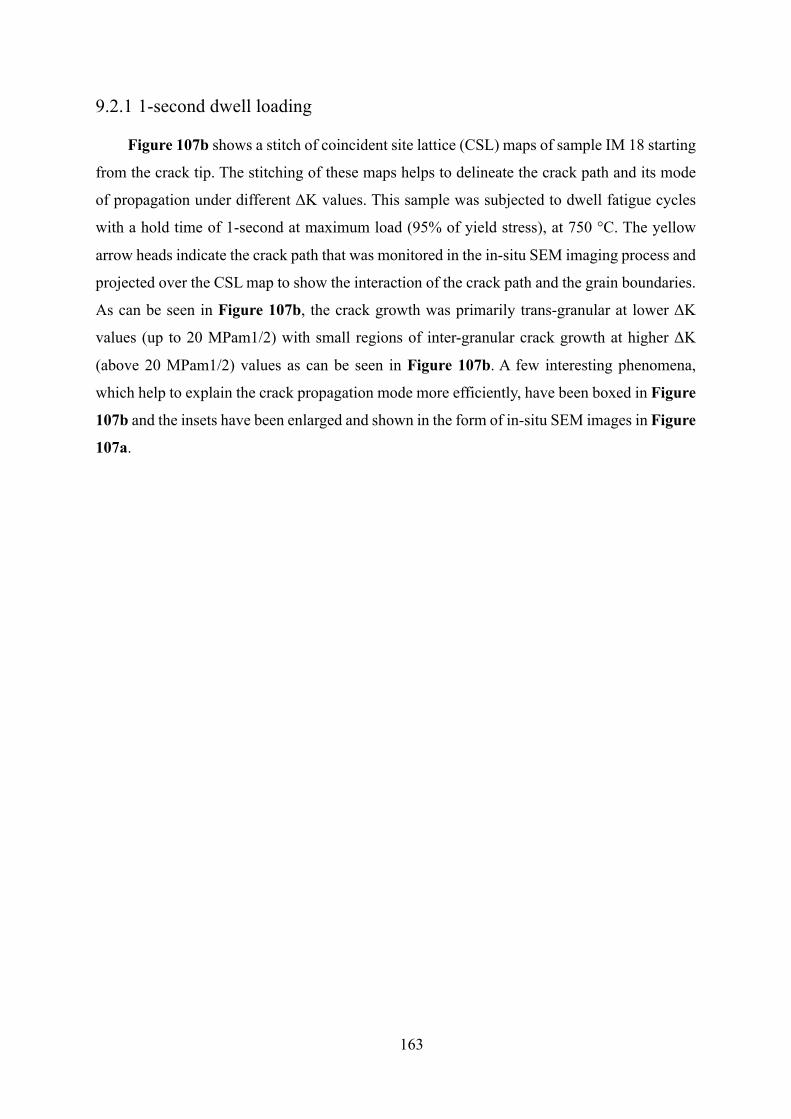
163
9.2.1 1-second dwell loading
Figure 107b shows a stitch of coincident site lattice (CSL) maps of sample IM 18 starting
from the crack tip. The stitching of these maps helps to delineate the crack path and its mode
of propagation under different ΔK values. This sample was subjected to dwell fatigue cycles
with a hold time of 1-second at maximum load (95% of yield stress), at 750 °C. The yellow
arrow heads indicate the crack path that was monitored in the in-situ SEM imaging process and
projected over the CSL map to show the interaction of the crack path and the grain boundaries.
As can be seen in Figure 107b, the crack growth was primarily trans-granular at lower ΔK
values (up to 20 MPam1/2) with small regions of inter-granular crack growth at higher ΔK
(above 20 MPam1/2) values as can be seen in Figure 107b. A few interesting phenomena,
which help to explain the crack propagation mode more efficiently, have been boxed in Figure
107b and the insets have been enlarged and shown in the form of in-situ SEM images in Figure
107a.
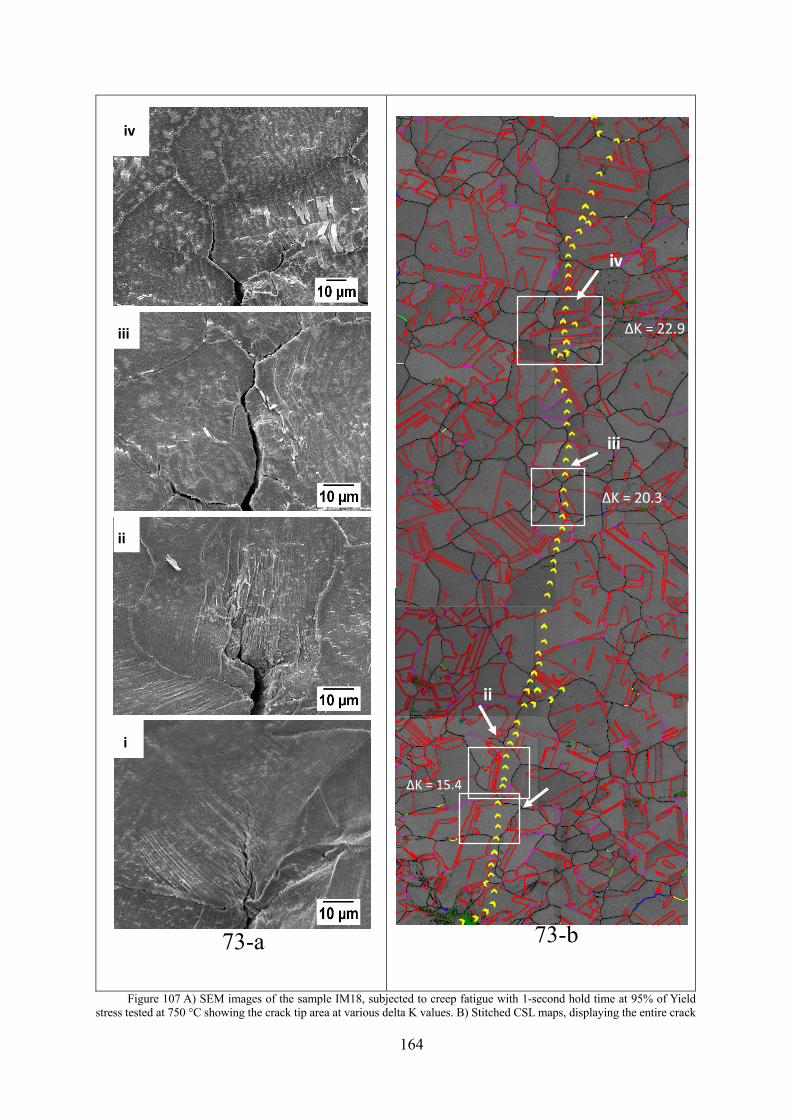
164
Figure 107 A) SEM images of the sample IM18, subjected to creep fatigue with 1-second hold time at 95% of Yield stress tested at 750 °C showing the crack tip area at various delta K values. B) Stitched CSL maps, displaying the entire crack
ΔK = 30
ΔK = 35
i
ii
iii
i
v
i
ii
i
v
73-a 73-b
ΔK = 15.4
ΔK = 20.3
ΔK = 22.9
i
ii
iii
iv
iv
165
path (using arrow heads) through the sample surface and its interactions with various grain- and twin- boundaries. Figure 107-a-i shows crack making an angle with slip planes while Figure 107-a-ii shows crack growth parallel to slip plane both at lower delta K values. Figure 107-a-iii and Figure 107-a-iv show transgranular crack growth at medium to high delta K values.
For instance, the trans-granular crack growth occurs with the help of a slip mechanism,
which is indicated by the presence of slip lines in the vicinity of the crack. These slip lines were
oriented at different angles with respect to the crack. They may be parallel to direction to the
crack growth as shown in (Figure 107a-ii) or almost perpendicular to the crack tip (Figure
107a-i).
It is known that at ambient temperatures or very high loading frequencies, the low stacking
fault energy in austenitic stainless steels allows them to undergo planar slip, wherein the
dislocations remain in planar arrays and planar shear offsets are produced on polished surfaces. [ 64] Here, the crack grows along the slip planes. At higher temperatures (>0.4 Tm) or lower
loading frequencies, uniformly distributed, non-planar dislocation motion or wavy slip occurs
because thermal activation allows dislocations to climb and cross-slip out of their original slip
planes. In such a scenario, the crack propagates perpendicular to the slip plane.
At higher ΔK values (above 20 MPam1/2), as can be seen in Figure 107a-iii and Figure
107a-iv due to a longer exposure of the sample to high temperature, the cavitation along the
grain boundaries make them more sensitive to cracking ahead of the crack tip. This can be
observed in Figure 108, where the crack-tip is surrounded by cavitated grain boundaries in its
vicinity. As such, crack growth is a combination of intergranular and transgranular failure.
Wherever there is a random boundary perpendicular to the loading direction in the vicinity of
the crack tip, the crack grows in an intergranular fashion. The crack path had only 6.86% Σ3
twin boundaries even when most of the boundaries, about 60%, were Σ3 twin boundaries. This
is because crack growth is primarily transgranular and Σ3 twin boundaries are resistant to
cracking.
166
Figure 108 An in-situ SEM image from the surface of sample IM18 subjected to creep fatigue with a hold period of 1-second at maximum load tested at 750C, which shows the extent of grain boundary cavitation at higher
values of ΔK. The black arrow shows the location of the crack-tip and the white arrows show the cavitated grain boundaries around the crack tip.
Figure 109 shows the crack growth rate as a function of ΔK values for various dwell time.
As can be seen in this figure, after an initial transient response to loading, a Stage-II crack
growth characterized by linear (da/dN) vs ΔK occurs. This is since the specimen was pre-
cracked already and as such the Stage-I crack growth, which is primarily influenced by shear
stresses and shear strains, had already occurred during pre-cracking process. The Stage-II
fatigue-crack propagation is mostly tension (mode I)-driven, in the direction normal to the
applied fatigue load and is insensitive to the grain boundary character. [ 65 ]
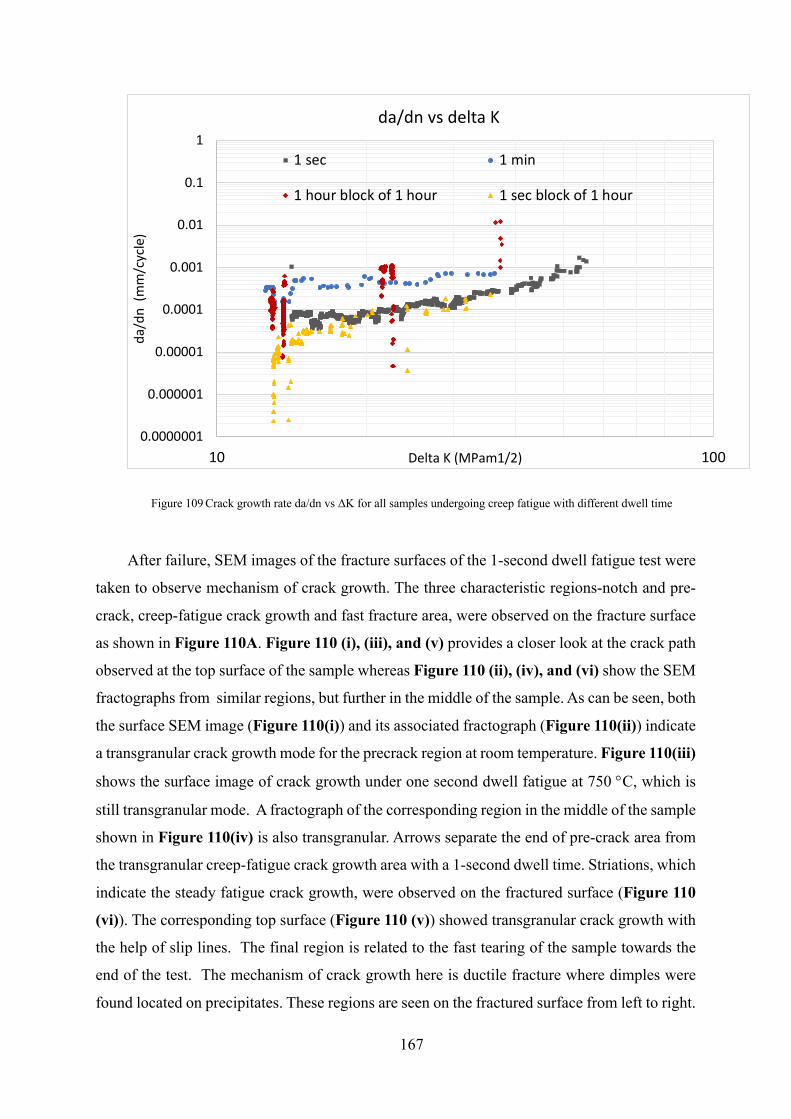
167
Figure 109 Crack growth rate da/dn vs ΔK for all samples undergoing creep fatigue with different dwell time
After failure, SEM images of the fracture surfaces of the 1-second dwell fatigue test were
taken to observe mechanism of crack growth. The three characteristic regions-notch and pre-
crack, creep-fatigue crack growth and fast fracture area, were observed on the fracture surface
as shown in Figure 110A. Figure 110 (i), (iii), and (v) provides a closer look at the crack path
observed at the top surface of the sample whereas Figure 110 (ii), (iv), and (vi) show the SEM
fractographs from similar regions, but further in the middle of the sample. As can be seen, both
the surface SEM image (Figure 110(i)) and its associated fractograph (Figure 110(ii)) indicate
a transgranular crack growth mode for the precrack region at room temperature. Figure 110(iii)
shows the surface image of crack growth under one second dwell fatigue at 750 °C, which is
still transgranular mode. A fractograph of the corresponding region in the middle of the sample
shown in Figure 110(iv) is also transgranular. Arrows separate the end of pre-crack area from
the transgranular creep-fatigue crack growth area with a 1-second dwell time. Striations, which
indicate the steady fatigue crack growth, were observed on the fractured surface (Figure 110
(vi)). The corresponding top surface (Figure 110 (v)) showed transgranular crack growth with
the help of slip lines. The final region is related to the fast tearing of the sample towards the
end of the test. The mechanism of crack growth here is ductile fracture where dimples were
found located on precipitates. These regions are seen on the fractured surface from left to right.
0.0000001
0.000001
0.00001
0.0001
0.001
0.01
0.1
1
10 100
da/d
n (m
m/c
ycle
)
Delta K (MPam1/2)
da/dn vs delta K
1 sec 1 min
1 hour block of 1 hour 1 sec block of 1 hour
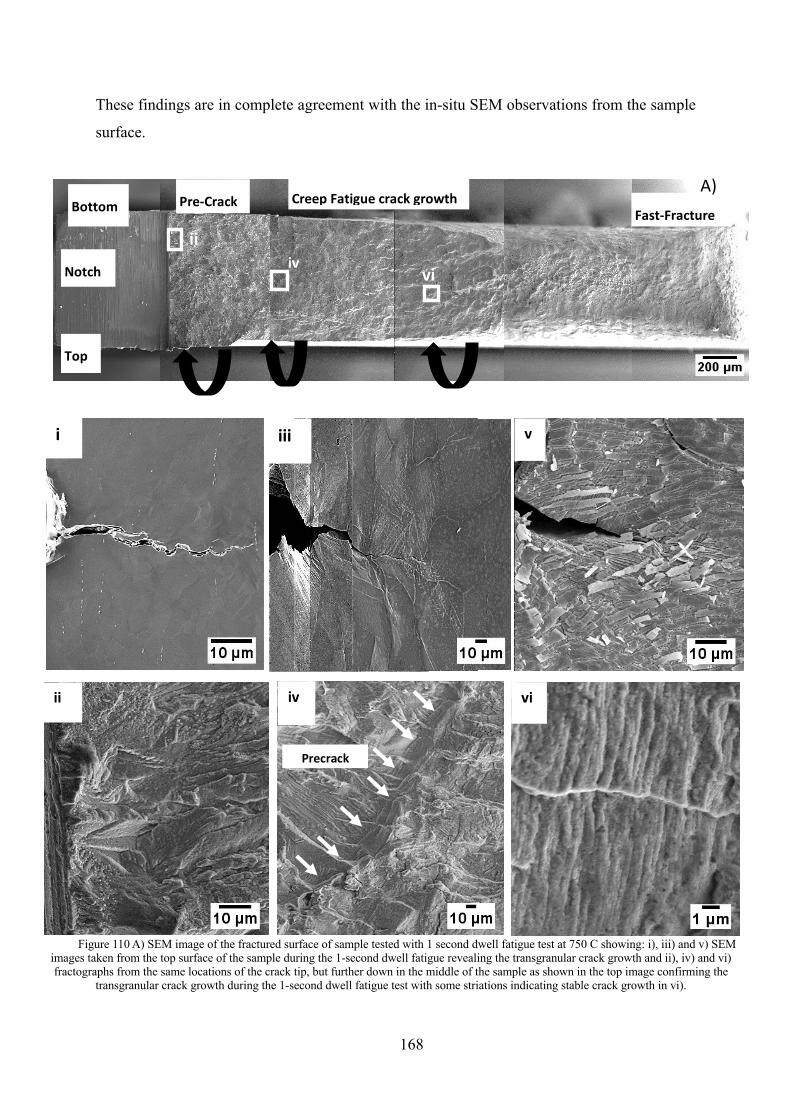
168
These findings are in complete agreement with the in-situ SEM observations from the sample
surface.
v iii i Top
Bottom
Notch
Pre-Crack Fast-Fracture
i iii
iv ii vi
v
vi iv ii
Precrack
Creep Fatigue crack growth A)
Figure 110 A) SEM image of the fractured surface of sample tested with 1 second dwell fatigue test at 750 C showing: i), iii) and v) SEM images taken from the top surface of the sample during the 1-second dwell fatigue revealing the transgranular crack growth and ii), iv) and vi) fractographs from the same locations of the crack tip, but further down in the middle of the sample as shown in the top image confirming the
transgranular crack growth during the 1-second dwell fatigue test with some striations indicating stable crack growth in vi).
169
9.2.2 1-minute dwell
Figure 111 shows a stitch of CSL maps of sample IM 26, which was subjected to a creep
fatigue cyclic loading with a dwell time of 1-minute. In the stitched CSL maps, the entire crack
path has been shown in the form of yellow arrow heads, starting from the crack tip at the bottom.
As can be seen, by changing the dwell time from 1-second to 1-minute, at a maximum load of
95% yield stress at 750 °C, the crack growth mechanism changes from primarily transgranular
to mixed mode with majority intergranular crack growth. This indicates a shift in the
mechanism of crack growth.
As the loading begins and the crack starts to propagate, the first two grains show trans-
granular crack growth, which can be observed in Figure 111b. This can be attributed to the
effect of the pre-crack (shown in Figure 111b) on its nearby grains, which was introduced
through fatigue loading at room temperature. After the crack tip passes the first two grains, the
crack propagates in a primarily intergranular fashion. In-situ SEM images show a lack of slip
lines when compared with the 1-second dwell CFCG test, as can be seen throughout the sample
in Figure 111a (i), (ii) and (iii). Instead, grain boundary voids are created during the 1-minute
hold time and the crack grows during cycling. In Figure 111a-i, white arrows indicate the voids
formed ahead of the crack tip. The increase in dwell time to 1-minute causes creep damage in
the material and therefore the mode of crack growth is mixed mode with majority being
intergranular.
Additionally, it was observed that at various sites on the sample, the crack path changed
due to its interaction with Σ3 boundaries. In Figure 111a-i, the right-side branch (indicated by
black arrow) of the bifurcated crack stops growing due to the crack being arrested at a Σ3
boundary. In Figure 111a-ii-a, the crack reaches a point where it is only surrounded by Σ3
boundaries. To avoid the Σ3 boundaries, the crack becomes trans-granular and proceeds
towards the nearest voids at the random grain boundary (Figure 111a-ii-b).
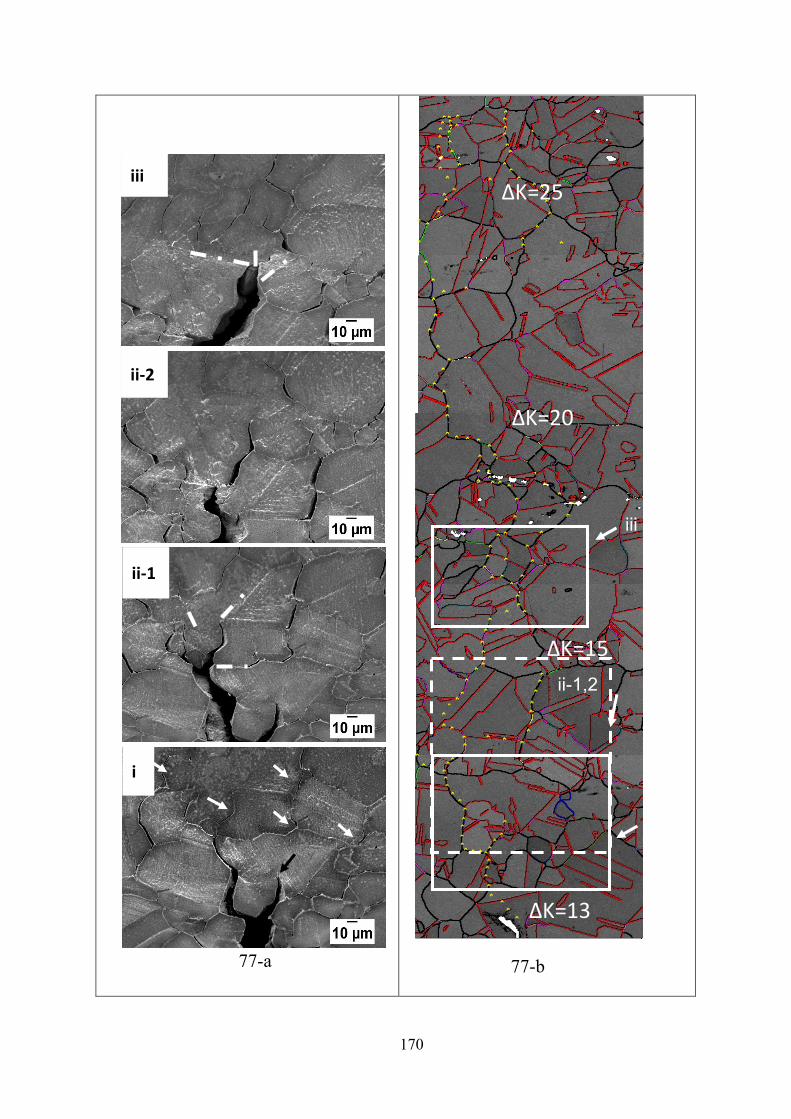
170
∆K=25
∆K=20
∆K=15
∆K=13
iii
ii-1,2
i
i
ii-1
ii-2
iii
77-a 77-b
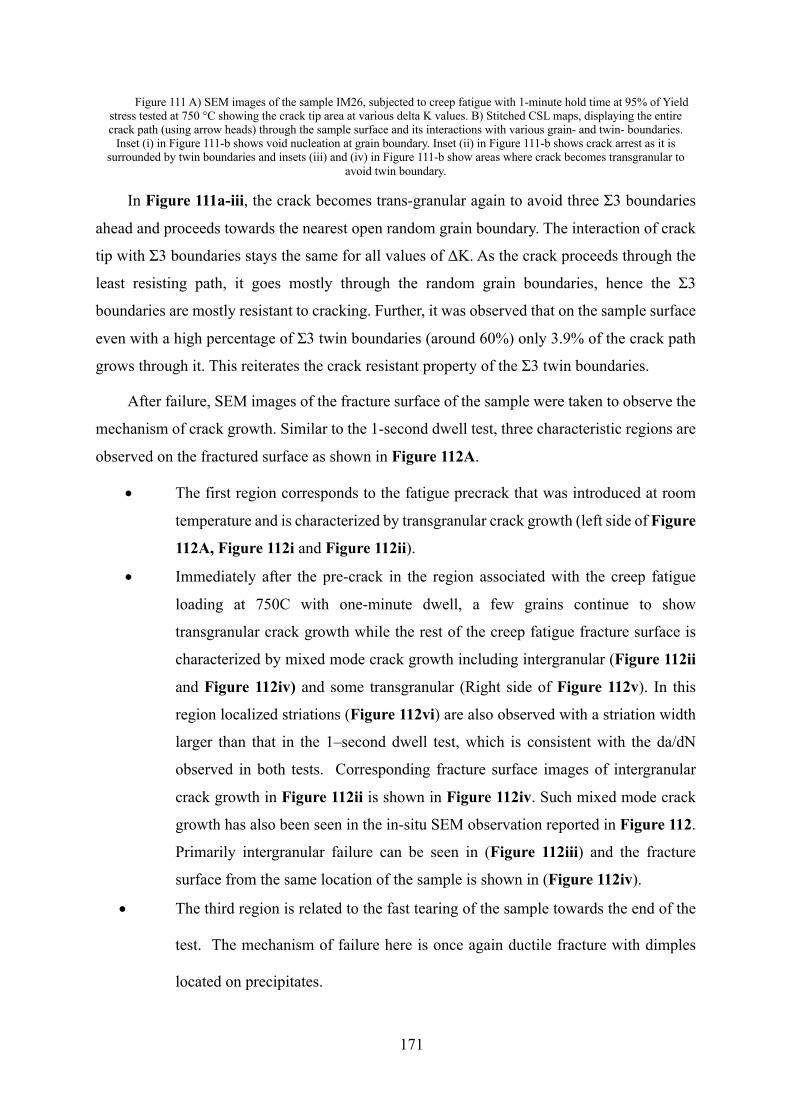
171
Figure 111 A) SEM images of the sample IM26, subjected to creep fatigue with 1-minute hold time at 95% of Yield stress tested at 750 °C showing the crack tip area at various delta K values. B) Stitched CSL maps, displaying the entire crack path (using arrow heads) through the sample surface and its interactions with various grain- and twin- boundaries.
Inset (i) in Figure 111-b shows void nucleation at grain boundary. Inset (ii) in Figure 111-b shows crack arrest as it is surrounded by twin boundaries and insets (iii) and (iv) in Figure 111-b show areas where crack becomes transgranular to
avoid twin boundary.
In Figure 111a-iii, the crack becomes trans-granular again to avoid three Σ3 boundaries
ahead and proceeds towards the nearest open random grain boundary. The interaction of crack
tip with Σ3 boundaries stays the same for all values of ΔK. As the crack proceeds through the
least resisting path, it goes mostly through the random grain boundaries, hence the Σ3
boundaries are mostly resistant to cracking. Further, it was observed that on the sample surface
even with a high percentage of Σ3 twin boundaries (around 60%) only 3.9% of the crack path
grows through it. This reiterates the crack resistant property of the Σ3 twin boundaries.
After failure, SEM images of the fracture surface of the sample were taken to observe the
mechanism of crack growth. Similar to the 1-second dwell test, three characteristic regions are
observed on the fractured surface as shown in Figure 112A.
• The first region corresponds to the fatigue precrack that was introduced at room
temperature and is characterized by transgranular crack growth (left side of Figure
112A, Figure 112i and Figure 112ii).
• Immediately after the pre-crack in the region associated with the creep fatigue
loading at 750C with one-minute dwell, a few grains continue to show
transgranular crack growth while the rest of the creep fatigue fracture surface is
characterized by mixed mode crack growth including intergranular (Figure 112ii
and Figure 112iv) and some transgranular (Right side of Figure 112v). In this
region localized striations (Figure 112vi) are also observed with a striation width
larger than that in the 1–second dwell test, which is consistent with the da/dN
observed in both tests. Corresponding fracture surface images of intergranular
crack growth in Figure 112ii is shown in Figure 112iv. Such mixed mode crack
growth has also been seen in the in-situ SEM observation reported in Figure 112.
Primarily intergranular failure can be seen in (Figure 112iii) and the fracture
surface from the same location of the sample is shown in (Figure 112iv).
• The third region is related to the fast tearing of the sample towards the end of the
test. The mechanism of failure here is once again ductile fracture with dimples
located on precipitates.
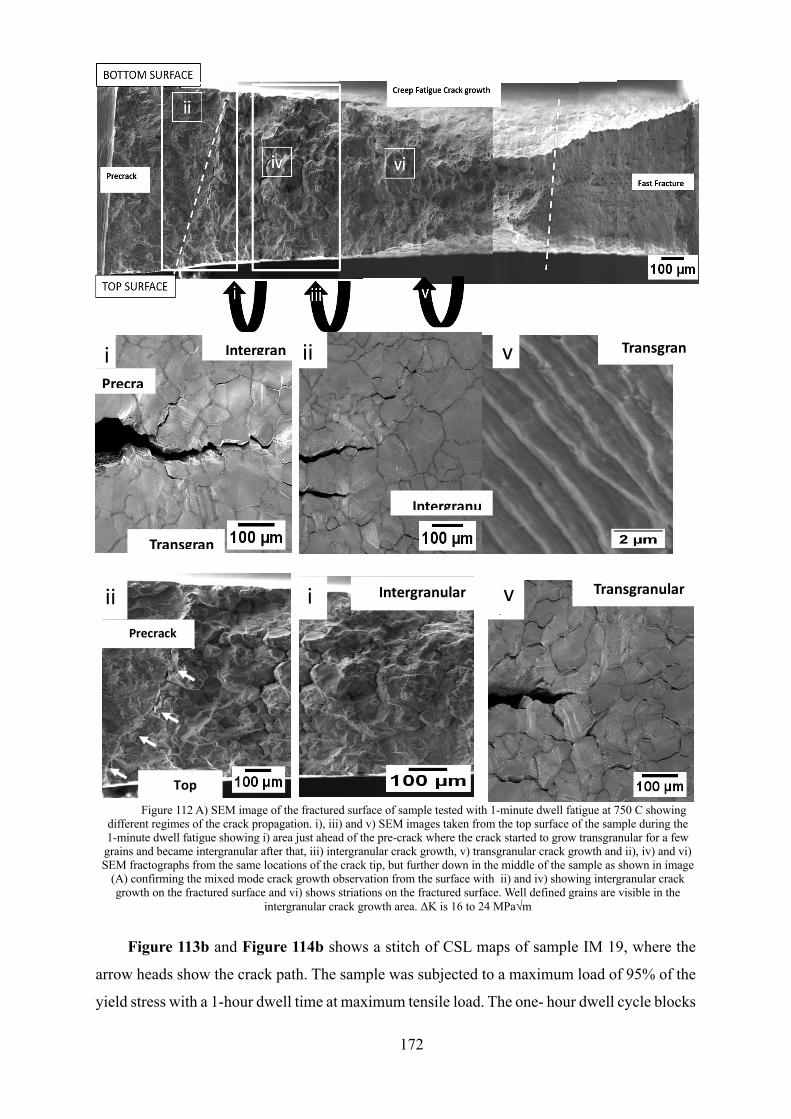
172
9.2.3 1-hour dwell
Figure 113b and Figure 114b shows a stitch of CSL maps of sample IM 19, where the
arrow heads show the crack path. The sample was subjected to a maximum load of 95% of the
yield stress with a 1-hour dwell time at maximum tensile load. The one- hour dwell cycle blocks
ii Precrack
Top Surface
i Intergran
Transgran
Precra
iii
Intergranu
iv
Intergranular
v Transgranular
vi
Transgranular
Figure 112 A) SEM image of the fractured surface of sample tested with 1-minute dwell fatigue at 750 C showing different regimes of the crack propagation. i), iii) and v) SEM images taken from the top surface of the sample during the 1-minute dwell fatigue showing i) area just ahead of the pre-crack where the crack started to grow transgranular for a few grains and became intergranular after that, iii) intergranular crack growth, v) transgranular crack growth and ii), iv) and vi) SEM fractographs from the same locations of the crack tip, but further down in the middle of the sample as shown in image
(A) confirming the mixed mode crack growth observation from the surface with ii) and iv) showing intergranular crack growth on the fractured surface and vi) shows striations on the fractured surface. Well defined grains are visible in the
intergranular crack growth area. ΔK is 16 to 24 MPa√m

173
were interrupted by 1-second dwell cycle blocks to expedite crack growth. The arrowheads
marked in indicate the 1-hour dwell CFCG while the area in between these 1-hour dwell fatigue
cracks indicate 1-second dwell CFCG intervals at 750 °C. As can be observed, most of the
creep damage was observed in the form of grain boundary separations, the extent of which
increased as the delta K value increased. The test started with 200 cycles of 1-hour dwell block
followed by 6800 cycles of 1-second dwell block, then 200 cycles of 1-hour dwell block again
followed by a 16700 cycles of 1-second dwell block, then 141cycles of 1-hour dwell block and
5150 cycles of 1-second dwell block with a final block of 14 cycles of 1-hour dwell.
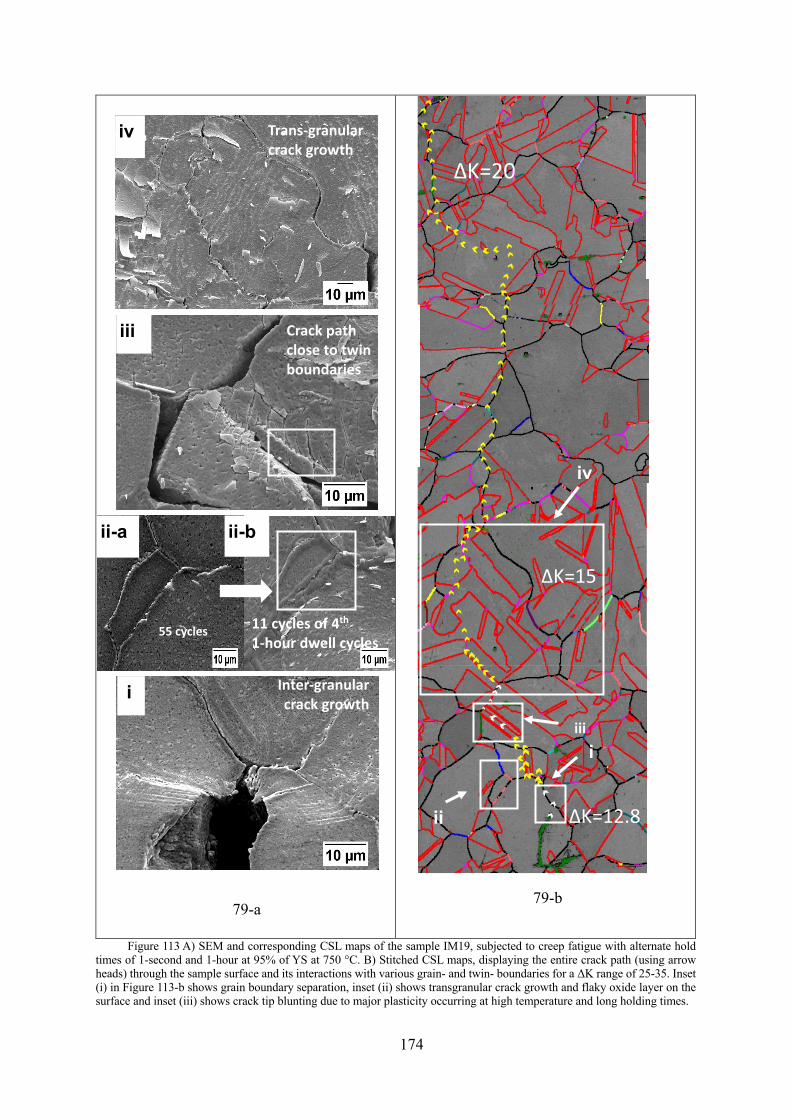
174
Figure 113 A) SEM and corresponding CSL maps of the sample IM19, subjected to creep fatigue with alternate hold times of 1-second and 1-hour at 95% of YS at 750 °C. B) Stitched CSL maps, displaying the entire crack path (using arrow heads) through the sample surface and its interactions with various grain- and twin- boundaries for a ΔK range of 25-35. Inset (i) in Figure 113-b shows grain boundary separation, inset (ii) shows transgranular crack growth and flaky oxide layer on the surface and inset (iii) shows crack tip blunting due to major plasticity occurring at high temperature and long holding times.
∆K=12.8
∆K=15
∆K=20
Inter-granular crack growth i
ii-a
55 cycles 11 cycles of 4th 1-hour dwell cycles
Crack path close to twin boundaries
iii
iv
Trans-granular crack growth
ii
i
iii
iv
ii-b
79-a 79-b
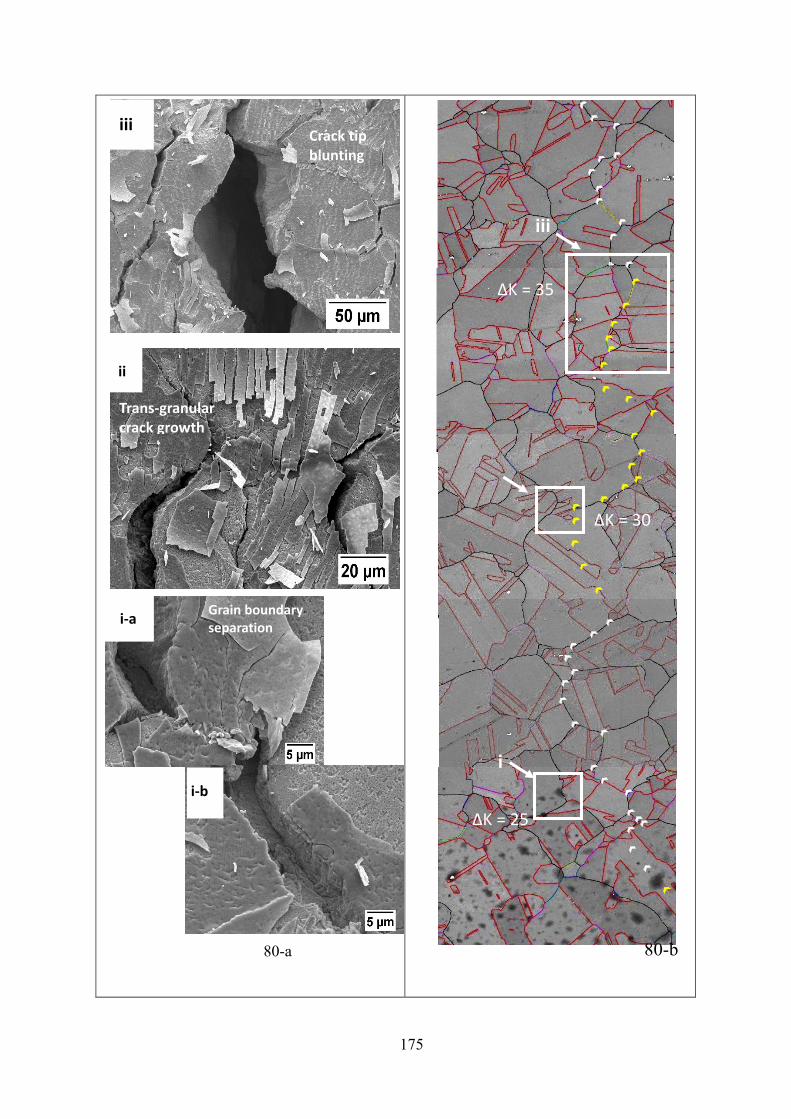
175
Grain boundary separation i-a
i-b
Trans-granular crack growth
ii
iii Crack tip blunting
i
ΔK = 25
ii
ΔK = 30
ΔK = 35
iii
80-a 80-b
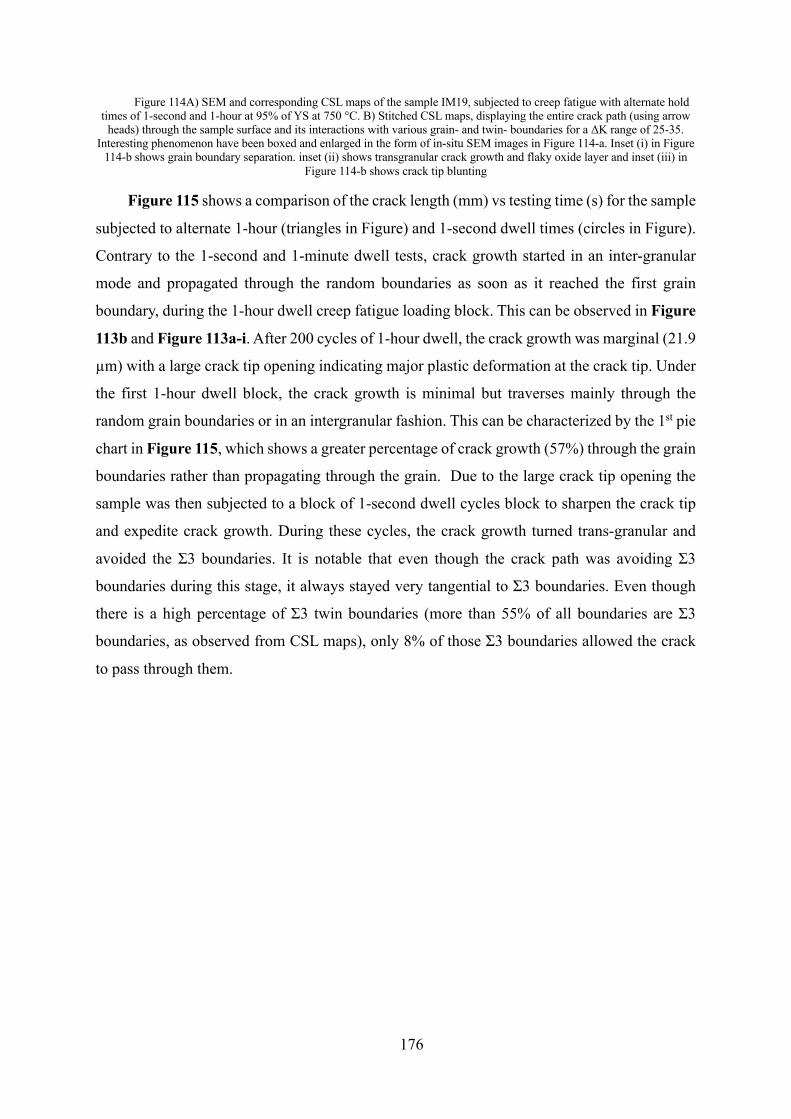
176
Figure 114A) SEM and corresponding CSL maps of the sample IM19, subjected to creep fatigue with alternate hold times of 1-second and 1-hour at 95% of YS at 750 °C. B) Stitched CSL maps, displaying the entire crack path (using arrow
heads) through the sample surface and its interactions with various grain- and twin- boundaries for a ΔK range of 25-35. Interesting phenomenon have been boxed and enlarged in the form of in-situ SEM images in Figure 114-a. Inset (i) in Figure
114-b shows grain boundary separation. inset (ii) shows transgranular crack growth and flaky oxide layer and inset (iii) in Figure 114-b shows crack tip blunting
Figure 115 shows a comparison of the crack length (mm) vs testing time (s) for the sample
subjected to alternate 1-hour (triangles in Figure) and 1-second dwell times (circles in Figure).
Contrary to the 1-second and 1-minute dwell tests, crack growth started in an inter-granular
mode and propagated through the random boundaries as soon as it reached the first grain
boundary, during the 1-hour dwell creep fatigue loading block. This can be observed in Figure
113b and Figure 113a-i. After 200 cycles of 1-hour dwell, the crack growth was marginal (21.9
µm) with a large crack tip opening indicating major plastic deformation at the crack tip. Under
the first 1-hour dwell block, the crack growth is minimal but traverses mainly through the
random grain boundaries or in an intergranular fashion. This can be characterized by the 1st pie
chart in Figure 115, which shows a greater percentage of crack growth (57%) through the grain
boundaries rather than propagating through the grain. Due to the large crack tip opening the
sample was then subjected to a block of 1-second dwell cycles block to sharpen the crack tip
and expedite crack growth. During these cycles, the crack growth turned trans-granular and
avoided the Σ3 boundaries. It is notable that even though the crack path was avoiding Σ3
boundaries during this stage, it always stayed very tangential to Σ3 boundaries. Even though
there is a high percentage of Σ3 twin boundaries (more than 55% of all boundaries are Σ3
boundaries, as observed from CSL maps), only 8% of those Σ3 boundaries allowed the crack
to pass through them.
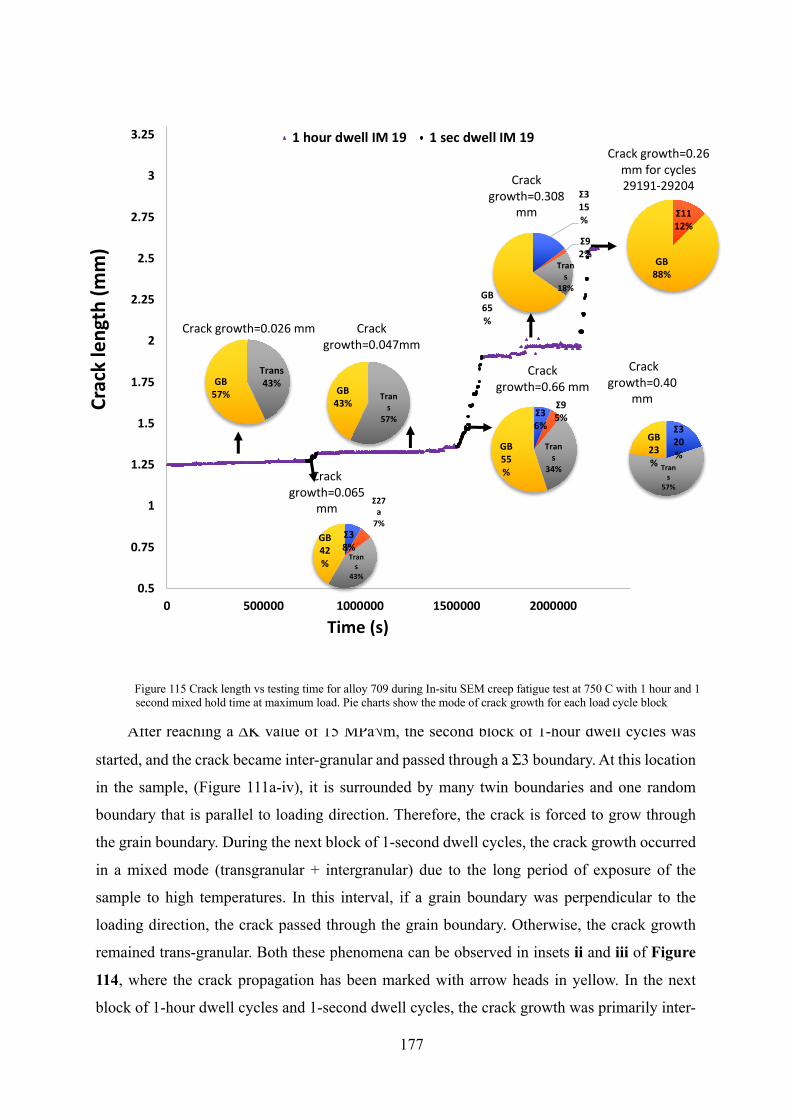
177
After reaching a DK value of 15 MPa√m, the second block of 1-hour dwell cycles was
started, and the crack became inter-granular and passed through a Σ3 boundary. At this location
in the sample, (Figure 111a-iv), it is surrounded by many twin boundaries and one random
boundary that is parallel to loading direction. Therefore, the crack is forced to grow through
the grain boundary. During the next block of 1-second dwell cycles, the crack growth occurred
in a mixed mode (transgranular + intergranular) due to the long period of exposure of the
sample to high temperatures. In this interval, if a grain boundary was perpendicular to the
loading direction, the crack passed through the grain boundary. Otherwise, the crack growth
remained trans-granular. Both these phenomena can be observed in insets ii and iii of Figure
114, where the crack propagation has been marked with arrow heads in yellow. In the next
block of 1-hour dwell cycles and 1-second dwell cycles, the crack growth was primarily inter-
0.5
0.75
1
1.25
1.5
1.75
2
2.25
2.5
2.75
3
3.25
0 500000 1000000 1500000 2000000
Crac
k le
ngth
(mm
)
Time (s)
1 hour dwell IM 19 1 sec dwell IM 19
Trans43%GB
57%
Crack growth=0.026 mm
Σ38%
Σ27a
7%
Trans
43%
GB42%
Crack growth=0.065
mm
Trans
57%
GB43%
Crack growth=0.047mm
Σ36%
Σ95%
Trans
34%
GB55%
Crack growth=0.66 mm
Σ315%
Σ92%
Trans
18%GB65%
Crack growth=0.308
mm
Σ320%
Trans
57%
GB23%
Crack growth=0.40
mm
Σ1112%
GB88%
Crack growth=0.26 mm for cycles 29191-29204
Figure 115 Crack length vs testing time for alloy 709 during In-situ SEM creep fatigue test at 750 C with 1 hour and 1 second mixed hold time at maximum load. Pie charts show the mode of crack growth for each load cycle block
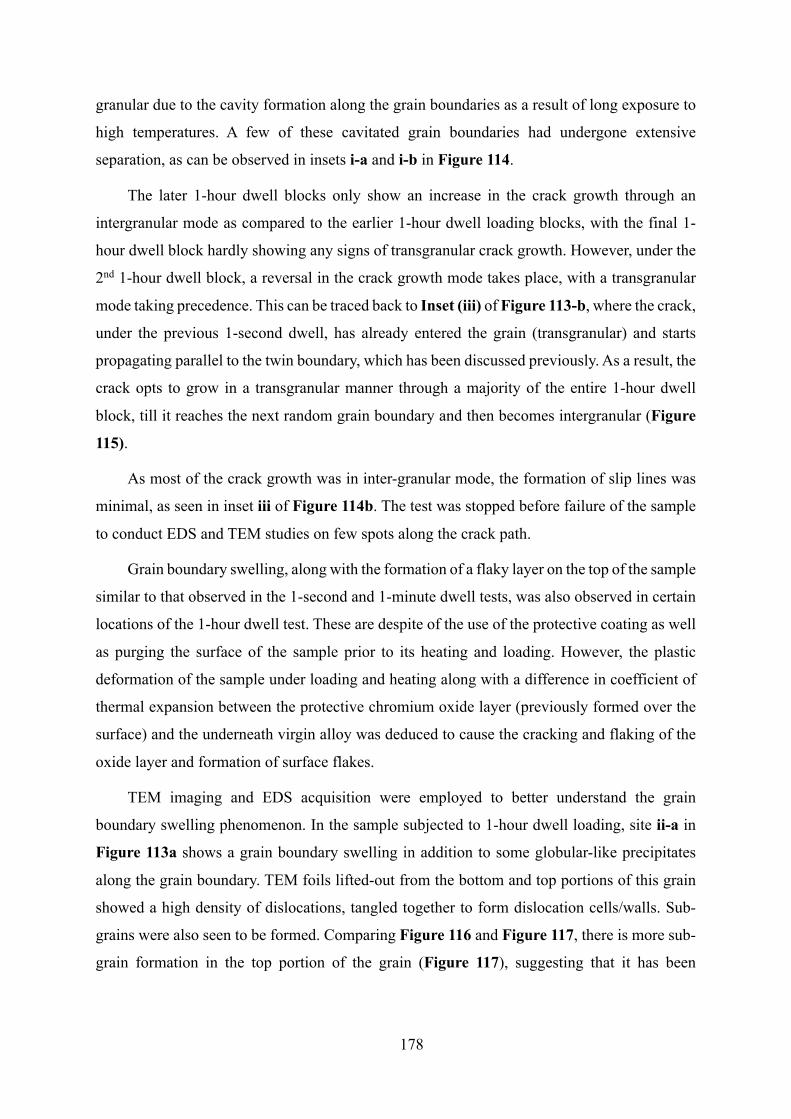
178
granular due to the cavity formation along the grain boundaries as a result of long exposure to
high temperatures. A few of these cavitated grain boundaries had undergone extensive
separation, as can be observed in insets i-a and i-b in Figure 114.
The later 1-hour dwell blocks only show an increase in the crack growth through an
intergranular mode as compared to the earlier 1-hour dwell loading blocks, with the final 1-
hour dwell block hardly showing any signs of transgranular crack growth. However, under the
2nd 1-hour dwell block, a reversal in the crack growth mode takes place, with a transgranular
mode taking precedence. This can be traced back to Inset (iii) of Figure 113-b, where the crack,
under the previous 1-second dwell, has already entered the grain (transgranular) and starts
propagating parallel to the twin boundary, which has been discussed previously. As a result, the
crack opts to grow in a transgranular manner through a majority of the entire 1-hour dwell
block, till it reaches the next random grain boundary and then becomes intergranular (Figure
115).
As most of the crack growth was in inter-granular mode, the formation of slip lines was
minimal, as seen in inset iii of Figure 114b. The test was stopped before failure of the sample
to conduct EDS and TEM studies on few spots along the crack path.
Grain boundary swelling, along with the formation of a flaky layer on the top of the sample
similar to that observed in the 1-second and 1-minute dwell tests, was also observed in certain
locations of the 1-hour dwell test. These are despite of the use of the protective coating as well
as purging the surface of the sample prior to its heating and loading. However, the plastic
deformation of the sample under loading and heating along with a difference in coefficient of
thermal expansion between the protective chromium oxide layer (previously formed over the
surface) and the underneath virgin alloy was deduced to cause the cracking and flaking of the
oxide layer and formation of surface flakes.
TEM imaging and EDS acquisition were employed to better understand the grain
boundary swelling phenomenon. In the sample subjected to 1-hour dwell loading, site ii-a in
Figure 113a shows a grain boundary swelling in addition to some globular-like precipitates
along the grain boundary. TEM foils lifted-out from the bottom and top portions of this grain
showed a high density of dislocations, tangled together to form dislocation cells/walls. Sub-
grains were also seen to be formed. Comparing Figure 116 and Figure 117, there is more sub-
grain formation in the top portion of the grain (Figure 117), suggesting that it has been
179
subjected to a larger amount of strain than the bottom portion. This is consistent with the fact
that the section on the top is closer to the main-crack when compared to the lower section.
a b
c
Figure 116 Oxide layer characterization of Sample IM19, subjected to alternate hold periods of 1-second and 1-hour, a) SEM image showing the 1st position where TEM foil was lifted-out, b) SEM image of the TEM foil, c) Bright field scanning transmission electron
microscopy (BF-STEM) image of TEM foil.
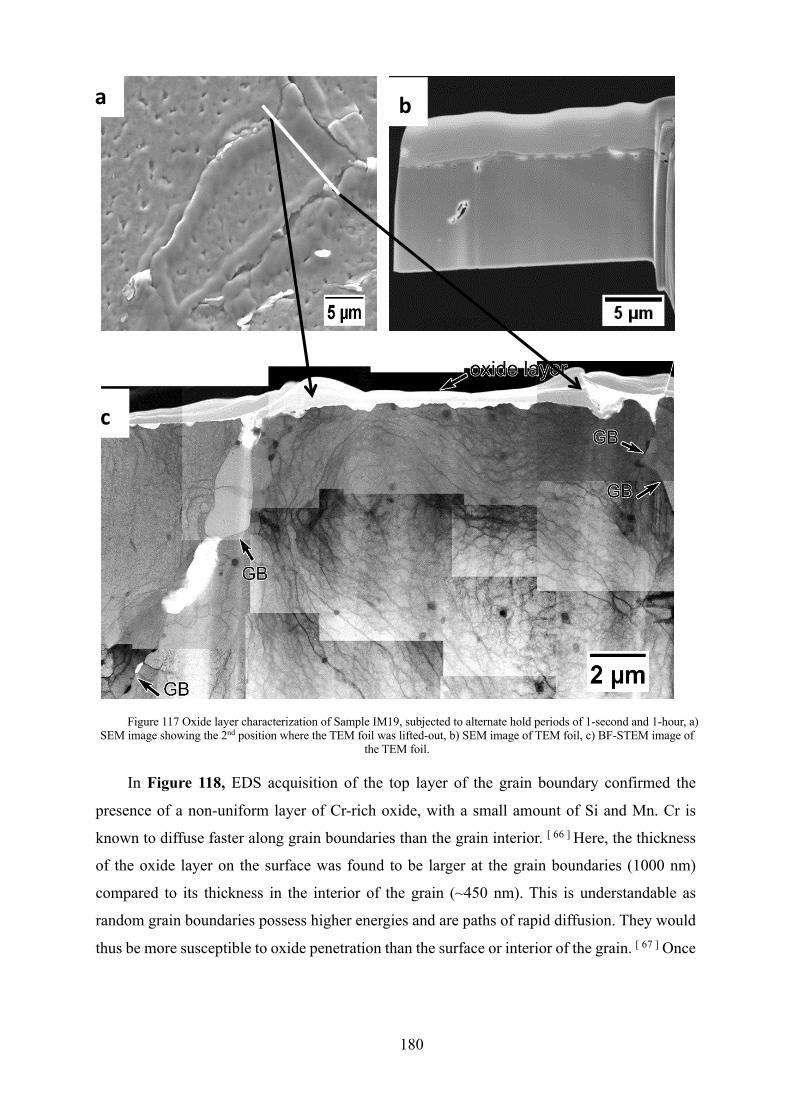
180
In Figure 118, EDS acquisition of the top layer of the grain boundary confirmed the
presence of a non-uniform layer of Cr-rich oxide, with a small amount of Si and Mn. Cr is
known to diffuse faster along grain boundaries than the grain interior. [ 66 ] Here, the thickness
of the oxide layer on the surface was found to be larger at the grain boundaries (1000 nm)
compared to its thickness in the interior of the grain (~450 nm). This is understandable as
random grain boundaries possess higher energies and are paths of rapid diffusion. They would
thus be more susceptible to oxide penetration than the surface or interior of the grain. [ 67 ] Once
a b
c
Figure 117 Oxide layer characterization of Sample IM19, subjected to alternate hold periods of 1-second and 1-hour, a) SEM image showing the 2nd position where the TEM foil was lifted-out, b) SEM image of TEM foil, c) BF-STEM image of
the TEM foil.
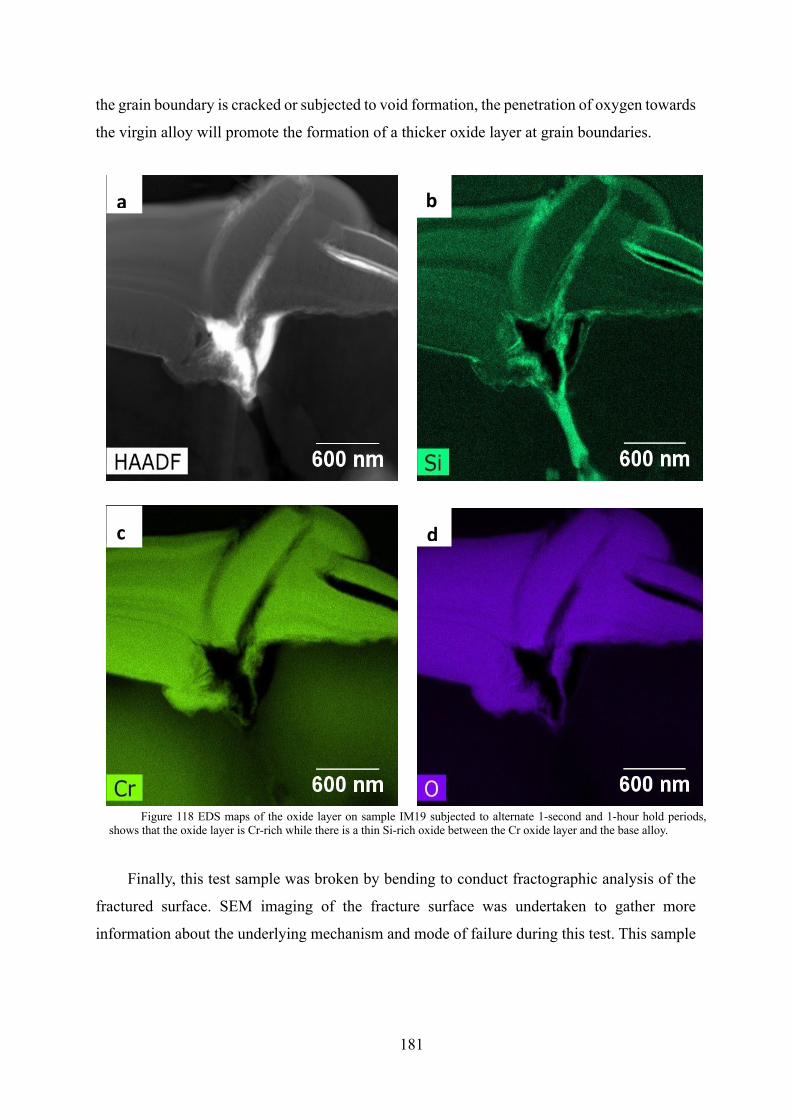
181
the grain boundary is cracked or subjected to void formation, the penetration of oxygen towards
the virgin alloy will promote the formation of a thicker oxide layer at grain boundaries.
Finally, this test sample was broken by bending to conduct fractographic analysis of the
fractured surface. SEM imaging of the fracture surface was undertaken to gather more
information about the underlying mechanism and mode of failure during this test. This sample
a b
c d
Figure 118 EDS maps of the oxide layer on sample IM19 subjected to alternate 1-second and 1-hour hold periods, shows that the oxide layer is Cr-rich while there is a thin Si-rich oxide between the Cr oxide layer and the base alloy.
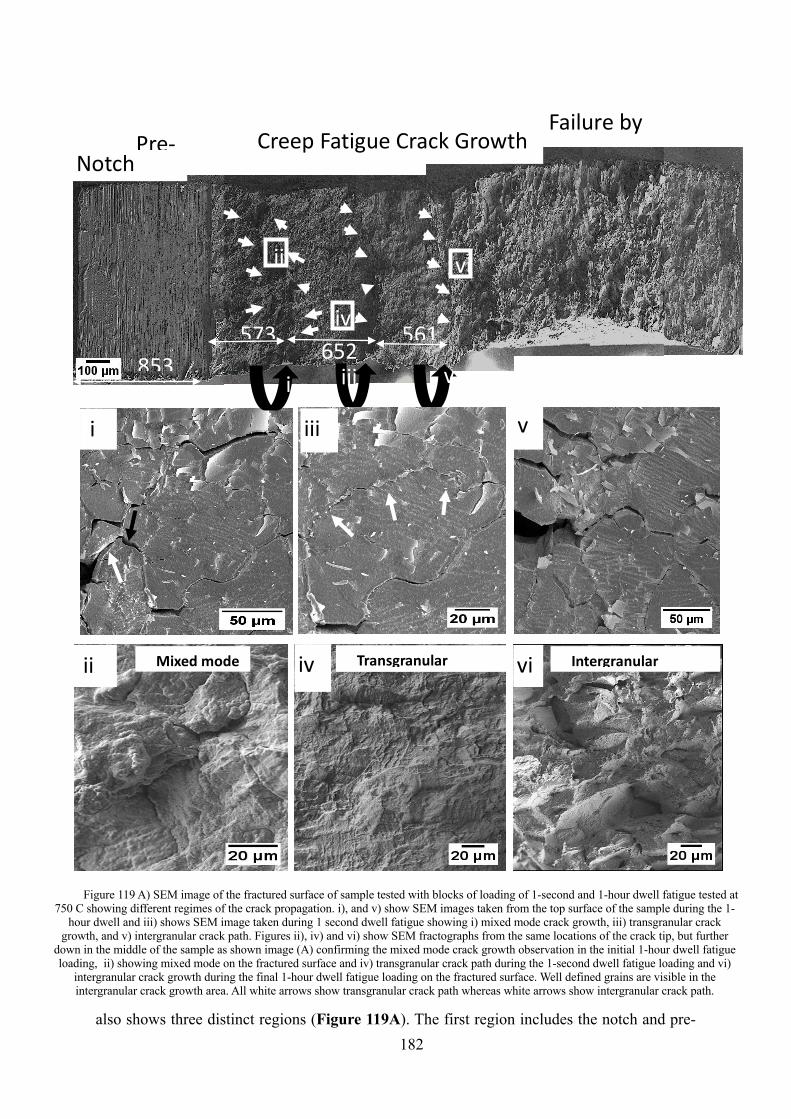
182
also shows three distinct regions (Figure 119A). The first region includes the notch and pre-
ii
Notch
573 652
561
853
Pre-Failure by bending
ii
vi iv
iv
vi
Transgranular Fracture
Intergranular Fracture
Mixed mode
i iii v
Creep Fatigue Crack Growth
i iii v
Figure 119 A) SEM image of the fractured surface of sample tested with blocks of loading of 1-second and 1-hour dwell fatigue tested at 750 C showing different regimes of the crack propagation. i), and v) show SEM images taken from the top surface of the sample during the 1-
hour dwell and iii) shows SEM image taken during 1 second dwell fatigue showing i) mixed mode crack growth, iii) transgranular crack growth, and v) intergranular crack path. Figures ii), iv) and vi) show SEM fractographs from the same locations of the crack tip, but further
down in the middle of the sample as shown image (A) confirming the mixed mode crack growth observation in the initial 1-hour dwell fatigue loading, ii) showing mixed mode on the fractured surface and iv) transgranular crack path during the 1-second dwell fatigue loading and vi)
intergranular crack growth during the final 1-hour dwell fatigue loading on the fractured surface. Well defined grains are visible in the intergranular crack growth area. All white arrows show transgranular crack path whereas white arrows show intergranular crack path.
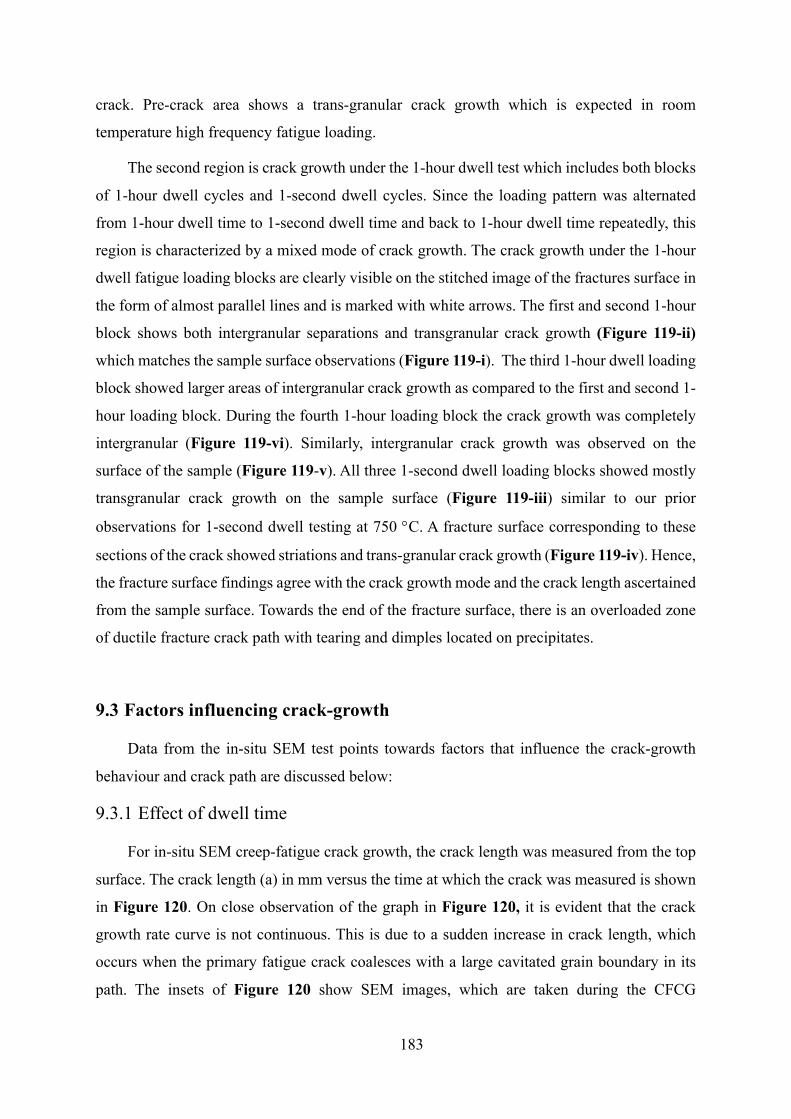
183
crack. Pre-crack area shows a trans-granular crack growth which is expected in room
temperature high frequency fatigue loading.
The second region is crack growth under the 1-hour dwell test which includes both blocks
of 1-hour dwell cycles and 1-second dwell cycles. Since the loading pattern was alternated
from 1-hour dwell time to 1-second dwell time and back to 1-hour dwell time repeatedly, this
region is characterized by a mixed mode of crack growth. The crack growth under the 1-hour
dwell fatigue loading blocks are clearly visible on the stitched image of the fractures surface in
the form of almost parallel lines and is marked with white arrows. The first and second 1-hour
block shows both intergranular separations and transgranular crack growth (Figure 119-ii)
which matches the sample surface observations (Figure 119-i). The third 1-hour dwell loading
block showed larger areas of intergranular crack growth as compared to the first and second 1-
hour loading block. During the fourth 1-hour loading block the crack growth was completely
intergranular (Figure 119-vi). Similarly, intergranular crack growth was observed on the
surface of the sample (Figure 119-v). All three 1-second dwell loading blocks showed mostly
transgranular crack growth on the sample surface (Figure 119-iii) similar to our prior
observations for 1-second dwell testing at 750 °C. A fracture surface corresponding to these
sections of the crack showed striations and trans-granular crack growth (Figure 119-iv). Hence,
the fracture surface findings agree with the crack growth mode and the crack length ascertained
from the sample surface. Towards the end of the fracture surface, there is an overloaded zone
of ductile fracture crack path with tearing and dimples located on precipitates.
9.3 Factors influencing crack-growth
Data from the in-situ SEM test points towards factors that influence the crack-growth
behaviour and crack path are discussed below:
9.3.1 Effect of dwell time
For in-situ SEM creep-fatigue crack growth, the crack length was measured from the top
surface. The crack length (a) in mm versus the time at which the crack was measured is shown
in Figure 120. On close observation of the graph in Figure 120, it is evident that the crack
growth rate curve is not continuous. This is due to a sudden increase in crack length, which
occurs when the primary fatigue crack coalesces with a large cavitated grain boundary in its
path. The insets of Figure 120 show SEM images, which are taken during the CFCG
A)
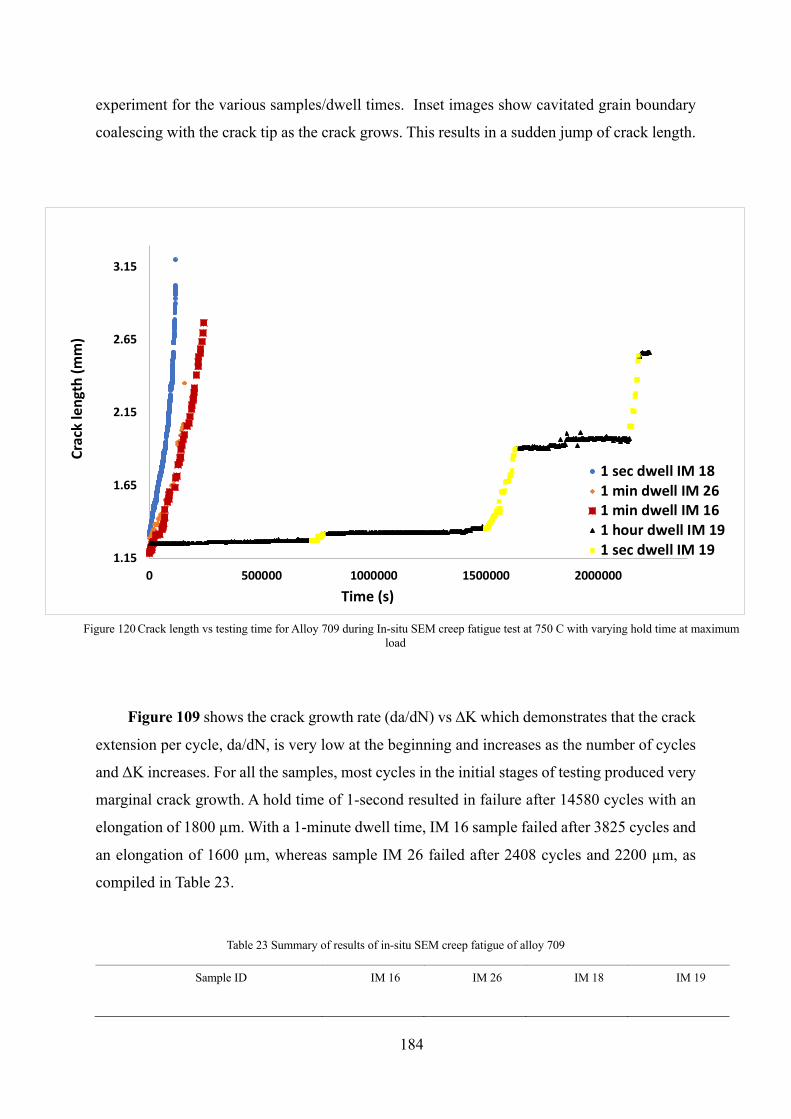
184
experiment for the various samples/dwell times. Inset images show cavitated grain boundary
coalescing with the crack tip as the crack grows. This results in a sudden jump of crack length.
Figure 109 shows the crack growth rate (da/dN) vs ∆K which demonstrates that the crack
extension per cycle, da/dN, is very low at the beginning and increases as the number of cycles
and ΔK increases. For all the samples, most cycles in the initial stages of testing produced very
marginal crack growth. A hold time of 1-second resulted in failure after 14580 cycles with an
elongation of 1800 µm. With a 1-minute dwell time, IM 16 sample failed after 3825 cycles and
an elongation of 1600 µm, whereas sample IM 26 failed after 2408 cycles and 2200 µm, as
compiled in Table 23.
Table 23 Summary of results of in-situ SEM creep fatigue of alloy 709
Sample ID IM 16 IM 26 IM 18 IM 19
1.15
1.65
2.15
2.65
3.15
0 500000 1000000 1500000 2000000
Crac
k le
ngth
(mm
)
Time (s)
1 sec dwell IM 181 min dwell IM 261 min dwell IM 161 hour dwell IM 191 sec dwell IM 19
Figure 120 Crack length vs testing time for Alloy 709 during In-situ SEM creep fatigue test at 750 C with varying hold time at maximum load
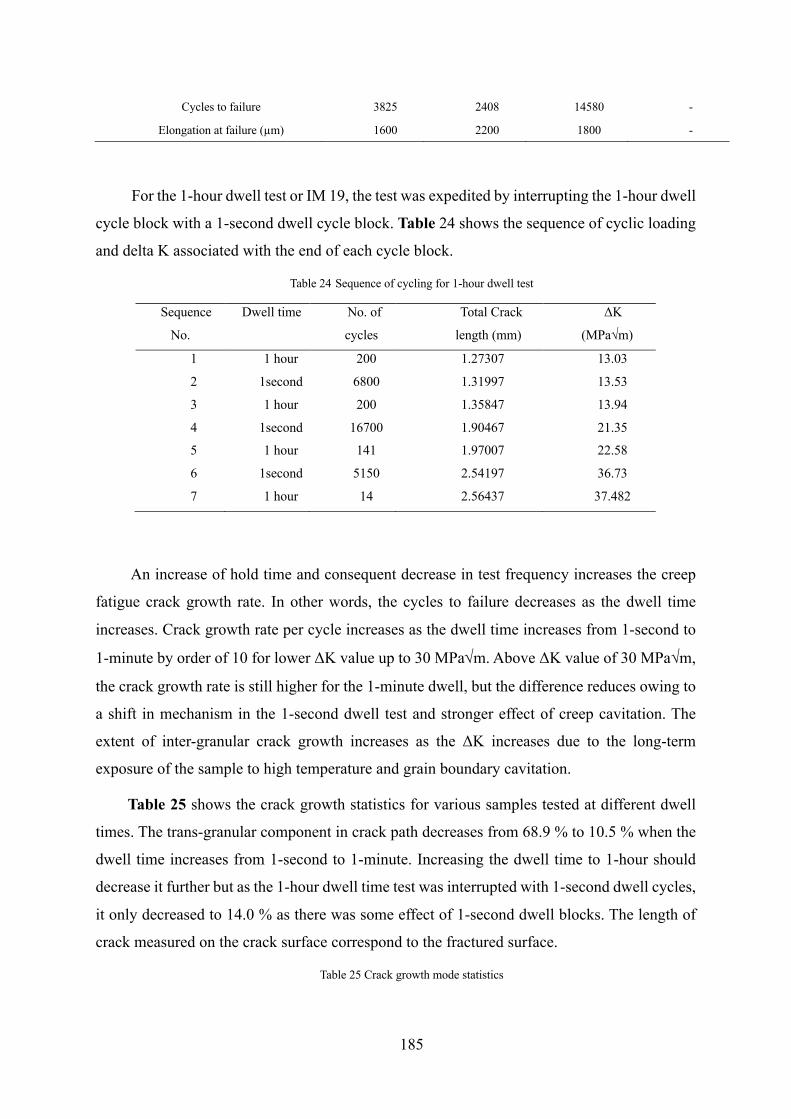
185
Cycles to failure 3825 2408 14580 -
Elongation at failure (µm) 1600 2200 1800 -
For the 1-hour dwell test or IM 19, the test was expedited by interrupting the 1-hour dwell
cycle block with a 1-second dwell cycle block. Table 24 shows the sequence of cyclic loading
and delta K associated with the end of each cycle block.
Table 24 Sequence of cycling for 1-hour dwell test
Sequence
No.
Dwell time No. of
cycles
Total Crack
length (mm)
ΔK
(MPa√m)
1 1 hour 200 1.27307 13.03
2 1second 6800 1.31997 13.53
3 1 hour 200 1.35847 13.94
4 1second 16700 1.90467 21.35
5 1 hour 141 1.97007 22.58
6 1second 5150 2.54197 36.73
7 1 hour 14 2.56437 37.482
An increase of hold time and consequent decrease in test frequency increases the creep
fatigue crack growth rate. In other words, the cycles to failure decreases as the dwell time
increases. Crack growth rate per cycle increases as the dwell time increases from 1-second to
1-minute by order of 10 for lower ΔK value up to 30 MPaÖm. Above ΔK value of 30 MPa√m,
the crack growth rate is still higher for the 1-minute dwell, but the difference reduces owing to
a shift in mechanism in the 1-second dwell test and stronger effect of creep cavitation. The
extent of inter-granular crack growth increases as the ΔK increases due to the long-term
exposure of the sample to high temperature and grain boundary cavitation.
Table 25 shows the crack growth statistics for various samples tested at different dwell
times. The trans-granular component in crack path decreases from 68.9 % to 10.5 % when the
dwell time increases from 1-second to 1-minute. Increasing the dwell time to 1-hour should
decrease it further but as the 1-hour dwell time test was interrupted with 1-second dwell cycles,
it only decreased to 14.0 % as there was some effect of 1-second dwell blocks. The length of
crack measured on the crack surface correspond to the fractured surface.
Table 25 Crack growth mode statistics
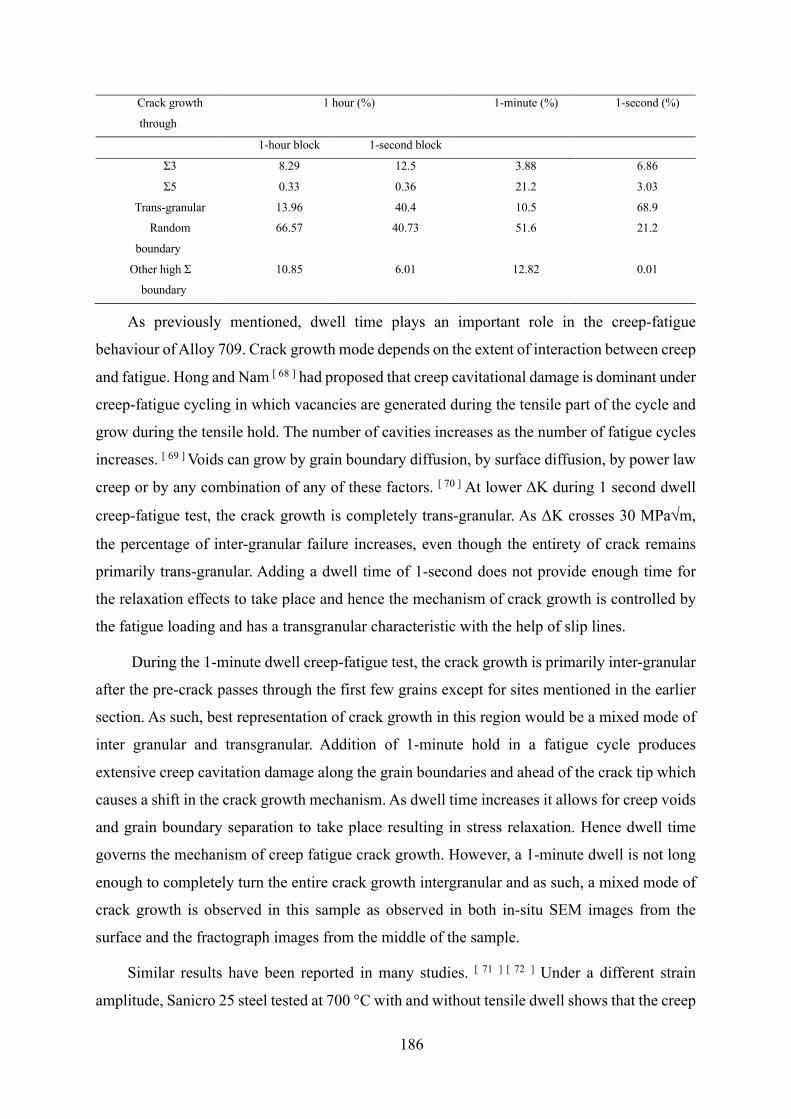
186
Crack growth
through
1 hour (%) 1-minute (%) 1-second (%)
1-hour block 1-second block
Σ3 8.29 12.5 3.88 6.86
Σ5 0.33 0.36 21.2 3.03
Trans-granular 13.96 40.4 10.5 68.9
Random
boundary
66.57 40.73 51.6 21.2
Other high Σ
boundary
10.85 6.01 12.82 0.01
As previously mentioned, dwell time plays an important role in the creep-fatigue
behaviour of Alloy 709. Crack growth mode depends on the extent of interaction between creep
and fatigue. Hong and Nam [ 68 ] had proposed that creep cavitational damage is dominant under
creep-fatigue cycling in which vacancies are generated during the tensile part of the cycle and
grow during the tensile hold. The number of cavities increases as the number of fatigue cycles
increases. [ 69 ] Voids can grow by grain boundary diffusion, by surface diffusion, by power law
creep or by any combination of any of these factors. [ 70 ] At lower ΔK during 1 second dwell
creep-fatigue test, the crack growth is completely trans-granular. As ΔK crosses 30 MPaÖm,
the percentage of inter-granular failure increases, even though the entirety of crack remains
primarily trans-granular. Adding a dwell time of 1-second does not provide enough time for
the relaxation effects to take place and hence the mechanism of crack growth is controlled by
the fatigue loading and has a transgranular characteristic with the help of slip lines.
During the 1-minute dwell creep-fatigue test, the crack growth is primarily inter-granular
after the pre-crack passes through the first few grains except for sites mentioned in the earlier
section. As such, best representation of crack growth in this region would be a mixed mode of
inter granular and transgranular. Addition of 1-minute hold in a fatigue cycle produces
extensive creep cavitation damage along the grain boundaries and ahead of the crack tip which
causes a shift in the crack growth mechanism. As dwell time increases it allows for creep voids
and grain boundary separation to take place resulting in stress relaxation. Hence dwell time
governs the mechanism of creep fatigue crack growth. However, a 1-minute dwell is not long
enough to completely turn the entire crack growth intergranular and as such, a mixed mode of
crack growth is observed in this sample as observed in both in-situ SEM images from the
surface and the fractograph images from the middle of the sample.
Similar results have been reported in many studies. [ 71 ] [ 72 ] Under a different strain
amplitude, Sanicro 25 steel tested at 700 °C with and without tensile dwell shows that the creep
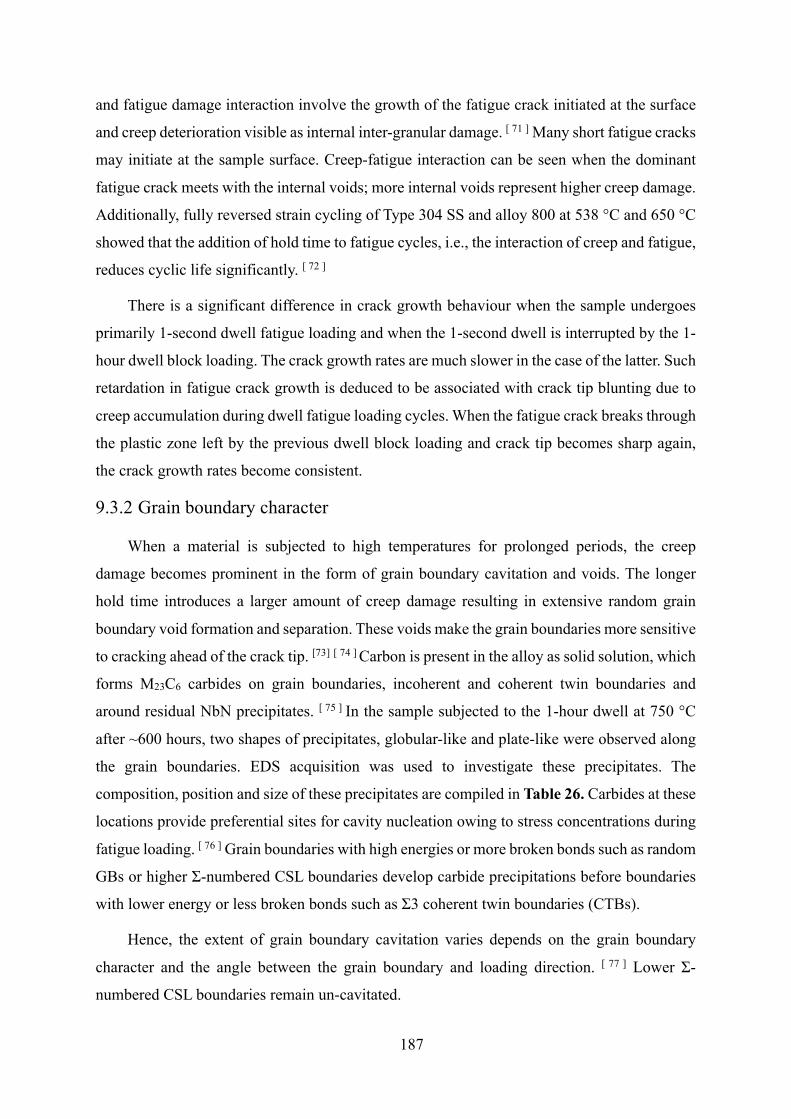
187
and fatigue damage interaction involve the growth of the fatigue crack initiated at the surface
and creep deterioration visible as internal inter-granular damage. [ 71 ] Many short fatigue cracks
may initiate at the sample surface. Creep-fatigue interaction can be seen when the dominant
fatigue crack meets with the internal voids; more internal voids represent higher creep damage.
Additionally, fully reversed strain cycling of Type 304 SS and alloy 800 at 538 °C and 650 °C
showed that the addition of hold time to fatigue cycles, i.e., the interaction of creep and fatigue,
reduces cyclic life significantly. [ 72 ]
There is a significant difference in crack growth behaviour when the sample undergoes
primarily 1-second dwell fatigue loading and when the 1-second dwell is interrupted by the 1-
hour dwell block loading. The crack growth rates are much slower in the case of the latter. Such
retardation in fatigue crack growth is deduced to be associated with crack tip blunting due to
creep accumulation during dwell fatigue loading cycles. When the fatigue crack breaks through
the plastic zone left by the previous dwell block loading and crack tip becomes sharp again,
the crack growth rates become consistent.
9.3.2 Grain boundary character
When a material is subjected to high temperatures for prolonged periods, the creep
damage becomes prominent in the form of grain boundary cavitation and voids. The longer
hold time introduces a larger amount of creep damage resulting in extensive random grain
boundary void formation and separation. These voids make the grain boundaries more sensitive
to cracking ahead of the crack tip. [73] [ 74 ] Carbon is present in the alloy as solid solution, which
forms M23C6 carbides on grain boundaries, incoherent and coherent twin boundaries and
around residual NbN precipitates. [ 75 ] In the sample subjected to the 1-hour dwell at 750 °C
after ~600 hours, two shapes of precipitates, globular-like and plate-like were observed along
the grain boundaries. EDS acquisition was used to investigate these precipitates. The
composition, position and size of these precipitates are compiled in Table 26. Carbides at these
locations provide preferential sites for cavity nucleation owing to stress concentrations during
fatigue loading. [ 76 ] Grain boundaries with high energies or more broken bonds such as random
GBs or higher Σ-numbered CSL boundaries develop carbide precipitations before boundaries
with lower energy or less broken bonds such as Σ3 coherent twin boundaries (CTBs).
Hence, the extent of grain boundary cavitation varies depends on the grain boundary
character and the angle between the grain boundary and loading direction. [ 77 ] Lower Σ-
numbered CSL boundaries remain un-cavitated.
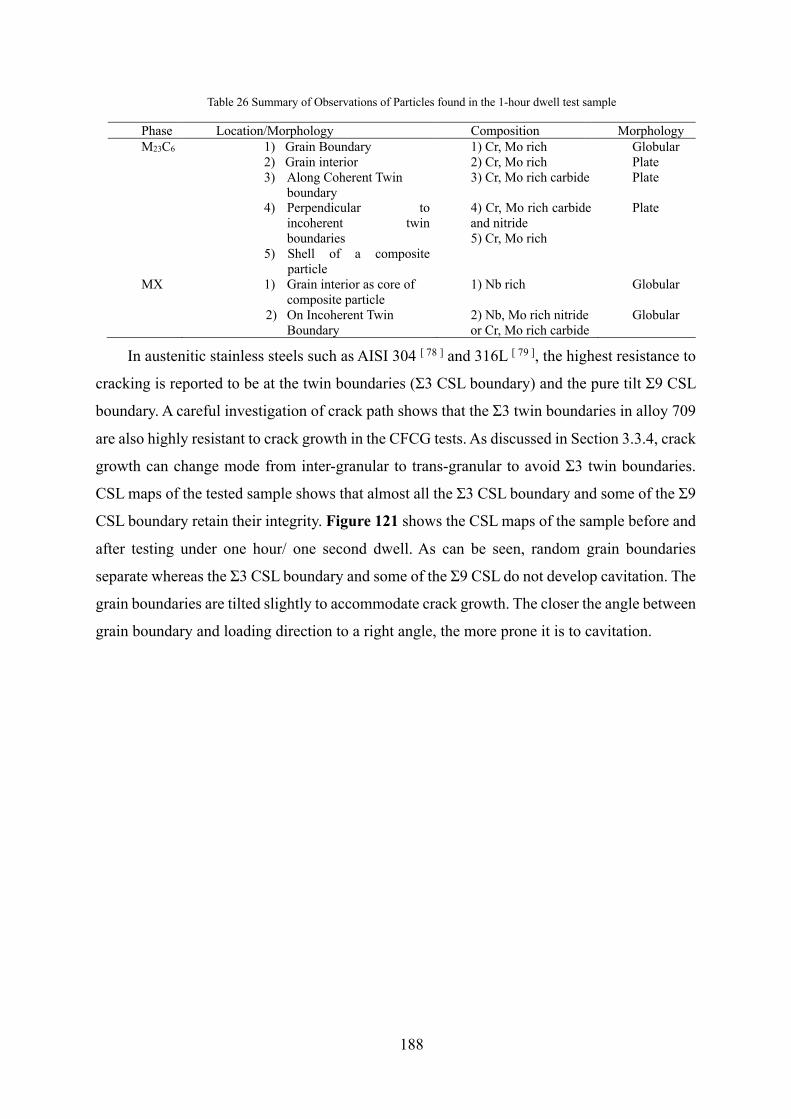
188
Table 26 Summary of Observations of Particles found in the 1-hour dwell test sample
Phase Location/Morphology Composition Morphology M23C6 1) Grain Boundary
2) Grain interior 3) Along Coherent Twin
boundary 4) Perpendicular to
incoherent twin boundaries
5) Shell of a composite particle
1) Cr, Mo rich 2) Cr, Mo rich 3) Cr, Mo rich carbide 4) Cr, Mo rich carbide and nitride 5) Cr, Mo rich
Globular Plate Plate Plate
MX 1) Grain interior as core of composite particle
2) On Incoherent Twin Boundary
1) Nb rich 2) Nb, Mo rich nitride or Cr, Mo rich carbide
Globular Globular
In austenitic stainless steels such as AISI 304 [ 78 ] and 316L [ 79 ], the highest resistance to
cracking is reported to be at the twin boundaries (Σ3 CSL boundary) and the pure tilt Σ9 CSL
boundary. A careful investigation of crack path shows that the Σ3 twin boundaries in alloy 709
are also highly resistant to crack growth in the CFCG tests. As discussed in Section 3.3.4, crack
growth can change mode from inter-granular to trans-granular to avoid Σ3 twin boundaries.
CSL maps of the tested sample shows that almost all the Σ3 CSL boundary and some of the Σ9
CSL boundary retain their integrity. Figure 121 shows the CSL maps of the sample before and
after testing under one hour/ one second dwell. As can be seen, random grain boundaries
separate whereas the Σ3 CSL boundary and some of the Σ9 CSL do not develop cavitation. The
grain boundaries are tilted slightly to accommodate crack growth. The closer the angle between
grain boundary and loading direction to a right angle, the more prone it is to cavitation.
4 1
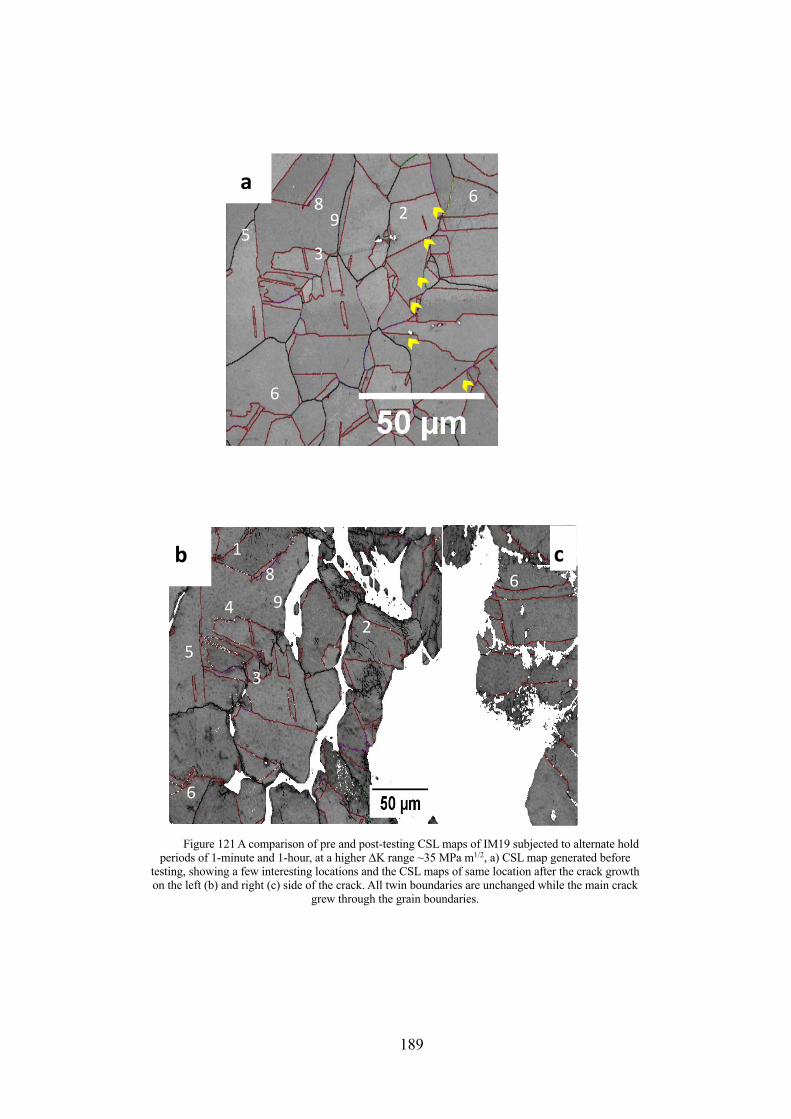
189
8 7
7 b c
6
5
8 9 2
6
3
a
1
2
3
4
5
6 8 9
6
Figure 121 A comparison of pre and post-testing CSL maps of IM19 subjected to alternate hold periods of 1-minute and 1-hour, at a higher ΔK range ~35 MPa m1/2, a) CSL map generated before
testing, showing a few interesting locations and the CSL maps of same location after the crack growth on the left (b) and right (c) side of the crack. All twin boundaries are unchanged while the main crack
grew through the grain boundaries.
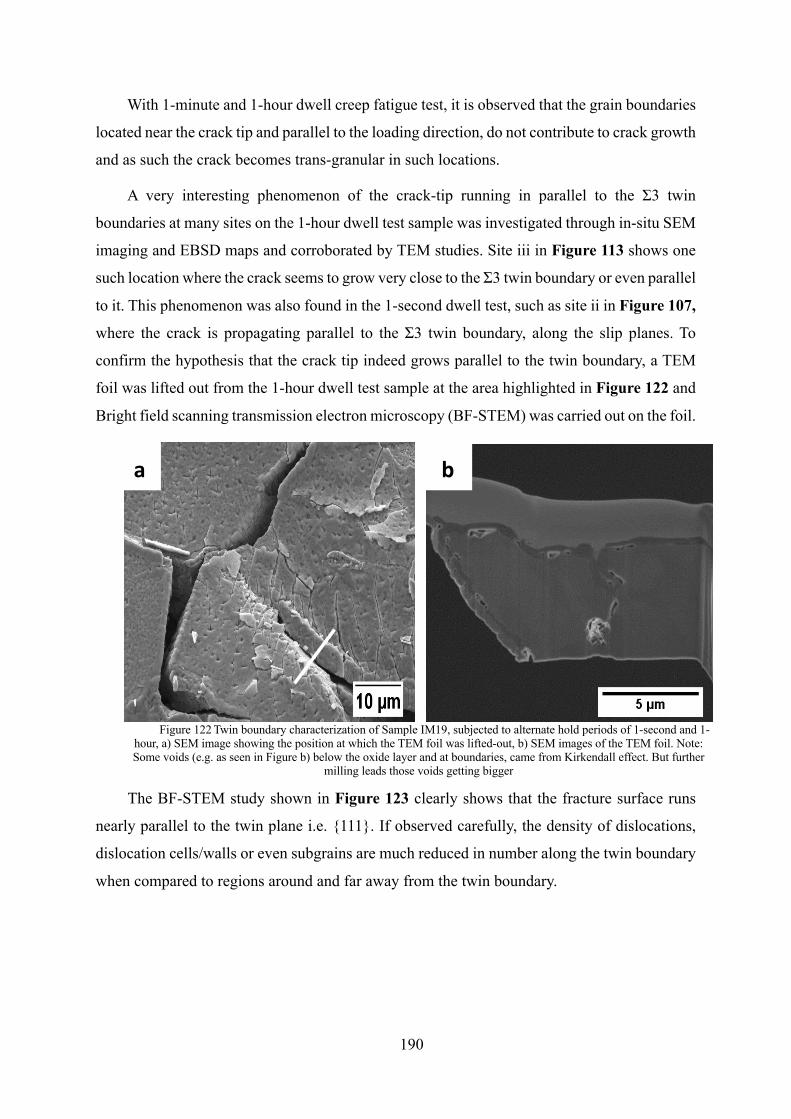
190
With 1-minute and 1-hour dwell creep fatigue test, it is observed that the grain boundaries
located near the crack tip and parallel to the loading direction, do not contribute to crack growth
and as such the crack becomes trans-granular in such locations.
A very interesting phenomenon of the crack-tip running in parallel to the Σ3 twin
boundaries at many sites on the 1-hour dwell test sample was investigated through in-situ SEM
imaging and EBSD maps and corroborated by TEM studies. Site iii in Figure 113 shows one
such location where the crack seems to grow very close to the Σ3 twin boundary or even parallel
to it. This phenomenon was also found in the 1-second dwell test, such as site ii in Figure 107,
where the crack is propagating parallel to the Σ3 twin boundary, along the slip planes. To
confirm the hypothesis that the crack tip indeed grows parallel to the twin boundary, a TEM
foil was lifted out from the 1-hour dwell test sample at the area highlighted in Figure 122 and
Bright field scanning transmission electron microscopy (BF-STEM) was carried out on the foil.
The BF-STEM study shown in Figure 123 clearly shows that the fracture surface runs
nearly parallel to the twin plane i.e. {111}. If observed carefully, the density of dislocations,
dislocation cells/walls or even subgrains are much reduced in number along the twin boundary
when compared to regions around and far away from the twin boundary.
a b
Figure 122 Twin boundary characterization of Sample IM19, subjected to alternate hold periods of 1-second and 1-hour, a) SEM image showing the position at which the TEM foil was lifted-out, b) SEM images of the TEM foil. Note: Some voids (e.g. as seen in Figure b) below the oxide layer and at boundaries, came from Kirkendall effect. But further
milling leads those voids getting bigger
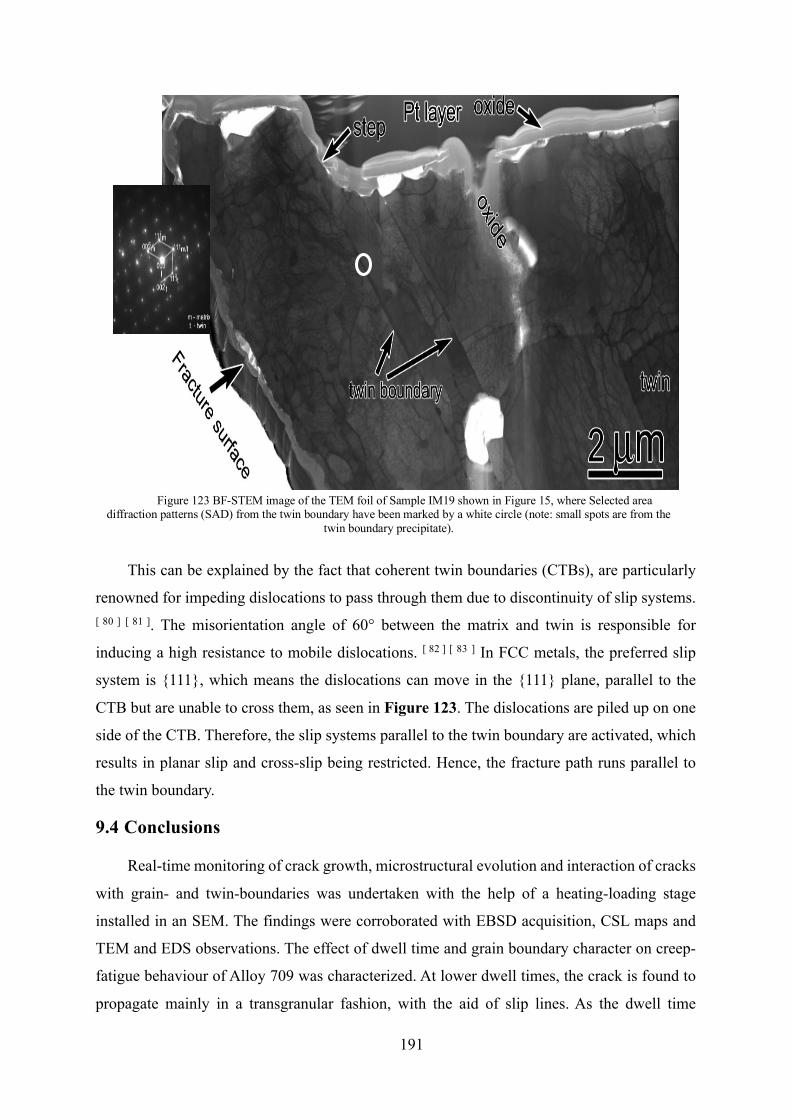
191
This can be explained by the fact that coherent twin boundaries (CTBs), are particularly
renowned for impeding dislocations to pass through them due to discontinuity of slip systems. [ 80 ] [ 81 ]. The misorientation angle of 60° between the matrix and twin is responsible for
inducing a high resistance to mobile dislocations. [ 82 ] [ 83 ] In FCC metals, the preferred slip
system is {111}, which means the dislocations can move in the {111} plane, parallel to the
CTB but are unable to cross them, as seen in Figure 123. The dislocations are piled up on one
side of the CTB. Therefore, the slip systems parallel to the twin boundary are activated, which
results in planar slip and cross-slip being restricted. Hence, the fracture path runs parallel to
the twin boundary.
9.4 Conclusions
Real-time monitoring of crack growth, microstructural evolution and interaction of cracks
with grain- and twin-boundaries was undertaken with the help of a heating-loading stage
installed in an SEM. The findings were corroborated with EBSD acquisition, CSL maps and
TEM and EDS observations. The effect of dwell time and grain boundary character on creep-
fatigue behaviour of Alloy 709 was characterized. At lower dwell times, the crack is found to
propagate mainly in a transgranular fashion, with the aid of slip lines. As the dwell time
Figure 123 BF-STEM image of the TEM foil of Sample IM19 shown in Figure 15, where Selected area diffraction patterns (SAD) from the twin boundary have been marked by a white circle (note: small spots are from the
twin boundary precipitate).

192
increases, the fatigue life decreases, and creep cavitation damage become more dominant. As
a result, crack growth shifts from transgranular, to mixed mode and then to solely intergranular.
In general, a transgranular crack is observed growing with the help of slip lines whereas an
intergranular crack grows by the coalescence of voids and grain boundary separation. Over a
period of in-situ heating and loading, a flaky layer developed on the surfaces of all the samples,
relatively thicker in the sample subjected to the 1-hour dwell test. The high-temperature CFCG
tests indicate that twin boundaries produce a strengthening effect by impeding dislocation
motion due to a discontinuity in the slip system.
193
10 Dwell-fatigue crack growth in Alloy709
(The results presented in this chapter will be submitted at as journal article.
Authors:- Jin Yan, Suyang Yu, Rengen Ding, Hangyue Li, Afsaneh Rabiei and
Paul Bowen.
Title:- “A study of creep-fatigue crack growth behaviour of an advanced
stainless steel Alloy 709”." To be submitted.)
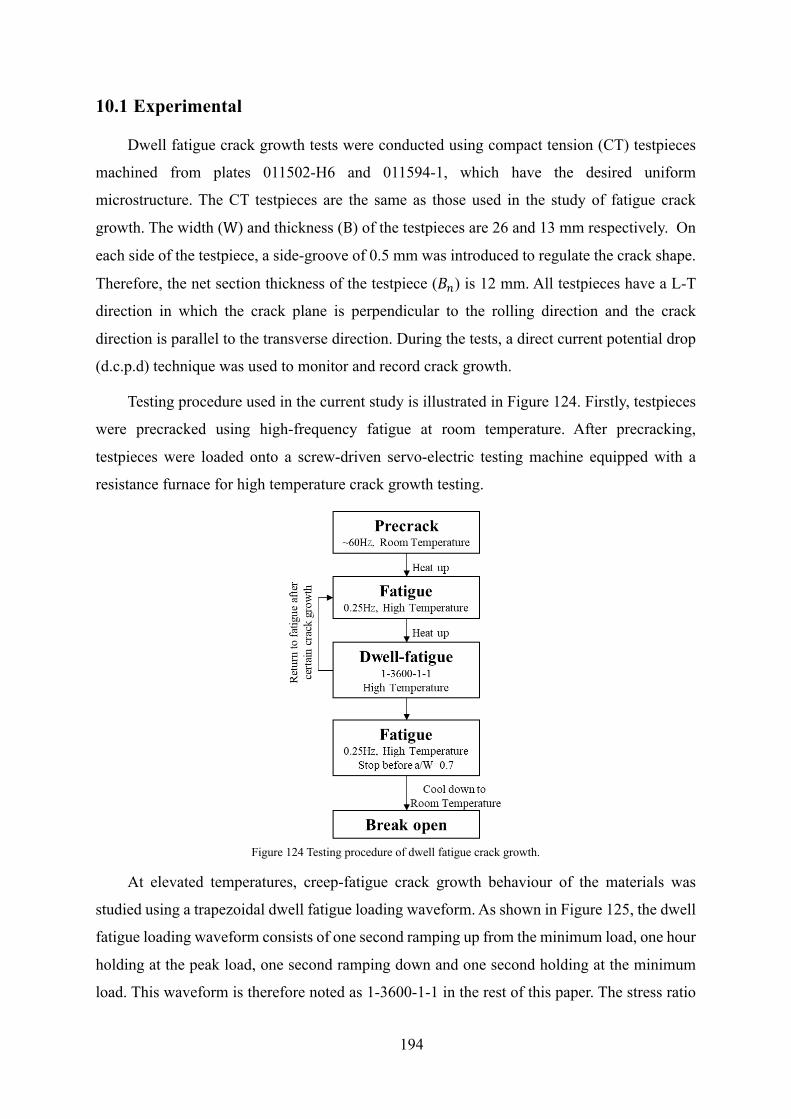
194
10.1 Experimental
Dwell fatigue crack growth tests were conducted using compact tension (CT) testpieces
machined from plates 011502-H6 and 011594-1, which have the desired uniform
microstructure. The CT testpieces are the same as those used in the study of fatigue crack
growth. The width (W) and thickness (B) of the testpieces are 26 and 13 mm respectively. On
each side of the testpiece, a side-groove of 0.5 mm was introduced to regulate the crack shape.
Therefore, the net section thickness of the testpiece (E() is 12 mm. All testpieces have a L-T
direction in which the crack plane is perpendicular to the rolling direction and the crack
direction is parallel to the transverse direction. During the tests, a direct current potential drop
(d.c.p.d) technique was used to monitor and record crack growth.
Testing procedure used in the current study is illustrated in Figure 124. Firstly, testpieces
were precracked using high-frequency fatigue at room temperature. After precracking,
testpieces were loaded onto a screw-driven servo-electric testing machine equipped with a
resistance furnace for high temperature crack growth testing.
Figure 124 Testing procedure of dwell fatigue crack growth.
At elevated temperatures, creep-fatigue crack growth behaviour of the materials was
studied using a trapezoidal dwell fatigue loading waveform. As shown in Figure 125, the dwell
fatigue loading waveform consists of one second ramping up from the minimum load, one hour
holding at the peak load, one second ramping down and one second holding at the minimum
load. This waveform is therefore noted as 1-3600-1-1 in the rest of this paper. The stress ratio
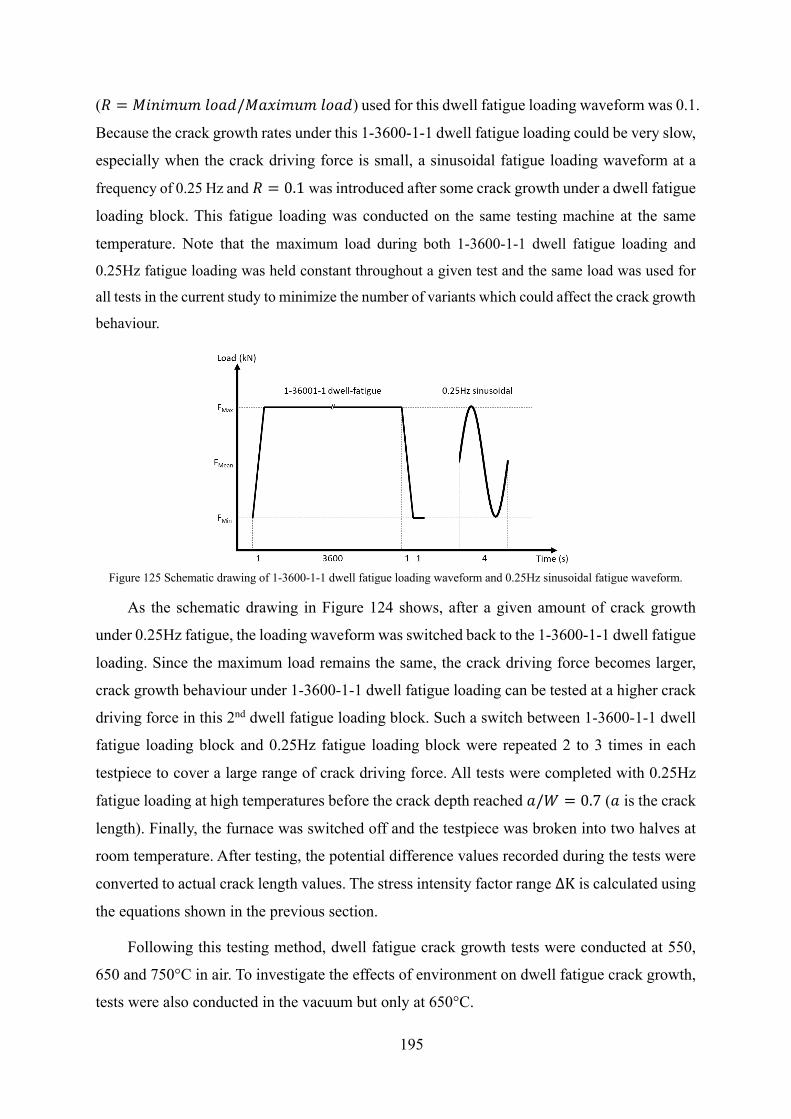
195
(0 = ÅÇ3ÇÉÑÉÖÜH!/ÅHáÇÉÑÉÖÜH!) used for this dwell fatigue loading waveform was 0.1.
Because the crack growth rates under this 1-3600-1-1 dwell fatigue loading could be very slow,
especially when the crack driving force is small, a sinusoidal fatigue loading waveform at a
frequency of 0.25 Hz and 0 = 0.1 was introduced after some crack growth under a dwell fatigue
loading block. This fatigue loading was conducted on the same testing machine at the same
temperature. Note that the maximum load during both 1-3600-1-1 dwell fatigue loading and
0.25Hz fatigue loading was held constant throughout a given test and the same load was used for
all tests in the current study to minimize the number of variants which could affect the crack growth
behaviour.
Figure 125 Schematic drawing of 1-3600-1-1 dwell fatigue loading waveform and 0.25Hz sinusoidal fatigue waveform.
As the schematic drawing in Figure 124 shows, after a given amount of crack growth
under 0.25Hz fatigue, the loading waveform was switched back to the 1-3600-1-1 dwell fatigue
loading. Since the maximum load remains the same, the crack driving force becomes larger,
crack growth behaviour under 1-3600-1-1 dwell fatigue loading can be tested at a higher crack
driving force in this 2nd dwell fatigue loading block. Such a switch between 1-3600-1-1 dwell
fatigue loading block and 0.25Hz fatigue loading block were repeated 2 to 3 times in each
testpiece to cover a large range of crack driving force. All tests were completed with 0.25Hz
fatigue loading at high temperatures before the crack depth reached H/G = 0.7 (H is the crack
length). Finally, the furnace was switched off and the testpiece was broken into two halves at
room temperature. After testing, the potential difference values recorded during the tests were
converted to actual crack length values. The stress intensity factor range ∆K is calculated using
the equations shown in the previous section.
Following this testing method, dwell fatigue crack growth tests were conducted at 550,
650 and 750°C in air. To investigate the effects of environment on dwell fatigue crack growth,
tests were also conducted in the vacuum but only at 650°C.
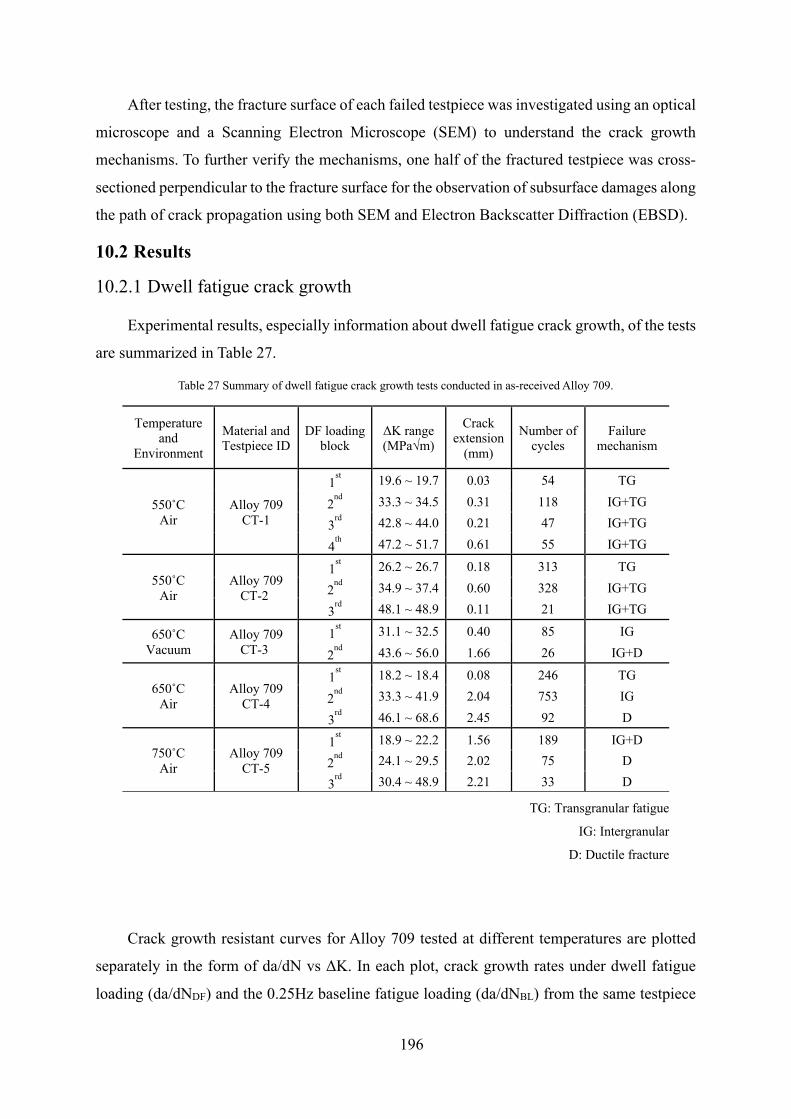
196
After testing, the fracture surface of each failed testpiece was investigated using an optical
microscope and a Scanning Electron Microscope (SEM) to understand the crack growth
mechanisms. To further verify the mechanisms, one half of the fractured testpiece was cross-
sectioned perpendicular to the fracture surface for the observation of subsurface damages along
the path of crack propagation using both SEM and Electron Backscatter Diffraction (EBSD).
10.2 Results
10.2.1 Dwell fatigue crack growth
Experimental results, especially information about dwell fatigue crack growth, of the tests
are summarized in Table 27.
Table 27 Summary of dwell fatigue crack growth tests conducted in as-received Alloy 709.
Temperature and
Environment
Material and Testpiece ID
DF loading block
ΔK range (MPa√m)
Crack extension
(mm)
Number of cycles
Failure mechanism
550˚C Air
Alloy 709 CT-1
1st 19.6 ~ 19.7 0.03 54 TG
2nd
33.3 ~ 34.5 0.31 118 IG+TG
3rd
42.8 ~ 44.0 0.21 47 IG+TG
4th
47.2 ~ 51.7 0.61 55 IG+TG
550˚C Air
Alloy 709 CT-2
1st 26.2 ~ 26.7 0.18 313 TG
2nd
34.9 ~ 37.4 0.60 328 IG+TG
3rd
48.1 ~ 48.9 0.11 21 IG+TG
650˚C Vacuum
Alloy 709 CT-3
1st 31.1 ~ 32.5 0.40 85 IG
2nd
43.6 ~ 56.0 1.66 26 IG+D
650˚C Air
Alloy 709 CT-4
1st 18.2 ~ 18.4 0.08 246 TG
2nd
33.3 ~ 41.9 2.04 753 IG
3rd
46.1 ~ 68.6 2.45 92 D
750˚C Air
Alloy 709 CT-5
1st 18.9 ~ 22.2 1.56 189 IG+D
2nd
24.1 ~ 29.5 2.02 75 D
3rd
30.4 ~ 48.9 2.21 33 D
TG: Transgranular fatigue
IG: Intergranular
D: Ductile fracture
Crack growth resistant curves for Alloy 709 tested at different temperatures are plotted
separately in the form of da/dN vs ΔK. In each plot, crack growth rates under dwell fatigue
loading (da/dNDF) and the 0.25Hz baseline fatigue loading (da/dNBL) from the same testpiece
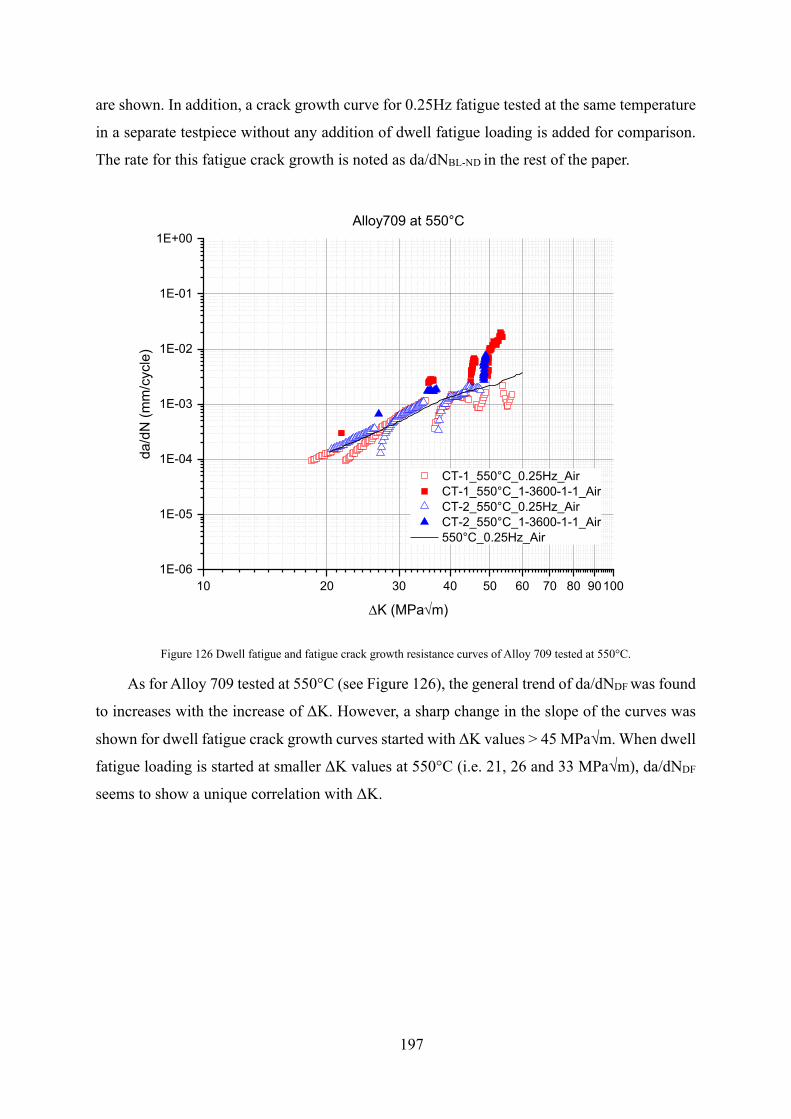
197
are shown. In addition, a crack growth curve for 0.25Hz fatigue tested at the same temperature
in a separate testpiece without any addition of dwell fatigue loading is added for comparison.
The rate for this fatigue crack growth is noted as da/dNBL-ND in the rest of the paper.
Figure 126 Dwell fatigue and fatigue crack growth resistance curves of Alloy 709 tested at 550°C.
As for Alloy 709 tested at 550°C (see Figure 126), the general trend of da/dNDF was found
to increases with the increase of ΔK. However, a sharp change in the slope of the curves was
shown for dwell fatigue crack growth curves started with ΔK values > 45 MPa√m. When dwell
fatigue loading is started at smaller ΔK values at 550°C (i.e. 21, 26 and 33 MPa√m), da/dNDF
seems to show a unique correlation with ΔK.
10 20 30 40 50 60 70 80 901001E-06
1E-05
1E-04
1E-03
1E-02
1E-01
1E+00Alloy709 at 550°C
da/d
N (
mm
/cyc
le)
DK (MPaÖm)
CT-1_550°C_0.25Hz_Air CT-1_550°C_1-3600-1-1_Air CT-2_550°C_0.25Hz_Air CT-2_550°C_1-3600-1-1_Air 550°C_0.25Hz_Air
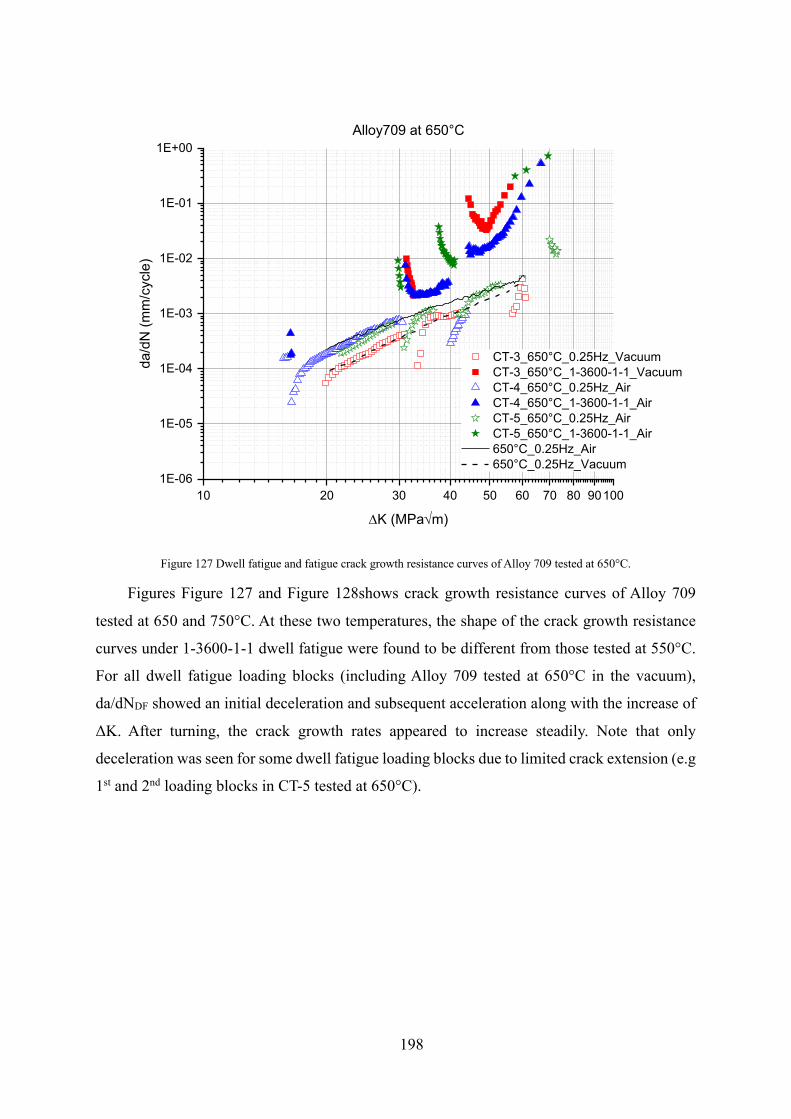
198
Figure 127 Dwell fatigue and fatigue crack growth resistance curves of Alloy 709 tested at 650°C.
Figures Figure 127 and Figure 128shows crack growth resistance curves of Alloy 709
tested at 650 and 750°C. At these two temperatures, the shape of the crack growth resistance
curves under 1-3600-1-1 dwell fatigue were found to be different from those tested at 550°C.
For all dwell fatigue loading blocks (including Alloy 709 tested at 650°C in the vacuum),
da/dNDF showed an initial deceleration and subsequent acceleration along with the increase of
ΔK. After turning, the crack growth rates appeared to increase steadily. Note that only
deceleration was seen for some dwell fatigue loading blocks due to limited crack extension (e.g
1st and 2nd loading blocks in CT-5 tested at 650°C).
10 20 30 40 50 60 70 80 901001E-06
1E-05
1E-04
1E-03
1E-02
1E-01
1E+00Alloy709 at 650°C
da/d
N (
mm
/cyc
le)
DK (MPaÖm)
CT-3_650°C_0.25Hz_Vacuum CT-3_650°C_1-3600-1-1_Vacuum CT-4_650°C_0.25Hz_Air CT-4_650°C_1-3600-1-1_Air CT-5_650°C_0.25Hz_Air CT-5_650°C_1-3600-1-1_Air 650°C_0.25Hz_Air 650°C_0.25Hz_Vacuum
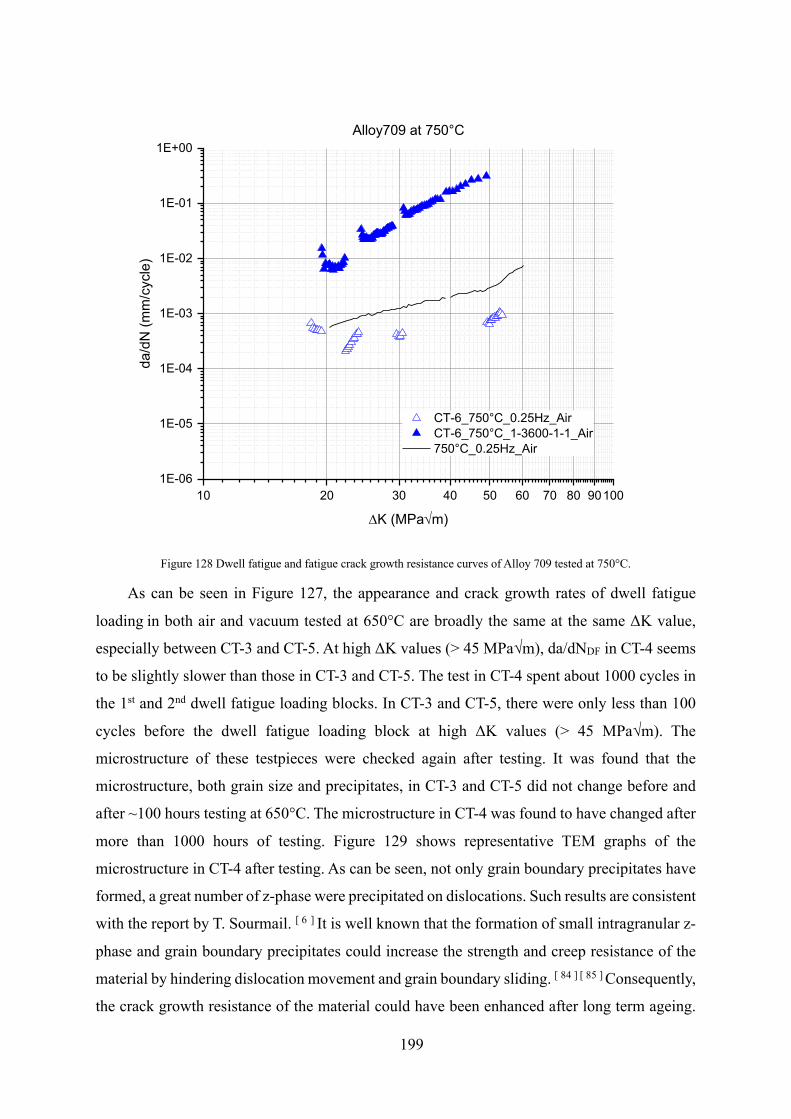
199
Figure 128 Dwell fatigue and fatigue crack growth resistance curves of Alloy 709 tested at 750°C.
As can be seen in Figure 127, the appearance and crack growth rates of dwell fatigue
loading in both air and vacuum tested at 650°C are broadly the same at the same ΔK value,
especially between CT-3 and CT-5. At high ΔK values (> 45 MPa√m), da/dNDF in CT-4 seems
to be slightly slower than those in CT-3 and CT-5. The test in CT-4 spent about 1000 cycles in
the 1st and 2nd dwell fatigue loading blocks. In CT-3 and CT-5, there were only less than 100
cycles before the dwell fatigue loading block at high ΔK values (> 45 MPa√m). The
microstructure of these testpieces were checked again after testing. It was found that the
microstructure, both grain size and precipitates, in CT-3 and CT-5 did not change before and
after ~100 hours testing at 650°C. The microstructure in CT-4 was found to have changed after
more than 1000 hours of testing. Figure 129 shows representative TEM graphs of the
microstructure in CT-4 after testing. As can be seen, not only grain boundary precipitates have
formed, a great number of z-phase were precipitated on dislocations. Such results are consistent
with the report by T. Sourmail. [ 6 ] It is well known that the formation of small intragranular z-
phase and grain boundary precipitates could increase the strength and creep resistance of the
material by hindering dislocation movement and grain boundary sliding. [ 84 ] [ 85 ] Consequently,
the crack growth resistance of the material could have been enhanced after long term ageing.
10 20 30 40 50 60 70 80 901001E-06
1E-05
1E-04
1E-03
1E-02
1E-01
1E+00Alloy709 at 750°C
da/d
N (
mm
/cyc
le)
DK (MPaÖm)
CT-6_750°C_0.25Hz_Air CT-6_750°C_1-3600-1-1_Air 750°C_0.25Hz_Air
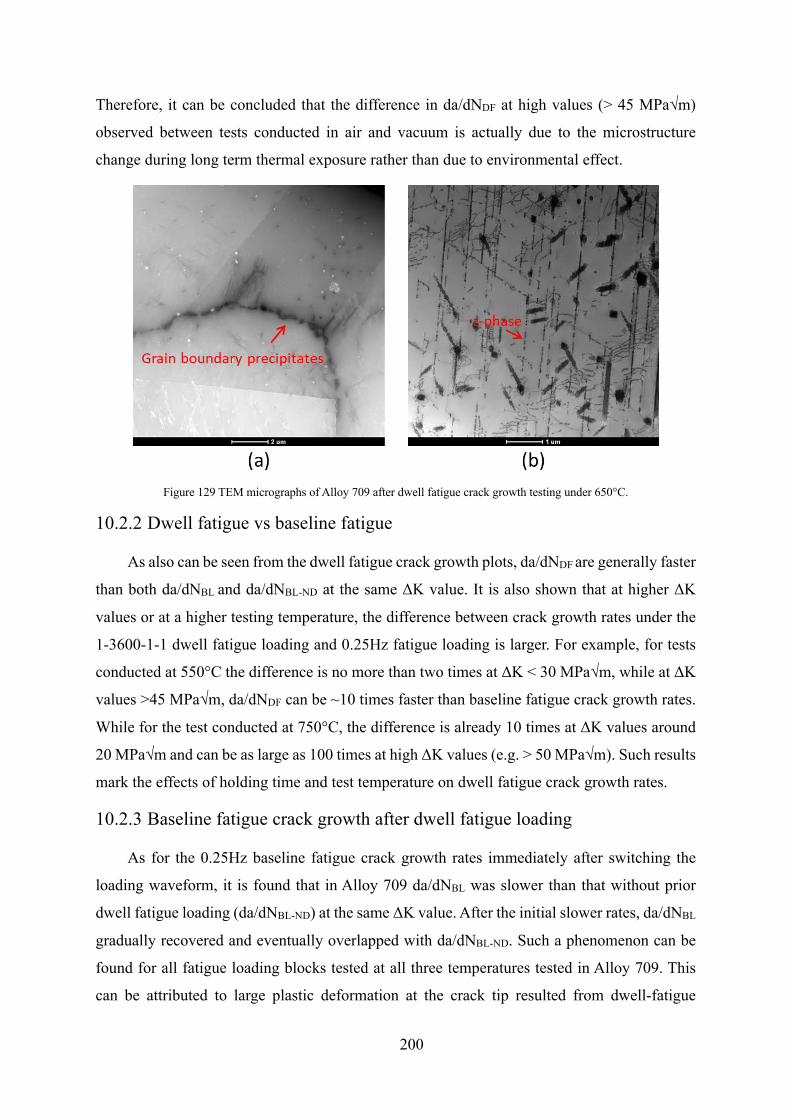
200
Therefore, it can be concluded that the difference in da/dNDF at high values (> 45 MPa√m)
observed between tests conducted in air and vacuum is actually due to the microstructure
change during long term thermal exposure rather than due to environmental effect.
Figure 129 TEM micrographs of Alloy 709 after dwell fatigue crack growth testing under 650°C.
10.2.2 Dwell fatigue vs baseline fatigue
As also can be seen from the dwell fatigue crack growth plots, da/dNDF are generally faster
than both da/dNBL and da/dNBL-ND at the same ΔK value. It is also shown that at higher ΔK
values or at a higher testing temperature, the difference between crack growth rates under the
1-3600-1-1 dwell fatigue loading and 0.25Hz fatigue loading is larger. For example, for tests
conducted at 550°C the difference is no more than two times at ΔK < 30 MPa√m, while at ΔK
values >45 MPa√m, da/dNDF can be ~10 times faster than baseline fatigue crack growth rates.
While for the test conducted at 750°C, the difference is already 10 times at ΔK values around
20 MPa√m and can be as large as 100 times at high ΔK values (e.g. > 50 MPa√m). Such results
mark the effects of holding time and test temperature on dwell fatigue crack growth rates.
10.2.3 Baseline fatigue crack growth after dwell fatigue loading
As for the 0.25Hz baseline fatigue crack growth rates immediately after switching the
loading waveform, it is found that in Alloy 709 da/dNBL was slower than that without prior
dwell fatigue loading (da/dNBL-ND) at the same ΔK value. After the initial slower rates, da/dNBL
gradually recovered and eventually overlapped with da/dNBL-ND. Such a phenomenon can be
found for all fatigue loading blocks tested at all three temperatures tested in Alloy 709. This
can be attributed to large plastic deformation at the crack tip resulted from dwell-fatigue
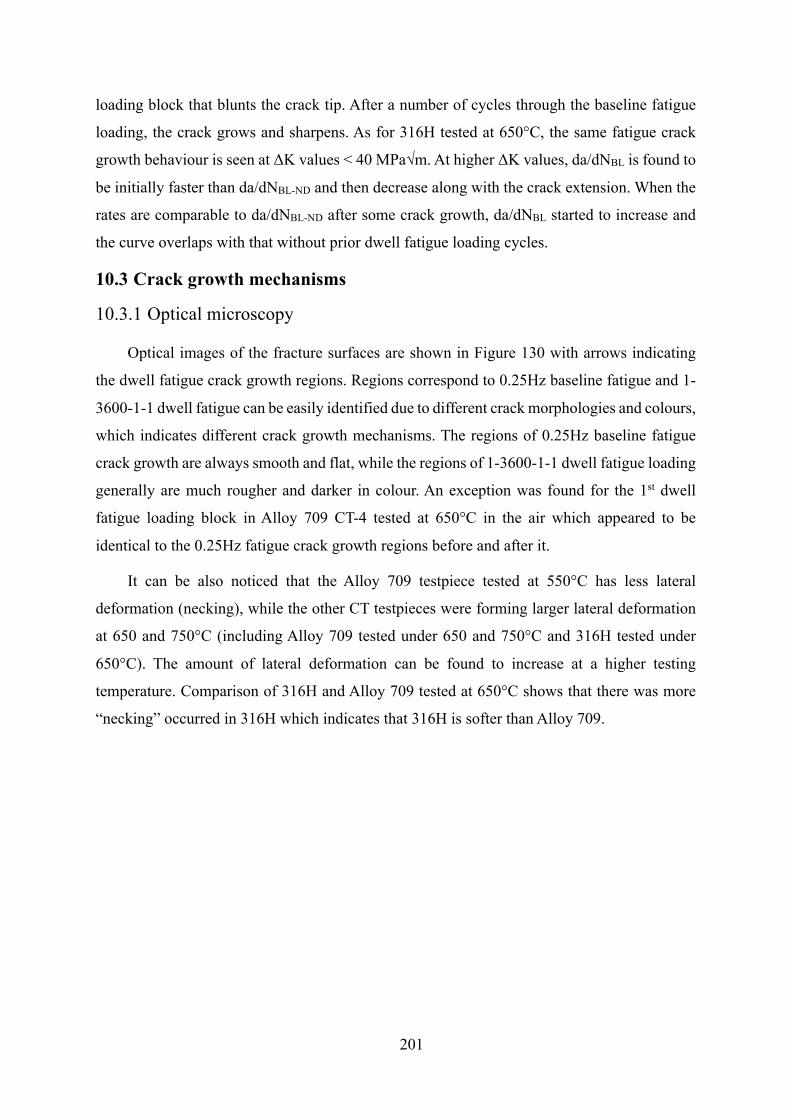
201
loading block that blunts the crack tip. After a number of cycles through the baseline fatigue
loading, the crack grows and sharpens. As for 316H tested at 650°C, the same fatigue crack
growth behaviour is seen at ΔK values < 40 MPa√m. At higher ΔK values, da/dNBL is found to
be initially faster than da/dNBL-ND and then decrease along with the crack extension. When the
rates are comparable to da/dNBL-ND after some crack growth, da/dNBL started to increase and
the curve overlaps with that without prior dwell fatigue loading cycles.
10.3 Crack growth mechanisms
10.3.1 Optical microscopy
Optical images of the fracture surfaces are shown in Figure 130 with arrows indicating
the dwell fatigue crack growth regions. Regions correspond to 0.25Hz baseline fatigue and 1-
3600-1-1 dwell fatigue can be easily identified due to different crack morphologies and colours,
which indicates different crack growth mechanisms. The regions of 0.25Hz baseline fatigue
crack growth are always smooth and flat, while the regions of 1-3600-1-1 dwell fatigue loading
generally are much rougher and darker in colour. An exception was found for the 1st dwell
fatigue loading block in Alloy 709 CT-4 tested at 650°C in the air which appeared to be
identical to the 0.25Hz fatigue crack growth regions before and after it.
It can be also noticed that the Alloy 709 testpiece tested at 550°C has less lateral
deformation (necking), while the other CT testpieces were forming larger lateral deformation
at 650 and 750°C (including Alloy 709 tested under 650 and 750°C and 316H tested under
650°C). The amount of lateral deformation can be found to increase at a higher testing
temperature. Comparison of 316H and Alloy 709 tested at 650°C shows that there was more
“necking” occurred in 316H which indicates that 316H is softer than Alloy 709.
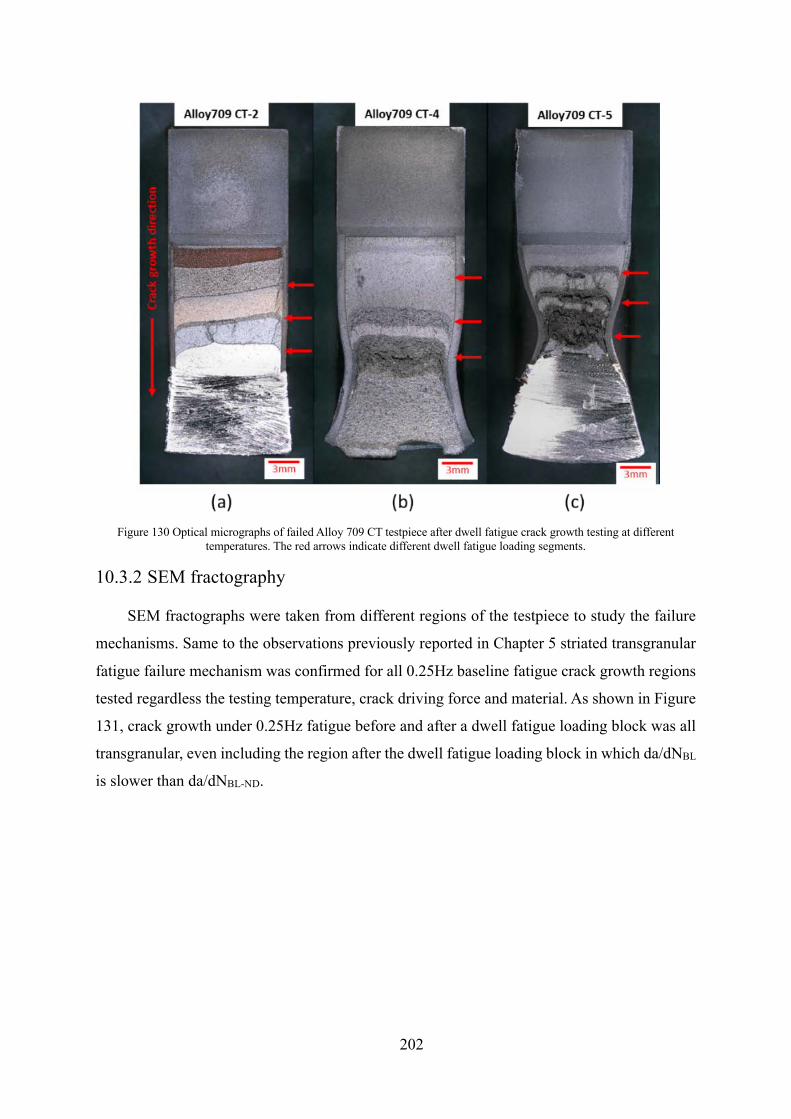
202
Figure 130 Optical micrographs of failed Alloy 709 CT testpiece after dwell fatigue crack growth testing at different
temperatures. The red arrows indicate different dwell fatigue loading segments.
10.3.2 SEM fractography
SEM fractographs were taken from different regions of the testpiece to study the failure
mechanisms. Same to the observations previously reported in Chapter 5 striated transgranular
fatigue failure mechanism was confirmed for all 0.25Hz baseline fatigue crack growth regions
tested regardless the testing temperature, crack driving force and material. As shown in Figure
131, crack growth under 0.25Hz fatigue before and after a dwell fatigue loading block was all
transgranular, even including the region after the dwell fatigue loading block in which da/dNBL
is slower than da/dNBL-ND.
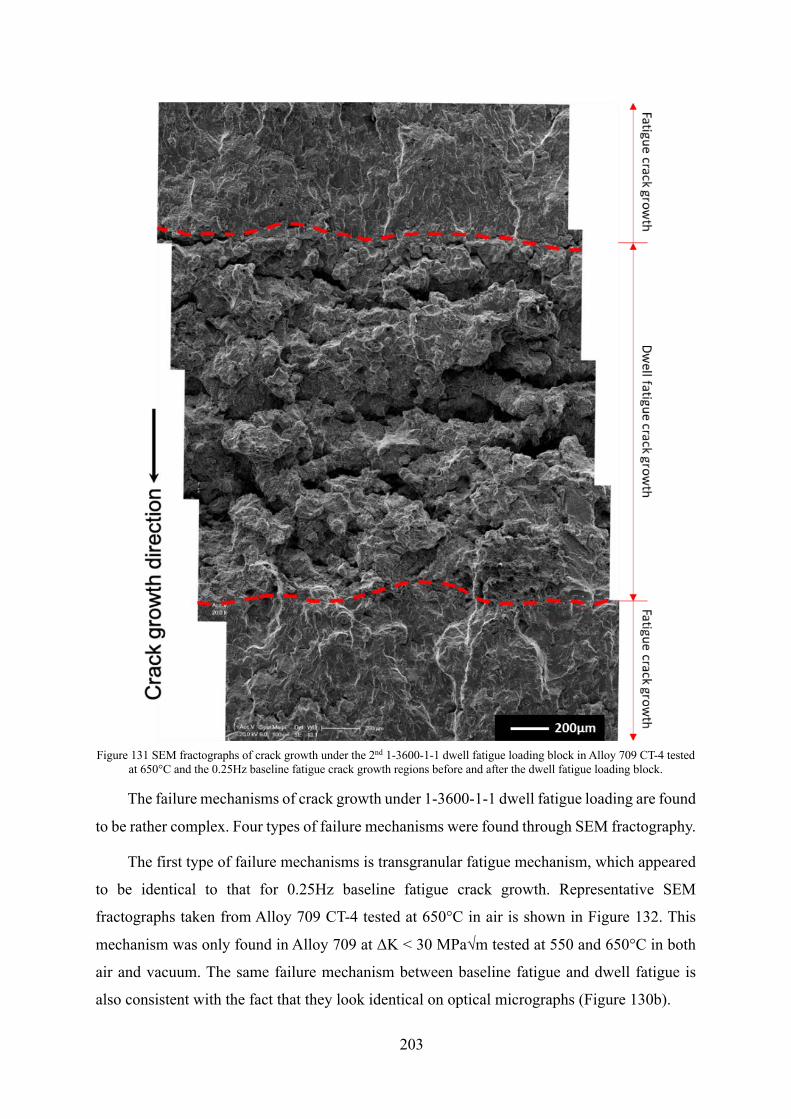
203
Figure 131 SEM fractographs of crack growth under the 2nd 1-3600-1-1 dwell fatigue loading block in Alloy 709 CT-4 tested
at 650°C and the 0.25Hz baseline fatigue crack growth regions before and after the dwell fatigue loading block.
The failure mechanisms of crack growth under 1-3600-1-1 dwell fatigue loading are found
to be rather complex. Four types of failure mechanisms were found through SEM fractography.
The first type of failure mechanisms is transgranular fatigue mechanism, which appeared
to be identical to that for 0.25Hz baseline fatigue crack growth. Representative SEM
fractographs taken from Alloy 709 CT-4 tested at 650°C in air is shown in Figure 132. This
mechanism was only found in Alloy 709 at ΔK < 30 MPa√m tested at 550 and 650°C in both
air and vacuum. The same failure mechanism between baseline fatigue and dwell fatigue is
also consistent with the fact that they look identical on optical micrographs (Figure 130b).
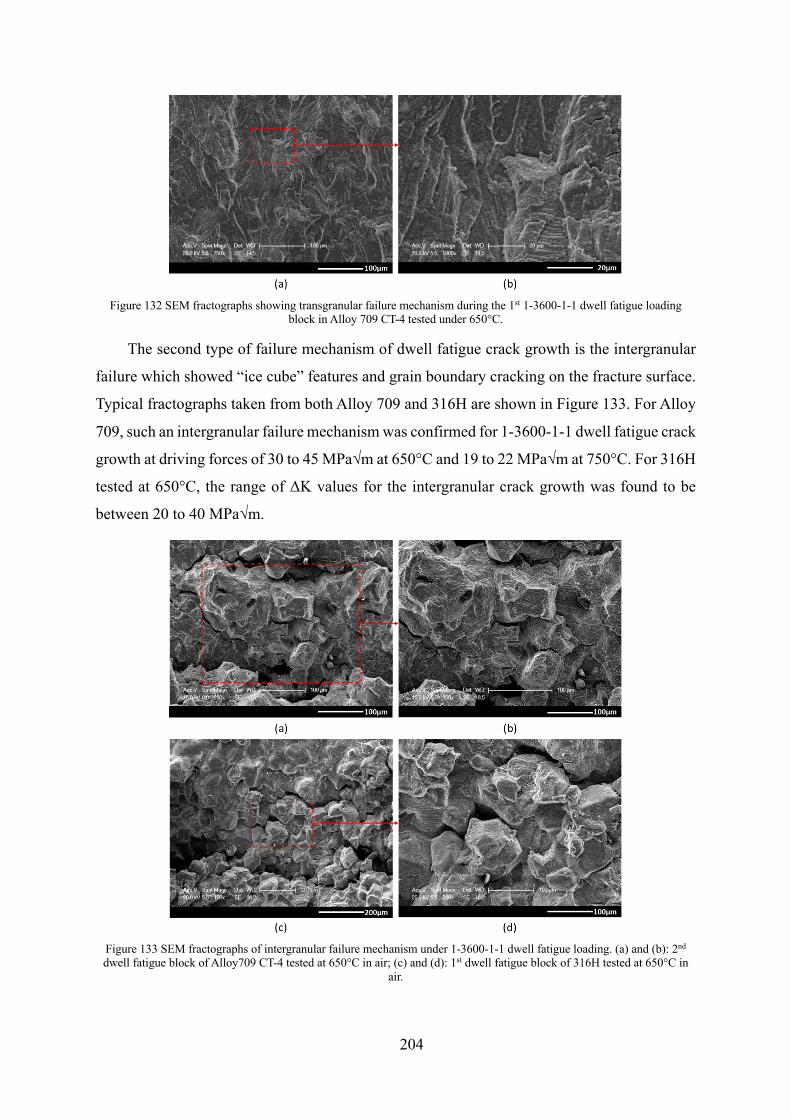
204
Figure 132 SEM fractographs showing transgranular failure mechanism during the 1st 1-3600-1-1 dwell fatigue loading
block in Alloy 709 CT-4 tested under 650°C.
The second type of failure mechanism of dwell fatigue crack growth is the intergranular
failure which showed “ice cube” features and grain boundary cracking on the fracture surface.
Typical fractographs taken from both Alloy 709 and 316H are shown in Figure 133. For Alloy
709, such an intergranular failure mechanism was confirmed for 1-3600-1-1 dwell fatigue crack
growth at driving forces of 30 to 45 MPa√m at 650°C and 19 to 22 MPa√m at 750°C. For 316H
tested at 650°C, the range of ΔK values for the intergranular crack growth was found to be
between 20 to 40 MPa√m.
Figure 133 SEM fractographs of intergranular failure mechanism under 1-3600-1-1 dwell fatigue loading. (a) and (b): 2nd dwell fatigue block of Alloy709 CT-4 tested at 650°C in air; (c) and (d): 1st dwell fatigue block of 316H tested at 650°C in
air.
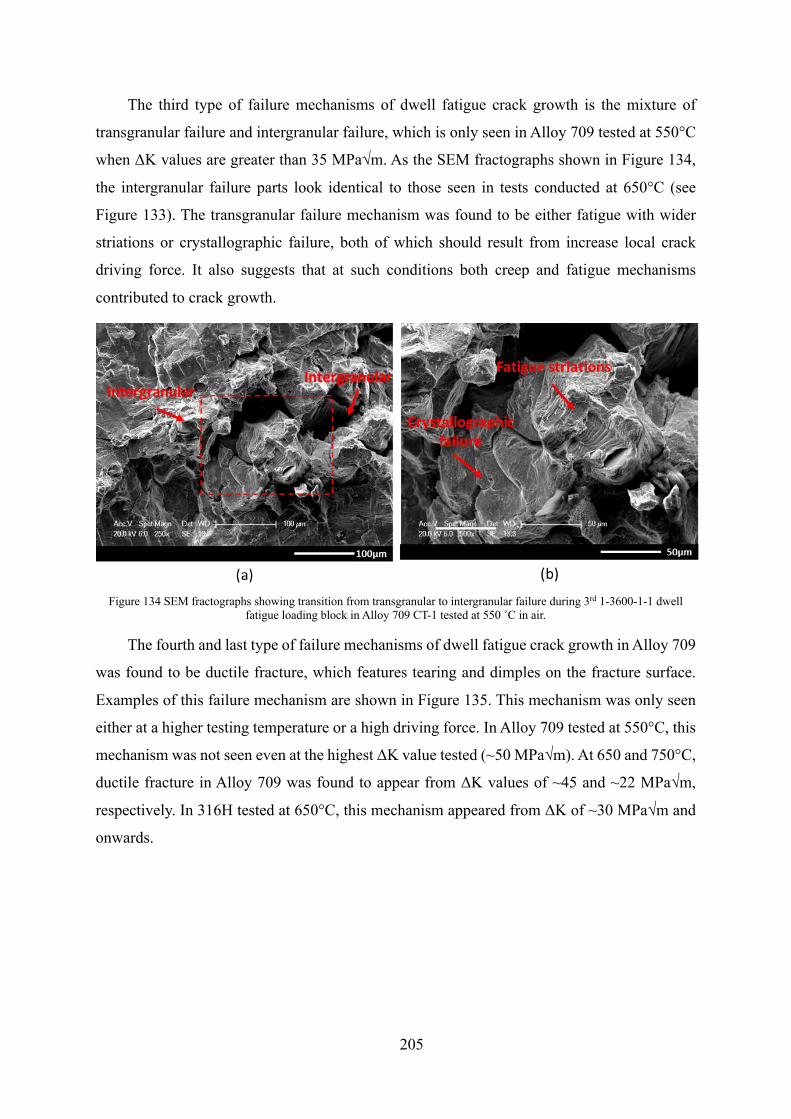
205
The third type of failure mechanisms of dwell fatigue crack growth is the mixture of
transgranular failure and intergranular failure, which is only seen in Alloy 709 tested at 550°C
when ΔK values are greater than 35 MPa√m. As the SEM fractographs shown in Figure 134,
the intergranular failure parts look identical to those seen in tests conducted at 650°C (see
Figure 133). The transgranular failure mechanism was found to be either fatigue with wider
striations or crystallographic failure, both of which should result from increase local crack
driving force. It also suggests that at such conditions both creep and fatigue mechanisms
contributed to crack growth.
Figure 134 SEM fractographs showing transition from transgranular to intergranular failure during 3rd 1-3600-1-1 dwell
fatigue loading block in Alloy 709 CT-1 tested at 550 ˚C in air.
The fourth and last type of failure mechanisms of dwell fatigue crack growth in Alloy 709
was found to be ductile fracture, which features tearing and dimples on the fracture surface.
Examples of this failure mechanism are shown in Figure 135. This mechanism was only seen
either at a higher testing temperature or a high driving force. In Alloy 709 tested at 550°C, this
mechanism was not seen even at the highest ΔK value tested (~50 MPa√m). At 650 and 750°C,
ductile fracture in Alloy 709 was found to appear from ΔK values of ~45 and ~22 MPa√m,
respectively. In 316H tested at 650°C, this mechanism appeared from ΔK of ~30 MPa√m and
onwards.
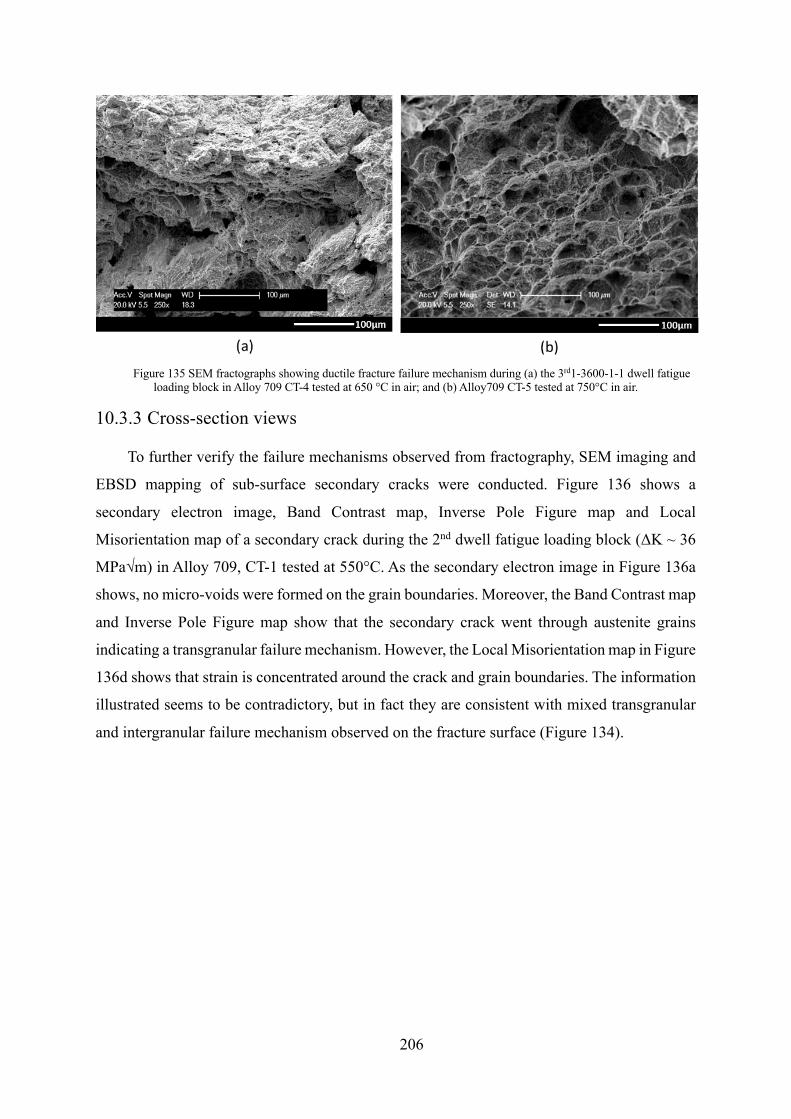
206
Figure 135 SEM fractographs showing ductile fracture failure mechanism during (a) the 3rd1-3600-1-1 dwell fatigue
loading block in Alloy 709 CT-4 tested at 650 °C in air; and (b) Alloy709 CT-5 tested at 750°C in air.
10.3.3 Cross-section views
To further verify the failure mechanisms observed from fractography, SEM imaging and
EBSD mapping of sub-surface secondary cracks were conducted. Figure 136 shows a
secondary electron image, Band Contrast map, Inverse Pole Figure map and Local
Misorientation map of a secondary crack during the 2nd dwell fatigue loading block (ΔK ~ 36
MPa√m) in Alloy 709, CT-1 tested at 550°C. As the secondary electron image in Figure 136a
shows, no micro-voids were formed on the grain boundaries. Moreover, the Band Contrast map
and Inverse Pole Figure map show that the secondary crack went through austenite grains
indicating a transgranular failure mechanism. However, the Local Misorientation map in Figure
136d shows that strain is concentrated around the crack and grain boundaries. The information
illustrated seems to be contradictory, but in fact they are consistent with mixed transgranular
and intergranular failure mechanism observed on the fracture surface (Figure 134).
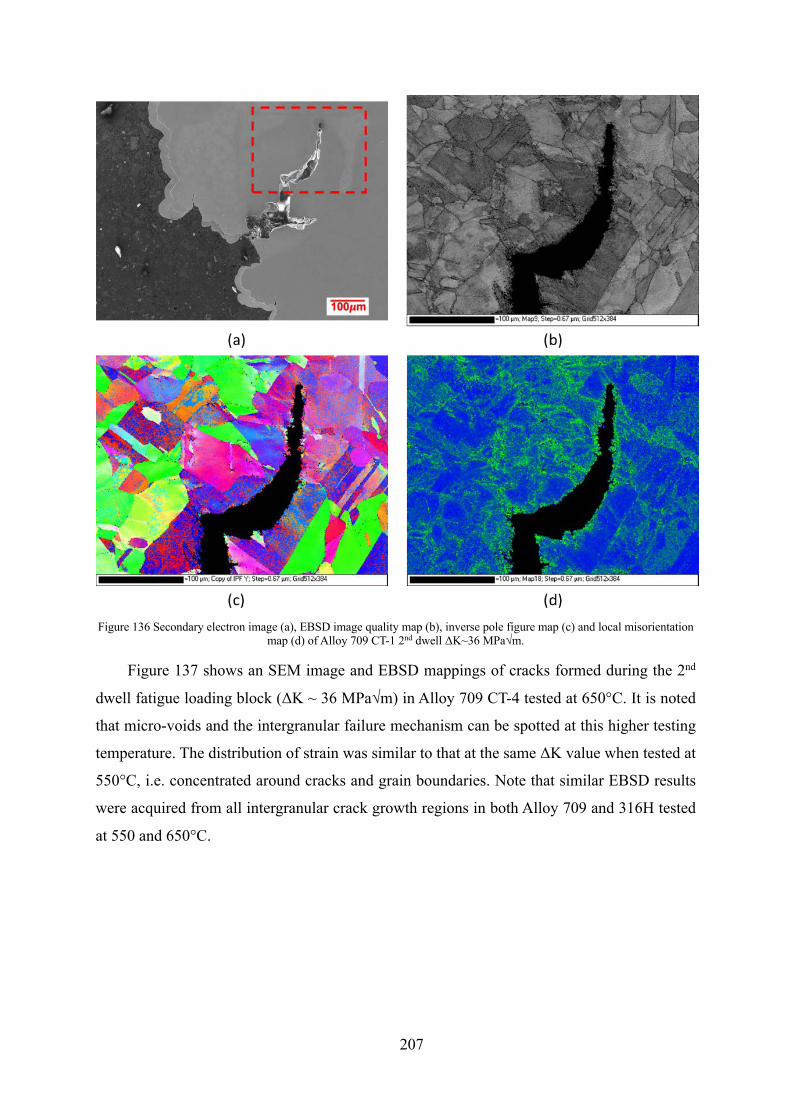
207
Figure 136 Secondary electron image (a), EBSD image quality map (b), inverse pole figure map (c) and local misorientation
map (d) of Alloy 709 CT-1 2nd dwell ΔK~36 MPa√m.
Figure 137 shows an SEM image and EBSD mappings of cracks formed during the 2nd
dwell fatigue loading block (ΔK ~ 36 MPa√m) in Alloy 709 CT-4 tested at 650°C. It is noted
that micro-voids and the intergranular failure mechanism can be spotted at this higher testing
temperature. The distribution of strain was similar to that at the same ΔK value when tested at
550°C, i.e. concentrated around cracks and grain boundaries. Note that similar EBSD results
were acquired from all intergranular crack growth regions in both Alloy 709 and 316H tested
at 550 and 650°C.
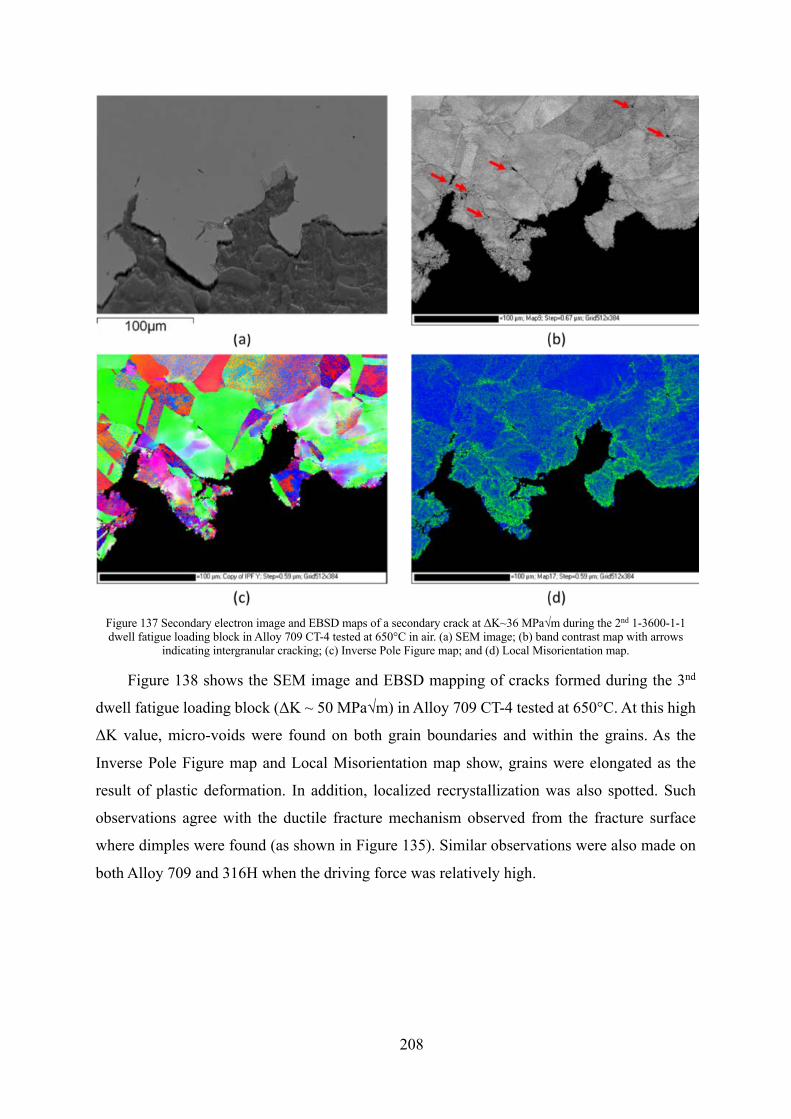
208
Figure 137 Secondary electron image and EBSD maps of a secondary crack at ΔK~36 MPa√m during the 2nd 1-3600-1-1 dwell fatigue loading block in Alloy 709 CT-4 tested at 650°C in air. (a) SEM image; (b) band contrast map with arrows
indicating intergranular cracking; (c) Inverse Pole Figure map; and (d) Local Misorientation map.
Figure 138 shows the SEM image and EBSD mapping of cracks formed during the 3nd
dwell fatigue loading block (ΔK ~ 50 MPa√m) in Alloy 709 CT-4 tested at 650°C. At this high
ΔK value, micro-voids were found on both grain boundaries and within the grains. As the
Inverse Pole Figure map and Local Misorientation map show, grains were elongated as the
result of plastic deformation. In addition, localized recrystallization was also spotted. Such
observations agree with the ductile fracture mechanism observed from the fracture surface
where dimples were found (as shown in Figure 135). Similar observations were also made on
both Alloy 709 and 316H when the driving force was relatively high.
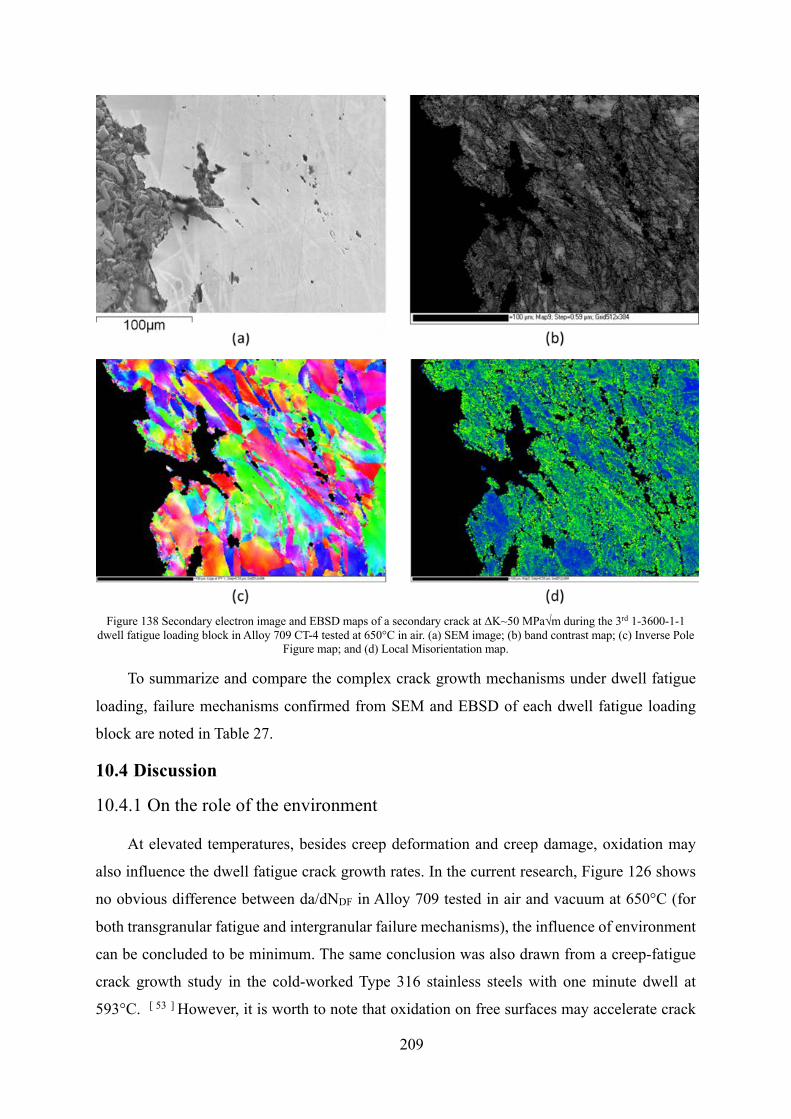
209
Figure 138 Secondary electron image and EBSD maps of a secondary crack at ΔK~50 MPa√m during the 3rd 1-3600-1-1
dwell fatigue loading block in Alloy 709 CT-4 tested at 650°C in air. (a) SEM image; (b) band contrast map; (c) Inverse Pole Figure map; and (d) Local Misorientation map.
To summarize and compare the complex crack growth mechanisms under dwell fatigue
loading, failure mechanisms confirmed from SEM and EBSD of each dwell fatigue loading
block are noted in Table 27.
10.4 Discussion
10.4.1 On the role of the environment
At elevated temperatures, besides creep deformation and creep damage, oxidation may
also influence the dwell fatigue crack growth rates. In the current research, Figure 126 shows
no obvious difference between da/dNDF in Alloy 709 tested in air and vacuum at 650°C (for
both transgranular fatigue and intergranular failure mechanisms), the influence of environment
can be concluded to be minimum. The same conclusion was also drawn from a creep-fatigue
crack growth study in the cold-worked Type 316 stainless steels with one minute dwell at
593°C. [ 53 ] However, it is worth to note that oxidation on free surfaces may accelerate crack
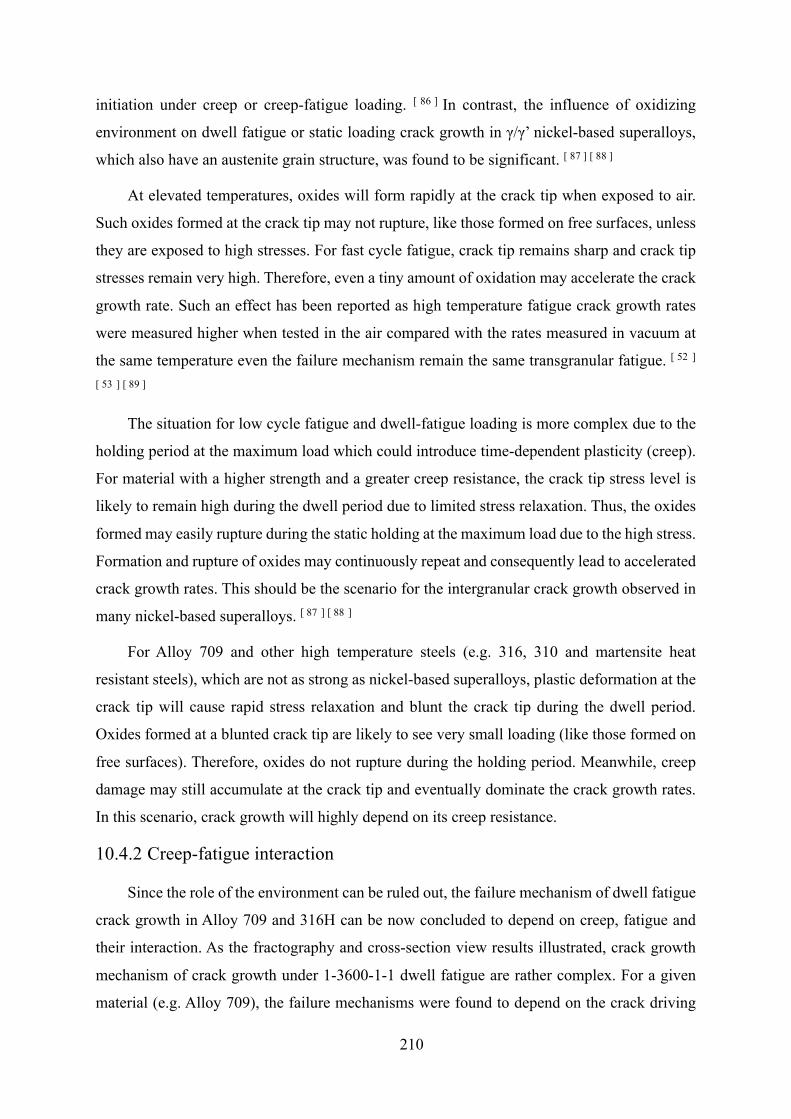
210
initiation under creep or creep-fatigue loading. [ 86 ] In contrast, the influence of oxidizing
environment on dwell fatigue or static loading crack growth in γ/γ’ nickel-based superalloys,
which also have an austenite grain structure, was found to be significant. [ 87 ] [ 88 ]
At elevated temperatures, oxides will form rapidly at the crack tip when exposed to air.
Such oxides formed at the crack tip may not rupture, like those formed on free surfaces, unless
they are exposed to high stresses. For fast cycle fatigue, crack tip remains sharp and crack tip
stresses remain very high. Therefore, even a tiny amount of oxidation may accelerate the crack
growth rate. Such an effect has been reported as high temperature fatigue crack growth rates
were measured higher when tested in the air compared with the rates measured in vacuum at
the same temperature even the failure mechanism remain the same transgranular fatigue. [ 52 ]
[ 53 ] [ 89 ]
The situation for low cycle fatigue and dwell-fatigue loading is more complex due to the
holding period at the maximum load which could introduce time-dependent plasticity (creep).
For material with a higher strength and a greater creep resistance, the crack tip stress level is
likely to remain high during the dwell period due to limited stress relaxation. Thus, the oxides
formed may easily rupture during the static holding at the maximum load due to the high stress.
Formation and rupture of oxides may continuously repeat and consequently lead to accelerated
crack growth rates. This should be the scenario for the intergranular crack growth observed in
many nickel-based superalloys. [ 87 ] [ 88 ]
For Alloy 709 and other high temperature steels (e.g. 316, 310 and martensite heat
resistant steels), which are not as strong as nickel-based superalloys, plastic deformation at the
crack tip will cause rapid stress relaxation and blunt the crack tip during the dwell period.
Oxides formed at a blunted crack tip are likely to see very small loading (like those formed on
free surfaces). Therefore, oxides do not rupture during the holding period. Meanwhile, creep
damage may still accumulate at the crack tip and eventually dominate the crack growth rates.
In this scenario, crack growth will highly depend on its creep resistance.
10.4.2 Creep-fatigue interaction
Since the role of the environment can be ruled out, the failure mechanism of dwell fatigue
crack growth in Alloy 709 and 316H can be now concluded to depend on creep, fatigue and
their interaction. As the fractography and cross-section view results illustrated, crack growth
mechanism of crack growth under 1-3600-1-1 dwell fatigue are rather complex. For a given
material (e.g. Alloy 709), the failure mechanisms were found to depend on the crack driving
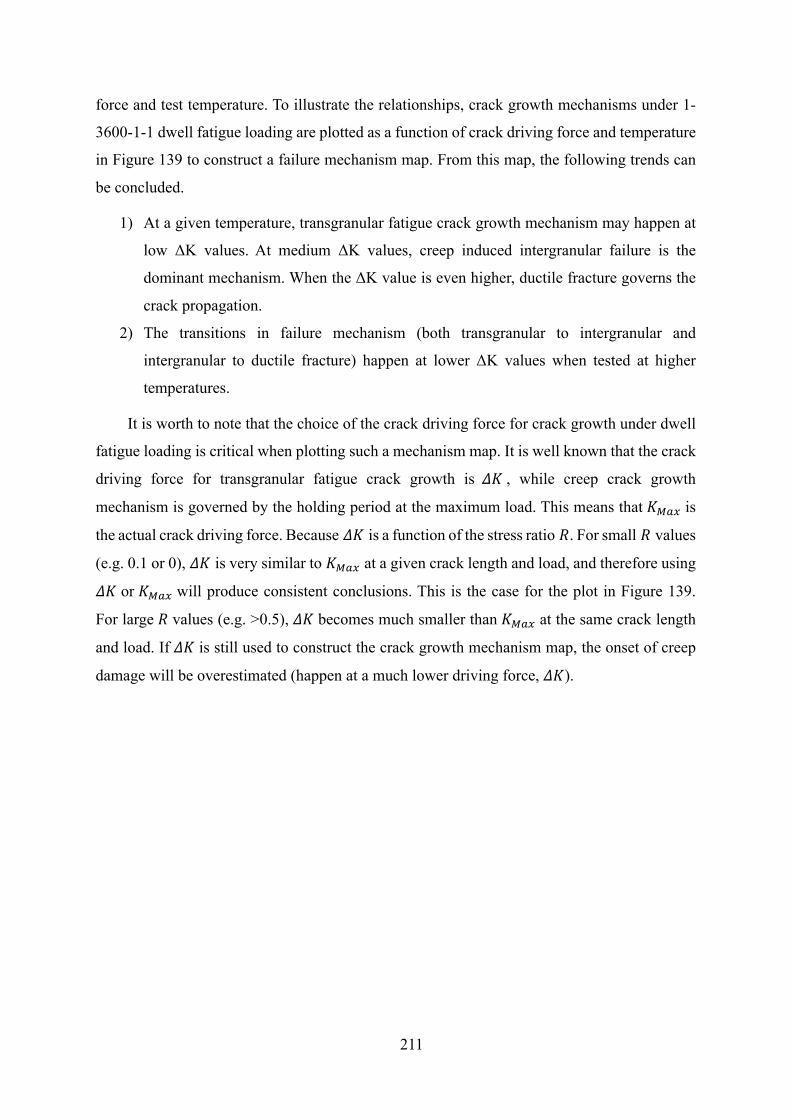
211
force and test temperature. To illustrate the relationships, crack growth mechanisms under 1-
3600-1-1 dwell fatigue loading are plotted as a function of crack driving force and temperature
in Figure 139 to construct a failure mechanism map. From this map, the following trends can
be concluded.
1) At a given temperature, transgranular fatigue crack growth mechanism may happen at
low ΔK values. At medium ΔK values, creep induced intergranular failure is the
dominant mechanism. When the ΔK value is even higher, ductile fracture governs the
crack propagation.
2) The transitions in failure mechanism (both transgranular to intergranular and
intergranular to ductile fracture) happen at lower ΔK values when tested at higher
temperatures.
It is worth to note that the choice of the crack driving force for crack growth under dwell
fatigue loading is critical when plotting such a mechanism map. It is well known that the crack
driving force for transgranular fatigue crack growth is àR , while creep crack growth
mechanism is governed by the holding period at the maximum load. This means that RBâä is
the actual crack driving force. Because àR is a function of the stress ratio 0. For small 0 values
(e.g. 0.1 or 0), àR is very similar to RBâä at a given crack length and load, and therefore using
àR or RBâä will produce consistent conclusions. This is the case for the plot in Figure 139.
For large 0 values (e.g. >0.5), àR becomes much smaller than RBâä at the same crack length
and load. If àR is still used to construct the crack growth mechanism map, the onset of creep
damage will be overestimated (happen at a much lower driving force, àR).
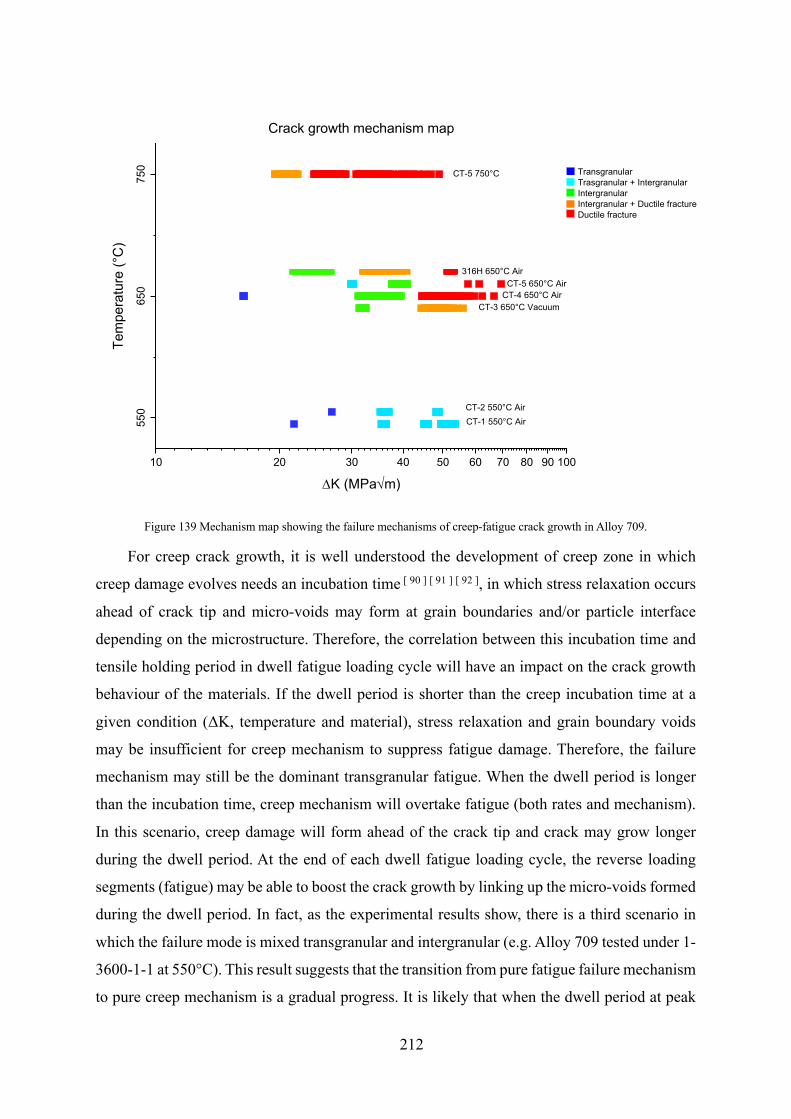
212
Figure 139 Mechanism map showing the failure mechanisms of creep-fatigue crack growth in Alloy 709.
For creep crack growth, it is well understood the development of creep zone in which
creep damage evolves needs an incubation time [ 90 ] [ 91 ] [ 92 ], in which stress relaxation occurs
ahead of crack tip and micro-voids may form at grain boundaries and/or particle interface
depending on the microstructure. Therefore, the correlation between this incubation time and
tensile holding period in dwell fatigue loading cycle will have an impact on the crack growth
behaviour of the materials. If the dwell period is shorter than the creep incubation time at a
given condition (ΔK, temperature and material), stress relaxation and grain boundary voids
may be insufficient for creep mechanism to suppress fatigue damage. Therefore, the failure
mechanism may still be the dominant transgranular fatigue. When the dwell period is longer
than the incubation time, creep mechanism will overtake fatigue (both rates and mechanism).
In this scenario, creep damage will form ahead of the crack tip and crack may grow longer
during the dwell period. At the end of each dwell fatigue loading cycle, the reverse loading
segments (fatigue) may be able to boost the crack growth by linking up the micro-voids formed
during the dwell period. In fact, as the experimental results show, there is a third scenario in
which the failure mode is mixed transgranular and intergranular (e.g. Alloy 709 tested under 1-
3600-1-1 at 550°C). This result suggests that the transition from pure fatigue failure mechanism
to pure creep mechanism is a gradual progress. It is likely that when the dwell period at peak
10 20 30 40 50 60 70 80 90 100
550
650
750
316H 650°C AirCT-5 650°C Air
CT-1 550°C AirCT-2 550°C Air
CT-4 650°C AirCT-3 650°C Vacuum
Crack growth mechanism mapTe
mpe
ratu
re (°
C)
DK (MPaÖm)
CT-5 750°C TransgranularTrasgranular + IntergranularIntergranularIntergranular + Ductile fractureDuctile fracture
213
load is comparable to the incubation time needed, both mechanisms can contribute to crack
growth depending on the local microstructure. This also suggests that in addition to the synergic
effect of creep-fatigue interaction, there also exist a competition between these two
mechanisms.
The understanding of failure mechanisms is critical to crack growth rates modelling and
thus component lifing. A summation model of creep-fatigue crack growth is generally used to
predict the creep-fatigue crack growth rate per cycle (da/dNçé) [ 93 ] [ 94 ] [ 95 ], as the equation
below shows.
da/dNçé = da/dNé + da/dtç ∙ tç
where da/dNé and da/dtç are the fatigue crack growth rate and creep crack growth rate
at the same driving force (normally K is used) and tç is the dwell period for creep crack growth.
In this summation model, da/dNé is measured from transgranular fatigue crack growth, while
da/dtç is measured from intergranular crack growth. Therefore, this model may not be able to
accurately predict dwell fatigue crack growth rates for all three scenarios discussed above. In
the current paper, the validity of this model for different situations cannot yet be evaluated
without crack growth data from pure fatigue and creep crack growth conditions. This can be
made when such results are available.
Based on the above discussion, the incubation time for creep crack growth in Alloy 709
may be estimated from the crack growth mechanisms verified. Since in Alloy 709 tested under
550 and 650°C the failure mechanism of dwell fatigue crack growth was found to be
transgranular fatigue at ΔK < 30 MPa√m, it suggests that the incubation time for Alloy 709 at
these conditions are longer than 1 hour. For ΔK > 30 MPa√m tested under 550 and 650°C, the
failure mechanism was changed to either micro-voids induced intergranular cracking or ductile
fracture. Such changes in mechanism indicate that the incubation time is now shorter than 1
hour. In Alloy 709 tested at 750°C, intergranular failure is found at ΔK value as low as 20
MPa√m which also means the incubation time at this condition is also shorter than 1 hour.
These results suggest that the creep incubation time in Alloy 709 is shorter at a higher test
temperature and/or a higher crack driving force. The underlying reason should originate from
creep deformation behaviour, as higher temperatures and/or higher stresses will lead to faster
transitions into steady-state creep and faster minimum creep rates.
For 316H tested at 650°C in the current research, intergranular cracking was observed
from ΔK value around 22 MPa√m. At the same ΔK value and testing temperature, the crack
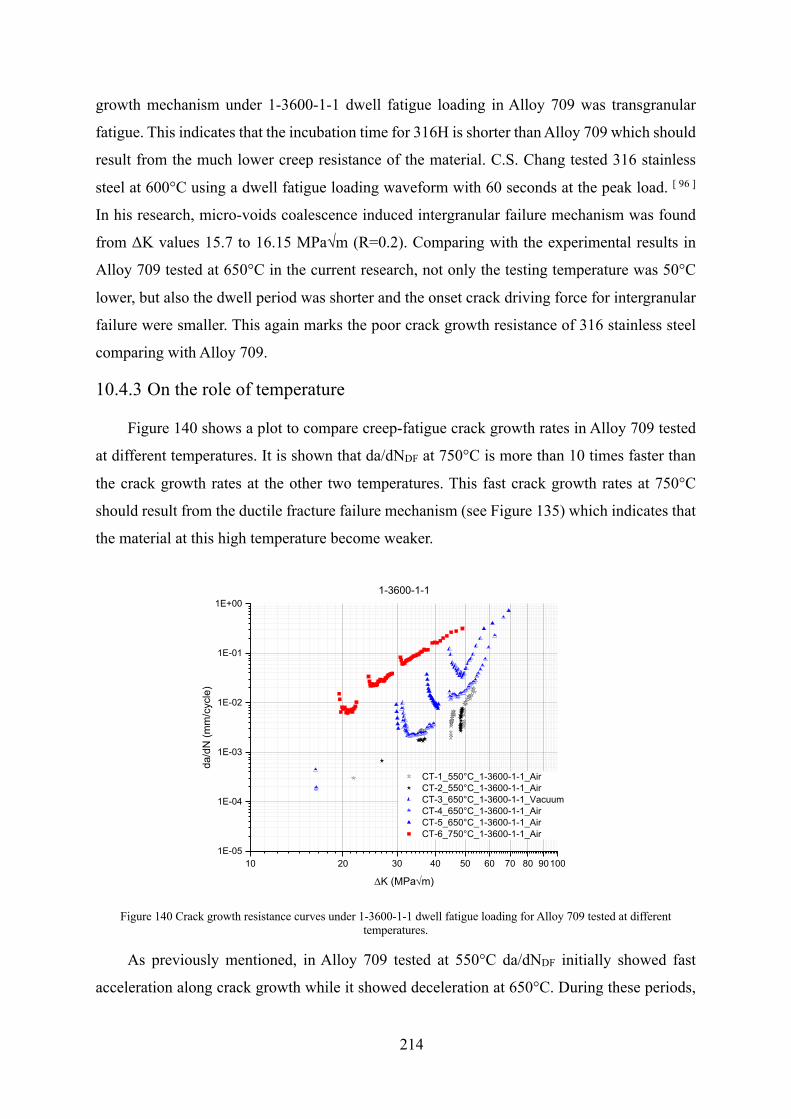
214
growth mechanism under 1-3600-1-1 dwell fatigue loading in Alloy 709 was transgranular
fatigue. This indicates that the incubation time for 316H is shorter than Alloy 709 which should
result from the much lower creep resistance of the material. C.S. Chang tested 316 stainless
steel at 600°C using a dwell fatigue loading waveform with 60 seconds at the peak load. [ 96 ]
In his research, micro-voids coalescence induced intergranular failure mechanism was found
from ΔK values 15.7 to 16.15 MPa√m (R=0.2). Comparing with the experimental results in
Alloy 709 tested at 650°C in the current research, not only the testing temperature was 50°C
lower, but also the dwell period was shorter and the onset crack driving force for intergranular
failure were smaller. This again marks the poor crack growth resistance of 316 stainless steel
comparing with Alloy 709.
10.4.3 On the role of temperature
Figure 140 shows a plot to compare creep-fatigue crack growth rates in Alloy 709 tested
at different temperatures. It is shown that da/dNDF at 750°C is more than 10 times faster than
the crack growth rates at the other two temperatures. This fast crack growth rates at 750°C
should result from the ductile fracture failure mechanism (see Figure 135) which indicates that
the material at this high temperature become weaker.
Figure 140 Crack growth resistance curves under 1-3600-1-1 dwell fatigue loading for Alloy 709 tested at different
temperatures.
As previously mentioned, in Alloy 709 tested at 550°C da/dNDF initially showed fast
acceleration along crack growth while it showed deceleration at 650°C. During these periods,
10 20 30 40 50 60 70 80 901001E-05
1E-04
1E-03
1E-02
1E-01
1E+001-3600-1-1
da/d
N (m
m/c
ycle
)
DK (MPaÖm)
CT-1_550°C_1-3600-1-1_Air CT-2_550°C_1-3600-1-1_Air CT-3_650°C_1-3600-1-1_Vacuum CT-4_650°C_1-3600-1-1_Air CT-5_650°C_1-3600-1-1_Air CT-6_750°C_1-3600-1-1_Air
215
da/dNDF at 650°C can be found to be much faster than that at 550°C at the same ΔK value.
After the initial acceleration and deceleration, da/dNDF also showed steady state crack growth
and now the rates at 550 and 650°C were be found to be quite comparable with da/dNDF at
550°C slightly slower.
At elevated temperatures (e.g. 550 and 650°C), no matter what the dominant crack growth
mechanism is in Alloy 709, time-dependent creep deformation and creep damage should
happen in the vicinity of the crack tip. For a given material and a given stress, creep strain
accumulation and stress relaxation at the crack tip should be faster at a higher temperature. This
stress redistribution at the crack tip obviously will have an impact on the crack growth rates.
Quasi-static tensile testing on Alloy 709 showed that the yield strength at 550°C is close
to those at 650 and 750°C in vacuum, but at 550°C Alloy 709 have much more work hardening. [ 61 ] Meanwhile, the speed to develop the creep zone (creep deformation and creep damage)
ahead of the crack tip will also be much slower at 550°C compared with those at 650 and 750°C.
Therefore, it is likely that at 550°C the initial crack growth at the beginning of a dwell fatigue
loading block (not just in the first 1-3600-1-1 cycle) was still controlled by the linear elastic
plastic zone ahead of the crack tip. Although intergranular failure may happen at relatively
higher crack driving force, the initial crack growth rates were still comparable to the baseline
fatigue crack growth rates. Along with crack propagation, creep zone and creep damage became
more prevalent and consequently makes more contribution to the total crack growth per cycle.
Therefore, da/dNDF became much faster than da/dNBL at the same ΔK value. Since the crack
growth mode has changed, the slope of the crack growth resistant curves may also change
accordingly.
The initial deceleration in da/dNDF seen in tests conducted at 650°C was previously
reported in steels [ 97 ] [ 98 ] and nickel superalloys. [ 87 ] [ 88 ] Currently, the general understanding
is associated with the stress relaxation at the crack tip. [ 97 ] [ 98 ]
At 650°C, the tensile strength of the material is lower than that at 550°C. [ 61 ] Therefore,
the initial crack growth rates from a sharp crack at the onset of a dwell fatigue loading block is
likely to be high due to the high stresses at the crack tip (same for both transgranular and
intergranular failure mechanisms). At the beginning of dwell fatigue loading cycles, crack tip
remains sharp with only a little stress relaxation. The higher stress concentration at the crack
tip may cause faster crack growth rates as cracking may be still governed by the plastic zone.
This should be the same for both transgranular and intergranular failure mechanisms. Stress
216
relaxation and creep strain will continue to accumulate at crack tip even the crack is
propagating. Therefore, the stresses at crack tip will gradually decrease along with the
development of the creep zone, and consequently crack growth rates may decelerate. At a
certain stage, the creep zone will dominate the crack tip stress field. This is likely to be the
moment when the size of the creep zone becomes larger than the linear elastic plastic zone
according to the analysis of crack tip stress development. [ 99 ] [ 100 ] Now, the dwell fatigue crack
growth enters a steady state, and da/dNDF increases along with crack growth.
10.4.4 Influence of dwell fatigue loading on subsequent fatigue crack growth
Crack growth plots in Figure 126-Figure 128 also show that 0.25Hz baseline fatigue crack
growth rates right after dwell fatigue loading blocks (da/dNBL) were either slower or faster than
those without any prior dwell fatigue loading (da/dNBL-ND). As discussed above, the
introduction of a long dwell period will introduce creep deformation and creep damage ahead
of the crack tip, both of which could affect the subsequent fatigue crack growth.
The development of the creep deformation in the creep zone ahead of the crack tip can
lead to stress relaxation and reduce the effective crack driving force. The influence will become
larger with the development of the creep zone and even influence a large volume of material,
which is normally noted as extensive creep. [ 101 ] When the loading is now switched from dwell
fatigue loading to fast cycling (e.g. 0.25Hz fatigue), due to the reduced stresses in the creep
zone and the blunted crack tip, the effective driving force for fatigue crack growth is reduced.
Thus, da/dNBL will be measured to be smaller than da/dNBL-ND. Only when the crack has
propagated out of the creep influenced zone, the fatigue crack growth rates will become back
to normal and comparable to da/dNBL-ND. For example, this can be seen from the fatigue crack
growth curve after the 1st dwell in Alloy 709 CT-4 tested at 650°C in air (Figure 126). On the
other hand, if severe creep damage has formed, the subsequent baseline fatigue crack growth
rates will be accelerated as the material ahead of the crack tip is weakened.
It is also worth to note that for some cases, da/dNBL were still slower than da/dNBL-ND (e.g.
Alloy 709 CT-6 tested at 750°C) after some crack growth. The reason should be that the crack
did not grow out of the creep zone formed during the prior dwell fatigue loading block. If a
longer crack growth was allowed, the rates may recover back to normal.

217
11 Comparison between Alloy 709 and 316H
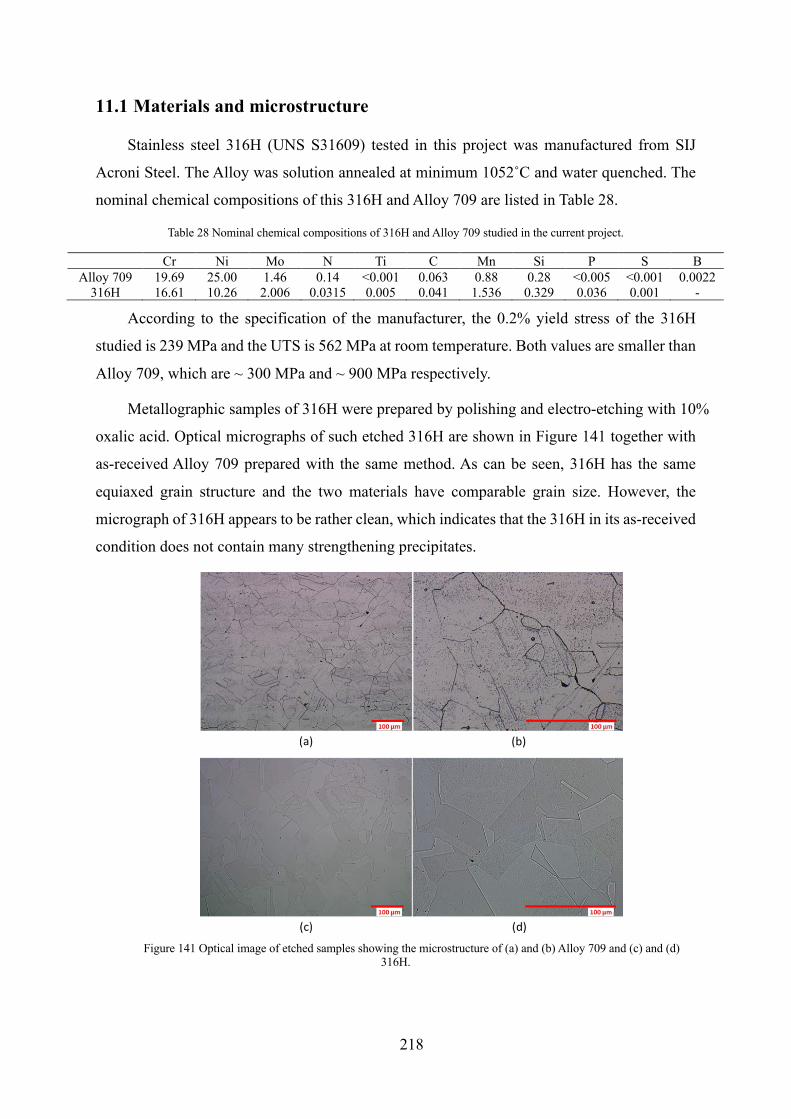
218
11.1 Materials and microstructure
Stainless steel 316H (UNS S31609) tested in this project was manufactured from SIJ
Acroni Steel. The Alloy was solution annealed at minimum 1052˚C and water quenched. The
nominal chemical compositions of this 316H and Alloy 709 are listed in Table 28.
Table 28 Nominal chemical compositions of 316H and Alloy 709 studied in the current project.
Cr Ni Mo N Ti C Mn Si P S B Alloy 709 19.69 25.00 1.46 0.14 <0.001 0.063 0.88 0.28 <0.005 <0.001 0.0022
316H 16.61 10.26 2.006 0.0315 0.005 0.041 1.536 0.329 0.036 0.001 -
According to the specification of the manufacturer, the 0.2% yield stress of the 316H
studied is 239 MPa and the UTS is 562 MPa at room temperature. Both values are smaller than
Alloy 709, which are ~ 300 MPa and ~ 900 MPa respectively.
Metallographic samples of 316H were prepared by polishing and electro-etching with 10%
oxalic acid. Optical micrographs of such etched 316H are shown in Figure 141 together with
as-received Alloy 709 prepared with the same method. As can be seen, 316H has the same
equiaxed grain structure and the two materials have comparable grain size. However, the
micrograph of 316H appears to be rather clean, which indicates that the 316H in its as-received
condition does not contain many strengthening precipitates.
Figure 141 Optical image of etched samples showing the microstructure of (a) and (b) Alloy 709 and (c) and (d)
316H.
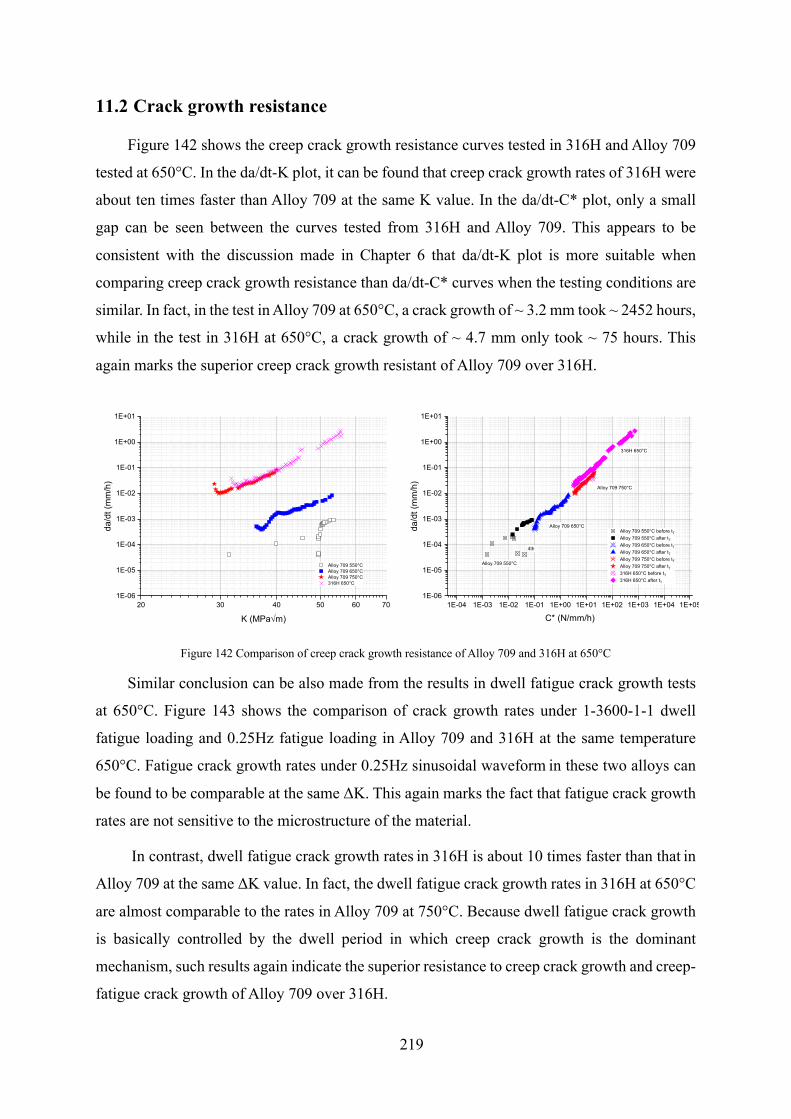
219
11.2 Crack growth resistance
Figure 142 shows the creep crack growth resistance curves tested in 316H and Alloy 709
tested at 650°C. In the da/dt-K plot, it can be found that creep crack growth rates of 316H were
about ten times faster than Alloy 709 at the same K value. In the da/dt-C* plot, only a small
gap can be seen between the curves tested from 316H and Alloy 709. This appears to be
consistent with the discussion made in Chapter 6 that da/dt-K plot is more suitable when
comparing creep crack growth resistance than da/dt-C* curves when the testing conditions are
similar. In fact, in the test in Alloy 709 at 650°C, a crack growth of ~ 3.2 mm took ~ 2452 hours,
while in the test in 316H at 650°C, a crack growth of ~ 4.7 mm only took ~ 75 hours. This
again marks the superior creep crack growth resistant of Alloy 709 over 316H.
Figure 142 Comparison of creep crack growth resistance of Alloy 709 and 316H at 650°C
Similar conclusion can be also made from the results in dwell fatigue crack growth tests
at 650°C. Figure 143 shows the comparison of crack growth rates under 1-3600-1-1 dwell
fatigue loading and 0.25Hz fatigue loading in Alloy 709 and 316H at the same temperature
650°C. Fatigue crack growth rates under 0.25Hz sinusoidal waveform in these two alloys can
be found to be comparable at the same ΔK. This again marks the fact that fatigue crack growth
rates are not sensitive to the microstructure of the material.
In contrast, dwell fatigue crack growth rates in 316H is about 10 times faster than that in
Alloy 709 at the same ΔK value. In fact, the dwell fatigue crack growth rates in 316H at 650°C
are almost comparable to the rates in Alloy 709 at 750°C. Because dwell fatigue crack growth
is basically controlled by the dwell period in which creep crack growth is the dominant
mechanism, such results again indicate the superior resistance to creep crack growth and creep-
fatigue crack growth of Alloy 709 over 316H.
20 30 40 50 60 701E-06
1E-05
1E-04
1E-03
1E-02
1E-01
1E+00
1E+01
da/d
t (m
m/h
)
K (MPaÖm)
Alloy 709 550°C Alloy 709 650°C Alloy 709 750°C 316H 650°C
1E-04 1E-03 1E-02 1E-01 1E+00 1E+01 1E+02 1E+03 1E+04 1E+051E-06
1E-05
1E-04
1E-03
1E-02
1E-01
1E+00
1E+01
316H 650°C
Alloy 709 750°C
Alloy 709 650°C
4th
da/d
t (m
m/h
)
C* (N/mm/h)
Alloy 709 550°C before tT Alloy 709 550°C after tT Alloy 709 650°C before tT Alloy 709 650°C after tT Alloy 709 750°C before tT Alloy 709 750°C after tT 316H 650°C before tT 316H 650°C after tT
Alloy 709 550°C
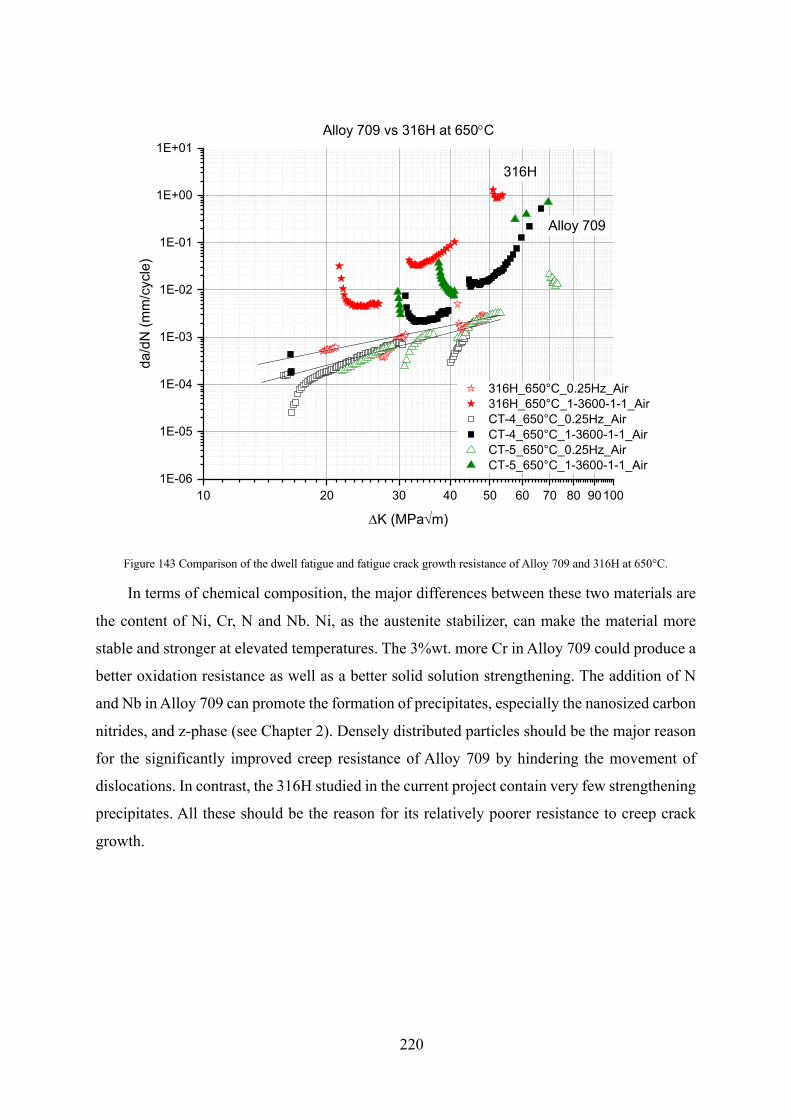
220
Figure 143 Comparison of the dwell fatigue and fatigue crack growth resistance of Alloy 709 and 316H at 650°C.
In terms of chemical composition, the major differences between these two materials are
the content of Ni, Cr, N and Nb. Ni, as the austenite stabilizer, can make the material more
stable and stronger at elevated temperatures. The 3%wt. more Cr in Alloy 709 could produce a
better oxidation resistance as well as a better solid solution strengthening. The addition of N
and Nb in Alloy 709 can promote the formation of precipitates, especially the nanosized carbon
nitrides, and z-phase (see Chapter 2). Densely distributed particles should be the major reason
for the significantly improved creep resistance of Alloy 709 by hindering the movement of
dislocations. In contrast, the 316H studied in the current project contain very few strengthening
precipitates. All these should be the reason for its relatively poorer resistance to creep crack
growth.
10 20 30 40 50 60 70 80 901001E-06
1E-05
1E-04
1E-03
1E-02
1E-01
1E+00
1E+01
Alloy 709
Alloy 709 vs 316H at 650°Cda
/dN
(mm
/cyc
le)
DK (MPaÖm)
316H_650°C_0.25Hz_Air 316H_650°C_1-3600-1-1_Air CT-4_650°C_0.25Hz_Air CT-4_650°C_1-3600-1-1_Air CT-5_650°C_0.25Hz_Air CT-5_650°C_1-3600-1-1_Air
316H

221
12 Effects of ageing on the mechanical properties of Alloy 709
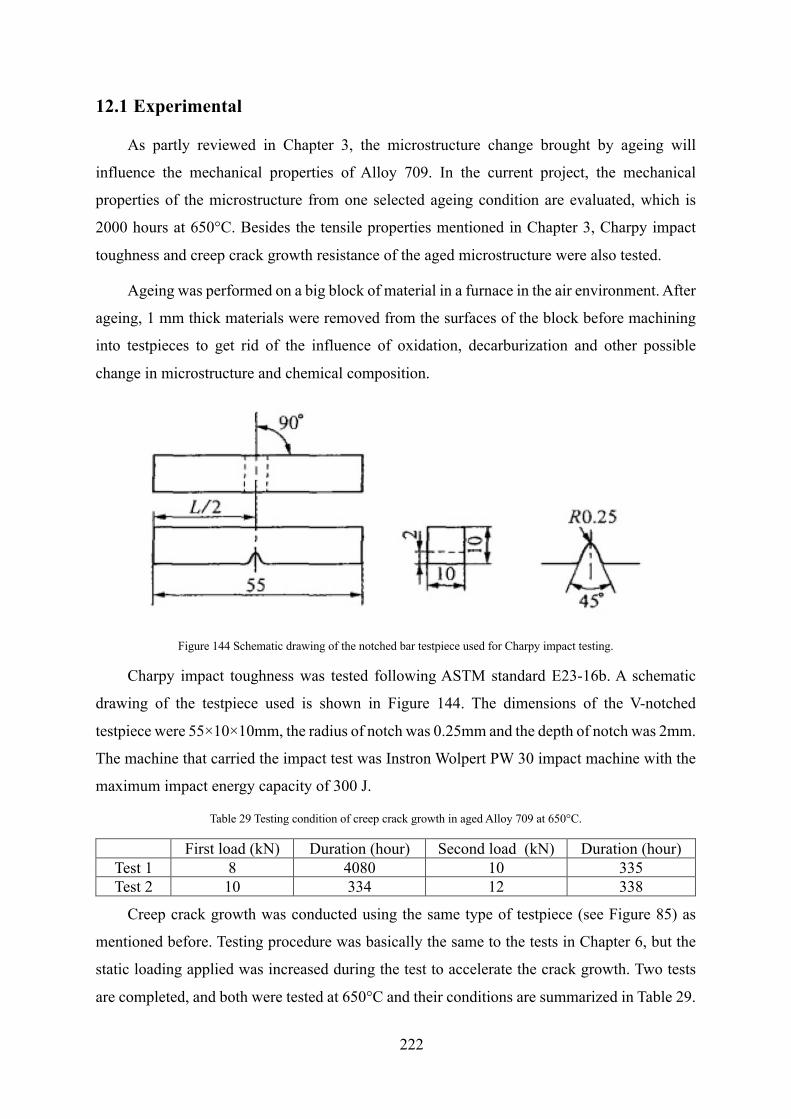
222
12.1 Experimental
As partly reviewed in Chapter 3, the microstructure change brought by ageing will
influence the mechanical properties of Alloy 709. In the current project, the mechanical
properties of the microstructure from one selected ageing condition are evaluated, which is
2000 hours at 650°C. Besides the tensile properties mentioned in Chapter 3, Charpy impact
toughness and creep crack growth resistance of the aged microstructure were also tested.
Ageing was performed on a big block of material in a furnace in the air environment. After
ageing, 1 mm thick materials were removed from the surfaces of the block before machining
into testpieces to get rid of the influence of oxidation, decarburization and other possible
change in microstructure and chemical composition.
Figure 144 Schematic drawing of the notched bar testpiece used for Charpy impact testing.
Charpy impact toughness was tested following ASTM standard E23-16b. A schematic
drawing of the testpiece used is shown in Figure 144. The dimensions of the V-notched
testpiece were 55×10×10mm, the radius of notch was 0.25mm and the depth of notch was 2mm.
The machine that carried the impact test was Instron Wolpert PW 30 impact machine with the
maximum impact energy capacity of 300 J.
Table 29 Testing condition of creep crack growth in aged Alloy 709 at 650°C.
First load (kN) Duration (hour) Second load (kN) Duration (hour) Test 1 8 4080 10 335 Test 2 10 334 12 338
Creep crack growth was conducted using the same type of testpiece (see Figure 85) as
mentioned before. Testing procedure was basically the same to the tests in Chapter 6, but the
static loading applied was increased during the test to accelerate the crack growth. Two tests
are completed, and both were tested at 650°C and their conditions are summarized in Table 29.
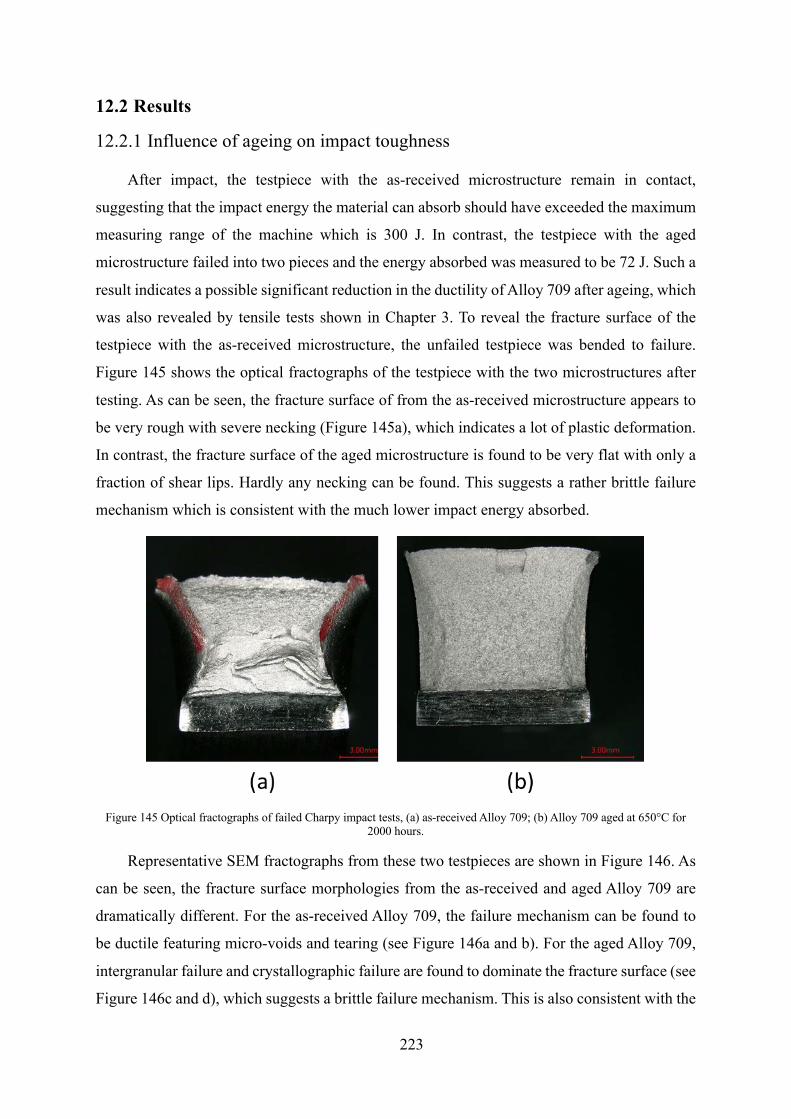
223
12.2 Results
12.2.1 Influence of ageing on impact toughness
After impact, the testpiece with the as-received microstructure remain in contact,
suggesting that the impact energy the material can absorb should have exceeded the maximum
measuring range of the machine which is 300 J. In contrast, the testpiece with the aged
microstructure failed into two pieces and the energy absorbed was measured to be 72 J. Such a
result indicates a possible significant reduction in the ductility of Alloy 709 after ageing, which
was also revealed by tensile tests shown in Chapter 3. To reveal the fracture surface of the
testpiece with the as-received microstructure, the unfailed testpiece was bended to failure.
Figure 145 shows the optical fractographs of the testpiece with the two microstructures after
testing. As can be seen, the fracture surface of from the as-received microstructure appears to
be very rough with severe necking (Figure 145a), which indicates a lot of plastic deformation.
In contrast, the fracture surface of the aged microstructure is found to be very flat with only a
fraction of shear lips. Hardly any necking can be found. This suggests a rather brittle failure
mechanism which is consistent with the much lower impact energy absorbed.
Figure 145 Optical fractographs of failed Charpy impact tests, (a) as-received Alloy 709; (b) Alloy 709 aged at 650°C for
2000 hours.
Representative SEM fractographs from these two testpieces are shown in Figure 146. As
can be seen, the fracture surface morphologies from the as-received and aged Alloy 709 are
dramatically different. For the as-received Alloy 709, the failure mechanism can be found to
be ductile featuring micro-voids and tearing (see Figure 146a and b). For the aged Alloy 709,
intergranular failure and crystallographic failure are found to dominate the fracture surface (see
Figure 146c and d), which suggests a brittle failure mechanism. This is also consistent with the
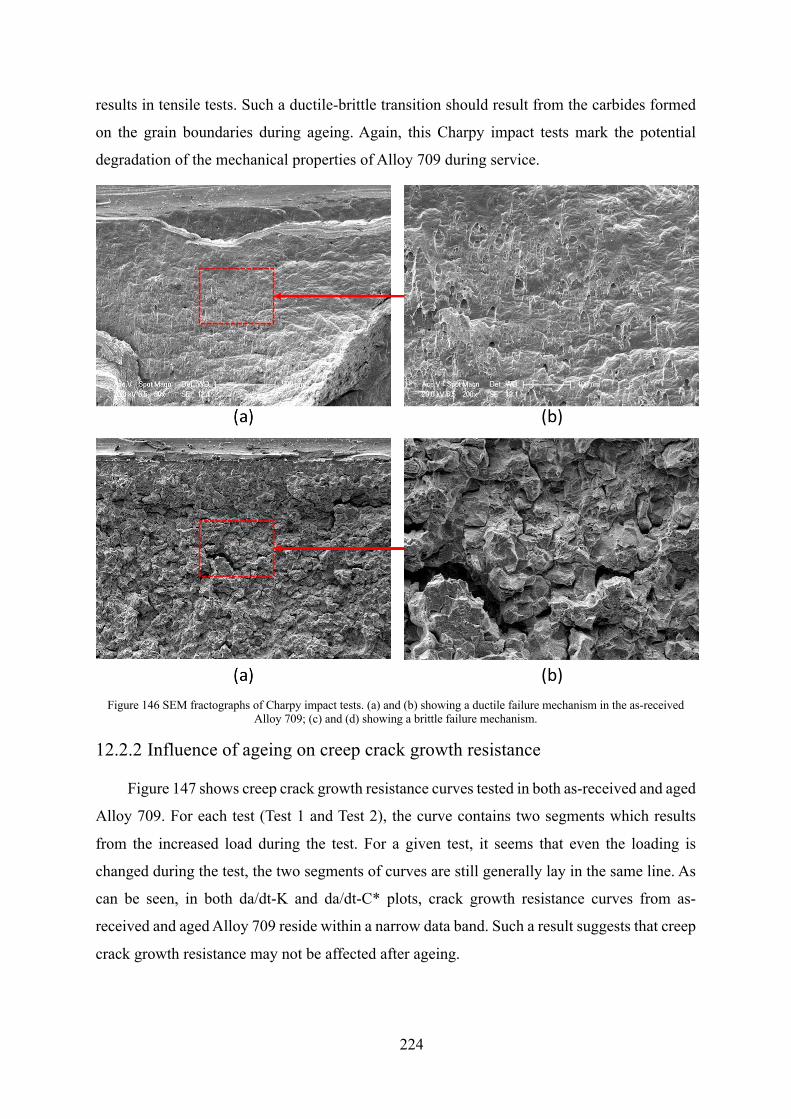
224
results in tensile tests. Such a ductile-brittle transition should result from the carbides formed
on the grain boundaries during ageing. Again, this Charpy impact tests mark the potential
degradation of the mechanical properties of Alloy 709 during service.
Figure 146 SEM fractographs of Charpy impact tests. (a) and (b) showing a ductile failure mechanism in the as-received
Alloy 709; (c) and (d) showing a brittle failure mechanism.
12.2.2 Influence of ageing on creep crack growth resistance
Figure 147 shows creep crack growth resistance curves tested in both as-received and aged
Alloy 709. For each test (Test 1 and Test 2), the curve contains two segments which results
from the increased load during the test. For a given test, it seems that even the loading is
changed during the test, the two segments of curves are still generally lay in the same line. As
can be seen, in both da/dt-K and da/dt-C* plots, crack growth resistance curves from as-
received and aged Alloy 709 reside within a narrow data band. Such a result suggests that creep
crack growth resistance may not be affected after ageing.
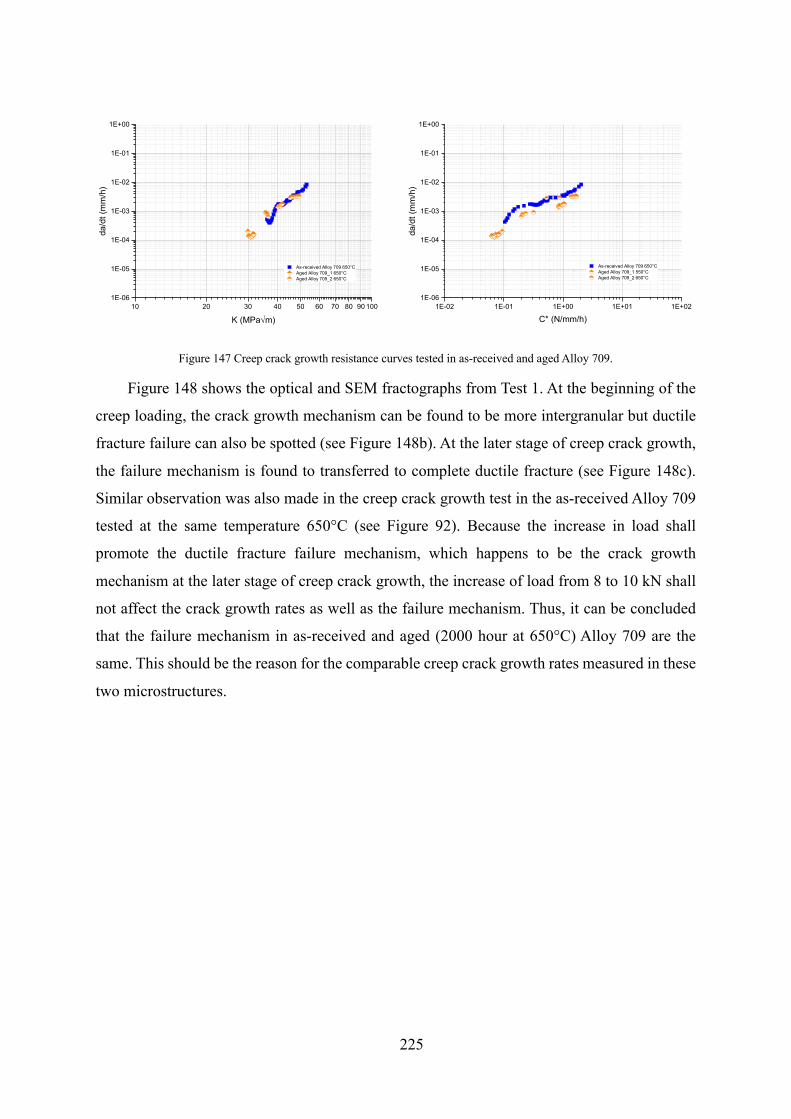
225
Figure 147 Creep crack growth resistance curves tested in as-received and aged Alloy 709.
Figure 148 shows the optical and SEM fractographs from Test 1. At the beginning of the
creep loading, the crack growth mechanism can be found to be more intergranular but ductile
fracture failure can also be spotted (see Figure 148b). At the later stage of creep crack growth,
the failure mechanism is found to transferred to complete ductile fracture (see Figure 148c).
Similar observation was also made in the creep crack growth test in the as-received Alloy 709
tested at the same temperature 650°C (see Figure 92). Because the increase in load shall
promote the ductile fracture failure mechanism, which happens to be the crack growth
mechanism at the later stage of creep crack growth, the increase of load from 8 to 10 kN shall
not affect the crack growth rates as well as the failure mechanism. Thus, it can be concluded
that the failure mechanism in as-received and aged (2000 hour at 650°C) Alloy 709 are the
same. This should be the reason for the comparable creep crack growth rates measured in these
two microstructures.
10 20 30 40 50 60 70 80 90 100
1E-06
1E-05
1E-04
1E-03
1E-02
1E-01
1E+00
da
/dt
(mm
/h)
K (MPaÖm)
As-received Alloy 709 650°C
Aged Alloy 709_1 650°C
Aged Alloy 709_2 650°C
1E-02 1E-01 1E+00 1E+01 1E+02
1E-06
1E-05
1E-04
1E-03
1E-02
1E-01
1E+00
da
/dt
(mm
/h)
C* (N/mm/h)
As-received Alloy 709 650°C
Aged Alloy 709_1 550°C
Aged Alloy 709_2 650°C
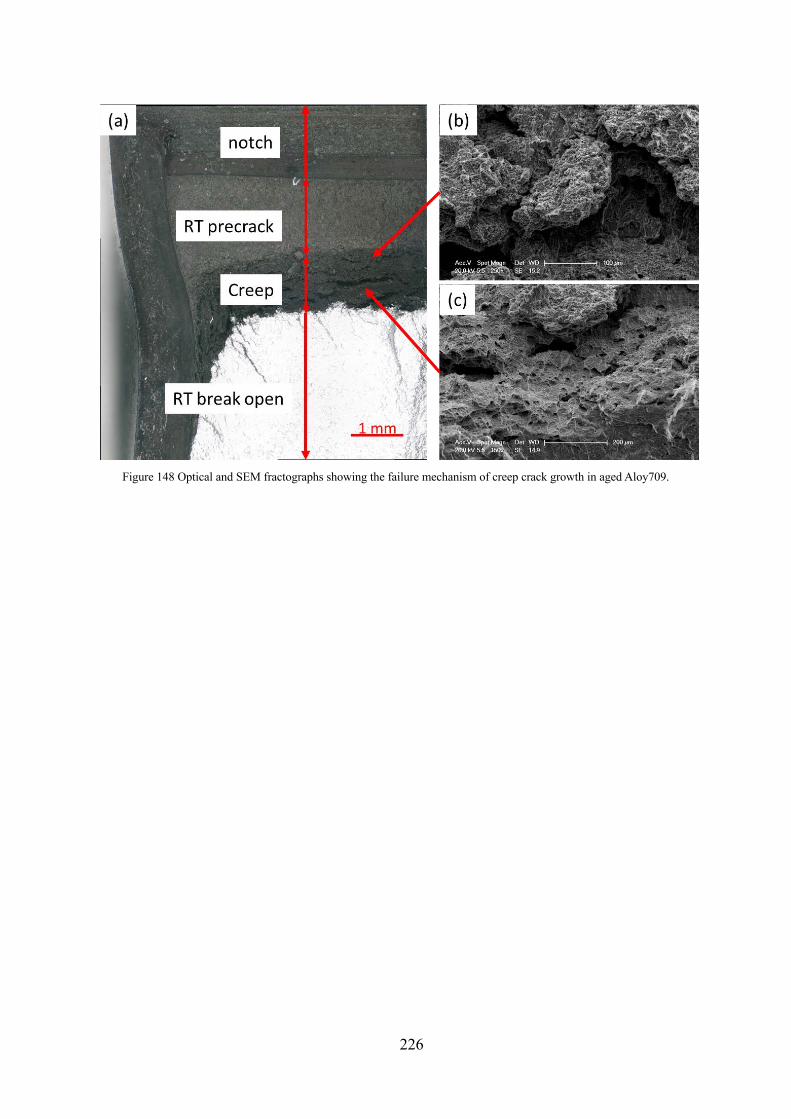
226
Figure 148 Optical and SEM fractographs showing the failure mechanism of creep crack growth in aged Aloy709.
227
13 Conclusions
1. The microstructure of Alloy 709 in the as-received condition contains equiaxed
austenite grain structure and prominently Nb(CN) precipitate with occasional rod-shaped Z
phase (CrNbN). The microstructure of Alloy 709 is found to be fairly stable at 550°C after
ageing for 2000 hours. However, at 650 and 750°C, the microstructure may change rapidly.
Aging at 650°C produced a nearly continuous distribution of globular M23C6 phases at grain
boundaries, plate-like M23C6 phases at twin boundaries and in the grain interior, and blocky
M23C6 phases on Nb(CN). Fine dispersoid Z phases on dislocations were observed after aging
for 500 hours; their amount increases with aging time. After aging at 750°C, q phase nucleates
on M23C6 carbides and evidence for the transformation of M23C6 to q phase was found, which
suggests that q phase is the more stable at this temperature.
2. Under tensile test at various temperatures, alloy 709 shows typical stress-strain curves
of austenite stainless steels with an excellent work hardening capability up to a temperature of
650°C and a superb ductility at all temperatures. Serrated stress strain curves were observed at
550, 650 and 750 °C. The deformation mechanism at temperatures up to 650 °C was slip
dominated. At high temperatures, intergranular void formation and micro crack growth and
coalescence happened. With increase in temperature, the slip activation is observed at higher
strains, with void nucleation and coalescence. Samples tested at all temperatures failed via
transgranular crack propagation, even though crack initiation was intergranular in nature.
Orientation of the sample did not affect the deformation mechanism. Tensile tests reveal that
at the temperature range of 550-750°C the yield strength of the as-received Alloy 709 does not
change much but they are all lower than that at room temperature. UTS of the as-received
microstructure decreases along with the increase of temperature mainly due to the change in
deformation mechanisms.
3. Comparing with the as-received Alloy 709, the material after aging at 650°C for 200
hours shows increased yield strength at all testing temperatures, which is contributed to
dispersoid strengthening induced by M23C6 and Z-phase. Reduction in the ultimate tensile
strength and ductility are also seen and are found to be the result of the formation of brittle
M23C6 at grain boundaries.
4. Fatigue crack growth resistance of Alloy 709 was found to be insensitive to the testing
temperature from 550 to 750°C. The influence of environment (vacuum and air) on fatigue
228
crack growth rates was also found to be small. The failure mechanism under all condition are
dominated by transgranular fatigue.
5. Creep crack growth rates of as-received Alloy 709 were found to increase with the
increase of testing temperature (550 to 750°C). In the da/dt-C* plot, crack growth resistance
curves tested at different temperatures all sit in the same line which forms a master curve for
creep crack growth in Alloy 709.
6. Real-time monitoring of creep deformation, microstructural evolution and interaction
of cracks with grain- and twin-boundaries was undertaken with the help of a heating-loading
stage installed in an SEM. A sample design having a continuously reducing cross-section was
utilized to ensure that the maximum deformation and cracking occur at the center where SEM
imaging, EBSD and EDS mapping can be focused. A new method of loading where the load
was gradually increased in multiple steps was undertaken. This new approach helps to generate
multiple creep data points from a single test specimen while saving time required in the in-situ
loading heating SEM. Minimum creep rate, Stress Exponent Factor “n” was found to be 5.6
and activation energy was found to be 366 kJ/mol. These findings are well in line with those
seen in the literature. Hence proving that the setup, sample design and loading method are very
suitable for conducting creep tests. These results will be further polished for publication soon.
7. As for Alloy 709, crack growth mechanisms are found to depend on both testing
temperature and crack driving force. As summarized in a mechanism map, the crack growth
mechanism under the current dwell fatigue loading waveform (with one hour tensile holding)
may be transgranular fatigue at a low crack driving. At an increased crack driving force, the
mechanism may be changed to intergranular. At an even higher crack driving force, ductile
fracture becomes the dominant mechanism. Such a transition of failure mechanisms is found
to happen at lower driving force values when tested at a higher temperature. This crack growth
mechanism map can set a foundation for the modelling of crack growth behaviour of Alloy 709.
The transition in failure mechanism should result from the competition between fatigue damage
and creep damage mechanism. The testing environment seems to have little to no effect on
creep-fatigue performance of Alloy 709 under testing conditions.
8. The dwell fatigue and creep crack growth resistance of Alloy 709 is shown to be
significantly better than the 316H stainless steel. When tested at 650°C, the crack growth
rate in Alloy 709 can be 10 times slower than that in 316H at the same crack driving force.
Such results suggest if Alloy 709 is used to replace 316H a greater design margin (temperature
and stress) and/or component life in the future nuclear power structures may be achieved.
229
9. Real-time monitoring of creep- fatigue crack growth using a heating-loading stage
installed in the SEM together with EBSD, CSL maps, TEM and EDS observations revealed
that at lower dwell times, the crack propagate mainly in a transgranular fashion, with the aid
of slip lines. As the dwell time increases, the fatigue life decreases, and creep cavitation damage
become more dominant. As a result, crack growth shifts from transgranular, to mixed mode and
then to solely intergranular. In general, a transgranular crack is observed growing with the help
of slip lines whereas an intergranular crack grows by the coalescence of voids and grain
boundary separation. The high-temperature CFCG tests indicate that twin boundaries produce
a strengthening effect by impeding dislocation motion due to a discontinuity in the slip system.
10. Alloy 709 aged at 650°C showed a significant reduction in the absorbed energy during
impact toughness testing, from > 300 to 72 J. The failure mechanism also changed from ductile
failure to brittle intergranular and crystallographic failure. In terms of creep crack growth tested
at 650°C both crack growth rates and failure mechanism seem unaffected by the change in the
initial microstructure.
230
14 Future work
The program for the UK team will continue till September 2019 and the US team will
keep working on the creep tests and aged samples in the meantime alongside with the UK team.
Up to now, the UK team have completed most of the experimental work listed in the initial
plan. However, because the creep and creep fatigue tests took very long time, a few tests will
be completed before the deadline. These tests include creep crack growth tests using large CT
testpieces (W = 50 mm) to investigate the effect of testpiece size and crack tip constraint on
creep crack growth rates. In addition to limited number of mechanical tests, more in-depth
mechanism study will be conducted to improve the understanding how does ageing affect the
crack growth rates and mechanism. Lastly, a thorough analysis of interaction between creep
and fatigue will be conducted. The team will submit the remaining papers for publication
during this period.
231
15 Outcomes
15.1 Education at North Carolina State University
15.1.1 Master student research program
• Swathi Upadhyay, graduated in December 2017, MS Thesis title: Tensile Properties of
Alloy 709 at various temperature
15.1.2 PhD Research Program
• Amrita Lall, From 2016 to now, Dissertation title Creep Fatigue crack growth mechanism
of alloy 709
• Siddhartha Sarkar, From 2018 to now, Dissertation title Creep mechanism of alloy 709
15.2 Education at University of Birmingham
15.2.1 Undergraduate final year program
• Serge Ngaboyisonga, from 2016.10 to 2017.03, Fatigue crack growth of Alloy 709 at
high temperatures.
• Zak Viney, from 2017.10 to 2018.03, Crack growth in two austenitic stainless steels
under creep and dwell-fatigue loading.
15.2.2 Master student research program
• Conor Fraser, from 2017.05 to 2017.09, Dwell-fatigue crack growth in an advanced
austenitic stainless steel Alloy 709.
15.2.3 PhD research program
• Jin Yan, from 2016.01 to 2019.09, Microstructure and mechanical properties of an
advanced austenite stainless steel Alloy 709.
232
15.3 Dissemination
15.3.1 Journal papers
• Swathi Updhayay, Hangyue Li, Paul Bowen and Afsaneh Rabiei . "A study on tensile
properties of Alloy 709 at various temperatures." Materials Science and Engineering:
A 733 (2018): 338-349.
• Amrita Lall, Siddhartha Sarkar, Rengen Ding, Paul Bowen and Afsaneh Rabiei.
“Performance of alloy 709 under Creep-Fatigue at Various Dwell Times”, submitted to
Material Science and Engineering A in February 2019.
• Rengen Ding, Jin Yan, Hangyue Li, Suyang Yu, Afsaneh Rabiei and Paul Bowen,
“Deformation microstructure and tensile properties of Alloy 709 at different
temperatures”, Submitted to Materials & Design in March 2019.
• Rengen Ding, Jin Yan, Hangyue Li, Suyang Yu, Afsaneh Rabiei and Paul Bowen,
“Microstructural evolution of Alloy 709 during aging”, Submitted to Materials Science
and Engineering A in March 2019.
• Siddhartha Sarkar, Amrita Lall, Rengen Ding, Paul Bowen and Afsaneh Rabiei. “Creep
Properties of alloy 709”, to be submitted in May 2019.
• Suyang Yu, Jin Yan, Rengen Ding, Hangyue Li, Afsaneh Rabiei and Paul Bowen.
“Fatigue crack growth of an advanced austenitic stainless steel for nuclear application”
To be submitted.
• Jin Yan, Suyang Yu, Rengen Ding, Hangyue Li, Afsaneh Rabiei and Paul Bowen. “A
study of creep-fatigue crack growth behaviour of an advanced stainless steel Alloy
709”." To be submitted.
• Suyang Yu, Jin Yan, Rengen Ding, Hangyue Li, Afsaneh Rabiei and Paul Bowen. “Creep
behaviour of an advanced austenitic stainless steel for nuclear application” To be
submitted.
15.3.2 Conferences
• Fatigue and Dwell-Fatigue Crack Growth in an Advanced Austenitic Stainless Steel,
14th International Conference on Fracture (ICF 14), Rhodes, Greece, June 18-23, 2017.
233
16 References
1 Smith, A., The diffusion of chromium in type 316 stainless steel. Metal Science, 1975. 9(1): p. 375-378. 2 Li, L., et al., Non-equilibrium grain boundary cosegregation of Mo and P. Applied surface science, 2006. 252(11): p. 3989-3992 3 Ding, R., T. Rong, and J. Knott, Phosphorus segregation in 2.25 Cr–1Mo steel. Materials science and technology, 2005. 21(1): p. 85-92 4 Ding, R. and J. Knott, Grain boundary segregation of phosphorus and molybdenum in 2· 25Cr–1Mo steel. Materials Science and Technology, 2008. 24(10): p. 1189-1194. 5 Vorlicek, V. and P. Flewitt, Cooling induced segregation of impurity elements to grain boundaries in Fe-3 wt% Ni alloys, 214wt% Cr-1 wt% Mo steel and submerged arc weld metal. Acta metallurgica et materialia, 1994. 42(10): p. 3309-3320. 6 Sourmail, T. and H. Bhadeshia, Microstructural evolution in two variants of NF709 at 1023 and 1073 K. Metallurgical and materials transactions A, 2005. 36(1): p. 23-34. 7 Rothman, S., L. Nowicki, and G. Murch, Self-diffusion in austenitic Fe-Cr-Ni alloys. Journal of Physics F: Metal Physics, 1980. 10(3): p. 383. 8 Thomas Sourmail, Precipitation in creep resistant austenitic stainless steels, Mater. Sci. Technol. 17 (2001) 1–14. 9 Y. Minami, H. Kimura, Y. Ihara, Microstructural changes in austenitic stainless steels during long-term aging, Mater. Sci. Technol. 2 (1986) 795–806. 10 P.J. Maziasz, R.W. Swindeman, Development of creep resistant austenitic stainless steels for advanced steam cycle superheater application, LEGIBILITY Not. (1987) 619. 11 M.C. Carroll, L.J. Carroll, Fatigue and creep–fatigue deformation of an ultra-fine precipitate strengthened advanced austenitic alloy, Mater. Sci. Eng. A. 556 (2012) 864–877. doi: 10.1016/j.msea.2012.07.082.
12 Y. Yamamoto, M.P. Brady, Z.P. Lu, C.T. Liu, M. Takeyama, P.J. Maziasz, B.A. Pint, Alµmina-Forming Austenitic Stainless Steels Strengthened by Laves Phase and MC Carbide Precipitates, Metall. Mater. Trans. A. 38 (2007) 2737–2746. doi:10.1007/s11661-007-9319-y. 13 M.P. Brady, Y. Yamamoto, M.L. Santella, L.R. Walker, Composition, Microstructure, and Water Vapor Effects on Internal/External Oxidation of Alµmina-Forming Austenitic Stainless Steels, Oxid. Met. 72 (2009) 311–333. doi:10.1007/s11085-009-9161-2.
234
14 Y. Yamamoto, M.P. Brady, Z.P. Lu, P.J. Maziasz, C.T. Liu, B.A. Pint, K.L. More, H.M. Meyer, E.A. Payzant, Creep-resistant, Al2O3-forming austenitic stainless steels, Science. 316 (2007) 433–436. 15 S. Sham, ARC Materials Development - Accomplishments and Plans, (n.d.). https://www.energy.gov/sites/prod/files/2013/09/f2/ARC-Matls-CrossCut-2013.pdf. 16 J.-H. Shim, E. Kozeschnik, W.-S. Jung, S.-C. Lee, D.-I. Kim, J.-Y. Suh, Y.-S. Lee, Y.W. Cho, Nµmerical simulation of long-term precipitate evolution in austenitic heat-resistant steels, Calphad. 34 (2010) 105–112. doi: 10.1016/j.calphad.2010.01.001. 17 P. Rodriguez, Serrated plastic flow, Bull. Mater. Sci. 6 (1984) 653–663. 18 K.G. Samuel, S.L. Mannan, P. Rodriguez, Serrated yielding in AISI 316 stainless steel, Acta Metall. 36 (1988) 2323–2327. 19 K. Peng, K. Qian, W. Chen, Effect of dynamic strain aging on high temperature properties of austenitic stainless steel, Mater. Sci. Eng. A. 379 (2004) 372–377. doi: 10.1016/j.msea.2004.03.004. 20 B.K. Choudhary, Activation energy for serrated flow in type 316L(N) austenitic stainless steel, Mater. Sci. Eng. A. 603 (2014) 160–168. doi: 10.1016/j.msea.2014.02.083. 21 B.K. Choudhary, Influence of Strain Rate and Temperature on Tensile Deformation and Fracture Behavior of Type 316L(N) Austenitic Stainless Steel, Metall. Mater. Trans. A. 45 (2014) 302–316. doi:10.1007/s11661-013-1978-2. 22 Z.Q. Xu, Y.Z. Shen, Serrated Flow in 316LN Austenitic Stainless Steel, Appl. Mech. Mater. 455 (2013) 159–162. doi: 10.4028/www.scientific.net/AMM.455.159. 23 G. T.W, K. W., T. C.L., Development of a Resistance Heating Facility for the Determination of Tensile Properties of Aircraft and Missile Alloys., Avco Corporation, 1963. https://icme.hpc.msstate.edu/mediawiki/index.php/File:B2.PNG (accessed October 25, 2017). 24 Choudhary, B., et al., Tensile stress–strain and work hardening behaviour of 316LN austenitic stainless steel. Materials science and technology, 2001. 17(2): p. 223-231. 25 Fressengeas, C., et al., Dynamic strain aging: a coupled dislocation—solute dynamic model. Materials Science and Engineering: A, 2005. 400: p. 226-230. 26 Soare, M. and W. Curtin, Single-mechanism rate theory for dynamic strain aging in fcc metals. Acta Materialia, 2008. 56(15): p. 4091-4101. 27 Han, G., I. Jones, and R. Smallman, Direct evidence for Suzuki segregation and Cottrell pinning in MP159 superalloy obtained by FEG (S) TEM/EDX. Acta materialia, 2003. 51(10): p. 2731-2742.
235
28 Koizumi, Y., et al., Suzuki segregation in Co–Ni-based superalloy at 973 K: an experimental and computational study by phase-field simulation. Acta Materialia, 2012. 60(6-7): p. 2901-2915. 29 Alomari, A.S., N. Kumar, and K. Murty, Enhanced ductility in dynamic strain aging regime in a Fe-25Ni-20Cr austenitic stainless steel. Materials Science and Engineering: A, 2018. 729: p. 157-160. 30 Isaac Samuel, E. and B. Choudhary, Bhanu Sankara Rao. Scr. Mater, 2002. 46: p. 507.
31 Karlsen, W., et al., Microstructural manifestation of dynamic strain aging in AISI 316 stainless steel. Journal of nuclear materials, 2009. 395(1-3): p. 156-161.
32 Binder, W., C. Brown, and R. Franks, Resistance To Sensitization of Austenitic Chromium-Nickel Steels of 0.03-Percent Max Carbon Content. Transactions of the American Society for Metals, 1949. 41: p. 1301-1370.
33 Murty, K.L. and Charit, I., 2008. Structural materials for Gen-IV nuclear reactors:
Challenges and opportunities. Journal of Nuclear Materials, 383(1-2), pp.189-195. 34 Staubli, M., Scarlin, B., Mayer, K.H., Kern, T.U., Bendick, W., Morris, P.,
DiGianfrancesco, A. and Cerjak, H.H., 2003. Materials for Advanced Steam Power Plants: The European COST522 Action. In International Charles Parsons Turbine Conference. Maney.
35 Kikuchi, M., Sakakibara, M., Otoguro, Y., Mimura, H., Araki, S. and Fujita, T., 1987.
An austenitic heat resisting steel tube developed for advanced fossil-fired steam plants. In High temperature alloys (pp. 267-276). Springer, Dordrecht.
36 Takahashi, T., Kikuchi, M., Sakurai, H., Nagao, K., Sakakibara, M., Ogawa, T., Araki,
S. and Yasuda, H., 1988. Development of High-Strength 20 Cr--25 Ni(NF 709) Steel for USC Boiler Tubes. Nippon Steel Tech. Rep., (38), pp.26-33.
37 Sourmail, T., 2001. Precipitation in creep resistant austenitic stainless steels. Materials
science and technology, 17(1), pp.1-14. 38 Porter, T., Findley, K. and McMurtrey, M., Assessment of Creep-Fatigue Behavior of
Alloy 709. 39 Sourmail, T. and Bhadeshia, H.K.D.H., 2005. Microstructural evolution in two variants
of NF709 at 1023 and 1073 K. Metallurgical and materials transactions A, 36(1), pp.23-34. 40 Upadhayay, S., Li, H., Bowen, P. and Rabiei, A., 2018. A study on tensile properties of
Alloy 709 at various temperatures. Materials Science and Engineering: A, 733, pp.338-349.
236
41 Alomari, A.S., Kumar, N. and Murty, K.L., 2019. Creep Behavior and Microstructural
Evolution of a Fe-20Cr-25Ni (Mass Percent) Austenitic Stainless Steel (Alloy 709) at Elevated Temperatures. Metallurgical and Materials Transactions A, 50(2), pp.641-654.
42 Alomari, A. S., Kumar, N., & Murty, K. L. (2019). Creep Behavior and Microstructural
Evolution of a Fe-20Cr-25Ni (Mass Percent) Austenitic Stainless Steel (Alloy 709) at Elevated Temperatures. Metallurgical and Materials Transactions A, 50(2), 641-654.
43 Thaveeprungsriporn, V. and Was, G.S., 1997. The role of coincidence-site-lattice
boundaries in Creep of Ni-16Cr-9Fe at 360 C. Metallurgical and Materials Transactions A, 28(10), pp.2101-2112.
44 Randle, V., 1996. The role of the coincidence site lattice in grain boundary
engineering (No. 659). Maney Pub. 45 Watanabe, T., Kimura, S.I. and Karashima, S., 1984. The effect of a grain boundary
structural transformation on sliding in< 1010>-tilt zinc bicrystals. Philosophical Magazine A, 49(6), pp.845-864.
46 Lehockey, E.M. and Palumbo, G., 1997. On the creep behaviour of grain boundary
engineered nickel 1. Materials Science and Engineering: A, 237(2), pp.168-172.
47 International, A., Standard Test Method for Measurement of Creep Crack Growth Times and Rates in Metals. 2013: West Conshohocken, PA.
48 Paris, P. and F. Erdogan, A Critical Analysis of Crack Propagation Laws. Journal of Basic Engineering, 1963. 85(4): p. 528-533.
49 Laiarinandrasana, L.P., Roland; Kabiri, Rachid; Drubay, Bernard. Master Curve da/dt vs C* for Creep and Creep-Fatigue Crack Growth on CT Specimens. in 16th international conference on structural mechanics in reactor technology. 2001. Washington, USA.
50 Tabuchi, M., et al., Results of a Japanese round robin program for creep crack growth using Gr.92 steel welds. Engineering Fracture Mechanics, 2010. 77(15): p. 3066-3076.
51 Standard Test Method for Measurement of Fatigue Crack Growth Rates. 2015, ASTM International.
52 Mills, W.J. and L.A. James, Fatigue crack propagation behaviour of type 316 stainless steel at elevated temperature in a vacuum. International Journal of Fatigue, 1988. 10(1): p. 33-36.
53 Sadananda, K. and P. Shahinian, Effect of environment on crack growth behavior in austenitic stainless steels under creep and fatigue conditions. Metallurgical Transactions A, 1980. 11(2): p. 267-276.
237
54 Chadwick, G.A. and Smith, D.A. eds., 1976. Grain boundary structure and properties. Academic Press 55 Kim, T., Hong, K.T. and Lee, K.S., 2003. The relationship between the fracture toughness and grain boundary character distribution in polycrystalline NiAl. Intermetallics, 11(1), pp.33-39. 56 WATANABE, T. (1993). DISTRIBUTION (GBCD). Textures and Microstructures, 20, 195-216. 57 Shi, J. and Zikry, M.A., 2009. Grain–boundary interactions and orientation effects on crack behavior in polycrystalline aggregates. International Journal of Solids and Structures, 46(21), pp.3914-3925. 58 Farkas, D., Van Swygenhoven, H. and Derlet, P.M., 2002. Intergranular fracture in nanocrystalline metals. Physical Review B, 66(6), p.060101. 59 Suyang Yu, Jin Yan, Hangyue Li, Rengen Ding, Amrita Lall, Afsaneh Rabiei and Paul Bowen “Fatigue crack growth resistance of a new austenitic stainless steel Alloy 709 at elevated temperatures”, to be submitted to journal of fatigue 60 Yu, L., Song, X., You, L., Jiao, Z., & Yu, H. (2015). Effect of dwell time on creep-fatigue life of a high-Nb TiAl alloy at 750° C. Scripta Materialia, 109, 61-63. 61 Upadhayay, S., Li, H., Bowen, P. and Rabiei, A., 2018. A Study on Tensile Properties of Alloy 709, at various temperatures. Materials Science and Engineering: A. 62 Liu, M., Gan, Y., Hanaor, D.A., Liu, B. and Chen, C., 2015. An improved semi-analytical solution for stress at round-tip notches. Engineering Fracture Mechanics, 149, pp.134-143. 63 Zhai, T.G., Wilkinson, A.J. and Martin, J.W., 2000. A crystallographic mechanism for fatigue crack propagation through grain boundaries. Acta materialia, 48(20), pp.4917-4927. 64 Gell, M. and Leverant, G.R., 1973. Mechanisms of high-temperature fatigue. In Fatigue at elevated temperatures. ASTM International 65 Mouritz, A.P., 2012. Introduction to aerospace materials. Elsevier. 66 Huntz, A.M., Reckmann, A., Haut, C., Sévérac, C., Herbst, M., Resende, F.C.T. and Sabioni, A.C.S., 2007. Oxidation of AISI 304 and AISI 439 stainless steels. Materials Science and Engineering: A, 447(1-2), pp.266-276. 67 Oshida, Y. and Liu, H.W., 1988. Grain boundary oxidation and an analysis of the effects of oxidation on fatigue crack nucleation life. In Low Cycle Fatigue. ASTM International. 68 Hong, J. W., Nam, S. W., & Rie, K. T. (1985). A model for life prediction in low-cycle fatigue with hold time. Journal of materials science, 20(10), 3763-3770.
238
69 Nam, S. W. (2002). Assessment of damage and life prediction of austenitic stainless steel under high temperature creep–fatigue interaction condition. Materials Science and Engineering: A, 322(1-2), 64-72. 70 Cocks, A. C. F., & Ashby, M. F. (1982). On creep fracture by void growth. Progress in materials science, 27(3-4), 189-244. 71 Petrá š, R., Polák, J., Damage mechanism in austenitic steel during high temperature cyclic loading with dwells, International Journal of Fatigue (2018), doi: https://doi.org/10.1016/j.ijfatigue.2018.02.017 72 Jaske, C. E., Mindlin, H., & Perrin, J. S. (1973). Combined low-cycle fatigue and stress relaxation of alloy 800 and type 304 stainless steel at elevated temperatures. In Fatigue at Elevated Temperatures. ASTM International. 73 Tanaka, H., Murata, M., Abe, F. and Irie, H., 2001. Microstructural evolution and change in hardness in type 304H stainless steel during long-term creep. Materials Science and Engineering: A, 319, pp.788-791. 74 Sandström, R., 2014. Creep strength of austenitic stainless steels for boiler applications. In Coal Power Plant Materials and Life Assessment (pp. 127-146). 75 Sourmail, T. and Bhadeshia, H.K.D.H., 2005. Microstructural evolution in two variants of NF709 at 1023 and 1073 K. Metallurgical and materials transactions A, 36(1), pp.23-34. 76 Hong, H.U., Rho, B.S. and Nam, S.W., 2001. Correlation of the M23C6 precipitation morphology with grain boundary characteristics in austenitic stainless steel. Materials Science and Engineering: A, 318(1-2), pp.285-292. 77Don, J., & Majumdar, S. (1986). Creep cavitation and grain boundary structure in type 304 stainless steel. Acta metallurgica, 34(5), 961-967. 78 Hong, H. U., Rho, B. S., & Nam, S. W. (2001). Correlation of the M23C6 precipitation morphology with grain boundary characteristics in austenitic stainless steel. Materials Science and Engineering: A, 318(1-2), 285-292. 79 Sakaguchi, N., Ohguchi, Y., Shibayama, T., Watanabe, S., & Kinoshita, H. (2013). Surface cracking on Σ3, Σ9 CSL and random grain boundaries in helium implanted 316L austenitic stainless steel. Journal of Nuclear Materials, 432(1-3), 23-27. 80 Zhang, P., Zhang, Z.J., Li, L.L. and Zhang, Z.F., 2012. Twin boundary: Stronger or weaker interface to resist fatigue cracking?. Scripta Materialia, 66(11), pp.854-859. 81 Tran, H.S., Tummala, H., Péron-Lührs, V., Fivel, M. and Habraken, A.M., 2015. Interaction between dislocation and coherent twin boundary by quasicontinuum model. In COMPLAS XIII: proceedings of the XIII International Conference on Computational Plasticity: fundamentals and applications (pp. 992-1002). CIMNE.
239
82 Christian, J.W. and Mahajan, S., 1995. Deformation twinning. Progress in materials science, 39(1-2), pp.1-157. 83 Lu, L., Shen, Y., Chen, X., Qian, L. and Lu, K., 2004. Ultrahigh strength and high electrical conductivity in copper. Science, 304(5669), pp.422-426. 84 Zhang, J.S., et al., Grain boundary precipitation strengthening in high temperature creep of Fe�15Cr�25Ni alloys. Scripta Metallurgica, 1989. 23(4): p. 547-551.
85 Rashidi, M., et al., Microstructure and mechanical properties of two Z-phase strengthened 12%Cr martensitic steels: the effects of Cu and C. Materials Science and Engineering: A, 2017. 694: p. 57-65.
86 Goswami, T. and H. Hanninen, Dwell effects on high temperature fatigue damage mechanisms: Part II. Materials & Design, 2001. 22(3): p. 217-236.
87 Yu, S.Y., et al., Mechanisms of dwell fatigue crack growth in an advanced nickel disc alloy RR1000. MATEC Web of Conferences, 2014. 14: p. 03002.
88 Li, H.Y., et al., Effects of microstructure on high temperature dwell fatigue crack growth in a coarse grain PM nickel based superalloy. Acta Materialia, 2015. 90(0): p. 355-369.
89 Mahoney, M.W. and N.E. Paton, The Influence of Gas Environments on Fatigue Crack Growth Rates in Types 316 and 321 Stainless Steel. Nuclear Technology, 1974. 23(3): p. 290-297.
90 Austin, T.S.P. and G.A. Webster, PREDICTION OF CREEP CRACK GROWTH INCUBATION PERIODS. Fatigue & Fracture of Engineering Materials & Structures, 1992. 15(11): p. 1081-1090.
91 Piques, R., P. Bensussan, and A. Pineau, Crack initiation and growth under creep and fatigue loading of an austenitic stainless steel. Nuclear Engineering and Design, 1989. 116(3): p. 293-306.
92 Ainsworth, R.A., The initiation of creep crack growth. International Journal of Solids and Structures, 1982. 18(10): p. 873-881. 93 Saxena, A., Creep and creep–fatigue crack growth. International Journal of Fracture, 2015. 191(1): p. 31-51. 94 Ainsworth, R.A., R5 procedures for assessing structural integrity of components under creep and creep–fatigue conditions. International Materials Reviews, 2006. 51(2): p. 107-126.
95 Holdsworth, S., Creep-Fatigue Failure Diagnosis. Materials, 2015. 8(11): p. 7757-7769.
240
96 Chang, C.-S., Fracture processes in simulated HAZ microstructures of stainless steel / by Chung-Shing Chang, in School of Metallugy and Materials. 2000, University of Birmingham: Birmingham. 97 Narasimhachary, S.B. and A. Saxena, Crack growth behavior of 9Cr−1Mo (P91) steel under creep–fatigue conditions. International Journal of Fatigue, 2013. 56: p. 106-113. 98 Tang, Z., et al., Creep-fatigue crack growth behavior of G115 steel under different hold time conditions. International Journal of Fatigue, 2018. 116: p. 572-583. 99 Saxena, A., Creep crack growth under transient conditions. Materials Science and Engineering: A, 1988. 103(1): p. 125-129. 100 Landes, J.D. and K.-H. Schwalbe, An analysis of creep deformation parameters. Part 1: background. Engineering Fracture Mechanics, 2004. 71(16): p. 2449-2461. 101 Davis, J.R., ASM specialty handbook: heat-resistant materials. 1997: Asm International.