metropolitan city growth and management in post-liberalized india
TRANSCRIPT

44
Eurasian Geography and Economics, 2012, 53, No. 1, pp. 44–62. http://dx.doi.org/10.2747/1539-7216.53.1.44Copyright © 2012 by Bellwether Publishing, Ltd. All rights reserved.
Metropolitan City Growth and Management in Post-liberalized India
Annapurna Shaw1
Abstract: A noted Indian urban geographer examines the growth and management of metro-politan cities in India since the country’s economic liberalization was introduced in 1991. The author discusses the significant changes in urban policy that have been initiated over the last two decades, with the state diluting its presence in many sectors and inviting private capital participation in the economy. Also covered are metropolitan growth and investment patterns traced to major urban, state, and central government policies. A comparative study of two met-ropolitan areas, Kolkata and Bangalore, is used to highlight differences in governance patterns in light of local exigencies as well as globalization. Journal of Economic Literature, Classifi-cation Numbers: F020, H540, J610, O180. 2 figures, 2 tables, 44 references. Key words: India, Kolkata, Bangalore, metropolitan cities, economic liberalization, city management, municipal services, urban development, urban revenues and expenditures, social indicators.
INTRODUCTION
India began the 21st century with a relatively low level of urbanization compared to other large developing countries. With 28.7 percent of its population living in urban areas in the
census year of 2001, it lagged far behind the urbanization levels of much of Latin America, Southeast and East Asia, as well as Africa. By the next census of 2011, the urban population share had increased to 31.16 percent. But despite its low level of urbanization, India has a very large urban population (around 377 million). Compared to 2001 when 37 percent of the urban population lived in 35 million-plus cities, around 42.6 percent of the urban population is concentrated today in 53 million-plus cities (Census of India, 2011). They are India’s engines of growth and also its magnets, attracting people from the surrounding countryside, smaller towns, and less dynamic regions. With higher demographic growth rates than the rest of the urban system, and experiencing considerable horizontal expansion, India’s largest cities are, however, beset with problems of inequality in access to basic municipal services as well as to critical social facilities such as schools and health care. In addition, they face environmental problems such as increasing air and noise pollution, shrinking green spaces, and congested roads. Managing them so as to increase their livability and inclusiveness and, at the same time, maintain their economic energy and cultural diversity is indeed a major challenge.
This paper examines the growth and management of the million-plus cities in India, also known as metropolitan cities (Fig. 1), since economic liberalization was started in 1991. In the next section, urban policy changes that have occurred after the liberalization are briefly discussed. In the last two decades, with the state reducing its presence in many sectors and inviting private-sector participation, there have been significant changes in urban policy. One
1Professor, Indian Institute of Management Calcutta, Joka, Diamond Harbor Road, Kolkata 700104, India ([email protected]).

ANNAPURNA SHAW 45
aspect of the impact of such changes is presented in a third section of the paper, which analyzes economic investment patterns in metropolitan cities between 1995 and 2010. A fourth section presents a comparative history of two metropolitan areas, Kolkata and Bangalore, to highlight the different urban contexts in which liberalization has unfolded. What these differences have meant in terms of revenue generation and expenditure patterns of local government, as well as overall social well-being of the urban area, are discussed in a fifth section, and concluding observations are presented in a sixth.
POLICY CHANGES AFTER LIBERALIZATION
It has been 20 years since the opening of the Indian economy in 1991 and its impacts on the country’s cities, hardly noticeable after the first decade, have since the second emerged as
Fig 1. India’s metropolitan cities in 2011.
46 EURASIAN GEOGRAPHY AND ECONOMICS
striking and significant in several ways. The changes are an ongoing process heralding even greater transformations to come. They have been driven partly by the needs of the growing cities themselves as the country enters its third decade of fairly rapid economic growth and partly by changes in macro-economic policy and India’s position in global markets.
The 1990s thinking on urban issues was greatly influenced by what was happening glob-ally where, in many developed countries, a neoliberal shift from state-directed development strategies of the prior 40 years to market-driven and laissez faire strategies had occurred, with governments taking a backseat in important policy areas. Such a change in ideas involved a switch from reliance on state to non-state actors and a focus on the private sector, non-government organizations, and civil society.
A major consequence of the shift in thinking was a re-emphasis on the large or metropoli-tan city as the focus of policy attention. By the 1990s, this was happening throughout Asia, particularly as attempts at controlling the growth of large cities during earlier decades had failed and urban primacy continued unabated in many of the smaller Asian countries despite government intervention to channel growth away from the largest cities (e.g., see Rondenneli, 1991). In India, the so-called Mega Cities Programme launched in 1993 served to highlight the major problems of large cities (e.g., see Chakravorty, 1996). These cities fit the role of growth engines and concentration of resources in them was justified, as they were growing rapidly and contained a large percentage of the urban population, including the urban poor. Large cities were also most amenable to management by the new public management (NPM) tools and techniques that were greatly in vogue after liberalization. NPM stressed the incor-poration of the values and efficiencies of the private sector in publicly managed organizations, such as those delivering basic urban services (e.g., see Prasad, 2008). This could be done by organizational changes within the public sector, such as separating the responsibilities of building and financing urban infrastructure from those of their regulation and monitoring, and from that of service delivery. Thus, in India, while the focus of major reforms during 1991–2001 was on financial and industrial deregulation, changes in thinking about the urban were already in place via the advocacy of new public management tools and techniques for the better management of cities.
Alongside the re-emphasis on the large city, the first decade after economic liberaliza-tion was also important for the passage of the 73rd and 74th Constitution Amendment Acts in 1992 (The Constitution Amendment Acts, n.d.) to give greater stability and power to local rural and urban governing bodies. The 74th Constitution Amendment Act sought to make urban local government more effective in self-administration, and certain positive outcomes have followed, such as ensuring a five-year term for urban government, making elections the norm, and reserving seats for women and other historically disadvantaged groups such as the Scheduled Castes and Scheduled Tribes2 in municipal councils. But the decentralization that was attempted through this act has been partial, for urban local government still lacks adequate financing and financial control. The exceptions are the largest and more affluent municipal corporations of the country; it should be noted, however, that municipal councils of small towns have not benefitted much.3
2These groups are expressly recognized in India’s constitution as the beneficiaries of affirmative action policies. Together they account for almost a quarter of India’s population.
3A municipal corporation is a local government body that manages large cities in India. The population cutoff for determining the size of such a body varies by state, but is generally around 300,000. Although administratively part of the district in which it is located, it is formed by a municipal incorporation act that endows the city with its powers and functions. It interacts directly with the state government.

ANNAPURNA SHAW 47
Although no other new urban policy or program was introduced during the 1990s, a number of subtle, preparatory changes were taking place. In the 1990s, the government’s role in the land market began to gradually change, with its declaration of wanting to act as “enabler and facilitator” rather than as land developer (Shaw, 1996). To further this end, in 1999, the central government scrapped the Urban Land (Ceiling and Regulation) Act of 1976 as a central act (The Urban Land, 2008), seen as preventing transactions involving large plots of land and giving the government too much discretionary control over the land market in large cities. At present, most of the country’s major states have repealed the Act in their own legislative assemblies, thus enabling private developers to undertake large development proj-ects covering sizable tracts of land.
In these ways, the decade of the 1990s laid the groundwork for the introduction of more comprehensive reforms that were launched thereafter. It was in the second decade after eco-nomic reforms were initiated that a direct attempt was made to reform the urban sector through the launching of a specific program. In 2001, India’s central government unveiled its “urban sector reforms” aimed at increasing the efficiency of urban local bodies. These were manifest in an Urban Reform Incentive Fund (Brief Note, n.d.) implemented in 2003, in which state governments were offered incentives to undertake reforms. In December 2005, this idea was incorporated in the central government’s massive new urban program called the Jawaharlal Nehru Urban Renewal Mission (JNNURM; Government of India, 2005b), by which 500,000 million rupees (Rs.) was to be pumped into the urban system during the following seven years (from 2005–2006 to 2011–2012) for all types of infrastructure creation and improvement of urban governance.
The program, a flagship of the UPA (United Progressive Alliance), India’s present ruling coalition, has been of particular importance to metropolitan regions. JNNURM has two sub-components: urban infrastructure and governance (UIG) and basic services for the urban poor (BUSP). The two sub-missions cover the 35 metropolitan cities of 2001, all state capitals, and a few other cities of national importance, making a total of 65 cities for which the center is spending Rs 391,500 million by 2012 to upgrade slums and create new infrastructure.4 But the funding comes with conditions and these include a series of reforms to be undertaken by the city government requesting funds and by the state within which the city is located. The reforms are of two types: mandatory and optional. Mandatory reforms for local government include the following: adoption of a modern, accrual-based double-entry accounting system; use of e-governance for various services; property tax reform; the levying of reasonable user fees; and internal earmarking of budgets for basic services to the poor as well as provision of such services, to include security of tenure, improved housing, and other social services. Mandatory reforms for the state include: implementation of decentralization as per the 74th Amendment Act; repeal of Urban Land Ceiling and Regulation Act; reform of rent control laws; rationalization of the stamp duty (bringing it down to 5 percent over a period of seven years); enactment of the Public Disclosure Law to enable public scrutiny of the city’s fiscal plan and release of performance information (Public Disclosure Law, n.d.); and enactment of the Community Participation Law (Ghosh, 2008) and assigning to elected urban local bodies a “city planning function.”
The expected outcomes of JNNURM are modern and transparent budgeting, account-ing, and financial management systems; a city-wide framework for planning and governance;
4Towns and cities not among the selected 65 are covered by two other schemes within the JNNURM program: the Urban Infrastructure Development Scheme for Small and Medium Towns (UIDSSMT) and the Integrated Housing and Slum Development Programme (IHSDP) (see Government of India, n.d.). The financial allocation for these two schemes was Rs. 108,500 million.

48 EURASIAN GEOGRAPHY AND ECONOMICS
access to a basic level of urban services for all citizens; and financially self-sustaining agen-cies for urban governance. While the program is still ongoing and it is too early to assess its full impact, a mid-course appraisal of the program indicates some successes as well as failures. The former include the availability of much-needed funding for improving city infrastructure5 and the enthusiasm with which many cities have availed themselves of it. As of September 2009, 467 projects have been sanctioned amounting to Rs 503 billion and 77 percent of them are for basic services such as water supply, sewerage, and drainage (Sivaramkrishnan, 2011). Among individual cities, Bangalore has been sanctioned the most projects—40 worth a com-bined Rs. 27.98 billion.6 Examination of the distribution of projects by state indicates that central funding has gone primarily to seven states with large urban populations and a higher level of urbanization than the national average: Maharashtra, Tamil Nadu, Karnataka, Gujarat, Uttar Pradesh, Andhra Pradesh, and West Bengal.7
Successes also include a gradual improvement in service delivery of some municipal functions through the increasing use of e-governance, a key emphasis of the JNNURM reforms. Examples include improvements in birth registration and issuance of birth certifi-cates, a more streamlined and transparent property tax system in several cities, easier bill payment and customer service systems, and the creation of city government websites with all services and contact information listed. The Right to Information Act, in effect since 2005 (Government of India, 2005a), has provided the impetus for government agencies (includ-ing city governments) to provide the public with more information about their activities. The initiatives of non-governmental organizations have also ensured more openness, but this varies considerably from state to state.
The implementation of JNNURM has revealed a number of problems as well. Some have arisen because of the way the program has bypassed urban local bodies. Except in the seven largest cities with strong municipal corporations, the program is mostly coordinated by the state government and its development institutions, with local government in smaller cit-ies having little involvement in framing the city development plan or writing up the detailed project reports through which funding from the center is sought (Sivaramakrishnan, 2011). Neither have small-city local governments had much involvement in project implementa-tion. Another criticism of the reforms required to access central funding is that they are more “investor friendly” than “people friendly.” By emphasizing public-private partnerships in projects, even in housing for the poor, they signal the continued withdrawal of the state and the strengthening of the private sector in the provision of key social services.
Overall, during the second decade following economic liberalization the central gov-ernment has shown much greater interest in the management of India’s cities and this is also manifest in new rules and regulations enacted for them by the center. These include the Municipal Solid Waste (Management and Handling) Rules (Government of India, 2000), Urban Transport Policy (2006; National Urban Transport Policy, n.d.), National Urban Housing and Habitat Policy (Government of India, 2007a), and National Urban Sanitation Policy (Government of India, 2008). Through these policies the central government hopes to steer the states and their urban local governments into actions designed to improve urban quality of life. However, given India’s great size and diversity, state responses to central policy are not uniform, even though all states have attempted to increase inward investment.
5On the critical need for additional infrastructure to accommodate expected future metropolitan growth in India, see Nijman (2012, this issue).
6Following Bangalore in this respect are Chennai (39 projects), Kolkata (34), Ahmedabad (25), Surat (25), Greater Mumbai (24), and Hyderabad (22) (Sivaramakrishnan, 2011).
7The partial exception is Uttar Pradesh, which does not have an above-average level of urbanization.
ANNAPURNA SHAW 49
The next section of this paper is intended to highlight the divergent outcomes evident in the country’s different metropolitan cities.
INVESTMENT PATTERNS IN MAJOR METROPOLITAN AREAS, 1995–2010
Post-liberalization changes in India’s metropolitan cities are reflected in the kinds of investment they are experiencing and the agencies which make these investments. The changes have facilitated the development of economically dynamic urban corridors of growth in some parts of the country and new urban clusters elsewhere. This situation notwithstand-ing, large swathes of India are excluded from such dynamic developments, locked into old industrial bases and high unemployment and “exporting” their skilled and unskilled labor to the economically dynamic urban regions.
Of interest are both the quantity and type of investment received by the different urban regions, as detailed in data compiled by the Centre for Monitoring the Indian Economy (CMIE).8 The data are disaggregated by state and district. Because some of the largest cities are coextensive with entire districts, it is possible to identify investment that flows into these large cities. The cumulative investment in large projects (measured in Rs. one crore [Rs. 10 million] in Table 1) received by major cities and their adjoining districts between June 1995 and December 2010 indicates the following patterns.
First, three urban locations in the country have benefitted from enormous investment (Fig. 2). With a total of over two million crores, a western region, or Ahmedabad–Mumbai–Pune urban corridor has been the largest investment destination, with Mumbai and the adjoin-ing districts of Thane and Raigarh receiving a little above a million crores. Similarly, Delhi and its adjoining districts of Faridabad, Gurgaon, Ghaziabad, and Noida constitute a northern region that has received over a million crores. In both Delhi and Mumbai, the adjoining areas have received more investment than the city itself. In contrast, in a southern region of high investment (i.e., Chennai, Bangalore, and Hyderabad), which forms the third hub of high investment, these cities proper have received more than their outlying districts. Overall, the coffers of southern cities have received over one million crores of investment.
A second notable feature is that the magnitudes of investment flowing into economically dynamic regions contrast sharply with that into the country’s other urban regions (Table 1). Apart from the Kolkata Urban Agglomeration (Fig. 2), which includes 40 smaller cities and towns and spills over into the adjoining districts of North and South 24 Parganas, Hugli, and Howrah, cumulative investment in cities outside the economically dynamic parts of the coun-try has been considerably smaller in scale. The Kolkata urban region itself has not done all that well. Although much larger in terms of population, it ranks behind smaller metropolitan cities such as Bangalore, Hyderabad, and Ahmedabad when compared by the quantity of received investments.
An interesting follow-up question involves the sources of investment in urban India. Have investments primarily been forthcoming from public or private sources, and has foreign direct investment been of any significant magnitude in the country’s cities? Cumulative data for the period 1995–2010 indicate a distinct pattern for the core areas of India’s major cities and their surrounding urban regions. In the core areas of several major cities, comprising the old municipal corporation, there has been significant public investment, the highest in the capital city of Delhi where central and state government investments together amount to
8CMIE is an autonomous statistical organization based in Mumbai that has been publishing data on various aspects of investment in India since 1995.

50 EURASIAN GEOGRAPHY AND ECONOMICS
Table 1. Cumulative Investment in the Urban Regions, 1995–2010 (Rs. crore)a
Urban regionInvestment in:
Urban area Adjoining districts Total
Dynamic urban regionsWestern regionb 2,018,266
(US$ 448.5 billion)Ahmedabad 335,060 335,060Surat 289,641 289,641Vadodara 99,091 99,091Mumbai 500,459 522,806c 1,023,265Pune 271,209 271,209
Southern hubs of growth 1,701,658(US$ 376.1 billion)
Chennai 289,641 233,018d 522,659Bangalore 345,583 48,283e 393,866Hyderabad 266,991 103,108f 370,099Vishakapatnam 248,773 248,773Kochi (Ernakulam) 121,990 121,990Coimbatore 44,271 44,271
Northern region 1,337,446(US$ 297.2 billion)
Delhi 378,409 682,185g 1,060,234Ludhiana and Jalandar 100,598 100,598Jaipur 128,796 128,796Chandigarh 47,818 47,818
Other urban regionsEastern region 483, 697
(US$ 107.5 billion)Kolkata 181,470 136,709h 318,179Patna 67,041 67,041Dhanbad 98,477 98,477
North-Central region 117,882(US$ 26.2 billion)
Varanasi 18,857 18,857Lucknow 75,128 75,128Kapur 23,897 23,897
Central region 206,517(US$ 45.9 billion)
Bhopal 69,326 69,326Indore 46,521 46,521Nagpur 90,670 90,670
a1 crore = 10 million rupees, or approximately US$200,000 in mid-January, 2012. The USD-Indian rupee exchange rate has varied during the 15-year period from lows of Rs 38 to a dollar to highs of over Rs 50. Rs 45 to a dollar can be used here as the exchange rate to represent the entire period. However, given that both domestic investments as well as inward flows of FDI have also varied from year to year and from decade to decade (FDI from less than 1 billion a year prior to 1991 and a high of 38 billion around 2007), such conversion (e.g., 2,018,266 Rs. crore = $448.5 billion for the Western region) might still admittedly be somewhat simplistic.bAhmedabad–Mumbai–Pune corridor.cAdjoining districts are Thane and Raigarh.dAdjoining districts are Tiruvallur and Kanchipuram.eAdjoining district is Bangalore Rural.fAdjoining district is Rangareddy.gAdjoining districts are Faridabad, Gurgaon, Ghaziabad, and Noida.hAdjoining districts are North 24 Parganas, South 24 Parganas, Haora, and Hugli.Source: Compiled by author from CMIE, CapEx database, cited in Shaw, 2012a.

ANNAPURNA SHAW 51
60 percent of the total. However, in Kolkata, Chennai, Hyderabad, and Ahmedabad, private investment from domestic sources has exceeded public investment. Urban regions surround-ing the core city have received much less public investment, relying instead on private domes-tic sources. This pattern however, does not apply to Bangalore and Hyderabad, where the surrounding district has received substantial state government inflows. What the data also show, quite clearly, is that foreign direct investment (FDI) has not been a major contributor to urban projects in the last 15 years (at its highest only around 16 percent in the suburbs of Bangalore).9 Second, most of the FDI has gone to the urban regions of major Indian cities rather than the old core areas.
9In previous work with CMIE data for the period 1995–2005, Bangalore also ranked first in FDI (Shaw and Satish, 2007).
Fig. 2. Dynamic urban corridors and clusters of cities in 2011.
52 EURASIAN GEOGRAPHY AND ECONOMICS
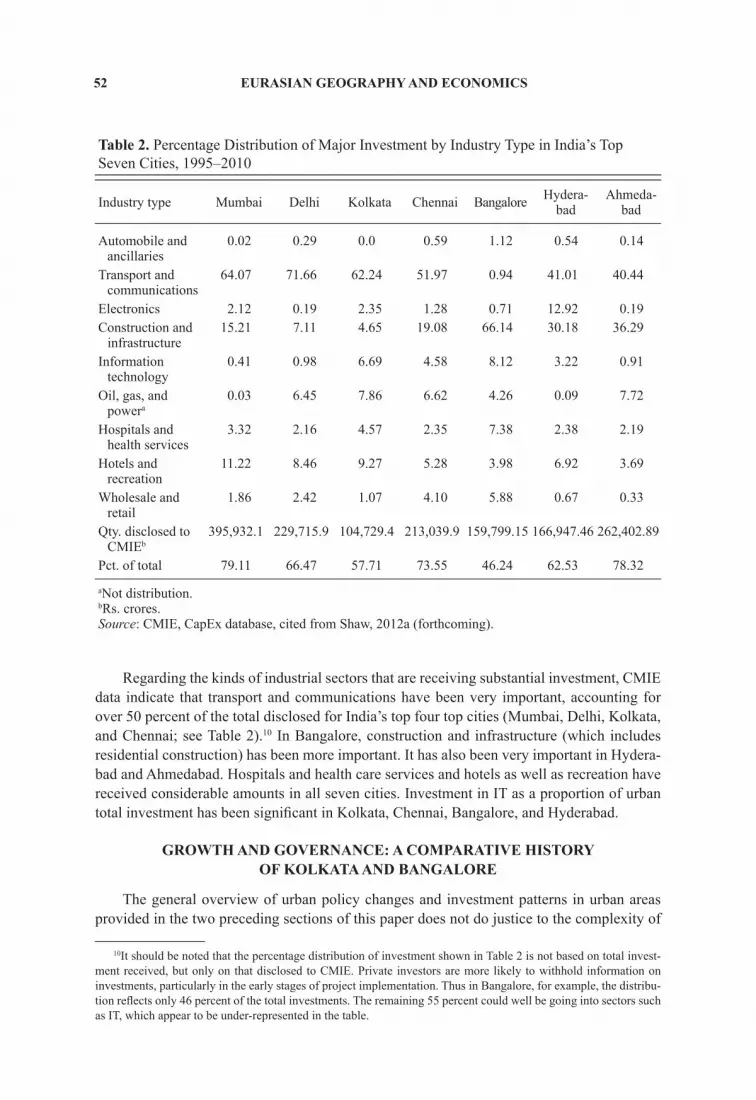
Regarding the kinds of industrial sectors that are receiving substantial investment, CMIE data indicate that transport and communications have been very important, accounting for over 50 percent of the total disclosed for India’s top four top cities (Mumbai, Delhi, Kolkata, and Chennai; see Table 2).10 In Bangalore, construction and infrastructure (which includes residential construction) has been more important. It has also been very important in Hydera-bad and Ahmedabad. Hospitals and health care services and hotels as well as recreation have received considerable amounts in all seven cities. Investment in IT as a proportion of urban total investment has been significant in Kolkata, Chennai, Bangalore, and Hyderabad.
GROWTH AND GOVERNANCE: A COMPARATIVE HISTORY OF KOLKATA AND BANGALORE
The general overview of urban policy changes and investment patterns in urban areas provided in the two preceding sections of this paper does not do justice to the complexity of
10It should be noted that the percentage distribution of investment shown in Table 2 is not based on total invest-ment received, but only on that disclosed to CMIE. Private investors are more likely to withhold information on investments, particularly in the early stages of project implementation. Thus in Bangalore, for example, the distribu-tion reflects only 46 percent of the total investments. The remaining 55 percent could well be going into sectors such as IT, which appear to be under-represented in the table.
Table 2. Percentage Distribution of Major Investment by Industry Type in India’s Top Seven Cities, 1995–2010
Industry type Mumbai Delhi Kolkata Chennai Bangalore Hydera-bad
Ahmeda-bad
Automobile and ancillaries
0.02 0.29 0.0 0.59 1.12 0.54 0.14
Transport and communications
64.07 71.66 62.24 51.97 0.94 41.01 40.44
Electronics 2.12 0.19 2.35 1.28 0.71 12.92 0.19Construction and
infrastructure15.21 7.11 4.65 19.08 66.14 30.18 36.29
Information technology
0.41 0.98 6.69 4.58 8.12 3.22 0.91
Oil, gas, and powera
0.03 6.45 7.86 6.62 4.26 0.09 7.72
Hospitals and health services
3.32 2.16 4.57 2.35 7.38 2.38 2.19
Hotels and recreation
11.22 8.46 9.27 5.28 3.98 6.92 3.69
Wholesale and retail
1.86 2.42 1.07 4.10 5.88 0.67 0.33
Qty. disclosed to CMIEb
395,932.1 229,715.9 104,729.4 213,039.9 159,799.15 166,947.46 262,402.89
Pct. of total 79.11 66.47 57.71 73.55 46.24 62.53 78.32
aNot distribution.bRs. crores.Source: CMIE, CapEx database, cited from Shaw, 2012a (forthcoming).

ANNAPURNA SHAW 53
central-state-local relations and their importance in explaining the existing condition of cities and their potential futures. To understand more profoundly the extent to which government policy has changed since India’s liberalization and how it has impacted the management of cities, one should turn to a more in-depth view of growth and governance in specific cities. The diversity of experiences within Indian states makes this even more necessary.
There is a consensus to the effect that since the onset of economic liberalization in 1991, the states have gradually gained greater autonomy, especially in land and licensing matters. While state governments share the same basic legal framework, they also interpret and imple-ment national regulations differently. Some states such as Gujarat, Maharashtra, Karnataka, and Andhra Pradesh, have made their processes more efficient and their leading cities are well ahead with regard to attractiveness to business and investment (World Bank, 2009). Some such as Kerala and Tamil Nadu have a history of social reform and have been at the forefront in implementing stronger welfare measures. These states also have carried out the decentralization of government to the local level better than others. Because of their almost complete jurisdiction over municipal affairs as well as over policy that is important to cities (e.g., industrial location and development), the state’s position becomes critical in enabling or constraining metropolitan business policies and governance.
This section of my paper focuses on the evolution of two large metropolitan cities, Kolkata and Bangalore, to provide a deeper view. It provides a retrospective look into the recent past of both metropolitan areas in order to show the economic, social, and political con-text within which liberalization took place. These two cities have several contrasting features, with Kolkata broadly representing the old India and Bangalore the new. A comparative study can thus indicate the upside and downside of both the neoliberal and statist models of urban growth in a developing country.
Kolkata Metropolitan Area
West Bengal, a state in eastern India within which the Kolkata Metropolitan Area is located, is a middle-level entity in terms of key social and economic indicators (World Bank, 2005; see also Chakravorty, 2012 in this issue). It was one of India’s leading states in the early decades after independence, having been the headquarters of the British Raj and the earliest to experience the Westernization and modernization that accompanied British rule. Kolkata (then Calcutta) was the capital city until 1911, after which the capital was shifted to Delhi. What followed has been mainly a story of decline, first political and then after the 1950s economic, in tandem with the decline of the jute and engineering industries that were the economic base of the metropolitan region. Declining global demand for jute products and packaging, loss of jute-growing areas to present-day Bangladesh (then East Pakistan) after the partition of India in 1947, and failure to upgrade technology and remain competitive were some of the reasons for the economic descent.
The Kolkata Metropolitan Area is India’s third-largest urban region in terms of popula-tion, after Mumbai and Delhi, and covers an area of 1851.41 km2. Its population according to Census 2011’s provisional numbers is 14.1 million (Census of India, 2011), a small increase from 13.2 million in 2001 (Census of India, 2001. Administration of the area is vested in urban and rural local bodies of government, state government development organizations, and the central government based on its control of small military cantonments. More specifi-cally, the Kolkata metropolitan area consists of 3 municipal corporations, 38 municipalities, 2

54 EURASIAN GEOGRAPHY AND ECONOMICS
cantonments, 1 notified area,11 77 non-municipal or census towns,12 and 445 rural government bodies. Its political fragmentation reflects the history of the region which was an important industrial area from the early 20th century until about the 1960s. Many of the municipali-ties are former jute-milling towns that attained their municipal status during the late colo-nial period. Of the 41 urban local bodies (i.e., municipal corporations and municipalities), only 11 (i.e., 27 percent) were created after independence in 1947. The Kolkata Municipal Corporation is the oldest urban local body in the metropolitan area, having been founded in 1726. It is the core of the metropolitan region.
The Kolkata Municipal Corporation is also the largest component of the metropolitan area, occupying roughly 11 percent of its geographical area and accounting for 4.5 million people (31.1 percent of its population) in 2001. The 38 smaller municipal towns extend over a third of the metropolitan area and account for 45.1 percent of its residents, while 40.3 percent of metropolitan land was still rural in 2001, accounting for only 8.7 percent of its population. In the last 50 years, these different components have experienced different rates of urban growth. The core area (Kolkata Municipal Corporation) has stagnated, its annual growth rate falling from 0.8 percent during 1951–1961 to 0.41 percent during 1991–2001 (e.g., see Census of India, 1981, 2001). The smaller municipal towns, on the other hand, have continued to grow steadily with an annual growth rate of 2.10 percent during 1951–1961 that increased to 2.69 percent during 1991–2001.
Important for our understanding of the present situation in the metropolitan region is its political history and the policies adopted by the state government, which until recently had been administered by a coalition of Left parties (Left Front) for a period of 34 years. Having come to power in 1977, the Left Front first embarked on land reforms and an agri-cultural growth policy. Initial land reforms were successful so that agricultural productivity increased significantly during the 1980s. However, the urban-industrial sector was neglected and with the decline of jute and engineering, the state’s economic performance fell. There was industrial flight because of militant trade unionism and loss of workdays due to strikes and lockouts. Increasing unemployment and urban decay slowed migration into the metro-politan area.
In 1994, a New Industrial Policy welcoming “appropriate foreign capital” was announced, but investment prospects did not improve. Nonetheless, from 2000 until 2007, there was an economic revival of sorts, with accelerated growth in state net domestic product and private investments, as well as an expanding IT and services sector (Shaw, 2008). There was also a rebound in the state’s old engineering base, with new investments in the steel industry. The improving industrial climate had positive effects on the retail sector and real estate, leading to big investments in shopping malls and large-format residential complexes (Shaw and Satish, 2007). Various government institutions made huge gains in the sale and leasing of land.
The impact of renewed growth on income and social welfare in the metropolitan region appears to be muted. For West Bengal, the latest official poverty data indicate that 14.8 per-cent of its urban population was below the poverty line in 2004–2005 compared to 28.6 percent in the state’s rural areas (Government of India, 2007b). Wide variations in the Human Development Index between urban and non-urban regions in the state indicate that relative deprivation levels have not changed much (Datta, 2007). Urban consumption levels have
11A notified area is an area designated by the state government for future development, generally for industrial purposes. Unlike the elected urban local bodies, the notified area is governed by a committee appointed by the state government.
12For a definition of the census towns, see footnote 3 in the article by Nijman (2012, p. 10; in this issue).
ANNAPURNA SHAW 55
always been significantly higher than rural, typically being more than one and a half times the latter (Government of West Bengal, 2004).
In May 2011, the Trinamul Congress, the main opposition party in the state, won a resounding victory over the Left parties. A few days after the win, the new Chief Minister, Ms. Mamata Banerjee, announced an expansion of the boundaries of the Kolkata Municipal Corporation, now to include Joka, an outlying community to the south and Sector 5 of Salt Lake to the northeast. An array of new investments has been announced, including expansion of the underground metro system from a single north-south line to a network, new overpasses, and an upgrading of the city’s river front. Being a major coalition partner of the present UPA central government in Delhi, Banerjee has raised hopes for an influx of funding from the center to revive and improve the city and West Bengal (Centre to Fund, 2011). Since 2008, the prospects of substantial private investment entering the state have remained bleak, so that Kolkata’s economic growth has been slow, with the lowest demand for office space among India’s seven top cities (Sobhana, 2011).13
Bangalore Metropolitan Area
The Bangalore Metropolitan Area is located in the state of Karnataka, and ranked fourth in the World Bank’s (2005) classification of 16 largest Indian states according to key eco-nomic and social indicators. The state’s modern history and economic trajectory present a sharp contrast to West Bengal’s. A large part of the state overlaps with the former kingdom of Mysore, which was annexed by the British in 1799 and retained as a princely state until India’s independence in 1947. By the turn of the 20th century, textile mills were established in the region around Bangalore and a wave of entrepreneurial activity followed. Several important institutions of learning, such as the Indian Institute of Science and the Engineering College of Bangalore also were founded. The Mysore government provided one of the earli-est examples of a “mixed economy,” with a blend of private- and public-sector industrializa-tion, a model that would influence national planning in the early post-independence years (Heitzman, 2006).
Advancing industrialization saw the establishment of Hindustan Aircraft Pvt. Ltd. (HAL) in 1940, the Radio and Electrical Manufacturing Company in 1942, and Mysore Electrical Industries in 1945. During the early-post independence period public-sector industries were set up with central government support, including the Indian Telephone Industries (1948), Bharat Electronics Ltd. (1954), and Hindustan Machine Tools (1955). The choice of Bangalore for the location of these important firms reflected Karnataka’s tradition of state-sponsored industrialization, the city’s mild climate, the presence of the Indian Institute of Science and other science and engineering colleges, as well as availability of cheap electrical power. There were also security issues and the need to place important technology facilities out of range of potential Pakistani air strikes (Heitzman, 2004, p. 45). The above factors were also instrumen-tal in spawning Bangalore’s information technology industry, which received a boost in the 1980s when the central government banned IBM from operating in the country.
In the 1970s, these large-scale industries contributed to dynamic regional growth, providing substantial employment as well as multiplier effects. At the same time, the state
13Land acquisition problems in 2007 have made private industry reluctant to invest in West Bengal. Economic growth has slowed due to the failure to implement several large development projects, for instance, the highly pub-licized Tata Nano automobile manufacturing project, which left the state in October 2008 after much acrimony over land acquisition.

56 EURASIAN GEOGRAPHY AND ECONOMICS
government encouraged the expansion of small and medium-sized industries by establishing a series of offices to oversee the planning of industrial parks and provision of infrastructure for newly acquired industrial areas. In 1976, the government created the Bangalore Development Authority to devise a comprehensive plan for the fast-growing metropolitan area (Bangalore Development Authority, 2007).
With the Congress Party in power continuously until 1983, consensus-building among bureaucrats, private capitalists, a growing professional class, and workers within the orga-nized sector marked Karnataka’s political culture. The public-sector institutions spawned a type of managerial innovation that resulted in the creation of new public-sector (parastatal) organizations that led to the furtherance of the state planning model. Until the 1980s, this model seemed to work well and deliver a reasonable standard of living (Heitzman, 2004). However, by the late 1980s, the metropolitan area population had grown to 2,660,088, and Karnataka state had become nearly one-third (31 percent) urban. The suddenness of this growth and unpreparedness of the metropolis to handle it necessitated a change in policy. This need for change also coincided with a time of political change. The Congress Party lost the state assembly elections in 1983 and was replaced in power by the Janata Party, with its “Karnataka for the Kannadigas” slogan. Such regional chauvinism was to remain a feature of Karnataka’s political landscape despite the Congress Party’s intermittent returns to power during the subsequent period.
By the 1990s, the jurisdiction of the Bangalore Development Authority had increased to 1290 km2, with the Bangalore City Corporation forming its core area and encompassing 241 km2. Surrounding the core were built-up lands including a number of urban outgrowths as well as independent municipal and town councils. Beyond the built-up zone, a total of 208 km2 was earmarked for future urbanization. These three zones, totaling together 565 km2, formed the “Bangalore Conurbation,” which was surrounded by a green belt covering an area of 714 km2. However, by 1999, further growth led to the abandonment of the green belt to allow for the dispersal of the anticipated population increment in peripheral areas of the Bangalore Development Authority (Government of Karnataka, various years, as cited in Heitzman, 2004).
The continued rapid growth of Bangalore city in the first decade of the 21st century has led to further geographical expansion. On January 16, 2007, the Government of Karnataka certified the constitution of a considerably larger entity, the Greater Bangalore Municipal Corporation, by merging the existing city corporation with 8 outlying cities/towns and 111 adjacent villages. With this development, the geographical area of Bangalore city increased from 225 to 800 km2 and its population from less than 6 million to 8 million, spread over 140–150 wards (Kumar, 2007). There were significant inequalities among the outlying cities and the core, so that the purpose of the merger can be traced to efforts to improve and co-ordinate infrastructure development over the entire area.
The merger was also driven by the desire of the state government to facilitate Bangalore’s growth and development into a “network city” as an integral part of a global production-consumption complex based on software production, ITES (Information Technology Enabled Services), biotechnology, aviation, as well as space and scientific research. The broader goals and outlook of the state administration, its bureaucrats, local government officials, and civil society organizations provide a contrast to those of Kolkata and have had a noticeable impact on the size and disbursement of the metropolitan area’s of fiscal resources.

ANNAPURNA SHAW 57
CITY REVENUES, EXPENDITURES, AND SOCIAL INDICATORS
The revenue sources and expenditure patterns of city government over a number of years can provide key insights into the way a city is being managed and whether there has been a significant change in management strategy. In India as in most parts of the world, the revenue sources of city government are of three types: (1) own sources raised from city taxes and from non-tax sources such as user charges, fees and fines; (2) external sources such as higher-level government transfers of funds; and (3) borrowings or loans. Some interesting similarities and contrasts between the Kolkata and Bangalore metropolitan areas can be identified based on an analysis of revenue streams derived from these three sources and expenditures in 1994–1995, 2001–2002, and 2004–2005 (Shaw, 2012b). For both metropolitan areas, a conscious attempt was made to look at differences between the core city and the suburbs on the one hand and among suburbs on the other.
Starting with own source revenue, it was found that with economic liberalization, both kinds of differentiation have increased in the Kolkata Metropolitan Area. While the average own source per capita revenue for the metropolitan area increased in real value from Rs. 82 in 1994–1995 to Rs. 286 in 2004–2005, when the core city was excluded the average became lower. Second, differences among the smaller municipalities of the metropolitan area declined between 1994–1995 and 2001–2002, but rose quite sharply by 2004–2005. Third, there has been a steep rise in the highest own source earnings within the metropolitan area (core and suburbs), which increased in real value from Rs. 498 in 1994–1995 to Rs. 1,431 in 2004–2005, while the lowest only improved from Rs 2 in 1994–1995 to Rs. 16 in 2004–2005. This is reflected in high Gini values in 2004–2005 for both the suburbs and the metropolitan area. Clearly, some urban local bodies have been much more economically dynamic than others, the most dynamic being the core city (Kolkata Municipal Corporation).
For the Bangalore Metropolitan Area, the real average own source earnings per capita of Rs. 546 in 2004–2005 is much higher than Kolkata’s, and the differentiation between the core city and the suburbs, which was very high in 2001–2002, fell in 2004–2005 due to a rise in earnings at the bottom level (poorer suburbs). This tendency confirms the overall economic improvement of the larger metropolitan region.
Turning now to the role of government transfer payments to the local level, it was found that the transfers have been important in lowering own source earning differentiation in Kolkata. Here, transfers from the state government have partially equalized total revenues per capita, as indicated by significantly lower Gini values for all three years. After government transfers, average total per capita revenue rose, in real terms, from Rs 232 in 1994–1995 to Rs 498 in 2004–2005. In all three years, after government transfers, while average per capita rev-enue rose, the Gini coefficient and the coefficient of variation were lower than those from own source revenue per capita. This was partly an outcome of the Left Front’s deliberate policy of reducing differences in expenditure between the core city and the suburbs and between the Kolkata metropolitan area and the urban local bodies outside it by equalizing the size of the per capita development grant (Government of West Bengal, 2005, p. 1).
For Bangalore, transfers from the state government reduced inequalities in 2001–2002 but not in 2004–2005. Here a marked difference in policy should be noted. Unlike Kolkata, where the Left Front government continued to play a critical role in equalizing the differ-ences in earning capacity of the smaller towns, in the Bangalore metropolitan area (where the economic scenario has been more vibrant) the role of government transfers to equalize total per capita revenue across the suburbs has been waning. In fact, in 2004–2005, the Gini coefficient for own source revenue at .33 was lower than that of total revenue on a per capita

58 EURASIAN GEOGRAPHY AND ECONOMICS
basis (at .39), suggesting that intrametropolitan differences in per capita resources actually increased after government transfers.
Turning now to expenditures, not only is the level of spending important but also the distribution of expenditures for different purposes. To facilitate our understanding of the lat-ter, local government expenditures were divided into four broad categories: administrative, developmental, redistributive, and amenity. Developmental expenditure refers to spending on infrastructure and new construction, and redistributive expenditure to the financing of pub-lic health and education. Some interesting contrasts emerge. First, during the 10-year period 1994–1995 to 2004–2005, average per capita expenditure in real terms has increased three-fold in the Kolkata Metropolitan Area and twofold in the Bangalore Area. But, as in the case of per capita total revenue, average per capita expenditure in the case of Bangalore (Rs. 745) in 2004–2005 was considerably higher than Kolkata’s Rs. 474. However, while the Kolkata Metropolitan Area’s expenditure has risen steadily during the entire period, Bangalore’s spend-ing exhibited a sharp rise in 2001–2002 and a subsequent drop in 2004–2005. Second, there is greater disparity in expenditures in the latter. This is partly because the differences in earning capacity within the constituent units of the Bangalore Metropolitan Area were not equalized by state transfers to the extent they were in the Kolkata Metropolitan Area; Bangalore city (Rs. 2032 per capita expenditure in 2004–2005) contrasted sharply with the town councils of Byataraya, Dasarahalla, and Yalahanka (Rs. 219, 211, and 255, respectively). Third, there are clear differences between the two metropolitan areas when it comes to the distribution of total expenditure. In the Kolkata Metropolitan Area and in Kolkata city, the highest expenditure throughout the period has been toward redistributive activities (primarily water supply and sewerage). While expenditures in the Bangalore Metropolitan Area are similarly tilted toward redistribution, the city of Bangalore offers a distinct contrast, with its relatively lower percent-age allocations to redistribution, higher allocations to developmental expenditure, and high level of loans and borrowings. As developmental expenditure covers roads and commercial activities, this redirection in expenditure (i.e., in 1994–1995 and 2001–2002 redistributive expenditure did not constitute the majority of local government expenditure) could suggest the shaping of a different strategy for metropolitan growth.
Insights provided by an examination of the revenues and expenditures of the two metro-politan areas must be viewed side by side with actual socio-economic data to understand post-liberalization changes. Some key variables in the demographic, social, and economic context of large metropolitan areas in India are population size, level of literacy, percentage of slum population, and access to basic facilities. A strong indicator of development or its absence (more so than the overall level of literacy) is the level of female literacy. Data for the Kolkata Metropolitan Area indicate that the average female literacy for the suburbs is slightly higher than that of the core city, and second, that inequalities within the core are greater than within the suburbs. In fact the difference between the ward with the lowest female literacy and that with the highest is as much as 41 percentage points. The range in the suburbs is around half that at 26. Second, the level of inequality for the metropolitan area as a whole is quite low. Likewise for indicators of access to basic facilities such as percentage of households with a latrine/toilet in the house and electricity, and percentage of households with a water closet, the Gini value is low (Shaw, 2012b). But there is considerable social and economic differentia-tion within the 141 wards of the core city of Kolkata. While there are more than 4,000 slum clusters and six wards where the slum population exceeds 90 percent of the total population, there are also wards with no slums.
For the Bangalore Metropolitan Area, quantitative data were not available at such a dis-aggregated level, which prompted use of other data and reports. An interesting contrast to
ANNAPURNA SHAW 59
Kolkata is seen when the Bangalore Metropolitan Area is broadly classified as: city or core area, suburbs, and greenbelt, which is the outer edge of the metropolis. Regarding education, skilled workers, monthly household income, and access to basic facilities, the city is clearly ahead of its suburbs and the outer zone. For instance, while 15 percent of households in the core have a member with a graduate or a post-graduate degree, the level drops to 9 percent in the suburbs and 6 percent in the greenbelt. These differences also are apparent in a detailed report on public services for the poor in the peri-urban areas of Bangalore (Sekhar et al., 2005). The Association for Promoting Social Action and the Public Affairs Centre conducted a survey of four slums located in the peri-urban areas of Bangalore city in 2004 and found dissatisfaction to be very high regarding water supply from public taps, public toilets, under-ground drainage, and garbage removal.
There is another area of well-being in which the two metropolitan areas provide a stark contrast. In a 2009 survey conducted by the National Crime Records Bureau, Bangalore has been shown to be India’s suicide capital, with the largest numbers of suicides per year and on a per capita basis.14 Kolkata ranked last on that list (Rai, 2011). Quite clearly, becoming “new India” is not without its costs.
CONCLUSION
Twenty years after the launch of economic liberalization, urban areas in India, and in par-ticular large cities, are experiencing changes in the built environment due to significant policy changes. These include the easing of several restrictions to facilitate the supply of urban land, such as the repeal in 1999 of the Urban Land (Ceiling and Regulation) Act (1976); encourage-ment of the use of “new land management tools,” such as the transfer of land development rights and extra FAR (floor area ratio); permitting greater vertical height through an increase in the FAR; the use of larger plots of land for housing real estate, shopping malls and office projects; and the more rapid recycling of land under obsolete uses. Overall, there has been a decline in direct government intervention in the land market and much more emphasis on public-private partnerships or fully private projects.
However, at the same time, it is important to keep in mind that the pace of change has varied in different parts of the country, reflecting the varied responses of state governments to fiscal and other reforms promoted by the center. In the economically dynamic regions of the country, the pace of reform has been much faster than in regions that have lagged. In this regard, the fast-growing metropolitan area of Bangalore provides a contrast to the older and more slowly growing Kolkata Metropolitan Area, where West Bengal’s Left Front govern-ment continued its policy of place equalization both within the metropolitan area and in urban local bodies outside, raising both the total revenues and thus the expenditures of smaller cit-ies. The smaller quantities of private investment coming into West Bengal and its urban areas has meant continued dependence on state government transfers to meet even minimum levels of basic services. In Bangalore, a more concentrated expenditure on the core city has followed attempts to develop it as major global software and IT-enabled services hub. By absorbing several smaller and poorer suburbs within its boundaries in 2007, it is attempting to reduce inequalities across a larger area. We thus see two metropolitan cities that are employing quite different strategies.
Financially, the Left Front’s strategy of place equalization without commensurate growth of industry and private sources of revenue has resulted in a deeply indebted state government.
14Bangalore accounts for 16 percent of all suicides in India’s 35 biggest cities, with 2,167 suicides in 2009 and a suicide rate of 38 per 100,000 population (Rai, 2011; see also IT City, 2011).

60 EURASIAN GEOGRAPHY AND ECONOMICS
The new Chief Minister has repeatedly requested a bailout package from the center in order to implement new growth stimuli in the state’s economy. The Karnataka government, on the other hand, has done well fiscally but the stresses and strains of fast growth are telling on the population in other ways, such as a high suicide rate. The upside and downside of both the new, neoliberal, reforms-driven rapid growth model of Bangalore as well as the statist, slow-growth model of Kolkata caution against excessive advocacy of either path, and suggest the need for a balanced approach to urban growth.
REFERENCES
Bangalore Development Authority, “BDA—The Organization,” 2007 [http://www.bdabangalore.org/organization.htm], last accessed January 24, 2012.
“Brief Note on Urban Reforms Incentive Fund (URIF),” n.d. [http://mhupa.gov.in/programs/housing/urifII.htm], last accessed January 23, 2012.
Census of India, Series 23: West Bengal, District Census Handbook. Parts XIII, A & B, Town Directory, Primary Census Abstract: Calcutta District. New Delhi, India: Government of India, 1981.
Census of India, West Bengal. Kolkata District. Primary Census Abstract, 2001 [CD ROM].Census of India, “Provisional Population Tables,” 2011 [http://www.censusindia.gov.in/], last accessed
January 13, 2012.“Centre to Fund West Bengal Finances: Pranab Mukherjee,” Kolkata News, May 30, 2011 [http://
kolkata.localtiger.com/calcutta/Kolkata-news/], last accessed January 23, 2012.Chakravorty, Sanjoy, “Too Little, in the Wrong Places? Mega City Programme and Efficiency and
Equity in Indian Urbanization,” Economic and Political Weekly, 31, 35/37:2565–2567 and 2569–2572, 1996.
Chakravorty, Sanjoy, “Regional Development in India: Paradigms Lost in a Period of Great Change,” Eurasian Geography and Economics, 53, 1:21–43, 2012.
CMIE (Centre for Monitoring the Indian Economy), Capex Database, n.d. [http://capex.cmie.com], last accessed July 30, 2011.
Datta, Polly, “Devolution of Financial Power to Local Self-Governments: The ‘Feasibility Frontier’ in West Bengal,” South Asia Research, 27, 1:105–124, 2007.
Ghosh, Abantika, “Soon, a Community Participation Law,” The Times of India, February 26, 2008 [http://articles.timesofindia.indiatimes.com/2008-02-26/], last accessed January 23, 2012.
Government of India, Ministry of Environment and Forests, “Municipal Solid Wastes (Management and Handling) Rules,” The Gazette of India, September 25, 2000 [http://envfor.nic.in/legis/hsm/mswmhr.html], last accessed Janaury 23, 2012.
Government of India, Ministry of Housing and Urban Poverty Alleviation, National Urban Housing and Habitat Policy. New Delhi, India: Government of India, 2007a [http://mhupa.gov.in/ policies/duepa/HousingPolicy2007.pdf], last accessed January 25, 2012.
Government of India, Ministry of Urban Poverty Alleviation, JNNURM Directorate, “Proto-type Interactive Public Questions & Answers,” n.d. [http://mhupa.gov.in/PQAS/jnnurm.pdf], last accessed January 24, 2012.
Government of India, Ministry of Law and Justice, Legislative Department, “The Right to Infor-mation Act, 2005: No. 22 of 2005,” June 21, 2005a [http://righttoinformation.gov.in/rti-act.pdf], last accessed January 23, 2012.
Government of India, Ministry of Urban Development, National Urban Sanitation Policy. New Delhi, India: Government of India, 2008.
Government of India, Ministry of Urban Employment and Poverty Alleviation/Ministry of Urban Development, Jawaharlal Nehru National Urban Renewal Mission: Overview. New Delhi, India: Government of India, 2005b [http://jnnurm.nic.in/wp-context/upload/2011/01/UIGOverview.pdf], last accessed January 24, 2012.

ANNAPURNA SHAW 61
Government of India, Press Information Bureau, Poverty Estimates for 2004-5. New Delhi, India: Government of India, 2007b.
Government of Karnataka, Directorate of Economics and Statistics, Statistical Abstract of Karna-taka. Bangalore, India: Government of Karnataka, various years.
Government of West Bengal, Bureau of Applied Economics and Statistics, Municipal Statistics of West Bengal. Kolkata, India: Government of West Bengal, various years.
Government of West Bengal, Development and Planning Department, West Bengal Human Devel-opment Report, 2004. Kolkata, India: Government of West Bengal, 2004.
Government of West Bengal, Municipal Affairs Department, Administrative Report of Municipal Affairs Department 2001–2005. Kolkata, India: Government of West Bengal, 2005.
Heitzman, James, Network City: Planning the Information Society in Bangalore. New Delhi, India: Oxford University Press.
“IT City Retains Suicide Capital Tag,” The Hindu, October 29, 2011 [http://www.thehindu.com/news/cities/Bangalore/article2579335.ece], last accessed January 17, 2012.
Kolkata Metropolitan Development Authority, Socio-economic Profile of Households in Calcutta Metropolitan Area: 1996–97. Kolkata, India: Kolkata Metropolitan Development Authority, 1997.
Kumar, Krishna, S., Greater Bangalore Governance Options. Bangalore, India: Public Affairs Centre, 2007.
“National Urban transport Policy,” n.d. [http://urbanindia.nic.in/policies/TransportPolicy.pdf], last accessed January 24, 2012.
Nijman, Jan, “India’s Urban Challenge,” Eurasian Geography and Economics, 53, 1:7–20, 2012. Prasad, R. N., C. Lalkima, Srinibas Pathi, Lalrintluanga, Lalneihzovi, and M. Lakshmi, eds., New
Public Management in India: Problems and Perspectives. Delhi: Shipra Publications, 2008.“Public Disclosure Law: State Level Reform,” n.d. [http://www.indiaurbanportal.in/reforms/state/
PublicDisclosureLaw.pdf], last accessed January 25, 2012.Rai, Saritha, “The Dark Side of Bangalore Shining: It’s No. 1 in Suicides in Country,” Financial
Express, October 17, 2011 [http://www.financialexpress.com/news/the-dark-side-of-bangalore-shining-its-no.1-in-suicides-in-country/860804/3#], last accessed January 17, 2012.
Rondinelli, D. A., “Asian Urban Development Policies in the 1990s: From Growth Control to Urban Diffusion,” World Development, 19, 7:791–803, 1991.
Shaw, Annapurna, “Urban Policy in Post-independent India: An Appraisal,” Economic and Political Weekly, 31, 4:224–228, 1996.
Shaw, Annapurna, “High Tech Development in the Kolkata Metropolitan Area: Locational Dynamics and Impacts,” in Sheila Prasad, A. C. M. Van Westen, and C. Ramachandraiah, eds., Dynamics of High-Tech Urban Spaces: Asian European Perspectives. New Delhi, India: Manohar Publications, 2008, 367–393.
Shaw, Annapurna, Indian Cities. New Delhi, India: Oxford University Press, Oxford Short Book Series, 2012a (forthcoming).
Shaw, Annapurna, “Metropolitan Governance and Inequality in India,” in Jefferey Sellers, ed., Inter-national Metropolitan Governance, 2012b (forthcoming),
Shaw, Annapurna and M. K. Satish, “Metropolitan Restructuring in Post-liberalised India: Separat-ing the Global and the Local.,” Cities: The Journal of Urban Policy and Planning, 24, 2:148–163, 2007.
Sehkar, Sita, Meena Nair, and Venugopal Reddy, Are They Being Served? Citizen Report Card on Public Services for the Poor in Peri-urban Areas of Bangalore. Bangalore, India: Association for Promoting Social Action and Public Affairs Centre, 2005.
Sivaramakrishnan, K., Re-visioning Indian Cities: The Urban Renewal Mission. New Delhi, India: Sage Publications, 2011.
Sobhana, K.,“City at Bottom of Office Heap,” The Telegraph (Kolkata), October 12, 2011, 6. “The Constitution Amendment Acts, Including Statement of Objects and Reasons (SOR),” n.d. [http://
indicode.nic.in/coiweb/coifiles/amendment.htm], last accessed January 23, 2012.

62 EURASIAN GEOGRAPHY AND ECONOMICS
“The Urban Land (Ceiling and Regulation) Repeal Act, 1999,” last updated February 2008 [http://www .helplinelaw.com/docs/], last accessed January 23, 2012.
World Bank, State Fiscal Reforms in India: Progress and Prospects. New Delhi, India: Macmillan India, 2005.
World Bank, Doing Business in India 2009. Washington, DC: The World Bank, 2009.