draft version4.1 - metropolitan transportation commission
TRANSCRIPT
Released: February 2016 ○
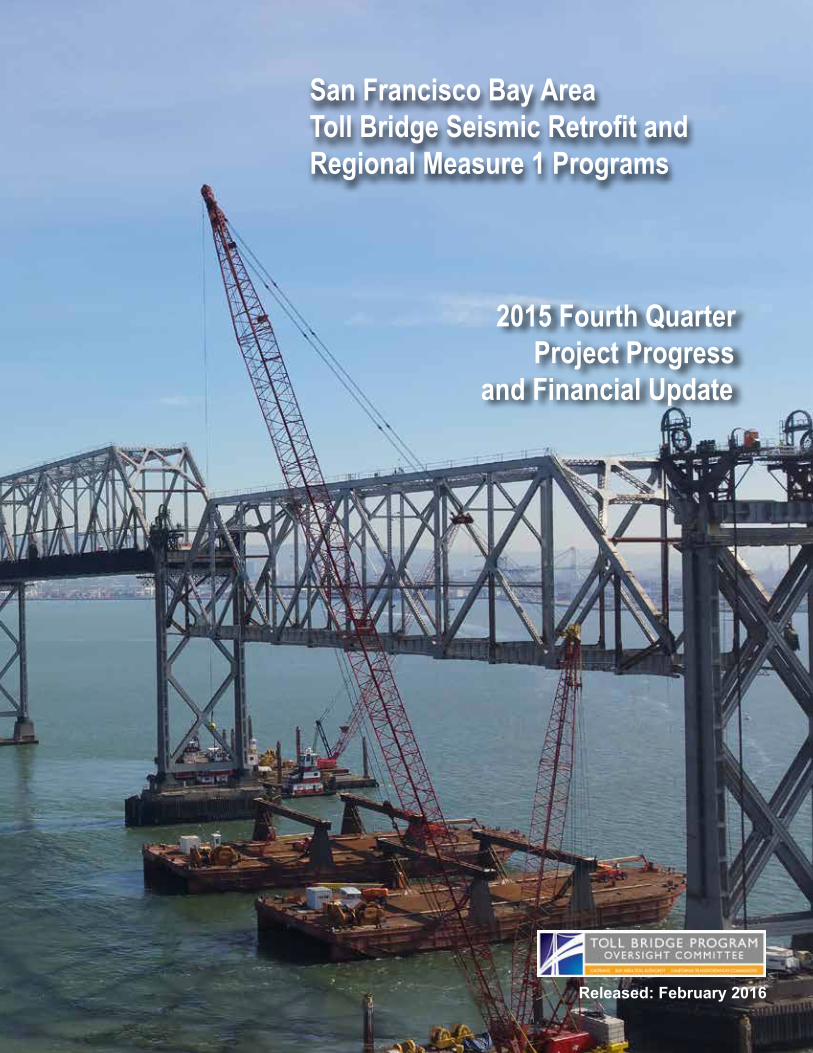
2015 Fourth QuarterProject Progress
and Financial Update
DRAFT VERSION4.1
San Francisco Bay AreaToll Bridge Seismic Retrofit andRegional Measure 1 Programs
San Francisco Bay AreaToll Bridge Seismic Retrofit andRegional Measure 1 Programs
2015 Fourth QuarterProject Progress
and Financial Update
Released: February 2016


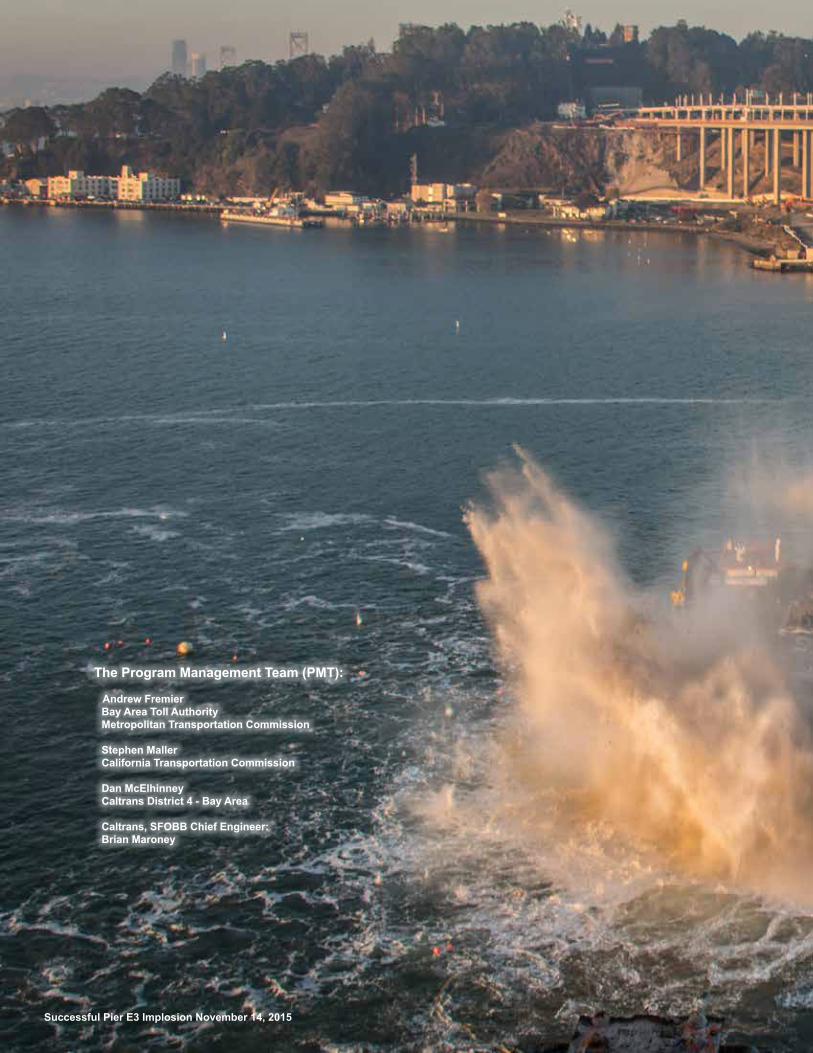
Successful Pier E3 Implosion November 14, 2015
The Program Management Team (PMT):
Andrew FremierBay Area Toll AuthorityMetropolitan Transportation Commission
Stephen MallerCalifornia Transportation Commission
Dan McElhinneyCaltrans District 4 - Bay Area
Caltrans, SFOBB Chief Engineer: Brian Maroney
Table of Contents
Introduction 1Toll Bridge Seismic Retrofit Program Cost Summary 2Toll Bridge Seismic Retrofit Program Schedule Summary 3San Francisco-Oakland Bay Bridge Seismic Retrofit Strategy 4
Yerba Buena Island Transition Structures #2 5504’/288’ Structures Dismantling 6Marine Foundations 7Self-Anchored Suspension Bridge Superstructure 8
TBSRP Risk Management Program Update 9Program Funding Status 12Quarterly Environmental Compliance Highlights 14Appendices 15
x
Toll Bridge Program Oversight Committee
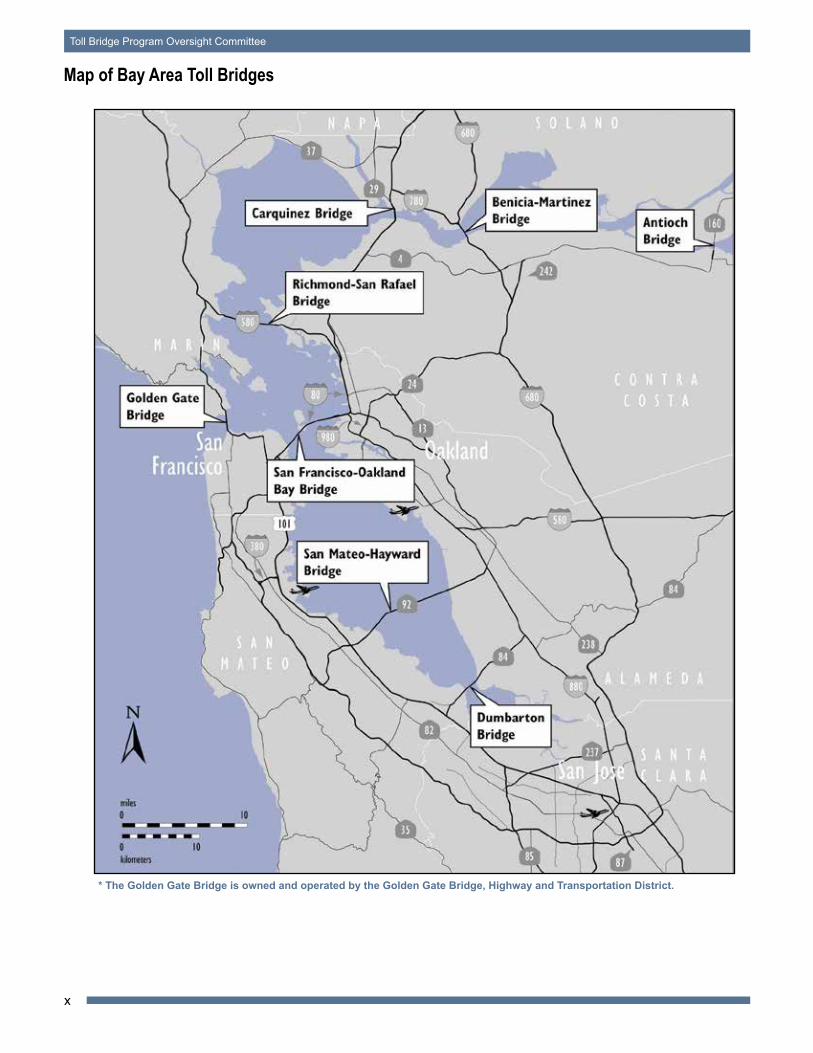
Map of Bay Area Toll Bridges
* The Golden Gate Bridge is owned and operated by the Golden Gate Bridge, Highway and Transportation District.
1
2015 Fourth Quarter Project Progress and Financial Update
Introduction
Introduction
Introduction
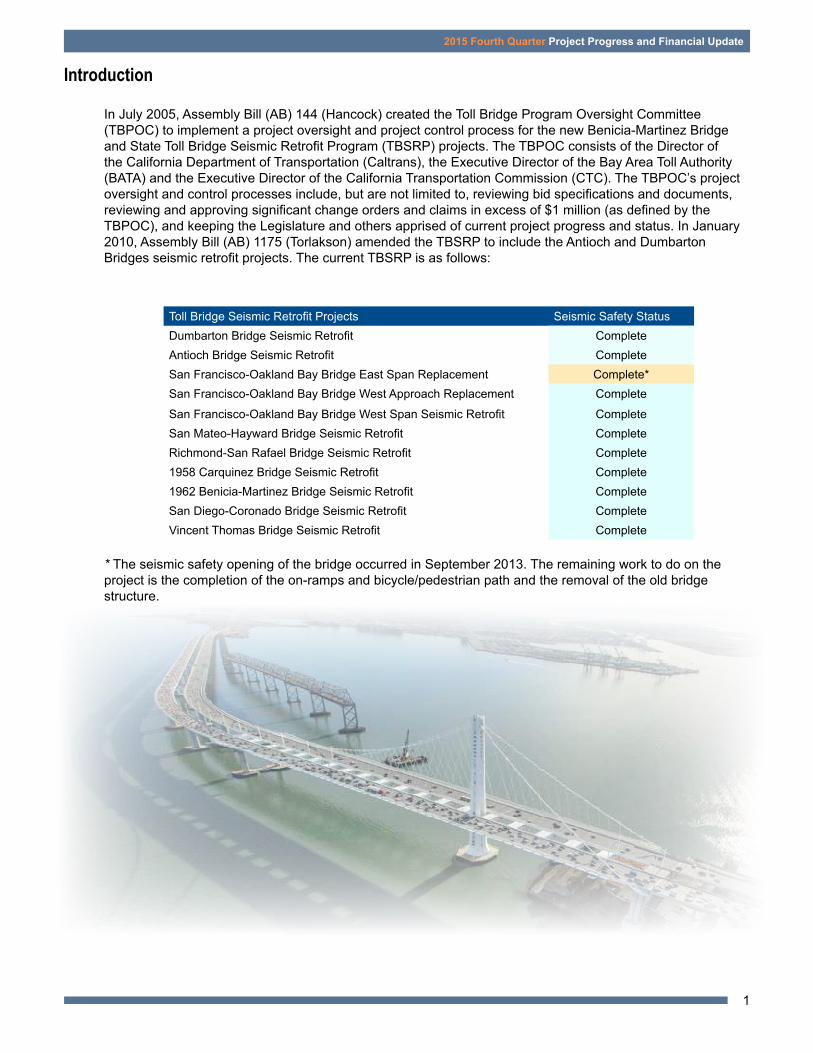
Toll Bridge Seismic Retrofit Projects Seismic Safety StatusDumbarton Bridge Seismic Retrofit CompleteAntioch Bridge Seismic Retrofit CompleteSan Francisco-Oakland Bay Bridge East Span Replacement Complete*San Francisco-Oakland Bay Bridge West Approach Replacement CompleteSan Francisco-Oakland Bay Bridge West Span Seismic Retrofit CompleteSan Mateo-Hayward Bridge Seismic Retrofit CompleteRichmond-San Rafael Bridge Seismic Retrofit Complete1958 Carquinez Bridge Seismic Retrofit Complete1962 Benicia-Martinez Bridge Seismic Retrofit CompleteSan Diego-Coronado Bridge Seismic Retrofit CompleteVincent Thomas Bridge Seismic Retrofit Complete
In July 2005, Assembly Bill (AB) 144 (Hancock) created the Toll Bridge Program Oversight Committee (TBPOC) to implement a project oversight and project control process for the new Benicia-Martinez Bridge and State Toll Bridge Seismic Retrofit Program (TBSRP) projects. The TBPOC consists of the Director of the California Department of Transportation (Caltrans), the Executive Director of the Bay Area Toll Authority (BATA) and the Executive Director of the California Transportation Commission (CTC). The TBPOC’s project oversight and control processes include, but are not limited to, reviewing bid specifications and documents, reviewing and approving significant change orders and claims in excess of $1 million (as defined by the TBPOC), and keeping the Legislature and others apprised of current project progress and status. In January 2010, Assembly Bill (AB) 1175 (Torlakson) amended the TBSRP to include the Antioch and Dumbarton Bridges seismic retrofit projects. The current TBSRP is as follows:
* The seismic safety opening of the bridge occurred in September 2013. The remaining work to do on the project is the completion of the on-ramps and bicycle/pedestrian path and the removal of the old bridge structure.
2
Toll Bridge Program Oversight Committee
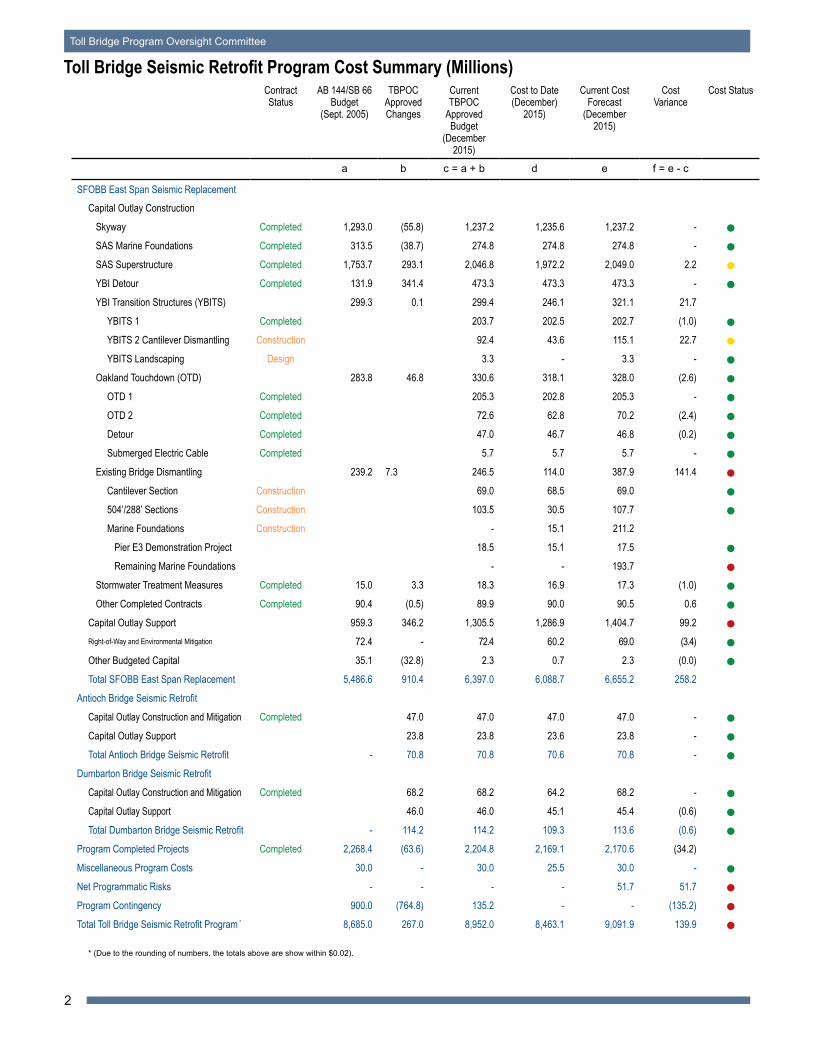
Toll Bridge Seismic Retrofit Program Cost Summary
Toll Bridge Seismic Retrofit Program Cost Summary (Millions)Contract Status
AB 144/SB 66 Budget
(Sept. 2005)
TBPOCApproved Changes
Current TBPOC
Approved Budget
(December 2015)
Cost to Date (December)
2015)
Current Cost Forecast
(December 2015)
Cost Variance
Cost Status
a b c = a + b d e f = e - c
SFOBB East Span Seismic ReplacementCapital Outlay Construction
Skyway Completed 1,293.0 (55.8) 1,237.2 1,235.6 1,237.2 - ●SAS Marine Foundations Completed 313.5 (38.7) 274.8 274.8 274.8 - ●SAS Superstructure Completed 1,753.7 293.1 2,046.8 1,972.2 2,049.0 2.2 ●YBI Detour Completed 131.9 341.4 473.3 473.3 473.3 - ●YBI Transition Structures (YBITS) 299.3 0.1 299.4 246.1 321.1 21.7
YBITS 1 Completed 203.7 202.5 202.7 (1.0) ●YBITS 2 Cantilever Dismantling Construction 92.4 43.6 115.1 22.7 ●YBITS Landscaping Design 3.3 - 3.3 - ●
Oakland Touchdown (OTD) 283.8 46.8 330.6 318.1 328.0 (2.6) ●OTD 1 Completed 205.3 202.8 205.3 - ●OTD 2 Completed 72.6 62.8 70.2 (2.4) ●Detour Completed 47.0 46.7 46.8 (0.2) ●Submerged Electric Cable Completed 5.7 5.7 5.7 - ●
Existing Bridge Dismantling 239.2 7.3 246.5 114.0 387.9 141.4 ●Cantilever Section Construction 69.0 68.5 69.0 ●504’/288’ Sections Construction 103.5 30.5 107.7 ●Marine Foundations Construction - 15.1 211.2
Pier E3 Demonstration Project 18.5 15.1 17.5 ● Remaining Marine Foundations - - 193.7 ●
Stormwater Treatment Measures Completed 15.0 3.3 18.3 16.9 17.3 (1.0) ●Other Completed Contracts Completed 90.4 (0.5) 89.9 90.0 90.5 0.6 ●
Capital Outlay Support 959.3 346.2 1,305.5 1,286.9 1,404.7 99.2 ●Right-of-Way and Environmental Mitigation 72.4 - 72.4 60.2 69.0 (3.4) ●Other Budgeted Capital 35.1 (32.8) 2.3 0.7 2.3 (0.0) ●Total SFOBB East Span Replacement 5,486.6 910.4 6,397.0 6,088.7 6,655.2 258.2
Antioch Bridge Seismic Retrofit
Capital Outlay Construction and Mitigation Completed 47.0 47.0 47.0 47.0 - ●Capital Outlay Support 23.8 23.8 23.6 23.8 - ●Total Antioch Bridge Seismic Retrofit - 70.8 70.8 70.6 70.8 - ●
Dumbarton Bridge Seismic Retrofit
Capital Outlay Construction and Mitigation Completed 68.2 68.2 64.2 68.2 - ●Capital Outlay Support 46.0 46.0 45.1 45.4 (0.6) ●Total Dumbarton Bridge Seismic Retrofit - 114.2 114.2 109.3 113.6 (0.6) ●
Program Completed Projects Completed 2,268.4 (63.6) 2,204.8 2,169.1 2,170.6 (34.2)
Miscellaneous Program Costs 30.0 - 30.0 25.5 30.0 - ●Net Programmatic Risks - - - - 51.7 51.7 ●Program Contingency 900.0 (764.8) 135.2 - - (135.2) ●Total Toll Bridge Seismic Retrofit Program * 8,685.0 267.0 8,952.0 8,463.1 9,091.9 139.9 ●
* (Due to the rounding of numbers, the totals above are show within $0.02).
3
2015 Fourth Quarter Project Progress and Financial Update
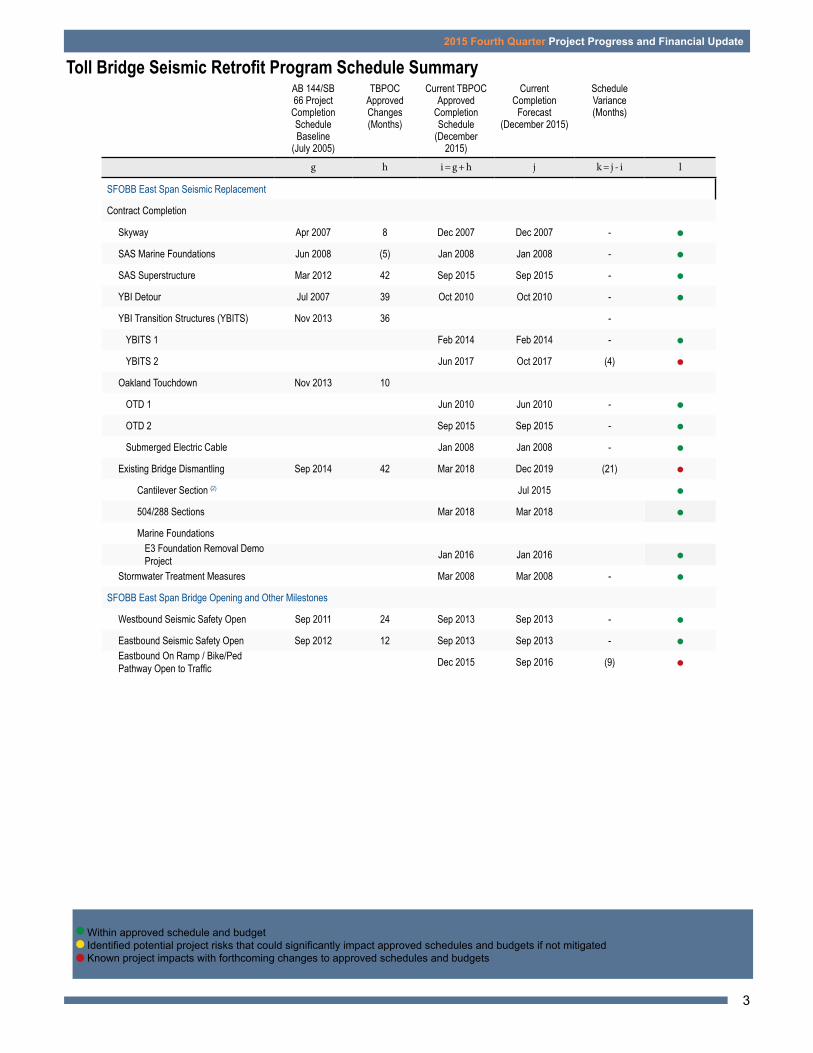
Toll Bridge Seismic Retrofit Program Schedule Summary
Toll Bridge Seismic Retrofit Program Schedule Summary
AB 144/SB 66 Project
Completion Schedule Baseline
(July 2005)
TBPOC Approved Changes (Months)
Current TBPOC Approved
Completion Schedule
(December 2015)
Current Completion
Forecast(December 2015)
Schedule Variance (Months)
g h i = g + h j k = j - i l
SFOBB East Span Seismic Replacement
Contract Completion
Skyway Apr 2007 8 Dec 2007 Dec 2007 - ●SAS Marine Foundations Jun 2008 (5) Jan 2008 Jan 2008 - ●SAS Superstructure Mar 2012 42 Sep 2015 Sep 2015 - ●YBI Detour Jul 2007 39 Oct 2010 Oct 2010 - ●YBI Transition Structures (YBITS) Nov 2013 36 -
YBITS 1 Feb 2014 Feb 2014 - ●YBITS 2 Jun 2017 Oct 2017 (4) ●
Oakland Touchdown Nov 2013 10
OTD 1 Jun 2010 Jun 2010 - ●OTD 2 Sep 2015 Sep 2015 - ●Submerged Electric Cable Jan 2008 Jan 2008 - ●
Existing Bridge Dismantling Sep 2014 42 Mar 2018 Dec 2019 (21) ●Cantilever Section (2) Jul 2015 ●504/288 Sections Mar 2018 Mar 2018 ●Marine Foundations
E3 Foundation Removal Demo Project Jan 2016 Jan 2016 ●
Stormwater Treatment Measures Mar 2008 Mar 2008 - ●SFOBB East Span Bridge Opening and Other Milestones
Westbound Seismic Safety Open Sep 2011 24 Sep 2013 Sep 2013 - ●Eastbound Seismic Safety Open Sep 2012 12 Sep 2013 Sep 2013 - ●Eastbound On Ramp / Bike/Ped Pathway Open to Traffic Dec 2015 Sep 2016 (9) ●
Within approved schedule and budgetIdentified potential project risks that could significantly impact approved schedules and budgets if not mitigatedKnown project impacts with forthcoming changes to approved schedules and budgets
West Approach West Span4
Toll Bridge Program Oversight CommitteeToll Bridge Program Oversight Committee
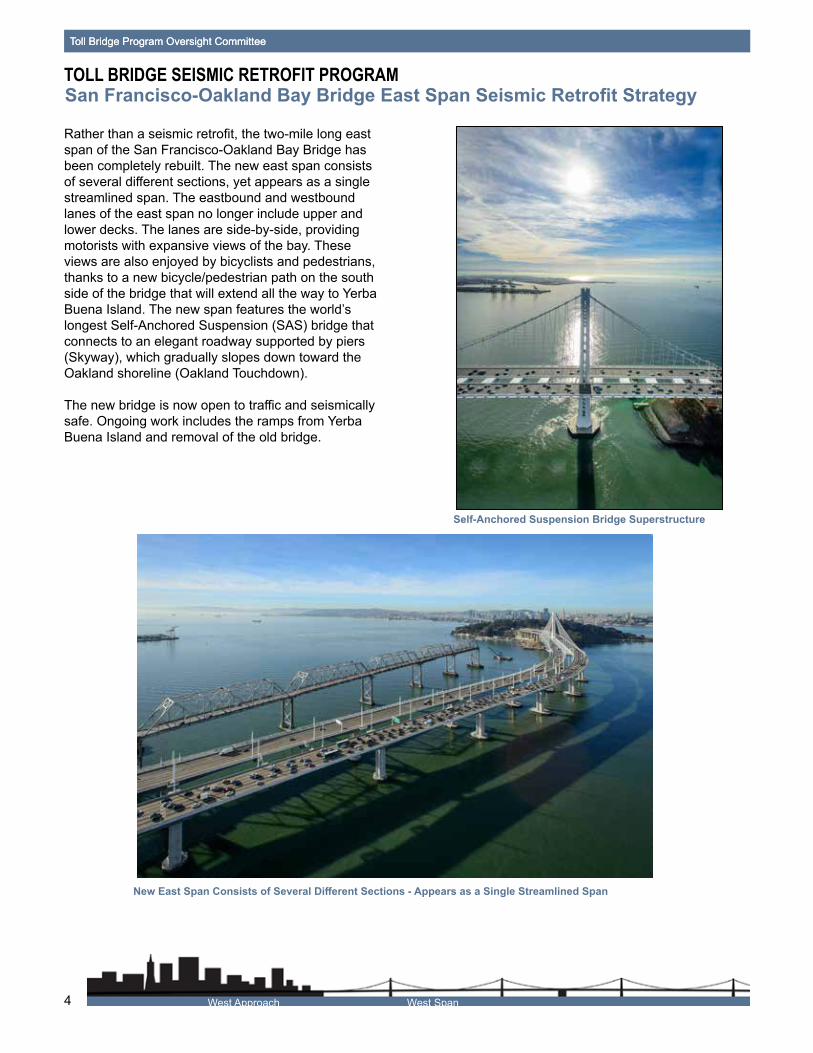
TOLL BRIDGE SEISMIC RETROFIT PROGRAMSan Francisco-Oakland Bay Bridge East Span Seismic Retrofit Strategy
San Francisco-Oakland Bay Bridge Seismic Retrofit Strategy
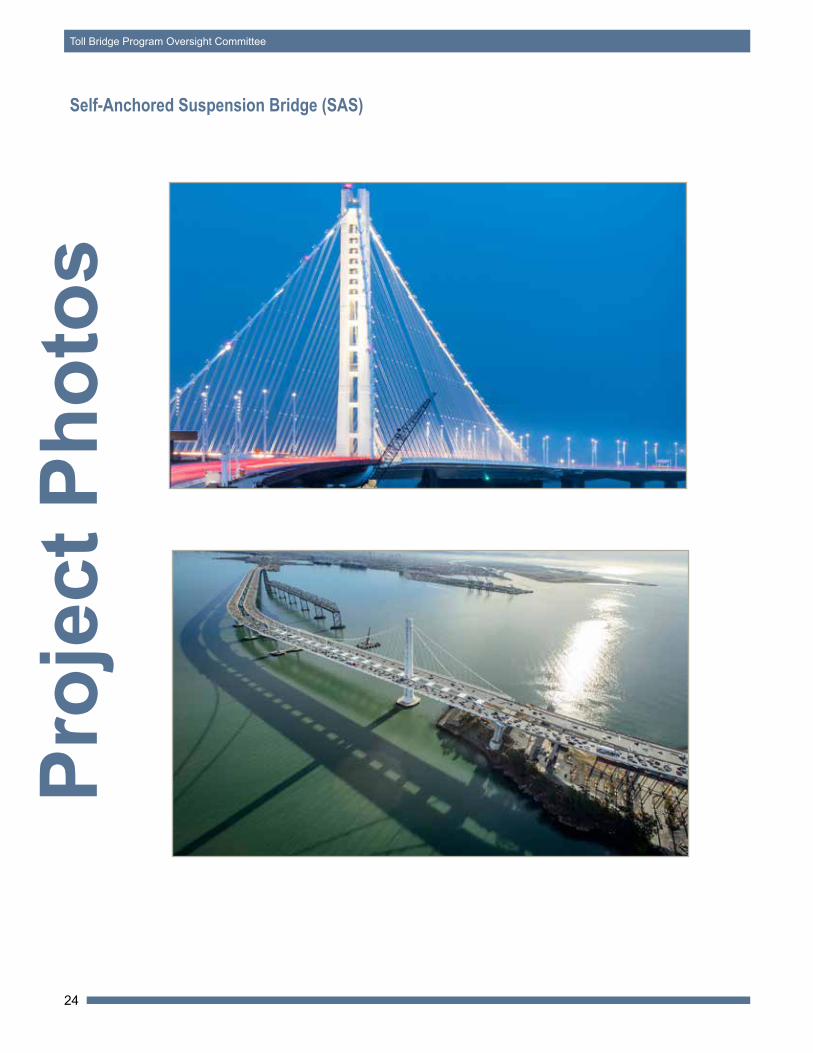
Rather than a seismic retrofit, the two-mile long east span of the San Francisco-Oakland Bay Bridge has been completely rebuilt. The new east span consists of several different sections, yet appears as a single streamlined span. The eastbound and westbound lanes of the east span no longer include upper and lower decks. The lanes are side-by-side, providing motorists with expansive views of the bay. These views are also enjoyed by bicyclists and pedestrians, thanks to a new bicycle/pedestrian path on the south side of the bridge that will extend all the way to Yerba Buena Island. The new span features the world’s longest Self-Anchored Suspension (SAS) bridge that connects to an elegant roadway supported by piers (Skyway), which gradually slopes down toward the Oakland shoreline (Oakland Touchdown).
The new bridge is now open to traffic and seismically safe. Ongoing work includes the ramps from Yerba Buena Island and removal of the old bridge.
New East Span Consists of Several Different Sections - Appears as a Single Streamlined Span
Self-Anchored Suspension Bridge Superstructure
Yerba Buena Island Transition SAS Skyway Oakland Touchdown 5
2015 Fourth Quarter Project Progress and Financial Update
East Span Seismic Replacement Project
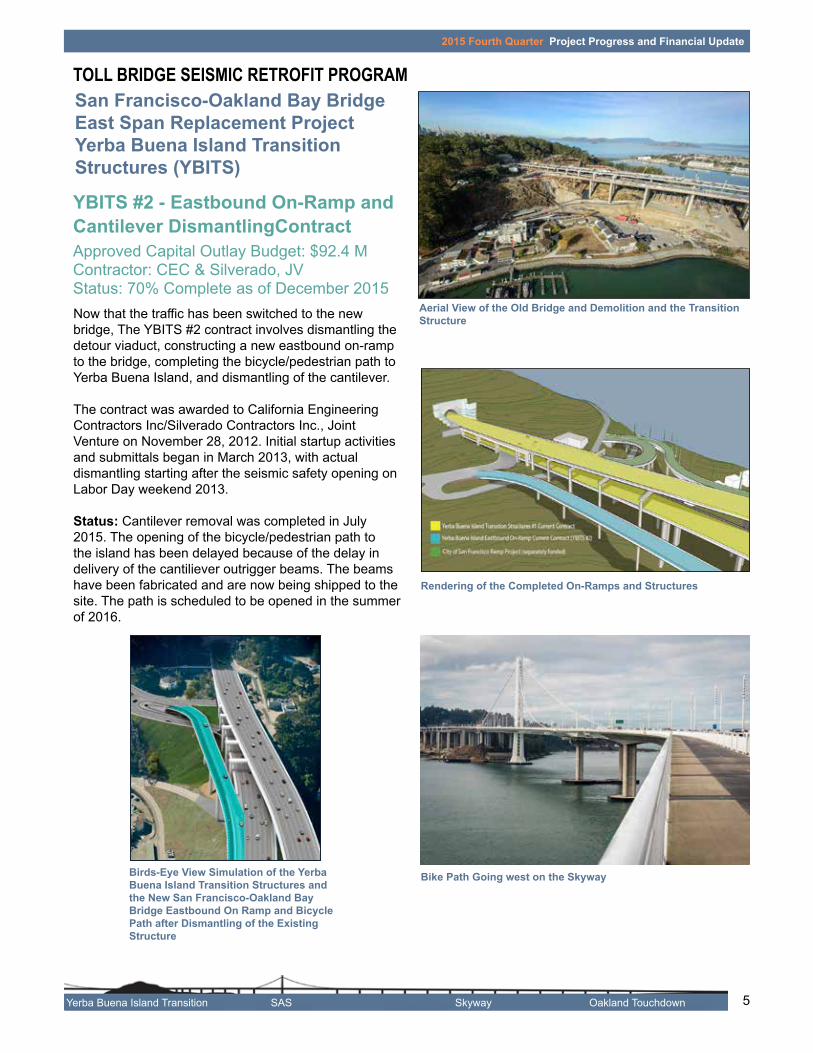
YBITS #2 - Eastbound On-Ramp and Cantilever DismantlingContractApproved Capital Outlay Budget: $92.4 MContractor: CEC & Silverado, JVStatus: 70% Complete as of December 2015
TOLL BRIDGE SEISMIC RETROFIT PROGRAMSan Francisco-Oakland Bay Bridge East Span Replacement ProjectYerba Buena Island Transition Structures (YBITS)
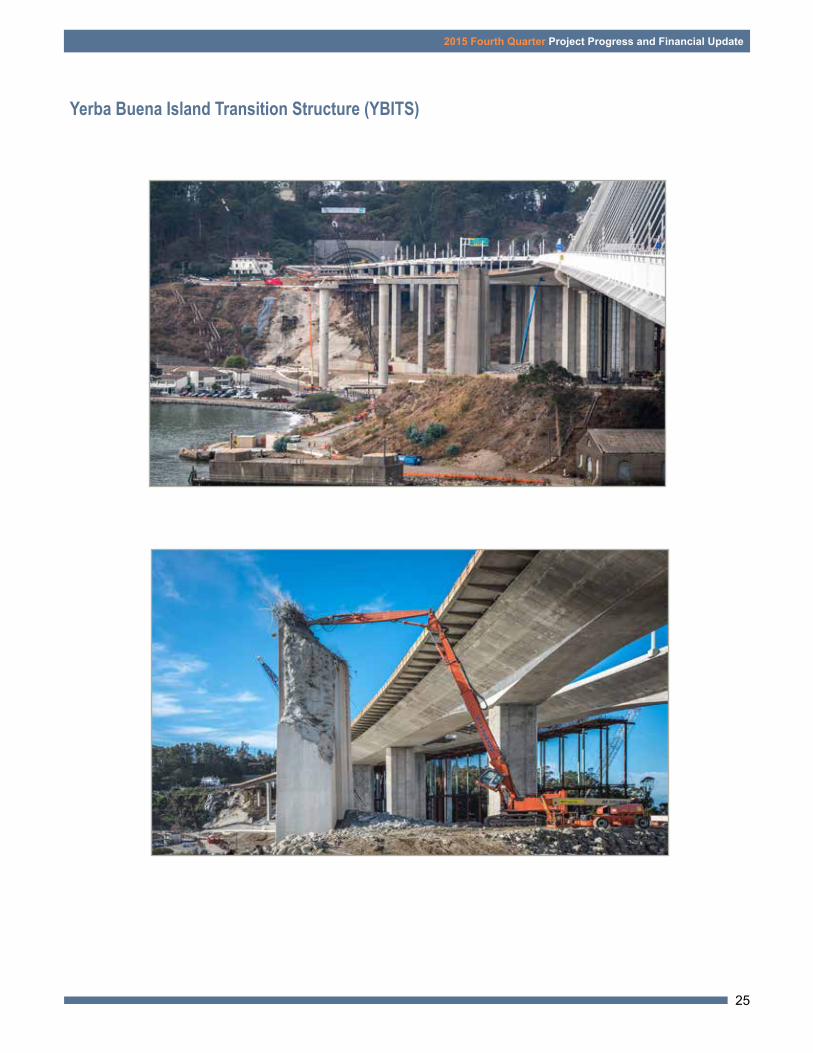
Now that the traffic has been switched to the new bridge, The YBITS #2 contract involves dismantling the detour viaduct, constructing a new eastbound on-ramp to the bridge, completing the bicycle/pedestrian path to Yerba Buena Island, and dismantling of the cantilever.
The contract was awarded to California Engineering Contractors Inc/Silverado Contractors Inc., Joint Venture on November 28, 2012. Initial startup activities and submittals began in March 2013, with actual dismantling starting after the seismic safety opening on Labor Day weekend 2013.
Status: Cantilever removal was completed in July2015. The opening of the bicycle/pedestrian path to the island has been delayed because of the delay in delivery of the cantiliever outrigger beams. The beams have been fabricated and are now being shipped to the site. The path is scheduled to be opened in the summer of 2016.
Aerial View of the Old Bridge and Demolition and the Transition Structure
Birds-Eye View Simulation of the Yerba Buena Island Transition Structures and the New San Francisco-Oakland Bay Bridge Eastbound On Ramp and Bicycle Path after Dismantling of the Existing Structure
Bike Path Going west on the Skyway
Rendering of the Completed On-Ramps and Structures
West Approach West Span6
Toll Bridge Program Oversight Committee
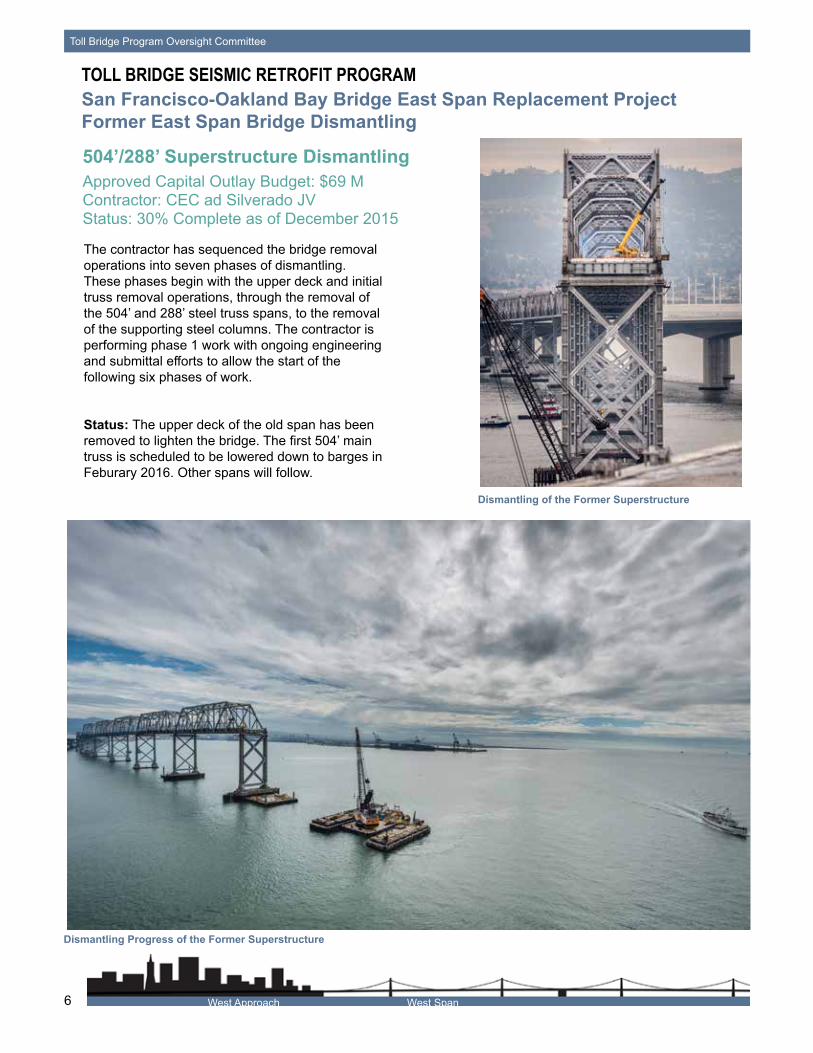
The contractor has sequenced the bridge removal operations into seven phases of dismantling. These phases begin with the upper deck and initial truss removal operations, through the removal of the 504’ and 288’ steel truss spans, to the removal of the supporting steel columns. The contractor is performing phase 1 work with ongoing engineering and submittal efforts to allow the start of the following six phases of work.
Status: The upper deck of the old span has been removed to lighten the bridge. The first 504’ main truss is scheduled to be lowered down to barges in Feburary 2016. Other spans will follow.
TOLL BRIDGE SEISMIC RETROFIT PROGRAMSan Francisco-Oakland Bay Bridge East Span Replacement ProjectFormer East Span Bridge Dismantling
504’/288’ Superstructure DismantlingApproved Capital Outlay Budget: $69 MContractor: CEC ad Silverado JVStatus: 30% Complete as of December 2015
Dismantling of the Former Superstructure
Dismantling Progress of the Former Superstructure
Yerba Buena Island Transition SAS Skyway Oakland Touchdown 7
2015 Fourth Quarter Project Progress and Financial Update
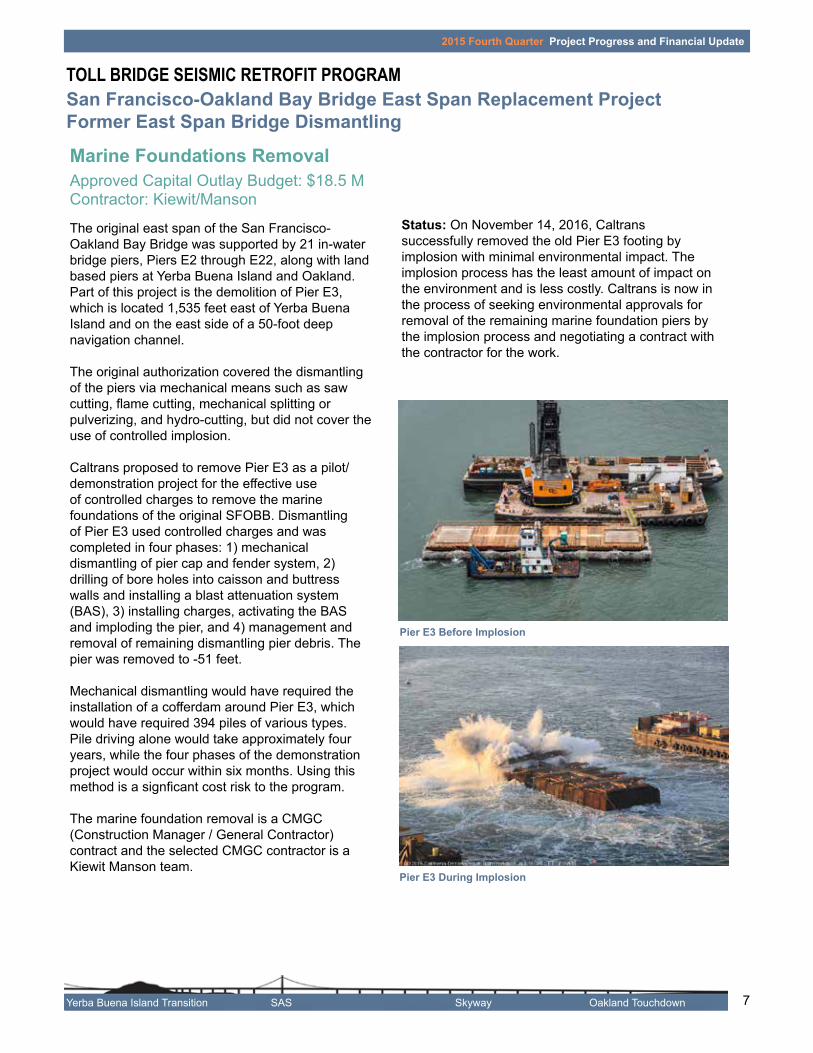
The original east span of the San Francisco-Oakland Bay Bridge was supported by 21 in-water bridge piers, Piers E2 through E22, along with land based piers at Yerba Buena Island and Oakland. Part of this project is the demolition of Pier E3, which is located 1,535 feet east of Yerba Buena Island and on the east side of a 50-foot deep navigation channel.
The original authorization covered the dismantling of the piers via mechanical means such as saw cutting, flame cutting, mechanical splitting or pulverizing, and hydro-cutting, but did not cover the use of controlled implosion.
Caltrans proposed to remove Pier E3 as a pilot/demonstration project for the effective use of controlled charges to remove the marine foundations of the original SFOBB. Dismantling of Pier E3 used controlled charges and was completed in four phases: 1) mechanical dismantling of pier cap and fender system, 2) drilling of bore holes into caisson and buttress walls and installing a blast attenuation system (BAS), 3) installing charges, activating the BAS and imploding the pier, and 4) management and removal of remaining dismantling pier debris. The pier was removed to -51 feet.
Mechanical dismantling would have required the installation of a cofferdam around Pier E3, which would have required 394 piles of various types. Pile driving alone would take approximately four years, while the four phases of the demonstration project would occur within six months. Using this method is a signficant cost risk to the program.
The marine foundation removal is a CMGC (Construction Manager / General Contractor)contract and the selected CMGC contractor is a Kiewit Manson team.
TOLL BRIDGE SEISMIC RETROFIT PROGRAMSan Francisco-Oakland Bay Bridge East Span Replacement ProjectFormer East Span Bridge Dismantling
Status: On November 14, 2016, Caltrans successfully removed the old Pier E3 footing by implosion with minimal environmental impact. The implosion process has the least amount of impact on the environment and is less costly. Caltrans is now in the process of seeking environmental approvals for removal of the remaining marine foundation piers by the implosion process and negotiating a contract with the contractor for the work.
Marine Foundations RemovalApproved Capital Outlay Budget: $18.5 MContractor: Kiewit/Manson
Dismantling of the Former Superstructure
Pier E3 Before Implosion
Pier E3 During Implosion
8
Toll Bridge Program Oversight Committee
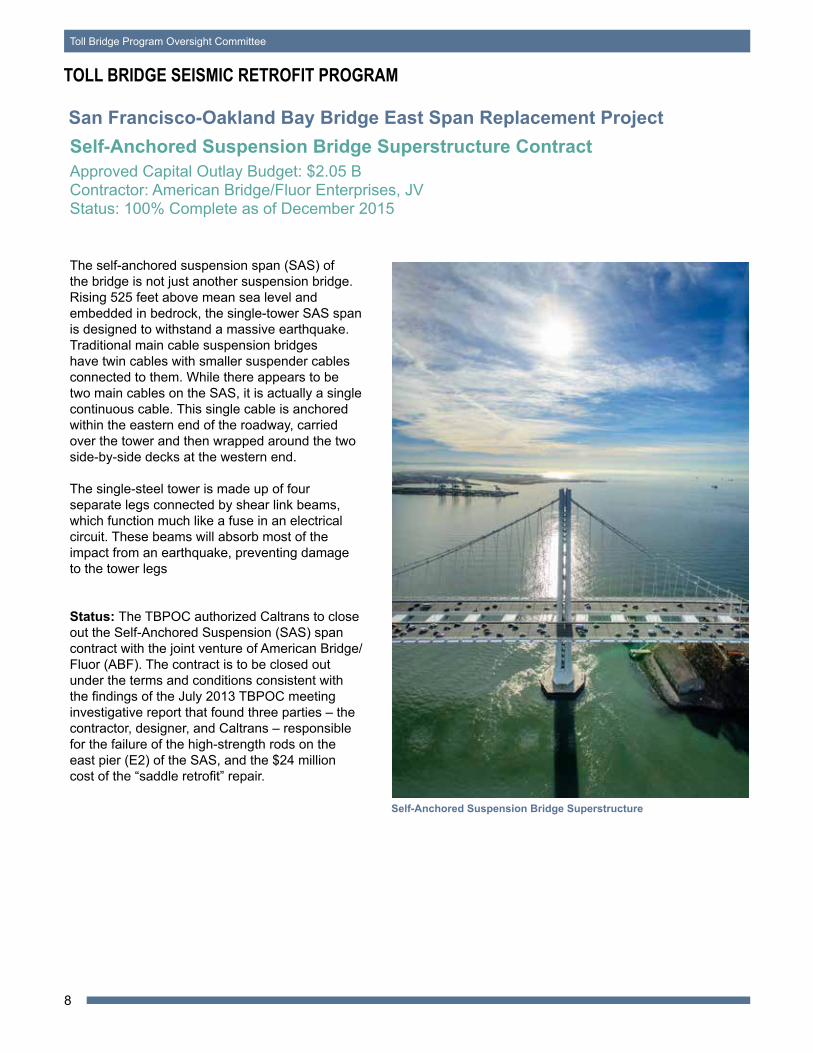
Self-Anchored Suspension Bridge Superstructure ContractApproved Capital Outlay Budget: $2.05 BContractor: American Bridge/Fluor Enterprises, JVStatus: 100% Complete as of December 2015
TOLL BRIDGE SEISMIC RETROFIT PROGRAM
San Francisco-Oakland Bay Bridge East Span Replacement Project
The self-anchored suspension span (SAS) of the bridge is not just another suspension bridge. Rising 525 feet above mean sea level and embedded in bedrock, the single-tower SAS span is designed to withstand a massive earthquake. Traditional main cable suspension bridges have twin cables with smaller suspender cables connected to them. While there appears to be two main cables on the SAS, it is actually a single continuous cable. This single cable is anchored within the eastern end of the roadway, carried over the tower and then wrapped around the two side-by-side decks at the western end.
The single-steel tower is made up of four separate legs connected by shear link beams, which function much like a fuse in an electrical circuit. These beams will absorb most of the impact from an earthquake, preventing damage to the tower legs
Status: The TBPOC authorized Caltrans to close out the Self-Anchored Suspension (SAS) span contract with the joint venture of American Bridge/Fluor (ABF). The contract is to be closed out under the terms and conditions consistent with the findings of the July 2013 TBPOC meeting investigative report that found three parties – the contractor, designer, and Caltrans – responsible for the failure of the high-strength rods on the east pier (E2) of the SAS, and the $24 million cost of the “saddle retrofit” repair.
Self-Anchored Suspension Bridge Superstructure
9
TOLL BRIDGE SEISMIC RETROFIT PROGRAMRisk Management Program Update Potential Draw On Program Reserve (Program Contingency)The program contingency is currently $135.2 million in Caltrans continues to implement comprehensive risk management on all TBSRP projects in accordance with AB 144 cost. Risk response efforts continue to focus on mitigating the estimated cost and schedule impacts of identified risks. The “bottom line” of cost risk analysis is whether the program contingency remains adequate to cover all identified risks.
Each contract has a contingency allowance within its budget. The sum of these contingency allowances is compared to the total of capital outlay (CO), capital outlay support(COS)and program-wide risks. Any excess of the risks over the contingency allowances represents a potential draw on the program contingency. The program contingency is currently $135.2 million in accordance with the TBPOC approved budget. As of the end of the fourth quarter of 2015, the 50 percent probable draw on program contingency is $275.1 million. The potential draw ranges from about $170 million to $370 million (see Figure 1 on the following page).
The program contingency is currently insufficient to cover the cost of identified risks and it is likely that a portion of the $483 million that was transferred early out of the program since 2010 will may need to be reinstated to help pay for the remainder of the work, possibly up to $235 million ($370 million-$135 million). RISK MANAGEMENT DEVELOPMENTS
Self-Anchored Suspension Span ContractContract Close Out: The SAS contract was accepted on September 24, 2015. The estimate after acceptance included several deductions as credit for issues that Caltrans determined were the responsibility of the contractor. The proposed final estimate was run October 29, 2015. The contractor submitted his exceptions to the proposed final estimate on November 6, 2015. The contractor documented 12 outstanding disputes totaling $49.2 million in claims. The project team will work with the contractor, the Toll Bridge Oversight Committee (TBPOC) and the California Transportation Commission (CTC) to expedite the claims process in an attempt to reach an agreement. This effort could take several quarters to completely address and may need to be resolved in arbitration.
Investigation of Anchor Rods at the Tower Base: The investigation of the tower base anchor rods continues. Caltrans carried out a detailed testing program on the tower anchor rods to help quantify the extent of the
problem with the bolts grouting. The program resulted in several recommendations to address the tower anchor rods issue. A director’s order for funds toto build a mock-up to verify the best means and methods to repair the faulty grouting of the tower anchor rods is in place and work is ongoing. The tower anchor rods were primarily required for the stability of the bridge during the construction phase. The project team is performing seismic analysis of as-built conditions of the bridge to determine if the anchor rods are even required to meet the design capacity of the bridge, this information can be used to help determine the ultimate repair strategy for the anchor rods. Based on the results of the mock-up and seismic analysis, a scope of work can then be developed to implement the repair. Additional micro-indication testing and sample thread measurement of anchor rods will also be conducted. The cost of the testing is a Capital Outlay Support (COS) effort and that cost is captured in the COS budget and risk register. However, there will be capital costs for a new construction contract to address this issue,. The scope of work is still undefined, but the risk register carries a range of $4.0 million to $28 million for this work and the risk is captured under the program-level risk register as the work will need to be performed on a different contract.
Oakland Touchdown #2 ContractContract Close Out: The project team worked to close out all unresolved extra work billing issues prior to issuing the proposed final estimate. All residual billings can be covered in the remaining funds in the Contract Change Order (CCO) log, and as a result, the final contract close-out risk was retired.
Yerba Buena Island Transition Structure #2 ContractCoast Guard Considerations: The license agreement with the Coast Guard will expire before the completion of construction activities on Yerba Buena Island (YBI). The Coast Guard was reluctant to extend the license as it has plans to relocate mission-critical activities from Coast Guard Island in Oakland to YBI, and has requested that Caltrans complete all work that affects Coast Guard property or activities by the summer of 2016. Caltrans worked with the Coast Guard and the contractor to arrive at an agreeable solution. Re-sequencing construction activities has been under consideration for the last several quarters and the TBPOC approved CCO #111 – Re-sequencing of Coast Guard Work – for an additional $5 million at its December 7, 2015 meeting. The risk register continues to carry this risk ($4 million -$9 million) until the risk is transferred to the CCO log in the first quarter of 2016.Coordination with On-Ramps Project: The team continues to cooperate and coordinate with the adjacent project. This contract builds on-ramps and off-ramps on the north side of the new bridge and is administered by the City of San Francisco.
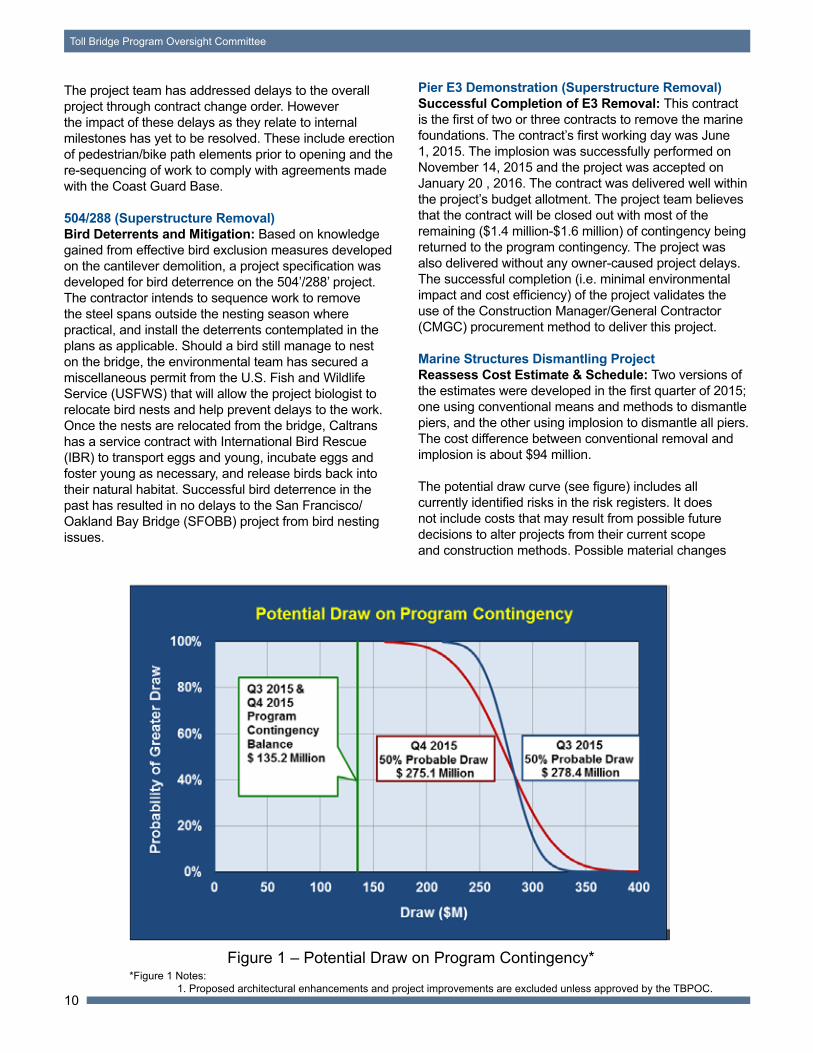
*Figure 1 Notes: 1. Proposed architectural enhancements and project improvements are excluded unless approved by the TBPOC.
Figure 1 – Potential Draw on Program Contingency*
10
Toll Bridge Program Oversight Committee
The project team has addressed delays to the overall project through contract change order. However the impact of these delays as they relate to internal milestones has yet to be resolved. These include erection of pedestrian/bike path elements prior to opening and the re-sequencing of work to comply with agreements made with the Coast Guard Base.
504/288 (Superstructure Removal)Bird Deterrents and Mitigation: Based on knowledge gained from effective bird exclusion measures developed on the cantilever demolition, a project specification was developed for bird deterrence on the 504’/288’ project. The contractor intends to sequence work to remove the steel spans outside the nesting season where practical, and install the deterrents contemplated in the plans as applicable. Should a bird still manage to nest on the bridge, the environmental team has secured a miscellaneous permit from the U.S. Fish and Wildlife Service (USFWS) that will allow the project biologist to relocate bird nests and help prevent delays to the work. Once the nests are relocated from the bridge, Caltrans has a service contract with International Bird Rescue (IBR) to transport eggs and young, incubate eggs and foster young as necessary, and release birds back into their natural habitat. Successful bird deterrence in the past has resulted in no delays to the San Francisco/Oakland Bay Bridge (SFOBB) project from bird nesting issues.
Pier E3 Demonstration (Superstructure Removal)Successful Completion of E3 Removal: This contract is the first of two or three contracts to remove the marine foundations. The contract’s first working day was June 1, 2015. The implosion was successfully performed on November 14, 2015 and the project was accepted on January 20 , 2016. The contract was delivered well within the project’s budget allotment. The project team believes that the contract will be closed out with most of the remaining ($1.4 million-$1.6 million) of contingency being returned to the program contingency. The project was also delivered without any owner-caused project delays. The successful completion (i.e. minimal environmental impact and cost efficiency) of the project validates the use of the Construction Manager/General Contractor (CMGC) procurement method to deliver this project.
Marine Structures Dismantling ProjectReassess Cost Estimate & Schedule: Two versions of the estimates were developed in the first quarter of 2015; one using conventional means and methods to dismantle piers, and the other using implosion to dismantle all piers. The cost difference between conventional removal and implosion is about $94 million.
The potential draw curve (see figure) includes all currently identified risks in the risk registers. It does not include costs that may result from possible future decisions to alter projects from their current scope and construction methods. Possible material changes
11
2015 Fourth Quarter Project Progress and Financial Update
to a project are not placed in a risk register according to best practices. A materially changed project differs substantially from its predecessor and requires a new risk register.
The removal of marine foundations is a project that may undergo material changes in 2016. The project assumes that the implosion method of removal will be used. The successful results of the Pier E3 Demonstration Project helped demonstrate the effectiveness of this method of demolition. However, the project may still have to revert to conventional methods of removal if the environmental agencies do not provide permit approvals, concur or impose overly restrictive limitations on the use of the implosion method. Conventional methods of demolition could increase the project cost by at least up to $94 million. This possibility is not in the risk register as it would be a material change to the project and as outlined above and its cost is not reflected in the draw curve. This potential increase in cost may be considered as an amount of funds that may need to be added to the program contingency to pay for conventional demolition should that method of demolition be required by the environmental agencies.
RISK MANAGEMENT LOOK AHEAD
Self-Anchored Suspension Span ContractThe project close-out effort will continue. The cost of support budget will continue to be spent until final close out is achieved.
Yerba Buena Island Transition Structure #2 ContractThe removal of the first two 504’ spans is scheduled to occur in the first quarter of 2016. A timely completion of
this work will allow the contractor to successfully complete the transfer of the E4 and E5 foundation piers to the marine structures dismantling contractor, in accordance with the 504’/288’ contract milestones.
504’/288’ Steel Structures Dismantling ContractThe removal of the first two of five 504’ spans is scheduled to occur in the first quarter of 2016. A timely completion of this work will allow the contractor to successfully complete the transfer of the E4 and E5 foundation piers to the marine structures dismantling contractor, in accordance with the 504’/288’ contract milestones.
Marine Structures Dismantling ContractThere is only $55 million of the marine structures dismantling CO budget left to finance the remainder of the pier removal project. The project currently has an engineer’s estimate of $193 million and project risks of $50 million, so the cost to completion is forecast at $243 million. The current scope of work (removal of piers E4-E18) will be negotiated and ready to award by April 2016. A likely cost $140 million (Item Cost + SFM + SWF plus 10% contingency) to award the project. Thus, a budget adjustment of up to $138 million ($193 million - $55 million)approximately $85 million ($140 million - $55 million) will need to be approved in February 2016 by the TBPOC in order for the funds to be approved by BATA in March 2016 and have the funds available by April 1, 2016 to award the contract. Additional budget adjustments may be needed in the future to finance the remaining project scope (piers E2 and E18-E22) if they are removed and to finance project risks if they occur.
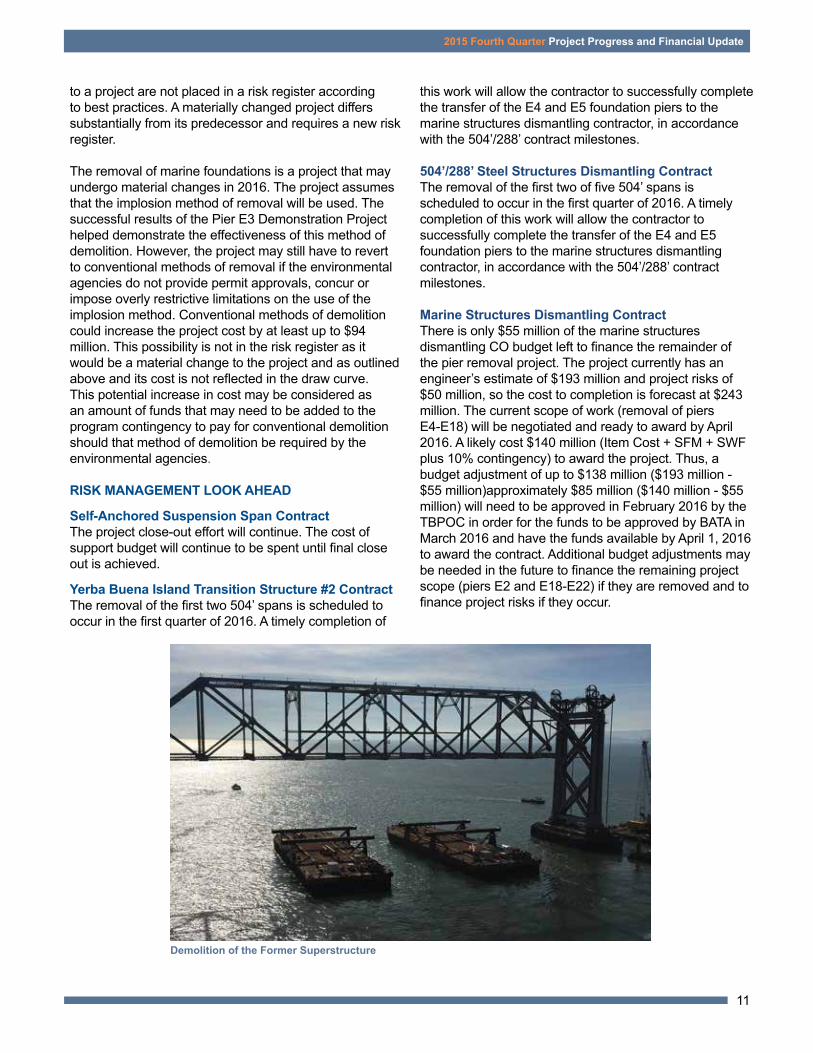
Demolition of the Former Superstructure
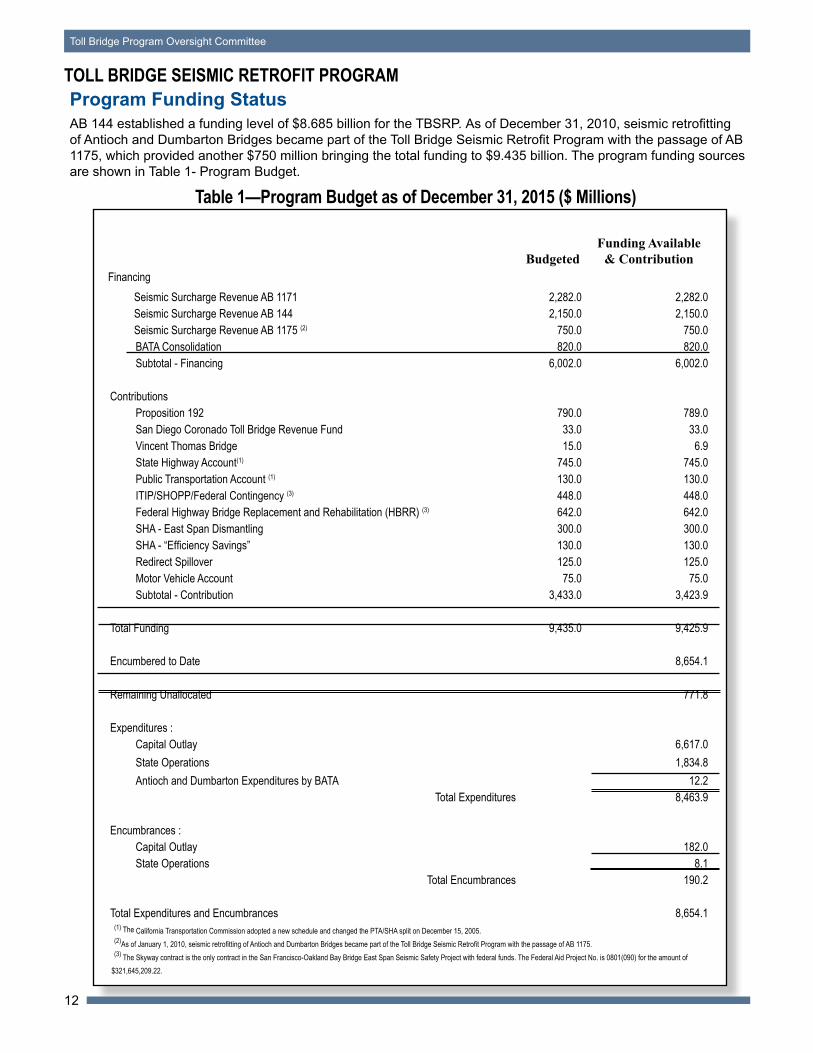
Program Funding StatusAB 144 established a funding level of $8.685 billion for the TBSRP. As of December 31, 2010, seismic retrofitting of Antioch and Dumbarton Bridges became part of the Toll Bridge Seismic Retrofit Program with the passage of AB 1175, which provided another $750 million bringing the total funding to $9.435 billion. The program funding sources are shown in Table 1- Program Budget.
Table 1—Program Budget as of December 31, 2015 ($ Millions)
TOLL BRIDGE SEISMIC RETROFIT PROGRAM
BudgetedFunding Available
& ContributionFinancing
Seismic Surcharge Revenue AB 1171 2,282.0 2,282.0Seismic Surcharge Revenue AB 144 2,150.0 2,150.0Seismic Surcharge Revenue AB 1175 (2) 750.0 750.0BATA Consolidation 820.0 820.0Subtotal - Financing 6,002.0 6,002.0
ContributionsProposition 192 790.0 789.0San Diego Coronado Toll Bridge Revenue Fund 33.0 33.0Vincent Thomas Bridge 15.0 6.9State Highway Account(1) 745.0 745.0Public Transportation Account (1) 130.0 130.0ITIP/SHOPP/Federal Contingency (3) 448.0 448.0Federal Highway Bridge Replacement and Rehabilitation (HBRR) (3) 642.0 642.0SHA - East Span Dismantling 300.0 300.0SHA - “Efficiency Savings” 130.0 130.0Redirect Spillover 125.0 125.0Motor Vehicle Account 75.0 75.0Subtotal - Contribution 3,433.0 3,423.9
Total Funding 9,435.0 9,425.9
Encumbered to Date 8,654.1
Remaining Unallocated 771.8
Expenditures :Capital Outlay 6,617.0State Operations 1,834.8Antioch and Dumbarton Expenditures by BATA 12.2
Total Expenditures 8,463.9
Encumbrances : Capital Outlay 182.0State Operations 8.1
Total Encumbrances 190.2
Total Expenditures and Encumbrances 8,654.1 (1) The California Transportation Commission adopted a new schedule and changed the PTA/SHA split on December 15, 2005. (2)As of January 1, 2010, seismic retrofitting of Antioch and Dumbarton Bridges became part of the Toll Bridge Seismic Retrofit Program with the passage of AB 1175. (3) The Skyway contract is the only contract in the San Francisco-Oakland Bay Bridge East Span Seismic Safety Project with federal funds. The Federal Aid Project No. is 0801(090) for the amount of $321,645,209.22.
12
Toll Bridge Program Oversight Committee
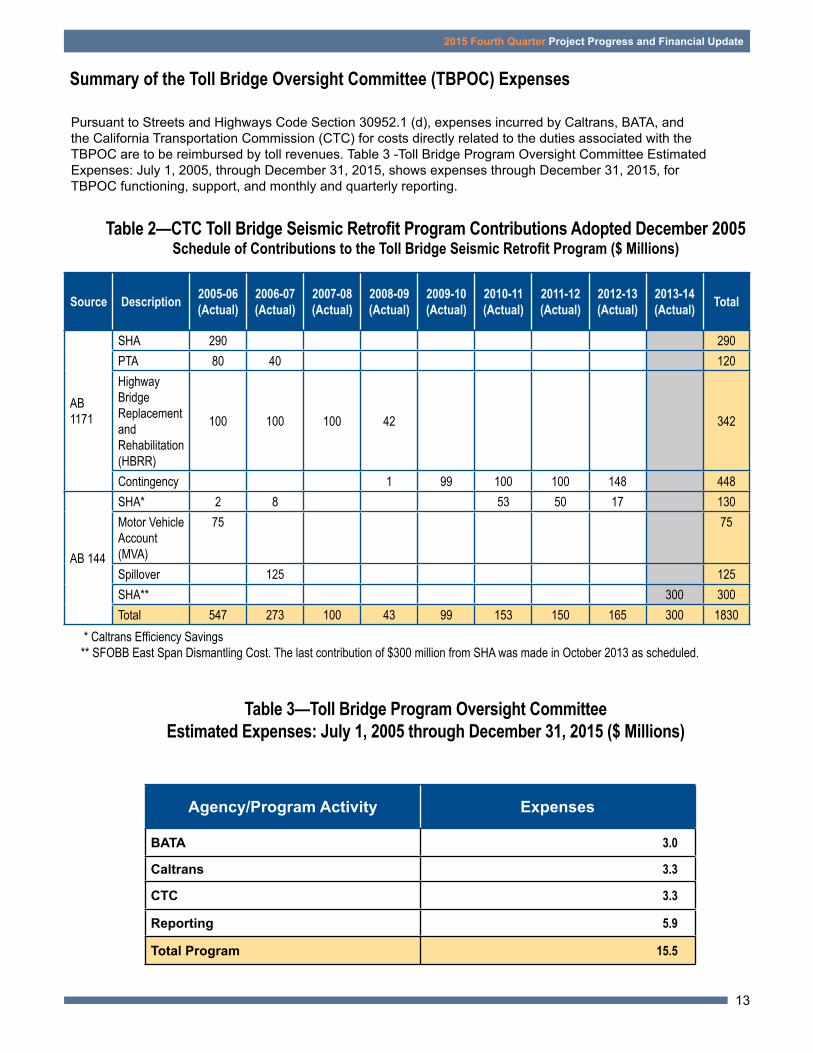
Pursuant to Streets and Highways Code Section 30952.1 (d), expenses incurred by Caltrans, BATA, and the California Transportation Commission (CTC) for costs directly related to the duties associated with the TBPOC are to be reimbursed by toll revenues. Table 3 -Toll Bridge Program Oversight Committee Estimated Expenses: July 1, 2005, through December 31, 2015, shows expenses through December 31, 2015, for TBPOC functioning, support, and monthly and quarterly reporting.
Summary of the Toll Bridge Oversight Committee (TBPOC) Expenses
Table 2—CTC Toll Bridge Seismic Retrofit Program Contributions Adopted December 2005Schedule of Contributions to the Toll Bridge Seismic Retrofit Program ($ Millions)
Source Description 2005-06(Actual)
2006-07(Actual)
2007-08(Actual)
2008-09(Actual)
2009-10(Actual)
2010-11(Actual)
2011-12(Actual)
2012-13(Actual)
2013-14(Actual) Total
AB1171
SHA 290 290PTA 80 40 120Highway BridgeReplacementandRehabilitation(HBRR)
100 100 100 42 342
Contingency 1 99 100 100 148 448
AB 144
SHA* 2 8 53 50 17 130Motor VehicleAccount (MVA)
75 75
Spillover 125 125SHA** 300 300Total 547 273 100 43 99 153 150 165 300 1830
* Caltrans Efficiency Savings** SFOBB East Span Dismantling Cost. The last contribution of $300 million from SHA was made in October 2013 as scheduled.
Table 3—Toll Bridge Program Oversight Committee Estimated Expenses: July 1, 2005 through December 31, 2015 ($ Millions)
Agency/Program Activity Expenses
BATA 3.0
Caltrans 3.3
CTC 3.3
Reporting 5.9
Total Program 15.5
13
2015 Fourth Quarter Project Progress and Financial Update
14
Toll Bridge Program Oversight Committee
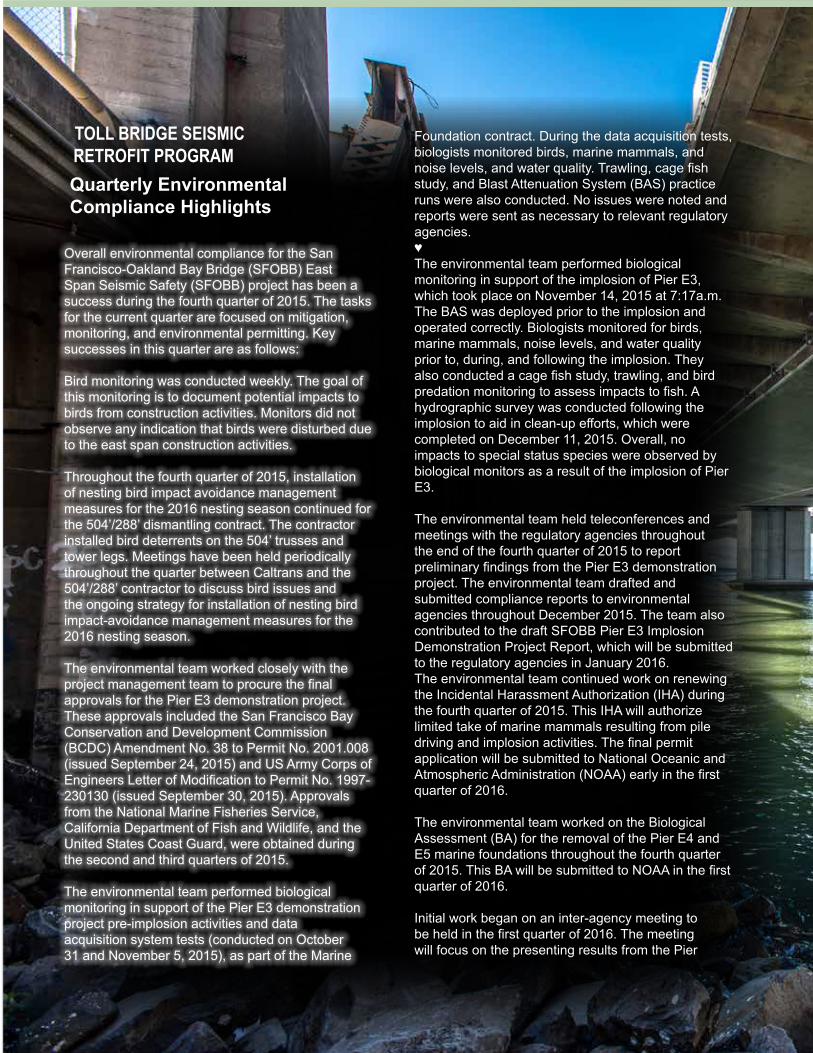
TOLL BRIDGE SEISMIC RETROFIT PROGRAMQuarterly Environmental Compliance Highlights
Overall environmental compliance for the San Francisco-Oakland Bay Bridge (SFOBB) East Span Seismic Safety (SFOBB) project has been a success during the fourth quarter of 2015. The tasks for the current quarter are focused on mitigation, monitoring, and environmental permitting. Key successes in this quarter are as follows:
Bird monitoring was conducted weekly. The goal of this monitoring is to document potential impacts to birds from construction activities. Monitors did not observe any indication that birds were disturbed due to the east span construction activities.
Throughout the fourth quarter of 2015, installation of nesting bird impact avoidance management measures for the 2016 nesting season continued for the 504’/288’ dismantling contract. The contractor installed bird deterrents on the 504’ trusses and tower legs. Meetings have been held periodically throughout the quarter between Caltrans and the 504’/288’ contractor to discuss bird issues and the ongoing strategy for installation of nesting bird impact-avoidance management measures for the 2016 nesting season.
The environmental team worked closely with the project management team to procure the final approvals for the Pier E3 demonstration project. These approvals included the San Francisco Bay Conservation and Development Commission (BCDC) Amendment No. 38 to Permit No. 2001.008 (issued September 24, 2015) and US Army Corps of Engineers Letter of Modification to Permit No. 1997-230130 (issued September 30, 2015). Approvals from the National Marine Fisheries Service, California Department of Fish and Wildlife, and the United States Coast Guard, were obtained during the second and third quarters of 2015.
The environmental team performed biological monitoring in support of the Pier E3 demonstration project pre-implosion activities and data acquisition system tests (conducted on October 31 and November 5, 2015), as part of the Marine
Foundation contract. During the data acquisition tests, biologists monitored birds, marine mammals, and noise levels, and water quality. Trawling, cage fish study, and Blast Attenuation System (BAS) practice runs were also conducted. No issues were noted and reports were sent as necessary to relevant regulatory agencies.♥The environmental team performed biological monitoring in support of the implosion of Pier E3, which took place on November 14, 2015 at 7:17a.m. The BAS was deployed prior to the implosion and operated correctly. Biologists monitored for birds, marine mammals, noise levels, and water quality prior to, during, and following the implosion. They also conducted a cage fish study, trawling, and bird predation monitoring to assess impacts to fish. A hydrographic survey was conducted following the implosion to aid in clean-up efforts, which were completed on December 11, 2015. Overall, no impacts to special status species were observed by biological monitors as a result of the implosion of Pier E3.
The environmental team held teleconferences and meetings with the regulatory agencies throughout the end of the fourth quarter of 2015 to report preliminary findings from the Pier E3 demonstration project. The environmental team drafted and submitted compliance reports to environmental agencies throughout December 2015. The team also contributed to the draft SFOBB Pier E3 Implosion Demonstration Project Report, which will be submitted to the regulatory agencies in January 2016. The environmental team continued work on renewing the Incidental Harassment Authorization (IHA) during the fourth quarter of 2015. This IHA will authorize limited take of marine mammals resulting from pile driving and implosion activities. The final permit application will be submitted to National Oceanic and Atmospheric Administration (NOAA) early in the first quarter of 2016.
The environmental team worked on the Biological Assessment (BA) for the removal of the Pier E4 and E5 marine foundations throughout the fourth quarter of 2015. This BA will be submitted to NOAA in the first quarter of 2016.
Initial work began on an inter-agency meeting to be held in the first quarter of 2016. The meeting will focus on the presenting results from the Pier
15
2015 Fourth Quarter Project Progress and Financial Update
E3 demonstration project and request agency feedback on the upcoming pier removal and retention strategy.
APPENDICES
A. TBSRP AB 144/SB 66 Baseline Budget, Forecasts and Expenditures through December 31, 2015 (A-1 and A-2)
B. TBSRP (SFOBB East Span Only) AB 144/SB 66 Baseline Budget, Forecasts and Expenditures through December 31, 2015
C. Project Photos
D. Glossary of Terms
16
Toll Bridge Program Oversight Committee
Contract
AB 144/SB 66/AB 1175(07/2005)
ApprovedChanges
Current Approved
Budget(12/2015)
Cost to Date(12/2015)
Cost Forecast(12/2015)
At-Completion
Variancea c d e = c + d f g h = g - e
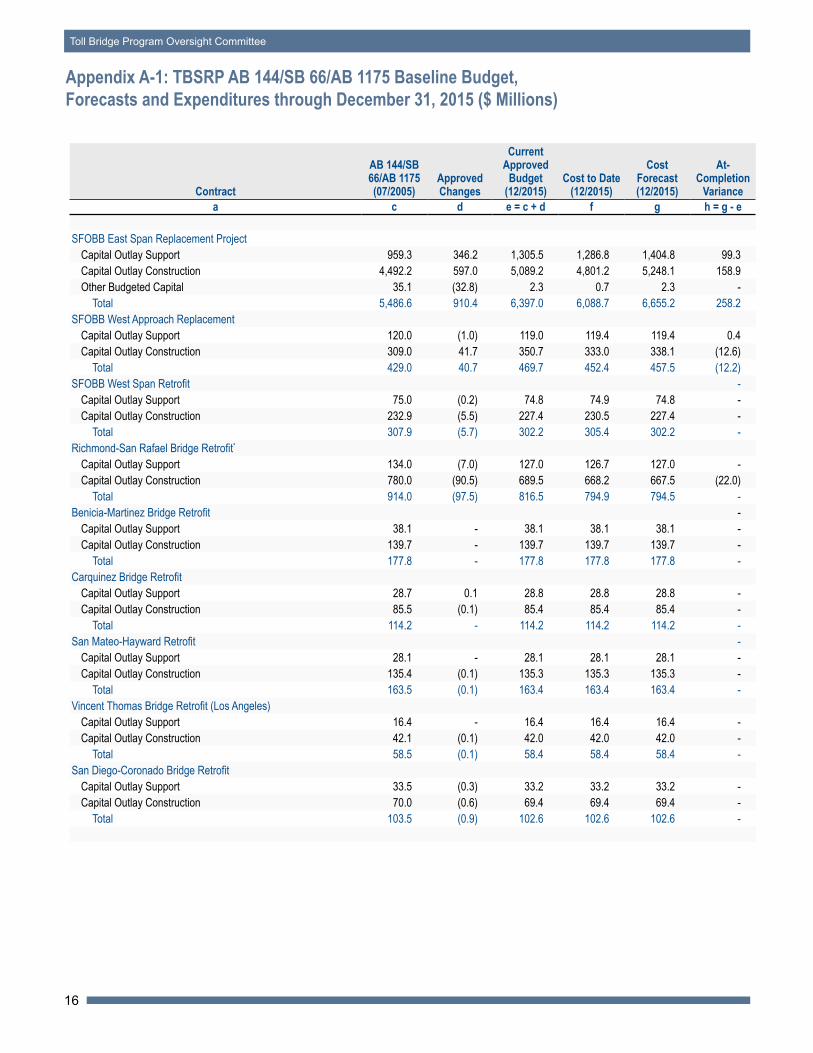
SFOBB East Span Replacement ProjectCapital Outlay Support 959.3 346.2 1,305.5 1,286.8 1,404.8 99.3 Capital Outlay Construction 4,492.2 597.0 5,089.2 4,801.2 5,248.1 158.9 Other Budgeted Capital 35.1 (32.8) 2.3 0.7 2.3 -
Total 5,486.6 910.4 6,397.0 6,088.7 6,655.2 258.2 SFOBB West Approach Replacement
Capital Outlay Support 120.0 (1.0) 119.0 119.4 119.4 0.4 Capital Outlay Construction 309.0 41.7 350.7 333.0 338.1 (12.6)
Total 429.0 40.7 469.7 452.4 457.5 (12.2)SFOBB West Span Retrofit -
Capital Outlay Support 75.0 (0.2) 74.8 74.9 74.8 - Capital Outlay Construction 232.9 (5.5) 227.4 230.5 227.4 -
Total 307.9 (5.7) 302.2 305.4 302.2 - Richmond-San Rafael Bridge Retrofit*
Capital Outlay Support 134.0 (7.0) 127.0 126.7 127.0 - Capital Outlay Construction 780.0 (90.5) 689.5 668.2 667.5 (22.0)
Total 914.0 (97.5) 816.5 794.9 794.5 - Benicia-Martinez Bridge Retrofit -
Capital Outlay Support 38.1 - 38.1 38.1 38.1 - Capital Outlay Construction 139.7 - 139.7 139.7 139.7 -
Total 177.8 - 177.8 177.8 177.8 - Carquinez Bridge Retrofit
Capital Outlay Support 28.7 0.1 28.8 28.8 28.8 - Capital Outlay Construction 85.5 (0.1) 85.4 85.4 85.4 -
Total 114.2 - 114.2 114.2 114.2 - San Mateo-Hayward Retrofit -
Capital Outlay Support 28.1 - 28.1 28.1 28.1 - Capital Outlay Construction 135.4 (0.1) 135.3 135.3 135.3 -
Total 163.5 (0.1) 163.4 163.4 163.4 - Vincent Thomas Bridge Retrofit (Los Angeles)
Capital Outlay Support 16.4 - 16.4 16.4 16.4 - Capital Outlay Construction 42.1 (0.1) 42.0 42.0 42.0 -
Total 58.5 (0.1) 58.4 58.4 58.4 - San Diego-Coronado Bridge Retrofit
Capital Outlay Support 33.5 (0.3) 33.2 33.2 33.2 - Capital Outlay Construction 70.0 (0.6) 69.4 69.4 69.4 -
Total 103.5 (0.9) 102.6 102.6 102.6 -
Appendix A-1: TBSRP AB 144/SB 66/AB 1175 Baseline Budget, Forecasts and Expenditures through December 31, 2015 ($ Millions)
17
2015 Fourth Quarter Project Progress and Financial Update
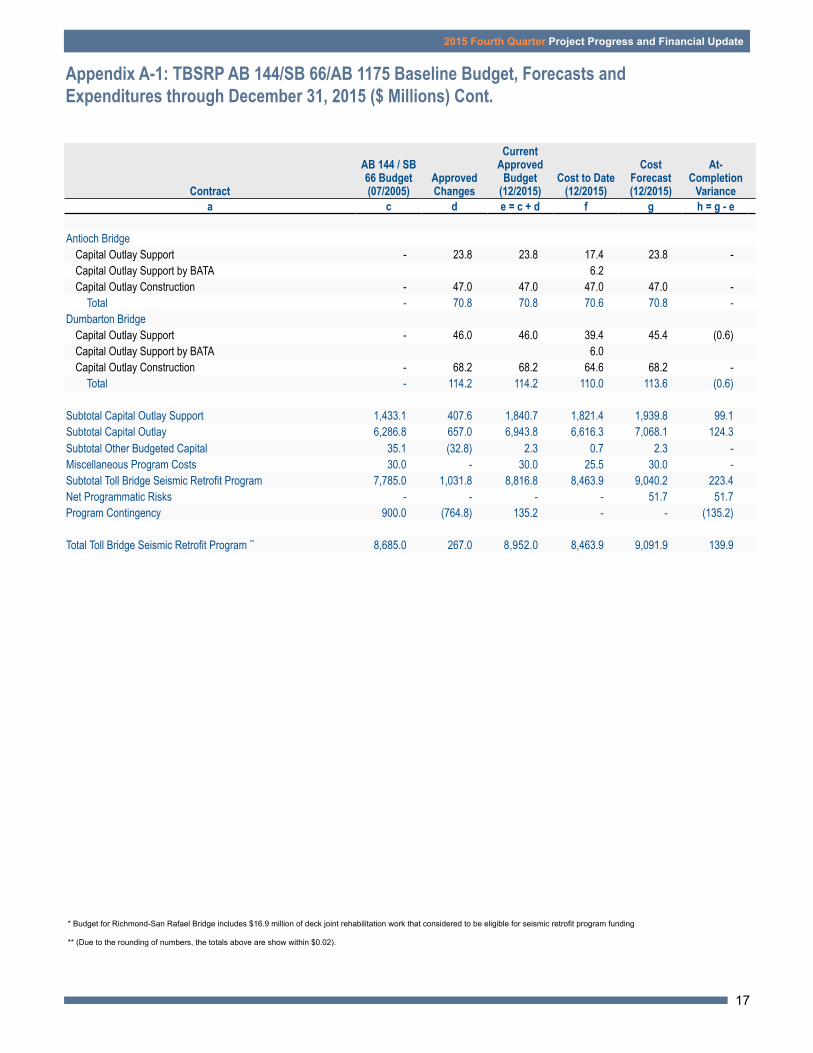
Appendix A-1: TBSRP AB 144/SB 66/AB 1175 Baseline Budget, Forecasts and Expenditures through December 31, 2015 ($ Millions) Cont.
* Budget for Richmond-San Rafael Bridge includes $16.9 million of deck joint rehabilitation work that considered to be eligible for seismic retrofit program funding ** (Due to the rounding of numbers, the totals above are show within $0.02).
Contract
AB 144 / SB66 Budget(07/2005)
ApprovedChanges
Current Approved
Budget(12/2015)
Cost to Date(12/2015)
Cost Forecast(12/2015)
At-Completion
Variancea c d e = c + d f g h = g - e
Antioch BridgeCapital Outlay Support - 23.8 23.8 17.4 23.8 - Capital Outlay Support by BATA 6.2 Capital Outlay Construction - 47.0 47.0 47.0 47.0 -
Total - 70.8 70.8 70.6 70.8 - Dumbarton Bridge
Capital Outlay Support - 46.0 46.0 39.4 45.4 (0.6)Capital Outlay Support by BATA 6.0 Capital Outlay Construction - 68.2 68.2 64.6 68.2 -
Total - 114.2 114.2 110.0 113.6 (0.6)
Subtotal Capital Outlay Support 1,433.1 407.6 1,840.7 1,821.4 1,939.8 99.1 Subtotal Capital Outlay 6,286.8 657.0 6,943.8 6,616.3 7,068.1 124.3 Subtotal Other Budgeted Capital 35.1 (32.8) 2.3 0.7 2.3 - Miscellaneous Program Costs 30.0 - 30.0 25.5 30.0 - Subtotal Toll Bridge Seismic Retrofit Program 7,785.0 1,031.8 8,816.8 8,463.9 9,040.2 223.4 Net Programmatic Risks - - - - 51.7 51.7 Program Contingency 900.0 (764.8) 135.2 - - (135.2)
Total Toll Bridge Seismic Retrofit Program ** 8,685.0 267.0 8,952.0 8,463.9 9,091.9 139.9
18
Toll Bridge Program Oversight Committee
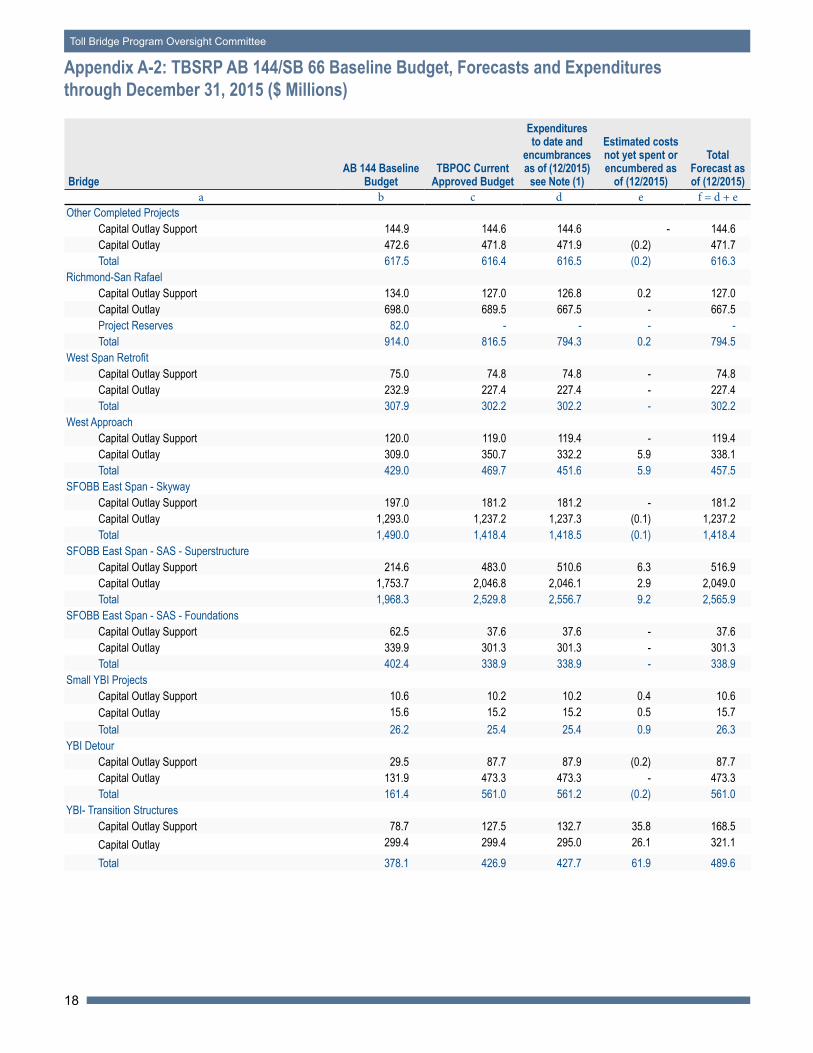
Appendix A-2: TBSRP AB 144/SB 66 Baseline Budget, Forecasts and Expenditures through December 31, 2015 ($ Millions)
BridgeAB 144 Baseline
BudgetTBPOC Current
Approved Budget
Expenditures to date and
encumbrancesas of (12/2015)
see Note (1)
Estimated costs not yet spent or encumbered as
of (12/2015)
Total Forecast as of (12/2015)
a b c d e f = d + eOther Completed Projects
Capital Outlay Support 144.9 144.6 144.6 - 144.6 Capital Outlay 472.6 471.8 471.9 (0.2) 471.7 Total 617.5 616.4 616.5 (0.2) 616.3
Richmond-San RafaelCapital Outlay Support 134.0 127.0 126.8 0.2 127.0 Capital Outlay 698.0 689.5 667.5 - 667.5 Project Reserves 82.0 - - - - Total 914.0 816.5 794.3 0.2 794.5
West Span RetrofitCapital Outlay Support 75.0 74.8 74.8 - 74.8 Capital Outlay 232.9 227.4 227.4 - 227.4 Total 307.9 302.2 302.2 - 302.2
West ApproachCapital Outlay Support 120.0 119.0 119.4 - 119.4 Capital Outlay 309.0 350.7 332.2 5.9 338.1 Total 429.0 469.7 451.6 5.9 457.5
SFOBB East Span - SkywayCapital Outlay Support 197.0 181.2 181.2 - 181.2 Capital Outlay 1,293.0 1,237.2 1,237.3 (0.1) 1,237.2 Total 1,490.0 1,418.4 1,418.5 (0.1) 1,418.4
SFOBB East Span - SAS - SuperstructureCapital Outlay Support 214.6 483.0 510.6 6.3 516.9 Capital Outlay 1,753.7 2,046.8 2,046.1 2.9 2,049.0 Total 1,968.3 2,529.8 2,556.7 9.2 2,565.9
SFOBB East Span - SAS - FoundationsCapital Outlay Support 62.5 37.6 37.6 - 37.6 Capital Outlay 339.9 301.3 301.3 - 301.3 Total 402.4 338.9 338.9 - 338.9
Small YBI ProjectsCapital Outlay Support 10.6 10.2 10.2 0.4 10.6 Capital Outlay 15.6 15.2 15.2 0.5 15.7 Total 26.2 25.4 25.4 0.9 26.3
YBI DetourCapital Outlay Support 29.5 87.7 87.9 (0.2) 87.7 Capital Outlay 131.9 473.3 473.3 - 473.3 Total 161.4 561.0 561.2 (0.2) 561.0
YBI- Transition Structures Capital Outlay Support 78.7 127.5 132.7 35.8 168.5 Capital Outlay 299.4 299.4 295.0 26.1 321.1 Total 378.1 426.9 427.7 61.9 489.6
19
2015 Fourth Quarter Project Progress and Financial Update
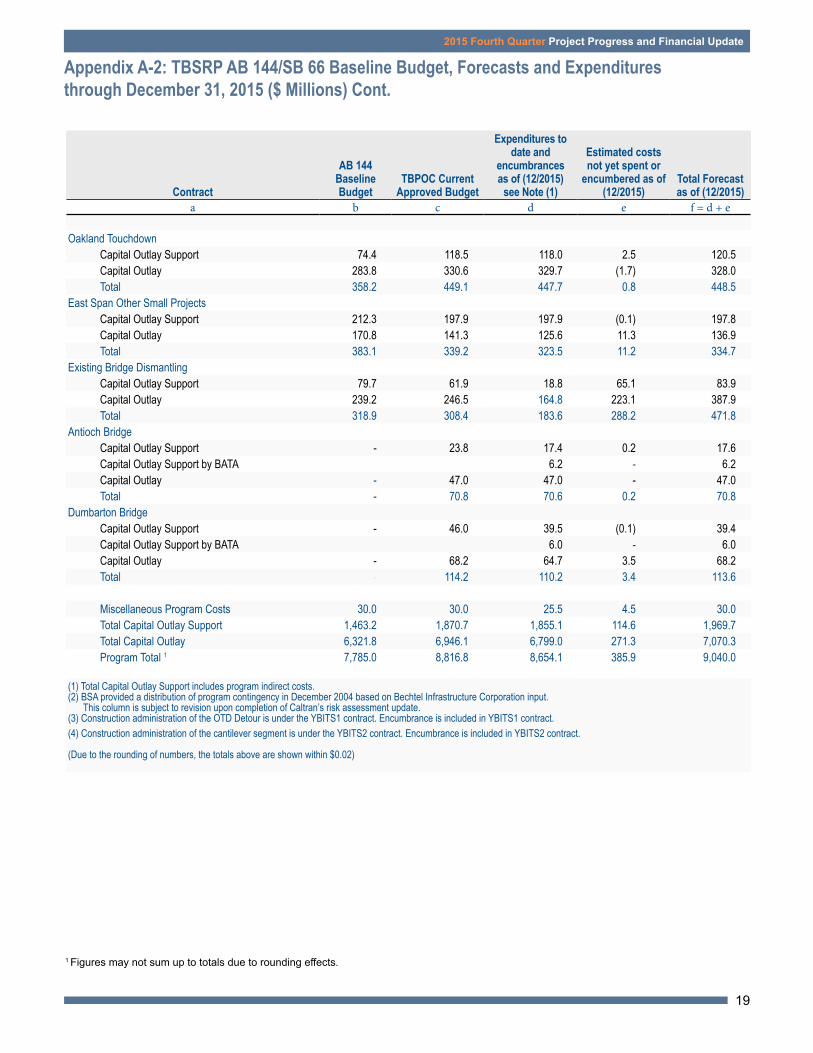
Appendix A-2: TBSRP AB 144/SB 66 Baseline Budget, Forecasts and Expenditures through December 31, 2015 ($ Millions) Cont.
Contract
AB 144 Baseline Budget
TBPOC Current Approved Budget
Expenditures to date and
encumbrancesas of (12/2015)
see Note (1)
Estimated costs not yet spent or
encumbered as of (12/2015)
Total Forecast as of (12/2015)
a b c d e f = d + e
Oakland TouchdownCapital Outlay Support 74.4 118.5 118.0 2.5 120.5 Capital Outlay 283.8 330.6 329.7 (1.7) 328.0 Total 358.2 449.1 447.7 0.8 448.5
East Span Other Small ProjectsCapital Outlay Support 212.3 197.9 197.9 (0.1) 197.8 Capital Outlay 170.8 141.3 125.6 11.3 136.9 Total 383.1 339.2 323.5 11.2 334.7
Existing Bridge DismantlingCapital Outlay Support 79.7 61.9 18.8 65.1 83.9 Capital Outlay 239.2 246.5 164.8 223.1 387.9 Total 318.9 308.4 183.6 288.2 471.8
Antioch BridgeCapital Outlay Support - 23.8 17.4 0.2 17.6 Capital Outlay Support by BATA 6.2 - 6.2 Capital Outlay - 47.0 47.0 - 47.0 Total - 70.8 70.6 0.2 70.8
Dumbarton BridgeCapital Outlay Support - 46.0 39.5 (0.1) 39.4 Capital Outlay Support by BATA 6.0 - 6.0 Capital Outlay - 68.2 64.7 3.5 68.2 Total - 114.2 110.2 3.4 113.6
Miscellaneous Program Costs 30.0 30.0 25.5 4.5 30.0 Total Capital Outlay Support 1,463.2 1,870.7 1,855.1 114.6 1,969.7 Total Capital Outlay 6,321.8 6,946.1 6,799.0 271.3 7,070.3 Program Total 1 7,785.0 8,816.8 8,654.1 385.9 9,040.0
(1) Total Capital Outlay Support includes program indirect costs.(2) BSA provided a distribution of program contingency in December 2004 based on Bechtel Infrastructure Corporation input.
This column is subject to revision upon completion of Caltran’s risk assessment update.(3) Construction administration of the OTD Detour is under the YBITS1 contract. Encumbrance is included in YBITS1 contract.(4) Construction administration of the cantilever segment is under the YBITS2 contract. Encumbrance is included in YBITS2 contract.
(Due to the rounding of numbers, the totals above are shown within $0.02)
1 Figures may not sum up to totals due to rounding effects.
20
Toll Bridge Program Oversight Committee
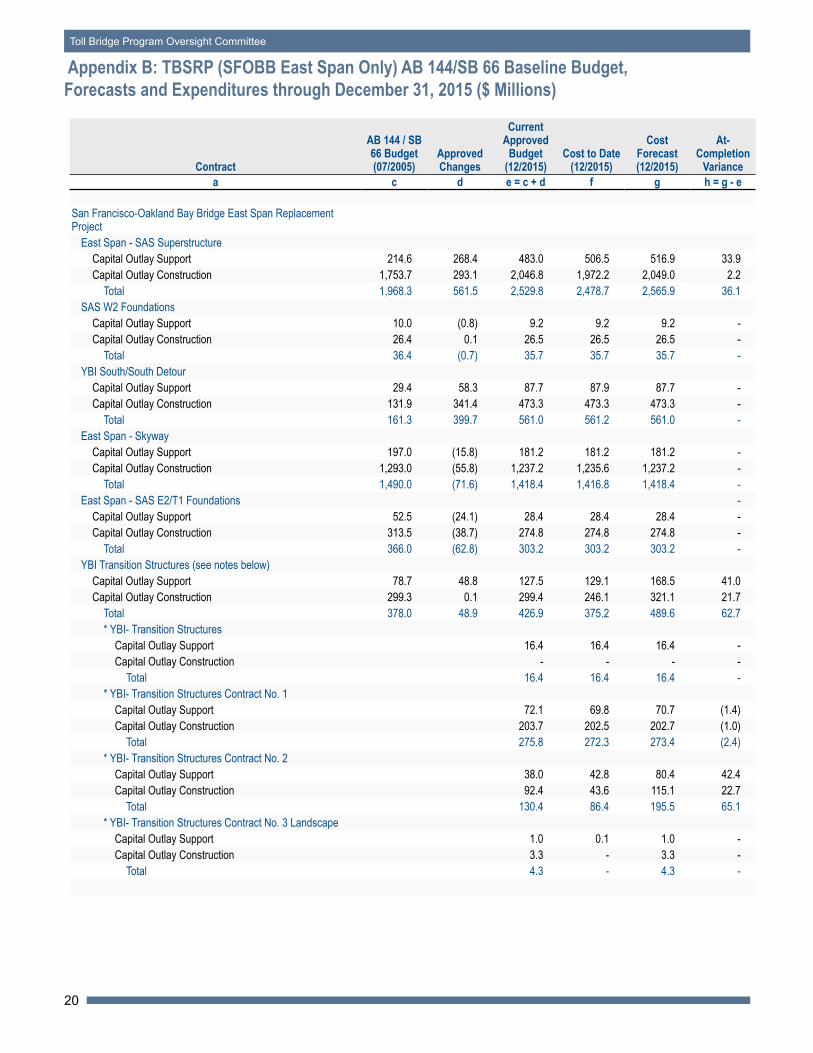
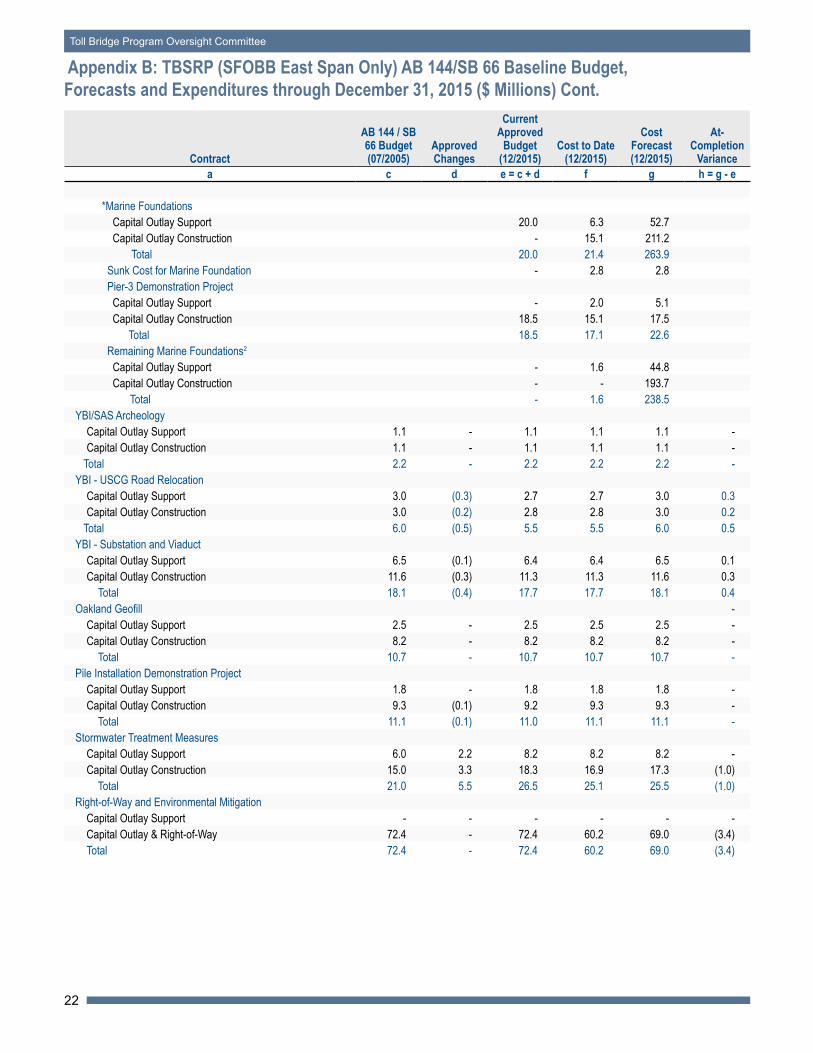
Appendix B: TBSRP (SFOBB East Span Only) AB 144/SB 66 Baseline Budget, Forecasts and Expenditures through December 31, 2015 ($ Millions)
Contract
AB 144 / SB66 Budget(07/2005)
ApprovedChanges
Current Approved
Budget(12/2015)
Cost to Date(12/2015)
Cost Forecast(12/2015)
At-Completion
Variancea c d e = c + d f g h = g - e
San Francisco-Oakland Bay Bridge East Span Replacement Project
East Span - SAS SuperstructureCapital Outlay Support 214.6 268.4 483.0 506.5 516.9 33.9 Capital Outlay Construction 1,753.7 293.1 2,046.8 1,972.2 2,049.0 2.2
Total 1,968.3 561.5 2,529.8 2,478.7 2,565.9 36.1 SAS W2 Foundations
Capital Outlay Support 10.0 (0.8) 9.2 9.2 9.2 - Capital Outlay Construction 26.4 0.1 26.5 26.5 26.5 -
Total 36.4 (0.7) 35.7 35.7 35.7 - YBI South/South Detour
Capital Outlay Support 29.4 58.3 87.7 87.9 87.7 - Capital Outlay Construction 131.9 341.4 473.3 473.3 473.3 -
Total 161.3 399.7 561.0 561.2 561.0 - East Span - Skyway
Capital Outlay Support 197.0 (15.8) 181.2 181.2 181.2 - Capital Outlay Construction 1,293.0 (55.8) 1,237.2 1,235.6 1,237.2 -
Total 1,490.0 (71.6) 1,418.4 1,416.8 1,418.4 - East Span - SAS E2/T1 Foundations -
Capital Outlay Support 52.5 (24.1) 28.4 28.4 28.4 - Capital Outlay Construction 313.5 (38.7) 274.8 274.8 274.8 -
Total 366.0 (62.8) 303.2 303.2 303.2 - YBI Transition Structures (see notes below)
Capital Outlay Support 78.7 48.8 127.5 129.1 168.5 41.0 Capital Outlay Construction 299.3 0.1 299.4 246.1 321.1 21.7
Total 378.0 48.9 426.9 375.2 489.6 62.7 * YBI- Transition Structures
Capital Outlay Support 16.4 16.4 16.4 - Capital Outlay Construction - - - -
Total 16.4 16.4 16.4 - * YBI- Transition Structures Contract No. 1
Capital Outlay Support 72.1 69.8 70.7 (1.4)Capital Outlay Construction 203.7 202.5 202.7 (1.0)
Total 275.8 272.3 273.4 (2.4)* YBI- Transition Structures Contract No. 2
Capital Outlay Support 38.0 42.8 80.4 42.4 Capital Outlay Construction 92.4 43.6 115.1 22.7
Total 130.4 86.4 195.5 65.1 * YBI- Transition Structures Contract No. 3 Landscape
Capital Outlay Support 1.0 0.1 1.0 - Capital Outlay Construction 3.3 - 3.3 -
Total 4.3 - 4.3 -
21
2015 Fourth Quarter Project Progress and Financial Update
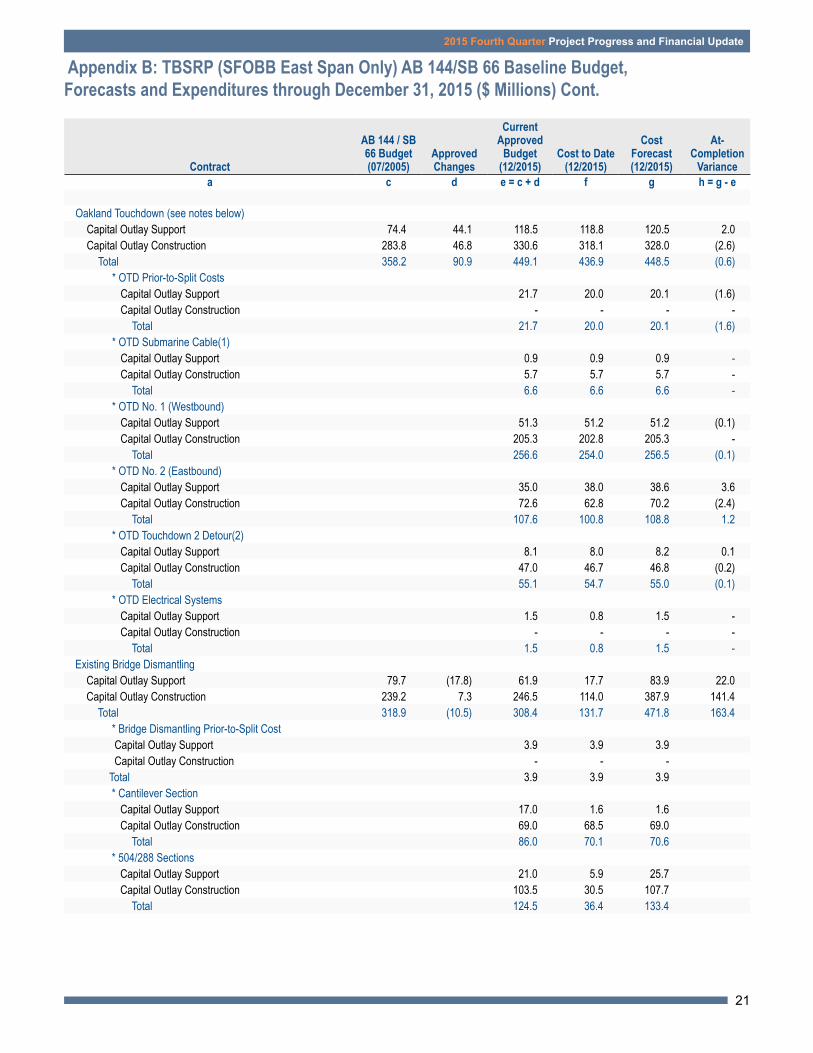
Appendix B: TBSRP (SFOBB East Span Only) AB 144/SB 66 Baseline Budget, Forecasts and Expenditures through December 31, 2015 ($ Millions) Cont.
Contract
AB 144 / SB66 Budget(07/2005)
ApprovedChanges
Current Approved
Budget(12/2015)
Cost to Date (12/2015)
Cost Forecast(12/2015)
At-Completion
Variancea c d e = c + d f g h = g - e
Oakland Touchdown (see notes below)Capital Outlay Support 74.4 44.1 118.5 118.8 120.5 2.0 Capital Outlay Construction 283.8 46.8 330.6 318.1 328.0 (2.6)
Total 358.2 90.9 449.1 436.9 448.5 (0.6) * OTD Prior-to-Split Costs
Capital Outlay Support 21.7 20.0 20.1 (1.6)Capital Outlay Construction - - - -
Total 21.7 20.0 20.1 (1.6) * OTD Submarine Cable(1)
Capital Outlay Support 0.9 0.9 0.9 - Capital Outlay Construction 5.7 5.7 5.7 -
Total 6.6 6.6 6.6 - * OTD No. 1 (Westbound)
Capital Outlay Support 51.3 51.2 51.2 (0.1)Capital Outlay Construction 205.3 202.8 205.3 -
Total 256.6 254.0 256.5 (0.1) * OTD No. 2 (Eastbound)
Capital Outlay Support 35.0 38.0 38.6 3.6 Capital Outlay Construction 72.6 62.8 70.2 (2.4)
Total 107.6 100.8 108.8 1.2 * OTD Touchdown 2 Detour(2)
Capital Outlay Support 8.1 8.0 8.2 0.1 Capital Outlay Construction 47.0 46.7 46.8 (0.2)
Total 55.1 54.7 55.0 (0.1) * OTD Electrical Systems
Capital Outlay Support 1.5 0.8 1.5 - Capital Outlay Construction - - - -
Total 1.5 0.8 1.5 - Existing Bridge Dismantling
Capital Outlay Support 79.7 (17.8) 61.9 17.7 83.9 22.0 Capital Outlay Construction 239.2 7.3 246.5 114.0 387.9 141.4
Total 318.9 (10.5) 308.4 131.7 471.8 163.4 * Bridge Dismantling Prior-to-Split Cost Capital Outlay Support 3.9 3.9 3.9 Capital Outlay Construction - - - Total 3.9 3.9 3.9 * Cantilever Section
Capital Outlay Support 17.0 1.6 1.6 Capital Outlay Construction 69.0 68.5 69.0
Total 86.0 70.1 70.6 * 504/288 Sections
Capital Outlay Support 21.0 5.9 25.7 Capital Outlay Construction 103.5 30.5 107.7
Total 124.5 36.4 133.4
22
Toll Bridge Program Oversight Committee
Appendix B: TBSRP (SFOBB East Span Only) AB 144/SB 66 Baseline Budget, Forecasts and Expenditures through December 31, 2015 ($ Millions) Cont.
Contract
AB 144 / SB66 Budget(07/2005)
ApprovedChanges
Current Approved
Budget(12/2015)
Cost to Date(12/2015)
Cost Forecast(12/2015)
At-Completion
Variancea c d e = c + d f g h = g - e
*Marine Foundations Capital Outlay Support 20.0 6.3 52.7 Capital Outlay Construction - 15.1 211.2
Total 20.0 21.4 263.9 Sunk Cost for Marine Foundation - 2.8 2.8 Pier-3 Demonstration Project Capital Outlay Support - 2.0 5.1 Capital Outlay Construction 18.5 15.1 17.5
Total 18.5 17.1 22.6 Remaining Marine Foundations2
Capital Outlay Support - 1.6 44.8 Capital Outlay Construction - - 193.7 Total - 1.6 238.5
YBI/SAS ArcheologyCapital Outlay Support 1.1 - 1.1 1.1 1.1 - Capital Outlay Construction 1.1 - 1.1 1.1 1.1 -
Total 2.2 - 2.2 2.2 2.2 - YBI - USCG Road Relocation
Capital Outlay Support 3.0 (0.3) 2.7 2.7 3.0 0.3 Capital Outlay Construction 3.0 (0.2) 2.8 2.8 3.0 0.2
Total 6.0 (0.5) 5.5 5.5 6.0 0.5 YBI - Substation and Viaduct
Capital Outlay Support 6.5 (0.1) 6.4 6.4 6.5 0.1 Capital Outlay Construction 11.6 (0.3) 11.3 11.3 11.6 0.3
Total 18.1 (0.4) 17.7 17.7 18.1 0.4 Oakland Geofill -
Capital Outlay Support 2.5 - 2.5 2.5 2.5 - Capital Outlay Construction 8.2 - 8.2 8.2 8.2 -
Total 10.7 - 10.7 10.7 10.7 - Pile Installation Demonstration Project
Capital Outlay Support 1.8 - 1.8 1.8 1.8 - Capital Outlay Construction 9.3 (0.1) 9.2 9.3 9.3 -
Total 11.1 (0.1) 11.0 11.1 11.1 - Stormwater Treatment Measures
Capital Outlay Support 6.0 2.2 8.2 8.2 8.2 - Capital Outlay Construction 15.0 3.3 18.3 16.9 17.3 (1.0)
Total 21.0 5.5 26.5 25.1 25.5 (1.0)Right-of-Way and Environmental Mitigation
Capital Outlay Support - - - - - - Capital Outlay & Right-of-Way 72.4 - 72.4 60.2 69.0 (3.4)Total 72.4 - 72.4 60.2 69.0 (3.4)
23
2015 Fourth Quarter Project Progress and Financial Update
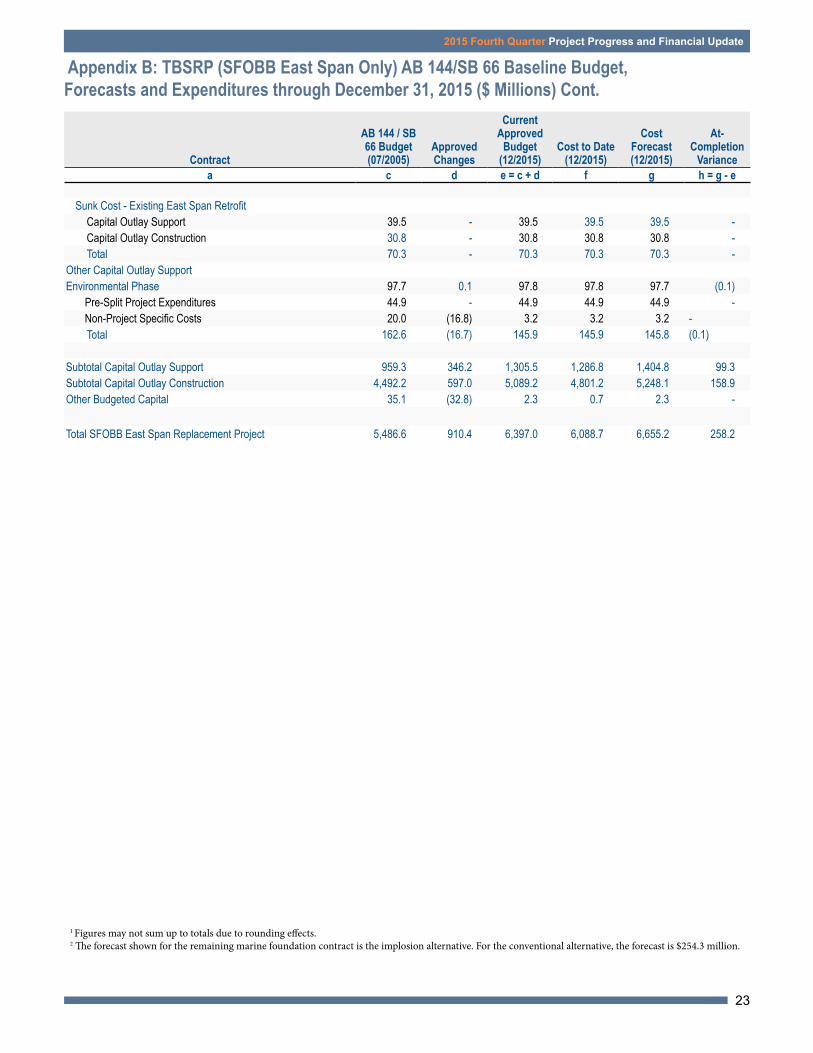
1 Figures may not sum up to totals due to rounding effects.2 The forecast shown for the remaining marine foundation contract is the implosion alternative. For the conventional alternative, the forecast is $254.3 million.
Appendix B: TBSRP (SFOBB East Span Only) AB 144/SB 66 Baseline Budget, Forecasts and Expenditures through December 31, 2015 ($ Millions) Cont.
Contract
AB 144 / SB66 Budget(07/2005)
ApprovedChanges
Current Approved
Budget(12/2015)
Cost to Date(12/2015)
Cost Forecast(12/2015)
At-Completion
Variancea c d e = c + d f g h = g - e
Sunk Cost - Existing East Span RetrofitCapital Outlay Support 39.5 - 39.5 39.5 39.5 - Capital Outlay Construction 30.8 - 30.8 30.8 30.8 - Total 70.3 - 70.3 70.3 70.3 -
Other Capital Outlay SupportEnvironmental Phase 97.7 0.1 97.8 97.8 97.7 (0.1)
Pre-Split Project Expenditures 44.9 - 44.9 44.9 44.9 - Non-Project Specific Costs 20.0 (16.8) 3.2 3.2 3.2 - Total 162.6 (16.7) 145.9 145.9 145.8 (0.1)
Subtotal Capital Outlay Support 959.3 346.2 1,305.5 1,286.8 1,404.8 99.3 Subtotal Capital Outlay Construction 4,492.2 597.0 5,089.2 4,801.2 5,248.1 158.9 Other Budgeted Capital 35.1 (32.8) 2.3 0.7 2.3 -
Total SFOBB East Span Replacement Project 5,486.6 910.4 6,397.0 6,088.7 6,655.2 258.2
24
Toll Bridge Program Oversight Committee
Proj
ect P
hoto
sSelf-Anchored Suspension Bridge (SAS)
Demolition Workers on a Section of the East Spanof the Former Oakland-San Francisco Bay Bridge
25
2015 Fourth Quarter Project Progress and Financial Update
Yerba Buena Island Transition Structure (YBITS)
26
Toll Bridge Program Oversight Committee
Oakland Touchdown Detour Progress
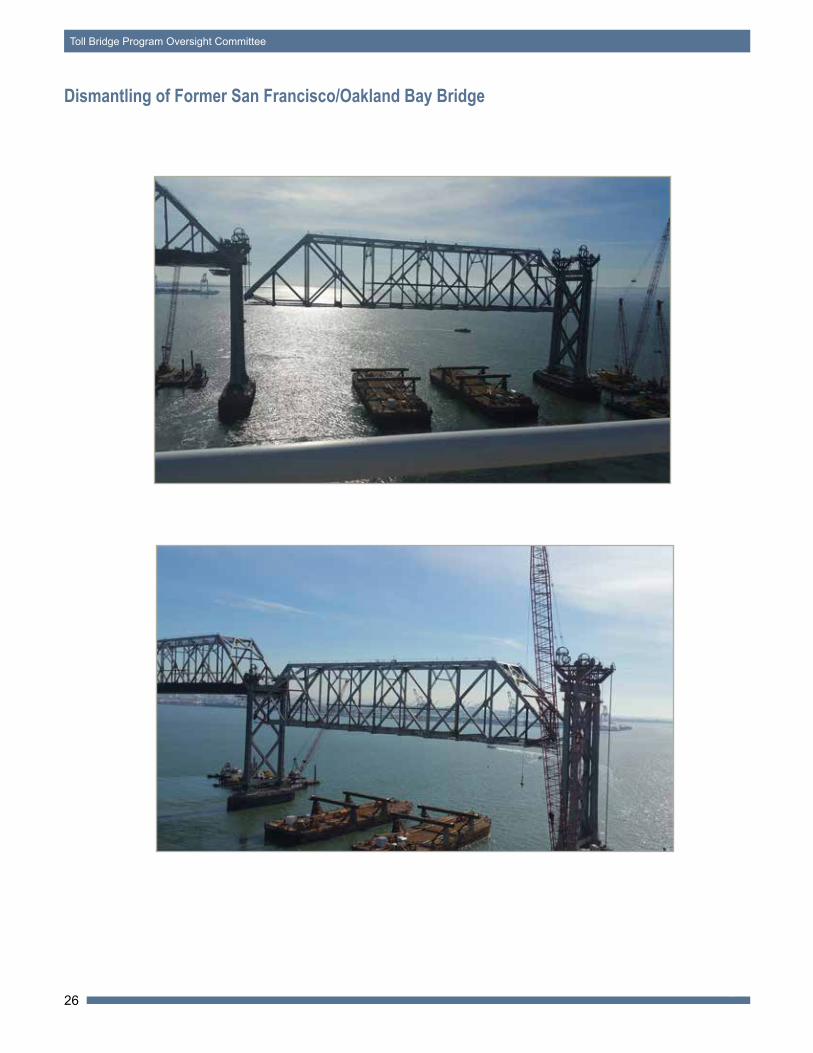
Dismantling of Former San Francisco/Oakland Bay Bridge
27
2015 Fourth Quarter Project Progress and Financial Update
Appendix: Glossary of Terms
Bay Area Management ConsultantsAn Association of URS Corporation and Hatch Mott MacDonald
Glossary of TermsAB 144/SB 66 BUDGET: The planned allocation of resources for the Toll Bridge Seismic Retrofit Program, or subordinate projects or contracts, as provided in Assembly Bill 144 and Senate Bill 66, signed into law by Governor Schwarzenegger on July 18, 2005, and September 29, 2005, respectively.
AB 144/SB 66 PROJECT COMPLETE BASELINE: The planned completion date for the Toll Bridge Seismic Retrofit Program or subordinate projects or contracts.
APPROVED CHANGES: For cost, changes to the AB 144/SB 66 Budget or BATA Budget as approved by the Bay Area Toll Authority Commission. For schedule, changes to the AB 144/SB 66 Project Complete Baseline approved by the Toll Bridge Program Oversight Committee, or changes to the BATA Project Complete Baseline approved by the Bay Area Toll Authority Commission.
AT COMPLETION VARIANCE or VARIANCE (cost): The mathematical difference between the Cost Forecast and the Current Approved Budget.
BATA BUDGET: The planned allocation of resources for the Regional Measure 1 Program, or subordinate projects or contracts as authorized by the Bay Area Toll Authority as of June 2005.
BATA PROJECT COMPLETE BASELINE: The planned completion date for the Regional Measure 1 Program or subordinate projects or contracts.
COST FORECAST: The current forecast of all of the costs that are projected to be expended so as to complete the given scope of the program, project, or contract.
COST TO DATE: The actual expenditures incurred by the program, project or contract as of the month and year shown.
CURRENT APPROVED BUDGET: The sum of the AB 144/SB 66 Budget or BATA Budget and Approved Changes.
HINGE PIPE BEAMS: Pipes between roadway sections designed to move within their sleeves during expansion or contraction of the decks during minor events, such as changes in temperature. The beams are designed to absorb the energy of an earthquake by deforming in their middle or “fuse” section. Hinge pipe beams are also found at the western piers where the SAS connects to the YBITS (Hinge “K” pipe beams).
PROJECT COMPLETE CURRENT APPROVED SCHEDULE: The sum of the AB 144/SB 66 Project Complete Baseline or BATA Project Complete Baseline and Approved Changes.
PROJECT COMPLETE SCHEDULE FORECAST: The current projected date for the completion of the program, project, or contract.
SCHEDULE VARIANCE or VARIANCE (schedule): The mathematical difference expressed in months between the Project Complete Schedule Forecast and the Project Complete Current Approved Schedule.
% COMPLETE: % Complete is based on an evaluation of progress on the project, expenditures to date, and schedule.