methods of oabservation at sea - wmo library - world
TRANSCRIPT

WORLD METEOROLOGICAL ORGANIZATION
TECHNICAL NOTE No. 2
METHODS OF OABSERVATION AT SEA
PART I – SEA SURFACE TEMPERATURE
WMO-No. 26. TP. 8
Secretariat of the World Meteorological Organization – Geneva – Switzerland
WORLD METEOROLOGICAL ORGANIZATION
TECHNICAL NOTE No. 19
OBSERVATIONAL
CHARACTERISTICS OF THE JET STREAM
A Survey of the Literature(Report prepared by a working group of the Commission for Aerology)
WMO-No. 71. TP. 27
Secretariat of the World Meteorological Organization – Geneva – Switzerland
WMO TECHNICAL NOTES
A new series of WiVIO Publications to include a selection of papers prepared forWMO meetings and reports by the WMO Secretariat.
Price
No. 1 Artificial i.nducement of precipitation (out of print)
No. 2 Methods of observation at seaPart I: Sea surface temperature. . . . . . . . . . .Part II: Air teluperature and. humidity, atmospheric pres
sure, cloud height, -wind, rainfall and visibility.
No. 3 Meteorological aspects of aircraft icing
No. 4 Energy from the wiml. . . . . . . .
Sw. Fr. 1.-
Sw. Fr. 1.~
Sw. Fr. 1.-
Sw. Fr. 1.
Sw. Fr. 10.-
No. 5 Diverses expeTiences de comparaison de radiosondes. Dr. L.M. Malet ., .
and
No. 6 Diagl'ammcs aerologiqucs. Dr. P. Defrise
) S•. ,., 1.-
No. 7 Reduction of atlnosphCTic pressure (Preliminary report onproblems involved) . . . . . . . . . . . . . . . . . Sw. Fr. 3.-
Sw. Fr. 1.-
8 Atmospheric radiation (Currentblems). Dr. W. L. Godson . . .
and
No.i~~es~i~at~o~cs. a~d. p.ro: IJ
No. 9 Tropical ci.l'culation patterns. Dr. H. Flohn
No. 10 The forecasting from weather data of potato bligbt andother plant diseases and pests. P. lVI. Austin Bourke.
and
No. 11 The standardization of the measurement of evaporationas a cliJnatic factor. G. W. Robertson
Sw. Fr. 2.~
No. 12 Atmospherics techniques. Sw. Fr. 3.-
No. 13 A-rtificial control of clouds and hydTometeors. L. Dufour·Ferguson Hall· F.H. Ludlam, Chairman· E.J. Smith. Sw. Fr. 3.-
No. 15 The relative accuracy of rawins and contour-measuredwinds in relation to pCl'fol'lnance criteria. W. L. Godson
No. 16 Supcradiabatic lapse rate in the upper air. W. L. Godson.
No. 17 Notes on the problems of cargo ventilation. \V.F. lYlcDonald
No.18 Aviation aspects of luountain ·waves. ill. A. Alaka ... Sw. Fr. 7.-
No. 14 I-r~mogeneite du Tcseau europeen]. Lugeon ~ P. Ackermann.
de radiosondages.
1,."
Sw. Fr.
4.-
3.-
WORLD METEOROLOGICAL ORGANIZATION
TECHNICAL NOTE No. 19
OBSERVATIONALCHARACTERISTICS OF THE JET STREAM
A Survey of the Literature
Report of a working group of the Commission for Aerology prepared by
R. BERGGREN - W. J. GIBBS - C.W. NEWTON, Chairman
PRICE: Sw. fro 9.-
I WlVIO· No. 71. TP. 27 ISecretariat of the World l\rleteorological Organization .. Geneva .. Switzerland
1958

OBSERVATIONAL CHARACTERISTICS OF THE JET STREAM
TABLE OF CONTENTS
Foreword
Summary (French,
1. Introduction
Russian, Spanish)
1
2. General character of wind and temperature fields ..... 3
3. Mean circulationTreatment ofAvailabilityThe existing
and climatology of the jet streams 4data...... 5of data 0.................................................... 6knowledge 6
4. Relation of jet stream to synoptic systems.......... . 11Extratropical jet streams; large scale features .: 12Smaller-scale features; relation to cyclones and
surface frontal systems 13Relation of jet streams to deep tropospheric frontal layers 15
5. Horizontal profiles through the jet stream I wind shear andvorticity distribution ... 17
Profiles from aerological analyses 17Magnitudes of shear and vorticity 18Multiple jets......... 19Jet-stream profiles from aircraft reconnaissance............. . 20Wind shear and vorticity values revealed by aircraft flights 23
............. 2628
6. Variation of wind in the verticaL........ . .Relation between jet axis and tropopause height . .Character of vertical wind profile .Low tropospheric and high stratospheric wind maxima .Details in the vertical wind profile; accuracy of wind
soundings..... . .Maximum observed wind speeds . .
..24. 24
2426
7. Clear air turbulence and the jet stream . 28
9. Navigational aspects of the jet stream .
IV
8. Clouds and the jet stream
TABLE OF OONTENTS
Page
.................................. 33
36
Figures .
Bibliography .
. 41
. .. 63
FOREWORD
At its fifth session, the Executive Committee of the World Meteorolo
gical Organization approved a recommendation by the first session of the Com
mission for Aeronautical Meteorology of WMO, held simultaneously with the
fourth session of the Meteorology Division of the International Civil Avia
tion Organization (Montreal, 1954), that a descriptive survey of existing
literature on the jet stream should be issued by WMO.
In implementation of the above recommendation, the President of the
WMO Commission for Aerology established, with the approval of his commission,
a working group to prepare the requested survey. At its second session (Paris,
1957), the Commission for Aerology noted with satisfaction a first draft of
the report and recommended early publication of the report by WMO. This re
commendation was endorsed by the ninth session of the Executive Committee.
The final report of the working group is .reproduced in the present Technical
Note.
I take this opportunity of expressing deep appreciation to the members
of the working group for the time and effort which they have devoted in the
preparation of this report.
(D.A. Davies)Secretary-General
CARACTERISTIQUES DU JET STREAM REVELEES PAR L'OBSERVATION
Le present rapport a pour but de resumer les principales caracteristiques connues du jet stream, telles que nous les revelent l'observation directeet l'analyse aerologique. II n'entre pas dans Ie cadre de ce rapport d'examiner les theories relatives a la formation du jet stream au les hypotheses rapprochant les caracteristiques du jet stream du developpement de systemes meteorologiques. Une longue bibliographie enumere toutefois des ouvrages quitraitent de ces questions.
La premiere et la deuxieme sections portent sur des definitions, unbref resume historique et les caracteristiques generales des champs du ventet de la temperature au voisinage du jet stream, telles qu'elles ressortentdes analyses aerologiques.
Dans la troisieme section, un examen des problemes relatifs aux donnees et aux analyses est suivi d'un resume general des connaissances actuellessur la distribution des jet streams a llechelle planetaire. Les jets d'estd'une vitesse atteignant jusqu'a 100 noeuds se trouvent dans les regions equatoriales au-des sus du niveau de 200 mb. Les jet streams sUbtropicaux d'ouestse situent pres de 200 mb dans les deux hemispheres, avec des vitesses typiques de 100 a 200 noeuds pres des latitudes de 300 N et S. Ces jet streams ontune grande stabilite surtout en hiver; en ete, ils se dirigent vers Ie poleet s'attenuent (il devient difficile de les identifier dans l'hemisphere norden ete). Pres de 300 mb, entre les latitudes de 40° et 60°, se trouvent desjet streams associes a la zone du front polaire; leur position est tres variable et ils n'apparaissent pas distinctement sur les cartes des valeursmoyennes. Dans l'hemisphere nord, les vents moyens d'hiver les plus fortssont situes aux endroits au les thalwegs, dans les vents d'ouest des latitudes moyennes, penetrent dans les latitudes du jet stream sUbtropical, ces endroits se trouvant pres des cotes orientales de l'Asie et de l'Amerique duNord et au-dessus du Moyen-Orient. C'est dans les regions subpolaires que setrouvent les jets stratospheriques ayant leurs plus fortes vitesses a 30 kmau a des niveaux plus eleves; ce sont de forts vents drouest en hiver qui deviennent des vents d'est moderes en ete.
La quatrieme section resume les relations existant entre les jetstreams et les systemes synoptiques. Les jets sUbtropicaux, aux latitudes deshautes press ions sUbtropicales, ne sont pas lies a des systemes frontaux. Lescyclones frontaux des latitudes moyennes sont lies aux jets du front polaired'une fagon generale, et l'on trouve dans Ie jet stream des andes et des variations longitudinales de la vitesse qui sont purement liees a des systemesmigratoires en surface. Le jet du front polaire est toutefois frequemment caracterise par des ruptures,et dans certains cas ses relations avec les fronts
RESUME VII
en surface sont tres complexes. Les fronts marques sletendant jusqu'au niveaude la tropopause ont toujours des jet streams qui leur sont associes (tendanta se trouver au-des sus du front polaire, situe au niveau de 500 mb), mais desfronts facilement identifiables sont souvent absents pres des jet streams.
La cinquieme section resume les connaissances sur la variation horizontale du vent. Les analyses aerologiques et certaines mesures effectuees abord d'aeronefs confirment Ie fait que sur la face anticyclonique du jetstream Ie gradient horizontal est limite par ill condition que la rotationnelleabsolue ne devienne pas inferieure a zero. Pour un courant rectiligne aux latitudes moyennes, cela signifie que Ie gradient anticyclonique ne depasse pasune valeur voisine de 10 m/sec sur 100 km, correspondant a la valeur du parametre de Coriolis, mais qu1il s'en approche frequemment. Sur la face cyclonique, des gradients d'une valeur double ou triple sont courants et l'on a parfois observe des gradients cinq ou six fois plus grands. On estime que lespreuves de variations marquees a une petite echelle, basees sur des donneesobtenues au cours de vols de reconnaissance, ne sont pas assez determinantes;les ecarts d'une distribution "reguliere" de la vitesse paraissent atteindreun maximum vers 10 noeuds. Des jet streams multiples, chacun ayant une largeur caracteristique d'environ 500 km, peuvent toutefois se trouver tres presles uns des autres.
La sixieme section a trait a la variation du vent dans la verticale.En moyenne, les vents les plus forts ont tendance a se trouver a environ 1 kmau-dessous du niveau de la tropopause; cette relation n'est pas claire toutpres de l'axe du jet stream qui est generalement situe dans la zone d'une"rupture" entre des systemes de tropopause. Des etudes statistiques montrentqu'en moyenne Ie gradient vertical aux latitudes moyennes a tendance a peuvarier avec l'altitude et la vitesse du vent diminue jusqu'a la moitie environ de sa valeur maximum aux niveaux situes a 5 km de part et d'autre du niveau du vent maximum. A travers des fronts distincts, Ie gradient verticalest souvent de 15 a 20 m/sec par km. Dans Ie jet stream subtropical, les fortsvents peuvent ne se trouver que dans une couche peu epaisse de 100 mb de partet d'autre du niveau du vent maximum. Les problemes de la mesure du vent sontexamines dans cette section ou il est dit, en conclusion, que de tres grandeset irregulieres variations de la vitesse du vent dans la verticale sont souvent fictives.
La septieme section du rapport resume les connaissances sur la turbulence en air clair. Cette turbulence est observee presque entierement sur laface cyclonique du jet stream et elle est couramment observee avec une stabilite verticale marquee. Certains indices laissent entendre que l'intensite dela turbulence dans une situation donnee varie avec la direction de vol d'unaeronef.
naont
des niveauxffieme sectionrapport avec
types de nuagesdu jet stream. Latypes de nuages, en
La huitieme section examine certainset eleves qui sont caracteristiques
des resultats d1etudes statistiques deemplacements autour du jet stream.
La neuvieme section donne un bref resume des methodes pratiques devigation aeronautique tirant profit du jet stream. Les previsions du vent
moyenstraitedivers
VIII RESUME
ete utilisees efficacement, notamment par les aeronefs qui utilisent les techniques d'observation de la temperature pendant Ie vol, dans les regions oules jet streams sont generalement associes a des fronts polaires.
Le rapport se termine par une bibliographie de plusieurs centainesd'ouvrages, traitant directement ou indirectement du jet stream.
HAB~~AEMNE XAPAKTEPMCTMEH CTPYWHOrO TE~HMa
B HaCTO~em CTaTbe ~enaeTCH rrOITbTIKa CYMMHpOBaTb OCHOBBbleHSBeCTHble XapaKTepHCTHKH CTpyllHOrO Te~eHHH B TaKOm CTerreHH, BKaKOm 3TO rrOSBonHIDT HerrOCpe~CTBeHHble Haonm~eHHH H a3po~orH~eCKHm
aHanHs.GTaTbH, O~HaKO, He ~enaeT HHKaKliX llOITbITOK HH ooc~aTb
TeopHH oopaSOBaHHH CTpyllHbrr Te~eHHm HH CTpOHTb KaKHe-~Hoo rlillOTeSN OTHOCHTe~bHO BnHHHHH cTpymHbrr Te~eHHm Ha paSBHTHe YC~OBHm llOrO~I.B 3Tom CTaTbe, TeM He MeHee, ~aeTCH llO~POOHaH oTIo~OrpaWHH.
BKITID~aro~aH paoOThl H llO 3THM BOrrpOCaM.
B rrepBOM H BTOpOM pas~enax rrpliBO~HTCH orrpe~e~eHHR, KpaTKHmHCTopH~eCKHm OOSop, a Ta~e oo~e CBe~eHHH 0 BeTpOBhrr H TeMllepaTypHbrr rronRX B Herrocpe~CTBeHHom O~SOCTH OT CTpyllHOrO Te~eHTIH,
KaK 3TO nOKaShrnaeT a3ponorH~eCKHm aHanTIS.
TpeTHm pas~e~ paCCMaTpliBaeT rrpooneMy rro~~eHHH ~aHHhrr H npoo~eMY npOTISBO~CTBa aHanHsa, sa KOTOphWH cne~yeT oo~m OOSop HMeID~XCH CBe~eHHM 0 n~aHeTapHOM pacnpe~eneHTITI CTpyllHhrr Te~eHTIm. BocTO~Hhle CTpyllHhle Te~eHHR co CKOpOCTHMH ~o 100 ysnoB BCTpe~aroTcH B3KBaTOpHaITbHhrr pamoHax Ha ypOBHe Bhme 200 Mo.3arr~Hhle cyoTponH~ec
Klie CTpyllHble Te~eHTIH, BCTpe~aro~ecH B OOOHX rronymapTIRX BO~SH 200MO. ypOBHH H He~aITeKO OT 30
0ceBepHom H ~Hom illllpOT HMeIDT xapaR
TepHNe CKOpOCTH 100-200 ysnoB. 3TH Te~eHHH OTnTI~aroTcH oO~bmom YC-TOM~TIBOCTbID ocooeHHO B SHMHee BpeMH, a neTOM - CBOHM C~BTIrOM BHanpaBneHliH rronmca H ocnaOneHTIeM ( neTOM liX CTaHOBHTCH TPY~HO 00Hap~Tb B ceBepHOM llo~ymaplili ). BonHsli 30 MO. rrOBepXHOCTH Me~y
illHpOTaMTI 400 TI 600
oOHap~liBaroTcR CTpyllHhle Te~eHHH, CBHsaHHhle CnOnRpHOM WPOHTaITbHOm sOHom H, KOTopNe o~eHb ~aCTO MeHHIDT CBoe rrono~eHHe li He MoryT ONTb HCHO HaHeceBbI Ha KapTN Cpe~HTIX SHa~eHliM.
GaMble CHnbHNe cpe~HHe 3HMHHe BeTpN B ceBepHOM llonymaplili Haonm~~
IDTCH TaM, r~e BeTpN sarr~Horo rrOHca B cpe~HeM illllpOTe, OTKnOHHHCbrrpoHliKaroT B illllpOTN CYOTpOITli~eCKOro CTpyllHOrO Te~eHliH. TaKliMli MecTaMli HB~HIDTCH BOCTO~Hoe nooepe~be ASHli H CeBepHom AMepliKH,a TaR~e Gpe~Hlim BocTOK. GTpyllHhle Te~eHliH cTpaTocwepN C Halioo~ee ClinbHhWH BeTpaMH Ha BNCOTe 30 KM. li Bhme Haonm~aroTcH B cyorronHpHhrrpamoHax li BapbHpyroTCH OT CHnbHhrr sarr~Hhrr SHMOM ~o cpe~HflX BOC TO~Hhrr ~eTOM.
~eTBepTNm pas~e~ cYMMllPyeT ~aHHhle OTHOCHTenbHO CBHSli cTpymHhrr Te~eHliM C CliHorrTli~eCKHMli CliCTeMaMH. GyoTporrfl~ecKHe cTpyllHhleTe~eHliH B illHpOTax cyoTporrH~ecKlix BNCOT He CBRsaHhI C CflCTeMaMliWpOHTOB. illpOHTanbHhle ilMKnOHhI cpe~HHx illHpOT, B oo~eM, CBHsaHbI C
x
OB30PHA.H OTATJO.H
Te~eHMHMli nO~HPHOrO wpOHTa, a BO~RbI M Eo~eoaHMH B OKOpOOTM no illMpOTe Hao~~aroToH B OTpyTIHOM Te~eHlill, KOTopoe B~MHeT Ha nepeMe~e
HMe OMOTeM y nOBepXHOOTM. OTpyTIHNe Te~eHMH nO~HpHoro wpOHTa, O~Ha
KO, 'IaOTO XapaKTepMSyIDTOH nepephIDaMM JZI B HeKOTophIX o~~aHX MXOBHSh 0 WPOHTaMM y nOBepXHOOTM ~OBO~hHO O~O~HaH. Bwp~eHHNe WpOHThI,paonpOOTpaBHID~eOH Bn~OTh ~O ypOBHH TpononayshI Boer~a OBH3aHhI 00OTPyTIHhIMM Te~eHMHMJZI (JlIMeIOT TeH~eHU;= HaxO~MThOH Ha,n; 500 MO. ypOBHeM, r~e paono~araeTOH nO~HpHhrn WpOHT), XOTH ~eTKO On03HaBaeMhleWPOHThI ~aOTO OTOyTOTByIDT BO~M3M OTpyMHhIT Te~eHMM.
B nHTOM pa3~e~e ,n;aroTOH OBe,n;eHMH 0 ropMSOHT~hHhIT nepeMe~eHll
HX BeTpa. AspO~Orli'IeCKMM aH~M3 M HeKOTophIe CaMO~eTHhle Hao~~eHliH
nO~TBep~aroT TOT WaKT, ~TO Ha aHTliU;JZI~OH~hHOM OTopOHe OTpYflHoroTe~eHliH ropliSOHT~hHhrn rpa,n;MeHT O~paHJZI'IeH TeM OOOTOHTe~hOTBOM,
~TO aOOO~THhrn BliXpb He npliHMMaeT OTpliu;aTe~hHoro SHa~eHliH. ~~H
npHMoro Te'IeHMH B cpe,n;HMX illMpOTax STO OSHa'IaeT, 'ITO aHTliU;MK~OH~h
Hhrn rpa,n;lieHT He npeBhmaeT, XOTH ~aOTO npMO~MxaeTOH K SHa~eH= 10M/oeK. Ha 100 EM., OOOTBeToTByH 3Ha~eH= KOPMo~MooBa napaMeTpa.Ha U;li~oHa~hHoM oTopoHe rpa,n;MeHThI npeBhmaro~e STO 3Ha'IeHMe B ,n;Bali~ TpM pa3a OOBepmeHHO OOh~HhI li liHor,n;a ~~e Hao~,n;aroTOH c~~aM,
Eor,n;a rpa,n;MeHThI npeBhIillaroT ero B 5 M~M 6 pas. ~oKasaTe~boTBa TaKliXM~oMaOmTaORb~ oT~oHeHMfl, OCHOBaHHhle Ha Hao~,n;eHliHX aBMapaSBe,n;KMO~MTaroTOH He~oOTaTO~HhIMli; OT~OHeHMH OT "r~a,n;Koro" npoWli~H OKOpOCTM B HaliOO~hillMX OBOliX SHa~eHMHX OOOTaB~HIDT OKO~O 10 YS~OB. OOCTaBHhle CTpyTIHhle Te~eHMH, E~,ZJ;hrn liS KOToporo MMeeT XapaKTepHyID =PliHY500 EM. M~ OKO~O MOrYT, o,n;HaEo, Hao~,n;aThoH B Henoope,n;oTBeHHoflO~300TM O,n;HO OT ,n;pyroro.
B meoTOM pa3,n;e~e paocMaTpliBaeToH Bonpoo nep8Me~eHMH BeTpa noBepTMK~. B ope,n;HeM HaMOO~ee OM~hHhle BeTphI Hao~~aIOTcH Ha paocToHHMM nplio~sliTe~hHo 1 EM. H~e ypOBHH TpononayshI; STa OBH3h HenoHHTHa BO~3M OOM OTpyMHoro Te-qeHMH, KOTopaH MMeeT Te~eHU;= ~e~aTb
B paflOHe "pasphIDa" Me~y OMOTeMaMM Tpononays. CTaTJlLOTli'IeCElie llSY~eHJlLH nOKaShIDaIOT, ~TO B ope,n;HeM BepTMK~hHhrn rpa,n;MeHT B ope~HMX
=pOTax MMeeT TeH~eHU;= HeSHa~MTe~hHO MSMeHHThOH C BhICOTOM JIL, ~TO
B ope~HeM OKOpOCTh BeTpa na,n;aeT npMO~SMTe~hHO HanO~OBMHY OT MaROMM~hHoro SHa~eHJlLH Ha ypOBHHX 5 EM. Bhme M HJIL~e ypOBHH MaKOJlIMa~h
Horo BeTpa. B OT~eT~MBhIX WpOHTax BepTJlLK~hRblfl rpa,n;MeHT ~aOTO OhIBaeT OT 15 ,n;o 20 M/oeK. Ha Kli~oMeTp. B oyoTponM~eoEoM CTPyTIHOM Te~eHJlLM CJIL~bHhle B eTphI MorYT saE~~aThOH B ySEOM o~oe 100 MO. Bhme liHli~e ypOBHH MaECMMa~hHoro BeTpa. B STOM pas,n;e~e paOCMaTpJILBaIOTOHTaEXe npOO~eMhI MSMepeHJlLH BeTpa; ,n;e~aIOTCH BhIDO,ZJ;hI, ~TO o~eHh OO~billMe
M HeperY~HpHhle nepeMe~eHMH OKOpOOTM BeTpa no BepTJlLK~JIL ~aOTO OhI-B aIOT WMETI'IB HhIMM.
XI
OE30PHAR CTAT~R
Ce~~MOll pa3~e~ OyMMlipyeT OBe~eHlia OTHOOliTe~~HO Typoy~eHTHoO
Tli B OBOOO~HOll aTMOO~epe. TaEaa Typoy~eHTHoOT~ OOhflHO HaO~~aeTOa
Ha ~liK~OHli~eOKOM ~~aHre OTpyllHOrO Te~eHlia li 0 ~eTKO Bh~~eHHOll
BepTliK~~HOll OTaOli~~HoOT~ro. MMeeTOa OBli~eTe~~OTBO TOrO, ~TO liHTeHOliBHOOT~ Typoy~eHTHoOTli rrpli ~aHHOll oliTya~lili li3MeHHeTOa 0 HarrpaH~eHlieM nO~eTa OaMO~eTa.
B BOO~MOM pa3~e~e paOOMaTpliBaroToa HeKOTOpHe XapaETepHHe B~l
OO~aKOB Ope~HerO li BepXHerO apyOOB, Tlinli~HHX ~~a OTpyllHOrO Te~e
HliH. 3~eo~ ~e paOOMaTpliBaroTOH pe3Y~~TaTH OTaTliOTli~eOKliX li3~eHlill
BH~OB OO~aEOB OTHOOliTe~~HO paS~~HhN nO~O~eHlill BOKpyr OTpyllHOrOTe~eHlia.
B ~eBaTOM pa3~e~e ~aeTOa KpaTKOe pe3IDMe rrpaKTli~eOKliX MeTO~OB
BOS~ymHOll HaBlira~lili npli liOrrO~~30BaHlili OTpyllHOrO Te~eHlia. 3~~eKTliB
Hoe liorrO~~30BaHlie nporHOSOB 0 BeTpe rrpOliSBO~H~OO~, B ~aOTHOOTli,
OaMO~eTaMli, npliMeHaro~li TeXHliKY Hao~~eHlia sa TeMrrepaTypOll BOBpeMa no~eTa B Tex palloHax, r~e OTpyllHhle Te~eHlia OO~HO OBaSaHhIo rrO~apHhThrn ~POHTaMli.
EliO~liorp~li~eOKlill orrliOOK, Hao~liThrnaro~ll HeOKO~~KO OOT paOOTHerroope~OTBeHHO li~ KOOBeHHO saTparliBaro~x rrpoo~eMY OTpyllHhN Te~eHlill, rrpli~araeToa K OaMOMy ~OK~~Y.
, ~.
CARACTERISTICAS OBSERVADAS DE LAS CORRIENTES DE CHORRO
Resumen
El objeto de este trabajo es presentar un resumen de las principalescaracteristlcas conocidas de las corrientes de chorro, tal como se ponen de
'manifiesto por la observaci6n directa y aparecen en los an~lisis aero16gicos.En,el no se intenta disentir las teorfas sobre la formaci6n de corrientes deohorro, ni las hip6tesis sobre las relaciones entre las caracterfsticas delas corrientes de chorro y la formaci6n y desarrollo de situaciones meteorol6gicas. Sin 'embargo, la bibliograffa que completa la publicaci6n contienereferenciasa trabajos que tratan de estas materias.
En las dos primeras secciones se dan las definiciones y un breve resumen hist6rico asf c,omo las c,aracterfsticas generales de los campos de vientoy temperatura en las proximidades de las corrientes de chorro puestas de mani
'fiesto en los an~lisis aero16gicos.
Despues de examinar los problemas relativos a los datos de observaci6ny a los metodos de an~lisis, en la tercera secci6n se da un resumen generalde los conocimientos actuales sobre la distribuci6n global de las corrientesde ohorro. En las regiones ecuatoriales se forman corrientes de chorro delEste, con velocidades de hasta unos 100 nudos, por encima del nivel de 200 mb.En las regiones subtropicales de los dos hemisferios se encuentran corrientesde chorro del Oeste en la proximidad del nivel de 200 mb, con velocidades tfpicas de 100 a 200 nudos, alrededor de 30° Norte y Sur. Estas corrientes sonmuy estacionarias, sobre todo en invierno, desvi~ndose hacia el polo y debilit~ndose en verano (en esta epoca del ano es muy diffcil identificarlas en elhemisferio Norte). Entre los 40° y 60° de latitud, y hacia el nivel de 300 mb,hay corrientes de chorro asociadas con la zona del frente polar, que son muyvariables en posici6n y no aparecen claramente en los mapas de valores medios.Los vientos medios m~s fuertes se presentan, en el hemisferio Norte, en lossitios en donde los collados de presi6n de la circulaci6n del Oeste en las latitudes medias penetran en la zona de las corrientes de chorro subtropicales;esos lugares se hallan en las proximidades de las costas orientales de Asia yde America del Norte y sobre el Oriente Medio. En las zonas subpolares se encuentran corrientes de chorro estratosfericas, con vientos m~ximos a alturasde 30 km y m~s, los cuales varian de fuertes corrientes del Oeste en inviernoa corrientes moderadas del Este en verano.
La cuarta secci6n contiene un resumen de los conocimientos sobre lasrelaciones, las corrientes de ohorro y las situaciones sin6pticas. En el cintur6n subtropical de altas presiones las corrientes de chorro no aparecen relacionadas a sistemas frontales. De una manera general, las depresiones frontales de las latitudes medias est~n relacionadas can las corrientes de chorrodel frente polar, y se han encontrado en estas corrientes ondulaciones y
RESUMEN XIII
variaciones longitudinales de velocidad asociadas con sist,emas superficialesmigratorios. Las corrientes de chorro del frente polar presentan frecuentementediscontinuidades, y en ciertos casos su relaci6n con los frentes en superficiees muy compleja. Los frentes muy marcados y que alcanzan hasta el nivel de latropopausa van siempre acompafiados de corrientes de chorro (generalmente situado's por encima del nivel de 500 mb en la zona del frente polar) perc no es frecuente que en las proximidades de las corrientes de chorro existan frentes f~
cilmente identificables.
La quinta secci6n contiene un resumen de los conocimientos sobre la variaci6n horizontal del viento. Los an~lisis aero16gicos y ciertas medidas efectuadas desde avi6n han puesto de manifiesto que en la parte anticic16nica delas corrientes de chorro el gradiente del campo de viento est~ limitado por lacondici6n que la vorticidad absoluta no puede ser menor que cero. En el casode corrientes rectilfneas, en las latitudes medias, esta condici6n significaque el gradiente anticic16nico no excede, perc frecuentemente se aproxima, deun valor del orden de 10 m/sec en 100 km, que corresponde al valor del parametro de Coriolfs. En la parte cic16nica, gradientes dobles 0 triples que esevalor son frecuentes, y a veces se han observado gradientes cinco 0 seis vecesmayores. Se consideran como poco concluyentes las pruebas de variaciones marcadas en pequefia escala, basadas en observaciones efectuadas durante vuelos dereconocimiento; las desviaciones de un "perfil regular" del campo de velocidades parecen ser como m~ximo de unos 10 nudos. Sin embargo, es posible encontrar, muy cerca una de otra, corrientes de chorro mGltiples, cada una con suancho caracterfstico de 500 km.
La secci6n sexta est~ dedicada a la variaci6n vertical del viento. Generalmente, los vientos m~s fuertes se encuentran aproximadamente a 1 km por debajo de la tropopausa; esta relaci6n no es muy clara cerca del eje de la Corriente de chorro, que tiende a situarse en una "ruptura tt entre tropopausas.Los estudios estadfsticos indican que, en promedio, el gradiente vertical, enlas latitudes medias, varia poco con la altura y que, en promedio tambien, lavelocidad disminuye casi a la mitad del m~ximo, a niveles 5 km por encima ypor debajo del nivel de viento m~ximo. A traves de frentes bien definidos, e1gradiente vertical es con frecuencia de 15 a 20 m/sec. por ki16metro. En lascorrientes de chorro subtropicales los vientos muy fuertes pueden quedar comprendidos en un estrato poco espeso, unos 100 mb por encima y por debajo delnivel de viento m~ximo. En esta secci6n se trata tambien de los problemas quepresenta la medida del viento, y se concluye que en muchos casos las variaciones muy grandes e irregulares de la velocidad del viento son ficticias.
En la septima secci6n se resumen los conocimientos sobre turbulenciaen aire despejado. Este tipo de turbulencia se observa casi exclusivamenteen el lado cic16nico de las corrientes de chorro, y muy frecuentemente cuandoexiste una estabilidad vertical muy marcada. Ciertas indicaciones hacen pensar que la intensidad de la turbulenciaen una misma situaci6n varia con ladirecci6n de vuelo del avi6n que la experimenta.
Ciertos tipos caracterfsticos de nubes medias y altas asociadas a Corrientes de chorro constituyen el tema de la octava secci6n, en la cual se examinan los resultados de estudios estadfsticos de los tipos de nubes en relaci6n
XIV RESUMEN
con las diversas zonas que se distinguen en los alrededores de las corrientesde chorro.
La novenay ~ltima secci6n contiene un breve resumen de los metodospr~cticos de navegaci6n aerea para sacar ventaja de las corrientes de chorro.En las regiones en que estas corrientes est~n generalmente asociadas con frentes polares, se han utilizado con buenos resultados las previsiones de viento,sobre todo para aviones que utilizan las tecnicas de observaci6n de la temperatura durante el vuelo.
La publicaci6n incluye, al final, una lista de varios cientos de referencias bibliogr~ficas de trabajos que tratan directa 0 indirectamente de lascorrientes de chorro.
OBSERVATIONAL CHARACTERISTICS OF THE JET STREAM
1. INTRODUCTION
According to a definition recommended by the Commission for Aerology,World Meteorological Organization, "A jet stream is a strong narrow current,concentrated along a quasi-horizontal axis in the upper troposphere or in thestratosphere, characterized by strong vertical and lateral wind shears andfeaturing one or more velocity maxima". For operational purposes, the Commission has recommended the criteria that "Normally a jet stream is thousandsof kilometres in length, hundred of kilometres in width and some kilometresin depth. The vertical shear of wind is of the order 5-10 m/sec per km andthe lateral shear is of the order 5 m/sec per 100 km. An arbitrary lowerlimit of 30 m/sec is assigned to the speed of the wind along the axis of ajet stream".*
Al though the term "j et stream" was not applied to the atmospheric phenomenon until 1947, intimations of its existence can be found in earlier literature. For example, Dines (1911) presented composite vertical cross sectionsshowing the distribution of temperature between high- and low-pressure centers, and indicated that strong localized winds must exist, with maximumspeeds generally at the 10 to 12 km level. Pilot-balloon observations inEngland (Dobson, 1920) showed winds in excess of 100 mi/hr (45 m/sec) nearthe tropopause, verifying the existence of strong winds computed from movements of cirrus clouds. The concentrated nature of the band of strong westerlies was indicated by mean cross sections shown by Bjerknes et al (1933)and by Willett (1944). --
Shaw (1904) computed the winds at the 4 km level from the Northern Hemisphere winter mean charts prepared by Teisserenc de Bart several years earlier,and concluded that "••• the distribution of pressure at the 4000 meter levelis favorable for a steady circulation of air around the polar axis, with anaverage velocity of 50 mph (20-25 m/sec)", the motion being in waves, andthat "••• in the southern hemisphere motion follows the lines of equal latitude more closely". Shaw also showed that the motion at 4 km was quite similar to the thermal wind between the earth's surface and that level.
Hesselberg (1913) and Douglas (1922), using data on cirrus movementswhich indicated upper-level winds up to 65-75 m/sec, deduced certain featuresof the wind and thermal structures of cyclones which are in rather good agreement with the results obtained by direct aerological analysis.
* The Executive Committee of the World Meteorological Organization adoptedthis definition as a provisional definition of the term "jet stream"[Res. 25 (EC-IX)] •
2 INTRODUCTION
From speculations on the thermal structure of cyclones, Goldie (1937)predicted the existence of a narrow zone of strong winds (width 500 km, speedaround 60 m/sec). From composite plots of cloud movements against distancefrom cyclone centers, Goldie (1939) found cyclonic shear of the order 25 m/secin 900 km, a modest value in light of later observations but at least suggestive of one important feature of jet-stream structure. Analyses from theearly swarm meteorograph ascents over Europe, e.g. by Bjerknes and Palmen(1937), show concentrated currents with geostrophic speeds in excess of 100m/sec. Goldie, Shaw, Brunt, and others recognized that a fast upper currentcould in some way be important for explaining the deepening of ·cyclones.
The references cited above suggest that the existence of a wind field,having the general character of the jet stream, was at least recognized in aqualitative way many years ago. Because of the sparsity of observations inthe high troposphere and stratosphere, the implications of the early deductions and observations could not be followed up in any systematic manner,until the abrupt increase in the density and quality of the world network ofaerological observations in the 1940's made possible the routine analysis ofconditions in the upper levels.
The first organized studies of the jet stream were carried out bya group,comprising investigators of several nationalities, at the University ofChicago in 1946-1947 under the leadership of Rossby and Palmen (Staff Members,University of Chicago, 1947; Rossby 1947; Palmen 1948b). It was immediatelyapparent that the jet stream, in which the major part of the kinetic energyof the hemispheric wind systems is concentrated within a small part of thetotal volume of the atmosphere, is a phenomenon of fundamental importance forunderstanding both the general circulation and the day-to-day behavior ofsynoptic disturbances. Aside from the theoretical implications, study of thejet stream has been spurred by the need for a detailed knowledge of the winddistribution in the upper troposphere and in the stratosphere, which arosewith the advent of higher-speed, higher-altitude and longer-range aircraft.
It is not surprising that a vast amount of literature connected with thejet stream has appeared in the last decade. The intention of this monographis.to present a broad summary of present knowledge on this subject. Severalsummaries have appeared earlier, the most comprehensive being that by Riehl,Alaka, Jordan and Renard (1954). For the sake of completeness, it will benecessary to repeat much of the discussion found in the other summaries. Aneffort will be made to present different illustrative material wherever possible, a consequence being that in some cases the earliest work of a givenkind may not be shown.
The present monograph will be concerned only with observational featuresof the jet stream. Theories of the jet stream, and its implications for theforecasting of weather systems, have been dealt with in extenso by Riehl et ~(1952, 1954). The bibliography of the present report includes papers ontheory and forecasting.
Because of limitations in instrumentation, or simply the incompletenessof observations, much of the data gathered on the jet stream cannot be
GENERAL CHARACTER OF WIND AND TEMPERATURE FIELDS 3
regarded as completely definitive. Thus there are inevitable differences ininterpretations of the data. Where justifiably conflicting viewpoints exist,an attempt will be made to present both sides. At the same time, the writerswill occasionally exercise the liberty of suggesting whether, in their opinions, given interpretations appear to be justified by the evidence presented.
It is quite possible that some important facts about the structure andbehavior of the jet stream will have escaped the attention of the group preparing this report. For those interested in searching the original literature,a fairly extensive bibliography has been appended.
2. GENERAL CHARACTER OF WIND AND TEMPERATURE FIELDS
Because of the intimate relation between the fields of wind and temperature, the character of the jet stream cannot be discussed without at thesame time describing the salient features of the field of temperature. Thedetails of the wind and temperature fields vary in different situations, andno single illustration can be regarded as typical for all cases. The broadfeatures shown in Figure 2.1, however, are fairly characteristic of themiddle-latitude westerlies in winter. This is a mean cross section overNorthAmerica for 0300 GCT 30 November 1947, using all soundings between longitudes65° and l35°W, the averaging being performed with respect to the axis of maximum wind. The corresponding 300 mb chart is shown in Figure 2.2, in whichthe concentration of height contours near latitude 45° is strikingly evident.
The general features shown by these figures have been discussed in detailby Staff Members, University of Chicago (1947), palmen and Collaborators(1948), Riehl (1948b), and Nyberg (1949). These are, broadly, the following:
(1) In the troposphere, a zone of strong horizontal temperature gradient,usually most pronounced in a layer sloping upward toward the cold air, separating more or less homogeneous polar and tropical air masses. The zone ofstrong baroclinity mayor may not be characterized by a distinct ir£n1 havingpronounced vertical stability. Within the barocline zone, whose width is ofthe order 500-1000 km, is concentrated a substantial part of the total poleto-equator temperature difference.
(2) In the stratosphere above the tropospheric baroc1ine zone, the horizontal temperature gradient reverses, with warmest air 500-1000 km to the left(north, in this case) and cooler air to the right, at a given level. North ofthe warm "bubble", near latitude 55° in this figure, the stratospheric temperature characteristically decreases poleward in winter, although this is notnecessarily so in summer.
(3) A relatively low and warm "polar tropopause, around 8 to 10 kmelevation, north of the frontal zone. Some distance to the south, a high cold"tropical" tropopause at 16-17 km, characteristic of tropical air in lowerlatitudes. Over and just south of the frontal zone, an "extratropical" tropopause at 10-12 km, with a characteristic upward bulge near the 200 mb level.
4 MEAN CIRCULATION AND CLIMATOLOGY OF THE JET STREAMS
(4) In the tropospheric zone of strong baroclinity, a rapid increase ofwind with height up to around the 250 to 300 mb level, and a decrease withheight above that level, where the horizontal temperature gradient reverses.Further north and south, weather vertical shear where the baroclinity is weak.In this particular example (Figure 2.2), there was a closed low near latitude55°-60°, with easterly winds to the north; this is naturally not characteristic of the typical situation in all longitudes. In an average winter situation the westerly wind increases gradually with height through the tropospherein the polar air, and in the stratosphere, north of the warm "bubble" mentioned under (2), a more pronounced increase of westerly wind with height generally occurs.
(5) The surface wind being relatively weak, the wind in the upper troposphere and lower stratosphere depends essentially upon the integrated thermal windfrom the surface upward. In accord with the thermal features discussed above,a core of strongest wind or "jet stream" is observed above the baroclinic zone,and in the vicinity of the tropopause break, having maximum strength (90 m/secin this case) at the level where there is no horizontal temperature gradient.The jet stream is flanked on the right side (Northern Hemisphere) by stronganticyclonic shear in a band perhaps 5° latitude wide, and on the left sideby more pronounced cyclonic shear in a corresponding band. On the anticyclonicflaru<, the absolute vorticity is characteristically near zero in a narrow bandin the upper troposphere (anticyclonic shear near the value of the Coriolisparameter; in middle latitudes around 10 m/sec in 100 km). On the cyclonicflank, the maximum absolute vorticity is for a well-marked jet ordinarily inexcess of two up to five times the Corio lis parameter. Further north andsouth, weaker horizontal shear is observed.
There are many variations on the broad features shown in Figures 2.1 and2.2; some of these will be discussed in the following sections. In particular, the situation illustrated ~ccurred in mid-winter, and, especially in thestratosphere of middle and high latitudes, the thermal structure undergoesstrong changes between winter and summer, with consequent large seasonal variations in the character of the wind field.
3. MEAN CIRCULATION AND CLIMATOLOGY OF THE JET STREAMS
Because of the great variations of the instantaneous wind field, it isappropriate to examine the structure of the atmosphere in the mean state,before returning to the complexities of individual cases. An examination ofthe mean state has the further advantage that averages can be pieced togetherto provide a picture of the circulation in regions where observations wouldbe too sparse to determine the circulation at a given instant of time.
It should be borne in mind that the available data do not justify a rigidacceptance of the precise values of the wind field shown on mean upper aircharts. Although the major features are believed to be known with fair certainty, precise numerical values can only be regarded as tentative and subject
MEAN CIRCULATION AND CLIMATOLOGY OF THE JET STREAMS
to revision as more data become available.
5
Treatment of Data. The utilization of data to obtain a picture of themean circulation and climatology of the jet stream is a complex and exactingtask. The data used may be upper wind observations, observations of temperature and the calculated geopotential field, or a combination of these typesof data.
Upper wind data are best analyzed by using the assumption of Brooks et al(1950) regarding the manner in which wind vectors are distributed. This involves the frequency analysis of the west-east and south-north components ofthe individual wind vectors observed at regular intervals. From this analysisare obtained the vector mean and standard vector deviation for groups of observations at individual observation stations (usually, daily observationsgrouped by months).
This type of analysis is complicated by the fact that the data for levelswhere jet streams occur are usually incomplete. In the case of visual upperwind observations, either cloud entry, low elevation or great distance of theballoon from the observer frequently cause termination of the observation before the jet-stream level is reached. Even with radio and radar wind-findingmethods, range and elevation limitations have the same effect, though for asmaller number of cases.
If the missing observations were uncorrelated with the wind speed and direction, the sample frequency distribution would yield a representative vector deviation, but if some correlation does exist the frequency distributionof the sample will be biased and unrepresentative of real conditions. It isnot known precisely how winds at jet-stream levels are correlated with cloudiness (see later discussion on clouds and jet stream); however, it is certainthat limitations of range and elevation are correlated with the wind strengthat jet-stream levels so that there is a tendency for all observed wind distributions at these levels to be biased toward light winds. Thus visual observations will yield distributions containing the unknown bias due to cloudinessand also a bias toward light winds, while radio and radar wind observationswill suffer from the latter bias. This means that it is necessary to be extremely critical in determining vector means from wind observations when attempting to establish the position and intensity of the jet stream on meancharts.
The use of the mean topography of constant-pressure surfaces in determining the mean wind field depends on the accuracy of the height observations andthe validity of the geostrophic assumption. A radiosonde network with compatibly instrumented stations 250 to 500 km apart is required, to give a meantopography of the necessary accuracy. Little is known regarding the validityof the geostrophic relationship between topography and mean winds, but it maybe said to be increasingly doubtful from latitude 30° equatorwards.
The use of mean temperature gradients in determining the vertical shearof mean winds also depends upon the geostrophic assumption and is thereforelimited by the same considerations.
6 MEAN CIRCULATION AND CLIMATOLOGY OF THE JET STREAMS
Because of the many errors which may arise in assessing the mean circulation and climatology of the jet stream, it is important. that all studiesshould clearly indicate the nature of the data used and the methods of analysis employed.
Availability of Data. An examination of upper-air networks (see, e.g.,Figure 2 in Namias and Clapp, 1951) reveals the areas where the mean winds injet-stream levels may be established with reasonable certainty, and shows thatover most oceanic areas and in equatorial regions data are not sufficient foran accurate and comprehensive picture to be drawn. It is essential to realizethat all analyses that have been made of the complete global circulation depend, over very large regions, upon a piecemeal combination of observationshaving different lengths of record and sometimes even different periods ofrecord, together with extrapolations from available data regions (either horizontally or vertically).
Information useful in determining the mean circulation and climatology ofthe jet stream may be grouped under three main headings :
(1) The large mass of observational data of upper winds, temperatures,humidities, and geopotentials of isobaric surfaces, published by some authorities and available on request from others, which is too voluminous to be usedwithout considerable collation and processing.
(2) Means and frequency analyses of upper air data, such as World WeatherRecords published by the United States Weather Bureau and the New ZealandMeteorological Office. These publications, unfortunately, do not always indicate whether the records are likely to be biased because of missing observations.
(3) Published papers on mean winds, mean constant-pressure topographyand mean temperature, notably that of Brooks et ~ (1950). Here again it isunfortunate that only rarely do these papers give an adequate description ofthe extent and reliability of the data used in their preparation.
If a comprehensive and extensive study of the mean circulation and climatology of the world's jet streams is to be made, a coordinated program ofanalysis of upper-air data must be carried out by each meteorological service.
The Existing Knowledge. An examination of the literature suggests thatthere are five main areas of occurrenCe of jet streams (Gibbs, 1953): overeguatorial regions, in the vicinity of latitudes 30° in both north and south,and between latitudes 40° and 60° in both hemispheres. In addition, jetstreams at very high levels are found over the subpolar regions.
Figures 3.1 to 3.5 give in broad outline the variation of the mean zonalflow with altitude, latitude, longitude, and time of year (for spring and fallcharts, see Bannon 1954, Jenkinson 1955 and Kochanski 1955). Figure 3.1 givesthe variation of the flow with latitude and altitude in summeT and winter,averaged over all longitudes (see also Namias and Clapp 1949, Petterssen 1950,1956), while in Figures 3.2 and 3.3 the variation of flow with latitude andlongitude are indicated for the 200 mb level. Figure 3.4, a mean cross section along SooW in the Northern Hemisphere, is presented to show the conditions
MEAN CIRCULATION AND CLIMATOLOGY OF THE JET STREAMS 7
in a location with extensive observational data, and also to bring out thestructure of the circulation in high levels. Not all the features shown inFigure 3.4 are necessarily representative of other longitudes, because of theeffects of the land-sea distribution. For example, the strong subtropicalmaximum of easterlies shown by these sections appears to some extent to be alocalized phenomenon affected by the North American continent. Figure 3.5,showing the monthly mean zonal flow, averaged over all longitudes for the300 mb level in the Northern Hemisphere, illustrates the general nature of theseasonal variations in latitude and strength of the westerly flow during aparticular six-month period. It is seen (cf. Figure 3.1) that the mean westwind system as a whole undergoes a marked variation, being strongest andclosest to the equator in winter. The annual meridional shift is quite similar to that undergone by the subtropical high-pressure belts at sea level.
Knowledge of the equatorial jet stream (high-level maximum easterlies inFigures 3.1 to 3.3) is limited to the relatively few radar or radio-wind stations in these latitudes (because of persistent cloudiness visual wind observations are rare at the appropriate levels). Radiosonde observations oftemperature and geopotential at isobaric surfaces are of little assistance indetermining the wind structure in equatorial and subequatorial regions becauseof uncertainties regarding the geostrophic assumption, and the extreme sensitivity of geostrophic wind computations to the accuracy of observations inthese latitudes.
Cognizance of a temperature minimum at about 100 mb in low latitudes ledWillett (1944) to suggest a belt of strong easterlies in subequatorial latitudes in summer. Brooks et al (1950) suggested a high-level belt of strongereasterly winds in equatorial regions and Gibbs (1953) suggested that this beltmight have jet-stream characteristics.
In recent years, an increasing amount of evidence, admittedly still somewhat fragmentary, has been accumulating to define the character of an equatorial jet stream occurring above the 200 mb level with speeds sometimes exceeding 90 kt (the term equatorial as here used refers to the general regionnear, but not necessarily on, the equator). This jet stream has been observedover Africa, Southeast Asia, and Australia, generally within 15° latitude ofthe equator and apparently having a most northerly position in July and mostsoutherly position in January (cf. Figure 3.1; also Gibbs 1953 where theeasterly jet is indicated as having a mean speed of 40-45 kt at 100 mb, in asector near 1500 E).
There is ample support for the presence of the subequatorial easterly jetin particular localities. Vuorela (1948, 1950) shows examples of easterliesof 80-100 kt in the equatorial Atlantic, and Davies and Sansom (1952) reportedoccasional 3- to 15-day periods of easterly winds in excess of 45 kt at 150200 mb, over East Africa in summer and winter. In the Southern Asia region,Koteswaram (1956) has shown the presence of a summer easterly jet of considerable longitudinal extent, with core at 100-150 mb in latitude 15°N (see Figure 3.3). This is supported by Ramsey (1955), who also found a January maximum at 2°S. Hay (1953) found easterlies at Singapore (IoN) throughout theyear at the 100-150 mb level, the maximum speed sometimes being greater than
8 MEAN CIRCULATIDN AND CLIMATOLOGY OF THE JET STREAMS
90 kt, with similar results at Hong Kong (22°N) during the summer months.From aircraft reports, Emery (1956) reported the existence in this region ofa narrow core of strong easterlies with maximum speed 75-100 kt above 200 mb.Over India, Krishna Rao (1952) considers that easterly jet streams are mostlikely to occur between 5° and 18°N, at the 100-150 mb level, while over Aden(13°N) Frost (1952) and Austin (1953) have found a July maximum at 100-150 mb.In the Australasian area, Bond (1953) located jets of SO kt at Darwin (12°S)in January and February 1953. The increasing volume of upper wind data shouldenable more definite conclusions to be drawn in the future regarding the position, intensity and conformation of this jet stream, but it will be necessaryto make a careful statistical analysis of data, with due allowance for missing observations and for bias.
The mean data, as well as individual cases analyzed by Koteswaram (1956)and others, indicate that the low-latitude easterlies are strongest and mostcoherent when in their most northerly position in Northern Hemisphere summer.Their steadiness is quite high at that time, in the regions south of theprincipal land masses; however (see Figure 3.3) in localities such as thewestern and central Pacific Ocean the mean easterlies are poorly developed.Here, as indicated by Riehl (1948a), the high-level circulation tends to takeon the form of transient closed eddies. Riehl (1954b, p. 250) shows an example of a localized westerly jet in the central Pacific, in latitudes l5-200 Nin July, with maximum speed of more than 100 kt. Thus within the latitudes ofthe summer mean hemispheric easterlies, local westerly jets may be found whichreach the intensity of wind maxima connected with middle-latitude frontal systems in summer.
Details of the high-level wind distribution in equatorial regions arediscussed at length by Palmer et £1 (1955). These authors indicate two easterly maxima of the mean winds (averaged around the hemispheres) throughoutthe year, the summer-hemisphere jet being most pronounced. The separatingminimum of mean easterly wind speed near the equator is due mainly to greatvariability, rather than low wind speeds. A narrow and shallow thread ofwesterlies (mean zonal speed 10 m/sec) is found at 50 mb (20 km) right overthe equator, surmounted by the easterly "Krakatoa winds" which reach a meanspeed of more than 30 m/sec at 10 mb (3D km).
The sUbtropical jet streams of both hemispheres have been the subject ofconsiderable study during the last five to ten years, as evidenced by the workof Austin (1953), Bannon (1954b), Chaudhury (1950), Gabites (1952), Gibbs(1952, 1953), Gilchrist (1955), Hess (1948), Hofmeyer (1952, 1953), Hutchings(1950, 1952b), Johnson (1952), Koteswaram (1953), Krishna Rao (1952), Loeweand Radok (1950), Matsumoto, Ito~ and Arakawa (1953), Mohri (1953), Moir(1950), Mironovitch (1953), Ockenden (1939), Palmen (1951a), POrter (1952a, b),Row (1951), Sutcliffe and Bannon (1954), and Yeh (1950).
The subtropical jet stream appears on mean charts at the 2DD mb level(Figures 3.2, 3.3), and on vertical sections, as the strongest and most continuous belt of westerlies, in the latitudes of the subtropical high-pressurebelts at the surface (note, in Figure 3.1, that the greatest westerly speedsaloft are directly over the latitudes of zero zonal speed at the surface, bothsummer and winter).
MEAN CIRCULATION AND CLIMATOLOGY OF THE JET STREAMS 9
The Southern Hemisphere seems less influenced by orographic effects andapparently has a more regular mean circulation than the Northern, so that observations of the subtropical jet stream from the Southern Hemisphere may bemore representative of its essential character. It appears that in theSouthern Hemisphere the sUbtropical jet stream occurs near the 200 mb level,at latitudes slightly below 30 0 S in winter and between 35° and 400 S in summer.The mean wind speed in the jet stream region approaches 100 kt in winter, butis generally less than 70 kt in summer. In winter the jet stream is a particularly persistent feature on 200 mb charts, the speed maximum on individualdaily charts being of the order 200 kt and the alignment of the jet axis beingdominantly west-east. Although it is not possible to construct reliable hemispheric 200 mb charts for the whole Southern Hemisphere, it seems likely thatthere is not a great deal of variation of the mean subtropical jet stream withlongitude.
The Northern Hemisphere subtropical jet stream has been identified overthe Mediterranean-Middle East-India region where it appears to have characteristics similar to those described above. However, in the Western Atlanticand to some extent in the Western Pacific, it appears that the subtropicaljet stream is, on mean charts, difficult to distinguish from active higherlatitude jet streams occurring in those regions.
Reports from North Africa, Bahrein, and India indicate a jet stream near300 N with a mean speed over 100 kt at 200 mb in winter, and near 40 0 N in summer, at a lower height and with considerably lower speed. Over the Asian landmass in winter, a double stream occurs. For example, Chaudhuri (1950) foundmaxima at 31° and 400 N at longitude 1200 E. In the Japanese region, Ooi et al(1951-1953) found similar results. At 500 mb in the Far Eastern region,Murakami (1953) established that the jet stream was stationary in winter atabout 300 N until May, when a secondary stream appeared at 55°N. A cross seCtion at 800 W (east coast of North America) by Hess (1948) showed a strongmaximum at 35°N of 100 kt at a height of 200 mb, and a secondary maximum at ahigher level at 55°N in winter; whereas in summer, the maximum speed of 50 ktat 200 mb was found at 55°N, with an indistinct secondary, not clearly separated, near 40-45°N. The winter maximum speed may be compared with that observed in a comparable region of Asia, about 150 kt (Mohri, 1953) to 180 kt(Bannon, 1954c) average near 200 mb over Southern Japan (cf. Figure 3.2).In the Hawaiian Islands region, Bannon (1954b) found that in winter there aretwo maxima of westerly flow at 200 mb height, one of 75 kt at 200 N, the otherat 300 N. He identified the same pattern over the West Indies, with a maximumof 80 kt at 20-25°N and the secondary 10° or more further north.
To isolate the characteristics of the subtropical jet stream, T.N. KrishnaMurti (report as yet unpublished) at the University of Chicago has analyzedthe low-latitude wind field of the Northern Hemisphere on a daily basis forthree winter months (December 1955 through February 1956). Examples of thedaily analyses are shown in Figure 3.6. When averaging is done with respectto the jet axis rather than by geographical locations, the mean jet at 200 mbstands out with great clarity. It was found that the winter subtropical jethas three waves around the hemisphere, with median locations of crests atlatitudes 30-35° and troughs at latitudes 22-25°N. In agreement with thefindings of Namias and Clapp (1949), large wind speed variations are observed
10 MEAN CIRCULATION AND CLIMATOLOGY OF THE JET STREAMS
along the jet axis. Greatest speeds are found at the crests (compare Figure3.2) : 140-150 kt at 70 0 W (east coast North America) and 400 E (Middle East),and 180 kt near 145°E (east coast Asia). Minimum speeds of 100-110 kt werefound at lowest latitudes on the jet axis. It will be noted that the crestsin the subtropical jet axis oCCur at the longitudes of the middle-latitudetroughs on upper-level mean charts for winter. There was little deviationfrom the above pattern on a day-to-day basis, except for latitudinal shiftsof the jet axis 7 to 8° north Or south of its median position.
The greatest steadiness in location of the subtropical jet axis is foundin the region from India across China through southern Japan. The small degree of meridional movement here is attributed to the fact that in winter thejet hugs the south side of the Himalaya complex; the stability being favoredboth by its presence as a physical barrier and as a high-level cold source(see Ramage, 1952). Northward shift of the westerly subtropical jet (to aposition north of the Himalayas) and replacement by the summer subequatorialeasterlies occurs quite rapidly. According to Sutcliffe and Bannon (1954)and Tun Yin (1949), this shift over the Middle East-Southeast Asia region isclosely tied to the onset of the summer monsoon.
The secondary maximum appearing at higher latitudes, in the earlierstudies mentioned above, appears to be associated with the middle latitude or"polar front" jet stream. Although such jets are quite pronounced on dailycharts, they are very obscure on mean charts because of their relative transience in time and space. The charts by Brooks et al (1950) show greatest variations about a mean state in the eastern parts of the North Atlantic and NorthPacific Oceans, where the mean vector deviation of the 300 mb wind in winteris 40 to 50 kt.
Studies such as those by Hubert and Dagel (1955) and Murray and Johnson(1952) indicate that these jet streams are frequently closely associated withpolar fronts. Because of their variation in geographical position (Phillips,1950) they are not apparent on mean charts except in areas of persistent frontal occurrence such as the eastern coasts of North America and Asia (Figures3.2, 3.3). In these locations a high frequency of frontal occurrences givesrise to a quasi-permanent jet stream which on a mean chart appears as a particularly strong wind maximum which merges with the mean subtropical jet stream.
From a section across the North Atlantic, Johnson (1953d) found the mainwesterly flow (for January 1950) to be centered at 61 0 N with a mean speed of60 kt at a height below 300 mb. From consideration of three mean cross sections in the North Atlantic region in January 1952, Hubert and Dagel find apolar jet at latitudes 40-50oN and subtropical jets near 12° on the wsst sideand near 25°N on the east side of the Atlantic. At the same time, a high-altitude jet stream circulation appears, most clearly defined over Scandinavia.There it appears as a current centered near 62°N with mean winds of 56 kt at100 mb, still increasing with height.
This latter current corresponds to the winter "polar night maximum" indicated by the hydrostatically computed wind field shown by Kochanski (Figure3.4) at 65-75°N and particularly strong above 50 mb. This feature is strikinglyevident on the winter mean 41 and 96 mb charts of Scherhag (1948).
RELATION OF JET STREAMS TO SYNOPTIC SYSTEMS 11
In the Southern Hemisphere, observations in middle and high latitudes areparticularly deficient, but from experience with frontal analysis at the surface Gibbs (1953) suggested that a minor mean jet stream may exist in higherlatitudes (in summer, around 50 kt at 300 mb near latitude 600 S). It is wellknown that in winter a well marked cold pool occurs over Antarctica and extends to about 100 mb. Gibbs has suggested that this may be associated with amean jet stream at about 100 mb between latitudes 70° and 80 0 S. This is alsoshown on the mean sections of Hutchings (1950) and of Flohn (1950b), who indicate mean westerlies of 30 m/sec at 30 km height near the South Pole.
The high-level stratospheric jets in the subpolar regions are the features which undergo the strongest annual variation, from very strong westerlies in winter to moderately strong mean easterlies in summer. This variationof wind is associated with the annual temperature variation of 35-500 C at20-30 km over the North Pole (Kochanski, 1955) and a probably greater variation over the South Pole.
For an extensive discussion of the available knowledge of winds higherthan 30 km (up to 100 km), the reader is referred to a survey by Murgatroyd(1957). In winter, the subtropical maximum of easterlies (Figure 3.4) appearsto be strongest near 30 km height. Maximum westerlies are found near 60 km,with mean speeds in excess of 100 m/sec at latitudes 50-60°. The westerliesagain decrease upward, and at least in the subtropics give way to easterliesnear the 100 km level. In summer, a maximum of easterlies is observed, sloping upward from 50 km in the tropics to around 80 km in subpolar regions.Maximum easterly speeds of 70 m/sec or more are found at latitudes 15-40°.The easterlies give way to westerlies near the 100 km level. The variationfrom winter westerlies to summer easterlies near 60 km is associated with thestrong seasonal temperature variation noted in connection with Figure 3.4,and the "polar maxima" in that figure show in fact the lower extensions ofthe general high-level wind belts.
The few illustrations in Figures 3.1 to 3.5 have been chosen to bringout the main features of the global wind patterns near jet-stream levels. Itmust be emphasized that there are strong regional differences in the mean flowand that hemisph€ric means (Figure 3.1) are not adequate representations forany given longitude. This is clear from Figures 3.2, 3.3 and 3.6. Examplesby Radok and Grant (1957) and Kochanski (1955) demonstrate also that thereare large local variations even in the seasonal mean winds, from year to year.
4. RELATION OF JET STREAMS TO SYNOPTIC SYSTEMS
Most of the discussion to follow will have to do with jet streams associated with the polar-front z~ne, for the simple reason that the more abundant observations available in middle and higher latitudes have encouraged synoptic case-studies there rather than in subtropical and tropical latitudes.Naturally these studies have tended to emphasize the association between jetstreams and frontal zones. Well marked polar fronts always have attendant jet
12 RELATION OF JET STREAMS TO SYNOPTIC SYSTEMS
streams, but the reverse is not always true. Thus the absence of surfacefronts does not necessarily indicate the absence of a jet stream.
This is particularly true of the subtropical jet stream, which appearsto be a quasi-permanent feature of the circulation, affected in certain localities by occasional intrusions of frontal jet streams from higher latitudes.An investigation by Phillips (1950) indicated that when polar-front jetsmigrate southward into subtropical latitudes, the associated low-level barocline field gradually disappears, although baroclimity is maintained in themiddle and upper troposphere.
Experience with analysis in the Southern Hemisphere, where the subtropicaljet stream is apparently the most important one, indicates that there are onthe whole no attendant fronts. Thus any attempt to apply middle-latitudefrontal models indiscriminately to the lower-latitude jet streams is likelyto lead to confusion. Unless otherwise specified, the following remarks onsynoptic systems are intended to refer to the systems of middle and higherlatitudes.
Extratropical Jet· Streams: Large-Scale Features. The well-known concepts of long waves, with their attendant cyclone families, serve as a .usefulguide to the general features of jet stream structure. There are usually 3to 7 long waves around the hemisphere (Rossby and Collaborators, 1939;Cressman, 1948), with a corresponding number of large-scale waves in the jetstream.
As noted by Staff Members, University of Chicago (1947), there is a fairly close relationship between the meandering of the large-scale flow and thatof the major barocline zone, or polar front zone. Since the latter is connected with a jet stream, it follows that when the major waves have largeamplitudes, with cold air in low latitudes in the vicinity of upper troughsand warm air extending into high latitudes in the vicinity of upper ridges,the jet stream itself is characterized by waves of large amplitude.
Figure 4.1 (Bradbury and Palmen, 1953) shows a typical example of theisotherm pattern at 500 mb in winter, which brings out the meandering character of the polar-front zone, where the isotherms are most concentrated. Although the jet stream does not exactly follow this isotherm ribbon, there isgenerally a close relationship in the broad features (the jet-stream axistends to have a somewhat smaller amplitude than shown by waves in the isothermband). The shapes of the waves in this figure vary from nearly sinusoidalover the eastern Pacific to highly irregular over Europe and North Africa,where a perturbation of very large north-south amplitude is observed.
Examples of the development of irregular large-amplitude wave patternsare discussed in detail by Palmen and Nagler (1949), Berggren, Bolin, andRossby (1949) and Rex (1950). The alternation between small- and large-amplitude wave patterns with attendant variations in the strength of the mean hemispheric westerly flow ("index cycle") is discussed by Namias (1947, 1950) andby Rossby and Willett (1948). No attempt will be made here to summarize thesynoptic processes involved; a perusal of the references cited will sufficeto bring out the great variations of the large-scale flow patterns and of themeandering jet streams.
RELATION OF JET STREAMS TO SYNOPTIC SYSTEMS 13
Cressman (1950) found that in most cases there tend to be two principaljet streams around the hemisphere (on a given day these may appear to bejoined over part of the hemisphere, and widely separated over other parts,with an average latitudinal separation of 10-20°). Cressman Lomputed dailyaverage latitudes and strengths of the jet stream around most of the NorthernHemisphere at 300 mb for two periods of about 6 months each. He found thaton the whole such hemispheric jet streams tended to form in higher latitudes,and to drift southward at a rate of one-half to two degrees latitude per day.In other instances, splitting of a pre-existing jet stream appears to occur,with a temporary poleward drift of one branch, followed by a movement southward. The same behaviour was observed at SooW in a stuDY by Phillips (1950).
The double (or sometimes triple) set of mean hemispheric jet streams observed on a given map may in general consist of one jet which has been inexistence for a long time and drifted far south, and another which has recently formed in the north. During its latitudinal migration a marked variation of intensity is observed. Figure 4.2 is suggestive in this regard. Thisfigure shows the mean latitude and mean strength of the jet stream at 300 mbfor three warm and three cool months. For both periods a marked tendency isevident for the jet stream to have maximum intensity in middle latitudes. Ifthe meridional drift of the jet stream is an accepted feature, it is clearthat on the average the jets forming in higher latitudes strengthen considerably in approaching middle latitudes, then weaken again on approaching the tropics. It is not clear what implications, if any, Figure 4.2 has for the subtropical jet, which is most pronounced at a higher level than represented inthat figure.
Smaller-Scale Features Relation to Cyclones and..,.Surface Frontal Svstems.Superimposed on the large-scale perturbations of the jet stream are smallerscale perturbations which tend to be associated in a general way with individual wave cyclones. In line with the observation by Bjerknes and Solberg(1922), there may be several cyclones with one long wave (but sometimes onlyone; see Bjerknes 1951; Palmen 1951b), and ideally one would expect aboutthe same number of smaller-scale jet stream perturbations associated with corresponding waves in the polar front zone. Although the relation beuNeen waveson the jet stream and the surface synoptic systems is not always this simple,the character of surface synoptic systems does serve as a useful guide as towhat to expect in regard to the jet-stream pattern.
Instructive examples of the relationship between jet streams and surfacesynoptic systems over the British Isles and environs have been given by Murrayand Johnson (1952). Vederman (1954) has attempted to describe the generalrelationship between wave cyclones and configuration of the jet stream, combining the material'of Murray and Johnson with experience from synoptic systemsover North America.
Figure 4.3, taken from Vederman, shows an idealized wave-cyclone familyand the general relationship of the jet stream to surface cyclone and frontalsystems at various stages of the development. As would be expected, when thewave cyclone is weak and its attendant frontal system has small amplitude, thejet stream (which more or less reflects the barocline field integrated throughthe troposphere) also has small wave amplitude. As a cyclone intensifies and
14 RELATION OF JET STREAMS TO SYNOPTIC SYSTEMS
increased amplitude is given to the mean thermal field, the jet-stream waveamplifies likewise. In the final stage of occlusion, according to Vederman,the jet stream tends to split into two branches ahead of the cyclone, as indicated in the figure. Since it is characteristic of the ideal cyclone thatat first the surface low is found at the wave peak On the surface front, whilein the occluded and final dying stages the strong portion of the front movessuccessively farther and farther south with respect to the surface low center,a relative movement of the surface low across and finally to the left side ofthe jet axis is characteristic.
As noted by Vederman and by Murray and Johnson, there are many complicated variations in the jet-stream structure relative to a surface cyclone.However, as Vederman states, a general conception such as shown in Figure 4.3is useful even if it does not apply in all cases, just as the wave cyclonemodel is useful although not universally applicable in the most rigid sense.Application of models is naturally of chief interest over areas such as oceanicregions, where direct aerologl.cal observations are sparse or absent.
In general, as indicated in Figure 4.3, the jet stream lies closer tocold than to warm fronts at the surface. As pointed out by Palmen· (1948b),on the average the jet-stream axis tends to be found approximately above ~he
intersection ·of the 500 mb surface with the warm-air boundary of a strongfrontal layer; and, as noted by Murray and Johnson, this generally places thejet axis 200 to 400 mi (300-600 km) behind cold fronts and 400 to 800 mi (6001200 km) in advance of warm fronts at the surface. The jet stream axis doesnot run parallel to a surface frontal system, but instead may lie quite closeto the surface front near the peak of a warm sector, and farther away from thesurface front with increasing distance upstream or downstream from the wavepeak. It is frequently observed that the jet-stream axis may lie actuallysouth of the surface wave peak, entirely within the warm sector over part ofits length.
Marked variations in wind speed generally occur along a jet axis; astriking example is shown in Figures 4.4 and 4.5. Here the thermal contrastin mid-troposphere (Figure 4.4) is highly concentrated in the southwesternUnited States, with a pronounced diffluence of the isotherms further east.Corresponding to the general features of the thermal wind field in Figure 4.4,a strong highly-concentrated jet (maximum speed 200 kt) is observed in Figure 4.5, south of Great Salt Lake. Further east, a rapid decrease in speed isobserved, where the horizontal temperature gradient becomes weaker. Severallocalized jet maxima of the sort shown in Figure 4.5 may be found along a jetaxis, over a length such as depicted in Figure 4.3. The wavy jet axis as awhole (if a regular pattern exists) will tend to move with the medium- andlarge-scale wave patterns. At the same time the individual speed maxima gen- .erally move downstream with a component along the jet axis (the main jet maximum in Figure 4.5 was moving eastward at the rate of about 30 kt). For examples of isotach analyses in different kinds of synoptic situations, see Newtonand Carson (1953), Riehl et al (1954), Gazzola (1955) and Gibbs (1955).
Connected with movements of this type, are changes in the wind structureof individual troughs and ridges aloft. During the development of a strong
RELATION OF JET STREAMS TO SYNOPTIC SYSTEMS 15
trough in the upper troposphere (often in connection with surface cyclogenesis),the strongest winds are characteristically found on the west side; during thedevelopment the zone of strongest wind migrates through the equatorward sideof the trough and in the final stage of development is generally found on theeast side.
Although in the schematic Figure 4.3 the jet stream has been drawn with acontinuous axis, breaks in the jet axis are more the rule than the exception.In connection with the examples shown by Murray and Johnson (1952), theseauthors note that the jet stream associated with the cold front of a givencyclone may appear entirely disconnected from the jet stream over the warmfront surface.
Murray and Johnson find that the maximum wind at the jet-stream axistends to be stronger by about 25 kt over a cold front than over a warm front.Although the number of cases involved is small, and the cases they studiedwere all in the vicinity of the British Isles and may be biased by the geography of the region, this may quite generally be the case since cold frontsare usually steeper than warm fronts, with more pronounced average baroclinitythrough a deep layer.
Relation of Jet Streams to Deep Tropospheric Frontal Layers. Although ageneral association is found between frontal systems and the jet stream, therelation is not always clear-cut. As noted by Palmen (195lb), a front whichis strong at the earth's surface may be exceedingly vague in the upper troposphere, while a strong frontal layer in the upper troposphere may be onlypoorly reflected at the ground. In some cyclones, as noted originally byNyberg (1945), the surface fronts may locally be only shallow phenomena duringthe early life of the cyclone. Thus, as pointed out by Riehl (1948b), thebaroclinity associated with a distinct frontal layer may in an individualinstance contribute only a minor part to the total thermal wind between theearth's surface and the level of the jet stream, most of the vertical shearbeing associated with weaker but still significant baroclinity through a deeplayer of the troposphere within the individual air masses. Cross sectionsfound in the literature show a great deal of variation, from jet streams associated with no distinct frontal layer to those associated with strong frontal layers sloping upward through the entire depth of the troposphere.
An example of the variations in frontal structure observed with a particular jet stream is shown in Figures4.6 and 4.7. These sections, 500 km aparton the west side of a weak surface cyclone, were observed in a situation verysimilar to that in Figures4.4 and 4.5, the corresponding locations being normal to the isotherms near the westernmost dashed line in Figure 4.4, and justwest of the heavy dot in that figure (location of a surface cyclone). Figures4.6 and 4.7 show in the one case a well-defined frontal layer extending throughthe whole troposphere, and in the other a shallow frontal layer confined tothe lowest 300 mb. A section half-way in between (not shown), only 250 kmfrom the upstream section, showed no upper-tropospheric frontal layer at all,and only a weak low-level front. The jet stream, on the other hand, is notmuch weaker in the downstream section than in the one upstream. Cle3rly onecannot make any general statement that the jet stream is or is not associated
16 RELATION OF JET STREfu~ TO SYNOPTIC SYSTEMS
with fronts, since both statements may be true in different instances (seeReed and Sanders 1953) and even 'in different places along the same jet stream.It might be pointed out that the differences between Figures 4.6 and 4.7 donot merely involve a change in slope of the front; the upper part of thefrontal layer in Figure 4.6 gradually became diffuse toward the east, with nomarked change in slope, while the nearly horizontal stable layer in Figure 4.6is a separate phenomenon entirely (the potential temperatures at frontal surfaces being about 20° different in the two cases).
As noted in the preceding section, the location of jet axes with respect tosurface fronts varies considerably from case to case. With the same cycloneand frontal system, this relationship is often observed to change markedlywithin a relatively short period of time. With particular regard to the coldfront, a jet stream may be found in close proximity to the surface frontduring the early stages of a cyclonic development. Later, as the cold air subsides and spreads out at the surface, with a pronounced change in frontalslope, the jet-stream axis may be found at a great distance from the surfacecold front. The latter may be observed to move very far southward in a 24or 48-hour period, while the associated jet stream may at the same time undergo little southward movement (see, e.g., Palmen and Newton 1951). It is clearthat great caution must be used in attempting to relate jet-stream positionsto those of surface fronts.
In this regard, it is useful to construct frontal contour charts (Crocke~
Godson, and Penner, 1947) to show the structure of frontal surfaces a loft.Some very striking examples are given by Anderson, Boville, and McClellan(1955), showing the relationship of jet streams to frontal contour patterns.In the examples they show, distinct jets are connected with the polar front andthe arctic front; these jets combine and intensify markedly where the twofrontal systems approach each other closely, with a combination of theirsolenoid fields.
Over Japan and vicinity, a pronounced stable layer is frequently observedwhich has all the characteristics of a frontal layer but is confined entirelyto the upper troposphere. Mohri (1953) has called this the "subtropical front",by virtue of its association with the subtropical jet stream. Figure 4.8 showsa remarkable example of the atmospheric structure at a time when this "front"has merged temporarily with the polar front, to produce'a pronounced stablelayer over 5 km deep and 500 km wide. The "subtropical front" is observed onoccasion at least as far east as the middle Pacific. This phenomenon may beconfined to this particular geographical region, which is likewise the regionhaving the strongest winds in the world. Note the deep layer of strong vertical shear in Figure 4.8, culminated by winds in eXCess of 100 m/sec.
As noted in Section 2, corresponding to the strong horizontal temperaturegradient below jet-stream level there is a strong gradient of reverse senseabove the jet. Berggren (1952, 1953) has proposed that the polar front can beanalyzed as a single transition zone, as in Figure 4.9, dividing the tropicalair, as an entity comprising both troposphere and stratosphere, from the polarair mass, also troposphere plus stratosphere. The polar stratosphere beingwarmer than the tropical stratosphere, this means that a front acting as a
HORIZONTAL PROFILES THROUGH THE JET STREAM 17
warm front in the troposphere acts as a cold front in the stratosphere, assuggested by Bjerknes and Palm~n (1937). Near the maximum wind level, wherethe frontal layer reverses in slope, there is no horizontal temperature contrast (Figure 4.9). At this level, where the vertical shear is nil, thestrongest horizontal shear is observed, according to Berggren.
The exact nature of the zone of transition from polar to tropical aircannot be determined with confidence from routine aerological observations,because of the distance between stations, and the manner of analysis (compareFigures 2.1, 4.6 and 4.9) is to some extent a matter of individual preference.Eventually aircraft reconnaissance may throw some light on the exact structureof the temperature field. An analysis of the type indicated in Figure 4.9 isa useful concept regardless of whether the frontal boundaries are in allplaces clearly defined, since such an analysis brings out the principal features of the zone of transition as a boundary between air masses both introposphere and stratosphere, and the nature of this zone as one of markedcyclonic shear at all upper levels. As discussed in a later section, knowledge of the structure of the temperature field relative to the wind field,as depicted in Figure 4.9, has been found to be of considerable use in aerialnavigation.
All the examples shown above were taken from the middle-latitude polarfront region. McIntyre and Lee (1953) show a cross section through the arcticfront (with warm-air temperatures of -33C at 500 mb compared with -15C in Figure 4.9) which is in all essentials similar to the characteristic structure inmiddle latitudes (including tropopause configuration). They present data suggesting that such frontal jet-stream systems may move southward with a gradualtransformation to warmer air masses (cf. Cressman, 1950, Phillips 1950).
5. HORIZONTAL PROFILES THROUGH THE JET STREAMDISTRIBUTION
WIND SHEAR AND VORTICITY
Knowledge of the typical values of horizontal wind shear to be expectedin the vicinity of the jet stream is not only of theoretical interest, butalso of very considerable practical importance. On the whole, aero logicalwind observations tend to be more sparse and less accurate where the upperwinds are strong. If some general rules could be derived for construction ofthe wind profile, it would be possible to analyze the wind-speed field by useof a few wind observations quite distant from the axis of maximum wind; suchgeneral knowledge as is available has been used on a routine basis by someanalysts for several years.
Profiles from Aerological Analyses. The general character of the horizontal distribution of wind through the jet stream at different levels is represented by Figure 5.1. The wind profile is seen to be characterized by arather sharply-peaked maximum, with strong shear on both sides of the jetstream core, the gradient of speed decreasing in general with increasing distance from the axis of maximum wind. This figure is derived from a mean cross
18 HORIZONTAL PROFILES THROUGH THE JET STREAM
section constructed from 12 winter cases, the temperature field having beenaveraged with respect to a system of coordinates fixed to the polar-frontlayer. Although this method preserves the major features, the extreme valuesof horizontal shear are to some extent damped.
In Figure 5.1 the maximum "peakedness" of the wind profile is seen at300 mb, near the level of maximum wind. The strongest cyclonic shear is foundthere and in the upper part of the frontal layer. As noted by Palmen (1948b),the axis of strongest wind tends to be found nearly above the warm boundaryof the frontal layer at 500 mb. The zone of strongest anticyclonic shear,2-300 km from the jet axis, frequently lies nearly over the front at 700 mb,and by hydrostatic reflection the cyclonic shear within the front tends to beweakest near that level. Thus in Figure 5.1 the shear at 500 mb through thefrontal layer is more than double that at 700 mb.
Other things being equal, the intensity of the cyclonic shear borderingthe jet stream appears to be greater in cases where there is a pronouncedfront than when there is not. As seen from Figures 4.6 and 4.9, the pronounced vertical shear found within the sloping frontal layer is also associated with marked horizontal shear. Figure 4.6 may be compared with Figure4.7, where the front is absent in the higher troposphere, and both the vertical and horizontal shear are weaker.
Magnitudes of Shear and Vorticity. At the level of maximum wind, manyaero logical analyses supported by gradient wind computations and by observedwinds have shown that the absolute vorticity tends to reach a limiting valuenear zero on the anticyclonic side of the jet stream at varying distances 100to 400 km from the jet axis.
The absolute vorticity may be expressed as f + ~~ + ~ f being the
Coriolis parameter 2 w sin 0; V, the wind speed; {)V , the wind shear (posi-()n
tive for cyclonic shear); and R, the radius of streamline curvature (positivecyclonic). Thus in straight flow, the maximum anticyclonic shear 100-300 kmfrom jet axis (see Figure 2.1) has about the same value as the Coriolis parameter (order 10 m/sec or 20 kt in 100 km near latitude 450).
Such analyses as are available indicate that the anticyclonic shear isstronger for cyclonically curved, and weaker for anticyclonically curvedstreamlines, than the limiting value for straight flow, suggesting that theshear and curvature combined tend to reach the limiting value -f. With verystrong winds in intense troughs, where the curvature term in the above expression sometimes approaChes the value of f, the anticyclonic shear may thus beup to about 2xlO-4 sec-lor 20 m/sec in 100 km.
The observation that the absolute vorticity does not go negative is ingood agreement with expectations from the criterion for "dynamic instability",first developed by Solberg (1939) and later amplified by Kleinschmidt (1941),Van Mieghem (1951) and others. This criterion predicted that lateral instabiIi ty should develop if the vorticity of the gradient wind field should go below zero; in that case the condition of instability should be destroyed in the
HORIZONTAL PROFILES THROUGH THE JET STREAM 19
same way that strong superadiabatic lapse rates tend to be eliminated by vertical exchange. Strictly speaking, the vorticity concerned should be that inan isentropic surface (Bjerknes, 1951), so that above or below the level ofstrongest wind the limiting value of anticyclonic shear in a level surface issomewhat weaker than indicated by the above criterion.
While the magnitude of anticyclonic shear seems to be restricted by thecondition of zero absolute vorticity, there is no known theoretical restriction on the magnitude of the shear which may be attained on the cyclonic flankof the jet stream. On the average, the shear is considerably stronger on thecyclonic than on the anticyclonic flank; with a pronounced jet the velocityprofile is particularly asymmetrical. Analyses from aerological observationssuggest that the maximum absolute vorticity on the cyclonic flank (when gradients of velocity are measured on "synoptic scale" of 100-200 km) is 2 to 6times the Coriolis parameter in practically all cases; this is probably exceeded in some. Berggren (1952) gives for Figure 4.9, within the verticalpart of the front at tropopause level, shear of 45 to 60 m/sec (up to 115 kt)per 100 km horizontal distance, based on observed winds. Vuorela (1953) findscomparable values. In Figure 5.1 the greatest horizontal shear near jet levelis about 15 m/sec per 100 kmj this would be an underestimate for the individual cases involved.
Murray and Johnson (1952) and Johnson (1953d), from mean profiles constructed from a large number of cross sections, find that over distances ofroughly 400 km from the jet axis the cyclonic shear averages about 1.5 timesthe value of the anticyclonic shear. Over smaller distances, the shear wouldof course be larger. According to Hsieh (1950b), the value of the horizontalshear tends to be somewhat smaller in ridges than in troughs.
The most extreme development of atmospheric troughs is the formation ofshear lines, where oppositely-directed jet streams with speeds of the order100 kt are found close together. With a well-developed shear line an averageshear of around 20 m/sec per 100 km (Murray and Johnson 1952; Newton, Phillips,Carson and Bradbury 1951) may be observed over the characteristic distance of500-600 km separating the jets.
Murray and Johnson note that on the average for the cases they analyzed,the distance from the jet axis out to the place where the wind speed drops toone-half its maximum value is about 300 km on the cyclonic side, and 500 kmon the anticyclonic side of the jet. These distances agree very closely withthe corresponding "half widths" at 300 mb in Figure 5.l.
MUltiple Jets. As noted earlier, there tends to be more than one majorjet stream observable at a given meridian at a particular time. Figure 5.2shows a typical example of two principal jet streams, each having localizedmaxima of wind speed along its axis. The individual jet stream systems mayinclude the subtropical jet, and one or more jets connected with the polar,arctic, or other frontal systems. Connected with an individual frontal systemthere is often observed, instead of a single jet stream as suggested by theidealized Figure 4.3, two more-or-less parallel jet streams separated by 500BOO km distance (Gustafson 1949). Jet streams associated with separate wave
20 HORIZONTAL PROFILES THROUGH THE JET STREAM
or frontal systems in different latitude belts may also lie in close proximityover parts of the weather map. For a discussion of the streakiness of atmospheric and oceanic currents, see Rossby (1953).
Figure 5.3 shows a cross section through three jets which happened to lieclose together in one locality (diverging sharply a short distance downstreamfrom the section). In this case, the wind data up-and downstream from the section showed the discrete natures of the individual jet streams, each characterized by cyclonic and anticyclonic shears of the magnitudes typical forsingle jet streams. It is not always possible to distinguish between the individual jets, however, and it is COmmon practice to "merge" two wind maximainto one, where they come into close lateral proximity on an isotach chart.Whether this actually occurs is often not determinable from the observations.Whether or not two separate jets are present in the vicinity, such a "confluence" (Namias and Clapp, 1949) is associated with lateral concentration ofthe thermal field, and the upper-level winds tend to be strongest downstreamfrom a zone of confluence and upstream from a diffluent zone. As shown byAnderson et ~ (1955), such a reinforcement of the thermal field, and ~rength
ening of the upper winds, frequently occurs where the arctic- and polar-frontzones lie close together.
As noted by Riehl and Teweles (1953), in cases with very strong winds inone maximum (e.g. 150 kt) the tendency is for only a single jet to dominate aregion of the size, say, of the United States. On occasions with weaker winds,say 60-75 kt maximum, several collateral jet axes or "fingers" may be observedin a comparable region. As illustrated by Figure 4.5, downstream from a largeand strong jet maximum, where marked deceleration occurs, the wind field maydegenerate into such minor fingers several hundred km apart.
Jet-Stream Profiles from· Aircraft Reconnaissance. The wind profiles inFigure 5.1 were computed using the geostrophic wind relationship. When analyzing the wind field by use of the regular network of radiosonde and upperwind stations, one is faced with the possibility that some details of thetemperature and height fields may either be smoothed out in the analysis Ornot shown by the data in the first place. The question then arises to whatextent details in the wind and temperature fields may exist, which are notshown by the aerological network. To attempt to answer this question andother related ones, several extensive aircraft reconnaissance programs havebeen and are being carried out.
The discussion here will be concerned only with the wind field, which hasbeen explored chiefly in reconnaissance programs of the U.S. Air Force andU.S. Navy. Other extensive programs, such as the Meteorological ResearchFlight from Farnborough, England (Murray, 1956) and those discussed later inthe section on turbulence, have not had investigation of the wind field astheir primary aim. Murray states that the flights generally confirmed the picture presented by cross sections from routine upper air data, but do not addmuch to existing ideas on the thermal structure in the vicinity of the jetstream.
Measurements of winds by aircraft depend essentially, in all methods used,upon computing the wind drift from the difference between vector ground track
HORIZONTAL PROFILES THROUGH THE JET STREAM 21
of the aircraft, and its movement relative to the air as indicated by true airspeed and heading. Very great care must be exercised in interpreting the results of such wind measurements, to take cognizance of the degree of possibleerror involved. It is generally impossible, from the published data, to formany impression of the errors due to faulty airspeed measurement or compasscalibration, which are not necessarily negligible (see discussion by Rutherford,1956). Errors in ground tracking, however, are generally assumed to contributethe major part to errors in wind computations.
In jet streams reconnaissance, fast aircraft are used in order to minimizethe effect of time variations of the wind and temperature fields, in determining the space variations. A primary objective being to study the space distribution in more detail than is possible by use of the aero logical network,it has been held essential to make measurements over as short segments of aflight as feasible, such segments usually corresponding to t to 2 minutes flying time (it has generally been found necessary to smooth over greater intervals than planned, in evaluating "the data).
Several methods have been used in determining ground speed and directionof flight : vertical photography of the underlying surface; triangulation bybearings on (or from) ground radio stations; and use of a radar device aboardthe aircraft which utilizes the Doppler effect to compute movement with respect to identifiable ground targets. Use of the first method is naturallyconfined to situations wherein there is little cloud cover beneath the aircraft, and therefore in general to restricted types of synoptic situations.
While it is not possible to go into detail on the various methods of navigation, it is at least appropriate to comment on the fact that small errorsin position fixes can result in appreciable errors in wind determination. Forexample, a cumulative error in navigational fix 'of only 0.5 nautical milebetween two points at one minute intervals of a flight path would result in avector error in wind determination amounting to 30 kt. In at least one extensive flight program, the probable errors in fix were greater than this, obviating the possibility of investigating the small--scale structure of thewind field.
The broad results of aircraft reconnaissance of the jet stream have verified the general character of the wind profiles, such as shown in Figure 5.1,that have been computed from aero logical data. The principal questions appearto be in regard to details, e.g. whether the wind profile is sharply peaked orrounded, and whether the profile has a regular smooth shape, or is characterized by a "micro-structure" reflecting significant fluctuations of the windabout the smoothed profile. .
The earliest published aircraft measurements of wind in flights across thejet stream are those by Hurst (1952, 1953), the fixes being determined photographically. A wind profile from one flight over Great Britain is shown inFigure 5.4. Hurst (1953) estimates that the probable error due to effect ofvariations in altitude and heading of the aircraft upon the photographic fixwas 3.5 kt, and that the derived winds "are not inconsistent with a smoothvelocity profile".
22 HORIZONTAL PROFILES THROUGH THE JET STREAM
Figure 5.5 shows a composite 300 mb profile obtained by Riehl (1955) bycombining Hurst's results with those from several reconnaissance flights byU.S. Navy aircraft. In the Navy flights, fixes were obtained by triangulationfrom radio stations ("Omnirange"). Measurements made at frequent intervalsindicated very large fluctuations in the derived winds, but it was found thatthese could for the most part be ascribed to errors in fix, which were of theorder 2 nautical miles, and often larger. Such fluctuations were consequentlyrejected by Riehl et £1 (1955), and the profiles in Figure 5.5 represent aconsiderable smoothing of the original data.
The peak wind of 244 knots in Figure 5.5 was the strongest measured onany of the Navy flights. An exhaustive examination of this case (Riehl et al1955; see also more extensive discussion by Riehl and Maynard, 1954) showsthat it was impossible to fit the results of this aircraft flight into an analysis for the corresponding time utilizing the regular aerological winds. Thusit is ,necessary either to conclude that the aircraft measurements indicatedwinds very much too strong over the flight path as a whole, or that the surrounding aerological wind observations over a large area indicated systematically very much (20-100 kt) too weak speeds. Which of these alternatives ispreferable is not indicated by the authors; although they state that the reconnaissance results were consistent with gradient winds computed from thepressure field.
Analysis of further results from the same flight program (U.S. Navy, 1955)discloses considerable variety in the shape of the wind profile across the jetstream. In contrast to Figure 5.5, some flights indicated blunt, rather thansharply peaked, wind maxima. The investigators attribute the difference incharacter largely to the fact that some flights were made across the "tail" orupstream portion of jet maxima, while others were made across the region of thestrongest winds, or in the "nose" or downstream portion. Two of the five"blunt" profiles were in the tail portion, the others being across the centralportion. In general, the flights across the noses of jet maxima showed a considerably less well-defined character than that in Figure 5.5, with weakershear on the cyclonic side.
A question which cannot be answered by analyses of regular aero logicalobservations is that of small-scale" streakiness" in the wind field. Attemptshave been made to analyze the micro-structure of the wind field on the basisof reconnaissance measurements by U.S. Air Force planes equipped with Dopplerradar systems. With such equipment, essentially instantaneous wind computations are made by the automatic-computing navigation system of the aircraft.Most of the published analyses show observations at about 30-km intervals.Some results have been presented by Endlich et Ql (1954), Landers (1955),Brundidge (1956), Cunningham (1956a) and Saucier et al (1956).
An example is reproduced in Figure 5.6, constructed from the results offlights at 280 and 380 mb. Isotachs from conventional aerological data (dashedlines) agree rather well with the broad scale results, considering the difference between observation times. With regard to the fine structure, Landers(1955) states, "The striking features on this Cross section are the three centers of maximum speed within the large-scale jet stream. All three of these
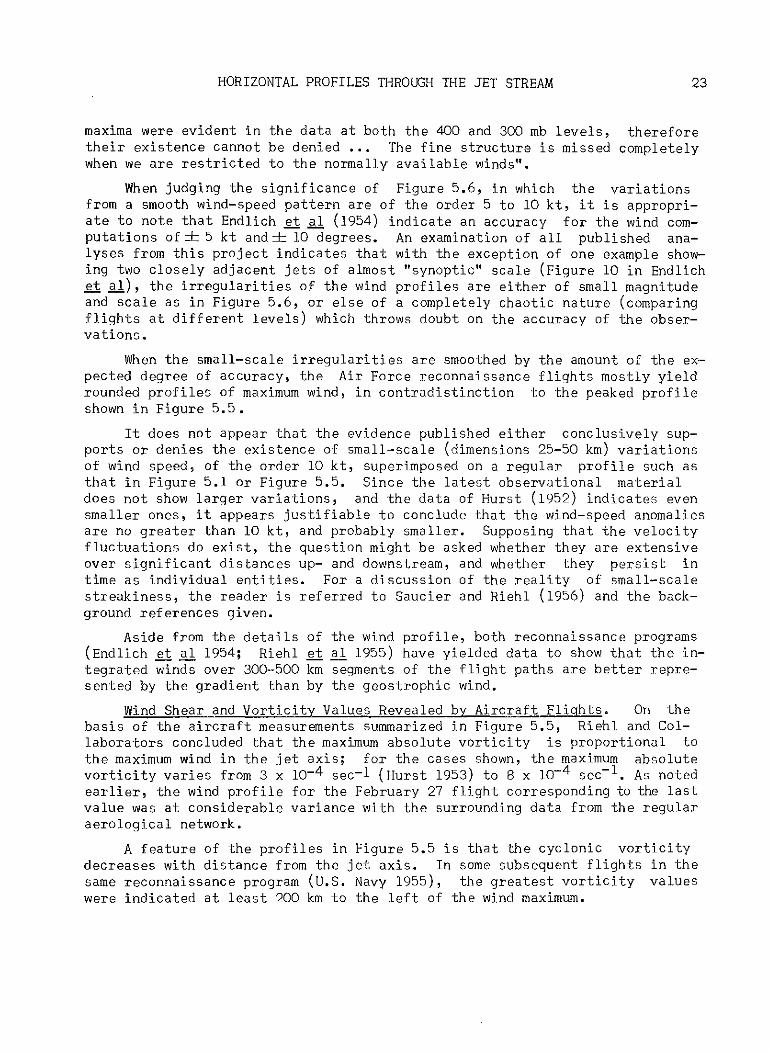
HORIZONTAL PROFILES THROUGH THE JET STREAM 23
maxima were evident in the data at both the 400 and 300 mb levels, thereforetheir existence cannot be denied '" The fine structure is missed completelywhen we are restricted to the normally available winds".
When judging the significance of Figure 5.6, in which the variationsfrom a smooth wind-speed pattern are of the order 5 to 10 kt, it is appropriate to note that Endlich et 21 (1954) indicate an accuracy for the wind computations of=e 5 kt and~ 10 degrees. An examination of all published analyses from this project indicates that with the exception of one example showing two closely adjacent jets of almost "synoptic" scale (Figure 10 in Endlichet 21), the irregularities of the wind profiles are either of small magnitudeand scale as in Figure 5.6, or else of a completely chaotic nature (comparingflights at different levels) which throws doubt on the accuracy of the observations.
When the small-scale irregularities are smoothed by the amount of the expected degree of accuracy, the Air Force reconnaissance flights mostly yieldrounded profiles of maximum wind, in contradistinction to the peaked profileshown in Figure 5.5.
It does not appear that the evidence published either conclusively supports or denies the existence of small-scale (dimensions 25-50 km) variationsof wind speed, of the order 10 kt, superimposed on a regular profile such asthat in Figure 5.1 Or Figure 5.5. Since the latest observational materialdoes not show larger variations, and the data of Hurst (1952) indicates evensmaller ones, it appears justifiable to conclude that the wind-speed anomaliesare no greater than 10 kt, and probably smaller. Supposing that the velocityfluctuations do exist, the question might be asked whether they are extensiveover significant distances up- and downstream, and whether they persist intime as individual entities. For a discussion of the reality of small-scalestreakiness, the reader is referred to Saucier and Riehl (1956) and the background references given.
Aside from the details of the wind profile, both reconnaissance programs(Endlich et ~ 1954; Riehl et al 1955) have yielded data to show that the integrated winds over 300-500 km segments of the flight paths are better represented by the gradient than by the geostrophic wind.
Wind Shear and Vorticity Values Revealed by Aircraft Flights. On thebasis of the aircraft measurements summarized in Figure 5.5, Riehl and Collaborators concluded that the maximum absolute vorticity is proportional tothe maximum wind in the jet axis; for the cases shown, the maximum absolutevorticity varies from 3 x 10⁻⁴ sec- l (Hurst 1953) to 8 x 10⁻⁴ sec-I. As notedearlier, the wind profile for the February 27 flight corresponding to the lastvalue was at considerable variance with the surrounding data from the regularaerological network.
A feature of the profiles in Figure 5.5 is that the cyclonic vorticitydecreases with distance from the jet axis. In some subsequent flights in thesame reconnaissance program (U.S. Navy 1955), the greatest vorticity valueswere indicated at least 200 km to the left of the wind maximum.
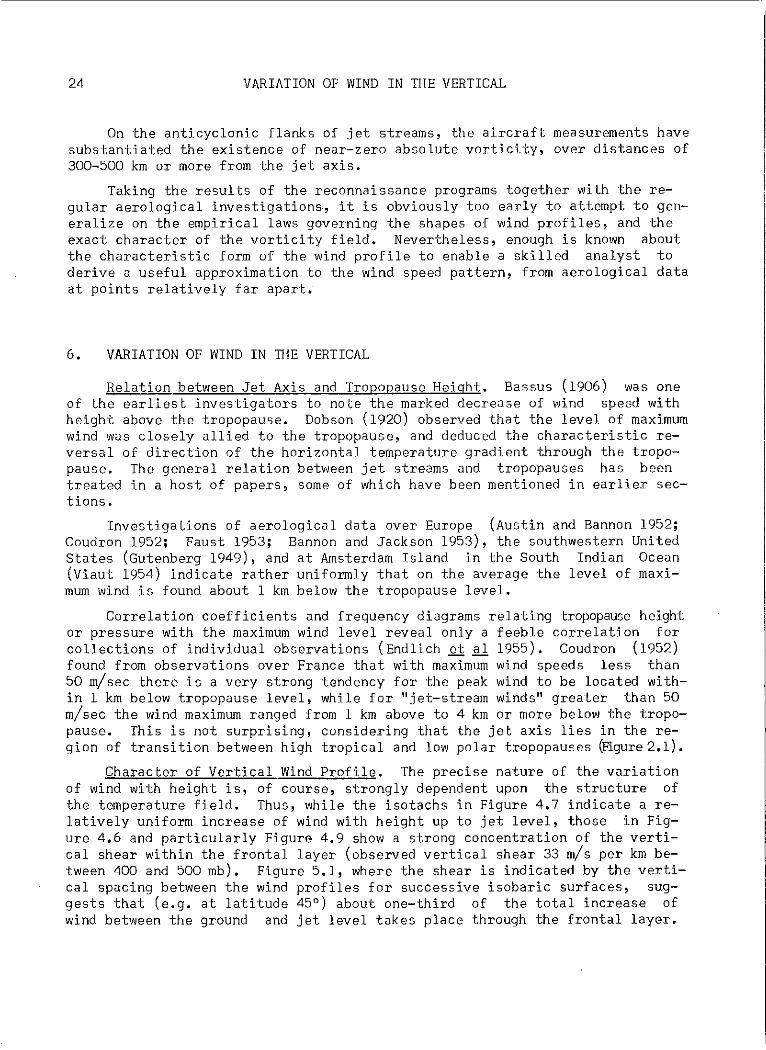
24 VARIATION OF WIND IN THE VERTICAL
On the anticyclonic flanks of jet streams, the aircraft measurements havesubstantiated the existence of near-zero absolute vorticity, over distances of300-500 km or more from the jet axis.
Taking the results of the reconnaissance programs together with the regular aerological investigations, it is obviously too early to attempt to gen··eralize on the empirical laws governing the shapes of wind profiles, and theexact character of the vorticity field. Nevertheless, enough is known aboutthe characteristic form of the wind profile to enable a skilled analyst toderive a useful approximation to the wind speed pattern, from aerological dataat points relatively far apart.
6. VARIATION OF WIND IN THE VERTICAL
Relation between Jet Axis and Tropopause Height. Bassus (1906) was oneof the earliest investigators to note the marked decre~se of wind speed withheight above the tropopause. Dobson (1920) observed that the level of maximumwind was closely allied to the tropopause, and deduced the characteristic reversal of direction of the horizontal temperature gradient through the tropopause. The general relation between jet streams and tropopauses has beentreated in a host of papers, some of which have been mentioned in earlier sections.
Investigations of aerological data over Europe (Austin and Bannon 1952;Coudron 1952; Faust 1953; Bannon and Jackson 1953), the southwestern UnitedStates (Gutenberg 1949), and at Amsterdam Island in the South Indian Ocean(Viaut 1954) indicate rather uniformly that on the average the level of maximum wind is found about 1 km below the tropopause level.
Correlation coefficients and frequency diagrams relating tropopause heightor pressure with the maximum wind level reveal only a feeble correlation forcollections of individual observations (Endlich et al 1955). Coudron (1952)found from observations over France that with maximum wind speeds less than50 m/sec there is a very strong tendency for the peak wind to be located within 1 km below tropopause level, while for "jet-stream winds" greater than 50m/sec the wind maximum ranged from 1 km above to 4 km or more below the tropopause. This is not surprising, considering that the jet axis lies in the region of transition between high tropical and low polar tropopauses ~igure2.1).
Character of Vertical Wind Profile. The precise nature of the variationof wind with height is, of course, strongly dependent upon the structure ofthe temperature field. Thus, while the isotachs in Figure 4.7 indicate a relatively uniform increase of wind with height up to jet level, those in Figure 4.6 and particularly Figure 4.9 show a strong concentration of the vertical shear within the frontal layer (observed vertical shear 33 m/s per km between 400 and 500 mb). Figure 5.1, where the shear is indicated by the vertical spacing between the wind profiles for successive isobaric surfaces, suggests that (e.g. at latitude 45°) about one-third of the total increase ofwind between the ground and jet level takes place through the frontal layer.
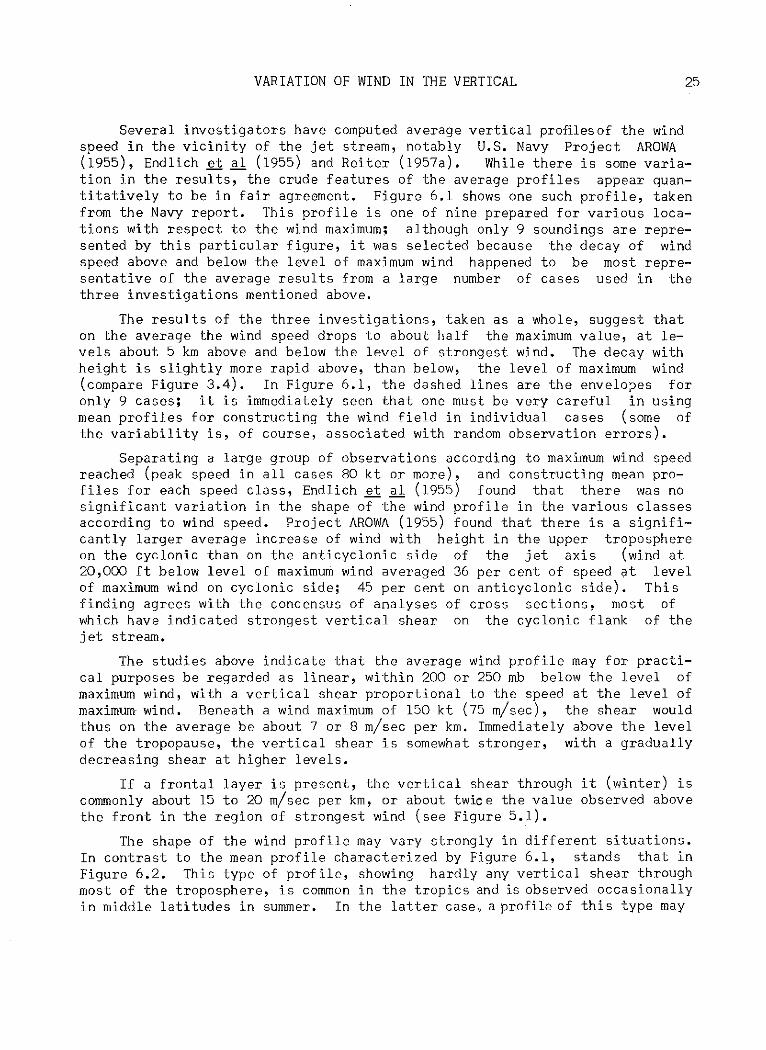
VARIATION OF WIND IN THE VERTICAL 25
Several investigators have computed average vertical profiles of the windspeed in the vicinity of the jet stream, notably U.S. Navy Project AROWA(1955), Endlich et ~ (1955) and Reiter (1957a). While there is some variation in the results, the crude features of the average profiles appear quantitatively to be in fair agreement. Figure 6.1 shows one such profile, takenfrom the Navy report. This profile is one of nine prepared for various locations with respect to the wind maximum; although only 9 soundings are represented by this particular figure, it was selected because the decay of windspeed above and below the level of maximum wind happened to be most representative of the average results from a large number of cases used in thethree investigations mentioned above.
The results of the three investigations, taken as a whole, suggest thaton the average the wind speed drops to about half the maximum value, at levels about 5 km above and below the level of strongest wind. The decay withheight is slightly more rapid above, than below, the level of maximum wind(compare Figure 3.4). In Figure 6.1, the dashed lines are the envelo?es foronly 9 cases; it is immediately seen that one must be very careful in usingmean profiles for constructing the wind field in individual cases (some ofthe variability is, of course, associated with random observation errors).
Separating a large group of observations according to maximum wind speedreached (peak speed in all cases 80 kt or more), and constructing mean profiles for each speed class, Endlich et al (1955) found that there was nosignificant variation in the shape of the wind profile in the various classesaccording to wind speed. Project AROWA (1955) found that there is a significantly larger average increase of wind with height in the upper troposphereon the cyclonic than on the anticyclonic side of the jet axis (wind at20,000 ft below level of maximum wind averaged 36 per cent of speed at levelof maximum wind on cyclonic side; 45 per cent on anticyclonic side). Thisfinding agrees with the concensus of analyses of cross sections, most ofwhich have indicated strongest vertical shear on the cyclonic flank of thejet stream.
The studies above indicate that the average wind profile may for practical purposes be regarded as linear, within 200 or 250 mb below the level ofmaximum wind, with a vertical shear proportional to the speed at the level ofmaximum wind. Beneath a wind maximum of 150 kt (75 m/sec), the shear wouldthus on the average be about 7 or 8 m/sec per km. Immediately above the levelof the tropopause, the vertical shear is somewhat stronger, with a graduallydecreasing shear at higher levels.
If a frontal layer is present, the vertical shear through it (winter) iscommonly about 15 to 20 m/sec per km, or about twice the value observed abovethe front in the region of strongest wind (see Figure 5.1).
The shape of the wind profile may vary strongly in different situations.In contrast to the mean profile characterized by Figure 6.1, stands that inFigure 6.2. This type of profile, showing hardly any vertical shear throughmost of the troposphere, is common in the tropics and is observed occasionallyin middle latitudes in summer. In the latter case, a profile of this type may
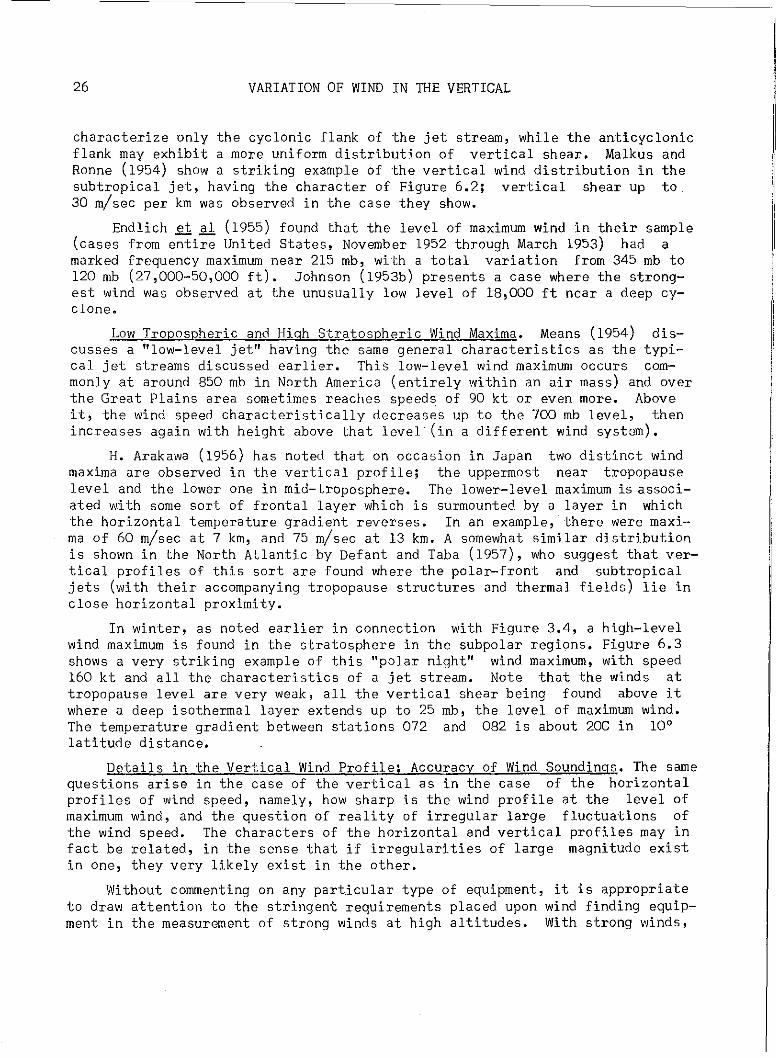
26 VARIATION OF WIND IN THE VERTICAL
characterize only the cyclonic flank of the jet stream, while the anticyclonicflank may exhibit a more uniform distribution of vertical shear. Malkus andRonne (1954) show a striking example of the vertical wind distribution in thesubtropical jet, having the character of Figure 6.2; vertical shear up to30 m/sec per km was observed in the case they show.
Endlich et al (1955) found that the level of maximum wind in their sample(cases from entire United States, November 1952 through March 1953) had amarked frequency maximum near 215 mb, with a total variation from 345 mb to120 mb (27,000-50,000 ft). Johnson (1953b) presents a case where the strongest wind was observed at the unusually low level of 18,000 ft near a deep cyclone.
Low Tropospheric and High Str~tospheric Wind Maxima. Means (1954) disCUsses a "low-level jet" having the same general characteristics as the typical jet streams discussed earlier. This low-level wind maximum occurs commonly at around 850 mb in North America (entirely within an air mass) and overthe Great Plains area sometimes reaches speeds of 90 kt or even more. Aboveit, the wind speed characteristically decreases up to the 700 mb level, thenincreases again with height above that level· (in a different wind system).
H. Arakawa (1956) has noted that on occasion in Japan two distinct windmaxima are observed in the vertical profile; the uppermost near tropopauselevel and the lower one in mid-troposphere. The lower-level maximum is associated with some sort of frontal layer which is surmounted by a layer in whichthe horizontal temperature gradient reverses. In an example, there were maxima of 60 m/sec at 7 km, and 75 m/sec at 13 km. A somewhat similar distributionis shown in the North Atlantic by Defant and Taba (1957), who suggest that vertical profiles of this sort are found where the polar-front and subtropicaljets (with their accompanying tropopause structures and thermal fields) lie inclose horizontal proximity.
In winter, as noted earlier in connection with Figure 3.4, a high-levelwind maximum is found in the stratosphere in the subpolar regions. Figure 6.3shows a very striking example of this "polar night" wind maximum, with speed160 kt and all the characteristics of a jet stream. Note that the winds attropopause level are very weak, all the vertical shear being found above itwhere a deep isothermal layer extends up to 25 mb, the level of maximum wind.The temperature gradient between stations 072 and 082 is about 20C in 10°latitude distance.
Details in the Vertical Wind Profile; Accuracy of Wind Soundings. The samequestions arise in the case of the vertical as in the case of the horizontalprofiles of wind speed, namely, how sharp is the wind profile at the level ofmaximum wind, and the question of reality of irregular large fluctuations ofthe wind speed. The characters of the horizontal and vertical profiles may infact be related, in the senSe that if irregularities of large magnitude existin one, they very likely exist in the other.
Wi thout commenting on any particular type of equipment, it is appropriateto draw attention to the stringent requirements placed upon wind finding equipment in the measurement of strong winds at high altitudes. With strong winds,
VARIATION OF WIND IN THE VERTICAL 27
it is quite common for a meteorological balloon to be observed at angles lessthan 10° above the horizon, when the balloon is at high altitudes. At thiselevation angle, if the balloon is at 12 km height and its elevation is measured incorrectly by 0.1°, a trigonometric error of position amounting to 720mwill result. Two successive noncompensating errors of this size, at oneminute intervals, would lead to an error in wind computation of 24 m/sec or47 kt.
In principle, modern automatic direction-finding equipment is capable ofmeasuring angles with an estimated accuracy of~ 0.05° or less (Ference, 1951).Unfortunately, derangement of calibration takes place in field use, and testsat field stations often show much greater fluctuations of an obviously spurious nature, as vividly illustrated by the wind profile in Figure 6.4 (Reiter,1957a). While this is an extreme example, irregular fluctuations of 20 to 50kt in 1-2000 ft are Common with radio direction-finding equipment under strongwind conditions (see, e.g., specimens shown by Clem, 1954). In view of thevariability of types of equipment and of operating conditions, no categoricalstatement of the size of errors can be made. Thus one can never be certainwhat part of the irregularities such as shown in Figure 6.4 are real, butthere is a strong presumption (supported by unpublished records and hearsayreports of station equipment tests) that the fluctuations are mainly spuriousand should be disregarded. The seriousness of the problem of representativeness of wind soundings has been recognized by the official weather services,and improvements (considering the character of the equipment, largely havingto do with faster-rising balloons and larger smoothing intervals) Can fortunately be expected. Meanwhile, it is essential to realize the limitations ofthe available wind reports. The consequence of not taking a realistic view ofthese limitations is brought out by comparison of the transmitted wind report(Figure 6.4) with the original speed profile. The message sent for upper levels, using the present coding technique, depends largely upon random circumstances in just where a standard level lies on the plotted sounding curve. AsReiter points out, the selection of standard levels for transmission at, say500 m higher, would have resulted in an entirely different wind profile withapparent levels of maximum wind elsewhere than indicated by the profile forthe coded report in the figure. The manner of selection of winds at standardlevels for broadcasting seriously affects the quality of individual wind reports used in constructing constant-level or isobaric analyses.
The above remarks are intended to apply to visual or radio direction-finding methods, which are used at the bulk of the wind-finding stations in mostregions. Radar and radarsonde observations, in which the slant range is measured and which are not so critically dependent upon the accuracy of measurement of angle (Jones, 1949), are inherently very much more accurate. Windsmeasured by the British (radar) system, for example, do not show the greatfluctuations as in Figure 6.4.
In light of what has been said above, it is evident that nothing can besaid with assurance about the sharpness of the wind profile at the peak windspeed, the determination of which would depend upon very accurate measurementof speeds at close height intervals which are in principle impossible with
28 CLEAR AIR TURBULENCE AND THE JET STREAM
ordinary wind-finding equipment. Thus for example the contention by Endlichet.i!l (1955) that there isa sharp peak at jet level, with an abrupt changefrom a rather uniform increase of wind with height below to a pronounced decrease with height above maximum wind level, rather than a more moderatelyrounded wind profile as suggested by cross-section analyses, can neither beconfirmed nor disproved by the wind observations. In this regard, it shouldbe pointed out that if the wind field conforms at all well to the geostrophicor gradient-wind relationship,a sharp peak is to be expected only under special circumstances. A discontinuity in the vertical shear, as shown.by Palmen(1948b) would only be expected on a surface through which there is an abruptdiscontinuity of the horizontal temperature gradient. A sharp peak of thewind profile is thus to be expected only where the strongest wind coincideswith a sloping tropopause. As noted earlier this is not usually the case, thejet being in most cases found some distance below the tropopause.
Maximum Observed Wind Speeds. In popular press and radio accounts, thejet stream is often described as having characteristic speeds of 300 kt ormore. Several widely publicized upper wind observations have indicated speedsgreater than this value. The U.S. Air Weather Service (1955) reports that allsuch cases which have been checked have proven to be erroneous.
The excessive speeds may be due to oscillations in angular measurementsby direction-finding equipment, such as involved in Figure 6.4, or to a variety of other causes. An important contributing cause, only recently recognized, is failure to take the sphericity of the earth into account when computing the horizontal distance to a balloon. This factor tends to make "flatearth" trigonometrically-computed distances and speeds too great. Under Common conditions (see Gustafson 1954), if sphericity is not taken into accountan overestimate of 30 to 40 kt can result, if the wind is 200 kt at jet-streamlevel; the error is greater for stronger winds.
On the other hand, bona fide wind speed measurements in excess of 200 kthave been made on many occasions (for a synoptic example, see Foster andRobinson 1953). The Air Weather Service report (1955) lists four legitimateobservations of speeds greater than 250 kt in the Northern Hemisphere. Two ofthese were made at Tateno, Japan, using a system by which a balloon is released at Honjo (88 km west) and observed in relay by Honjo and Tateno stations. Since the~ maximum speed in the jet over southern Japan in winteris around 180 kt, it is likely thBt speeds up to 300 kt may occur on occasion.In the run-of-the-mill winter jet streams of the Northern Hemisphere, localmaximum velocities reached appear usually to be between about 140 and 200 kt(for a regional appraisal, see Cunningham 1956b); while in summer the characteristic maxima are 1/2 to 2/3 these speeds.
7. CLEAR AIR TURBULENCE AND THE JET STREAM
Clear air turbulence can be experienced at all altitudes from the groundup to the ceiling level of conventional aircraft. In lower levels it is obvious that turbulence may OCCUr during certain meteorological conditions and
CLEAR AIR TURBULENCE AND THE JET STREAM 29
it is mostly foreseen by the pilot. Thus, he has time to reduce the speed ofthe aircraft and to be on the alert in this respect. At higher levels, however, clear air turbulence most often occurs without any warning whatsoeverto the pilot. Thus, the aircraft enters the turbulent region with a normalcruising speed, which means that the effect of the turbulence on the aircraftat times may be severe.
During the last ten years a number of papers dealing with the problem ofclear air turbulence have been published. Most of them only discuss reportsfrom an altitude greater than, say, 4000 m. For the discussion in this paper,howev~r, this restriction has no negative effect.
Before going into more details a discussion of the difficulties one encounters when studying the problems of clear air turbulence must be mentioned.
Most of the published reports of clear air turbulence come from westernEurope and the North American continent, with a few scattered reports fromother locations. The reports represent, however, a very heterogeneous sample.The type of aircraft and the height of the turbulence regions vary considerably and sometimes the reports fail to give these details. The number of reports is as a whole rather limited, and furthermore they most often representpositive reports. The fact that a report is not available for a certain region and for a certain time can mean either that (a) no turbulence was observed, (b) turbulence was observed but not reported, or (c) no aircraft wasat the specified location at the specified time.
A comparatively small percentage of the turbulence reports give the effect of the turbulence on the aircraft in terms of accelerometer readings.Most often only subjective measurements are given. An example of the subjec-tive definitions are given by the following list, which can be found on anICAO form: slight (perceptible), moderate (difficulty walking), and severe(objects thrown about cabin).
Finally it must be emphasized that the study of the meteorological conditions prevailing in areas with turbulence is hampered by two effects. Firstthe upper air network is sparse even in areas where it is densest; secondly,the turbulence reports are most often not synchronous with the meteorologicalreports.
The above-mentioned difficulties have been allowed for in different ways.One of the first attempts to tackle the problem of clear air turbulence wasmade by the British European Airways. In this case a Mosquito aeroplane wassent out on search flights on the different BEA routes in Europe (Hislop,1951), using a systematic flight technique in order to insure a maximum possibility of encountering turbulence. In the test period discussed by Lake(1956), the attempt was made to get a maximum number of reports at the hoursof the upper air soundings (0300 and 1500 GMT). Many others have picked outonly those reports that are within a reasonable distance in space as well asin time from an upper air sounding.
When studying the meteorological conditions in connection with turbulencereports different authors have put the emphasis on different meteorologicalvariables. The importance of low values of Richardson's number (proportional
30 CLEAR AIR TURBULENCE AND THE JET STREAM
to thermal stability and inverse of vertical shear) has been stressed by some(Bannon, 1951b, 1951d; Jones, 1954; Hislop, 1951), while others have disregarded the vertical stability and only considered the vertical wind shear(Mook, 1952). Lake (1956) studied the vertical gradient of the horizontalkinetic energy and the product of the horizontal wind speed and the verticalgradient of the wind shear. The importance of horizontal wind shear has beenmentioned by many authors : (Bannon, 1951b, 1951d; Berggren, 1952; Harrison,1950, 1951; Mook, 1952; Arakawa, 1953). In some papers a discussion isgiven about the connection between turbulence and the tropopause (Bannon,1951d; Hislop, 1951), and in others between turbulence and fronts (Aanensen,1948; Berggren, 1952; Frost, 1953; Pothecary, 1953).
It would lead too far to discuss in this paper the many aspects of thevery complex question of clear air turbulence. The reader is referred to theabove-mentioned papers by Hislop (1951), Mook (1952), Lake (1956) as well asto a detailed study pUblishedby Chambers (1955). The latter author gives manyexamples of cases with turbulence together with corresponding upper air charts.He states that clear air turbulence has not been a problem on BOAC flightsover the London-Far East and the London-South Africa routes.
By definition a jet stream is connected with large values of the horizontal and vertical wind shear. From the discussion above it is thereforeclear that an aircraft flying in a jet stream area in many cases may encounterclear. air turbulence. In this connection two questions immediately arise.First, what is the probability that clear air turbulence will be encounteredby an aircraft flying in a jet stream, and second, in which part of the jetstream as seen in a Cross section will the turbulence most likely occur?
The first question is not dealt with so much in the literature. Some figures may, however, be quoted. According to Hyde (1954), clear air turbulencewas observed in· 40 per cent of the cases when a jet stream existed in the areacovered by the flight. Jones (1954) discusses special flights made throughjet streams over the British Isles. Out of 30 such flights 28 were successful;that is, the aircraft encountered clear air turbulence. Of the 28 cases, onethird contained reports of slight turbulence, one-third gave moderate turbulence and one-third severe turbulence.
In Chambers' (1955) paper, however, the figure is much lower. For theBOAC flights Over the routes from London to the Far East and South Africa clearair turbulence was encountered in 18 per cent of the jet-stream cases. Thesame indication is given in a report by Riehl, Berry, and Maynard (1955) onthe jet-stream investigations over eastern North America during the winter1952-53. In their paper, these authors state that strong jets were virtuallywithout turbulence, in spite of intense lateral wind shear, and that the record as a whole indicated only weak turbulence areas.
Most papers containing statistics about clear air turbulence and jetstreams give the percentage of positive turbulence reports in connection witha jet stream out of the total number of positive reports. Bannon (1951b) statesthat out of 296 reports 69 (23 per cent) were in connection with a jet stream,defined by him as a localized current with a speed equal to or greater than
CLEAR AIR TURBULENCE AND THE JET STREAM 31
the corresponding figures forof a total of 97 cases 69 (71Jones (1954) has the figures
80 kt. In another paper (1951d) he has studiedreports of heavy turbulence only and finds thatper cent) occur in connection with jet streams.147 and 105 respectively, i.e. 72 per cent.
It ought to be pointed out here that all these authors have used different definitions of a jet stream as no generally accepted definition was available to them.
The question of determining the position of the turbulent areas with respect to the jet stream has been tackled by Bannon (l951d, 1952) in the following manner. For each individual jet stream a horizontal length unit was determined to be the distance from the jet axis to the point on the low pressure side where the wind velocity at the level of maximum wind had decreasedto half its maximum value. This distance was on the average 170-225 km. Asvertical coordinate a logarithmic pressure scale was used, measuring the pressure distance from the jet axis. Then, the coordinates for the turbulencelocations were determined in this coordinate system for each turbulence report. These reports were then plotted on a mean cross section through thejet stream (Figure 7.1).
As can be seen from the figure, most of turbulent areas are on the lowpressure side of the jet. Very few observations stem from the lower half ofthe anticyclonic side. No turbulence was reported near the jet axis. This isin good agreement with a statement made by Frost (1953): "Once in the jetstream, contrary to general belief, flying conditions are usually velvetysmooth".
In Figure 7.1 the average distance of turbulence reports from the jetaxis towards the cyclonic side seems to be of the order of 100 km. Jones(1954) has applied Bannon's technique on a sample of 147 cases with heavy turbulence. His result is in agreement with Bannon's findings. Jones gets 75per cent of the· cases on the low pressure side and 10 per cent in the lowerhalf of the anticyclonic side. The horizontal distance unit is in his caseabout 250 km, and the average distance of the turbulence areas from the jetaxis towards the cyclonic side is of the order of 100-150 km.
It seems to be well established that the clear air turbulence that occursin connection with a jet stream is more persistent in time and more widespreadin space than normal with this type of turbulence (areas of characteristicwidth 50-75 km, dimension unknown along wind direction, depth 2-3000 ft). Furthermore, the relation between jet and turbulence seems to be more marked incases of severe turbulence than in cases of light turbulence.
So far, only wind variations in a vertical plane normal to the jet-streamaxis have been discussed. As mentioned in Section 5 above, pronounced variations of the maximum value of the wind speed occur along the jet axis. If onestudies, e.g., 300 mb charts with isotachs, one often finds marked areas ofisotach concentration with a large gradient of the wind velocity also in thedirection of the wind (see Figurre4.5, 5.2). These closed isotachs oftenmove through the large-scale wave patterns, and may for example be found atone time west of a given trough and later on east of the same trough. When
32 CLEAR AIR TURBULENCE AND THE JET STREAM
studying the vertical variation of the wind velocity above a certain geographic point one may observe a large variation with time of the vertical windshear even if the jet-stream axis is found above the station all the time.
This special aspect of the problem of the interrelationship between jetstream and clear air turbulence has been discussed by Clem (1954). He statesthat most cases of turbulence in connection with a jet occur in connectionwith the passage of a velocity maximum. The stability variations related tothe passage may also have some bearing on the OCCurrence of turbulence (forremarks on the sharp irregular vertical variations in wind speed which Clemconnects with the turbulence, see preceding Section). Clem's observation hasbeen substantiated in a study conducted by the U.S. Air Weather Service (1956).Chambers (1955) states that clear-air turbulence in its severest form mayoften occur near the "exit" of a well-developed jet stream, or in an area associated with a "fork" or "bend" in the axis.
Special flights made in box fashion parallel to and across the jet stream(Clodman, 1957) have revealed that clear-air turbulence makes itself felt muchmore strongly when the aircraft is flying parallel to the wind direction, thanwhen it is flying crosswind. Although this conclusion is opposite to thatreached in an earlier study (U.S. Navy 1955), it was stated in that study(based on frequency analyses of accelerometer records rather than pilot's estimate of turbulence) that the records analyzed did not justify a firm conclusion. Clodman's results may explain some of the differences in incidenceof turbulence noted between the other investigations cited above. The flightsin some of those investigations were, for example, primarily conducted insuch a manner (flying across the wind) that turbulence may have been minimized.
The above brief discussion of the connection between clear air turbulence and the jet stream shows the complexity of the problem. The turbulenceseems often to be of a patchy nature and the number of observations is fartoo small. Moreover, the reports have to be of a more homogeneous nature before we can hope to see a theory of clear air turbulence be developed. At thepresent time, to judge by the differencesin approach to the problem, opinionSeems to be divided in regard to the basic question whether horizontal or vertical eddies (or both) are involved.
Aside from turbulence associated with the jet stream as such, topographicfeatures. have to be considered in some localities. According to Turner (1955),clear-air turbulence over Great Britain appears in SOme cases to be clearlyrelated to the topography; such turbulence is often distinguishable from,but may occur along with, standing waves due to orography. An example of severe clear-air turbulence (Canberra aircraft at 40,000 ft turned upside down)occurring in connection with standing waves is given by Jones (1955). Basicvertical motions in the waves (which may be smooth or turbulent) range up to15 m/sec, or more in some localities (for example in the lee of the SierraNevada of California). Although the occurrence of standing waves is not restricted to the immediate neighborhood of jet streams (the waves being primarily related to strong winds and stable conditions at hill- or mountain-top level), the strongest waves generally do occur in jet-stream situations (Jenkins
CLOUDS AND THE JET STREAM 33
1952, Colson 1954). Turner (1955) and Jones (1955), as well as Radok (1954a),suggest that locally the turbulence associated with jet streams may be ihtensified by interaction with the orographic waves.
8. CLOUDS AND THE JET STREAM
It has been known for a long time that some close connection exists between certain synoptic features and the upper winds. Already in 1913 Hesselbergpublished an investigation into the movement of cirrus clouds, and the highmean values of the speed of movement of medium and high clouds as observed atBlue Hill Observatory in the northeastern Unites States were known early.These values were rather high for that time and at first were regarded assomewhat doubtful. Later investigations have shown, however, that the areaunder consideration is characterized by high upper winds (Figures 3.2, 3.3;for an interesting comparison of old cloud speed data with up-to-date meancharts, see Jenkinson 1954).
When the concept of the jet stream was brought into meteorology it becameof interest to investigate whether or not there was any connection between certain types of clouds and the jet stream. An investigation of this kind can becarried out in different ways, and in this section three different methodswill be discussed.
The first method, introduced by Sawyer in 1951 is a statistical one, whichtries to take the conditions around many jet streams into account, using theposition relative to the jet-stream core, entrance, and exit as a referencesystem. Thus, when using this method one is in principle not interested inthe geographical location of the phenomena.
The second approach is that of Schaefer (1953b) and Schaefer and Hubert(1955). In this case the observer is placed at a fixed location (mainlySchenectady in the northeastern part of USA) and studies the distribution ofclouds with relation to jet streams that are passing over the observer's head.To a large extent this study is carried out with the aid of color photos andfilms.
The third method may be called the pilot's method, i.e. a cloud studymade by a pilot when flying in a jet stream. This point of view was discussedby Frost (1953, 1954), a pilot of the British Overseas Airways Corporation.
The method of analysis used by Sa~~er and Ilett (1951) is described bythem in the following way : "The period covered by the analysis was the year1949. Occasions of jet streams passing over or within about 500 miles of theBritish Isles were noted by examination of the 300 mb contour charts drawn regularly at the Central Forecasting Office. For this purpose a belt of approximately straight flow with a maximum wind speed (observed or geostrophic) at300 mb of 70 kt or more was taken as defining a 'jet stream'. However, in orderto see if the chosen lower limit of velocity had any effect on the results,the statistical analysis was also completed separately for those cases in which
34 CLOUDS AND THE JET STREAM
the wind speed exceeded 120 kt.of greatest velocity, was noteddistribution of medium and high
The axis of the jet stream, that is the lineon the charts for 1500 GMT each day, and thecloud examined in relation to this.
"All available observations of medium and high cloud for 1500 GMT wereanalysed in relation to their position with respect to the axis of the jetstream. The present scheme of synoptic reporting does not make provision forreports of the amount of the medium and high cloud layers on all occasions.However, an estimate of the amount of both medium and high cloud was made onthe basis of the total amount of cloud reported and the amounts reported inlower cloud layers. For this purpose it was assumed that the same proportionof the whole sky was covered by medium and high cloud as in the part of thesky visible through the low cloud. If the amount of low cloud was less than4 octas and no upper cloud was reported, both cirrus and medium cloud wereassumed to be absent. Occasions of 4 octas of low cloud or more and no mediumor cirrus observed were not included in the statistical summaries.
"In order to analyze the distribution of cloud in relation to the axis ofthe jet stream, the area around the jet stream was divided into eight sectionsas indicated in Figure 8.1. The area was divided first into bands parallel to,the jet stream and 200 miles wide, and secondly by a line perpendicular to theaxis through its mid point, dividing the jet stream into two equal sectionslongitudinally from the entrance to the mid point and from the mid point to theexit. The letters in Figure 8.1 have been used to define the sectors in thetabular results."
Tables 1 and 2 give the results of the analysis. From the tables we cansee that the amount of cirrus of 4 octas or more are more frequent to theright of the jet-stream axis than to the left. According to the authors thisdistribution was slightly more pronounced with the stronger jets. Furthermore,the amount of medium clouds are slightly less in Sectors A and B. The frontaland layer types of cirrus are more common to the right of the jet-stream axis,while anvil cirrus clouds (type 3) are much more common to the left of theaxis. These features were better developed with the stronger jets, accordingto the authors. Finally, the tables reveal very clearly that altocumuluscumulogenitus (type 6) are much more common to the left than to the right ofthe jet axis. On the other hand, frontal types of altostratus and altostratuscastellanus were more common to the right of the jet stream.
The above findings are in good agreement with the distribution of cloudtypes that could be anticipated from Figure 4.9. To the left of the 300 mbjet stream the cold air masses are deep enough to allow considerable verticalgrowth of the cumulus clouds, while most of the upgliding motion OCCurs in thearea to the right of the 300 mb jet stream. In most cases with a well definedlimit of an area of cirrus clouds, this boundary lay near the jet-stream axis,and this was particularly the case when the jet was connected with an activefront.
Jet streams over ridges of high pressure on the sea level chart were quiteoften characterized by small or no cloud amounts in all sectors.
The statistical study discussed in this paragraph has some shortcomingsthat reduce the value of the analysis: (a) It is difficult to place the exact
CLOUDS AND THE JET STREAM 35
center of the jet stream with smaller error than about 300 km in the areaunder consideration. (b) The exact amount of medium and high clouds was sometimes difficult to evaluate because of existing low clouds. (c) The reportsof the amount and type of the medium and high cloud are uncertain. (d) It isreasonable to assume that the cloud observations are more representative forthe central portion of the jet stream, longitudinally speaking, than for theexit and entrance regions. (e) The investigation is restricted to a certaingeographical area and the results are strictly applicable only to this area,their applicability to other areas depending upon whether the main featuresof the jet stream (e.g. vertical motion pattern, moisture, stability) have ageneral application or not. Finally, (f) the number of individual jets andthe corresponding number of cloud observations are not given.
In his first paper Schaefer (1953b) describes four different types ofhigh and medium clouds that according to his observations show high correlation with the existence of a jet stream aloft. The four classes of clouds(see original article for examples in color) are: 1. High clouds (type 4 and5); cirrus streamers of great complexity moving at high velocity and showinglong tufted streamers, complex shear lines, and massive whorls (illustratedby Figure 8.2). 2. High clouds (type 9); cirrocumulus in blanket-like massesscattered in a random fashion although sometimes in a line showing evidence ofbeing at the crests of undulations in the stream. Clouds sometimes changingin character, shifting rapidly to cirrus streamers or showing fine structuredwaves at very high altitudes; some blankets show high order Tyndall spectrain green, red, and other colors when near the sun (illustrated by Figure 8.3).3. Middle clouds (type 4 and 7); altocumulus lenticular wave clouds sometimesin great profusion with large lateral dimensions in the direction of flow ofthe stream; often with considerable vertical depths and piling up in manylayers. Such clouds show little apparent relationship to ground topography,although they are basically "standing" clouds and, therefore, do not exhibitrapid movement except when snow is shed from them. When this occurs, long·streamers may extend downwind for many miles to emphasize the high velocitynature of the air. When near the sun high order Tyndall spectra colors arecommonplace (illustrated by Figure 8.4). 4. Middle clouds (type 3 and 5); abillow type cloud which may extend from horizon to horizon with the waves inparallel bands at right angles to the air flow. At times the cloud sheet mayappear as a relatively thin layer with the units more cellular in form (illustrated by Figure 8.5).
Schaefer gives a preliminary rule of thumb method for the detection of ajet stream from cloud observations made at the ground. If three of tha cloudtypes described above can be observed and there also is evidence of high velocity movement and coherency, then a jet stream is likely to be in the nearproximity of the observer. If all four cloud types occur, Schaefer considersthe evidence complete.
So far no discussion of the distribution of the clouds with respect tothe jet-stream axis was made by Schaefer. In the next paper (Schaefer andHubert, 1955) such an attempt was made.
In this paper Schaefer and Hubert try to find an explanation fo~ the"turbulent motion" cloud types which have been observed in connection with jet
36 NAVIGATIONAL ASPECTS OF THE JET STREAM
streams, and 'their position relative to the jet axis. The fact that the vertical compOnent of the absolute vorticity often is near zero or at timesacquires negatiVe valu'es to the right of the jet axis, looking downwind, iscombined with the known distribution of the Richardson's number (Figure 8.6).Now, if the large-scale distribution of the vertical velocity is such thatthe' air on the high pressure side of the jet stream is brought to or near tosaturation, the onset of turbulence as indicated by low Richardson's numbermay give rise to sOme of the specific jet stream cloud types as are discussedearlier. It is interesting to notice that according to Figure 8.6 the preference for these types of clouds is to the right of the jet axis, in goodagreement with the findings of Sawyer and Ilett. The cloud pictures in FigUres 8.7 and 8.8 were taken at Schenectady, whose position is indicated inFigure 8.6, near the time of that section.
Schaefer and Hubert mention in their paper that some indication ,of a rolling motion about horizontal axes have been found in lapse-time photographsof jet-stream clouds. This type of motion was postulated by Rossby (1953) fornarrow oceanic currents.
In an article published in 1953, Frost gives two interesting examples ofjet-stream clouds. On one occasion he was flying at about 5500 m and 3000 mbelow a narrow long cloud streak; While flying under the cloud he experienceda wind of 138 kt, exactly in line with the cloud streak. At another occasionhe flew with a dead tail ~ind of 148 kt for about 2700 km directly under athin cloud not more than about 2 km wide.
In a second article (1954) Frost gives a third example of a narrow jetstream-cloud extending over large distances downwind. A cloud at about 6600 mwas observed to reach from horizon to horizon but was only a few km wide.The cloud was observed to move eastward with a speed of 180 kt. On the sameoccasion Frost observed that the cloud had a 'well-defined edge on the pola~
side. This ,is in agreement with the findings of Sawyer and Ilett.
Finally, Frost gives indications that a line of cirrus cloud parallelingthe jet stream had a rolling motion ofa clockwise nature when viewed downwind.This note is interesting because it is in agreement with the statement bySchaefer and Hubert discussed above.
9. NAVIGATIONAL ASPECTS OF THE JET STREAM
In this section, a brief discussion of some special aspects of the jetstream is given. No systematic scheme of how to fly in a jet stream can begiven in this general paper. Most of the facts that will be brought forwardhere have been mentioned before in earlier sections, more or less explicitly.The related problems of clear air turbulence and clouds in the jet-stream areahave been covered earlier.
Already in the early days of aviation history jet streams have upsetoperations. The number of such incidents was, however, small because of the
NAVIGATIONAL ASPECTS OF THE JET STREAM 37
low ceiling of the first aircraft. In a paper by Durst and Davies (1949) acas~ from World War I is mentioned where a German zeppelin air raid on theBritish Isles was hampered by the existence of strong upper winds.
When the ceiling of aircraft increased, the number of jet-stream incidents grew larger. During World War II it became more and more common thatpilots and navigators reported very strong upper winds, and eventually meteorologists had to face the difficult problem of forecasting upper windspeeds of 100-200 kt or even more. Some figures quoted by Jacobs (1955) maybe of interest to illustrate the difficulties; a local decrease of wind from200 to 72 kt during 3 hours at 12 km, and a vertical increase of 150 kt in900 m. Practical operations have belied the opinion held earlier by many,that use of faster aircraft would make the influence of the wind less important. On the contrary, an accurate knowledge of the wind field is criticalfor the economical operation of such aircraft on long-distance flights (for aspecific example, see Great Britain Meteorological Office, 1955).
The general question of forecasting upper level winds for aircraft hasbeen discussed in great detail by Durst (1954a, 1954b) and by Rutherford (1956),who point out that there are navigational as well as meteorological limitations to the accuracy to be expected in utilizing wind forecasts. No attemptcan be made here to summarize the general navigational aspects.
For the pilot-in-command and the dispatching organization the question is:Will there be jet-stream conditions during flight, and if that is the casewill it be a head wind or a tail wind? If it is a tail wind the question ishow to find it and stay in it during flight. In the case of head winds onewill try avoid the jet-stream core, and if one happens to strike one, the problem is how to get out of it quickly. We will first deal with the above questions for flights well below the jet-stream core, that is on an average below8 to 10 km.
The value of a thorough pre-flight briefing cannot be over estimated. Ifthe pilot and the flight operations officer can get an accurate view of theflight conditions well in advance of the time of departure, much is to begained. The overall weight of the aircraft is predetermined, and every kilogram saved in fuel weight means more paying goods, either passengers orfreight.
Furthermore, it is very important for the pilot to get a hint of the different possibilities of development of the upper air currents. If the forecast goes wrong it is very helpfUl for him to know which direction the development may have taken. Let us take one example·: A forecaster is basing hisupper wind forecast on the assumption that a frontal wave will develop into amajor storm that will be near the flight path of the aircraft, and has informed the. crew of this assumption. Now, if the navigator during flight findsout that the actual winds are much weaker than forecast and he· at the sametime can see that no heavy cloud system can be found, he knows that it wouldbe useless to try to chase strong winds in that area.
When in strong tail winds, it is the goal of the navigator to keep theaircraft in the jet stream if possible. If the flight is undertaken at a level
38 NAVIGATIONAL ASPECTS OF THE JET STREAM
below the jet-stream axis, then the aircraft thermometer can be used as awind indicator (Davis, 1954). As can be seen from Figure 4.6 or 4.9, an aircraft flying downstream in the maximum winds will have strong horizontal temperature gradients on its left side and weak gradients to its right. If thethermometer readings, which ought to be taken every 10 or 15 minutes, using avortex thermometer, show that the ambient temperature is rapidly falling off,then the aircraft is flying in rapidly decreasing tail winds and ought tomake a right turn back to higher temperatures.
On the higher-pressure side of the jet stream, the horizontal wind shearis smaller than on the left side. Thus, if the aircraft is misplaced towardsthe high-pressure side with regard to the jet core, it will not experiencesuch rapid falling off of the tail wind component. The navigator can in thismanner keep the aircraft in high tail winds with the aid of the thermometer.
As a first approximation, in searching for the jet-stream axis, somehelp can be derived from the tendency for certain particular temperatures tobe associated with the warm-air side of the frontal zone where strongest windsare .found. McIntyre (1955) found that over southern England there is a strongassociation between the jet axis and a 500 mb temperature of -22°C; Sorebreny(1955) states that between about 500 and 350 mb in winter over the southwestPacific the warm-air boundary tends to be found at temperature 2-3° warmerthan that of the standard atmosphere (standard is -21°C at 500 mb). McIntyreand Lee (1953) find that in winter over North America the strongest association of high winds at 500 mb occurs with a temperature near -22°C ("maritimearctic front"), with other maxima near -35°C ("continental arctic") and -14°C("polar front"). To fully utilize in-flight searching techniques, it is obviously ess~ntial for the aircrew to be thoroughly familiar with the typicaltemperature and wind structures to be expected in the particular locale oftheir operations.
The problem of keeping the aircraft out of strong head winds is handledalong the same lines of reasoning as discussed above. If the head winds aretoo strong a right turn (Northern Hemisphere) through the area of strong cyclonic wind shear is made and is reflected by rapidly falling ambient temperature.
At levels well above the level of the jet~stream core the same techniquesmay be used, noting that the strongest wind is at the cold, rather than thewarm, boundary of the zone of the strong temperature gradient (Figure 4.9). Itmust be remembered that in this region the horizontal temperature gradientsquite often are smaller and that the existence of the tropopause makes theconditions more complex at these levels.
At about the level of the jet-stream core the thermometer readings are ofno value for keeping the aircraft in or away from the maximum winds, becauseof the absence of a horizontal temperature gradient. In these areas the Dvalue (deviation from standard atmosphere height, obtainable over the oceanas the difference between radio- and pressure-altimeter readings) can be usedwith·success. The D-value, which naturally can be used at all levels, cangive an indication of the wind speed; a rapidly changing D-value during flight
NAVIGATIONAL ASPECTS OF THE JET STREAM 39
means that the aircraft is crossing a strong wind zone. An aircraft flyingdownstream in high winds should maintain a fixed D-value as long as possible,whereas an aircraft in strong head winds should veer right and continue aslong as the D-value continues to decrease rapidly.
From 255 maps over the United States during the period August-December1951, Fletcher (1953) found that in 92 per cent of the cases the axis ofstrongest wind was found, at 500 mb, between the contours 18200 and 18800 ft(-100 to + 500 ft D).
The above discussion is based on the assumption that the aircraft is tobe held at a fixed level and is able to search out other wind speeds onlythrough horizontal movements. This is the case when the flight level of theaircraft is determined by an air traffic control service or when the performance data of the aircraft fix a certain altitude and temperature. It goeswithout saying that the most rapid change of wind speed may be effected usually by changing the height of the aircraft, since the vertical wind shear isabout two orders of magnitude larger than the horizontal shear.
The above general rules of how to deal with some navigational problemsin jet-stream conditions can be systematized in different ways. One method,used by an airline flying between Tokyo and Honolulu, is discussed byStiefelmaier (1955) and Serebreny (1955). A number of predetermined tracksbetween Tokyo and Honolulu are made up beforehand, and the forecaster and dispatcher choose one of them before departure and recommend it to the pilot-,incommand. The pilot follows this track and makes adjustments to it according tothe general rules indicated above.
A correction to the upper wind forecast may be made as a suggestion tothe pilot to switch over to another of the predetermined tracks, the decisionoften being made on the basis of temperature readings and other informationsent to the forecast office while the airplane is en route. This method ofcorrecting a forecast imposes very little burden on the communication channels.In Stiefelmaier's paper, the savings made to the company by using the jetstream flight techniques is said to have been half a million dollars on about220 flights. In the Pacific, the jet stream on this particular flight is usedon a regularly scheduled basis during the colder months, November through Marc~
In addition to the above-mentioned rules for jet-stream navigation, someof the findings discussed in Section 8 may be used. Sometimes special cloudformations can be found near the jet stream, and a pilot may be able to keepin strong tail winds by following a cloud streak for many hundred miles (Frost,1954).
Furthermore, the region of strong horizontal, cyclonic wind shear is sometimes the site of clear air turbulence. An aircraft flying in strong head ortail winds and experiencing clear air turbulence has almost certainly left thearea of strongest winds towards the low pressure side.
Finally, one ought to mention some facts that unfortunately reduce thevalue of jet-stream navigation. The rapidly increasing air traffic volumemakes it necessary to lead the aircraft in certain corridors (airways) which
40 NAVIGATIONAL ASPECTS OF THE JET STREAM
they are required to follow. This reduces the possibility for the pilot totake advantage of a jet stream by choosing another track. The airway systemis becoming more and more common. Moreover, particularly with jet aircraft,it is not always most economical of fuel to fly at the altitude of maximumutilization of winds, or to expend the extra fuel required to adjust theflight path to such an altitude or location (Kelly and Caster, 1954; Reiter,1957). Another drawback is that the customs officers and the people comingto the airport to meet a guest or relative don't like to find the aircrafttwo hours ahead of schedule!
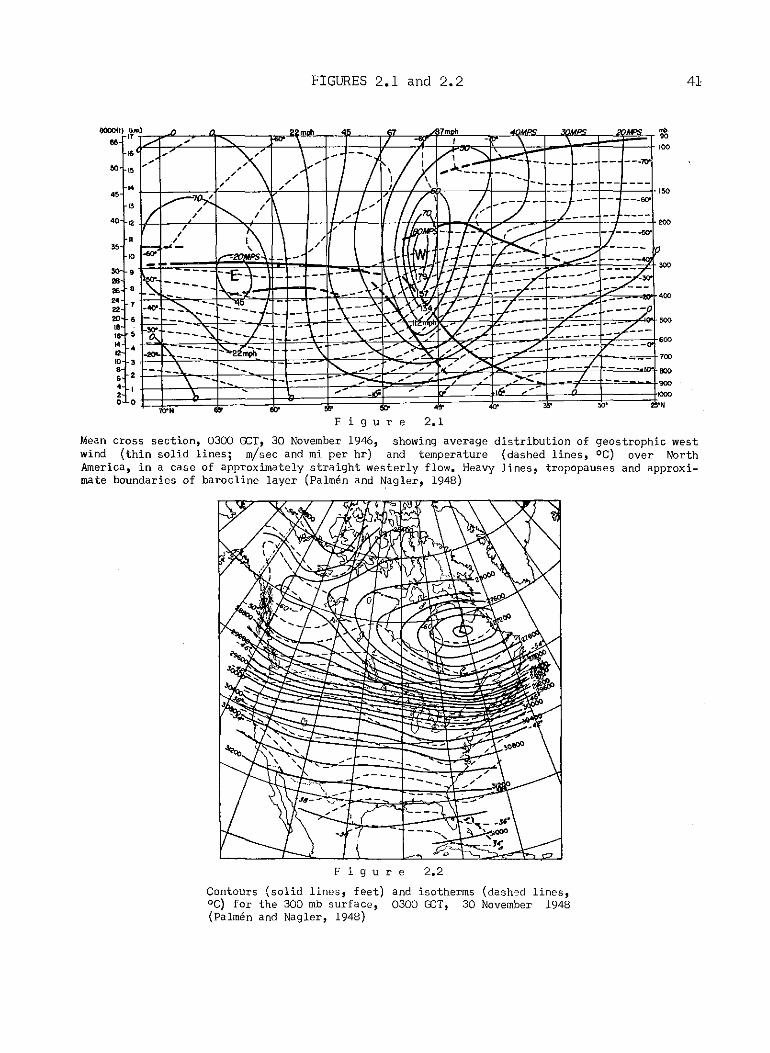
FIGURES 2.1 and 2.2 41
10". •Fig u r e 2.1
,...distribution of geostrophic west
(dashed lines, oC) over Northlines, tropopauses and approxi-
Mean cross section, 0300 GeT, 30 November 1946, showing averagewind (thin solid lines; m/sec and mi per hr) and temperatureAmerica, in a case of approximately straight westerly flow. Heavymate boundaries of barocline layer (Palmen and ~agler, 1948)
Fig u r e 2.2
Contours (solid lines, feet)oC) for the 300 mb surface,(Palmen and Nagler, 1948)
and isotherms (dash9d lines,0300 GCT, 30 November 1948
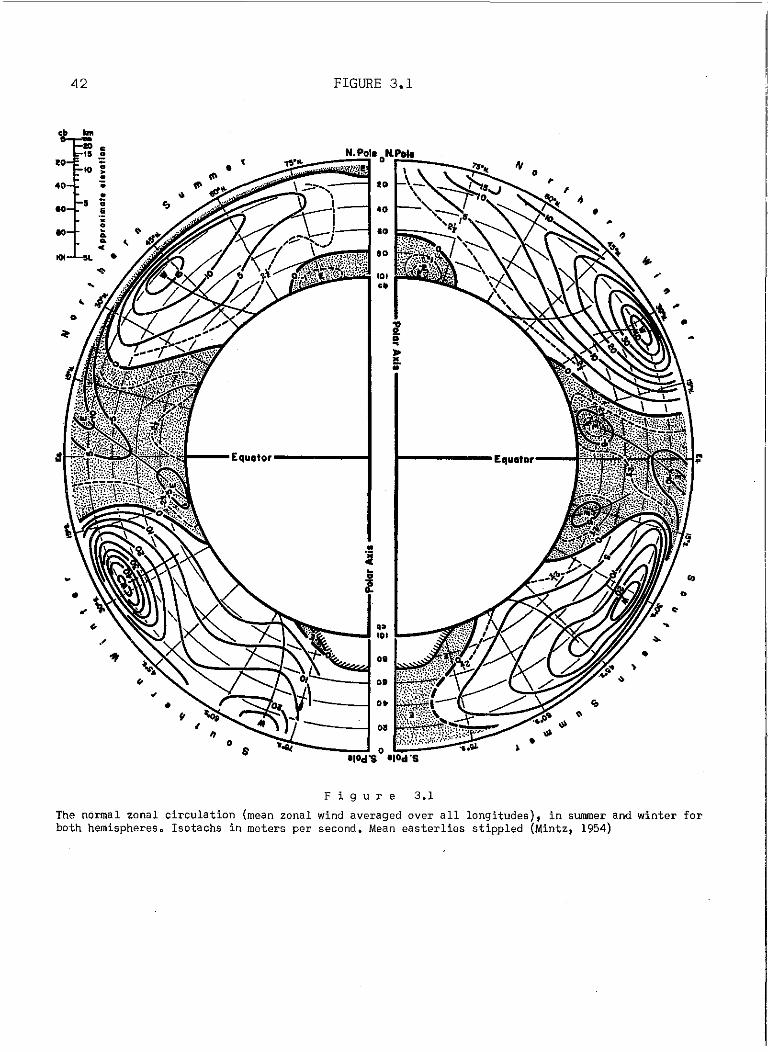
,•I10d"S II0d'S
--_---l0•
•
•
.'
..•
42 FIGURE 3.1
c ...III •,.
~"', ......
10 • •••40 • ..
l! .... • • CO 4'.!· ~.. e I •"-"- <c
"'... .. •~ 101, c.
,0
~
Fig u r e 3.1
The normal zonal circulation (mean zonal wind averaged over all longitudes), in summer and winter forboth hemisphereso Isotachs in meters per second. Mean easterlies stippled (Mintz, 1954)
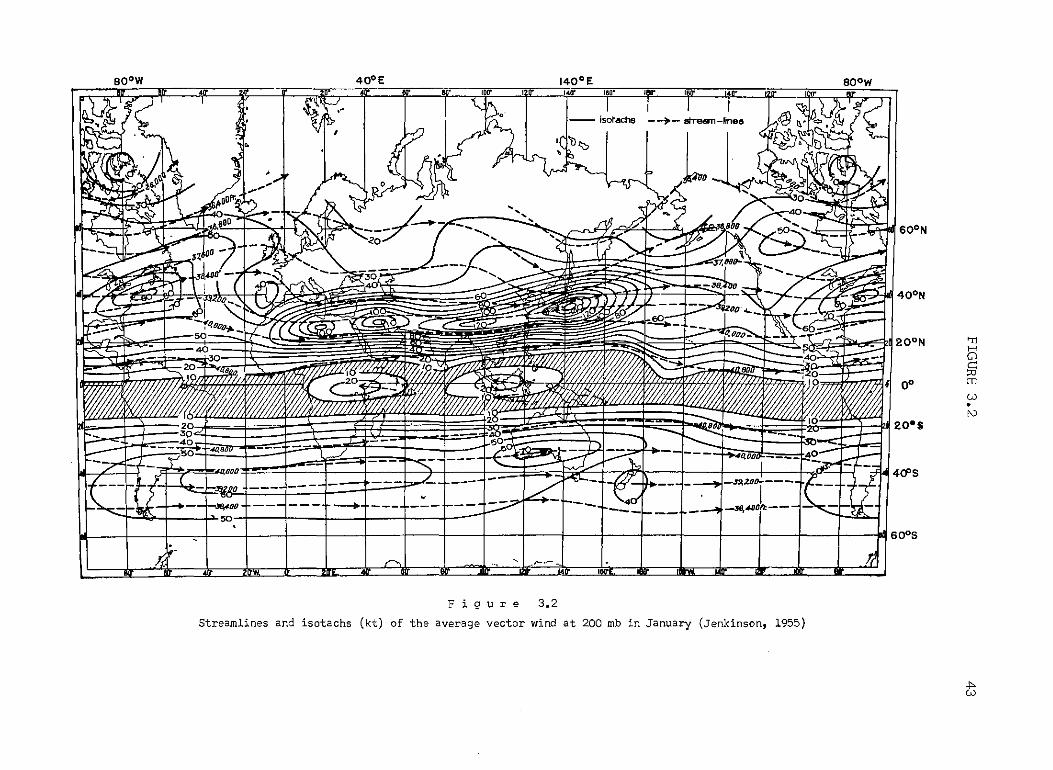
400 N
20 0 N 71HClg
61 0" mw.rv
20·$
4<1'5
Soow
~~6QON
J400Ei4O'
--~--
400 E
-
--;;-;;r--- _.
'.448,
-~'"'+"'DOO
SOOW
~B!!~-l-isir~-i-.J&400
~"" I I I I I l-r
Fig u r e 3.2
Streamlines and isotachs (kt) of the average vector wind at 200 mb in January (Jenkinson, 1955)
t;
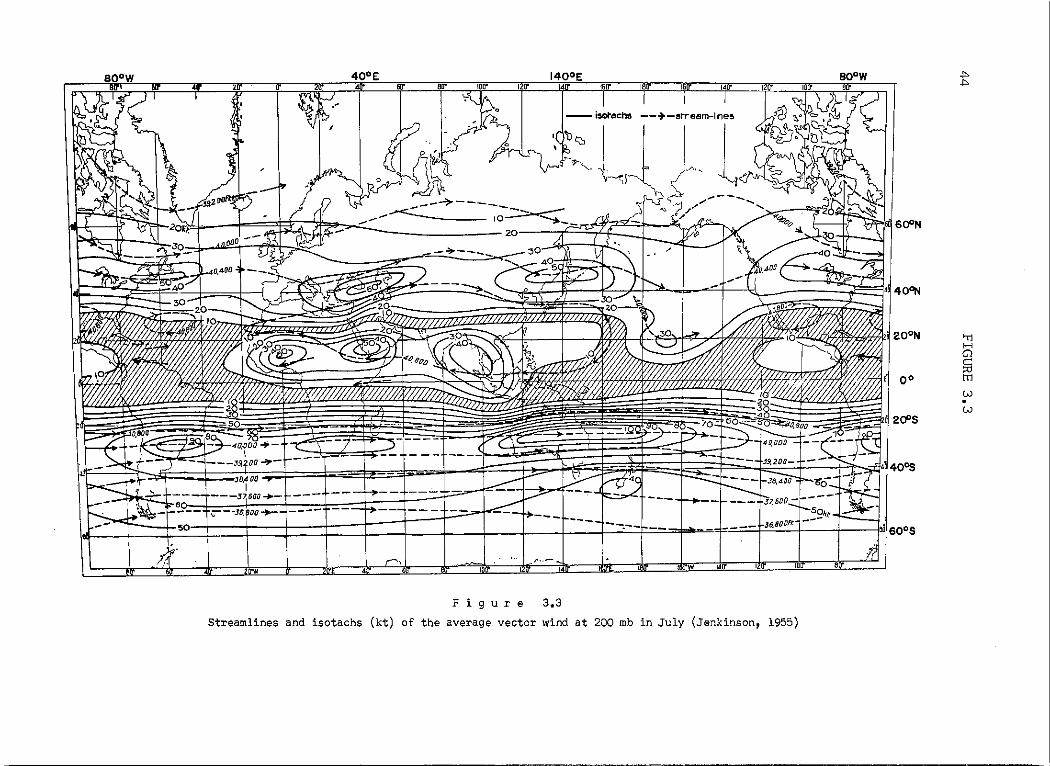
'II" 40" s:r _ aD" 100" -12t1' ~lL- -----.i!l~811' __ Hilt 14ll" 120"800 W 400 E 1400 E 80DW t
.1 I I
~~--r~4-=---~---' I' tIO~ .;.,
~~~j. ----- -- ) .,"~I ",,-----, .._ ~ _ _ V ''AO :>----"~;~ - _.---,"- . --- .. .. ..... -
>-.'"..c::::i-o-::;y-0z,g. 1~~i~~~~~~i~~~f-~[::>h~L......,~.::.::1-<,,~,~ - ~~.~ I ,",0 . .~ 40"N
/
7jHCl
~h1
W.W
\
,d'l
'Ii "r, r··-- mo'W- 14i
1r
Fig u r e 3.3
Streamlines and isotachs (kt) of the average vector wind at 200 mb in July (Jenkinson, 1955)
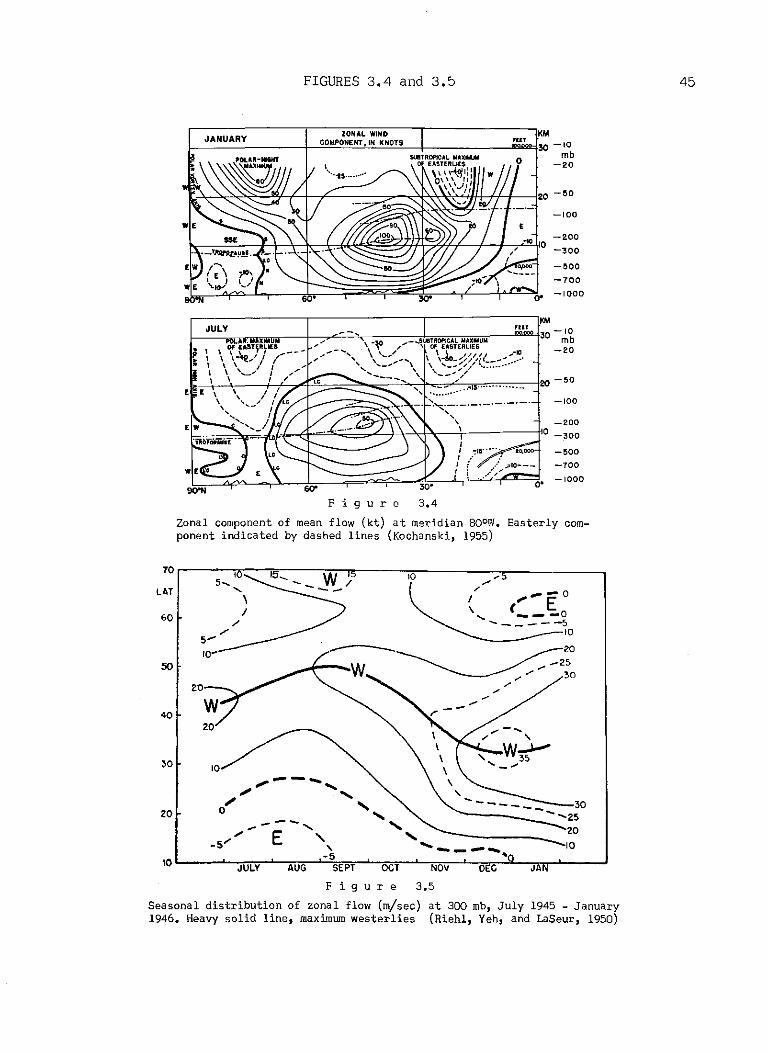
FIGURES 3.4 and 3.5 45
-1000
-100
O'
-20010
-300
-eoo-700
0- -1000
:..··115 ···
60'
r---------,--~Z~O~N~'~L~.~,~ND;;---T---------'KM
I-_J_A_N_U_A_R_Y +-_e~o~.~p~O~N~ENT"'_'.~IN'_'K~N~OT~S'_____1---------1-"""""130 -10
mb-20
9O'N
Fig u r e 3.4
Zonal corr~onent of mean flow (kt) at meridian SOoW. Easterly component indicated by dashed lines (Kochanski, 1955)
~
~
/' ""--E- O
\ c..... 0- __ ---5
10
20_25
~
... "" 30~
//
... ---___ 30"----__~- -25
2010
~--
10
,.-- .... ,'" ...." ,o ...../~-E-- ..... ' ' .....
-5' ,, ---- .....-510 .....--~-J"U"LvY~~A..U"G''-''"SE''PT>r.....'o1iiC''iTr.......'Nllio\i:v,.L-''O'''Er:C-'''--..,J;;;A1ilNr'----'
20
70 I5_
LAT "-\
60 I/
/5~
1050
20
4()
~o 10
Fig u r e 3.5
Seasonal distribution of zonal flow Cm/sec) at 300 rob, July 1945 - January1946. Heavy solid line, maximum westerlies (Riehl, Yeh, and LaSeur, 1950)
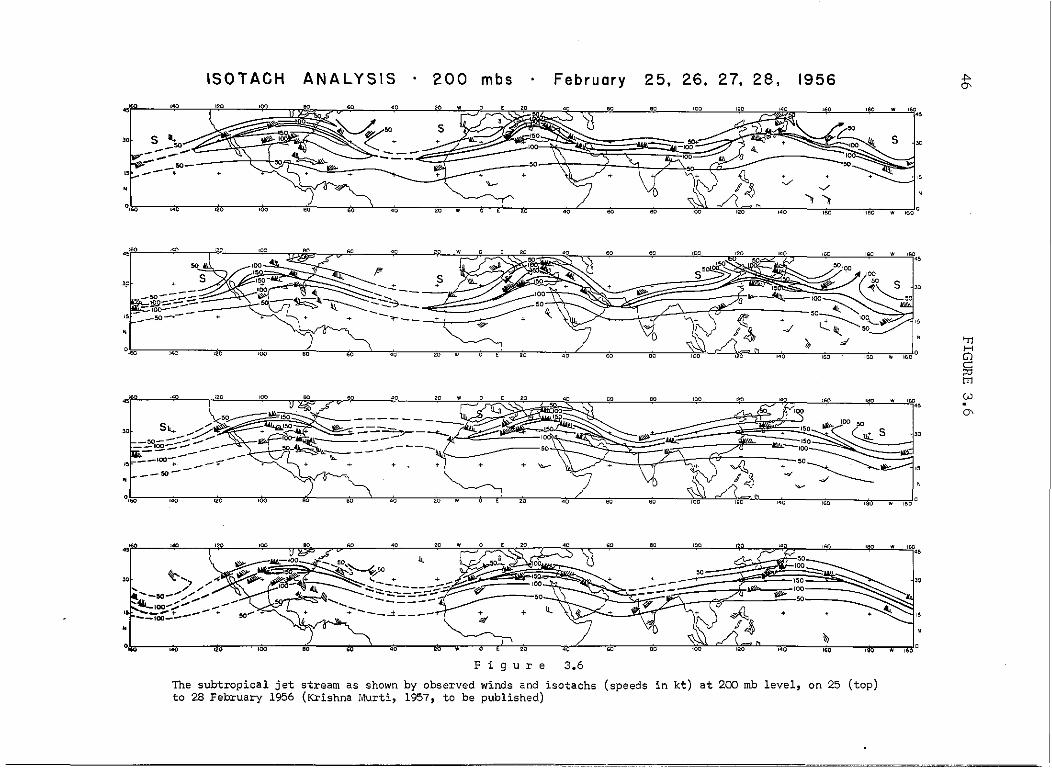
-!'0'
"
'600
'BO'00v, ,
1956
~
,"
25. 26. 27. 28.February200 mbs
""
ANALYSIS
eo'00"i2O
ISOTACH
""O,iO
151
":r.....~~~:~:~~~'~~i~~'iOO~i~~~~~~~OO~~~~':O:~~:~~~~i~~~~~~~j~~~;00;~;~;";;~:";0~~;~"~0~~;;"~0~~~~';"~~~~'''~~W~l'6045
S 00
:so S'" ... ---..:::: !>o'" loo!& s 30__50 -100
.-- -- 100 ~ 100
- - :;0 ~ _-""''l:l';;;~:"' __..5lJ- __ ~ _ ~n __
>nHGl§3mw0'
"
"i600
160°
w'"
iOO'"
'"
'"
"i4O
T20"
"
80 100 IBO W 160
S~ ~'00~ 00~\ S j""-00+
J "
•
"
"40
..,
+
"
N
+
N
N
+
'';0·
..,
"
"
"
80'00
'00'20
IW'"
~0je::c
,:;1'""-_,00-__ 50:' __ -r
_50--::::~1l::=1Q9=---~ 50(
~_IOO-- _'5~ __50--
°i~o
3pl
"I'~~~~::~~,,;o~~~~,~00~~i;~~~~"0~~~'~o~~~;,,~;~~~~~~,~0~~~~'~O~i~;'~O~:::'~O:~~~";O~~~~~~~~§~~:'~"~:~~':"~~'L_']OO "oo~"""O ~:OO~ "0 '00 00
30 5h... ......~ 150 ... ::...-=-~~--__"'__ 150 ~( ( ..+ S_oo--.::-_~- '00-""," - " "'" "'" "O~"'--~
- >or =:::-..z:\. ... \ /
'f·~ 'ZC' '0;) Br:>.60 40 20WOC20..~ ( ~. JF@5 !{ v F::J .--..... '"0-.. _!Vl~
"~ ! \ ) / \'Ai d' \=r'l ~ I
o ...a 120 100 eo eo 40 iW wOE 20 40 60 eo 100 120 140 IBO 180 W 160 0
•
" '" '00 " " ",," W 0 , " '00 "0 ," oo~'OO"
'00",-
30 ~.... 4=- ~ 50 150~~ ~o..... /') ./"" iF »f' ~ 100 ~l--$O- ............. '" so~
_"",,.- _- 01,~102-' _- _...... .... ..il .. ~. ~
15 --100-":.--- .. ~.... -------
Fig u r e 3.6
The subtropical jet stream as shown by observed winds and isotachs (speeds in kt) at 200 mb level, on 25 (top)to 28 February 1956 (Krishna Murti, 1957, to be published)
--------------------------~---~---~~~~~~~~~---~~--~--"~~~~~~-~.~------~..~-~-
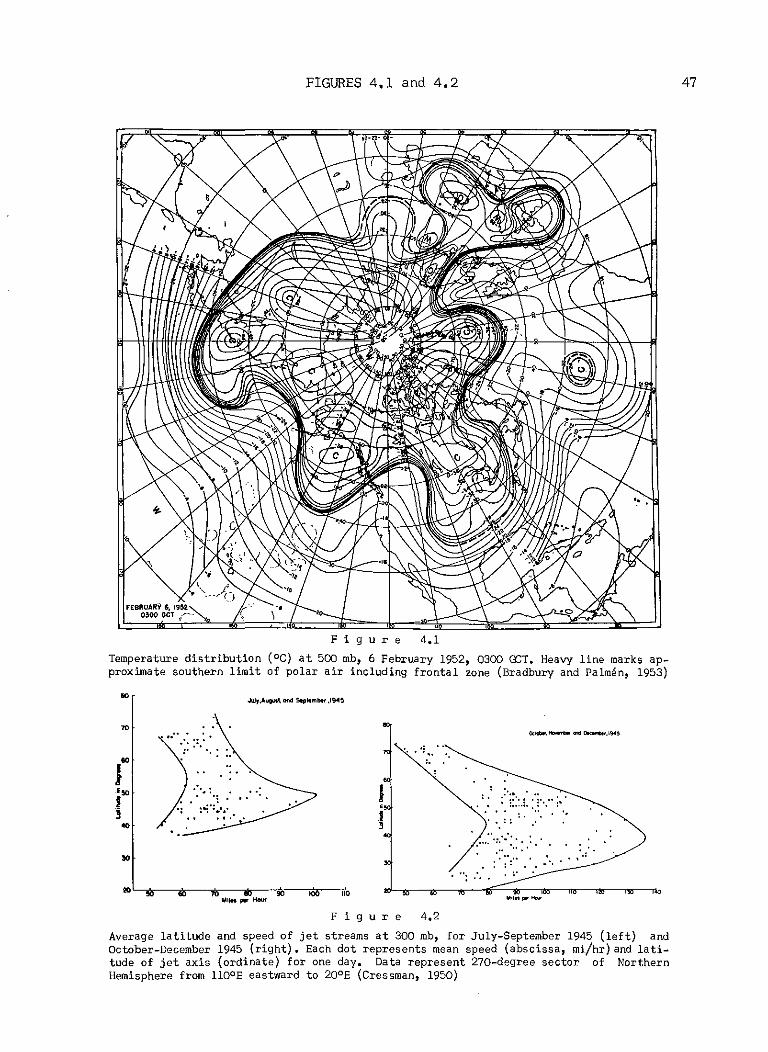
FIGURES 4.1 and 4.2 47
FEBRUARY 6, 1'352:,0300 GCT ~-,,-- "'"
Fig u r e 4.1
Temperature distribution (oc) at 500 rob, 6 February 1952, 0300 OCT. Heavy line marks ap_proximate southern l~it of polar air including frontal zone (Bradbury and Palmen, 1953)
50
.. (::'.:. ':"':':'.. '..'. ::
.::...
': ...
., ,',
50
f-50
I..".
'" L-;l>-."'i>-'70l>---.l,-----;l>-'.,--,(n'oMilo per Hour
Fig u r e 4.2
Average latitude and speed of jet streams at 300 rob, for July-September 1945 (left) andOctober-December 1945 (right). Each dot represents mean speed (abscissa, roi/hr) and latitude of jet axis (ordinate) for one day. Data represent 270-degree sector of NorthernHemisphere from 1100 E eastward to 200 E (Cressman, 1950)
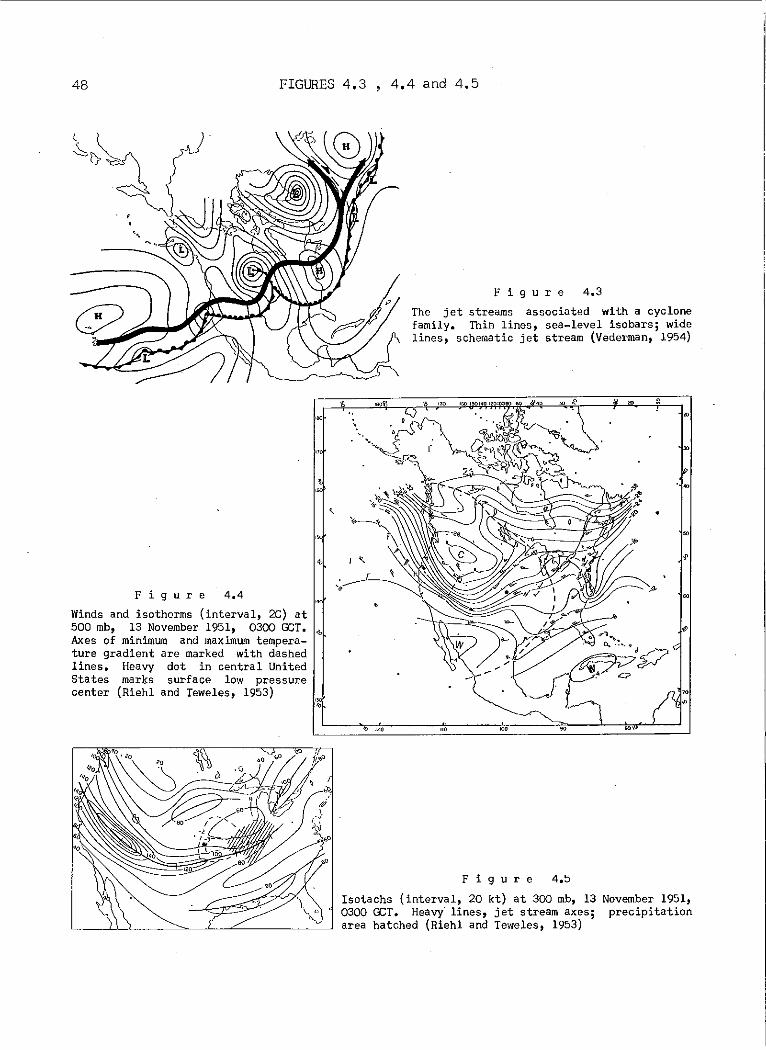
48 FIGURES 4.3 , 4.4 and 4.5
Fig u r e 4.3
The jet streams associated with a cyclonefamily. Thin lines, sea-level isobars; widelines, schematic jet stream (Vederman, 1954)
Fig u r e 4.4
Winds and isotherms (interval, 2C) at500 mb, 13 November 1951, 0300 GeT. ~
Axes of minlinum and maximum temperature gradient are marked with dashedlines. Heavy dot in central UnitedStates marks surface low pressurecenter (Riehl and Teweles, 1953)
'0
Fig u r e 4.5
Isotachs (interval, 20 kt) at 300 mb, 130300 OCT. Heavi lines, jet 5 tream axes;area hatched (Riehl and Teweles, 1953)
November 1951,precipitation
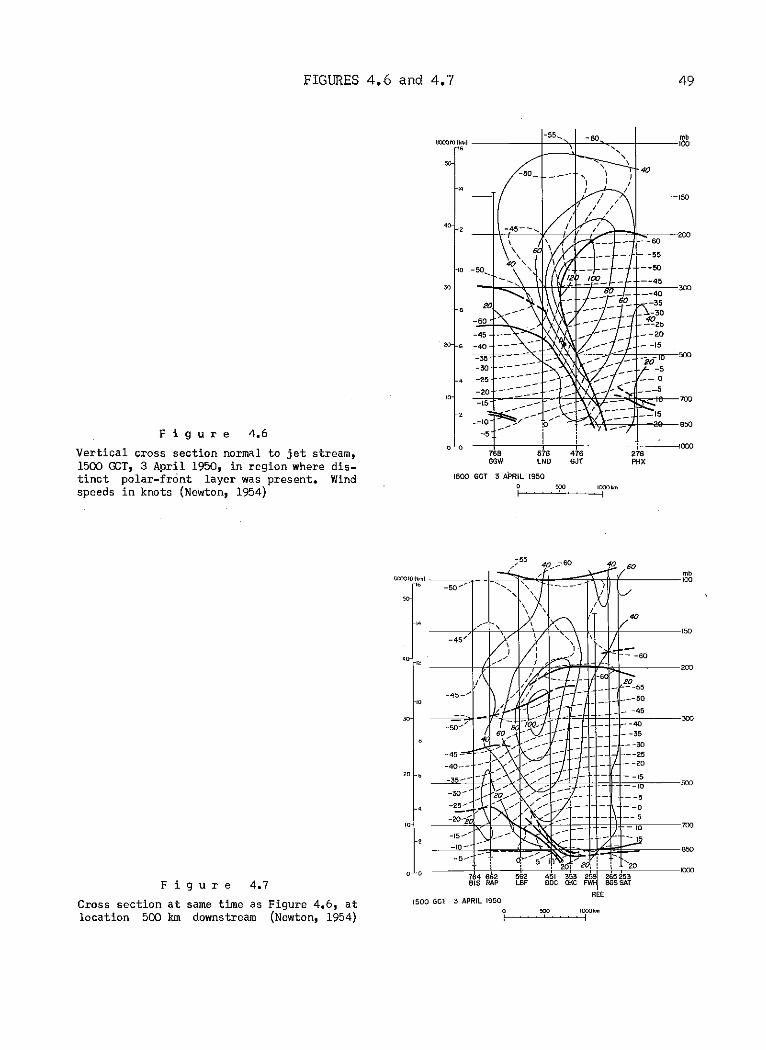
FIGURES 4.6 and 4.7 49
Fig u r e 4.6
Vertical cross section normal to jet stream,1500 GCT, 3 April 1950, in region where distinct polar-front layer was present. Windspeeds in knots (Newton, 1954)
40
--+f---+---+cY'7----;'\-+---'50
" =850, ---, i ,,"XlO, , , , , ,
768 576 476 276GGW lND OJT PHX
1500 GeT 3 APRIL [950
= ,=~,I
, ;55 40... _- 60 40 60
(LCXXlmll",,) m""'0
" -50'-
40
, '''''-45/
- -60
"'"-620--55
___ 50
_ -45
-<0300
--:35--30--25
_ -2.0
" • - -15--10
- -,--0
--," -OQ roo
-""'''-,- - '2020' 20,'000, ,
764 662 '" 450 '" eo, 265253
F i 9 u r e 4.7 BIS RAP LB' DOC OKC FW BGSSAT
mCross section at same time as Figure 4.6, at 1500 GeT :3 APRIL 1950
location 500 kIn downstream (Newton, 1954), ':" ,=~
I I
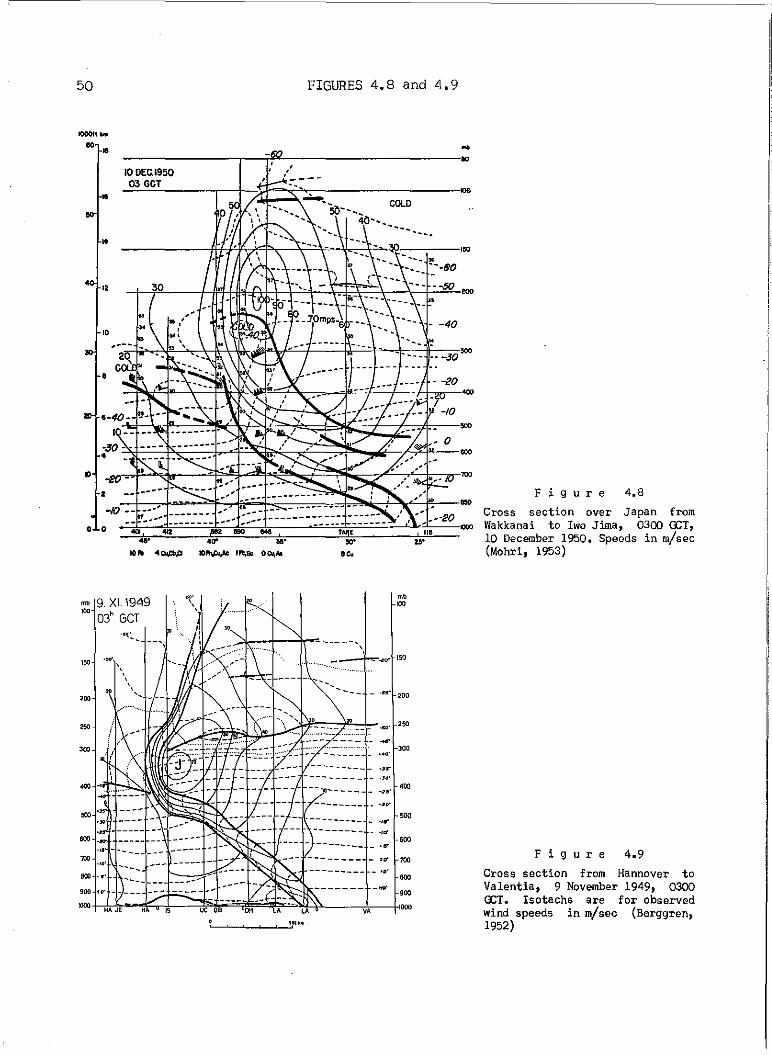
50 FIGURES 4.8 and 4.9
Fig u r e 4.8
Cross section over Japan fromWakkanai to Iwo Jima, 0300 ceI,10 December 1950. Speeds in m/sec(Mohri, 1953)
- ~50 200
K·-·eo2---,---",
~
--------r----'-;.!~!!L------------oo, '.IODEGI950
03 GeT-=-='::':--I--j-/.~~--;:;::;::-''''
.......... COlD51)-- -40-•..........
'"
""" ..00
Fig u r e 4.9
Cross section from Hannover toValentia, 9 November 1949, 0300OCT. Isotachs are for observedwind speeds in m/sec (Berggren,1952)
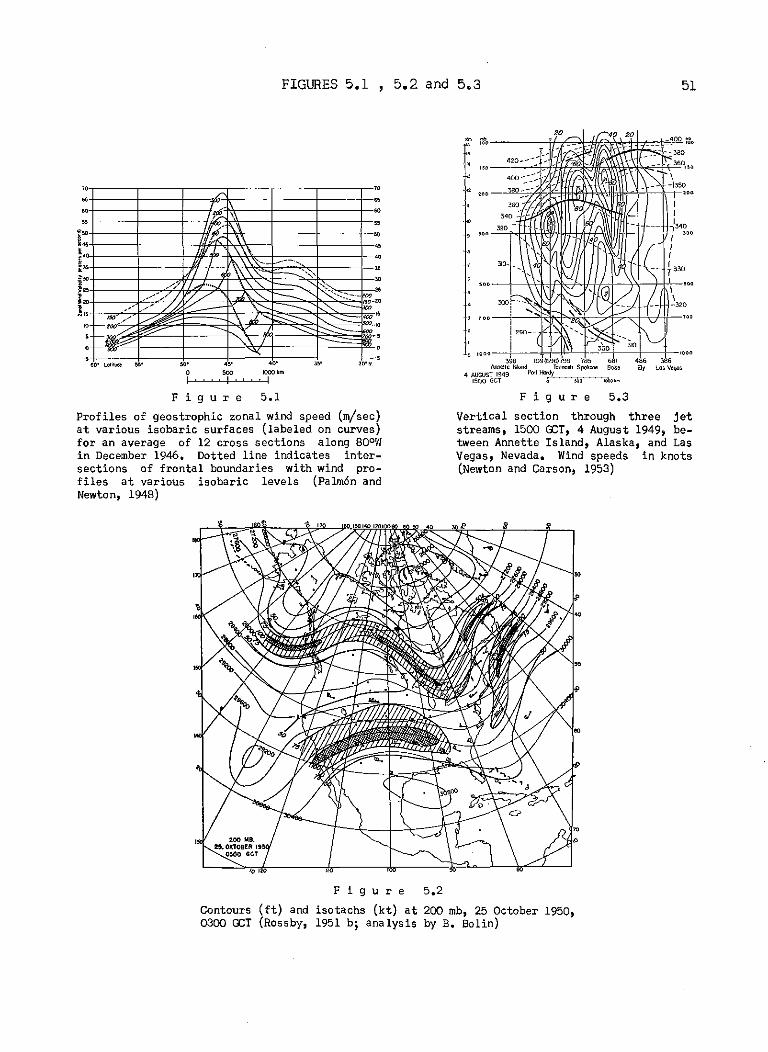
FIGURES 5.1 , 5.2 and 5.3 51
Profiles of geostrophic zonal wind speed (m/sec)at various isobaric surfaces (labeled on curves)for an average of 12 cross sections along 800 Win December 1946. Dotted line indicates intersections of frontal boundaries with wind profiles at various isobaric levels (Palmen andNewton, 1948)
\\-320
\-1350
,,3ZO )340
,.. --""r+1-tt-MI-fl,It:I:tf1'f:?®lJJffI-t+--tff-',,I
};no,
II 290-,i
to 00 ~-"i-,--,,,t,"-+,-.";,-",'---,1-,,AMette Island Ta:toosll Spol<_
4 ~~gs~dr9 ""1 Honj?'----;"'..-_.
Fig u r e 5.3
Vertical section through three jetstreams, 1500 GeT, 4 August 1949, between Annette Island, Alaska, and LasVegas, Nevada. Wind speeds in knots(Newton and Carson, 1953)
,
",."
•ro
•,."..
,..!>O 4~ 0"
o 500 IOOOkm
f-I~~+I~.~~'-11
Fig u r e 5.1
,/'
,
..-,
i£1\\,\\. '.I. . \\\
iii J, -. -_.:::.......
~
,. ,,- "'-- -->-', '.. "- ~ ,~;:-
"" ,,-
,. ,/"",'" '/ ./ .I:'.. , ---- ,,----:c- ~
/
~':--' ----- -, ~ ~-,
""/, .... ~--- -....:: ~,
" -"".- -....:: ~----- i,-~ "- ----=, -'
•
Fig u r e 5.2
Contours (ft) and isotachs (kt) at 200 rob, 25 October 1950,0300 GeT (Rossby, 1951 b; analysis by B. Bolin)
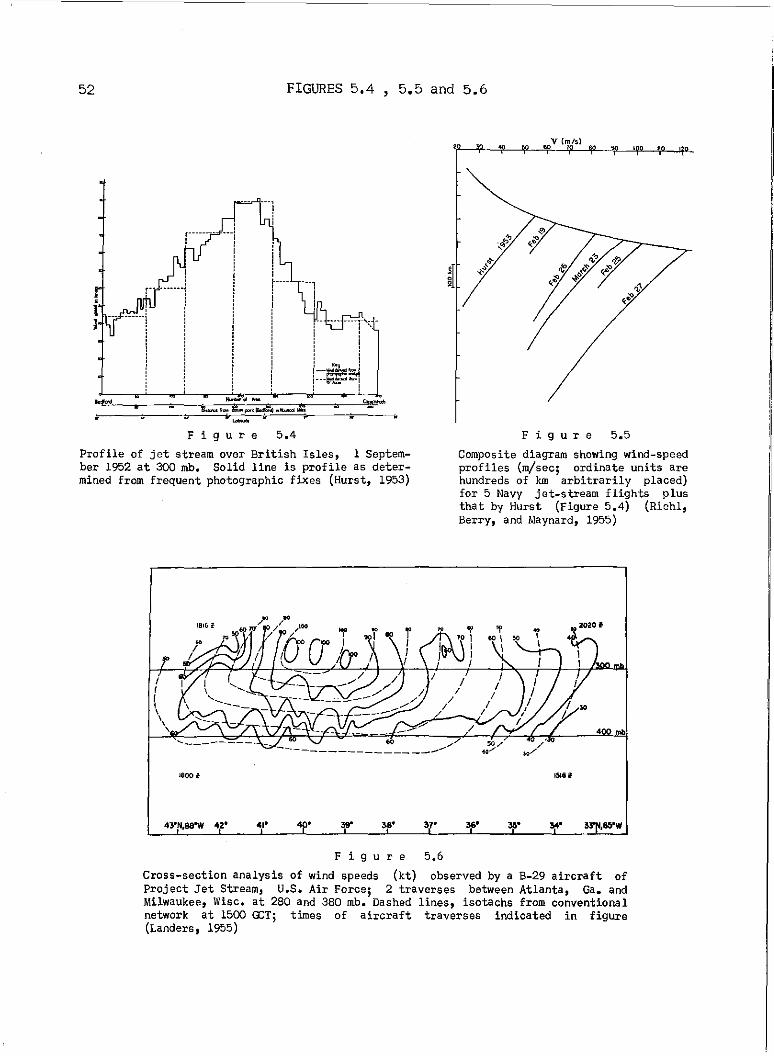
52 FIGURES 5,4 , 5.5 and 5.6
V (m/slro ,
•
- •... ----r":4~: .!!". ',-.....-'-1
, --i---~...~-!
• •-_.-
&-_g;;;f<"<~"_..e•
!I r" ·......1
i : :1:,,'
1 j:i
i,' j:
Fig u r e 5.4
Profile of jet stream over British Isles, 1 September 1952 at 300 mh. Solid line is profile as determined from frequent photographic fixes (Hurst, 1953)
Fig u r e 5.5
Composite diagram showing wind-speedprofiles (m/sec; ordinate units arehundreds of km arbitrarily placed)for 5 Navy jet-stream flights plusthat by Hurst (Figure 5.4) (Riehl,Berry, and Maynard, 1955)
/---------------mb
1800t
4" ,.. 31" ... ... 34'
Fig u r e 5.6
Cross-section analysis of wind speeds (kt) observed by a B-29 aircraft ofProject Jet Stream, U.S. Air Force; 2 traverses between Atlanta, Ga. andMilwaukee, Wise. at 280 and 380 mb. Dashed lines, isotachs from conventionalnetwork at 1500 GeT; times of aircraft traverses indicated in figure(Landers, 1955)
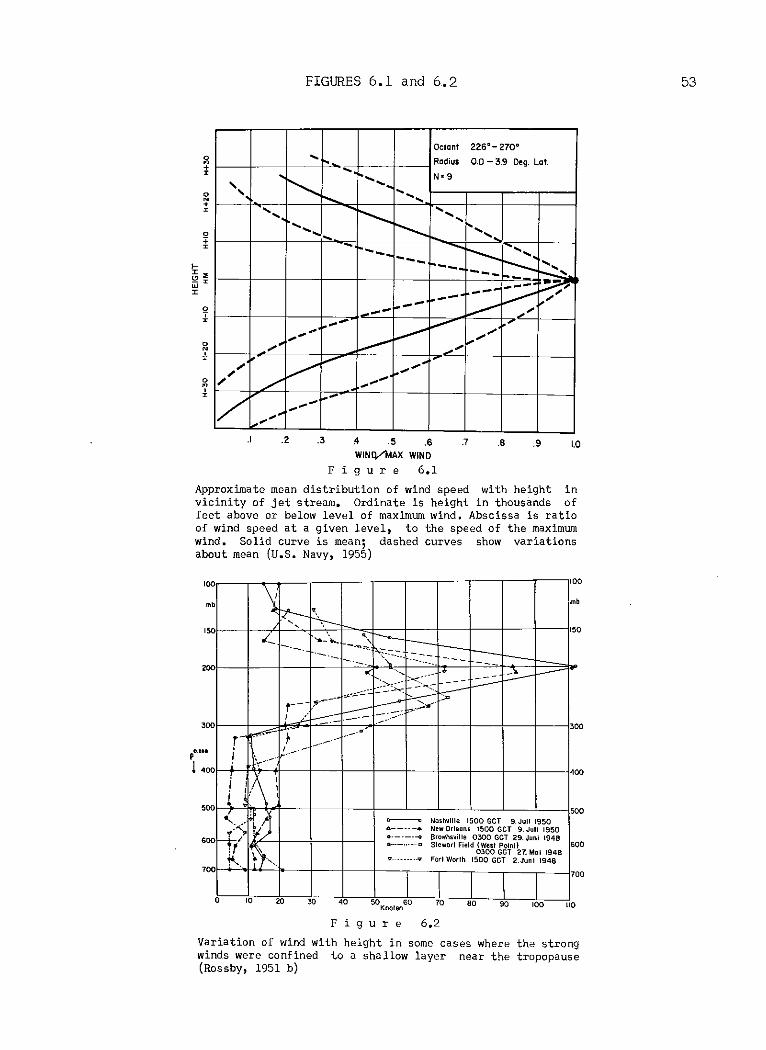
FIGURES 6.1 and 6.2 53
o
"zlI."z"'I
o.,z
g,z
Octant 226°- 2700...Radius 0.0 - 3.9 Deg. Lat.
, ...I'----- ......, N-9,,
'- ................ r--... ............... r--... ............ """-...... ...
~.....-.. r-.... .......--- f- __ .. r--: ......--- I- ..
--- ::::-~-- 1____
","--1----~'"-- 1,.--
L,....-V'"",' - L--- ",'"
~-
"."
-----V -"-'" / --~
1/ ---1_.......... -.2 .3 :4 .5
WINO/l.tAX
Figure
.6WIND
6.1
.7 .8 .9 1.0
Approximate mean distribution of wind speed with height invicinity of jet stream. Ordinate is height in thousands offeet above or below level of maximum wind. Abscissa is ratioof wind speed at a given level, to the speed of the maximumwind. Solid curve is mean; dashed curves show variationsabout mean (U.S. Navy, 1955)
600
mbmb
,001~-~~.-..---r--.,--r--'-"-T--r-,--'00
\~,.1 ---l----A---:.''----,.\-P-c---::'::"::j-o-d-----t--+-1--+---+--I~~ 1~
L_L.L~-l-:·-:·E...-~·...t-~:~j·JS--·---I:=:tj::=:kdbl'00 ~ "~-~" -~.~-~..,..;"" """ ,_• ", '......-,.. .. .. " t.:::--- .......
....,~~~~ -~-"e:-:~r-- .--- e::.- L-:: ~~..- ::.1 jL.---:--- ._.- -;:.:___
,00,~---t:=;~#:"a9'~=f::::;;"'''''--T--r---t--t---j--l'OOI r- ..... r
pUM i n~ _._. )/...l,oo)I-+'-1A~·'rc---+!---+-~+--+--i--.J.--+--+--i--j.oo
1 i./\ \'oo'I-l--"l]\t--"t--'I---+--+_-+_-..I__L_...L_...J._-..IL-j500,_ ..fl,J' -----... Nashville 1500 GCT 9.Jull 1950
600)~.j.1~'''i.'-I]''"';LJ--+__+-_--+__ ~~=~.: ~~:~~~~I~~s o~~o G~~T 2::j~~li ~~~~"f I~ Siewart Field {West Poinll: .~ 0300 GCT 27. Mal 1948~. I ~ .". ...--...._..... ForI Wartll 1500 GCT 2.Junt 1948
,00f-+-.:'-!-4""::j.---+--+---+--,-,,.-,---,._--,_.......j,00
o 10 20 .0 50 60Knoten
10 ao 90 '00 110
Fig u r e 6.2
Variation of wind with height in some cases where the strongwinds were confined to a shallow layer near the tropopause(Rossby, 1951 b)
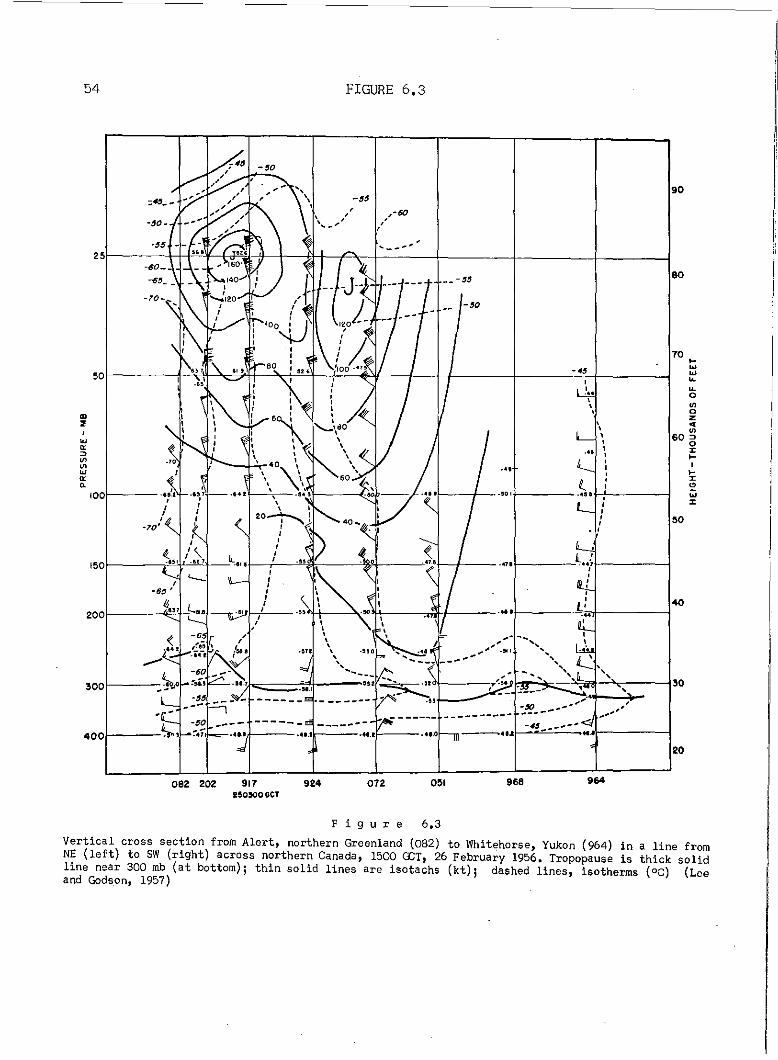
54 FIGURE 6.3
eo
90
---,
, ', '--'
-60 __
-6~__
-'0-
70 ...w-4$ w50 , ~
.1.. ~
0,'",, 0.. %..,. ,'", , 60 =>w ,0,"'" ... , ...=> , ,'" ,'" ... , ...w
Ii... • "'" , '"...64 r -'0 I .45t , W100
I ",,50•,
_471 ~44~150 •, ,, :,, ,,\ ,
40~'H L..., •." , ." ....200 ,
,,< ,
·4. ! ... ,' -'"-,--- 30300 ---- ,
----------400 ~, -----......1
20
202 9'7 924 072 0" 968 964082250500GCT
Fig u r e 6.3
Vertical cross section from Alert, northern Greenland (082) to Whitehorse, Yukon (964) in a line fromNE (left) to SW (right) across northern Canada, 1500 GeT, 26 February 1956. Tropopause is thick solidline near 300 mb (at bottom); thin solid lines are isotachs (kt); dashed lines, isotherms (oC) (Leeand Godson, 1957)
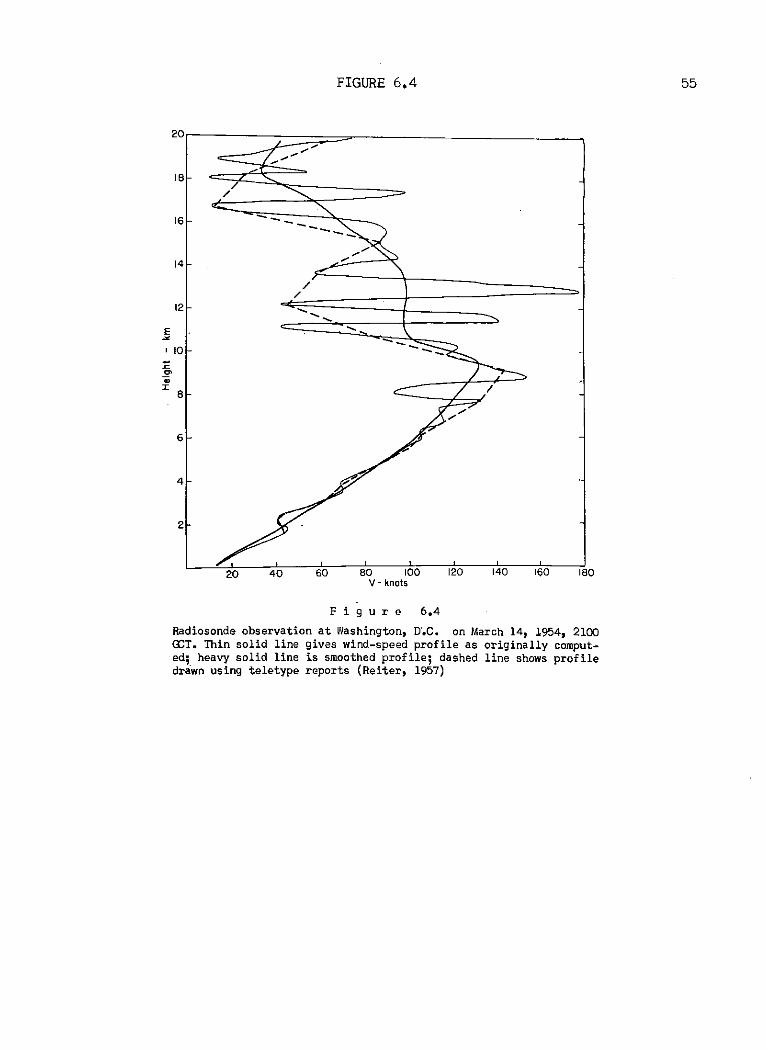
FIGURE 6.4
20//
///
/18
/
16 -- -----//
14 /
//
12 -........E .... ....~ --, 10
:c'"";;;:I:
8
6
4
2
20 40 60 80 100 120 140 160 180V - knots
F i 9 u r e 6.4
Radiosonde observation at Washington, D~C. on March 14, 1954, 2100OCT. Thin solid line gives wind-speed profile as originally computed; heavy solid line is smoothed profile; dashed line shows profiledrawn using teletype reports (Reiter, 1957)
55
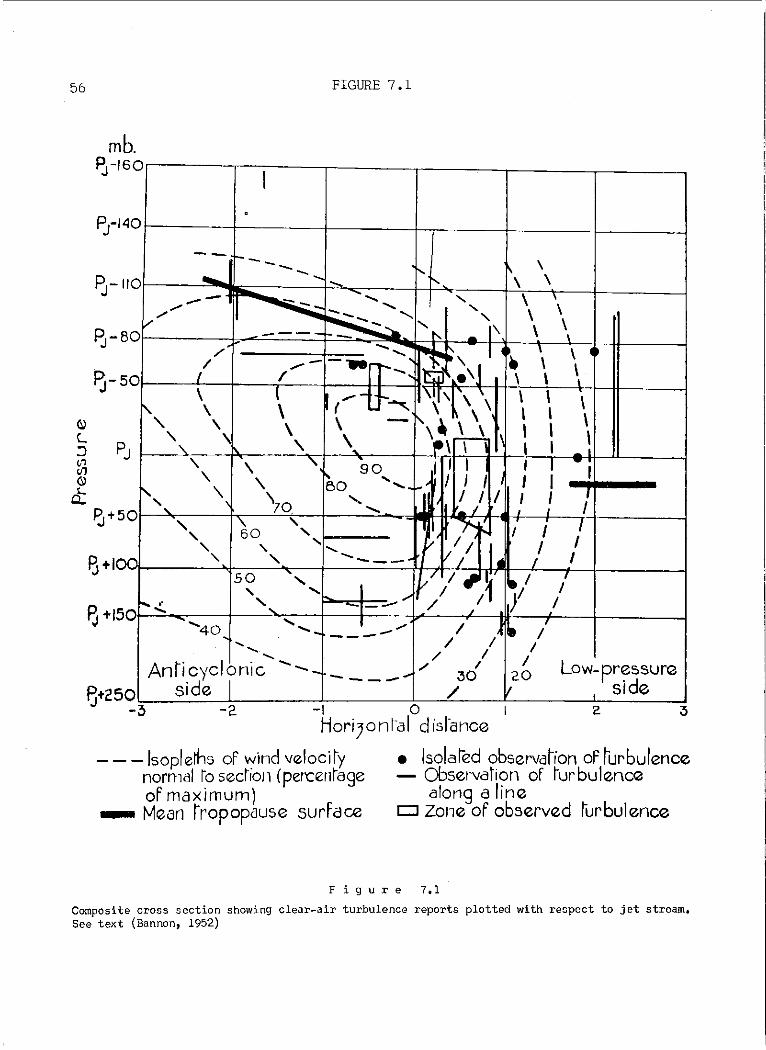
56 FIGURE 7.1
mb.~-1601--11--~----,---r--------r---.....,
I.
PJ-140r----t-----t---+,---+----+-__-1---
':I- 110 ~----- ...... , 'I-- ,,\",...-- -- ............... '...... \ \
:,..-/ F---, '..... 'I' \ \F3 - 80 - -'- - - '\ \ \
/' ...... 14 \ \./ ,,- ... r-- , ~~'" I • \
~- 50r--~f---j--+I-_+-_=Hf__--1'H~~:;l~'·~·'...:.\41+-\\------1\,---\-\-l---I1-----1\ \ ("- ~ \~'\ \ \ \ \ \
().) ',\ \ \ - \. 1. \ \ I I \c. ", ''\j '\ \ \~, ~ I I,IJ PJ " ", I'" \ \ I I~ "\"' 90 I I I I I I<;) '\ '\ 50 ' ...... ~,' I I , I ...;+-__
d: " '\ 'Jo " ...... r: "I ,I ,'I'f3+50 "... ." )0 " ~ I , '
, ,,'...... v,// I I 'f3 +11'V'Ul...1----'----'t~--='--.,.----1-----=-:..=.=-·-f/----;A',/.'-=."WI~~-;iL_i__/-i----__l
50 ", V'/ ;tl~ It / /r- ' " ~ "" / /1)/ /
~ +150r..:..::......,::--t-~'~-lr_+-------Y...:..-~·C-.--_tJt________;f--_l---_l-40,' ...... , -/ I~I. /
" / / I- / I I
AnricycloIhie - ...... - ~ ,/ 3d 20 Low-pre5SUr12~+250i---=s_id_e_;;- T-__-----:!;-~/__~iI __!I:-=s..:..id_e:....--::!
-3 -2 -I 0 Z;3Horijonl-al disl'ance
- - -Isopleths of wind veloci~y • Isolaied observalion of lurbulencenormal ro sedron (pereen~age - Observation of ~urbulenc12of maximum) along a line
_ tv1iZan rropopause surface CJ Zone of observed rurbulence
Figure 7.1
Composite cross section showing clear-air turbulence reports plotted with respect to jet stream.See text (Bannon, 1952)
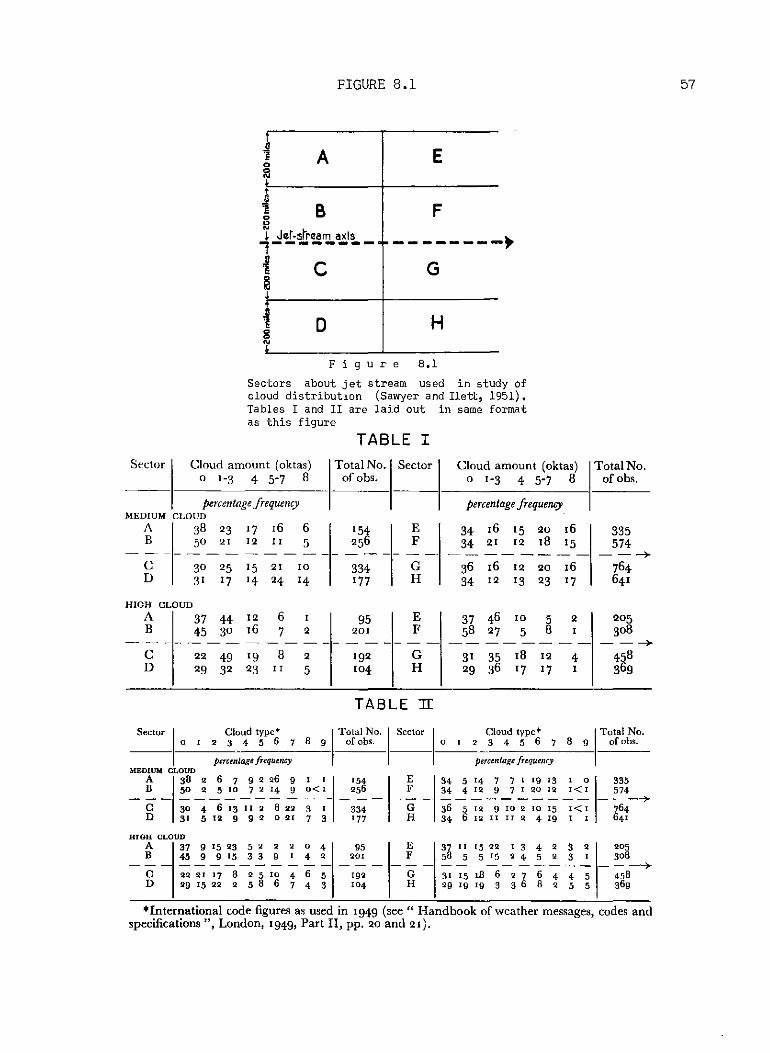
A
FIGURE 8.1
E
57
B~olilj J.r-5~,.am axis,--------~ C~
F
--------~G
t
1g'l'
o H
Fig u r e 8.1
Sectors about jet stream used in study ofcloud distributlOn (Sawyer and Ilett, 1951).Tables I and II are laid out in same formatas this figure
TABLE ISector Cloud amount (oktas) Total No. Sector Cloud amount (oktas) TotalNo.
a 1-3 4 5-7 8 of obs. a 1-3 4 5-7 8 ofobs.
percentage~requensv percentage frequencyMEDIUM CLOUD
A 38 23 17 16 6 154 E 34 16 15 20 16 335B 50 21 12 II 5 256 F 34 21 12 18 15 574
~ --- --- --- ---- -- ------ -- ......C 30 25 15 21 IO 334 G 36 16 12 20 16 764D 31 17 14 24 14 177 H 34 12 13 23 17 641
HIGH CLOUD
A 37 44 12 6 1 95 E 37 46 10 5 2 205B 45 30 16 7 2 201 F 58 27 5 8 I 308
---- ---- ----- ------ ------ -- -- ......C 22 49 19 8 2 192 G 31 35 18 12 4 458D 29 32 23 I I 5 104 H 29 36 '7 17 I 369
TABLE :IT
Sector
1
0Cloud type· ITotal No. I Secto,
1
0Cloud type. ITotal No., 2 3 4 5 6 7 B 9 of obs. , 2 3 4 5 6 7 B 9 of obs.
perunlagt frequency percentage frequencyMEDtUM CLOUD
A 3B 2 6 7 9 2 26 9 I ,'5' E 3. 5 '. 7 7 , 19 13 , 0 335
B 50 2 5 co 7 2 14 9 0<' 256 F 3. • " 9 7 I 20 12 ,< , 57.--- -------- --- --- ---------- ----+C 30 • 6 '3 " 2 B .. 3 , 33. G 36 5 " 9 <02 10 15 ,< , 76•D 31 5 12 9 9 2 0 .. 7 3 '77 R 3' 6 12 II " 2 • 19 , , 6.,
HIOH CLOUDA 37 9 15 23 5 2 2 2 0 • 95 E 37 " 15 22 , 3 4 2 3 2 205B .5 9 9 '5 3 3 9 , • 2 20' F 5B 5 5 '5 2 • 5 2 3 , 30B
--- ---------- --- --- ---------- ---'-+C 22 21 17 B 2 5 10 • 6 5 192 G 3' 15 1.8 6 2 7 6 • • 5 '5BD !l9 15 22 2 5 B 6 7 • 3 <0' R 29 19 19 3 3 6 B 2 5 5 369
·International code figures as used in 1949 (see" Handbook of weather messages, codes andspecifications ", London, 1949, Part II, pp. 20 and 21).
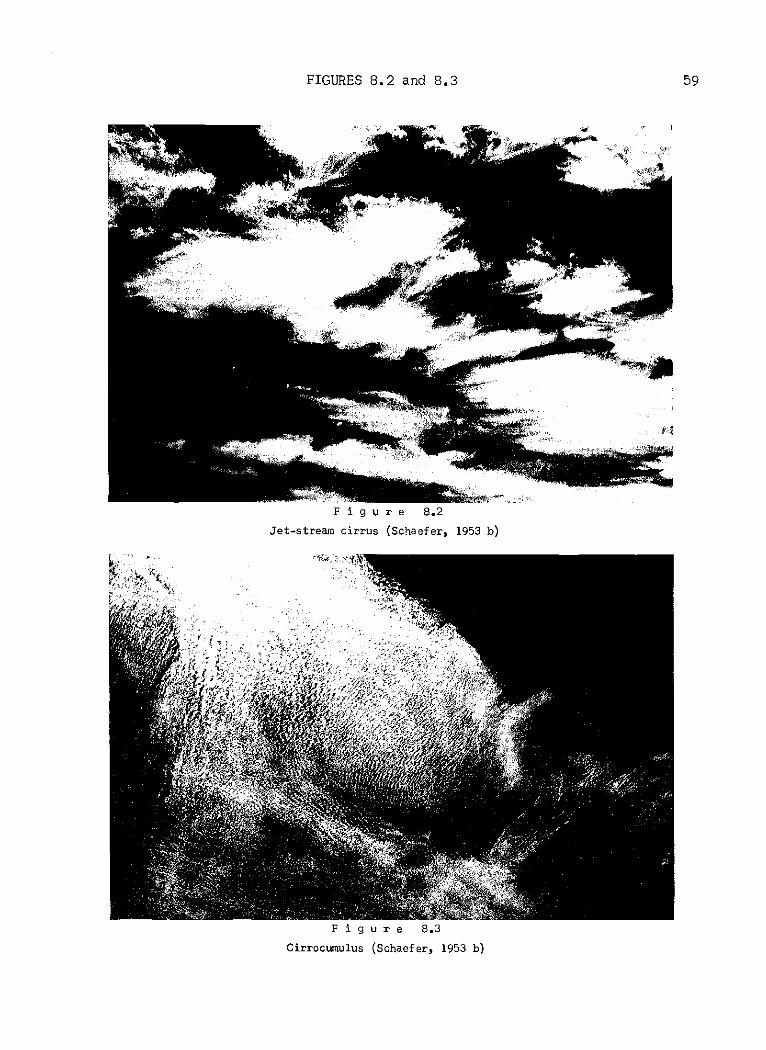
FIGURES 8.2 and 8.3
Fig u r e 8.2
Jet-stream cirrus (Schaefer, 1953 b)
Fig u r e 8.3
Cirrocumulus (Schaefer, 1953 b)
59
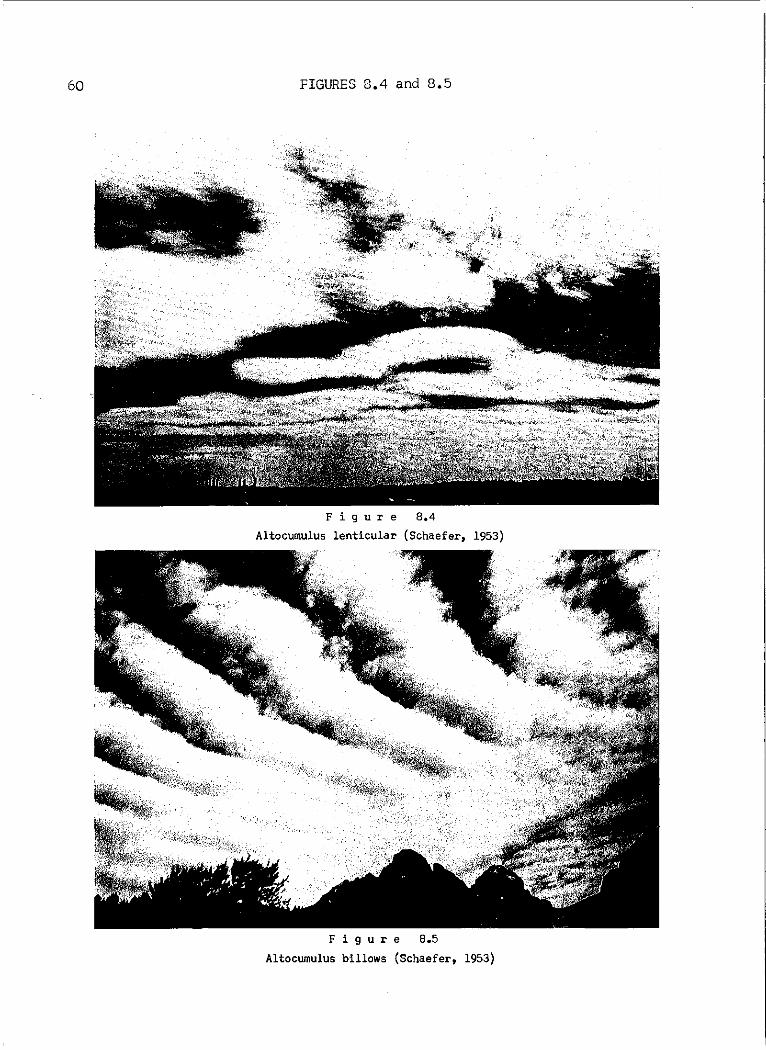
60 FIGURES 8.4 and 8.5
Fig u r e 8.4
Altocumulus lenticular (Schaefer, 1953)
Fig u r e 8.5
Altocumulus billows (Schaefer, 1953)
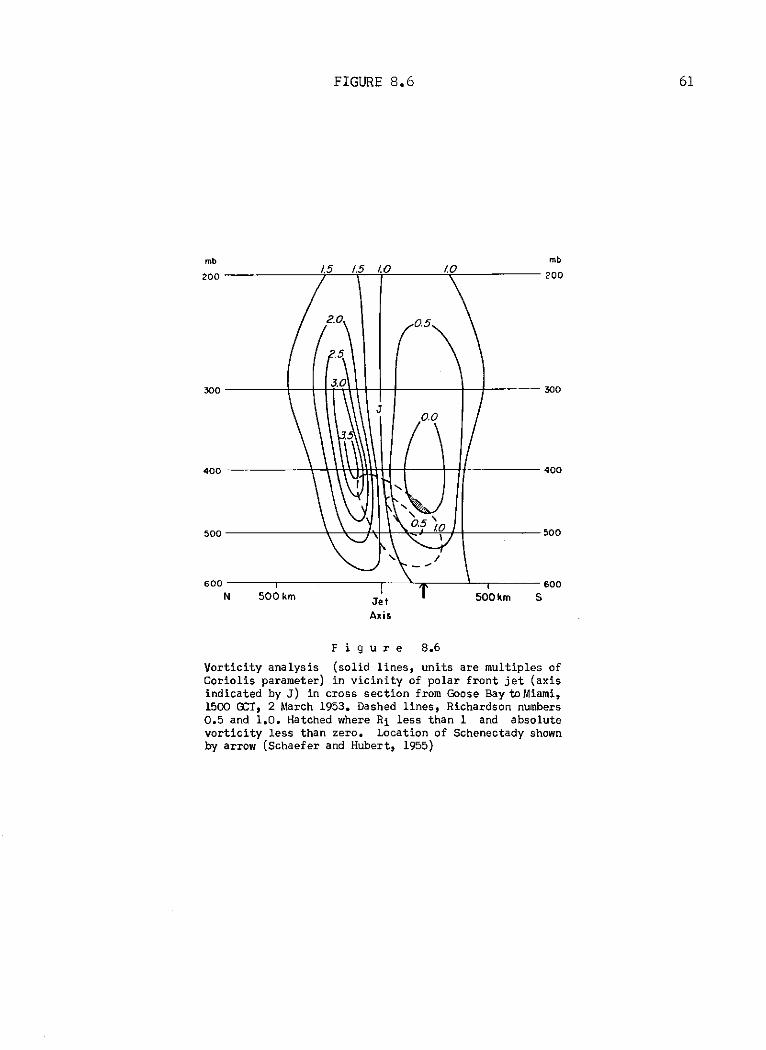
FIGURE 8.6 61
mbmb
300 ----+-+--rr'1++-\--I--I-----+---,I---- 300
500 ---------\----''r--f'ti--\-~.,.J.--".\'-,I-+------500
400 ------+-t+\r\-JrllitH+-+--+-t/'------ 400
______---..;'0p'5'--"fo5'-YI.OL-__--'T-' _200 200
600 ---,---------,---""',-----'-,---- 600
N Jet 500km S
Axis
Fig u r e 886
Vorticity analysis (solid lines, units are multiples ofCoriolis parameter) in vicinity of polar front jet (axisindicated by J) in cross section from Goose Bay to Miami,1500 GeT, 2 March 1953. Dashed lines, Richardson numbers0.5 and 1.0. Hatched where Hi less than 1 and absolutevorticity less than zero. Location of Schenectady shownby arrow (Schaefer and Hubert, 1955)
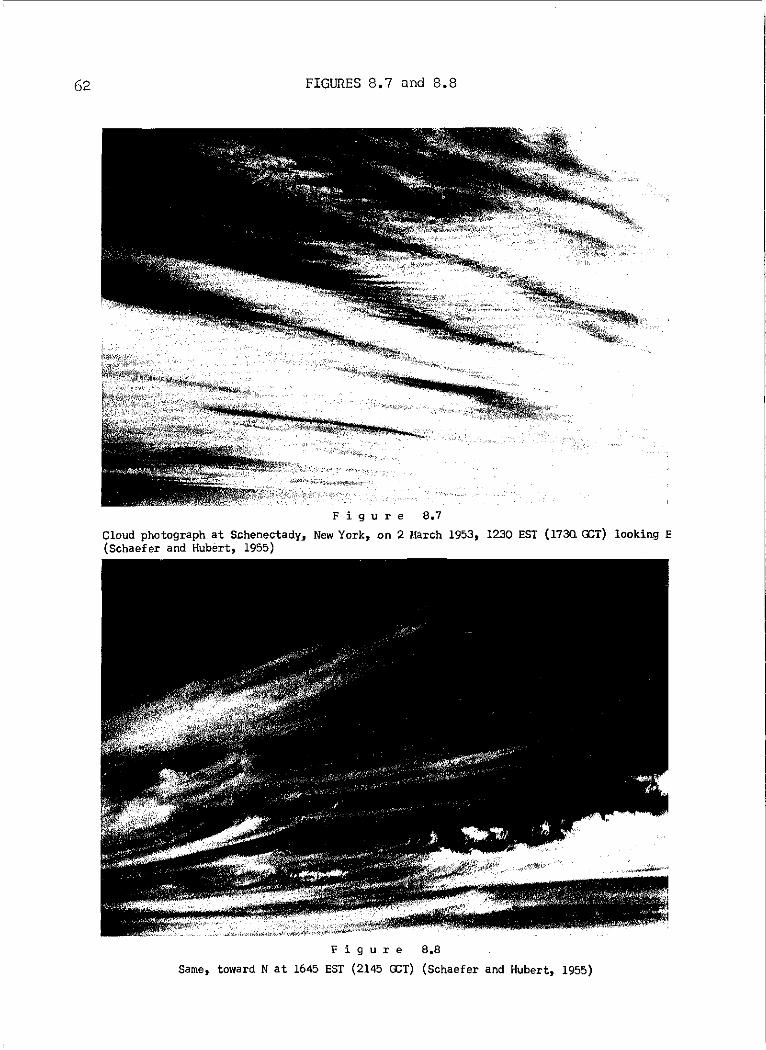
62 FIGURES 8.7 and 8.8
Fig u r e 8.7
Cloud photograph at Schenectady, New York, on 2 March 1953, 1230 EST (173QGeT) looking E(Schaefer and Hubert, 1955)
Fig u r e 8.8
Same, toward N at 1645 EST (2145 GeT) (Schaefer and Hubert, 1955)
BIBLIOGRAPHY
The bibliography to follow includes the bulk of papers to date on thejet stream. Although the foregoing report has been confined to observationalaspects, papers on theory and forecasting, and a scattering of papers inareas more or less directly related to the jet stream, have been included inthe bibliography. Because of the large number of papers listed, it is desirable to draw attention to some particular articles and surveys :
1. Extended discussions and surveys of jet stream and general circulation : Eady and Sawyer 1951; Flohn 1950 b; McTaggart-Cowan 1950; Petterssen1956; Riehl, Alaka, Jordan and Renard 1954; Rodriguez Franco 1955; Sheppard1951; University of Chicago 1947.
2. Mean circulation; climatology of weather systems : Brooks, Durst,Carruthers, Dewar and Sawyer 1950; Gibbs 1953; Mintz and Dean 1952; Petterssen1950; Widger 1952.
3. Analysis techniques on upper-level charts and cross sections, etc.:Saucier 1955.
4. Dynamic relationships between weather systems and jet streams, andweather forecasting : Dickson 1955; French and Johannessen 1954; Petterssen1956; Riehl and collaborators 1952.
5. Analogies with oceanic currents, and hydrodynamics experiments :Riehl and Fultz 1957; Rossby 1953.
6. Aircraft operations: Bannon, Frost and Kirk 1956; Dwyer 1953;Harrison 1951,
Extensive bibliographies on the jet stream and relatedthe following: Jet Stream - Evans and Kramer 1953b, U.S. Air1952; High-level Winds - Evans 1953, Evans and Kramer 1953 a;Rigby and Kramer 1954; Turbulence - Kramer and Rigby 1952. -
topics includeWeather Service
Tropopause
In preparing this monograph, great help was derived from the referenceto Meteorological Abstracts and Bibliography (MAE). With few exceptions, allarticles listed in MAE under the heading "Jet Stream" in Volumes 1 throughNumber 8 of Volume 8 (August 1957) are included; abstracts for other papersnot listed under this subject heading were also scanned.
Papers are listed by author, year, title, publication, volume, and pagenumber, in that order. Where an abstract has been located in MAE, the MAEindex number follows in parentheses. Index numbers 1- to 12- are for numbers1 to 12 in Volume 1; index numbers for other volumes are in the form 3.2- or3B-, for Volume 3, Number 2; 6.7- or 6G-, for Volume 6, Number 7, and so on.
64 BIBLIOGRAPHY
To save space, publication names have in most cases been abbreviatedaccording to the following list
Aer.
AFSG
AMM
AMGB
AWSTR
AWSM
BAAlS
BDW
CPRMS
GBMR
GBPN
GM
GPA
GRP
lAM
IJMG
JIN
JM
JMSJ
JRAS
MAB
MM
MRP
MWR
NZCN
NZTN
PMG
PTMe
Aeroplane, London
Air Force Surveys in Geophysics, U.S. Air Force, Cambridge ResearchCenter
Australian Meteorological Magazine
Archiv fuer r'ieteorologie. Geophysik und Bioklimatologie
Air Weather Service Technical Report, U.S. Air Weather Service
Air Weather Service Manual
Bulletin of the American Meteorological Society
Berichte. Deutscher Wetterdienst in der U.S.-Zone
Centenary Proceedings. Royal Meteorological Society
Great Britain Meteorological Office. Meteorological Reports
Great Britain Meteorological Office. Professional Notes
Geophysical Memoirs, Great Britain Meteorological Office
Geofisica Pura e Applicata
Geophysical Research Papers, U.S. Air Force, Cambridge ResearchCenter
Scientific Proceedings. International Association of Meteorology(UGGI). Rome 1954
Indian Journal of Meteorology and Geophysics
Journal of the Institute of Navigation, London
Journal of Meteorology
Journal of the Meteorological Society of Japan
Journal of the Royal Aeronautical Society
Meteorological Abstracts and Bibliography
Meteorological Magazine
Meteorological Research Papers, Great Britain, MeteorologicalResearch Committee
Monthly Weather Review
New Zealand Meteorological Service. Circular Note
"ew Zealand Meteorological Service. Technical Note
Papers in Meteorology and Geophysics, Tokyo
Proceedings, Toronto Meteorological Conference, Royal Meteorological Society
BIBLIOGRAPHY 65
quarterly Journal, Royal Meteorological Society
Tellus
USWB United States Weather Bureau, unpublished typescript
Wea o Weather
Wwi. Weatherwise
*Aanensen, C.J.M., 1948 : Turbulence in clear air near a warm front surface.MM 77, 209-210
Aeroplane, London, 1950 : Research into clear gusts. Aer. 78, 237-238 (9-99,3K-157, 5D-174)
Aeroplane, London, 1952 : Meteorology and Jet Aircraft, I and II, Aer. 82,234; 285-286 (4.1-32)
Aeroplane, London, 1954 : Jet stream variations. Aer. 86, 228 (6.2-135)
Alaka, M.A., 1955: A case study of an easterly jet stream in the tropics.Univ. Chicago, Dept. Meteorology, Ph.D. dissertation,March 1955 (75 p. typed)
Anderson, A.D., 1952 : Meteorological trajectory study for test flights to bemade from San Francisco. U.S. Nav. Res. Lab •• NRL Mem.Rep., No. 23 (4G-88)
*Anderson, R., B.W. Boville and D.E. McClellan, 1955 : An operational frontalcontour analysis model. QJffiAS 81, 588-599 (7.3-167)
Arakawa, H., 1950 The conservation law about the horizontal of the totalvorticity. PMG 1 (2.10-62)
* Referred to in text.
66 BIBLIOGRAPHY
Arakawa, H., 1951 Possible heavy turbulent exchange between the extratropica1 tropospheric air and the polar stratospheric air.Tel. 3, 208-211 (4.8-99)
Arakawa, H., 1951 Tropopause in a steady zonal wind field. JMSJ 29, 86-89(3.3-112, 4G-58, 5D-177)
Arakawa, H., 1952 The anticyclonic eddies just south of jet stream. A~GB
5, 1-4 (3.11-113, 4G-89)
*Arakawa, H., 1953 Clear-air turbulence near the jet stream. QJm~S 79,162-163 (4.6-140, 4G-120)
*Arakawa, H., 1956 Characteristics of the low-level jet stream. JM 13,504-506 (8.2-127)
Aubert, E.J.; Clem, L.H.; Klein, W.H.; Winston, J.S.; Hawkins, H.F. andMartin, D.E., 1950-53 : Weather and circulation of •••Nov., Dec. 1950; Apr., May, Nov. 1951; Jan., Apr • •••Aug.; Oct., Dec. 1952; Jan• ••• Mar. 1953. MWR 78 :201-203, 217-219; 79 : 71-73, 96-99, 208-211; 80 : 7-9,70-72, 82-87, 99-104, 118-122, 134-137, 190-194, 246249; 81 : 16-19, 43-46, 77-81 (3.6-7, 4G-121) (see alsolater monthly discussions in ~{wR)
*Austin, E.E., and J.K. Bannon, 1952 : Relation of the height of the maximumwind to the level of the tropopause on occasions ofstrong wind. MM 81, 321-325 (4.4-174, 4G-90, 5D-199)
*Austin, E.E., 1953 : Upper winds at Aden. QJRMS 79, 528-532
Austin, E.E., and D. Dewar, 1953 : Upper winds over the Mediterranean andMiddle East. MRP 811 (2 p.)
Badner, J., and M.A. Johnson, 1957 : Relationship of tropopause and jetstreams to rainfall in southeastern United States,February 4-9, 1957. MWR 85, 62-68
Baker, W.C., 1952 Riding the jet streams. Air Facts, N.Y., 15, 39-45 (3K209)
Bannon, J.K., 1948 Meteorological factors in the occurrence of turbulenceat high altitudes. MRP 436 (12 p.)
Bannon, J.K., 1951 a : Meteorological aspects of turbulence affecting aircraft at high altitude. GBPN 104; MM 80, 271 (3K-162,4G-60)
*Bannon, J.K., 1951 b : Severe turbulence encountered by aircraft near jetstreams. MM 80, 262-269 (3.2-120, 3K-163)
BIBLIOGRAPHY 67
Bannon, J.K., 1951 c : Severe clear air turbulence experienced at high altitude on 2 and 7 November 1950. MRP 631 (3K-145, 4G-61)
*Bannon, J.K., 1951 d : Turbulence at high altitude: a further meteorologicalanalysis. MM 80, 331-332 (4E-207)
*Bannon, J.K., 1952 Weather systems associated with some occasions of severeturbulence at high altitude. WA 81, 97-101 (3K-188, 5D201)
Bannon, J.K., and N.E. Davis, 1953 : Atmospheric circulation at high altitudes in the tropics and subtropics. MM 82, 116-121 (4E249)
*Bannon, J.K., and M.P. Jackson, 1953 : Relation between tropopause and levelof maximum wind at Gibraltar. MM 82, 100-102 (4E-250,5D-219)
Bannon, J.K., 1954 a : Note on the structure of the high altitude strong windbelt in the Middle East in winter. QJffiAS 80, 218-221
*Bannon, J.K., 1954 b : Note on the subtropical jet stream in January andApril 1951. IWA 83, 257-263 (6.2-127)
*Bannon, J.K., 1954 c : Some aspects of the mean upper-air flow over the earth.PTMe, 109-121
*Bannon, J.K., B.C. Frost and T.H. Kirk, 1956 : Some meteorological aspects ofhigh-level navigation. (Three articles); Bannon: Strongwinds in the upper atmosphere above 15,000 ft.; Frost:Jet streams and the pilot; Kirk : The problems of forecasting. JIN 9, 282-309 (7.10-49)
Bannon, J.K., and R.A. Jones, 1956(7.5-191)
Average wind at 60 mb. ~! 85, 194-200
*Bassus, K. von, 1906-1907 : Ueber die Windverhaeltnisse in der oberen Inversion. Beitrage z. Phys. d. freien Atmos., 2, 92-95(5D-9)
Beamer, C.C., and S.M. Serebreny, 1953 : Pacific jet stream research, for theperiod 1 February - 30 April 1953. Fan. Am. World Airw.,Inc., Pac. Alaska Div.; Bur. Aeronaut~ojectAROWA,Contr. N189s-90981, Frog. Repo No.1 (41-279)
Bell, G.J., and L.H. Kwai, 1953 : Upper winds determined by radar 1949 to1951. Hong Kong Roy. Obs., Tech. Notes, No.5 (4E-251,5B-304)
68 BIBLIOGRAPHY
Bellamy, J.C., 1954 : Four dimensional flight planning. Navigation 4, 105-113(6.7-91)
Bergeron, T., 1954 Multiple frontal systems as links in the general atmospheric circulation (Summary only). lAM, p. 289
*Berggren, R., B. Bolin and C.G. Rossby, 1949 : An aerological study of zonalmotion, its perturbations and breakdown. Tel. 1 (2), 1437 (2-74, 4G-13)
*Berggren, R., .1952 The distribution of temperature and wind connected withactive tropical air in the higher troposphere and someremarks concerning clear air turbulence at high altitude.Tel. 4, 43-53 (3K-189, 5D-202)
*Berggren, R., 1953
Berson, F.A., 1950
On temperature frequency distribution in the free atmosphere and a proposed model for frontal analysis. Tel. 5,95-100 (5.2-146, 5D-242)
On the rale of long-wave instability in the general circulation; a study of five-day means in November 1948.Sweden. Meteor. och Hydrolog. Inst., Medd., Ser. A., No.3 (4G-31)
Bhalotra, Y.P.R., 1955 : A case of severe clear-air turbulence over northIndia. Wea. 10, 329-330
Bilancini, R., 1950 : La "corrente a getto" (the jet stream). Rivista di meteorologia aeronautica, 10(3), 3-13 (2.9-75, 4G-32)
Bindon, H.H., 1950 A preliminary report on high level turbulence above20,000 feet over Eastern Canada. Nat. Res. Coun. ofCanada, Report, No. C.C. 125, 6 p:-T4E-182)
*Bjerknes, J., and E. Palmen, 1937 : Investigation of selected European cyclones by means of serial ascents. Geofys. Publ. 12,No.2, 62 p. (4E-87, 5D-91)
*Bjerknes, J., 1951 Extratropical cyclones. In: Compendium of Meteorology,Boston, pp. 577-598
*Bjerknes, V., J. Bjerknes, H. Solberg and T. Bergeron, 1933 : PhysikalischeHydronamik. Berlin, J. Springer, 797 p. (4G-2)
Blair, C.F., Jr., 1951 : Flying the jet stream. Skyways, N.Y., 10 (9), 12-13(4.4-175, 4G-62)
Bleeker, W., 1949 The relation between fronts and jetstream. BAMS 30, 190191 (2.5-84)
BIBLIOGRAPHY 69
Bleeker, W., 1950
Bolin, B., 1950
*Bond, H.G., 1953
The structure of weather systems. cPru~s, pp. 66-80 (2.367, 4G-63)
On the influence of the earth's orography on the generalcharacter of the westerlies. Tel. 2, 184-195 (2.2-60)
Easterly jet streams over Darwin. Wea. 8, 252-253 (5.1135)
Boogaard, H.M. v.d., 1954 : Jet stream between Pretoria and Maun. So. AfricaWea. Bur. News Ltr., No. 63:8 (6.4-144)
Boville, B.W., W.S. Creswick and J.J. Gillis, 1955 : A frontal jet streamcross section. Tel. 7, 314-321 (7.10-153)
Bracelin, P., 1952 Notes on jet streams and turbulence at high levels.Great Brit. Admiralty. Naval Wea. Svc •• Circ., No. 15/52; M~S 161/52 (3K-190, 3K-211, 5D-203)
*Bradbury, D., and E. Palmen, 1953 : On the existence of a polar front at the500 mb level. BAMS 34, 56-62 (5.1-145)
Briggs, J., 1952: Turbulence associated with a jet stream. MM 81, 119-120(3K-191)
Brooks, C.E.P., C.S. Durst and N. Carruthers, 1946 : Upper winds over theworld. Part I. The frequency distribution of winds at apoint in the free air. QJ~S 72, 51-54
*Brooks, C.E.P., C.S. Durst, N. Carruthers, D. Dewar and J.S. Sawyer, 1950 :Upper winds over the world. GM 10, No. 85, 149 p. (10117)
*Brundidge, K.C., 1956 : Analysis of selected project jet stream flight data.Texas A. and M. ColI., Dept. of Ocean~ Sci. Rep. No. 10(Contr. AF 19 (604) - 559)(62 p.)(8.7-174)
Brunt, D., 1930 The present position of theories of the orIgIn of cyclonic depressions. QJ~S 56, 345-350 (Reprinted in :Some problems of modern meteorology. Roy. Meteor. Soc.,London, 1934)
Buell, C.E., 1957 An approximate relationship between the variability ofwind and the variability of pressure or height in theatmosphere. Bk~S 38, 47-51
Bundgaard, R.C., 1954 : Observations on billow clouds and deforming exhausttrails from aircraft. PTAC pp. 182-187
70 BIBLIOGRAPHY
Campbell Orde, A.C., 1952 : Some practical experience with civil jet transport operation and associated meteorological problems.Aero. Eng. Rev., March 1952, 47-54
*Chambers, E., 1955 Clear air turbulence and civil jet operations. JRAS 59,613-628 (7.7-61)
*Chaudhuri, A.M., 1950 : On the vertical distribution of wind and temperatureover Indo-Pakistan along the meridian 76°E in winter.Tel. 2, 56-62 (3-87, 6-38, 4G-34)
Clapp, P.F., and J.S. Winston, 1951 : A case study of confluence as relatedto the jet stream. JM 8, 231-243 (3.5-224, 4G-63)
Clarkson, L.S., 1956 : Analysis of winds at 4C,OOO ft and 50,000 ft overSingapore. MM 85, 1-9
Clarkson, L.S., 1956 : Variation with time of winds at 40,000 ft and 50,000ftover Singapore. MM 85, 99-101
*Clem, Le R.H., 1954 : Clear-air turbulence at high levels. PTMe, pp. 193-198
Clem, Le R.H., De V. Colson and L.P. Harrison, 1954 : Corrections of upperlevel wind computations for effect of earth's curvature.Bk~S 35, 357-362
Clem, Le R.H., 1955 : Clear-air turbulence near the jet-stream maxima. BAMS36, 53-60 (7.4-197)
*Clodman, J., 1957
Co16n, J.A., 1951
*Colson, D., 1954
*Coudron, J., 1952
Coyle, J.R., 1950
Anisotropic high-level turbulence. QJm~s 83, 116-120
On the wind structure above the tropopause over PuertoRico. BAMS 32, 52-53 (2.11-118)
Meteorological problems in forecasting mountain waves.BAMS 35, 363-371
Le jet et les courbes de variation de la vitesse moyennedu vent avec l'altitude. Jour. Scien. de la Meteor., 4,143-148 (5D-247)
The nature of sub-stratospheric conditions on the BuenosAires-London air route. Panair do Brasil, Met. Serv.,Brazilian Wea. Study, 10 p. (3C-32, 4G-35)
*Cressman, G.P., 1948 : On the forecasting of long waves in the upper westerlies. JM 5, 44-57 (4G-9)
*Cressman, G.P., 1950 : Variations in the structure of the upper westerlies.JM 7, 39-47 (5-4C, 4G-36)
BIBLIOGRAPHY
*Crocker, A.M., W.L. Godson and C.M. Penner, 1947JM 4, 95-99
Frontal contour charts.
71
Crocker, A.M., 1949 : Synoptic applications of the frontal contour chart :the motion of selected lows, 5-7 November 1946. QJ~~S
75, 57-70
Crocker, A.M., 1952 : Jet stream in eastern North America on the afternoon ofMay 20, 1952. Canada. Met. Div •• Cir. 2153, Tec. 119(4G-91)
Crossley, A.F., 1949 Equivalent head winds on air routes. JIN 2, 195-209
*Cunningham, N.W;, 1956 a : A study of thermal wind in the vicinity of a jetstream. Texas A. and M. ColI., Dept. Ocean., Sci. Rep.No. 8 (Contr. AF 19 (604)-559) (8.6-199)
*Cunningham, N.W., 1956 b : The frequency distribution of high velocity windcurrents over Texas. Texas A. and M. College. Dept.Ocean•• Sci. Rep. No.9 {Contr. AF 19 (604)-559)(8.6265)
Current Science, 1953 : "Jet Stream" under study. Curro Sci., Calcutta, 22,135 (6.2-134)
Dahler, H., 1957 Zur Entstehung des Jetstreams und einige Folgerungen.Met. Runds. 10, 93-100
Dalziel, K., 1955: Rawin measurements at Heard Island. AMM No. 10, 47-56
Davies, D.M., 1950 : Atmospheric winds. JRAS 54, 602-605 (4G-37, 2.1-122)
*Davies, D.A., and Sansom, H.W., 1952 : Easterly jets over East Africa. Wea. ~343-344 (4.4-176, 4G-92)
Davis, N.E., 1951
*Davis, N.E., 1954
Defant, A., 1949
Defant, F., 1951
The mean position of the jet stream. MRP 615 (4G-64)
A successful transatlantic crossing in a jet stream.N~ 83, 268-271 (6.2-128)
Neuere Ansichten ueber die allgemeine Zirkulation derAtmosphaere in mittleren Breiten. m~GB Ser. A., 1:273294 (4-54, 4G-19, 5D-148)
Die Aenderungen des meridionalen Windprofils durch Kondensationswaerme und Turbulenzvorgaenge. AMGB 4, 156-175(3.3-106, 4B-253, 4G-65)
72
Defant, F., 1953
Defant, F., 1956
BIBLIOGRAPrrl
On the mechanism of index changes. Univ. Chicago. Dept.Meteor., Contr. N6 ori-20, T.O. II, Proj. NR 082 003,Tech Rep. May 1953 (5D-248, 7A-193)
Ueber die Struktur hochtroposphaerischer Duesenstroemeinsbesondere des subtropischen Strahlstroms ueber Nordamerika. BDW No.4 (22), 126-133 (8.7-152)
*Defant, F., and H. Taba, 1957 : The threefold structure of the atmosphere andthe characteristics of the tropopause. Tel. 9, 259-274
de Pasquale, 0., 1955 : Idee e applicazioni precorritrici di oltre 30 anniaddietro sulle "correnti a getto". Riv. di Meteor. Aero.15, 32-34 (8.1-198)
*Dickson, R.R., 1955 : A case study of the jet stream. BA~S 36, 195-203 (7.4144)
Dickson, R.R., _1955 : Aids to jet stream forecasting. U.S. Office of NavalOperations, NAVAER, 50-1P-533. 53 p. (8C-67)
Dines, W.H., 1911 The vertical temperature distribution in the atmosphereover England, and some remarks on the general and localcirculation. Phil. Trans. Roy. Soc. London, Ser. A.,211, 277-300
*Dobson, G.M.B., 1920 : Winds and temperature gradients in the stratosphere.QJRMS 46, 54-64
*Douglas, C.K.M., 1922 : Observation of upper cloud drift as an aid to research and to weather forecasting. QJRMS 48, 342-356
Douglas, C.K.M., 1925 : On the relation between the source of the air and theupper air temperature up to base of the stratosphere.QJRMS 51, 229-238 (5D-50)
Due Rojo, A., 1954 El "Jet stream" 0 rio aereo estratosf~rico. Revista deGeofisica, Madrid, No. 49, 1954 (6.10-136)
Dunning, H.H., and N.E. La Seur, 1955 : An evaluation of some condensationtrail observations. BAMS 36, 73-79 (6.9-248)
Dursi Moreau, E.V., 1954 : Corriente de "chorro". Rev. Nac. de Aeronaut.Buenos Aires, 14, 54-55 (6.2-129)
*Durst, C.S., and N.E. Davis, 1949 : Jet streams and their importance to airnavigation. JIN 2, 210-218 (4G-20)
Durst, C.S., 1952 High level winds and temperatures for jet aircraftoperation. QJru~s 78, 442-448 (4E-229). Discussion follows
Durst, C.S., 1952
BIBLIOGRAPHY
The relation between wind flow over· British Isles andthe Mediterranean. MRP 776, 2 p. (4E-230)
73
Durst, C.S., 1954 a : The accuracy of route wind forecasts for aviation. JIN7, No. 1
Durst, C.S., 1954 b : Variation of wind with time and distance. GM 12, No. 93
Durward, J., 1921: Diurnal variation in wind velocity and direction at different heights. GBPN 15, 12 p.
Durward, J., 1925 The investigation of the winds in the upper air from information regarding the place of fall of pilot balloonsand the distribution of pressure. GBPN 42, 13 p. (4G-l)
Durward, J ., 1936 Upper winds at Wadi Ha lfa (Sudan). GBPN 72, 11 p.
Durward, J., 1937 : Upper winds measured at MIY Imperia, Mirabella Bay,Crete. GBPN 79, 13 p.
Durward, J" 1938 : Upper winds at Nicosia (Cyprus). GBPN 87, 12 p.
Durward, J., and D.C.E. Jones, 1955 : Weather phenomena at high levels.Aer. 88, 18-21 (6.9-151)
*Dwyer, W.A., 1953
Dwyer, W.N., 1955
Dykes, C., 1952
Meteorology and the operation of high altitude aircraft.A~~ No.3, 22-37 (6.11-69)
Cloud forms associated with "jet stream". AMM No.855-56 (7.7-200)
Some operating problems of future transport aircraft.JRAS 56, 189-200 (3K-210)
*Eady, E.T., and J.S. Sawyer, 1951 : Reviews of modern meteorology - Dynamicsof flow patterns in extra-tropical regions. QJru~s 77,531-551 (3.4-114, 4G-66)
Ekhart, E., 1940 Zur Kenntnis der Windverhaeltnisse in der oberen Stratosphaere. Berlin, Reichsamt fuer Wetterdienst, 50 p. (5D108)
Ellison, T.H., and C.D. Walshaw, 1955 : The evaluation of some regression coefficients for estimating the 150 mb wind at Liverpool.QJRMS 81, 480-483
*Emery, P.F., 1956 Strong winds at high levels in the equatorial zone ofthe Far East. MM 85, 275-277 (8.2-128)
74 BIBLIOGRAPHY
Endlich, R.M., 1953 : A study of vertical velocities in the vicinity of jetstreams. JM 10, 407-415 (5.6-117, 5H-90). See alsoFleagle (letter) and Endlich (reply), JM 11, 513-514(6.5-116)
*Endlich, R.M., P. Harney, G.C. McLean, and others, 1954 : Project jet stream.The observation and analysis of the detailed structureof the atmosphere near the tropopause. Bk~S 35, 143-153(6.5-121)
*Endlich, R.M., S.B. Solot and H.A. Thur, 1955 : The mean vertical structureof the jet stream. Tel. 7, 308-313 (7.9-144)
Esso Air World, New York, 1951 : Clear air turbulence. Vol. 3, 128-130 (3K168, 5D-180)
*Evans, Gwynne J., 1953 : Selective annotated bibliography on high level winds(500-100 mb). MAB 4, 613-655 (6B-150)
*Evans, G.J., and M.P. Kramer, 1953 a : Selective annotated bibliography onstratospheric and ionospheric winds (above 100 mb). MAB4, 733-754 (6B-150)
*Evans, G.J., and M.P. Kramer, 1953 b : Annotated bibliography on the jetstream. MAB 4, 822-845 (6B-150)
Ewing, A., 1954 Jet stream steers the weather. Sci. News Ltr., 66, 362364 (7.1-199)
Farkas, E., 1954 Upper winds over Canton Island and Tarawa. NZTN No. 115,Wellington, 5 p.
Farkas, E., 1955: Upper winds over Invercargill. NZTN No. 121, 6 p.
*Faust, H., 1953: Die Nullschicht, der Sitz des troposphaerischen Windmaximums. Met. Rundschau, 6, 6-15 (4E-253)
Faust, H., 1954 Die Strahlstroeme als Erscheinungen der Nullschicht.Met. Rund., 7, 161-166 (6.2-130)
Faust, H., 1955 Uebergradientische Winde in der Nullschicht und das Problem der Strahlstroeme. AMGB 8, 45-71 (6.8-10)
*Ference, M., 1951 Instrumentation and techniques for meteorologicalmeasurements. Compendium of Meteorology, Boston, pp.12071222
Fleagle, R.G., 1957 : On the dynamics of the general circulation. QJRMS 83,1-20
BI BL IOGRAPHY 75
*Fletcher, R.D., 1953 : The association of wind speed with height of upper-airconstant-pressure surface. BAMS 34, 155-159 (4G-131)
Flohn, H., 1950 a Die planetarische Zirkulation der Atmosphaere bis 30 kmHoehe. BDW No. 12, 156-161 (10-68)
*Flohn, H., 1950 b Grundzuege der allgemeinen atmosphaerischen Zirkulationauf der Suedhalbkugel. AN1GB 2, 17-64 (6-39, 4G-38)
Flohn, H., 1951: Die Zirkulation der Atmosphaere in den Polargebieten.Polarforschung, 3, 58-64 (3.3-108)
Flohn, H., 1951/52 Behrmann's "Prinzip der Selbstverstaerkung" in der Meteorologie und die Maeanderbildung in Atmosphaere undOzean. Erde, Berlin, (3/4), 211-219 (3.10-109, 4G-93)
Flohn, H., 1952 Probleme der grossraeumigen Synoptik. BDW No. 35, 12-23(3.10-72)
Flohn, H., 1954 Investigations on the general atmospheric circulation,especially in lower latitudes. lAM pp. 431-442
*Foster, R.L., and E.F. Robinson, 1953 : The strong jet over the South-westernPlains States, November 24-25, 1953. MNR 81, 374-378(5.11-88)
Fotheringham, R.R., 1953 : High altitude winds at O.W.S. "Polar Front". MRP812, 2 p.
Freeman, J.C., Jr.; J.T. Hurt; A. Kasahara, 1956 : Barotropic models of thejet stream. Texas A. &M. ColI. De t. Ocean. andMeteor., Sci Rep. No. 12 Contr. AF 19 (604)-559)(98 pp.)(8.6-2)
*French, J.E. and K.R. Johannessen, 1954 : Forecasting high clouds from highlevel constant-pressure charts. PTMC, 160-171 (6.3-75)
*Frost, B.C., 1953: Flying in jet stream winds. Shell Av. News, No. 186,4-8 (5.9-203)
*Frost, B.C., 1954 More about the jet stream. Shell Av. News, No. 195, 1418 (6.6-253, 7.7-62)
Frost, B.C., 1955 Novos fatos s8bre 0 jet stream. Aviacao, Rio de Janeiro,17, 288-299
*Frost, R., 1952 The upper air circulation in low latitudes and its relation to certain climatological discontinuities. MRP 706(3.7-87, 4G-94)
76 BIBLIOGRAPHY
Fuglister, F .C., 1951 : Multiple currents in the Gulf-stream system. Tel. 3,230-233
Fultz, D., 1949
Fultz, D., 1951
A preliminary report on experiments with thermally produced lateral mixing in a rotating hemisph~rical shellof liquid. JM 6, 17-33 (3-43)
Experimental analogies to atmospheric motions. Compendium of Meteorology, Boston, 1951. pp. 1235-1248
*Gabites, J.F., 1952 : Mean westerly wind flow between the 700 and 100 millibar levels over the New Zealand region. NZTN No. 90(4G-95)
Gabites, J.F. and E.M. Porter, 1952 : Equivalent head winds on air routesleading to New Zealand. NZTN No. 86, 4 p. (4E-234)
Gabites, J.F. and E.M. Porter, 1952 : Equivalent head winds at 30,000 ft onSouth Pacific air routes during 1951. NZTN No. 83, 4 p.(4E-234)
Gabites, J.F., 1953 : Mean westerly wind flow in the upper levels over theNew Zealand region. New Zeal. Jour. Sci. and Technol.,Sec. B. 34, 384-390 (4G-123)
Gales, D.M., 1955
Garriock, A., 1955
Gazzola, A., 1954
*Gazzola, A., 1955
Airways weather San Francisco-Cheyenne. Trans World Airlines, Inc., Jan. 15, 1955. 23 p. (7.3-63)
A case of clear air turbulence at medium altitudes. A~n
No.9, 44-54
Le jet stream dans une situation de bloquage. lAM,pp. 44-49
La corrente a getto durante une situazione di blocco.Riv. di Meteor. Aero., Rome, 15, 25-31 (8.1-193)
General Electric Review, 1953 : "The jet was chasing its tail". G.E. Rev.,56, 42-47 (4G-132)
Georgi, J., 1950
Georgii, W., 1953
*Gibbs, W.J., 1952
Hochstuerme ueber der Daenemarkstrasse. Deutsche Hydrogr.Zeits., 3, 136-143 (4G-39)
1. Problemas de la corriente ondulatoria y de chorro enla Argentina. Rev. Nac. de Aeronaut., Buenos Aires, 13,33-37; 2. La corriente atmosferica de chorro. Ibid., 13,42-45 (5.7-128, 5H-126)
Notes on the mean jet stream over Australia. JM 9, 279284 (4.2-107, 4D-263, 4G-96)
BIBLIOGRAPHY 77
*Gibbs, W.J., 1953
*Gibbs, W.J., 1955
A comparison of hemispheric circulations with particularreference to the western Pacific. QJFlliIS 79, 121-136(4D-270, 4G-124)
200 mb divergence associated with rapid and intensecyclogenesis. ANV~ No. 11, 17-35
Gilchrist, A., 1953 : Upper winds in the tropics and subtropics. MRP 795,12 p. (5D-223)
*Gilchrist, A., 1955 : Winds between 300 and 100 mb in the tropics and subtropics. GBMR No. 16, 28 p.
Girs, A.A., 1955
Godson, W.L., 1955
Gold, E., 1953
*Goldie, A.H.R., 1937
*Goldie, A.H.R., 1939
K voprosu ob izuchenii obshchel tsirkuliatsii atmosfery.(Investigation of the general circulation of the atmosphere.) Akademiia Nauk SSSR, Izvestiia, Ser. Geo9., No.4, 16-28 (7.10-149)
Arctic jet streams and high-level turbulence. In : Sci.Pap. No.1, Arctic Met. Group, McGill Univ. (Contr. AF19 (604)-1141) (8.4-179)
The variation of wind near the tropopause. MM 82, 194198 (4.11-192, 5D-224)
Kinematical features of depressions. QA No. 72
Depressions as vortices. QA No. 79
Goldie, A.H.R., 1947 The upper atmosphere. Estimated distribution of temperature, pressure and wind up to the 45 km level. MRP360,6 p.
Goody, R.M., 1954
Grant, A., 1952
The physics of the stratosphere. Cambridge monog. onPhys., Cambridge Univ. Press, 187 p. (5D-231)
A re-examination of the zonal-wind profile under conditions of constant vorticity. JM 9, 439-441 (4.7-73)
Gray, G.J., Jr., 1951 : Jet streams and aircraft operations. ~Ni. 4, 99-101;III (3.4-118, 4G-67)
Gray, R. and N. Carruthers, 1951 Upper air over the Falkland Islands. MAl80, 125-130 (2.11-181)
Great Brit. Met. Off., 1950 : Equivalent headwinds on some of the principalair routes of the world. GBMR No.7, 19 p. (11-116, 4E192)
78 BIBLIOGRAPHY
Great Brit. Met. Off., 1951 : Upper air climatology of the Southern Hemisphere. Discussion. MM 80, 52-56 (2.8-159)
Great Brit. Met. Off., 1951 : Measurement of upper winds. Discussion. MM 80,83-86
Great Brit. Met. Off., 1952 : Winds in the stratosphere over Great Britain.Discussion. WA 81, 14-18
Great Britain Met. Off., 1952 : Forecasting winds at 30,000 - 40,000 feet andabove. Discussion. MM 81, 79-85 (3.9-69)
*Great Britain Met. Off., 1955 : Forecasting for long distance flights. ~~ 84,79-89
Great Brit. Nav. Wea. Serv., 1952 : Notes on jet streams and turbulence athigh levels. Gt. Brit. Nav. Wea. Serv'l Circ. No. 15/52,7 p.
Grover, J.H.H., 1955 Operational aspects of jet streams. Aeronautics,London, 32, 102-105 (7.2-134)
*Gustafson, A.F., 1949 : Final report on the upper winds project. Dept. Meteor. Univ. Calif. Los Angeles
*Gustafson, A.F., 1954 : The error in rawin computations due to neglecting theearth's curvature. BAMS 35, 295-300
*Gutenberg, B., 1949 New data on the lower stratosphere. BAMS 30, 62-64
Harding, E.T., 1954 Jet stream research in the Navy. Wwi. 7, 3-6 (6.2-131)
Harding, J., 1955: The profile of jet streams in the Middle East. MRP 932,11 p. (7.5-121)
Harley, D.G., 1954 Equivalent tail winds pn the Shannon to Gander route.JIN,Jan. 1954, see also MRP 749, 1952
*Harrison, H.T., Jr., 1950 : Some characteristics of the upper level LOW andthe jet stream. United Airlines, Inc. ~~teor. Circ.,No. 34 (3K-151, 4G-40)
*Harrison, H.T., 1951 : Some meteorological problems indicated for jet transport operation at 40,000 feet. Aero. Eng, Rev., Apr.1951, 52-61 (3.1-17, 5D-187)
Haurwitz, B., 1954 Zonal wind field in the upper atmosphere. New York Univ.,Res. Div., Contract AF 19 (122)-49, Scien. Rep. No.7,Feb.~54 (6.9-223)
BIBLIOGRAPHY 79
Hay, R.F.M., 1952
*Hay, R.F.M., 1953
Heastie, H., 1955
Heines, J.M., 1956
Wind at high levels over Hong Kong. MRP 778, 6 p. (4E239)
High level strong easterlies over Singapore and HongKong. Wea. 8, 206-208 (See also MRP 770, 1952)
Average height of the standard isobaric surfaces overthe area from the North Pole to 55oN in January. MRP 918(6.ll-272)
Jet stream navigation. Shell Avia o News, London, No.212, 14-18 (8.2-129)
Herbst, W., R. Neuwirth and K. Philipp, 1954 : Betrachtungen ueber die Eignungradioaktiver atomtechnischer Aeroso1e a1s Markierungsmittel bei Arbeiten auf dem Gebiete der MeteorologischenStroemungsforschung. ~atu~iss., 41, 156-160 (5.8-276,7E-68)
*Hess, S.L., 1948 Some new meridional cross-sections through the atmosphere. JM 5, 293-300 (4G-10)
*Hesselberg, Th., 1913 : Die Luftbewegung im Cirrusniveau. Veroeff. Geophys.Inst. Univ. Leipzig, Serie 2, Band 1, 17-73
Hi1debrandsson, H.H., 1898 : Etudes internationa1es des nuages 1896-1897.Observations et mesures de 1a Suede. Upsala, 182 p.(4E-254)
Hille, A., 1954 Trans. (Jet streams and frontal zones in the upper air).Tdoejaras, 58, 90-95 (6.2-132)
Hislop, G.S., 1949 Clear air turbulence incident encountered by D-H "Comet"aircraft 14 November, 1949. Brit. Eur. Airways Corp.,R.S.D. Note, No. 41 (3K-133, 4G-21)
Hislop, G.S., 1950 Gusts from a clear sky. ~~craft, Melbourne, 29; 18-19,40-41 (4E-193)
Hislop, G.S., and D.M. Davies, 1950 : An investigation of high altitude clearair turbulence over Europe using Mosquito aircraft. Gt.Brit. Aeronaut. Res. Council, Rep. and memoranda, No.2737 (6.2-199)
*Hislop, GoS., 1951 Clear air turbulence over Europe. JRAS 55, 185-225 (3K172, 5D-188)
Hofmeyer, W.L., 1950 : Remarks on the theory of the jet stream. JM 7, 245(4G-41)
80 BIBLIOGRAPHY
*Hofmeyer, W.L., 1952 : A statistical analysis of radar winds over Pretoria inwinter. Notos, 1, No.4, 186-192
*Hofmeyer, W.L., 1953 : A statistical analysis of radar winds over Pretoria insummer. Notos, 2, No.3, 144-148
Hollman, G., 1954 Zur Frage des Nullschichteffekts und der Strahlstroeme.Met. Runds., 7, 166-170 (6.2-133)
Hovmoeller, E., 1948 : North-south cross section showing distributions oftemperature, relative hllinidity and wind in a well-markedzonal current over western Europe. JM 5, 67-69 (4G-ll)
Hovmoeller, E., 1950 : Zonal and meridional air currents in the stratosphereover Europe. GPA 17, 112-120 (2 0 5-66, 4E-194)
Hoyle, H.D., 1955 The subtropical jet-stream of the North Pacific in January and April 1952 0 MRP 924, June 28, 1955. 8 po (7.5-122)
Hsieh, Y.-P., 1949 An investigation of a selected cold vortex over NorthAmerica. JM 6, 401-410 (3-46)
Hsieh, Y.-P., 1950 a : On the formation of shear lines in the upper atmosphere.JM 7, 382-387 (2.4-74)
*Hsieh, Y.-P., 1950 b : The mean wind and temperature distribution through aflat upper ridge in winter. Tel. 2, 130-133 (11-71, 4G-42)
Hubert, W.E., 1953 A case study of variations in structure and circulationabout westerly jet streams over Europe. Tel. 4, 359-372(5.7-86)
*Hubert, W.E. and Y. Dagel, 1955 : Upper mean flow over the North Atlanticduring January 1952. Tel. 7, 111-117 (6.10-193)
Hughes, G.D. and R.I. Foster, 1954 : The tropopause during a major change incirculation over the Western United States, November 25to 28, 1954. M~R 82, 343-353 (6.11-172)
*Hurst, G.W., 1952 The profile of a jet stream observed 18 January 1952.QJRMS 78, 613-615 (3.10-196, 4G-98)
*Hurst, G.W., 1953 The profile of a jet stream observed 1 September 1952.QJRMS 79, 407-411
*Hutchings, J.W., 1950 : A meridional atmospheric cross section for an oceanicregion. JM 7, 94-100 (7-40, 4G-43, 41-252, 5D-167)
Hutchings, J.W., 1952 a : A note on the distribution of free air wind vectorsabout their mean. QJRMS 78, 105-106
BIBLIOGRAPHY 81
*Hutchings, J.W., 1952 b : The winter jet-stream in the Southern Hemisphere.Wea. 7, 73-77 (3 0 5-143, 4G-99) (See also Wea. 7, 258)
*Hyde, E.A., 1954 Clear air turbulence and its allied phenomena. ~~.~, No. 192, 14-15
Iselin, C.O., 1950 Some common characteristics of the Gulf-stream and theatmospheric jet stream. N.Y. Acad. Sci., Transactions,2nd ser. 13, 84-86 (3.4-115, 4G-44)
Ishimaru, Y., 1952 Fundamental vorticity equation and jet stream mechanism.Mechanism of the earth's atmosphere, 4th communication.Geophys. Mag., 24, 41-80 (4G-IOO, 6.1-127)
Ishimaru, Y., 1954 On the zonal circulation and its perturbation. (Mechanism of the earth's atmosphere, 5th communication. Geophys. Mag., 25, 123-149 (5.9-127)
Isozaki, I., 1952 A mechanism of pressure disturbance. J. Met. Res., Toky~
4, 97-105 (5.4-147)
Izawa, T., 1950 On the upper distur.bances in the westerlies whose meancirculation have longitudinal wind gradient (in Japanese).JMSJ 28, 224-232 (2.7-80)
*Jacobs, L.E., 1955 Navigational aspects of the jet stream. Navigation, 4,242-249 (7.4-145)
James, D.G., 1953 An account of one of the methods employed in the investigation of clear air turbulence. MRP 792, 7 p.
James, R.P., and G.C. Holzworth, 1954 : Some fluctuations in the jet streamand tropopause associated with cyclonic development andmovement, February 18-21, 1954. MWR 82, 64-72 (6.6-173)
James, R.W., 1951
James, R.W., 1952
Jenista, C.O., Jr.,
*Jenkins, C.F., 1952
A February cross-section along the Greenwich meridian.MM 80, 341-346 (3.6-84, 4G-68)
On the vertical structure of pressure and wind-fields.A~GB 5, 17-35 (3.10-112)
1953 : A statistical study of precipitation distributionas related to various types of mean zonal motion. BANIS34, 10-13 (4.11-220)
Forecasting the mountain wave. AFSG No. 15 (5.1-211)
Jenkins, C.F., and J. Kuettner, 1953 : Flight aspects on the mountain wave.AFSG No. 25
82 BIBLIOGRAPHY
*Jenkinson, A.F., 1954 : Upper winds from nephoscope observations. MM 83, 174D5
*Jenkinson, A.F., 1955 : Average vector wind distribution of the upper air intemperate and tropical latitudes. MM 84, 140-147 (6.10197)
Jenkinson, A.F., 1956 : The relation between standard deviation of contourheight and standard vector deviation of wind. QJRMS 82,198-208
Johnson, DoH., 1952 : Further notes on the wind field of middle latitudes.MRP 761 (4.6-151, 4G-I02)
Johnson, D.H., 1953 a The accuracy of 100 mb contour heights. MRP 800, 3 p.
*Johnson, D.H., 1953 b Jet stream of October 28, 1952. MM 82, 178-182 (4G133)
Johnson, D.H., 1953 c : The jet stream. Parts I and II. Wea. 8, 270-274;325-329 (5.4-163)
*Johnson, D.H., 1953 d : A further study of the upper westerlies; the structure of the wind field in the eastern North Atlanticand western Europe in January 1950. QJRMS 79, 402-407(4.11-193)
Johnson, D.H., and S. Daniels, 1954 : Rainfall in relation to the jet streams.QJRMS 80, 212-217 (5.6-220, 5H-96)
du Jonchay, I., 1952 : L'importance des vents portants en altitude notammentdans Ilhemisphere sud. GPA 21, 52-57 (3.11-163)
Jones, D.C.E., 1953 : Investigation of high altitude clear air turbulencenear jet streams: special flights by R.A.F. and R.A.E.aircraft. MRP 827, 4 p. (5.6-163)
Jones, D.C.E., 1953 : Weather systems associated with some occasions of severeturbulence in clear nir at high altitude : a furtheranalysis. MRP 828 (5.6-163)
*Jones, D.C.E., 1954 : Further investigations of high-level clear-air turbulence. MM 83, 166-173 (5.9-184)
*Jones, D.C.E., 1955 : Exceptionally severe clear-air turbulence and otherphenomena on 14 April, 1954. MM 84, 107-111(6.7-223)
*Jones, F.E., 1949 Radar as an aid to the study of the atmosphere. JRAS 53,437-448
BIBLIOGRAPHY 83
Jones, J.J., 1951 The physical causecl the jet stream in the Japanese area.U.S. Air Force 2143 D Air W~a. Wing Tech. Bull. 1 (7),4-21 (3.6-85, 4G-77)
Kasahara, A., 1950 On the dynamical mechanism of the high tropospheric jetstream. Tokyo, Univ. Geophys. Inst., Geophys. ~,3(31), 10 p.; also Collected Meteor. ~apers, 2(2) (2.1072, 4G-45)
Kasahara, A., 1956 Three dimensional structure of small-scale atmosphericperturbations aloft. Texas A. and M. ColI. Dept. ofOcean., Sci. Rep. No.7 (Contr. 'AF (604)-559) (39~)(8.6-201)
Kaufman, P., 1950 Bemerkungen zum jet-stream in Atlantik-Wetterdienst.BDW No. 12, 200-201 (10-61)
*Kelly, R.C., and H.B. Caster, 1954 : Simulated jet transport operation. Soc.Automotive Engrs., N.Y., S.A.E. Preprint, No. 298 (6.792)
Khrgian, A.K.H., 1953 : Fizika a~osfery. Mosc~~. 456 p. (5D-243, 5.7-7)
Kimpara, A., 1953: A~~ospherics due to fronts in the upper atmosphere.Nagoya Univ., Res. Inst. of Atmospherics, Proc., 1, 4549 (4K-263)
Klein, W.H., 1951
Klein, W.H., 1954
A hemispheric study of daily pressure variability at sealevel and aloft. JM 8, 332-346
The weather and circulation of April 1954 : A month witha confluent jet stream. AWIR 82, 104-109 (6.5-122)
*Kleinschmidt, E., Jr., 1941 : Stabilitatstheorie des geastrophischen Windfeldes. Ann. Hydrogr., Berlin, 69, 305-325
Kleinschmidt, E., Jr., 1955 : Die Entstehung einer ~6henzyklone tiber Nordamerika. Tel. 7, 96-110 (7.11-178)
Klieforth, H.M., 1955 : Mountain wave - jet stream project. Dept. Meteor.UCLA, Final Report, Contr. AF 19(604)-1308 (8.3-235)
Knighting, E., 1954 Upper winds over the world. QJRMS 80, 239-240
Kobayashi, Y., 1951 On the zonal component of upper wind at Tateno. J. Aero.obs., Taten~, Japan, 5, 37-41 (4E-268)
*Kochanski, A., 1955 : Cross sections of the mean zonal flow and temperaturealong 80oW. JM 12, 95-106 (6.8-202)
84
Koo, C.-C., 1955
BIBLIOGRAPHY
Der dynamische Einfluss des Hochlandes von Tibet auf dieostasiatische Zirkulation. Acta A ronomica, Budapest, 5,273-284. Also (in Hungarian Idojaras, 59, 204-211
*Koteswaram, P., 1953 : An analysis of the high tropospheric wind circulationover India in winter. IJMG 4, 13-21 (4G-125)
Koteswaram, P., C.R.V. Raman and S. Parthasarathy, 1953 : The mean jet streamover India and Burma in winter. IJMG 4, 111-122 (4G-134,5B-309)
Koteswaram, P., and S. Parthasarathy, 1954 : The mean jet stream over Indiain the pre-monsoon and post-monsoon seasons and verticalmotions associated with subtropical jet streams. IJMG 5,138-156 (8.1-201)
*Koteswaram, P., 1956 : Easterly jet stream in the tropics. Vniv. Chicago.Dept. Meteor., Rep. on Res., Proj. NR 082-120 (Contr.N 6 ori -02036) (8.6-202)
Koteswaram, P., 1957 : Mean zonal wind circulation over India. IJMG 8, 346347
*Kramer, M.P., and M. Rigby, 1952 : Selective annotated bibliography on atmospheric turbulence and "bumpiness" in flight. MAE 3 (11),1185-1219 (3K-, 4G-l03)
*Krishna Rao, P.R., 1952 : Probable regions of "jet" streams in the upper airover India. Curro Sci., Bangalore, 21, 63-64 (3.10-197,4G-104)
Kuettner, J., 1952 On the possibility of soaring on travelling waves in thejet stream. ~ing, 16, 9-14 (3K-197, 4G-l05)
Kuettner, J., 1952 Note on high level turbulence encountered by a glider.AFSG No. 29, 3 p. (6.2-204)
Kuettner, J., 1955
Kuo, H.-L., 1950
*Lake, H., 1956
Lamb, H.H., 1952
The exploration of the jet stream by sailplanes. Soaring,19, 11-13, 16-17 (7.7-143).The motion of atmospheric vortices and the general circulation. JM 7, 247-258 (2.2-66)
A meteorological analysis of clear air turbulence. GRP47, 63 p. (See correspondence, Arakawa and Lake: Clearair turbulence associated with negative vertical windshear. JM 14, 188-190)
The jet stream in the Southern Hemisphere. Wea. 7, 258(4G-106)
Lamb, H.H., 1957
BIBLIOGRAPHY
Some interesting properties of the "Nullschicht" ormaximum wind layer. MNI 86, 142-145
85
Lamb, H.H., J. Fleming, H.D. Hoyle and J. Robinson, 1957 : Jet streams overNorth Africa and the central Mediterranean in Januaryand February 1954. MIA 86, 97-111 (8.8-203)
*Landers, H., 1955
Lee, R., 1955
Analysis of some "Project Jet Stream" data. BAMS 36,371-378 (7.9-145)
Synoptic evidence for a direct circulation about a jetstream. QJru~s 81, 462-468 (6.11-201)
*Lee, R., and Godson, W.L., 1957 : The arctic stratospheric jet stream duringthe winter of 1955-56. Journa; of Meteorology, 14, 126135
Lettau, H., 1956 Theoretical notes on the dynamics of the equatorial atmosphere. Beit. Z. Phy~. der Atmos., 29, 107-122
*Loewe, F., and V. Radok, 1950 : A meridional aero1ogica1 cross-section inthe South-West Pacific. JM 7, 58-65; 305-306 (revision)(5-101, 2.2-151, 4G-46 , 5D-172)
Magata, M., 1950: On the structure of the jet stream. PMG 175-187
Ma1et, L.M., 1954: Diverses experiences de comparaison de radiosondes.World Met. Org., Ol~, No. 35.TP.11, Tech. Note, No.5,1954 (7.2-93)
*Ma1kus, J.S., and C. Ronne, 1954 : On the structure of some cwnu10nimbusclouds which penetrated the high tropical troposphere.Tel. 6, 351-366
*Matswnoto, S., H. Itoo and A. Arakawa, 1953 : On the monthly mean distribution of temperature, wind and relative humidity of theatmosphere over Japan from March 1951 to February 1952.JMSJ 31, 248-258 (5.10-42)
McClellan, D.E., 1954 : Jet stream analysis. Can. Met. Div., Cir. -2425,TEC-179, Feb. 1, 1954 (6.2-72, 6.7-171)
McIntyre, D.P., 1951 : Some trends in modern meteorology. Phys. i~_~~,Toronto, pp. 13-17 (5.2-10)
*McIntyre, D.P., and R. Lee, 1953 : Jet streams in middle and high latitudes.PTye 172-181 (6.3-109)
*McIntyre, D.P., 1955 : On the baroc1ine structure of the westerlies. JM 12,201-210 (6.9-155)
86 BIBLIOGPJWHY
McClean, G.S., and R.M. Rados, 1955 : Project jet stream observation of asmall-scale high-level vortex. BAMS 36, 469-474 (7.11181)
*McTaggart-Cowan, P.D., 1950 The jet stream. Roy. meteor. Soc. Canadian Br.,1, No. 1 (2.9-80, 4G-47)
*Means, L.L., 1954 A study of the mean southerly wind-maximum in low levelsassociated with a period of summer precipitation in theMiddle West. BAMS 35, 166-170 (6.4-145)
Miles) M.F., 1952: Temperature and wind distribution in the lower stratosphere. MM 81, 212-215
*Mintz, Y., and G.A. Dean, 1952 : The observed mean field of motion of theatmosphere. GRP No. 17, 65 p.
~~intz, Y., 1954 The observed zonal circulation of the atmosphere. BAMS35, 208-214
*Mironovitch, M.V., 1953 : Representation de la circulation atmospherique generale pour une coupe aerologique meridienne a traversles deux hemispheres. Acad. des sci., Paris Comptes Rendus, 236(4), 404-406 (4G-126, 5D-227, 5.1-136)
*Mohri, K., 1953
*Moir, R.W., 1950
*Mook, C.P., 1952
Moore, J.G., 1956
Murakami, T., 1951
*Murakami, T., 1953
On the fields of wind and temperature over Japan and adjacent waters during winter of 1950-1951. Tel. 5, 340358 (5.9-131)
A brief note on the upper winds at 30,000 ft over Nandi,Fiji. NZCN No. 59, 2 p.
A meteorological analysis of reports of turbulence encountered by aircraft in clear air. Aer. Eng. Rev., N.Y.,11, 22-27 (3K-200)
Cross-sections of the mean zonal component of geostrophic wind. MM 85, 167-171.
On the study of the change of the upper westerlies inthe last stage of Baiu season (Rainy season in Japan).JMSJ 29, 162-175 (3.3-109, 4G-71) (in Japanese)
On the seasonal variation of upper flow patterns. Part I.From winter to spring. JMSJ 31, 173-193 (5.9-204)
*Murgatroyd, R.J., 1957 : Winds and temperatures between 20 km and 100 km - areview. QJru~s 83, 417-458
BIBLIOGRAPHY 87
Murray, R., 1951 Practical value of the contour chart as a method of re~
presenting upper winds. Summary of results. MRP 663, 5 p.
Murray, R., and S. Daniels, 1951 : Transverse flow at entrance and exit tojet streams. QJffi~S 79, 236~241 (3.11-116, 4G-72) (Seealso QJRMS 80, 112-113)
Murray, R., 1952 The jet streams over the British Isles during 14~18 June1951. MRP 743 (4.5-133, 4G-135)
*Murray, R., and D.H. Johnson, 1952 : Structure of the upper westerlies; astudy of the field in the eastern Atlantic and westernEurope in September 1950. QJRMS 78, 186-199 (3.8-6, 4G~
108)
Murray, R., 1953
Murray, R., 1954
*Murray, R., 1956
*Namias, J., 1947
The upper troposphere and lower stratosphere near jetstreams : an examination of observations by the Meteorological Research Flight, Farnborough. MRP 813, 18 p.(5.3-143)
On the accuracy of contour charts in forecasting upperwinds. GBPN No. 110, 11 p.
Some features of jet streams as shown by aircraft observations. GM No. 97 (7.6-9)
Physical nature of some fluctuations in the speed of thezonal circulation. JM 4, 125-133 (4G~7)
*Namias, J., and P.F. Clapp, 1949 : Confluence theory of the high-troposphericjet stream. JM 6, 330-336 (2~78, 4G~22)
*Namias, J., 1950
Namias, J., 1951
The index cycle and its rale in the general circulation.JM 7, 130-139 (7-41)
Meteorology in navigation. Inst. Navig., Los Angeles,7th Ann. Mtg., N.Y. City, 1951 (3.10~198, 4G-73)
*Namias, J., and P.F. Clapp, 1951 : Observational studies of general circulation patterns. Compendium of Meteorol£gy, Amer. Meteor.Soc., 551-567
Namias, J., 1952 : The jet stream. Sci. Am•• 187, 26-31 (4.5-94, 4G-I09)
National Advisory Committee for Aeronautics, 1955 : Meteorological problemsassociated with commercial turbojet - aircraft opera~
tion. NACA Research Memorandum, ffi~54L29, Washington,June 21, 1955, 46 p.
88 BIBLIOGRAPHY
*Newton, C.W., N.A. Phillips, J.E. Carson and D.L. Bradbury, 1951 :of shear lines near the tropopause in summer.153-171 (3.11-120, 4G-74)
StructureTel. 3,
*Newton, C.W., and J.E. Carson, 1953 : Structure of wind field andof vorticity in a summer situation. Tel. 5,(6.1-212)
variations321-339
*Newton, C.W., 1954 Frontogenesis and frontolysis as a three-dimensionalprocess. JM 11, 449-461 (6.5-139)
New York Times Mag., 1955 : The jet stream. N.Y. Times Mag., Sec. 6, p. 40,Jan. 2, 1955 (7.5-123)
Nojima, H., 1954
*Nyberg, A., 1945
*Nyberg, A., 1949
Nyberg, A., 1950 I
Nyberg, A., 1953
The jet streams over Honjo and Tateno in the winterseason 1951-1952. J. Aero. Obs. Tateno, 5, 219-232;The easterlies in the lower stratosphere observed overHonjo and Tateno in January and February 1952. Ibid.,233-244 (8.4-184) -----
Synoptic-aero logical investigation of weather conditions in Europe, 17-24 April 1939. Statens Meteor.Hydrog. Anstalt, Comm., Ser. of pap., No. 48, 122 p.(Stockholm)
An aerological study of large-scale atmospheric disturbances. Tel. 1 (1), 44-53 (4G-23)
A study of vertical motion and formation of fronts andjet streams. CPRMS pp. 81-89 (2.5-85, 4G-49)
Note on "A further study on the relation between the jetstream and cyclone formation". Tel. 5, 316-317 (5.7-88);Riehl, H., reply, 317-318
*Ockenden, C.V., 1939 : High altitude pilot balloon ascents at Habbaniya,Iraq. QJRNIS 65, 551-553
Oliver, V.J., 1947 The forecasting significance of high level winds in subArctic regions. BAMS 28, 9-14 (4G-S)
*Ooi, S., S. Matsumoto and H. Itoo, 1951 : A study on westerly troughs nearJapan (I). PMG 2, 219-233. Ooi, S., S. Matsumoto, H.Itoo and A. Arakawa, 1952 :.(11). PMG 3, 1-11; Matsumoto,S., H. Itoo and A. Arakawa, 1953 : •• (111). PMG 3, 229245 (4.11-116)
Painter, H.E., 1952 : Vertical currents observed at Habbaniya, May 6, 1952.MM 81, 339-340
BIBLIOGRAPHy 89
Palmen, E., 1935 Registrierballonaufstiege in einer tiefen Zyklone.Finska Vetenskaps - Soc., Helsinki, Corom. Phys.-M~.,
8(3), 1-32 (5D-79)
Palmen, E., 1948 a Discussion of problems concerning frontal analysis inthe free atmosphere. Ibid., 8 (8), 47 p. (2.6-31)
*Palmen, E., 1948 b : On the distribution of temperature and wind in the upperwesterlies. JM 5, 20-27 (5-42, 4G-12)
*Palmen, E., and K.M. Nagler, 1948 : An analysis of the wind and temperaturedistribution in the free aLmosphere over North Americain case of approximately westerly flow. JM 5, 58-64(4G-13, 5D-144)
*Palmen, E., and C.W. Newton, 1948 : A study of the mean wind and temperaturedistribution in the vicinity of the polar front inwinter. JM 5, 220-226 (4G-14)
Palmen, E., 1949 On the origin and structure of high level cyclones southof the maximum westerlies. Tel. 1 (1), 22-31 (4G-24)
*Palmen, E., and K.M. Nagler, 1949 : The formation and structure of a largescale disturbance in the westerlies. JM 6, 227-242 (4G25)
*Palmen, E., 1951 a The rale of atmospheric disturbances in the general circulation. QJRMS 77, 337-354 (2.10-71, 4G-75)
*Palmen, E., and C.W. Newton, 1951 : On the three-dimensional motions in anoutbreak of polar air. JM 8, 25-39
*Palmen, E., 1951 b The aero logy of extratropical disturbances. In Compendium of Meteorology, Boston., pp. 599-620 (3.5-8, 5D239)
Palmen, E., 1954 Uber die atmospnarischen Strahlstrome. Berlin. FreieUniv. Inst. of Met. u. Geophys~t. Abh., 2, 35-50(6.9-156)
Palmer, C.E., 1954 The general circulation between 200 mb and 10 mb overthe equatorial Pacific. Wea. 9, 341-349 (6.3-110)
*Palmer, C.E., C.W. Wise, L.J. Stempson and G.H. Duncan, 1955 : The practicalaspects of tropical meteorology. Univ. Calif. LosAngeles, Oahu Res. Cen., Spec. Rep. No.2 (AFCRC-TN-55460); AWSM 105-48 (195 p.)
Pellisari, L., 1953 : Le "ra ffiche in aria limpida". Rivista di Meteor. Aero!l~tica, 13, 53-54 (5.8-164)
90
Perry, I., 1954
BIBLIOGRAPHY
Some aspects of Comet flight of interest to the navigator. Navigation 4, 42-51
*Petterssen, 5., 1950 : Some aspects of the general circulation of the atmosphere. cpm~s, pp. 120-155 (2.3-62)
Petterssen, 5., 1952 : On the propagation and growth of jet-stream waves.QJm~S 78, 337-353 (4.2-176, 4G-IIO)
*Petterssen, 5., 1956 : Weather analysis and forecasting. (2nd ed.) Vol. I,McGraw-Hill, New York, 428 p. (See pp. 112-121)
*Phillips, N.A., 1950 : The behaviour of jet streams over eastern Northfu~erica during January and February 1948. Tel. 2, 116124 (11-62, 4G-50)
Phillips, N.A., 1956 : The general circulation of the atmospherecal experiment. QJm~s 82, 123-164
A numeri-
Phillpot, H.R., and D.G. Reid, 1952 : Equivalent headwinds on Australian airroutes. Comm. Australia Bur. Meteor., Bull. No. 41,Melbourne, 24 p.
Platzman, G.W., 1949 : The motion of barotropic disturbances in the uppertroposphere Q Tel. 1, No.3, 53-64
Porter, E.M., 1951 Some observations of a "jet stream" in the New Zealandregion. NZCN 74 (4G-76)
*Porter, E.M., 1952 a Upper winds over Nandi and Auckland. NZTN 92, 8 p.
*Porter, E.M., 1952 b Upper winds over Invercargill. NZTN 94, 5 p. (SeeFarkas, 1955)
Porter, E.M., 1953 The westerly wind flow at 300 mb across Australia andNew Zealand. NZTN 98 (5.4-165)
*Pothecary, I.J.W., 1953 : Clear-air turbulence at 20,000 feet in a frontalzone. M~ 82, 175-178
Prandtl, L., 1949
Prandtl, L., 1950
Preusche, W., 1952
Wettervorgange in der oberen Tropospnare. Akad. Wiss.in Gottingen, Math.-phys. Klasse, Math.-phys.-chem. Abteil., Nachrichten, No.2: 13-18 (4.3-119, 4G-26)
Dynamische Erkl~rung des Jet-stream pnanomens. BDWNo. 12, 198-200 (10-63)
Ein Modell zur Veranschaulichung der Vertikalbewegungenin der Jet-zone. BDW No. 38, 42-46 (4.2-177, 4G-lll)
BIBLIOGRAPHY 91
Priestley, C.H.B., 1950 : On the dynamics of the general atmospheric circulation. Aust. J. Sci. ~., Sere A., Phys. Sci., 3(1),1-18 (2.1-75, 2.2-70, 4G-51)
Priestley, C.H.E., 1950 : Flow of momentum and mass across the high pressurebelt of the earth's atmosphere. Nature, 165, 855-856(8-42)
Proud, S., 1937 :
Queney, P., 1952 :
Queney, P., 1953
Queney, P., 1953
Queney, P., 1954
*Radok, D., 1954 a
Radok, D., 1954 b
Dpper winds at Kingston, Jamaica. GBPN No. 78, 26 p.
Les ondes atmospheriques considerees comme aSSOCleesaux discontinuites du tourbillon. Tel. 4, 88-111 (4G112, 4.8-89, 7K-129)
La resonance interne du jet-stream et son rele dans laformation des cyclones. Ind. Acad. S~i., Bangalore,Proc., Sec. A., 37, 213-222 (4G-136)
Phenomenes de resonance et d'instabilite dans les ecoulements barotropes, avec application aux ondes atmospheriques de grande echelle. Ann. de~~., 9, 185-226(6.4-129)
Les grands mouvements de l'atmosphere. La Meteorologie,4th Ser., No. 35, 195-207 (6.11-195)
Severe turbulence at high levels over New South Wales.MM 83, 48-52
A comparison of geostrophic and observed upper winds.AMM No.7, 1-6
*Radok, D., and A.M. Grant, 1957 Variations in the high tropospheric meanflow over Australia and New Zealand. JM 14, 141-149
Raethjen, P., 1951 Das planetarische Zirkulationssystem. Annalen der Meteor., 4, 65-75. (3.3-110)
*Ramage, C.S., 1952 Relationship of general circulation to normal weatherover southern Asia and the western Pacific during thecool season. JM 9, 403-408 (4.6-104, 4G-113, 5E-3l3)
Ramamurti, K.M., 1955 : A "jet stream" over northern India as revealed by a"Comet" debriefing report. IJMG 6, 277-278 (8.6-264)
Ramanathan, K.R., 1954 : Atmospheric ozone and the general circulation ofthe atmosphere. lAM, pp. 3-24
92 BIBLIOGRAPHY
Ramanathan, K.R., 1954 : On upper tropospheric easterlies and the travel ofmonsoon and post-monsoon storms and depressions. Proceedings, UNESCO Symp. on Typhoons, Tokyo, Nov. 9-12,1954 (7.2-135)
Ramaswamy, C., 1956 : On the subtropical jet stream and its rille in the development of large-scale convection. Tel. 8, 26-60
*Ramsey, B., 1955 Upper winds in the South-East Asia - West Australia region. MM 84, 372-376
Ratner, B., 1955 The high wind over Philadelphia, Pa., January 23, 1955.m~R 83, 31 (7.4-218)
Ratner, B., 1955 Winds and fallout: a climatological appraisal. US!1B,June 1955, 19 p. (7E-164)
*Reed, R.J., and F. Sanders, 1953 : An investigation of the development of amid-tropospheric frontal zone and its associated vorticity field. JM 10, 338-349 (5.3-138)
Reed, R.J., 1955 A study of a characteristic type of upper-level frontogenesis. J~ 12, 226-237 (See also letters by Pothecary,JM 13, 316-317 and by Boville and Creswick, JM 14, 9193)
*Reiter, E., 1957 a The layer of maximum wind. Final report, University ofChicago, Contr. Noas-55-262-C with Project Arowa, U.S.Navy
Reiter, E.R., 1957 b : Jet stream and jet aircraft operations. Navigation(Los Angeles) 5, 267-278
*Rex, D.F •• 1950
*Riehl, H., 1948 a
*Riehl, H., 1948 b
Blocking action in the middl,? troposphere and its effectupon regional climate. I. An aero logical study of blocking action. Tel. 2, 196-211 (2.2-68)
On the formation of typhoons. JM 5, 247-264
Jet stream in the upper troposphere and cyclone formation. Tran~_kner. geophys. Un., 29, 175-186 (4G-15)
*Riehl, H., T.-C. Yeh and N.E. LaSeur, 1950 : A study of variations of thegeneral circulation. JM 7, 181-194 (8-39, 48-52)
Riehl, H., 1952 Northern and Southern Hemisphere jet streams. Wea. 7,388 (4.5-95, 4G-114)
BIEL IOGRAPBY 93
Riehl, B., and C.O. Jenista, 1952 : A quantitative method for 24-hour jetstream prognosis. JM 9, 159-166 (3E-237, 4.3-81, 4G115) (See correspondence L. Sherman and H. Riehl, JM10, 231-232 (4.11-78))
*Riehl, B., and Collaborators, 1952 : Forecasting in middle latitudes. Mete~olo~cal Monographs, 1, No.5, 80 p.
*Riehl, H., and S. Teweles, 1953 : A further study on the relation betweenthe jet stream and cyclone formation. Tel. 5, 66-79(4G-127, 5.1-208) (See also Nyberg 1953)
*Riehl, H., 1954 a Jet stream flight, March 23, 1953. A~GB 7, 56-66(5.11-89)
*Riehl, B., 1954 b: Tropical Meteorology. New York, McGraw-Hill (392 p.)
*Riehl, B., M.A. Alaka, C.L. Jordan and R.J. Renard, 1954 : The jet stream.Meteor. ~onographs, 2 (7), 100 p. (6B-201, 6.5-1)
*Riehl, H., and H. Maynard, 1954 : Exploration of the jet stream by aircraftduring the winter of 1953. Univ. Chicago Dept. Meteor.Contr. N 189s-88360, Ii~al rep. (6.2-136)
Riehl, B. (letter) and S. Teweles, Jr., (reply), 1954 : Rainfall and vorticity advection. JM 11, 425-428 (6.3-81)
*Riehl, H., F.A. Berry and H. Maynard, 1955 : Exploration of the jet streamby aircraft during the 1952-1953 winter. JM 12, 26-35(6.5-123)
*Riehl, B., and D. Fultz, 1957 : Jet stream and long waves in a steady rotating dishpan experiment : Structure of the circulation.QJru~s 83, 215-231
*Rigby, M., and M.P. Kramer, 1954 : Annotated bibliography on the tropopause.i~S 5, 488-548 (5D- -)
*Rodrfguez Franco, P., 1955 : Notas sobre las corrientes de chorro.de Geoffsico, Madrid, 14, 313-346 (8.6-204)
Ravista----
Rossby, C.-G., 1936 : Dynamics of steady ocean currents in the light of experimental fluid mechanics. Pap. Phys._Ocean. and Meteor., Cambridge, Mass., 5 (1) (4G-4)
*Rossby, C.-G., 1947 : On the distribution of angular velocity in gaseous envelopes under the influence of large-scale mixing processes. BN~S 28, 53-68
94 BIBLIOGRAPHY
*Rossby, C.-G., and H.C. Willett, 1948 : The circulation of the upper troposphere and lower stratosphere. Scienc~, (108), 643-652(4G-16)
Rossby, C.-G., 1949 : On the nature of the general circulation of the loweratmosphere. In : Atmospheres of the Earth and Planets,G.P. Kuiper (Ed.), Chicago, Univ. Chicago Press, pp. 16-48 (10-65, 4G-27)
Rossby, C.-G., 1950 : On the dynamics of certain types of blocking waves.Chinese Geophys. Soc., Jour., Nanking, 2(1), 1-13 (2.569, 4G-53)
Rossby, C.-G., 1951 a : On the vertical and horizontal concentration of angular momentum in air and ocean currents. I. Introductory comments and basic principles, with particularreference to the vertical concentration of momentum inocean currents. Tel. 3, 15-27 (2.11-63, 4G-77)
*Rossby, C.-G., 1951 b : Uber die Vertikalverteilung von Windgesehwindigkeitund Schwerestabilitat in Freistrahlbewegungen der oberenTropospnare. ~~GB 4, 3-23 (3.4-120, 4G-78)
*Rossby, C.-G., 1953 : A comparison of current patterns in the atmosphere andin the ocean basins. Un. Geodes. et Geophys. Int., Proces-Verbaux, Ass. de Meteor., Brussels, August 1951(7.8-125)
Rotch, A.L., and A.H. Palmer, 1911 : Charts of the atmosphere for aeronautsand aviators. New York, Wiley. 98 p., 24 charts (4E-3)
*Row, A.L., 1951 :
Rubin, M.J., 1953
Upper winds over Auckland. NZCN No. 78, 1 p.
Results of recent observational studies of the SouthernHemisphere circulation. Syrup. on Use of Models in Geophys. Fluid Dyn., Johns Hopkins Univ" Sept. 1-4, 1953(5.6-119)
Rubin, M.J., and H. Van Loon, 1954 Aspects of the circulation of the Southern Hemisphere. JM 11, 68-76 (5.4-101)
Rutherford, G.T., 1954 : A profile of the jet stream, 9 August 1953. ~WA No.7, 13-25 (7.4-143)
Rutherford, G.T., 1955 : Comparison of forecast winds with those reported byaircraft on high altitude flights. fu~ No.8, 33-36
*Rutherford, G.T., 1956 : The accuracy of forecast and found winds. fuWA No. 12
BIBLIOGRAPHY 95
Rutherford, G.T., 1956 : Clear air turbulence in Australia. AMM, No. 12, 6171 (8.5-228)
Sato, T., 1951 Dynamics of the jet stream. PMG 2, 132-149 (4.2-108,4G-79)
Satow, P.G., 1952: Meteorology and navigation. JIN 5, 203-222 (4.7-14)
*Saucier, W.J., 1955 : Principles~~~teorological analysis. Chicago, Univ.of Chicago Press (438 p.)
*Saucier, W.J. (letter) and H. Riehl (reply), 1956 : Exploration of the jetstream by aircraft during the 1952/1953 winter. JM 13,312-314 (7.10-155)
*Saucier, W.J., ~al (a collection of papers), 1956 : Analysis and forecasting of wind field near the tropopause. A. and M. ColI.of Texas, Final Report, Contr. No. AF 19 (604)-559 -
Saudek, V.M., and R.C. Eldredge, 1952 : Work carried out by the SouthernCalifornia Soaring Association, Inc., in Phase II ofthe Mountain Wave Project, October 1951 - October 1952.Univ. Cal. Los Angeles, Dept. Meteor., Mtn. Wave_Proi"Contr. AF 19 (122)-263, Suppl. Rep. No.3 (5H-82)
Sawyer, J.S., 1949 The significance of dynamic instability in atmosphericmotions. QJm~S 75, 364-374
Sawyer, J.S., 1950 Equivalent headwinds. Application of upper wind statistics to air route planning. GBMR No.6, 20 p.
Sawyer, J.S., 1950 The movement of jet streams and the wind hodograph.~~ 79, 357-358 (2.6-87, 4G-54)
*Sawyer, J.S., and B. Ilett, 1951 : The distribution of medium and high cloudnear the jet streams. ~~ 80, 277-281 (3.4-195, 4G-8l)
SaW'fer, J.S., 1954 Day to day variations in the tropopause. GM 11, No. 92,40 p. (5D-232) (See also 4G-80)
Sawyer, J.S., 1955 The free atmosphere in the vicinity of fronts. Q~ 12,No. 96 (5.5-113)
Sawyer, J .S., 1956 (Unpubl. talk) "Some new ideas on fronts". Wea. H, 124
Sawyer, J.S., 1956 The vertical circulation at meteorological fronts andits relation to frontogenesis. Proc. Roy. Soc. A, 234,346-362
96
Sawyer, J.S., 1957
BrBLIOGRAPHY
Jet stream features of the earth's atmosphere. Wea, 12,333-344
Schaefer, V.J., 1953 a Cloud photography project. Wwi. 6, 72-73 (5.1-226)
*Schaefer, V.J., 1953 b Cloud forms of the jet stream. Tel. 5, 27-31 (4G128)
Schaefer, V.J., 1953 c : The use of clouds for locating the jet stream. Aer.85, 599-602 (5.9-205)
Schaefer, V.J., 1955 : Atmospheric electricity associated with jet streams.Geophys. Pap. No. 42, Proc. Conf. Atmos. Elec., Geophys.Res. Dir., Air Force Cambridge Res~nter
Schaefer, V.J., 1955 : Jet streams, thunderstorms and project skyfire. A~GB
8, 265-282 (6J-332)
Schaefer, V.J., 1955 : Thunderstorms and project skyfire. N.Y. Acad. Sci.,Trans., Ser. 2, 17, 470-473 (7.2-277)
*Schaefer, V.J., and W.E. Hubert, 1955 : A case study of jet stream clouds.Tel. 7, 301-307 (7.9-146)
Scherhag, R., 1948
Schmitt, W., 1952
Schmitt, W., 1952
Neue Methoden der Wetteranalyse und Wetterprognose.Springer Ver., Berlin (424 p.) (1-52)
Preliminary mean absolute topography 500 mb SouthernHemisphere 700 W - 120o E, summer 1951/52. Notos 1, 7-17(4E-248)
Two intense polar-outbreaks in the southern oceans.Notos 1, 193-201 (4G-116)
Science Digest, 1951 : Jet winds rule the weather. Sci. Dig., 29, 65-66 (2.9-77, 4G-69)
Science News Letter, 1953 : Track jet streams by cloud motions. Sci. N.L.,63, 83-84 (5.1-137)
Scorer, R.S., 1951 Clear-air turbulence over Europe. Wea, 6, 59-60 (2.680)
Scrase, F.J., 1954 Turbulence in the upper air, as shown by radar wind andradiosonde measurements. QJRMS 80, 369-376
Seilkopf, H., 1952 Modell der atmospnarischen Grosszirkulation. BOW 35,68-71 (3.10-77)
BIBLIOGRAPHY 97
Sekera, Z., 1949 The distribution of kinetic energy in certain steadybarotropic currents. JM 6, 321-329 (2-79, 4G-28)
Sellick, N.P., 1950 High winds over Southern Rhodesia. Wea. 5, 67 (4E-267)
Serebreny, S.M., 1951 : Some preliminary considerations of the jet streamover Japan. Pan Am. Worid Airway$, Pac.-Alaska Div.,Tech. Rep., No. 41 (4.3-120, 4G-82)
Serebreny, S.M., and E.J. Wiegman, 1953 : Characteristic properties of thejet stream over the Pacific, Case history No.1, Pt. 1.Ibid., Contr. N189s-90981, Tech. Rep., No.1, Nov. 19535.7-11)
Serebreny, S.M., and E.J. Wiegman, 1954?: Certain characteristic features ofthe jet stream and their application to airline operation. Met. Section, Pan ~. World Airw., Pac.-Al. Div.,37 p. (6.7-173)
Serebreny, S.M., E.J. Wiegman and W.F. Carlson, 1954 : Characteristic properties of the jet stream over the Pacific. Case historyNo.1, Pt. 2, ~, Contr. N189s-96835, Tech. R~. No.4,Sept. 1954 (161 pp.) (7~-124)
Serebreny, S.M., E.J. Wiegman and W.F. Carlson, 1954 : Characteristic properties of the jet stream over the Pacific. Case historyNo.2, Pt. 1, ibid., Contr. N189s-96835, Tech • ..E_~o
No.2, Mar. 1954 (6.7-172). Also: Part 2, ibi~ Tech.Rep. 3, Aug. 1954 (157 p.)
*Serebreny, S.M., 1955 : The jet stream structure over the Pacific. Navigation, 4, 231-241 (7.5-125)
*Shaw, W.N., 1904 On the general circulation of the atmosphere in middleand higher latitudes. NWiR 32, 264-267
Shell Aviation News, 1953 : Cloud forms of the jet stream. Shell~News,
No. 180, 4-6 (6.7-240)
Shell Aviation News, 1954 : Clear air turbulence and its allied phenomena.Shell Av. News, No. 192, 14-15 (6.7-222)
*Sheppard, P.A., 1951 : Recent advances in science, meteorology. The jet streamand related phenomena. Science Progress, 39, 483-495(3.1-124, 3K-208, 4G-83)
Sheppard, P.A., 1952 : The general circulation of the atmosphere. Sci~r~.,
40, 89-106 (3.6-9)
98
*Solberg, H., 1939
BIBLIOGRAPHY
Le mouvement d1inertie de l'atmosphere stable et sonrele dans la theorie des cyclones. Proces-Verbaux, Meteor., Un, geod. geophys. inter., Edinburgh, Sept. 1936,II, 66-82
South Africa, Dept. of Transport, Weather Bureau, 1950 Upper winds in Southern Africa. Pretoria 1950. 282 p.
Starr, V.P., 1948
Starr, V.P., 1950
An essay on the general circulation of the earth's atmosphere. JM 5, 39-43 (7.8-128)
Geostrophic departures in the jet stream. Tel. 2, 233235 (2.2-65, 4G-55)
Starr, V.P., and R.M. \Vhite, 1952 : Schemes for the study of hemispheric exchange processes. QJffi~S 78, 407-410 (3.10-116)
Starrett, L.G., 1949 : The relation of precipitation patterns in NorthAmerica to certain types of jet streams at the 300 millibar level. JM 6, 347-352 (2-80, 4G-29)
Stewart, C.D., 1924 : The measurement of upper wind velocities by observations of artificial clouds. GBPN No. 38, 15 p.
*Stiefelmaier, C.A., 1955 : Operational aspects of the jet stream. ~vigation, 4, 227-231 (7.5-126)
Suda, K., 1955 On the cold wave of January 1954 in the Far East. Geofis. Pura e Applic., 32, 159-169
Sutcliffe, R.C., 1940 : Rapid development where cold and warm air massesmove toward each other. Syno? Div. Tech. Mem. No. 12,Air Min., Great Brit., 1940
Sutcliffe, R.C., and J.S. Saw-Jer, 1954 : Forecasting winds up to the 100 mblevel by the contour-chart technique. PTMC, pp. 155-159
*Sutcliffe, R.C., and J.K. Bannon, 1954 : Seasonal changes in upper-air conditions in the Mediterranean Middle East area. lAM, pp.322-334
Teweles, S., Jr., 1954 : Jet-stream detail with respect to other meteorological factors. PTMe, pp. 188-192 (6.3-190)
Tillotson, K.C., and De V. Colson, 1954 : Wave-cloud formation at Denver.Wwi. 7, 34-35 (6.2-137)
Torrance, J.D., 1943 : Upper winds. So. African Air Force, Met. Section, TechNotes No. 24, 7 p.
BIBLIOGRAP~{ 99
T6th, G., 1933 : Szokatlanul nagy szelsebesseg a szabad legkorben Budapestfellett. Iaoj~ras, Budapest, 37, 91 (4G-3)
Touart, C.N., 1954/1955 : Jet streams fact and fiction. Air Univ. Quart.Egy. Maxwell Air Force Base, Ala. 7, 75-88 (7.11-174)
Treloar, H.M., 1948 : Extreme winds in high levels. Wea. Development and Res.Bull. Melbourne, 10, 15-18 (4G-17)
Treolar, H.M., 1954 : Geostrophic wind approximation in low latitudes. AMMNo.7, 7-12
*Tun Yin, Maung, 1949 : A synoptic study of the onset of the summer monsoonover India and Burma. JM 6, 393-400 (3-87, 5B-262)
*Turner, H.S., 1955 Clear air turbulence and topography. Wea. 10, 294-297(7.2-178)
Ulrich, K.O., 1954 go~n in der noheren Atmospnarebilden Gefahrezonen Turden Luftverkehr. Umschau, 54, 577-580 (6.2-207)
U.S. Air Weather Service, 1951 : High-level isotach analysis. AWSM 105-26,10 p. (3.1~58, 4E-220)
*U.S. Air Weather Service, 1952 : Bibliography on the jet stream. AWS Bibliography, No. 12, Mar. 1952, 9 p. (4G-117, 6B-136)
*U.S. Air Weather Service, 1955 : Winds over 100 knots in the Northern Hemisphere. AWSTR 105-121 (67 p.)
*U.S. Air Weather Service, 1956 : Preliminary results of project cloud trail.AWSTR 105-132, 23 p.
U.S. Air Weather Service, 1956 : The Black Sheep system of forecasting windsfor long-range jet aircraft. AWSTR 105-139, 48 p. (8C79)
United States Navy,
U.S. Navy Bureau of
1954 : Tables of winds and their aiding and retarding effect at 850, 700, 500, 300 and 200 mb. Part I, NorthPacific Area; Part II, North Atlantic Area. NAVAER 50lc-526, Aerology Branch, Off. Chief Nav. Oper., 275 p.and 261 p.
Aeronautics, 1953 : Operational research into the detailed structure of the jet stream. Project AROWA (TED-UNLMA-501.15), Second Quart. Prog. Rep., Jan. 1 - Anr. 1,1953 (4G-129, 5.8-111)
100 BIBLIOGRAPHY
*U.S. Navy Bureau of Aeronautics, 1955 : Operational research into the detailed structure of the jet stream. Ibid., Tech. Rep. No.2,Task 15, 59 p. plus appendix ----
u.s. Office of Naval Operations, 1952 : Practical methods of weather analysisand prognoses. U.S. Off. Nav. 0Q2., NA50-lP-502, 193 p.(5D-216)
u.s. Weather Bureau, ---- : Monthly climatic data of the world
*Univ. Chicago, Dept., Meteorology, 1947 : On the general circulation of theatmosphere in middle latitudes. BA~S 28, 255-280 (4G-6)
Vaisanen, A., 1954 Comparison between the geostrophic and gradient wind inthe case of westerly jet. Geophysica, 4, 203-217
Van der Ham, C.J., 1954 : De straal stroom. Hemel on Dampkiring, 52, 201-210(6.11-203)
Van Mieghem, J., 1939 : Sur l'existence de Itair tropical froid et de l'effetde foehn dans Itatmosphere libre. Mem. Inst. Roy. Meteor.Belg., No. 12, 32 p. (5D-105)
Van Mieghem, J., 1950 : Sur la circulation transversale associee a un courant atmospherique. Tel. 2, 52-55 (6-37, 4G-56)
*Van Mieghem, J., 1951 : Hydrodynamic instabilityo Compendium of Meteorology,Boston, pp. 434-453
Van Mieghem, J., 1954 : Vorticity transport in the atmosphere. lAM, pp. 415429
Vederman, J., and C.D. Smith, Jr., 1950 : The winter mid-troposphere circulation near the North Pole. Bk~S 31, 197-205 (8-40)
*Vederman, J., 1954 The life cycles of jet streams and extratropical cyclones. BAMS 35, 239-244 (6.7-174)
Venkiteshwaran, S.P., 1950 : Winds at 10 km and above over India and itsneighbourhood. Proc. Nat. Inst. of Sci. of India, 16,19-27 (10-116, 2.6-88, 5.4-167)
Venkiteshwaran, S.P., and S. Yegnanarayanan, 1951 : Radar measurements ofupper winds over Poona during the southwest monsoon.IJMG 2, 228-232 (3.7-146)
*Viaut, A., 1954 Quelques considerations sur Ie champ de pression et lesperturbations du front polaire austral dans Ie sud sudouest de l'ocean Indien. lAM pp. 290-301
BIBLIOGRAPHY 101
*Vuorela, L.A., 1948 : Contribution to the aero logy of the tropical Atlantic.JM 5, 115-117
*Vuorela, L.A., 1950 : Synoptic aspects of tropical regions of the AtlanticOcean, West Africa and South America. Helsinki, Univ.,Meteorologian laitos, Mitteilungen, No. 67, 130 p. (2.427)
*Vuorela, L.A., 1953 : On the air flow connected with the invasion of uppertropical air over northwest Europe. Geophysica, Helsinki,4, 105-130 (5D-244)
Vuorela, L., 1954
Walter, A., 1927
Weekes, K., 1954
Ueber die Luftbewegung im Zusammenhang mit Vorstoessentropischer Luft in hoeheren Schichten ueber Nordwesteuropa. Berlin, Freie Univ., Inst. fuer Meteor. u. Geophys .. Meteor. Abhandl" 2, 152-172
Results of observations on the direction and velocity ofthe upper air current over South Indian Ocean. GM 39,32 p.
Reviews of modern meteorology-II : The physical state ofthe upper atmosphere. QJm~s 80, 2-15
*Widger, W.K., 1952 Survey of available information on the wind fields between the surface and the lower stratosphere. Air ForceCambridge Res. Cen., AFSG No. 25, 154 p. (6.1-13, 6B140)
Wilkins, E.M., 1949 : Relation between speed and latitudinal position of thebelt of strongest westerlies and the location of troughsand ridges aloft. Univ. Chicago, Dept. Meteor., Res.Report, Nov. 1949 (4G-30)
*Willett, H.C., 1944 : Descriptive Meteorology. New York, Academic Press,310 p. (see pp. 131-135) (4G-5)
Williamson, E.A., 1951 : High level "jet streams" in the atmosphere. NZCNNo. 72 (4G-84)
Willis, D.C., 1956 Practical navigation over the North Atlantic. JIN 9,310-322 (7.10-51)
Winchester, James H., 1952 : High altitude winds. Aviation age, 17 (4), 4243 (4G-1l8)
Winston, J.S., 1952 : Confluence and the jet stream over the Atlantic andNorth America during January 1949. USIVB, Ext. Fest. Sec.9 p. (4G-1l9)
102
Wyatt, lV.H., 1952
BIBLIOGRAPHY
An interesting encounter with clear-air turbulence.lVwi. 5, 134-135 (4.8-148)
Yamada, H., and Matsuhashi, S., 1951 : On the winds aloft analysis by raob.Tateno, Aerolog. Obs., Jour., 5, 20~31 (4F-87, 4G-85)
Yamada, H., and S. Nakamura, 1954 : Mean condition of wind aloft in winterover Japan. ]£i£, 5, 323-335 (7.2-196)
*Yeh, T.-C., 1950
Yeh, T.-C., 1951
The circulation of the high troposphere over China inthe winter of 1945-46. Tel. 2, 173-183 (2.2-69, 4G-57)
On the maintenance of zonal circulation in the atmosphere. JM 8, 146-150 (3.3-113, 4G-86)
Yeh, T.-C., J.E. Carson and J.J. Marciano, 1951 : On the relation betweenthe circumpolar westerly current and rainfall over theHawaiian Islands. Meteor. Monographs, 1 (3), 47-55 (3.10-231, 4I-239)