management strategies in agriculture - wmo library
TRANSCRIPT
WORLD METEOROLOGICAL ORGANIZATION
TECHNICAL NOTE No. 202
MANAGEMENT STRATEGIES IN AGRICULTUREAND FORESTRY FOR MITIGATION OF
GREENHOUSE GAS EMISSIONS AND ADAPTATIONTO CLIMATE VARIABILITY AND CLIMATE
CHANGE
Report of the CAgM-XII Working Group on the Impact of Management Strategies in Agriculture and Forestry to MitigateGreenhouse Gas Emissions and to Adapt to Climate Variability and Climate Change
Secretariat of the World Meteorological Organization - Geneva - Switzerland
WMO-No. 969
The World Meteorological Organization
The World Meteorological Organization (WMO), of which 187* States and Territories are Members, is a specialized agencyof the United Nations. The purposes of the Organization are:
(a) To facilitate world-wide cooperation in the establishment of networks of stations for the making of meteorologicalobservations as well as hydrological and other geophysical observations related to meteorology, and to promote theestablishment and maintenance of centres charged with the provision of meteorological and related services;
(b) To promote the establishment and maintenance of systems for the rapid exchange of meteorological and related infor-mation;
(c) To promote standardization of meteorological and related observations and to ensure the uniform publication of obser-vations and statistics;
(d) To further the application of meteorology to aviation, shipping, water problems, agriculture and other human activities;(e) To promote activities in operational hydrology and to further close cooperation between Meteorological and
Hydrological Services; and(f) To encourage research and training in meteorology and, as appropriate, in related fields and to assist in
coordinating the international aspects of such research and training.
(Convention of the World Meteorological Organization, Article 2)
The Organization consists of the following:
The World Meteorological Congress, the supreme body of the Organization, brings together the delegates of Members onceevery four years to determine general policies for the fulfilment of the purposes of the Organization, to approve long-termplans, to authorize maximum expenditures for the following financial period, to adopt Technical Regulations relating to inter-national meteorological and operational hydrological practice, to elect the President and Vice-Presidents of the Organizationand members of the Executive Council and to appoint the Secretary-General;
The Executive Council, composed of 36 directors of national Meteorological or Hydrometeorological Services, meets atleast once a year to review the activities of the Organization and to implement the programmes approved by Congress;
The six regional associations (Africa, Asia, South America, North and Central America, South-West Pacific and Europe),composed of Members, coordinate meteorological and related activities within their respective Regions;
The eight technical commissions, composed of experts designated by Members, study matters within their specific areas ofcompetence (technical commissions have been established for basic systems, instruments and methods of observation, atmos-pheric sciences, aeronautical meteorology, agricultural meteorology, marine meteorology, hydrology, and climatology);
The Secretariat, headed by the Secretary-General, serves as the administrative, documentation and information centre of theOrganization. It prepares, edits, produces and distributes the publications of the Organization, carries out the duties specifiedin the Convention and other Basic Documents and provides secretariat support to the work of the constituent bodies of WMOdescribed above.
________* On 31 December 2003
WORLD METEOROLOGICAL ORGANIZATION
Secretariat of the World Meteorological Organization - Geneva - Switzerland2004
WMO-No. 969
TECHNICAL NOTE No. 202
MANAGEMENT STRATEGIES IN AGRICULTUREAND FORESTRY FOR MITIGATION OF
GREENHOUSE GAS EMISSIONS AND ADAPTATIONTO CLIMATE VARIABILITY AND CLIMATE
CHANGE
Report of the CAgM-XII Working Group on the Impact of Management Strategies in Agriculture and Forestry to MitigateGreenhouse Gas Emissions and to Adapt to Climate Variability and Climate Change

© 2004, World Meteorological Organization
ISBN: 92-63-10969-9
NOTE
The designations employed and the presentation of material in this publication do not implythe expression of any opinion whatsoever on the part of the Secretariat of the World Meteorological Organization concerning the legal status of any country, territory, city or area, or of its authorities, or concerning the delimitation of its frontiers or boundaries.
CONTENTS
Page
ACKNOWLEDGEMENTS....................................................................................................... III
FOREWORD ............................................................................................................................. IX
SUMMARY (English, French, Russian and Spanish) .............................................................. XI
LIST OF CONTRIBUTORS .................................................................................................... XV
CHAPTER 1 – THE RECENT IPCC ASSESSMENT OF CLIMATE CHANGE AND REGIONS MOST VULNERABLE TO PROJECTED CLIMATE CHANGE(By M.J. Salinger) ...................................................................................................................... 11.1 Introduction .................................................................................................................... 11.2 The recent IPCC science assessments............................................................................ 2
1.2.1 Observed changes in the climate system ........................................................... 21.2.2 The forcing agents that cause climate change .................................................. 51.2.3 Projected climate change during the 21st century ............................................ 7
1.3 The impacts of 20th-century climate change ................................................................ 101.4 Future impacts on agriculture and forestry..................................................................... 11
1.4.1 Agriculture and rangelands................................................................................ 111.4.2 Forests ................................................................................................................. 121.4.3 Regional impacts ................................................................................................ 13
1.5 Regions most vulnerable to current and projected climate change .............................. 14
CHAPTER 2 – THE IMPACT OF CLIMATE CHANGE ON GREENHOUSE GAS EMISSIONS FROM AGRICULTURE AND FORESTRY (By Yanxia Zhao) ....................... 162.1 Introduction .................................................................................................................... 16
2.1.1 Agricultural contributions to anthropogenic emissions of methane and nitrous oxide....................................................................................................... 16
2.2 Production mechanisms, influencing factors and emission contributions of the different agricultural source categories ........................................................................... 162.2.1 Enteric fermentation .......................................................................................... 162.2.2 Manure management ......................................................................................... 192.2.3 Rice cultivation.................................................................................................. 192.2.4 Agricultural soil management............................................................................ 222.2.5 Agricultural residue burning .............................................................................. 23
2.3 Land-use change, forestry and carbon dioxide............................................................... 232.3.1 Introduction ....................................................................................................... 232.3.2 Changes in carbon forest stocks......................................................................... 232.3.3 Changes in agricultural soil carbon stocks ........................................................ 25
2.4 Impact of climate change and elevated carbon dioxide concentration on the structure and function of agricultural and forest ecosystems ........................................................ 262.4.1 Interactions between climate change and land surface change ........................ 262.4.2 Effects of climate change ................................................................................... 272.4.3 Effects of increasing atmospheric carbon dioxide ............................................. 27
CHAPTER 3 – THE IMPACT OF MANAGEMENT STRATEGIES IN AGRICULTURE AND AGROFORESTRY TO MITIGATE GREENHOUSE GAS EMISSIONS (By R.L. Desjardins) ............................................................................................ 303.1 Introduction .................................................................................................................... 303.2 Agricultural sources and sinks of greenhouse gases ....................................................... 30
3.2.1 Carbon dioxide................................................................................................... 303.2.2 Methane ............................................................................................................. 313.2.3 Nitrous oxide...................................................................................................... 313.2.4 Tools for reducing uncertainties in estimating greenhouse gas emissions ........ 33
3.3 Mitigation of greenhouse gas emissions from agroecosystems ....................................... 343.3.1 Livestock management....................................................................................... 343.3.2 Animal waste and nutrient management .......................................................... 343.3.3 Crop management.............................................................................................. 353.3.4 Soil management................................................................................................ 363.3.5 Energy ................................................................................................................. 363.3.6 Putting it all together......................................................................................... 36
3.4 The broader picture with respect to management practices.......................................... 373.4.1 Environmental issues.......................................................................................... 373.4.2 Feasibility............................................................................................................ 383.4.3 Economics .......................................................................................................... 393.4.4 Net impact.......................................................................................................... 39
3.5 Potential impact of mitigation strategies available for reducing greenhouse gas emissions from agroecosystems ....................................................................................... 39
CHAPTER 4 – ADAPTATION STRATEGIES REQUIRED TO REDUCE VULNERABILITY IN AGRICULTURE AND FORESTRY TO CLIMATE CHANGE, CLIMATE VARIABILITY AND CLIMATE EXTREMES (By H.P. Das) .............................. 414.1 An overview of adaptation strategies to reduce vulnerability of agriculture to climate
change and climate variability ....................................................................................... 414.1.1 Introduction ....................................................................................................... 414.1.2 Problems associated with adaptation to climate change................................... 414.1.3 Vulnerability to climate change and its dimensions ......................................... 414.1.4 Assessing vulnerability ....................................................................................... 424.1.5 Impact of climate change on agricultural production ....................................... 424.1.6 Adaptation ......................................................................................................... 45
4.2 Impact of climate change on agricultural soils and adaptation measures...................... 484.2.1 Introduction ....................................................................................................... 484.2.2 Effects of higher carbon dioxide on soil properties and productivity ............... 484.2.3 Soil dynamics and the implications for agriculture........................................... 494.2.4 Adaptation to climate change ........................................................................... 53
4.3 Agricultural impacts of climate change and adaptation measures ................................ 544.3.1 Introduction ....................................................................................................... 544.3.2 Effects of climate change on plant physiology and processes............................ 544.3.3 Study situations of vulnerability and adaptation in different regions............... 564.3.4 Adaptation ......................................................................................................... 604.3.5 Animal husbandry and climate change ............................................................. 634.3.6 Adaptations and adjustments for livestock due to climate change .................. 654.3.7 The socio-economic capability to adapt............................................................ 66
4.4 Impact of climate change on forests and adaptation strategies ..................................... 684.4.1 Introduction ....................................................................................................... 684.4.2 Climate change and forests ................................................................................ 684.4.3 Expected climatic changes in forest areas ......................................................... 694.4.4 Impacts of climate change and land-use changes on tropical forests................ 694.4.5 Impacts of climatic change on temperate forests .............................................. 704.4.6 Impacts of climatic change on boreal forests..................................................... 704.4.7 Adaptation ......................................................................................................... 714.4.8 Research needs ................................................................................................... 73
4.5 Mitigating agricultural emissions of greenhouse gases ................................................... 744.5.1 Introduction ....................................................................................................... 744.5.2 Carbon dioxide................................................................................................... 754.5.3 Methane ............................................................................................................. 824.5.4 Nitrous oxide...................................................................................................... 84
4.6 Impact of extreme events on agriculture and adaptation measures............................... 854.6.1 Introduction ....................................................................................................... 854.6.2 Negative effects of extreme events on agriculture ............................................ 864.6.3 Effect of extreme events on crops and possible adaptations ............................. 86
IV CONTENTS
Page
CHAPTER 5 – THE IMPACT OF MANAGEMENT STRATEGIES REQUIRED FOR REDUCING THE VULNERABILITY OF AGRICULTURE AND FORESTRY TO CLIMATE VARIABILITY AND CLIMATE CHANGE (By O.D. Sirotenko) ...................... 935.1 Introduction .................................................................................................................... 935.2 Techniques for analysing agroclimatic indices with allowance for climate change ...... 93
5.2.1 Application of average values in agroclimatic studies under climate change conditions ........................................................................................................... 93
5.2.2 Analysis of climate-induced risks under conditions of climate change ............ 945.3 Models and tools for adaptation of agriculture to climate variability and climate change 96
5.3.1 Optimisation of and resource utilisation as a form of adaptation to the currentand/or expected climate conditions................................................................... 96
5.4 Adaptation to current and/or expected climate conditions by changing agricultural crop growing technology................................................................................................. 100
5.5 Strategies for adapting agriculture to expected climate change (moderate latitudes) .. 1015.5.1 Yields and adaptation...................................................................................................... 101
CHAPTER 6 – CONTRIBUTION TO GREENHOUSE GAS EMISSIONS ANDVULNERABILITY/ADAPTATION STUDY OF AGRICULTURE IN AFRICA(By Birama Diarra)..................................................................................................................... 1056.1 Introduction .................................................................................................................... 1056.2 Analysis of the impact of greenhouse gases on climate and plants ............................... 1056.3 Contribution to the inventory of greenhouse gases....................................................... 1066.4 The agricultural situation in Mali .................................................................................. 108
6.4.1 Agriculture ......................................................................................................... 1086.4.2 Animal husbandry.............................................................................................. 1106.4.3 Socio-economic situation................................................................................... 110
6.5 The agricultural situation in Mozambique ..................................................................... 1126.6 Vulnerability/adaptation study ....................................................................................... 112
6.6.1 Climate change model ....................................................................................... 1126.6.2 Crop growth simulation model .......................................................................... 113
6.7 Conclusion ...................................................................................................................... 116
CHAPTER 7 – FOREST INDUSTRIES AND CLIMATE CHANGE (By Jacques Lahaussois) 1187.1 Introduction .................................................................................................................... 1187.2 Forest industries .............................................................................................................. 1187.3 Review of forest industries.............................................................................................. 119
7.3.1 Raw material supply ........................................................................................... 1207.3.2 Harvesting .......................................................................................................... 1207.3.3 Transport ............................................................................................................ 1207.3.4 Processing ........................................................................................................... 120
7.4 Forest industries and greenhouse gas emissions ............................................................. 1217.4.1 Wood raw material ............................................................................................. 1217.4.2 Harvesting and transport ................................................................................... 1227.4.3 Processing ........................................................................................................... 1237.4.4 Effluents management........................................................................................ 1247.4.5 End products....................................................................................................... 124
7.5 Mitigation measures........................................................................................................ 1257.5.1 Raw materials ..................................................................................................... 1257.5.2 Harvesting and transport ................................................................................... 1257.5.3 Processing ........................................................................................................... 1257.5.4 Disposal of forest products ................................................................................. 127
7.6 Conclusion ...................................................................................................................... 127
CONTENTS V
Page
CHAPTER 8 – THE IMPACT OF THE CONVERSION OF FORESTS INTO CROP AND RANGELANDS DUE TO HUMAN AND LIVESTOCK POPULATION PRESSURE ON THE SOURCES AND SINKS OF CARBON AND GLOBAL WARMING(By Jens Mackensen) ................................................................................................................. 1288.1 Introduction .................................................................................................................... 1288.2 The extent of global deforestation and future needs for agricultural land .................... 1288.3 The global carbon balance in terrestrial ecosystems...................................................... 1298.4 Carbon and other greenhouse gas fluxes following forest conversion and subsequent
agricultural management ................................................................................................ 1318.4.1 Above ground changes....................................................................................... 1318.4.2 Below ground changes........................................................................................ 1328.4.3 Other greenhouse gas fluxes as relevant to land use and land-use change....... 1348.4.4 Conversion of forest to cropland and rangeland ............................................... 1348.4.5 Conversion of (natural) grassland to cropland.................................................. 1358.4.6 Conversion of wetlands...................................................................................... 1358.4.7 Conversion of old-growth forest to managed forests......................................... 137
8.5 Conclusion ...................................................................................................................... 137
CHAPTER 9 – CONCLUSIONS AND RECOMMENDATIONS (By H.P. Das) ................ 139
APPENDIX 1 – UNITS OF MEASUREMENT....................................................................... 141
REFERENCES............................................................................................................................ 142
VI CONTENTS
Page

For Chapter 3, Dr R.L. Desjardins gratefully acknowledges the assistance of R. Riznek in preparing the text and the help-ful comments of W. Baier, C. Campbell, H. Janzen and S. Kaharabata.
Chapter 6 was written in collaboration with the following colleagues in Mali: Mr Famouké Traore (EcoleNationale d’Ingénieurs), Mr Abdoulaye Bayoko (Centre National de la recherche scientifique et technologique),Mr Alhousseini Bretaudeau (IPR/IFRA) and Mr Mama Konate (Direction Nationale de la Météorologie).
ACKNOWLEDGEMENTS
There is evidence that global warming over the last millennium has already resulted in increased global average annualtemperatures and changes in rainfall, with the 1990s being likely to be the warmest decade, in the northern hemisphere.Over the past century, changes in temperature patterns have had a direct impact on the number of frost days and thelength of growing seasons with their consequent significant implications for agriculture and forestry. Land cover changes,changes in global ocean circulation and sea surface temperature patterns, and changes in the composition of the globalatmosphere are leading to changes in rainfall. These changes may be more pronounced in the tropics. For example, cropvarieties grown in the Sahel may not be able to withstand the projected warming trends and will certainly be at risk dueto the projected lower amounts of rainfall.
Some farming systems with an inherent resilience may adapt more readily to climate pressures, making long-termadjustments to varying and changing conditions. Other systems will need interventions for adaptation to be supported byagrometeorological services for agricultural producers. This applies, among others, to systems where pests and diseasesplay an important role. Scientists have to guide policy makers in fostering an environment in which adaptation strate-gies can be effected. There is a clear need for integrating preparedness for climate variability and climate change.
In developed countries, higher trend yields, but with greater annual fluctuations and changes in cropping patternsand crop calendars can be expected with changing climate scenarios. Shifts in projected cropping patterns can be dis-ruptive to rural societies in general. However, developed countries have the technology to adapt more readily to projectedclimate changes. In many developing countries, the present conditions of agriculture and forestry are already marginal,due to degradation of natural resources, the use of inappropriate technologies and other stresses. For these reasons, theability to adapt will be more difficult in the tropics and subtropics and in countries in transition.
Food security will remain a problem in many developing countries. Nevertheless, there are many examples of tra-ditional knowledge, indigenous technologies and local innovations that can be used effectively as a foundation forimproved farming systems. Before developing adaptation strategies, it is essential to learn from the actual difficulties facedby farmers in coping with risk management at the farm level. Agrometeorologists must play an important role in assist-ing farmers with the development of feasible strategies to adapt to climate variability and climate change.Agrometeorologists should also advise national policy makers on the urgent need to cope with the vulnerabilities of agri-culture and forestry to climate variability and climate change.
Adaptation to the adverse effects of climate variability and climate change is a high priority for nearly all coun-tries, but developing countries are particularly vulnerable. Effective measures to cope with vulnerability and adaptationneed to be developed at all levels. Capacity building must be integrated into adaptation measures for sustainable agricul-tural development strategies. Consequently, nations must develop strategies that effectively focus on specific regionalissues to promote sustainable development.
Given the significance of appropriate management strategies in agriculture and forestry for the mitigation ofgreenhouse gas emissions and adaptation to climate variability and climate change, the Commission for AgriculturalMeteorology (CAgM) at its Twelfth Session held in Accra, Ghana, in February 1999, invited Dr H.P. Das(India/Chairman), Dr Raymond Desjardins (Canada), Mr Birama Diarra (Mali), Mr Jacques Lahaussois (FAO),Dr Michael J. Salinger (New Zealand), Mr Jens Mackensen (UNEP), Professor Oleg D. Sirotenko (Russian Federation)and Ms Zhao Yanxia (China) to survey and present examples of the impact of adaptation strategies necessary for reduc-ing vulnerability of agriculture and forestry to climate variability and climate change. The group was asked to recommendappropriate adaptation strategies to reduce vulnerability of agriculture and forestry to climate change, climate variabilityand climate extremes. The group was also asked to present a report of the science of climate change from the latest IPCCassessment; to study the impact of the conversion of forests into crop and rangelands due to human and livestock popu-lation pressure on the sources and sinks of carbon and global warming; to provide examples of the impact of managementstrategies to mitigate greenhouse gas emissions from agroecosystems; and to study the impact of climate change on green-house gas emissions from agriculture and forestry.
The report of the group addresses these issues which are of great interest to all nations and in particular to devel-oping countries. I believe that the publication of this report as a WMO Technical Note will contribute to thedevelopment of sustainable agricultural strategies by WMO Members. It is therefore with much pleasure that I take thisopportunity to express the gratitude of the World Meteorological Organization to all members of the Working Group whocontributed to the report.
(M. Jarraud)Secretary-General
FOREWORD
This technical note, which looks at management strategies in agriculture and forestry aimed at the mitigation ofgreenhouse gas emissions and adaptation to climate variability and climate change, reviews a number of strategies acrossa range of climate scenarios and discusses options and examples from around the world.
Chapter 1 (The recent IPCC assessment of climate change and regions most vulnerable to projected climate change) givesan overview of recent IPCC reports and predictions for the 21st century and the role that greenhouse gases play in climatechange. The impact that the changing climate will have on agriculture and forestry globally is reviewed and the mostvulnerable regions identified.
In Chapter 2 (The impact of climate change on greenhouse gas emissions from agriculture and forestry) the significant roleof methane, nitrous oxide and carbon dioxide emissions from agriculture and forestry is assessed, with data from the USAand China by way of example. Enteric fermentation, manure management, rice cultivation, soil management and cropresidue burning are sources of methane and nitrous oxide. Various conditions and management practices which influencethe quantity of emissions are outlined. The effects of land use and land-use change on the carbon dioxide flux and theimpact of elevated atmospheric carbon dioxide levels on the functioning of agricultural systems are examined.
A wide range of methods to manage and reduce greenhouse gas emissions from agriculture and forestry are detailedin Chapter 3 (The impact of management strategies in agriculture and agroforestry to mitigate greenhouse gas emissions), with afocus on a systems approach adopted in Canada.
Adapting to climate change is the focus of Chapter 4 (Adaptation strategies required to reduce vulnerability inagriculture and forestry to climate change, climate variability and climate extremes). Vulnerability assessments and adaptationstrategies for different regions around the world are given. This long chapter concludes with a look at the problems posedto agriculture and forestry by extreme meteorological events. A brief description of some adaptation measures is provided.
Chapter 5 (The impact of management strategies required for reducing the vulnerability of agriculture and forestry to climatevariability and climate change) begins by looking at techniques for assessing agroclimatic indices in relation to a changingclimate – vital for going on to analyse climate-induced risks for agricultural situations. Adaptations via agrotechnology, inmoderate latitudes, are discussed.
Chapter 6 (Contribution to greenhouse gas emissions and vulnerability/adaptation study of agriculture in Africa) looks atactivities which contribute to greenhouse gas emissions in some African countries and analyses vulnerability to the impactof climate change on certain crops. Mali is the main focus of this chapter.
The role of forest industries in climate change, both as a source of greenhouse gas emissions and as contributor inemissions reduction is the subject of Chapter 7 (Forest industries and climate change).
Chapter 8 (The impact of the conversion of forests into crop and rangelands due to human and livestock population pressureon the sources and sinks of carbon and global warming) concentrates on carbon losses and emissions of greenhouse gasesrelating to forest conversion and changes in forest carbon stocks as a result of management practices.
Chapter 9 (Conclusions and recommendations) stresses the importance of encouraging further work in the field ofadaptive strategies in managing climate change and climate vulnerability across a wide variety of locations and situations.The chapter ends with a list of practical recommendations for strategies and further research.
SUMMARY
RÉSUMÉ
La présente note technique, qui porte sur les stratégies de gestion mises en œuvre dans les domaines de l’agriculture et dela foresterie en vue d’atténuer les émissions de gaz à effet de serre et de faciliter l’adaptation à la variabilité du climat et auchangement climatique, passe en revue un certain nombre de stratégies correspondant à différents scénarios climatiques etévoque des solutions et des exemples recueillis dans le monde entier.
Le chapitre 1, intitulé The recent IPCC assessment of climate change and regions most vulnerable to projected climatechange (La dernière évaluation du GIEC concernant l’évolution du climat et les régions les plus vulnérables auxchangements climatiques anticipés), donne un aperçu des derniers rapports et des dernières prévisions du GIEC pour leXXIe siècle et précise le rôle que jouent les gaz à effet de serre dans l’évolution du climat. Il comprend en outre une analysede l’incidence qu’aura le changement climatique sur l’agriculture et la foresterie à l’échelle du globe et un inventaire desrégions les plus vulnérables.
Au chapitre 2, intitulé The impact of climate change on greenhouse gas emissions from agriculture and forestry (Incidencedu changement climatique sur les émissions de gaz à effet de serre d’origine agricole et forestière), on évalue l’importancedu rôle des émissions de méthane, d’hémioxyde d’azote et de dioxyde de carbone dues à l’agriculture et à la foresterie aumoyen de données recueillies aux États-Unis d’Amérique et en Chine, à titre d’exemple. La fermentation entérique, lagestion du fumier, la riziculture, la gestion des sols et le brûlage des résidus de récolte produisent du méthane et del’hémioxyde d’azote. Diverses circonstances et méthodes de gestion qui influent sur le volume des émissions sont évoquées.Les effets des modes d’utilisation des terres et des changements d’affectation des terres sur le flux de dioxyde de carbone ainsique l’incidence d’une forte concentration de dioxyde de carbone dans l’atmosphère sur le fonctionnement des systèmesagricoles sont examinés.
Un large éventail de méthodes permettant de gérer et de réduire les émissions de gaz à effet de serre dues àl’agriculture et à la foresterie sont présentées en détail au chapitre 3, intitulé The impact of management strategies in agricultureand agroforestry to mitigate greenhouse gas emissions (Contribution des stratégies de gestion appliquées dans les domaines del’agriculture et de la foresterie à la réduction des émissions de gaz à effet de serre), où l’accent est mis sur une approchesystémique mise en œuvre au Canada.
L’adaptation au changement climatique est le thème central du chapitre 4, intitulé Adaptation strategies required toreduce vulnerability in agriculture and forestry to climate change, climate variability and climate extremes (Stratégies d’adaptationrequises pour réduire la vulnérabilité au changement climatique, à la variabilité du climat et aux extrêmes climatiques dansles domaines de l’agriculture et de la foresterie). On y présente des évaluations de la vulnérabilité et des stratégiesd’adaptation pour différentes régions du globe. Ce long chapitre se termine par un examen des problèmes que posent lesphénomènes météorologiques extrêmes en matière d’agriculture et de foresterie. Enfin, on y décrit brièvement quelquesmesures d’adaptation.
Le chapitre 5, intitulé The impact of management strategies required for reducing the vulnerability of agriculture andforestry to climate variability and climate change (Conséquences des stratégies de gestion nécessaires pour réduire lavulnérabilité de l’agriculture et de la foresterie à la variabilité du climat et au changement climatique), s’intéresse enpremier lieu aux techniques d’évaluation des indices agroclimatiques eu égard à un changement climatique – essentielles sil’on souhaite procéder à l’analyse des risques liés au climat pour diverses situations agricoles. Des mesures d’adaptationfondées sur l’agrotechnologie, mises en œuvre à des latitudes moyennes, sont examinées.
Le chapitre 6, intitulé Contribution to greenhouse gas emissions and vulnerability/adaptation study of agriculture in Africa(Contribution de l’agriculture pratiquée en Afrique aux émissions de gaz à effet de serre et évaluation de sa vulnérabilité etde sa capacité d’adaptation), traite des activités qui produisent des émissions de gaz à effet de serre dans certains paysafricains et analyse la vulnérabilité de certaines cultures aux effets du changement climatique. Le Mali occupe une place dechoix dans ce chapitre.
Le rôle des industries forestières dans le changement climatique, que ce soit en tant que sources d’émissions de gazà effet de serre ou comme facteurs de réduction de ces émissions, est le sujet du chapitre 7, intitulé Forest industries andclimate change (Industries forestières et changement climatique).
Le chapitre 8, intitulé The impact of the conversion of forests into crop and rangelands due to human and livestockpopulation pressure on the sources and sinks of carbon and global warming (Incidence de la transformation des forêts en terrescultivées et en parcours sous l’effet de l’accroissement des populations humaines et animales sur les sources et les puits decarbone et le réchauffement général), a principalement trait aux pertes de carbone et aux émissions de gaz à effet de serreliées à la transformation des forêts et aux modifications des réserves de carbone forestier résultant de certaines méthodes degestion.
Le chapitre 9, intitulé Conclusions and recommendations (Conclusions et recommandations), insiste sur la nécessitéd’encourager les travaux visant à élaborer des stratégies adaptatives en matière de gestion du changement climatique et dela variabilité du climat pour un large éventail d’emplacements et de situations. Ce chapitre se termine par une liste derecommandations pratiques au sujet de ces stratégies et des travaux de recherche à entreprendre.
РЕЗЮМЕ
В настоящей технической записке, которая посвящена стратегиям управления в сельском и лесном хозяйстве,
направленным на уменьшение выбросов парниковых газов и на адаптацию к изменчивости и изменению климата,
рассматривается ряд стратегий в определенном диапазоне сценариев поведения климата, а также обсуждаются
варианты и примеры со всего мира.
В главе 1 (Недавно проведенная МГЭИК оценка изменения климата, а также регионов, наиболее уязвимых
для предполагаемого изменения климата) дается общий обзор последних докладов и предсказаний МГЭИК,
касающихся XXI века, а также той роли, которую парниковые газы играют в изменении климата. Рассматривается
влияние, которое изменяющийся климат будет оказывать на сельское и лесное хозяйство на глобальном уровне, а
также определяются самые уязвимые регионы.
В главе 2 (Влияние изменения климата на выбросы парниковых газов, возникающих при ведении сельского и
лесного хозяйства) оценивается значительная роль выбросов метана, окиси азота и двуокиси углерода,
возникающих при ведении сельского и лесного хозяйства, на примере данных, полученных из США и Китая.
Источниками метана и окиси азота являются: ферментация в кишечнике домашнего скота, работа с
органическими удобрениями, возделывание риса, обработка почвы и сжигание растительных остатков.
Описываются в общих чертах различные условия и виды практики управления, которые оказывают влияние на
объемы выбросов. Исследуются воздействия землепользования и изменения землепользования на поступление
двуокиси углерода, а также влияние повышенных уровней содержания двуокиси углерода в атмосфере на
функционирование сельскохозяйственных систем.
Широкий ряд методов управления выбросами парниковых газов, возникающих при ведении сельского и
лесного хозяйства, и их уменьшения подробно рассматривается в главе 3 (Влияние стратегий управления в
сельском и агролесном хозяйстве, направленных на уменьшение выбросов парниковых газов), с уделением особого
внимания системному подходу, принятому в Канаде.
Адаптации к изменению климата посвящена глава 4 (Стратегии адаптации, необходимые для уменьшения
уязвимости сельского и лесного хозяйства для изменения климата, его изменчивости и экстремальных
климатических явлений). Приводятся оценки уязвимости и стратегии адаптации для различных районов мира.
Эта объемная глава завершается рассмотрением проблем, возникающих в сельском и лесном хозяйстве в связи с
экстремальными метеорологическими явлениями. Представлено краткое описание некоторых мер по адаптации.
Глава 5 (Влияние стратегий управления, необходимых для снижения уязвимости сельского и лесного хозяйств
для изменчивости и изменения климата) начинается с рассмотрения методик оценки агроклиматических индексов
в их связи с изменяющимся климатом, что очень важно для перехода к анализу вызываемых климатом рисков для
ситуаций в сельском хозяйстве. Обсуждаются вопросы адаптации в средних широтах посредством использования
агротехнологии.
В главе 6 (Исследование вклада сельского хозяйства в Африке в выбросы парниковых газов и его
уязвимости/адаптации) рассматриваются виды деятельности, которые вносят вклад в выбросы парниковых газов
в некоторых африканских странах, а также анализируется уязвимость, связанная с воздействием изменения
климата на определенные сельскохозяйственные культуры, в основном на примере Мали.
Роль лесной индустрии в изменении климата как в качестве источника выбросов парниковых газов, так и
фактора, способствующего уменьшению выбросов, является предметом рассмотрения в главе 7 (Лесная индустрия
и изменение климата).
В главе 8 (Влияние преобразования лесов в сельскохозяйственные и пастбищные угодья вследствие роста
численности населения и поголовья домашнего скота на источники и поглотители углерода, а также на глобальное
потепление) внимание сосредоточено на потерях углерода и выбросах парниковых газов, связанных с
преобразованием лесов и изменениями в запасах углерода в лесах в результате практики управления.
Глава 9 (Выводы и рекомендации) подчеркивает важность поощрения дальнейшей работы в области
стратегий адаптации для решения проблем изменения климата и уязвимости для воздействий климата в
различных местах и при различных ситуациях. Глава заканчивается перечнем практических рекомендаций
относительно стратегий и дополнительных научных исследований.
RESUMEN
En esta nota técnica se consideran las estrategias de gestión en agricultura y silvicultura para la mitigación de emisiones degases de efecto invernadero y la adaptación a la variabilidad del clima y el cambio climático y se examinan varias estrategiasen una amplia gama de escenarios, además de presentar opciones y dar ejemplos de todo el mundo.
En el Capítulo 1 (The recent IPCC assessment of climate change and regions most vulnerable to projected climate change[La reciente evaluación del IPCC sobre el cambio climático y las regiones más vulnerables al cambio del clima previsto]) seofrece un panorama general de los recientes informes y predicciones del IPCC para el siglo XXI y la función quedesempeñan en el cambio climático los gases de efecto invernadero. Se examina el impacto que tendrá el cambio climáticoen la agricultura y la silvicultura en todas partes, y se señalan las regiones más vulnerables.
En el Capítulo 2 (The impact of climate change on greenhouse gas emissions from agriculture and forestry [El impactodel cambio climático en las emisiones de gases de efecto invernadero de la agricultura y la silvicultura]) se evalúa laimportante función de las emisiones de metano, óxido nitroso y dióxido de carbono de la agricultura y la silvicultura, condatos de Estados Unidos y China, a título de ejemplo. La fermentación entérica, el aprovechamiento del estiércol, el cultivode arroz, la gestión de los suelos y la quema de residuos de cultivos son fuentes de metano y óxido nitroso. Se describendiversas condiciones y prácticas de gestión que influyen en la cantidad de las emisiones. También se examinan los efectosdel uso de la tierra y el cambio de uso de la tierra sobre el flujo de dióxido de carbono y el impacto de elevados niveles dedióxido de carbono atmosférico en el funcionamiento de los sistemas agrícolas.
En el Capítulo 3 (The impact of management strategies in agriculture and agroforestry to mitigate greenhouse gas emissions[El impacto de las estrategias de gestión en la agricultura y la agrosilvicultura para mitigar las emisiones de gases de efectoinvernadero]) se detalla una amplia gama de métodos para gestionar y reducir las emisiones de gases de efecto invernaderode la agricultura y la silvicultura, prestándose especial atención a un método de sistemas adoptado en Canadá.
El Capítulo 4 (Adaptation strategies required to reduce vulnerability in agriculture and forestry to climate change, climatevariability and climate extremes [Estrategias de adaptación necesarias para reducir la vulnerabilidad en la agricultura y lasilvicultura al cambio climático, la variabilidad del clima y condiciones climáticas extremas]) se centra en la adaptación alcambio climático. Se ofrecen evaluaciones de la vulnerabilidad y estrategias de adaptación para diferentes regiones delmundo. Este largo capítulo concluye con la consideración de los problemas que plantean a la agricultura y a la silviculturalos fenómenos meteorológicos extremos. Se describen brevemente algunas medidas de adaptación.
El Capítulo 5 (The impact of management strategies required for reducing the vulnerability of agriculture and forestry toclimate variability and climate change [El impacto de las estrategias de gestión necesarias para reducir la vulnerabilidad de laagricultura y la silvicultura a la variabilidad del clima y el cambio climático]) comienza con un análisis de las técnicas paraevaluar índices agroclimáticos en relación con la variación del clima, que es esencial para analizar los riesgos de origenclimático en situaciones agrícolas. También se trata de las adaptaciones por medio de la agrotecnología, en latitudesmoderadas.
Dr H.P. Das (Chairman)DirectorAgricultural Meteorology DivisionIndia Meteorological DepartmentPune 411 005INDIA
Dr Raymond DesjardinsResearch BranchAgriculture and Agrifood Canada960 Karling AvenueOttawa, Ontario K1A 0C6CANADA
Mr Birama DiarraDirection Nationale de la MétéorologieB.P. 237BamakoMALI
Mr Jacques LahaussoisForest Products DivisionForestry DepartmentFAOVia delle Terme di Caracalla00100 RomeITALY
Dr Michael J. SalingerNational Institute of WaterAtmospheric ResearchP.O. Box 109-695AucklandNewmarketNEW ZEALAND
Mr Jens MackensenDivision of EnvironmentPolicy Development and LawUnited Nations Environment Programme (UNEP)P.O. Box 30052NairobiKENYA
Ms Zhao YanxiaChinese Academy of Meteorological SciencesBaishiqiao Road No. 46Western SuburbBeijing 100081CHINA
LIST OF CONTRIBUTORS
CHAPTER 1
THE RECENT IPCC ASSESSMENT OF CLIMATE CHANGEAND REGIONS MOST VULNERABLE TO PROJECTEDCLIMATE CHANGE (by M.J. Salinger)
Between 1998–2001, the Intergovernmental Panel on Climate Change (IPCC)prepared the Third Assessment Report (TAR) on the scientific assessment ofclimate change; Working Groups I and II released their reports in January andFebruary 2001 and Working Group III in March 2001.
The IPCC scientific assessments of climate change are the most comprehensivereports of the science of climate change. The Third Assessment Report was compiledbetween December 1998 and January 2001 by 123 lead authors, 516 contributingauthors, 21 review editors and over 300 expert reviewers. Delegations from about 100countries approved the Summary for Policymakers in Shanghai on 17–20 January 2001and accepted the report Climate Change 2001: The Scientific Basis (IPCC, 2001a).
This contribution will provide an overview of the recent IPCC assessment ofthe science of climate change and identify the regions most vulnerable to currentand projected climate change in the context of expected disruption to agriculturalproduction over the next few decades.
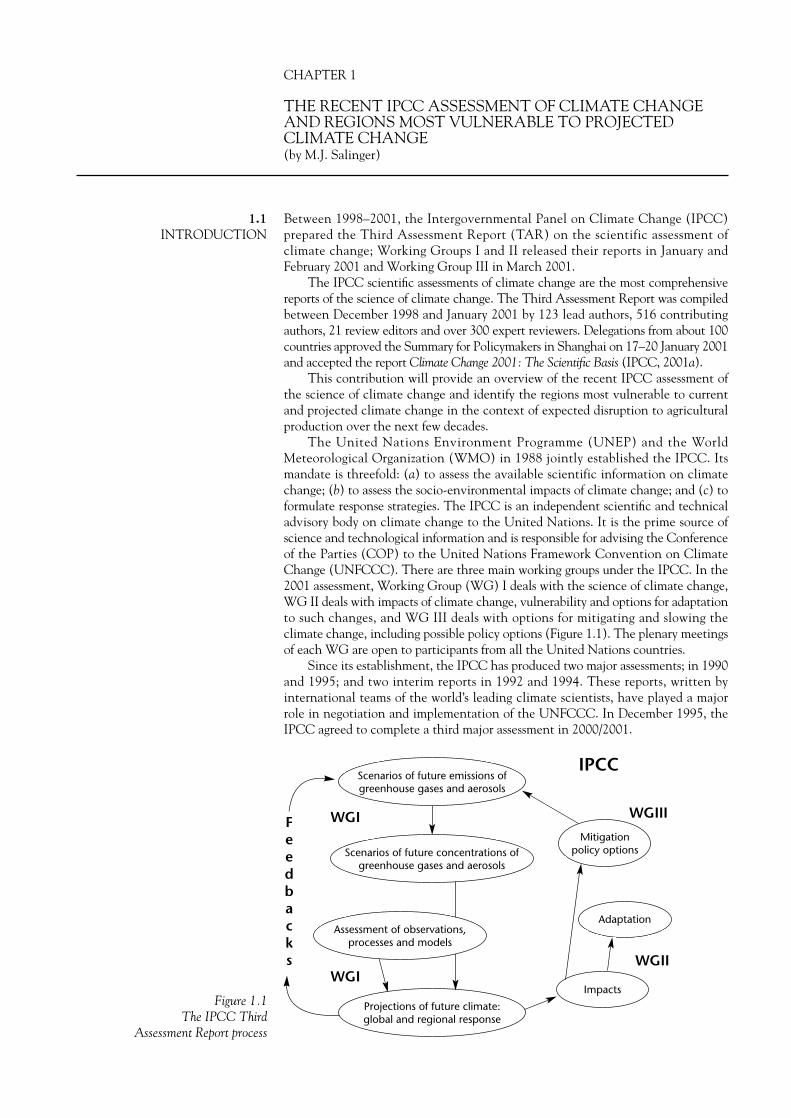
The United Nations Environment Programme (UNEP) and the WorldMeteorological Organization (WMO) in 1988 jointly established the IPCC. Itsmandate is threefold: (a) to assess the available scientific information on climatechange; (b) to assess the socio-environmental impacts of climate change; and (c) toformulate response strategies. The IPCC is an independent scientific and technicaladvisory body on climate change to the United Nations. It is the prime source ofscience and technological information and is responsible for advising the Conferenceof the Parties (COP) to the United Nations Framework Convention on ClimateChange (UNFCCC). There are three main working groups under the IPCC. In the2001 assessment, Working Group (WG) I deals with the science of climate change,WG II deals with impacts of climate change, vulnerability and options for adaptationto such changes, and WG III deals with options for mitigating and slowing theclimate change, including possible policy options (Figure 1.1). The plenary meetingsof each WG are open to participants from all the United Nations countries.
Since its establishment, the IPCC has produced two major assessments; in 1990and 1995; and two interim reports in 1992 and 1994. These reports, written byinternational teams of the world’s leading climate scientists, have played a majorrole in negotiation and implementation of the UNFCCC. In December 1995, theIPCC agreed to complete a third major assessment in 2000/2001.
1.1INTRODUCTION
Scenarios of future emissions ofgreenhouse gases and aerosols
Scenarios of future concentrations ofgreenhouse gases and aerosols
Projections of future climate:global and regional response
Mitigation policy options
Adaptation
Impacts
IPCC
WGIII
WGII
WGI
WGI
Feedbacks
Assessment of observations,processes and models
Figure 1.1The IPCC Third
Assessment Report process
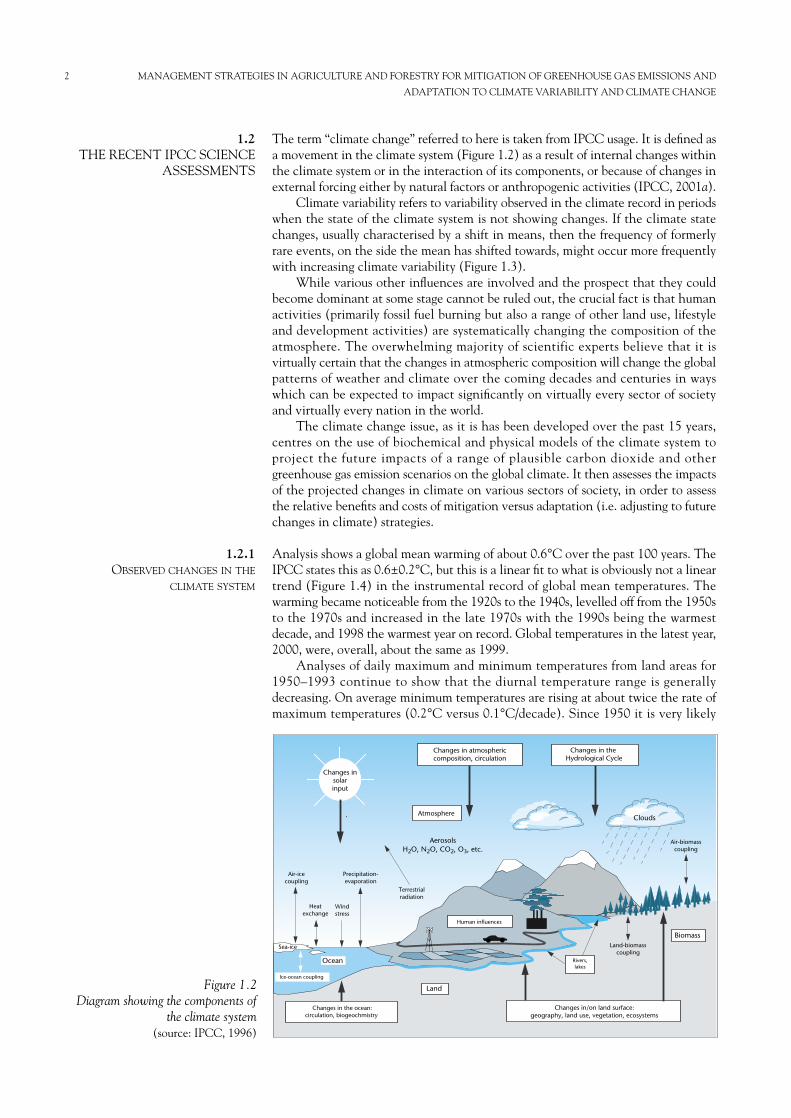
The term “climate change” referred to here is taken from IPCC usage. It is defined asa movement in the climate system (Figure 1.2) as a result of internal changes withinthe climate system or in the interaction of its components, or because of changes inexternal forcing either by natural factors or anthropogenic activities (IPCC, 2001a).
Climate variability refers to variability observed in the climate record in periodswhen the state of the climate system is not showing changes. If the climate statechanges, usually characterised by a shift in means, then the frequency of formerlyrare events, on the side the mean has shifted towards, might occur more frequentlywith increasing climate variability (Figure 1.3).
While various other influences are involved and the prospect that they couldbecome dominant at some stage cannot be ruled out, the crucial fact is that humanactivities (primarily fossil fuel burning but also a range of other land use, lifestyleand development activities) are systematically changing the composition of theatmosphere. The overwhelming majority of scientific experts believe that it isvirtually certain that the changes in atmospheric composition will change the globalpatterns of weather and climate over the coming decades and centuries in wayswhich can be expected to impact significantly on virtually every sector of societyand virtually every nation in the world.
The climate change issue, as it is has been developed over the past 15 years,centres on the use of biochemical and physical models of the climate system toproject the future impacts of a range of plausible carbon dioxide and othergreenhouse gas emission scenarios on the global climate. It then assesses the impactsof the projected changes in climate on various sectors of society, in order to assessthe relative benefits and costs of mitigation versus adaptation (i.e. adjusting to futurechanges in climate) strategies.
Analysis shows a global mean warming of about 0.6°C over the past 100 years. TheIPCC states this as 0.6±0.2°C, but this is a linear fit to what is obviously not a lineartrend (Figure 1.4) in the instrumental record of global mean temperatures. Thewarming became noticeable from the 1920s to the 1940s, levelled off from the 1950sto the 1970s and increased in the late 1970s with the 1990s being the warmestdecade, and 1998 the warmest year on record. Global temperatures in the latest year,2000, were, overall, about the same as 1999.
Analyses of daily maximum and minimum temperatures from land areas for1950–1993 continue to show that the diurnal temperature range is generallydecreasing. On average minimum temperatures are rising at about twice the rate ofmaximum temperatures (0.2°C versus 0.1°C/decade). Since 1950 it is very likely
1.2.1OBSERVED CHANGES IN THE
CLIMATE SYSTEM
1.2THE RECENT IPCC SCIENCE
ASSESSMENTS
2 MANAGEMENT STRATEGIES IN AGRICULTURE AND FORESTRY FOR MITIGATION OF GREENHOUSE GAS EMISSIONS AND
ADAPTATION TO CLIMATE VARIABILITY AND CLIMATE CHANGE
Ocean
Atmosphere
Air-icecoupling
Precipitation-evaporation
Air-biomasscoupling
Heatexchange
Changes insolarinput
Land-biomasscoupling
Biomass
Land
Sea-ice
Ice-ocean coupling
AerosolsH2O, N2O, CO2, O3, etc.
Windstress
Human influences
Terrestrialradiation
Clouds
Rivers,lakes
Changes in the Hydrological Cycle
Ocean
Changes in atmosphericcomposition, circulation
Changes in/on land surface:geography, land use, vegetation, ecosystems
.
Changes in the ocean:circulation, biogeochmistry
Figure 1.2Diagram showing the components of
the climate system (source: IPCC, 1996)
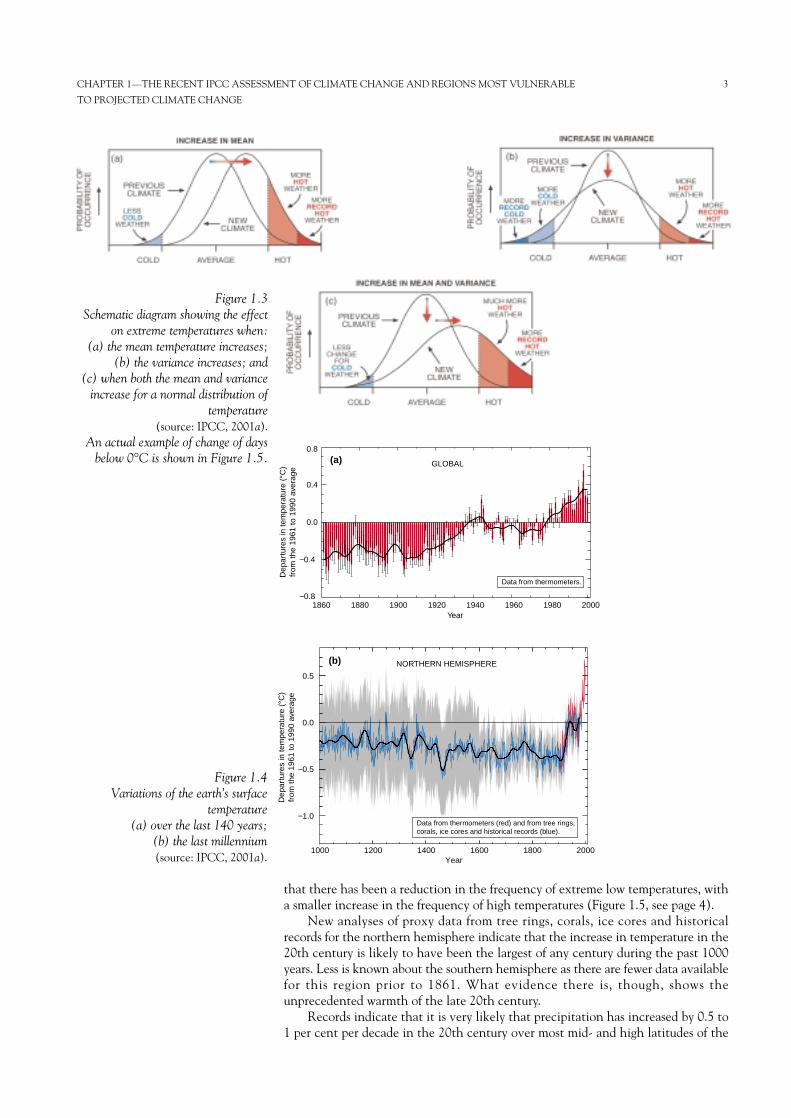
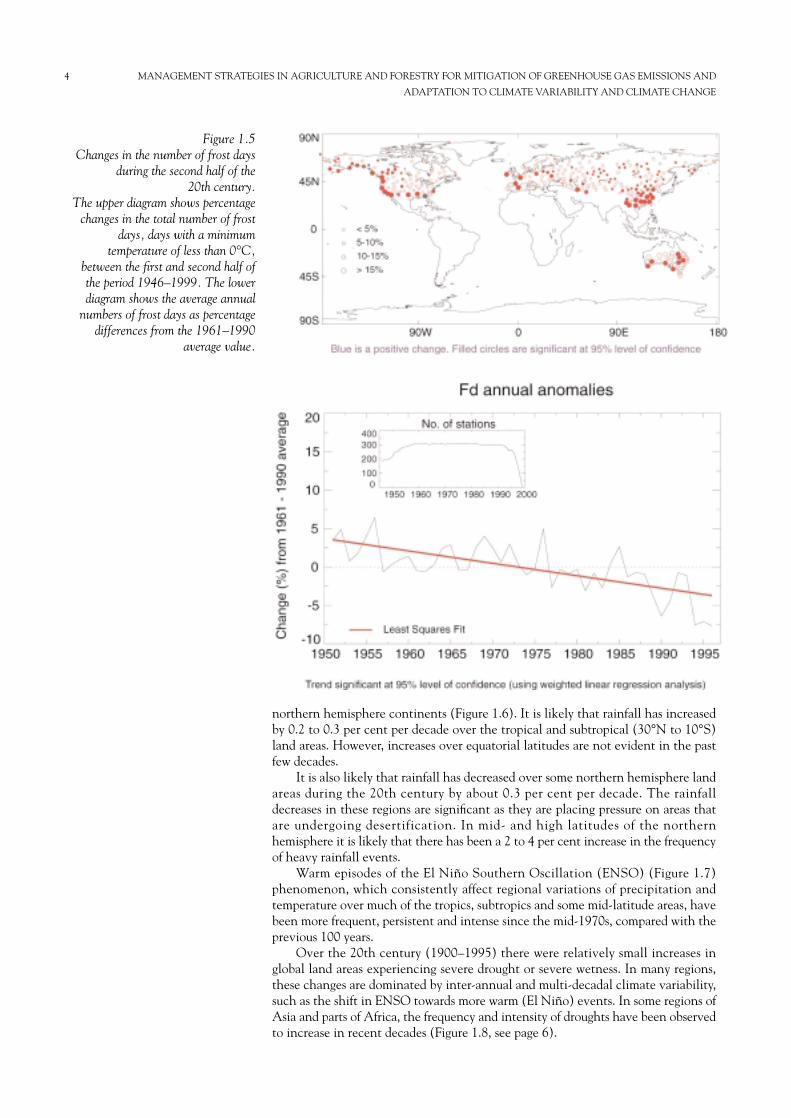
that there has been a reduction in the frequency of extreme low temperatures, witha smaller increase in the frequency of high temperatures (Figure 1.5, see page 4).
New analyses of proxy data from tree rings, corals, ice cores and historicalrecords for the northern hemisphere indicate that the increase in temperature in the20th century is likely to have been the largest of any century during the past 1000years. Less is known about the southern hemisphere as there are fewer data availablefor this region prior to 1861. What evidence there is, though, shows theunprecedented warmth of the late 20th century.
Records indicate that it is very likely that precipitation has increased by 0.5 to1 per cent per decade in the 20th century over most mid- and high latitudes of the
CHAPTER 1—THE RECENT IPCC ASSESSMENT OF CLIMATE CHANGE AND REGIONS MOST VULNERABLE 3
TO PROJECTED CLIMATE CHANGE
Figure 1.3Schematic diagram showing the effect
on extreme temperatures when:(a) the mean temperature increases;
(b) the variance increases; and (c) when both the mean and variance
increase for a normal distribution oftemperature
(source: IPCC, 2001a). An actual example of change of days
below 0°C is shown in Figure 1.5.
Dep
artu
res
in te
mpe
ratu
re (
°C)
from
the
1961
to 1
990
aver
age
(b) NORTHERN HEMISPHERE
Data from thermometers (red) and from tree rings, corals, ice cores and historical records (blue).
1000 1200 1400 1600 1800 2000Year
−1.0
−0.5
0.0
0.5
Figure 1.4Variations of the earth’s surface
temperature (a) over the last 140 years;
(b) the last millennium (source: IPCC, 2001a).
1860 1880 1900 1920 1940 1960 1980 2000Year
Dep
artu
res
in te
mpe
ratu
re (
°C)
from
the
1961
to 1
990
aver
age
(a) GLOBAL
Data from thermometers.
−0.8
−0.4
0.0
0.4
0.8
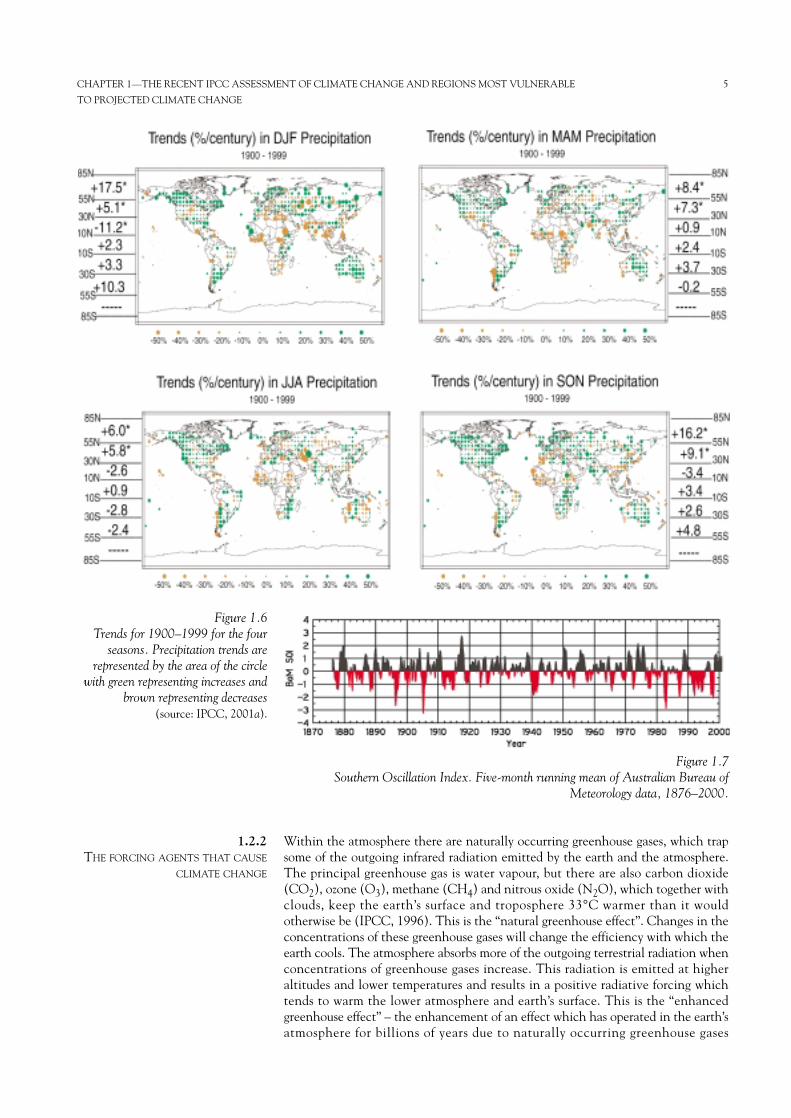
northern hemisphere continents (Figure 1.6). It is likely that rainfall has increasedby 0.2 to 0.3 per cent per decade over the tropical and subtropical (30°N to 10°S)land areas. However, increases over equatorial latitudes are not evident in the pastfew decades.
It is also likely that rainfall has decreased over some northern hemisphere landareas during the 20th century by about 0.3 per cent per decade. The rainfalldecreases in these regions are significant as they are placing pressure on areas thatare undergoing desertification. In mid- and high latitudes of the northernhemisphere it is likely that there has been a 2 to 4 per cent increase in the frequencyof heavy rainfall events.
Warm episodes of the El Niño Southern Oscillation (ENSO) (Figure 1.7)phenomenon, which consistently affect regional variations of precipitation andtemperature over much of the tropics, subtropics and some mid-latitude areas, havebeen more frequent, persistent and intense since the mid-1970s, compared with theprevious 100 years.
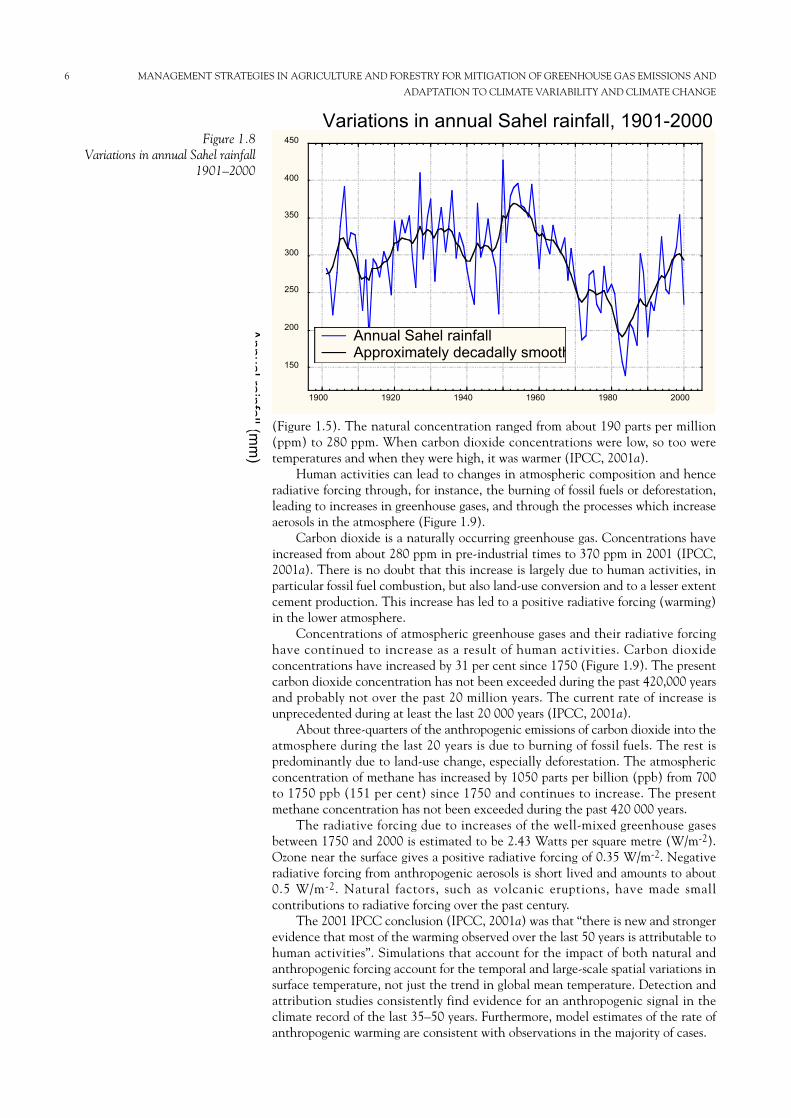
Over the 20th century (1900–1995) there were relatively small increases inglobal land areas experiencing severe drought or severe wetness. In many regions,these changes are dominated by inter-annual and multi-decadal climate variability,such as the shift in ENSO towards more warm (El Niño) events. In some regions ofAsia and parts of Africa, the frequency and intensity of droughts have been observedto increase in recent decades (Figure 1.8, see page 6).
4 MANAGEMENT STRATEGIES IN AGRICULTURE AND FORESTRY FOR MITIGATION OF GREENHOUSE GAS EMISSIONS AND
ADAPTATION TO CLIMATE VARIABILITY AND CLIMATE CHANGE
Figure 1.5Changes in the number of frost days
during the second half of the20th century.
The upper diagram shows percentagechanges in the total number of frost
days, days with a minimumtemperature of less than 0°C,
between the first and second half ofthe period 1946–1999. The lowerdiagram shows the average annual
numbers of frost days as percentagedifferences from the 1961–1990
average value.
Within the atmosphere there are naturally occurring greenhouse gases, which trapsome of the outgoing infrared radiation emitted by the earth and the atmosphere.The principal greenhouse gas is water vapour, but there are also carbon dioxide(CO2), ozone (O3), methane (CH4) and nitrous oxide (N2O), which together withclouds, keep the earth’s surface and troposphere 33°C warmer than it wouldotherwise be (IPCC, 1996). This is the “natural greenhouse effect”. Changes in theconcentrations of these greenhouse gases will change the efficiency with which theearth cools. The atmosphere absorbs more of the outgoing terrestrial radiation whenconcentrations of greenhouse gases increase. This radiation is emitted at higheraltitudes and lower temperatures and results in a positive radiative forcing whichtends to warm the lower atmosphere and earth’s surface. This is the “enhancedgreenhouse effect” – the enhancement of an effect which has operated in the earth’satmosphere for billions of years due to naturally occurring greenhouse gases
1.2.2THE FORCING AGENTS THAT CAUSE
CLIMATE CHANGE
CHAPTER 1—THE RECENT IPCC ASSESSMENT OF CLIMATE CHANGE AND REGIONS MOST VULNERABLE 5
TO PROJECTED CLIMATE CHANGE
Figure 1.6Trends for 1900–1999 for the four
seasons. Precipitation trends arerepresented by the area of the circle
with green representing increases andbrown representing decreases
(source: IPCC, 2001a).
Figure 1.7Southern Oscillation Index. Five-month running mean of Australian Bureau of
Meteorology data, 1876–2000.
(Figure 1.5). The natural concentration ranged from about 190 parts per million(ppm) to 280 ppm. When carbon dioxide concentrations were low, so too weretemperatures and when they were high, it was warmer (IPCC, 2001a).
Human activities can lead to changes in atmospheric composition and henceradiative forcing through, for instance, the burning of fossil fuels or deforestation,leading to increases in greenhouse gases, and through the processes which increaseaerosols in the atmosphere (Figure 1.9).
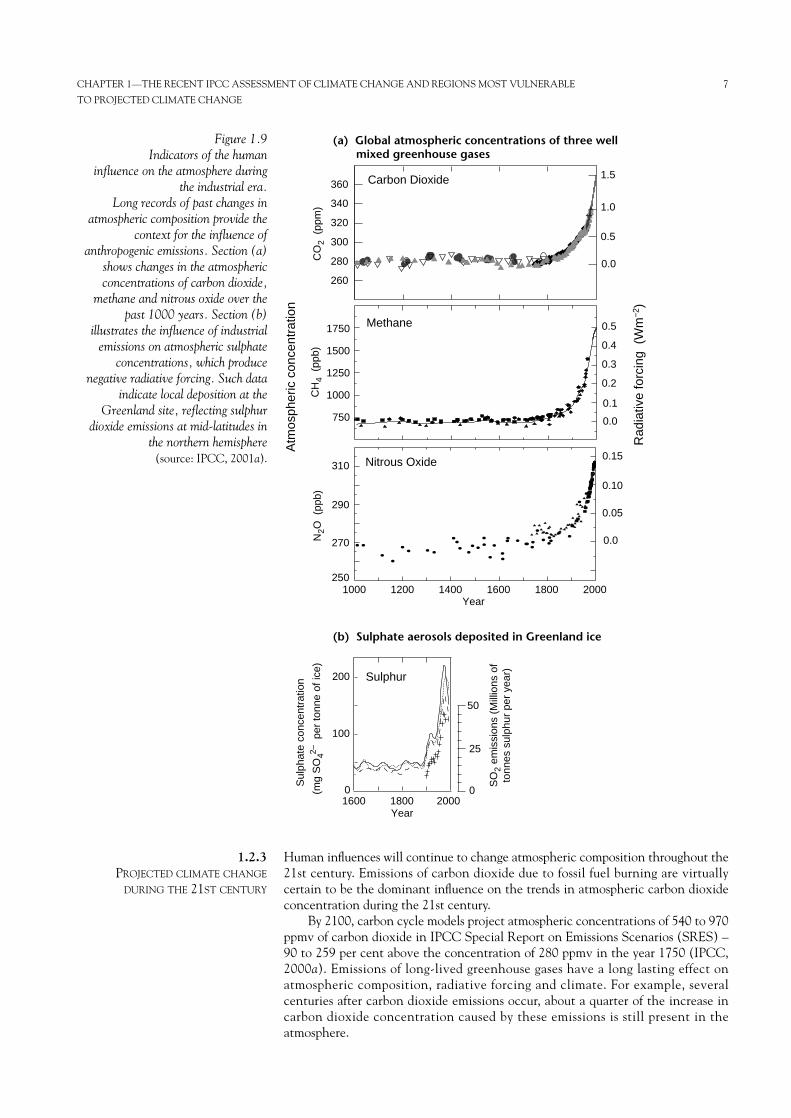
Carbon dioxide is a naturally occurring greenhouse gas. Concentrations haveincreased from about 280 ppm in pre-industrial times to 370 ppm in 2001 (IPCC,2001a). There is no doubt that this increase is largely due to human activities, inparticular fossil fuel combustion, but also land-use conversion and to a lesser extentcement production. This increase has led to a positive radiative forcing (warming)in the lower atmosphere.
Concentrations of atmospheric greenhouse gases and their radiative forcinghave continued to increase as a result of human activities. Carbon dioxideconcentrations have increased by 31 per cent since 1750 (Figure 1.9). The presentcarbon dioxide concentration has not been exceeded during the past 420,000 yearsand probably not over the past 20 million years. The current rate of increase isunprecedented during at least the last 20 000 years (IPCC, 2001a).
About three-quarters of the anthropogenic emissions of carbon dioxide into theatmosphere during the last 20 years is due to burning of fossil fuels. The rest ispredominantly due to land-use change, especially deforestation. The atmosphericconcentration of methane has increased by 1050 parts per billion (ppb) from 700to 1750 ppb (151 per cent) since 1750 and continues to increase. The presentmethane concentration has not been exceeded during the past 420 000 years.
The radiative forcing due to increases of the well-mixed greenhouse gasesbetween 1750 and 2000 is estimated to be 2.43 Watts per square metre (W/m-2).Ozone near the surface gives a positive radiative forcing of 0.35 W/m-2. Negativeradiative forcing from anthropogenic aerosols is short lived and amounts to about0.5 W/m-2. Natural factors, such as volcanic eruptions, have made smallcontributions to radiative forcing over the past century.
The 2001 IPCC conclusion (IPCC, 2001a) was that “there is new and strongerevidence that most of the warming observed over the last 50 years is attributable tohuman activities”. Simulations that account for the impact of both natural andanthropogenic forcing account for the temporal and large-scale spatial variations insurface temperature, not just the trend in global mean temperature. Detection andattribution studies consistently find evidence for an anthropogenic signal in theclimate record of the last 35–50 years. Furthermore, model estimates of the rate ofanthropogenic warming are consistent with observations in the majority of cases.
6 MANAGEMENT STRATEGIES IN AGRICULTURE AND FORESTRY FOR MITIGATION OF GREENHOUSE GAS EMISSIONS AND
ADAPTATION TO CLIMATE VARIABILITY AND CLIMATE CHANGE
Variations in annual Sahel rainfall, 1901-2000
Annual rainfall (m
m)
150
200
250
300
350
400
450
1900 1920 1940 1960 1980 2000
Annual Sahel rainfallApproximately decadally smooth
Figure 1.8Variations in annual Sahel rainfall
1901–2000
Human influences will continue to change atmospheric composition throughout the21st century. Emissions of carbon dioxide due to fossil fuel burning are virtuallycertain to be the dominant influence on the trends in atmospheric carbon dioxideconcentration during the 21st century.
By 2100, carbon cycle models project atmospheric concentrations of 540 to 970ppmv of carbon dioxide in IPCC Special Report on Emissions Scenarios (SRES) –90 to 259 per cent above the concentration of 280 ppmv in the year 1750 (IPCC,2000a). Emissions of long-lived greenhouse gases have a long lasting effect onatmospheric composition, radiative forcing and climate. For example, severalcenturies after carbon dioxide emissions occur, about a quarter of the increase incarbon dioxide concentration caused by these emissions is still present in theatmosphere.
1.2.3PROJECTED CLIMATE CHANGE
DURING THE 21ST CENTURY
CHAPTER 1—THE RECENT IPCC ASSESSMENT OF CLIMATE CHANGE AND REGIONS MOST VULNERABLE 7
TO PROJECTED CLIMATE CHANGE
CO
2 (
ppm
)
260
280
300
320
340
360
1000 1200 1400 1600 1800 2000
CH
4 (
ppb)
1250
1000
750
1500
1750N
2O (
ppb)
310
290
270
250
0.0
0.5
1.0
1.5
0.5
0.4
0.3
0.2
0.1
0.0
0.15
0.10
0.05
0.0
Carbon Dioxide
Methane
Nitrous Oxide
Atm
osph
eric
con
cent
ratio
n
Rad
iativ
e fo
rcin
g (
Wm
−2)
1600 1800
200
100
0(mg
SO
42– p
er to
nne
of ic
e)
Sulphur
Sul
phat
e co
ncen
trat
ion
Year
Year2000
50
25
0 SO
2 em
issi
ons
(Mill
ions
of
tonn
es s
ulph
ur p
er y
ear)
(b) Sulphate aerosols deposited in Greenland ice
(a) Global atmospheric concentrations of three well mixed greenhouse gases
Figure 1.9Indicators of the human
influence on the atmosphere duringthe industrial era.
Long records of past changes inatmospheric composition provide the
context for the influence ofanthropogenic emissions. Section (a)
shows changes in the atmosphericconcentrations of carbon dioxide,
methane and nitrous oxide over thepast 1000 years. Section (b)
illustrates the influence of industrialemissions on atmospheric sulphate
concentrations, which producenegative radiative forcing. Such data
indicate local deposition at theGreenland site, reflecting sulphur
dioxide emissions at mid-latitudes inthe northern hemisphere
(source: IPCC, 2001a).
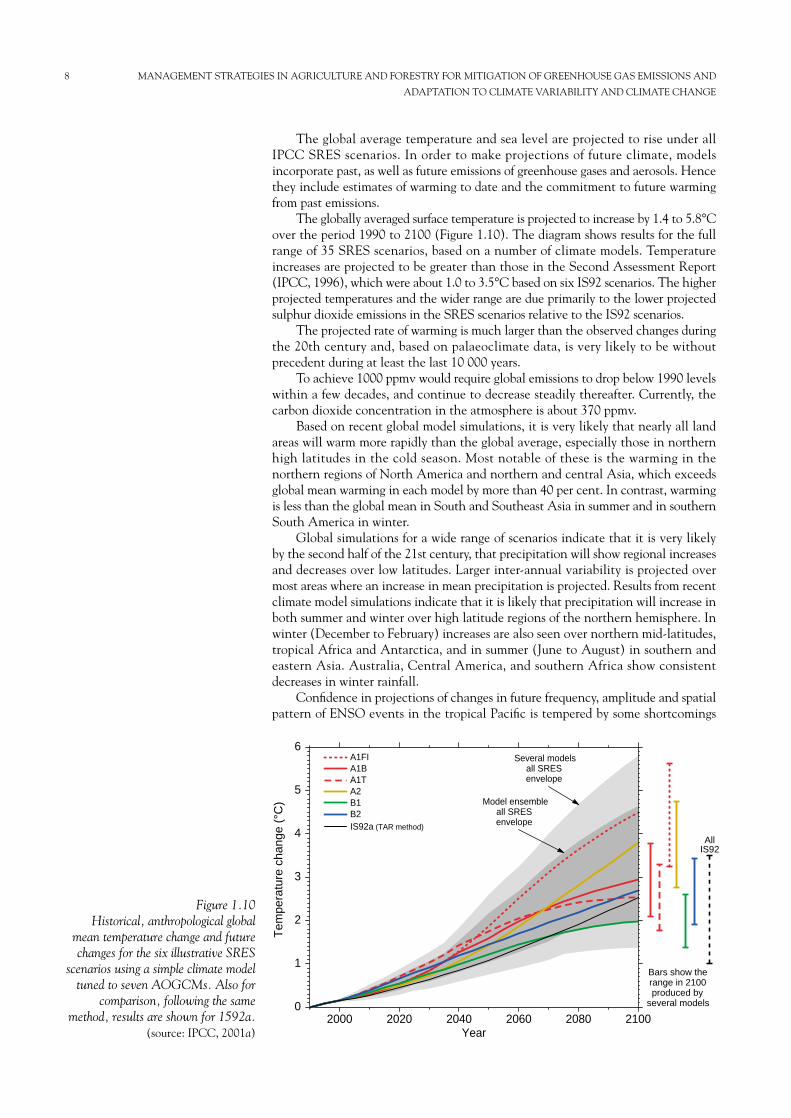
The global average temperature and sea level are projected to rise under allIPCC SRES scenarios. In order to make projections of future climate, modelsincorporate past, as well as future emissions of greenhouse gases and aerosols. Hencethey include estimates of warming to date and the commitment to future warmingfrom past emissions.
The globally averaged surface temperature is projected to increase by 1.4 to 5.8°Cover the period 1990 to 2100 (Figure 1.10). The diagram shows results for the fullrange of 35 SRES scenarios, based on a number of climate models. Temperatureincreases are projected to be greater than those in the Second Assessment Report(IPCC, 1996), which were about 1.0 to 3.5°C based on six IS92 scenarios. The higherprojected temperatures and the wider range are due primarily to the lower projectedsulphur dioxide emissions in the SRES scenarios relative to the IS92 scenarios.
The projected rate of warming is much larger than the observed changes duringthe 20th century and, based on palaeoclimate data, is very likely to be withoutprecedent during at least the last 10 000 years.
To achieve 1000 ppmv would require global emissions to drop below 1990 levelswithin a few decades, and continue to decrease steadily thereafter. Currently, thecarbon dioxide concentration in the atmosphere is about 370 ppmv.
Based on recent global model simulations, it is very likely that nearly all landareas will warm more rapidly than the global average, especially those in northernhigh latitudes in the cold season. Most notable of these is the warming in thenorthern regions of North America and northern and central Asia, which exceedsglobal mean warming in each model by more than 40 per cent. In contrast, warmingis less than the global mean in South and Southeast Asia in summer and in southernSouth America in winter.
Global simulations for a wide range of scenarios indicate that it is very likelyby the second half of the 21st century, that precipitation will show regional increasesand decreases over low latitudes. Larger inter-annual variability is projected overmost areas where an increase in mean precipitation is projected. Results from recentclimate model simulations indicate that it is likely that precipitation will increase inboth summer and winter over high latitude regions of the northern hemisphere. Inwinter (December to February) increases are also seen over northern mid-latitudes,tropical Africa and Antarctica, and in summer (June to August) in southern andeastern Asia. Australia, Central America, and southern Africa show consistentdecreases in winter rainfall.
Confidence in projections of changes in future frequency, amplitude and spatialpattern of ENSO events in the tropical Pacific is tempered by some shortcomings
8 MANAGEMENT STRATEGIES IN AGRICULTURE AND FORESTRY FOR MITIGATION OF GREENHOUSE GAS EMISSIONS AND
ADAPTATION TO CLIMATE VARIABILITY AND CLIMATE CHANGE
AllIS92
2000 2020 2040 2060 2080 2100Year
0
1
2
3
4
5
6
Tem
pera
ture
cha
nge
(°C
)
A1FIA1BA1TA2B1B2IS92a (TAR method)
Several modelsall SRESenvelope
Model ensembleall SRESenvelope
Bars show therange in 2100produced by
several models
Figure 1.10Historical, anthropological global
mean temperature change and futurechanges for the six illustrative SRES
scenarios using a simple climate modeltuned to seven AOGCMs. Also for
comparison, following the samemethod, results are shown for 1592a.
(source: IPCC, 2001a)
in how well El Niño is simulated in complex models. Current projections show littlechange or a small increase in amplitude for El Niño events over the next 100 years.However, even with little or no change in El Niño amplitude, global warming islikely to lead to greater extremes of drying and heavy rainfall, and to increase therisk of droughts and floods that occur with El Niño events in many different regions.
It is also likely that warming associated with increasing greenhouse gases willcause an increase of Asian monsoon precipitation variability. Changes in themonsoon mean duration and strength depend on the details of the emissionscenario. Confidence in such projections is also limited by how well the climatemodels simulate the detailed seasonal evolution of the monsoons.
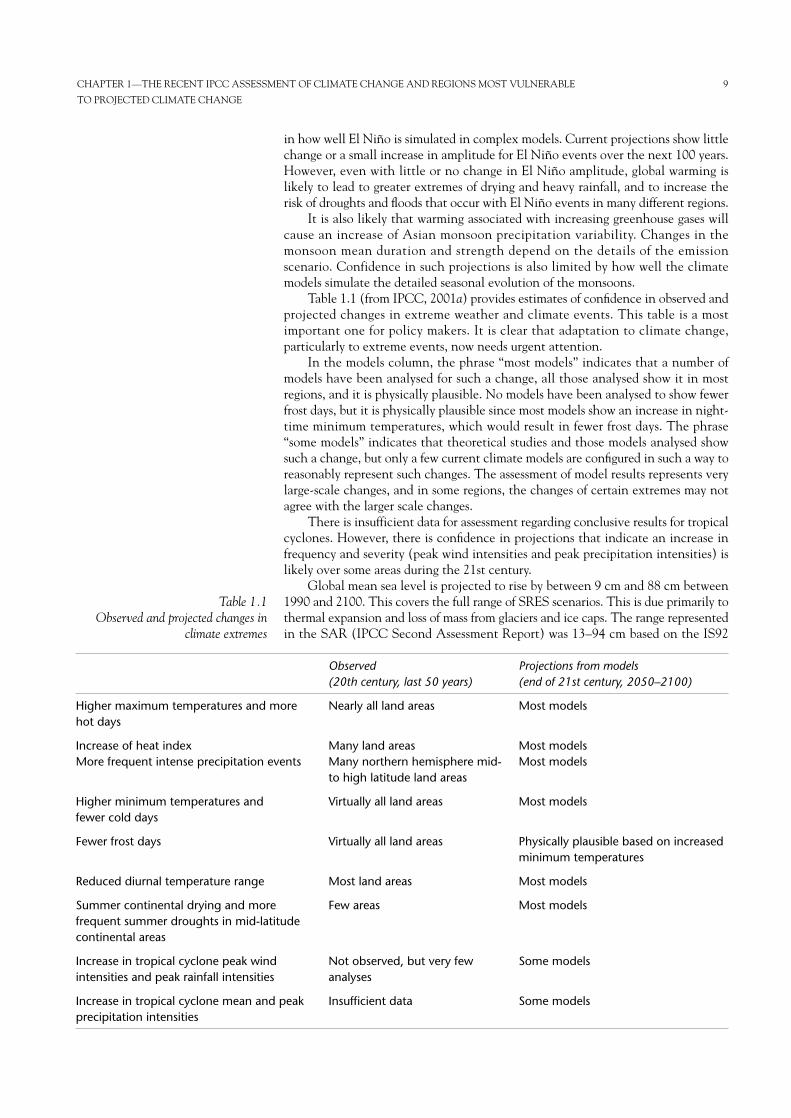
Table 1.1 (from IPCC, 2001a) provides estimates of confidence in observed andprojected changes in extreme weather and climate events. This table is a mostimportant one for policy makers. It is clear that adaptation to climate change,particularly to extreme events, now needs urgent attention.
In the models column, the phrase “most models” indicates that a number ofmodels have been analysed for such a change, all those analysed show it in mostregions, and it is physically plausible. No models have been analysed to show fewerfrost days, but it is physically plausible since most models show an increase in night-time minimum temperatures, which would result in fewer frost days. The phrase“some models” indicates that theoretical studies and those models analysed showsuch a change, but only a few current climate models are configured in such a way toreasonably represent such changes. The assessment of model results represents verylarge-scale changes, and in some regions, the changes of certain extremes may notagree with the larger scale changes.
There is insufficient data for assessment regarding conclusive results for tropicalcyclones. However, there is confidence in projections that indicate an increase infrequency and severity (peak wind intensities and peak precipitation intensities) islikely over some areas during the 21st century.
Global mean sea level is projected to rise by between 9 cm and 88 cm between1990 and 2100. This covers the full range of SRES scenarios. This is due primarily tothermal expansion and loss of mass from glaciers and ice caps. The range representedin the SAR (IPCC Second Assessment Report) was 13–94 cm based on the IS92
CHAPTER 1—THE RECENT IPCC ASSESSMENT OF CLIMATE CHANGE AND REGIONS MOST VULNERABLE 9
TO PROJECTED CLIMATE CHANGE
Observed Projections from models(20th century, last 50 years) (end of 21st century, 2050–2100)
Higher maximum temperatures and more Nearly all land areas Most modelshot days
Increase of heat index Many land areas Most modelsMore frequent intense precipitation events Many northern hemisphere mid- Most models
to high latitude land areas
Higher minimum temperatures and Virtually all land areas Most modelsfewer cold days
Fewer frost days Virtually all land areas Physically plausible based on increasedminimum temperatures
Reduced diurnal temperature range Most land areas Most models
Summer continental drying and more Few areas Most modelsfrequent summer droughts in mid-latitude continental areas
Increase in tropical cyclone peak wind Not observed, but very few Some modelsintensities and peak rainfall intensities analyses
Increase in tropical cyclone mean and peak Insufficient data Some modelsprecipitation intensities
Table 1.1Observed and projected changes in
climate extremes
scenarios. Despite the higher temperature change projections in this assessment, thesea level projections are slightly lower, primarily due to use of improved models,which give a smaller contribution from glaciers and ice sheets.
Anthropogenic climate change will persist for many centuries because emissionsof long-lived greenhouse gases have a lasting effect on atmospheric composition,radiative forcing and climate. For example, several centuries after carbon dioxideemissions occur, about a quarter of the increase in carbon dioxide concentrationcaused by these emissions is still present in the atmosphere.
After greenhouse gas concentrations have stabilised, global average surfacetemperatures would rise at a rate of only a few tenths of a degree per century ratherthan several degrees per century as projected for the 21st century withoutstabilisation. Global mean surface temperature increases and rising sea level fromthermal expansion of the ocean are projected to continue for hundreds of years afterstabilisation of greenhouse gas concentrations (even at present levels), owing to thelong timescales on which the deep ocean adjusts to climate change.
Owing to the long lifetime of carbon dioxide and the slow adjustment of theoceans, there is already substantial future commitment to further global climatechange even in the absence of further emissions of greenhouse gases in theatmosphere. The IPCC considered various options for stabilising carbon dioxide andgreenhouse gas concentrations at levels up to about four times those of pre-industriallevels, and all show that substantial reductions in emissions, well below currentlevels, would be required sooner or later in all cases.
Changes in agriculture and food security have been accompanied by an increase ofproductivity of wheat in Australia, but with an expansion of the ranges of certainpests in the United States. A reduction in cereal crop production in Africa and anincrease in desertified area, with a 25 per cent reduction in productive area, hasoccurred.
An increase in climate extremes in western Siberia, the Baikal region andeastern parts of Boreal Asia has been reported in recent decades. Regions andseasons with marked ENSO responses have also been detected in the Asian territoryof the former USSR, where significant statistical relationships between climaticanomalies and ENSO events have been obtained. Observed negative impacts onsensitive systems such as permafrost, water resources and spread of vector bornediseases will be exacerbated by climate change.
Certainly, the extremes of the Southern Oscillation (SO) are in part responsiblefor large portions of climate variability at inter-annual scales in Latin America.
Dry anomalous conditions affect the Amazon region of Brazil northward to theCaribbean through the latter half of the year. In particular, deficient rainy seasons havebeen observed during ENSO years in northern Amazonia and northeast Brazil.Droughts that led to forest fires were detected during the very strong ENSO events of1911/12, 1925/26, 1982/83 and recently in 1997/98, and these were years withextreme drought in Northeast Brazil also. In contrast, in southern Brazil the signal ofENSO is the opposite to that in northeast Brazil and northern Amazonia, withpositive, and sometimes extremely large, anomalies of rainfall during the rainy seasonof ENSO years, while drought can occur during the positive Southern Oscillationphase, referred as La Niña. Data for the eastern Pacific region indicate that the numberof strong hurricanes in the region has been increasing since 1973. Such changes mayrepresent a major environmental and economic threat for countries such as Mexicoand others in Central America. In the Caribbean, it is not yet clear whether there isany tendency in the number and intensity of hurricanes. However, it is known thatthe number of hurricanes affecting Central America increases during La Niña years.Hurricanes Gilbert in 1988 and Mitch in 1998 are clear examples of this effect.
The African continent is particularly vulnerable to the impacts of climatechange because of the factors of widespread poverty, recurrent droughts, inequitableland distribution, and over dependence on rain-fed agriculture. Although adaptationoptions, including traditional coping strategies, are available theoretically, in
1.3THE IMPACTS OF 20TH-
CENTURY CLIMATE CHANGE
10 MANAGEMENT STRATEGIES IN AGRICULTURE AND FORESTRY FOR MITIGATION OF GREENHOUSE GAS EMISSIONS AND
ADAPTATION TO CLIMATE VARIABILITY AND CLIMATE CHANGE
practice, the human, infrastructural and economic response capacity to effect timelyresponse actions may well be beyond the economic means of some countries.
Previous sections have discussed mainly the IPCC Working Group I (Science)findings. Working Group II notes that recent regional climate changes, particularlytemperature increases, have already affected many physical and biological systems.Emerging evidence that recent increases in floods and droughts in some areas haveaffected some social and economic systems is documented, with the rider thatrelative impacts of climatic and socio-economic factors (such as population shiftsand land-use changes) are difficult to quantify.
Experiments have shown that the relative enhancement of productivity caused byelevated carbon dioxide is usually greater when temperature rises, but may be lessat above optimal temperatures. Although the beneficial effects of elevated carbondioxide on the yield of crops are well established for the experimental conditionstested, this knowledge is incomplete both for a number of tropical crop species andfor crops grown under sub-optimal conditions (low nutrients, weeds, pests anddiseases). In experimental work, grain and forage quality declines with carbondioxide enrichment and higher temperatures.
Experimental evidence suggests the relative enhancement of productivity byelevated carbon dioxide is usually greater under drought conditions than in wet soil.Nevertheless, a climate change-induced reduction in summer soil moisture, whichmay occur even in some cases of increased summer precipitation, would havedetrimental effects on some of the major crops especially in drought prone regions.
Soil properties and processes including organic matter decomposition, leachingand soil water regimes will be influenced by a temperature increase. Soil erosion anddegradation are likely to aggravate the detrimental effects of a rise in air temperatureon crop yields. Climate change may increase erosion in some regions both throughheavy rainfall and through increased wind speed.
Model simulations of wheat growth indicate that a greater variation oftemperature (change in the frequency of extremes) under a changing climatereduced the average grain yield. Moreover, recent research emphasises theimportance of understanding how variability interacts with changes in climatemeans in determining yields.
Crop modelling studies comparing equilibrium with transient scenarios ofclimate change report significant yield differences. The few studies that includecomparable transient and equilibrium climate change scenarios generally reportgreater yield loss with equilibrium climate change than with the equivalent transientclimate change. However, these few studies are plagued with problems ofinconsistency in methodologies which make the comparisons speculative.
Prospects for the adaptation of plant material to increased air temperature,through traditional breeding and genetic modification, appear promising (establishedbut incomplete). More research on the possible adaptation of crop species to elevatedcarbon dioxide is needed before more certain results can be presented. Simulationswithout adaptation suggest more consistent yield losses from climate change in thetropical latitudes than the temperate latitudes. Agronomic adaptation abates extremeyield losses at all latitudes, but yields tend to remain beneath baseline levels afteradaptation more consistently in the tropics than temperate latitudes.
The ability of livestock producers to adapt their herds to the physiological stressof climate change is inconclusive, in part because of the general lack ofexperimentation and simulations of livestock adaptation to climate change. Cropand livestock farmers who have sufficient access to capital and technologies areexpected to adapt their fanning systems to climate change. Substantial shifts in theirmix of crops and livestock production may be necessary. However, considerable costscould be involved in this process, in learning and gaining experience with differentcrops or if irrigation becomes necessary. In some cases, a lack of water due to climatechange might mean that increased irrigation demands could not be met. However,
1.4.1AGRICULTURE AND RANGELANDS
1.4FUTURE IMPACTS ON
AGRICULTURE ANDFORESTRY
CHAPTER 1—THE RECENT IPCC ASSESSMENT OF CLIMATE CHANGE AND REGIONS MOST VULNERABLE 11
TO PROJECTED CLIMATE CHANGE

although speculative due to lack of research, it is intuitive that the costs ofadaptation should depend critically on the rate of climate change.
The effectiveness of adaptation in ameliorating the economic impacts ofclimate change across regions will depend critically on regional resourceendowments. It appears that developed countries will fare better in adapting toclimate change while developing countries and countries in transition, especially inthe tropics and subtropics, will fare worse. This finding has particularly significantimplications for the distribution of impacts within developing countries, as well asbetween the more and less developed countries. These findings provide evidence tosupport the hypothesis advanced in the SAR that climate change is likely to have itsgreatest adverse impacts on areas where resource endowments are the poorest andthe ability of planners to respond and adapt is most limited.
Degradation of soil and water resources are two major future challenges forglobal agriculture. These processes are likely to be intensified by adverse changes intemperature and precipitation. Land use and management have been shown to havea greater impact on soil conditions than the direct effects of climate change, thusadaptation has the potential to significantly mitigate these impacts. A criticalresearch need is to assess whether resource degradation will significantly increasethe risks faced by vulnerable agricultural and rural populations.
Most rangelands in the world have been affected by human activity and manyare degraded in some way. Many of the world’s rangelands are affected by ENSOevents and are sensitive to the frequency of these events, resulting in changes in theproductivity of these systems.
From observations and modelling studies, the effects of elevated carbon dioxideand climate change could result in increased plant productivity and thus an increasein soil carbon sequestration in many rangelands. However, some of the gains inproductivity would be offset by increases in temperatures and human managementactivities. Modelling studies and observations suggest that plant production, speciesdistribution, disturbance regimes (e.g. frequencies of fires, insect/pest outbreaks),grassland boundaries and non-intensive animal production would be affected bypotential changes in climate and land use. The impacts of climate change are likelyto be minor compared with land degradation.
In many parts of the world dominated by rangelands, the lack of infrastructureand investment in resource management limits the available options for adaptationand also makes these areas more sensitive and vulnerable to the impacts of climatechange (high confidence). Some adaptation options (e.g. integrated landmanagement) could be implemented irrespective of technology and infrastructure.Other adaptation options could be implemented through active involvement ofcommunities in the management of rangelands.
The loss in forest cover appears to have slowed down in recent years compared with1980 to 1995. However, fragmentation, non-sustainable logging of mature forests,degradation, and development of infrastructure – all leading to losses of biomass –have occurred over significant areas in developing and developed countries. Pressurefrom disturbances such as fires appears to be increasing around the world. Firesuppression in temperate managed and unmanaged forests with access toinfrastructure and human capital has been largely successful, while regions withcomparatively less infrastructure have been more susceptible to natural and humancaused fires. Deforestation will continue to be the dominant factor influencing land-use change in tropical regions. Timber harvests near roads and mills in tropicalregions are likely to continue to fragment and damage natural forests.
The response to climate change and other pressures will alter future carbonstorage in forests, but the global extent and direction of the change is unknown.Recent experimental evidence suggests that the net balance between net primaryproductivity (NPP, usually assumed to increase with warming, but challenged byrecent studies), heterotrophic respiration (often assumed to increase with warming,but also challenged by recent studies) and disturbance releases (often ignored but
1.4.2FORESTS
12 MANAGEMENT STRATEGIES IN AGRICULTURE AND FORESTRY FOR MITIGATION OF GREENHOUSE GAS EMISSIONS AND
ADAPTATION TO CLIMATE VARIABILITY AND CLIMATE CHANGE
shown to be important in boreal estimates of net biome productivity) is no longer asclear as was stated in the SAR.
Research reported since the SAR confirms the view that the largest and earliestimpacts induced by climate change are likely to occur in boreal forests wherechanges in weather-related disturbance regimes and nutrient cycling are primarycontrols on productivity (high confidence). The effect of these changes on NPP andcarbon storage is uncertain. Since the SAR, free-air carbon dioxide enrichment(FACE) experiments suggest that tree growth rates may increase, litter fall and fineroot development may increase and total NPP may increase. However, these effectsare expected to saturate because forest stands tend towards maximum carryingcapacity and plants may become acclimated to increased carbon dioxide levels.
Longer-term experiments on tree species grown under elevated carbon dioxidein open-top chambers under field conditions over several growing seasons haveprovided a number of results. These include continued and consistent stimulation ofphotosynthesis, little evidence of long-term loss of sensitivity to carbon dioxide, ahighly variable relative effect on above ground dry mass – greater than indicated byseedling studies – and an annual increase in wood mass per unit of leaf area. Theseresults contradict some of the FACE experiment results.
Contrary to the SAR, global timber market studies that include adaptationsuggest that climate change will increase the global timber supply and enhanceexisting market trends towards a rising market share of developing countries.Consumers are likely to benefit from lower timber prices while producers may gain orlose depending on regional changes in timber productivity and potential diebackeffects. Studies that do not consider global market forces, timber prices oradaptation, predict that supply in boreal regions could decline. Industrial timberharvests are predicted to increase 1–2 per cent per year. The area of industrial timberplantations is likely to continue expanding and management in second growthforests in temperate regions is likely to continue to intensify, thus taking pressureoff natural forests for harvests (high confidence).
Africa is highly vulnerable to climate change, which will worsen food security,mainly through increased extremes and shifts in rainbearing systems. This continentalready experiences a major deficit in food production in many areas. Potentialdeclines in soil moisture will add further stress. Inland and marine fisheries providea significant contribution to food; but water stress and land degradation will meaninland fisheries will be more vulnerable to episodic droughts. Rising sea level willalso cause salinisation and inundation in low-lying areas. The Nile Delta will beparticularly affected.
Food security is also of great importance to Asia. Crop production and aquaculturewill be threatened by increasing temperature, water stresses, sea level rise, increasedflooding and strong winds associated with intense tropical cyclones. Areas in mid-and high latitudes are expected to experience increases in crop yields. However, yieldsin lower latitudes are likely to decrease. A longer summer season will lead to anorthward shift of agriculture in boreal Asia and favour increases in agriculturalproductivity. Changes will also affect crop scheduling, as well as the duration of thegrowing period of crops. In China, yields of major crops are expected to decline.Acute water shortages there, combined with increased thermal stress should adverselyaffect wheat. In India rice production will be adversely affected by heat stress. Cropdiseases such as wheat scab, rice blast and sheath and culm blight of rice could alsobecome more widespread as Asian climates become warmer and wetter. Again, risingsea levels will cause local inundation. Coupled with flooding, the delta areas of themajor rivers of Bangladesh/India (Ganges) and China are most vulnerable.
Asia dominates world aquaculture, producing 80 per cent of all farmed fish,shrimp and shellfish. Many wild stocks are over exploited. Effective conservationand sustainable management of marine and inland fisheries are required at thenational and regional level so that aquatic productivity can increase.
1.4.3.2Asia
1.4.3REGIONAL IMPACTS
1.4.3.1Africa
CHAPTER 1—THE RECENT IPCC ASSESSMENT OF CLIMATE CHANGE AND REGIONS MOST VULNERABLE 13
TO PROJECTED CLIMATE CHANGE
Agricultural yields for most crops will increase as a result of increasing atmosphericcarbon dioxide concentration. This increase in yields will be counteracted by theincrease in soil moisture deficits in southern and eastern Europe and by theshortening of the duration of the growing season for many grain crops because ofincreased temperature. Overall, northern Europe is likely to experience positiveeffects, whereas some agricultural production systems in southern Europe may bethreatened. There will be changes in fisheries and aquaculture production as climatechanges, with faunal shifts that affect freshwater and marine fish and shellfishbiodiversity. These changes will be aggravated by the current unsustainableexploitation of fisheries.
Crop models from many countries in this region project decreased yields for maize,wheat barley and grapes even with the direct effects of carbon dioxide fertilisation.Predicted increases in temperature will reduce crop yields in the region byshortening the crop growing cycle.
Global warming is also likely to reduce silvicultural yields because lack of wateroften limits dry season growth. The dry season is expected to become longer andmore intense in many parts of this region.
Small to moderate climate change will not impair food and fibre production in NorthAmerica. There will be strong regional effects, with some areas suffering significantloss of comparative advantage to other regions. There is potential for increaseddrought in the Great Plains/Canadian Prairies and opportunities for a limitednorthward shift in production areas in Canada. Increased production from directincreases in atmospheric carbon dioxide concentration is projected to offset losses.
However, climate change is expected to increase the areal extent andproductivity of forests over the next 50–100 years. Extremes of long-term climatechange scenarios indicate the possibility of widespread forest decline.
Agricultural activities are particularly vulnerable to regional reductions in rainfall insouthwest and inland Australia. Drought frequency and consequent stresses onagriculture are likely to increase in parts of Australia and New Zealand as a result ofhigher temperatures and changes in ENSO. Carbon dioxide fertilisation mayprovide some initial benefits, although this will be offset once warming in excess of2–4°C occurs with associated rainfall changes.
Arable farming, especially on low islands and coral atolls, is concentrated near the“coast”. Changes in watertable heights and salinisation will be stressful to staplecrops such as taro. Although fishing is small scale, it is important to locallivelihoods. Many breeding grounds and habitats for fish and shellfish – such asmangroves, coral reefs, seagrass beds and salt ponds – will face increased disruptionas sea levels rise and climate changes. Many low islands and coral atolls are expectedto become uninhabitable as sea levels rise.
Developing countries are at a greater risk of adverse impacts from climate changecompared with developed countries. Increased warming is going to affect most regionspredominantly negatively, with some developing countries being more severelyimpacted than developed ones. Climate change is also expected to reduce availablewater in many water stressed areas of the world such as central Asia, southern Africaand European and African countries around the Mediterranean. Agricultural impactson Africa, Asia and Latin America are shown in Table 1.2, with more informationfrom selected country or continental scale studies in Figure 1.11. Note that there areuncertainties and ranges of climate responses from the climate scenarios, which givethe range of total change in agricultural production.
Cereal crop yields are projected to decline in most tropical and subtropicalregions, relative to yields projected for the current climate. Less severe effects and
1.5REGIONS MOST
VULNERABLE TO CURRENTAND PROJECTED CLIMATE
CHANGE
1.4.3.7Small Island States
1.4.3.6Australia and New Zealand
1.4.3.5North America
1.4.3.4Latin America
1.4.3.3Europe
14 MANAGEMENT STRATEGIES IN AGRICULTURE AND FORESTRY FOR MITIGATION OF GREENHOUSE GAS EMISSIONS AND
ADAPTATION TO CLIMATE VARIABILITY AND CLIMATE CHANGE
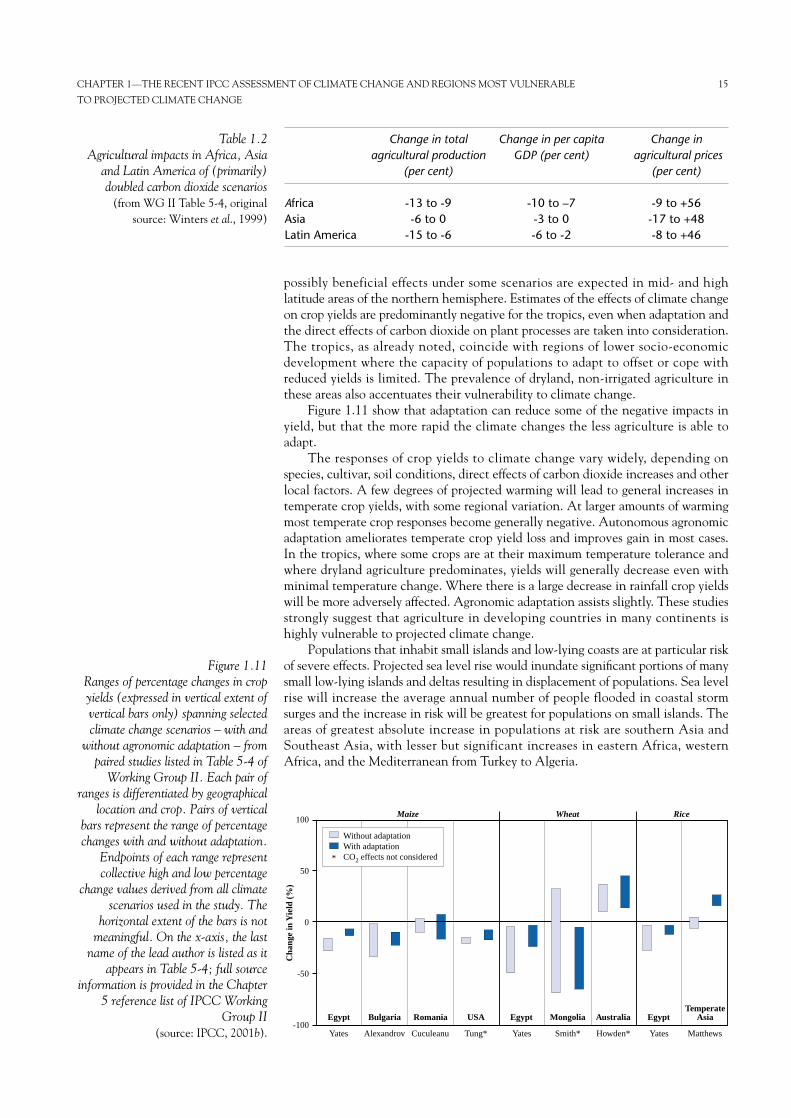
possibly beneficial effects under some scenarios are expected in mid- and highlatitude areas of the northern hemisphere. Estimates of the effects of climate changeon crop yields are predominantly negative for the tropics, even when adaptation andthe direct effects of carbon dioxide on plant processes are taken into consideration.The tropics, as already noted, coincide with regions of lower socio-economicdevelopment where the capacity of populations to adapt to offset or cope withreduced yields is limited. The prevalence of dryland, non-irrigated agriculture inthese areas also accentuates their vulnerability to climate change.
Figure 1.11 show that adaptation can reduce some of the negative impacts inyield, but that the more rapid the climate changes the less agriculture is able toadapt.
The responses of crop yields to climate change vary widely, depending onspecies, cultivar, soil conditions, direct effects of carbon dioxide increases and otherlocal factors. A few degrees of projected warming will lead to general increases intemperate crop yields, with some regional variation. At larger amounts of warmingmost temperate crop responses become generally negative. Autonomous agronomicadaptation ameliorates temperate crop yield loss and improves gain in most cases.In the tropics, where some crops are at their maximum temperature tolerance andwhere dryland agriculture predominates, yields will generally decrease even withminimal temperature change. Where there is a large decrease in rainfall crop yieldswill be more adversely affected. Agronomic adaptation assists slightly. These studiesstrongly suggest that agriculture in developing countries in many continents ishighly vulnerable to projected climate change.
Populations that inhabit small islands and low-lying coasts are at particular riskof severe effects. Projected sea level rise would inundate significant portions of manysmall low-lying islands and deltas resulting in displacement of populations. Sea levelrise will increase the average annual number of people flooded in coastal stormsurges and the increase in risk will be greatest for populations on small islands. Theareas of greatest absolute increase in populations at risk are southern Asia andSoutheast Asia, with lesser but significant increases in eastern Africa, westernAfrica, and the Mediterranean from Turkey to Algeria.
CHAPTER 1—THE RECENT IPCC ASSESSMENT OF CLIMATE CHANGE AND REGIONS MOST VULNERABLE 15
TO PROJECTED CLIMATE CHANGE
Change in total Change in per capita Change inagricultural production GDP (per cent) agricultural prices
(per cent) (per cent)
Africa -13 to -9 -10 to –7 -9 to +56Asia -6 to 0 -3 to 0 -17 to +48Latin America -15 to -6 -6 to -2 -8 to +46
Table 1.2Agricultural impacts in Africa, Asia
and Latin America of (primarily)doubled carbon dioxide scenarios
(from WG II Table 5-4, original source: Winters et al., 1999)
Cha
nge
in Y
ield
(%
)
100
50
0
-50
-100
Maize Wheat Rice
Without adaptationWith adaptationCO2 effects not considered*
Egypt Bulgaria Romania USA Egypt Mongolia Australia EgyptTemperate
Asia
Yates Alexandrov Cuculeanu Tung* Yates Smith* Howden* Yates Matthews
Figure 1.11Ranges of percentage changes in cropyields (expressed in vertical extent ofvertical bars only) spanning selectedclimate change scenarios – with and
without agronomic adaptation – frompaired studies listed in Table 5-4 of
Working Group II. Each pair ofranges is differentiated by geographical
location and crop. Pairs of verticalbars represent the range of percentagechanges with and without adaptation.
Endpoints of each range representcollective high and low percentage
change values derived from all climatescenarios used in the study. The
horizontal extent of the bars is notmeaningful. On the x-axis, the last
name of the lead author is listed as itappears in Table 5-4; full source
information is provided in the Chapter5 reference list of IPCC Working
Group II (source: IPCC, 2001b).
CHAPTER 2
THE IMPACT OF CLIMATE CHANGE ON GREENHOUSEGAS EMISSIONS FROM AGRICULTURE AND FORESTRY (by Yanxia Zhao)
The report of Working Group I of the IPCC, Climate Change 2001 concludes thatglobally averaged surface temperature has increased by 0.6+0.2°C over the 20thcentury; and that, for the range of scenarios developed in the IPCC Special Reporton Emission Scenarios (SRES), the globally averaged surface air temperature isprojected, by models, to warm 1.4 to 5.8°C by 2100 relative to 1900.
Carbon dioxide is responsible for most of the temperature increase. Since theIndustrial Revolution, the equilibrium of atmospheric carbon has been altered.Atmospheric concentrations of carbon dioxide have risen about 28 per cent (IPCC,1996), principally because of fossil fuel combustion. Changes in land use and forestrypractices can also emit carbon dioxide (e.g., through conversion of forest land toagricultural or urban use) or act as a sink for carbon dioxide (e.g., through netadditions to forest biomass).
Methane and nitrous oxide are two of the most important greenhouse gases inthe atmosphere after water vapour and carbon dioxide. The overall contributions ofmethane and nitrous oxide to global warming are significant because they have beenestimated to be 21 and 310 times respectively more effective at trapping heat in theatmosphere than carbon dioxide. During the last 150 years, methane concentrationshave increased from about 700 to 1750 ppbv and nitrous oxide from 270 to 316ppbv. Their annual rates of increase over the period 1990 to 1999 are 0.4 per cent formethane and 0.25 per cent for nitrous oxide (IPCC, 2001).
Agricultural activities contribute directly to emissions of methane and nitrousoxide through a variety of processes including the following source categories:enteric fermentation in domestic livestock, livestock manure management, ricecultivation, agricultural soil management and agricultural residue burning.
It can be estimated that the anthropogenic methane and nitrous oxide emissionsglobally are 373 Tg CH4/a and 3.4 Tg N/a respectively, agriculture accounting for about205 Tg CH4/a and 2.1Tg N/a, i.e. accounting for 55 per cent and 62 per cent. Fromtables 2.1 and 2.2 (see page 18), it can be seen that in most countries, the emissions ofmethane and nitrous oxide from agriculture are more than half the respective totals.
Table 2.3 presents emission estimates for USA agriculture from 1990 to 1999. Methaneemissions from enteric fermentation and manure management represent about 74 percent and 20 per cent of total methane emissions from agriculture. Rice cultivation andagricultural crop residue burning were minor sources. Agricultural soil managementactivities were the largest sources of nitrous oxide emissions, accounting for about 94 percent. Between 1990 and 1999, methane emissions from agricultural activities increasedby 4.7 per cent while nitrous oxide emissions increased by 10.7 per cent. Unlike theUSA, in some Asian countries (Table 2.4, see page 18), such as Bangladesh, China,Indonesia, Philippines and Thailand, rice cultivation was the largest source of methane– due to their large areas under cultivation. The second largest source was entericfermentation. But for India and Pakistan, emissions from enteric fermentation were morethan that from rice cultivation. In Asian countries, as for the USA, agricultural soil wasthe largest source of nitrous oxide emissions.
Methane is produced as part of normal digestive processes in animals. Amongdomesticated animal types, ruminant animals (e.g., cattle, buffalo, sheep, goats andcamels) are the major emitters of methane because of their unique digestive system.Ruminants possess a rumen, or large “fore-stomach”, in which microbial fermentation
2.2.1ENTERIC FERMENTATION
2.2.1.1Production mechanisms
2.2PRODUCTION MECHANISMS,
INFLUENCING FACTORSAND EMISSION
CONTRIBUTIONS OF THEDIFFERENT AGRICULTURAL
SOURCE CATEGORIES
2.1.1AGRICULTURAL CONTRIBUTIONS TO
ANTHROPOGENIC EMISSIONS OF
METHANE AND NITROUS OXIDE
2.1INTRODUCTION
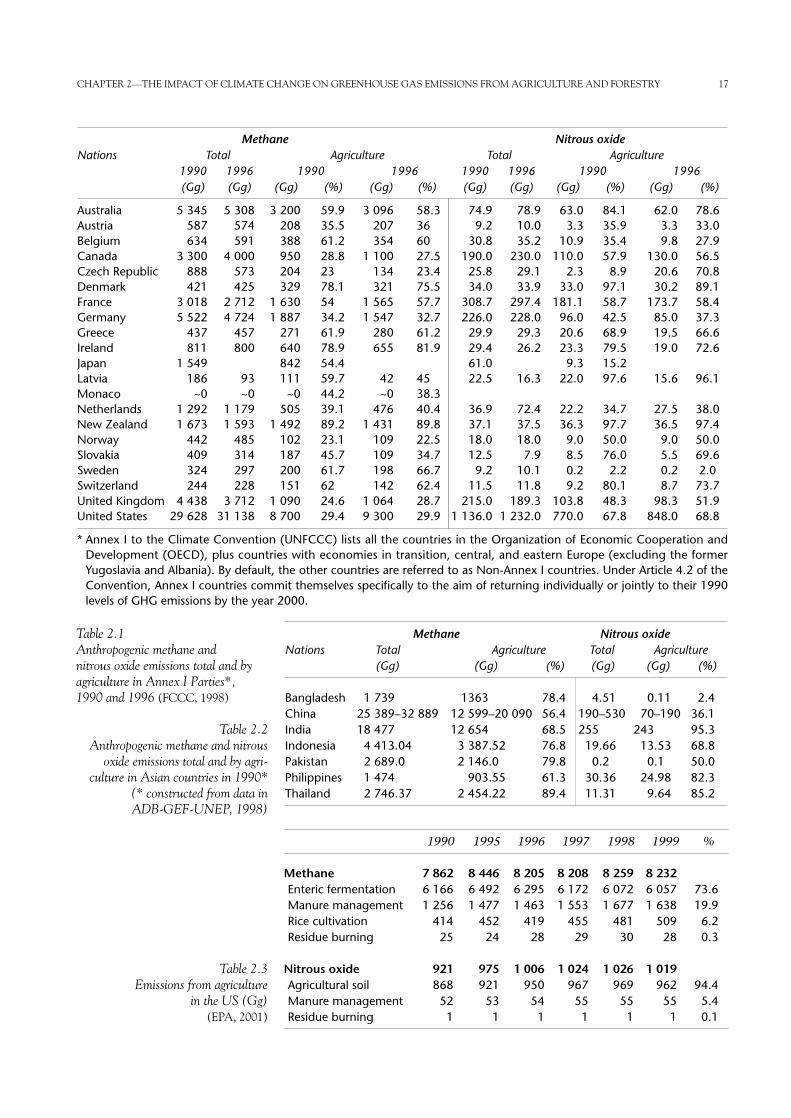
CHAPTER 2—THE IMPACT OF CLIMATE CHANGE ON GREENHOUSE GAS EMISSIONS FROM AGRICULTURE AND FORESTRY 17
Methane Nitrous oxideNations Total Agriculture Total Agriculture
1990 1996 1990 1996 1990 1996 1990 1996 (Gg) (Gg) (Gg) (%) (Gg) (%) (Gg) (Gg) (Gg) (%) (Gg) (%)
Australia 5 345 5 308 3 200 59.9 3 096 58.3 74.9 78.9 63.0 84.1 62.0 78.6Austria 587 574 208 35.5 207 36 9.2 10.0 3.3 35.9 3.3 33.0Belgium 634 591 388 61.2 354 60 30.8 35.2 10.9 35.4 9.8 27.9Canada 3 300 4 000 950 28.8 1 100 27.5 190.0 230.0 110.0 57.9 130.0 56.5Czech Republic 888 573 204 23 134 23.4 25.8 29.1 2.3 8.9 20.6 70.8Denmark 421 425 329 78.1 321 75.5 34.0 33.9 33.0 97.1 30.2 89.1France 3 018 2 712 1 630 54 1 565 57.7 308.7 297.4 181.1 58.7 173.7 58.4Germany 5 522 4 724 1 887 34.2 1 547 32.7 226.0 228.0 96.0 42.5 85.0 37.3Greece 437 457 271 61.9 280 61.2 29.9 29.3 20.6 68.9 19.5 66.6Ireland 811 800 640 78.9 655 81.9 29.4 26.2 23.3 79.5 19.0 72.6Japan 1 549 842 54.4 61.0 9.3 15.2Latvia 186 93 111 59.7 42 45 22.5 16.3 22.0 97.6 15.6 96.1Monaco ~0 ~0 ~0 44.2 ~0 38.3Netherlands 1 292 1 179 505 39.1 476 40.4 36.9 72.4 22.2 34.7 27.5 38.0New Zealand 1 673 1 593 1 492 89.2 1 431 89.8 37.1 37.5 36.3 97.7 36.5 97.4Norway 442 485 102 23.1 109 22.5 18.0 18.0 9.0 50.0 9.0 50.0Slovakia 409 314 187 45.7 109 34.7 12.5 7.9 8.5 76.0 5.5 69.6Sweden 324 297 200 61.7 198 66.7 9.2 10.1 0.2 2.2 0.2 2.0Switzerland 244 228 151 62 142 62.4 11.5 11.8 9.2 80.1 8.7 73.7United Kingdom 4 438 3 712 1 090 24.6 1 064 28.7 215.0 189.3 103.8 48.3 98.3 51.9United States 29 628 31 138 8 700 29.4 9 300 29.9 1 136.0 1 232.0 770.0 67.8 848.0 68.8
* Annex I to the Climate Convention (UNFCCC) lists all the countries in the Organization of Economic Cooperation andDevelopment (OECD), plus countries with economies in transition, central, and eastern Europe (excluding the formerYugoslavia and Albania). By default, the other countries are referred to as Non-Annex I countries. Under Article 4.2 of theConvention, Annex I countries commit themselves specifically to the aim of returning individually or jointly to their 1990levels of GHG emissions by the year 2000.
Methane Nitrous oxideNations Total Agriculture Total Agriculture
(Gg) (Gg) (%) (Gg) (Gg) (%)
Bangladesh 1 739 1363 78.4 4.51 0.11 2.4China 25 389–32 889 12 599–20 090 56.4 190–530 70–190 36.1India 18 477 12 654 68.5 255 243 95.3Indonesia 4 413.04 3 387.52 76.8 19.66 13.53 68.8Pakistan 2 689.0 2 146.0 79.8 0.2 0.1 50.0Philippines 1 474 903.55 61.3 30.36 24.98 82.3Thailand 2 746.37 2 454.22 89.4 11.31 9.64 85.2
Table 2.1 Anthropogenic methane and nitrous oxide emissions total and byagriculture in Annex I Parties*, 1990 and 1996 (FCCC, 1998)
Table 2.2 Anthropogenic methane and nitrous
oxide emissions total and by agri-culture in Asian countries in 1990*
(* constructed from data in ADB-GEF-UNEP, 1998)
1990 1995 1996 1997 1998 1999 %
Methane 7 862 8 446 8 205 8 208 8 259 8 232Enteric fermentation 6 166 6 492 6 295 6 172 6 072 6 057 73.6Manure management 1 256 1 477 1 463 1 553 1 677 1 638 19.9Rice cultivation 414 452 419 455 481 509 6.2Residue burning 25 24 28 29 30 28 0.3
Nitrous oxide 921 975 1 006 1 024 1 026 1 019Agricultural soil 868 921 950 967 969 962 94.4Manure management 52 53 54 55 55 55 5.4Residue burning 1 1 1 1 1 1 0.1
Table 2.3 Emissions from agriculture
in the US (Gg) (EPA, 2001)
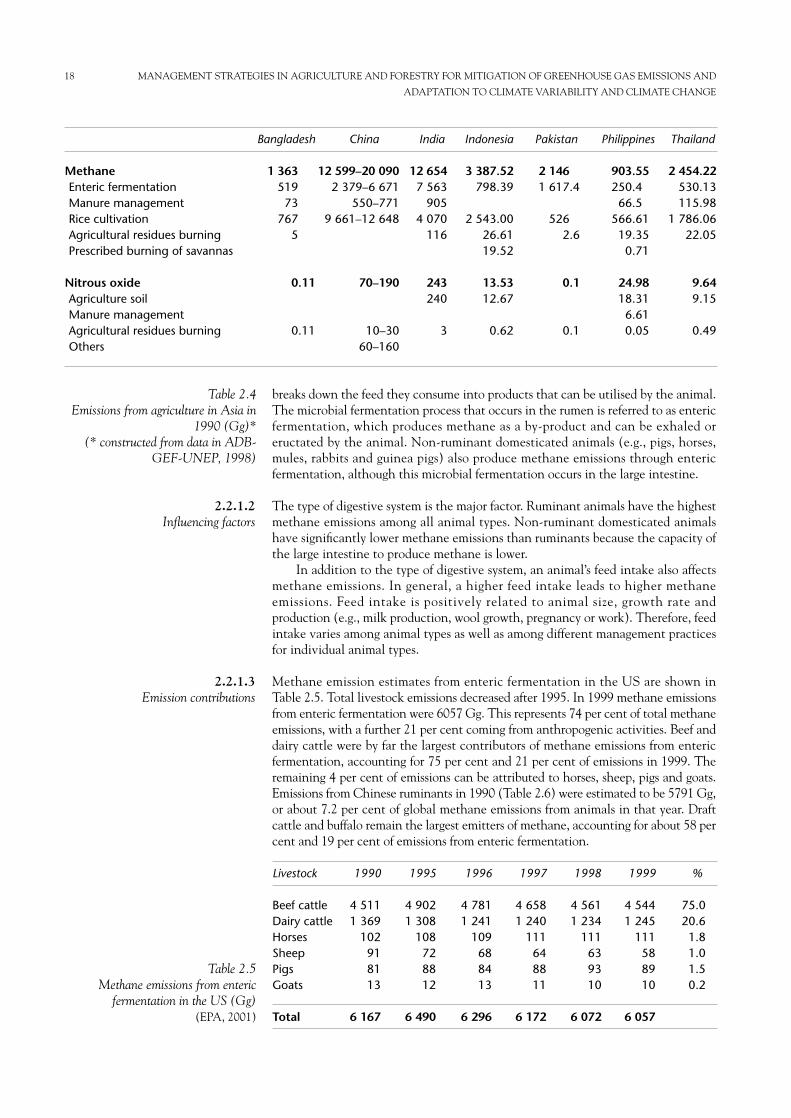
breaks down the feed they consume into products that can be utilised by the animal.The microbial fermentation process that occurs in the rumen is referred to as entericfermentation, which produces methane as a by-product and can be exhaled oreructated by the animal. Non-ruminant domesticated animals (e.g., pigs, horses,mules, rabbits and guinea pigs) also produce methane emissions through entericfermentation, although this microbial fermentation occurs in the large intestine.
The type of digestive system is the major factor. Ruminant animals have the highestmethane emissions among all animal types. Non-ruminant domesticated animalshave significantly lower methane emissions than ruminants because the capacity ofthe large intestine to produce methane is lower.
In addition to the type of digestive system, an animal’s feed intake also affectsmethane emissions. In general, a higher feed intake leads to higher methaneemissions. Feed intake is positively related to animal size, growth rate andproduction (e.g., milk production, wool growth, pregnancy or work). Therefore, feedintake varies among animal types as well as among different management practicesfor individual animal types.
Methane emission estimates from enteric fermentation in the US are shown inTable 2.5. Total livestock emissions decreased after 1995. In 1999 methane emissionsfrom enteric fermentation were 6057 Gg. This represents 74 per cent of total methaneemissions, with a further 21 per cent coming from anthropogenic activities. Beef anddairy cattle were by far the largest contributors of methane emissions from entericfermentation, accounting for 75 per cent and 21 per cent of emissions in 1999. Theremaining 4 per cent of emissions can be attributed to horses, sheep, pigs and goats.Emissions from Chinese ruminants in 1990 (Table 2.6) were estimated to be 5791 Gg,or about 7.2 per cent of global methane emissions from animals in that year. Draftcattle and buffalo remain the largest emitters of methane, accounting for about 58 percent and 19 per cent of emissions from enteric fermentation.
2.2.1.3Emission contributions
2.2.1.2Influencing factors
18 MANAGEMENT STRATEGIES IN AGRICULTURE AND FORESTRY FOR MITIGATION OF GREENHOUSE GAS EMISSIONS AND
ADAPTATION TO CLIMATE VARIABILITY AND CLIMATE CHANGE
Livestock 1990 1995 1996 1997 1998 1999 %
Beef cattle 4 511 4 902 4 781 4 658 4 561 4 544 75.0Dairy cattle 1 369 1 308 1 241 1 240 1 234 1 245 20.6Horses 102 108 109 111 111 111 1.8Sheep 91 72 68 64 63 58 1.0Pigs 81 88 84 88 93 89 1.5Goats 13 12 13 11 10 10 0.2
Total 6 167 6 490 6 296 6 172 6 072 6 057
Bangladesh China India Indonesia Pakistan Philippines Thailand
Methane 1 363 12 599–20 090 12 654 3 387.52 2 146 903.55 2 454.22Enteric fermentation 519 2 379–6 671 7 563 798.39 1 617.4 250.4 530.13Manure management 73 550–771 905 66.5 115.98Rice cultivation 767 9 661–12 648 4 070 2 543.00 526 566.61 1 786.06Agricultural residues burning 5 116 26.61 2.6 19.35 22.05Prescribed burning of savannas 19.52 0.71
Nitrous oxide 0.11 70–190 243 13.53 0.1 24.98 9.64Agriculture soil 240 12.67 18.31 9.15Manure management 6.61Agricultural residues burning 0.11 10–30 3 0.62 0.1 0.05 0.49Others 60–160
Table 2.4Emissions from agriculture in Asia in
1990 (Gg)*(* constructed from data in ADB-
GEF-UNEP, 1998)
Table 2.5Methane emissions from enteric
fermentation in the US (Gg) (EPA, 2001)
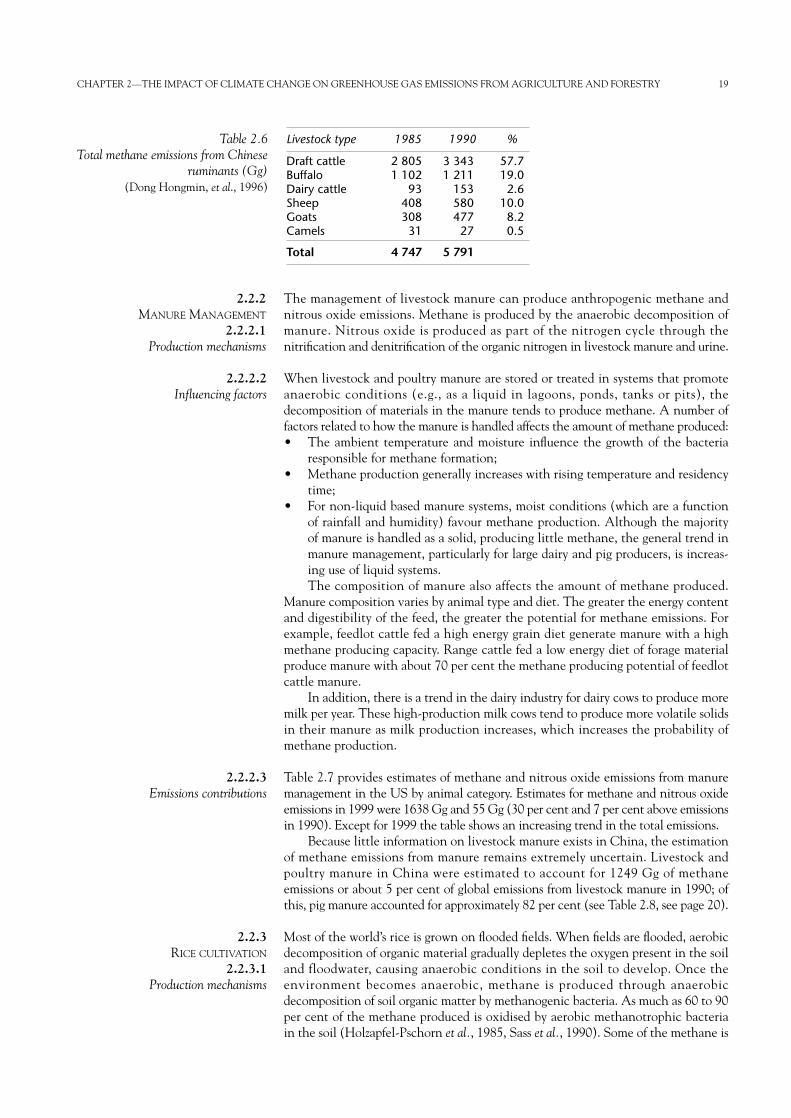
The management of livestock manure can produce anthropogenic methane andnitrous oxide emissions. Methane is produced by the anaerobic decomposition ofmanure. Nitrous oxide is produced as part of the nitrogen cycle through thenitrification and denitrification of the organic nitrogen in livestock manure and urine.
When livestock and poultry manure are stored or treated in systems that promoteanaerobic conditions (e.g., as a liquid in lagoons, ponds, tanks or pits), thedecomposition of materials in the manure tends to produce methane. A number offactors related to how the manure is handled affects the amount of methane produced:• The ambient temperature and moisture influence the growth of the bacteria
responsible for methane formation;• Methane production generally increases with rising temperature and residency
time;• For non-liquid based manure systems, moist conditions (which are a function
of rainfall and humidity) favour methane production. Although the majorityof manure is handled as a solid, producing little methane, the general trend inmanure management, particularly for large dairy and pig producers, is increas-ing use of liquid systems. The composition of manure also affects the amount of methane produced.
Manure composition varies by animal type and diet. The greater the energy contentand digestibility of the feed, the greater the potential for methane emissions. Forexample, feedlot cattle fed a high energy grain diet generate manure with a highmethane producing capacity. Range cattle fed a low energy diet of forage materialproduce manure with about 70 per cent the methane producing potential of feedlotcattle manure.
In addition, there is a trend in the dairy industry for dairy cows to produce moremilk per year. These high-production milk cows tend to produce more volatile solidsin their manure as milk production increases, which increases the probability ofmethane production.
Table 2.7 provides estimates of methane and nitrous oxide emissions from manuremanagement in the US by animal category. Estimates for methane and nitrous oxideemissions in 1999 were 1638 Gg and 55 Gg (30 per cent and 7 per cent above emissionsin 1990). Except for 1999 the table shows an increasing trend in the total emissions.
Because little information on livestock manure exists in China, the estimationof methane emissions from manure remains extremely uncertain. Livestock andpoultry manure in China were estimated to account for 1249 Gg of methaneemissions or about 5 per cent of global emissions from livestock manure in 1990; ofthis, pig manure accounted for approximately 82 per cent (see Table 2.8, see page 20).
Most of the world’s rice is grown on flooded fields. When fields are flooded, aerobicdecomposition of organic material gradually depletes the oxygen present in the soiland floodwater, causing anaerobic conditions in the soil to develop. Once theenvironment becomes anaerobic, methane is produced through anaerobicdecomposition of soil organic matter by methanogenic bacteria. As much as 60 to 90per cent of the methane produced is oxidised by aerobic methanotrophic bacteriain the soil (Holzapfel-Pschorn et al., 1985, Sass et al., 1990). Some of the methane is
2.2.3RICE CULTIVATION
2.2.3.1Production mechanisms
2.2.2.3Emissions contributions
2.2.2.2Influencing factors
2.2.2MANURE MANAGEMENT
2.2.2.1Production mechanisms
CHAPTER 2—THE IMPACT OF CLIMATE CHANGE ON GREENHOUSE GAS EMISSIONS FROM AGRICULTURE AND FORESTRY 19
Table 2.6Total methane emissions from Chinese
ruminants (Gg) (Dong Hongmin, et al., 1996)
Livestock type 1985 1990 %
Draft cattle 2 805 3 343 57.7Buffalo 1 102 1 211 19.0Dairy cattle 93 153 2.6Sheep 408 580 10.0Goats 308 477 8.2Camels 31 27 0.5
Total 4 747 5 791
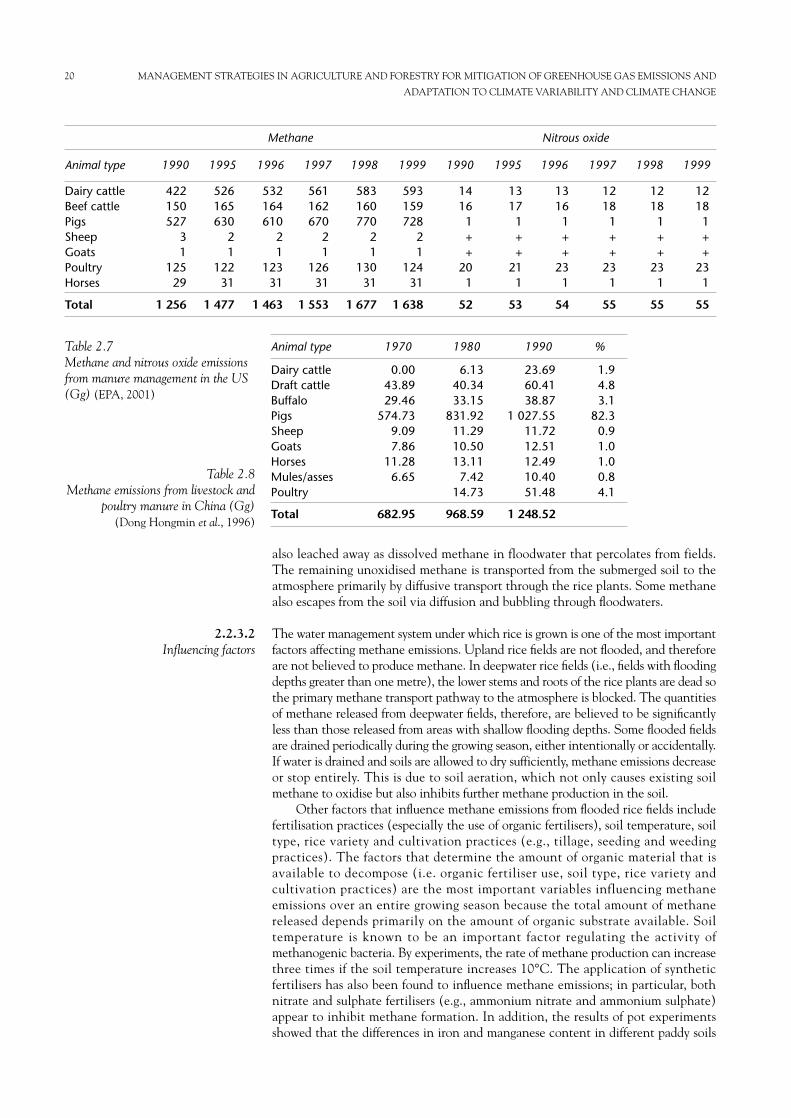
also leached away as dissolved methane in floodwater that percolates from fields.The remaining unoxidised methane is transported from the submerged soil to theatmosphere primarily by diffusive transport through the rice plants. Some methanealso escapes from the soil via diffusion and bubbling through floodwaters.
The water management system under which rice is grown is one of the most importantfactors affecting methane emissions. Upland rice fields are not flooded, and thereforeare not believed to produce methane. In deepwater rice fields (i.e., fields with floodingdepths greater than one metre), the lower stems and roots of the rice plants are dead sothe primary methane transport pathway to the atmosphere is blocked. The quantitiesof methane released from deepwater fields, therefore, are believed to be significantlyless than those released from areas with shallow flooding depths. Some flooded fieldsare drained periodically during the growing season, either intentionally or accidentally.If water is drained and soils are allowed to dry sufficiently, methane emissions decreaseor stop entirely. This is due to soil aeration, which not only causes existing soilmethane to oxidise but also inhibits further methane production in the soil.
Other factors that influence methane emissions from flooded rice fields includefertilisation practices (especially the use of organic fertilisers), soil temperature, soiltype, rice variety and cultivation practices (e.g., tillage, seeding and weedingpractices). The factors that determine the amount of organic material that isavailable to decompose (i.e. organic fertiliser use, soil type, rice variety andcultivation practices) are the most important variables influencing methaneemissions over an entire growing season because the total amount of methanereleased depends primarily on the amount of organic substrate available. Soiltemperature is known to be an important factor regulating the activity ofmethanogenic bacteria. By experiments, the rate of methane production can increasethree times if the soil temperature increases 10°C. The application of syntheticfertilisers has also been found to influence methane emissions; in particular, bothnitrate and sulphate fertilisers (e.g., ammonium nitrate and ammonium sulphate)appear to inhibit methane formation. In addition, the results of pot experimentsshowed that the differences in iron and manganese content in different paddy soils
2.2.3.2 Influencing factors
20 MANAGEMENT STRATEGIES IN AGRICULTURE AND FORESTRY FOR MITIGATION OF GREENHOUSE GAS EMISSIONS AND
ADAPTATION TO CLIMATE VARIABILITY AND CLIMATE CHANGE
Table 2.7Methane and nitrous oxide emissionsfrom manure management in the US(Gg) (EPA, 2001)
Animal type 1970 1980 1990 %
Dairy cattle 0.00 6.13 23.69 1.9Draft cattle 43.89 40.34 60.41 4.8Buffalo 29.46 33.15 38.87 3.1Pigs 574.73 831.92 1 027.55 82.3Sheep 9.09 11.29 11.72 0.9Goats 7.86 10.50 12.51 1.0Horses 11.28 13.11 12.49 1.0Mules/asses 6.65 7.42 10.40 0.8Poultry 14.73 51.48 4.1
Total 682.95 968.59 1 248.52
Methane Nitrous oxide
Animal type 1990 1995 1996 1997 1998 1999 1990 1995 1996 1997 1998 1999
Dairy cattle 422 526 532 561 583 593 14 13 13 12 12 12Beef cattle 150 165 164 162 160 159 16 17 16 18 18 18Pigs 527 630 610 670 770 728 1 1 1 1 1 1Sheep 3 2 2 2 2 2 + + + + + +Goats 1 1 1 1 1 1 + + + + + +Poultry 125 122 123 126 130 124 20 21 23 23 23 23Horses 29 31 31 31 31 31 1 1 1 1 1 1
Total 1 256 1 477 1 463 1 553 1 677 1 638 52 53 54 55 55 55
Table 2.8 Methane emissions from livestock and
poultry manure in China (Gg) (Dong Hongmin et al., 1996)
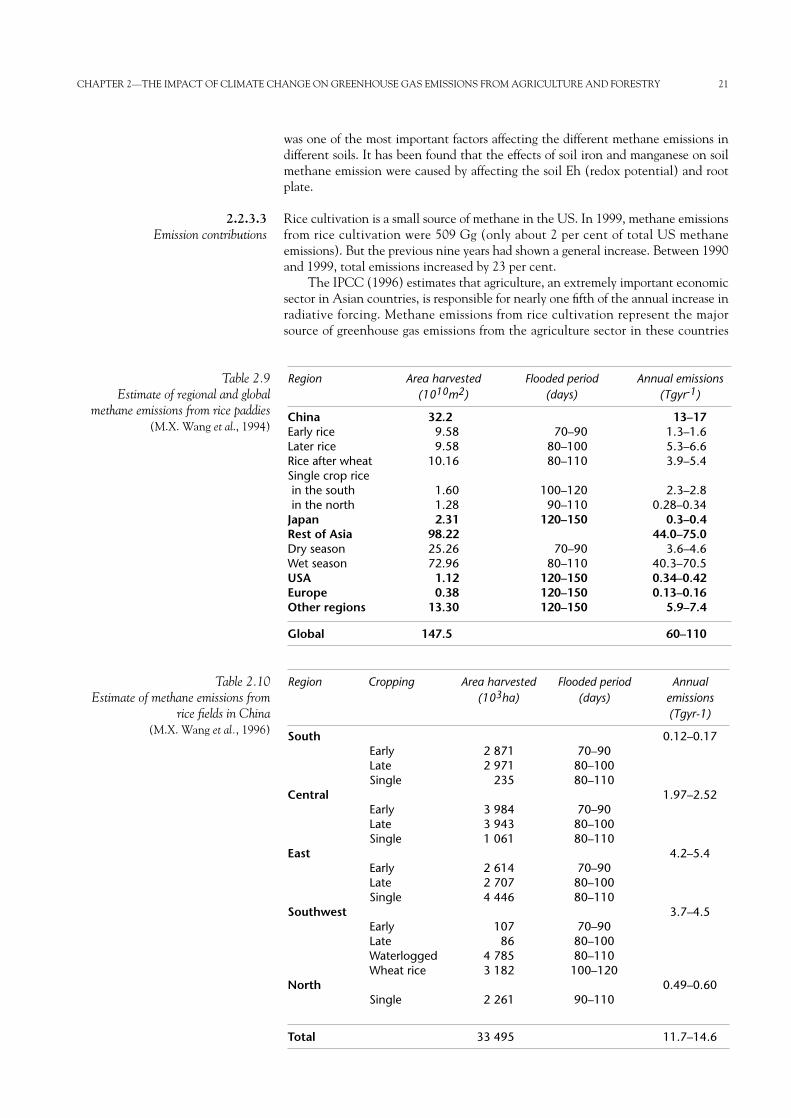
was one of the most important factors affecting the different methane emissions indifferent soils. It has been found that the effects of soil iron and manganese on soilmethane emission were caused by affecting the soil Eh (redox potential) and rootplate.
Rice cultivation is a small source of methane in the US. In 1999, methane emissionsfrom rice cultivation were 509 Gg (only about 2 per cent of total US methaneemissions). But the previous nine years had shown a general increase. Between 1990and 1999, total emissions increased by 23 per cent.
The IPCC (1996) estimates that agriculture, an extremely important economicsector in Asian countries, is responsible for nearly one fifth of the annual increase inradiative forcing. Methane emissions from rice cultivation represent the majorsource of greenhouse gas emissions from the agriculture sector in these countries
2.2.3.3Emission contributions
CHAPTER 2—THE IMPACT OF CLIMATE CHANGE ON GREENHOUSE GAS EMISSIONS FROM AGRICULTURE AND FORESTRY 21
Region Area harvested Flooded period Annual emissions(1010m2) (days) (Tgyr-1)
China 32.2 13–17Early rice 9.58 70–90 1.3–1.6Later rice 9.58 80–100 5.3–6.6Rice after wheat 10.16 80–110 3.9–5.4Single crop ricein the south 1.60 100–120 2.3–2.8in the north 1.28 90–110 0.28–0.34
Japan 2.31 120–150 0.3–0.4Rest of Asia 98.22 44.0–75.0Dry season 25.26 70–90 3.6–4.6Wet season 72.96 80–110 40.3–70.5USA 1.12 120–150 0.34–0.42Europe 0.38 120–150 0.13–0.16Other regions 13.30 120–150 5.9–7.4
Global 147.5 60–110
Table 2.9Estimate of regional and global
methane emissions from rice paddies (M.X. Wang et al., 1994)
Table 2.10Estimate of methane emissions from
rice fields in China (M.X. Wang et al., 1996)
Region Cropping Area harvested Flooded period Annual(103ha) (days) emissions
(Tgyr-1)
South 0.12–0.17Early 2 871 70–90Late 2 971 80–100Single 235 80–110
Central 1.97–2.52Early 3 984 70–90Late 3 943 80–100Single 1 061 80–110
East 4.2–5.4Early 2 614 70–90Late 2 707 80–100Single 4 446 80–110
Southwest 3.7–4.5Early 107 70–90Late 86 80–100Waterlogged 4 785 80–110Wheat rice 3 182 100–120
North 0.49–0.60Single 2 261 90–110
Total 33 495 11.7–14.6
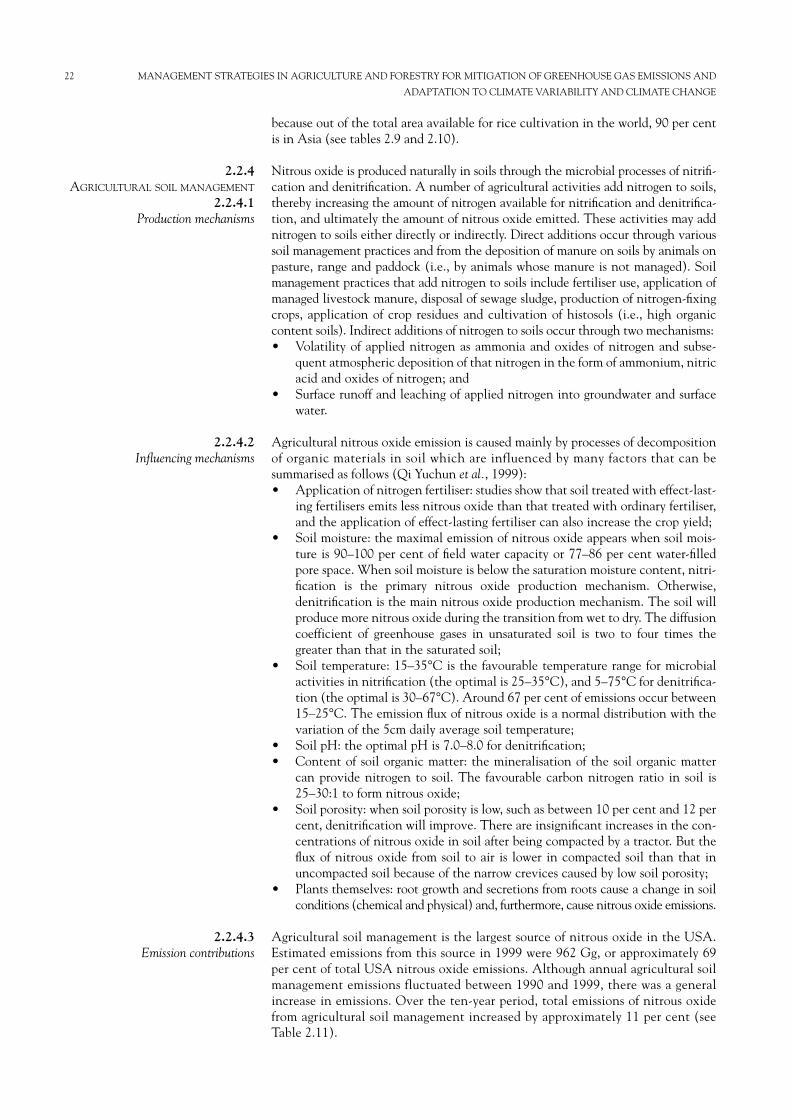
22 MANAGEMENT STRATEGIES IN AGRICULTURE AND FORESTRY FOR MITIGATION OF GREENHOUSE GAS EMISSIONS AND
ADAPTATION TO CLIMATE VARIABILITY AND CLIMATE CHANGE
because out of the total area available for rice cultivation in the world, 90 per centis in Asia (see tables 2.9 and 2.10).
Nitrous oxide is produced naturally in soils through the microbial processes of nitrifi-cation and denitrification. A number of agricultural activities add nitrogen to soils,thereby increasing the amount of nitrogen available for nitrification and denitrifica-tion, and ultimately the amount of nitrous oxide emitted. These activities may addnitrogen to soils either directly or indirectly. Direct additions occur through varioussoil management practices and from the deposition of manure on soils by animals onpasture, range and paddock (i.e., by animals whose manure is not managed). Soilmanagement practices that add nitrogen to soils include fertiliser use, application ofmanaged livestock manure, disposal of sewage sludge, production of nitrogen-fixingcrops, application of crop residues and cultivation of histosols (i.e., high organiccontent soils). Indirect additions of nitrogen to soils occur through two mechanisms:• Volatility of applied nitrogen as ammonia and oxides of nitrogen and subse-
quent atmospheric deposition of that nitrogen in the form of ammonium, nitricacid and oxides of nitrogen; and
• Surface runoff and leaching of applied nitrogen into groundwater and surfacewater.
Agricultural nitrous oxide emission is caused mainly by processes of decompositionof organic materials in soil which are influenced by many factors that can besummarised as follows (Qi Yuchun et al., 1999): • Application of nitrogen fertiliser: studies show that soil treated with effect-last-
ing fertilisers emits less nitrous oxide than that treated with ordinary fertiliser,and the application of effect-lasting fertiliser can also increase the crop yield;
• Soil moisture: the maximal emission of nitrous oxide appears when soil mois-ture is 90–100 per cent of field water capacity or 77–86 per cent water-filledpore space. When soil moisture is below the saturation moisture content, nitri-fication is the primary nitrous oxide production mechanism. Otherwise,denitrification is the main nitrous oxide production mechanism. The soil willproduce more nitrous oxide during the transition from wet to dry. The diffusioncoefficient of greenhouse gases in unsaturated soil is two to four times thegreater than that in the saturated soil;
• Soil temperature: 15–35°C is the favourable temperature range for microbialactivities in nitrification (the optimal is 25–35°C), and 5–75°C for denitrifica-tion (the optimal is 30–67°C). Around 67 per cent of emissions occur between15–25°C. The emission flux of nitrous oxide is a normal distribution with thevariation of the 5cm daily average soil temperature;
• Soil pH: the optimal pH is 7.0–8.0 for denitrification; • Content of soil organic matter: the mineralisation of the soil organic matter
can provide nitrogen to soil. The favourable carbon nitrogen ratio in soil is25–30:1 to form nitrous oxide;
• Soil porosity: when soil porosity is low, such as between 10 per cent and 12 percent, denitrification will improve. There are insignificant increases in the con-centrations of nitrous oxide in soil after being compacted by a tractor. But theflux of nitrous oxide from soil to air is lower in compacted soil than that inuncompacted soil because of the narrow crevices caused by low soil porosity;
• Plants themselves: root growth and secretions from roots cause a change in soilconditions (chemical and physical) and, furthermore, cause nitrous oxide emissions.
Agricultural soil management is the largest source of nitrous oxide in the USA.Estimated emissions from this source in 1999 were 962 Gg, or approximately 69per cent of total USA nitrous oxide emissions. Although annual agricultural soilmanagement emissions fluctuated between 1990 and 1999, there was a generalincrease in emissions. Over the ten-year period, total emissions of nitrous oxidefrom agricultural soil management increased by approximately 11 per cent (seeTable 2.11).
2.2.4.3Emission contributions
2.2.4.2Influencing mechanisms
2.2.4AGRICULTURAL SOIL MANAGEMENT
2.2.4.1Production mechanisms
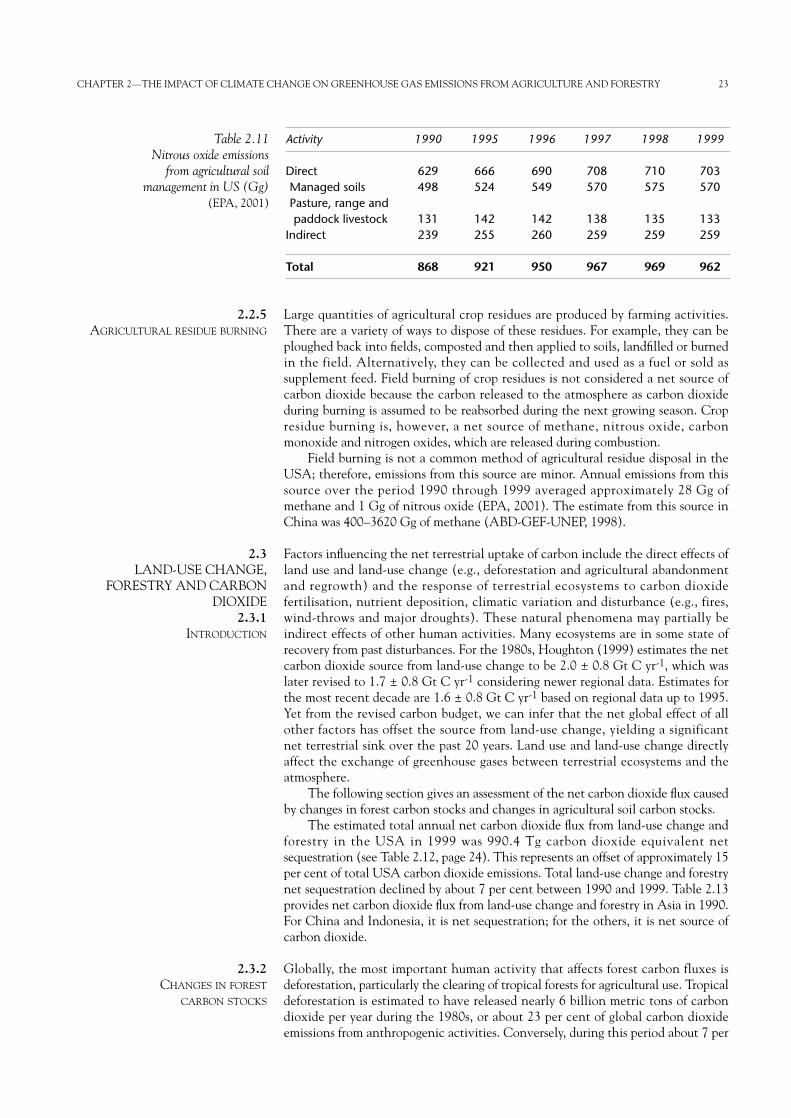
Large quantities of agricultural crop residues are produced by farming activities.There are a variety of ways to dispose of these residues. For example, they can beploughed back into fields, composted and then applied to soils, landfilled or burnedin the field. Alternatively, they can be collected and used as a fuel or sold assupplement feed. Field burning of crop residues is not considered a net source ofcarbon dioxide because the carbon released to the atmosphere as carbon dioxideduring burning is assumed to be reabsorbed during the next growing season. Cropresidue burning is, however, a net source of methane, nitrous oxide, carbonmonoxide and nitrogen oxides, which are released during combustion.
Field burning is not a common method of agricultural residue disposal in theUSA; therefore, emissions from this source are minor. Annual emissions from thissource over the period 1990 through 1999 averaged approximately 28 Gg ofmethane and 1 Gg of nitrous oxide (EPA, 2001). The estimate from this source inChina was 400–3620 Gg of methane (ABD-GEF-UNEP, 1998).
Factors influencing the net terrestrial uptake of carbon include the direct effects ofland use and land-use change (e.g., deforestation and agricultural abandonmentand regrowth) and the response of terrestrial ecosystems to carbon dioxidefertilisation, nutrient deposition, climatic variation and disturbance (e.g., fires,wind-throws and major droughts). These natural phenomena may partially beindirect effects of other human activities. Many ecosystems are in some state ofrecovery from past disturbances. For the 1980s, Houghton (1999) estimates the netcarbon dioxide source from land-use change to be 2.0 ± 0.8 Gt C yr-1, which waslater revised to 1.7 ± 0.8 Gt C yr-1 considering newer regional data. Estimates forthe most recent decade are 1.6 ± 0.8 Gt C yr-1 based on regional data up to 1995.Yet from the revised carbon budget, we can infer that the net global effect of allother factors has offset the source from land-use change, yielding a significant net terrestrial sink over the past 20 years. Land use and land-use change directlyaffect the exchange of greenhouse gases between terrestrial ecosystems and theatmosphere.
The following section gives an assessment of the net carbon dioxide flux causedby changes in forest carbon stocks and changes in agricultural soil carbon stocks.
The estimated total annual net carbon dioxide flux from land-use change andforestry in the USA in 1999 was 990.4 Tg carbon dioxide equivalent netsequestration (see Table 2.12, page 24). This represents an offset of approximately 15per cent of total USA carbon dioxide emissions. Total land-use change and forestrynet sequestration declined by about 7 per cent between 1990 and 1999. Table 2.13provides net carbon dioxide flux from land-use change and forestry in Asia in 1990.For China and Indonesia, it is net sequestration; for the others, it is net source ofcarbon dioxide.
Globally, the most important human activity that affects forest carbon fluxes isdeforestation, particularly the clearing of tropical forests for agricultural use. Tropicaldeforestation is estimated to have released nearly 6 billion metric tons of carbondioxide per year during the 1980s, or about 23 per cent of global carbon dioxideemissions from anthropogenic activities. Conversely, during this period about 7 per
2.3.2CHANGES IN FOREST
CARBON STOCKS
2.3LAND-USE CHANGE,
FORESTRY AND CARBONDIOXIDE
2.3.1INTRODUCTION
2.2.5AGRICULTURAL RESIDUE BURNING
CHAPTER 2—THE IMPACT OF CLIMATE CHANGE ON GREENHOUSE GAS EMISSIONS FROM AGRICULTURE AND FORESTRY 23
Table 2.11 Nitrous oxide emissions
from agricultural soil management in US (Gg)
(EPA, 2001)
Activity 1990 1995 1996 1997 1998 1999
Direct 629 666 690 708 710 703Managed soils 498 524 549 570 575 570Pasture, range andpaddock livestock 131 142 142 138 135 133
Indirect 239 255 260 259 259 259
Total 868 921 950 967 969 962
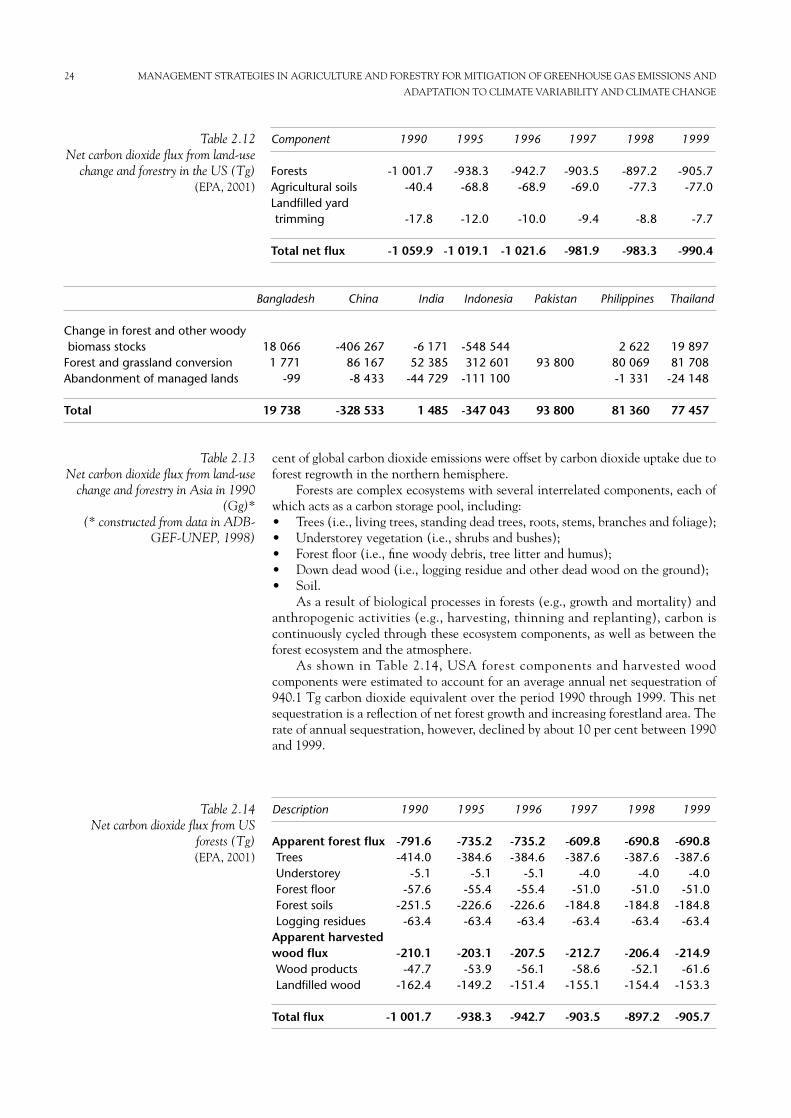
cent of global carbon dioxide emissions were offset by carbon dioxide uptake due toforest regrowth in the northern hemisphere.
Forests are complex ecosystems with several interrelated components, each ofwhich acts as a carbon storage pool, including: • Trees (i.e., living trees, standing dead trees, roots, stems, branches and foliage);• Understorey vegetation (i.e., shrubs and bushes);• Forest floor (i.e., fine woody debris, tree litter and humus);• Down dead wood (i.e., logging residue and other dead wood on the ground);• Soil.
As a result of biological processes in forests (e.g., growth and mortality) andanthropogenic activities (e.g., harvesting, thinning and replanting), carbon iscontinuously cycled through these ecosystem components, as well as between theforest ecosystem and the atmosphere.
As shown in Table 2.14, USA forest components and harvested woodcomponents were estimated to account for an average annual net sequestration of940.1 Tg carbon dioxide equivalent over the period 1990 through 1999. This netsequestration is a reflection of net forest growth and increasing forestland area. Therate of annual sequestration, however, declined by about 10 per cent between 1990and 1999.
24 MANAGEMENT STRATEGIES IN AGRICULTURE AND FORESTRY FOR MITIGATION OF GREENHOUSE GAS EMISSIONS AND
ADAPTATION TO CLIMATE VARIABILITY AND CLIMATE CHANGE
Component 1990 1995 1996 1997 1998 1999
Forests -1 001.7 -938.3 -942.7 -903.5 -897.2 -905.7Agricultural soils -40.4 -68.8 -68.9 -69.0 -77.3 -77.0Landfilled yard trimming -17.8 -12.0 -10.0 -9.4 -8.8 -7.7
Total net flux -1 059.9 -1 019.1 -1 021.6 -981.9 -983.3 -990.4
Table 2.12Net carbon dioxide flux from land-use
change and forestry in the US (Tg) (EPA, 2001)
Bangladesh China India Indonesia Pakistan Philippines Thailand
Change in forest and other woody biomass stocks 18 066 -406 267 -6 171 -548 544 2 622 19 897
Forest and grassland conversion 1 771 86 167 52 385 312 601 93 800 80 069 81 708Abandonment of managed lands -99 -8 433 -44 729 -111 100 -1 331 -24 148
Total 19 738 -328 533 1 485 -347 043 93 800 81 360 77 457
Table 2.13Net carbon dioxide flux from land-use
change and forestry in Asia in 1990(Gg)*
(* constructed from data in ADB-GEF-UNEP, 1998)
Description 1990 1995 1996 1997 1998 1999
Apparent forest flux -791.6 -735.2 -735.2 -609.8 -690.8 -690.8Trees -414.0 -384.6 -384.6 -387.6 -387.6 -387.6Understorey -5.1 -5.1 -5.1 -4.0 -4.0 -4.0Forest floor -57.6 -55.4 -55.4 -51.0 -51.0 -51.0Forest soils -251.5 -226.6 -226.6 -184.8 -184.8 -184.8Logging residues -63.4 -63.4 -63.4 -63.4 -63.4 -63.4
Apparent harvested wood flux -210.1 -203.1 -207.5 -212.7 -206.4 -214.9Wood products -47.7 -53.9 -56.1 -58.6 -52.1 -61.6Landfilled wood -162.4 -149.2 -151.4 -155.1 -154.4 -153.3
Total flux -1 001.7 -938.3 -942.7 -903.5 -897.2 -905.7
Table 2.14 Net carbon dioxide flux from US
forests (Tg) (EPA, 2001)
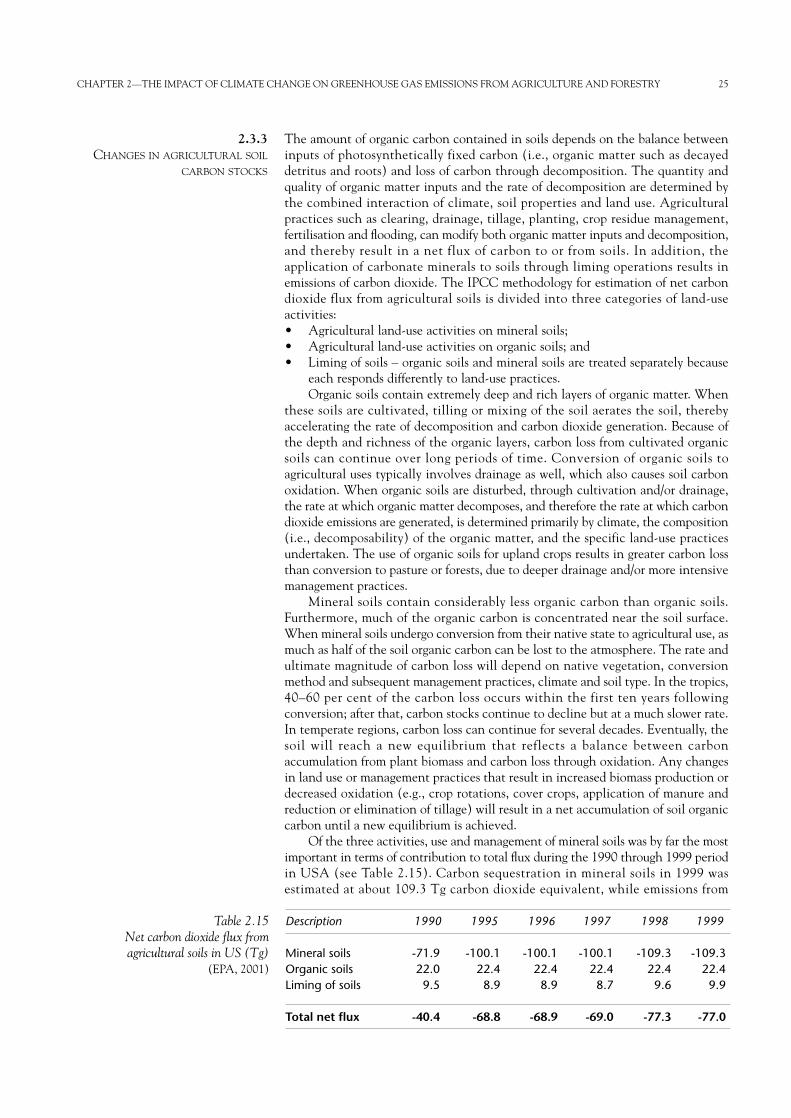
CHAPTER 2—THE IMPACT OF CLIMATE CHANGE ON GREENHOUSE GAS EMISSIONS FROM AGRICULTURE AND FORESTRY 25
The amount of organic carbon contained in soils depends on the balance betweeninputs of photosynthetically fixed carbon (i.e., organic matter such as decayeddetritus and roots) and loss of carbon through decomposition. The quantity andquality of organic matter inputs and the rate of decomposition are determined bythe combined interaction of climate, soil properties and land use. Agriculturalpractices such as clearing, drainage, tillage, planting, crop residue management,fertilisation and flooding, can modify both organic matter inputs and decomposition,and thereby result in a net flux of carbon to or from soils. In addition, theapplication of carbonate minerals to soils through liming operations results inemissions of carbon dioxide. The IPCC methodology for estimation of net carbondioxide flux from agricultural soils is divided into three categories of land-useactivities:• Agricultural land-use activities on mineral soils; • Agricultural land-use activities on organic soils; and • Liming of soils – organic soils and mineral soils are treated separately because
each responds differently to land-use practices. Organic soils contain extremely deep and rich layers of organic matter. When
these soils are cultivated, tilling or mixing of the soil aerates the soil, therebyaccelerating the rate of decomposition and carbon dioxide generation. Because ofthe depth and richness of the organic layers, carbon loss from cultivated organicsoils can continue over long periods of time. Conversion of organic soils toagricultural uses typically involves drainage as well, which also causes soil carbonoxidation. When organic soils are disturbed, through cultivation and/or drainage,the rate at which organic matter decomposes, and therefore the rate at which carbondioxide emissions are generated, is determined primarily by climate, the composition(i.e., decomposability) of the organic matter, and the specific land-use practicesundertaken. The use of organic soils for upland crops results in greater carbon lossthan conversion to pasture or forests, due to deeper drainage and/or more intensivemanagement practices.
Mineral soils contain considerably less organic carbon than organic soils.Furthermore, much of the organic carbon is concentrated near the soil surface.When mineral soils undergo conversion from their native state to agricultural use, asmuch as half of the soil organic carbon can be lost to the atmosphere. The rate andultimate magnitude of carbon loss will depend on native vegetation, conversionmethod and subsequent management practices, climate and soil type. In the tropics,40–60 per cent of the carbon loss occurs within the first ten years followingconversion; after that, carbon stocks continue to decline but at a much slower rate.In temperate regions, carbon loss can continue for several decades. Eventually, thesoil will reach a new equilibrium that reflects a balance between carbonaccumulation from plant biomass and carbon loss through oxidation. Any changesin land use or management practices that result in increased biomass production ordecreased oxidation (e.g., crop rotations, cover crops, application of manure andreduction or elimination of tillage) will result in a net accumulation of soil organiccarbon until a new equilibrium is achieved.
Of the three activities, use and management of mineral soils was by far the mostimportant in terms of contribution to total flux during the 1990 through 1999 periodin USA (see Table 2.15). Carbon sequestration in mineral soils in 1999 wasestimated at about 109.3 Tg carbon dioxide equivalent, while emissions from
2.3.3CHANGES IN AGRICULTURAL SOIL
CARBON STOCKS
Description 1990 1995 1996 1997 1998 1999
Mineral soils -71.9 -100.1 -100.1 -100.1 -109.3 -109.3Organic soils 22.0 22.4 22.4 22.4 22.4 22.4Liming of soils 9.5 8.9 8.9 8.7 9.6 9.9
Total net flux -40.4 -68.8 -68.9 -69.0 -77.3 -77.0
Table 2.15Net carbon dioxide flux fromagricultural soils in US (Tg)
(EPA, 2001)
organic soils were estimated at about 22.4 Tg carbon dioxide equivalent andemissions from liming were estimated at about 9.9 Tg carbon dioxide equivalent.Together the three activities accounted for net sequestration of 77.0 Tg carbondioxide equivalent in 1999. Total annual net carbon dioxide flux was negative eachyear over the 1990 to 1999 period. Between 1990 and 1999, total net carbonsequestration in agricultural soils increased by 90 per cent.
Over the short term, such as ten years, climate change and elevated carbon dioxideconcentration mainly influence some biological processes and species changes inthe ecosystem. But over the long term, such as 10–100 years, their impacts result inchanges in the structure and function of ecosystems. These changes in structure andfunction lead to changes in greenhouse gas emissions.
The net radiation absorbed by the continents is partitioned mainly into sensibleand latent (evapotranspiration) heat fluxes whose release back into the atmospheredirectly influences local air temperature and humidity and in turn other climatesystem variables. In any given locale, soil moisture availability and vegetation statelargely determine the fraction of net radiation that is used for evapotranspiration,as well the photosynthetic and respiration rates. Thus, attention must be paid to thelinks between vegetation and the terrestrial energy, water and carbon cycles, andhow these might change due to ecophysiological responses to elevated carbondioxide and changes in climate.
Fluxes of energy, momentum, water and heat, traditionally defined as physicalclimate system variables, can all be defined as functions of the type and density ofthe local vegetation and the depth and physical properties of the soil. Change inthe physical character of the land surface can affect land-atmosphere exchanges ofradiation, momentum, heat and water. Changes in vegetation type, density andassociated soil properties usually lead to changes in terrestrial carbon stocks andfluxes that can then directly contribute to the evolution of atmospheric carbondioxide concentration.
There are two types of land surface change: direct anthropogenic change, suchas deforestation and agriculture; and indirect change, where changes in climate orcarbon dioxide concentration force changes in vegetation structure and functionwithin biomes, or the migration of biomes themselves. Large-scale deforestation inthe humid tropics has been identified as an important ongoing process, and itspossible impact on climate has been the topic of several field campaigns.
Changes to the land surface resulting from climate change or increased carbondioxide concentration are likely to become important over the mid-to long term.For example, the extension of the growing season in high latitudes will probablyresult in increases in biomass density, biogeochemical cycling rates, photosynthesis,respiration and fire frequency in the northern forests, leading to significant changesin albedo, evapotranspiration, hydrology and the carbon balance of the zone.
Over the next 50–100 years, it is more likely that changes in vegetation densityand soil properties within existing biome borders will make a greater contribution tomodifying the physical climate system and carbon cycle processes than any large-scale biogeographical shifts. In some cases, soil physical and chemical properties willlimit the rate at which biomes can “migrate”.
Soil moisture conditions directly influence the net surface energy balance anddetermine the partitioning of the surface heat flux into sensible and latentcontributions, which in turn control the evolution of the soil moisture distribution.In relation to climate change, such mechanisms are relevant since they might leadto, or intensify, a reduction in summer soil moisture in mid- and high latitude semi-arid regions under doubled carbon dioxide conditions. Studies showed some impactof soil conditions upon land precipitation during episodes of convective activity.
The feedback mechanisms between soil moisture conditions and precipitationare particularly relevant to climate change studies since they may interact with, anddetermine the response to, larger-scale changes in atmospheric circulation,precipitation and soil-moisture anomalies.
2.4IMPACT OF CLIMATE
CHANGE AND ELEVATEDCARBON DIOXIDE
CONCENTRATION ON THESTRUCTURE AND FUNCTION
OF AGRICULTURAL ANDFOREST ECOSYSTEMS
2.4.1INTERACTIONS BETWEEN CLIMATE
CHANGE AND LAND SURFACE
CHANGE
26 MANAGEMENT STRATEGIES IN AGRICULTURE AND FORESTRY FOR MITIGATION OF GREENHOUSE GAS EMISSIONS AND
ADAPTATION TO CLIMATE VARIABILITY AND CLIMATE CHANGE
Photosynthesis and respiration are climatically sensitive. Solar radiation, temperatureand available water affect photosynthesis, plant respiration and decomposition, thusclimate change can lead to changes in net ecosystem production (NEP). Warmingmay increase NPP in temperate and arctic ecosystems where it can increase thelength of the seasonal and daily growing cycles, but it may decrease NPP in water-stressed ecosystems as it increases water loss. Respiratory processes are sensitive totemperature; soil and root respiration have generally been shown to increase withwarming in the short term (Lloyd and Taylor, 1994; Boone et al., 1998) althoughevidence on longer-term impacts is conflicting (Trumbore, 2000; Giardina and Ryan,2000; Jarvis and Linder, 2000). Changes in rainfall pattern affect plant wateravailability and the length of the growing season, particularly in arid and semi-aridregions. Cloud cover can be beneficial to NPP in dry areas with high solar radiation,but detrimental in areas with low solar radiation. Changing climate can also affectthe distribution of plants and the incidence of disturbances such as fire (which couldincrease or decrease depending on warming and precipitation patterns, possiblyresulting under some circumstances in rapid losses of carbon), wind, and insect andpathogen attacks leading to changes in net biome production (NBP). The globalbalance of these positive and negative effects of climate on NBP depends strongly onregional aspects of climate change. For agriculture and forest production, increasesare proposed in some cases and decreases in others.
High correlation exists between the spatial distribution of vegetation and climatepatterns on a continental scale. Major climatic zones, which govern species ranges,are expected to shift with climate changes. Under such conditions, existing species,particularly trees, will find it difficult to adapt and be increasingly asynchronous withtheir environment. Increases in temperature can be expected to lengthen the growingseason in areas where agricultural potential is limited by insufficient warmth, resultingin a poleward shift of the thermal limits of agriculture. Increases in temperature arealso likely to affect the crop calendar and, therefore, change current planting systems.
The distribution of insects, pests and their associated predators is closely related toclimate. Temperature increases may extend the geographical range of some insects andpests currently limited by temperature. As with crops, such effects would be greatest athigher latitudes. New or migrant pests may become established as climatic conditionsbecome more favourable for them. In temperate regions, where insect pests anddiseases are not generally serious at present, damage is likely to increase under warmerconditions. An important unknown, however, is the effect that changes inprecipitation amount and air humidity may have on the insect pests themselves and ontheir predators, parasites and diseases. Climatic change may significantly influenceinteractions between pests and their predators and parasites. In addition, mostagricultural and tree diseases have greater potential to reach severe levels.
There are numerous other ways by which changes in climate can have an indirectbut important effect on agriculture and forestry, largely through effects on somephysical systems. Changes in the intensity of rainfall may affect rates of soil erosionand desertification. Higher rates of evapotranspiration could, in some regions, lead tomore frequent spells during which topsoils are dry and therefore prone to erosion bywind. A third, and more long term, consequence of changes in rainfall may bechanges in soil fertility resulting from changes in the soil base status.
Carbon dioxide and oxygen compete for the reaction sites on the photosyntheticcarbon-fixing enzyme, Rubisco. Increasing the concentration of carbon dioxide inthe atmosphere has two effects on the Rubisco reactions: increasing the rate ofreaction with carbon dioxide (carboxylation) and decreasing the rate ofoxygenation. Both effects increase the rate of photosynthesis, since oxygenation isfollowed by photorespiration, which releases carbon dioxide (Farquhar et al., 1980).With increased photosynthesis plants can develop faster, attaining the same final
2.4.3EFFECTS OF INCREASING
ATMOSPHERIC CARBON DIOXIDE
2.4.3.1Photosynthesis, respiration and
growth
2.4.2.4 Some environmental processes
2.4.2.3Distribution of pests and diseases
2.4.2.2Shifts of climatic zones and crop
planting systems
2.4.2EFFECTS OF CLIMATE CHANGE
2.4.2.1Net primary production (NPP)
CHAPTER 2—THE IMPACT OF CLIMATE CHANGE ON GREENHOUSE GAS EMISSIONS FROM AGRICULTURE AND FORESTRY 27
size in less time, or can increase their final mass. In the first case the overall rate oflitter production increases and so the soil carbon stock increases; in the second case,both the below ground and above ground carbon stocks increase. Both types ofgrowth response to elevated carbon dioxide have been observed (Masle, 2000).
In addition, the phenological development and growth rate of agricultural cropsand grassland are accelerated in elevated atmospheric carbon dioxide concentration.This leads to increases in crop productivity and increases in harvestable yield insome cases (e.g., Tubiello et al., 1999), though not in others (Wechsung et al., 1999).Tropical grasslands have very high NPP, especially below ground (House and Hall,2000), but whether the amount of carbon stored in the soil is increasing is uncertain.
The strength of the response of photosynthesis to an increase in carbon dioxideconcentration depends on the photosynthetic pathway used by the plant. Plants witha photosynthetic pathway known as C3 (all trees, nearly all plants of cold climatesand most agricultural crops including wheat and rice) generally show increased ratesof photosynthesis in response to increases in carbon dioxide concentration above thepresent level (Koch and Mooney, 1996; Curtis, 1996; Mooney et al., 1999). Plantswith the C4 photosynthetic pathway (tropical and many temperate grasses, somedesert shrubs and some crops including maize and sugar cane) already have amechanism to concentrate carbon dioxide and therefore show either no directphotosynthetic response, or less response than C3 plants (Wand et al., 1999).Increased carbon dioxide has also been reported to reduce plant respiration undersome conditions (Drake et al., 1999), although this effect has been questioned.
Increased carbon dioxide concentration allows partial closure of stomata, restrictingwater loss during transpiration and producing an increase in the ratio of carbon gainto water loss (“water-use efficiency” – WUE) (Field et al., 1995a; Drake et al., 1997;Farquhar, 1997; Korner, 2000). Stomatal conductance is down-regulated withconsequent increased efficiency of use of both nitrogen and water (Curtis, 1996;Curtis and Wang, 1998; Peterson et al., 1999; Medlyn et al., 2000). This effect canlengthen the duration of the growing season in seasonally dry ecosystems and canincrease NPP in both C3 and C4 plants.
Photosynthesis and stomatal conductance exhibit strong diurnal variation.These physiologically-driven variations have a direct influence on the diurnalsurface air temperature range in continental interiors and are directly sensitive tochanges in atmospheric carbon dioxide concentration. Further, increasingatmospheric carbon dioxide is likely to directly affect the stomatal function throughfeedbacks in the photosynthesis-conductance system. Increased carbon dioxideconcentrations allow vegetation to maintain the same photosynthesis rates with alower evapotranspiration rate.
The process of carbon dioxide “fertilisation” thus involves direct effects on carbonassimilation and indirect effects such as those via water saving. Increasing carbondioxide can therefore lead to structural and physiological changes in plants(Pritchard et al., 1999) and can further affect plant competition and distributionpatterns due to the different responses of different species. Field studies show thatthe relative stimulation of NPP tends to be greater in low-productivity years,suggesting that improvements in water- and nutrient-use efficiency can be moreimportant than direct NPP stimulation (Luo et al., 1999). Trees grown in doublethe atmospheric carbon dioxide concentration translocate appreciably more carbonbelow ground than do trees grown in ambient carbon dioxide concentration. Muchof this carbon ends up as fine roots, microbes and mycorrhizae that contributedetritus to the pool of soil organic matter (Rey and Jarvis, 1997).
C3 crops show an average increase in NPP of around 33 per cent for a doubling ofatmospheric carbon dioxide (Koch and Mooney, 1996). Grassland and crop studiescombined show an average biomass increase of 14 per cent, with a wide range of
2.4.3.5Net primary production (NPP)
2.4.3.4Fertilisation
2.4.3.3Stomatal aperture and water use
2.4.3.2C3 and C4 plants
28 MANAGEMENT STRATEGIES IN AGRICULTURE AND FORESTRY FOR MITIGATION OF GREENHOUSE GAS EMISSIONS AND
ADAPTATION TO CLIMATE VARIABILITY AND CLIMATE CHANGE
responses among individual studies (Mooney et al., 1999). In cold climates, lowtemperatures restrict the photosynthetic response to elevated carbon dioxide. Intropical grasslands and savannahs C4 grasses are dominant, so it has been assumedthat C3 trees and grasses would gain a competitive advantage at high carbon dioxide(Gifford, 1992; Collatz et al., 1998). This is supported by carbon isotope evidencefrom the last glacial maximum, which suggests that low carbon dioxide favours C4plants (Street-Perrott et al., 1998). However, field experiments suggest a morecomplex picture with C4 plants doing better than C3 under elevated carbon dioxidedue to improved WUE at the ecosystem level (Owensby et al., 1993; Polley et al.,1996). Highly productive forest ecosystems have the greatest potential for absoluteincreases in productivity due to carbon dioxide effects. Experiments in forests areexpensive and technically challenging thus there are insufficient long-term data.Long-term field studies on young trees have shown a stimulation of photosynthesis ofabout 60 per cent for a doubling of carbon dioxide (Saxe et al., 1998; Norby et al.,1999). A FACE experiment in a fast-growing young pine forest showed an increaseof 25 per cent in NPP for an increase in atmospheric carbon dioxide to 560ppm(DeLucia et al., 1999). Some of this additional NPP is allocated to root metabolismand associated microbes; soil carbon dioxide efflux increases, returning a part (butnot all) of the extra NPP to the atmosphere (Allen et al., 2000). The response ofmature forests to increases in atmospheric carbon dioxide concentration has notbeen shown experimentally; it may be different from that of young forests for variousreasons, including changes in leaf carbon to nitrogen ratios and stomatal responsesto water vapour deficits as trees mature (Norby et al., 1999; Curtis and Wang, 1998).
Increased levels of carbon dioxide can enhance nitrogen fixation by leguminousspecies, through increased rates of photosynthesis. The direct effects of carbondioxide on nitrogen fixation could be advantageous in grass and legume pastures.
2.4.3.6 Effect on biological nitrogen fixations
CHAPTER 2—THE IMPACT OF CLIMATE CHANGE ON GREENHOUSE GAS EMISSIONS FROM AGRICULTURE AND FORESTRY 29
CHAPTER 3
THE IMPACT OF MANAGEMENT STRATEGIES INAGRICULTURE AND AGROFORESTRY TO MITIGATEGREENHOUSE GAS EMISSIONS (by R.L. Desjardins)
Much of the information on greenhouse gas emissions and mitigation measures hasbeen summarised in a series of reports by the IPCC. According to the IPCC (2001b),there are a number of gases for which anthropogenic emissions have been identifiedas contributing to global warming, however, only three are of importance inagriculture: carbon dioxide, methane and nitrous oxide. During the last 150 years,carbon dioxide concentration has increased from 280 to 369 ppmv, methane from700 to 1750 ppbv and nitrous oxide from 270 to 316 ppbv. Their annual rates ofincrease over the period 1990 to 1999 are 0.4 per cent, 0.4 per cent and 0.25 percent respectively (IPCC, 2001b).
The increase in the concentration of greenhouse gas emissions is changing theradiation budget of the earth’s surface, which influences climate. For example, globalsurface temperature increased by about 0.6°C during the last century (IPCC, 2001b).Climate experts estimate that the surface temperature of the earth is likely toincrease by somewhere between 0.1°C and 0.4°C per decade in the future, thusheating the planet by 1.4–5.8°C from 1990 to 2100 (IPCC, 2001b).
Globally, agriculture accounts for about one fifth of the increase in greenhousegases. Most of the present contribution from agroecosystems is due to methane andnitrous oxide, where agroecosystems contribute about 50 per cent and 70 per cent,respectively of the anthropogenic emissions (Cole et al., 1996). Hence, unlike mostother sectors, the emissions from agriculture are mostly from biological sources ratherthan from energy ones. This means that the agricultural community faces a differentchallenge to that of other sectors. However, being a highly managed ecosystem, itcan offer unique solutions to the world’s efforts to attenuate climate change.
The contribution of a gas to the greenhouse effect depends on its capacity toabsorb and re-emit radiation and on how long it remains in the atmosphere. Gasmolecules react with other compounds in the atmosphere to form new molecules.For example, a methane molecule, which has an atmospheric lifetime of about12 years, is eventually transformed into carbon dioxide and water. Over a 100-yearperiod, one kilogram of methane has a global warming potential (GWP) 23 timesthat of one kilogram of carbon dioxide and one kilogram of nitrous oxide has 296times the GWP of one kilogram of carbon dioxide. Over a 20-year period the GWPof methane is 62 and nitrous oxide is 275 (IPCC, 2001b). These numbers, whichare known as the carbon dioxide equivalence of these gases, are useful in evaluatingthe effects of reducing carbon dioxide emissions relative to other greenhouse gases.The numbers for a 100-year time horizon will be used in this chapter.
This chapter will provide information on the contribution of agroecosystems tothe greenhouse gas build-up in the atmosphere. It will also examine howmanagement strategies in agriculture and agroforestry could be used to reducegreenhouse gas emissions and to increase carbon sequestration.
The primary role of agriculture is to produce food. This involves storing carbon inplants and animals. About 35 per cent of the land area in the world is used for thispurpose. During the process of producing food, greenhouse gases are emitted.Figure 3.1 (see page 31) shows the principal sources and sinks of carbon dioxide,methane and nitrous oxide associated with primary agriculture.
About two thirds of the increase of carbon dioxide in the atmosphere over the last150 years is attributable to the burning of fossil fuels and about one third is
3.2.1CARBON DIOXIDE
3.2AGRICULTURAL SOURCES
AND SINKS OF GREENHOUSEGASES
3.1INTRODUCTION
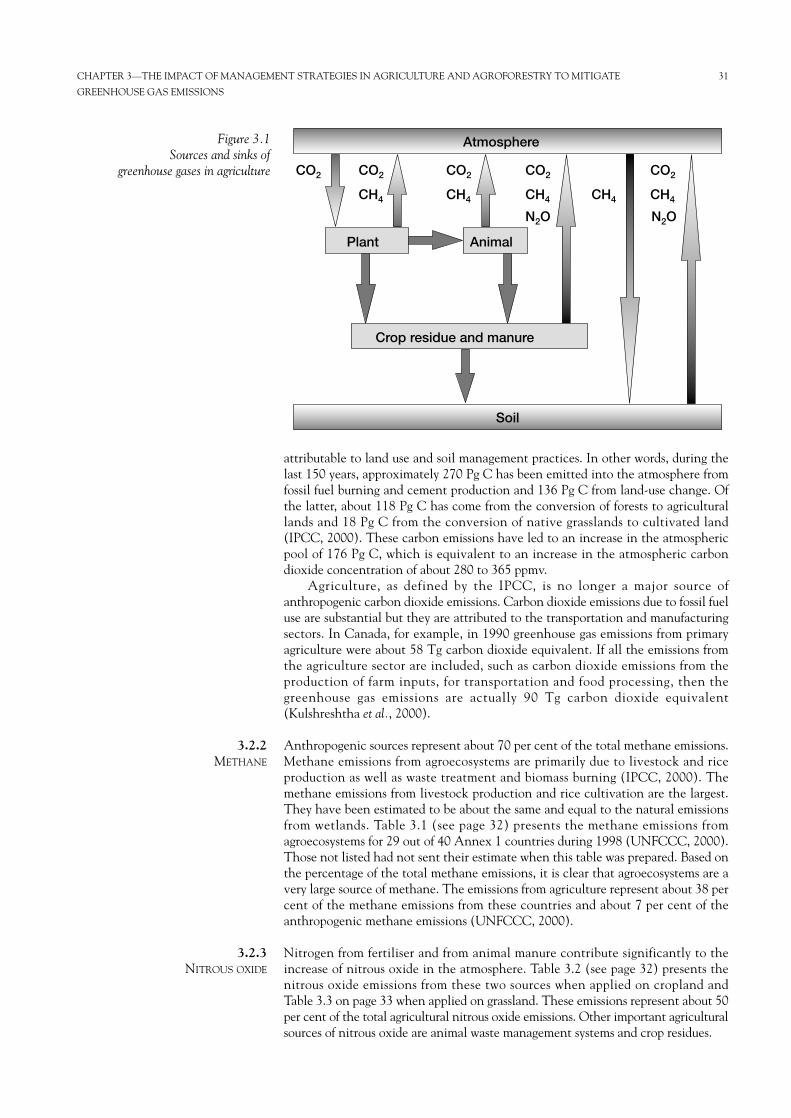
attributable to land use and soil management practices. In other words, during thelast 150 years, approximately 270 Pg C has been emitted into the atmosphere fromfossil fuel burning and cement production and 136 Pg C from land-use change. Ofthe latter, about 118 Pg C has come from the conversion of forests to agriculturallands and 18 Pg C from the conversion of native grasslands to cultivated land(IPCC, 2000). These carbon emissions have led to an increase in the atmosphericpool of 176 Pg C, which is equivalent to an increase in the atmospheric carbondioxide concentration of about 280 to 365 ppmv.
Agriculture, as defined by the IPCC, is no longer a major source ofanthropogenic carbon dioxide emissions. Carbon dioxide emissions due to fossil fueluse are substantial but they are attributed to the transportation and manufacturingsectors. In Canada, for example, in 1990 greenhouse gas emissions from primaryagriculture were about 58 Tg carbon dioxide equivalent. If all the emissions fromthe agriculture sector are included, such as carbon dioxide emissions from theproduction of farm inputs, for transportation and food processing, then thegreenhouse gas emissions are actually 90 Tg carbon dioxide equivalent(Kulshreshtha et al., 2000).
Anthropogenic sources represent about 70 per cent of the total methane emissions.Methane emissions from agroecosystems are primarily due to livestock and riceproduction as well as waste treatment and biomass burning (IPCC, 2000). Themethane emissions from livestock production and rice cultivation are the largest.They have been estimated to be about the same and equal to the natural emissionsfrom wetlands. Table 3.1 (see page 32) presents the methane emissions fromagroecosystems for 29 out of 40 Annex 1 countries during 1998 (UNFCCC, 2000).Those not listed had not sent their estimate when this table was prepared. Based onthe percentage of the total methane emissions, it is clear that agroecosystems are avery large source of methane. The emissions from agriculture represent about 38 percent of the methane emissions from these countries and about 7 per cent of theanthropogenic methane emissions (UNFCCC, 2000).
Nitrogen from fertiliser and from animal manure contribute significantly to theincrease of nitrous oxide in the atmosphere. Table 3.2 (see page 32) presents thenitrous oxide emissions from these two sources when applied on cropland andTable 3.3 on page 33 when applied on grassland. These emissions represent about 50per cent of the total agricultural nitrous oxide emissions. Other important agriculturalsources of nitrous oxide are animal waste management systems and crop residues.
3.2.3NITROUS OXIDE
3.2.2METHANE
CHAPTER 3—THE IMPACT OF MANAGEMENT STRATEGIES IN AGRICULTURE AND AGROFORESTRY TO MITIGATE 31
GREENHOUSE GAS EMISSIONS
Plant
Atmosphere
Soil
Animal
Crop residue and manure
CO2 CO2
CH4
CO2
CH4
CO2
CH4 CH4
N2O N2O
CO2
CH4
Figure 3.1Sources and sinks of
greenhouse gases in agriculture
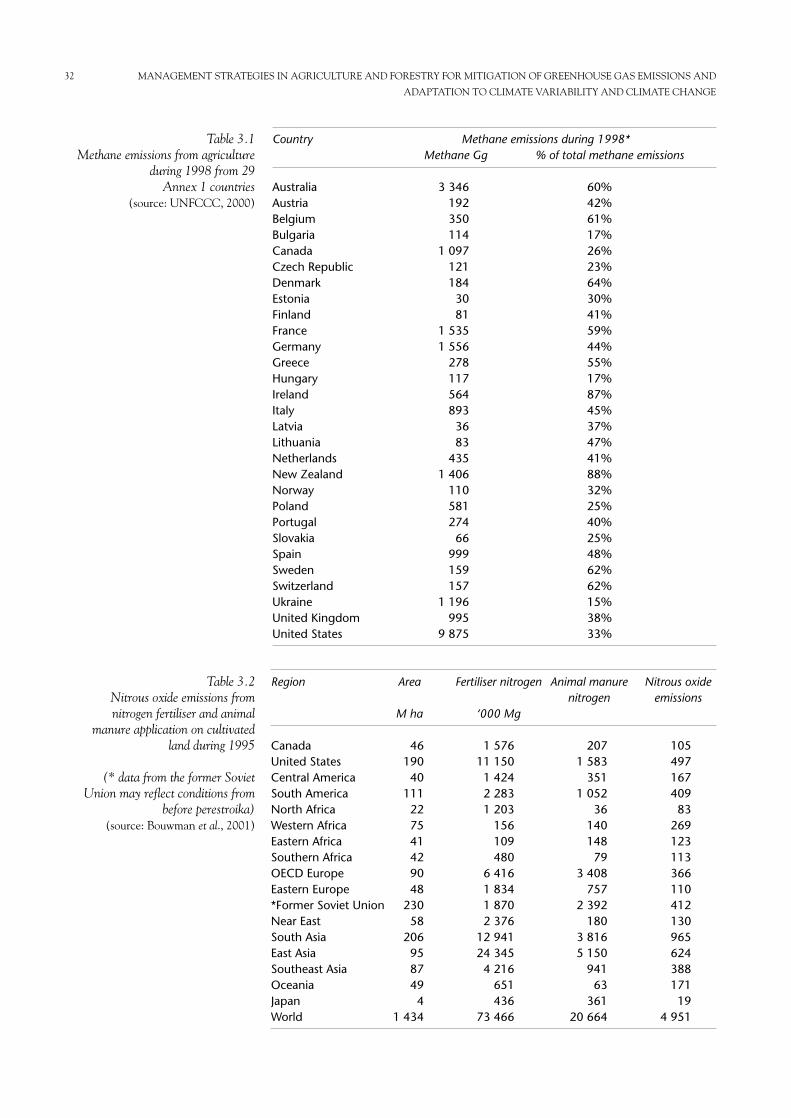
32 MANAGEMENT STRATEGIES IN AGRICULTURE AND FORESTRY FOR MITIGATION OF GREENHOUSE GAS EMISSIONS AND
ADAPTATION TO CLIMATE VARIABILITY AND CLIMATE CHANGE
Country Methane emissions during 1998*Methane Gg % of total methane emissions
Australia 3 346 60%Austria 192 42%Belgium 350 61%Bulgaria 114 17%Canada 1 097 26%Czech Republic 121 23%Denmark 184 64%Estonia 30 30%Finland 81 41%France 1 535 59%Germany 1 556 44%Greece 278 55%Hungary 117 17%Ireland 564 87%Italy 893 45%Latvia 36 37%Lithuania 83 47%Netherlands 435 41%New Zealand 1 406 88%Norway 110 32%Poland 581 25%Portugal 274 40%Slovakia 66 25%Spain 999 48%Sweden 159 62%Switzerland 157 62%Ukraine 1 196 15%United Kingdom 995 38%United States 9 875 33%
Table 3.1Methane emissions from agriculture
during 1998 from 29 Annex 1 countries
(source: UNFCCC, 2000)
Region Area Fertiliser nitrogen Animal manure Nitrous oxide nitrogen emissions
M ha ‘000 Mg
Canada 46 1 576 207 105United States 190 11 150 1 583 497Central America 40 1 424 351 167South America 111 2 283 1 052 409North Africa 22 1 203 36 83Western Africa 75 156 140 269Eastern Africa 41 109 148 123Southern Africa 42 480 79 113OECD Europe 90 6 416 3 408 366Eastern Europe 48 1 834 757 110*Former Soviet Union 230 1 870 2 392 412Near East 58 2 376 180 130South Asia 206 12 941 3 816 965East Asia 95 24 345 5 150 624Southeast Asia 87 4 216 941 388Oceania 49 651 63 171Japan 4 436 361 19World 1 434 73 466 20 664 4 951
Table 3.2Nitrous oxide emissions fromnitrogen fertiliser and animal
manure application on cultivatedland during 1995
(* data from the former SovietUnion may reflect conditions from
before perestroika) (source: Bouwman et al., 2001)
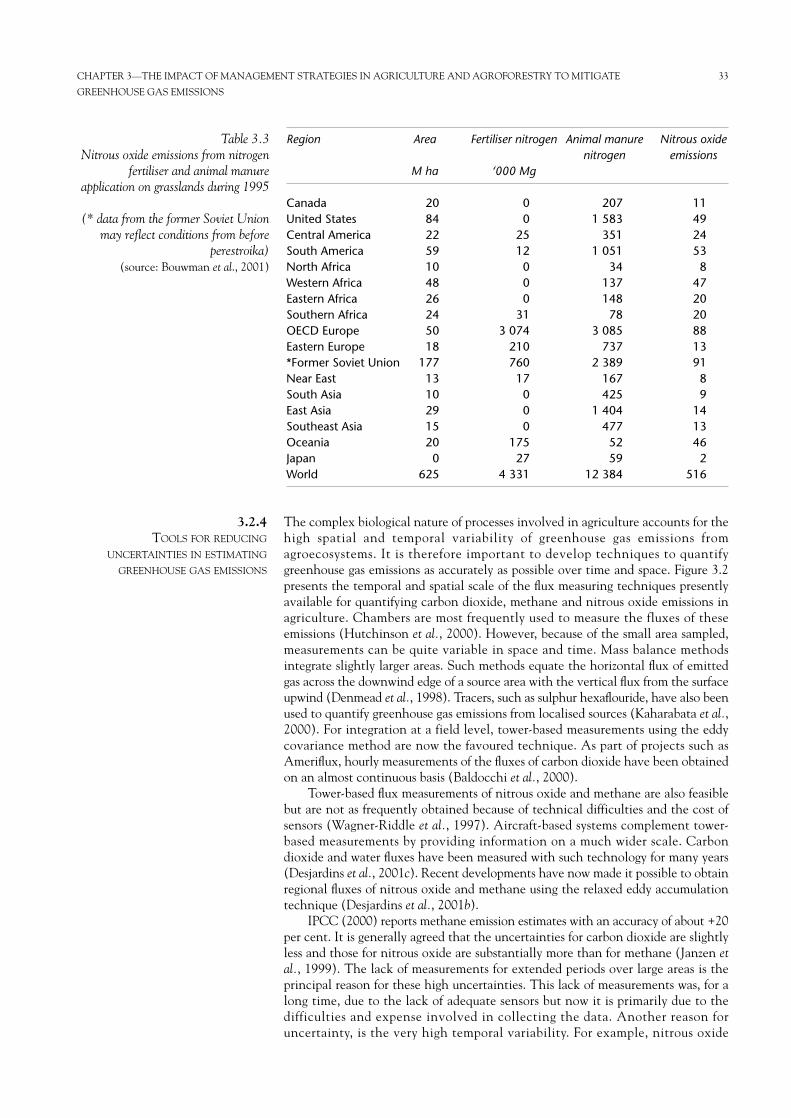
The complex biological nature of processes involved in agriculture accounts for thehigh spatial and temporal variability of greenhouse gas emissions fromagroecosystems. It is therefore important to develop techniques to quantifygreenhouse gas emissions as accurately as possible over time and space. Figure 3.2presents the temporal and spatial scale of the flux measuring techniques presentlyavailable for quantifying carbon dioxide, methane and nitrous oxide emissions inagriculture. Chambers are most frequently used to measure the fluxes of theseemissions (Hutchinson et al., 2000). However, because of the small area sampled,measurements can be quite variable in space and time. Mass balance methodsintegrate slightly larger areas. Such methods equate the horizontal flux of emittedgas across the downwind edge of a source area with the vertical flux from the surfaceupwind (Denmead et al., 1998). Tracers, such as sulphur hexaflouride, have also beenused to quantify greenhouse gas emissions from localised sources (Kaharabata et al.,2000). For integration at a field level, tower-based measurements using the eddycovariance method are now the favoured technique. As part of projects such asAmeriflux, hourly measurements of the fluxes of carbon dioxide have been obtainedon an almost continuous basis (Baldocchi et al., 2000).
Tower-based flux measurements of nitrous oxide and methane are also feasiblebut are not as frequently obtained because of technical difficulties and the cost ofsensors (Wagner-Riddle et al., 1997). Aircraft-based systems complement tower-based measurements by providing information on a much wider scale. Carbondioxide and water fluxes have been measured with such technology for many years(Desjardins et al., 2001c). Recent developments have now made it possible to obtainregional fluxes of nitrous oxide and methane using the relaxed eddy accumulationtechnique (Desjardins et al., 2001b).
IPCC (2000) reports methane emission estimates with an accuracy of about +20per cent. It is generally agreed that the uncertainties for carbon dioxide are slightlyless and those for nitrous oxide are substantially more than for methane (Janzen etal., 1999). The lack of measurements for extended periods over large areas is theprincipal reason for these high uncertainties. This lack of measurements was, for along time, due to the lack of adequate sensors but now it is primarily due to thedifficulties and expense involved in collecting the data. Another reason foruncertainty, is the very high temporal variability. For example, nitrous oxide
3.2.4TOOLS FOR REDUCING
UNCERTAINTIES IN ESTIMATING
GREENHOUSE GAS EMISSIONS
CHAPTER 3—THE IMPACT OF MANAGEMENT STRATEGIES IN AGRICULTURE AND AGROFORESTRY TO MITIGATE 33
GREENHOUSE GAS EMISSIONS
Region Area Fertiliser nitrogen Animal manure Nitrous oxide nitrogen emissions
M ha ‘000 Mg
Canada 20 0 207 11United States 84 0 1 583 49Central America 22 25 351 24South America 59 12 1 051 53North Africa 10 0 34 8Western Africa 48 0 137 47Eastern Africa 26 0 148 20Southern Africa 24 31 78 20OECD Europe 50 3 074 3 085 88Eastern Europe 18 210 737 13*Former Soviet Union 177 760 2 389 91Near East 13 17 167 8South Asia 10 0 425 9East Asia 29 0 1 404 14Southeast Asia 15 0 477 13Oceania 20 175 52 46Japan 0 27 59 2World 625 4 331 12 384 516
Table 3.3Nitrous oxide emissions from nitrogen
fertiliser and animal manureapplication on grasslands during 1995
(* data from the former Soviet Unionmay reflect conditions from before
perestroika)(source: Bouwman et al., 2001)
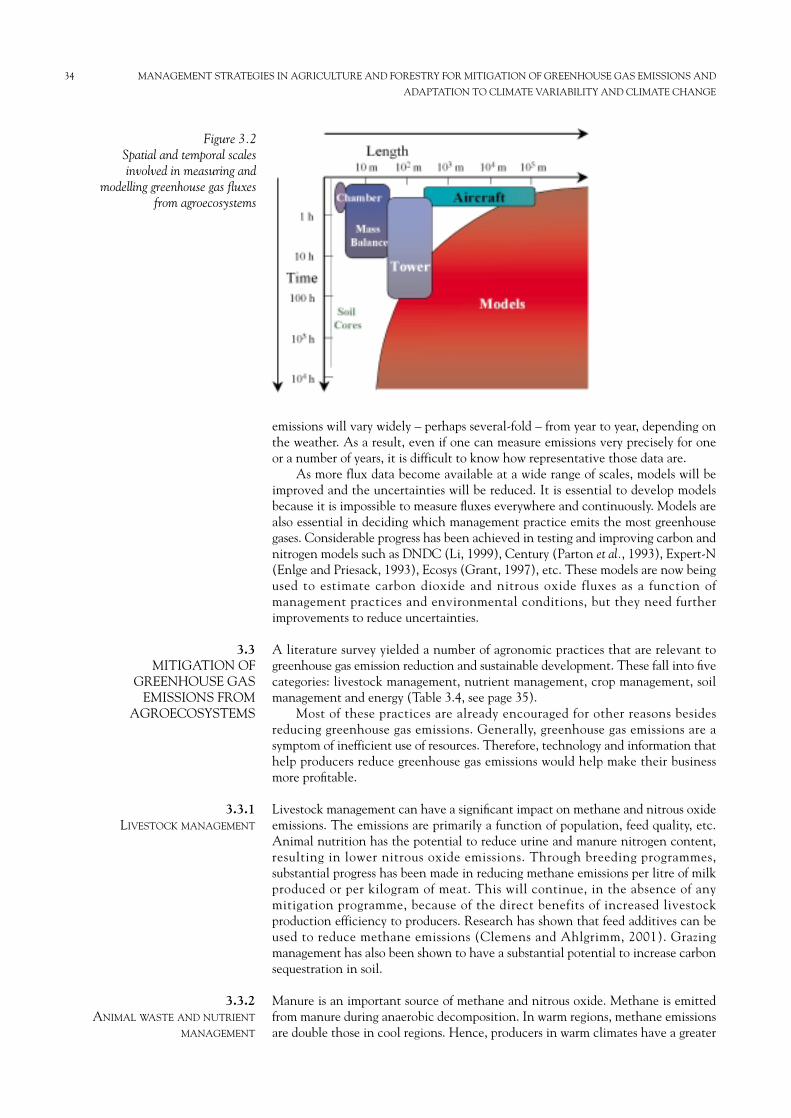
emissions will vary widely – perhaps several-fold – from year to year, depending onthe weather. As a result, even if one can measure emissions very precisely for oneor a number of years, it is difficult to know how representative those data are.
As more flux data become available at a wide range of scales, models will beimproved and the uncertainties will be reduced. It is essential to develop modelsbecause it is impossible to measure fluxes everywhere and continuously. Models arealso essential in deciding which management practice emits the most greenhousegases. Considerable progress has been achieved in testing and improving carbon andnitrogen models such as DNDC (Li, 1999), Century (Parton et al., 1993), Expert-N(Enlge and Priesack, 1993), Ecosys (Grant, 1997), etc. These models are now beingused to estimate carbon dioxide and nitrous oxide fluxes as a function ofmanagement practices and environmental conditions, but they need furtherimprovements to reduce uncertainties.
A literature survey yielded a number of agronomic practices that are relevant togreenhouse gas emission reduction and sustainable development. These fall into fivecategories: livestock management, nutrient management, crop management, soilmanagement and energy (Table 3.4, see page 35).
Most of these practices are already encouraged for other reasons besidesreducing greenhouse gas emissions. Generally, greenhouse gas emissions are asymptom of inefficient use of resources. Therefore, technology and information thathelp producers reduce greenhouse gas emissions would help make their businessmore profitable.
Livestock management can have a significant impact on methane and nitrous oxideemissions. The emissions are primarily a function of population, feed quality, etc.Animal nutrition has the potential to reduce urine and manure nitrogen content,resulting in lower nitrous oxide emissions. Through breeding programmes,substantial progress has been made in reducing methane emissions per litre of milkproduced or per kilogram of meat. This will continue, in the absence of anymitigation programme, because of the direct benefits of increased livestockproduction efficiency to producers. Research has shown that feed additives can beused to reduce methane emissions (Clemens and Ahlgrimm, 2001). Grazingmanagement has also been shown to have a substantial potential to increase carbonsequestration in soil.
Manure is an important source of methane and nitrous oxide. Methane is emittedfrom manure during anaerobic decomposition. In warm regions, methane emissionsare double those in cool regions. Hence, producers in warm climates have a greater
3.3.2ANIMAL WASTE AND NUTRIENT
MANAGEMENT
3.3.1LIVESTOCK MANAGEMENT
3.3MITIGATION OF
GREENHOUSE GASEMISSIONS FROM
AGROECOSYSTEMS
34 MANAGEMENT STRATEGIES IN AGRICULTURE AND FORESTRY FOR MITIGATION OF GREENHOUSE GAS EMISSIONS AND
ADAPTATION TO CLIMATE VARIABILITY AND CLIMATE CHANGE
Figure 3.2Spatial and temporal scalesinvolved in measuring and
modelling greenhouse gas fluxesfrom agroecosystems
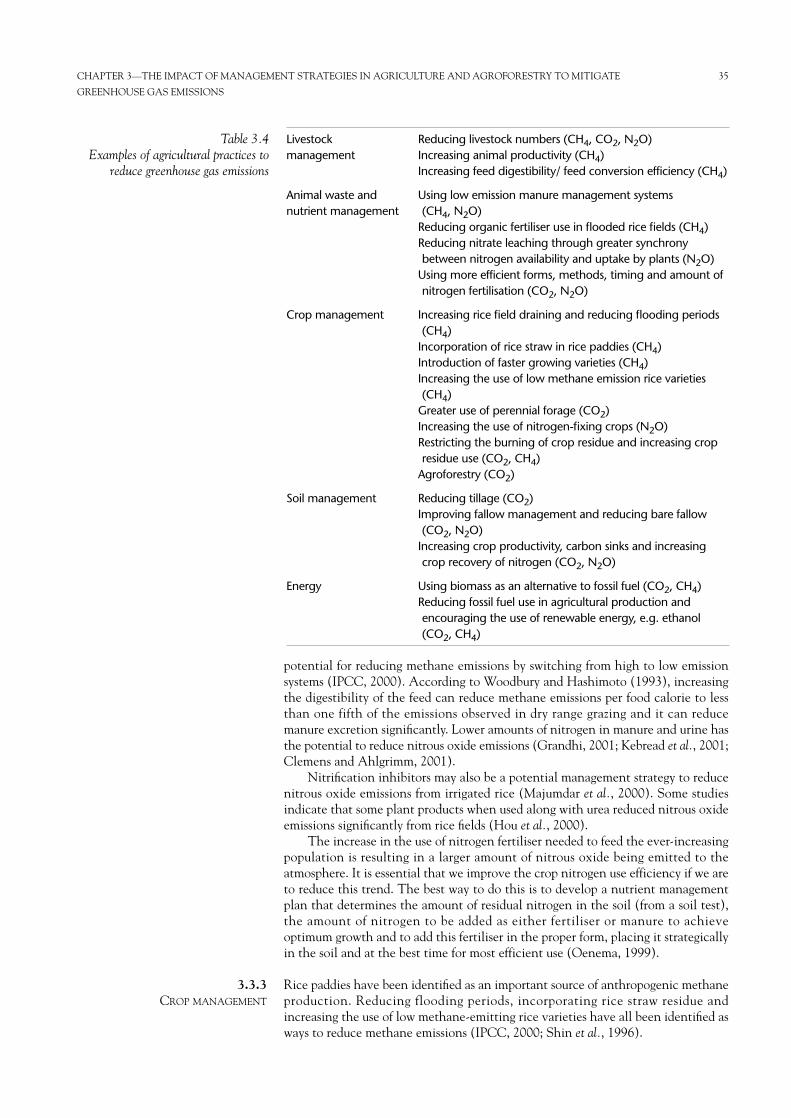
potential for reducing methane emissions by switching from high to low emissionsystems (IPCC, 2000). According to Woodbury and Hashimoto (1993), increasingthe digestibility of the feed can reduce methane emissions per food calorie to lessthan one fifth of the emissions observed in dry range grazing and it can reducemanure excretion significantly. Lower amounts of nitrogen in manure and urine hasthe potential to reduce nitrous oxide emissions (Grandhi, 2001; Kebread et al., 2001;Clemens and Ahlgrimm, 2001).
Nitrification inhibitors may also be a potential management strategy to reducenitrous oxide emissions from irrigated rice (Majumdar et al., 2000). Some studiesindicate that some plant products when used along with urea reduced nitrous oxideemissions significantly from rice fields (Hou et al., 2000).
The increase in the use of nitrogen fertiliser needed to feed the ever-increasingpopulation is resulting in a larger amount of nitrous oxide being emitted to theatmosphere. It is essential that we improve the crop nitrogen use efficiency if we areto reduce this trend. The best way to do this is to develop a nutrient managementplan that determines the amount of residual nitrogen in the soil (from a soil test),the amount of nitrogen to be added as either fertiliser or manure to achieveoptimum growth and to add this fertiliser in the proper form, placing it strategicallyin the soil and at the best time for most efficient use (Oenema, 1999).
Rice paddies have been identified as an important source of anthropogenic methaneproduction. Reducing flooding periods, incorporating rice straw residue andincreasing the use of low methane-emitting rice varieties have all been identified asways to reduce methane emissions (IPCC, 2000; Shin et al., 1996).
3.3.3CROP MANAGEMENT
CHAPTER 3—THE IMPACT OF MANAGEMENT STRATEGIES IN AGRICULTURE AND AGROFORESTRY TO MITIGATE 35
GREENHOUSE GAS EMISSIONS
Livestock Reducing livestock numbers (CH4, CO2, N2O)management Increasing animal productivity (CH4)
Increasing feed digestibility/ feed conversion efficiency (CH4)
Animal waste and Using low emission manure management systemsnutrient management (CH4, N2O)
Reducing organic fertiliser use in flooded rice fields (CH4)Reducing nitrate leaching through greater synchronybetween nitrogen availability and uptake by plants (N2O)
Using more efficient forms, methods, timing and amount ofnitrogen fertilisation (CO2, N2O)
Crop management Increasing rice field draining and reducing flooding periods(CH4)
Incorporation of rice straw in rice paddies (CH4) Introduction of faster growing varieties (CH4)Increasing the use of low methane emission rice varieties(CH4)
Greater use of perennial forage (CO2)Increasing the use of nitrogen-fixing crops (N2O)Restricting the burning of crop residue and increasing cropresidue use (CO2, CH4)
Agroforestry (CO2)
Soil management Reducing tillage (CO2)Improving fallow management and reducing bare fallow(CO2, N2O)
Increasing crop productivity, carbon sinks and increasingcrop recovery of nitrogen (CO2, N2O)
Energy Using biomass as an alternative to fossil fuel (CO2, CH4)Reducing fossil fuel use in agricultural production andencouraging the use of renewable energy, e.g. ethanol(CO2, CH4)
Table 3.4Examples of agricultural practices to
reduce greenhouse gas emissions
The selection of crops can also reduce greenhouse gas emissions. Increasing theuse of nitrogen-fixing crops (legumes) reduces the need for nitrogen fertiliser, whichreduces the amount of carbon dioxide produced during fertiliser production.Conversion of cropland to grassland favours carbon sequestration in soil organicmatter (Conant et al., 2001).
Crop residue management can also help reduce greenhouse gas emissions.Restricting the burning of crop residues and using crop residues for making productssuch as strawboards and ethanol can help reduce emissions of greenhouse gas andsequester carbon.
Agroforestry can represent a sustainable alternative to cultivating the land. Ithas the potential to increase carbon sequestration in marginal farmland and tosequester carbon in the tree biomass. It can also enhance biodiversity as well as soiland water conservation. IPCC (2000) reports that better management of landsalready under agroforestry (about 400 million ha) would result in carbon gains ofabout 0.2 to 0.5 Mg C ha-1yr-1. Even larger gains, about 3 Mg C ha-1yr-1, could beachieved by converting unproductive cropland or grasslands into agroforestry.
Agricultural soils contain a manageable pool of carbon. Most cultivated soilscontain about 1–5 per cent carbon by weight, much of it stored in organic matter,derived from the residues of plants growing on the soil. Carbon sequestrationhappens when carbon build-up in the soil exceeds the loss due to decay throughcultivation and other processes. The goal of soil management, for greenhouse gasmitigation, is to increase the soil organic matter, thus increasing the amount oforganic carbon that is retained in soils. Agronomic studies have identified a numberof soil management practices that favour increased soil carbon storage (Paustian etal., 1998). These include: using less intensive tillage, reducing the use of bare fallow,as well as increasing crop production and thus crop residues returned to the soil, byusing better crop rotations, crop types, fertiliser practices, etc. According to Lal etal., (1999) practices that reduce soil erosion can also increase carbon storage in soils;however, Gregorich et al., (1998) suggest that eroded soil is merely soil displaced inthe landscape and thus does not affect carbon sequestration.
The use of land to provide food and fibre while enhancing soil carbon stocks andproducing energy provided another opportunity to reduce greenhouse gasconcentrations in the atmosphere. Globally, biofuel contributes about 14 per cent ofprimary energy supply (IPCC, 2000). Instead of extracting carbon from deep withinthe earth and burning it and producing carbon dioxide, biofuel production simplyrecycles the carbon originally removed from the atmosphere through photosynthesis.Most biofuel use is traditional wood fuel in developing countries, but agriculturaland forest products provide significant industrial feedstocks for energy productionin developed countries. In North America, corn-based ethanol presently accountsfor a large portion of the production, but it can also be made from crops such aswheat, and sugar cane and forestry products. It is expected that ethanol producedfrom cellulose such as wheat straw or switch grass will increase in future years. Cost-effective enzyme technology that breaks down plant fibre releasing sugar that canbe fermented into ethanol are expected to be available in the near future. Thiswould help meet the demand for food, fibre and energy.
A systems approach to estimating greenhouse gas emissions from the agriculture andthe agri-food sector in Canada has been developed by Kulshreshtha et al., (2000).This was accomplished using CEEMA: a resource allocation model and agreenhouse gas emissions model (Figure 3.3). The resource allocation sub-model isbased on the Canadian Regional Agricultural Model (CRAM). CRAM analyses theimpact of policy changes on land use and on economic returns on a regional scale forthe entire Canadian agricultural industry. It takes a given level of resources for aregion and, under a given set of economic conditions, allocates the availableresources to provide an optimum level of net returns to producers. Associated with
3.3.6PUTTING IT ALL TOGETHER
3.3.5ENERGY
3.3.4SOIL MANAGEMENT
36 MANAGEMENT STRATEGIES IN AGRICULTURE AND FORESTRY FOR MITIGATION OF GREENHOUSE GAS EMISSIONS AND
ADAPTATION TO CLIMATE VARIABILITY AND CLIMATE CHANGE
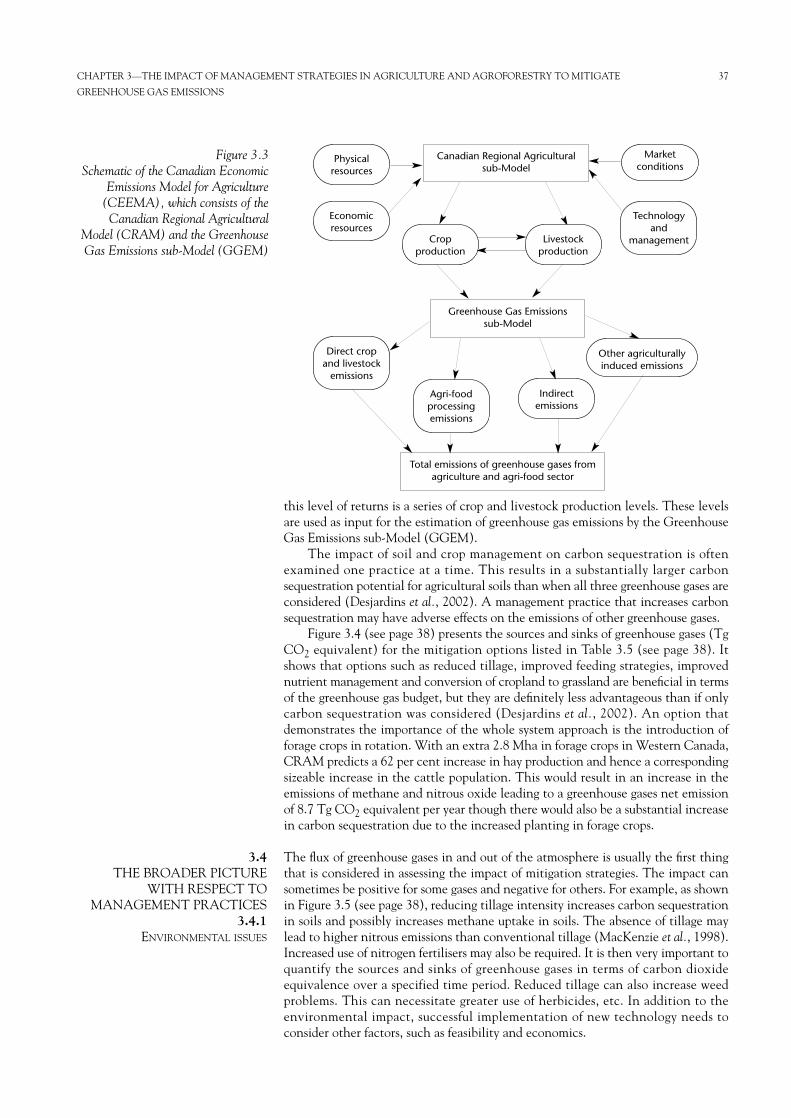
this level of returns is a series of crop and livestock production levels. These levelsare used as input for the estimation of greenhouse gas emissions by the GreenhouseGas Emissions sub-Model (GGEM).
The impact of soil and crop management on carbon sequestration is oftenexamined one practice at a time. This results in a substantially larger carbonsequestration potential for agricultural soils than when all three greenhouse gases areconsidered (Desjardins et al., 2002). A management practice that increases carbonsequestration may have adverse effects on the emissions of other greenhouse gases.
Figure 3.4 (see page 38) presents the sources and sinks of greenhouse gases (TgCO2 equivalent) for the mitigation options listed in Table 3.5 (see page 38). Itshows that options such as reduced tillage, improved feeding strategies, improvednutrient management and conversion of cropland to grassland are beneficial in termsof the greenhouse gas budget, but they are definitely less advantageous than if onlycarbon sequestration was considered (Desjardins et al., 2002). An option thatdemonstrates the importance of the whole system approach is the introduction offorage crops in rotation. With an extra 2.8 Mha in forage crops in Western Canada,CRAM predicts a 62 per cent increase in hay production and hence a correspondingsizeable increase in the cattle population. This would result in an increase in theemissions of methane and nitrous oxide leading to a greenhouse gases net emissionof 8.7 Tg CO2 equivalent per year though there would also be a substantial increasein carbon sequestration due to the increased planting in forage crops.
The flux of greenhouse gases in and out of the atmosphere is usually the first thingthat is considered in assessing the impact of mitigation strategies. The impact cansometimes be positive for some gases and negative for others. For example, as shownin Figure 3.5 (see page 38), reducing tillage intensity increases carbon sequestrationin soils and possibly increases methane uptake in soils. The absence of tillage maylead to higher nitrous emissions than conventional tillage (MacKenzie et al., 1998).Increased use of nitrogen fertilisers may also be required. It is then very important toquantify the sources and sinks of greenhouse gases in terms of carbon dioxideequivalence over a specified time period. Reduced tillage can also increase weedproblems. This can necessitate greater use of herbicides, etc. In addition to theenvironmental impact, successful implementation of new technology needs toconsider other factors, such as feasibility and economics.
3.4THE BROADER PICTURE
WITH RESPECT TOMANAGEMENT PRACTICES
3.4.1ENVIRONMENTAL ISSUES
CHAPTER 3—THE IMPACT OF MANAGEMENT STRATEGIES IN AGRICULTURE AND AGROFORESTRY TO MITIGATE 37
GREENHOUSE GAS EMISSIONS
Total emissions of greenhouse gases fromagriculture and agri-food sector
Greenhouse Gas Emissions sub-Model
Physicalresources
Marketconditions
Technologyand
management
Economicresources
Other agriculturallyinduced emissions
Indirectemissions
Agri-foodprocessingemissions
Direct cropand livestock
emissions
Cropproduction
Livestockproduction
Canadian Regional Agricultural sub-Model
Figure 3.3 Schematic of the Canadian Economic
Emissions Model for Agriculture(CEEMA), which consists of the
Canadian Regional AgriculturalModel (CRAM) and the GreenhouseGas Emissions sub-Model (GGEM)
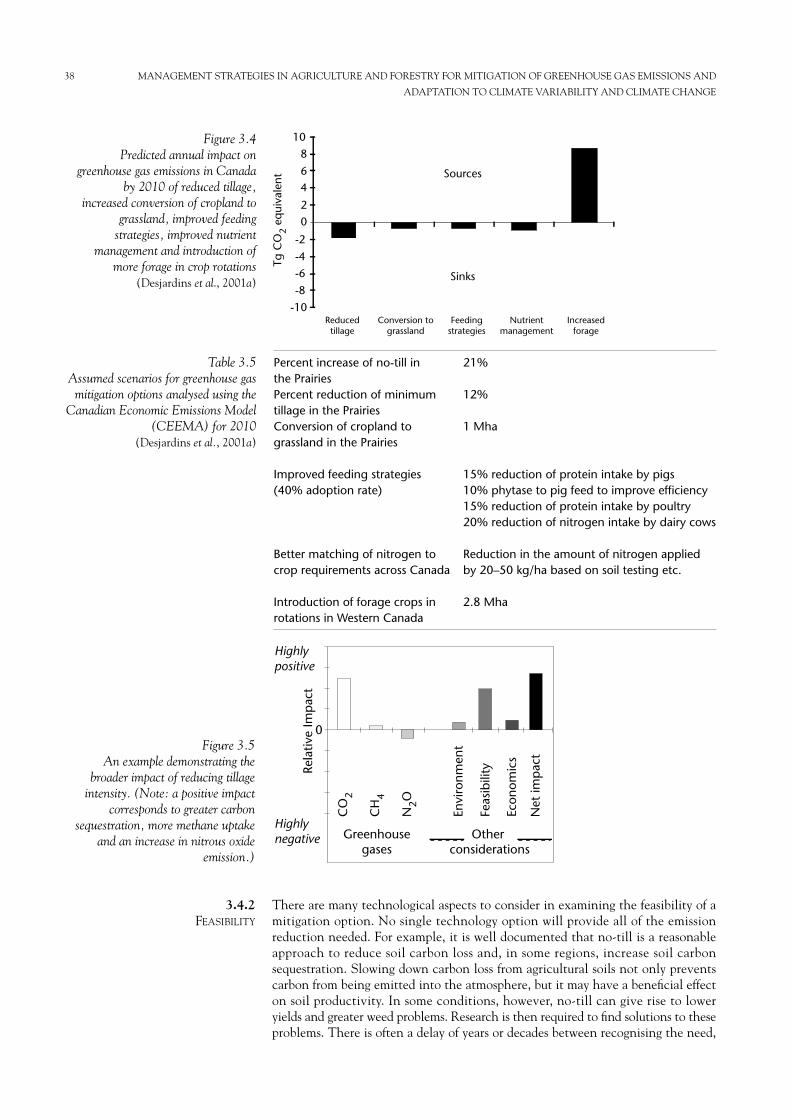
There are many technological aspects to consider in examining the feasibility of amitigation option. No single technology option will provide all of the emissionreduction needed. For example, it is well documented that no-till is a reasonableapproach to reduce soil carbon loss and, in some regions, increase soil carbonsequestration. Slowing down carbon loss from agricultural soils not only preventscarbon from being emitted into the atmosphere, but it may have a beneficial effecton soil productivity. In some conditions, however, no-till can give rise to loweryields and greater weed problems. Research is then required to find solutions to theseproblems. There is often a delay of years or decades between recognising the need,
3.4.2FEASIBILITY
38 MANAGEMENT STRATEGIES IN AGRICULTURE AND FORESTRY FOR MITIGATION OF GREENHOUSE GAS EMISSIONS AND
ADAPTATION TO CLIMATE VARIABILITY AND CLIMATE CHANGE
10
8
64
2
-2
-4
-6
-8
-10
0
Sources
SinksTg
CO
2 eq
uiva
lent
Reducedtillage
Conversion tograssland
Feedingstrategies
Nutrientmanagement
Increasedforage
Figure 3.4Predicted annual impact on
greenhouse gas emissions in Canadaby 2010 of reduced tillage,
increased conversion of cropland tograssland, improved feeding
strategies, improved nutrientmanagement and introduction of
more forage in crop rotations (Desjardins et al., 2001a)
Percent increase of no-till in 21%the PrairiesPercent reduction of minimum 12%tillage in the PrairiesConversion of cropland to 1 Mhagrassland in the Prairies
Improved feeding strategies 15% reduction of protein intake by pigs(40% adoption rate) 10% phytase to pig feed to improve efficiency
15% reduction of protein intake by poultry20% reduction of nitrogen intake by dairy cows
Better matching of nitrogen to Reduction in the amount of nitrogen applied crop requirements across Canada by 20–50 kg/ha based on soil testing etc.
Introduction of forage crops in 2.8 Mharotations in Western Canada
Table 3.5Assumed scenarios for greenhouse gasmitigation options analysed using the
Canadian Economic Emissions Model(CEEMA) for 2010
(Desjardins et al., 2001a)
Greenhousegases
Other considerations
CO
2
CH
4
N2O
Envi
ronm
ent
Feas
ibili
ty
Econ
omic
s
Net
imp
act
Highlynegative
Highlypositive
Rela
tive
Imp
act
0Figure 3.5
An example demonstrating thebroader impact of reducing tillage
intensity. (Note: a positive impactcorresponds to greater carbon
sequestration, more methane uptakeand an increase in nitrous oxide
emission.)
developing technological solutions and implementing them. The implementationoften requires the purchase of new equipment. Farmers under financial constraintsare often faced with limited opportunities to adapt to new technologies. There are, however, certain practices that can be adopted quite rapidly. For example,adoption of new crop varieties allows for rapid changes that can take advantage ofenvironmental conditions and are economical.
Cost effective measures to reduce greenhouse gas emissions are required if farmersare to adopt them. It is important to demonstrate that lower greenhouse gasemissions usually correspond to higher production and vice versa. The managementstrategies that contribute to increased soil carbon sequestration often result in bettersoil quality and higher yields, while poor nutrient management results in lower yieldsand higher nitrous oxide emissions and higher cost. A good criterion in agriculturein evaluating a mitigation measure is the cost of reducing greenhouse gas emissionsper unit of agricultural products; for example, the amount of milk or meat producedper animal. Methane emitted per unit of production is a more useful index thansimply the amount of methane emitted per animal.
The cost of greenhouse gas emission reduction in agriculture must be comparedwith the cost of emissions reduction in other sectors. It is important to consider theeconomic competitiveness with trading partners. Coordinating actions amongsectors and countries will help reduce the cost of mitigation measures. Newmitigation options can bring new sources of funding for farmers. For example, a shiftto biofuels could increase the demand for straw and certain crops and increase theincome of farmers while possibly being more environmentally friendly.
Most technologies carry with them certain advantages and disadvantages. Whenseveral technologies are combined, the trade-off must be carefully assessed. Thedegree of acceptance by the farming community is very important because the netimpact of a technology is very dependent on the level of adoption.
Permanence is also an important criterion to consider when we examine thenet impact of management strategies. Soil carbon in the upper layer of the soil canbe quickly re-released to the atmosphere by discontinuing practices such asconservation tillage. Also conversion to soil organic matter does not put all thecarbon into a highly sequestered state (humic material), some of the carbon is in alabile form which can be easily decomposed and can be lost as carbon dioxide.
In examining the impact of reducing the emissions of various gases it is alsoimportant to consider the lifetime of the gas. The different lifetimes in theatmosphere of carbon dioxide and methane result in interesting implications. Areduction of a short-lived gas, such as methane, will be noticed rapidly in theatmospheric concentration. However, any carbon dioxide emissions that are avoidedwill not be observed as rapidly, yet it will have longer-lasting benefits.
It is fairly clear that no single mitigation option will provide all of the emissionreductions society requires. Carbon dioxide emissions must decrease by 50 per centby the end of the 21st century if we are to reach stabilisation at about 450 ppmv.Such a reduction is only possible with large reductions in energy use. Reductionoptions in the agriculture sector provide significant potential for reducinggreenhouse gas emissions. As part of the Second Assessment Report of IPCCprepared in 1995, Cole et al., (1996) reported potential reduction of greenhousegases of 1.2–3.3 Pg C eq/yr from the world agricultural sector. About 32 per cent ofthis reduction was associated with carbon dioxide emissions, 42 per cent due tocarbon offset by biofuels, 16 per cent due to reduced methane emissions and 10 percent due to reduced nitrous oxide emissions.
IPCC (2000) presents the potential carbon sequestration from additionalactivities within Annex 1 countries and globally assuming an ambitious policyagenda (Table 3.6, see page 40). A value of about 1.0 Pg C /yr is predicted for 2010and about 1.5 Pg C for 2040. This sequestration will, however, not occur unless
3.5POTENTIAL IMPACT OF
MITIGATION STRATEGIESAVAILABLE FOR REDUCING
GREENHOUSE GASEMISSIONS FROM
AGROECOSYSTEMS
3.4.4NET IMPACT
3.4.3ECONOMICS
CHAPTER 3—THE IMPACT OF MANAGEMENT STRATEGIES IN AGRICULTURE AND AGROFORESTRY TO MITIGATE 39
GREENHOUSE GAS EMISSIONS
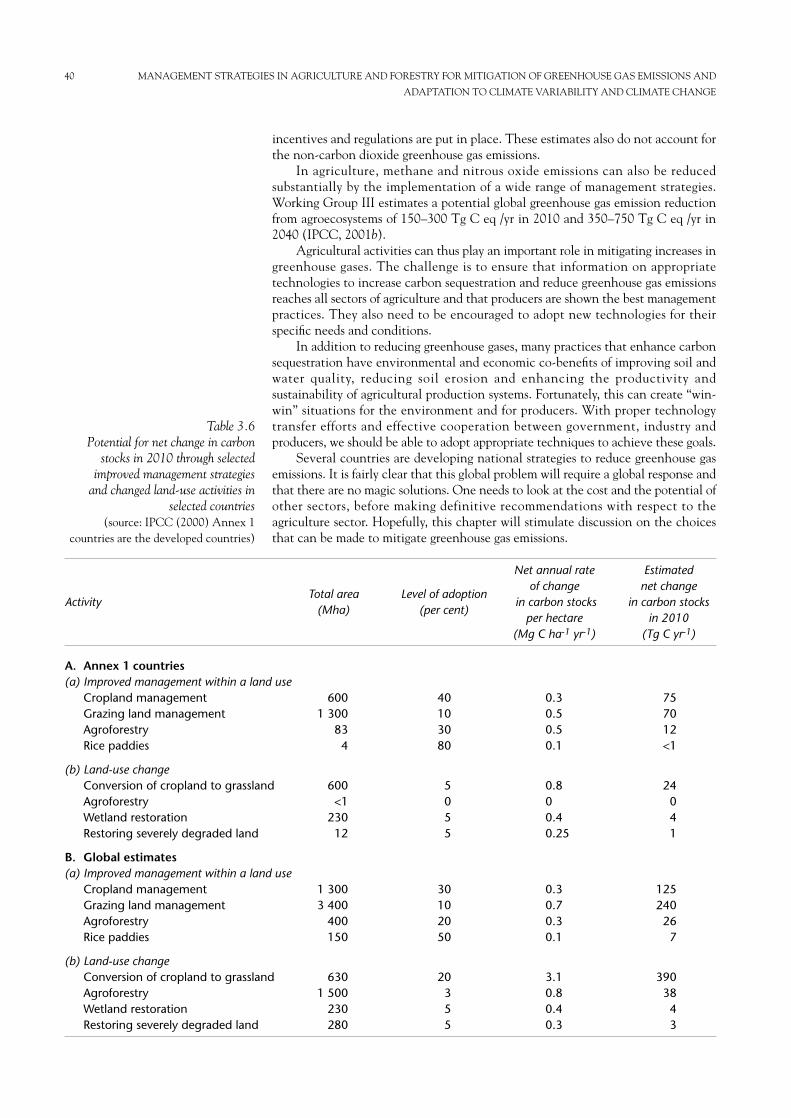
incentives and regulations are put in place. These estimates also do not account forthe non-carbon dioxide greenhouse gas emissions.
In agriculture, methane and nitrous oxide emissions can also be reducedsubstantially by the implementation of a wide range of management strategies.Working Group III estimates a potential global greenhouse gas emission reductionfrom agroecosystems of 150–300 Tg C eq /yr in 2010 and 350–750 Tg C eq /yr in2040 (IPCC, 2001b).
Agricultural activities can thus play an important role in mitigating increases ingreenhouse gases. The challenge is to ensure that information on appropriatetechnologies to increase carbon sequestration and reduce greenhouse gas emissionsreaches all sectors of agriculture and that producers are shown the best managementpractices. They also need to be encouraged to adopt new technologies for theirspecific needs and conditions.
In addition to reducing greenhouse gases, many practices that enhance carbonsequestration have environmental and economic co-benefits of improving soil andwater quality, reducing soil erosion and enhancing the productivity andsustainability of agricultural production systems. Fortunately, this can create “win-win” situations for the environment and for producers. With proper technologytransfer efforts and effective cooperation between government, industry andproducers, we should be able to adopt appropriate techniques to achieve these goals.
Several countries are developing national strategies to reduce greenhouse gasemissions. It is fairly clear that this global problem will require a global response andthat there are no magic solutions. One needs to look at the cost and the potential ofother sectors, before making definitive recommendations with respect to theagriculture sector. Hopefully, this chapter will stimulate discussion on the choicesthat can be made to mitigate greenhouse gas emissions.
40 MANAGEMENT STRATEGIES IN AGRICULTURE AND FORESTRY FOR MITIGATION OF GREENHOUSE GAS EMISSIONS AND
ADAPTATION TO CLIMATE VARIABILITY AND CLIMATE CHANGE
Net annual rate Estimated of change net change
ActivityTotal area Level of adoption
in carbon stocks in carbon stocks(Mha) (per cent)
per hectare in 2010(Mg C ha-1 yr-1) (Tg C yr-1)
A. Annex 1 countries(a) Improved management within a land use
Cropland management 600 40 0.3 75Grazing land management 1 300 10 0.5 70Agroforestry 83 30 0.5 12Rice paddies 4 80 0.1 <1
(b) Land-use changeConversion of cropland to grassland 600 5 0.8 24Agroforestry <1 0 0 0Wetland restoration 230 5 0.4 4Restoring severely degraded land 12 5 0.25 1
B. Global estimates(a) Improved management within a land use
Cropland management 1 300 30 0.3 125Grazing land management 3 400 10 0.7 240Agroforestry 400 20 0.3 26Rice paddies 150 50 0.1 7
(b) Land-use changeConversion of cropland to grassland 630 20 3.1 390Agroforestry 1 500 3 0.8 38Wetland restoration 230 5 0.4 4Restoring severely degraded land 280 5 0.3 3
Table 3.6Potential for net change in carbon
stocks in 2010 through selectedimproved management strategies
and changed land-use activities inselected countries
(source: IPCC (2000) Annex 1countries are the developed countries)
CHAPTER 4
ADAPTATION STRATEGIES REQUIRED TO REDUCEVULNERABILITY IN AGRICULTURE AND FORESTRY TOCLIMATE CHANGE, CLIMATE VARIABILITY AND CLIMATEEXTREMES (by H.P. Das)
Climate change will affect agriculture through effects on crops, soils, insects, weedsand diseases, and livestock. Climatic conditions interact with agriculture throughnumerous and diverse mechanism ranging from effects of carbon dioxideconcentration on tissue-and organ-specific photosynthate allocation, eutrophicationand acidification of soils, and the survival and distribution of pest populations tocrop breeding aims, animal shelter requirements, and the location of production.Favourable weather and climate is central to success in agriculture. As a result,farmers, agronomists, soil scientists, agricultural engineers, crop and livestockbreeders, and scientists, with expertise on pests and their control, have, in one wayor another, devoted much of their efforts to taking advantage of favourable climaticconditions and limiting exposure to losses due to the extreme events and variationsin climate. This focus on climate and natural resource conditions has generated vastinformation on the detailed response of crop and livestock varieties to climate andweather and a wide array of varieties and technologies that are or can be used acrossthe varied climates of world.
One aspect of the problem that has received considerable attention isadaptation. Adaptation is both fascinating and difficult because it focuses on theinteraction between systems and in particular the interaction between physical andsocial systems. Evaluating the scope or potential for adaptation requires a descriptionof the physical world and its constraints. Evaluating whether this potential can berealised requires an understanding of the response of decision makers and theconstraints and capacities of social systems. Historically, agriculture has proved tobe highly adaptive to changing technology, resource conditions and increasingdemands, providing evidence of the potential for agriculture to adapt to changingclimate. But, adaptation to historic changes has not been without cost ordislocation. And, whether the evidence that agriculture has adapted in the past isrelevant to the problems of changing climate remains open to scientific debate.
Adaptation to climate change presents some unique difficulties. The high degree ofnormal weather variability in many regions means that effectively detecting whetherclimate has actually changed is not straightforward. Errors of over- and under-weighting new information are possible. Farmers may switch to longer maturingvarieties believing the climate has warmed and seasons have lengthened only tosuffer frost damage when the apparent warming was short-lived. Or, they may remainwith shorter maturing varieties, possibly suffering yield loss because of a shortenedgrain filling period as development is pushed by warmer temperatures, regretting thatthey had not moved to a longer maturing varieties. And, since only after a numberof years can statistical significance to observations of success and failure bedeveloped; it will not be easy to know whether one has adjusted correctly or not.
Vulnerability, appropriately defined, can be useful for decision making. Vulnerabilityas generally used in the impact literature incorporates the idea of potential fornegative consequences which are difficult to ameliorate through adaptive measuresgiven the range of possible climate changes that might reasonably occur. Defining anarea as vulnerable is, thus, not a prediction of negative consequences of climatechange; it is an indication that across the range of possible climate changes, thereare some climate outcomes that would lead to relatively negative consequences.
4.1.3VULNERABILITY TO CLIMATE
CHANGE AND ITS DIMENSIONS
4.1.2PROBLEMS ASSOCIATED WITH
ADAPTATION TO CLIMATE CHANGE
4.1AN OVERVIEW OF
ADAPTATION STRATEGIESTO REDUCE VULNERABILITY
OF AGRICULTURE TOCLIMATE CHANGE AND
CLIMATE VARIABILITY4.1.1
INTRODUCTION
Across possible climates, almost any region faces some chance of loss, so nearly allregions are vulnerable. Quantification can make the concept much more useful. Wemay like to know the relatively more vulnerable populations or the relatively morevulnerable regions. A targeted strategy to reduce vulnerability would start with thesepopulations or regions. Vulnerability depends on the unit of observation and thegeographic scale considered. Vulnerability can be defined at different scalesincluding yield, farm or farm sector, regional economic or hunger vulnerability.
Yields are relatively more vulnerable if a small change in climate results in alarge change in yield. Farmer or farm sector vulnerability is measured in terms ofimpact on profitability or viability of the farming system. Regional economicvulnerability reflects the sensitivity of the regional or national economy to farmsector impacts. Hunger vulnerability is an “aggregate measure of the factors thatinfluence exposure to hunger and pre-disposition to its consequences” involving“interactions of climate change, resource constraints, population growth andeconomic development” (Downing, 1992; Bohl et al., 1994).
The one relatively robust conclusion is that the mean temperature will go up formost regions due to climatic change but increase in mean temperature appears notto be that important compared with changes in variability, extremes, storminess andprecipitation. Of the dimensions of climate change relevant to agriculture-temperature extremes, seasonality, diurnal variation, precipitation and extremeevents, we have little confidence in global climate model (GCM) predictions.Comparisons of GCMs at regional level much below continental scale show a widerange of outcomes, generally including both precipitation increases or decreases.The range of possible outcomes means that nearly every system at nearly any scalehas some potential vulnerability. It also means there is little information content inregional climatic predictions that can distinguish vulnerability – all regions facenearly the same broad and flat distribution of possible climate outcomes.
There is more reliable information content on existing conditions of agricultureand socio-economic groups. If you are poor and currently at risk of hunger, climatechange is more likely to make you hungry than you are rich and well fed. If you growmaize in the heart of an area with nearly ideal conditions (e.g., the USA Corn Belt)you are less vulnerable than your counterparts on the fringe.
While perhaps most difficult to evaluate, vulnerability in terms of hunger andmalnutrition ought to be the first concern. But the focus on hunger does not meanthat other types of vulnerability are unimportant. Regional economic development,land degradation, or increased environmental stress, resulting from agriculturalproduction under a changed climate, are important concerns as well. A major reasonfor identifying vulnerabilities of different types and at different scales is to betterunderstand what can or might be done to guard against potential losses or, for thatmatter, take advantage of potential opportunities. Identifying locations that arevulnerable to yield loss due to increases in the likelihood of extreme heat duringcritical crop development may suggest consideration of alternative varieties.
The potential impacts of climate change on agriculture are highly uncertain. Thelarge number of studies conducted over the past few years for many different sitesacross the world show few, if any, robust conclusions of either the magnitude ordirection of impact for individual countries or regions.
The main conclusion that does emerge from impact studies is that climatechange has the potential to change significantly the productivity of agriculture inmost locations. Some currently highly productive areas may become much lessproductive. Some currently marginal areas may benefit substantially while othersmay become unproductive. Crop yield studies show regional variations of +20, 30 ormore per cent in some areas and equal size losses in other areas. Most areas canexpect change and will need to adapt, but the direction of change, particularly ofprecipitation, and required adaptations currently cannot be predicted. Nor may itever be possible to predict them with confidence. Current evidence suggests that
4.1.5IMPACT OF CLIMATE CHANGE ON
AGRICULTURAL PRODUCTION
4.1.4ASSESSING VULNERABILITY
42 MANAGEMENT STRATEGIES IN AGRICULTURE AND FORESTRY FOR MITIGATION OF GREENHOUSE GAS EMISSIONS AND
ADAPTATION TO CLIMATE VARIABILITY AND CLIMATE CHANGE
poleward regions where agriculture is limited by short growing seasons are morelikely to gain while subtropical and tropical regions may be more likely to sufferdrought and losses in productivity. However, these broad conclusions hardly providethe basis for mapping out a long-term strategy for agricultural adaptation. Thus,policy must retain flexibility to respond as conditions change.
Table 4.1 (see page 44) summarises the results of the large number of studies of climatechange impact on potential crop production. While the table does not provide thedetail on the range of specific studies, methods and climate scenarios evaluated, itprovides an indication of the wide range of estimates. The general conclusion of globalstudies, that tropical areas may be more likely to suffer negative consequences, is partlysupported by the results in the table. For Europe, the United States and Canada, andfor Asia (including China) and the Pacific Rim, where many more studies have beenconducted, the results generally range from severe negative effects (-60, -70 per cent,or complete crop failure) to equally large potential yield increases.
The wide ranges of estimates are due to several, as yet unresolved, factors.Differences among climate scenarios are important and these can generate wideranges of impacts even when using identical methods for the same regions. Forexample, a study of the potential impact on rice yields conducted for most of thecountries of South and Southeast Asia and for China, Japan and Korea using thesame crop model found yield changes for India to range from -3 to +28 per cent, forMalaysia from +2 to +27 per cent, for the Philippines from -14 to +14 per cent andfor mainland China from -18 to -4 per cent (Matthews et al., 1994a, b) depending onwhether the Goddard Institute for Space Studies (GISS), Geophysical FluidDynamics Laboratory (GFDL) or United Kingdom Meteorological Office (UKMO)climate scenario was used.
The impacts across sites can vary widely within a region. Thus, how many andwhich sites are chosen to represent a region and how the site-specific estimates areaggregated can have important effects on the results. Studies for the United Statesand Canada demonstrate the wide range of impacts across sites with total or near-total crop failures every year projected for wheat and soyabeans at one site in theUnited States (Rosenzweig et al., 1994) but wheat yield increases of 180 to 230 percent for other sites in the United States and Canada (Rosenzweig et al., 1994;Brklacich et al., 1994).
Whether and how changes in a crop variety are specified in a study can have alarge impact. Studies conducted on wheat response in Australia found impactsranging from -34 to +65 per cent for the same climate scenario and site dependingon which known and currently grown wheat cultivar was specified in the crop model(Wang et al., 1992). Similarly, Matthews et al. (1994a, b) concluded that the severeyield losses in South, Southeast and East Asia for rice in many scenarios was due toa threshold temperature effect that caused spikelet sterility. Thus, an impact analysisthat narrowly specifies a crop variety is likely to generate a much different estimateimpact than an analysis that specifies responses on the basis of the genetic variationsacross existing cultivars. Some studies have attempted to evaluate how future cropbreeding may change the range of genetic variability available in future varieties(Easterling et al., 1993).
Finally, the estimated amount of adaptation likely to be undertaken by farmersvaries. Fundamental views about how the farm sector responds to changingconditions (of any kind) shape the choice of methodological approach and thesemethodological approaches can give apparently widely different estimates of impact.Specification of the crop variety in a crop response model illustrates this difference.For some analysts, the prospect that farmers will not change the variety of cropgrown over the next 100 years as climate, technology, prices and other factorschange, is so remote that they choose to represent change among varieties as anessentially autonomous response of the farm sector. Other analysts choose morespecific crop variety characteristics, viewing even crop variety change as neitherautomatic nor without cost. For example, different varieties of wheat produce flours
4.1.5.1Regional crop responses
CHAPTER 4—ADAPTATION STRATEGIES REQUIRED TO REDUCE VULNERABILITY IN AGRICULTURE AND FORESTRY 43
TO CLIMATE CHANGE, CLIMATE VARIABILITY AND CLIMATE EXTREMES
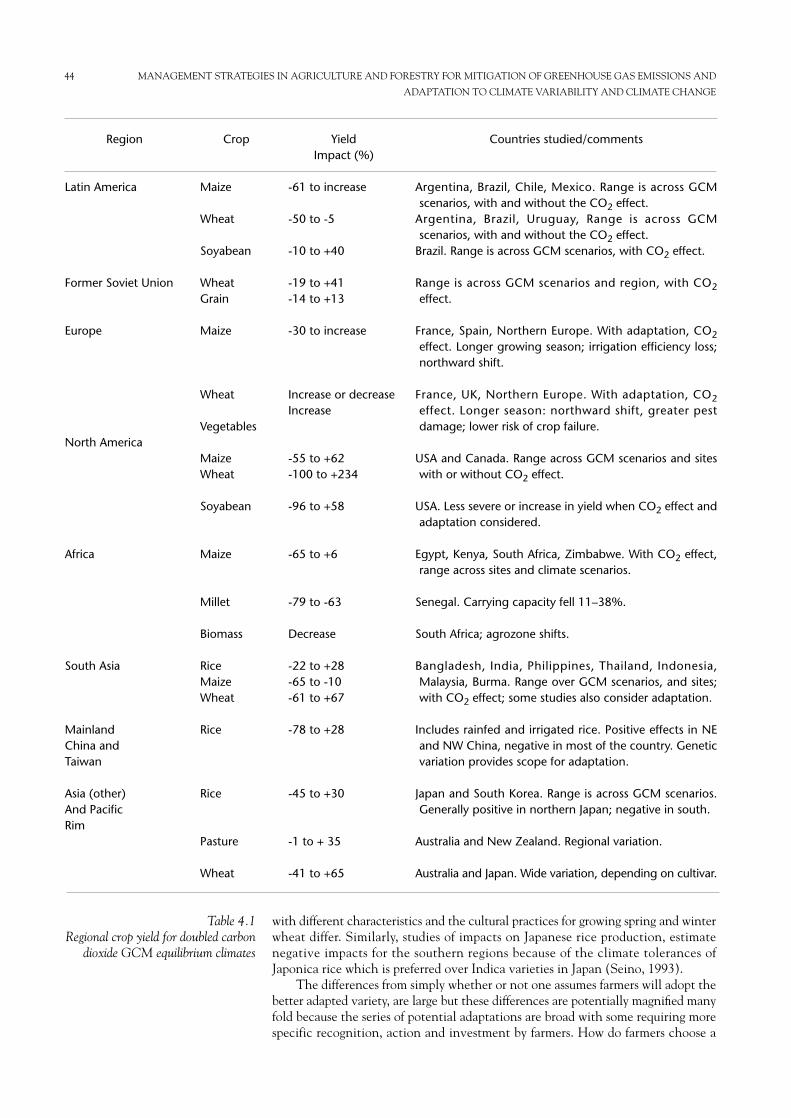
with different characteristics and the cultural practices for growing spring and winterwheat differ. Similarly, studies of impacts on Japanese rice production, estimatenegative impacts for the southern regions because of the climate tolerances ofJaponica rice which is preferred over Indica varieties in Japan (Seino, 1993).
The differences from simply whether or not one assumes farmers will adopt thebetter adapted variety, are large but these differences are potentially magnified manyfold because the series of potential adaptations are broad with some requiring morespecific recognition, action and investment by farmers. How do farmers choose a
44 MANAGEMENT STRATEGIES IN AGRICULTURE AND FORESTRY FOR MITIGATION OF GREENHOUSE GAS EMISSIONS AND
ADAPTATION TO CLIMATE VARIABILITY AND CLIMATE CHANGE
Region
Latin America
Former Soviet Union
Europe
North America
Africa
South Asia
MainlandChina andTaiwan
Asia (other)And PacificRim
Crop
Maize
Wheat
Soyabean
WheatGrain
Maize
Wheat
Vegetables
MaizeWheat
Soyabean
Maize
Millet
Biomass
RiceMaizeWheat
Rice
Rice
Pasture
Wheat
Yield Impact (%)
-61 to increase
-50 to -5
-10 to +40
-19 to +41-14 to +13
-30 to increase
Increase or decreaseIncrease
-55 to +62-100 to +234
-96 to +58
-65 to +6
-79 to -63
Decrease
-22 to +28-65 to -10-61 to +67
-78 to +28
-45 to +30
-1 to + 35
-41 to +65
Countries studied/comments
Argentina, Brazil, Chile, Mexico. Range is across GCMscenarios, with and without the CO2 effect.
Argentina, Brazil, Uruguay, Range is across GCMscenarios, with and without the CO2 effect.
Brazil. Range is across GCM scenarios, with CO2 effect.
Range is across GCM scenarios and region, with CO2effect.
France, Spain, Northern Europe. With adaptation, CO2effect. Longer growing season; irrigation efficiency loss;northward shift.
France, UK, Northern Europe. With adaptation, CO2effect. Longer season: northward shift, greater pestdamage; lower risk of crop failure.
USA and Canada. Range across GCM scenarios and siteswith or without CO2 effect.
USA. Less severe or increase in yield when CO2 effect andadaptation considered.
Egypt, Kenya, South Africa, Zimbabwe. With CO2 effect,range across sites and climate scenarios.
Senegal. Carrying capacity fell 11–38%.
South Africa; agrozone shifts.
Bangladesh, India, Philippines, Thailand, Indonesia,Malaysia, Burma. Range over GCM scenarios, and sites;with CO2 effect; some studies also consider adaptation.
Includes rainfed and irrigated rice. Positive effects in NEand NW China, negative in most of the country. Geneticvariation provides scope for adaptation.
Japan and South Korea. Range is across GCM scenarios.Generally positive in northern Japan; negative in south.
Australia and New Zealand. Regional variation.
Australia and Japan. Wide variation, depending on cultivar.
Table 4.1Regional crop yield for doubled carbon
dioxide GCM equilibrium climates
planting date – by planting at the same time each year regardless of weatherconditions or by planting when soil temperatures are sufficient for crop growth,when the rainy season starts, or when the fields can be tilled? If the decision is partlykeyed to weather conditions, then the farm decision-making process will lead tosome amount of autonomous adjustment to climate change. Similarly, will thechanges in tillage and irrigation practices, crop rotation schemes, crops and cropprocessing and harvesting that are likely to occur over the next 100 years due tomany factors, also reflect changes in climate that are occurring simultaneously, orwill farmers be unable to detect climate change and therefore fail to adapt thesesystems; becoming and remaining ill-adapted to the climate conditions occurringlocally? If they adapt to current conditions (but cannot confidently look ahead) howmaladjusted will their long-lived investments be after 3, 5, 10 or 20 years ofcontinuous changes in climate?
Adaptation is concerned with responses to both adverse and positive effects ofclimate change. It refers to any adjustment – whether passive, reactive onanticipatory – that can respond to anticipated or actual consequences associatedwith climate change. Measures to adjust to climate change should be taken both onan individual level and by society as a whole. The search for more resilient cropsshould be intensified, vulnerable coastlines should be defended by sea walls andimproved weather forecasts may permit better preparation for extreme weatherevents. On an individual level, farmers may change crops or adjust planting dates,households will increase their demand for air conditioning, people may stop buildingin or move away from flood prone plains (IPCC, 1996).
Adaptation options have two purposes:• To reduce the damages from climate change; and• To increase the resilience of societies and ecosystems to the aspects of climate
change that cannot be avoided.Clearly, adaptation measures are inter-linked with mitigation measures. The
more one succeeds in limiting climate change the easier it will be to adapt to it.Three types of adaptation measures are commonly distinguished: protection, retreatand accommodation.
There are no comprehensive surveys of the various adaptation options and theircosts, probably because adaptation covers such a broad range of potential action andalso because of the large uncertainties surrounding these options. The literature onthe subject is limited but growing. In any case, it is clear that society now alreadyincurs large costs in adapting to climate extremes; climate change will just increasethe costs.
Adaptation in various degrees and in some form or the other may be necessaryto cope with ecosystem changes that have interfaces with human activities. Theextent of these changes and their subsequent impact on human affairs will dependon the sequence, security and characteristics of the climatic changes that initiatedthem. Changes in temperature and associated rainfall regimes lead to more droughtsin some localities and heavier rainfall in others, thus affecting worldwide surface andgroundwater availability, which in turn will affect agronomic practices and yields inagriculture. Fisheries and forestry will be affected by changes in temperature and theavailability and quality of water (e.g. salinity). Temperature rise may also affectlivestock populations and output through heat stress and climate-related influenceson infestations of parasites, insects and disease.
Climate change may cause accelerated sea level rise, possibility attended byincreased flooding, changes in regional temperature, increases in the frequency ofstorms and hurricanes and changes in the mean value and variability ofprecipitation.
Options for adapting to sea level rise can generally be categorised as retreat,accommodation or protection. Accommodation to sea level rise involves not onlythe adaptation of existing structures to a higher sea level but also a variety of otherresponses, such as the elimination of subsidised insurance in industrialised countries
4.1.6ADAPTATION
CHAPTER 4—ADAPTATION STRATEGIES REQUIRED TO REDUCE VULNERABILITY IN AGRICULTURE AND FORESTRY 45
TO CLIMATE CHANGE, CLIMATE VARIABILITY AND CLIMATE EXTREMES
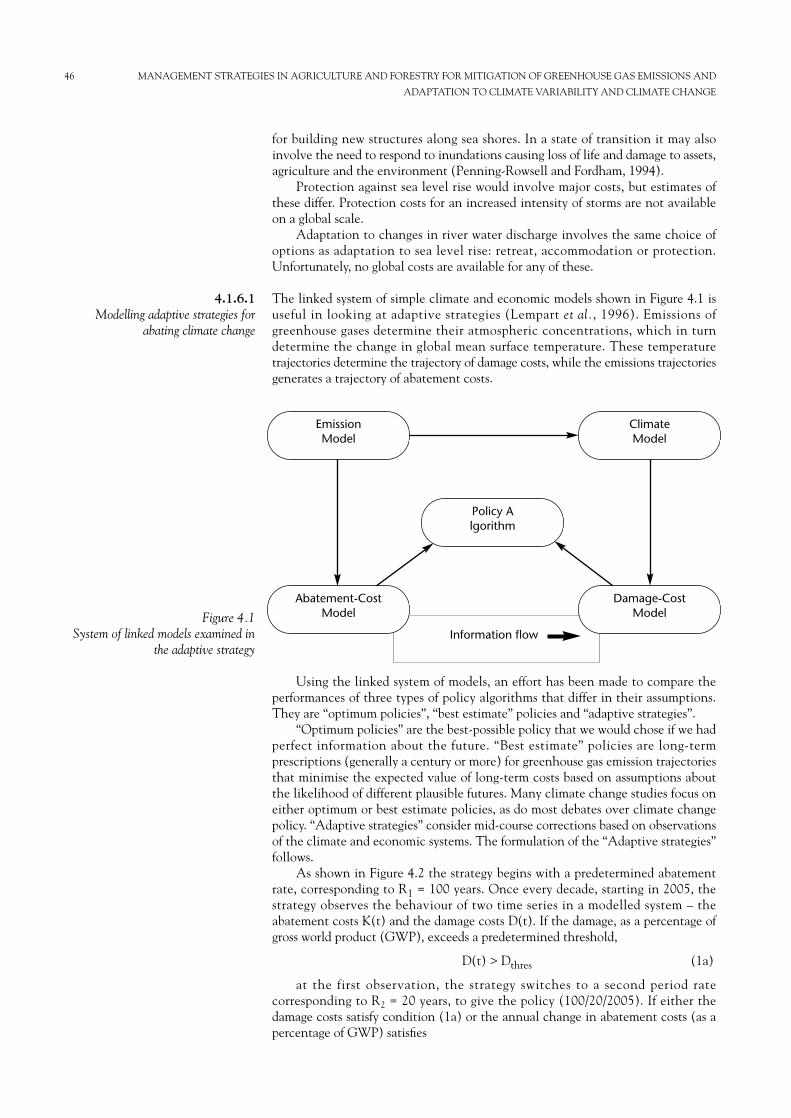
for building new structures along sea shores. In a state of transition it may alsoinvolve the need to respond to inundations causing loss of life and damage to assets,agriculture and the environment (Penning-Rowsell and Fordham, 1994).
Protection against sea level rise would involve major costs, but estimates ofthese differ. Protection costs for an increased intensity of storms are not availableon a global scale.
Adaptation to changes in river water discharge involves the same choice ofoptions as adaptation to sea level rise: retreat, accommodation or protection.Unfortunately, no global costs are available for any of these.
The linked system of simple climate and economic models shown in Figure 4.1 isuseful in looking at adaptive strategies (Lempart et al., 1996). Emissions ofgreenhouse gases determine their atmospheric concentrations, which in turndetermine the change in global mean surface temperature. These temperaturetrajectories determine the trajectory of damage costs, while the emissions trajectoriesgenerates a trajectory of abatement costs.
Using the linked system of models, an effort has been made to compare theperformances of three types of policy algorithms that differ in their assumptions.They are “optimum policies”, “best estimate” policies and “adaptive strategies”.
“Optimum policies” are the best-possible policy that we would chose if we hadperfect information about the future. “Best estimate” policies are long-termprescriptions (generally a century or more) for greenhouse gas emission trajectoriesthat minimise the expected value of long-term costs based on assumptions aboutthe likelihood of different plausible futures. Many climate change studies focus oneither optimum or best estimate policies, as do most debates over climate changepolicy. “Adaptive strategies” consider mid-course corrections based on observationsof the climate and economic systems. The formulation of the “Adaptive strategies”follows.
As shown in Figure 4.2 the strategy begins with a predetermined abatementrate, corresponding to R1 = 100 years. Once every decade, starting in 2005, thestrategy observes the behaviour of two time series in a modelled system – theabatement costs K(t) and the damage costs D(t). If the damage, as a percentage ofgross world product (GWP), exceeds a predetermined threshold,
D(t) > Dthres (1a)
at the first observation, the strategy switches to a second period ratecorresponding to R2 = 20 years, to give the policy (100/20/2005). If either thedamage costs satisfy condition (1a) or the annual change in abatement costs (as apercentage of GWP) satisfies
4.1.6.1Modelling adaptive strategies for
abating climate change
46 MANAGEMENT STRATEGIES IN AGRICULTURE AND FORESTRY FOR MITIGATION OF GREENHOUSE GAS EMISSIONS AND
ADAPTATION TO CLIMATE VARIABILITY AND CLIMATE CHANGE
Policy Algorithm
Information flow
ClimateModel
Abatement-CostModel
Damage-CostModel
Emission Model
Figure 4.1 System of linked models examined in
the adaptive strategy
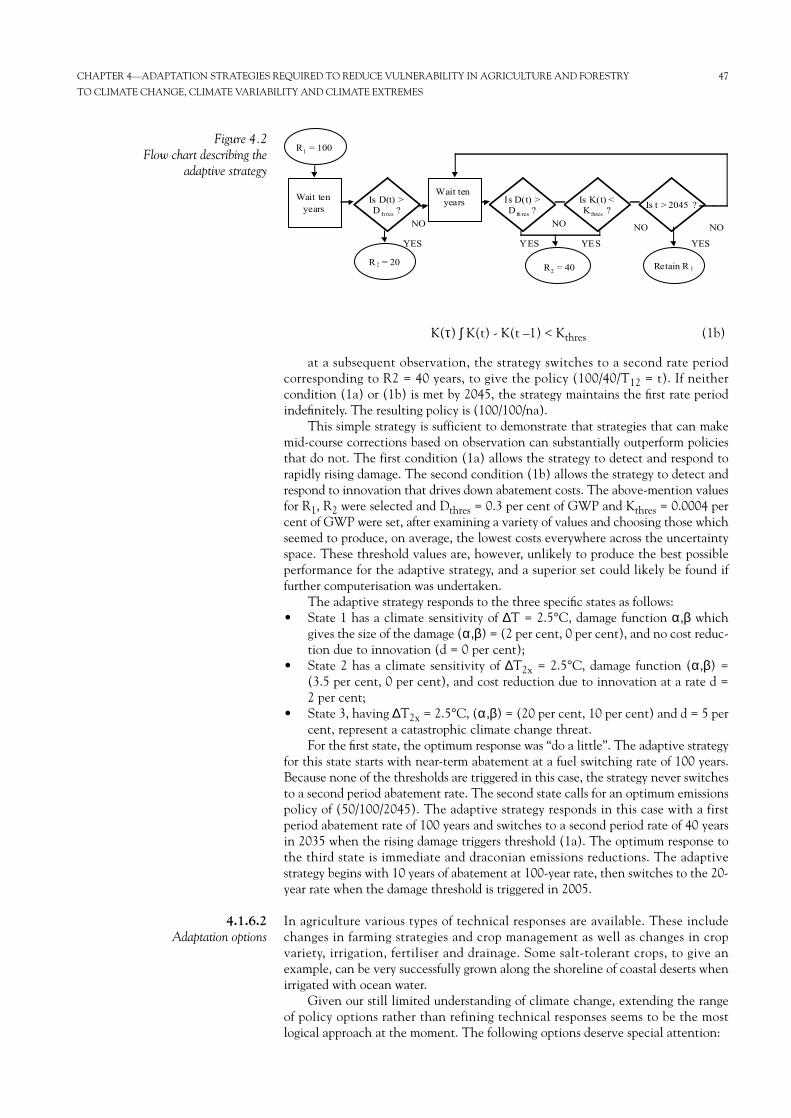
K(τ) ∫ K(t) - K(t –1) < Kthres (1b)
at a subsequent observation, the strategy switches to a second rate periodcorresponding to R2 = 40 years, to give the policy (100/40/T12 = t). If neithercondition (1a) or (1b) is met by 2045, the strategy maintains the first rate periodindefinitely. The resulting policy is (100/100/na).
This simple strategy is sufficient to demonstrate that strategies that can makemid-course corrections based on observation can substantially outperform policiesthat do not. The first condition (1a) allows the strategy to detect and respond torapidly rising damage. The second condition (1b) allows the strategy to detect andrespond to innovation that drives down abatement costs. The above-mention valuesfor R1, R2 were selected and Dthres = 0.3 per cent of GWP and Kthres = 0.0004 percent of GWP were set, after examining a variety of values and choosing those whichseemed to produce, on average, the lowest costs everywhere across the uncertaintyspace. These threshold values are, however, unlikely to produce the best possibleperformance for the adaptive strategy, and a superior set could likely be found iffurther computerisation was undertaken.
The adaptive strategy responds to the three specific states as follows:• State 1 has a climate sensitivity of ∆T = 2.5°C, damage function α,β which
gives the size of the damage (α,β) = (2 per cent, 0 per cent), and no cost reduc-tion due to innovation (d = 0 per cent);
• State 2 has a climate sensitivity of ∆T2x = 2.5°C, damage function (α,β) =(3.5 per cent, 0 per cent), and cost reduction due to innovation at a rate d =2 per cent;
• State 3, having ∆T2x = 2.5°C, (α,β) = (20 per cent, 10 per cent) and d = 5 percent, represent a catastrophic climate change threat.For the first state, the optimum response was “do a little”. The adaptive strategy
for this state starts with near-term abatement at a fuel switching rate of 100 years.Because none of the thresholds are triggered in this case, the strategy never switchesto a second period abatement rate. The second state calls for an optimum emissionspolicy of (50/100/2045). The adaptive strategy responds in this case with a firstperiod abatement rate of 100 years and switches to a second period rate of 40 yearsin 2035 when the rising damage triggers threshold (1a). The optimum response tothe third state is immediate and draconian emissions reductions. The adaptivestrategy begins with 10 years of abatement at 100-year rate, then switches to the 20-year rate when the damage threshold is triggered in 2005.
In agriculture various types of technical responses are available. These includechanges in farming strategies and crop management as well as changes in cropvariety, irrigation, fertiliser and drainage. Some salt-tolerant crops, to give anexample, can be very successfully grown along the shoreline of coastal deserts whenirrigated with ocean water.
Given our still limited understanding of climate change, extending the rangeof policy options rather than refining technical responses seems to be the mostlogical approach at the moment. The following options deserve special attention:
4.1.6.2Adaptation options
CHAPTER 4—ADAPTATION STRATEGIES REQUIRED TO REDUCE VULNERABILITY IN AGRICULTURE AND FORESTRY 47
TO CLIMATE CHANGE, CLIMATE VARIABILITY AND CLIMATE EXTREMES
Wait tenyears
Is D(t) >Dth res ?
Wait tenyears Is t > 2045 ?
Is K(t) <Kthres ?
Is D(t) >Dth res ?
R2 = 20 Retain R 1
R1 = 100
YES YES YES YES
NO NONONO
R2 = 40
Figure 4.2Flow chart describing the
adaptive strategy
• Capacity building, in both industrialised and developing countries, to educatepeople in the former about the effects of their activities on carbon-trapping biota, and people in the latter about responses to the effects of naturalclimatic variability and of potential future climate change;
• Changes in land-use allocation, including developing the potential of tropicalplant species. Since most of the world’s plant food comes from only 20 species,the potential of the vast majority of plant species is still to be developed;
• Improvements in food security policies and reduction of post harvest losses.Given that post harvest losses, due to deficient systems of storage and trans-port, amount in many developing countries to 50 per cent of production, ormore, there is major scope for improvement;
• Conversion to “controlled environment agriculture”. Large-scale introductionof integrated “controlled environment agriculture” in developing countriesmight easily require an investment of several tens of billions of dollars, or billions of dollars per annum if introduced over decades;
• Aquaculture. Climate change affects ocean circulation in the upper layers,upwelling and ice extent, all of which affect marine biological production andhence, marine fisheries. One way to adapt is to intensify aquaculture develop-ment. Integrating aquaculture with “controlled environment agriculture” hasgreat potential, given recent dramatic advances in marine biotechnology. Themost sterile, nutrient-rich bottom water from Ocean Thermal EnergyConversion (OTEC) systems holds considerable promise as a culture mediumfor kelp, abalone, oysters and a range of fish species.
The main potential changes in soil-forming factors (forcing variables) directlyresulting from global change would be in organic matter supply from biomass, soiltemperature regime and soil hydrology, the latter because of shifts in rainfall zones aswell as changes in potential evapotranspiration.
As part of the soil-plant-atmosphere continuum, soils influence speciesdistribution, productivity, water and biogeochemical cycling, and underpin theability of land to grow crops and to support grazing. Changes in soil properties,arising from climate change, will have profound implications for agriculture, givenboth the timescales and spatial coverage over which soil processes can operate.Furthermore, soils are a non-renewable resource and many soil processes areirreversible at “reasonable” economic costs. As such, soils and their dynamics haveincreasingly become a central feature both of the agricultural impacts and widerclimate change debate.
The biggest single change in soils expected as a result of climate change wouldbe a gradual improvement in fertility and physical conditions of soils in humid andsub-humid climates. Another major change would be the poleward retreat of thepermafrost boundary, discussed by Goryachkin and Targulian (1990). Certaintropical soils with low physio-chemical activity, such as in the Amazon region, mayundergo a radical change from one major soil-forming process to another(Sombroek, 1990).
Higher atmospheric carbon dioxide concentration, increases growth rates and water-use efficiency of crops and natural vegetation in so far as other factors do notbecome limiting.
The increased productivity is generally accompanied by more litter or cropresidues, a greater total root mass and root exudation, increased mycorrhizalcolonisation and activity of other rhizosphere or soil micro-organisms, includingsymbiotic and root-zone nitrogen fixers. The latter would have a positive effect onnitrogen supply to crops or vegetation. The increased microbial and root activity inthe soil would entail higher carbon dioxide partial pressure in soil air and carbondioxide activity in soil water, hence increased rates of plant nutrient release (e.g.potassium, manganese, micro-nutrients) from weathering of soil minerals. Similarly,the mycorrhizal activity would lead to better phosphate uptake. These effects would
4.2.2EFFECTS OF HIGHER CARBON
DIOXIDE ON SOIL PROPERTIES AND
PRODUCTIVITY
4.2IMPACT OF CLIMATE
CHANGE ONAGRICULTURAL SOILS AND
ADAPTATION MEASURES
4.2.1INTRODUCTION
48 MANAGEMENT STRATEGIES IN AGRICULTURE AND FORESTRY FOR MITIGATION OF GREENHOUSE GAS EMISSIONS AND
ADAPTATION TO CLIMATE VARIABILITY AND CLIMATE CHANGE
be in synergy with better nutrient uptake by the more intensive root system due tohigher atmospheric carbon dioxide concentration.
The greater microbial activity tends to increase the quantity of plant nutrientscycling through soil organisms. The increased production of root material tends toraise soil uptake by the root mat, and would provide more time for incorporationinto the soil by earthworms, termites, etc. Higher soil temperatures would counteractincreases in “stable” organic matter content, which also entails the temporaryimmobilisation and cycling of greater quantities of plant nutrients in the soil. Highercarbon-nitrogen ratios in litter, would entail slower decomposition and slower re-mobilisation of the plant nutrients from the litter and soil organic matter contentbut would further stimulate microbial activity.
The greater stability and the faster infiltration increase the resilience of the soilagainst water erosion and consequent loss of soil fertility. The increased proportionof bypass flow also decreases the nutrient loss by leaching during periods with excessrainfall. This refers to the available nutrients in the soil, including well-incorporatedfertilisers or manure, but not to fertilisers broadcast on the soil surface. These aresubject to loss by runoff or leaching.
These changes increase the resilience of the soil against physical degradationand nutrient loss by increased intensity, seasonality or variability of rainfall, as wellas against some of the unfavourable changes in rate or direction of soil-formingprocesses.
In most cases, changes in soils by direct human action, on-site or off-site are fargreater than the direct climate-induced effects. Soil management measures designedto optimise the soil’s sustained productive capacity would therefore be generallyadequate to counteract any degradation of agricultural land by climate change. Soilsof natural areas, or other land with low intensity management such as semi-naturalforests used for extraction of wood and other products, are less readily protectedagainst the effects of climate change but such soils, too, are threatened less byclimate change than by human actions. These can be off-site, such as pollution byacid deposition, or on-site, such as excessive nutrient extraction under very low-input agriculture.
Soil properties are determined by a diverse range of soil process, which can bephysical, chemical or biological; and which can occur at different rates. Soils arecomplex components of all terrestrial ecosystems. The response of soils to climatechange will derive from changes in the rates of these processes, and will ultimatelylead to changes in soil properties with far-reaching implications. However, most soilprocesses are not at equilibrium, as shown by the major changes in soils over the last50 years. The rate and nature of soil processes are themselves influenced by soilproperties. Soil processes will be influenced directly by temperature, precipitationand atmospheric carbon dioxide changes, particularly as these effect the soil waterregime and plant growth, and indirectly by climate-induced changes in land use andmanagement. In turn, changes in soils will affect the composition and structure ofvegetation and feedback to the climate system.
Soils may respond to climate change through the influence of more than onesoil process, and a summary of these influences is given in Table 4.2 (see page 50).The table also indicates the climatic drivers of change, the likely timescale of anyresponse and whether the processes are reversible or not (Rounsevell et al., 1999).
Soil moisture has a substantial influence on the range of soil processes. Changes in soilwater fluxes will also feedback to the climate system itself, whereby enhanced soildrying can exacerbate and even perpetuate drought conditions by decreasing availablemoisture, altering circulation patterns vital to storm development, and increasing airtemperatures (McCorcle, 1990). Soil water contents are controlled by the processesof infiltration, percolation, runoff and drainage and respond rapidly to variability inthe amounts and distribution of precipitation or the addition of irrigation. Temperaturechanges also impact on soil water contents through their influence on
4.2.3.1Impact on soil water
4.2.3SOIL DYNAMICS AND THE
IMPLICATIONS FOR AGRICULTURE
CHAPTER 4—ADAPTATION STRATEGIES REQUIRED TO REDUCE VULNERABILITY IN AGRICULTURE AND FORESTRY 49
TO CLIMATE CHANGE, CLIMATE VARIABILITY AND CLIMATE EXTREMES
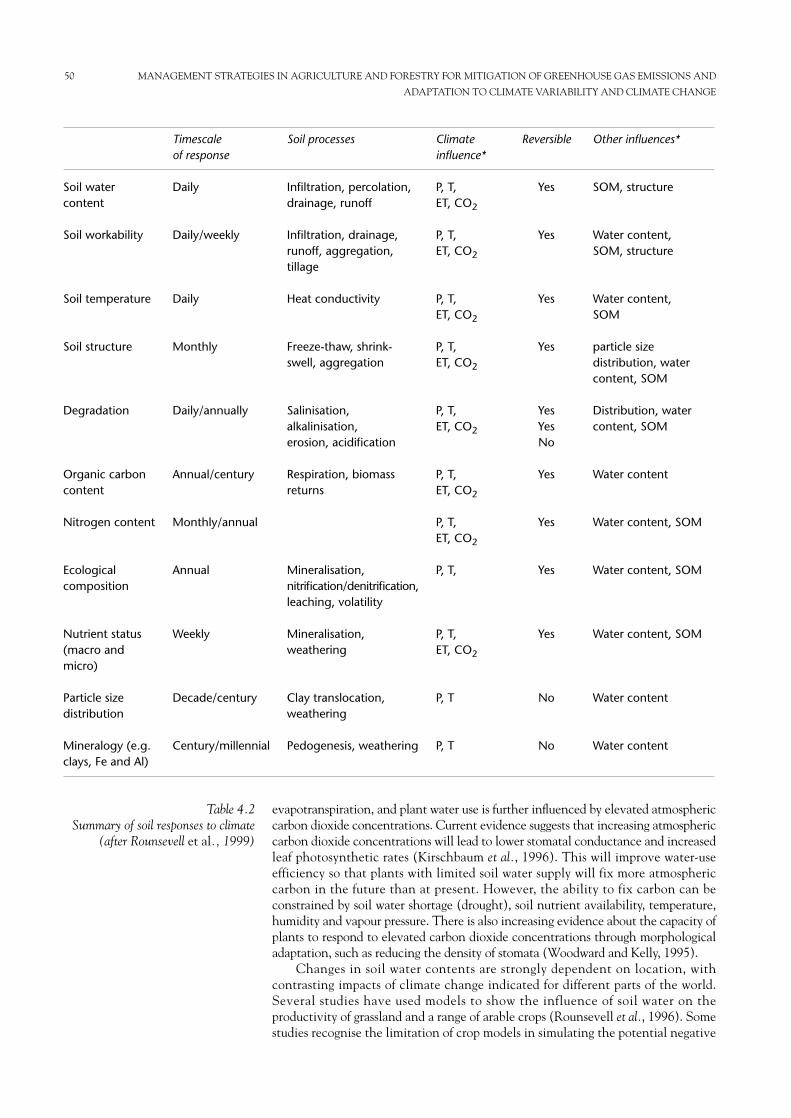
evapotranspiration, and plant water use is further influenced by elevated atmosphericcarbon dioxide concentrations. Current evidence suggests that increasing atmosphericcarbon dioxide concentrations will lead to lower stomatal conductance and increasedleaf photosynthetic rates (Kirschbaum et al., 1996). This will improve water-useefficiency so that plants with limited soil water supply will fix more atmosphericcarbon in the future than at present. However, the ability to fix carbon can beconstrained by soil water shortage (drought), soil nutrient availability, temperature,humidity and vapour pressure. There is also increasing evidence about the capacity ofplants to respond to elevated carbon dioxide concentrations through morphologicaladaptation, such as reducing the density of stomata (Woodward and Kelly, 1995).
Changes in soil water contents are strongly dependent on location, withcontrasting impacts of climate change indicated for different parts of the world.Several studies have used models to show the influence of soil water on theproductivity of grassland and a range of arable crops (Rounsevell et al., 1996). Somestudies recognise the limitation of crop models in simulating the potential negative
50 MANAGEMENT STRATEGIES IN AGRICULTURE AND FORESTRY FOR MITIGATION OF GREENHOUSE GAS EMISSIONS AND
ADAPTATION TO CLIMATE VARIABILITY AND CLIMATE CHANGE
Soil watercontent
Soil workability
Soil temperature
Soil structure
Degradation
Organic carboncontent
Nitrogen content
Ecologicalcomposition
Nutrient status(macro andmicro)
Particle sizedistribution
Mineralogy (e.g.clays, Fe and Al)
Timescale of response
Daily
Daily/weekly
Daily
Monthly
Daily/annually
Annual/century
Monthly/annual
Annual
Weekly
Decade/century
Century/millennial
Soil processes
Infiltration, percolation,drainage, runoff
Infiltration, drainage,runoff, aggregation,tillage
Heat conductivity
Freeze-thaw, shrink-swell, aggregation
Salinisation,alkalinisation, erosion, acidification
Respiration, biomassreturns
Mineralisation,nitrification/denitrification,leaching, volatility
Mineralisation,weathering
Clay translocation,weathering
Pedogenesis, weathering
Climateinfluence*
P, T, ET, CO2
P, T,ET, CO2
P, T,ET, CO2
P, T,ET, CO2
P, T,ET, CO2
P, T,ET, CO2
P, T,ET, CO2
P, T,
P, T,ET, CO2
P, T
P, T
Reversible
Yes
Yes
Yes
Yes
YesYesNo
Yes
Yes
Yes
Yes
No
No
Other influences*
SOM, structure
Water content, SOM, structure
Water content, SOM
particle sizedistribution, watercontent, SOM
Distribution, watercontent, SOM
Water content
Water content, SOM
Water content, SOM
Water content, SOM
Water content
Water content
Table 4.2Summary of soil responses to climate
(after Rounsevell et al., 1999)
effects of excess water (Maytin et al., 1995), with the important consequences thishas for soil erosion (Favis-Mortlock et al., 1991), nutrient leaching (Ramos et al.,1994) and workability (Rounsevell and Brignall, 1994). Because of these limitations,better treatment of soil properties and management practices represent a majorchallenge for the future modelling of agriculture and climate change. Such researchalso has important implications for climate change impacts on catchment hydrology(Arnell, 1992).
Soil temperature is directly related to air temperatures, so that warmer soils will arisefrom a warmer world, although the conductivity of heat through soil is mediated bythe mineralogy, the organic matter content, soil moisture effects, the surface albedoand the vegetation. Temperature controls the rate of most soil processes, butespecially those that are biologically-mediated. Soil temperature changes are likelyto have the greatest impact in the permafrost regions at high latitudes (Kane et al.,1991). For example, modelling studies have shown that the active layer depth in soilsof permafrost terrain could increase by 75 per cent in response to a 3°C increase in airtemperatures (Waelbroeck, 1993); however such a change would seem to have onlyminimal effects on the total net mineralisation of tundra soils (Jonasson et al., 1993).
Soil workability and the related concept of trafficability have a substantial influenceon the distribution and management of arable crops in temperate (Rounsevell,1993) and subtropical regions. Workability refers to the soil condition when tillagemachinery can engage with the soil, for example in the preparation of seed beds;trafficability refers to the accessibility of land during crop husbandry. Workabilityrequires the soil to be neither too wet, which would result in compaction orsmearing (with associated yield losses), nor too dry in which the production of a finetilth can be difficult (Rounsevell and Jones, 1993). Thus, soil workability is directlydependent on the soil water content.
In temperate grassland systems, poaching by grazing livestock, in which animalhooves cause damage to wet soils, is analogous to soil workability for machinery(Harrod, 1979). Changes in the period of the year when soil conditions aresufficiently dry to avoid poaching, as a result of climate change, have been shown toimpact on the potential distribution of intensive agricultural grassland in Englandand Wales (Rounsevell et. al., 1996a). Changes were shown to include theintensification of currently wet upland grazing areas because of changes in the soilmoisture regime.
Changes in the climate might be expected to modify soil structure through itsinfluence on the physical processes, and through changes in soil organic matterlevels (e.g. Carter and Stewart, 1996).
Soils with high clay contents, especially those with a smectitic mineralogy, havethe potential to shrink when they are dry and swell as they wet-up again. Thisbehaviour results in the formation of large cracks and fissures. Drier climaticconditions would be expected to increase the frequency and size of crack formationin soils, especially those in temperate regions which currently do not reach their fullshrinkage potential (Climate Change Impacts Review Group, 1991, 1996). Thereare about 260 million hectares of vertisols, which exhibit these characteristics, inthe world (Beek et al., 1980), and they are among the most difficult soils to managefor cultivation. It is likely that the predicted climate change for parts of Africa andAsia will lead to a change in the agricultural status of these soils.
Salinity and waterlogging are currently lowering the productivity of 25 per cent ofthe world’s irrigated cropland (Brown and Young, 1990) and potentially will havesignificant impacts on future agricultural production under a changed climate.
An increase in temperature coupled with reduced rainfall will lead to predominantlyupward water movement in soils, as currently seen in the more arid parts of the
Salt-affected soils
4.2.3.5Impact on soil degradation
4.2.3.4Impact on soil structure
4.2.3.3Impact on soil workability
4.2.3.2Impact on soil temperature
CHAPTER 4—ADAPTATION STRATEGIES REQUIRED TO REDUCE VULNERABILITY IN AGRICULTURE AND FORESTRY 51
TO CLIMATE CHANGE, CLIMATE VARIABILITY AND CLIMATE EXTREMES
world, and this will result in the accumulation of salts in the upper soil layers. Sucheffects will be intensified if poor quality irrigation water is used on agricultural soils.Climate change will increase inundation and salinity along coastal regionsworldwide, through the influence of sea level rise (Pezeshki et al., 1990).
In well drained, structurally stable soils, increased amounts and intensity ofprecipitation will result in a greater potential for leaching. This could increase soilacidification through the depletion of basic cations (Brinkman, 1990), althoughacidification will probably only become evident after buffering pools are exhausted.
Peat soils are among the most fragile agricultural soils in the world. Adecrease in precipitation and/or increase in temperature increases their vulnera-bility to oxidation and loss of volume. It has been suggested that under climatechange the volume of peats in agricultural use will shrink by as much as 40 percent (Kuntze, 1993).
Soil erosion is currently undermining the productivity of around 33 per cent of theworld’s cropland (Brown and Young, 1990). Climate change is likely to increaseboth wind and water erosion rates in the future (Botterweg, 1994), especially whereclimate change leads to increases in the frequency and intensity of precipitationevents (Phillips et al., 1993). Erosion rates will also be affected by climate-inducedchanges in land use (Boardman et al., 1990) and soil organic carbon contents(Bullock et al., 1996).
Eroded soils also provide a feedback to the climate system. A large fraction oftropospheric aerosols derive from wind-blown mineral particles and these contributeto radiative forcing (Tegen et al., 1996).
Soil organic matter (SOM) consists of a variety of products, ranging from undecayedplant and animal remains (frequently termed detritus), through ephemeral productsof decomposition to more or less unstructured (anatomically) amorphous organicmaterial, often termed humus.
Soil organic matter primarily affects the physical properties of soils by modifyingthe size and stability of aggregates and the surface adsorption/desorptioncharacteristics (Le Bissonnais, 1996). In turn, these modify the soil water holdingcapacity and the physio-chemical properties of soils and may influence otherphenomena, such as erosion. Climate change will directly impact on SOM qualityand aggregate size primarily through temperature and precipitation mediated effects(Pregitzer and Atkinson, 1993), and indirectly by changing land-use patterns.
Plant growth and soil water use are strongly influenced by the availability ofnutrients. Where climatic conditions are favourable for plant growth, the shortage ofsoil nutrients will have a more pronounced effect (Shaver et al., 1992). It has beensuggested that increased plant growth in a carbon dioxide enriched atmosphere mayrapidly deplete soil nutrients and consequently the positive effects of carbon dioxideincrease may not persist as soil fertility decreases (Bhattacharya and Geyer, 1993).
Soil organisms have relatively broad temperature optima, and so a small amount ofglobal warming is unlikely to have a large influence on soil ecological composition(Tinker and Ineson, 1990). However, soil organisms will be affected by elevatedatmospheric carbon dioxide concentrations because of changes in litter supply to,and fine roots in soils as well as changes in the soil moisture regime (Rounsevell etal., 1996b).
Organisms such as plant pathogens and symbiotic organisms depend onparticular vegetation types, which may relocate as a consequence of climate changeat different rates compared with the soil organisms themselves (Kirschbaum et al.,1996). Thus, shifts in the abundance of species within the soil microbial and faunalpopulations are more likely to result from land-use change (Kirschbaum et al., 1996)because of the slow rates of migration of soil organisms (Tinker and Ineson, 1990).
4.2.3.8Impact on soil ecology
4.2.3.7Impact on soil nutrient status
4.2.3.6Impact on soil organic matter
Soil erosion
Acidification
52 MANAGEMENT STRATEGIES IN AGRICULTURE AND FORESTRY FOR MITIGATION OF GREENHOUSE GAS EMISSIONS AND
ADAPTATION TO CLIMATE VARIABILITY AND CLIMATE CHANGE
CHAPTER 4—ADAPTATION STRATEGIES REQUIRED TO REDUCE VULNERABILITY IN AGRICULTURE AND FORESTRY 53
TO CLIMATE CHANGE, CLIMATE VARIABILITY AND CLIMATE EXTREMES
The weathering of rock material is instrumental in the development of soils, butoccurs over very long time periods. Weathering involves the physical disruption ofrock structures followed by chemical changes within the constituent minerals(White, 1981). Weathering rates depend, amongst other factors, on temperature andthe rate of water percolation (Wagenet et al., 1994), both of which will beinfluenced by climate change.
In humid climates, more soil reduction resulting from waterlogging can lead togreater ferrolysis (Brinkman, 1990). In well drained, structurally stable soilsincreased amounts and intensity of precipitation will result in a greater potential forleaching. This could accelerate the processes of hydrolysis and cheluviation,especially in the tropics and in high latitude areas (Brinkman, 1990).
Thus, climate change will have the effect of accelerating the rates of weatheringand clay surface processes (Wagenet et al., 1994). Over long periods of time, thiswill result in changes to the global distribution of soil types, concurrent with changesin the use to which these soils may be put.
Adaptation to climate change through the management of agricultural soils remainsa complex issue given the multiplicity of factors affecting land-use decision making(including policy and economics) together with the unknowns of technologicalchange (including engineering and biotechnology). However, it will be the use andmanagement of soils that ultimately influence the ability of agriculture to adapt toclimate change. Adaptation options occur primarily at three spatial scales:• The field scale, for instance by changing machinery or the timing of opera-
tions, the use of different crops, introducing irrigation;• The farm scale, through socio-economic changes affecting, for example, farm
sizes or diversification to non-agricultural land uses via changes in profitabili-ty; and
• The regional and/or national scale, through policy responses aimed at marketsupport or environmental regulation, such as the recognition of soils as a non-renewable natural resource, or concerns over water quantity and quality.To armour the world’s soils against any negative effect of climate change, or
against other extremes in external circumstances such as nutrient depletion or excess(pollution), or drought or high-intensity rains, the best that land users could do,would be:• To manage their soils to give them maximum physical resilience through a
stable, heterogeneous pore system by maintaining a closed ground cover asmuch as possible;
• To use an integrated plant nutrient management system to balance the inputand off take of nutrients over a cropping cycle or over the years, while main-taining soil nutrient levels low enough to minimise losses and high enough tobuffer occasional high demands.Irrigation is the established adaptation to soil moisture deficits. A number of
studies have addressed this subject in relation to climate change (Ramirez andFinnerty, 1996). However, the use of irrigation as an adaptation strategy is notalways appropriate because it assumes that water is available for irrigation, whichmay not always be the case (Delecolle et al., 1995), that water is of sufficient qualityto avoid salinisation (Varallyay, 1994), and that it is profitable for a farmer toirrigate: the economic environment often limits the types of crops that can beirrigated (Leeds-Harrison and Rounsevell, 1993) more than the absence of theresource itself. Where water is in short supply it may be possible to introduceimproved irrigation practices (e.g. drip irrigation, underground irrigation) that cansave up to 50 per cent water compared with conventional approaches. The use ofmathematical optimisation and simulation models for irrigation scheduling alsoprovide a means of conserving limited water resources (Kos, 1992).
If these constraints prevent the use of irrigation then farmers will adapt bychanging their selection of crops, which will result in a new geographicaldistribution of agricultural land use, or they will introduce management techniques
4.2.4ADAPTATION TO CLIMATE CHANGE
4.2.3.9Impact on mineral transformations
and clay surface processes
that conserve soil moisture. One such technique, reduced or no-tillage, is alsoeffective in maintaining soil organic carbon contents with the benefits to agricultureof improved soil structure and fertility, as discussed earlier. Soil organic carboncontents have been shown to increase by 85 per cent after 8 years on a clay loamsoil following the introduction of reduced tillage (Mahboubi et al., 1993), and by20 per cent after 5 years on a red-brown earth in Australia (Smetten et al., 1992).Increasing the area of non-tillage cropland in the USA from its present 27 per centto a potential 76 per cent has been estimated to result in gains of soil organic carbonof 0.43 Gt after 30 years (Kern and Johnson, 1991).
In addition, it is likely that farmers will adapt to climate change by changingother land management practices such as sowing dates and the timing of nitrogenfertiliser applications (Baethgen and Magrin, 1995) as well as introducing differentcrop varieties and rotations (Pimentel, 1991).
There is an established body of knowledge on the use of conservationtechniques to mitigate soil erosion, and thorough reviews of these techniques havebeen given elsewhere (e.g. Hudson, 1995; Morgan, 1995). The balance of evidencefrom climate change and soil erosion studies suggests that management for soilconservation will become increasingly important in the future.
The attempt to understand what climate change means for global agriculture leadsus to consider issues beyond global modelling and global model results. Theagricultural system has changed dramatically over the past decades and centuries.No one imagines that the next decades will not see profound changes in how andwhere food and fibre is produced. Increasing population and recognition of resourcescarcities and environmental considerations will mean that more food and fibre mustbe produced using technologies that make more efficient use of soil, water andclimatic resources and minimise environmental impact. Climate change impactswill depend on how the agricultural system changes in response to other recurrentpressures (Das, 1999).
Adaptation is an important factor to consider. There are widely divergent viewsof the ability of the system to adapt. Lack of a precise terminology among researchersis responsible for some of these differences. At one extreme, adaptation meansfinding ways to produce the same crop at no additional cost. At the other,adaptation may involve relocating and finding employment outside of agriculture.To consistently compare estimates, the standard economic analysis approach is toconsider all the possible changes holding production costs constant. The resultingchange, measured in yield or profits, is the impact of climate change. Theproduction level could be lower or higher than without climate change – either ayield loss or gain in a single crop situation. These changes can be directly comparedwith a no adaptation case. Another difference that makes comparison of resultsdifficult is whether and how studies distinguish between adaptation and adjustment.Adjustment costs arise, and are greater, when the adaptation response are made in ashort time period. Expectations that climate change will be slow and gradual couldeasily mean that adjustment costs would be negligible, whereas scenarios withrelatively unstable shifting of climate patterns at local levels could find highadjustment costs.
As plant type and plant productivity are major determinants of food production, itis critical to understand and quantify the response of the most important crops tochanging environmental conditions. Different crop species have differentresponses to increased atmospheric carbon dioxide concentrations and to thecombined changes in other factors such as temperature, precipitation, pollutants,ultraviolet radiation (UV-B), etc. Similarly climate affects most major soilprocesses and is a major factor in soil formation. Many of the world’s major soilare potentially vulnerable to soil degradation (e.g. loss of soil organic matter,leaching of soil nutrients, salinisation and erosion) as a likely consequence ofclimate change.
4.3.2EFFECTS OF CLIMATE CHANGE ON
PLANT PHYSIOLOGY AND SOIL
PROCESSES
4.3AGRICULTURAL IMPACTS OF
CLIMATE CHANGE ANDADAPTATION MEASURES
4.3.1INTRODUCTION
54 MANAGEMENT STRATEGIES IN AGRICULTURE AND FORESTRY FOR MITIGATION OF GREENHOUSE GAS EMISSIONS AND
ADAPTATION TO CLIMATE VARIABILITY AND CLIMATE CHANGE
CHAPTER 4—ADAPTATION STRATEGIES REQUIRED TO REDUCE VULNERABILITY IN AGRICULTURE AND FORESTRY 55
TO CLIMATE CHANGE, CLIMATE VARIABILITY AND CLIMATE EXTREMES
Carbon dioxide is a key factor in photosynthesis and in plant growth. After diffusioninto the plant through stomata, it is transformed by photosynthesis intocarbohydrates. A large number of water molecules are lost by transpiration throughthe stomata for every carbon dioxide molecule entering the leaf. In a carbon dioxiderich environment, the large concentration gradient forces more carbon dioxide intothe plant, while partial closure of the stomata will reduce water losses from the leaf.As stomatal opening decreases in a high carbon dioxide environment, water lossfrom the plant is also reduced, increasing water use efficiency. For example, thereare indications that doubling present carbon dioxide concentrations reducesstomatal conductance (opening) by 30–60 per cent depending on the species. Thereduction in water consumption is called the carbon dioxide anti-transpirationeffect. The water use efficiency of the plant improves, since less water is used forequal or more carbon dioxide transformed into dry matter. At the same time, netphotosynthesis might increase, because photorespiration, which reduces carbon gain,is less at high carbon dioxide concentrations. In optimal conditions of light,moisture and availability of nutrients, this fertilisation effect could increase above-and below-ground biomass production by 10–40 per cent depending on crop typeand even to higher levels such as the case in cotton. Earlier and more rapid leafproduction is expected and the incremental increase in biomass can benefit the rootsystem even more. The earlier establishment of the ground cover, because of theearly canopy development, may also limit water loss by direct soil evaporation. Thisresponse is even greater at high temperatures, since the optimum temperature forphotosynthesis increases with high atmospheric carbon dioxide. In contrast,combined low temperatures and elevated carbon dioxide concentration could reduceplant growth.
The importance of the anti-transpiration and fertilisation effects varies withcrop type. For example, at double atmospheric carbon dioxide the biomassproduction of C3 plants, including major crops such as rice, wheat, potatoes, beans,soyabean, sunflower, groundnut and cotton, can be expected to increase, on average,by some 30 per cent, provided other factors are not limiting.
On the other hand, and independently of carbon dioxide, the physiology of C4plants permits a generally higher photosynthetic capacity than in C3 plants. Thisefficiency, however, is quickly saturated in increased carbon dioxide concentration.Therefore, in a carbon dioxide rich environment, the net improvement inphotosynthesis of C4 plants is proportionally small (about 10 per cent, mostly instem), although the water use efficiency might significantly improve (by about 40per cent). This category includes crops of major importance for food productionssuch as maize, sorghum, sugar cane and millet, but also tropical grasses, pasture,forage and some weed species that are critical for agricultural production. Generally,C4 plants seem to be less sensitive to carbon dioxide enrichment (Porter, 1993).
A sudden doubling of atmospheric carbon dioxide concentration and associatedhigher temperatures – as in most experimental set-ups, both enclosed and under free-air enrichment – may result in soil degradation including nutrient depletion. Apotential increase in initial soil fertility under elevated atmospheric carbon dioxidecan be expected if the increase occurs gradually, as in practice and as in the case incrop models that take into account the gradual transient increases. Additional litteris likely to raise soil organic matter content unless litter chemistry drastically changescausing a decline in litter decomposition rate. However, the higher soil temperaturecan stimulate microbial respiration and the decomposition of the organic matter (i.e.,mineralisation) and cause the release of nutrients which become available for plantuptake through the root system unless microbial competition with plants for theavailable nutrients is intensified. Furthermore, since both the nutrient uptakeefficiency and the structure (length and density) of root systems improve underelevated carbon dioxide concentrations, overall plant nutrient uptake can alsoincrease. Furthermore, there are indications that the expanded root system canpenetrate more deeply into the soil and reach extra sources of moisture and nutrients.
4.3.2.2Effects on soil fertility
4.3.2.1Carbon dioxide fertilisation and anti-
transpiration effects
56 MANAGEMENT STRATEGIES IN AGRICULTURE AND FORESTRY FOR MITIGATION OF GREENHOUSE GAS EMISSIONS AND
ADAPTATION TO CLIMATE VARIABILITY AND CLIMATE CHANGE
Temperate Asia includes the following Asia Pacific developing countries: China,North Korea and Mongolia where rice, wheat and maize are the three leading foodcrops. Several major studies have been conducted in this area.
For China, past results show generally negative yield effects but range from lessthan 10 per cent (Zhang, 1993) to more than 30 per cent (Jin et al., 1994). Hulmeet al. (1992) concluded that to a certain extent, warming would be beneficial withincreasing yield due to diversification of cropping systems. Meanwhile, theyestimated that by 2050, when they expect an average warming for China of 1.2°C,increased evapotranspiration would generally exceed the increase in precipitation,thus leading to a greater likelihood of yield loss due to water stress for some rice-growing areas even as the area suitable for rice expands. Recent studies show thatthe impacts vary widely in range, across different scenarios and different sites, thechanges for several crop yield by 2050 are projected to be: rice (-78 per cent to +15per cent), wheat (-21 per cent to +55 per cent), and maize (-19 per cent to +5 percent) (Lin Erda, 1996).
The following adaptations are suggested to lessen the detrimental effects ofclimate change on China’s agriculture: assuring the sown acreage of grain to stabiliseat a level of 0.08–0.09 ha per capita to attain the production target; strengtheningirrigation capacity; transforming medium or low-yield farmland; adopting subsoilfertiliser application; using superior species of crops; improving cultural techniquesunder climate variations; using dryland farming techniques; and developing feedcrops instead of grain crops.
For Mongolia, Bayasgalan et al. (1996) researched the effect of climate changeon the yield of spring wheat. The results show that the production of spring wheatcould be reduced significantly due to higher evapotranspiration. Simulated adaptiveoptions, such as change of planting date using different varieties of spring wheat,and applying the ideal amount of nitrogen fertiliser at the optimum time, arepotential responses that could modify the effects.
Tropical Asia includes most of the Asian-Pacific developing countries, such asBangladesh, Bhutan, Burma, Cambodia, India, Indonesia, Laos, Malaysia, Nepal,Papua New Guinea, Philippines, Singapore, Sri Lanka, Thailand and Vietnam. Riceis by far the most important food crop across the humid areas of Tropical Asia. Inarid and semi-arid areas, a wide variety of other crops are grown, includingsoyabeans, maize, wheat, tubers, fruits, and vegetables. Production is often highlydependent on precipitation and, in areas with seasons of less rainfall, on irrigation.
Many climate change impact studies have been conducted in various regionsof Tropical Asia. Agriculture in this area is very vulnerable to climate change.Studies show that climate change would amplify frequency and intensity ofhazardous weather, such as tropical cyclones, storm surges, floods and droughts,which damage life, property and crop production. A decrease in rice production dueto climate effects and sea level rise, combined with rapidly increasing populations,would threaten food security. Anglo et al. (1996) noted that changes in averageclimate conditions and climate variability will have a significant effect onagriculture in many parts of the region. Areas that concentrate on the production oftropical crops such as tea and coconuts as well as regions with limited access toagricultural markets would be badly affected. Decreased rice yields were projectedby Matthews et al. (1995) for low latitude areas in tropical Asia and increased yieldswere projected for higher latitudes using three global climate models. Resultsindicated possible shift in the rice-growing regions away from the equatorial regionsto higher latitudes.
In Bangladesh, the impact of climate change parameters such as drought,inundation and salinity intrusion on rice, a major crop of Bangladesh, was studied byKarim et al. (1996) using the CERES – Rice Model. They found elevated carbondioxide levels increased rice yield. However, high temperature reduces rice yield inmost locations and the detrimental effects of temperature rise will more than offsetthe positive effect from increased carbon dioxide levels; 0.8 to 2.9 million metric
4.3.3.2Tropical Asia
4.3.3STUDY SITUATIONS OF
VULNERABILITY AND ADAPTATION IN
DIFFERENT REGIONS
4.3.3.1Temperate Asia
tons of potential rice output may be lost in the affected zone by the year 2030.Agricultural adaptation strategies addressed included rice genotype development tosustain rice yield; management options and adjustment of agro-ecological variabilityof rice yield with the change in climate; development of mitigating technologies,etc, (Karim et al., 1996).
Parry et al. (1992) showed yield impacts (-65 per cent to +10 per cent) thatvaried across the countries of Thailand, Indonesia and Malaysia leading to losses infarming income of US$10 to US$130 per year. These authors estimated that a 1-metre sea level rise could threaten 4200 ha of productive agricultural land inMalaysia. In Thailand, Tongyai (1994) tested GCM climate change scenarios onsimulated upland and paddy rice and found that yields decreased by -2 to -17 percent in two of the scenarios (with direct carbon dioxide effects included). Amien etal. (1996) found changes in climate could have significant effects on rice yields inIndonesia. Production of many crops in Indonesia is likely to decline due to flooding,erosion, the loss of arable land and greater plant moisture loss during the dry season.Shifts in precipitation patterns are likely to disrupt cropping in both rainfed andirrigated agricultural systems compounded by changes in soil moisture due totemperature shifts and erosion. Yields of upland crops such as soyabean and maizewill decline by 20 per cent and 40 per cent, respectively, whereas rice yields willdecline by only 2.5 per cent. Suggested adaptation measures include soilconservation and water conservation; afforestation through agroforestry, particularlywith nitrogen-fixing crops; abandoning cultivation if customary crops can no longersurvive; introducing other species better able to withstand the new climaticconditions. In a study of northwest India, Lal et al. (1997) also found that with therise in surface air temperature the reduction in yield offsets the effects of elevatedcarbon dioxide levels, the projected net effect being a considerable reduction in riceyield. In the Philippines, the agricultural impacts were expected to be more seriousin areas vulnerable to typhoons and floods, areas frequently affected by droughts,and those near coastal areas most vulnerable to storm surge and salt intrusion.Adaptive options include developing cultivars resistant to climate change; new farmtechniques for the management of crops under conditions of stress, plant pests anddisease; design and development of efficient farm implements; and improvement ofpost harvest technologies, which include among other things, the use and processingof farm products, by-products and agricultural waste. Escano and Buendia (1994)conducted a study, in which results showed that rice yield in the Philippinesdeclined under GCM scenarios with direct carbon dioxide effects taken into accountin at least one important agricultural region of the Philippines. In Sri Lanka, someadverse impacts on agriculture were found. Agriculture will be affected by salinityintrusion and flooding. Analysis of impacts on paddy (rice) using a crop modeldeveloped by Seshu and Cady (1983) showed that paddy cultivation will drop byabout 6 per cent with a temperature increase of 0.5°C in the year 2010. Anotherstudy on rice using regressive analysis techniques showed an increase in output witha small temperature increase, but output drops with further increases in temperature.The following are adaptive options: trying out salt water resistant varieties of cropsin the areas where drainage is poor; diversifying the agriculture and food habits ofpeople primarily limited to rice, wheat flour and sugar, to include other grains, yamsand tubers and food crops such as jack and bread fruit and non-traditional food fruitcrops; improving management of irrigation systems; improving management of wetzone watersheds and catchment areas; implementing crop livestock integration;changing crop varieties and cropping patterns to suit changing climatic conditions;implementing agro-forestry systems, etc.
The impact of climate change on wheat yield simulated in India using adynamic crop growth model, WTGROWS, indicated that a 1°C rise in the meantemperature had no significant effect on potential yields, but an increase of 2°Creduced potential grain yields in most places (Aggarwal et al., 1993). In a laterstudy, Rao et al. (1995) used the CERES wheat simulation model and scenariosfrom three equilibrium GCMs (GISS, GFDL and UKMO) and showed that in all
CHAPTER 4—ADAPTATION STRATEGIES REQUIRED TO REDUCE VULNERABILITY IN AGRICULTURE AND FORESTRY 57
TO CLIMATE CHANGE, CLIMATE VARIABILITY AND CLIMATE EXTREMES
simulations wheat yields were smaller than those in the current climate, even withthe beneficial effects of carbon dioxide on crop yield. Yield reductions were due toa shortening of the wheat growing season, resulting from scenario temperatureincreases. Karim et al. (1996) showed that wheat yields are vulnerable to climatechange in Bangladesh. Studies on the productivity of sorghum showed adverseeffects in rainfed areas of India (Rao et al., 1995) similar to corn yield in thePhilippines (Buan et al., 1996).
The likely impact of climate change on the tea industry of Sri Lanka wasstudied by Wijeratne (1996). He found that tea yield is sensitive to temperature,and that an increase in the frequency of drought and extreme rainfall events couldresult in a decline in tea yield. The other important crops of the region are rubber,oil palm, coconut, sugar cane, coffee, spices, etc. but almost no information on theimpact of climate change on these crops is available. Sea level rise and climatechange could seriously affect Vietnam’s agriculture. Drought could occur morefrequently during the winter spring crop season; inundation could occur morefrequently during the winter and summer autumn seasons.
Arid Asia includes the following Asian-Pacific developing countries: Afghanistan,Kazakhstan, Kyrgyz Republic, Pakistan, and Uzbekistan.
General assessments have suggested both positive and negative impacts ofclimate change scenarios on agriculture. Positive examples include decreasing frostrisk and more productive upland agriculture if appropriate cultivars are used.Populations of pests and disease causing organisms, many of which havedistributions that are climatically controlled, may have a negative impact. Inatmospheres rich in carbon dioxide, plants can take up the carbon dioxide necessaryfor photosynthesis with less loss of water from their stomatal pores. This gain inwater use efficiency has been demonstrated to be most advantageous in plantsgrowing in water limited circumstances and, thus, may lead to higher productivitythroughout the region. There is also evidence that forage quality and the proteincontent of some cereals may fall, (Diaz, 1995). Suggested adaptation optionsinclude: adoption of water conservation techniques; expansion of winter crops thatare much less demanding on water; diversification of economic activity.
The preliminary vulnerability assessments based on the DSSAT model fordoubled carbon dioxide conditions showed that the spring wheat and winter wheatyields would decrease by 12 per cent in Northern Kazakhstan. Potato productivitywill decrease by 6–10 per cent if warming is 2°C (Kavalerchik et al., 1995).Pilifosova et al. (1996) estimated the possible effects of climate change on yield ofspring wheat and winter wheat in Kazakhstan. Reductions of spring wheat yield areanticipated to be 56 per cent under CCCM, 51 per cent under GEB3 and 12 percent under GEDI scenarios. Winter wheat yield could increase about 21 per centunder GFDI and 17 per cent under GID3 and CCCM scenarios. The followingadaptation alternatives are recommended: changing planting dates; switching fromspring wheat to winter wheat; irrigating; increasing fallow area; implementing snowreserving; switching to more suitable wheat varieties; applying fertiliser, pesticides,and weed control.
Average summer monsoon rainfall in Pakistan’s interior would increase by 17to 59 per cent. The resulting floods could destroy the irrigation infrastructure andcrops, particularly cotton planted in June and July, which is extremely susceptibleto field flooding in its early stages of growth. On the other hand, the GISS modelprojected opposing results: a decline in the summer monsoon and associated waterresources. This could severely stress winter crop production, including wheat, themain food staple. Projected climate change caused simulated wheat yields todecrease dramatically in the major areas of agricultural production, even under fullyirrigated conditions. Decreases in modelled grain yields were caused primarily bytemperature increases that shortened the duration of the life cycle of the crop,particularly the grain-filling period. These decreases were somewhat counteractedby the beneficial physiological carbon dioxide effects on crop growth. Adaptation
4.3.3.3Arid Asia
58 MANAGEMENT STRATEGIES IN AGRICULTURE AND FORESTRY FOR MITIGATION OF GREENHOUSE GAS EMISSIONS AND
ADAPTATION TO CLIMATE VARIABILITY AND CLIMATE CHANGE
strategies that were considered included development of more heat resistantcultivars, delayed planting and other changes in farming practices.
While Africa, particularly sub-Saharan Africa, is highly dependent on agriculture,relatively little quantitative work has been done on the impacts of climatic change.Little or no effort has been devoted to studying agricultural effects on countries ofthe Middle East.
Recent studies (Sivakumar, 1993; Magadza, 1994) indicate that most of Africawill be sensitive to climate change, although some regions may benefit from warmerand wetter conditions.
Sivakumar (1993) considered the effects of climatic variability (primarilyperiodic droughts) on agriculture in some areas of the region, finding that suchdroughts have significant negative effects on production, crop season length andhigher-order social impacts. The economies of countries of North Africa and theMiddle East are generally less dependent on agriculture than are those of sub-Saharan Africa. One study for Egypt (Eid, 1994) indicated the potential for severeimpacts on national wheat and maize production. The adaptive optionsrecommended included development of heat resistant varieties, applying fertiliserand irrigation and timely climate information, although these adaptation measuresare unable to fully offset yield loss.
Climate impact studies conducted over the past 15 years include those ofZhukovsky and Belechenko (1988) and Sirotenko et al. (1984). These studies didnot include the direct effect of increasing atmospheric carbon dioxide. Recentestimates have included coverage of most of the region and have included thecarbon dioxide effect and other environmental change (Sirotenko and Abashina,1994; Sirotenko et al., 1991).
The estimated response of agriculture varied significantly across the region aswell as across climate scenarios. Sirotenko and Abashina (1994) estimate theimpacts to be favourable on the agriculture of northern European Russia and Siberiaand to cause a general northward shift of crop zones. Kovda and Pachepsky (1989)report the potential for significant additional soil loss and degradation resulting fromclimate change.
Some of the adaptive recommended measures include implementing snowreserving, increasing fallow areas and switching to more suitable wheat varieties.
Climate impact studies for Latin America that include the direct effect of carbondioxide generally show negative impacts for wheat, barley and maize but positiveimpacts for soyabeans. A study for Chile, suggested decreased yields for wheat andgrapes but increases for maize and potatoes (Downing, 1992).
The largest area with clear vulnerability to climate variability in the region isthe Brazilian northeast. Like most agricultural areas of Latin America, this regionhas a rainy season when crops are grown and a dry season with little or no rain. Inthe case of the Brazilian northeast, the rainy season is relatively short (3–4 months)and the occurrence of years with no rainy season is frequent. Climate variations thatwould result in shorter rainy seasons and/or increased frequency of rainless yearswould have extremely negative consequences for the region.
Some adaptive measures such as changing crop varieties and cropping patternsto suit changing climate conditions and implementing agroforestry systems couldmitigate some of the losses in agricultural output.
Simulated yields of grains and other crops have been generally found to increasewith warming in the north, particularly when adaptation is considered, but decreasesubstantially in the Mediterranean area even with adaptation. Northern yieldincreases depend on the beneficial effects of carbon dioxide on crop growth andclimate scenarios showing sufficient increases in precipitation to counter higher ratesof evapotranspiration. Yield declines in the Mediterranean region are due to
4.3.3.7Western Europe
4.3.3.6 Latin America
4.3.3.5Eastern Europe
4.3.3.4 Africa and the Middle East
CHAPTER 4—ADAPTATION STRATEGIES REQUIRED TO REDUCE VULNERABILITY IN AGRICULTURE AND FORESTRY 59
TO CLIMATE CHANGE, CLIMATE VARIABILITY AND CLIMATE EXTREMES
increased drought resulting from the combination of increased temperature andprecipitation decreases.
For many vegetable crops, warmer temperatures will generally be beneficial, andthere are possibilities for vegetable production to expand in northern and westernareas.
Warmer winters will reduce winter chilling and probably adversely effect appleproduction in temperate maritime areas, and could lead to loss of adequate winterchilling for crops such as peaches, nectarines and kiwi fruit in southern Europe.Significant shifts in areas suitable for different types of grapes also could occur(Kenny and Harrison, 1992). Other studies have explored how the climaticallylimited range for crops, including maize, wheat, cauliflower and grapes, wouldchange under various GCMs and other climate scenarios (Kenny and Harrison,1993). In general, these studies found a northward shift of crop-growing zones withpotential for grain maize to be grown as far north as the UK and central Finland.
Some of the adaptive measures are, changing planting date, applying pesticidesand changing crop varieties.
Selected USA/Canada agricultural impact studies show a wide range of impacts.Rosenzweig (1985) simulated increased areas for wheat production, especially inCanada, under the GISS climate change scenario, while major wheat regions in theUnited States remain the same. Crosson (1989) found that warmer temperaturesmay shift much of the wheat-maize-soyabean producing capacity northward,reducing US production and increasing production in Canada. Shifting climatezones may result in lower production of corn or wheat and different and morediverse crops because the productivity in the new areas is likely to be limited dueto the shallow, infertile soils (CAST, 1992). The adaptive measures suggestedinclude planting earlier and switching to more diverse crops.
Some climatic change is unavoidable over the next 50 years because the climatesystem is slowly responding to the current atmospheric accumulation of trace gases.Given the potentially large direct impacts on yield, adaptation and adjustment willbe important to limit losses or to take advantage of improving climatic conditions(Rosenberg and Crosson, 1991; Mendelsohn et al., 1994).
While adaptation can be important, there is a wide range of views on thepotential of agricultural systems to adapt to climate change. These differences stemfrom many factors. Smit (1993) traced part of the divergence in views to differentinterpretations of “adaptation” which include the prevention of loss, toleration ofloss or relocation to avoid loss. Differences also stem from differing estimates of thescope of technological alternatives. These include the genetic diversity of crops,the ability of plant breeders and biotechnology to develop new crops and the costand availability of management alternatives including capital inputs, the timing offield operations, fertiliser, energy and water needed for irrigation. There are alsowidely varying views of what climate change will mean. Will climate change be agradual change in mean conditions or erratic changes in extreme events andincreased variability? Also at issue is the condition of the agricultural system thatexperiences climate change. A financially strong system with numerous optionsand farm managers adept at adjusting to change may be more adaptable than onesuffering from financial stress, degraded resources and with few technologicaloptions.
These views suggest several questions that must be asked with regard toagricultural adaptation (Smit, 1993). Can agriculture adjust rapidly andautonomously, slowly and only with careful guidance, or is there little scope foradjustments? Does the response of the system require planning by farmers (plantbreeders, water managers, farm policy makers) specifically taking into accountclimate change, and if so what is their capability to detect change and respond? Dothe individuals and institutions that must adapt currently have the knowledge ortechnology to respond or must it be invented, developed and learned?
4.3.4ADAPTATION
4.3.3.8 USA and Canada
60 MANAGEMENT STRATEGIES IN AGRICULTURE AND FORESTRY FOR MITIGATION OF GREENHOUSE GAS EMISSIONS AND
ADAPTATION TO CLIMATE VARIABILITY AND CLIMATE CHANGE
The most plausible of the projected climate and direct effects of carbon dioxide (i.e.general warming, altered precipitation and evapotranspiration, carbon dioxidefertilisation effect on photosynthesis and improved water use efficiency) indicate anumber of possible response strategies. These include the use of cultivars that requireeither longer or shorter growing seasons. In high latitude regions shortness of thegrowing season is the primary limiting factor. Warming would allow the use of moreproductive long season cultivars. Such cultivars should be readily available fromlower latitude locations (Rosenberg, 1992; Salinger et al., 2000).
The carbon dioxide fertilisation effect on plants will increase and climatechanges may occur because of the combined increase of all greenhouse effect gases.Global agriculture could adapt to gradual regional climate changes, but suddenchanges would be more serious. Adaptation and/or mitigation actions could includethe following:• Selection of plants that can better utilise carbohydrates which are produced
when plants are grown at elevated carbon dioxide;• Selection of plants that produce less structural matter and more reproductive
capacity under carbon dioxide enrichment;• Search for germplasms that are adapted to higher day and night temperatures,
and incorporate those traits into desirable crop production cultivars to improveflowering and seed set;
• Change planting dates and other crop management procedures to optimiseyield under new climatic conditions, and select for cultivars that are adaptedto these changed agricultural practices;
• Shift to species that have more stable production under high temperatures ordrought;
• Determine whether more favourable nitrogen:carbon ratios can be attained inforage cultivars adapted to elevated carbon dioxide;
• Where needed, and where possible, develop irrigation systems for crops.Photoperiod limitations (if any) may be overcome by means of traditional plant
breeding procedures. In regions where mid- and late summer temperatures and/orwater stress become severe enough to interfere with the plant’s reproductive cycle,shorter season varieties may be introduced.
Similarly, the development or importation of more drought and heat resistantstrains of major crop species can be expected to occur in response to warming and/ordessication. Soyabeans avoid drought by defoliation and refoliate when (if) rainsreturn. Sorghum resists drought by its tolerance of high temperatures and ability toroll its leaves to reduce transpiration. These crops may replace drylands corn whereheat and drought sensitive crop becomes uneconomic.
Greater emphasis will likely be placed on moisture conserving tillage methodsin dryland agriculture. Various forms of minimum-tillage, conservation tillage,stubble mulching and fallowing are already gaining in popularity in many countriesbecause of lower energy and labour requirements than conventional tillage. The rateof adaptation of these techniques would likely increase if farmers were to gain aperception that the climate is becoming drier and hotter.
Drying in the mid-continental regions would reduce runoff from range, forestand agricultural lands. The supply of water for all competing uses would decline, butthe effect would probably be greatest on agriculture since the quantities used inirrigation are great.
Irrigation efficiency (the ratio of water entering and remaining within the rootzone to that applied to the field) can be improved considerably with laser-levelling offields, use of surge irrigation in furrows, adaptation of sprinkler systems to operate atlow pressures and other techniques.
As noted above, water use efficiency (photosynthate produced per unit of watertranspired) is improved by carbon dioxide enrichment of the atmosphere. There areother ways to improve water use efficiency in agriculture. Windbreaks, for example,reduce evaporative demand in the air over the plants they shelter. The shelteredplants remain better hydrated and thus, better able to carry out photosynthesis. A
4.3.4.1Some possible adaptation strategies
CHAPTER 4—ADAPTATION STRATEGIES REQUIRED TO REDUCE VULNERABILITY IN AGRICULTURE AND FORESTRY 61
TO CLIMATE CHANGE, CLIMATE VARIABILITY AND CLIMATE EXTREMES
wide array of inter-cropping techniques – multi-cropping, relay cropping and others– provide greater overall production per unit of land occupied and can beconductive to improved water use efficiency because of the microclimatic conditionsthey create (Crosson and Rosenberg, 1989).
A small number of adaptive strategies that are possible with currently availabletechnology have been described in this chapter. Other adaptation techniques andpolicies can be developed in the coming decades. These are, in the first instance,not completely new farming or cropping technologies but existing technologiesadapted to new problems caused by climate change. Baldy and Stigter (1997) havefor this purpose given an account of the agrometeorology of multiple cropping inwarm climates. Stigter and Baldy (1995) holds additional examples. Research anddevelopment efforts over the coming decades may make current techniques moreefficient or more widely applicable and may provide new techniques as well. Speciesnot previously used for agricultural purposes may be identified and others alreadyidentified may be quickly domesticated. A report of the Council for AgriculturalScience and Technology, USA (CAST, 1984), identified a number of species fornew food and industrial crops.
Perennial plants would be harvested periodically to provide feedstocks for theindustrial synthesis of foods and other products, making for a more efficient use ofland, water and nutrients. Farms in this scheme would be biomass producing entitiesconnected by pipelines to the processing plants, much like oil wells linked to arefinery. Controlled climate environments are already very important in providinghigh value products such as ornamental plants, flowers and vegetables. Improvedtechniques of water management, nutrient recycling, carbon dioxide fertilisation,high intensity lighting and integrated pest management might be used to providehigh protein, concentrated carbohydrate foods. This might help offset some portionof lost agricultural productivity, if that is to be the net effect of greenhouse warming.
One important exception relates to the expansion of irrigation as an adaptation.The planning and construction of dams and water distribution systems have muchlonger time horizons than most of the adaptations described above. It seems morelikely, however, given the uncertainty about regional climate changes, that moreemphasis will be devoted to increasing the efficiency of existing water supply systemsthan to developing new ones as a response to climate change.
Nearly all agricultural impact studies conducted over the past five years haveconsidered the issue of adaptation in some way. Smit (1993) identifies over 70specific adaptation for Canadian agriculture, but concluded that the empiricalinformation needed to judge whether it is possible to easily and successfully adaptdoes not exist. There are a number of major classes of adaptations considered in theliterature that are broadly applicable.
For frost-limited growing areas (i.e., temperate and cold areas), warming couldextend the season, allowing planting of longer-maturity annual varieties thatachieve higher yields. For short season crops such as wheat, rice, barley, oats andmany vegetable crops, extension of the growing season may allow more crops peryear. Also, where warming leads to regular summer highs above the criticalthreshold, a split season with a short summer fallow period. For subtropical andtropical areas where the growing season is limited by precipitation or where thecropping already occurs throughout the year, the ability to extend the growingseason may be more limited, and depends on how precipitation patterns change. Astudy for Thailand found yield losses in the warmer season were partially offset bygains in the cooler seasons (Parry et al., 1992).
Most major crops varieties exist with a wide range of maturities and climatictolerance and responses, and the range is wider between different crops. For example,Matthews et al. (1994) identified spikelet sterility in one, highly used, rice variety inSouth and Southeast Asia as responsible for large yield losses under higher
Different crop variety or spices
Seasonal changes and sowing dates
4.3.4.2Technological options for adaptation
to climate change
62 MANAGEMENT STRATEGIES IN AGRICULTURE AND FORESTRY FOR MITIGATION OF GREENHOUSE GAS EMISSIONS AND
ADAPTATION TO CLIMATE VARIABILITY AND CLIMATE CHANGE
temperatures. Given the wide genetic variability among rice varieties, however, theyconcluded it would be relatively easy to breed varieties that did not exhibit spikeletsterility at the modelled temperatures. Crop diversification in Canada (Cohen et al.,1992), and in China (Hulme et al., 1992), have been identified as adaptive responses.
Where irrigation already exists, studies have considered increasing water supply tomeet additional plant water demands due to higher temperatures. Across studies,irrigated agriculture is, in general, less negatively affected than dryland agriculture.Adding irrigation is costly since available surface water supplies are already fullyallocated in most irrigated areas, groundwater supplies are being drawn down, andpoorly designed irrigation is responsible for salinisation and other land degradationproblems (CAST, 1992). There is, however, wide scope for enhancing irrigationefficiency through adoption of drip irrigation systems and other water conservingtechnologies (FAO, 1989; 1991). Tillage method, maintenance of crop residues anduse of fallow periods are other means of increasing the water supply available forcropping. One effect of elevated levels of carbon dioxide is to close plant stomataand reduce transpiration thus increasing water use efficiency. This effort hasgenerally not been factored into assessments.
Added nitrogen and other fertilisers are likely to be necessary to take full advantageof the carbon dioxide fertilisation efforts. Among climate simulation studies for somedeveloping countries where low moisture is not a limiting factor, increases infertiliser application from current levels would significantly increase current yieldseven though subsequent climate change would then result in yield loss (Baethgen,1994). Studies have also considered a wider range of input adjustments includingtillage method, grain drying, and other field operations (Smit, 1993). In general,considering a broader range of options creates more possibilities to avoid losses ortake advantage of opportunities presented by climate change.
The genetic base is broad for most crops but limited for some (e.g., kiwi fruit). Atleast one study has attempted to look at how hypothetical new varieties wouldrespond to climate change (Easterling et al., 1993). Heat resistance, salt tolerance,drought resistance, crops that are more easily stored and general crop improvementshave been identified as breeding goals (Smit, 1993).
Minimum and reduced tillage technologies in combination with planting of covercrops and green manure crops offers substantial possibility (Brinkman andSombroek, 1996) to reverse existing depletion of soil organic matter, soil erosionand nutrient loss and to combat potential further losses due to climate change(Brinkman and Sombroek, 1996; Cameron and Oram, 1994; Rosenberg, 1992).
Linking agricultural management to seasonal climate predictions (currently largelybased on ENSO phenomena), where such predictions can be made with reliability,can allow management to adapt judiciously to climate change. Management/climatepredictor links are an important and growing part of agricultural extension in bothdeveloped and developing countries (Nicholls and Wong, 1990).
Climate affects animal agriculture in four ways:• The impact of changes in livestock feedgrain availability (Kane et al., 1993;
Rosenzweig and Parry, 1994); • Impacts on livestock pastures and forage crops (Easterling et al., 1993; McKeon
et al., 1993);• The direct effects of weather and extreme events on animal health, growth and
reproduction (Rath et al., 1994); and• Changes in the distribution of livestock diseases (Stem et al., 1988).
Generally, the impacts of changes in feedgrain prices or forage production onlivestock production and costs are moderated by the markets. Impacts of changes in
4.3.5ANIMAL HUSBANDRY AND
CLIMATE CHANGE
Improved short-term climateprediction
Tillage
New crop varieties
Other inputs
Water supply and irrigation systems
CHAPTER 4—ADAPTATION STRATEGIES REQUIRED TO REDUCE VULNERABILITY IN AGRICULTURE AND FORESTRY 63
TO CLIMATE CHANGE, CLIMATE VARIABILITY AND CLIMATE EXTREMES
feedgrain supply on the supply of meat, milk, eggs and other livestock products interms of price increase is substantially less than the initial feedgrain price stock(Reilly et al., 1994). Bowes and Crosson (1993) demonstrated the importance offeed exports or imports into a region in determining downstream impacts onlivestock and meatpacking industries. It was also found that, for developing countryagriculture, livestock are a better hedge against losses than crops because animalsare better able to survive extreme weather events such as drought. The relativelylower sensitivity of livestock to climate change is also documented for the historicalcase of the USA Dust Bowl experience of the 1930s (Waggoner, 1993).
Livestock systems may be influenced by climate change directly by means of itseffect on animal health, growth and reproduction and indirectly through its impactson productivity of pastures and forage crops. Heat stress has several negative effectson animal production, including reduced reproduction in dairy cows and reducedfertility in pigs. This may negatively affect livestock production in summer incurrently warm regions of Europe. Warming during the cold period for cooler regionsis likely to be beneficial as a result of reduced feed requirements, increased survivaland lower energy costs. The impact of climate change on grassland will affectlivestock living in these pastures. In Scotland, studies of the effect on grass-basedmilk production indicate that these effects vary by locality. For herds grazed on grass-clover swards, milk output may increase regardless of site, as a result of the carbondioxide effect on nitrogen fixation (Topp and Doyle, 1996).
The impact of climate on pastures and unimproved rangelands may includedeterioration of pasture quality toward poorer quality, subtropical (C4), grasses intemperate pastoral zones as a result of warmer temperatures and less frost, orincreased invasion of undesirable shrubs. However, there is also the potentialincrease in yield and possible expansion of area if the climate changes is favourableand/or as a direct result of increasing carbon dioxide (Salinger and Porteus, 1993;Campbell et al., 1995).
Heat stress has a variety of detrimental effects on livestock, with significanteffects on milk production and reproduction in dairy cows (Orr et al., 1993). Swinefertility shows seasonal variation due to seasonal climate variability (Claus andWeiler, 1987). Reproductive capabilities of dairy bulls and boars and conception incows are affected by heat stress. Comprehensive assessment of the response of dairycattle to heat stress in NSW and Queensland was carried out by Davidson et al.(1996). The physiological effects of heat stress include reduced food intake, weightloss, decreased reproduction rates, reduction in milk yields, increased susceptibilityto parasites, and, in extreme cases, collapse and death.
Various studies suggest that warming in the tropics and in the subtropics duringwarm months affects livestock reproduction and production negatively (e.g. reducedanimal weight, decreased dairy production, and less feed conversion efficiency)(Klinedist et al., 1993; Rath et al., 1994). Results, are however, mixed for impacts intemperate and cooler regions: forage-fed livestock generally do better (due to moreforage) but more capital intensive operations, such as dairy are negatively affected(Baker et al., 1993). Warming during the cold periods for temperate areas may bebeneficial to livestock production due to reduced feed requirements, increasedsurvival of young calf and lower energy costs.
In New Zealand, productivity of dairy farms might be adversely affected by asouthward shift of undesirable subtropical grass species, such as Paspalum dilatatum(Campbell et al., 1996). At present, P. dilatatum is recognised as a significantcomponent of dairy pastures in Northland, Auckland, Waikato, and the Bay ofPlenty.
With mean annual temperatures increased by 4.0°C and precipitation 15 percent above the present average (consistent with the GISS double carbon dioxideclimate), the onset of the growing season of grass in Iceland would be broughtforward by almost 50 days, hay yields on improved pastures would increase by abouttwo thirds and herbage on unimproved rangelands by about a half (Bergthorsson etal., 1988). The numbers of sheep that could be carried out on the pastures would
64 MANAGEMENT STRATEGIES IN AGRICULTURE AND FORESTRY FOR MITIGATION OF GREENHOUSE GAS EMISSIONS AND
ADAPTATION TO CLIMATE VARIABILITY AND CLIMATE CHANGE
be raised by about 250 per cent and on the rangelands by two thirds if the averagecarcass weight of sheep and lambs is maintained as at present.
Husbandry of different subspecies of Rangifer tarandus is widely practised indifferent regions of the Arctic, particularly in Eurasia. Between 1991 and 1997,Russia’s domestic reindeer stock declined from 2.3 million to 1.6 million animals.Whether climate change contributed to this decline is uncertain (Weller and Lange,1999), but climate warming is likely to alter husbandry practices. The overall impactof climatic warming on the population dynamics of reindeer and caribou ungulates iscontroversial. One view is that there will a decline in caribou and musk oxen,particularly if the climate becomes more variable (Gunn and Skogland, 1997). Analternative view is that because caribou are generalist feeders and appear to be highlyresilient, they should be able to tolerate climate change (Callaghan et al., 1998).Arctic island caribou migrate seasonally across the sea ice between Arctic islands inlate spring and autumn. Less sea ice could disrupt these migrations, with unforeseenconsequences for species survival and gene flow.
Impacts may be relatively minor for livestock production systems (e.g. confinedbeef, dairy, poultry, swine) because such systems control exposure to climate andprovide opportunity for further controls (e.g. shading, wetting, increasing aircirculation, air conditioning and alterations of barns and livestock shelters).Livestock production systems that do not depend primarily on grazing are lessdependent on local feed sources and changes in feed quality, can be correctedthrough feed supplements. The fact that livestock production is distributed acrossdiverse climatic conditions from cool temperate to tropical regions providesevidence that these systems are adaptable to different climates.
Many studies of climate and weather impacts on livestock find that theprincipal impacts are an increased role for management, adoption of new breeds insome cases where climate changes are moderate (for example, Brahman cattle andBrahman crosses are more heat and insect resistant than breeds now dominant inTexas and Southern Europe) and introduction of different species in some cases ofextreme weather changes (Rath et al., 1994).
The importance of adaptations and adjustments by livestock producers is oftenoverlooked when assessing the impact of global warming on agriculture resultingin an over estimation of the impacts (Easterling et al., 1989). Hahn (1990) pointedto the importance of animal adaptations and adjustments by livestock producers indetermining the actual impact of global warming. These adjustments andadaptations can be simple farm-level changes, or they can be broader institutional-level policy changes. These adaptations are beneficial to the agriculturalcommunity as a whole, but may involve significant dislocation costs (e.g. moving toa cooler location, applying environmental modification etc.) for certain livestockproducers. Milk production declines predicted under global warming conditionsmay be reduced because of the effect of possible adaptations by animals and geneticselection for heat tolerant animals by producers. Systems with significantmanagement intervention via, for instance, forage and animal germplasmimprovement or irrigation, will provide opportunities for adaptation to meetchanging environmental conditions. Research is needed to prepare adaptivestrategies to cope with the interactive effects of changes in such conditions. Inorder to survive in an adverse environment with recurring drought due to climatechange, adaptation options, such as mobile livestock management strategies largelydetermined by available water resources, replacement of cattle by goats, expansionof arable farming etc., may be beneficial. In fact, agriculturists modify theirmanagement practices to adapt to changing climate conditions. Strategic options inthis case include varying stocking rates, timing of grazing and genotypes and speciesof grazers.
Heat stress can be reduced by the use of shade and sprinklers, and thresholdsfor their use can be determined. Jones and Hennessy (2000) applied this adaptationto the Hunter Valley in NSW, Australia, and estimated the probabilities of given
4.3.6ADAPTATIONS AND ADJUSTMENTS
FOR LIVESTOCK DUE TO CLIMATE
CHANGE
CHAPTER 4—ADAPTATION STRATEGIES REQUIRED TO REDUCE VULNERABILITY IN AGRICULTURE AND FORESTRY 65
TO CLIMATE CHANGE, CLIMATE VARIABILITY AND CLIMATE EXTREMES
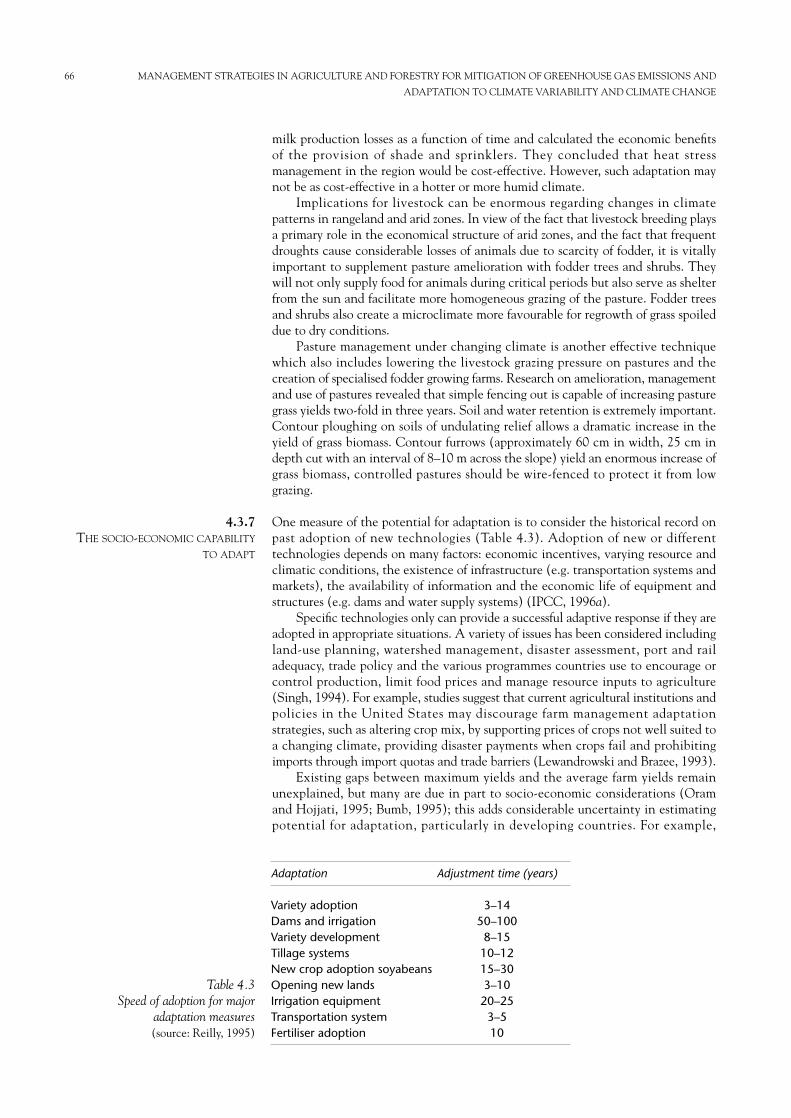
milk production losses as a function of time and calculated the economic benefitsof the provision of shade and sprinklers. They concluded that heat stressmanagement in the region would be cost-effective. However, such adaptation maynot be as cost-effective in a hotter or more humid climate.
Implications for livestock can be enormous regarding changes in climatepatterns in rangeland and arid zones. In view of the fact that livestock breeding playsa primary role in the economical structure of arid zones, and the fact that frequentdroughts cause considerable losses of animals due to scarcity of fodder, it is vitallyimportant to supplement pasture amelioration with fodder trees and shrubs. Theywill not only supply food for animals during critical periods but also serve as shelterfrom the sun and facilitate more homogeneous grazing of the pasture. Fodder treesand shrubs also create a microclimate more favourable for regrowth of grass spoileddue to dry conditions.
Pasture management under changing climate is another effective techniquewhich also includes lowering the livestock grazing pressure on pastures and thecreation of specialised fodder growing farms. Research on amelioration, managementand use of pastures revealed that simple fencing out is capable of increasing pasturegrass yields two-fold in three years. Soil and water retention is extremely important.Contour ploughing on soils of undulating relief allows a dramatic increase in theyield of grass biomass. Contour furrows (approximately 60 cm in width, 25 cm indepth cut with an interval of 8–10 m across the slope) yield an enormous increase ofgrass biomass, controlled pastures should be wire-fenced to protect it from lowgrazing.
One measure of the potential for adaptation is to consider the historical record onpast adoption of new technologies (Table 4.3). Adoption of new or differenttechnologies depends on many factors: economic incentives, varying resource andclimatic conditions, the existence of infrastructure (e.g. transportation systems andmarkets), the availability of information and the economic life of equipment andstructures (e.g. dams and water supply systems) (IPCC, 1996a).
Specific technologies only can provide a successful adaptive response if they areadopted in appropriate situations. A variety of issues has been considered includingland-use planning, watershed management, disaster assessment, port and railadequacy, trade policy and the various programmes countries use to encourage orcontrol production, limit food prices and manage resource inputs to agriculture(Singh, 1994). For example, studies suggest that current agricultural institutions andpolicies in the United States may discourage farm management adaptationstrategies, such as altering crop mix, by supporting prices of crops not well suited toa changing climate, providing disaster payments when crops fail and prohibitingimports through import quotas and trade barriers (Lewandrowski and Brazee, 1993).
Existing gaps between maximum yields and the average farm yields remainunexplained, but many are due in part to socio-economic considerations (Oramand Hojjati, 1995; Bumb, 1995); this adds considerable uncertainty in estimatingpotential for adaptation, particularly in developing countries. For example,
4.3.7THE SOCIO-ECONOMIC CAPABILITY
TO ADAPT
66 MANAGEMENT STRATEGIES IN AGRICULTURE AND FORESTRY FOR MITIGATION OF GREENHOUSE GAS EMISSIONS AND
ADAPTATION TO CLIMATE VARIABILITY AND CLIMATE CHANGE
Adaptation Adjustment time (years)
Variety adoption 3–14Dams and irrigation 50–100Variety development 8–15Tillage systems 10–12New crop adoption soyabeans 15–30Opening new lands 3–10Irrigation equipment 20–25Transportation system 3–5Fertiliser adoption 10
Table 4.3Speed of adoption for major
adaptation measures(source: Reilly, 1995)
Baethgen (1994) found that a better selection of wheat variety combined withimproved fertiliser inputs could double the yields in Uruguay to 6 T/ha under thecurrent climate with current management practices. Under the UKMO climatescenario, yields fell to 5 T/ha – still well above 2.5–3.0 T/ha currently achieved byfarmers in the area. On the other hand, Singh (1994) concludes that the normalneed to plan for storms and extreme weather events in Pacific island nations createssignificant resiliency. Whether technologies meet the self-described needs ofpeasant farmers is critical in their adaptation (Cacero, 1993). Other studiesdocument how individuals cope with environmental disasters, identifying howstrongly political, economic, and ethnic factors interact to facilitate or preventcoping in cases ranging from the Dust Bowl disaster in the United States to floodsin Bangladesh to famines in the Sudan, Ethiopia and Mozambique (McGregor,1994). These considerations indicate the need for local capability to develop andevaluate potential adaptations that fit changing conditions (COSEPUP, 1992).Important strategies for improving the ability of agriculture to respond to diversedemands and pressures, drawn from past experience in transfer technology foragricultural development follow (IPCC, 1996a).
Improved training and general education of populations dependent on agriculture,particularly in countries where education of rural workers is currently limited, canimprove the ability to adapt. Agronomic experts and extension agents can onlyprovide guidance on possible strategies and technologies which may be effective.Farmers must evaluate and compare options to find those appropriate to their needsand circumstances. Education can improve their ability options.
Strategies which are effective in dealing with current climate variability andresource degradation are also likely to increase resilience and adaptability to futureclimate change. Identification of the present vulnerability of agriculture systems,causes of resource degradation and existing systems which are resilient andsustainable could increase resilience to climate change.
Agricultural research centres and experimental stations can examine the“robustness” of present farming systems (i.e., their resilience to extremes of heat,cold, frost, water shortage and other factors). They can test new farming systems asthey are developed to meet changes in climate, technology, prices, costs and otherfactors.
Preservation and effective use of genetic material provide the bases for thedevelopment of new varieties. Biotechnology increases the scope for plantdevelopment by allowing genetic manipulation at the molecular level. Changingclimate is likely to increase the value of the networks of experimental stations thatcan share genetic material and research results. Strengthened intellectual propertyrights in developing countries might allow positive returns on private investments inseed technologies for agricultural regions.
An extension system that brings research results to farmers would allow quickerlearning about complicated interactions between changes in climate, technologyand market risks. In return, farmers’ problems, perspectives and success could be fedback to researchers, increasing the relevancy of the agricultural research system.
Food programmes and other social security programmes would provide insuranceagainst local supply changes. International famine and hunger programmes need tobe considered with respect to their adequacy.
Transportation, distribution and market integration provide the infrastructure tosupply food during crop shortfalls that might be induced in some regions because ofclimate variability or worsening agricultural conditions.
4.3.7.7 Marketing and distribution systems
4.3.7.6Food security
4.3.7.5Agricultural extension
4.3.7.4Genetic resources and intellectual
property rights protection
4.3.7.3 Agricultural research
4.3.7.2Identify present vulnerabilities
4.3.7.1Training and education
CHAPTER 4—ADAPTATION STRATEGIES REQUIRED TO REDUCE VULNERABILITY IN AGRICULTURE AND FORESTRY 67
TO CLIMATE CHANGE, CLIMATE VARIABILITY AND CLIMATE EXTREMES
Existing policies may limit efficient response to climate change. Changes in policiessuch as crop subsidy schemes, land tenure systems that do not allow private landownership, inefficient water pricing and allocation, and removal of internationaltrade barriers could increase the adaptive capability of agriculture.
Many of the above strategies will be beneficial regardless of how or whetherclimate changes. Goals and objectives vary considerably between farmers in differentcountries, with different existing situations, and subject to different future climates.
This conclusion suggests that building the capability to deal with change andevaluate possible responses is fundamental to successful adaptations.
Forests contain a wide range of species and these ecosystems contain 80 per cent ofall above ground carbon and 40 per cent of all soil carbon. A variety of biological,chemical and physical factors affect forest ecosystems. Forest productivity and thenumber of species generally increase with increasing temperature, precipitation andnutrient availability. Forests are particularly vulnerable to and may decline rapidlyunder extreme changes in water availability (either drought or waterlogging).Models project that a sustained increase of 1°C in global mean temperature issufficient to cause changes in regional climates that will affect the growth andregeneration capacity of forests in many regions. In several instances, this will alterthe function and composition of forests significantly. As a consequence of possiblechanges in temperature and water availability under doubled equivalent carbondioxide equilibrium conditions, a substantial fraction (a global average of one third,varying by region from one seventh to two thirds) of the existing forested area ofthe world will undergo major changes in broad vegetation types. The greatestchanges will occur in high latitudes.
Climate change is expected to occur rapidly relative to the speed at which forestspecies grow, reproduce, and re-establish themselves, For mid-latitude regions, anaverage global warming of 1–3.5°C over the next 100 years would be equivalent toshifting isotherms poleward approximately 150–550 km or an altitude shift of150–550 m; in low latitudes, temperatures would generally be increased to higherlevels than now exist. This compares with past tree species migration rates of theorder of 4–200 km per century. Entire forest types may disappear, and newecosystems may take their places.
Mature forests are a large terrestrial store of carbon. In general, temperate andtropical forests contain as much carbon above ground as below ground, but borealforests contain most of their carbon below ground. It remains unclear whether forestswill continue to sequester carbon through growth under less suitable conditions thanexist today. Although NPP could increase, the standing biomass of forests may notbecause of more frequent outbreaks and extended ranges of pests and pathogens, andincreasing frequency and intensity of fires. Large amounts of carbon could be releasedinto the atmosphere during transitions from one forest type to another, because therate at which carbon can be lost during times of high forest mortality is greater thanthe rate at which it can be gained through growth to maturity.
Forests are the earth’s ecosystems that remain the least disturbed by humaninfluence. Climate change affects forests on spatial scales ranging from leaves to thecanopy and on temporal scales from minutes to centuries. The relevant climaticchanges occur at all levels from short-term weather fluctuations creatingdisturbances (such as frosts) to longer term changes in average climatic conditions(such as moisture availability or the length of the growing season) or the frequencyof extreme events (such as droughts, floods or intense storms). Current climatemodels do not fully match these levels, since they are best at simulating averageconditions at a relatively coarse spatial resolution and are usually not yet run forlonger than a century. Changes in frequencies of extreme events are highlyuncertain, as are local scale climate changes, although both are of high relevanceto forests. Most transient changes in the structure of forests, such as the decline ofcertain tree species are driven by a combination of climatic changes and are
4.4.2CLIMATE CHANGE AND FORESTS
4.4 IMPACT OF CLIMATE
CHANGE ON FORESTS ANDADAPTATION STRATEGIES
4.4.1INTRODUCTION
4.3.7.8 Commodity and resource policy
reform
68 MANAGEMENT STRATEGIES IN AGRICULTURE AND FORESTRY FOR MITIGATION OF GREENHOUSE GAS EMISSIONS AND
ADAPTATION TO CLIMATE VARIABILITY AND CLIMATE CHANGE
modified by local, biological interactions acting on temporal scales ranging frommonths to centuries. It is currently very difficult therefore, to assess the likely ratesof climate driven transient changes in forests.
Tropical forest product availability will be affected more by changes in land usethan by climate change. Projections indicate that growing stock will decline byabout half due to non-climatic reasons related to human activities. This projecteddecline holds up even after calculating changes in climate and atmosphericcomposition, which could increase forest productivity, and the areas where tropicalforests can potentially grow. Communities that depend on tropical forests forfuelwood, nutrition, medicines and livelihood will most feel the effects of declinein forested area, standing stock and bio-diversity.
Temperate zone requirements for forest products could be met for at least thenext century. This conclusion emerges from projected climate and land-use changesthat leave temperate forest covering about as much land in 2050 as today. It furtherassumes that current forest harvests increase only slightly, that the annual growthincrement remains constant, and that imports from outside increasingly meet thetemperate zone’s need for forest products. Although it is not yet clear if thisassumption can be met given production projections in other zones.
Boreal forests are likely to undergo irregular and large-scale losses of living treesbecause of the impacts of projected climate change. Such losses could initiallygenerate additional wood supply from salvage harvests, but could severely reducestanding stocks and wood-product availability over the long term. The exact timingand extent of this pattern is uncertain. Current and future needs for boreal forestproducts are largely determined outside the zone by importers; future requirementsfor forest products may exceed the availability of boreal industrial roundwood duringthe 21st century, given the projections for temperate and tropical zone foreststanding stocks and requirements.
Future forest characteristics are likely to depend on a few specific aspects of the rangeof climatic changes that could occur. The most relevant include:• Changes in the regional or seasonal pattern of climate such as the temperature
increases that are expected to be greatest at high latitudes and there, greatestin winter (Greco et al., 1994). Due to this, impacts on forests at high latitudesmay be greater than elsewhere.
• Water shortages during the growing season. Decreasing summer precipitationtogether with increased evaporative demand would lead to decreases in soilwater especially in many mid-latitude regions where water is most critical forgrowth. It is important to note that water shortages can develop even withunchanged rainfall amounts, due to rising temperatures causing increasedevaporative demand. Significant regional variation with water availabilitychanging only marginally in some regions and improving in others, whereas inmany other regions water availability may decrease drastically, is expected.
• Changes in climate forcing are expected to be one or two orders of magnitudefaster than rates of climatic change experienced by forests during most of thepast 100 000 to 200 000 years, except, perhaps, during the Younger DryasEvent 10 000 years ago (Dansgaard et al., 1989; Webb III and Bartlein, 1992;Gates, 1993). Such rapid climatic change would have particular impacts onforests. For example, there may be forest decline, interruption of tree life cycles,loss of slowly migrating species, and increasing abundance of more aggressive,early successional species.
All forests are expected to experience more frequent disturbance, with greater andpossibly permanent impacts, such as increased soil erosion, and other forms ofdegradation and nutrient depletion. Rates of deforestation eventually must decreaseas less and less of the original forest remains. There are, however, proposals to slowthe loss of tropical forests (UNCED, 1992), and many nations have large-scale plansfor the protection or restoration of their forests (e.g., Brazil, India and China:
4.4.4IMPACTS OF CLIMATE AND LAND-USE
CHANGES ON TROPICAL FOREST
4.4.3EXPECTED CLIMATIC CHANGES IN
FORESTED AREAS
CHAPTER 4—ADAPTATION STRATEGIES REQUIRED TO REDUCE VULNERABILITY IN AGRICULTURE AND FORESTRY 69
TO CLIMATE CHANGE, CLIMATE VARIABILITY AND CLIMATE EXTREMES
Winjum et al., 1993). Henderson-Sellers and McGuffie (1994) show that in anenhanced carbon dioxide climatic regime, tropical evergreen broadleaf forests couldreadily re-establish after deforestation. In some areas, decreased rainfall mayaccelerate the loss of dry forests to savannah, while in others, increased rainfall andincreased water use efficiency with elevated carbon dioxide may favour theexpansion of forests and agroforestry. In both cases, the outcome will be stronglyinfluenced by human activities. Overall, shifts in rainfall patterns in the tropicscould increase the rate of conversions of forests to agricultural land by increasinghuman migration from areas affected by droughts, erosion, or other forms of landdegradation to non degraded and more productive forest land.
The productivities of different areas of tropical forest are likely to increase ordecrease in accordance with changes in rainfall, as indicated by simulation studies(Raich et al., 1991). Researchers are agreed, however, that increased water useefficiency by plants in response to elevated carbon dioxide is likely to enhance theproductivity of vegetation in the prior tropical regions.
Land-use change is obviously the greatest threat to species diversity of tropicalforests, but Cramer and Leemans (1993) speculate that climatic change alone coulddecrease the diversity of land types at the boundaries of biomes, particularly in thetropics.
As long as the current agricultural surpluses in temperate regions persist, the temperateforest area is likely to be increased by afforestation. Climatic change will enable thetemperate forest to advance poleward, in many northern areas displacing boreal forest,and also potentially to expand in wet, maritime regions (Morikawa, 1993). Earlysuccessional, pioneer species will be favoured, and opportunities will exist for forestersto introduce species and ecotypes from warmer regions (Cannell et al., 1989).However, in drier, continental regions, repeated summer droughts may lead to the lossof temperate forests. The rate of loss in biomass and carbon in this areas could exceedthe rate of carbon gain in newly forested areas (Smith et al., 1992a).
The net primary productivity of temperate ecosystems is predicted to increase inresponse to rising carbon dioxide concentrations, warming and increased nitrogenmineralisation rates. Many experiments have confirmed that elevated carbondioxide enhances the growth of young trees and that the effect is sustained overseveral years (Wullschleger et al., 1995).
Forests that are not in decline may show little change in net carbon storagebecause, in temperate climates, increases in net primary productivity may be offsetby increased soil respiration due to higher temperatures (Thornley et al., 1991;Kirschbaum, 1993). That is, the net ecosystem productivity may not change, andmay even decrease. Forests suffering from wildfire, pest outbreaks or decline eventswill loose carbon and may become a major source of carbon (King and Neilson,1992; Smith and Shugart, 1993).
There is a general consensus that climatic change will have a greater impact onboreal forests than on tropical and perhaps temperate forests, and that more frequentor changed patterns of disturbance by fire and insect pests may be more importantagents of change than elevated temperatures and carbon dioxide levels per se(Dixon and Krankina, 1993). Overall, the boreal forest is likely to decrease in area,biomass and carbon stock, with the move toward younger age-classes andconsiderable disruption at its southern boundary (Kurz et al., 1995). Carbon dioxideenrichment itself may have less effect than in warmer climates.
On its southern border, the boreal forest may give way to northern deciduousforest (or agriculture) in areas with a maritime influence and to grassland orxerophytic steppe vegetation in mid-continental areas, and species shifts may occurin the mid-boreal region (Prentice and Sykes, 1995).
The future of the transitory forest is likely to be determined by increasingoccurrence of extended high intensity wildfires until a new climate-vegetation-fireequilibrium is established (Crutzen and Goldammer, 1993). Other researchers
4.4.6IMPACTS OF CLIMATIC CHANGE ON
BOREAL FORECASTS
4.4.5IMPACTS OF CLIMATIC CHANGE ON
TEMPERATE FORESTS
70 MANAGEMENT STRATEGIES IN AGRICULTURE AND FORESTRY FOR MITIGATION OF GREENHOUSE GAS EMISSIONS AND
ADAPTATION TO CLIMATE VARIABILITY AND CLIMATE CHANGE
suggest that there may be little forest decline. Intra-specific genetic diversity willbuffer change, and species that are no longer in a favourable climate will simply growand regenerate poorly and be overtaken by invading species either gradually or afterdisturbance (Malanson et al., 1992).
Increasing temperatures are likely to stimulate soil organic matterdecomposition and increased nutrient (especially nitrogen) availability, leading toan increase in net primary productivity of non-stressed stands, averaging perhaps 10per cent in the boreal zone in a doubled carbon dioxide climate (Melillo et al.,1993). However, despite increasing productivity, there may be a net carbon loss fromthe ecosystem because a small temperature rise will greatly enhance decompositionrates (Jenkinson et al., 1991), whereas carbon dioxide fertilisation will be of loweffectiveness because of low temperatures (Kirschbaum, 1993). Also, productivitymay not increase in dry areas if water limitations increase due to a higherevaporative demand.
In the forest tundra, rising temperatures are likely to enhance the developmentand germination of seeds of many species, increasing forest cover and enabling anorthward migration to occur. However, it will take more than 100 years for anynew forest areas to mature in the forest tundra, so the northward expansion ofmature boreal forest is likely to be slower than the rate at which it is lost to grasslandand temperate deciduous forest at its southern boundary. The tundra itself is likely tobecome a carbon source in response to warming (Oechel et al., 1993).
Forests themselves may to some extent acclimate or adapt to new climaticconditions, as evidenced by the ability of some species to thrive outside their naturalranges. Also, elevated carbon dioxide levels may enable plants to use water andnutrients more efficiently (Luo et al., 1994). Nevertheless, the speed and magnitudeof climate change are likely to be too great to avoid some forest decline by the timeof a carbon dioxide doubling.
Consideration may therefore be given to human actions that minimiseundesirable impacts. Special attention may be given to specialists, species with smallpopulations, endemic species with a restricted range, peripheral species, those thatare genetically impoverished, or those that have important ecosystem functions(Franklin et al., 1992). These species may be assisted by providing natural migrationcorridors (e.g., by erecting reserves with a north-south orientation), but many mayeventually require assisted migration to keep up with the speed with which theirsuitable habitats move with climate change. Some mature forests may be assisted bysetting aside reserves at the poleward border of their range, especially if theyencompass diverse altitudes, and water and nutrient regimes (Myers, 1993), or bylessening pollutant stresses and land-use changes that result in forest degradation(Daily, 1995; Das, 2000).
Effective options for adapting to and ameliorating potential global wood supplyshortages include the following:• In the tropics, adaptation should include developing practices and policies that
reduce social pressures driving land conversion (e.g., by increasing crop andlivestock productivity) and by developing large plantations;
• In temperate areas, application of modern forestry practices to reduce harvestdamage to ecosystems combined with the substitution of non-timber products,could reduce significantly the effect of climate on wood availability;
• In boreal regions, adaptation to potential climate induced large-scale distur-bances – such as by rapid reforestation with warmth-adapted seeds – appears tobe most useful. Increased prices for forestry products seem certain to lead toadaptation measures that will reduce demand, increase harvest and make treeplantations more economically feasible.
Fuelwood supply depends very much on forest area and the quantity and pattern ofrainfall. Forests yields are likely to be reduced with decreasing rainfall. Thus in dryand densely populated areas fuelwood may become scarce due to a combination of
4.4.7.1Adaptation to gradual change
4.4.7ADAPTATION
CHAPTER 4—ADAPTATION STRATEGIES REQUIRED TO REDUCE VULNERABILITY IN AGRICULTURE AND FORESTRY 71
TO CLIMATE CHANGE, CLIMATE VARIABILITY AND CLIMATE EXTREMES
population growth and climate change. Adaptation could take the form of eitherswitching to new fuels or more efficient production and conversion of biomass.
As forests decline, increasing amounts of fuelwood may be derived from treesplanted on private land. Countries that face fuelfood or charcoal shortages andcannot afford or do not want to switch to imported fossil fuels could develop small-scale projects to test the feasibility of new biomass conversion and productiontechniques. Adaptation will be especially necessary in areas with low landavailability or low growth potential as in arid and semi-arid regions. Biofuel supplyfrom trees, shrubs, grass or crop residues can be increased or maintained by thefollowing means.• Better management of natural resources by giving local populations a stake in
sustainably grown forests (Bertrand, 1993);• Planting more trees on agricultural land and establishing better prices for bio-
fuels derived from these plantations to provide rural incomes and incentives togrow more biomass;
• Carrying out research to identify higher yielding species, preferably trees andshrubs, that are easy to propagate and are better adapted to extreme conditionssuch as droughts and acidic or saline soils (Riedacker et al., 1994);
• Increasing the productivity of agricultural land.
One of the many objectives for forest management is to foster conservation andsequestration in forests. Most forest sector actions that promote carbon conservationand sequestration make good social, economic and ecological sense in the absence ofclimate change considerations. Other objectives for managing forests includesustainable development, industrial wood and fuel production, traditional forestuses, protection of natural resources (e.g., biodiversity, water and soil), recreationand rehabilitation of damaged land. Carbon conservation and sequestrationresulting from managing for these objectives will be an added benefit.
There are basically three categories of forest management practices that can beemployed to curb the rate of increase in carbon dioxide in the atmosphere. Thesecategories are: • Management for conservation (prevent emissions);• Management for storage (short-term measures over the next 50 years or so);
and• Management for substitution (long-term measures).
The goal of conservation management is mainly to conserve existing carbonpools in forests as much as possible by controlling deforestation, protecting forests inreserves, changing harvesting regimes and controlling other anthropogenicdisturbances such as fire and pest outbreaks. The goal of storage management is toexpand the storage of carbon in forest ecosystems by increasing the area and/orcarbon density of natural and plantation forests and increasing storage in durablewood products. Substitution management aims at increasing the transfer of forestbiomass carbon into products (e.g. construction materials and biofuels) that canreplace fossil fuel based energy and products, cement-based products and otherbuilding material.
In the short term, timber supplies from all zones can be readily assured in intensivelymanaged forests. The use of forest plantations to mitigate increasing atmosphericcarbon dioxide and to generate fuels from biomass is a subject of immense interest.Unfortunately, past intensive management, especially fire suppression and treeselection at species and intra-specific levels, has created forests that now may bemore vulnerable to fire, pests and pathogens, although others dispute thisconclusion. Given the current degree of uncertainty over future climates and thesubsequent response of forest ecosystems, adaptation strategies (those enacted tominimise forest damage from a changing environment) entail greater degrees of riskthan do mitigation measures (those enacted to reduce the rate or magnitude of theenvironmental changes) (IPCC, 1996).
4.4.7.3Adaptation and coping options
4.4.7.2Carbon mitigation options by forest
management
72 MANAGEMENT STRATEGIES IN AGRICULTURE AND FORESTRY FOR MITIGATION OF GREENHOUSE GAS EMISSIONS AND
ADAPTATION TO CLIMATE VARIABILITY AND CLIMATE CHANGE
There are a number of standard harvest options suggested as appropriate forameliorating the effects of climate change (IPCC, 1996).• Sanitation harvests – increased timber losses are expected from pests, diseases
and fire because the trees themselves may be stressed by warmer conditions andthe large moisture deficits expected to accompany warming and land clearancefor tropical agriculture. Extensive sanitary felling can produce large volumes oftimber reducing revenue per unit of wood and reducing incentives for inten-sive management, while disrupting future timber availability.
• Changing harvesting method – harvesting and even site preparation are quitedependent on cold winters in northern regions where forests occur on pre-dominantly swamp lands that can only be accessed when frozen. Use ofecosystem protection approaches (Clark and Stankey, 1991) can be particular-ly useful in the light of the multiple-use needs in temperate and boreal regionsand the need for mixes of species and ages in all zones to prepare for several dif-ferent outcomes of environmental change.
• Shortening rotations – reduction of rotation age is a simple method for reduc-ing exposure of maturing timber stocks to deteriorating conditions, as well asincreasing opportunities for modifying the genetic make up of the forest. Gainsmay be offset by diminished timber quality, a lower mean annual increment,and impacts on other values such as certain game species and aesthetic quali-ties. Short-rotation plantations in tropical regions are an important option inmeeting local fuelwood needs, coincidentally relieving pressure to harvestmore pristine forests.
• Increased thinning – the stimulation of tree vigour following stand thinninghas special application under increasing moisture deficits. The modification offorest microclimate by thinning offers considerable potential for the manage-ment of pests.
Establishment options that can be quite effective in reducing the effects of climatechange are selected from common silvicultural practices.• Choice of species in anticipatory planting – mixed species for current planting
should be considered wherever possible, as a means to increase diversity andflexibility in adaptive management. Critical non-timber values such as snowretention, soil stability, water quality and carbon storage should be taken intoaccount.
• Vulnerability of young stands in anticipatory planting – the planting of speciesand varieties better adapted to future conditions may well increase vulnerabilityof the resulting stands during their early establishment. Selection of provenanceoffers an important tactic to reduce the vulnerability.
• Assisting natural migrations in protected areas – protected areas are the rich-est sources of genetic materials and warrant expansion into comprehensivesystems. To be effective they must function in landscapes where ecologicalintegrity is sufficient to permit the movement of living organisms; there mustbe a comprehensive approach to both commodity and reserved lands.
• Assisting natural migration by transplanting species – large numbers ofseedlings raised in nurseries many hundreds of kilometres from planting sitescan be planted in the millions. Optimism must be tempered by experience,however. Forest managers have been attempting to reforest Iceland for the past50 years without much apparent success.
• Gene pool conservation – specialist species (indicated by restricted geograph-ic ranges) will be most at risk, and their only chance of surviving may bethrough conservation in forest reserves, arboreta and conventional seed banksand cryogenic storage.
New research products needed to conduct an accurate assessment of socio-economicimpacts of forest responses to climate change have perhaps become obvious fromthe foregoing analysis. The assessments are based on quantitative scenarios of
4.4.8RESEARCH NEEDS
Establishment options
Harvest options
CHAPTER 4—ADAPTATION STRATEGIES REQUIRED TO REDUCE VULNERABILITY IN AGRICULTURE AND FORESTRY 73
TO CLIMATE CHANGE, CLIMATE VARIABILITY AND CLIMATE EXTREMES
changing availability of and need for forest products and amenities. Validity ofscenarios is critical if they are to function as descriptions of the implications ofcurrent knowledge for future conditions. In all regions, scenarios were foundinadequate because the effects of increasing carbon dioxide and forest dieback couldnot be quantified. In tropical regions, the scenarios are deemed inadequate becausethey probably underestimated the regional and local importance of land use ontimber availability. In temperate regions, the scenarios were incapable of quantifyingthe buffering effects on timber needs, offered by shifting technology aimed atproduct substitution and on availability by intense mechanical management offorests. In boreal regions, the scenarios excluded transient responses of timberavailability to environmental change and extra-regional responses of timber needsby economic processes, which replace local forest products demand there. Allregions probably will undergo changes that could not be expected only from thevariables considered in this assessment. Thus, research required for an adequateassessment includes both environmental monitoring and data collection, and thedevelopment of models to project future impacts.
Our capability to assess the likely fate of the world’s forests under alteredclimatic conditions has been limited because the conceptual modelling frameworkfor such an assessment is still in an early stage of development. It needs to be refinedto improve the understanding of climate change impacts at the following levels: • Firstly, the eco-physiological responses of trees to changing climate and carbon
dioxide concentrations;• Secondly, the relationship between tree growth and transient forest dynamics;
and• Thirdly, the influence of changing forest characteristics on the global carbon
balance and hence their feedback to the greenhouse effect. The predictive power of current modelling approaches decreases with each level.
A consistent research strategy to overcome these limitations needs to beaccompanied by a monitoring programme that can provide appropriate databases forinitialisation, calibration, validation and application of the models (IPCC, 1996).
The agricultural sector worldwide, accounts for approximately one fifth of theannual anthropogenic increase in greenhouse forcing, producing around 50 per centof anthropogenic methane and 70 per cent of nitrous oxide emissions and around 5per cent of anthropogenic carbon dioxide emissions (Cole et al., 1996). Land-usechanges including deforestation, biomass burning and land degradation account foran additional 14 per cent. Indications are that emission rates of methane and nitrousoxide will increase substantially as agricultural production and fertiliser use respondto the needs for increased food supply especially in developing countries.
Management of agricultural lands, rangelands and forests can play an importantrole in reducing current emissions and/or enhancing the sinks of carbon dioxide,methane and nitrous oxide. Measures to reduce emissions and sequester atmosphericcarbon include slowing deforestation, enhancing natural forest generation,establishing tree plantations, promoting agroforestry, altering the management ofagricultural soils and rangelands, restoring degraded agricultural lands andrangelands and improving the diet of ruminants. Although these are demonstrated,effective measures, a number of important uncertainties linger regarding their globalpotential to reduce emissions or sequester carbon (Desjardins et al., 2001).
Table 4.4 summarises greenhouse gas mitigation options related to agriculture.These options include a qualitative assessment of their relevance for the three tracegases of carbon dioxide, methane and nitrous oxide.
Proposed options for conserving and sequestering carbon and reducing othergreenhouse gas emissions in the forestry and agriculture sector are consistent withother objectives of land management, such as sustainable development, industrialwood and fuelwood production, traditional forest uses, protection of other naturalresources (e.g., biodiversity, soil, water), recreation and increasing agriculturalproductivity.
4.5MITIGATING
AGRICULTURAL EMISSIONSOF GREENHOUSE GASES
4.5.1INTRODUCTION
74 MANAGEMENT STRATEGIES IN AGRICULTURE AND FORESTRY FOR MITIGATION OF GREENHOUSE GAS EMISSIONS AND
ADAPTATION TO CLIMATE VARIABILITY AND CLIMATE CHANGE
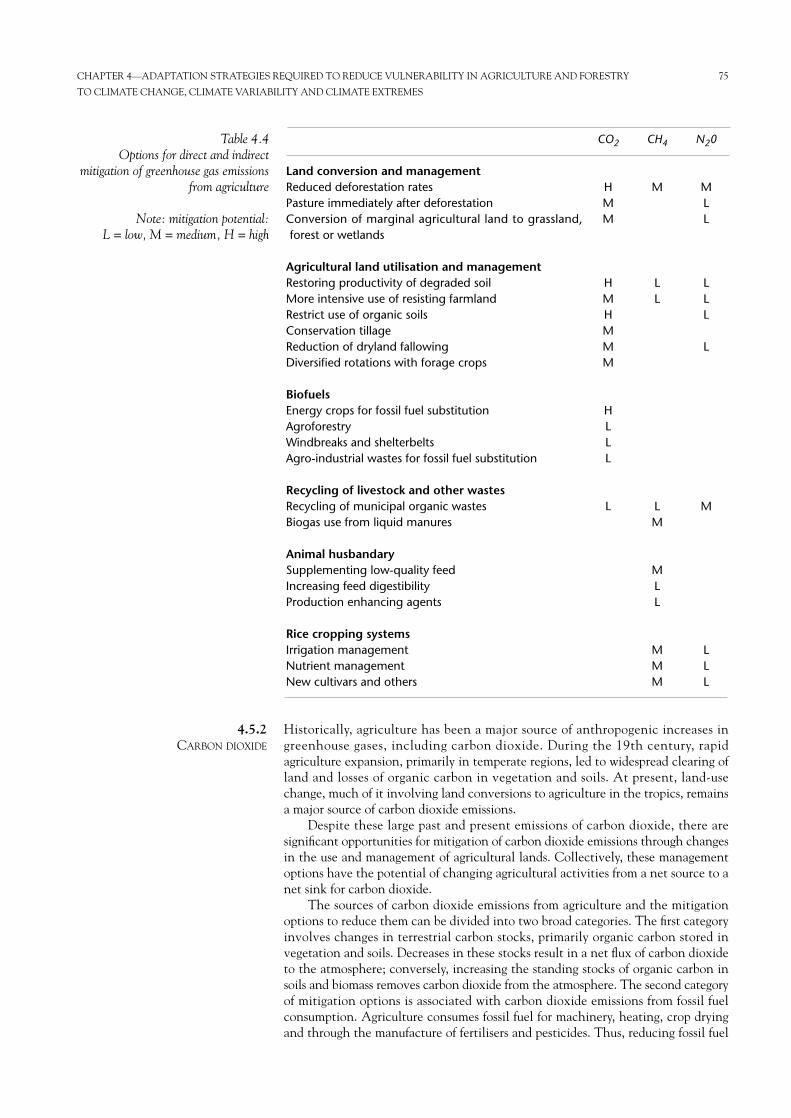
Historically, agriculture has been a major source of anthropogenic increases ingreenhouse gases, including carbon dioxide. During the 19th century, rapidagriculture expansion, primarily in temperate regions, led to widespread clearing ofland and losses of organic carbon in vegetation and soils. At present, land-usechange, much of it involving land conversions to agriculture in the tropics, remainsa major source of carbon dioxide emissions.
Despite these large past and present emissions of carbon dioxide, there aresignificant opportunities for mitigation of carbon dioxide emissions through changesin the use and management of agricultural lands. Collectively, these managementoptions have the potential of changing agricultural activities from a net source to anet sink for carbon dioxide.
The sources of carbon dioxide emissions from agriculture and the mitigationoptions to reduce them can be divided into two broad categories. The first categoryinvolves changes in terrestrial carbon stocks, primarily organic carbon stored invegetation and soils. Decreases in these stocks result in a net flux of carbon dioxideto the atmosphere; conversely, increasing the standing stocks of organic carbon insoils and biomass removes carbon dioxide from the atmosphere. The second categoryof mitigation options is associated with carbon dioxide emissions from fossil fuelconsumption. Agriculture consumes fossil fuel for machinery, heating, crop dryingand through the manufacture of fertilisers and pesticides. Thus, reducing fossil fuel
4.5.2CARBON DIOXIDE
CHAPTER 4—ADAPTATION STRATEGIES REQUIRED TO REDUCE VULNERABILITY IN AGRICULTURE AND FORESTRY 75
TO CLIMATE CHANGE, CLIMATE VARIABILITY AND CLIMATE EXTREMES
Land conversion and managementReduced deforestation ratesPasture immediately after deforestationConversion of marginal agricultural land to grassland,forest or wetlands
Agricultural land utilisation and managementRestoring productivity of degraded soilMore intensive use of resisting farmlandRestrict use of organic soilsConservation tillageReduction of dryland fallowingDiversified rotations with forage crops
BiofuelsEnergy crops for fossil fuel substitutionAgroforestryWindbreaks and shelterbeltsAgro-industrial wastes for fossil fuel substitution
Recycling of livestock and other wastesRecycling of municipal organic wastesBiogas use from liquid manures
Animal husbandarySupplementing low-quality feedIncreasing feed digestibilityProduction enhancing agents
Rice cropping systemsIrrigation managementNutrient managementNew cultivars and others
CO2
HMM
HMHMMM
HLLL
L
CH4
M
LL
LM
MLL
MMM
N20
MLL
LLL
L
M
LLL
Table 4.4 Options for direct and indirect
mitigation of greenhouse gas emissionsfrom agriculture
Note: mitigation potential: L = low, M = medium, H = high
consumption by agriculture includes several mitigation opportunities. Agriculturecan also play a role in reducing fossil fuel consumption by other economic sectorsthrough the production of biofuels. Since biofuel carbon is originally derived fromthe atmosphere, via photosynthesis, the substitution of biofuels for fossil fuelsrepresents a net decrease in anthropogenic carbon dioxide emissions.
The main terrestrial carbon stocks are made up of the carbon contained invegetation and the carbon, both organic and inorganic, stored in soils. It isestablished that during the period from 1700 to 1985, the combined amounts ofcarbon stored in the earth’s biomass and soils declined by 170 Pg mainly due to theconversion of native ecosystems to agriculture (Houghton and Skole, 1990). In thecurrent global carbon budget, there is a net emission of carbon dioxide attributedto land-use change, predominantly in the tropics, most of which is associated withland clearing for agriculture (Schimel et al., 1995). The rate of tropical land clearingfor agriculture averaged around 10 Mha per year during the 1980s (Houghton,1994).
Mitigation options relating to changes in biomass and soil carbon can besubdivided into actions which address (i) changing the type and rate of landconversion to agriculture and (ii) changing the management practices on landwhich is already in agriculture.
(i) Land-use changeLand-use conversions in the tropics – the loss of carbon from biomass and soils dueto the conversion of native ecosystems to agricultural use in the tropics is thesecond largest (after fossil fuel) source of carbon dioxide input to the atmosphere.The majority of this stems from the removal (burning and decay) of woody biomasscarbon stocks, which are irrevocably lost unless the land is returned to forest cover.Soil organic carbon also decreases following land clearing for agriculture, due to thecombined effects of increased rates of decomposition with cultivation and (often)reduced amounts of plant residues returning to the soil (Greenland, 1995). Inglobal assessments of the carbon losses attributable to land-use change, soil carbonhas been estimated to contribute 20–40 per cent of the total (Houghton and Skole,1990). As compared with biomass carbon, the quantities lost from soil are moreuncertain and more affected by management. Among the factors determining theresponse of soil carbon to disturbance are climate and soil type (Feller, 1993), landclearing method (Lal, 1986) and subsequent land use. In general, the mostfavourable scenario for maintaining (or increasing) soil carbon stocks followingland clearance is the establishment of a perennial vegetation cover, such as grass.In some cases, forest conversions to well managed pastures may result in similar orincreased soil carbon levels compared with native forest (Cerri et al., 1991) where-as most cultivated systems, as well as unimproved pastures, show substantial losses(Feller, 1993). However, the most significant option for reducing agriculturallyrelated carbon dioxide emissions, is to reduce the rate of land conversion, of tropi-cal forests in particular.
A number of difficult issues including population increase, unresolved landtenure, desire for higher living standards and other socio-political factors drive thedemand for new crop land in the tropics. However, the suitability and managementof this new cropland is often poor, resulting in land degradation which exertsadditional pressure to convert new lands to agriculture. Currently, only one half ofthe area converted from tropical forests to agriculture contributes to an increase inproductive agricultural land; the other half is used to replace previously cultivatedland which has been degraded and abandoned from production (Houghton, 1994).Thus, mitigating carbon dioxide emissions through reducing the rate of tropical landconversion is necessarily linked to a more sustainable use and improved productivityof existing farmland (Sanchez et al., 1990).
The mitigation options associated with land-use changes are strongly related tomajor climatic zones. These zones broadly differentiate according to climate and soil
4.5.2.1Change in terrestrial carbon stocks by
agriculture
76 MANAGEMENT STRATEGIES IN AGRICULTURE AND FORESTRY FOR MITIGATION OF GREENHOUSE GAS EMISSIONS AND
ADAPTATION TO CLIMATE VARIABILITY AND CLIMATE CHANGE
constraints on land management as well as human resource constraints and land-use history. In sub-humid zones, much of the land area has already beenconverted to permanent agriculture and is likely to remain so. However, improvedmanagement and productivity on these lands could help to reduce agriculturalexpansion (and hence deforestation) in humid zones, especially in Latin Americaand Africa. In the semi-arid zone, soil and biomass carbon stocks are smaller anddiffer less as a function of land use; therefore, the scope for carbon dioxide mitigationthrough changing land-use patterns is more limited. The most significantopportunities for mitigating carbon dioxide emissions from reducing tropical landconversions appear to be in the humid tropics and in tropical wetlands.
Processes causing land degradation are numerous, including soil erosion,salinisation, acidification and organic matter and nutrient depletion, usually as aresult of unsuitable land-use and management practices. To our knowledge there isno systematic global inventory of carbon stocks on degraded lands. However, it isclear that both biomass and soil carbon are generally depleted relative to nativeecosystems and well-managed agroecosystems. Thus reducing land degradation andrestoring existing degraded land are significant mitigation options. For example, inthe tropical and subtropical regions of China about 48 Mha is classified as“wasteland,” of which 80 per cent is considered suitable for forestry and 8 per centand 6 per cent could be restored as cropland and pasture, respectively (Li and Zhao,1998). In India, over 100 Mha are classified as degraded and greatly depleted in soilcarbon. Experiments have shown that salt and alkali-affected soils have a relativelyhigh potential for carbon sequestration, if suitable tree and grass species and watermanagement measures are used (Gupta and Rao, 1994). These authors estimatedthat restoration of 35 Mha of wasteland in India could sequester up to 2 Pg C.
Lands degraded by erosion can suffer large losses of carbon through physicalremoval of topsoil. For example, Weaver et al. (1987) showed a 40 per cent decreasein soil carbon content at sites in Puerto Rico with an increase in slope from 0–25per cent to greater than 45 per cent, due to increased rates of soil erosion. Manyareas of the tropics are particularly prone to water erosion, due to the high intensityrainfall, and carbon displaced by erosion is estimated to be about 1.6 Pg C y-1 forthe tropics as a whole (Lal, 1995). Deposition of carbon into buried sediments wheredecomposition is substantially slowed could reduce net carbon dioxide emissions.On the other hand, severe erosion can degrade the productivity of the land andreduce its ability to maintain carbon in biomass and soils; hence erosion controlmeasures would be highly beneficial from the standpoint of carbon dioxidemitigation.
(ii) Management of agricultural landSoil organic matter is the main carbon stock of interest in agricultural systems. Thebiomass carbon pool on agricultural lands is composed of small stature vegetationwhich is removed at least once a year by harvesting. Thus there is little capacity forlong-term accumulation of standing stocks of crop biomass, as for example in forestvegetation. Hence, discussion of mitigation potentials relating to increasing carbonstorage on agricultural lands will focus on manipulating soil carbon stocks(Desjardins et al., 2002).
A rough estimate of the potential for increasing carbon in agricultural soils canbe obtained by comparing the carbon stocks in land presently under cultivation withtheir original, pre-cultivation, carbon levels. Using the distribution of cultivatedsoils across major soil groups, their associated carbon contents, and estimatingaverage losses due to cultivation, yields a current global stock in cultivated lands of168 Pg C and a historical loss from these soils of 54 Pg C.
These global estimates of carbon loss from cultivated soils provide a referencelevel for the carbon sequestration that might be achieved through improved soilmanagement. Restoring carbon sinks in artificially-drained wetland soils is unlikelyexcept in cases where they are taken out of agricultural production and reverted towetlands. Therefore, the potential to increase carbon levels in cultivated systems is
CHAPTER 4—ADAPTATION STRATEGIES REQUIRED TO REDUCE VULNERABILITY IN AGRICULTURE AND FORESTRY 77
TO CLIMATE CHANGE, CLIMATE VARIABILITY AND CLIMATE EXTREMES
largely restricted to upland soils. Assuming a recovery of between 50–67 per cent ofhistoric carbon losses (43 Pg C from upland soils) as a reasonable upper limit, theglobal potential for carbon sequestration in agricultural soils over the next 50–100years would be on the order of 20–30 Pg C.
The amount of organic carbon which can be stored in soil is determined by thebalance of the input of carbon from plant residues and the mineralisation of soilorganic matter, released as carbon dioxide (and as methane in anaerobic soils).Factors which increase the rate of carbon inputs or decrease rates of carbonmineralisation will result in higher levels of soil carbon. Both sets of processes areunder some degree or management control, along with limits imposed by climateand soil conditions.
Crop selection, production subsidies (e.g., fertiliser, irrigation water) and residuemanagement are practices that can influence carbon inputs. Feed grains (e.g., maizeand sorghum) and intensively-managed cereals are among the annual crops whichproduce the greatest amounts of above-ground residues. In perennial forage cropsand pastures, a high proportion of the primary production is directed below groundwhich promotes the build-up of soil carbon (Haynes et al., 1991). Burning or otherremoval of residues often decreases soil carbon levels, although charcoal formationand the retention of some unburned residues may lessen the impact of burning onsoil carbon levels (Prasad and Power, 1991). Addition of exogenous carbon sourcessuch as manure and sewage sludge, which represent a “recycled” input of cropbiomass, can be effective in increasing soil carbon (Sauerbeck, 1992).
In summary, management aimed at achieving high residue production, the useof perennial forage crops, elimination of bare fallowing and reduced tillage willpromote carbon sequestration in soil.
Reversion of agricultural land – in temperate regions there is little expansion ofagricultural land, and in regions with food surpluses (e.g., USA, Canada, WesternEurope) the agricultural land base is being reduced. A similar situation may occur inthe longer term for countries in Eastern Europe and the former Soviet Union as perunit area productivity increases. Thus, the reversion of marginal agricultural landto forest (including shelterbelts and plantations), grassland and wetlands represent apotential for carbon sequestration.
It is well recognised that the conversion of cultivated agricultural land toperennial vegetation usually results in a net accumulation of soil organic matter(Paustian et al., 1997). The absence of physical disturbance due to tillage and theincrease in below ground carbon inputs, particularly with perennial grasses, are themost important factors contributing to increased soil carbon levels.
Because carbon stocks are likely to be depleted when lands are returned tocultivation, short duration set-asides will have little or no effect on long-termcarbon sequestration. If soils are left uncultivated and revert to grassland or forestvegetation, carbon contents in upper soil horizons could eventually reach levelscomparable to their pre-cultivation conditions.
Upon release from agricultural production, carbon sequestration wouldcontinue only until soils reached a new equilibrium value, most of which would berealised over a 50–100 year period. An exception is in the case of reversion towetlands, where the build-up of organic soils provides a more sustained carbon sink.
A large-scale reversion or afforestation of agricultural land is only possible ifadequate supplies of food, fibre and energy can be obtained from the remaining area.This is currently possible in the EU and USA through intensive farming systems.However, if management intensity decreases, because of environmental concerns orchanges in policy (Enquete Commission, 1995; Sauerbeck, 1994), this mitigationoption may no longer be available.
Carbon sequestration through improved management – most temperateagricultural soils have been in use for several decades to centuries and thus the rapidloss of carbon following initial cultivation has largely abated. Very little land in thetemperate zone is currently being converted to agriculture. Thus, as a first
4.5.2.2Temperate agriculture
78 MANAGEMENT STRATEGIES IN AGRICULTURE AND FORESTRY FOR MITIGATION OF GREENHOUSE GAS EMISSIONS AND
ADAPTATION TO CLIMATE VARIABILITY AND CLIMATE CHANGE
approximation, it is reasonable to assume that temperate agricultural soils as a wholeare not a large source or sink of carbon under current practices (Sauerbeck, 1993).However, soil organic carbon in permanently cropped fields can be increasedthrough a number of management practices including greater returns of organicmaterials to soil, decreased periods of bare fallow, use of perennial grasses and wintercover crops, recycling of organic wastes, reduced tillage, erosion control andagroforestry.
As discussed, soil carbon levels are closely tied to the rate of carbon return fromcrop residues and other sources. Increasing crop production through better nutrientmanagement, reduced bare fallowing and improved cultivars, can increase carboninputs to soil, if crop residues are not removed or burned.
Bare fallow is used extensively in semi-arid areas of Canada, the United States,Australia and the Former Soviet Union to offset rainfall variability and increase soilwater storage. Eliminating or reducing such fallow through better water managementcould significantly increase carbon in semi-arid croplands and decrease soil erosion(Janzen, 1987). During bare fallow periods, mineralisation of soil organic carbon isgenerally faster than under a crop, due to higher soil moisture, and there is no inputof crop residues (e.g., in a spring wheat-fallow rotation, there may be only fourmonths of crop cover per 24 months).
Greater use of perennial forage crops can significantly increase soil carbonlevels, due to high root carbon production, lack of tillage disturbance andprotection from erosion. Increases of up to 100 g Cm-2 y-1 have been documentedfor cultivated land planted to grassland. Where climate permits, winter cover cropsdecrease erosion and provide additional inputs to carbon thereby increasing soilorganic carbon.
Large applications of manure can increase soil carbon substantially (Sauerbeck,1992). However, such an application rate is not possible on a large scale and theoffsite impacts of large manure application need to be considered.
Reduced tillage systems, especially no-till, decrease the physical disturbance ofsoils and leave a higher proportion of crop residues at or near the soil surface. Mostlong-term studies comparing no-till with conventional cultivation have shown netincreases in soil organic carbon. (Paul et al., 1997). Direct, short-term measurementsof carbon dioxide flux in no-till versus tilled soil also show reduced emissions fromno-till (Reicosky and Lindstrom, 1995), which is consistent with an increase incarbon storage.
The decrease in soil carbon as a consequence of cultivation is of the same order asthat for temperate regions, averaging around 25–30 per cent (Davidson andAckerman, 1993), although carbon losses are typically more rapid in the tropics(Tiessen et al., 1994). Decreases in soil carbon are a result of lower organic matterinputs relative to native systems, enhanced decomposition rates and/or erosion.Management to increase soil carbon levels is a high priority for improving theproductivity and sustainability of tropical agricultural systems.
However, there are significant economic, educational and sociologicalconstraints to improved soil management in much of the tropics. Many tropicalfarmers cannot afford or have limited access to purchase chemical inputs such asfertilisers and herbicides. Hence, productivity is low, as is the capacity to invest insoil improving measures, such as increasing organic matter levels. Crop residues areoften needed for livestock feed, fuel or other household uses, which reduces carboninputs to soil. On the other hand, development efforts which seek to increase thesustainability and productivity of tropical agriculture will be largely compatible withcarbon dioxide mitigation needs. To the extent that improved management is basedon significantly increased fossil fuel consumption; however, benefits for carbondioxide mitigation will be correspondingly decreased.
In much of the semi-arid tropics, the predominant land use is pastoral andgrazing control is an important option for maintenance of soil carbon. Data fromnortheast Brazil suggest that improved pastures can maintain soil carbon levels
4.5.2.3Tropical agriculture
CHAPTER 4—ADAPTATION STRATEGIES REQUIRED TO REDUCE VULNERABILITY IN AGRICULTURE AND FORESTRY 79
TO CLIMATE CHANGE, CLIMATE VARIABILITY AND CLIMATE EXTREMES
comparable to that of native systems (1–1.5 per cent C in the top 20 cm), whichare roughly twice that in shifting cultivation systems (Tiessen et al., 1998). In annualcropping systems, water availability is the main determinant of productivity and theuse of reduced tillage and mulching to increase available water and reduce surfaceerosion can increase soil carbon (Lal, 1986). In areas where cropping and livestockare closely integrated, such as parts of the West African Sahel and the Miombo zonein Southern Africa, better efficiency of manure utilisation and supplementalcommercial fertiliser can increase productivity and soil carbon (Tiessen et al., 1998).Overall, however, soil carbon stocks in the semi-arid tropics are low even in nativeecosystems and therefore carbon dioxide mitigation options are limited.
In sub-humid and humid zones, carbon dioxide mitigation potentials are higher.For example, Fisher et al., (1994) reported very large below ground carbon increasesof 25–70 Mg ha-1 within 5–10 years after establishing pastures of deep-rootingAfrican grasses in Colombia. While further research is needed to substantiate thesevalues, it seems clear that carbon sequestration potential can be significant underfavourable conditions. With greater water availability, the physical condition andfertility of soils also become more important as constraints. In the humid tropics,management options will be strongly controlled by soil type.
The development of acid (AI) tolerant crops, which could increase organicinputs without increasing soil pH, is a mitigation option. The inherent physicalconditions of these soils are generally good but can be degraded with intensivetillage. Reduced tillage (Aina, 1979), mulch farming (Lal et al., 1980; Sidhu andSur, 1993), alley cropping and agroforestry practices (Hauser and Kang, 1993) cancontribute to maintenance of soil structure and reduced erosion. These practicesalso promote increased organic matter inputs and reduced decomposition rates,through reducing soil temperatures and soil disturbance. In the brown soil andvolcanic soil types, tillage and crop residue management are the major managementfactors effecting soil carbon contents. In wetland soils, especially paddy fields, lowaeration slows decomposition and leads to increased carbon contents, especially incontinuously wet soils (Greenland, 1995).
Fossil energy use by agriculture – fossil energy use by agriculture is about 3–4.5 percent of the total consumption in the developed countries of the world (Haas et al.,1995a, b; Enquete Commission, 1995). Thus, for the primary farm production sector,the mitigation potentials through reduced fuel consumption are relatively small.
Tillage, planting and harvest operations account for the greatest proportions offuel consumption in intensive cropping systems. Considerable energy savings arepossible with reductions in tillage intensity. On an areal basis, savings of 23 kg Cha-1y-1 in energy costs resulted from conversion of conventional tillage to no-till.
The fixation of atmospheric nitrogen into synthetic fertiliser requires energy,usually derived from fossil fuels. On average, the energy required to produce 1 unit ofnitrogen in fertiliser results in the release of 1.5 units of carbon to the atmosphere.Thus, the present global consumption of about 80 Tg fertiliser nitrogen results inthe emission of 120 Tg C (Cole et al., 1993). Although nitrogen fertiliser use indeveloped countries may not increase much further, it is predicted to double indeveloping countries by the year 2025 (Sauerbeck, 1994a, b). Accordingly, theenergy required for manufacturing nitrogen fertilisers, globally, will increase by about50 per cent. In Southeast Asia, for example, a 30 per cent overall increase in theuse of fossil fuel is considered necessary by the year 2000, if food production is tomeet the demands of population and economic growth. Thus, optimising nitrogenuse efficiency and minimising nitrogen surpluses would help to mitigate carbondioxide emissions, in addition to reducing nitrous oxide emissions.
Comparisons of emissions between conventional and alternative agriculturalsystems suggest a significant potential for reducing fossil carbon consumption in foodproduction. As an example, Hass et al., (1995a, b) calculated that organic farmsystems in Germany consume only 39 per cent of the overall fossil carbon requiredby comparable conventional farms. This is mainly due to the replacement of mineral
4.5.2.3Reduction in fossil fuel consumption
80 MANAGEMENT STRATEGIES IN AGRICULTURE AND FORESTRY FOR MITIGATION OF GREENHOUSE GAS EMISSIONS AND
ADAPTATION TO CLIMATE VARIABILITY AND CLIMATE CHANGE
nitrogen fertilisers by legume cropping, balanced animal stocking rates and a muchlower consumption of feed concentrates. Even energy inputs per ton of harvestedcrop were lower by 20–60 per cent (Haas et al., 1995a, b), although this depends onyield levels and cannot be generalised.
In evaluating mitigation options, the net energy use for the agricultural sector asa whole needs to be considered. For example, increased (fossil) energy inputs couldbe justified even at decreasing energy efficiencies if this intensification wasenvironmentally compatible and if yield increases resulted in surplus farmland forthe production of biofuels.
Biofuel production – the greatest agricultural potential for mitigating carbondioxide lies in increasing the amount and variety of plant biomass used directly forenergy production as a substitute for fossil energy. This increase could be realised bysubstituting biofuel crops for other agricultural crops, by growing them or byintermixing biofuel plants with food or forage plants in an agroforestry system.
Crop residues and by-products could be utilised for the production of energy toreplace fossil fuels. These vary widely, however, in terms of collecting andtransporting residues, as well as the extent to which crop residues can be removedfrom fields without adversely affecting soil carbon levels and crop productivity. Ingeneral, it is estimated that only 50 per cent of the residues can be removed withoutaffecting future soil productivity, and only 25 per cent should be considered asrecoverable for energy purposes.
Other opportunities include converting marginal or surplus crop and pastureland to forest, increasing the use of forest biomass and using recycled wood and paperproducts for biofuels. Many of the agricultural biofuels considered can be judiciouslycombined with forest biofuels to prolong harvest dates, reduce storage facility needs,create year-round feedstock supply and supply power stations.
Dedicated energy plants, including short-rotation woody crops, perennialherbaceous energy crops and annuals such as whole-plant cereal crops, could besustainably grown on the marginal to good cropland in the temperate zone. Due toincreasing agricultural demand in the tropics, a lower percentage of land is likely tobe dedicated to energy crops. However, there could be a significant amount of landstill available for biofuel production especially from marginal lands. The range ofestimated carbon emission reductions from energy crops in the tropics is estimated at160 to 513 Mt C yr-1 and in the temperate regions at 85 to 493 Mt C yr-1. Inaddition, agroforestry systems, where trees are grown in intensively managedcombinations with food or feed crops, have potential emission reductions of 10 to55 Mt C yr-1 in temperate and 46 to 205 Mt C yr-1 in tropical regions.
Recently, the use of vegetable oil for the production of biodiesel has attractedconsiderable attention. Biodiesel can be burned directly in modified diesel engines orcan be used in conventional diesel engines after conversion into methyl or ethyl.However, it currently costs considerably more to produce than petroleum diesel, soit is not likely to see expanded usage in immediate near future. The burning of wholeplant biomass as an alternative to fossil fuel results in the most significant carbondioxide mitigation, although the actual net effect depends on the plant yield andcomposition and on the intensity of the cropping system.
There are significant opportunities to utilise crop residues and by products forenergy purposes. A general estimate by Sampson et al., (1992) assumes that only 50per cent of the crop residues could be removed without affecting soil productivity,and only 25 per cent should be considered as recoverable for energy purposes. Basedon assumptions for energy conversion and degree of substitution for fossil carbon,crop residues could offset 220–320 Tg fossil C.
Estimating biomass energy potentials requires assumptions not only aboutavailable land productivity, plant species, and percentage of the crop to be used, butalso about collection and transport, conversion efficiencies and fuel substitutionfactors. Overall, agricultural biofuels (energy crops, agroforestry and crop residues)have the potential to substitute for 0.5 to 1.6 Pg fossil fuel carbon per year, whichrepresents 8–27 per cent of the current global consumption of fossil fuels.
CHAPTER 4—ADAPTATION STRATEGIES REQUIRED TO REDUCE VULNERABILITY IN AGRICULTURE AND FORESTRY 81
TO CLIMATE CHANGE, CLIMATE VARIABILITY AND CLIMATE EXTREMES
Atmospheric methane is produced by a wide variety of natural and anthropogenicprocesses. The major sources and a global budget of atmospheric methane werepresented in the 1992 IPCC report (Houghton et al., 1992).
Around 70 per cent of methane emissions arise from anthropogenic sourcesand about 30 per cent from natural sources. Agriculture is considered to beresponsible for more than two thirds of the anthropogenic sources globally.Biologically generated anaerobic environments (natural and man-made wetlands,enteric fermentation and anaerobic waste processing) are the major sources ofmethane, although losses associated with coal and natural gas industries are alsosignificant.
Human requirements for food and fibre have led to widespread conversion ofnatural ecosystems to agricultural use. This extensive land-use change, coupled withagricultural production practices and other anthropogenic effects, has had asubstantial impact on the biogeochemical cycles that determine atmosphericconcentrations of methane and nitrous oxide.
Successful development and implementation of mitigation strategies foragricultural sources of methane require comprehensive understanding of the effectsof land-use change and agricultural practices on fluxes of these gases and oncontrolling mechanisms. Current knowledge falls short of these criteria but issufficient to identify key systems/practices and geographic areas to target as well aslikely mitigation technologies. Proposed mitigation technologies should beevaluated within the context of farm production systems in order to ensure thatinteractions and/or feedbacks are taken into account.
Global assessment of methane emissions from ruminants requires that all factorscausing variations in methane emissions be considered. Methane emissions fromdomestic ruminants are estimated to be about 80 Mt yr-1, within a range of 65–100Mt yr-1. Cattle and buffalo account for about 80 per cent of the global annualmethane emissions from domestic livestock. Non-ruminant livestock make arelatively small contribution.
Ample opportunity exists to reduce methane from ruminants by improvinganimal productivity for milk and growth. A greater portion of the energy in animalfeed can be directed to milk and body weight production instead of maintenance. Ifimplemented, current and potential future technologies and management practicescould decrease methane emissions per unit product by 25 to 75 per cent in manyanimal systems; however, offsets of fossil fuel and nitrous oxide would needconsideration. Although conditions under which animals are maintained varywidely around the world, methane reduction strategies can be tailored to meet theneeds of each country.
Using combinations of these mitigation options could decrease methaneemissions per unit of product dramatically in animals fed poor quality diets whileimproved animal genetics and reproduction efficiency could decrease the numberof animals needed.
Most methane produced in anaerobic digestion constitutes a wasted energy sourcethat can be recovered by adapting manure management and treatment practicesadapted to collect methane (Hogan, 1993). The by-product of anaerobic manuredigestion can be utilised as animal feed, agriculture supplements and crop fertiliser.With current technologies methane emissions can be reduced by 25 to 80 per cent.Hogan (1993) identifies methane control options, although her estimates of totalmitigation potential need to be revised downward to reflect the revised bestestimates (USEPA, 1994) of total losses. Hogan’s recommended methods include:• Covered lagoons – this option is associated with large-scale, intensive farm
operations that are common in North America, Europe and regions of Asiaand Australia;
• Small-scale digesters – these digesters are designed to enhance anaerobicdecomposition of organic materials and to maximise methane production and
4.5.3.2Animal waste
4.5.3.1Ruminant animals
4.5.3 METHANE
82 MANAGEMENT STRATEGIES IN AGRICULTURE AND FORESTRY FOR MITIGATION OF GREENHOUSE GAS EMISSIONS AND
ADAPTATION TO CLIMATE VARIABILITY AND CLIMATE CHANGE
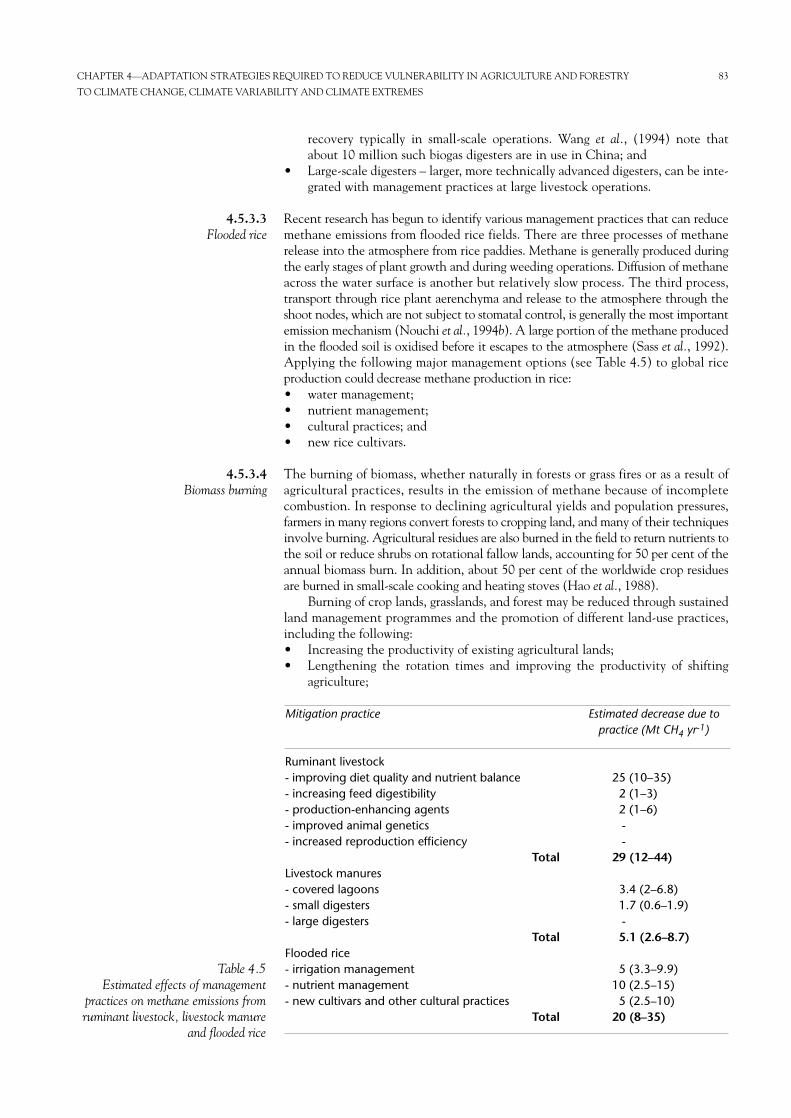
recovery typically in small-scale operations. Wang et al., (1994) note thatabout 10 million such biogas digesters are in use in China; and
• Large-scale digesters – larger, more technically advanced digesters, can be inte-grated with management practices at large livestock operations.
Recent research has begun to identify various management practices that can reducemethane emissions from flooded rice fields. There are three processes of methanerelease into the atmosphere from rice paddies. Methane is generally produced duringthe early stages of plant growth and during weeding operations. Diffusion of methaneacross the water surface is another but relatively slow process. The third process,transport through rice plant aerenchyma and release to the atmosphere through theshoot nodes, which are not subject to stomatal control, is generally the most importantemission mechanism (Nouchi et al., 1994b). A large portion of the methane producedin the flooded soil is oxidised before it escapes to the atmosphere (Sass et al., 1992).Applying the following major management options (see Table 4.5) to global riceproduction could decrease methane production in rice:• water management;• nutrient management;• cultural practices; and• new rice cultivars.
The burning of biomass, whether naturally in forests or grass fires or as a result ofagricultural practices, results in the emission of methane because of incompletecombustion. In response to declining agricultural yields and population pressures,farmers in many regions convert forests to cropping land, and many of their techniquesinvolve burning. Agricultural residues are also burned in the field to return nutrients tothe soil or reduce shrubs on rotational fallow lands, accounting for 50 per cent of theannual biomass burn. In addition, about 50 per cent of the worldwide crop residuesare burned in small-scale cooking and heating stoves (Hao et al., 1988).
Burning of crop lands, grasslands, and forest may be reduced through sustainedland management programmes and the promotion of different land-use practices,including the following:• Increasing the productivity of existing agricultural lands;• Lengthening the rotation times and improving the productivity of shifting
agriculture;
4.5.3.4Biomass burning
4.5.3.3Flooded rice
CHAPTER 4—ADAPTATION STRATEGIES REQUIRED TO REDUCE VULNERABILITY IN AGRICULTURE AND FORESTRY 83
TO CLIMATE CHANGE, CLIMATE VARIABILITY AND CLIMATE EXTREMES
Mitigation practice
Ruminant livestock- improving diet quality and nutrient balance- increasing feed digestibility- production-enhancing agents- improved animal genetics- increased reproduction efficiency
Livestock manures- covered lagoons- small digesters- large digesters
Flooded rice- irrigation management- nutrient management- new cultivars and other cultural practices
Total
Total
Total
Estimated decrease due topractice (Mt CH4 yr-1)
25 (10–35)2 (1–3)2 (1–6)--
29 (12–44)
3.4 (2–6.8)1.7 (0.6–1.9)-5.1 (2.6–8.7)
5 (3.3–9.9)10 (2.5–15)
5 (2.5–10)20 (8–35)
Table 4.5Estimated effects of management
practices on methane emissions fromruminant livestock, livestock manure
and flooded rice
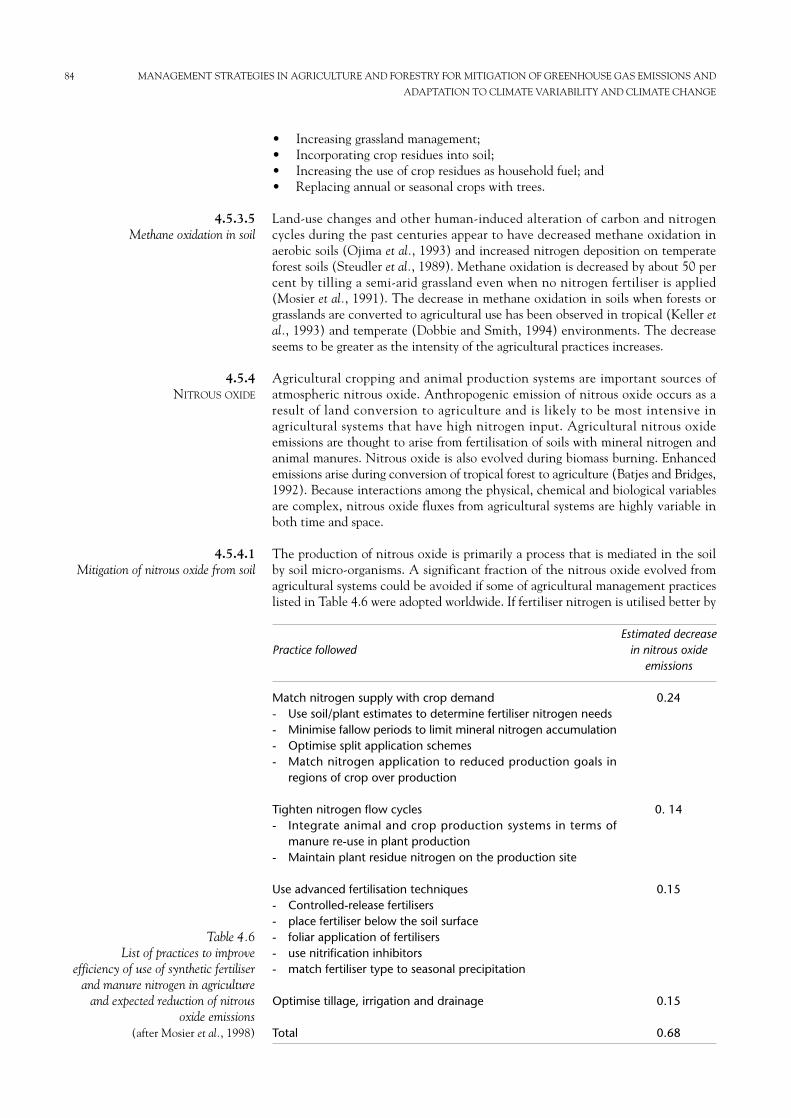
• Increasing grassland management;• Incorporating crop residues into soil;• Increasing the use of crop residues as household fuel; and• Replacing annual or seasonal crops with trees.
Land-use changes and other human-induced alteration of carbon and nitrogencycles during the past centuries appear to have decreased methane oxidation inaerobic soils (Ojima et al., 1993) and increased nitrogen deposition on temperateforest soils (Steudler et al., 1989). Methane oxidation is decreased by about 50 percent by tilling a semi-arid grassland even when no nitrogen fertiliser is applied(Mosier et al., 1991). The decrease in methane oxidation in soils when forests orgrasslands are converted to agricultural use has been observed in tropical (Keller etal., 1993) and temperate (Dobbie and Smith, 1994) environments. The decreaseseems to be greater as the intensity of the agricultural practices increases.
Agricultural cropping and animal production systems are important sources ofatmospheric nitrous oxide. Anthropogenic emission of nitrous oxide occurs as aresult of land conversion to agriculture and is likely to be most intensive inagricultural systems that have high nitrogen input. Agricultural nitrous oxideemissions are thought to arise from fertilisation of soils with mineral nitrogen andanimal manures. Nitrous oxide is also evolved during biomass burning. Enhancedemissions arise during conversion of tropical forest to agriculture (Batjes and Bridges,1992). Because interactions among the physical, chemical and biological variablesare complex, nitrous oxide fluxes from agricultural systems are highly variable inboth time and space.
The production of nitrous oxide is primarily a process that is mediated in the soilby soil micro-organisms. A significant fraction of the nitrous oxide evolved fromagricultural systems could be avoided if some of agricultural management practiceslisted in Table 4.6 were adopted worldwide. If fertiliser nitrogen is utilised better by
4.5.4.1Mitigation of nitrous oxide from soil
4.5.4NITROUS OXIDE
4.5.3.5Methane oxidation in soil
84 MANAGEMENT STRATEGIES IN AGRICULTURE AND FORESTRY FOR MITIGATION OF GREENHOUSE GAS EMISSIONS AND
ADAPTATION TO CLIMATE VARIABILITY AND CLIMATE CHANGE
Practice followed
Match nitrogen supply with crop demand- Use soil/plant estimates to determine fertiliser nitrogen needs- Minimise fallow periods to limit mineral nitrogen accumulation- Optimise split application schemes - Match nitrogen application to reduced production goals in
regions of crop over production
Tighten nitrogen flow cycles- Integrate animal and crop production systems in terms of
manure re-use in plant production- Maintain plant residue nitrogen on the production site
Use advanced fertilisation techniques- Controlled-release fertilisers- place fertiliser below the soil surface- foliar application of fertilisers- use nitrification inhibitors- match fertiliser type to seasonal precipitation
Optimise tillage, irrigation and drainage
Total
Estimated decreasein nitrous oxide
emissions
0.24
0. 14
0.15
0.15
0.68
Table 4.6 List of practices to improve
efficiency of use of synthetic fertiliserand manure nitrogen in agriculture
and expected reduction of nitrousoxide emissions
(after Mosier et al., 1998)
the crop, the amount of nitrogen needed will be less and therefore, less nitrous oxidewill be produced and even lesser nitrogen will leak from the system (Sauerbeck,1994b). Some of practices, such as use of nitrification inhibitors are known to havea direct effect on decreasing nitrous oxide emissions in field studies (Bronson et al.,1992). McTaggart et al. (1994) have shown that timing of application of differenttypes of synthetic fertiliser with seasonal water distribution can limit nitrous oxideproduction. Several application of small amounts of fertiliser nitrogen during thegrowing season have proven more useful for supplying nitrogen for plant growth insome systems than one large dose at the beginning of the season.
Only the direct emissions are readily amenable to control by on-farmmanagement, but management options that decrease the amount of extent nitrogenneeded to produce a crop also will decrease indirect nitrous oxide production.
By better matching nitrogen supply to crop demand and more closelyintegrating animal waste and crop residue management with crop production,nitrous oxide emissions could be decreased by about 0.38 Mt N2O. Furtherimprovements in farm technology, such as use of controlled-release fertilisers,nitrification inhibitors, timing and water management, should lead to improvementsin nitrogen use efficiency and further limit nitrous oxide production. Using inter-seasonal cover crops is one means of minimising the accumulation of nitrogen oxide;and its loss by denitrification.
Estimates indicate that 1000 Tg of woody biomass and 4 to 5 per cent of the world’sland (USEPA, 1990) is burned annually. Savannah and rangeland biomass is oftenburned to improve livestock forage. Such agricultural related burning may accountfor 50 per cent of the biomass burned annually. In addition crop resources andanimal dung are burned for fuels. Bouwman (1994) reviews that status of nitrousoxide formation during biomass burning and estimates a global emission of 0.1 to0.3 Mt N y-1. The mitigation potential is difficult to assess because if crop residue isreturned to the soil, part of the nitrogen mineralised will be converted to nitrousoxide. A significant decrease in the amount of agricultural biomass that is burnedcould be achieved by composting the material before it is returned to the field. It isnot known, however, how much nitrous oxide is released during composting.Burning also may make nitrogen and other nutrients more available to soil micro-organisms and result in enhanced emissions of nitrous oxide from soil.
Conversion of tropical forests to pasture and arable land may contribute an importantamount of nitrous oxide to the atmosphere (Keller et al., 1993). It is estimated that a20 per cent reduction from existing levels can be achieved by suitable management.
The concern over potential impacts of climate change by various parts of societyhas been heightened by increases in weather related impacts that have occurred inrecent years. Understanding potential climate change both in terms of trends andchanges in extreme events is critically important for a wide range of policy decisions(Pielke and Landsea, 1998).
Climatologically, extreme events are associated with “anomalous” weather,sometimes defined in terms of a “return period” of 10 years, 100 years or some othervalue (probabilities equivalent to one event in 10 years, 100 years, etc.). Increasedfrequency and magnitude of extreme events is often mentioned as a potentialcharacteristic of future global climate (Easterling, 1990). Even small changes in thefrequency of extreme events may have a disproportionate effect on whatmanagement can cope up with. For example, the life cycle of perennial plants maychange drastically if the frequency of extremes increases significantly, becauseseedling establishment and mortality of these plants are highly sensitive to extremes(Graetz et al., 1988). Both the stability of forage supply and the balance betweentemperature and subtropical species are largely controlled by the frequency ofextreme climatic events and thus are subject to change in a carbon dioxide warmedclimatic change scenario.
4.6 IMPACT OF EXTREME
EVENTS ON AGRICULTUREAND ADAPTATION
MEASURES
4.6.1INTRODUCTION
4.5.4.3Conversion of tropical forest
4.5.4.2Release due to biomass burning
CHAPTER 4—ADAPTATION STRATEGIES REQUIRED TO REDUCE VULNERABILITY IN AGRICULTURE AND FORESTRY 85
TO CLIMATE CHANGE, CLIMATE VARIABILITY AND CLIMATE EXTREMES
Weather disaster interactions with agriculture are complex and are likely to involvenon-agricultural factors. Weather factors which may negatively affect agricultureare given in Table 4.7. In order to assess the impact of weather disaster on agricul-ture, one must link two fundamental aspect, first, the disaster proper i.e. thedestructive power of the event and, secondly, the characteristics of the agriculturalsystem which has been hit. The counter measures that local/regional/nationalauthorities can take, include conservation of mountain slopes, rivers and coasts;preparation of systems for disaster prevention; meteorological observation andinformation systems; promoting people’s consciousness of preventing diseases; andthe development of communication systems. In the following discussion an attempthas been made to discuss some extreme events and their effect on agriculture alongwith the adaptation measures to reduce the negative effects (Das, 1997).
Droughts can be broadly classified in three types – meteorological, hydrological andagricultural droughts. In the South Asian latitudes, they are often intensified byprolonged dry seasons caused by anomalous monsoon circulation. The most vulnerableareas are those under the influence of subtropical anticyclones. Because of the quasi-cyclic nature of drought over large sections of the globe, it is doubtful if climaticwarming will decrease their intensity or frequency. Agricultural settlements in regionssuch as sub-Saharan Africa, Australia, China, southern Europe and mid-continentalNorth America are projected to be sensitive to drought conditions. The increasedsensitivity of crops to drought during the period from rooting to heading stage is wellknown. Particularly, adverse is the combination of drought and high temperatureswhich enhance evapotranspiration reducing soil moisture. These conditions wouldalso reduce the number of heads formed at this time, leading to the reduction of yield.
The economic and social impact of droughts has a pervasive societal ramificationwhich is often aggravated by human action, particularly in developing countries.Associated human misery underscores our vulnerability to this natural hazard. It is,therefore, necessary to improve our knowledge of the nature and causes of droughtand to make strategies for reducing its adverse impacts.
As with the occurrence of other disasters resulting from extreme weather eventsthere are two distinct phases in which the application of the knowledge of weatherand climate can minimise the impact of drought on the communities. The first isthe long-term planning in which strategies can be devised and precautions taken toreduce impact. The second phase is the action taken during the onset of the eventto reduce adverse effects.
The arid, semi-arid and marginal areas have a higher probability of droughtsincidence. In these zones, it is important for those responsible for planning of landuse and agricultural programmes, to seek expert climatological advice regardingrainfall expectations. Drought is the result of the interaction between land-usepattern and the rainfall regimes. There, is thus, an urgent need for a detailedexamination of rainfall records of these regions. In this regard, the development ofmethods of predicting, many weeks or months in advance, the occurrence of rainfalldeserves high priority.
Since the technological impacts quickly reach an optimum level, moreemphasis should be placed on the drought management policies to minimise thefoodgrain loss. The agricultural planning and practices need to be worked outconsidering overall water requirements within the agroclimatic zones. Crops whichneed shorter duration for maturity and require less water, need to be encouraged.Food reserve to meet the emergency of maximum up to two consecutive droughtsmust be maintained.
There is a need to have a drought watch system in a drought prone country atzonal levels having experts in meteorology, agriculture, irrigation, public health,food supplies etc. This system could monitor drought once it commences and offerremedial measures to the appropriate authorities. The pre-requisites for theoperation of such a drought watch system are:
4.6.3.2Drought management
4.6.3EFFECT OF EXTREME EVENTS ON
CROPS AND POSSIBLE ADAPTATIONS
4.6.3.1Drought
4.6.2NEGATIVE EFFECTS OF EXTREME
EVENTS ON AGRICULTURE
86 MANAGEMENT STRATEGIES IN AGRICULTURE AND FORESTRY FOR MITIGATION OF GREENHOUSE GAS EMISSIONS AND
ADAPTATION TO CLIMATE VARIABILITY AND CLIMATE CHANGE
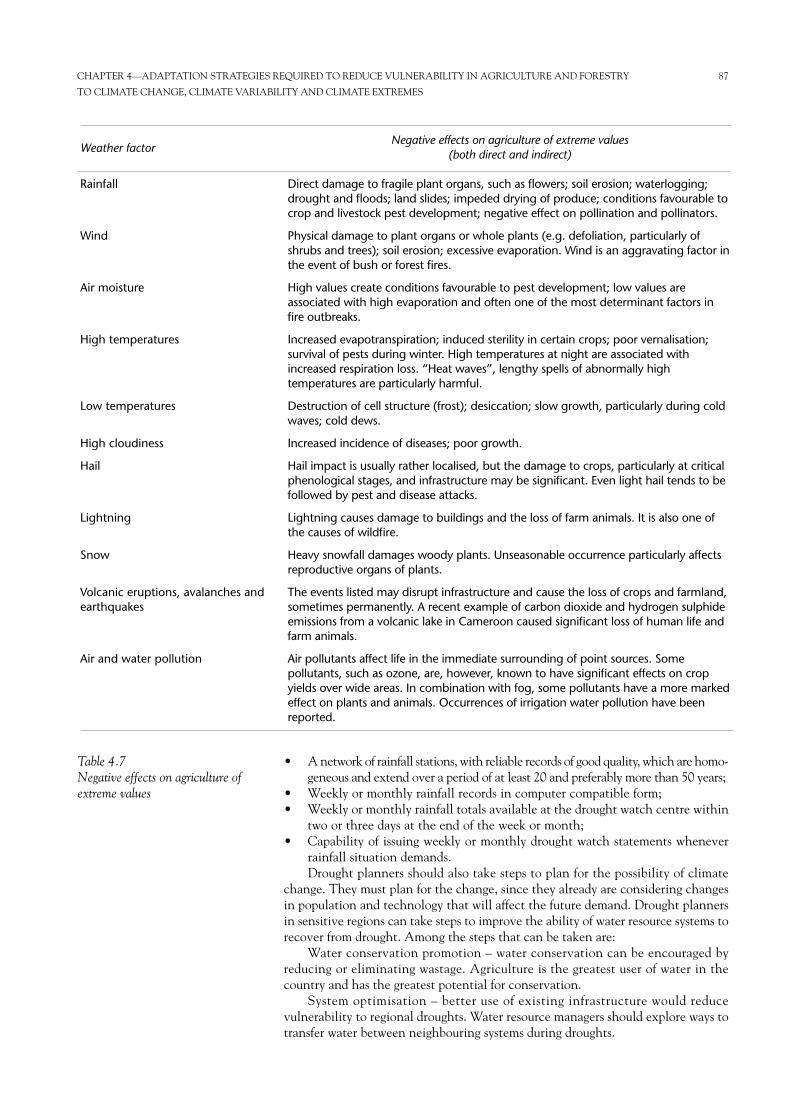
• A network of rainfall stations, with reliable records of good quality, which are homo-geneous and extend over a period of at least 20 and preferably more than 50 years;
• Weekly or monthly rainfall records in computer compatible form;• Weekly or monthly rainfall totals available at the drought watch centre within
two or three days at the end of the week or month;• Capability of issuing weekly or monthly drought watch statements whenever
rainfall situation demands.Drought planners should also take steps to plan for the possibility of climate
change. They must plan for the change, since they already are considering changesin population and technology that will affect the future demand. Drought plannersin sensitive regions can take steps to improve the ability of water resource systems torecover from drought. Among the steps that can be taken are:
Water conservation promotion – water conservation can be encouraged byreducing or eliminating wastage. Agriculture is the greatest user of water in thecountry and has the greatest potential for conservation.
System optimisation – better use of existing infrastructure would reducevulnerability to regional droughts. Water resource managers should explore ways totransfer water between neighbouring systems during droughts.
CHAPTER 4—ADAPTATION STRATEGIES REQUIRED TO REDUCE VULNERABILITY IN AGRICULTURE AND FORESTRY 87
TO CLIMATE CHANGE, CLIMATE VARIABILITY AND CLIMATE EXTREMES
Negative effects on agriculture of extreme values (both direct and indirect)
Direct damage to fragile plant organs, such as flowers; soil erosion; waterlogging;drought and floods; land slides; impeded drying of produce; conditions favourable tocrop and livestock pest development; negative effect on pollination and pollinators.
Physical damage to plant organs or whole plants (e.g. defoliation, particularly ofshrubs and trees); soil erosion; excessive evaporation. Wind is an aggravating factor inthe event of bush or forest fires.
High values create conditions favourable to pest development; low values areassociated with high evaporation and often one of the most determinant factors infire outbreaks.
Increased evapotranspiration; induced sterility in certain crops; poor vernalisation;survival of pests during winter. High temperatures at night are associated withincreased respiration loss. “Heat waves”, lengthy spells of abnormally hightemperatures are particularly harmful.
Destruction of cell structure (frost); desiccation; slow growth, particularly during coldwaves; cold dews.
Increased incidence of diseases; poor growth.
Hail impact is usually rather localised, but the damage to crops, particularly at criticalphenological stages, and infrastructure may be significant. Even light hail tends to befollowed by pest and disease attacks.
Lightning causes damage to buildings and the loss of farm animals. It is also one ofthe causes of wildfire.
Heavy snowfall damages woody plants. Unseasonable occurrence particularly affectsreproductive organs of plants.
The events listed may disrupt infrastructure and cause the loss of crops and farmland,sometimes permanently. A recent example of carbon dioxide and hydrogen sulphideemissions from a volcanic lake in Cameroon caused significant loss of human life andfarm animals.
Air pollutants affect life in the immediate surrounding of point sources. Somepollutants, such as ozone, are, however, known to have significant effects on cropyields over wide areas. In combination with fog, some pollutants have a more markedeffect on plants and animals. Occurrences of irrigation water pollution have beenreported.
Weather factor
Rainfall
Wind
Air moisture
High temperatures
Low temperatures
High cloudiness
Hail
Lightning
Snow
Volcanic eruptions, avalanches andearthquakes
Air and water pollution
Table 4.7 Negative effects on agriculture ofextreme values
Water quality protection – water pollution, control and abatementprogrammes can increase the amount of water available for consumption duringdroughts. River basins authorities should have comprehensive drought contingencyplans that will reduce the impacts of drought quickly, such as automatic short-termwater rationing.
All of these measures should have benefits even if climate does change or doesnot change.
Floods are produced by tropical cyclones, severe thunderstorms or prolonged heavy(including monsoonal) rainfall. These floods occur mainly in areas where the soil isnot well drained or are clayey and hence non-drainable. Heavy rains and floodsresult in certain constraints on agricultural activities but their impacts may varygreatly from one area to another depending on the rate of drainage seepage anddrying. Examples of negative effects, either direct or indirect of heavy rain and floodon agriculture, are the damage to fragile plant organs such as flowers and buds, soilerosion, waterlogging causing root asphyxiation and conditions favourable to cropand livestock pest development as well as on pollination and pollinators. But floodsmay have positive effects as well including silt deposition, water reserves repletionand soil desalinisation. Of particular notice in this context are riverbed changes andmajor landslides which may completely modify the agricultural landscape.
Hailstorms are another hazard which causes considerable damage to agriculturalproduction and productivity. Snow and ice have both beneficial and unfavourableeffects on agriculture.
Although humans possess considerable adaptive management capabilities to dealwith floods, flooding could become a more common problem with climate change,even if average precipitation decreases. Various devices may be employed in order tocontrol an excess flow of water so that a flow may be prevented, or at least, the worsteffects reduced. These devices include engineering works, embankments, detentionreservoirs, and the adaptation of river channels and facilities for flood diversion.The possibility of storm surges further complicates the problem of flood control.
Heavy rains due to monsoon occur mostly in lowlands and also along tropical coaststhat are exposed to trade winds. The precipitation is of the showery type, with theorographic effect often playing an important role. However, certain areas also getheavy rainfall when tropical depressions pass.
Hurricanes, tropical storms and typhoons also account for a considerableproportion of the heavy rainfall but the zone of heavier falls is restricted to aroundtheir landfall.
Heavy rains often adversely affect agricultural operations such as delayingplanting and other agricultural activities. Heavy rains injure plants by bending theplants to the ground. Floods and waterlogging induced by heavy rains cause damageto the plants by cutting of the oxygen supply to the roots. Heavy rains also indirectlyaffect the plants by creating congenial conditions for the development of pest anddiseases of crops and livestock.
Hailstones, which occur both in the temperate region and in the tropics, canphysically damage young crops in the field and so constitute a major hazard toagricultural production wherever they occur frequently. In continental USA, hailranks as the most destructive weather phenomenon, greater than that of tornadoes,typhoons or hurricanes. For the world as a whole, hailstorms are responsible forroughly the same annual monetary damage to crops as the combination ofhurricanes and tornadoes; this is due to their higher frequency and widerdistribution. Very often a hailstorm is followed by pest and disease attacks.
Various measures are usually taken to minimise or prevent crop damage fromhailstones. The possibility of influencing the incidence of hail is bound to appear
4.6.3.7Hail prevention
4.6.3.6Hails and crop damage
4.6.3.5Heavy rains and agricultural
production
4.6.3.4Flood control
4.6.3.3Floods
88 MANAGEMENT STRATEGIES IN AGRICULTURE AND FORESTRY FOR MITIGATION OF GREENHOUSE GAS EMISSIONS AND
ADAPTATION TO CLIMATE VARIABILITY AND CLIMATE CHANGE
highly questionable, in view of the enormous amounts of energy that are liberated inthe condensation process. However, in the past, various farm organisations havemade large-scale attempts to ward off the danger by “hail bombardment”. Thismethod aims at preventing hail formation by means of sound waves produced by anexploding rocket. Carefully controlled experiments carried out in Australia and Italyas early as the beginning of the 20th century demonstrated that hail bombardmentproduces no ascertainable effect.
Efforts to reduce the occurrence of hailstorms by seeding of high cumulus orcumulonimbus clouds have not yet produced any conclusive results even indeveloped countries. The aim of seeding is to create more small ice particles andmore but smaller hailstones which are less damaging to crops. Cloud seeding for thepurpose of suppressing hail is very common in Russia and has been carried outmostly on an experimental basis in parts of East Africa, notably Kenya. Developingcountries continue to suffer considerable loss of their agricultural production due tohailstorms. Although some research is in progress on cloud physics and hailoccurrences, a lot of work still remains to be done in the area of crop damage byhailstorms. It is understood that some farmers have been taking special insurancepolicies against damage caused by hailstorms.
Although regarded as unfavourable to agriculture, snow, ice and frozen ground mayoften be beneficial for agricultural production. There is considerable literature onthe effects on agriculture of these meteorological phenomena (Ventskevich, 1961).
Some of the implications of snow and ice and the frozen ground for agricultureinclude:• Snow and ice is an on-site stored source of water;• Snow and ice are physical hazards to livestock, and are also agents which par-
tially or completely cut off herbage from grazing animals. This seriously affectsthe management and transport of both fodder and animals. A range of physio-logical disorders and diseases of livestock can be attributed to snow and ice inaddition to the effects of cold weather on the maintenance of body heat;
• Snow, ice and frozen ground act as limiting factors in field cultivation andother operations (e.g. movements of fertilisers, farm produce), and restrictgrowth and development of both annual and perennial crops. These factorsgive rise to physical and disease damage to vegetation (e.g. breaking of forestand orchard tree branches, of fruit bushes, snow mould or “winter killing” ofpasture grasses etc.);
• Snow is a beneficial insulator from excessively low temperatures of ground andburied crops.In contrast to arable farming, snow, ice and frozen ground are almost entirely
detrimental to animal husbandry. In addition to direct effects on animals and theirmanagement, snow cover can seriously damage permanent pastures. Among the plantphysiological and fungal disorders that can arise are “snow mould”, which occursparticularly if a snow cover becomes very compact with or without actual layers ofice. Certainly under ice the diffusion of gases (oxygen and carbon dioxide) is seriouslyrestricted; under snow, adequate gas exchange seems possible. In spring the plants,weakened by lack of carbohydrate, are attacked by snow moulds which grow at theexpense of the carbohydrate reserves remaining in the plants and kill them.
A whole new class of hazards from snow and ice arise in forestry; among them thebreaking of branches and trunks due to snow loading, and particularly the loadingwhich occurs when freezing rain, driven in the wind, gets deposited and a layer of icebuilds up. Snow avalanching in mountainous areas – where forestry is often adominant feature of the economy – can be a serious “hazard”, as can be mudflowsassociated with the thaw. Forests can play a role in the control of water supplies. Bytrapping snow in the winter, and by the slow release of water during the spring thaw,the forest can inhibit “flash flows” and downstream flooding and the inevitable wasteof water.
4.6.3.9Snow and its impact on forestry
4.6.3.8Snow and snow cover, ice and frozen
ground and their implications foragriculture and adaptation measures
CHAPTER 4—ADAPTATION STRATEGIES REQUIRED TO REDUCE VULNERABILITY IN AGRICULTURE AND FORESTRY 89
TO CLIMATE CHANGE, CLIMATE VARIABILITY AND CLIMATE EXTREMES
The control and distribution of the valuable source of moisture in snow cover can beinfluenced by the use of shelterbelts. With belts of suitable permeability, the relativereduction of wind speed can lead to a retention of snow in a selected area. Wide,dense belts accumulate snow windward and within them; narrow, dense belts tend toaccumulate drifts windward and for some limited distance to the lee. In very aridareas it could be worthwhile encouraging the accumulation of snow in limited areasrather than allowing it to be spread thinly over extended areas.
The effect of windbreaks upon snow deposition and snow cover varies with thetype of belt and with the amount of snow. With dense windbreaks, wind-driven snowaccumulates on the windward side and, if the belt is wide, snow moves into it. If thebelt is narrow snow is deposited in the relatively quiet conditions of the protected zone.Strong winds in unprotected areas will remove snow from one part and deposit it else-where. In the protected area behind a narrow belt, the deposit can be rendered moreeven, with consequent advantages. Given sufficient snow, drifts will form in theprotected zone, but the more open the barrier, the less the build-up. Each species andvariety have not only optimal temperatures for different growth stages and functions,but lower and upper lethal limits too. Most physiological processes in plants occurbetween 0 and 45°C while arctic and alpine plants have optima as low as 12°C. Whentemperatures are equal to or below the lower limit, plant development ceases. Abovethe lower limit and below the optimum, chemical reaction becomes slow so that maxi-mum utilisation of the available photosynthate does not take place. Above theoptimum, substrates that could be used for yield, are increasingly lost through exces-sive respiration. At temperatures higher than 45°C, most physiological processesdecline due to the destruction of the enzyme system. High temperature can directlylead to unhealthy development of plant organs which results in lower yield or poorerquality of plants. Heat injury occurs occasionally in mid- and low latitude areas, andarid and semi-arid environments.
Retardation of growth and difficulties in fertilisation, even in heat-loving crops suchas maize and sorghum, occur at temperatures that are often well below the lethallimit. The harmful effects of excessive temperatures are usually aggravated by lack ofavailable moisture. Hot, dry dessicating winds usually further increase the damage.The yield of grain sorghum is adversely affected by heat waves occurring at flowering(Skerman, 1956). The damage can be the result of high temperature, water stress orboth factors. It was found that there was a loss of pollen viability due to dryness, notheat, which was, however, insufficient to reduce the number of grains set. Thereduction of grain set recorded was found to be entirely due to heat, and not dryness.The degree of damage caused by high temperature depends on the phenologicalstage of the plant at the time of heat wave, yield being most affected at, or soonafter, the boot stage (Pasternak and Wilson, 1969).
Low temperatures exert a powerful influence on most organisms and are rare intropical areas. Obviously damage due to low temperatures is the joint effect of thelow temperature and the length of time such temperatures persist. In temperateclimates two types of injuries occur because of low temperature. These are delayedgrowth and sterility.
Most crop plants are injured and many killed when night temperature is verylow. Tender leaves and flowers are very sensitive to low temperature and frost. Plantswhich are growing rapidly and flowering are easily killed. Low temperature interfereswith the respiration of plants. If low temperature coincides with wet soil, it results inthe accumulation of harmful products in the plant cells. Frost also interferes withplant metabolism.
Damage to crops by frost and freezing temperatures causes serious loss to farmers inmany parts of the world. In mid-latitudes, the incidence of killing frost determinesthe length of the growing season, which is practically limited to the time-intervalbetween the last killing frost of spring and the first killing of autumn. The shorter
4.6.3.13 Effect of frost on plant
4.6.3.12 Effect of low temperature and cold
spells on plants
4.6.3.11Heat waves and crop production
4.6.3.10Control of snow for agricultural
purposes
90 MANAGEMENT STRATEGIES IN AGRICULTURE AND FORESTRY FOR MITIGATION OF GREENHOUSE GAS EMISSIONS AND
ADAPTATION TO CLIMATE VARIABILITY AND CLIMATE CHANGE
this period is, the earlier maturing will be the varieties that can be grown and lowertheir potential yielding ability. In warmer regions occasional and exceptional frostsmay do considerable damage because the crops grown in such regions are usuallyvery susceptible to low temperature. Frost are, on the other hand, common in thetemperate region and in the subtropical areas which suffer occasional incursions ofcold air masses. The most acceptable theory of the injury and death caused by frostis the formation of ice crystals in and outside the plant cell.
Much of the damage caused to crops by frost and freezing temperature can beprevented. In some cases, the best protective measures are passive and can be takenlong before the freeze occurs. In other cases the protective methods are active andcan be taken at the moment of the danger. For the passive methods, some advancewarning can be given using climatological data while, for active methods, currentweather forecasts are required. The issuing of frost forecast and warnings of criticaltemperatures also plays a very important part in an active frost protectionprogramme. The economic value of such forecasting is obvious and the installationof a network of survey stations in the farm or orchard for measuring low temperaturesand their duration is now well recognised.
Frost can also be prevented by breaking up the inversion that accompaniesintense night-time radiation. This may be achieved in either of the following ways:• Heating the air by the use of oil burners which are strategically located
throughout the farm;• Mixing or stirring the air by the use of giant fans operated by electric or gas
driven motors;• Sprinkling the crops with water, putting a protective covering of craft paper
over plants and the use of shelterbelts; and• By adding a thin layer of sand to the ground every three years as sandy surfaces
warm up easily and cool only slowly by radiation.
Wind storms and squalls are similar and can traverse through large areas causingconsiderable damage to agricultural production in their paths. This damage is usuallyin the form of physical damage to plant organs or the whole plant such asdefoliation, particularly of shrubs and trees (coffee and tea plantations, citrus, etc.).Sugarcane and banana plantations crops are most affected by wind storms and squalllines. Complete loss of the crops has occurred on many occasions and in manycountries in the tropical regions (Gbeckor-Kove, 1995). In Nigeria, Ghana,Bangladesh, India and in many other tropical countries, wind gusts associated withsquall lines have been known to result in severe damage to forest trees, standingcrops, especially citrus, banana and sugarcane crops and to human dwellings.
Wind storm and squalls also lead to excessive evaporation causing depletion ofwater levels in lakes, dams, reservoirs etc. In addition, such winds are aggravatingfactors in the event of bush and forest fires. One can also mention the role of wind inthe dispersion of fungi spores, migration of locusts and other agricultural insect pests,and in the formation and saltation of sand dunes over agricultural lands in arid andsemi-arid regions.
The arid regions are characterised by frequent and strong winds which are due partlyto considerable convection during the day. The usually sparse vegetation is notcapable of slowing down air movement, so that sand and dust storm are a frequentconcomitant of wind movement. Much of the sand and dust is carried forconsiderable distance to form loose deposits in neighbouring regions. The heaviersand carried by the wind scours the soil surface.
Winds in dry climatic zones also affect plant growth mechanically and physiolog-ically. The sand and dust particles carried by wind damage plant tissues. Emergingseedlings may be completely covered or, alternatively, the roots of young plants maybe exposed by strong winds. Winds also cause considerable losses by inducing lodging,breaking of stalks and shedding of grains and ultimately decreasing the yield.
4.6.3.16 Sand and dust storms and desert
winds
4.6.3.15Wind storm and squall
4.6.3.14 Prevention against frost damage
CHAPTER 4—ADAPTATION STRATEGIES REQUIRED TO REDUCE VULNERABILITY IN AGRICULTURE AND FORESTRY 91
TO CLIMATE CHANGE, CLIMATE VARIABILITY AND CLIMATE EXTREMES
Forestry problems in relation to strong winds are very real and wind is the mainmeteorological hazard causing damage to forests. The factors which result in treeswithin a forest being blown down are complex. A major difficulty is that trees wellwithin the forest may be weakened and felled, leaving a pocket for further damagewith later gales.
In many countries, forests are a feature of high, undulating and wind-sweptareas, and changes in forest slope may well assist in giving geomorphic shelter. Insome forests, sheltered trees round the periphery exist to protect the crop trees moresusceptible to damage. The profile of the windward edge of such a shelter is oftenrelevant to protection. Trees most exposed to the strong winds tend to have stuntedgrowth and are under developed, giving a beneficial wedge sloping towards theforests (Lines, 1967).
The effects of strong winds in coastal areas can clearly be seen with stunted andoften very sculptured trees bearing unmistakable evidence of the direction of thestrong winds. In addition to the battering effects of winds, there is an importanteffect of damage by air-borne sea salt in coastal areas, making it impossible to growcrops which are sensitive to excessive salt.
Crop damage by strong winds may be minimised or prevented by the use ofwindbreaks (shelterbelts). These are natural (e.g. trees, shrubs, or hedges) orartificial (e.g. walls, fences) barriers to wind flow to shelter animal or crops. Properlyoriented and designed shelterbelts are very effective in stabilising agriculture inregions where strong wind cause mechanical damage and impose severe moisturestress on growing crops. Windbreaks save the loose soil from erosion and increasethe supply of moisture to the soil in spring.
The length of the return period is decided on a case-by-case basis, dependingon: i) the climatic phenomenon, such as flood, wind damage and drought; ii) theclimatic region or zone; iii) the season; and iv) the intensity of the impact on humanactivities, plants and animals. Extreme amounts or values that cause damage changefrom year to year as the level of the human activities in the area changes. Therefore,it is very difficult to define thresholds levels of temperature or precipitation that canbe used as permanent criteria in any one region or applied everywhere in the world.
Smith (1997) outlined detailed procedures for evaluating anticipatory adaptationpolicies in the climate change context. This approach addresses management ofinstitutional processes and proposes net benefits and implementability as centralevaluative criteria. In developed countries, the costs of defending infrastructure fromriver and coastal flooding have been calculated for extreme events under currentclimate conditions. From a disaster management perspective, Tol et al. (1996)argued that policies must be evaluated with respect to economic viability,environmental sustainability, public acceptability and behavioural flexibility. Tol etal. (1999) apply these observations in an examination of adaptation to increasedrisk in river floods in the Netherlands. Klein and Tol (1997) and Mizina et al. (1999)describe methodologies for evaluation, including cost-benefit, cost-effectiveness,risk-benefit and multi-criteria methods to evaluate possible adaptation options forcoastal zones and agriculture respectively.
Fankhauser (1996) provides an economic efficiency framework in whichadaptation actions are considered justified as long as the additional costs ofadaptation are lower than the additional benefits from the associated reduceddamages. Optimal levels of adaptation (in an economic efficiency sense) are basedon minimising the sum of adaptation costs and residual damage costs. Yohe andSchlesinger (1998) applied a cost-benefit rule to adaptation decisions across asample of the developed coastline of the USA. In Japan, protection of coastalinfrastructure was estimated to cost US$63 billion for raising port facilities plusUS$29 billion for coastal facilities.
4.6.3.20Economic efficiency in the protection
against extreme events
4.6.3.19 Protection against strong wind
4.6.3.18 Effect of strong wind in coastal areas
4.6.3.17 Effects of strong wind on forestry and
woodlands
92 MANAGEMENT STRATEGIES IN AGRICULTURE AND FORESTRY FOR MITIGATION OF GREENHOUSE GAS EMISSIONS AND
ADAPTATION TO CLIMATE VARIABILITY AND CLIMATE CHANGE
CHAPTER 5
THE IMPACT OF ADAPTATION STRATEGIES REQUIREDFOR REDUCING THE VULNERABILITY OF AGRICULTUREAND FORESTRY TO CLIMATE VARIABILITY AND CLIMATECHANGE (by O.D. Sirotenko)
According to the WGI IPCC report (Climate Change 2001: The Scientific Basis)the average global air temperature will increase from 1.5°C in 1990 to 6.0°C by2100. Furthermore, according to the last IPCC report, the concentration of carbondioxide – the most important greenhouse gas determining the productivity of theagroecosystem – will increase from the present figure of 367 ppm, via 463–623 ppmin 2050, to 478–1099 ppm in 2100. Thus, world agriculture in the 21st century willdevelop in non-static environmental and climatic conditions. Consequently, it iscrucial to leave last century’s dominant concept of climatic and environmentalinvariability for new concepts. These are based on the fact that the chemicalcontent of the atmosphere and the state of the soil in the 21st century will change atunprecedented speed, acutely increasing the significance of the adaptation factor ofworld economics as a whole, and agriculture in particular.
In accordance with the mandate of the Working Group, this report analyses themethods for solving the issue of agricultural adaptation to climate change andclimate variability with the aim of reducing any possible negative effects and usingfavourable opportunities. It also summarises the results of the strategies developed toadapt agriculture to expected climate change.
The year 1998 was the hottest, not only in 100 years, but in 1000 years, and the1990s have been recognised as the hottest decade of the same period, according tothe recently published results of the restoration of air temperature dynamics in thenorthern hemisphere using paleo-environmental records (Mann et al., 1999). Thepicture is the same the world over, we have had the 10 hottest years sinceinstrumental observations began (c. 1860) since 1983 and seven of them were inthe 1990s. Various natural phenomena are already showing signs of present-dayglobal warming: mountain glaciers and sea ice have decreased, the growing seasonhas lengthened, the amplitude of seasonal air temperature fluctuations has changedand a direct effect of the increase in the concentration of atmospheric carbondioxide on natural and cultivated plants has been observed (Borzenkova I.I., 1999).
The above phenomena, clearly indicating a non-static climatic system,necessitate the revision of the existing averaging methods for climatology andagroclimatology and, particularly, the use of the present “standard” 30-year averageclimatic value. Already, when this standard was first used, many followers (e.g. E.S.Rubinshtein, 1953) suggested that the 30-year period was not scientifically basedwhen considering climate change. There are supporters for both extending andshortening this period. The argument for using a shorter period was, until now,limited by the basic indication of the heterogeneity of meteorological observations,associated with system inaccuracy and incomplete station representation etc.
Let σ0 be the value characterising the heterogeneity of the series of observationsused. Although σ0 is not the value for observation system inaccuracy, it is usuallyvery similar (Budyko M.I., Drozdov O.A., 1996). Given that the desirable accuracyof the climatic norm determined should not be greater than the heterogeneity indexof the series of observations used, the following criteria is obtained (Budyko M.I.,Drozdov O.A., 1996):
(1)n00
2
≤
σσ
5.2TECHNIQUES FOR
ANALYSING AGROCLIMATICINDICES WITH ALLOWANCE
FOR CLIMATE CHANGE
5.2.1APPLICATION OF AVERAGE VALUES
IN AGROCLIMATIC STUDIES UNDER
CLIMATE CHANGE CONDITIONS
5.1INTRODUCTION
where n0 is the desirable length of observation period, σ is the variability of themeteorological element, and σ0 is the heterogeneity index of the given series ofelements.
According to this formula, the desirable averaging period length should be notmore than a few decades for temperature, humidity and hot season precipitation.This period can be as little as a few years for averaging radiation balance.
In the present conditions, the basic formula (1) should be reviewed due to thepresence of the climatic (agroclimatic) indicator trend caused by climate change.In the presence of the linear trend induced by higher temperatures, the distributionof a series of observations can be expanded on two components:
(2)
where r is the correlation coefficient between the series of observations and theseries 1,2,... N, representing a linear trend, in which N is the length of the series.The second component (2) enables the variability, caused by changing climaticconditions (trend) to be assessed. Supposing that the value r2σ2 can be significantlygreater than σ0, inserting this into (1) we can say that:
(3)
According to (3), when r=0.1, n0≤100 but when r=0.5, n0≤4 already. Thisresult shows that climate change significantly depreciates climatic norms calculatedover long observation periods.
There are also other approaches to finding an answer to the issue of theoptimum length of averaging period. Many researchers (Beamont R.T., 1957 andEnger J., 1959 and others) raised the question of extrapolating an average value fromthe previous period for the next two years. A similar understanding of the issue leadto the conclusion that the optimum averaging period for temperature andprecipitation is most often a period of between 15 and 20 years. The use of averagevalues for forecasting is extremely important.
Similar research into the most important agroclimatic indices (totaltemperature, moisture coefficient etc.) could lead to unexpected and valuablepractical consequences of the analysis of the last 20–30 years of data. It could berecommended in the near future that, concerning the evolution of global warming,the optimum series length for forecasting be sharply reduced for both moderate andhigh latitudes.
Despite the urgency of the task, the methods for analysing climate-induced risks foragriculture under conditions of climate change have not been adequately developed.The creation of such methods entails the rejection of the concept of climateinvariability. Alternative approaches, based on various models of a non-staticclimate have not yet been developed to the stage of practical application. Therefore,the empirical approach, which still needs further development and approval, ispresented in this chapter.
Methods for analysing the temporary dynamics of the climate-induced risk ofproducing extremely small crops (i.e. crop recurrence analysis y ≤ yk , where yk isthe critically low crop) lead to the analysis of the change in the correspondingprobability distribution parameters. In a normal distribution, the problem leads tothe dynamics of the mathematical expectation y– and the distribution σ2
y beingtracked (for the sliding period where j=1,2,...N years). It can be observed that therisk of a critically small crop was reduced when:
and
however, the risk of a critically small crop increased when: σ σy
j j y− −1 0p y y
j j− − −−
10f
5.2.2ANALYSIS OF CLIMATE-INDUCED
RISKS UNDER CONDITIONS OF
CLIMATE CHANGE
nr
0 2
1≤
σ σ σ2 2 2 2 21= −( ) +r r
94 MANAGEMENT STRATEGIES IN AGRICULTURE AND FORESTRY FOR MITIGATION OF GREENHOUSE GAS EMISSIONS AND
ADAPTATION TO CLIMATE VARIABILITY AND CLIMATE CHANGE
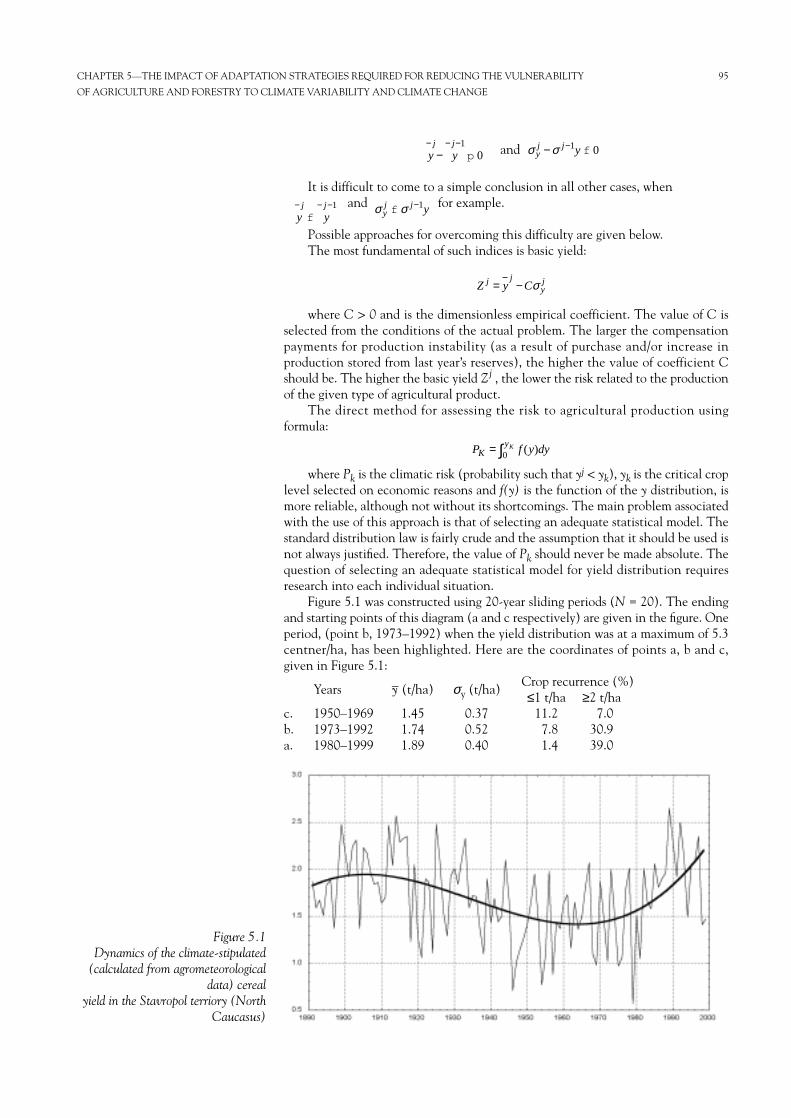
and
It is difficult to come to a simple conclusion in all other cases, whenand for example.
Possible approaches for overcoming this difficulty are given below.The most fundamental of such indices is basic yield:
where C > 0 and is the dimensionless empirical coefficient. The value of C isselected from the conditions of the actual problem. The larger the compensationpayments for production instability (as a result of purchase and/or increase inproduction stored from last year’s reserves), the higher the value of coefficient Cshould be. The higher the basic yield Zj , the lower the risk related to the productionof the given type of agricultural product.
The direct method for assessing the risk to agricultural production usingformula:
where Pk is the climatic risk (probability such that yj < yk), yk is the critical croplevel selected on economic reasons and f(y) is the function of the y distribution, ismore reliable, although not without its shortcomings. The main problem associatedwith the use of this approach is that of selecting an adequate statistical model. Thestandard distribution law is fairly crude and the assumption that it should be used isnot always justified. Therefore, the value of Pk should never be made absolute. Thequestion of selecting an adequate statistical model for yield distribution requiresresearch into each individual situation.
Figure 5.1 was constructed using 20-year sliding periods (N = 20). The endingand starting points of this diagram (a and c respectively) are given in the figure. Oneperiod, (point b, 1973–1992) when the yield distribution was at a maximum of 5.3centner/ha, has been highlighted. Here are the coordinates of points a, b and c,given in Figure 5.1:
Years y– (t/ha) σy (t/ha)Crop recurrence (%)≤1 t/ha ≥2 t/ha
c. 1950–1969 1.45 0.37 11.2 7.0b. 1973–1992 1.74 0.52 7.8 30.9a. 1980–1999 1.89 0.40 1.4 39.0
P f y dyKyK= ∫ ( )0
Z y Cj jyj= − σ
σ σy
j j yf −1
y yj j− − −f
1
σ σy
j j y− −1 0f y y
j j− − −−
10p
CHAPTER 5—THE IMPACT OF ADAPTATION STRATEGIES REQUIRED FOR REDUCING THE VULNERABILITY 95
OF AGRICULTURE AND FORESTRY TO CLIMATE VARIABILITY AND CLIMATE CHANGE
Figure 5.1Dynamics of the climate-stipulated
(calculated from agrometeorologicaldata) cereal
yield in the Stavropol terriory (NorthCaucasus)
Figure 5.1 shows that the agroclimatic conditions of Stavropolsky Kraiunderwent some fairly significant changes over the last 50 years. The beginning ofthe period (point c) saw low values for both yield and its annual variability. Eightyears later, the quadratic variance had reached its minimum (approximately 0.34t/ha) after which came the period of increased crop variability right down to0.52–0.53 t/ha (i.e. σy increased to more than 1.5 times its previous value). Thisincrease in calculated yield distribution in the first half of the period came whenyield was low, i.e. the agroclimatic conditions for cereals in the region clearlyworsened until 1966–1985. The year 1985 saw the start of a period in which theaverage yield and its distribution rose simultaneously. Increased average yield reducesthe risk of producing a small crop, but the increased variability, however, increasesthis risk. In order to gain a simple interpretation of the change of agroclimaticconditions, the risk criteria needs to be rendered tangible. To this end, the followinglinear rules are applied to Figure 5.1:
I. II.
Each of these rules divides the plane into two areas: the first rule gives the areain which the probability of receiving a crop of more than 1.5 t/ha is greater than 80per cent and the second, where the same probability is greater than 90 per cent.
In this case, a simple analysis of the dynamics of agricultural conditions is givenby the distance of the points plotting the present climate conditions from thecorresponding linear.
A critical yield level and its admissible risk value should be selected for eachproblem, i.e. the EV diagram should contain a linear corresponding to the problemto be solved.
The method under examination enables the movement of the given points onthe EV diagram to be tracked, monitoring contemporary climate change. For a moredetailed and more accurate analysis it is recommended that two EV diagrams be usedsimultaneously for one yield series, one calculated using adequate models for basicmeteorological data and the other constructed using a factual yield recordy j
f (j=1,2...,N). Besides monitoring present climate fluctuations (changes),comparison of these two EV diagrams also enables the trends of conditional changesin the agricultural system to be tracked.
In addition to the EV diagram, the creators of this method recommend that therisk of obtaining a crop smaller than the given level be recalculated each year. Thus,for example, the above data show that the recurrence of small crops (less than1 t/ha) decreased from 11 per cent in 1950–1969 to 1.5 per cent in the last period(1980–1999) i.e. the risk became seven times smaller.
The revelation of such important incidents in contemporary climate change isan important signal encouraging consistent economic decisions.
Land is agriculture’s main resource and more efficient land use based on yieldforecasts (calculations) will be of great economic importance. The problem ofoptimising sowing area comprises both temporal and spatial aspects and thuscomprises two particular functions, optimisation to increase gross takings andoptimisation to increase production stability.
It is possible to combine the two given aspects and the two particular functions.
It is recommended that the sowing area of any cultivated crop in the following iyears be determined using the rule:
(4)
where yi is the predicted (sowing) yield, and a is the proportionality coefficientwith a>0. To calculate yi it is recommended that the obtained least-squaresregression method be used, thus:
S a yi i=∧
5.3MODELS AND TOOLS FOR
ADAPTATION OF AGRICUL-TURE TO CLIMATE
VARIABILITY AND CLIMATECHANGE
5.3.1OPTIMISATION OF LAND RESOURCE
UTILISATION AS A FORM OF
ADAPTATION TO THE CURRENT
AND/OR EXPECTED CLIMATE
CONDITIONS
5.3.1.1Optimization of annual distribution of
sowing areas on the basis of yieldforecasts
y y= +1 5 0 128. . σy y= +1 5 0 084. . σ
96 MANAGEMENT STRATEGIES IN AGRICULTURE AND FORESTRY FOR MITIGATION OF GREENHOUSE GAS EMISSIONS AND
ADAPTATION TO CLIMATE VARIABILITY AND CLIMATE CHANGE
CHAPTER 5—THE IMPACT OF ADAPTATION STRATEGIES REQUIRED FOR REDUCING THE VULNERABILITY 97
OF AGRICULTURE AND FORESTRY TO CLIMATE VARIABILITY AND CLIMATE CHANGE
Where M is the mathematical expectation, and are the distribution
of the random values y and y respectively and is the correlation coefficient.
The efficiency of the yearly (sowing-sowing) adjustment of sowing areaaccording to rule (1) is given by the following formula (Sirotenko, Pavlova, 2001)
(5)where is
the yield variation coefficient.
The values for K calculated according to formula (5) are given in Table 5.1 (see“linear rule”) which shows that, without increasing the average sowing area, themean annual revenue can be considerably increased, by adjusting the sowing areaeach year according to yield forecasts. High quality yield forecasts and high variationcoefficients could lead to gains of 30–50 per cent.
The alternative rule and the exponential rule (Sirotenko, Pavlova, 2001), non-linear rules for sowing areas, have also been examined:
(6)
(7)
where so and smax are the lower and upper limits of si, when c>0 and y– = My.Table 5.1 gives the data for comparing the efficiency of all three rules, linear
(4), alternative (6) and exponential (7). The incontestable advantage is held by thealternative method, particularly when the yield forecast is of low quality and thereare few variation coefficients. Another advantage of this rule is its ease ofapplication, since it merely requires that either the highest or the lowest averageexpected crop value be known. However, in certain cases, such as when and Vyhave high values, the more radical exponential rule is the most efficient.
In order to objectively analyse the level of adaptation of sowing areasfor cultivated crops, the following formula is recommended (Sirotenko, Pavlova,2001):
(8)
where y is the yield at individual point or regions, s is the corresponding sowingarea, rys is the correlation coefficient and Vy and Vs are the yield variationcoefficient and sowing area coefficient respectively.
If the sowing area is enlarged in proportion to yield, then rys = 1 . This is anexample of total adaptation resulting in an increase of Vy and Vs in gross productrevenue, when compared with the random distribution, when rys = 0. A counter-adaptive distribution is also possible when rys = -1 .
The parameters (8) for the period between 1991 and 1998 in European Russiaare as follows:
Kys
ysr V Vys y s= = +1
5.3.1.2Optimization of space distribution of
sowing areas
ry y
∧
s s c y
s
s s
s sii
i=
≤∧
00exp( )
maxmax
iff
sy y
y yi =
≥∧
∧1
0if
p
VMyy
y=σ
KMys
MyMsr Vy y
y= = + ∧1 2 2
ry y
∧
σy2σ
y∧2
M y My riy y y
y
∧= =∧ ∧and σ σ2 2 2
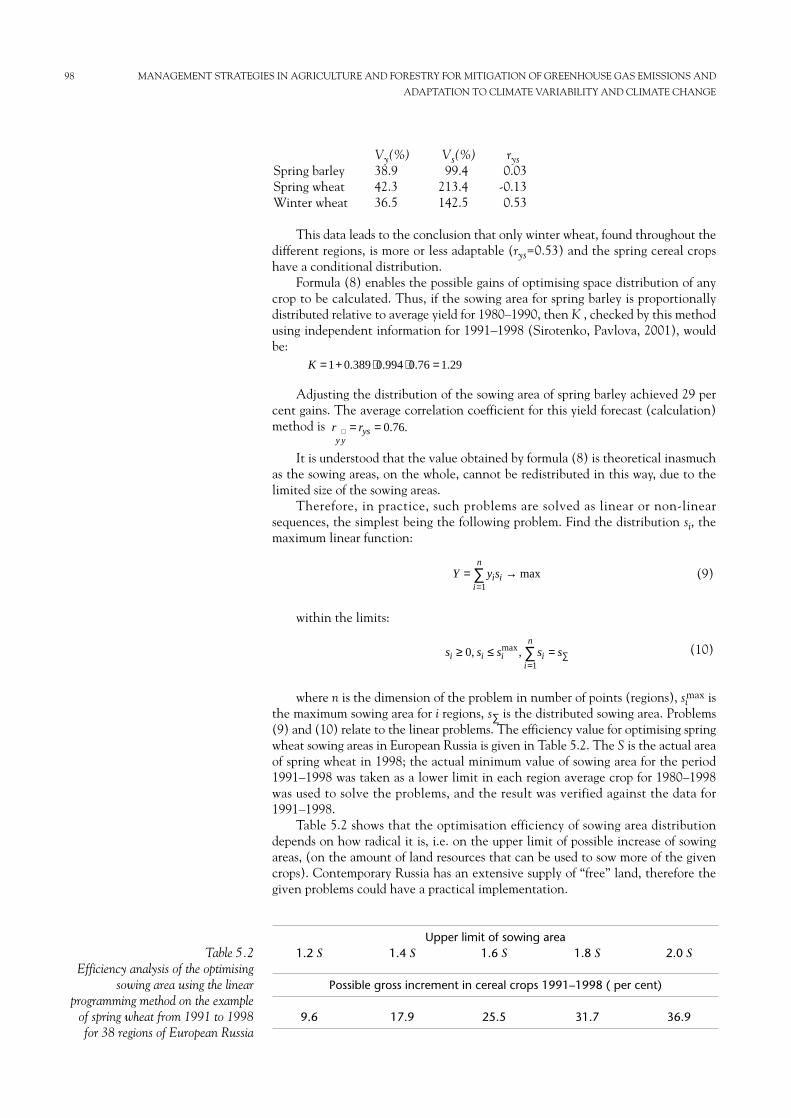
This data leads to the conclusion that only winter wheat, found throughout thedifferent regions, is more or less adaptable (rys=0.53) and the spring cereal cropshave a conditional distribution.
Formula (8) enables the possible gains of optimising space distribution of anycrop to be calculated. Thus, if the sowing area for spring barley is proportionallydistributed relative to average yield for 1980–1990, then K , checked by this methodusing independent information for 1991–1998 (Sirotenko, Pavlova, 2001), wouldbe:
Adjusting the distribution of the sowing area of spring barley achieved 29 percent gains. The average correlation coefficient for this yield forecast (calculation)method is
It is understood that the value obtained by formula (8) is theoretical inasmuchas the sowing areas, on the whole, cannot be redistributed in this way, due to thelimited size of the sowing areas.
Therefore, in practice, such problems are solved as linear or non-linearsequences, the simplest being the following problem. Find the distribution si, themaximum linear function:
(9)
within the limits:
(10)
where n is the dimension of the problem in number of points (regions), simax is
the maximum sowing area for i regions, s∑ is the distributed sowing area. Problems(9) and (10) relate to the linear problems. The efficiency value for optimising springwheat sowing areas in European Russia is given in Table 5.2. The S is the actual areaof spring wheat in 1998; the actual minimum value of sowing area for the period1991–1998 was taken as a lower limit in each region average crop for 1980–1998was used to solve the problems, and the result was verified against the data for1991–1998.
Table 5.2 shows that the optimisation efficiency of sowing area distributiondepends on how radical it is, i.e. on the upper limit of possible increase of sowingareas, (on the amount of land resources that can be used to sow more of the givencrops). Contemporary Russia has an extensive supply of “free” land, therefore thegiven problems could have a practical implementation.
s s s s si i i ii
n≥ ≤ = ∑
=∑0
1, ,max
Y y si ii
n= →
=∑ max
1
r ry y
ys∧ = = 0 76. .
K = + ⋅ ⋅ =1 0 389 0 994 0 76 1 29. . . .
Vy(%) Vs(%) rysSpring barley 38.9 99.4 0.03Spring wheat 42.3 213.4 -0.13Winter wheat 36.5 142.5 0.53
98 MANAGEMENT STRATEGIES IN AGRICULTURE AND FORESTRY FOR MITIGATION OF GREENHOUSE GAS EMISSIONS AND
ADAPTATION TO CLIMATE VARIABILITY AND CLIMATE CHANGE
Table 5.2Efficiency analysis of the optimising
sowing area using the linearprogramming method on the example
of spring wheat from 1991 to 1998for 38 regions of European Russia
Upper limit of sowing area1.2 S 1.4 S 1.6 S 1.8 S 2.0 S
Possible gross increment in cereal crops 1991–1998 ( per cent)
9.6 17.9 25.5 31.7 36.9
Adaptation aimed at increasing the stability of agricultural production is also is asimportant as maximising the gross crop, The simplest example for two crops isexamined below:
The first yield is denoted by y1 and the second by y2.The gross crop is determined by the formula
where α is the sowing area allotted to the first crop. It is necessary to find thevalue α=α0 for which the variation coefficient is minimal (where σy is
the average quadratic deviation and y– is the average value of y). If the variationcoefficient for the different crops does not significantly vary, then the optimum valueof α0 lies between nought and one and can be determined by thefollowing formula (Khukovsky, 1980):
(11)
where σ1 and σ2 are the average quadratic deviations, v1 and v2 are thevariation coefficients for the first and second crops and is the correlation coefficient.
The variation coefficient corresponding to the optimum climatic distributionof sowing areas (α=α0) is calculated using the formula:
(12)
The smaller the value of ρ, the stronger compensation effect; thus there can befull compensation within the limits when ρ = 1, i.e. there is no calculated gross cropfluctuation (v0 = 0). This is, of course, a particularly theoretical situation, but whenρ = 0.3 the gross crop variation coefficient for both crops is 20 per cent lower. It isnoted that when y–2 p y–1 the introduction of a second crop would lead to a lowergross crop, which could be undesirable.
Let us formulate the general arrangement of problems for optimising thedistribution of sowing areas for n crops. Let the gross crop be:
where y1, y2,...yn is yield, and s1, s2,...sn is the sowing area for each respectivecrop.
The distribution of the gross crop Y must be minimised:
(13)
within the following limits:
(14)
This last inequality means that, in order to solve the problem, the averageyearly gross yield under the conditions, should be found to be less than the givenvalue of Ymin. An increase in Ymin generally leads to an increase in σ2
y. Therefore, byvarying Ymin a compromise between average yield and stability, more fully meetingthe requirements of agricultural production, can be found.
Problems (13) and (14) relate to quadratic equations which can be solved usingstandard programmes. Crop statistics for the last two to three decades are required in
s s s s y Yi ii
n
i ii
n≥ = ≥∑
= =∑ ∑0
1 1, , minand
σ ρ σ σY i j ij i jj
n
i
ns s2
11= →
==∑∑ min
Y s y s y s yn n= + +1 1 2 2 ....
v v vv v v v
0 1 2
2
12
22
1 2
1
2=
−−
ρρ
α σσ
ρρ0
1
2
1 2
2 1
1
1= + ⋅−−
−v v
v v
0 10p pα( )
Vy
yy=
σ
y y y= + −α α1 21( )
5.3.1.3Optimisation of sowing areas to
increase the stability of agriculturalproductions
CHAPTER 5—THE IMPACT OF ADAPTATION STRATEGIES REQUIRED FOR REDUCING THE VULNERABILITY 99
OF AGRICULTURE AND FORESTRY TO CLIMATE VARIABILITY AND CLIMATE CHANGE
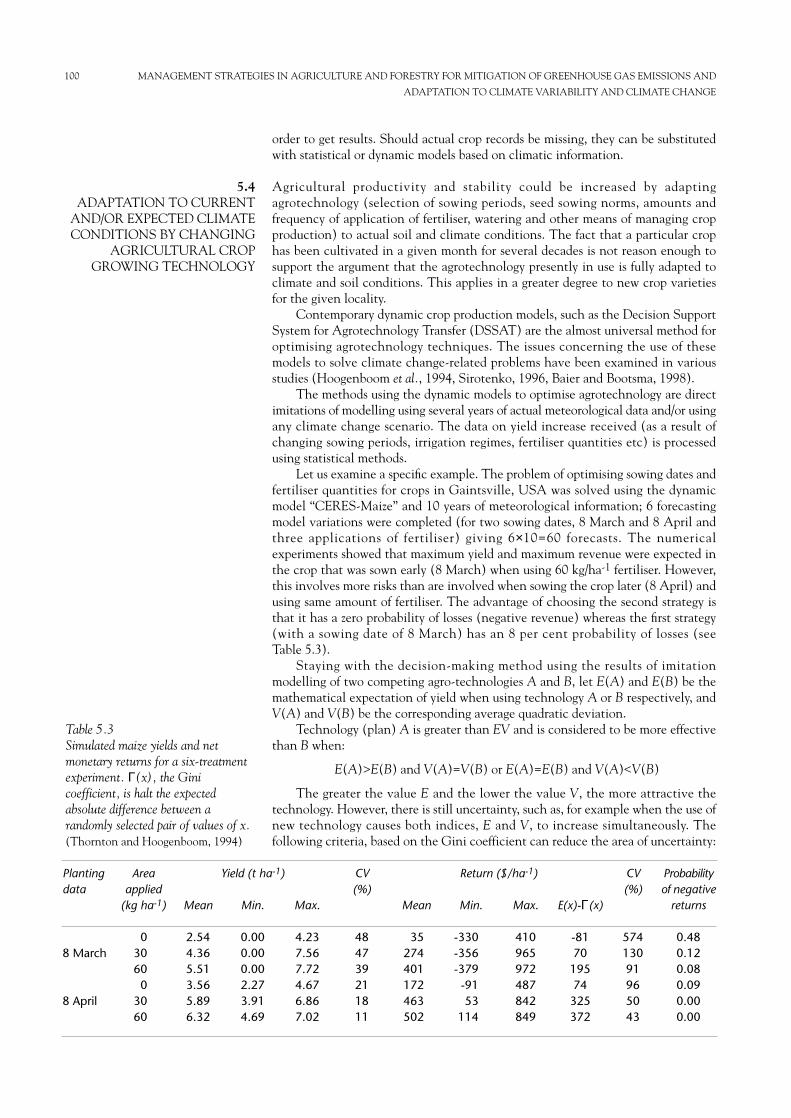
order to get results. Should actual crop records be missing, they can be substitutedwith statistical or dynamic models based on climatic information.
Agricultural productivity and stability could be increased by adaptingagrotechnology (selection of sowing periods, seed sowing norms, amounts andfrequency of application of fertiliser, watering and other means of managing cropproduction) to actual soil and climate conditions. The fact that a particular crophas been cultivated in a given month for several decades is not reason enough tosupport the argument that the agrotechnology presently in use is fully adapted toclimate and soil conditions. This applies in a greater degree to new crop varietiesfor the given locality.
Contemporary dynamic crop production models, such as the Decision SupportSystem for Agrotechnology Transfer (DSSAT) are the almost universal method foroptimising agrotechnology techniques. The issues concerning the use of thesemodels to solve climate change-related problems have been examined in variousstudies (Hoogenboom et al., 1994, Sirotenko, 1996, Baier and Bootsma, 1998).
The methods using the dynamic models to optimise agrotechnology are directimitations of modelling using several years of actual meteorological data and/or usingany climate change scenario. The data on yield increase received (as a result ofchanging sowing periods, irrigation regimes, fertiliser quantities etc) is processedusing statistical methods.
Let us examine a specific example. The problem of optimising sowing dates andfertiliser quantities for crops in Gaintsville, USA was solved using the dynamicmodel “CERES-Maize” and 10 years of meteorological information; 6 forecastingmodel variations were completed (for two sowing dates, 8 March and 8 April andthree applications of fertiliser) giving 6×10=60 forecasts. The numericalexperiments showed that maximum yield and maximum revenue were expected inthe crop that was sown early (8 March) when using 60 kg/ha-1 fertiliser. However,this involves more risks than are involved when sowing the crop later (8 April) andusing same amount of fertiliser. The advantage of choosing the second strategy isthat it has a zero probability of losses (negative revenue) whereas the first strategy(with a sowing date of 8 March) has an 8 per cent probability of losses (seeTable 5.3).
Staying with the decision-making method using the results of imitationmodelling of two competing agro-technologies A and B, let E(A) and E(B) be themathematical expectation of yield when using technology A or B respectively, andV(A) and V(B) be the corresponding average quadratic deviation.
Technology (plan) A is greater than EV and is considered to be more effectivethan B when:
E(A)>E(B) and V(A)=V(B) or E(A)=E(B) and V(A)<V(B)
The greater the value E and the lower the value V, the more attractive thetechnology. However, there is still uncertainty, such as, for example when the use ofnew technology causes both indices, E and V, to increase simultaneously. Thefollowing criteria, based on the Gini coefficient can reduce the area of uncertainty:
5.4ADAPTATION TO CURRENT
AND/OR EXPECTED CLIMATECONDITIONS BY CHANGING
AGRICULTURAL CROPGROWING TECHNOLOGY
100 MANAGEMENT STRATEGIES IN AGRICULTURE AND FORESTRY FOR MITIGATION OF GREENHOUSE GAS EMISSIONS AND
ADAPTATION TO CLIMATE VARIABILITY AND CLIMATE CHANGE
Plantingdata
8 March
8 April
Areaapplied
(kg ha-1)
03060
03060
Mean
2.544.365.513.565.896.32
Min.
0.000.000.002.273.914.69
Max.
4.237.567.724.676.867.02
CV(%)
484739211811
Mean
35274401172463502
Min.
-330-356-379-9153
114
Max.
410965972487842849
E(x)-Γ(x)
-8170
19574
325372
CV(%)
57413091965043
Probabilityof negative
returns
0.480.120.080.090.000.00
Yield (t ha-1) Return ($/ha-1)
Table 5.3 Simulated maize yields and netmonetary returns for a six-treatmentexperiment. Γ(x), the Ginicoefficient, is halt the expectedabsolute difference between arandomly selected pair of values of x.(Thornton and Hoogenboom, 1994)
It is preferable to choose technology B rather than technology A when:E(A)>E(B) and E(A)–Γ(A)>E(B)–Γ(B)where Γ(A) and Γ(B) are the Gini coefficients calculated as half of the average
difference (using absolute values) between all members of a series, the value of thesedistances being equal to
(where N is the number of members in the series).
From Table 5.3 we can deduct that:E(A)=6.32, E(B)=5.51E(A)–Γ(A)=372, E(B)–Γ(B)=195It is therefore preferable choose technology B rather than technology A, i.e. the
best sowing date is 8 April, using 60 kg/ha-1 of fertiliser. Strategies for adaptingagriculture to expected climate change (moderate latitudes).
A fuller data report on the problems of adapting world agriculture to climate changeexpected in the 21st century can be found in the IPCC Working Group IIContribution to the Third Assessment Report (TAR), which is being prepared forpublication.
This section is based on the summary of the materials of this report fortemperate climatic zones, supplemented with new results, mainly from Russia.
Russia is one of the countries in which agriculture is the most dependent on climatevariability and conditions of climate change. This has been particularly visible overthe last 10–15 years, which have been the hottest, most humid years in Russia inthe 20th century. Since the late 1960s the growing period at high latitudes hasincreased by no less than seven days and unusually warm winters have become morefrequent everywhere. However, regional climate change has shown itself to be moremarked. Climate-induced yields of spring wheat in Stavropolsky Krai in 1980–1999have grown by 30 per cent, when compared with the figures for 1950–1969 and therecurrence of low yields (less than 1 t ha-1) has decreased from 11 per cent to 1.5per cent. Over the last decade, improvement of agroclimatic conditions producingyield, reduction of climate-induced risk to agricultural production and growth ofbioclimatic potential have been noted throughout the majority of Russia.Nevertheless, the increase in air temperature and the related increase in evaporationin individual regions have not facilitated yield increase. For example, over the last10–15 years a negative trend of climate-induced yield for cereal crops has beenobserved in many regions of Siberia.
The positive consequences of the impact of expected climate change on thecultivation of plants include:• An increase in agriculturally-suitable land area; • An extended growing season;• Increased heat-resources for crops; and• Improved conditions for the wintering of field and garden plants.
When greenhouse gases in the atmosphere double, the agricultural areas of theRussian Federation will become approximately 1.5 times larger. The tundra areaswill sharply recede (becoming two to three times smaller), and the taiga areas willbecome considerably smaller, but the area of broadleaf woodland and steppes(wooded steppes) will appreciably increase, providing favourable agriculturalconditions.
The growing season is expected to lengthen by 3.5 days every 10 years over thenext few decades and the longer growing period and the longer hot season could beused to plant multiple crops (three or four crops per year). Agricultural workingconditions, including harvesting, are expected to improve, which could have aconsiderable economic impact.
The most important effect of global warming is the increase in heat resourcesenabling more of the crops that are particularly valuable and lacking in Russia to be
5.5.1YIELDS AND ADAPTATION
5.5.1.1Russia
5.5STRATEGIES FOR ADAPTING
AGRICULTURE TO EXPECTEDCLIMATE CHANGE
(MODERATE LATITUDES)
1
21N N( )−
CHAPTER 5—THE IMPACT OF ADAPTATION STRATEGIES REQUIRED FOR REDUCING THE VULNERABILITY 101
OF AGRICULTURE AND FORESTRY TO CLIMATE VARIABILITY AND CLIMATE CHANGE
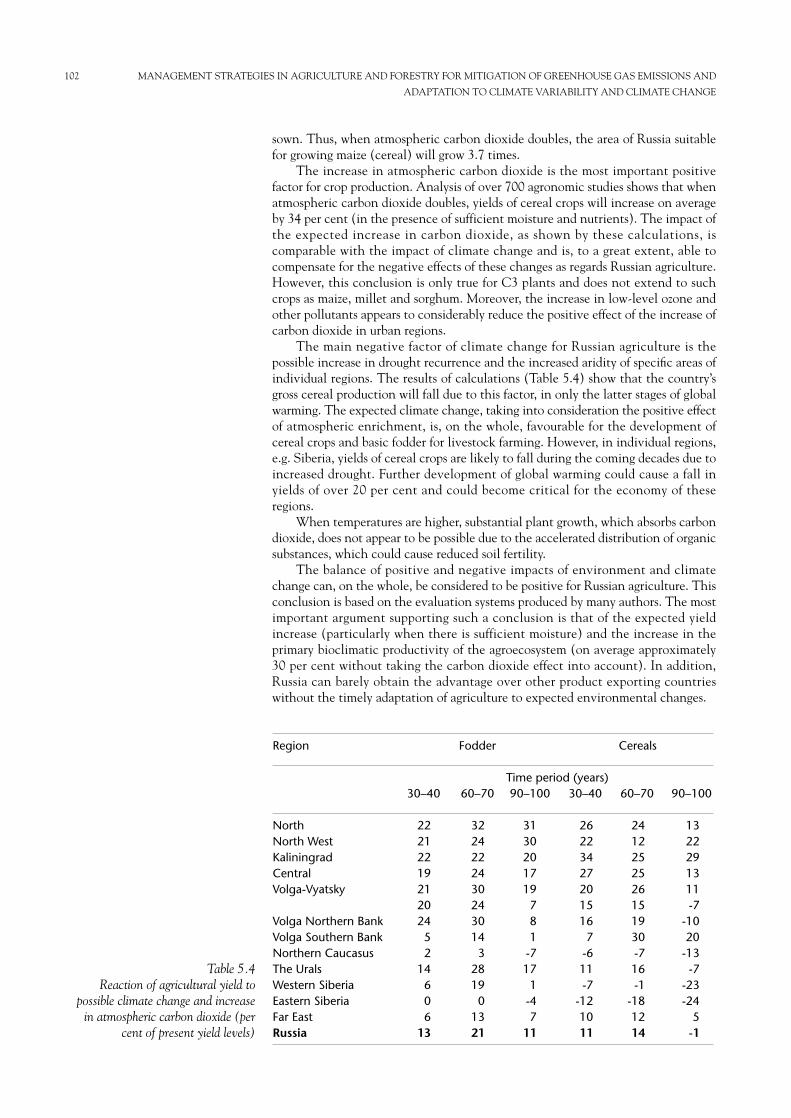
sown. Thus, when atmospheric carbon dioxide doubles, the area of Russia suitablefor growing maize (cereal) will grow 3.7 times.
The increase in atmospheric carbon dioxide is the most important positivefactor for crop production. Analysis of over 700 agronomic studies shows that whenatmospheric carbon dioxide doubles, yields of cereal crops will increase on averageby 34 per cent (in the presence of sufficient moisture and nutrients). The impact ofthe expected increase in carbon dioxide, as shown by these calculations, iscomparable with the impact of climate change and is, to a great extent, able tocompensate for the negative effects of these changes as regards Russian agriculture.However, this conclusion is only true for C3 plants and does not extend to suchcrops as maize, millet and sorghum. Moreover, the increase in low-level ozone andother pollutants appears to considerably reduce the positive effect of the increase ofcarbon dioxide in urban regions.
The main negative factor of climate change for Russian agriculture is thepossible increase in drought recurrence and the increased aridity of specific areas ofindividual regions. The results of calculations (Table 5.4) show that the country’sgross cereal production will fall due to this factor, in only the latter stages of globalwarming. The expected climate change, taking into consideration the positive effectof atmospheric enrichment, is, on the whole, favourable for the development ofcereal crops and basic fodder for livestock farming. However, in individual regions,e.g. Siberia, yields of cereal crops are likely to fall during the coming decades due toincreased drought. Further development of global warming could cause a fall inyields of over 20 per cent and could become critical for the economy of theseregions.
When temperatures are higher, substantial plant growth, which absorbs carbondioxide, does not appear to be possible due to the accelerated distribution of organicsubstances, which could cause reduced soil fertility.
The balance of positive and negative impacts of environment and climatechange can, on the whole, be considered to be positive for Russian agriculture. Thisconclusion is based on the evaluation systems produced by many authors. The mostimportant argument supporting such a conclusion is that of the expected yieldincrease (particularly when there is sufficient moisture) and the increase in theprimary bioclimatic productivity of the agroecosystem (on average approximately30 per cent without taking the carbon dioxide effect into account). In addition,Russia can barely obtain the advantage over other product exporting countrieswithout the timely adaptation of agriculture to expected environmental changes.
102 MANAGEMENT STRATEGIES IN AGRICULTURE AND FORESTRY FOR MITIGATION OF GREENHOUSE GAS EMISSIONS AND
ADAPTATION TO CLIMATE VARIABILITY AND CLIMATE CHANGE
Region Fodder Cereals
Time period (years)30–40 60–70 90–100 30–40 60–70 90–100
North 22 32 31 26 24 13North West 21 24 30 22 12 22Kaliningrad 22 22 20 34 25 29Central 19 24 17 27 25 13Volga-Vyatsky 21 30 19 20 26 11
20 24 7 15 15 -7Volga Northern Bank 24 30 8 16 19 -10Volga Southern Bank 5 14 1 7 30 20Northern Caucasus 2 3 -7 -6 -7 -13The Urals 14 28 17 11 16 -7Western Siberia 6 19 1 -7 -1 -23Eastern Siberia 0 0 -4 -12 -18 -24Far East 6 13 7 10 12 5Russia 13 21 11 11 14 -1
Table 5.4Reaction of agricultural yield to
possible climate change and increasein atmospheric carbon dioxide (per
cent of present yield levels)
Expanding Russian market farming into the more northern regions which havesufficient moisture is the main geographical aspect of adaptation to climate change.This thrust of adaptation coincides with an intensification programme for the non-blackland areas of the country, which is expected to increase the average cereal cropto 4–5 t ha-1 whilst sowing areas are simultaneously reduced. The resultingescalation of heat resources could be used to sow more of the more late-ripening,and generally more productive, crop types (varieties) and as result of sowing morestubble-based plants, spring varieties can be replaced with the higher-yield wintervarieties in the areas where their expansion was previously limited by harsh winters.
The next most important thrust of adaptation is the increase in productivityand stability of agriculture in the steppe and woodland areas of the country as aresult of carrying out a set of measures to combat drought and introduce protectivetechnology. These measures include reducing pastureland and developing oflivestock farming in the particularly arid regions, introducing agricultural systemsinvolving the widespread use of the most drought-resistant plants (varieties),minimising soil disturbance, utilising water vapour, reducing spring run off,eliminating unproductive evaporation and bringing spring sowing dates forward anddelaying winter sowing as late as possible in order to best use moisture resources etc.In those steppe (wooded steppe) regions where a sufficient moisture level isforecasted the main thrust of adaptation is the optimised exploitation of theincreased heat resources, by sowing more of the more heat-loving crops that arevaluable and in deficit in Russia and the introduction of multiple (second and third)crops etc.
In addition to the general thrust of adaptation of agriculture in Russia, here aresome more specific details:• Fruit growing and viticulture: increased heat resources and milder winters
create the preconditions for expanding the natural habitat of cultivated fruitand vineyards and considerable expansion of heat-loving, high-yield types(varieties) to the north and east;
• Irrigated agriculture: the irrigation development strategy should be reviewedrelative to the increased production of 1 ha of irrigated land due to increasedbioclimatic potential, and also relative to the increased costs of sprayed waterdue to increased evaporation (the temporary dynamics water-resource forecastsfor the Volga Basin are favourable for the development of irrigated agriculture);
• Livestock farming: heating costs are reduced owing to the shortened period inwhich livestock need to be kept inside and as a result of the increased fodderbase, conditions for livestock farming in the woodland areas are improved andin the arid steppe areas livestock farming can still be increased thanks to theincreased area of pastureland due to decreased arable use.
Agronomic adaptation strategies include two types of measures: short-termadjustments and long-term adaptations. The following belong to the first group:• Changing sowing and planting data – it is recommended that spring crops be
sown earlier, optimising, in warm climate conditions, the use of the first springreserves of soil moisture and enabling the high temperatures of midsummer tobe avoided. Winter cereals, however, should be planted later, when soil mois-ture levels increase due to reduced evaporation as temperatures decrease;
• Changing agro-techniques (quantities and application dates for fertiliser and pes-ticides etc.) – the change of climate conditions and the increase of atmosphericcarbon dioxide call for the serious restructuring of all crop growing technology(this particularly concerns amounts of organic and mineral fertilisers). On theone hand, carbon dioxide content stimulates the growth function of plants, buton the other hand the increased temperature leads to the accelerated decom-position of organic substances in the soil and increased precipitation leads toadditional losses of mineral nitrogen. Sufficiently developed imitation modelsare required to allow for these and other multi-directional processes whichaffect plant productivity;
5.5.1.2Europe
CHAPTER 5—THE IMPACT OF ADAPTATION STRATEGIES REQUIRED FOR REDUCING THE VULNERABILITY 103
OF AGRICULTURE AND FORESTRY TO CLIMATE VARIABILITY AND CLIMATE CHANGE
• Economy of soil moisture – one of the most important effects of higher tem-peratures is the increase in evapotranspiration, which is often notcompensated by a possible increase in precipitation, therefore the most impor-tant thrust of adaptation in central and southern Europe is the introduction ofmoisture-economising technology and development of irrigation (Easterling,1996). The moisture-economising technology has many uses, most of whichare aimed at reducing the flow of and eliminating unproductive evaporation(minimising soil disturbance, mulching, using windbreaks etc.Long-term adaptation includes:
• Changing the land use system – research carried out by Parry et al. (1998) forcentral Europe showed that optimising the use of pastureland in this regionshould be aimed at increasing the area of winter wheat, maize and vegetablesby reducing the sowing area of spring wheat, barley and potatoes;
• Development and more widespread implementation of biotechnology(Goodmanet et al., 1987) for stress adaptation (caused by heat, water, pests anddiseases);
• More sowing of the more drought-resistant varieties of crops – some crops aremore efficient in their use of water, evolving a strong, more reliable root systemable to cope with short-term soil aridity, such as, for example, sorghum whichis more stable in hotter climates and aridity than maize;
• Modifying microclimatic conditions – forming a windbreak is a reliable way ofchanging the microclimate, transforming the existing radiation and heat bal-ance by changing the reflectance, heat storage and conduction capacity of thesoil (mulching, hoeing, packing and ridge cutting).Any technology increasing production output from one unit area – the sowing
of mixed crops or the production of multiple crops enabling two to three crops tobe harvested per year – should be combined with the possible adaptation measures.Global warming will facilitate the wider implementation of such technology in theregions where moisture conditions allow it.
104 MANAGEMENT STRATEGIES IN AGRICULTURE AND FORESTRY FOR MITIGATION OF GREENHOUSE GAS EMISSIONS AND
ADAPTATION TO CLIMATE VARIABILITY AND CLIMATE CHANGE
CHAPTER 6
CONTRIBUTION TO GREENHOUSE GAS EMISSIONS ANDVULNERABILITY/ADAPTATION STUDY OF AGRICULTUREIN AFRICA(by Birama Diarra)
Most African industry is in the primary sector it is important to study agriculturalvulnerability/adaptation as it is this sector which provides the majority of rawmaterials for industry. Any disruption to this sector would have a considerableimpact on GDP and would intensify poverty.
The causes of present and future climate change, greatly affecting socio-economic activities, appear to be associated with the human activities that increasegreenhouse gas concentrations in the atmosphere, leading to climatic warming andchanges in rainfall.
This chapter looks at specific activities that contribute to greenhouse gasemissions in some African countries. It analyses agricultural vulnerability usingbiophysical models in order to assess the impact of climate change on the productionof certain crops.
It should be noted that this study relates primarily to Mali, and was subsequentlyextended to cover Africa, on the recommendations of the Working Group, Geneva,3–6 July 2001.
Detailed climatic study shows that the component factors are, to a certain extent,interdependent. It is, however, incontestable that carbon dioxide takes the majorrole climate change and climatic instability. Pollution of the earth’s atmosphere bycarbon dioxide and other greenhouse gases (water, methane, chlorofluorocarbons,hydrochlorofluorocarbons, carbon tetrachlorides, ozone, nitrous oxide) woulddefinitely cause the climate to become gradually warmer over the next few decades(Le Houerou, 1994). Of all these molecules, carbon dioxide is, without doubt, theleast active warming element. Nitrous oxide is 310 times more active;chlorofluorocarbons (CFCs) and hydrochlorofluorcarbons (HCFCs) are 5000 and10 000–18 000 times more active, respectively. It is therefore clear that warmingassociated with an increase in carbon dioxide content is clearly weaker and lessprofitable for carbon dioxide-permeable green plants than that associated with theincrease of other greenhouse gases. Many scenarios based on the global climatemodel lead to a possible 3°C (±1.5°C) warming of the lower atmosphere by 2050, ifthe carbon dioxide content of the atmosphere doubles relative to its present contentof 360 ppm (Kellog and Schware, 1981). Since green plants are the only livingbeings capable of fixing carbon dioxide, transforming it into organic matter viaphotosynthesis, they should benefit, a priori, from increased carbon dioxide levels.Consequently, our analysis will attempt to learn the consequences of an expectedincrease of carbon dioxide and develop adaptive strategies.
As noted, the interdependence of atmospheric circumstances is reasonably wellknown and shows the dominant influence of atmospheric carbon dioxide levels. Thehuman-induced increase of atmospheric carbon dioxide is said to be responsible forthe greenhouse effect, causing, inter alia, higher temperatures – the main factor ofwater consumption in plants.
Consequently, drought is said to be a direct consequence of the greenhouseeffect and is the main factor limiting agricultural production in the Sahel countries,such as Mali. As regards the lack of rainfall, Kunkel and Angel (1988) note that thescientific community has no sure way of knowing that drought is evidence of thegreenhouse effect.
The implications of the “temperature” factor will be analysed on the assumptionthat temperatures will increase as indicated by many studies into greenhouse gas
6.2ANALYSIS OF THE IMPACT
OF GREENHOUSE GASES ONCLIMATE AND PLANTS
6.1INTRODUCTION
emissions. The continuous increase in greenhouse gases, such as carbon dioxide,methane, nitrogen protoxide and various halocarbons in the atmosphere, could infact cause global warming and increase aridity in some regions (Houghton et al.,1990). However, it is hard to prove (Bootsma et al., 1996) that droughts have beenmore frequent during the last century as a result of increased greenhouse gasconcentrations. Schneider (1988) noted a connection between low rainfall and theabove-normal temperature increase, which leads to the conclusion that there is arelationship with the greenhouse effect. As mentioned above, temperature andaerodynamics are the main factors of water consumption in plants. The waterrequirements of crops increase as temperature increases. In other words, thepredicted temperature increase appears to mean that more water will be needed forplants to develop normally and as a result droughts would be more frequent. Weunderstand, therefore that temperature increase cannot be separated from theproblem of reduced rainfall and, consequently, drought.
Of all these elements, water is undeniably the most important element of lifeand all living beings have greater or lesser water requirements for their biologicalfunctions. Not only is water an essential component of organic matter, but it is alsothe main liaison factor between the different parts of the organism. As we say, “nowater; no life”. Water supply and requirements are closely associated with theintensity of climatic factors. Crop water supply is mainly determined by rainfall andthe chemo-physical characteristics of the soil, whereas crop water requirements areessentially dependent on climatic energy factors, particularly temperature, and thespecies or variety.
Rainwater is the main water supply for crops and determines surface andgroundwater levels. Even without climate change, precipitation fluctuates, thefluctuations varying according to the climatic zones. Therefore, the West AfricanSahel is not only characterised by irregular rainfall, but also and in particular by badrainfall distribution, which hinders the correct application of the agriculturalcalendar and, as a result, hinders crop yields. Present trends indicate a decrease inrainfall and our analyses are carried out on this assumption, even if some authorsexpect rainfall to increase (IPCC, 1998). This lack of rainfall has been called“drought”, a word having many definitions. A meteorologist considers drought tobe the absence of rain for a fairly long period of time, characterised by below-normalrainfall. The agronomist talks of drought when the lack of water in a given climatecauses water loss to be greater than supply, thus defining drought as a condition ofstress produced in plants due to the water supply being insufficient to compensateevapotranspiration losses. The physiologist considers drought to be a lack ofsaturation relative to the water content during turgor, consequently there is adrought whenever the lack of water causes defence reactions in the plant, i.e. foliagemodification such as wilting. Finally, the pedologist would say that drought is a lackof humidity relative to the retentive capacity of the soil. We could conclude thatdrought is a meteorological event seen as a lack of water expending soil humidity,reducing the water content of the atmosphere and plants and reducing yield. Inshort, drought can be defined as a process associated with a combination of climaticfactors.
If the effect of drought on crop yield no longer needs to be proven, theconsequences of excess rainfall can be as catastrophic, even if years of excess rainfallappear to be less frequent. Abundant rainfall can cause plant asphyxia, thedevelopment of cryptogamic diseases or insects and/or soil degradation; all thesesituations are concurrent with reduced yield.
An inventory of greenhouse gases has been compiled in Mali for 1995 (Table 6.1)and in other African countries. This report studies only the situation in Mali.
Considering the amounts in isolation, carbon dioxide (28 372.28 Gg) was themain greenhouse gas released into the atmosphere in Mali in 1995, being releasedessentially from the conversion of forests and meadows (20 819.88 Gg), from theagricultural use of soil (6597.79 Gg) and from the transformation and consumption
6.3CONTRIBUTION TO THE
INVENTORY OFGREENHOUSE GASES
106 MANAGEMENT STRATEGIES IN AGRICULTURE AND FORESTRY FOR MITIGATION OF GREENHOUSE GAS EMISSIONS AND
ADAPTATION TO CLIMATE VARIABILITY AND CLIMATE CHANGE
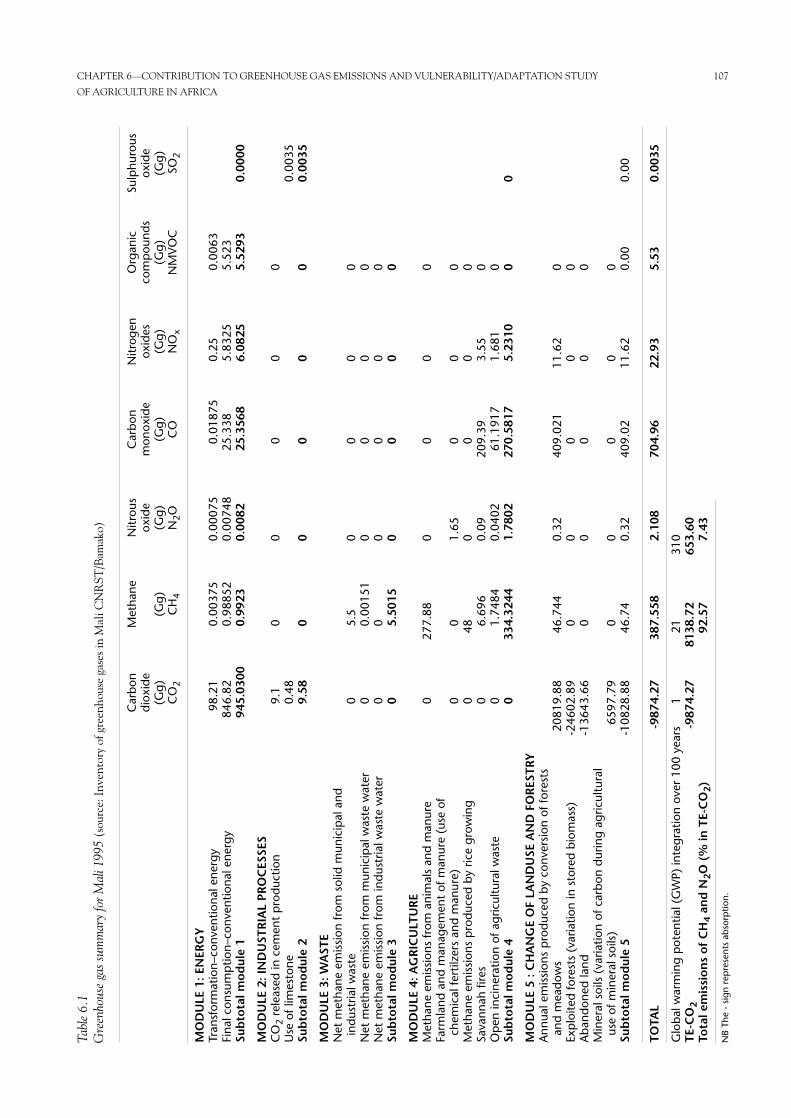
CHAPTER 6—CONTRIBUTION TO GREENHOUSE GAS EMISSIONS AND VULNERABILITY/ADAPTATION STUDY 107
OF AGRICULTURE IN AFRICATa
ble
6.1
Gre
enho
use
gas
sum
mar
y fo
r M
ali 1
995
(sou
rce:
Inve
ntor
y of
gre
enho
use
gase
s in
Mal
i CN
RST
/Bam
ako)
Car
bon
Met
hane
Nitr
ous
Car
bon
Nitr
ogen
Org
anic
Sulp
huro
usdi
oxid
eox
ide
mon
oxid
eox
ides
com
pou
nds
oxid
e(G
g)(G
g)(G
g)(G
g)(G
g)(G
g)(G
g)C
O2
CH
4N
2OC
ON
Ox
NM
VOC
SO2
MO
DU
LE 1
: EN
ERG
YTr
ansf
orm
atio
n–co
nven
tiona
l ene
rgy
98.2
10.
0037
50.
0007
50.
0187
50.
250.
0063
Fina
l con
sum
ptio
n–co
nven
tiona
l ene
rgy
846.
820.
9885
20.
0074
825
.338
5.83
255.
523
Sub
tota
l mo
dul
e 1
945.
0300
0.99
230.
0082
25.3
568
6.08
255.
5293
0.00
00
MO
DU
LE 2
: IN
DU
STR
IAL
PRO
CES
SES
CO
2re
leas
ed in
cem
ent
pro
duct
ion
9.1
00
00
0U
se o
f lim
esto
ne0.
480.
0035
Sub
tota
l mo
dul
e 2
9.58
00
00
00.
0035
MO
DU
LE 3
: WA
STE
Net
met
hane
em
issi
on fr
om s
olid
mun
icip
al a
nd
indu
stria
l was
te0
5.5
00
00
Net
met
hane
em
issi
on fr
om m
unic
ipal
was
te w
ater
00.
0015
10
00
0N
et m
etha
ne e
mis
sion
from
indu
stria
l was
te w
ater
00
00
00
Sub
tota
l mo
dul
e 3
05.
5015
00
00
MO
DU
LE 4
: AG
RIC
ULT
UR
EM
etha
ne e
mis
sion
s fr
om a
nim
als
and
man
ure
027
7.88
00
00
Farm
land
and
man
agem
ent
of m
anur
e (u
se o
f ch
emic
al fe
rtilz
ers
and
man
ure)
00
1.65
00
0M
etha
ne e
mis
sion
s p
rodu
ced
by r
ice
grow
ing
048
00
00
Sava
nnah
fire
s0
6.69
60.
0920
9.39
3.55
0O
pen
inci
nera
tion
of a
gric
ultu
ral w
aste
01.
7484
0.04
0261
.191
71.
681
0Su
bto
tal m
od
ule
40
334.
3244
1.78
0227
0.58
175.
2310
00
MO
DU
LE 5
: C
HA
NG
E O
F LA
ND
USE
AN
D F
OR
ESTR
YA
nnua
l em
issi
ons
pro
duce
d by
con
vers
ion
of fo
rest
s an
d m
eado
ws
2081
9.88
46.7
440.
3240
9.02
111
.62
0Ex
plo
ited
fore
sts
(var
iatio
n in
sto
red
biom
ass)
-246
02.8
90
00
00
Aba
ndon
ed la
nd-1
3643
.66
00
00
0M
iner
al s
oils
(va
riatio
n of
car
bon
durin
g ag
ricul
tura
l us
e of
min
eral
soi
ls)
6597
.79
00
00
0Su
bto
tal m
od
ule
5-1
0828
.88
46.7
40.
3240
9.02
11.6
20.
000.
00
TOTA
L-9
874.
2738
7.55
82.
108
704.
9622
.93
5.53
0.00
35
Glo
bal w
arm
ing
pot
entia
l (G
WP)
inte
grat
ion
over
100
yea
rs1
2131
0TE
-CO
2-9
874.
2781
38.7
265
3.60
Tota
l em
issi
on
s o
f C
H4
and
N2O
(%
in T
E-C
O2)
92.5
77.
43
NB
The
- si
gn r
epre
sent
s ab
sorp
tion.
of conventional energy (945.03 Gg). Carbon monoxide (704.96 Gg) emissions arenext, coming mainly (209.39 Gg) from savannah fires, from the transformation andconversion of forests and meadows (409.02 Gg) and from agricultural residues(61.19 Gg). Methane emissions are at 387.56 Gg and come mainly from livestock(277.88 Gg), rice crops (48 Gg), the conversion of forests and meadows (46.74 Gg),savannah fires (6.70 Gg) and waste (5.50 Gg).
Other gases released include: organic compounds (NMVOC) (5.53 Gg),nitrogen oxides (NOx), (22.93 Gg), nitrous oxide (2.11 Gg) and sulphurous oxide(0.0035 Gg).
Noting the emissions and sequestrations of the different gases, Figure 6.1 showsthe structure of human-induced greenhouse gas emissions in Mali, in 1995.
In parallel with these emissions, Mali is a large carbon dioxide absorberassociated with abandoned land (-13,643.66 Gg) and forests and plantations(-24,602. 89 Gg).
Distribution by type of emission gas in Mali, 1995 (in TE-carbon dioxide) isgiven in Table 6.2.
Table 6.2 shows that, in balancing emissions and absorption by gas type in 1995,the main gas contributing to global warming was methane (8,138.72 TE-carbondioxide). Next in line was nitrous oxide (653.60 TE-carbon dioxide). However, inthe same year, Mali absorbed carbon dioxide (-9,874.27 TE-carbon dioxide).
If we take into account the GWP of each of the main greenhouse gases released,(carbon dioxide, methane, nitrous oxide) we obtain a balance of -1,081.95 TE-carbon dioxide, which means that Mali was globally considered an absorber of thesethree gases in 1995 (Figure 6.3).
The distribution of emissions and absorptions of greenhouse gases by sector aregiven in Table 6.3.
The agricultural sector was the main sector contributing to warming in 1995with 87.40 per cent (7572.67 TE-CO2) of total TE-CO2 emissions, followed by theenergy sector with 11.17 per cent (968.41 TE-CO2) and then waste and industrialprocesses with 115.53 TE-CO2 (1.33 per cent) and 9.58 TE-CO2 (0.10 per cent)respectively. Furthermore, the change of land use and forestry sector absorbs carbondioxide (-9748.14 TE-CO2). In strategies for reducing greenhouse gases, priorityshould be given to strengthening these sequestrations in parallel with theimplementation of reduction strategies in the other sectors.
Agriculture still uses traditional methods to this day. However, progressivemechanisation can be observed. In the Koulikoro region, an area for which thevulnerability/adaptation study was carried out, traditional sector production forcereals was at 98.45 per cent of the total production of the two sectors in 1995.
In 1995 the production of the main cereals (millet, sorghum, rain-fed rice,maize and fonio) was 371 648 tonnes for Koulikoro region compared with 2 172 429tonnes for Mali as a whole. Average production per hectare was 882.64 kg in thisregion, compared with 807.4 kg for Mali as a whole. During the same crop year theaverage traditional-sector yield in the region for the main cereals reached 863.65kg ha-1 (Table 6.4, see page 110).
From Table 6.4, it is clear that sorghum is the most important agriculturalproduct of the region. Along with millet, it constitutes 82.25 per cent of total cerealproduction. Their importance can be explained by the fact that they form the staplediet.
Large, reasonably equipped farms, medium and small farms characteriseagriculture. Since the small farms do not have access to agricultural credit, theycontinue to use traditional methods. Agriculture barely uses irrigation, rendering itextremely vulnerable to climatic fluctuations.
Yields are just as affected by deficient or excess rainfall as by the bad rainfalldistribution during the crop development cycles.
Mechanization has progressed further in the OHVN and CMDT zones than inthe region as a whole. The OHVN zone comprises 33 127 farms 49 per cent of
6.4THE AGRICULTURALSITUATION IN MALI
6.4.1AGRICULTURE
108 MANAGEMENT STRATEGIES IN AGRICULTURE AND FORESTRY FOR MITIGATION OF GREENHOUSE GAS EMISSIONS AND
ADAPTATION TO CLIMATE VARIABILITY AND CLIMATE CHANGE
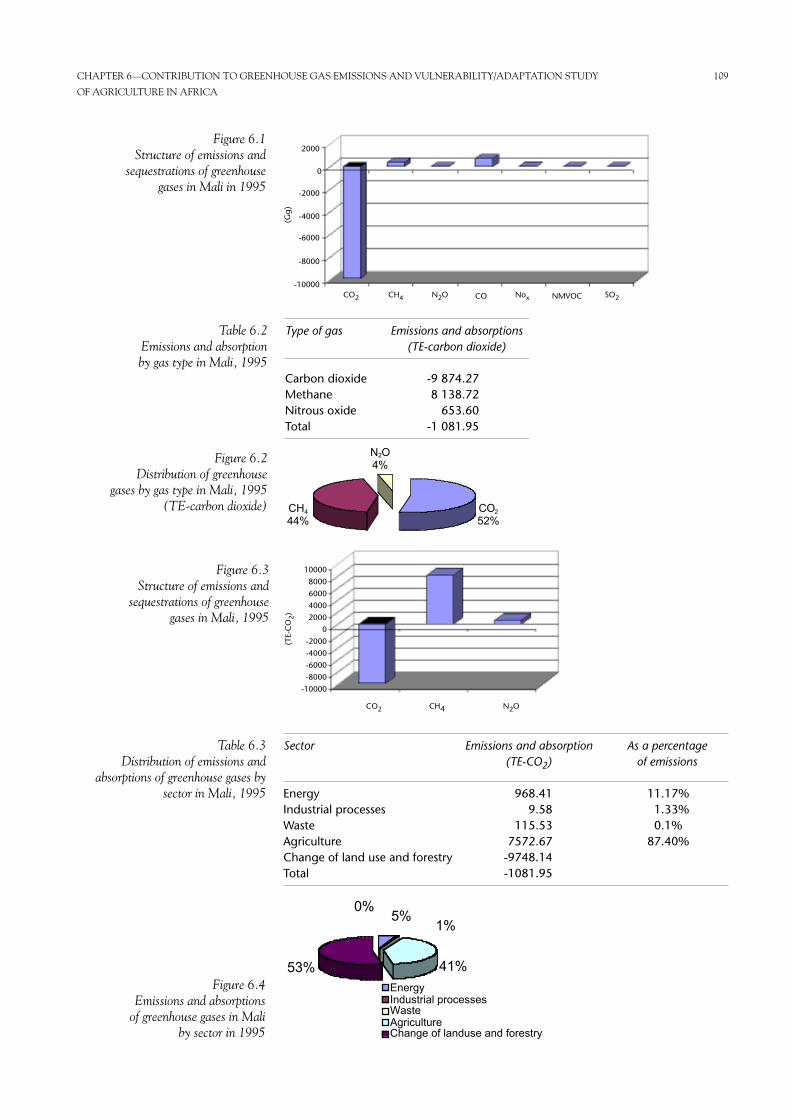
CHAPTER 6—CONTRIBUTION TO GREENHOUSE GAS EMISSIONS AND VULNERABILITY/ADAPTATION STUDY 109
OF AGRICULTURE IN AFRICA
2000
0
-2000
-4000
-6000
-8000
-10000CO2 CH4 N2O CO Nox NMVOC SO2
(Gg)
Figure 6.1Structure of emissions and
sequestrations of greenhouse gases in Mali in 1995
Table 6.2Emissions and absorption by gas type in Mali, 1995
Figure 6.2Distribution of greenhouse
gases by gas type in Mali, 1995 (TE-carbon dioxide)
Type of gas Emissions and absorptions (TE-carbon dioxide)
Carbon dioxide -9 874.27Methane 8 138.72Nitrous oxide 653.60Total -1 081.95
N2O4%
CO2
52%CH4
44%
10000
8000
6000
4000
2000
0
-2000
-4000
-6000
-8000
-10000
CO2 CH4 N2O
(TE-
CO
2)
Figure 6.3Structure of emissions and
sequestrations of greenhouse gases in Mali, 1995
Figure 6.4Emissions and absorptions
of greenhouse gases in Mali by sector in 1995
Sector Emissions and absorption As a percentage(TE-CO2) of emissions
Energy 968.41 11.17%Industrial processes 9.58 1.33%Waste 115.53 0.1%Agriculture 7572.67 87.40%Change of land use and forestry -9748.14Total -1081.95
Table 6.3Distribution of emissions and
absorptions of greenhouse gases bysector in Mali, 1995
41%53%
5%0%
1%
EnergyIndustrial processesWasteAgricultureChange of landuse and forestry
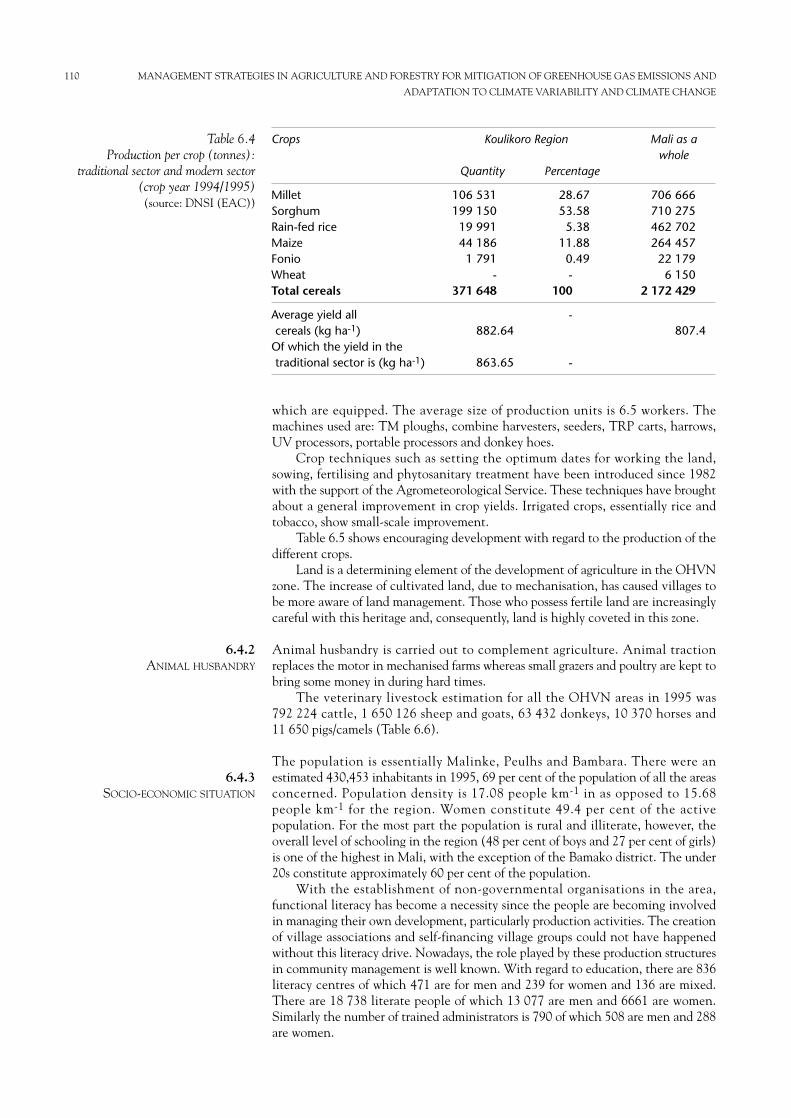
which are equipped. The average size of production units is 6.5 workers. Themachines used are: TM ploughs, combine harvesters, seeders, TRP carts, harrows,UV processors, portable processors and donkey hoes.
Crop techniques such as setting the optimum dates for working the land,sowing, fertilising and phytosanitary treatment have been introduced since 1982with the support of the Agrometeorological Service. These techniques have broughtabout a general improvement in crop yields. Irrigated crops, essentially rice andtobacco, show small-scale improvement.
Table 6.5 shows encouraging development with regard to the production of thedifferent crops.
Land is a determining element of the development of agriculture in the OHVNzone. The increase of cultivated land, due to mechanisation, has caused villages tobe more aware of land management. Those who possess fertile land are increasinglycareful with this heritage and, consequently, land is highly coveted in this zone.
Animal husbandry is carried out to complement agriculture. Animal tractionreplaces the motor in mechanised farms whereas small grazers and poultry are kept tobring some money in during hard times.
The veterinary livestock estimation for all the OHVN areas in 1995 was792 224 cattle, 1 650 126 sheep and goats, 63 432 donkeys, 10 370 horses and11 650 pigs/camels (Table 6.6).
The population is essentially Malinke, Peulhs and Bambara. There were anestimated 430,453 inhabitants in 1995, 69 per cent of the population of all the areasconcerned. Population density is 17.08 people km-1 in as opposed to 15.68people km-1 for the region. Women constitute 49.4 per cent of the activepopulation. For the most part the population is rural and illiterate, however, theoverall level of schooling in the region (48 per cent of boys and 27 per cent of girls)is one of the highest in Mali, with the exception of the Bamako district. The under20s constitute approximately 60 per cent of the population.
With the establishment of non-governmental organisations in the area,functional literacy has become a necessity since the people are becoming involvedin managing their own development, particularly production activities. The creationof village associations and self-financing village groups could not have happenedwithout this literacy drive. Nowadays, the role played by these production structuresin community management is well known. With regard to education, there are 836literacy centres of which 471 are for men and 239 for women and 136 are mixed.There are 18 738 literate people of which 13 077 are men and 6661 are women.Similarly the number of trained administrators is 790 of which 508 are men and 288are women.
6.4.3SOCIO-ECONOMIC SITUATION
6.4.2ANIMAL HUSBANDRY
110 MANAGEMENT STRATEGIES IN AGRICULTURE AND FORESTRY FOR MITIGATION OF GREENHOUSE GAS EMISSIONS AND
ADAPTATION TO CLIMATE VARIABILITY AND CLIMATE CHANGE
Crops Koulikoro Region Mali as a whole
Quantity Percentage
Millet 106 531 28.67 706 666Sorghum 199 150 53.58 710 275Rain-fed rice 19 991 5.38 462 702Maize 44 186 11.88 264 457Fonio 1 791 0.49 22 179Wheat - - 6 150Total cereals 371 648 100 2 172 429
Average yield all -cereals (kg ha-1) 882.64 807.4
Of which the yield in the traditional sector is (kg ha-1) 863.65 -
Table 6.4Production per crop (tonnes):
traditional sector and modern sector(crop year 1994/1995) (source: DNSI (EAC))
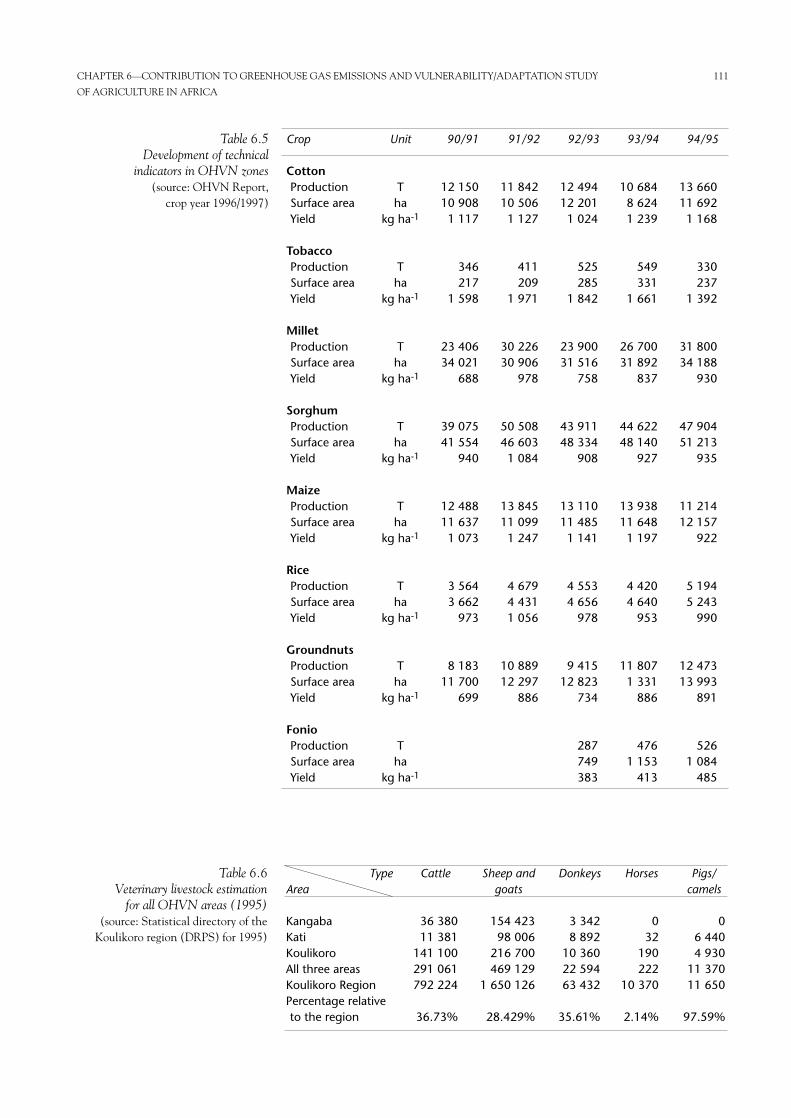
CHAPTER 6—CONTRIBUTION TO GREENHOUSE GAS EMISSIONS AND VULNERABILITY/ADAPTATION STUDY 111
OF AGRICULTURE IN AFRICA
Crop
CottonProductionSurface areaYield
TobaccoProductionSurface areaYield
MilletProductionSurface areaYield
SorghumProductionSurface areaYield
MaizeProductionSurface areaYield
RiceProductionSurface areaYield
GroundnutsProductionSurface areaYield
FonioProductionSurface areaYield
Unit
Tha
kg ha-1
Tha
kg ha-1
Tha
kg ha-1
Tha
kg ha-1
Tha
kg ha-1
Tha
kg ha-1
Tha
kg ha-1
Tha
kg ha-1
90/91
12 15010 9081 117
346217
1 598
23 40634 021
688
39 07541 554
940
12 48811 6371 073
3 5643 662
973
8 18311 700
699
91/92
11 84210 5061 127
411209
1 971
30 22630 906
978
50 50846 6031 084
13 84511 0991 247
4 6794 4311 056
10 88912 297
886
92/93
12 49412 2011 024
525285
1 842
23 90031 516
758
43 91148 334
908
13 11011 4851 141
4 5534 656
978
9 41512 823
734
287749383
93/94
10 6848 6241 239
549331
1 661
26 70031 892
837
44 62248 140
927
13 93811 6481 197
4 4204 640
953
11 8071 331
886
4761 153
413
94/95
13 66011 6921 168
330237
1 392
31 80034 188
930
47 90451 213
935
11 21412 157
922
5 1945 243
990
12 47313 993
891
5261 084
485
Table 6.5Development of technical
indicators in OHVN zones(source: OHVN Report,
crop year 1996/1997)
TypeArea
KangabaKatiKoulikoroAll three areasKoulikoro Region Percentage relativeto the region
Sheep andgoats
154 42398 006
216 700469 129
1 650 126
28.429%
Cattle
36 38011 381
141 100291 061792 224
36.73%
Donkeys
3 3428 892
10 36022 59463 432
35.61%
Horses
032
190222
10 370
2.14%
Pigs/camels
06 4404 930
11 37011 650
97.59%
Table 6.6Veterinary livestock estimation
for all OHVN areas (1995)(source: Statistical directory of the
Koulikoro region (DRPS) for 1995)
The area is undergoing major rural exodus. This can be explained by theproximity of Bamako, Mali’s capital and main economic centre. The rural youthmigrate towards this industrial and commercial centre looking for paid work. Thenet emigration level varies between 5 per cent and 19 per cent according to the cropyear balance.
Mozambique’s economy is based on agriculture, which accounts for 50 per cent ofGDP.
Over the last 20 years, the economy has been severely shaken, mainly due tothe civil war. Since 1987, with the onset of peace, the economy has started to seesatisfactory progress.
The most important foodstuffs are maize, manioc, groundnuts, rice, sorghumand millet. The main industrial crops are cotton, tea and sugar. It is estimated thatonly 6 per cent of the total surface area is cultivated, excluding pastureland andforestry (National Directorate for Water Affairs/UNICEF, 1987) and less than78 000 ha are irrigated.
The vulnerability/adaptation study for agriculture in Mali and in Mozambique wasbased on the climate change simulation and crop growth models. The global climatemodel was used to estimate the climatic parameter variations (temperature, rainfall,sunshine).
Climate change impact analysis requires that the scale of the actual changes bedefined at the outset. To this day there is no truly reliable method for forecastingthe future climate. Therefore, it is customary to seek to define a certain number ofplausible future climates, known as “climatic scenarios”. These scenarios are chosenso as to provide spatially compatible, coherent data, which is easily obtained orcalculated and which can be used in the impact models.
Three main categories of climate scenarios can be distinguished: synthesisedscenarios, analogue scenarios and scenarios drawn from global climate models.
The IPCC recommends that, “scenarios drawn from global climate models beused for impact studies”. The GCM are tri-dimensional numerical models of theglobal climatic system comprising: atmosphere, oceans, biosphere and cryosphere.These are the only valid tools available for simulating the physical phenomena thatdetermine the global climate. They estimate the climatic variables for a set of gridpoints evenly distributed around the globe.
However, the GCM has shortcomings that cause its estimations to be uncertain.It does not correctly represent cloud phenomena, has insufficient spatial resolution(the links of the grid measure 250 km horizontally at best), produces a globaltopography that does not take some important local elements into considerationand gives a simplified representation of the interactions between the earth and theatmosphere and between the oceans and the atmosphere. The data provided by theGCM is, at best, a general set of plausible future climate conditions and not aprediction.
However, when this data is supplemented by results from regional models, thelocal climatic variations required to analyse impacts can be obtained.
The GCM can be used to carry out two types of experiment analysing the futureclimate: equilibrium reaction experiments and transition reaction experiments. Theequilibrium reaction experiments analyse the equilibrium reaction of the globalclimate when the concentration of atmospheric carbon dioxide doubles, whereasthe transition reaction experiments simulate the characteristics of atmosphericdisturbance following a continuous increase of greenhouse gases over time.
In this study, we will consider the results of the global climate models givingthe global and Sahel temperature variations corresponding to a doubledconcentration of atmospheric carbon dioxide provided by IPCC studies.
The approach entails running the model with a “control” level of carbondioxide concentration (1 × CO2) of approximately 300 ppmv approximately
6.6.1CLIMATE CHANGE MODEL
6.6VULNERABILITY/
ADAPTATION STUDY
6.5THE AGRICULTURAL
SITUATION IN MOZAMBIQUE
112 MANAGEMENT STRATEGIES IN AGRICULTURE AND FORESTRY FOR MITIGATION OF GREENHOUSE GAS EMISSIONS AND
ADAPTATION TO CLIMATE VARIABILITY AND CLIMATE CHANGE
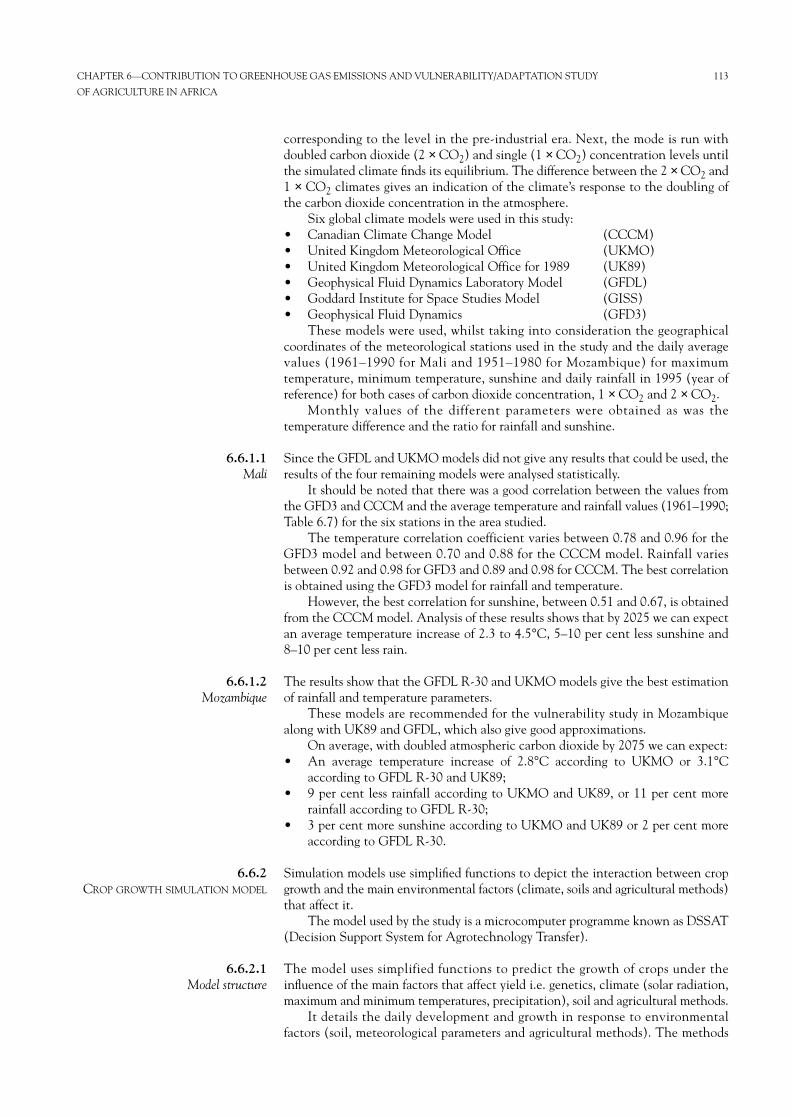
corresponding to the level in the pre-industrial era. Next, the mode is run withdoubled carbon dioxide (2 × CO2) and single (1 × CO2) concentration levels untilthe simulated climate finds its equilibrium. The difference between the 2 × CO2 and1 × CO2 climates gives an indication of the climate’s response to the doubling ofthe carbon dioxide concentration in the atmosphere.
Six global climate models were used in this study:• Canadian Climate Change Model (CCCM)• United Kingdom Meteorological Office (UKMO)• United Kingdom Meteorological Office for 1989 (UK89)• Geophysical Fluid Dynamics Laboratory Model (GFDL)• Goddard Institute for Space Studies Model (GISS) • Geophysical Fluid Dynamics (GFD3)
These models were used, whilst taking into consideration the geographicalcoordinates of the meteorological stations used in the study and the daily averagevalues (1961–1990 for Mali and 1951–1980 for Mozambique) for maximumtemperature, minimum temperature, sunshine and daily rainfall in 1995 (year ofreference) for both cases of carbon dioxide concentration, 1 × CO2 and 2 × CO2.
Monthly values of the different parameters were obtained as was thetemperature difference and the ratio for rainfall and sunshine.
Since the GFDL and UKMO models did not give any results that could be used, theresults of the four remaining models were analysed statistically.
It should be noted that there was a good correlation between the values fromthe GFD3 and CCCM and the average temperature and rainfall values (1961–1990;Table 6.7) for the six stations in the area studied.
The temperature correlation coefficient varies between 0.78 and 0.96 for theGFD3 model and between 0.70 and 0.88 for the CCCM model. Rainfall variesbetween 0.92 and 0.98 for GFD3 and 0.89 and 0.98 for CCCM. The best correlationis obtained using the GFD3 model for rainfall and temperature.
However, the best correlation for sunshine, between 0.51 and 0.67, is obtainedfrom the CCCM model. Analysis of these results shows that by 2025 we can expectan average temperature increase of 2.3 to 4.5°C, 5–10 per cent less sunshine and8–10 per cent less rain.
The results show that the GFDL R-30 and UKMO models give the best estimationof rainfall and temperature parameters.
These models are recommended for the vulnerability study in Mozambiquealong with UK89 and GFDL, which also give good approximations.
On average, with doubled atmospheric carbon dioxide by 2075 we can expect:• An average temperature increase of 2.8°C according to UKMO or 3.1°C
according to GFDL R-30 and UK89;• 9 per cent less rainfall according to UKMO and UK89, or 11 per cent more
rainfall according to GFDL R-30;• 3 per cent more sunshine according to UKMO and UK89 or 2 per cent more
according to GFDL R-30.
Simulation models use simplified functions to depict the interaction between cropgrowth and the main environmental factors (climate, soils and agricultural methods)that affect it.
The model used by the study is a microcomputer programme known as DSSAT(Decision Support System for Agrotechnology Transfer).
The model uses simplified functions to predict the growth of crops under theinfluence of the main factors that affect yield i.e. genetics, climate (solar radiation,maximum and minimum temperatures, precipitation), soil and agricultural methods.
It details the daily development and growth in response to environmentalfactors (soil, meteorological parameters and agricultural methods). The methods
6.6.2.1Model structure
6.6.2CROP GROWTH SIMULATION MODEL
6.6.1.2Mozambique
6.6.1.1Mali
CHAPTER 6—CONTRIBUTION TO GREENHOUSE GAS EMISSIONS AND VULNERABILITY/ADAPTATION STUDY 113
OF AGRICULTURE IN AFRICA
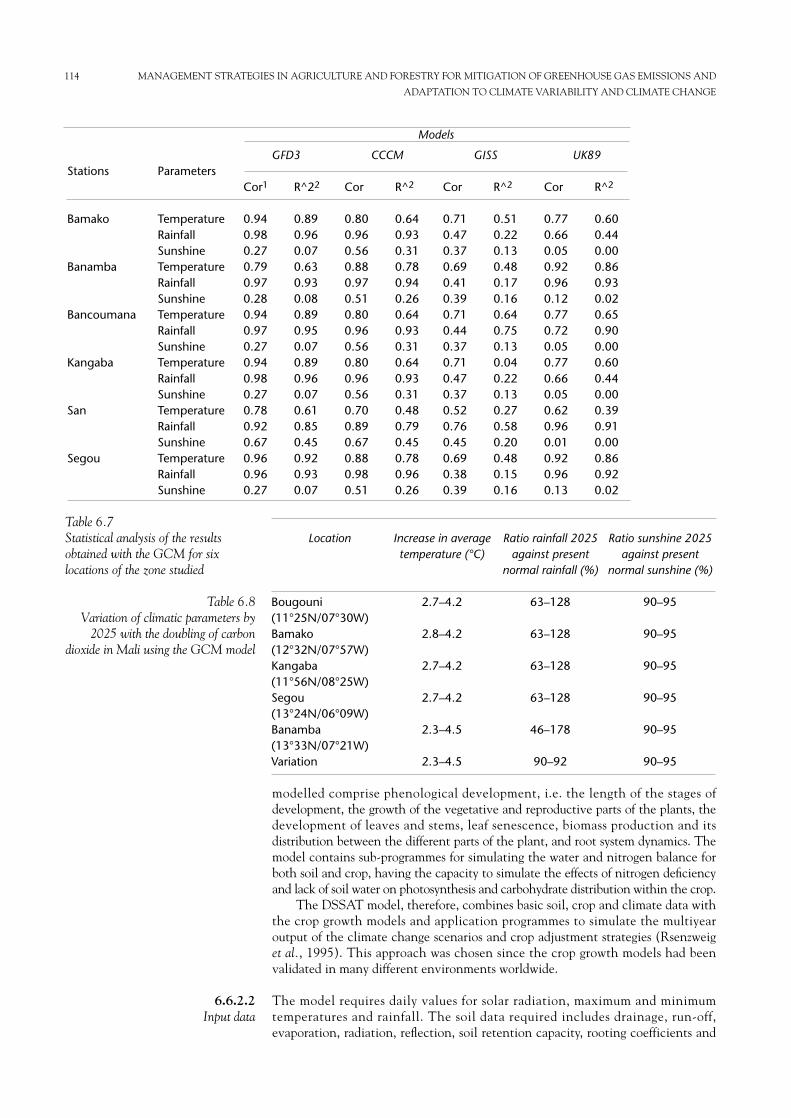
114 MANAGEMENT STRATEGIES IN AGRICULTURE AND FORESTRY FOR MITIGATION OF GREENHOUSE GAS EMISSIONS AND
ADAPTATION TO CLIMATE VARIABILITY AND CLIMATE CHANGE
modelled comprise phenological development, i.e. the length of the stages ofdevelopment, the growth of the vegetative and reproductive parts of the plants, thedevelopment of leaves and stems, leaf senescence, biomass production and itsdistribution between the different parts of the plant, and root system dynamics. Themodel contains sub-programmes for simulating the water and nitrogen balance forboth soil and crop, having the capacity to simulate the effects of nitrogen deficiencyand lack of soil water on photosynthesis and carbohydrate distribution within the crop.
The DSSAT model, therefore, combines basic soil, crop and climate data withthe crop growth models and application programmes to simulate the multiyearoutput of the climate change scenarios and crop adjustment strategies (Rsenzweiget al., 1995). This approach was chosen since the crop growth models had beenvalidated in many different environments worldwide.
The model requires daily values for solar radiation, maximum and minimumtemperatures and rainfall. The soil data required includes drainage, run-off,evaporation, radiation, reflection, soil retention capacity, rooting coefficients and
6.6.2.2Input data
Stations
Bamako
Banamba
Bancoumana
Kangaba
San
Segou
Parameters
TemperatureRainfallSunshineTemperatureRainfallSunshineTemperatureRainfallSunshineTemperatureRainfallSunshineTemperatureRainfallSunshineTemperatureRainfallSunshine
Cor1
0.940.980.270.790.970.280.940.970.270.940.980.270.780.920.670.960.960.27
R^22
0.890.960.070.630.930.080.890.950.070.890.960.070.610.850.450.920.930.07
Cor
0.800.960.560.880.970.510.800.960.560.800.960.560.700.890.670.880.980.51
R^2
0.640.930.310.780.940.260.640.930.310.640.930.310.480.790.450.780.960.26
Cor
0.710.470.370.690.410.390.710.440.370.710.470.370.520.760.450.690.380.39
R^2
0.510.220.130.480.170.160.640.750.130.040.220.130.270.580.200.480.150.16
R^2
0.600.440.000.860.930.020.650.900.000.600.440.000.390.910.000.860.920.02
Cor
0.770.660.050.920.960.120.770.720.050.770.660.050.620.960.010.920.960.13
GFD3 CCCM
Models
GISS UK89
Table 6.7Statistical analysis of the resultsobtained with the GCM for sixlocations of the zone studied
Table 6.8Variation of climatic parameters by
2025 with the doubling of carbondioxide in Mali using the GCM model
Location
Bougouni(11°25N/07°30W)Bamako(12°32N/07°57W)Kangaba(11°56N/08°25W)Segou(13°24N/06°09W)Banamba(13°33N/07°21W)Variation
Increase in averagetemperature (°C)
2.7–4.2
2.8–4.2
2.7–4.2
2.7–4.2
2.3–4.5
2.3–4.5
Ratio rainfall 2025against present
normal rainfall (%)
63–128
63–128
63–128
63–128
46–178
90–92
Ratio sunshine 2025against present
normal sunshine (%)
90–95
90–95
90–95
90–95
90–95
90–95
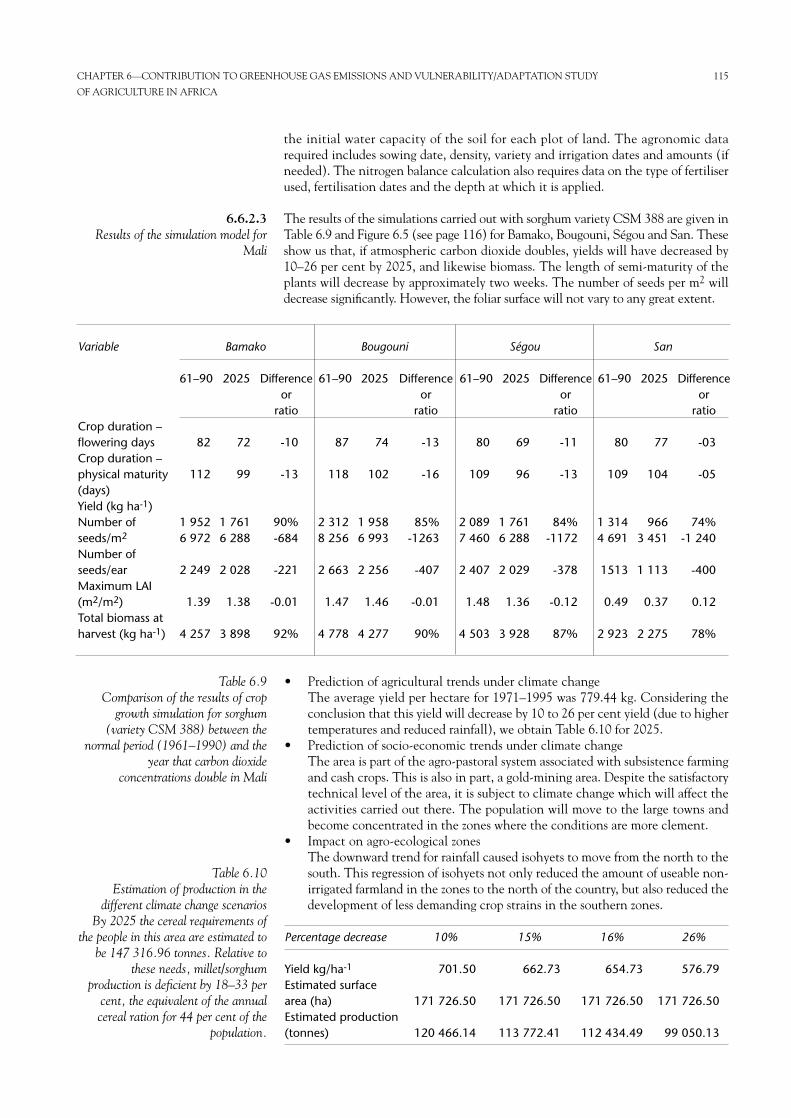
the initial water capacity of the soil for each plot of land. The agronomic datarequired includes sowing date, density, variety and irrigation dates and amounts (ifneeded). The nitrogen balance calculation also requires data on the type of fertiliserused, fertilisation dates and the depth at which it is applied.
The results of the simulations carried out with sorghum variety CSM 388 are given inTable 6.9 and Figure 6.5 (see page 116) for Bamako, Bougouni, Ségou and San. Theseshow us that, if atmospheric carbon dioxide doubles, yields will have decreased by10–26 per cent by 2025, and likewise biomass. The length of semi-maturity of theplants will decrease by approximately two weeks. The number of seeds per m2 willdecrease significantly. However, the foliar surface will not vary to any great extent.
• Prediction of agricultural trends under climate change The average yield per hectare for 1971–1995 was 779.44 kg. Considering theconclusion that this yield will decrease by 10 to 26 per cent yield (due to highertemperatures and reduced rainfall), we obtain Table 6.10 for 2025.
• Prediction of socio-economic trends under climate changeThe area is part of the agro-pastoral system associated with subsistence farmingand cash crops. This is also in part, a gold-mining area. Despite the satisfactorytechnical level of the area, it is subject to climate change which will affect theactivities carried out there. The population will move to the large towns andbecome concentrated in the zones where the conditions are more clement.
• Impact on agro-ecological zonesThe downward trend for rainfall caused isohyets to move from the north to thesouth. This regression of isohyets not only reduced the amount of useable non-irrigated farmland in the zones to the north of the country, but also reduced thedevelopment of less demanding crop strains in the southern zones.
6.6.2.3 Results of the simulation model for
Mali
CHAPTER 6—CONTRIBUTION TO GREENHOUSE GAS EMISSIONS AND VULNERABILITY/ADAPTATION STUDY 115
OF AGRICULTURE IN AFRICA
Variable
Crop duration –flowering daysCrop duration –physical maturity(days)Yield (kg ha-1)Number ofseeds/m2
Number ofseeds/earMaximum LAI(m2/m2)Total biomass atharvest (kg ha-1)
61–90
82
112
1 9526 972
2 249
1.39
4 257
2025
72
99
1 7616 288
2 028
1.38
3 898
Differenceor
ratio
-10
-13
90%-684
-221
-0.01
92%
61–90
87
118
2 3128 256
2 663
1.47
4 778
2025
74
102
1 9586 993
2 256
1.46
4 277
Differenceor
ratio
-13
-16
85%-1263
-407
-0.01
90%
61–90
80
109
2 0897 460
2 407
1.48
4 503
2025
69
96
1 7616 288
2 029
1.36
3 928
Differenceor
ratio
-11
-13
84%-1172
-378
-0.12
87%
61–90
80
109
1 3144 691
1513
0.49
2 923
2025
77
104
9663 451
1 113
0.37
2 275
Differenceor
ratio
-03
-05
74%-1 240
-400
0.12
78%
Bamako Bougouni Ségou San
Table 6.9Comparison of the results of crop
growth simulation for sorghum(variety CSM 388) between the
normal period (1961–1990) and theyear that carbon dioxide
concentrations double in Mali
Percentage decrease 10% 15% 16% 26%
Yield kg/ha-1 701.50 662.73 654.73 576.79Estimated surface area (ha) 171 726.50 171 726.50 171 726.50 171 726.50Estimated production (tonnes) 120 466.14 113 772.41 112 434.49 99 050.13
Table 6.10 Estimation of production in the
different climate change scenariosBy 2025 the cereal requirements of
the people in this area are estimated tobe 147 316.96 tonnes. Relative to
these needs, millet/sorghumproduction is deficient by 18–33 per
cent, the equivalent of the annualcereal ration for 44 per cent of the
population.
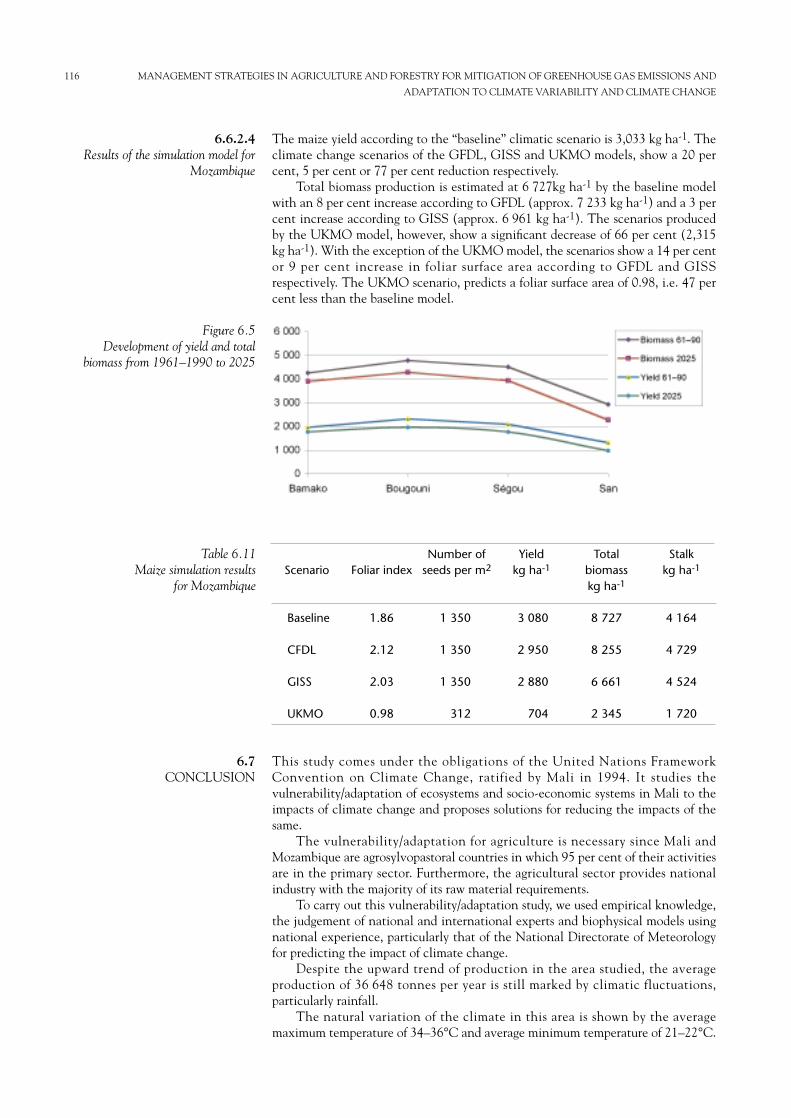
The maize yield according to the “baseline” climatic scenario is 3,033 kg ha-1. Theclimate change scenarios of the GFDL, GISS and UKMO models, show a 20 percent, 5 per cent or 77 per cent reduction respectively.
Total biomass production is estimated at 6 727kg ha-1 by the baseline modelwith an 8 per cent increase according to GFDL (approx. 7 233 kg ha-1) and a 3 percent increase according to GISS (approx. 6 961 kg ha-1). The scenarios producedby the UKMO model, however, show a significant decrease of 66 per cent (2,315kg ha-1). With the exception of the UKMO model, the scenarios show a 14 per centor 9 per cent increase in foliar surface area according to GFDL and GISSrespectively. The UKMO scenario, predicts a foliar surface area of 0.98, i.e. 47 percent less than the baseline model.
This study comes under the obligations of the United Nations FrameworkConvention on Climate Change, ratified by Mali in 1994. It studies thevulnerability/adaptation of ecosystems and socio-economic systems in Mali to theimpacts of climate change and proposes solutions for reducing the impacts of thesame.
The vulnerability/adaptation for agriculture is necessary since Mali andMozambique are agrosylvopastoral countries in which 95 per cent of their activitiesare in the primary sector. Furthermore, the agricultural sector provides nationalindustry with the majority of its raw material requirements.
To carry out this vulnerability/adaptation study, we used empirical knowledge,the judgement of national and international experts and biophysical models usingnational experience, particularly that of the National Directorate of Meteorologyfor predicting the impact of climate change.
Despite the upward trend of production in the area studied, the averageproduction of 36 648 tonnes per year is still marked by climatic fluctuations,particularly rainfall.
The natural variation of the climate in this area is shown by the averagemaximum temperature of 34–36°C and average minimum temperature of 21–22°C.
6.7CONCLUSION
6.6.2.4Results of the simulation model for
Mozambique
116 MANAGEMENT STRATEGIES IN AGRICULTURE AND FORESTRY FOR MITIGATION OF GREENHOUSE GAS EMISSIONS AND
ADAPTATION TO CLIMATE VARIABILITY AND CLIMATE CHANGE
Figure 6.5Development of yield and total
biomass from 1961–1990 to 2025
Scenario
Baseline
CFDL
GISS
UKMO
Foliar index
1.86
2.12
2.03
0.98
Number ofseeds per m2
1 350
1 350
1 350
312
Yieldkg ha-1
3 080
2 950
2 880
704
Totalbiomasskg ha-1
8 727
8 255
6 661
2 345
Stalkkg ha-1
4 164
4 729
4 524
1 720
Table 6.11 Maize simulation results
for Mozambique
This temperature variation highlights an upward trend that is gradually more markedas one moves north to the south, with an average increase of 0.4°C between 1981and 1995. Moreover this area is characterised, during the same period, by a badrainfall distribution, particularly at the beginning and the end of the growing season.
The greenhouse effect following the doubling of carbon dioxide levels in theatmosphere for the Sahel area of Mali predicts a temperature increase of 2.35 to4.5°C by the year 2025. Since this warming causes the evaporation requirements ofplants to increase, the climatic scenarios and their impact on the agricultural sectorcan be simulated. Therefore, our study shows that, under climate change, there willbe a 10–26 per cent loss of yield by 2025. This climate change-induced loss of yieldwill be seen as a food deficit, causing a rural exodus, inter alia.
Since climatic factors cannot be controlled, we seek essentially to improve themanagement of the consequences of climatic variations. The fact that some farmershave followed agrometeorological advice has enabled some regions in the countryto increase productivity achieving a cost benefit ratio of 21. This advice also enablesskills to be passed on to those who work the land, limiting the rural exodus andproviding rational management of the environment.
To reduce the impacts of climate change, plants and animals should be allowedto develop mechanisms for adapting to climatic fluctuations and humans should beallowed to control the frequency of the different climatic events so as to ensureoptimum management of the risks posed.
Draft research and development programmes are proposed, based on using theplant varieties that are adapted to climate change and developing adequateagrometeorological advice for minimising its negative impacts.
Transferring the results of these programmes to the farmers’ environment meansthat they need to be trained and equipped. The implementation of theseprogrammes should, in this way, contribute to the reduction of poverty and improvemanagement of natural resources.
The same studies reveal a reduction of yield and biomass for maize inMozambique.
CHAPTER 6—CONTRIBUTION TO GREENHOUSE GAS EMISSIONS AND VULNERABILITY/ADAPTATION STUDY 117
OF AGRICULTURE IN AFRICA
CHAPTER 7
FOREST INDUSTRIES AND CLIMATE CHANGE(by Jacques Lahaussois)
From 1850 to 1998, atmospheric carbon dioxide concentrations increased from 285 to366 ppm (IPCC, 2000). This led to an increase of the global average temperature thatrose by about 0.5°C, with a concentration of most of the high temperature records inthe 1990s. There is strong evidence that human-induced greenhouse gas emissionscontribute towards this “global warming”, which encompasses a change in most climatevariables, including their variability patterns. While solar radiation and rainfall aremajor climatic resources, climate is also the single main factor behind the variabilityof agricultural production in developing and developed countries alike. Global warm-ing may thus have profound effects on agriculture and food security. Crop agriculture,forestry and livestock are directly involved as sources or sinks of greenhouse gases, butthey are also among the most vulnerable victims of the foreseen changes.
Although there is no consensus on what will happen to agriculturalenvironments and production, and at what pace, the following consequences aregenerally accepted by the scientific community:• Climate has considerable inertia, and cannot be reversed over a short period of
time;• Future scenarios are uncertain and significant reduction of the uncertainties
will require a decade or more;• Global temperature may rise between 1.5 and 4.5°C by the end of the 21st century • Water vapour concentrations will increase in the lower atmosphere, and global
mean precipitation could increase by 1.5 to 2.5 per cent per 1°C of globalwarming;
• Sea level rise may reach about 50 cm by 2100.A temperature increase is expected particularly at high latitudes, and changes in
rainfall at low latitudes. The response to the changes by organisms is relatively easyto assess at the eco-physiological level. It includes, for instance, shorter crop cycles,carbon dioxide fertilisation, modifications of coastal/deltaic agriculture, modifiedcrop/animal and pest/disease relations. Major methodological difficulties areassociated with the extrapolation of impacts to the global scale. The literaturestresses the possibility of a modification of the current crop geopolitical balance,human population movements and increased global insecurity.
Very little is known about the spatial distribution of the more complex impacts.If expressed in terms of gross domestic product from agriculture (GDPA), and aftermaking due provision for adaptation, impact could generally be positive indeveloped countries, and negative elsewhere. Some authors also cautiously suggestthat by 2060 there may be a relative decrease of the number of hungry people, butan increase in Africa when expressed in absolute terms. In Asia, on the other hand,there would be both a relative and absolute decrease.
The purpose of this presentation is to review the role of forest industries inclimate change, both as a source for greenhouse gas emissions, and as a contributorto emission reductions. Forest industries, in the context of this paper, include allactivities related to the manufacture of forest products, i.e. tree plantations,harvesting, processing into lumber, wood-based panels, paper, household fixtures,furniture and disposal of end products. As its name implies, the forest industry isbased on the use of wood as raw material, with all its related benefits andenvironmental considerations.
Forest-based industries provide goods and services using forest resources. Goods canbasically be divided into two main groups: wood and non-wood forest products. Inthe process of producing these goods, socio-economic benefits accrue to the
7.2FOREST INDUSTRIES
7.1INTRODUCTION
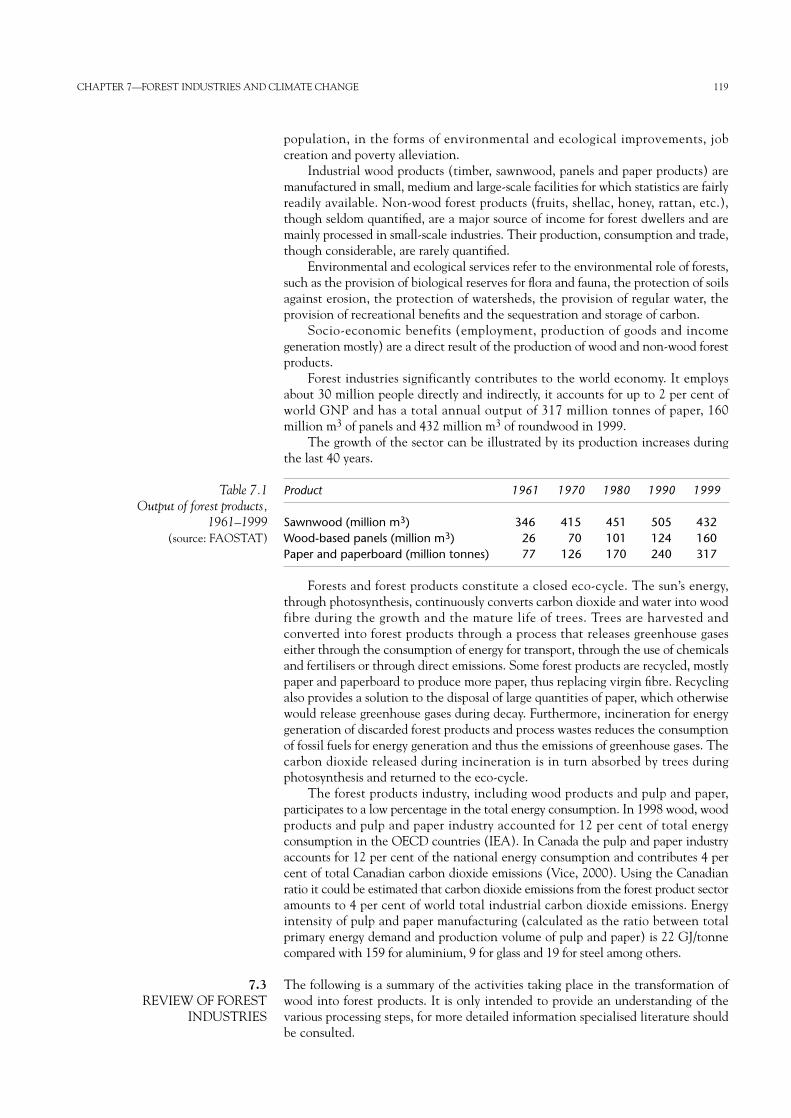
population, in the forms of environmental and ecological improvements, jobcreation and poverty alleviation.
Industrial wood products (timber, sawnwood, panels and paper products) aremanufactured in small, medium and large-scale facilities for which statistics are fairlyreadily available. Non-wood forest products (fruits, shellac, honey, rattan, etc.),though seldom quantified, are a major source of income for forest dwellers and aremainly processed in small-scale industries. Their production, consumption and trade,though considerable, are rarely quantified.
Environmental and ecological services refer to the environmental role of forests,such as the provision of biological reserves for flora and fauna, the protection of soilsagainst erosion, the protection of watersheds, the provision of regular water, theprovision of recreational benefits and the sequestration and storage of carbon.
Socio-economic benefits (employment, production of goods and incomegeneration mostly) are a direct result of the production of wood and non-wood forestproducts.
Forest industries significantly contributes to the world economy. It employsabout 30 million people directly and indirectly, it accounts for up to 2 per cent ofworld GNP and has a total annual output of 317 million tonnes of paper, 160million m3 of panels and 432 million m3 of roundwood in 1999.
The growth of the sector can be illustrated by its production increases duringthe last 40 years.
Forests and forest products constitute a closed eco-cycle. The sun’s energy,through photosynthesis, continuously converts carbon dioxide and water into woodfibre during the growth and the mature life of trees. Trees are harvested andconverted into forest products through a process that releases greenhouse gaseseither through the consumption of energy for transport, through the use of chemicalsand fertilisers or through direct emissions. Some forest products are recycled, mostlypaper and paperboard to produce more paper, thus replacing virgin fibre. Recyclingalso provides a solution to the disposal of large quantities of paper, which otherwisewould release greenhouse gases during decay. Furthermore, incineration for energygeneration of discarded forest products and process wastes reduces the consumptionof fossil fuels for energy generation and thus the emissions of greenhouse gases. Thecarbon dioxide released during incineration is in turn absorbed by trees duringphotosynthesis and returned to the eco-cycle.
The forest products industry, including wood products and pulp and paper,participates to a low percentage in the total energy consumption. In 1998 wood, woodproducts and pulp and paper industry accounted for 12 per cent of total energyconsumption in the OECD countries (IEA). In Canada the pulp and paper industryaccounts for 12 per cent of the national energy consumption and contributes 4 percent of total Canadian carbon dioxide emissions (Vice, 2000). Using the Canadianratio it could be estimated that carbon dioxide emissions from the forest product sectoramounts to 4 per cent of world total industrial carbon dioxide emissions. Energyintensity of pulp and paper manufacturing (calculated as the ratio between totalprimary energy demand and production volume of pulp and paper) is 22 GJ/tonnecompared with 159 for aluminium, 9 for glass and 19 for steel among others.
The following is a summary of the activities taking place in the transformation ofwood into forest products. It is only intended to provide an understanding of thevarious processing steps, for more detailed information specialised literature shouldbe consulted.
7.3REVIEW OF FOREST
INDUSTRIES
CHAPTER 7—FOREST INDUSTRIES AND CLIMATE CHANGE 119
Product 1961 1970 1980 1990 1999
Sawnwood (million m3) 346 415 451 505 432Wood-based panels (million m3) 26 70 101 124 160Paper and paperboard (million tonnes) 77 126 170 240 317
Table 7.1Output of forest products,
1961–1999 (source: FAOSTAT)
120 MANAGEMENT STRATEGIES IN AGRICULTURE AND FORESTRY FOR MITIGATION OF GREENHOUSE GAS EMISSIONS AND
ADAPTATION TO CLIMATE VARIABILITY AND CLIMATE CHANGE
Forest industries rely on wood for their raw material, and thus are large consumers oftrees. Trees are extracted either from natural forests, an increasingly controversialand decreasing source of raw material, or from man-made plantations. Forestplantations are the equivalent of agricultural crops but with a longer rotation, sincetrees are harvested every 25 to 80 years depending on the species planted and onthe growing conditions. Considering the investments required in forest industries(pulp and paper mills cost many hundreds of millions of US dollars), the reliability,homogeneity and continuity of the raw material supply is foremost in commercialconsiderations. To this end, natural forests as well as plantations are increasinglymanaged on a sustainable basis which guarantees continuous raw material supply ona long-term basis. Plantation activities involve the use of heavy equipment for landclearing, soil preparation and planting of the young trees, which is an importantconsumer of fossil fuel.
Harvesting involves the cutting and extracting of trees from the forest. Harvestingoperations are managed and planned with great care to protect the remaining trees,to reduce wood losses and to minimise soil impact and erosion. Cutting can be doneeither manually (mostly with chainsaws) or mechanically with specially equippedtractors which cut, stack and transport trees to the roadside. Trees are extracted fromthe logging area and brought to the roadside for further transporting, by tractors oranimals depending on the nature of the terrain and on economic conditions. Onsome very steep slopes or on particularly fragile sites trees are extracted by helicopter,or with cable-yarding systems which have a very low environmental impact but highoperating and capital costs, and high fossil fuel consumption.
Raw materials (wood, wood residues, market pulp, recycled products and otherproducts such as chemicals, etc.) for forest industries need to be transported toproduction facilities and finished goods shipped to consumers. Transport systemsdiffer according to infrastructure, level of development of the country and respectivecost of transportation. Often a combination of means of transport is requiredtogether with the associated transhipment.
Forest products are quite diversified, ranging from sawnwood and lumber to finishedproducts such as furniture and housing items (doors, window frames, etc.), varioustypes of panels and the different grades of pulp and paper. In all operations, the firststep is to remove the bark from the trees. This requires the use of handlingequipment: tractors, cranes and conveyors and the operation of heavy debarkingequipment before log storage.
In the case of sawnwood, processing consists of sawing trees to pre-setdimensions, followed by wood preservation treatment for protection against fungaland insect attack, drying to ensure dimensional stability and, finally, finishing.
In the production of panels (such as fibreboard, medium density fibreboard –MDF etc.) and veneers, trees are either chipped to produce particle board,chipboard, etc., or peeled and sliced to produce veneers and plywood. Various resinsare added before the panel is formed in a press. Panels are then finished by sanding,trimming and surface treatments. Furniture and housing components are producedby further processing of sawnwood, timber and/or panels to give the requireddimensions, assembly qualities and resistance to the final products.
Pulp is produced from wood chips either through a mechanical or a chemicalprocess. During chemical pulping, lignin in the wood is dissolved in a digester wherethe wood chips are cooked in a chemical solution. The chemicals can be a mixtureof sodium hydroxide and sodium sulphide or sulphite. After pulping, the cookingliquor (black liquor) is first concentrated and then incinerated in a recovery boiler,recovering the chemicals and generating steam for the plant (pulp or paper drying)and to produce electricity in a steam turbine. In the mechanical pulping process,chemical pre-treatment is used to soften wood chips and reduce energy consumptionduring fibre separation operations. After various cleaning operations, the pulp can be
7.3.4PROCESSING
7.3.3TRANSPORT
7.3.2HARVESTING
7.3.1RAW MATERIAL SUPPLY
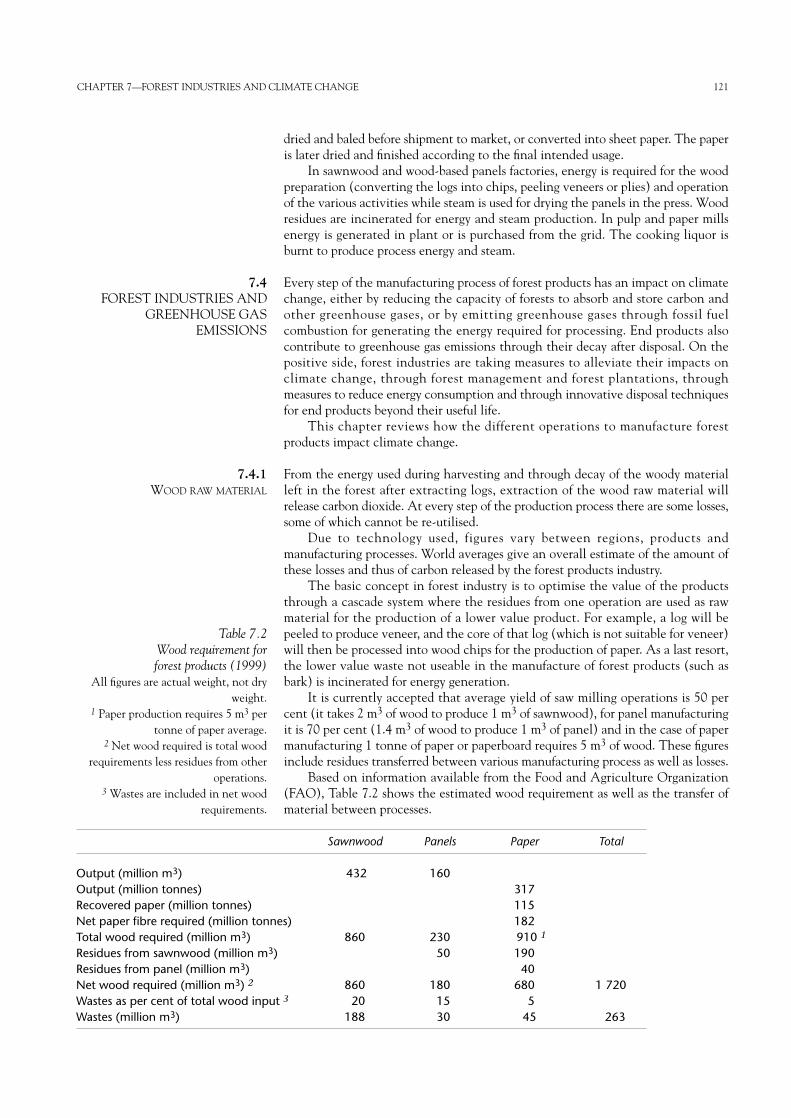
dried and baled before shipment to market, or converted into sheet paper. The paperis later dried and finished according to the final intended usage.
In sawnwood and wood-based panels factories, energy is required for the woodpreparation (converting the logs into chips, peeling veneers or plies) and operationof the various activities while steam is used for drying the panels in the press. Woodresidues are incinerated for energy and steam production. In pulp and paper millsenergy is generated in plant or is purchased from the grid. The cooking liquor isburnt to produce process energy and steam.
Every step of the manufacturing process of forest products has an impact on climatechange, either by reducing the capacity of forests to absorb and store carbon andother greenhouse gases, or by emitting greenhouse gases through fossil fuelcombustion for generating the energy required for processing. End products alsocontribute to greenhouse gas emissions through their decay after disposal. On thepositive side, forest industries are taking measures to alleviate their impacts onclimate change, through forest management and forest plantations, throughmeasures to reduce energy consumption and through innovative disposal techniquesfor end products beyond their useful life.
This chapter reviews how the different operations to manufacture forestproducts impact climate change.
From the energy used during harvesting and through decay of the woody materialleft in the forest after extracting logs, extraction of the wood raw material willrelease carbon dioxide. At every step of the production process there are some losses,some of which cannot be re-utilised.
Due to technology used, figures vary between regions, products andmanufacturing processes. World averages give an overall estimate of the amount ofthese losses and thus of carbon released by the forest products industry.
The basic concept in forest industry is to optimise the value of the productsthrough a cascade system where the residues from one operation are used as rawmaterial for the production of a lower value product. For example, a log will bepeeled to produce veneer, and the core of that log (which is not suitable for veneer)will then be processed into wood chips for the production of paper. As a last resort,the lower value waste not useable in the manufacture of forest products (such asbark) is incinerated for energy generation.
It is currently accepted that average yield of saw milling operations is 50 percent (it takes 2 m3 of wood to produce 1 m3 of sawnwood), for panel manufacturingit is 70 per cent (1.4 m3 of wood to produce 1 m3 of panel) and in the case of papermanufacturing 1 tonne of paper or paperboard requires 5 m3 of wood. These figuresinclude residues transferred between various manufacturing process as well as losses.
Based on information available from the Food and Agriculture Organization(FAO), Table 7.2 shows the estimated wood requirement as well as the transfer ofmaterial between processes.
7.4.1WOOD RAW MATERIAL
7.4FOREST INDUSTRIES AND
GREENHOUSE GASEMISSIONS
CHAPTER 7—FOREST INDUSTRIES AND CLIMATE CHANGE 121
Table 7.2Wood requirement for forest products (1999)
All figures are actual weight, not dryweight.
1 Paper production requires 5 m3 pertonne of paper average.
2 Net wood required is total woodrequirements less residues from other
operations.3 Wastes are included in net wood
requirements.
Sawnwood Panels Paper Total
Output (million m3) 432 160Output (million tonnes) 317Recovered paper (million tonnes) 115Net paper fibre required (million tonnes) 182Total wood required (million m3) 860 230 910 1
Residues from sawnwood (million m3) 50 190Residues from panel (million m3) 40Net wood required (million m3) 2 860 180 680 1 720Wastes as per cent of total wood input 3 20 15 5Wastes (million m3) 188 30 45 263
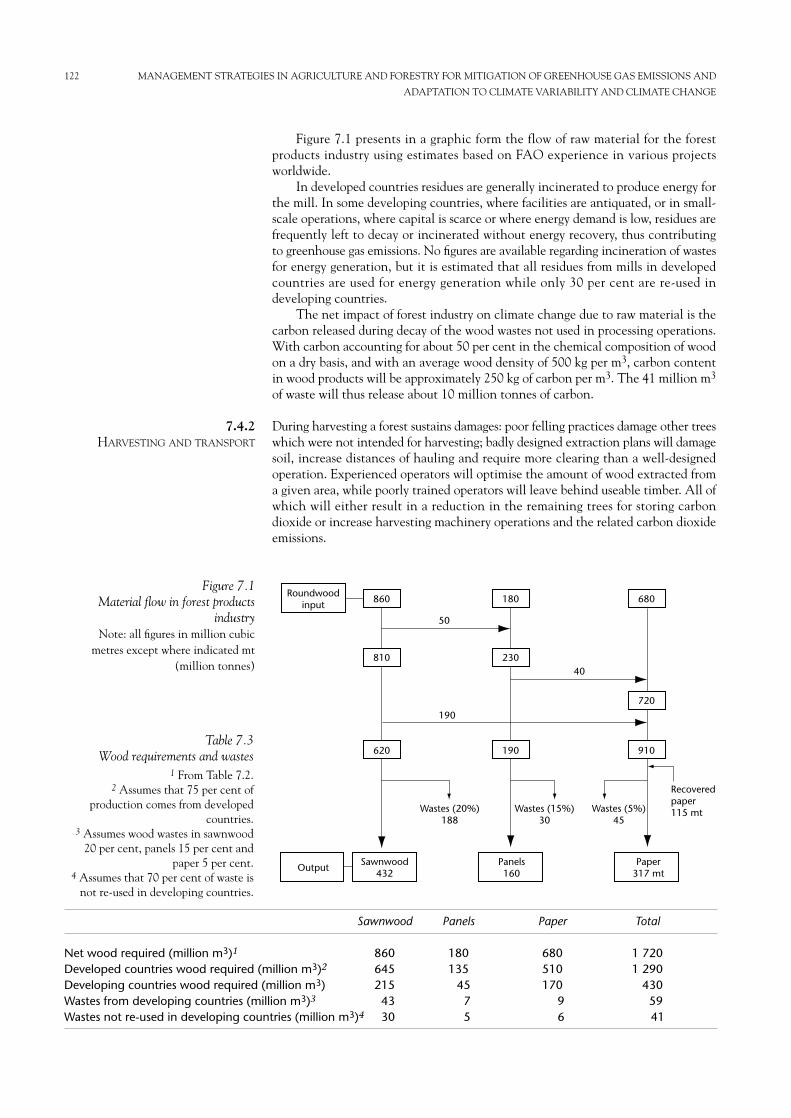
Figure 7.1 presents in a graphic form the flow of raw material for the forestproducts industry using estimates based on FAO experience in various projectsworldwide.
In developed countries residues are generally incinerated to produce energy forthe mill. In some developing countries, where facilities are antiquated, or in small-scale operations, where capital is scarce or where energy demand is low, residues arefrequently left to decay or incinerated without energy recovery, thus contributingto greenhouse gas emissions. No figures are available regarding incineration of wastesfor energy generation, but it is estimated that all residues from mills in developedcountries are used for energy generation while only 30 per cent are re-used indeveloping countries.
The net impact of forest industry on climate change due to raw material is thecarbon released during decay of the wood wastes not used in processing operations.With carbon accounting for about 50 per cent in the chemical composition of woodon a dry basis, and with an average wood density of 500 kg per m3, carbon contentin wood products will be approximately 250 kg of carbon per m3. The 41 million m3
of waste will thus release about 10 million tonnes of carbon.
During harvesting a forest sustains damages: poor felling practices damage other treeswhich were not intended for harvesting; badly designed extraction plans will damagesoil, increase distances of hauling and require more clearing than a well-designedoperation. Experienced operators will optimise the amount of wood extracted froma given area, while poorly trained operators will leave behind useable timber. All ofwhich will either result in a reduction in the remaining trees for storing carbondioxide or increase harvesting machinery operations and the related carbon dioxideemissions.
7.4.2HARVESTING AND TRANSPORT
122 MANAGEMENT STRATEGIES IN AGRICULTURE AND FORESTRY FOR MITIGATION OF GREENHOUSE GAS EMISSIONS AND
ADAPTATION TO CLIMATE VARIABILITY AND CLIMATE CHANGE
Roundwoodinput
OutputSawnwood
432Panels160
Paper317 mt
860
50
40810
190
620 190 910
720
680180
230
Wastes (20%)188
Wastes (15%)30
Wastes (5%)45
Recoveredpaper 115 mt
Figure 7.1Material flow in forest products
industryNote: all figures in million cubic
metres except where indicated mt(million tonnes)
Sawnwood Panels Paper Total
Net wood required (million m3)1 860 180 680 1 720Developed countries wood required (million m3)2 645 135 510 1 290Developing countries wood required (million m3) 215 45 170 430Wastes from developing countries (million m3)3 43 7 9 59Wastes not re-used in developing countries (million m3)4 30 5 6 41
Table 7.3Wood requirements and wastes
1 From Table 7.2.2 Assumes that 75 per cent of
production comes from developedcountries.
3 Assumes wood wastes in sawnwood20 per cent, panels 15 per cent and
paper 5 per cent.4 Assumes that 70 per cent of waste is
not re-used in developing countries.
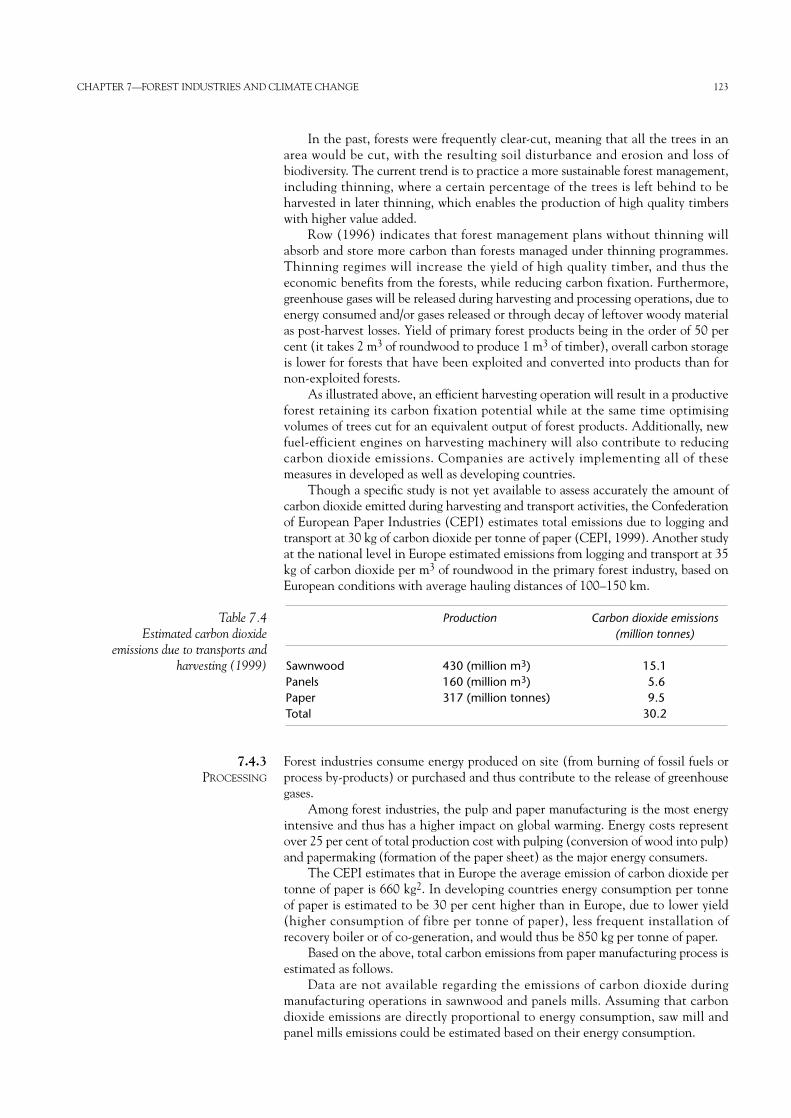
In the past, forests were frequently clear-cut, meaning that all the trees in anarea would be cut, with the resulting soil disturbance and erosion and loss ofbiodiversity. The current trend is to practice a more sustainable forest management,including thinning, where a certain percentage of the trees is left behind to beharvested in later thinning, which enables the production of high quality timberswith higher value added.
Row (1996) indicates that forest management plans without thinning willabsorb and store more carbon than forests managed under thinning programmes.Thinning regimes will increase the yield of high quality timber, and thus theeconomic benefits from the forests, while reducing carbon fixation. Furthermore,greenhouse gases will be released during harvesting and processing operations, due toenergy consumed and/or gases released or through decay of leftover woody materialas post-harvest losses. Yield of primary forest products being in the order of 50 percent (it takes 2 m3 of roundwood to produce 1 m3 of timber), overall carbon storageis lower for forests that have been exploited and converted into products than fornon-exploited forests.
As illustrated above, an efficient harvesting operation will result in a productiveforest retaining its carbon fixation potential while at the same time optimisingvolumes of trees cut for an equivalent output of forest products. Additionally, newfuel-efficient engines on harvesting machinery will also contribute to reducingcarbon dioxide emissions. Companies are actively implementing all of thesemeasures in developed as well as developing countries.
Though a specific study is not yet available to assess accurately the amount ofcarbon dioxide emitted during harvesting and transport activities, the Confederationof European Paper Industries (CEPI) estimates total emissions due to logging andtransport at 30 kg of carbon dioxide per tonne of paper (CEPI, 1999). Another studyat the national level in Europe estimated emissions from logging and transport at 35kg of carbon dioxide per m3 of roundwood in the primary forest industry, based onEuropean conditions with average hauling distances of 100–150 km.
Forest industries consume energy produced on site (from burning of fossil fuels orprocess by-products) or purchased and thus contribute to the release of greenhousegases.
Among forest industries, the pulp and paper manufacturing is the most energyintensive and thus has a higher impact on global warming. Energy costs representover 25 per cent of total production cost with pulping (conversion of wood into pulp)and papermaking (formation of the paper sheet) as the major energy consumers.
The CEPI estimates that in Europe the average emission of carbon dioxide pertonne of paper is 660 kg2. In developing countries energy consumption per tonneof paper is estimated to be 30 per cent higher than in Europe, due to lower yield(higher consumption of fibre per tonne of paper), less frequent installation ofrecovery boiler or of co-generation, and would thus be 850 kg per tonne of paper.
Based on the above, total carbon emissions from paper manufacturing process isestimated as follows.
Data are not available regarding the emissions of carbon dioxide duringmanufacturing operations in sawnwood and panels mills. Assuming that carbondioxide emissions are directly proportional to energy consumption, saw mill andpanel mills emissions could be estimated based on their energy consumption.
7.4.3 PROCESSING
CHAPTER 7—FOREST INDUSTRIES AND CLIMATE CHANGE 123
Table 7.4Estimated carbon dioxide
emissions due to transports andharvesting (1999)
Production Carbon dioxide emissions (million tonnes)
Sawnwood 430 (million m3) 15.1Panels 160 (million m3) 5.6Paper 317 (million tonnes) 9.5Total 30.2
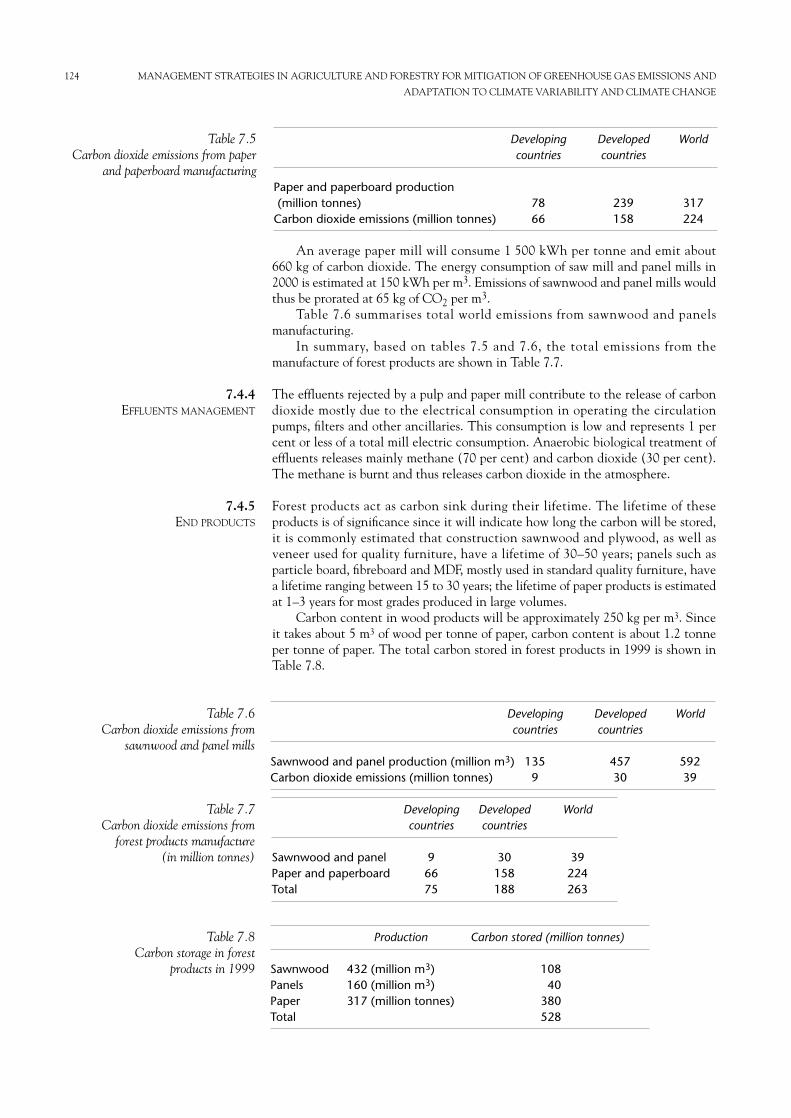
An average paper mill will consume 1 500 kWh per tonne and emit about660 kg of carbon dioxide. The energy consumption of saw mill and panel mills in2000 is estimated at 150 kWh per m3. Emissions of sawnwood and panel mills wouldthus be prorated at 65 kg of CO2 per m3.
Table 7.6 summarises total world emissions from sawnwood and panelsmanufacturing.
In summary, based on tables 7.5 and 7.6, the total emissions from themanufacture of forest products are shown in Table 7.7.
The effluents rejected by a pulp and paper mill contribute to the release of carbondioxide mostly due to the electrical consumption in operating the circulationpumps, filters and other ancillaries. This consumption is low and represents 1 percent or less of a total mill electric consumption. Anaerobic biological treatment ofeffluents releases mainly methane (70 per cent) and carbon dioxide (30 per cent).The methane is burnt and thus releases carbon dioxide in the atmosphere.
Forest products act as carbon sink during their lifetime. The lifetime of theseproducts is of significance since it will indicate how long the carbon will be stored,it is commonly estimated that construction sawnwood and plywood, as well asveneer used for quality furniture, have a lifetime of 30–50 years; panels such asparticle board, fibreboard and MDF, mostly used in standard quality furniture, havea lifetime ranging between 15 to 30 years; the lifetime of paper products is estimatedat 1–3 years for most grades produced in large volumes.
Carbon content in wood products will be approximately 250 kg per m3. Since it takes about 5 m3 of wood per tonne of paper, carbon content is about 1.2 tonneper tonne of paper. The total carbon stored in forest products in 1999 is shown inTable 7.8.
7.4.5END PRODUCTS
7.4.4EFFLUENTS MANAGEMENT
124 MANAGEMENT STRATEGIES IN AGRICULTURE AND FORESTRY FOR MITIGATION OF GREENHOUSE GAS EMISSIONS AND
ADAPTATION TO CLIMATE VARIABILITY AND CLIMATE CHANGE
Table 7.5Carbon dioxide emissions from paper
and paperboard manufacturing
Developing Developed Worldcountries countries
Paper and paperboard production(million tonnes) 78 239 317
Carbon dioxide emissions (million tonnes) 66 158 224
Table 7.6Carbon dioxide emissions from
sawnwood and panel mills
Table 7.7Carbon dioxide emissions from
forest products manufacture (in million tonnes)
Developing Developed Worldcountries countries
Sawnwood and panel production (million m3) 135 457 592Carbon dioxide emissions (million tonnes) 9 30 39
Developing Developed Worldcountries countries
Sawnwood and panel 9 30 39Paper and paperboard 66 158 224Total 75 188 263
Production Carbon stored (million tonnes)
Sawnwood 432 (million m3) 108Panels 160 (million m3) 40Paper 317 (million tonnes) 380Total 528
Table 7.8Carbon storage in forest
products in 1999
CHAPTER 7—FOREST INDUSTRIES AND CLIMATE CHANGE 125
The forest industry is applying practices to maintain the long-term sustainability offorest resources. Management practices include the efficient and sustainablemanagement of forests through minimal impact harvesting and plantationprogrammes to ensure continued supply of raw material. The managed exploitationof forests ensures that forests are maintained productively, minimises early death anddecay of trees, reduces fire hazards and optimises forest yield by maintaining a highnet annual increment. All of these factors play an important role in increasingcarbon fixation and reducing release of carbon dioxide during decay and fires. Forestmanagement also generates value and employment from forests and promotes theirconservation and management.
Some companies involved in forest products manufacturing have implementedfull-scale plantation programmes whether directly or indirectly in association withforest owners. Their objective is to ensure fibre supply that at the same time acts ascarbon sinks to absorb the emissions of greenhouse gases generated duringmanufacturing operations. For example, CEPI estimates that the average netsequestration in forests is approximately 3.1 tonnes of carbon dioxide per hectare offorest available for wood supply. It is further estimated that the amount of carbondioxide sequestered in managed forestlands corresponds to five times the carbondioxide emitted by the forest-based industry in 1977 (CEPI, 2000).
Efficient harvesting operations will result in a productive forest retaining its carbonfixation potential while at the same time optimising volumes of trees cut for anequivalent output of forest products. Additionally, new fuel-efficient engines onharvesting machinery will also contribute to reducing carbon dioxide emissions.Companies are actively implementing all of these measures in developed as well asdeveloping countries.
When deciding the location of their manufacturing facilities, forest industrycompanies will always try to minimise transport time and costs, thus resulting inlower shipping distances. When the companies own their transport fleet, normallytrucks, they choose the most efficient engines to minimise fuel costs. These twomeasures also contribute to a reduction in greenhouse gas emissions.
Co-generation, also called “combined heat and power” (CHP), is a way of reducingenergy consumption, while the use of biofuels as opposed to fossil fuels will reducethe emissions of greenhouse gases.
Co-generation (CHP) is the simultaneous generation of heat and electrical power ina cost-effective and environmentally responsible way. The process utilises thethermal output from the turbine exhaust – which accounts for 65–68 per cent of theoverall energy output of the generator sets – increasing the efficiency of thegenerator set dramatically and effectively reducing harmful pollutants. In industrialapplications the thermal output can be utilised in a variety of different ways, usuallyvia a boiler for steam generation, a water heater for hot water production, or theexhaust heat can be used for direct drying applications. The steam generated from aboiler can be re-injected into the gas turbine to boost electrical power output andreduce emissions. Alternatively, steam generated can be fed into a steam turbine toproduce further electrical output.
Traditional power stations only transform around 30–35 per cent of the energycontained in the fuel into electricity, most of the rest being wasted as heat or lost inthe process. CHP installations generate electricity on site allowing the heat fromthe exhaust to be utilised, giving an overall efficiency of around 80 per cent. This,coupled with the fact that the heat used for process steam production, is producedat negligible cost as a by-product of electricity generation can lead to energysavings of up to 50 per cent. CHP installations reduce dependence on importedenergy and improve environmental performance through reduced emissions.Industrial CHP plants can run on virtually any type of fuel including biogas andwastes.
7.5.3.1Combined heat and power
7.5.3PROCESSING
7.5.2HARVESTING AND TRANSPORT
7.5 MITIGATION MEASURES
7.5.1RAW MATERIALS
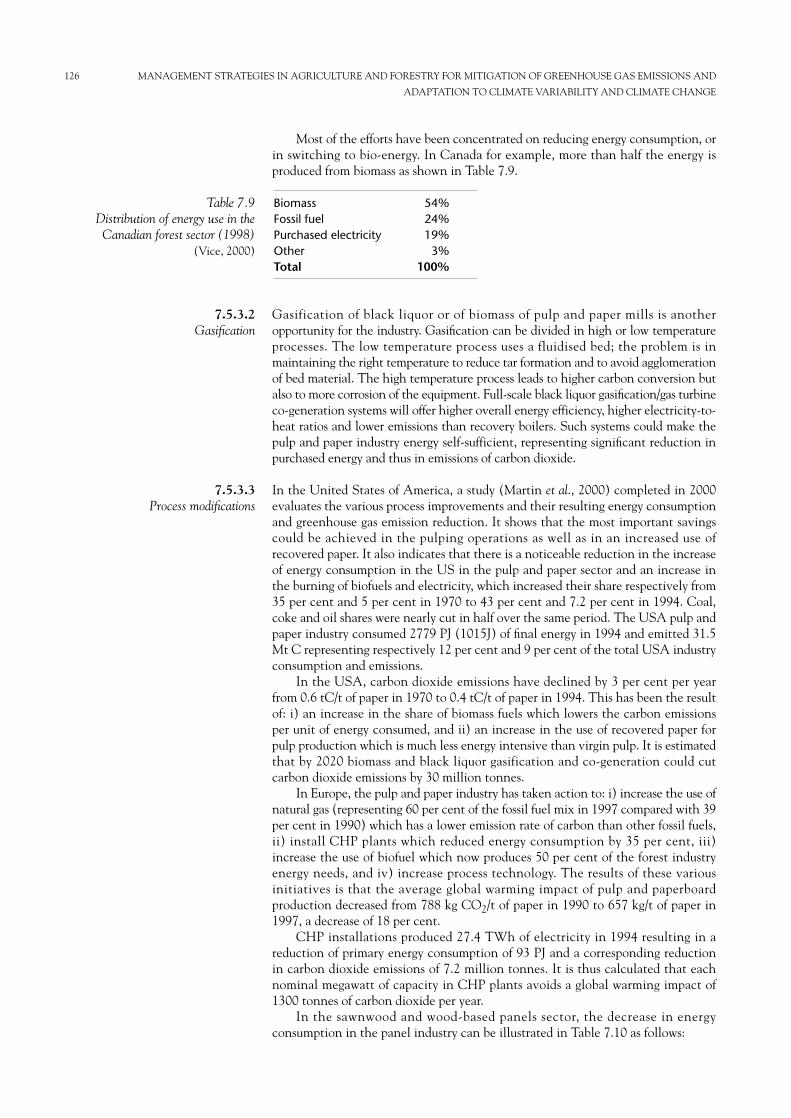
Most of the efforts have been concentrated on reducing energy consumption, orin switching to bio-energy. In Canada for example, more than half the energy isproduced from biomass as shown in Table 7.9.
Gasification of black liquor or of biomass of pulp and paper mills is anotheropportunity for the industry. Gasification can be divided in high or low temperatureprocesses. The low temperature process uses a fluidised bed; the problem is inmaintaining the right temperature to reduce tar formation and to avoid agglomerationof bed material. The high temperature process leads to higher carbon conversion butalso to more corrosion of the equipment. Full-scale black liquor gasification/gas turbineco-generation systems will offer higher overall energy efficiency, higher electricity-to-heat ratios and lower emissions than recovery boilers. Such systems could make thepulp and paper industry energy self-sufficient, representing significant reduction inpurchased energy and thus in emissions of carbon dioxide.
In the United States of America, a study (Martin et al., 2000) completed in 2000evaluates the various process improvements and their resulting energy consumptionand greenhouse gas emission reduction. It shows that the most important savingscould be achieved in the pulping operations as well as in an increased use ofrecovered paper. It also indicates that there is a noticeable reduction in the increaseof energy consumption in the US in the pulp and paper sector and an increase inthe burning of biofuels and electricity, which increased their share respectively from35 per cent and 5 per cent in 1970 to 43 per cent and 7.2 per cent in 1994. Coal,coke and oil shares were nearly cut in half over the same period. The USA pulp andpaper industry consumed 2779 PJ (1015J) of final energy in 1994 and emitted 31.5Mt C representing respectively 12 per cent and 9 per cent of the total USA industryconsumption and emissions.
In the USA, carbon dioxide emissions have declined by 3 per cent per yearfrom 0.6 tC/t of paper in 1970 to 0.4 tC/t of paper in 1994. This has been the resultof: i) an increase in the share of biomass fuels which lowers the carbon emissionsper unit of energy consumed, and ii) an increase in the use of recovered paper forpulp production which is much less energy intensive than virgin pulp. It is estimatedthat by 2020 biomass and black liquor gasification and co-generation could cutcarbon dioxide emissions by 30 million tonnes.
In Europe, the pulp and paper industry has taken action to: i) increase the use ofnatural gas (representing 60 per cent of the fossil fuel mix in 1997 compared with 39per cent in 1990) which has a lower emission rate of carbon than other fossil fuels,ii) install CHP plants which reduced energy consumption by 35 per cent, iii)increase the use of biofuel which now produces 50 per cent of the forest industryenergy needs, and iv) increase process technology. The results of these variousinitiatives is that the average global warming impact of pulp and paperboardproduction decreased from 788 kg CO2/t of paper in 1990 to 657 kg/t of paper in1997, a decrease of 18 per cent.
CHP installations produced 27.4 TWh of electricity in 1994 resulting in areduction of primary energy consumption of 93 PJ and a corresponding reductionin carbon dioxide emissions of 7.2 million tonnes. It is thus calculated that eachnominal megawatt of capacity in CHP plants avoids a global warming impact of1300 tonnes of carbon dioxide per year.
In the sawnwood and wood-based panels sector, the decrease in energyconsumption in the panel industry can be illustrated in Table 7.10 as follows:
7.5.3.3Process modifications
7.5.3.2Gasification
126 MANAGEMENT STRATEGIES IN AGRICULTURE AND FORESTRY FOR MITIGATION OF GREENHOUSE GAS EMISSIONS AND
ADAPTATION TO CLIMATE VARIABILITY AND CLIMATE CHANGE
Table 7.9 Distribution of energy use in theCanadian forest sector (1998)
(Vice, 2000)
Biomass 54%Fossil fuel 24%Purchased electricity 19%Other 3%Total 100%
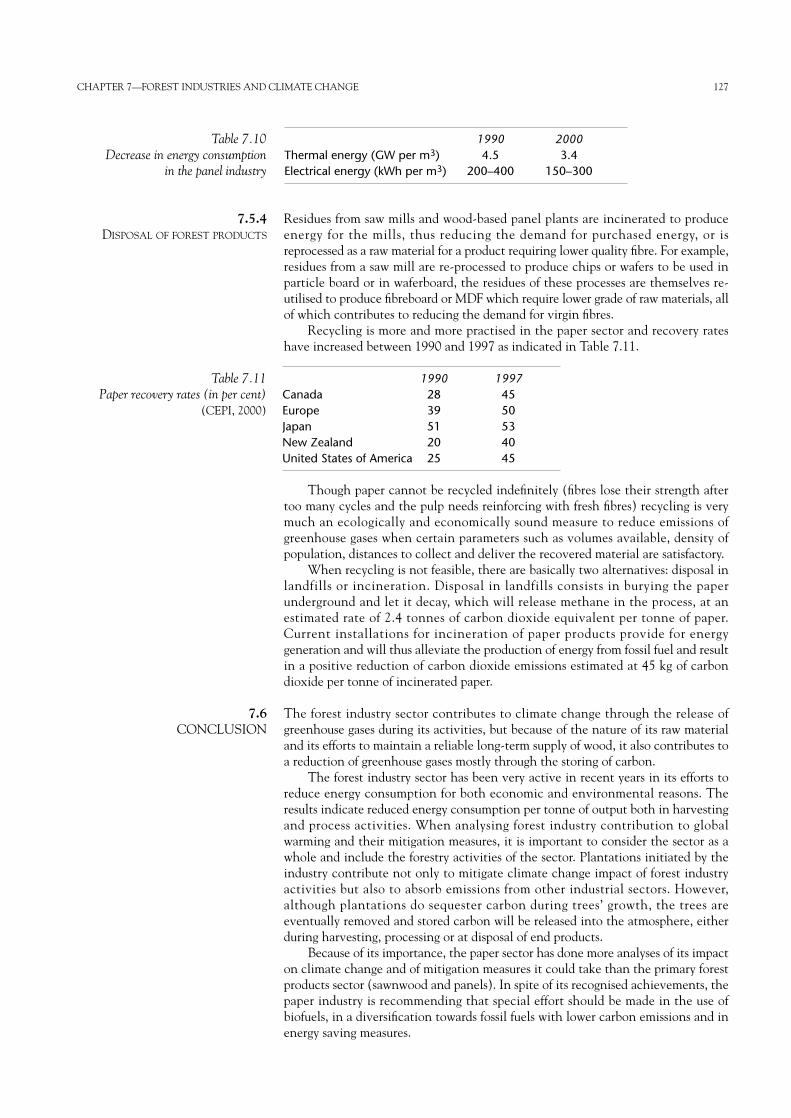
Residues from saw mills and wood-based panel plants are incinerated to produceenergy for the mills, thus reducing the demand for purchased energy, or isreprocessed as a raw material for a product requiring lower quality fibre. For example,residues from a saw mill are re-processed to produce chips or wafers to be used inparticle board or in waferboard, the residues of these processes are themselves re-utilised to produce fibreboard or MDF which require lower grade of raw materials, allof which contributes to reducing the demand for virgin fibres.
Recycling is more and more practised in the paper sector and recovery rateshave increased between 1990 and 1997 as indicated in Table 7.11.
Though paper cannot be recycled indefinitely (fibres lose their strength aftertoo many cycles and the pulp needs reinforcing with fresh fibres) recycling is verymuch an ecologically and economically sound measure to reduce emissions ofgreenhouse gases when certain parameters such as volumes available, density ofpopulation, distances to collect and deliver the recovered material are satisfactory.
When recycling is not feasible, there are basically two alternatives: disposal inlandfills or incineration. Disposal in landfills consists in burying the paperunderground and let it decay, which will release methane in the process, at anestimated rate of 2.4 tonnes of carbon dioxide equivalent per tonne of paper.Current installations for incineration of paper products provide for energygeneration and will thus alleviate the production of energy from fossil fuel and resultin a positive reduction of carbon dioxide emissions estimated at 45 kg of carbondioxide per tonne of incinerated paper.
The forest industry sector contributes to climate change through the release ofgreenhouse gases during its activities, but because of the nature of its raw materialand its efforts to maintain a reliable long-term supply of wood, it also contributes toa reduction of greenhouse gases mostly through the storing of carbon.
The forest industry sector has been very active in recent years in its efforts toreduce energy consumption for both economic and environmental reasons. Theresults indicate reduced energy consumption per tonne of output both in harvestingand process activities. When analysing forest industry contribution to globalwarming and their mitigation measures, it is important to consider the sector as awhole and include the forestry activities of the sector. Plantations initiated by theindustry contribute not only to mitigate climate change impact of forest industryactivities but also to absorb emissions from other industrial sectors. However,although plantations do sequester carbon during trees’ growth, the trees areeventually removed and stored carbon will be released into the atmosphere, eitherduring harvesting, processing or at disposal of end products.
Because of its importance, the paper sector has done more analyses of its impacton climate change and of mitigation measures it could take than the primary forestproducts sector (sawnwood and panels). In spite of its recognised achievements, thepaper industry is recommending that special effort should be made in the use ofbiofuels, in a diversification towards fossil fuels with lower carbon emissions and inenergy saving measures.
7.6CONCLUSION
7.5.4DISPOSAL OF FOREST PRODUCTS
CHAPTER 7—FOREST INDUSTRIES AND CLIMATE CHANGE 127
1990 2000Thermal energy (GW per m3) 4.5 3.4 Electrical energy (kWh per m3) 200–400 150–300
Table 7.10Decrease in energy consumption
in the panel industry
Table 7.11Paper recovery rates (in per cent)
(CEPI, 2000)
1990 1997Canada 28 45Europe 39 50Japan 51 53New Zealand 20 40United States of America 25 45
CHAPTER 8
THE IMPACT OF THE CONVERSION OF FORESTS INTOCROP AND RANGELANDS DUE TO HUMAN ANDLIVESTOCK POPULATION PRESSURE ON THE SOURCESAND SINKS OF CARBON AND GLOBAL WARMING (by Jens Mackensen)
During the last decade land use, land-use change and forestry gained attention beyondthe traditional range of natural resource managers. The impact of global climate changeand climate variability on natural ecosystems and their vulnerability refocused inter-national research and discussion. Possible adaptation and mitigating measures triggereda series of scenarios for natural resource management and ecosystem conservation.Carbon, making up a substantial part of plant biomass, has long been known for itsessential role especially in the fertility status of soils and as a regulating factor in soilwater content. However, recent discussions on the role of natural and managed ecosys-tems as sinks and sources of carbon dioxide put the functioning of carbon cycles interrestrial ecosystems into a new limelight of international research and policies.
During the last decade or so, a wide variety of studies were conducted andassessed to gain a better understanding of carbon dynamics in various ecosystemsand of abilities to monitor, account and verify activities relating to carbon pools.Two recent reports, which assess state-of-the-art information on carbon dynamicsin both, natural and managed ecosystems, summarise present knowledge andquantify carbon stocks and fluxes on a global as well as on an ecosystem level. TheGerman Advisory Council on Global Change, the WBGU, released in 1998 apublication on biological sinks and sources and the IPCC released in 2000 a specialreport on land use, land-use change and forestry. Both reports draw on a wealth ofscientific information and therefore form the main base for this review.
The revised IPCC guidelines for national greenhouse gas inventories (1997)state that on the global scale the most relevant land-use changes and managementpractices that result in carbon emissions and uptake include: i) forest and grasslandconversion, ii) changes in forest and other woody biomass stocks, and iii) theabandonment of managed land. This review paper will concentrate specifically oncarbon losses relating to forest conversion and changes in forest stocks due tomanagement changes. The IPCC guidelines (1997) also point out that calculationson emissions from land-use change and forestry especially on a global or regionalscale exhibit inherently large uncertainties or errors.
According to the FAO summary report on Global Forest Resources Assessment2000, (FAO 2000) the global deforestation rate averaged 9 million ha yr-1 duringthe 1990s. Deforestation further continued in tropical latitudes, while the totalforest area in higher latitudes increased. The tropics lost 13.5 million ha of naturalforest each year, while during the same period tropical forest plantations grew by1.8 million ha yr-1 and tropical secondary forest was estimated to have regeneratedat a rate of 1 million ha yr-1. Total forest area in China, Europe and USA (and someother countries such as India, Algeria, Bangladesh) increased by 18, 9 and 4 millionha respectively. The FAO assessment report (2000) states that the globaldeforestation rate decreased by 20 per cent as compared with the first half of thedecade. This change, however, is mainly due to the rapid establishment of industrialtree plantations (about 3 million ha yr-1), while the deforestation rate of naturalforests is considered to have continuously declined (see WRI and WWF, 2001).
Future trends for deforestation remain difficult to determine. Given a stillincreasing world population (of up to 9 billion people in 2050) and assuming thatpast trends continue it might be expected that an additional 10 billion ha of naturalecosystems will be converted into agricultural land by 2050.
8.2THE EXTENT OF GLOBAL
DEFORESTATION ANDFUTURE NEEDS FOR
AGRICULTURAL LAND
8.1INTRODUCTION
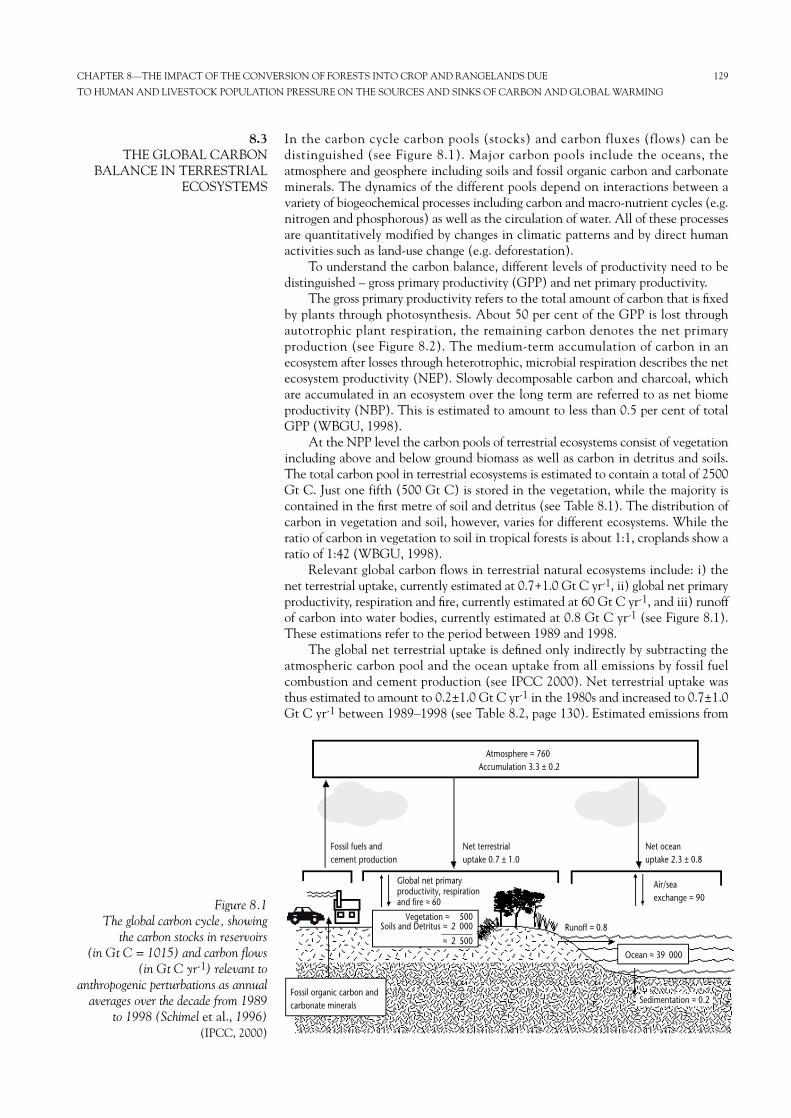
CHAPTER 8—THE IMPACT OF THE CONVERSION OF FORESTS INTO CROP AND RANGELANDS DUE 129
TO HUMAN AND LIVESTOCK POPULATION PRESSURE ON THE SOURCES AND SINKS OF CARBON AND GLOBAL WARMING
In the carbon cycle carbon pools (stocks) and carbon fluxes (flows) can bedistinguished (see Figure 8.1). Major carbon pools include the oceans, theatmosphere and geosphere including soils and fossil organic carbon and carbonateminerals. The dynamics of the different pools depend on interactions between avariety of biogeochemical processes including carbon and macro-nutrient cycles (e.g.nitrogen and phosphorous) as well as the circulation of water. All of these processesare quantitatively modified by changes in climatic patterns and by direct humanactivities such as land-use change (e.g. deforestation).
To understand the carbon balance, different levels of productivity need to bedistinguished – gross primary productivity (GPP) and net primary productivity.
The gross primary productivity refers to the total amount of carbon that is fixedby plants through photosynthesis. About 50 per cent of the GPP is lost throughautotrophic plant respiration, the remaining carbon denotes the net primaryproduction (see Figure 8.2). The medium-term accumulation of carbon in anecosystem after losses through heterotrophic, microbial respiration describes the netecosystem productivity (NEP). Slowly decomposable carbon and charcoal, whichare accumulated in an ecosystem over the long term are referred to as net biomeproductivity (NBP). This is estimated to amount to less than 0.5 per cent of totalGPP (WBGU, 1998).
At the NPP level the carbon pools of terrestrial ecosystems consist of vegetationincluding above and below ground biomass as well as carbon in detritus and soils.The total carbon pool in terrestrial ecosystems is estimated to contain a total of 2500Gt C. Just one fifth (500 Gt C) is stored in the vegetation, while the majority iscontained in the first metre of soil and detritus (see Table 8.1). The distribution ofcarbon in vegetation and soil, however, varies for different ecosystems. While theratio of carbon in vegetation to soil in tropical forests is about 1:1, croplands show aratio of 1:42 (WBGU, 1998).
Relevant global carbon flows in terrestrial natural ecosystems include: i) thenet terrestrial uptake, currently estimated at 0.7+1.0 Gt C yr-1, ii) global net primaryproductivity, respiration and fire, currently estimated at 60 Gt C yr-1, and iii) runoffof carbon into water bodies, currently estimated at 0.8 Gt C yr-1 (see Figure 8.1).These estimations refer to the period between 1989 and 1998.
The global net terrestrial uptake is defined only indirectly by subtracting theatmospheric carbon pool and the ocean uptake from all emissions by fossil fuelcombustion and cement production (see IPCC 2000). Net terrestrial uptake wasthus estimated to amount to 0.2±1.0 Gt C yr-1 in the 1980s and increased to 0.7±1.0Gt C yr-1 between 1989–1998 (see Table 8.2, page 130). Estimated emissions from
8.3THE GLOBAL CARBON
BALANCE IN TERRESTRIALECOSYSTEMS
Atmosphere ≈ 760 Accumulation 3.3 ± 0.2
Fossil fuels and cement production
Net terrestrial uptake 0.7 ± 1.0
Net oceanuptake 2.3 ± 0.8
Air/sea exchange ≈ 90
Ocean ≈ 39 000
Sedimentation ≈ 0.2
Runoff ≈ 0.8
Fossil organic carbon andcarbonate minerals
Vegetation ≈ 500Soils and Detritus ≈ 2 000
≈ 2 500
Global net primaryproductivity, respiration and fire ≈ 60 Figure 8.1
The global carbon cycle, showing the carbon stocks in reservoirs
(in Gt C = 1015) and carbon flows(in Gt C yr-1) relevant to
anthropogenic perturbations as annualaverages over the decade from 1989
to 1998 (Schimel et al., 1996)(IPCC, 2000)
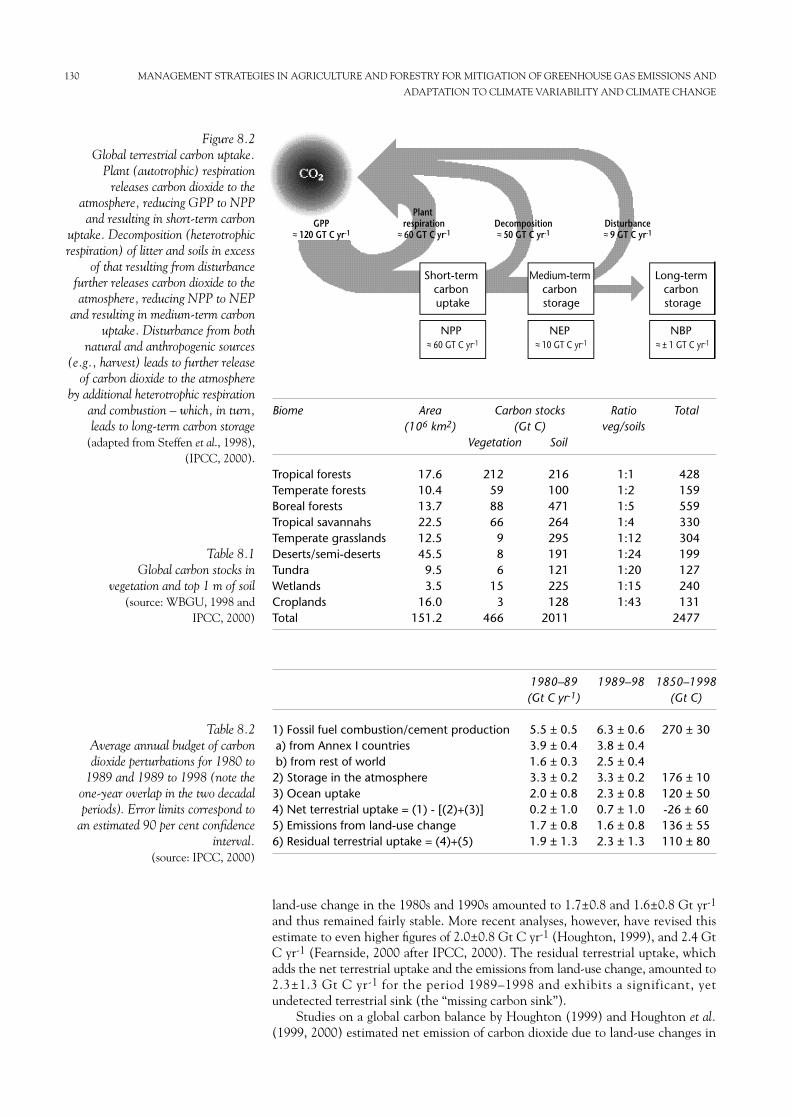
land-use change in the 1980s and 1990s amounted to 1.7±0.8 and 1.6±0.8 Gt yr-1
and thus remained fairly stable. More recent analyses, however, have revised thisestimate to even higher figures of 2.0±0.8 Gt C yr-1 (Houghton, 1999), and 2.4 GtC yr-1 (Fearnside, 2000 after IPCC, 2000). The residual terrestrial uptake, whichadds the net terrestrial uptake and the emissions from land-use change, amounted to2.3±1.3 Gt C yr-1 for the period 1989–1998 and exhibits a significant, yetundetected terrestrial sink (the “missing carbon sink”).
Studies on a global carbon balance by Houghton (1999) and Houghton et al.(1999, 2000) estimated net emission of carbon dioxide due to land-use changes in
130 MANAGEMENT STRATEGIES IN AGRICULTURE AND FORESTRY FOR MITIGATION OF GREENHOUSE GAS EMISSIONS AND
ADAPTATION TO CLIMATE VARIABILITY AND CLIMATE CHANGE
Short-term carbon uptake
Medium-term carbon storage
NPP ≈ 60 GT C yr-1
NEP ≈ 10 GT C yr-1
Long-term carbon storage
NBP ≈ ± 1 GT C yr-1
GPP≈ 120 GT C yr-1
Plant respiration
≈ 60 GT C yr-1Decomposition≈ 50 GT C yr-1
Disturbance≈ 9 GT C yr-1
Figure 8.2Global terrestrial carbon uptake.
Plant (autotrophic) respirationreleases carbon dioxide to the
atmosphere, reducing GPP to NPPand resulting in short-term carbon
uptake. Decomposition (heterotrophicrespiration) of litter and soils in excess
of that resulting from disturbancefurther releases carbon dioxide to theatmosphere, reducing NPP to NEP
and resulting in medium-term carbonuptake. Disturbance from both
natural and anthropogenic sources(e.g., harvest) leads to further release
of carbon dioxide to the atmosphereby additional heterotrophic respiration
and combustion – which, in turn,leads to long-term carbon storage
(adapted from Steffen et al., 1998),(IPCC, 2000).
Biome Area Carbon stocks Ratio Total(106 km2) (Gt C) veg/soils
Vegetation Soil
Tropical forests 17.6 212 216 1:1 428Temperate forests 10.4 59 100 1:2 159Boreal forests 13.7 88 471 1:5 559Tropical savannahs 22.5 66 264 1:4 330Temperate grasslands 12.5 9 295 1:12 304Deserts/semi-deserts 45.5 8 191 1:24 199Tundra 9.5 6 121 1:20 127Wetlands 3.5 15 225 1:15 240Croplands 16.0 3 128 1:43 131Total 151.2 466 2011 2477
Table 8.1Global carbon stocks in
vegetation and top 1 m of soil(source: WBGU, 1998 and
IPCC, 2000)
Table 8.2Average annual budget of carbondioxide perturbations for 1980 to
1989 and 1989 to 1998 (note theone-year overlap in the two decadalperiods). Error limits correspond to
an estimated 90 per cent confidenceinterval.
(source: IPCC, 2000)
1980–89 1989–98 1850–1998(Gt C yr-1) (Gt C)
1) Fossil fuel combustion/cement production 5.5 ± 0.5 6.3 ± 0.6 270 ± 30a) from Annex I countries 3.9 ± 0.4 3.8 ± 0.4b) from rest of world 1.6 ± 0.3 2.5 ± 0.42) Storage in the atmosphere 3.3 ± 0.2 3.3 ± 0.2 176 ± 103) Ocean uptake 2.0 ± 0.8 2.3 ± 0.8 120 ± 504) Net terrestrial uptake = (1) - [(2)+(3)] 0.2 ± 1.0 0.7 ± 1.0 -26 ± 605) Emissions from land-use change 1.7 ± 0.8 1.6 ± 0.8 136 ± 556) Residual terrestrial uptake = (4)+(5) 1.9 ± 1.3 2.3 ± 1.3 110 ± 80
general (referring to the above types of land-use change) from 1850–1998 to amountto 136±55 Gt C (see Table 8.2) plus an estimated 60 Gt C prior to 1850 (De Fries etal., 1999). For comparison, the global carbon dioxide emissions due to fossil fuelcombustion and cement production during 1850–1998 were estimated to amountto 270±30 Gt C (see IPCC, 2000). Carbon emissions due to land-use change,mainly from forests into other land use types, therefore account for approximately 33per cent of all global anthropogenic carbon emission in the given period (see IPCC,2000).
The uncertainty ranges associated with the above estimates are relatively large.The inter-annual and decadal variability results from technical limitations inmonitoring accurately gradual changes in the global carbon balance as influencedby constant anthropogenic interference. Also naturally occurring variations in theatmospheric carbon dioxide growth rate, the ocean uptake and the interrelationbetween the terrestrial biosphere and climate variability contribute to the givenuncertainties. In particular, the response of terrestrial ecosystems to climaticvariability is until now not well understood (IPCC, 2000).
Land-use change in most cases implies a change in land cover. Houghton (1991)identifies a total of seven types of land-use change which are relevant for changesin carbon stocks:• Conversion of natural ecosystems to permanent croplands;• Conversion of natural ecosystems to shifting cultivation;• Conversion of natural ecosystems to pasture;• Abandonment of croplands;• Abandonment of pastures;• Harvest of timber; and• Establishment of tree plantations (and secondary forests).
The last two, in relation to the temporal scope of assessment, can also beconsidered a land-use practice rather than land-use change (after IPCC, 2000).
A typical time-evolution of changes in carbon stocks following conversion offorests into: i) managed forest stands and ii) permanent agriculture is illustrated inFigure 8.3 (see page 132).
For both scenarios total carbon stocks on the site drop sharply after conversion.The biogeochemical processes related to these changes in carbon stock includeabove and below ground changes and are described in more detail below. Carbonstocks in the agricultural site will remain low, but will fluctuate due to variabilityand management type. Carbon stocks for a managed forest scenario also drop sharplyafter conversion, but increase over time according to the growth rate of thesubsequent stand. Total carbon stocks might eventually reach initial carbon stocks ina mature forest but might also remain significantly lower (see below). Exported forestproduct, as obtained from conversion, might retain a certain carbon stock, which isto be included for total carbon budgets. The life cycle of carbon in forest productsdepends on the specific product. Short-life span products include fuelwood, pulp andpaper products, where the half-life span is about four years. Medium and long-lifespan products such as sawn timber and plywood have half-life spans of 30–65 years(Pussinen et al., 1997, after IPCC, 2000).
Calculation of carbon losses from above ground biomass is technically relativelystraightforward. Losses occur through timber harvest, combustion losses(volatilisation and/or particle losses), respiration losses through duringdecomposition and leaching losses of dissolved carbon.
Timber harvest, depending on the forest type and management practices,accounts for a major proportion of carbon flow following forest conversion. Relativecarbon export through timber harvesting would be larger in temperate forests, wherewhole stands are often cut in one felling compared with tropical old-growth forest,where only a small percentage of above ground biomass is harvested. Thecombustion of residual forest slash is only common in a few forest management
8.4.1ABOVE GROUND CHANGES
8.4CARBON AND OTHER
GREENHOUSE GAS FLUXESFOLLOWING FOREST
CONVERSION ANDSUBSEQUENT
AGRICULTURALMANAGEMENT
CHAPTER 8—THE IMPACT OF THE CONVERSION OF FORESTS INTO CROP AND RANGELANDS DUE 131
TO HUMAN AND LIVESTOCK POPULATION PRESSURE ON THE SOURCES AND SINKS OF CARBON AND GLOBAL WARMING
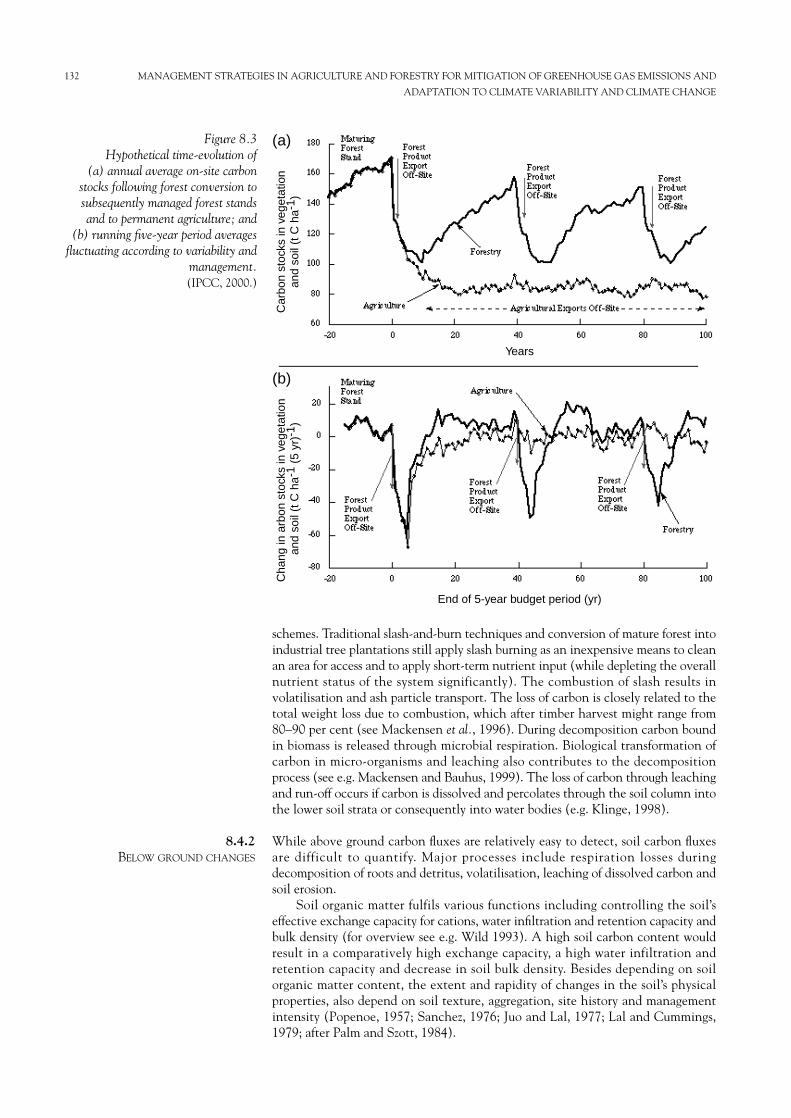
schemes. Traditional slash-and-burn techniques and conversion of mature forest intoindustrial tree plantations still apply slash burning as an inexpensive means to cleanan area for access and to apply short-term nutrient input (while depleting the overallnutrient status of the system significantly). The combustion of slash results involatilisation and ash particle transport. The loss of carbon is closely related to thetotal weight loss due to combustion, which after timber harvest might range from80–90 per cent (see Mackensen et al., 1996). During decomposition carbon boundin biomass is released through microbial respiration. Biological transformation ofcarbon in micro-organisms and leaching also contributes to the decompositionprocess (see e.g. Mackensen and Bauhus, 1999). The loss of carbon through leachingand run-off occurs if carbon is dissolved and percolates through the soil column intothe lower soil strata or consequently into water bodies (e.g. Klinge, 1998).
While above ground carbon fluxes are relatively easy to detect, soil carbon fluxesare difficult to quantify. Major processes include respiration losses duringdecomposition of roots and detritus, volatilisation, leaching of dissolved carbon andsoil erosion.
Soil organic matter fulfils various functions including controlling the soil’seffective exchange capacity for cations, water infiltration and retention capacity andbulk density (for overview see e.g. Wild 1993). A high soil carbon content wouldresult in a comparatively high exchange capacity, a high water infiltration andretention capacity and decrease in soil bulk density. Besides depending on soilorganic matter content, the extent and rapidity of changes in the soil’s physicalproperties, also depend on soil texture, aggregation, site history and managementintensity (Popenoe, 1957; Sanchez, 1976; Juo and Lal, 1977; Lal and Cummings,1979; after Palm and Szott, 1984).
8.4.2BELOW GROUND CHANGES
132 MANAGEMENT STRATEGIES IN AGRICULTURE AND FORESTRY FOR MITIGATION OF GREENHOUSE GAS EMISSIONS AND
ADAPTATION TO CLIMATE VARIABILITY AND CLIMATE CHANGE
(a)
Car
bon
stoc
ks in
veg
etat
ion
and
soil
(t C
ha-
1 )
(b)
Cha
ng in
arb
on s
tock
s in
veg
etat
ion
and
soil
(t C
ha-
1 (5
yr)
-1)
Years
End of 5-year budget period (yr)
Figure 8.3Hypothetical time-evolution of
(a) annual average on-site carbonstocks following forest conversion tosubsequently managed forest standsand to permanent agriculture; and
(b) running five-year period averagesfluctuating according to variability and
management. (IPCC, 2000.)
Soil carbon has different turnover times. Labile soil carbon pools, such as themicrobial biomass, has turnover times of a few weeks, while moderate soil carbonpools, such as particulate organic matter has turnover times of up to 20 years. Passivesoil carbon pools, including chemically sequestered intra-microaggregated carbon,which contributes 20–40 per cent of all organic matter in soils, has turnover times ofup to 3000 years (Jastrow and Miller, 1997, after Batjes, 1999). Differences in turnovertimes are relevant for assessing system responses to, for example, forest conversion.
Cultivation of previously untilled (forest) soils results in release of carbon intothe atmosphere as a result of enhanced decomposition (Houghton et al., 1993;Davidson and Ackerman, 1993). Estimations of soil carbon loss range between20–40 per cent. Veldkamp (1998) reports carbon losses of as low as 5 per cent in thefirst 20 cm of mainly tropical ulti- and oxisols in the Amazon. Veldkamp (1998) alsoreviewed studies, which found gains in soil organic carbon following pastureestablishment (e.g. Brown and Lugo, 1990b; Chone et al., 1994; Feigl et al., 1995;Neill et al., 1996) and concludes that the direction and magnitude of changes in soilcarbon depend on the initial carbon inventory of forest soils. According toVeldkamp (1998) soil carbon would decrease in the first 20 cm if the initial value isgreater than 5 kg m-2, while it would increase in soils having a higher soil inventory.
Sampled soil depth in which these losses occur are in most studies confined to amaximum of 1.5 m, however, other studies (e.g. Trumbore et al., 1995) indicate that(on tropical ulti- and oxisols sites) losses below 1 m soil depth may be of the samemagnitude as in the topsoil. Losses occur within the first few years (five years) afterconversion.
A new carbon equilibrium of tilled (agricultural) systems is thought to need upto 20 years and longer to develop. A new equilibrium state is also likely to be onpartly significantly lower levels compared with previous system levels, since thecarbon input by any subsequent systems will be lower compared with old-growthforests (Buschbacher et al., 1988; Uhl et al., 1988). This is accompanied by the factthat converted forest sites often have lower nutrient supply levels as nutrients arelost through harvesting, leaching and combustion (see Klinge, 1998; Hölscher et al.,1997b; Aweto, 1981; Werner, 1984; Scott, 1987).
Veldkamp (1998) shows that the annual rate of relative loss of C3 plantsdecreases over the first 25–40 years and may stay stable for up to 80 years. The gainof grass-derived C4 plants decreases over the first 25–40 years and remains stable ona low level (less than 1 per cent per annum).
Earlier reviews suffered from insufficient information on soil bulk density,sample depth etc. (Davidson and Ackerman, 1993). Fixed depth sampling tends tounderestimate carbon loss. Traditional estimates based on the changes in soil carbonconcentration tend to overestimate total carbon changes if compared with soilcarbon inventories, which would involve consideration of the changes in soil bulkdensity (Veldkamp, 1998). Studies which include the stable isotope 13C in order todistinguish between forest (C3) derived and tropical grass (C4) derived soil carbon(e.g. Balesdent et al., 1987) increased insight into carbon dynamics following forestconversion.
The review by Davidson and Ackerman (1993) did not confirm earlierhypotheses by Mann (1986) that the fraction of soil carbon inventory lost ispositively correlated with the total amount of carbon initially present.
Quantitative information on carbon loss through soil erosion is scarce. Erosionis a well quantified parameter indicating severity of forest conversion. Erosion ratesduring the conversion of tropical forests may range from 1 to 183 t ha-1 yr-1 with anaverage value of 50 t ha-1 yr-1 (Wiersum, 1984). Given a conservative carboncontent in tropical topsoils of 2 per cent, estimated loss of soil carbon would amountup to 3.7 t ha-1 yr-1. Morphological features that are prone to erosion include upperslope positions, summits and ridges. While short-distance transport of sediments,e.g. from an upper to a base slope position will only shift carbon content within agiven site, large-range transport of organic material is a significant carbon flow,which is of the same magnitude as net terrestrial carbon uptake (see Figure 8.1).
CHAPTER 8—THE IMPACT OF THE CONVERSION OF FORESTS INTO CROP AND RANGELANDS DUE 133
TO HUMAN AND LIVESTOCK POPULATION PRESSURE ON THE SOURCES AND SINKS OF CARBON AND GLOBAL WARMING
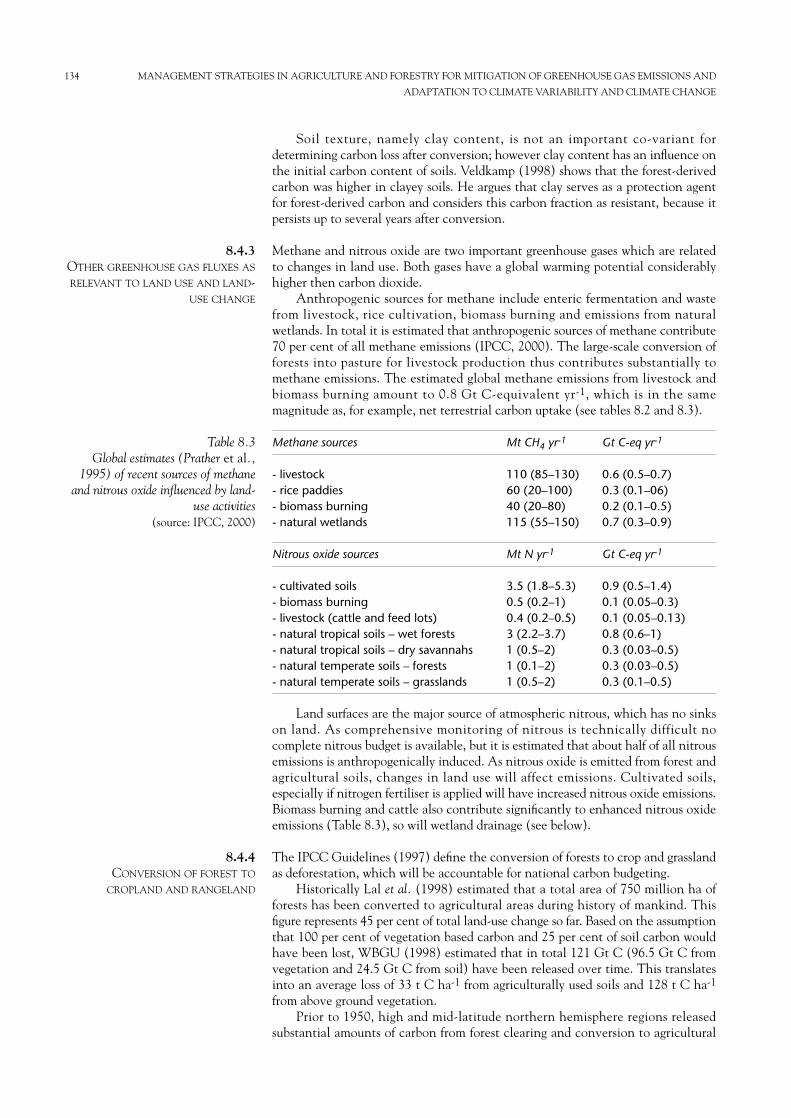
Soil texture, namely clay content, is not an important co-variant fordetermining carbon loss after conversion; however clay content has an influence onthe initial carbon content of soils. Veldkamp (1998) shows that the forest-derivedcarbon was higher in clayey soils. He argues that clay serves as a protection agentfor forest-derived carbon and considers this carbon fraction as resistant, because itpersists up to several years after conversion.
Methane and nitrous oxide are two important greenhouse gases which are relatedto changes in land use. Both gases have a global warming potential considerablyhigher then carbon dioxide.
Anthropogenic sources for methane include enteric fermentation and wastefrom livestock, rice cultivation, biomass burning and emissions from naturalwetlands. In total it is estimated that anthropogenic sources of methane contribute70 per cent of all methane emissions (IPCC, 2000). The large-scale conversion offorests into pasture for livestock production thus contributes substantially tomethane emissions. The estimated global methane emissions from livestock andbiomass burning amount to 0.8 Gt C-equivalent yr-1, which is in the samemagnitude as, for example, net terrestrial carbon uptake (see tables 8.2 and 8.3).
Land surfaces are the major source of atmospheric nitrous, which has no sinkson land. As comprehensive monitoring of nitrous is technically difficult nocomplete nitrous budget is available, but it is estimated that about half of all nitrousemissions is anthropogenically induced. As nitrous oxide is emitted from forest andagricultural soils, changes in land use will affect emissions. Cultivated soils,especially if nitrogen fertiliser is applied will have increased nitrous oxide emissions.Biomass burning and cattle also contribute significantly to enhanced nitrous oxideemissions (Table 8.3), so will wetland drainage (see below).
The IPCC Guidelines (1997) define the conversion of forests to crop and grasslandas deforestation, which will be accountable for national carbon budgeting.
Historically Lal et al. (1998) estimated that a total area of 750 million ha offorests has been converted to agricultural areas during history of mankind. Thisfigure represents 45 per cent of total land-use change so far. Based on the assumptionthat 100 per cent of vegetation based carbon and 25 per cent of soil carbon wouldhave been lost, WBGU (1998) estimated that in total 121 Gt C (96.5 Gt C fromvegetation and 24.5 Gt C from soil) have been released over time. This translatesinto an average loss of 33 t C ha-1 from agriculturally used soils and 128 t C ha-1
from above ground vegetation. Prior to 1950, high and mid-latitude northern hemisphere regions released
substantial amounts of carbon from forest clearing and conversion to agricultural
8.4.4CONVERSION OF FOREST TO
CROPLAND AND RANGELAND
8.4.3OTHER GREENHOUSE GAS FLUXES AS
RELEVANT TO LAND USE AND LAND-USE CHANGE
134 MANAGEMENT STRATEGIES IN AGRICULTURE AND FORESTRY FOR MITIGATION OF GREENHOUSE GAS EMISSIONS AND
ADAPTATION TO CLIMATE VARIABILITY AND CLIMATE CHANGE
Table 8.3Global estimates (Prather et al.,
1995) of recent sources of methaneand nitrous oxide influenced by land-
use activities(source: IPCC, 2000)
Methane sources Mt CH4 yr-1 Gt C-eq yr-1
- livestock 110 (85–130) 0.6 (0.5–0.7)- rice paddies 60 (20–100) 0.3 (0.1–06)- biomass burning 40 (20–80) 0.2 (0.1–0.5)- natural wetlands 115 (55–150) 0.7 (0.3–0.9)
Nitrous oxide sources Mt N yr-1 Gt C-eq yr-1
- cultivated soils 3.5 (1.8–5.3) 0.9 (0.5–1.4)- biomass burning 0.5 (0.2–1) 0.1 (0.05–0.3)- livestock (cattle and feed lots) 0.4 (0.2–0.5) 0.1 (0.05–0.13)- natural tropical soils – wet forests 3 (2.2–3.7) 0.8 (0.6–1)- natural tropical soils – dry savannahs 1 (0.5–2) 0.3 (0.03–0.5)- natural temperate soils – forests 1 (0.1–2) 0.3 (0.03–0.5)- natural temperate soils – grasslands 1 (0.5–2) 0.3 (0.1–0.5)
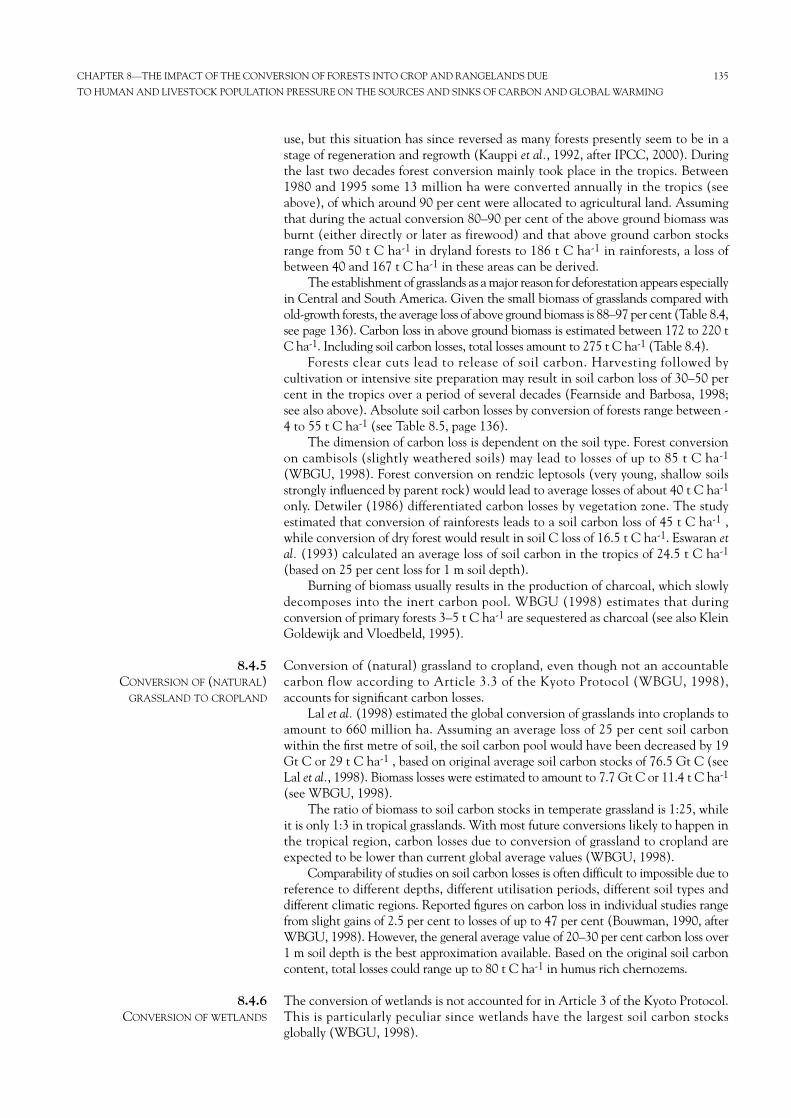
use, but this situation has since reversed as many forests presently seem to be in astage of regeneration and regrowth (Kauppi et al., 1992, after IPCC, 2000). Duringthe last two decades forest conversion mainly took place in the tropics. Between1980 and 1995 some 13 million ha were converted annually in the tropics (seeabove), of which around 90 per cent were allocated to agricultural land. Assumingthat during the actual conversion 80–90 per cent of the above ground biomass wasburnt (either directly or later as firewood) and that above ground carbon stocksrange from 50 t C ha-1 in dryland forests to 186 t C ha-1 in rainforests, a loss ofbetween 40 and 167 t C ha-1 in these areas can be derived.
The establishment of grasslands as a major reason for deforestation appears especiallyin Central and South America. Given the small biomass of grasslands compared withold-growth forests, the average loss of above ground biomass is 88–97 per cent (Table 8.4,see page 136). Carbon loss in above ground biomass is estimated between 172 to 220 tC ha-1. Including soil carbon losses, total losses amount to 275 t C ha-1 (Table 8.4).
Forests clear cuts lead to release of soil carbon. Harvesting followed bycultivation or intensive site preparation may result in soil carbon loss of 30–50 percent in the tropics over a period of several decades (Fearnside and Barbosa, 1998;see also above). Absolute soil carbon losses by conversion of forests range between -4 to 55 t C ha-1 (see Table 8.5, page 136).
The dimension of carbon loss is dependent on the soil type. Forest conversionon cambisols (slightly weathered soils) may lead to losses of up to 85 t C ha-1
(WBGU, 1998). Forest conversion on rendzic leptosols (very young, shallow soilsstrongly influenced by parent rock) would lead to average losses of about 40 t C ha-1
only. Detwiler (1986) differentiated carbon losses by vegetation zone. The studyestimated that conversion of rainforests leads to a soil carbon loss of 45 t C ha-1 ,while conversion of dry forest would result in soil C loss of 16.5 t C ha-1. Eswaran etal. (1993) calculated an average loss of soil carbon in the tropics of 24.5 t C ha-1
(based on 25 per cent loss for 1 m soil depth).Burning of biomass usually results in the production of charcoal, which slowly
decomposes into the inert carbon pool. WBGU (1998) estimates that duringconversion of primary forests 3–5 t C ha-1 are sequestered as charcoal (see also KleinGoldewijk and Vloedbeld, 1995).
Conversion of (natural) grassland to cropland, even though not an accountablecarbon flow according to Article 3.3 of the Kyoto Protocol (WBGU, 1998),accounts for significant carbon losses.
Lal et al. (1998) estimated the global conversion of grasslands into croplands toamount to 660 million ha. Assuming an average loss of 25 per cent soil carbonwithin the first metre of soil, the soil carbon pool would have been decreased by 19Gt C or 29 t C ha-1 , based on original average soil carbon stocks of 76.5 Gt C (seeLal et al., 1998). Biomass losses were estimated to amount to 7.7 Gt C or 11.4 t C ha-1
(see WBGU, 1998). The ratio of biomass to soil carbon stocks in temperate grassland is 1:25, while
it is only 1:3 in tropical grasslands. With most future conversions likely to happen inthe tropical region, carbon losses due to conversion of grassland to cropland areexpected to be lower than current global average values (WBGU, 1998).
Comparability of studies on soil carbon losses is often difficult to impossible due toreference to different depths, different utilisation periods, different soil types anddifferent climatic regions. Reported figures on carbon loss in individual studies rangefrom slight gains of 2.5 per cent to losses of up to 47 per cent (Bouwman, 1990, afterWBGU, 1998). However, the general average value of 20–30 per cent carbon loss over1 m soil depth is the best approximation available. Based on the original soil carboncontent, total losses could range up to 80 t C ha-1 in humus rich chernozems.
The conversion of wetlands is not accounted for in Article 3 of the Kyoto Protocol.This is particularly peculiar since wetlands have the largest soil carbon stocksglobally (WBGU, 1998).
8.4.6CONVERSION OF WETLANDS
8.4.5CONVERSION OF (NATURAL)
GRASSLAND TO CROPLAND
CHAPTER 8—THE IMPACT OF THE CONVERSION OF FORESTS INTO CROP AND RANGELANDS DUE 135
TO HUMAN AND LIVESTOCK POPULATION PRESSURE ON THE SOURCES AND SINKS OF CARBON AND GLOBAL WARMING
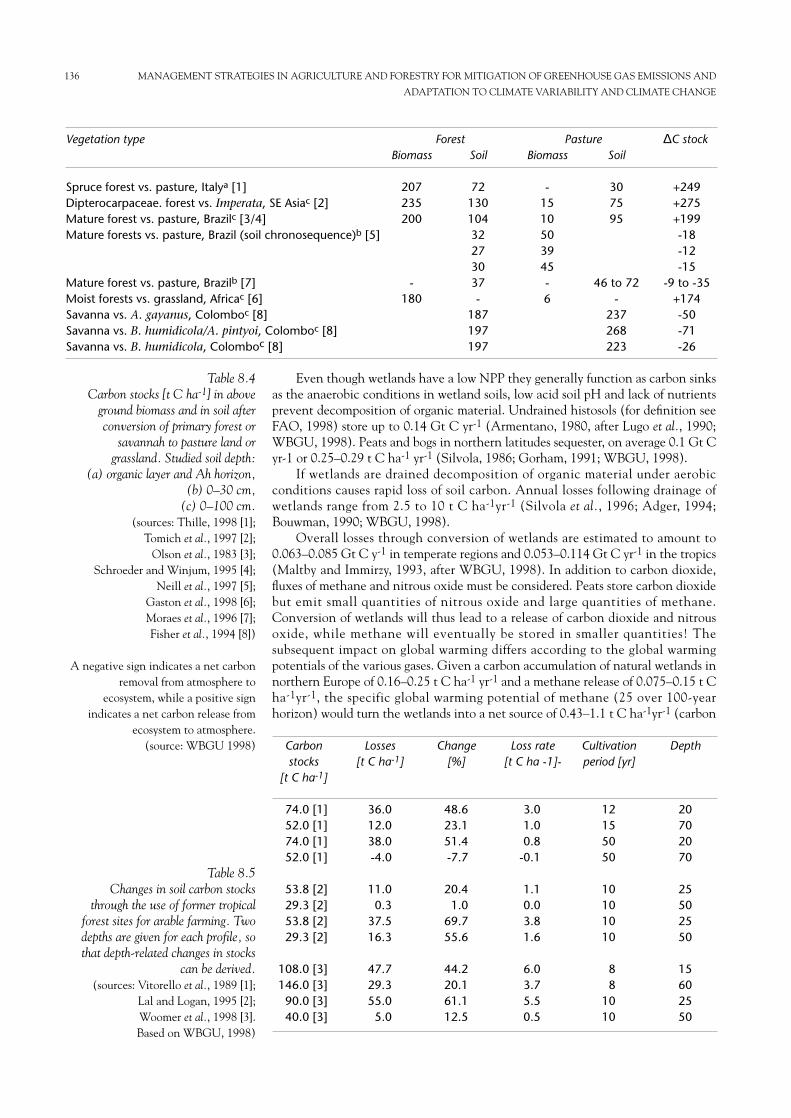
Even though wetlands have a low NPP they generally function as carbon sinksas the anaerobic conditions in wetland soils, low acid soil pH and lack of nutrientsprevent decomposition of organic material. Undrained histosols (for definition seeFAO, 1998) store up to 0.14 Gt C yr-1 (Armentano, 1980, after Lugo et al., 1990;WBGU, 1998). Peats and bogs in northern latitudes sequester, on average 0.1 Gt Cyr-1 or 0.25–0.29 t C ha-1 yr-1 (Silvola, 1986; Gorham, 1991; WBGU, 1998).
If wetlands are drained decomposition of organic material under aerobicconditions causes rapid loss of soil carbon. Annual losses following drainage ofwetlands range from 2.5 to 10 t C ha-1yr-1 (Silvola et al., 1996; Adger, 1994;Bouwman, 1990; WBGU, 1998).
Overall losses through conversion of wetlands are estimated to amount to0.063–0.085 Gt C y-1 in temperate regions and 0.053–0.114 Gt C yr-1 in the tropics(Maltby and Immirzy, 1993, after WBGU, 1998). In addition to carbon dioxide,fluxes of methane and nitrous oxide must be considered. Peats store carbon dioxidebut emit small quantities of nitrous oxide and large quantities of methane.Conversion of wetlands will thus lead to a release of carbon dioxide and nitrousoxide, while methane will eventually be stored in smaller quantities! Thesubsequent impact on global warming differs according to the global warmingpotentials of the various gases. Given a carbon accumulation of natural wetlands innorthern Europe of 0.16–0.25 t C ha-1 yr-1 and a methane release of 0.075–0.15 t Cha-1yr-1, the specific global warming potential of methane (25 over 100-yearhorizon) would turn the wetlands into a net source of 0.43–1.1 t C ha-1yr-1 (carbon
136 MANAGEMENT STRATEGIES IN AGRICULTURE AND FORESTRY FOR MITIGATION OF GREENHOUSE GAS EMISSIONS AND
ADAPTATION TO CLIMATE VARIABILITY AND CLIMATE CHANGE
Table 8.4Carbon stocks [t C ha-1] in above
ground biomass and in soil afterconversion of primary forest or
savannah to pasture land orgrassland. Studied soil depth:
(a) organic layer and Ah horizon, (b) 0–30 cm,
(c) 0–100 cm. (sources: Thille, 1998 [1];
Tomich et al., 1997 [2]; Olson et al., 1983 [3];
Schroeder and Winjum, 1995 [4]; Neill et al., 1997 [5];
Gaston et al., 1998 [6]; Moraes et al., 1996 [7];Fisher et al., 1994 [8])
A negative sign indicates a net carbonremoval from atmosphere to
ecosystem, while a positive signindicates a net carbon release from
ecosystem to atmosphere.(source: WBGU 1998)
Vegetation type Forest Pasture ∆C stockBiomass Soil Biomass Soil
Spruce forest vs. pasture, Italya [1] 207 72 - 30 +249Dipterocarpaceae. forest vs. Imperata, SE Asiac [2] 235 130 15 75 +275Mature forest vs. pasture, Brazilc [3/4] 200 104 10 95 +199Mature forests vs. pasture, Brazil (soil chronosequence)b [5] 32 50 -18
27 39 -1230 45 -15
Mature forest vs. pasture, Brazilb [7] - 37 - 46 to 72 -9 to -35Moist forests vs. grassland, Africac [6] 180 - 6 - +174Savanna vs. A. gayanus, Colomboc [8] 187 237 -50Savanna vs. B. humidicola/A. pintyoi, Colomboc [8] 197 268 -71Savanna vs. B. humidicola, Colomboc [8] 197 223 -26
Carbonstocks
[t C ha-1]
74.0 [1]52.0 [1]74.0 [1]52.0 [1]
53.8 [2]29.3 [2]53.8 [2]29.3 [2]
108.0 [3]146.0 [3]
90.0 [3]40.0 [3]
Losses[t C ha-1]
36.012.038.0-4.0
11.00.3
37.516.3
47.729.355.05.0
Change[%]
48.623.151.4-7.7
20.41.0
69.755.6
44.220.161.112.5
Loss rate[t C ha -1]-
3.01.00.8
-0.1
1.10.03.81.6
6.03.75.50.5
Cultivationperiod [yr]
12155050
10101010
88
1010
Depth
20702070
25502550
15602550
Table 8.5Changes in soil carbon stocks
through the use of former tropicalforest sites for arable farming. Twodepths are given for each profile, sothat depth-related changes in stocks
can be derived. (sources: Vitorello et al., 1989 [1];
Lal and Logan, 1995 [2]; Woomer et al., 1998 [3].Based on WBGU, 1998)
dioxide equivalent emission, Kasimir-Klemedtsson et al., 1997, after WBGU 1998).If wetlands are converted the overall balance would amount to a carbon release of1–19 t C ha-1yr-1 (assuming zero methane emissions). Including increased nitrousoxide emissions, the source potential would raise to 3.8–19 t C ha-1yr-1 (carbondioxide equivalent emission).
The conversion of old-growth mature forests into production forests can off-setconsiderable amounts of carbon. It is, however, not clear in the IPCC Guidelines(1997) whether this type of conversion is to be accounted for under the activitiesof Article 3.3 of the Kyoto Protocol.
Selective logging releases carbon in relation to the amount of timber removed.Indirect effects such as destroying and damaging of forest understorey and regrowthmay affect as much as one third of total forest biomass (IPCC, 2000). The loggedforest will subsequently act as carbon sink. The rate of carbon recovery depends onspecific growth parameters such as species, climate and nutrition.
Conversion of old-growth forest to managed forests is not restricted to tropicallatitudes but occurs also in temperate regions. Since production forests in temperatelatitudes are harvested at comparatively young ages (60–120 and a maximum of 200years) they may have up to 40–50 per cent lower wood biomass compared with old-growth forests. Total losses in temperate and boreal forests due to change in foresttype may thus range from 18 to 350 t C ha-1 (see WBGU, 1998; also Table 8.6 onpage 138). For plantations and secondary forests in the tropics, where the productioncycle is completed within 10–50 years, wood biomass is about 20–80 per cent lowercompared with old-growth stands (WBGU, 1998). Total figures for carbon loss dueto conversion into short-rotation forests range from 31 to 206 t C ha-1 (seeTable 8.6).
Land use change, i.e. conversion of forests into other land use types is a significantsource of greenhouse gases. The various processes, especially the carbon cycle, arewell understood. Quantification of carbon pools and flows on various ecosystemlevels is reasonable. However, as global estimations, in particular, are based onrelatively few studies, extrapolation of results consequently lead to majoruncertainties and errors. Soil carbon and its various fractions, which have differingfunctions and life cycles, require more research. Guidelines on the monitoring andbudgeting of carbon flows need to be refined. The understanding of mutual relationsbetween, for example, ecosystem functioning and climate variability and climatechange needs further research, as does the cumulative effect of continued globaldeforestation on regional climatic variation including local water cycles.
An enhanced understanding of ecosystem functioning and environmentalservices gained from extended research on ecosystem carbon cycles should also linkto major environmental issues. While the quantification of carbon pools and flows invarious ecosystems enables a better understanding of the carbon cycle it should notbe a self-focused endeavour, but must cross-cut to equally important environmentalissues such as biodiversity and forest protection, sustainable land use and watermanagement. The conversion of forest should thus not only be seen as a loss of acertain quantity of carbon but should be put into relation with the other majorenvironmental functions of such natural ecosystems.
8.5CONCLUSION
8.4.7CONVERSION OF OLD-GROWTH
FOREST TO MANAGED FORESTS
CHAPTER 8—THE IMPACT OF THE CONVERSION OF FORESTS INTO CROP AND RANGELANDS DUE 137
TO HUMAN AND LIVESTOCK POPULATION PRESSURE ON THE SOURCES AND SINKS OF CARBON AND GLOBAL WARMING
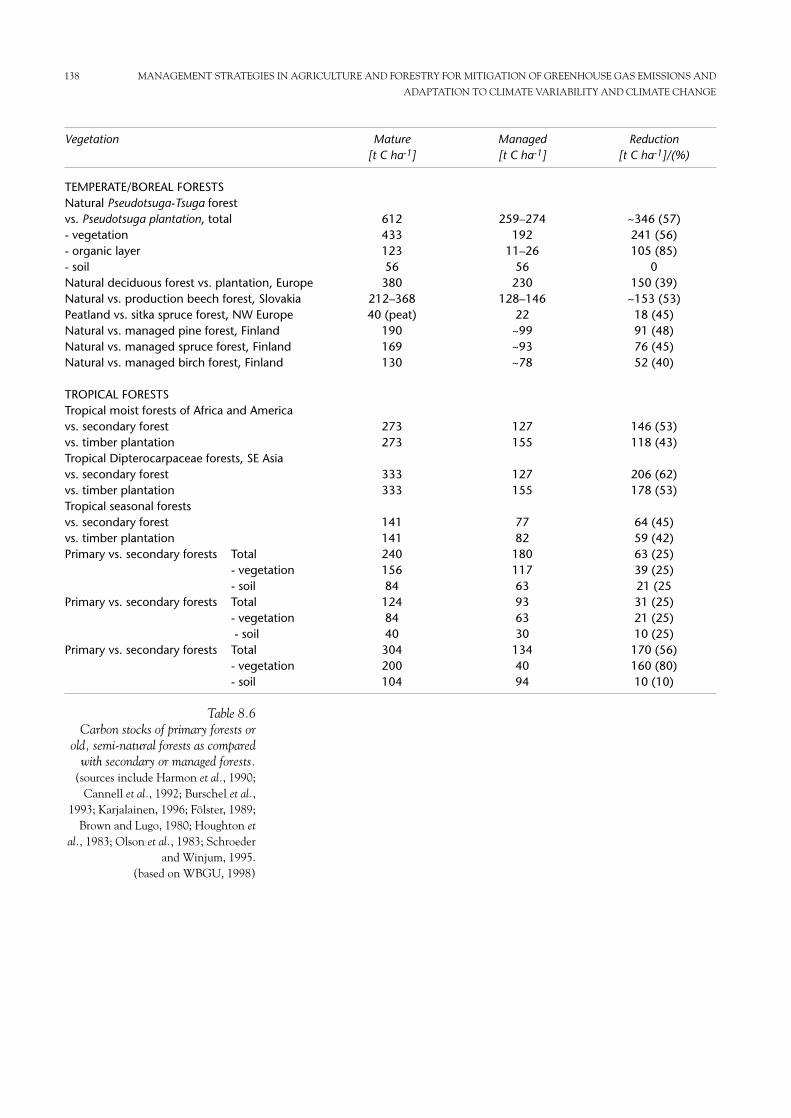
138 MANAGEMENT STRATEGIES IN AGRICULTURE AND FORESTRY FOR MITIGATION OF GREENHOUSE GAS EMISSIONS AND
ADAPTATION TO CLIMATE VARIABILITY AND CLIMATE CHANGE
Vegetation Mature Managed Reduction[t C ha-1] [t C ha-1] [t C ha-1]/(%)
TEMPERATE/BOREAL FORESTSNatural Pseudotsuga-Tsuga forest vs. Pseudotsuga plantation, total 612 259–274 ~346 (57)- vegetation 433 192 241 (56)- organic layer 123 11–26 105 (85)- soil 56 56 0Natural deciduous forest vs. plantation, Europe 380 230 150 (39)Natural vs. production beech forest, Slovakia 212–368 128–146 ~153 (53)Peatland vs. sitka spruce forest, NW Europe 40 (peat) 22 18 (45)Natural vs. managed pine forest, Finland 190 ~99 91 (48)Natural vs. managed spruce forest, Finland 169 ~93 76 (45)Natural vs. managed birch forest, Finland 130 ~78 52 (40)
TROPICAL FORESTSTropical moist forests of Africa and Americavs. secondary forest 273 127 146 (53)vs. timber plantation 273 155 118 (43)Tropical Dipterocarpaceae forests, SE Asiavs. secondary forest 333 127 206 (62)vs. timber plantation 333 155 178 (53)Tropical seasonal forestsvs. secondary forest 141 77 64 (45)vs. timber plantation 141 82 59 (42)Primary vs. secondary forests Total 240 180 63 (25)
- vegetation 156 117 39 (25)- soil 84 63 21 (25
Primary vs. secondary forests Total 124 93 31 (25)- vegetation 84 63 21 (25)- soil 40 30 10 (25)
Primary vs. secondary forests Total 304 134 170 (56)- vegetation 200 40 160 (80)- soil 104 94 10 (10)
Table 8.6Carbon stocks of primary forests or
old, semi-natural forests as comparedwith secondary or managed forests.
(sources include Harmon et al., 1990;Cannell et al., 1992; Burschel et al.,
1993; Karjalainen, 1996; Fölster, 1989;Brown and Lugo, 1980; Houghton et
al., 1983; Olson et al., 1983; Schroederand Winjum, 1995.
(based on WBGU, 1998)
CHAPTER 9
CONCLUSIONS AND RECOMMENDATIONS(By H.P. Das)
The effects of changes in climate on crop yields are likely to vary greatly from regionacross the globe. Given many uncertainties about the nature of climate change,there is little or no ability to accurately predict which region will benefit or lose.The results of the scenarios tested in many studies indicate that the effects of cropyields in mid- and high latitude regions appear to be positive or less adverse thanthose in low latitude regions, provided the potentially beneficial direct physiologicaleffects of carbon dioxide on crop growth can be fully realised. At a finer geographicscale, however, much depends on how precipitation patterns change. From adevelopment perspective, the most serious concern relates to the apparent differencein incremental yield impacts between developed and developing countries. Thescenario results suggest that if climatic change were to retard economic developmentbeyond the direct effects on agriculture in the poorer regions, especially in Africa,then overall impacts could be sizeable.
Recent work has also evaluated the potential for adaptation to climate changeand has found considerable potential. The principal debate is whether this potentialwill be realised. More precise scenarios of how climate will change at local andregional levels are needed as well as a better understanding of the social andeconomic factors leading farmers and others to detect and respond to changingclimate. Farmers will have difficulty responding to climate change if they cannotdetect that it is actually happening. Noise inherent in the climate system may makedetection of climate change difficult to distinguish from normal inter-annual andinter-decadal variability.
Climate change could possibly be a force that sets off a chain reaction ofmaladaptation. One should aim at striving to create an agricultural productionsystem that can adapt and respond to many changes and one that is using naturalresources wisely – for this will be effective in dealing with climate change. Indeveloping an adaptive agriculture we are unlikely to preserve the same farms in thesame places as they exist today. But with or without climate change farming will bemuch different in 100 years. Over-reacting by taking adaptive action when climatehas not changed can be as costly as failing to respond to changes that have occurred.Better representation of uncertainty in forecasts and predictions and identifyingstrategies that are effective under a range of climatic conditions are importantpriorities for future research.
1. Agronomists need to work closely with climatologists at the regional level toprovide a sound basis for optimising crops, soil and water management underthe changing conditions of climate.
2. As more is learned about the effects of anticipated climate change on crops,more efforts should be directed to exploring biological adaptations and man-agement systems for reducing these impacts on agriculture.
3. Under changing climatic conditions, efforts should be made by plant breed-ers to develop combinations of temperature tolerance and photoperiodresponses in new varieties.
4. The potential of tuber and root crops for producing edible calories under pro-jected climate change should be assessed for low and mid-latitudes becausethese crops can provide alternate productive cropping systems.
5. The impact of climate change on livestock needs to be examined in detail,since livestock are important for dairy farming and for energy, transport etc.in many parts of the world.
RECOMMENDATIONS
CONCLUSIONS
6. Every effort should be made to arrest deforestation and to promote upgradingof degraded lands through agroforestry and other appropriate forms of landuse to increase carbon fixation on earth.
7. Efforts should be made to implement sustainable short-rotation forestry forthe production of renewable biomass energy to replace non-renewable fossilfuels as a key criterion in reforestation and afforestation activities.
8. Considering the vulnerability of agricultural production to the occurrence ofclimate extremes, efforts should be made to determine the heat-tolerancelimits of currently grown and of alternative crops and varieties and to findsuitable agronomic methods to moderate the thermal regime affecting cropgrowth.
9. Farming and fishing families should be equipped with the latest location spe-cific information to increase their preparedness for floods, tropical cyclonesand drought. Mass media and computer aided extension techniques can helpto take the latest information derived from weather satellites to every village.
140 MANAGEMENT STRATEGIES IN AGRICULTURE AND FORESTRY FOR MITIGATION OF GREENHOUSE GAS EMISSIONS AND
ADAPTATION TO CLIMATE VARIABILITY AND CLIMATE CHANGE

APPENDIX 1
UNITS OF MEASUREMENT
Multiplier Name Alternative names Abbreviation
100 gram g103 grams Kilogram kg106 grams Megagram Tonne Mg109 grams Gigagram Thousand tonnes Gg1012 grams Teragram Million tonnes Tg1015 grams Petagram Gigatonnes or billion tonnes Pg
10-6 Parts per million by volume ppmv10-9 Parts per billion by volume ppbv106 ha Million hectares Mha
REFERENCES
Albritton, D., Allen, M.R., Baede, A.P.M., Church, J.A., Cubasch, U., Xiaosu, D.,Ding, Y., Ehhalt, D., Folland, C.K., Giorgi, F., Gregory, J.M., Griggs, D., Haywood,J.M., Hewitson, B., Houghton, J.T., House, J.I., Hulme, M., Isaksen, I., Jaramillo,V.J., Jayaraman, A., Johnston, C., Joos, F., Joussaume, S., Karl, T., Karoly, D.,Kheshgi, H., Le Quere, C., Maskell, K., Mata, L.J., McAvaney, B., McFarland, M.,Mearns, L.O., Meehl, G.A., Meira-Fihlo, L.G., Meleshko, V.P., Mitchell, J.F.B.,Moore, B., Mugara, R.K., Noguer, M., Nyenzi, B.S., Oppenheimer, M., Penner,J.E., Pollonais, S., Prather, M., Prentice, C, Ramaswamy, V., Ramirez-Rjas, A.,Raper, S., Salinger, M.J., Scoles, R.J., Solomon, S., Stocker, T., Stone, J., Stouffer,R.J., Trenberth, K.E., Wang, M-X., Watson, R.T., Yap, K.S and Zillman, J., 2001:Climate Change 2001: The Scientific Basis. Summary for Policymakers andTechnical Summary of the Working Group I Report, Cambridge University Press,Cambridge, U.K., 98 pp.
Intergovernmental Panel of Climate Change (IPCC), 1996: Climate Change 1995: TheScience of Climate Change. Houghton, J.T., Meira Filho, L.G., Callander, B.A.,Harris, N., Kattenberg, A and Maskell, K., (eds.), Cambridge University Press,Cambridge, U.K., 570 pp.
Intergovernmental Panel of Climate Change (IPCC), 2000: Emissions Scenariois:Special Report on Emissions Scenarios. Nakicenovic, N., and Swart, R., (eds.),Cambridge University Press, Cambridge, U.K., 599 pp.
Intergovernmental Panel of Climate Change (IPCC), 2001a: Climate Change 2001:The Scientific Basis. Houghton, J.H., Ding, Y., Griggs, D.J., Noguer, M., van derLinder, P.J., Dai. X., Maskell, K., Johnson, C.A., (eds.), Cambridge UniversityPress, Cambridge, U.K., 881 pp.
Intergovernmental Panel of Climate Change (IPCC), 2001b: Climate Change 2001:Impacts, Adaptation, and Vulnerability. McCarthy, J.J., Canziani, O.F., Leary, N.A.,Dokken, D.J., and White, K.S., (eds.), Cambridge University Press, Cambridge,U.K., 1032 pp.
Winters, P.R., Murgai, R., de Janvry, A., Sadoulet, E and Frisvold, G., 1999: Climatechange and agriculture: effects on developing countries. In: Global EnvironmentalChange and Agriculture, (Frisvold, G and Kuhn, B., eds.), Edward Elgar Publishers,Cheltenham, U.K.
ADB-GEF-UNEP, 1998: Asia Least-Cost Greenhouse Gas Abatement Strategy. AsianDevelopment Bank, Manila.
Allen, A.S., Andrews, J.A., Finzi, A.C., Matamala, R., Richter, D.D. and Schlesinger,W.H., 2000: Effects of free-air carbon dioxide enrichement (FACE) on below-ground processes in a Pinus taeda forest. Ecological Applications, 10: 437–448.
Boone, R.D., Nadelhoffer, K.J., Canary, J.D. and Kaye. J.P., 1998: Roots exert a stronginfluence on the temperature sensitivity of soil respiration. Nature, 396: 570–572.
Collatz, G.J., Berry, J.A. and Clark, J.S., 1998: Effects of climate and atmosphericcarbon dioxide partial pressure on the global distribution of C4 grasses: present,past, and future. Oecologia, 114: 441–454.
Curtis, P.S., 1996: A meta-analysis of leaf gas exchange and nitrogen in trees grownunder elevated carbon dioxide. Plant Cell and Environment, 19: 127–137.
Curtis, P.S., and Wang, X.Z., 1998: A meta-analysis of elevated carbon dioxide effectson woody plant mass, form, and physiology. Oecologia, 113: 299–313.
Dong Hongmin, Lin Erda, et al., 1996: An estimation of methane emissions from agri-culture activities in China. Ambio. Vol. 25, No. 4: 292–296.
DeLucia, E.H., Hamilton, J.G., Naidu, S.L., Thomas, R.B., Andrews, J.A., Finzi, A.,Lavine, M., Matamala, R., Mohan, J.E., Hendrey, G.R. and Schlesinger, W.H.,
CHAPTER 2
CHAPTER 1
1999: Net primary production of a forest ecosystem with experimental carbondioxide 2 enrichment. Science, 284: 1177–1179.
Drake, B.G., Azcon-Bieto, J., Berry, J., Bunce, J., Dijkstra, P., Farrar, J., Gifford, R.M.,Gonzalez-Meler, M.A., Koch, J., Lambers, H., Siedow J. and Wullschleger, S.,1999: Does elevated atmospheric carbon dioxide concentration inhibit mito-chondrial respiration in green plants? Plant Cell and Environment, 22: 649–657.
Eheridge, D.M., Pearman, G.I. and Fraster, P.J., 1992: Changes in tropospheric methanebetween 1841 and 1978 from a high accumulation rate Antarctic ice core. Tellus,44: 282–294.
EPA, 2001: Inventory of U.S. Greenhouse Gas Emissions and Sinks: 1990–1999.Farquhar, G.D., von Caemmerer, S.V. and Berry, J.A., 1980: A biochemical-model of
photosynthetic carbon dioxide assimilation in leaves of C3 plants. Planta, 149:78–90.
FCCC, 1998: Summary Compilation of Annual Greenhouse Gas Emissions InventoryData from Annex I Parties.
Giardina, C.P. and Ryan, M.G., 2000: Evidence that decomposition rates of organiccarbon in mineral soil do not vary with temperature. Nature, 404: 858–861.
Gifford, R.M., 1992: Implications of the globally increasing atmospheric carbon diox-ide concentration and temperature for the Australian terrestrial carbon budgetintegration using a simple-model. Australian Journal of Botany, 40: 527–543.
Holzapfel-Pschorn, A., Conradd, R., and Seiler, W., 1985: Production, oxidation, andemissions of methane in rice paddies. FEMS Microbiology Ecology 31: 343–351.
House, J.I., and Hall, D.O., 2000: Net primary production of savannas and tropicalgrasslands. In: Terrestrial Global Productivity: Past, Present and Future, Mooney, H.,Roy J. and Saugier, B., (eds.), Academic Press, San Diego (in press).
Intergovernmental Panel of Climate Change (IPCC), 1996: Climate Change 1995: TheScience of Climate Change. Houghton, J.T., Meira Filho, L.G., Callander, B.A.,Harris, N., Kattenberg, A and Maskell, K., (eds.), Cambridge University Press,Cambridge, U.K., 570 pp.
IPCC, 2001: Climate Change 2001:The Scientific Basis. Summary for Policymakers andTechnical Summary of the Working Group I Report, Cambridge University Press,Cambridge U.K., 881 pp.
Koch, G.W. and Mooney, H.A., 1996: Response of terrestrial ecosystems to elevatedcarbon dioxide: a synthesis and summary. In: Carbon Dioxide and TerrestrialEcosystems, Koch, G.W. and Mooney H.A., (eds.), Academic Press, San Diego,pp. 415–429.
Lloyd, J. and Taylor, J.A., 1994: On the temperature-dependence of soil respiration.Functional Ecology, 8: 315–323.
Masle, J. 2000: The effects of elevated carbon dioxide concentrations on cell divisionrates, growth patterns, and blade anatomy in young wheat plants are modulatedby factors related to leaf position, vernalization, and genotype. Plant Physiology,122: 1399–1415.
Mooney, H.A., Canadell, J., Chapin III, F.S., Ehleringer, J.R., Korner, C., McMurtrie.R.E., Parton, W.J., Pitelka, L.F. and Schulze, E.D., 1999: Ecosystem physiologyresponses to global change. In: Implications of Global Change for Natural andManaged Ecosystems. A Synthesis of GCTE and Related Research. IGBP Book 8,Series No. 4, Walker, B.H., Steffen, W.L., Canadell, J. and Ingram, J.S.I., (eds.),Cambridge University Press, Cambridge, U.K., pp. 141–189.
Wang, M.X. and Shangguan, X.J., Methane emissions from various rice fields in P.R.China. Theoretical and Applied Climatology, Vol. 55: 129–138.
Norby, R.J., Wullschleger, S.D., Gunderson, C.A., Johnson, D.W. and Ceulemans, R.,1999: Tree responses to rising carbon dioxide in field experiments: implicationsfor the future forest. Plant Cell and Environment, 22: 683–714.
Qi Yuchun, Dong Yunshe, 1999: Nitrous oxide emissions from soil and some influ-encing factors. Acta Geographica Sinica, Vol. 54. No. 6: 534–542.
REFERENCES 143
Owensby, C.E., Coyne, P.I. and Ham, J.M., 1993: Biomass production in a tallgrassprairie ecosystem exposed to ambient and elevated carbon dioxide. EcologicalApplications, 3: 644–653.
Polley, H.W., Johnson, H.B., Mayeux, H.S. and Tischler, C.R., 1996: Are some of therecent changes in grassland communities a response to rising carbon dioxideconcentrations? In: Carbon Dioxide, Populations, and Communities, Korner, C. andBazzaz F.A., eds., Academic Press, San Diego, pp. 177–195.
Prasad, S.S., 1997: Potential atmospheric sources and sinks of nitrous oxide.Possibilities from exited oxygen, “embryonic ozone” and optically pumped exitedoxygen. Journal of Geophysical Research, 102: 21527–21537.
Prather, M., Derwent, R., Ehhalt, D., Fraser, P., Sanhueza, E. and Zhou, X., 1995: Othertrace gases and atmospheric chemistry. In: Climate Change 1994: Radiative Forcingof Climate Change and an Evaluation of the IPCC IS92 Emission Scenarios,Houghton, J.T., Meira Filho, L.G., Bruce, J.P., Lee, H., Callander, B.A., Haites,E.F., eds., Cambridge University Press, Cambridge, Cambridge, U.K., pp. 73–126.
Sass, R.L., Fisher, F.M., Harcombe, P.A. and Turner, F.T. 1990: Methane productionand emissions in a Texas rice field. Global Biogeochemical Cycles 4: 47–68.
Saxe, H., Ellsworth, D.S. and Heath, J., 1998: Tree and forest functioning in anenriched carbon dioxide atmosphere. New Phytologist, 139: 395–436.
Street-Perrott, F.A., Huang, Y., Perrott, R.A. and Eglinton, G., 1998: Carbon isotopesin lake sediments and peats of last glacial age: implications for the global carboncycle, In: Stable Isotopes, Griffiths, H., ed., BIOS Scientific Publishers Ltd, pp.381–396.
Trumbore, S., 2000: Age of soil organic matter and soil respiration: radiocarbon constraintson belowground carbon dynamics. Ecological Applications, 10: 399–411.
Wand, S.J.E., Midgley, G.F., Jones, M.H. and Curtis, P.S., 1999: Responses of wild C4and C3 grass (Poaceae) species to elevated atmospheric carbon dioxide concen-tration: a meta-analytic test of current theories and perceptions. Global ChangeBiology, 5: 723–741.
Wang Mingxing, Dai Aiguo, et al., 1994: Sources of methane in China. In: Methaneand Nitrous Oxide: Global Emissions and Controls from Rice Fields and OtherAgricultural and Industrial Sources, NIAES, 1994: 9–26.
Bouwman, A. et al., 2001: Global estimates of gaseous emissions of reactive nitrogen fromagricultural land. Report commissioned by the International Fertilizer Associationand the Food and Agriculture Organization of the United Nations (in press).
Baldocchi, D. et al., 2001: FLUXNET: A new tool to study the temporal and spatialvariability of ecosystem-scale, carbon dioxide, water vapor, and energy flux densi-ties. Bulletin of the American Meteorological Society, 82: 2415–2434.
Cole, C.V., et al., 1996: Chapter 23: Agricultural Options for Mitigating GreenhouseGas Emissions. In: Climate Change 1995. Impacts, Adaptations and Mitigation ofClimate Change: Scientific-Technical Analysis. IPCC Working Group II. CambridgeUniversity Press, U.K., pp. 745–771.
Conant, R.T., Paustian K. and Elliot, E.T., 2001: Grassland management and conver-sion into grassland: effects on soil carbon. Ecol. Applic. 11: 343–355.
Denmead, O.T., Harper, L.A., Freney, J.R., Griffith, D.W.T., Leuning R. and Sharpe,R.R., 1998: A mass balance method for non-intrusive measurements of surface-air trace gas exchange. Atmos. Environ. 32: 3679–3688.
Desjardins, R.L., Kulshreshtha, S.N., Junkins, B., Smith, W., Grant, B. and Boehm,M., 2001a: Canadian greenhouse gas mitigation options in agriculture. Nutr. Cycl.Agroecosys. 60: 317–326.
Desjardins, R.L., Macpherson, J.I., Flechard, C.R., Pattey, E., Zhu, T., Riznek, R. andDow, D., 2001b: Sharpening the regional picture of nitrous oxide emissions from agri-cultural land. Presented at the Air Surface Exchange Conference in Edinburgh,Scotland, 3–7 July, 2000.
CHAPTER 3
144 MANAGEMENT STRATEGIES IN AGRICULTURE AND FORESTRY FOR MITIGATION OF GREENHOUSE GAS EMISSIONS AND
ADAPTATION TO CLIMATE VARIABILITY AND CLIMATE CHANGE
Desjardins, R.L., MacPherson, J.I. and Schuepp, P.H., 2001c: Aircraft-based fluxsampling strategies. Encyclopedia of Analytical Chemistry, Meyers, R.A., ed., pp.3573–3588, John Wiley & Sons Ltd, Chichester, U.K., 2000.
Desjardins, R.L., Smith, W.N., Grant, B., Tarnocai, C. and Dumanski, J., 2001d:Possibilities for changes in the greenhouse gas balance of agroecosystems inCanada. In: Soil Carbon Sequestration and the Greenhouse Effect. Lal, R., ed., pp.115–123. Soil Science Society of America Special Publication No. 57.
Enlge, T.H. and Priesack, E., 1993: Expert-N, a building block system of nitrogenmodels as a resource for advice, research, water management and policy. In:Integrated Soil and Sediment Research: A Basis for Proper Protection, Eijsackers H.J.P.and Hamers T., eds., Kluwer Academic Publishers, pp. 503–507.
Clemens, J. and Ahlgrimm, H., 2001: Greenhouse gases from animal husbandry: miti-gation options. Nutr. Cycl. Agroecosys. 60: 287–300.
Grandhi, R.R., 2001: Effect of supplemental phytase and ideal dietary amino acid ratiosin covered and hulless-barley-based diets on pig performance and excretion ofphosphorus and nitrogen in manure. Canadian Journal of Animal Science 81:115–123.
Grant, R.F., 1997: Changes in soil organic matter under different tillage and rotation:mathematical modeling in ecosystems. Soil Sci. Soc. Am. J. 61: 752–764.
Hutchinson, G.L., Livingston, G.P., Healy, R.W. and Striegl, R.G., 2000: Chambermeasurement of surface-atmosphere trace gas exchange: dependence on soil, inter-facial layer, and source/sink properties. J. Geophys. Res. 105: 8865–8876.
Hou A., Akiyama, H., Nakajima, Y., Sudo, S. and Tsuruta, H., 2000: Effects of ureaform and soil moisture on nitrous oxide and nitrogen monoxide emissions fromJapanese Andosols. Chemosphere – Global Change Science, 2: 321–327.
IPCC, 1996: Climate Change 1995: The Science of Climate Change. Technical summaryof the Working Group I. Cambridge University Press, Cambridge, U.K.
IPCC, 2000: Land Use, Land-use Change and Forestry. A special report of theIntergovernmental Panel on Climate Change, Cambridge University Press, U.K.,377 pp.
IPCC, 2001a: Climate Change 2001: Mitigation. A report of Working Group III of theIntergovernmental Panel on Climate Change, 58 pp.
IPCC, 2001b: Climate Change 2001: The Scientific Basis. Summary for Policymakers andTechnical Summary of the Working Group I Report, Cambridge University Press,Cambridge, U.K., 2001, 98 pp.
IPCC, 2001c: Third Assessment Report. Technical Summary of Working Group I.Cambridge University Press, U.K., 63 pp.
Janzen, H.H., Desjardins, R.L., Asselin, R. and Grace, B., eds., 1999: The Health of OurAir: Towards Sustainable Agriculture in Canada. Research Branch, Agriculture andAgri-Food Canada. Catalogue No. A53-1981/1998E, 98 pp.
Kaharabata, S.K., Schuepp, P.H. and Desjardins, R.L., 2000: Estimating methane emis-sions from dairy cattle housed in a barn and feedlot using an atmospheric tracer.Environmental Science and Technology, 34: 3296–3302.
Kebread, E., France, J., Beever, D.E. and Castello, A.R., 2001: Nitrogen pollution bydairy cows and its mitigation by dairy manitpulations. Nutr. Cycl. Agroecosys., 60:275–285.
Kulshreshtha, S.N., Junkins, B., Desjardins, R.L. and Giraldez, J.C., 2000: A systemsapproach to estimation of greenhouse gas emissions from the Canadian agricul-ture and agri-food sector. World Resource Review, 12: 321–337.
Lal, R., Follet, R.F., Kimble, J. and Cole, C.V., 1999: Managing U.S. cropland tosequester carbon in soil. J. Soil and Water Conserv., 54: 374–381.
Li, C., Frolking, S. and Harriss, R., 1994: Modelling biogeochemistry in agriculturalsoils. Global Biogeochem. Cycles, 8: 237–254.
MacKenzie, A.F., Fon, M.X. and Cadrin, F., 1998: Nitrous oxide emissions in threeyears as affected by tillage, corn-soybean-alfalfa rotations, and nitrogen fertiliza-tion. J. Environ. Qual., 27: 698–703.
REFERENCES 145
Majumdar, D., Kumar, S., Pathak, H., Jain, M.C. and Kumar, U., 2000: Reducingnitrous oxide emissions from an irrigated rice field of North India with nitrifica-tion inhibitors. Agriculture, Ecosystems and Environment, 81: 163–169.
Oenema, O., 1999: Strategies for decreasing nitrous oxide emissions from agriculturalsources. In: Proceedings of the International Workshop on Reducing Nitrous OxideEmissions from Agroecosystems, Desjardins R.L., Keng J. and Haugen-Kozyra K.,eds., pp. 175–191, Agriculture and Agri-Food Canada, Alberta Agriculture, Foodand Rural Development, Banff, Alberta, Canada.
Parton, W.J., Sherlock, J.M.O., Ojima, D.S., Gilmanor, T.G., Scholes, R., Schimel,D.S., Kirchner, T., Minaut, J.C., Seastedt, T., Garcia Moya, E., Kamnalrut, A. andKinyamario, J.I., 1993: Observations and modeling of humus and soil organicmatter dynamics for the grassland biome worldwide. Global Biogeochemical Cycle,7: 785–809.
Paustian, K., Cole, C.V., Sauerbeck, D. and Sampson, N., 1998: Carbon dioxide miti-gation by agriculture: an overview. Climate Change, 40: 135–162.
Shin Y.K., Yun, S.H., Park, M.E. and Lee, B.L., 1996: Mitigation options for methaneemissions from rice fields in Korea. Ambio, 25: 289–291.
Smith, W.N., Desjardins, R.L. and Pattey, E., 2000: The net flux of carbon from agri-cultural soils in Canada from 1970–2000. Global Change Biology, 6: 557–568.
UNFCC, 2000: National Communications from Parties included in Annex I to theConvention: Greenhouse Gas Inventory Data from 1990 to 1998. 13th Session, Lyon,11–15 September 2000, 92 pp.
Wagner-Riddle, C. and Thurtell, G.W., 1998: Nitrous oxide emissions from agricul-tural fields during winter and spring thaw as affected by management practices.Nutr. Cycl. Agroecosys., 52: 151–163.
Woodbury, J.W. and Hashimoto, A., 1993: Methane emissions from livestock manure.In International Methane Emissions, U.S. Environmental Protection Agency,Climate Change Division, Washington, DC, U.S.A.
Aggarwal, P. K. and Sinha, S. K., 1993: Effect of probable increase in carbon dioxideand temperature on wheat yields in India. Journal of Agricultural Meteorology, 48,5: 811–814.
Aina, P. O., 1979: Soil changes resulting from long term management practices in west-ern Nigeria. Soil Sci. Soc. Am. J., 43: 173–177.
Amien, I., Rejekiningrum, P., Pramudia, A. and Susanti, E., 1996: Effects of interan-nual climate variability and climate change on rice yield in Java, Indonesia;Climate change, vulnerability and adaptation in Asia and the Pacific. SpecialIssue: Water, Air and Soil Pollution, 92/1–2:29–39.
Anglo, E. G., Bolhofer, W.C., Erda, L., Huq, S., Lenhart, S., Mukherjee, S.K., Smith,J. and Wisniewski, J., 1996: Regional Workshop on Climate Change Vulnerability andAdaptation in Asia and the Pacific: Workshop Summary (Manila, Philippines 15–19January 1996), Kluwer Academic Publishers, Dordrecht, the Netherlands.
Arnell, N.W., 1992: Factors controlling the effects of climate change on river flowregimes in a humid temperate environment, J. Hydrol., 132: 321–342.
Baethgen, W.E., 1994: Impact of climate change on barley in Uruguay: yield changesand analysis of nitrogen management systems. In: Implications of Climate Changefor International Agriculture: Crop Modelling Study, Rosenzweig, C. and Iglesias, A.,eds., Environmental Protection Agency, Washington, DC, U.S.A.
Baethgen, W.E. and Magrin, G.O., 1995: Assessing the impacts of climate change onwinter crop production in Uruguay and Argentina using crop simulation models.In: Climate Change and Agriculture: Analysis of Potential International Impacts.Proceed. Sym. Amer. Soc. Agron., Minneapolis, MN, 4–5 Nov 1992. ASA Spec.Pub., 59: 207–228.
Baker, B.B., Hanson, J.D., Bourdon, R.M. and Eckert, J.B., 1993: The potential effectsof climatic change on ecosystem processes and cattle production on U.S. range-lands. Climatic Change, 23: 97–117.
CHAPTER 4
146 MANAGEMENT STRATEGIES IN AGRICULTURE AND FORESTRY FOR MITIGATION OF GREENHOUSE GAS EMISSIONS AND
ADAPTATION TO CLIMATE VARIABILITY AND CLIMATE CHANGE
Baldy, C. and Stigter, C.J., 1997: Agrometeorology of Multiple Cropping in Warm Climates.INRA, Paris, Science Publ., Enfield (USA), Oxford and IBH Publ. Co., NewDelhi.
Batjes, N.H. and Bridges, S.M., eds., 1992: World Inventory of Soil Emission Potentials.Proc. Int. Workshop WAG, 24–27 August 1992, WISE Report 2, InternationalSoil Reference and Information Centre, Wageningen, the Netherlands.
Bayasgalan, S., Bolortsetseg, B., Dagvadorj, D. and Natsagdorj, L., 1996: The Impactof Climate Change on Spring Wheat Yield in Mongolia and its Adaptability. In:Adapting Climate Change, Assessment and Issues, Smith, J.B., et al., eds., Springer-Verlag, New York, pp. 164–173.
Beek, K.J., Blokhuis, W.A., Driessen, P.M., Van Breemen, N., Brinkman, R. and Pons,L.J., 1980: Problem soils: their reclamation and management. In: Land Reclamationand Water Management: Developments, Problems and Challenges. InternationalInstitute for Land Reclamation and Improvement (ILRI) Publication 27,pp. 43–72, International Soil Reference and Information Centre, Wageningen,the Netherlands.
Bergthorsson, P., Bjornsson, H., Dyrmundsson, O., Gudmundsson, B., Helgadottir, A.and Jonmundsson, J.V., 1988: The effects of climatic variations on agriculture inIceland. In: The Impact of Climatic Variations on Agriculture, Vol. I, Assessments inCool Temperate and Cold Regions, Parry, M.L., Carter, T.R. and Kanijn, N.T.,eds., Kluwer, Dordrecht, the Netherlands.
Bertrand, M., 1993: La Nouvelle Politique Forestiere du Niger et les Marches Ruraux duBris Energie: Innovations Institutionelles, Organisationelles et Techniques. CIRAD,Montpellier, France.
Bhattacharya, N.C. and Geyer, R.A., 1993: Prospects of agriculture in a carbon diox-ide enriched environment. In: A Global Warming Forum: Scientific, Economic andLegal Overview, CRC Press, Inc. Boca Raton, U.S.A., pp. 487–505.
Boardman, J., Evans R., Favis-Mortlock, D.T. and Harris, T.M., 1990: Climate changeand soil erosion on agricultural land in England and Wales. Land Degradation andRehabilitation 2: 95–106.
Bohl, H.G., Downing, T.E. and Watts, M.J., 1994: Climate change and social vulner-ability: toward a sociology and geography of food insecurity. Global Environ. Change4 (1): 37–48.
Botterweg, P., 1994: Modelling the effects of climate change on run off and erosion inCentral Southern Norway. In: Rickson, R.J., eds., Conserving Soil Resources:European Perspectives. First Int. Con. Euro. Soc. Soil Conserv., pp. 273–285.
Bouwman, A.F., 1994: Estimated global source distribution of nitrous oxide. In Methaneand Nitrous Oxide Global Emissions and Controls from Rice Fields and otherAgricultural and Industrial Sources, Minami, K. Mosier, A. and Sass, R., eds., NIAESSeries 2, Yokendo Publishers, Tokyo, pp. 147–159.
Bowes, M.D. and Crosson, P., 1993: Consequences of climate change for the MINKecnomy: impact and responses. Climate Change, 24: 131–158.
Brinkman, R., 1990: Resilience against climate change? Soil minerals, transformationsand surface properties: Eh and pH. In: Soils on a Warmer Earth, Scharpenseel,H.W., Schomaker, M. and Ayoub, A., eds., Elsevier, pp. 51–60.
Brinkman, R. and Sombroek, W.G., 1996: The effects of global change on soil condi-tions in relation to plant growth and food production. In: Global Climate Changeand Agricultural Production, Bazzaz, F. and Sonbrek, W.G., eds., John Wiley & Sons,Chichester, U.K., pp. 49–65.
Brklacich, M., Stewart, R., Kirkwood, V. and Muma, R., 1994: Effects of global climatechange on wheat yields in the Canadian prairie. In: Implications of Climate Changefor International Agriculture: Crop Modelling Study. Rosenzweig, C. and Iglesias, A.,eds., U.S. Environmental Protection Agency, Washington DC.
Bronson, K.F., Mosier, A.R. and Bishnoi, S.R., 1992: Nitrous oxide emissions in irri-gated corn as affected by nitrification inhibitors. Soil Sci. Soc. Am. J., 56: 161–165.
REFERENCES 147
Brown, L.R. and Young, J.E., Feeding the world in the Nineties. In: State of the World1990, Brown, L.R., et al., eds., Worldwatch Institute Report on Progress Towarda Sustainable Society, 59–78, W.W. Norton and Co. Inc., New York.
Buan, R.D., Maglino, A.R., Evangelista, P.P. and Pajuelas, B.G., 1996: Vulnerabilityof Rice and Corn to Climate Change, in the Philippines. Climate Change,Vulnerability and Adaptation in Asia and the Pacific, Special Issue: Water, Airand Soil Pollution, 92/1–2: 41–51.
Bullock, P., Le Houerou, H., Hoffman, M.T., Rounsevell, M.D.A., Sehgal, J. andVarallyay, G., 1996: Land Degradation and Desertification. In: Climate Change1995: Impacts Adaptations and Mitigation of Climate Change: Scientific TechnicalAnalysis. Contribution of Working Group II to the Second Assessment Report of theIntergovernmental Panel on Climate Change, Watson, R.T., Zinyowera, M.C. andMoss, R.H., eds., Cambridge University Press, U.K., pp. 171–189.
Bumb, B.E., 1995: Growth potential of existing technology is insufficiently tapped. In:Population and Food in the Early 21st Century: Meeting Future Food Demand of anIncreasing World Population, Islam.N., eds., Occasional Paper, International FoodPolicy Research Institute (IFPRI), Washington DC, pp. 191–205.
Cacero, D.M., 1993: Peasant Strategies and Models of Technological Change: A Case StudyFrom Central Argentina. M. Phil. Thesis, University of Manchester, Manchester,U.K.
Callaghan, T.V., Korner, C., Lee, S.E. and Cornelison, J.H.C., 1998: Part 1: scenariosfor ecosystem responses to global change. In: Global Change in Europe’s ColdRegions, Heal, O.W., Callaghan, T.V., Comelissen, J.H.C., Korner, C. and Lee,S.E., eds., European Commission Ecosystems Research Report, 27, L-2985,Luxembourg, pp. 11–63.
Cameron, D. and Oram, P., 1994: Minimum and Reduced Tillage: Its use in North Americaand Western Europe and its Potential Applications in Eastern Europe, Russia andCentral Asia. International Food Policy Research Institute, Washington, DC, pp.121.
Campbell, B.D., Mckeon, G.M., Gifford, R.M., Clark, H., Stafford Smith, D.M.,Newron, P.C.D. and Luture, J.L., 1995: Impacts of atmospheric composition andclimate change on temperate and tropical pastoral agriculture. In: Greenhouse 94:Pearman, G. and Manning, M., eds., CSIRO, Canberra, Australia.
Campbell, B.D., Mckeon, G.M., Glifford, R.M., Clark, H., Stafford Smith, M.S.,Newton, P.C.D. and Lutze, J.L., 1996: Impacts of atmospheric composition andclimate change on temperate and tropical pastoral agriculture. In: Greenhouse:Coping With Climate Change, Bouma, W.J., Pearman, G.I. and Manning, M.R.,eds., CSIRO Publishing, Collingwood, Victoria, Australia, pp. 171–189.
Cannell, M.G.R., Grace, J. and Booth, A., 1989: Possible impacts of climatic warm-ing on trees and forests in the United Kingdom: a review. Forestry, 62: 337–364.
Carter, M.R. and Stewart, B.A., eds., 1996: Structure and Organic Matter Storage inAgricultural Soils, CRC Press, Boca Raton, Florida.
CAST (Council for Agricultural Science and Technology), 1984: Development of NewCrops: Needs, Procedures, Strategies and Options. CAST Report No. 102, Ames,Iowa, USA, 30 pp.
CAST, 1992: Preparing U.S. Agriculture for Global Climate Change. Report No. 119,Ames, Iowa, USA, 96 pp.
Cerri, C.C., Volkoff, B. and Andreaux, F., 1991: Nature and behaviour of organicmatter in soil under natural forest, and after deforestation, burning and cultiva-tion near Manaus. Forest Ecol. Manage., 38: 247–257.
Clark, R.N. and Stankey, G.H., 1991: New Perspectives or new forestry: the impor-tance of asking the right questions. Forest Perspective, 1: 9–13.
Claus, R. and Weiler, V., 1987: Seasonal variation of fertility in the pig and its expla-nation through hormonal profiles. Animal Breeding Abstract, 55, 963.
Cohen, S., Masterton, E. and Wheaton, J., 1992: Impacts of Climate Change Scenariosin the Prairie Provinces, A Case Study from Canada. SRC Publication No. E-2900-4-D-92, Saskatchewan Research, Saskatoon, Canada.
148 MANAGEMENT STRATEGIES IN AGRICULTURE AND FORESTRY FOR MITIGATION OF GREENHOUSE GAS EMISSIONS AND
ADAPTATION TO CLIMATE VARIABILITY AND CLIMATE CHANGE
Cole, C.V., Flach, K., Lee, J., Sauerbeck, D. and Stewart, B., 1993: Agricultural sourcesand sinks of carbon. Water, Air, Soil Pollut., 70: 111–122.
Cole, C.V., Cerry, C., Minami, K., Mosier, A., Rosenberg, N., Sauerbeck, D.,Damanski, J., Duxbury, J., Frency, J., Gupta, R., Heinemeyer, O., Kolchugina, T.,Lee, J., Paustian, K., Powlson, D., Sampson, N., Tiessen, H., Van Noordwijk, M.and Zhao, Q., 1996: Chapter 23: Agricultural options for mitigation of greenhousegas emissions. In: Climate Change 1995: Impacts, Adaptions and Mitigation of ClimateChange: Scientific-Technical Analyses, Watson, R.T., Zinyowera, M. and Moss, R.H.,eds., IPCC Working Group II, Cambridge University Press, Cambridge, U.K., pp.745–771.
COSEPUP, 1992: Policy Implications of Global Warming. National Academy Press,Washington, DC, pp. 1237.
Cramer, W.P. and Leemans, R., 1993: Assessing impacts of climate change on vegeta-tion using climate classification systems. In: Vegetation Dynamics and Global Change,Solomon A.M. and Shugart, H.H., eds., Chapman and Hall, New York andLondon, pp. 190–219.
Crosson, P., 1989: Climate change and mid-latitudes agriculture: perspectives on conse-quenses and rolicy responses. Climatic Change, 15: 51–73.
Crosson, P.R. and Rosenberg, N.J., 1989: Strategies for Agriculture, in Managing PlanetEarth, Special Issue of Scientific American, 260: 128–135.
Crutzen, P.J. and Goldammer, J.G., eds., 1993: Fire in the Environment: The Ecological,Atmospheric, and Climatic Importance of Vegetation Fires. Wiley, Chichester, U.K.,pp. 400.
Daily, G.C., 1995: Restoring value to the world’s degraded lands. Science, 269: 350–354.Dansgaard, W., White, J.W.C. and Johnsen, S.J., 1989: The abrupt termination of the
younger Dryas Climate event. Nature, London: 339: 532–533.Das, H.P., 1997: Agrometeorology Related to Extreme Events. WMO Training manual for
roving seminar, WMO, Geneva.Das, H.P., 1999: Strategies to be Adopted in Agriculture to Cope with the Impacts of Climate
Change and Climate Variability on Agriculture. Presented to RA-II Working GroupMeeting on Agricultural Meteorology (to be published as CAgM report, WMO),WMO, Geneva.
Das, H.P., 2000: The Effect of Climate Change on Forests and Adaptation Strategies to Cope with it. Paper presented at International Conference on Managing NaturalResources for Sustainable Agricultural Production in 21st Century, New Delhi.
Davidson, E.A. and Ackerman, I.L., 1993: Changes in soil carbon inventories follow-ing cultivation of previously untilled soils. Biogeochemistry, 20: 161–164.
Davison, T., McGowan, M., Mayer, D., Young, B., Jonsson, N., Hall, A., Matschoss,A., Goodwin, P., Goughan, J. and Lake, M., 1996: Managing Hot Cows in Australia.Queensland Department of Primary Industries, Brisbane, Australia, pp. 58.
Delecolle, R., Ruget, F., Ripoche, D. and Gosse, G., 1995: Possible effects of Climatechange on wheat and maize crops in France. In: Climate Change and Agriculture:Analysis of Potential International Impacts, Proceed. Sym. Amer. Soc. Agron.Mineapolis, MN, 4–5 Nov. 1992, ASA Spec. Publ., 59: 241–257.
Desjardins, R.L., Kulshreshta, S.N., Junkins, B., Smith, W., Grant, B. and Boehm, M.,2001: Canadian greenhouse gas mitigation options in agriculture. Nutr. Cycl.Agroecosys. 60: 317–326.
Desjardins, R.L., Smith, W.N., Grant, B., Janzen, H., Gameda, S. and Dumanski, J.,2002: Soil and crop management and the greenhouse gas budget of agroecosys-tems in Canada. J. of Soil and Water Conservation, (in press).
Diaz, S., 1995: Elevated carbon dioxide responsiveness, interaction at the communitylevel and plant functional types. Journal of Biogeography, 22: 289–295.
Dixon, R.K. and Krankina, O.N., 1993: Forest fires in Russia, carbon dioxide emissionsto the atmosphere. Canadian Journal of Forest Research, 23: 700–705.
Dobbie, K.E. and Smith, K.A., 1994: Effect of land use on the rate of uptake of methaneby surface soils in Northern Europe, Annales Geophysicae, supplement II, Part II,12: C388.
REFERENCES 149
Downing, T.E., 1992: Climate Change and Vulnerable Places: Global Food Security andCountry Studies in Zimbabwe, Kenya, Senegal, and Chile. Research Report No. 1,Environmental Change Unit, University of Oxford, pp. 54.
Easterling, W.E., Parry, M.L. and Crosson, P.R., 1989: Adapting future agriculture tochange in climate. In: Greenhouse Warming: Abatment and Adaptation, Resourcesfor the Future, Rosenberg, N.J., Easterling, W.E., Crosson, P.R. and Darmstadter,J., eds., Washington , DC., pp. 91.
Easterling, W.E., 1990: Climate Trends and Prospects. Island Press, Washington DC,pp. 32–55.
Easterling, W.E., Crosson, P.R., Rosenberg, N.J., McKenney, M.S., Katz, L.A. andLemon, K.M., 1993: Agricultural impact of and responses to climate change inthe Missouri-Iowa-Nebrasaka-Kanas (MINK) region. Climatic Change, 24(1–2):23–62.
Eid, H.M., 1994: Impact of climate change on simulated wheat and waize yields inEgypt. In: Implications of Climate Change For International Agriculture: CropModeling Study, Rosenzweig, C. and Iglesias, A., eds., U.S. EnvironmentalProtection Agency, Egypt Chapter, Washington, DC, pp. 1–14.
Escano, C.R. and Buendia, L.V., 1994: Climate impact assessment for agriculture inthe Philippines: simulation of rice yield under climate change scenarios. In:Implications of Climate Change For International Agriculture: Crop Modeling Study,Rosenzweig, C. and Iglesias, A., eds., U.S. Environmental Protection Agency,Philippines Chapter, Washington, DC, pp. 1–13.
Fankhauser, S., 1996: The potential costs of climate change adaptation. In: Adaptingto Climate Change: An International Perspective, Smith, J., Bhatti, N., Menzhulin,G., Benioff, R., Budyko, M.I., Campos, M., Jallow, B. and Rijsberman, F., eds.,Springer-Verlag, New York, U.S.A., pp. 80–96.
FAO, 1989: Guidelines for Designing and Evaluating Surface Irrigation Systems. Irrigationand Drainage Papers, 45, FAO, Rome, pp. 137.
FAO, 1991: Water Harvesting AGL. Miscellaneous Papers, 17, FAO, Rome, pp.133.Favis-Mortlock, D., Evans, R., Boardman, J. and Harris, T.M., 1991: Climate change,
winter wheat yield and soil erosion on the English South Downs. Agric. Syst., 37:415–433.
Feller, C., 1993: Organic inputs, soil organic matter and functional soil organiccompartments in low activity clay soils in tropical zones. In: Soil Organic MatterDynamics and Sustainability of Tropical Agriculture, Mulongoy, K. and Merckx, R.,eds., John Wiley and Sons, Chichester, U.K., pp. 77–88.
Fisher, M.J., Rao, I.M., Ayarza, M.A., Lascano, C.E., Sanz, J.I., Thomas, R.J. and Vera,R.R., 1994: Carbon storage by introduced deep rooted grasses in the SouthAmerican savannas. Nature, 371: 236–238.
Franklin, J.F., Swanson, F.J., Harmone, M.E., Perry, D.A., Spies, T.A., Dale, V.H.,Mckey, A. Ferrell, W.K., Means, J.E., Gregory, S.V., Lattin, J.D., Schowalter, T.D.and Larsen, D., 1992: Effects of global climate change on forests in northwesternNorth America. In: Global Warming and Biological Diversity, Peters, R.L. and T.Lovejoy, eds., Yale University Press, New Haven, CT and London, U.K., pp.244–257.
Gates, D.M., 1993: Climate Change and Its Biological Consequences. Sinauer AssociatesInc. Sunderland, MA, pp. 280.
Gbeckor-Kove, N., 1995: Main Climatic Events Affecting Agricultural Production. 4’emeSymposium International Sur1’, Assurance Agricole, WMO, Switzerland.
Goryachkin, S.V. and Targulian, V.O., 1990: Climate induced changes of the borealand subpolar soils. In: Scharpenseel, et al., eds., pp. 191–209.
Graetz, R.D., Walker, B.N. and Walker, P.A., 1988. The Consequences of Climate Changefor Seventy Percent of Australia. CSIRO Division of Atmospheric Research,Melbourne, Australia, pp. 399–420.
Greco, S., Moss, R.H., Viner, D. and Jenne, R., 1994: Climate Scenarios and Socio-economic Projections for IPCC WG II Assessment. IPCC-WMO and UNEP,Washington, DC, pp. 67.
150 MANAGEMENT STRATEGIES IN AGRICULTURE AND FORESTRY FOR MITIGATION OF GREENHOUSE GAS EMISSIONS AND
ADAPTATION TO CLIMATE VARIABILITY AND CLIMATE CHANGE
Greenland, D.J., 1995: Land use and soil carbon in different agroecological zones. In:Soil Management and Greenhouse Effects, Lal, R., Kimble, J., Levine, E. and Stewart,B.A., eds., Advances in Soil Science, CRC/Lewis Publishers, Boca, Raton, Florida,U.S.A., pp. 9–24.
Gupta, R.K. and Rao, D.L.N., 1994: Potential of wastelands for sequestering carbon byreforestation. Current Science, 66: 378–380.
Gunn, A. and Skogland, T., 1997: Responses of caribou and reindeer to global warm-ing. Ecological Studies, 124: 189–200.
Haas, G., Geier, U., Schulz, D.G. and Koepke, U., 1995a: Klimarelevanz desAgrarsektors der Bundesrepublik Deutschland: Reduzierung der Emission vonKohlendioxid Berichte ueber landwirtschaft 73, Landwirtschaftsverlag GmbH,Muenster-Hiltrup, Germany, pp. 387–400.
Haas, G., Geier, U. Schulz, D.G. and Koepke, U., 1995b: Vergleich Konventionellarund organischer Landbau-Teil I: Klimarelevante Kohlendioxid Emission durchden Verbrauch fossiler Energie, Berichte ueber Landwirtschaft 73,Landwirtschaftsverlag GmbH, Muenster-Hiltrup, Germany, pp. 401–415.
Hahn, G.L., 1990: Assessing the Impact of Global Climate Change on Animal Agriculture.Paper presented at the AMS Symposium on Biometeorology and Global Change,Anaheim, CA, February 9, 1990.
Hao, W.M., Scharffe, D. Crutzen, P.J., 1988: Production of nitrous oxide, methane andcarbon dioxide from soils in the tropical savanna during the dry season. J. Atmos.Chem., 7: 93–105.
Harrod, T.R., 1979: Soil suitability for grassland. In: Soil Survey Application, Clarvis,M.G. and Mackney, D., eds., Soil Survey Technical Monograph No. 13, 51–70.Harpenden, U.K.
Hauser, S. and Kang, B.T., 1993: Nutrient dynamics, maize yield and soil organic matterin alley cropping with Leucaena leucocephala. In: Soil Organic Matter Dynamics andSustainability of Tropical Agriculture, Mulongoy, K. and Merckx, R., eds., John Wileyand Sons, Chichester, U.K., pp. 215–222.
Haynes, R.J., Swift, R.S. and Stephen, R.C., 1991: Influence of mixed cropping rota-tions (pasture-arable) on organic matter content, water stable aggregation andclod porosity in a group of soils. Soil and Tillage Research, 19: 77–81.
Henderson-Sellers, A. and McGuffie, K., 1994: Land surface characterisation in green-house climate simulations. International Journal of Climatology, 14: 1065–1094.
Houghton, R.A. and Skole, D.L., 1990: Carbon. In: The Earth as Transformed by HumanAction, Turner, B.L., Clark, W.C., Kates, R.W., Richards, J.F., Mathews, J.T. andMeyer, W.B., eds., Cambridge University Press, New York, pp. 393–408.
Houghton, J.T., Callander, B.A. and Varney, S.A., eds., 1992: Climate Change 1992.The Supplementary Report to the IPCC Scientic Assessment, IntergovernmentalPanel on Climate Change, Cambridge University Press, pp. 200.
Houghton, R.A., 1994: The worldwide extent of land-use change. Bioscience, 44:305–313.
Hudson, N.W., 1995: Soil Conservation. Third edition, Batsford, London.Hulme, M., Wigley, T., Jiang, T., Zhao, Z., Wang, F., Ding, Y., Leemans, R. and
Markham, A., 1992: Climate Change due to the Green House Effect and itsImplications for China. CRU/WWF/SMA, World Wide Fund for Nature, Gland,Switzerland.
IPCC, 1992: Climate Change 1992. The IPCC Supplementary Report to the IPCCScientific Assessment. Supporting Material Working Group III, ResponseStrategies, Subgroup AFOS, WMO/UNEP, Geneva, pp. 14–22.
IPCC, 1996a: Scientific-technical analysis of impacts, adaptations, and mitigation ofclimate change. Vol. 2, Climatic Change 1995: IPCC Second Assessment Report,Cambridge University Press, Cambridge, U.K.
Janzen, H.H., 1987: Soil organic matter characteristics after long-term cropping to vari-ous spring wheat rotations. Can. J. Soil Sci., 67: 845.
REFERENCES 151
Jenkinson, D.S., Adams, D.E. and Wild, A., 1991: Model estimates of carbon dioxideemissions from soil in response to global warming. Nature (London), 351:304–306.
Jin, Z., Daokou, G., and Fang, J., 1994: Effects of climate change on rice productionand strategies for adaptation in Southern China. In: Implications of Climate Changefor International Agriculture: Crop Modeling Study, Rosenzweig, C. and Iglesias, A.,eds., U.S. Environment Protection Agency, China Chapter, Washington DC,pp.1–24.
Jonasson, S., Havstrom, M., Jensen, M. and Callaghan, T.V., 1993: In situ mineralisa-tion of nitrogen and phosphorous of Arctic soils after peturbations simulatingclimate change. Oecologia, 95: 179–186.
Jones, R.N. and Hennessy, K.J., 2000: Climate Change Impacts in the Hunter Valley: ARisk Assessment of Heat Stress Affecting Dairy Cattle. CSIRO AtmosphericResearch, Aspendale, Victoria, Australia, pp. 22.
Kane, D.L., Hinzman, L.D. and Zarling, J.P., 1991: Thermal response of the activelayers to climatic warming in permafrost environment. Cold Regions Sci. Technol.,19: 111–122.
Karim, Z., Hussian S.G. and Ahmed, M., 1996: Assessing impacts of climatic varia-tions on food-grain production in Bangladesh, climate change vulnerablity andadaptation in Asia and Pacific. Special Issue: Water, Air and Soil Pollution, 92/1–2:53–62.
Kavalerchik, S., Fisher, A., Golubtsov, V., Monocrovich, E., Pilifosova, O., Yeserkpova,L., Kozhahmetov, P., Lebed, L., Glumova, O., Skotselyas, I., Lee, V., Dolgih, S.,Gorneeva, Z., Mizina, S., Danchuk, D., Grossen, E., Startsev, A., Amirhanova,M., Inosemtseva, N., Papafanasopulo, G., Akimov, B., Medvedev, V. andAhmedzhanov, A., 1995: Overall Approaches and Preliminary Results from CountriesStudy. Interim Report on Climate Change Country Studies, pp. 49–55.
Keller, M., Veldkamp, M.E., Wettz, A.M. and Reiners, W.A., 1993: Effect of pastureage on soil trace-gas emissions from a deforested area of Costa Rica. Nature, 365:244–246.
Kenny, G.J. and Harrison, P.A., 1992: Thermal and moisture of grain Maize in Europe:model testing and sensitivity to climate change. Climate Research, 2: 113–129.
Kenny, G.J. and Harrison, P.A., 1993: Analysis of effects of climatic Change on broad-scale patterns of agroclimate in Europe. In: The Effect of Climatic Change onAgricultural and Horticultural Potential in Europe, Kenny, G.J., Harrison, P.A. andParry, M.A., eds., Environmental Change Unit, University of Oxford, Oxford,U.K., pp. 201–224.
Kern, J.S. and Johnson, M.G., 1991: The Impact of Conservation Tillage Use on Soil andAtmospheric Carbon in the Contiguous United States. EPA/600/3-91-056. USEPA,Environmental Research Lab.
King, G.A. and Neilson, R.P., 1992: The transient response of vegetation to climatechange: a potential source of carbon dioxide to the atmosphere. Water, Air andSoil Pollution, 64: 365–383.
Kirschbaum, M.U.F., 1993: A modelling study of the effects of changes in atmosphericcarbon dioxide concentration, temperature and atmospheric nitrogen input onsoil organic carbon storage. Tellus, 45B: 321–334.
Kirschbaum, M.U.F., Bullock, P., Evans, J.R., Goulding, K., Jarvis, P.G., Noble, I.R.,Rounsevell, M.D.A. and Sharkey, T.D., 1996: Ecophysiological, ecological andsoil processes in terrestrial ecosystems: a primer on general concepts and rela-tionships. In: Watson, R.T., Zinyowera, M.C. and Moss R.H., eds., Climate Change1995: Impacts, Adaptations and Mitigation of Climate Change: Scientific-TechnicalAnalyses. Contribution of Working Group II to the Second Assessment Report ofthe Intergovernmental Panel on Climate Change, Cambridge University Press,U.K., pp. 57–76.
Klein, R.J.T. and Tol, R.S.J., 1997: Adaptation to Climate Change: Options andTechnologies, An Overview Paper. Technical Paper FCCC/TP/1997/3, United
152 MANAGEMENT STRATEGIES IN AGRICULTURE AND FORESTRY FOR MITIGATION OF GREENHOUSE GAS EMISSIONS AND
ADAPTATION TO CLIMATE VARIABILITY AND CLIMATE CHANGE
Nations Framework Convention on Climate Change Secretariat, Bonn, Germany,pp. 33. Available online at http://www.unfccc.int/resource/docs/tp/tp3.pdf.
Klinedinst, P.L., Wilhite, D.A., Haha, G.L. and Hubbard, K.G., 1993: The potentialeffects of climate change on summer season dairy cattle milk production and repro-duction. Climatic Change, 23(1): 21–36.
Kos, Z., 1992: Sustainable Irrigation Planning Under the Climatic Changes. Proceed. Int.Conf. on Advances in Planning, Design and Management of Irrigation Systemsas Related to Sustainable Land Use, Leuven, pp. 193–202.
Kovda, V.A. and Pachepsky, Y.A., 1989: Soil Resources of the USSR, Their Usage andRecovering. The Report of the VII All-Union Congress of Soil Scientiest Academyof Sciences of the USSR, Scientific Centre of Biological Research, Puschino,USSR, pp.36.
Kuntze, H., 1993: Bogs as sinks and sources of carbon and nitrogen. Mitteilungen derDeutschen Bodenkundlichen Gesellschaft, 69: 277–280.
Kurz, W.A., Apps, M.J., Stocks, B.J. and Valney, W.J., 1995: Global climate change:disturbance regimes and biospheric feedbacks of temperate and boreal forests. In:Biospheric Feedbacks in the Global Climate System – Will the Warming Feed theWarming? Woodwell, G.M. and Mackenzie, F.T., eds., Oxford University Press,New York and Oxford, U.K., pp. 119–133.
Lal, R., De Vleeschauwer, D. and Nganje, R.M., 1980: Changes in properties of a newlycleared tropical alfisol as affected by mulching. Soil Sci. Soc. Am. J. 44: 827–833.
Lal, R., 1986: Soil surface management in the tropics for intensive land use and highand sustained production. Adv. Soil Sci., Vol. 5, Springer-Verlag, Inc., New York,pp. 109.
Lal, R., 1995: Global soil erosion by water and carbon dynamics. In: Soils and GlobalChange, Lal, R., Kimble, J., Levine, E., Stewart, B.A., eds., CRC/Lewis Publishers,Boca, Raton, Florida, pp. 131–142.
Lal, M., Singh, K.K., Rathor, L.S., Srinivasan, G. and Saseendrum, S.A., 1997:Vulnerablity of Rice and Wheat Yields in NW India to Future Changes in Climate.Centre for Atmospheric Science, Indian Institute of Technology, Tech. ReportNo. A/TR/1-96 (August 1996), New Delhi, pp. 29.
Le Bissonnais, Y., 1996: Aggregate stability and assessment of soil crustability anderodibility: I. Theory and methodology. Euro. J. Soil Sci, 47: 425–437.
Leads-Harrison, P.B. and Rounsevell, M.D.A., 1993: The impact of dry years on cropwater requirements in Eastern England. J. Inst. Water Env. Manag., 7: 497–505.
Lempert, R.J., Schlesinger, M.E. and Bankes, S.C., 1996: When we don’t know thecosts or the benefits: adaptive strategies for abating climate change. Climate, 33:235–274.
Lewandrowski, J. and Brazee, R., 1992: Governments, farms programmes and climatechange: a first look. In: Economic Issues in Global Climate Change: Agriculture,Forestry, and Natural Resources, Reilly, J. and Anderson, M., eds., Westview Press,Boulder, Co, pp. 132–147.
Lewandrowski, J.K. and Brazee, R.J., 1993: Farm programmes and climate change.Climatic Change, 23: 1–20.
Li, Z. and Zhao, Q., 1998: Carbon dioxide fluxes and potential mitigation in agricul-ture and forestry of tropical and subtropical China. Climate Change.
Lin, E.D., 1996: Agricultural vulnerablity and adaptation to global warming in China,climate change, vulnerablity and adaptation in Asia and the Pacific. Special Issue:Water, Air and Soil Pollution, 92/1–2: 63–73.
Lines, R., 1967. Woodlands as shelter on farm and fell. Q.J. of For., LXI, 103–114.Luo, Y., Field, C.B. and Mooney, H.A., 1994: Predicting responses of photosynthesis
and root fraction to elevated carbon dioxide: Interactions among carbon, nitro-gen and growth. Plant, Cell, and Environment, 17: 1195–1204.
Magadza, C.H. D., 1994: Climate change: some likely multiple impacts in SouthernAfrica. Food Policy, 19(2): 165–191.
Mahboubi, A.A., Lal, R. and Faussey, N.R., 1993: Twenty eight years of tillage effectson two soils in Ohio. Soil Sci. Soc. Amer. J., 57: 507–512.
REFERENCES 153
Malanson, G.P., Westman, W.E., and Yan, Y.N., 1992: Realized versus fundamentalniche functions in a model of Chaparral response to climatic change. EcologicalModelling, 64: 261–277.
Matthews, R.V., Kropff, M.J. and Bachelet, D., 1994a: Climate change and rice produc-tion in Asia. Entwicklungund Landlicherraum, 1: 16–19.
Matthews, R.V. Kropff, M.J., Bachelet, D. and Van Laar, H.H., 1994b: The Impact ofGlobal Climate Change on Rice Production in Asia: A Simulation Study. Report No.ERL-COR-821, U.S. Environmental Protection Agency, Environmental ResearchLaboratory, Corrallis, OR.
Matthews, R.B., Kropff, M.J. and Bachelet, D., 1995: Modelling the Impacts of ClimateChange on Rice Production in Asia. CAB International, Oxford and InternationalRice Research Institute, Manila, Philippines.
Maytin, C.E., Acevedo, M.F., Jaimez, R., Andressen, R., Harwell, M.A., Robock, A.,Azocar, A., 1995: Potential effects of global climate change on the phenology andyield of maize in Venezuela. Climate Change, 29: 189–211.
McCorcle, M.D., 1990: Atmospheric response to 1988 drought conditions and futureclimate implications. J. Iowa Acad. Sci., 97: 84–87.
McGregor, J., 1994: Climate change and involuntary migration. Food Policy, 19(2):121–132.
Mckeon, G.M., Howden, S.M., Abel, N.O.J. and King, J.M., 1993: Climate change:adapting tropical and subtropical grassland. In: Proceeding XVII InternationalGrassland Congress, CSIRO, Melbourne, pp. 1181–1190.
McTaggart, I., Clayton, H. and Smith, K., 1994: Nitrous oxide flux from fertilized grass-land: strategies for reducing emissions. In: Non-carbon dioxide Greenhouse Gases,Van Ham, J. et al., eds., Kluwer Academic Publishers, Dordrecht, Netherlands,pp. 421–426.
Melillo, J.M., Mc Guire, A.D., Kicklighter, D.W., Moore, B., Vorosmarty, C.J. andSchloss, A.L., 1993: Global climate change and terrestrial net primary produc-tion. Nature (London), 363: 234–240.
Mendelsohn, R., Nordhaus, W.D. and Shaw, D., 1994: The impact of global warmingon agriculture: Aricardian analysis. American Economic Review, 84(4): 753–771.
Mizina, S.V., Smith, J., Gossen, E., Spiecker, K. and Witkowski, S., 1999: An evalua-tion of adaptation options for climate change impacts on agriculture inKazakhstan. Mitigation and Adaptation Strategies for Global Change, 4: 25–41.
Morgan, R.P.C., 1995: Soil Erosion of Conservation. Second edition, Longman, Harlow,U.K.
Morikawa, Y., 1993: Climate changes and forests. In: The Potential Effects of ClimateChange in Japan, Harasawa, S.N., Hashimoto, H., Ookita, T., Masuda, K. andMorita T., eds., Centre for Global Envirnmental Research, Tsukuba, Ibaraki; 305,Japan, pp. 37–44.
Mosier, A.R., Schimel, D.S., Valentine, D., Bronson, K.F. and Parton, W.J., 1991:Methane and nitrous oxide fluxes in native, fertilized and cultivated grasslands.Nature, 350: 330–332.
Myers, N., 1993: Questions of mass extinction. Biodiversity and Conservation, 2: 2–17.Nouchi, I., Hosono, T., Aoki, K. and Minami, K., 1994b: Seasonal variation in
methane flux from rice paddies associated with methane concentration in soilwater, rice biomass and temperature, and its modelling. Plant and Soil, 161:195–208.
Oechel, W.C., Hastings, S.J., Vourlitis, G., Jenkins, M., Riechers, G. and Grulke, N.,1993: Recent change of Arctic tundra ecosystems from a net carbon dioxide sinkto a source. Nature (London), 361: 520–523.
Ojima, D.S., Valentine, D.W., Mosier, A.R., Parton, W.J. and Schimel, D.S., 1993:Effect of land use change on methane oxidation in temperate forest and grasslandsoils. Chemosphere, 26: 675–685.
Oram, P.A. and Hojjati, B., 1995: The growth potential of exsiting agricultural tech-nology. In: Population and Food in the Early 21st Century: Meeting Future Fooddemand of an Increasing World Population, Islam, N., eds., Occasional Paper,
154 MANAGEMENT STRATEGIES IN AGRICULTURE AND FORESTRY FOR MITIGATION OF GREENHOUSE GAS EMISSIONS AND
ADAPTATION TO CLIMATE VARIABILITY AND CLIMATE CHANGE
International Food Policy Research Institute (IFPRI), Washington DC, pp.167–189.
Orr, W.N., Cowan, R.T. and Davison, T.M., 1993: Factors affecting pregnancy rate inHolstein-friesian cattle mated during summer in a tropical upland environment.Australian Veterinary Journal.
Parry, M.L., Blantran, M., Chong, A.L. and Punich, S., 1992: The Potential Socio-Economic Effects of Climate Change in South-East Asia. United NationsEnvironment Programme, Nairobi, Kenya.
Pasternak, D. and Wilson, G.L., 1969: Effects of heat waves on grain sorghum at thestages of head emergence. Aust. J. Exp. Agric. An. Husb., 9: 636–8.
Paul, E.A., Paustian, K., Elliott, E.T. and Cole, C.V., 1997: Soil Organic Matter inTemperate Agroecosystems: Long-term Experiments in North America. CRC Press,Boca Raton, Florida, pp. 414.
Penning-Rowsell, E.C. and Fordham, M.H., 1994: Floods Across Europe: Flood HazardAssessment, Modelling and Management. Middlesex University Press, London.
Pezeshki, S.R. De Laune, R.D. and Patrick, W.H., 1990: Flooding and saltwater intru-sion: potential effects on survival and productivity of wetland forests along theU.S. Gulf Coast. Forest Ecol.and Manag., 33–34: 287–301.
Phillips, D.L., White, D. and Johnson, B., 1993: Implications of climate change scenar-ios for soil erosion potential in the U.S.A. Land Degradation and Rehabilitation, 4:61–72.
Pielke, R.A.Jr. and Landsea, C.W., 1998: Normalized hurricane damages in the UnitedStates: 1925–1955. Weather and Forecasting, (in press).
Pilifosova, O., Eserkepova, I. and Misina, S., 1996: Vulnerablity and adaptation assess-ment for Kazakstan, vulnerablity and adaptation to climate change. Interim Resultsfrom the U.S. Country Studies Program, Smith, J.B., Hug, S., Lenhart, S., Mata, L.J.,Nenesova, I., and Toure, S., eds., Kluwer Academic Publishers, Boston, pp.161–181.
Pimentel, D., 1991: Global warming, population growth and natural resources for foodproduction. Soc. Nat. Res., 4: 347–363.
Porter, J.R., 1993: AFRCWHEAT2: a model of the growth and development of wheatincorporating responses to water and nitrogen. European Journal of Agronomy, 2:69–82.
Prasad, R. and Power, J.F., 1991: Crop residue management. Advances in Soil Sciences,15: 205–251.
Pregitzer, K.S. and Atkinson, D., 1993: Impact of climate change on soil processes andsoil biological activity. BCPC Monograph, 56: 71–82.
Prentice, I.C. and Sykes M.T., 1995: Vegetation geography and global carbon storagechanges. In: Biospheric Feedbacks in the Global Climate System – Will the WarmingFeed the Warming? Woodwell, G.M. and Mackenzie, F.T., eds., Oxford UniversityPress, New York, and Oxford, U.K., pp. 304–312.
Raich, J.W., Rastetter, E.B., Mellilo, J.M., Kicklighter, D.W., Steudler, P.A., Peterson,B.J., Grace, A.L., Moore III, B. and Vorosmarty, C.J., 1991: Potential net primaryproduction in South America: application of a global model. EcologicalApplications, 1(4): 399–429.
Ramirez, J.A. and Finnerty, B., 1996: Carbon dioxide and temperature effects on evap-otranspiration and irrigated agriculture. J. Irrig. Drain. Eng., 122: 155–163.
Ramos, C., Lidon, A.L. and Rodrigo, A., 1994: The effects of climate change on irri-gated soils: water resources and solute leaching. In: Soil Responses to ClimateChange, Rounsevell, M.D.A., and Loveland, P.J., eds., NATO ASI Series 23,Springer-Verlag, Heidelberg, pp. 99–111.
Rao, D.G., Katyal, J.C., Sinha, S.K. and Srinivas, K., 1995: Impacts of climate changeon sorghum productivity in India: simulation study. In: Climate Change andAgriculture: Analysis of Potential Impacts, Rosenzwig, C., Allen, L.H., Harper, L.A.,Hollinger, S.E. and Jones, J.W., eds, American Society of Agronomy, SpecialPublication No. 59, Madisens, Wisconsin, pp. 325–337.
REFERENCES 155
Rath, D., Gadeken, D., Hesse, D. and Schlichting, M.C., 1994: EinflubvonKlinafaktoren auf dre tier production. In: Klimaveranderungen und LandwirtschaftPart II, Landbauforchung, Brunnert, H. and Dammgen, U., eds.
Reicosky, D.C. and Lindstrom, M.J., 1995: Impact of fall tillage on short-term carbondioxide flux. In: Soils and Global Change: Advances in Soil Science, Lal, R., Kimble,J., Levine, E. and Stewart, B.A., eds., CRC/Lewis Publishers, Boca Raton, Florida,pp. 440.
Reilly, J., Hohmann, N.and Kane, S., 1994: Climate change and agricultural trade:who benefits, who loses? Global Environmental Change, 4 (1): 24–36.
Riedacker, A., Dreye, E., Joly, H. and Pafadnam, C., 1994: Physiologie des Arbres etArbusters en Zones Arides et Semi-Arides. John Libbey, Montrouge, France, pp. 489.
Rosenberg, N.J., 1992: Adaptation of agriculture to climate change. Climatic Change,21: 385–405.
Rosenzweig, C., 1985: Potential CO2-Induced Climate Effects on North AmericanWheat Producing Regions. Climatic Change, 7: 367–389.
Rosenzweig, C., Curry, B., Richie, J.T., Jones, J.W., Chou, T.Y., Goldberg, R. andIglesias, A., 1994: The effects of potential climate change on simulated grain cropsin the United States. In: Implications of Climate Change for International Agriculture:Crop Modelling Studies, Rosenzweig, C. and Iglesias, A., eds., U.S. EnvironmentalProtection Agency, Washington DC, pp. 1–24.
Rounsevell, M.D.A. and Jones, R.J.A., 1993: A soil and agroclimatic model for esti-mating machinery work days: the basic model and climatic sensitivity. Soil Till.Res., 26: 179–191.
Rounsevell, M.D.A., 1993: A review of soil workability Mmodels and their limitationsin temperate regions. Soil Use Manag., 9: 15–21.
Rounsevell, M. D. A. and Brignall, A. P., 1994:.The potential effects of climate changeon autumn soil tillage opportunities in England and Wales. Soil Till. Res., 32:275–289.
Rounsevell, M.D.A., Brignall, A.P. and Siddons, P.A., 1996a: Potential climate changeeffects on the distribution of agricultural grassland in England and Wales. Soil UseManag., 12: 44–51.
Rounsevell, M.D.A., Bullock, P. and Harris, J., 1996b: Climate change soils andsustainability. In: Soils and Sustainability and the Natural Heritage, Taylor, A.G.,Gordon, J.E., and Usher, M.B., eds., Scottish Natural Heritage, HMSO, London,pp. 121–139.
Rounsevell, M.D.A., Evans, S.P. and Bullock, P., 1999: Climate change and agricul-tural soils: impacts and adaptation. Climatic Change, 43: 683–709.
Salinger, M.J. and Porteus, A.S., 1993: Climate change and variability: impacts onNew Zealand pastures. In: Proceedings XVII International Grassland Congress, pp.1075–1077.
Salinger, M.J., Stigter, C.J. and Das, H.P., 2000: Agrometerological adaptation strate-gies to increasing climate variability and climate change. Agric. For. Meteor., 103:167–184.
Sampson, R.N., Wright, L.L., Winjum, J.K., Kinsman, J.D., Benneman, J., Kurtsen, E.and Scurlock, J.M.O., 1992: Biomass management and energy. In: TerrestrialBiospheric Carbon Fluxes: Quantification of Sinks and Sources of Carbon Dioxide,Wisniewski, J. and Sampson, R.N., eds., Kluwer Academic Publishers, Drodrecht,Netherlands, pp. 139–162.
Sanchez, P.A., Palm, C.A. and Smyth, T.J., 1990. Approaches to mitigate tropicaldeforestation by sustainable soil management practices. In: Soils on a Warmer Earth,Scharpenseel, H.W., Schomaker, M. and Ayoub, A., eds., Elsevier, Amsterdam,the Netherlands, pp. 211–220.
Sass, R.L., Fisher, F.M., Wang, Y.B., Turner, F.T. and Jund, M.F., 1992: Methane emis-sion from rice fields: the effect of flood water management. Global Biogeochem.Cycles, 6: 249–262.
156 MANAGEMENT STRATEGIES IN AGRICULTURE AND FORESTRY FOR MITIGATION OF GREENHOUSE GAS EMISSIONS AND
ADAPTATION TO CLIMATE VARIABILITY AND CLIMATE CHANGE
Sauerbeck, D., 1992: Funktionen and Bedeutung der Organischen Substanzen fur dieBodenfruchtbarkeit-ein Ueberlick, Bodennutzung and Bodenfruchtbarkeit, Vol.4, Humushaushalt Berichte ueber Landwirstschaft, 206: 13–29.
Sauerbeck, D., 1993: Carbon dioxide emissions from agriculture: sources and mitiga-tion potentials. Water, Air, Soil Pollut., 70: 381–388.
Sauerbeck, D., 1994a: Die Landwirtschaft als Verusacherin und Betroffene MoeglicherKlimaveraenderungen. Klimaforschung in Bayern. In: Rundgespraeche derKommission fuer Oekologie, Bayrische Akademie der Wissenschaften, ed., BD.8,Verlg. F. Pfeil. Muenchen, pp, 151–168.
Sauerbeck, D., 1994b: Nitrogen fertilization and nitrogen balance – environmentalconsequences and limitations. In: The Terrestrial Nitrogen Cycle as Influenced byMan, Mohr, H.U. and Muentz, K., ed., Nova Acta Leopoldina (Halle), 70:441–447.
Schimel, D.S., Enting, I.G., Heimann, M., Wigley, T.M.L., Reynaud, D., Alves, D. andSiegenthaler, U., 1995: Carbon dioxide and the carbon cycle. In: Climate Change,1994: Radiative Forcing of Climate Change and an Evaluation of the IPCC IS92Emission Scenarios, Houghton, J.J., Meiro Filro, L.G., Bruce, J., Lee, H., Callander,B.A., Haites, E., Harris, N., and Maskell, K., eds., Cambridge University Press,Cambridge, U.K., 35–71.
Seino, H., 1993: Impacts of climatic warming on Japanese agriculture. In: The PotentialEffects of Climate Change in Japan, Shuzo, M., Hideo, H., Hirokazu, H., Toshiichi,O. and Tsuneyuki, M., eds., Environment Agency of Japan, Tokyo, pp. 15–35.
Shaver, G.R., Billings, W.D., Chapin III, F.S., Giblin, A.E., Nadelhoffer, K.J., Oechel,W.C., and Rastetter, E.B., 1992: Global change and the carbon balance of Arcticecosystems. Biosci, 42: 433–441.
Sidhu, A.S. and Sur, H.S., 1993: Effect of incorporation of legume straw on soil prop-erties and crop yield in a maize-wheat sequence. Trop. Agric. (Trinidad), 70:226–229.
Singh, U., 1994: Potential Climate Change Impacts on the Agricultural Systems of the SmallIsland Nations of the Pacific. Draft, IFDC-IRRI, Los Banos, Philippines, pp.28.
Sirontenko, O.D., Abashina, E.V. and Pavlova, V.N. 1984: The estimates of climatevariations of crops productivity. The Proceeding of the USSR Academy of Science:Physics of Atmosphere and Ocean, 20(11): 1104–1110, (in Russian).
Sirotenko, O.D. et al., 1991: Global warming and the agroclimatic resources of theRussian Plain. Soviet Geography, 32(5): 337–384.
Sirontenko, O.D. and Abashina, E.V., 1994: Impact of global warming on the agrocli-matic resources and agriculture productivity of Russia: result of the simulation.Meteorology and Hydrology, 4.
Sivakumar, M.V.K., 1993: Global climate change and crop production in the Sundano-Sahelian zone of West Africa. In: International Crop Science, Vol I., Crop ScienceSociety of America, Madison, WI.
Skerman, P.J., 1956: Heat waves and their significance in Queensland’s primary indus-tries. Arid Zone Res., 11: 195–8.
Smettem, K.J.R., Rovira, A.D., Wace, S.A., Willson, B.R. and Simon, A., 1992: Effectof tillage and crop rotation on the surface stability and chemical properties of ared-brown earth (alfisol) under wheat. Soil Till. Res., 22: 27–40.
Smith, T.M., Leemans, R. and Shugart, H.H., 1992a: Sensitivity of terrestrial carbonstorage to carbon dioxide-induced climate change:Comparison of four scenariosbased on general circulation models. Climatic Change, 21: 367–384.
Smith, J.B., 1997: Setting priorities for adaptation to climate change. GlobalEnvironmental Change, 7(3): 251–264.
Sombroek, W.G., 1990: Soils on a warmer earth: the tropical regions. In: Scharpenseel,et al., eds., 1990: 157–174.
Stem, E., Mertz, G.A., Stryker, J.D. and Huppi, M., 1988: Changing Animals DiseasePatterns Introduced by the Greenhouse Effect: Report of a Preliminary Study to theEnvironmental Protection Agency. Tufts University School of Veterinary Medicine,North Grafton, MA pp. 76.
REFERENCES 157
Steudler, P.A., Bowden, R.D., Melillo, J.M. and Aber, J.D., 1989: Influence of nitro-gen fertilization on methane uptake in temperate forest soils. Nature, 341:314–316.
Stigter, C.J. and Baldy, C., 1995: Manipulation of the microclimate by inter-cropping:making the best of services rendered. In: Ecophysiology of Tropical Inter-Cropping,Sinoquet, H., Cruz, P., eds., INRA, Paris, pp. 29–44.
Tegen, I., Lacis, A.A. and Fung, I., 1996: The influence on climate forcing of mineralaerosols from disturbed soils. Nature, 380: 419–422.
Thornley, J. H. M., Fowler, D. and Cannell, M .G. R., 1991: Terrestrial carbon storgaeresulting from CO2 and nitrogen fertilization in temperate grasslands. Plant, Celland Environment, 14: 1007–1011.
Tiessen, H., Feller, C., Sampaio, E.V.S.B. and Garin, P., 1998: Carbon sequestrationand turn over in semi-arid savannas and dry forest. Climate Change.
Tiessen, H., Cuevas, J.A. and Chacon, P., 1994: The role of soil organic matter stabil-ity in soil fertility and agricultural potential. Nature, 371: 783–785.
Tinker, P.B. and Ineson, P., 1990: Soil organic matter and biology in relation to climatechange. In: Soils on a Warmer Earth, Scharpenseel, H.W., Schomaker, M. andAyoub, A., eds., Elsevier, pp. 71–78.
Tol, R.S.J., Jansen, H.M.A., Klein, R.J.T. and Verbruggen, H., 1996: Some economicconsiderations on the importance of proactive integrated coastal zone manage-ment. Ocean and Coastal Management, 32(1): 39–55.
Tol, R.S.J., Grip, N.M., van der Olsthoorn, A.A. and van der Werff P.E., 1999: Adaptingto Climate Change: A Case Study on Riverine Flood Risks in the Netherlands. Societaland Institutional Response to Climate Change and Climate Hazards (SIRCH)Working Paper 5, Institute for Environmental Studies, Vrije Universiteit,Amsterdam, the Netherlands, pp. 9.
Tongyai, C., 1994: Impact of Climate Change on Simulated Rice Production in Thailand,Implications of Climate Change for International Agriculture: Crop Modelling Study,Rosenzeig, C., and Iglesias, A., eds., U.S. EPA, Washington, DC.
Topp, C.F.E. and Doyle, C.J., 1996: Simulating the impact of global warming on milkand forage production in Scotland. Part 2: the effects on milk yields and grazingmanagement of dairy herds. Agricultural Systems, 52: 243–270.
UNCED, 1992: Statement of Forest Principles. Final text of agreements negotiated bygovernments at the United Nations Conference on Environment andDevelopment (UNCED), 3–14 June 1992, Rio de Janeiro, Brazil, United Nations,Department of Public Information, New York, pp. 294.
USEPA, 1990: Greenhouse Gas Emissions from Agricultural Systems. Proc. IPCC-RSWG-AFOS Workshop, Vols. 1 and 2, USEPA-OPA, Washington, DC,IPCC/WMO, Geneva, Switzerland.
USEPA, 1994: International Anthropogenic Methane Emissions: Estimates for 1990. EPA20-R-93-010, U.S Environmental Protection Agency, Office of Policy, Planningand Evaluation, Washington, DC, pp. 2122.
Varallyay, G., 1994: Climate change, soil salinity and alkalinity. In: Soil Responses toClimate Change, Rounsevell, M.D.A. and Loveland, P.J., eds., NATO ASI Series23, Springer-Verlag, Heidelberg, pp. 39–54.
Ventskevich, G.Z., 1961: Agrometeorology. Translated from Russian by IsraelProgramme for Scientific Translations, Jerusalem, pp. 200.
Waelbroeck, C., 1993: Climate soil processes in the presence of permafrost: a systemmodeling approach. Ecol. Model., 69: 185–225.
Wagenet, R.J., Hutson, J.L. and Bouma, J., 1994: Modelling water and chemical fluxesas driving forces of pedogenesis. In: Quatitative Modelling of Soil Forming Processes,Bryant, R.B. and Arnold, R.W., eds., Proceedings Symposium Soil Sci. Soc. Amer.Minneapolis, Minnesota, U.S.A.
Waggoner, P.E., 1993: Assessing nonlinearities and surprises in the links of farming toclimate and weather. In: Assessing Surprises and Non Linearities in GreenhouseWarming, Darmstadter, J. and Toman, M.A., eds., Resources for the Future,Washington, DC., pp. 45–65.
158 MANAGEMENT STRATEGIES IN AGRICULTURE AND FORESTRY FOR MITIGATION OF GREENHOUSE GAS EMISSIONS AND
ADAPTATION TO CLIMATE VARIABILITY AND CLIMATE CHANGE
Wang, Mingxing, Dai Aiguo, Shangguan Xingjian, Ren Lixin, Shen Renxing, Schwz,H., Seiler, W., Rasmussen, R.A. and Khalil, M.A. K., 1994: Sources of methanein China. In: Methane and Nitrous Oxide: Global Emissions and Controls from RiceFields and other Agricultural and Industrial Sources, Minami, K., Mosier, A. and Sass,R., eds., NIAS, Yokendo Publishers, Tokyo, Japan, pp. 9–26.
Wang, Y.P., Handoko, J.R. and Rimmington, G.M., 1992: Sensitivity of wheat growthto increased air temperature for different scenarios of ambient carbon dioxideconcentration and rainfall in Victoria, Australia – a simulation study. ClimaticResearch, 131–149.
Weaver, P.L., Birdsey, R.A. and Lugo, A.E., 1987: Soil organic matter in secondaryforests of Puerto Rico. Biotropica 16: 17–23.
Webb III, T. and Bartlein, P.J., 1992. Global changes during the last three million years:climatic controls and biotic responses. Annual Review of Ecology and Systematics,23: 141–173.
Weller, G. and Lange, M., 1999: Impacts of Global Climate Change in the Arctic Regions.International Arctic Science Committee, Center for Global Change and ArcticSystem Research, University of Alaska, Fairbanks, AK, U.S.A., pp. 1–59.
White, R.E., 1981: Introduction to the Principles and Practices of Soil Science. BlackwellScientific Publications, Oxford, U.K., pp.198.
Wijeratne, M.A., 1996: Vulnerability of Sri Lanka tea production to global climatechange: climate change, vulnerability and adaptation in Asia and the Pacific.Special Issue: Water, Air, Soil Pollution, 92/1–2: 87–94.
Winjum, J.K., Dixon, R.K. and Schroeder, P.E., 1993: Forest management and carbonstorage: an analysis of twelve key forest nations. Water, Air, and Soil Pollution, 70:239–257.
Woodward, F.I. and Kelly, C.K., 1995: The influence of carbon dioxide concentrationon stomatal density. New Phytologist, 131: 311–327.
Wullschleger, S.D., Post, W.M. and King, A.W., 1995: On the potential for a carbondioxide fertilization effect in forests: estimates of the biotic growth factor, basedon 58 control-exposure studies. In: Biospheric Feedbacks in the Global Climate System– Will the Warming Feed the Warming? Woodwell, G.M. and Mackenzie, F.T., eds.,Oxford University Press, New York, and Oxford, U.K., pp. 85–107.
Yohe, G.W. and Schlesinger, M.E., 1998: Sea level change: the expected economiccost of protection or abandonment in the United States. Climate Change, 38:447–472.
Zhang, H., 1993: The Impact of Green House Effect on Double Rice in China, ClimateChange and Its Impact. Meteorology Press, Beijing, China, pp. 131–138.
Zhukovsky, E.E. and Belchenko, G.G., 1988: The stochastic system of crop yields fore-casting. Transactions of the Agrophysical Institutes, 70: 2–7 (in Russian).
Al Hakini, A., Rekika, D., Barries, C. et Monneveux, P., 1995: The use of tetraploidwheats to improve drought tolerance in durum wheat. In: Durum Wheat, SewanaWorkshop Aleppo, ICARDA.
Armenta-Sato, J., Chang, T.T., Loresto, G.C. et O’Toole, J.C., 1982: Genetic analysisof root characters in rice. Sabrao J. 15: 103–108.
Blum, A., 1988: Plant Breeding for Stress Environments. CRC Press, Boca Raton, Florida,pp. 223.
Bootsma, A., Boisvert, J.B., Jong, R.D., Baier, W., 1995: La sécheresse et l’agriculturecanadienne: revue des moyens d’action, Sécheresse, 4, vol. 7.
Bretaudeau, A. et Traore, B.M., 1991: Caractérisation de quelques paramètres morpho-physiologiques de deux variétés de sorgho (Sorghum bicolor Moench) soumises à unstress hydrique de fin de cycle. Rev. Res. Amélior. Prod. Agr. Milieu Arid, 3: 21–34.
Bretaudeau, A., Traore, B.M, Traore, S., Toure, .O.S. et Keita, M., 1994: Contributionà l’utilisation des paramètres morpho-physiologiques et agronomiques pour lasélection de variétés de sorgho résistantes à la sécheresse. In: Bilan hydrique agri-cole et sécheresse en Afrique Tropicale, Libbey, J., ed., Eurotext, Paris, pp. 125–136.
CHAPTER 6
REFERENCES 159
Charmard, P.C., Courel, M.F. et Schilling, M.A., 1997: L’inondation des planies dudelta intérieur du Niger (Mali). Tentatives de contrôle: la réalité et les risques.Sécheresse, Vol. 8, No. 3: 151–156.
Diarra, B., 1997: Rationalisation de l’assistance agrométéorologique opérationnelle au monderural. D.E.S. en Sciences de l’Environnement, Option Agrométéorologique,Fondation Universitaire Luxembourgeoise (F.U.M), Arlon, Belgique.
Van Diepen, C.A., Rappoldt, C., Wolf, J. and Vankeulen, H., 1984: CWFS crop growthsimulation model WOFOST documentation (version 4.1.) and fortran listing CWFS,Amsterdam/Wageningen, 130 pp.
DNSI, 1997: Perspective de population par cercle et par arrondissement (1993–1997).DNSI, 1997, Bamako.
DRPS, 1997: Annuaire statistique de la région de Koulikoro-année 1995, DRPS/Koulikoro.Ekayanake, U., O’Toole, J.C., Garrity, D.P. et Masajo, T.M., 1985: Inheritance of root
characters and their relation to drought tolerance in rice. Crop Sci., 25: 927–933.GIEC Groupe de travail II, 1996: Les Cahiers de Global Change No. 7: Conséquences de
l’Evolution du Climat, GIEC, pp. 51–53.Heinrich, D. et Herger, M., 1993: Atlas de l’écologie, pp. 170–253.Henson, I.E., Mahalakshimi, V, Bidinger, F.R. and Alargaswarmy G., 1982: Osmotic
adjustment to water stress in pearl millet (pennisetum americanum L. Leeke) underfield conditions. Plant Cell Environ., 5: 147–154.
IPCC Working Group II, 1998: The Regional Impacts of Climate Change: An Assementof Vulnerability. A special report of IPPC Working Group II, Cambridge UniversityPress, U.K.
Kellog, W.W., Schware, R, 1981: Climate Change and Society. Consequences of IncreasingCarbon Dioxide. Westview Press, Boulder, Colorado, U.S.A., pp. 178.
Van Keyken, H. and. Seligmann, N.G., 1987: Simulation of Water Use, NitrogenNutrition and Growth of a Spring Wheat Crop. Simulation Monographs, Rudac,Wageningen, pp. 310.
Konate, M., 1993: Amélioration des projets pilotes d’assistance météorologiques à l’agricul-ture. Centre AGRYMET, Niamey.
Konate, M. and Traore, K., 1987: Agroclimatic monitoring during the growing seasonin sem-arid regions of Africa. In: Planning of Drought, Toward a Reduction of SocietalVulnerability, Westwiew Press/Boulder and London.
Kunkel, K.E. and Angel, J.R., 1988: Perspective on the 1988 midwestern drought. EOS,70.
Houghton, J.T., Jenkins, G.J., Epharaums, J.J., eds., 1990: Climatic Change: the IPCCScientific Assessment Intergovernmental Panel on Climate Change, WMO/UNEP,Geneva, pp. 365.
Le Houerou, H.N., 1994: Changements climatiques et désertification. Sécheresse, No.2, Vol. 4: 95–111.
Monneveux, P. et This, D., 1997: La génétique face au problème de la tolérance desplantes cultivées à la sécheresse: espoirs et difficultés. Sécheresse, No. 1, Vol. 8:29–37.
MSSPA, 1990: Déclaration de politique sectorielle de santé et population. MSSPA, Bamako.MSPAS, 1997: Plan décennal de développement socio-sanitaire du Mali 1998–2007.
MSPAS, Bamako.Okoth-Ogendo, H. and Ojwang, J.B., 1995: A Climate for Development: Climate Change
Policy Options for Africa. ACTS Press, Nairobi, Kenya, SEI, Stockholm Sweden.Ouarzane A., 1993: Etude comparée des propriétés de la phospho-énol pyruvate
carboxylase foliaire de deux cultivars de sorgho (Sorghum bicolor L. Moench)pendant la sénescence et en réponse à des contraintes hydriques en conditionscontrôlées. Thèse Doc., Sc. et Techn. De l’environnement, Paris XII, pp. 169.
Parry, M., 1990: Climate Change and World Agriculture. Earthscan Publications Ltd inassociation with the International Institute for Applied Systems Analysis, UnitedNations Environment Programme.
PNUD/UNICEF/DNSI, 1995: Bilan diagnostic du développement humain durable, DNSI,Bamako.
160 MANAGEMENT STRATEGIES IN AGRICULTURE AND FORESTRY FOR MITIGATION OF GREENHOUSE GAS EMISSIONS AND
ADAPTATION TO CLIMATE VARIABILITY AND CLIMATE CHANGE
Roarke, B. et Quisenberry, J.E., 1997: Environmental and genetic components of stom-atal behavior in two genotypes of upland cotton. Plant Physiol. 59: 354–358.
Schneider, S.H., 1988: The greenhouse effect and the U.S. summer of 1988: cause andeffect or a media event. Climate Change 13: 113–115.
Schutz, 1995: Environnement et pollution.Shendan, D., 1985: L’irrigation, promesses et dangers: l’eau contre la faim? Earthscan,
l’Harmattan (édition).Sivakumar, M.V., Konate K.M. et Virmani, S.M., 1987: Agriclimatologie de l’Afrique de
l’Ouest: le Mali. Bulletin d’information No. 19, ICRISAT.Downing, T.E., 1992: Climatic Change and Vulnerable Places: Global Food, Security and
Country Studies in Zimbabwe, Kenya, Senegal and Chile. Environnemental ChangeUnit, University of Oxford, U.K.
UNEP, 1996: Handbook on Methods for Climate Change Impact Assessment and AdaptationStrategies. Draft version 1.3, and Institute for Environmental Studies October,1996.
Usher, P., 1995: An overview of international actions to deal with climate change. In:Proceedings of the International Conference on National Action to Mitigate GlobalClimate Change, 7–9 June 1994, Copenhagen, Denmark.
Van Kraalingen, D.W.G. and Van Keulen, H., 1987: Model development and applicationfor the "Projet pilote en agrométéorogie". CABO, Wageningen, the Netherlands.
Ye Ruoiu, 1995: Studies on climate change problems and response measures in China.In: Proceedings of the International Conference on National Action to Mitigate GlobalClimate Change, 7–9 June 1994, Copenhagen, Denmark.
Zmirou D., 1996: Some issues on health impacts of air pollution. ERCA, 1996.
American Forest and Paper Association, Confederation of European Paper Industries,Canadian Pulp and Paper Association, Japan Paper Association and New ZealandForest Industries Council, 2000: Climate change, meeting the challenge of global climatechange – views of the forest and paper industry in New Zealand, Canada, Japan, UnitedStates and Europe. Joint paper.
British Columbia Council of Forest Industries, 2000: British Columbia Forest Industry:Greenhouse gas emission trends 1978–1999.
Canadian International Development Agency, March 2000: Tropical forests and climatechange. Forestry issues paper.
Canadian Pulp and Paper Association, 1996: Paper industry slashes greenhouse gas emis-sions. Annual review.
Carpentier, A., 2000: Efforts to reduce carbon dioxide emissions in the pulp and paper andforest industry in Europe. FAO Advisory Committee on Paper and Wood Products.
CEPI, 1999: Implications of the Kyoto Protocol for the European pulp and paper industry.Confederation of European Paper Industries.
CEPI, 2000: CEPI’s views on the climate change challenge. Confederation of EuropeanPaper Industries, November 2000.
Chomitz, K.M., 2000: Evaluating carbon offsets from forestry and energy projects: how dothey compare? Development Research Group, World Bank.
Communication from the Commission to the Council and European Parliament onE.U. policies and measures to reduce greenhouse gas emissions: towards a Europeanclimate change programme, 2000.
Environmental review, Canada, energy information administration, official energystatistics from the U.S. Government, October 1995.
European Network of Energy Agencies (EnR) on behalf of Directorate General XVIIof the European Commission: Pulp and paper black liquor gasification. Atlas project.
FAO, 1997: Energy and Environment Basics. Regional Wood Energy DevelopmentProgramme in Asia, GCP/RAS/154/Net, FAO, July 1997.
FAO Forestry Paper No. 93.FAO, 2000: Forestry and the Kyoto Protocol: key issues. Latin America and Caribbean
Forestry Commission.
CHAPTER 7
REFERENCES 161
162 MANAGEMENT STRATEGIES IN AGRICULTURE AND FORESTRY FOR MITIGATION OF GREENHOUSE GAS EMISSIONS AND
ADAPTATION TO CLIMATE VARIABILITY AND CLIMATE CHANGE
Khrushch, M., Worrell, E., Price, L.K. Martin, N. and Einstein, D., 1999: Carbon emis-sions reduction potential in the U.S. chemicals and pulp and paper industries by applyingCHP technologies. Ernest Orlando Lawrence Berkeley National Laboratory.
IEA statistics for paper, pulp and printing, (http://www.iea.org/stats/files/table.htm).Information note on CHP, from Centrax Ltd Web site: www.centrax.co.uk/gtd/chp.htm.Information notes from Finnish Forest Industry Federation on: environment, pulp and
paper industry, mechanical wood processing, panel products industry, energyconsumption, mechanical woodworking industry and pulp and paper industry,February 2001.
IPCC: Summary for policy-makers: scientific-technical analyses of impacts, adaptations andmitigation of climate change. International Panel on Climate Change WorkingGroup II.
IPCC, 2000: Special report: land use, land-use change and forestry.Martin, N., Anglani, N., Einstein, D., Khrushch, M., Worrell, E. and Price, L.K., 2000:
Opportunities to improve energy efficiency and reduce greenhouse gas emissions in theU.S. pulp and paper industry. Ernest Orlando Lawrence Berkeley NationalLaboratory.
Moore, W.H., 2000: Efforts to reduce carbon dioxide emissions in the pulp and paper andforest industry in the USA. FAO Advisory Committee on Paper and Wood Products.
Nilsson, L.J, Larson, E.D., Gilbreath, K. and Gupta, A. Energy efficiency in the pulp andpaper industry.
Personal communications with Confédération Française de l’Industrie des PapiersCartons et Celluloses, France.
Quebec Forest Industries Association: Environmental performance: a top priority, reduc-ing the greenhouse effect.
Row, C., 1996: Effects of selected forest management options on carbon storage. In:Forest and Global Change. Volume 2: Forest Management Opportunities forMitigating Carbon Emissions (Sampson, Hair eds.), American Forests,Washington, DC, USA, pp. 59–90.
Kiyoshi Sakai, 2000: Efforts to reduce carbon dioxide emissions in the pulp and paper andforest industry in Japan. FAO Advisory Committee on Paper and Wood Products.
Vice, K., 2000: Canada’s forest sector response to Kyoto. FAO Advisory Committee onPaper and Wood Products.
UNEP, 1993: Measuring the “global warming potential” of greenhouse gases, climate changes.Fact sheet No. 7, Information Unit on Climate Change.
UNEP, 1993: Reducing greenhouse gas emissions from the energy sector, climate change. Factsheet No. 240, Information Unit on Climate Change.
UNEP, 2000: Climate change in the pulp and paper industry. NIEM, News brief, May 2000.U.S. DOE, 1998: Characterisation and conditioning of tars produced during black liquor gasi-
fication. Forest Product Project fact sheet, U.S. Department of Energy. September1998.
U.S. DOE, 2000: DOE opens competition for black liquor/biomass gasification. U.S.Department of Energy, DOE techline bulletin, 7 January 2000.
Worrell, E., 1994: Potentials for improved use of energy and materials.
Adger, W.N. and Brown, K., 1994: Land Use and the Causes of Global Warming. Wiley,Chichester, U.K.
Armentano, T.V., 1980: Drainage of organic soils as a factor in the world carbon cycle.BioScience, 30: 825–830.
Aweto, A.O., 1981: Secondary succession and soil fertility restoration in south-west-ern Nigeria. II. Soil fertility restoration. Journal of Ecology, 69: 609–614.
Balesdent, J.M., Mariotti, A. and Guillet, 1987: Natural 13C abundance as a tracer forstudies of soil organic matter dynamics. Soil Biology and Biochemistry, 19: 25–30.
Batjes, N., 1999: Management options for reducing carbon dioxide concentrations inthe atmosphere by increasing carbon sequestration in the soil. Report 410-200-031, Dutch National Research Programme on Global Air Pollution and ClimateChange and Technical Paper 30, International Soil Reference and InformationCentre, Wageningen, the Netherlands.
CHAPTER 8
Bouwman, A.F., 1990: Exchange of greenhouse gases between terrestrial ecosystemsand the atmosphere. In: Soils and the greenhouse effect. Proceedings of the InternationalConference "Soils and the Greenhouse Effect”, Bouwman, A.F., ed., Wiley,Chichester, U.K.
Brown, S. and Lugo, A.E., 1980: Preliminary Estimate of the Storage of OrganicCarbon in Tropical Forest Ecosystems. In: The Role of Tropical Forests on the WorldCarbon Cycle, Lugo, A.E., Brown, S. and Liegel, B. eds., Washington, DC, UnitedStates Department of Energy, Office of Environment, pp. 65–117.
Brown, S.and Lugo, A.E., 1990b: Effects of forest clearing and succession on the carbonand nitrogen content of soils in Puerto Rico and U.S. Virgin Islands. Plant and Soil124: 53–64.
Burschel, P., Kürsten, E. and Larson, B.C., 1993: Die Rolle von Wald und Forstwirtschaftim Kohlenstoffhaushalt – Eine Betrachtung für die Bundesrepublik Deutschland.Forstwissenschaftlich Fakultät der Universität München und Bayerische ForstlicheVersuchs und Forschungsanstalt, München.
Buschbacher, R., Uhl, C. and Serrão, E.A.S., 1988: Abandoned pastures in easternAmazonia. II. Nutrient stocks in the soil and vegetation. Journal of Ecology, 76: 682–699.
Cannell, M. G.R., Dewar, R.C. and Thornley, J.H.M., 1992: Carbon Flux and Storagein European Forests. In: Responses of Forest Ecosystems to Environmental Changes,Teller, A., Mathy, P. and Jeffers, J.N.R., eds., Elsevier, Amsterdam.
Chone, T., Andreux F., Correa, J.C., Volkoff, B. and Cerri C.C., 1994: Changes inorganic matter in an oxisol from the Central Amazonian forest during eight yearsas pasture, determined by 13C isotopic composition. In: Diversity of EnvironmentalBiogeochemistry, J. Berthelin, ed., Elsevier, New York.
Davidson, E.A. and Ackerman, I.L., 1993: Changes in soil carbon inventories follow-ing cultivation of previously untilled soils. Biogeochemistry, 20: 161–193.
Detwiler, R.P., 1986: Land use change and the global carbon cycle: The role of tropi-cal soils. Biogeochemistry, 2: 67–93.
Eswaran, H., van den Berg, E. and Reich, P., 1993: Organic carbon in the soils of theworld. Soil Science Society of America, 57: 192–194.
FAO, ISRIC, ISSS, 1998: World Reference Base for Soil Resources. World Soil ResourcesReports 84, Rome, pp. 1–88.
FAO, 2000: Global Forest Resources Assessment 2000, Rome.Feigl, B.J., Steudler, P.A. and Cerri, C.C., 1995: Effects of pasture introduction on soil
carbon dioxide emissions during the dry season in the state of Rondonia, Brazil.Biogeochemistry, 31: 1–14.
Fölster, H., 1989: Schriftliche Stellungnahme zum Thema “Schutz der tropischenWälder”. In: EK-Drucksache 11/61. Bonn, EK, pp. 70–92.
Gorham, E., 1991: Northern peatlands: role in the carbon cycle and probable responsesto climatic warming. Ecological Applications, 1: 182–195.
Harmon, M.E., Ferrell, W.K. and Franklin, J.F., 1990: Effects on carbon storage ofconversion of old-growth forests to young forests. Science, 247: 699–702.
Hölscher, D., Möller, R.F., Denich, M. and Fölster, H., 1997b: Nutrient input-outputbudget of shifting agriculture in Eastern Amazonia. Nutrient Cycling inAgroecosystems, 47: 49–57.
Hölscher, D., Mackensen, J. and Roberst, J.M., (in press) Forest recovery following agri-cultural land use in the humid tropics: Changes in vegetation structure, nutrientpools and the hydrological cycle
Houghton, R.A., Hobbie, J.E., Melillo, J.M. and Moore, B., 1983: Changes in thecarbon content of terrestrial biota and soils between 1860 and 1980: a net releaseof carbon dioxide to the atmosphere. Ecological Monographs 53, 3: 235–262.
Houghton, R.A, Unruh, J.D. and Lefebvre, P.A., 1993: Current land cover in the trop-ics and its potential for sequestering carbon. Global Biogeochemical Cycles, 7:305–320.
REFERENCES 163
IPCC, 1997: Revised 1996 IPCC Guidelines for National Greenhouse Gas Inventories.Intergovernmental Panel on Climate Change, Meteorological Office, Bracknell,UK.
IPCC, 2000: Land Use, Land-use Change and Forestry. Special report, United NationsEnvironment Programme and World Meteorology Organization, Geneva.
Jastrow, J.D. and Miller R.M., 1997: Soil aggregate stabilization and carbon sequestra-tion: feedbacks through organomineral associations. In: Soil Processes and theCarbon Cycle, Lal, R., et al., ed., CRC Press, Boca Raton, Florida, pp. 207–223.
Juo, A.S.R., Franzluebbers, K., Dabiri, A. and Ikhile, B., 1995: Changes in soil prop-erties during long-term fallow and continous cultivation after forest clearing inNigeria. Agriculture, Ecosystems & Environment, 56: 9–18.
Juo, A.S.R. and Lal, R., 1977: The effect of fallow and continous cultivation on thechemical and physical properties of an Alfisol in western Nigeria. Plant and Soil47: 567–584.
Kasimir-Klemedtsson, E., Klemedtsson, L., Berglund, K., Martikainen, P., Silvola, J.and Oenema, O., 1997: Greenhouse gas emissions from farmed organic soils, areview. Soil Use and Management, 13: 245–250.
Karjalainen, T., 1996: Dynamics and potential of carbon sequestration in managedstands and wood products in Finland under changing climatic conditions. ForestEcology and Management, 80: 113–132.
Klein Goldewijk, C.G.M. and Vloedbeld, M., 1995: The exchange of carbon dioxidebetween the atmosphere and the terrestial biosphere in Latin America. In: Soilsand Global Change, Lal, R., Kimble, J., Levine, E. and Stewart, B.A., eds., CRCPress, Boca Raton, Florida, pp. 395–413.
Klinge, R., 1998: Wasser- und Nährstoffdynamik im Boden und Bestand beim Aufbaueiner Holzplantage im östlichen Amazonasgebiet. Göttinger Beiträge zur Land-und Forstwirtschaft in den Tropen und Subtropen, 122: 1–260.
Lal R. & Cummings, J.D. (1979) Changes in properties of an alfisol produced by vari-ous crop covers. Soil Science, 127: 377–382.
Lal, R. and Logan, T.J., 1995: Agricultural activities and green house gas emissionsfrom soils in the tropics. In: Soils and Global Change, Lal, R., Kimble, J., Levine, E.and Stewart, B.A., eds., CRC Press, Boca Raton, Florida, pp. 293–307.
Lal, R., Kimble, J. and Follett, R., 1998: Land use and soil carbon pools in terrestrialecosystems. In: Management of Carbon Sequestration in Soil, Lal, R., Kimble, J.,Follett, R. and Stewart, B.A., eds., CRC Press, Boca Raton, Florida, pp. 1–10.
Lugo, A.E., Brown, S. and Brinson, M., 1990: Concepts in wetland ecology. In:Ecosystsms of the World: Forested Wetlands, Lugo, A.E., Brinson, M. and Brown, S.,eds., Elsevier, Amsterdam, pp. 53–85.
Mackensen, J., Hölscher, D., Klinge, R. and Fölster H., 1996: Nutrient transfer to theatmosphere due to burning of debris in East-Amazonia. Forest Ecology andManagement, 86: 121–128.
Mackensen, J. and Bauhus, J., 1999: The decay of coarse woody debris. National CarbonAccounting System, Technical Report No. 6. Australian Greenhouse Office,Canberra.
Maltby, E. and Immirzy, C.P., 1993: Carbon dynamics in peatlands and other wetlandsoils: regional and global perspectives. Chemosphere, 27: 999–1023.
Mann, L.K., 1986: Changes in soil carbon storage after cultivation. Soil Science, 142:279–288.
Neill, C., Fry, B., Melillo, J.M., Steudler, P.A., Moraes, J.F. and Cerri, C.C., 1996:Forest- and pasture-derived carbon contributions to carbon stocks and microbialrespiration of tropical pasture soils. Oecologia, 107: 113–119.
Olson, J.S., Watts, J.A. and Allison, L.J., 1983: Carbon in Live Vegetation of Major WorldEcosystems. Report DOE/NBB-0037, Washington, DC, U.S. Department ofEnergy, Office of Energy Research, Carbon Dioxide Research Division.
Palm, C.A. and Szott, L.T., 1984: Unpublished draft on soil and vegetation dynamicsduring fallows. Proyecto Suelos Tropicales, INIPA-NCSU, Yurimaguas, Peru.
164 MANAGEMENT STRATEGIES IN AGRICULTURE AND FORESTRY FOR MITIGATION OF GREENHOUSE GAS EMISSIONS AND
ADAPTATION TO CLIMATE VARIABILITY AND CLIMATE CHANGE
Popenoe, H., 1957: The influence of the shifting cultivation cycle on solid propertiesin Central America. Proc. 9th Pacific Science Congress, pp. 72–77.
Sanchez, P.A., 1976: Properties and Management of Soils in the Tropics. Wiley, New York.Schroeder, P.E. and Winjum, J.K., 1995: Assessing Brazil’s carbon budget: I. Biotic
Carbon Pools. Forest Ecology and Management, 75: 77–86.Scott, G., 1987: Shifting cultivation where land is limited – case study No. 3: Campa
Indian agriculture in the Gran Pajonal of Peru. In: Amazonian Rain Forests –Ecosystems Disturbance and Recovery, Jordan, ed., Springer, Berlin, pp. 34–45.
Silvola, J., 1986: Carbon dioxide dynamics in mires reclaimed for forestry in EasternFinland. Annales Botanici Fennici 23: 59–67.
Silvola, J., Alm, J., Ahlholm, U., Nykänen, H. and Martikainen, P.J., 1996: The contri-bution of plant roots to carbon dioxide fluxes from organic soils. Biology and Fertilityof Soils 23: 126–131.
Uhl C., Buschbacher, R. and Serrão, E.A.S., 1988: Abandoned pastures in easternAmazonia. I. Patterns of plant succession. Journal of Ecology 75: 663–681.
Trumbore, S.E, Davidson, E.A., de Camargo, P.B., Nepstad, DC and Martinelli, L.A.,1995: Belowground cycling of carbon in forests and pastures of Eastern Amazonia.Global Biogeochemical Cycles 9: 515–528.
Veldkamp, E., 1998: Changes in soil carbon stocks following conversion of forest topasture in the tropics. In: Notes from Underground – Soil Processes and GlobalChange, Holland E.A., ed., NATO ASI Series, Springer, Berlin.
WBGU (Wissenschaftlicher Beirat Globale Umweltveränderung German AdvisoryCouncil on Global Change), 1998: The accounting of biological sinks and sourcesunder the Kyoto Protocol: a step forwards or backwards for global environmental protec-tion? <http://www.awi-bremerhaven.de/WBGU/wgbu_sn1998_engl.html>
Werner, P., 1984: Changes in soil properties during tropical wet forest succession inCosta Rica. Biotropica 16(1): 43–50.
Wild, A., 1993: Soil and the Environment: An Introduction. Cambridge University Press,Cambridge, 287 pp.
WRI and WWF, 2001: Understanding the Forest Resources Assessment 2000. Forest brief-ing No. 1. Also <http://www.wri.org/press/fao_fra5.html>
REFERENCES 165
Recent WMO Technical Notes
No. 160 Soya bean and weather. By F. S. da Mota.
No. 166 Quantitative meteorological data from satellites. By C. M. Hayden, L. F. Hubert, E. P. McClain andR. S. Seaman. Edited by J. S. Winston.
No. 172 Meteorological aspects of the utilization of solar radiation as an energy source.
No. 173 Weather and airborne organisms, By D. E. Pedgley.
No. 180 Weather-based mathematical models for estimating development and ripening of crops. By G. W. Robertson.
No. 181 Use of radar in meteorology. By G. A. Clift, CIMO Rapporteur on Meteorological Radars.
No. 182 The analysis of data collected from international experiments on lucerne. Report of the CAgM Working Groupon International Experiments for the Acquisition of Lucerne/Weather Data.
No. 184 Land use and agrosystem management under severe climatic conditions.
No. 185 Meteorological observations using navaid methods.
No. 186 Land management in arid and semi-arid areas.
No. 187 Guidance material for the calculation of climatic parameters used for building purposes.
No. 188 Applications of meteorology to atmospheric pollution problems. By D. J. Szepesi, CCl Rapporteur onAtmospheric Pollution.
No. 189 The contribution of satellite data and services to WMO programmes in the next decade.
No. 190 Weather, climate and animal performance. By J. R. Starr.
No. 192 Agrometeorological aspects of operational crop protection.
No. 193 Agroclimatology of the sugar-cane crop. By B. C. Biswas.
No. 194 Measurements of temperature and humidity. By R. G. Wylie and T. Lalas.
No. 195 Methods of interpreting numerical weather prediction output for aeronautical meteorology. Report of theCAeM Working Group on Advanced Techniques Applied to Aeronautical Meteorology.
No. 196 Climate variability, agriculture and forestry. Report of the CAgM-IX Working Group on the study of ClimateEffects on Agriculture including Forecasts, and of the Effects of Agriculture and Forests on Climate.
No. 197 Agrometeorology of grass and grasslands for middle latitudes. By A. J. Brereton, S. A. Danielov and D. Scott.
No. 198 The effect of temperature on the citrus crop. By Z. Gat, Y. Erner and E. E. Goldschmidt.
No. 199 Climate variability, agriculture and forestry: an update. By M. J. Salinger, R. Desjardins, M. B. Jones,M. V. K. Sivakumar, N. D. Strommen, S. Veerasamy and Wu Lianhai, CAgM Rapporteurs on the Effects ofClimate Change and Variability on Agriculture and Forestry.
No. 200 Climate variability, agriculture and forestry: towards sustainability. By M. J. Salinger, R. L. Desjardins, P. H.Karing, S. Veerasamy and G. Zipoli, (CAgM-XI Joint Rapporteurs on the Effects of Climate Change andVariability on Agriculture and Forestry – Agrometeorological Aspects of Management Strategies andImprovement of Sustainability).
No. 201 Agrometeorology related to extreme events. By H.P. Das, T.I. Adamenko, K.A. Anaman, R.G. Gommes and G.Johnson (CAgM-XI Working Group on Agrometeorology Related to Extreme Events).
