metabolic shifts in microorganisms: the case of lactococcus
TRANSCRIPT
Metabolic Shifts in
Microorganisms:
The Case of Lactococcus lactis
Anisha Goel
Thesis committee
Promotors
Prof. Dr Willem M. de VosProfessor of MicrobiologyWageningen University
Prof. Dr Bas TeusinkProfessor of Systems BioinformaticsVU University Amsterdam
Co-promotor
Dr Douwe MolenaarAssistant professor, Systems Bioinformatics groupVU University Amsterdam
Other members
Prof. Dr Tjakko Abee, Wageningen University, The NetherlandsDr Richard van Kranenburg, Corbion (formerly Purac), Gorinchem, The NetherlandsProf. Dr Jan Kok, University of Groningen, The NetherlandsDr Ana R. Neves, Chr. Hansen A/S, Hørsholm, Denmark
This research was conducted under the auspices of the Graduate School VLAG (Advanced studies in Food Technology, Agrobiotechnology, Nutrition and Health Sciences)
Metabolic Shifts in
Microorganisms:
The Case of Lactococcus lactis
Anisha Goel
Thesissubmitted in fulfilment of the requirements for the degree of doctor
at Wageningen Universityby the authority of the Rector Magnificus
Prof. Dr M.J. Kropff,in the presence of the
Thesis Committee appointed by the Academic Boardto be defended in public
on Monday, 11th November 2013at 4 p.m. in the Aula.

Anisha GoelMetabolic shifts in microorganisms: The case of Lactococcus lactis, 184 pages
PhD thesis, Wageningen University, Wageningen, The Netherlands (2013)With references, with summaries in Dutch and English
ISBN 978-94-6173-734-2

Dedicated to my family...
“When love and skill work together, expect a masterpiece”
– John Ruskin

Abstract
A commonly observed organismal response to changing growth rate is a metabolic shift from one mode of metabolism to another. This phenomenon is potentially interesting from a fundamental and industrial perspective because it can influence cellular choices and can limit the capacity of industrial microorganisms to channel nutrients to desired products. The mechanistic cause of the metabolic shift may vary between species, but the presence of such shifts from bacteria to man suggests functional relevance, which may be understood through an evolutionary perspective. One of the many existing hypotheses (reviewed in Chapter 2) states that protein investment costs affect the metabolic strategy employed, and that the implemented strategy is the result of a cost-benefit analysis. To test this experimentally, we performed a global multi-level analysis using the model lactic acid bacterium Lactococcus lactis subsp. cremoris MG1363, which shows a distinct, anaerobic version of the bacterial Crabtree/Warburg effect: at low growth rates it produces “mixed-acids” (acetate, formate and ethanol) and at high growth rates it produces predominantly lactate from glucose.
We first standardized growth conditions and established an in vivo–like enzyme assay medium mimicking the intracellular environment for enzyme activity measurements of growing cells of L. lactis (Chapter 3). With standardized experimental procedures we characterized at multiple cellular levels, glucose-limited chemostat cultures of L. lactis at various growth rates. More than a threefold change in growth rate was accompanied by metabolic rerouting with, surprisingly, hardly any change in transcription, protein ratios, and enzyme activities (Chapter 4). Even ribosomal proteins, constituting a major investment of cellular machinery, scarcely changed. Thus, contrary to the original hypothesis, L. lactis displays a strategy where its central metabolism appears always prepared for high growth rate and it primarily employs the regulation of enzyme activity rather than alteration of gene expression. Only at the highest growth rate and during batch growth – conditions associated with glucose excess – we observed down-regulated stress protein levels and up-regulated glycolytic protein levels. We conclude from this that for glucose, transcription and protein expression largely follow a binary feast / famine logic in L. lactis.
To delve deeper into the mechanism of regulation of the shift in L. lactis, we tested a mixed-acid fermentative lactose-utilizing L. lactis MG1363 derivative and showed that there is a strong positive correlation between glycolytic flux and the extent of homolactic fermentation: a correlation caused by metabolic regulation (Chapter 5). We subsequently provided new evidence for a causal relationship between the concentration of the glycolytic intermediate, fructose-1,6-bisphosphate (FBP) and the metabolic shift. We showed that 2,5-anhydromannitol, which converts to a non-metabolizable FBP analogue in vivo, almost doubles the flux towards lactate when taken up by the cells. In vitro the activating effect of the analogue on lactate dehydrogenase is similar to native FBP, whereas it had no effect

on the enzyme phosphotransacetylase (part of the mixed-acid pathway). The activation concentration of the analogue, however, is much lower than normal intracellular FBP concentrations. This may imply that the activation of lactate dehydrogenase in vivo requires a much higher concentration of FBP, but this remains to be resolved. We subsequently put the regulatory relationships of glycolytic flux, FBP, the redox potential and allosteric effectors on enzymes of the glycolytic and downstream pathways together in a mathematical model to test and investigate whether these interactions can explain the metabolic shift (Chapter 6). Although the model was not able to consistently fit combined data from the chemostats at various dilution rates, and in vivo–NMR data of glucose pulsed non-growing cells, we found for the best fitted model that the parameters most influencing the metabolic shift were those involved in regulation by FBP and inorganic phosphate.
In conclusion, L. lactis seems to be always prepared for high growth rate as it carries a high overcapacity of enzymes, a property retained even after evolving for 800 generations under constant environmental conditions. Moreover, its growth rate-related metabolic shift does not appear to be an outcome of growth-rate optimization with protein cost as a major driver. At the mechanistic level, the choice of the strategy is regulated via alterations in metabolite levels, with FBP (and probably phosphate) exerting a central role.

1
Table of Contents
Chapter 1General Introduction
- 5 -
Chapter 2Metabolic Shifts: A Fitness Perspective for Microbial Cell Factories
- 15 -
Chapter 3Standardized Assay Medium To Measure Enzyme Activities of Lactococcus lactis while Mimicking Intracellular Conditions
- 33 -
Chapter 4Uncoupling of Growth-Associated Metabolism and Protein Expression Suggests Binary Control Logic
- 61 -
Chapter 5The Fructose Analogue 2,5-Anhydromannitol Redirects Metabolism in a Lactose-Utilizing Lactococcus lactis MG1363 Derivative towards Homolactic Fermentation.
- 97 -
Chapter 6A Kinetic Model of Lactococcus lactis Combining Data from Chemostat and Glucose Pulse Experiments Exhibits the Metabolic Shift as a Function of Growth Rate.
- 111 -
Chapter 7Summary, Discussion and Concluding Remarks
- 141 -
Bibliography
- 155 -
Samenvatting (Dutch)
- 172 -
Acknowledgements
- 175 -
About the Author
- 181 -
List of Publications
- 182 -
Overview of Completed Training Activities - 183 -

2

3
List of Abbreviations
ACALDH / ALDH Acetaldehyde dehydrogenaseACLDC Acetolactate decarboxylaseACLS Acetolactate synthaseACK Acetate kinaseADH Alcohol dehydrogenaseADP Adenosine 5’-diphosphate ATP Adenosine 5’-triphosphateALD Fructose-1,6-bisphosphate aldolaseALDH Acetaldehyde dehydrogenase2,3BPG 2,3-bisphosphoglycerateBTDD-RR (R,R)-Butanediol DehyDrogenaseD Dilution rate (h-1)DHAP Dihydroxyacetone phosphateENO EnolaseF6P Fructose-6-phosphateFBP Fructose-1,6-bisphosphateFBPase Fructose-1,6-bisphosphataseG3PD Glycerol-3-phosphate dehydrogenaseG6P Glucose-6-phosphateG6PDH Glucose-6-phosphate dehydrogenaseGAP / G3P Glyceraldehyde 3-phosphateGAPDH Glyceraldehyde 3-phosphate dehydrogenaseGLCi Glucose intracellularGLK GlucokinaseHXK HexokinaseLDH Lactate dehydrogenaseMAB Mixed Acid BranchNAD(P)H Nicotinamide dinucleotide (phosphate)PEP Phosphoenol pyruvatePG PhosphoglyceratePi PhosphatePFK PhosphofructokinasePFL Pyruvate formate lyasePGI Glucose-6-phosphate isomerasePGK 3-phospho glycerate kinasePGM Phospho glycerate mutasePTA PhosphotransacetylasePTS Phospho-transferase systemPYK Pyruvate kinaseTPI Triose phosphate isomerase


5
General
Introduction
“Wisdom begins in Wonder.”
- Socrates
CHAPTER 111 CHAPTER 1
5

6
Chapter 1

7
General Introduction
Introduction
Our planet is dominated by prokaryotic microorganisms, whether in the oceans, the soil, their sub-surfaces, air, plants, birds, animals and also humans (Whitman et al, 1998). Part of their success is due to their capacity to adapt very quickly to the environment. Their adaptation is mediated by metabolic (seconds to minutes) or gene-regulatory responses (several minutes to hours) on short time scales, and by accumulation of beneficial mutations on an intermediate time scale (a few hundred generations, i.e. weeks to months) (Bennett et al, 2008). An apparent regulatory response to changing growth conditions seems to be a shift from one mode of cellular metabolism to another, such as the shift from respiration to fermentation in yeast (to ethanol) (De Deken, 1966), tumour cells (to lactate) (Warburg, 1956) and E. coli (to acetate) (Britten, 1954), and the shift from mixed-acid to homolactic fermentation in Lactococcus lactis (Thomas et al, 1979). The focus of this thesis is on the latter industrially-relevant lactic acid bacterium since as discussed below, such shifts in metabolic strategies are potentially interesting from a fundamental as well as industrial perspective. From a fundamental scientific point of view, the reason why such metabolic shifts exist is unclear. From an industrial perspective such shifts are relevant because they affect the quality and productivity of industrial fermentations. The selection of L. lactis as model system for cell factories is further elaborated here as well as the system biology approach used in this thesis.
Cell factories and trade-offs
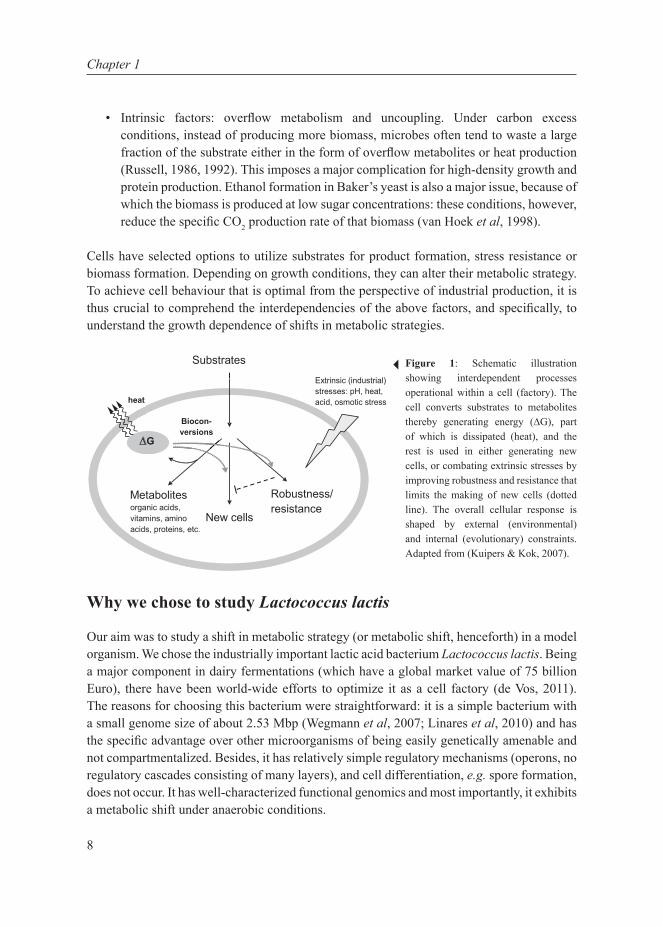
Bacteria have been utilized by humans since ancient times, with the earliest evidence of fermentation dating back to 7000-6600 BC (McGovern et al, 2004). The major use in current times is in the food and biotechnology industry. The maintenance of industrial strains, however, is not trivial. Industrial strains need to have and retain the required properties to maintain high production rates. These strains are continually subjected to selection of mutations that probe the boundaries of physical and biochemical limitations inherent in physiology and manifested as trade-offs. Essentially, trade-offs call for a choice between two incompatible features, either of which if chosen automatically leads to forfeiting the other. There are several biological examples of trade-offs: cells can invest in growing bigger or producing offspring, cells can be optimized for their current environment or be prepared for possible future changes, just to mention a few. The overall response of the cell depends on the metabolic strategies employed, which are governed by environmental (external) and evolutionary (internal) constraints. There are several factors, extrinsic and intrinsic, in the production processes that prevent optimal performance of bacteria in the industrial setting (Fig 1):
• Extrinsic factors: acid- and osmotic stress. A very low pH or a very high osmolality inhibits growth, which is favourable in fermented food products as these conditions also inhibit spoilage organisms. But the same condition imposes difficulty in biomass and protein production.
8
Chapter 1
• Intrinsic factors: overfl ow metabolism and uncoupling. Under carbon excess conditions, instead of producing more biomass, microbes often tend to waste a large fraction of the substrate either in the form of overfl ow metabolites or heat production (Russell, 1986, 1992). This imposes a major complication for high-density growth and protein production. Ethanol formation in Baker’s yeast is also a major issue, because of which the biomass is produced at low sugar concentrations: these conditions, however, reduce the specifi c CO2 production rate of that biomass (van Hoek et al, 1998).
Cells have selected options to utilize substrates for product formation, stress resistance or biomass formation. Depending on growth conditions, they can alter their metabolic strategy. To achieve cell behaviour that is optimal from the perspective of industrial production, it is thus crucial to comprehend the interdependencies of the above factors, and specifi cally, to understand the growth dependence of shifts in metabolic strategies.
Figure 1: Schematic illustration showing interdependent processes operational within a cell (factory). The cell converts substrates to metabolites thereby generating energy (∆G), part of which is dissipated (heat), and the rest is used in either generating new cells, or combating extrinsic stresses by improving robustness and resistance that limits the making of new cells (dotted line). The overall cellular response is shaped by external (environmental) and internal (evolutionary) constraints. Adapted from (Kuipers & Kok, 2007).
Why we chose to study Lactococcus lactis
Our aim was to study a shift in metabolic strategy (or metabolic shift, henceforth) in a model organism. We chose the industrially important lactic acid bacterium Lactococcus lactis. Being a major component in dairy fermentations (which have a global market value of 75 billion Euro), there have been world-wide efforts to optimize it as a cell factory (de Vos, 2011). The reasons for choosing this bacterium were straightforward: it is a simple bacterium with a small genome size of about 2.53 Mbp (Wegmann et al, 2007; Linares et al, 2010) and has the specifi c advantage over other microorganisms of being easily genetically amenable and not compartmentalized. Besides, it has relatively simple regulatory mechanisms (operons, no regulatory cascades consisting of many layers), and cell differentiation, e.g. spore formation, does not occur. It has well-characterized functional genomics and most importantly, it exhibits a metabolic shift under anaerobic conditions.
Substrates
Metabolites
New cells
Robustness/resistance
∆G
Biocon-versions
heat
Extrinsic (industrial)stresses: pH, heat, acid, osmotic stress
organic acids, vitamins, amino acids, proteins, etc.
9
General Introduction
Lactococcus lactis is an important industrial microorganism generally regarded as safe (GRAS). It is a low-GC-content, mesophilic, facultative gram-positive bacterium that rapidly ferments sugars to primarily produce lactic acid. It is one of the many species of Lactic Acid Bacteria (LAB) in the phylum Firmicutes that are found in nutrient rich environments such as milk, meat, decomposing plant material and the mammalian gastrointestinal tract (Carr et al, 2002). Traditionally LAB have been used in food fermentations due the properties they render: preservation, texture, flavour and nutritional value. Their use is not limited to the food industry: they are increasingly being used in diverse biotechnological applications. Their industrial applications include biomass production for starter cultures (used to initiate fermentation of food products), production of (high-value) metabolites, flavour compounds, (bulk) enzymes and/or (medically relevant/bioactive) proteins (de Vos & Hugenholtz, 2004; Teusink & Smid, 2006). They are also widely used to deliver a variety of biomolecules to the gastrointestinal tract (Wells & Mercenier, 2008; Berlec et al, 2012).
Among LAB, L. lactis has received by far the most attention. The commercial importance of L. lactis has led to extensive characterization of its physiology, and the development of a variety of genetic and metabolic engineering tools. Due to the available technologies and despite, or one may say, because of its relatively simple metabolism, L. lactis is an attractive target as a cell factory for the improvement of food quality and human health. It was the first genetically modified organism used as a delivery vehicle for therapeutic protein in the treatment of a human disease (Braat et al, 2006). Like other LAB, L. lactis lacks a functional electron chain and relies on fermentative processes (pyruvate to lactate) to satisfy its energy requirement by substrate level phosphorylation. The genome sequences of a number of L. lactis strains are available (Linares et al, 2010). Of special interest is L. lactis subsp. cremoris MG1363, which is a plasmid-free descendant of the dairy starter strain NCDO712 (Gasson, 1983) and is regarded as the international prototype for LAB genetics. Its derivative NZ9000 is widely used in combination with the nisin-controlled overexpression system (Kuipers et al, 1998). Hence, it is an ideal candidate for overexpression studies, but genome sequence analysis revealed that it has considerable differences with the strain MG1363 (Linares et al, 2010). MG1363 is a well-established strain for metabolic engineering strategies (de Vos & Hugenholtz, 2004). Moreover, evolutionary studies on prolonged chemostat cultivations are also being carried out on this strain (Price et al, 2010; Santos, 2011) making it an extremely attractive choice to study metabolic strategies.
Systems biology approach to comprehend metabolic strategies
The general systems theory put forth by Ludwig von Bertalanffy (Bertalanffy, 1950, 1969) was one of the first pioneering theories that proposed systems thinking and considered the organism as a ‘whole’ consisting of complex parts (Weckowicz, 1988). Thereafter ‘systems analysis’ endeavours were consistent in various areas of biology (developmental biology, immunology and ecology) (Westerhoff & Palsson, 2004). Subsequent decades of
10
Chapter 1
reductionistic research and its consequent revolution in high-throughput technologies –facilitating system characterization at the molecular level– has resulted in the availability of vast amounts of data. This has forced a change in perspective from reductionistic to holistic. The convergence of reductionistic molecular biology with a parallel stream of mathematical modelling (stemming from non-equilibrium thermodynamics theory) to elucidate cellular regulatory circuits has revived systems level thinking in biology, known in present day, as the field of Systems Biology (Westerhoff & Palsson, 2004). Such an integrative systems biology approach comprises iterative cycles of experimentation and mathematical modelling and aims at understanding emergent system behaviour arising out of characteristics of and interactions between its components.
Metabolic strategies are invariably linked to the metabolism of the microbes exhibiting metabolic shifts. Metabolism, however, cannot be isolated from the rest of the cell as evidenced by the link of growth rate to the onset of overflow metabolism in yeast, E coli, or L. lactis. Numerous successes have been reported in re-routing central carbon metabolism towards products of interest although the objective is often achieved by coordinated alterations of several genes rather than merely disrupting or overexpressing single genes (de Vos & Hugenholtz, 2004). Nevertheless predicting physiological behaviour is challenging due to the intricate interactions linking virtually all cellular processes. Tackling such challenges requires a global understanding of cell physiology and behaviour, a goal that systems biology aims to achieve.
The ‘evolutionary optimization’ perspective
As stated by Kitano (2002), the systems biology approach “requires a shift in our notion of “what to look for” in biology”. Kitano (2002) listed four fundamental properties, the insight of which can lead to a systems-level understanding of a biological system: system structures, system dynamics, the control method and the design method. The first property entails system definition at the molecular and structural level; the second entails time and condition dependent behaviour; the third entails the control mechanisms or the ‘how’ of system behaviour; and the fourth entails the design principle or the ‘why’ behind system behaviour. This can be likened to the indoctrination of efficient and final causes (causa efficiens and causa finalis) by Aristotle. The efficient cause is the ‘source’ of the change, or the molecular mechanism of a particular organismal trait; while the final cause is the ‘sake for which’ the trait exists, or the evolutionary advantage the trait confers to the organism. While most scientific investigations fall under the category of efficient causes, a deeper insight can be obtained by going a step further and asking the question: why do organisms behave as they do? In other words, we can aim to understand the organism from a functional, ‘fitness-enhancing’ perspective (Papp et al, 2009).
11
General Introduction
Adopting such an ‘evolutionary perspective’ can improve our understanding of organisms, and can lead to more effective solutions (Goel et al, 2012b). For instance, ecologists and behavioural scientists have tried to explain several aspects of animal behaviour from an optimization view of interacting strategies in populations. Examples are the explanation of the regulation of sex ratios in offspring (Hamilton, 1967), the evolutionary game theory applied to animal behaviour (Smith & Price, 1973) and the explanations of allometric scaling laws (West et al, 1997). In microbiology, classic examples are explanation of persistence of extracellular proteases (to break-down milk proteins to free peptides) in L. lactis (Bachmann et al, 2011) and invertase (hydrolysis of sucrose) in yeast (Gore et al, 2009) as cooperative traits. Furthermore, the successes of flux balance analysis approaches present a classic example of the usefulness of optimization approaches (Teusink et al, 2011).
Before undertaking the quest for the ‘final cause’, however, it is important to understand what evolution does to the behaviour, or in other words, to the regulation of metabolism of the organism. First of all, how does selection act on a population of organisms, or, what is fitness? The most commonly used proxies for fitness are the highest growth rate and the number of observable offspring. Secondly, it is necessary to define the physical and biochemical limitations within which the organism can be optimized. Finally, fitness needs to be linked to lower level biochemical properties or an observable aspect of the cell, for instance, the occurrence of the metabolic shift or other observable aspects in the behaviour of animals or microorganisms in conflict situations. These then can be related to fitness. In other words, one should model the optimization problem – to be able to make predictions from fitness optimization to selection of observable biological properties. These concepts are reviewed in more detail in chapter 2.
The questions
With the extensive characterization of the lactic acid bacterium Lactococcus lactis subsp. cremoris MG1363, we were interested in both, the how, as well as the why behind the growth-related metabolic shift of L. lactis from mixed-acid to homolactic fermentation. Linking protein investment and metabolism, it has been suggested that evolutionary optimization of resource allocation underlies the metabolic shift (Molenaar et al, 2009). We thus set out to test this hypothesis that the reason for shifting metabolic strategy from low to high substrate availability is optimization of protein allocation for maximization of growth rate. Integrated ‘omics’ approaches can offer a systems-level view of processes at multiple cellular levels (Aggarwal & Lee, 2003). Thus, using this systems biology approach to the model bacterium L. lactis, we were looking for answers to the following questions:
• How is the growth-dependent metabolic shift regulated in L. lactis?• How does this shift correlate with protein investment in L. lactis?• Why does L. lactis exhibit the metabolic shift?
12
Chapter 1
Thesis outline
The aim of this thesis is to understand metabolic shifts in bacteria. For this purpose, we have used a systems biology approach to elucidate a specific case of the metabolic shift from mixed-acid to homolactic fermentation in the industrially important lactic acid bacterium Lactococcus lactis subsp. cremoris MG1363. We first discuss at length the generality of the metabolic shift and its association with fitness and trade-offs in cell factories. Highlighting the importance of standardization in systems biology, we developed a standardized in vivo-like enzyme assay medium to measure enzyme capacities. Combining this protocol with transcript-, protein- and flux determinations, we conducted a multi-level analysis on L. lactis to investigate the metabolic shift as a function of growth. We conducted further experiments to investigate specifically the metabolic regulation of the shift in L. lactis. Finally we attempted to develop a kinetic model of L. lactis to bring together the numerous regulatory influences of the metabolic shift and investigated its intricate relationship with growth rate. These topics have given rise to the chapters of this thesis that are recapitulated below.
Chapter 2This chapter reviews the current literature on metabolic shifts in (micro)organisms with a focus on the performance in industry as cell factories. A number of theories and mechanisms for metabolic shifts as well as the trade-offs involved are summarized. Furthermore, the application of systems biology to tackle complexities of cell factories is discussed.
Chapter 3As a prerequisite to studying the metabolic shift from mixed-acid to homolactic fermentation in Lactococcus lactis with a systems biology approach, this chapter describes the standardization of the enzyme activity assay, resulting in an in vivo-like assay medium for L. lactis.
Chapter 4This chapter describes the investigation of the metabolic shift in L. lactis at multiple cellular levels at various growth rates in glucose-limited chemostat cultures. It combines transcript- and protein data, enzyme capacities and fluxes to extensively characterize the metabolic shift from mixed-acid to homolactic fermentation in L. lactis and shows that the shift is metabolically regulated.
Chapter 5To elaborate metabolic regulation of the metabolic shift in L. lactis further, this chapter provides evidence for a direct correlation of glycolytic flux with lactate formation. The effect of a non-metabolizable fructose-1,6-bisphosphate (FBP) analogue is also investigated. It reiterates the role of FBP in the metabolic regulation of the shift.

13
General Introduction
Chapter 6Combining the existing regulatory relationships affecting central carbon metabolism in L. lactis, this chapter describes a kinetic model of the glycolysis and downstream pathways of L. lactis. Based on the chemostat data from this thesis as well as in vivo NMR data from the literature, this model reproduces the metabolic shift from mixed-acid to homolactic fermentation as a function of growth rate. A sensitivity analysis of parameters affecting the shift –and limitations of the model fitting– are discussed.
Chapter 7 This chapter summarizes the findings of this thesis and concludes it. It reflects on the approach applied, and discusses various hypotheses that can be formulated based on data generated in this thesis. It discusses some results from evolution and heterogeneity experiments and puts into perspective our current understanding of metabolic shifts with L. lactis as a paradigm.


15
Metabolic Shifts:
A Fitness Perspective for
Microbial Cell Factories
Anisha Goel*,
Meike Tessa Wortel*, Douwe Molenaar and Bas Teusink
CHAPTER 222 CHAPTER 2
Published in Biotechnology Letters (2012) 34: 2147–2160 Reprinted with kind permission from Springer Science and
Business Media
*Contributed equally 15
16
Chapter 2
Abstract
Performance of industrial microorganisms as cell factories is limited by the capacity to channel nutrients to desired products, of which optimal production usually requires careful manipulation of process conditions, or strain improvement. The focus in process improvement is often on understanding and manipulating the regulation of metabolism. Nonetheless, one encounters situations where organisms are remarkably resilient to further optimization or their properties become unstable. Therefore it is important to understand the origin of these apparent limitations to find whether and how they can be improved. We argue that by considering fitness effects of regulation, a more generic explanation for certain behaviour can be obtained. In this view, apparent process limitations arise from trade-offs that cells faced as they evolved to improve fitness. A deeper understanding of such trade-offs using a systems biology approach can ultimately enhance performance of cell factories.
Keywords: Biotechnology industry, Evolution, Fitness, Metabolic shift, Systems biology, Trade-off

Metabolic shifts: a fitness perspective
17
Introduction
Among the several microorganisms used in the food and biotechnology industry, Escherichia coli, by far the most widely studied microorganism, is an excellent work horse for the production of several high value products (Table 1). Other work horses include Bacillus subtilis, lactic acid bacteria, yeast (Saccharomyces cerevisiae), fungi (Aspergilli) and mammalian cell lines, each utilized for the production of a wide range of products that are directly or indirectly an inherent part of our daily lives.
Not all of these organisms had the complete set of desired traits to start with. Multiple methods are employed to obtain the preferred properties, including evolutionary engineering, classical mutagenesis and screening, rational and reverse metabolic engineering, global transcription machinery engineering or genetic modification (Nevoigt, 2008), and more recently synthetic biology (Khalil & Collins, 2010). Numerous successes in substantial improvement of processes and strains have been reported in the past decades (Park & Lee, 2010; Brockmeier et al, 2006; Ikeda, 2006; Donalies et al, 2008; Smid et al, 2005). Nevertheless, common practical problems are encountered due to the shifts in metabolic strategies during growth (Table 1).
Industrial strains need to have and retain the required properties to maintain high production rates. However, the one process that none of these strains can evade is their evolution, governed by their “fitness” in the respective environments. Microorganisms are subject to selection and the selection pressure is often on specific growth rate. In a fermentor the fastest growing strain produces the most progeny and therefore is likely to invade most of the population. How well microorganisms flourish in terms of competing with other strains, is called their fitness. Most often, the strain properties necessary for industrial production processes are not the same as those that enable the cell to attain maximal fitness. Hence, identifying the selection pressures and strategic decisions that microorganisms can make, will help in tuning their environment so as to align their cellular objectives with the production process objective, and ensure constancy in biotechnological applications.
Understanding physiology from the perspective of optimized fitness
The end result of microbial physiology is a direct consequence of adaptations that improve fitness, which can be mimicked in silico by adopting some optimality criterion for a microorganism in its environment. The premise of this approach is that cells will adapt, often surprisingly fast, and move towards some optimal fitness if cultivated under constant conditions. Such an in silico optimality approach has been used frequently over the years, and is often also disputed: microorganisms might not be optimal for specific tasks. At the end of this section, we will show a counterexample of this optimality assumption.
18
Chapter 2
Nearly two decades ago, physiological observations of E. coli were explained by optimization of growth within stoichiometric constraints (Varma et al, 1993) using the well-known modelling approach for analysing biochemical networks: flux balance analysis (FBA) (Orth et al, 2010) . In the post-genome era, this approach was extended to genome-scale metabolic networks. An early example successfully demonstrated that optimizing metabolic network fluxes to maximize growth could explain physiological metabolic behaviour in E. coli (Edwards et al, 2001). In this approach, measured nutrient uptake rates are used to constrain the metabolic network which is then optimized for maximal growth, to generate predictions of growth and product formation rates. The in-silico predictions of growth of E. coli on acetate and succinate were found to be consistent with experimental measurements. Microorganisms are thus limited by environmental constraints and the aforementioned studies reinstate that the resulting physiological behaviour is a consequence of an underlying optimality objective which improves their fitness.
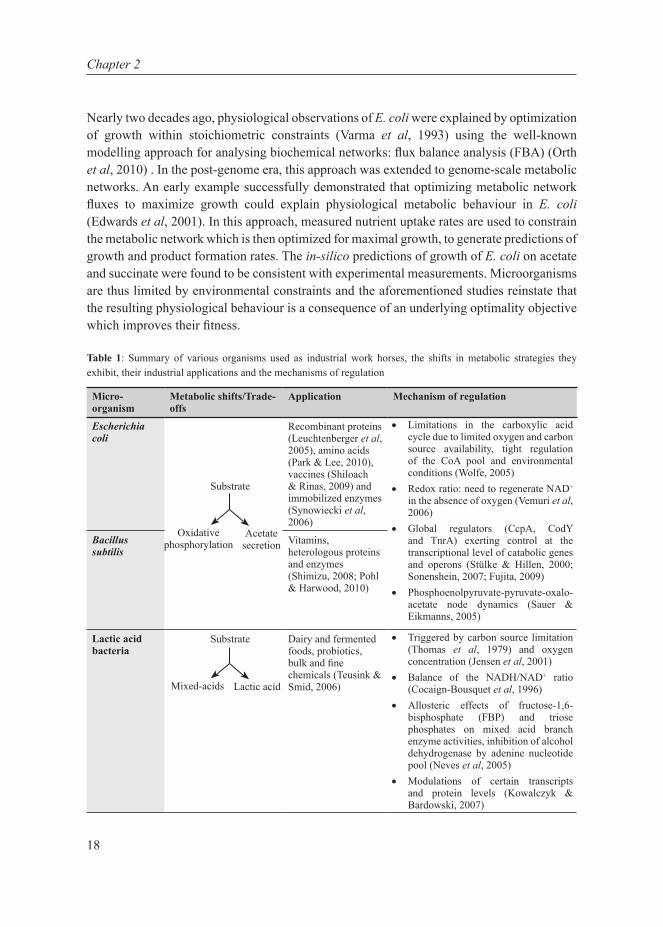
Table 1: Summary of various organisms used as industrial work horses, the shifts in metabolic strategies they exhibit, their industrial applications and the mechanisms of regulation
Micro-organism
Metabolic shifts/Trade-offs
Application Mechanism of regulation
Escherichia coli
Substrate
Recombinant proteins (Leuchtenberger et al, 2005), amino acids (Park & Lee, 2010), vaccines (Shiloach & Rinas, 2009) and immobilized enzymes (Synowiecki et al, 2006)
• Limitations in the carboxylic acid cycle due to limited oxygen and carbon source availability, tight regulation of the CoA pool and environmental conditions (Wolfe, 2005)
• Redox ratio: need to regenerate NAD+ in the absence of oxygen (Vemuri et al, 2006)
• Global regulators (CcpA, CodY and TnrA) exerting control at the transcriptional level of catabolic genes and operons (Stülke & Hillen, 2000; Sonenshein, 2007; Fujita, 2009)
• Phosphoenolpyruvate-pyruvate-oxalo-acetate node dynamics (Sauer & Eikmanns, 2005)
Bacillus subtilis
Vitamins, heterologous proteins and enzymes (Shimizu, 2008; Pohl & Harwood, 2010)
Lactic acid bacteria
Substrate Dairy and fermented foods, probiotics, bulk and fine chemicals (Teusink & Smid, 2006)
• Triggered by carbon source limitation (Thomas et al, 1979) and oxygen concentration (Jensen et al, 2001)
• Balance of the NADH/NAD+ ratio (Cocaign-Bousquet et al, 1996)
• Allosteric effects of fructose-1,6-bisphosphate (FBP) and triose phosphates on mixed acid branch enzyme activities, inhibition of alcohol dehydrogenase by adenine nucleotide pool (Neves et al, 2005)
• Modulations of certain transcripts and protein levels (Kowalczyk & Bardowski, 2007)
Oxidative phosphorylation
Acetate secretion
Mixed-acids Lactic acid

19
Metabolic shifts: a fitness perspective
Yeast (Saccharo-myces cerevisiae)
Substrate Baking, brewing, wine-making, bioethanol, bulk and fine chemicals, recombinant proteins (van Dam et al, 2002; Nevoigt, 2008)
• Low affinity and high capacity of pyruvate decarboxylase compared with pyruvate dehydrogenase enzymes (Postma et al, 1989; Pronk et al, 1996)
• Post-translational regulation (Daran-Lapujade et al, 2007; Pronk et al, 1996)
• Differential gene expression (Pronk et al, 1996)
• Flux-sensing via FBP (Huberts et al, 2012)
• Balance of the NADH/NAD+ ratio (Vemuri et al, 2007)
Filamentous fungi (Aspergilli)
Substrate Proteins, enzymes bulk and fine chemicals (Meyer et al, 2011)
• Environmental influences triggering transcriptional regulation
• Regulation by global regulators• Sporulation associated signal trans-
duction(Hoffmeister & Keller, 2007)
Mammalian cell lines (Myeloma, Hybridoma, etc.)
Substrate Recombinant proteins, monoclonal antibodies, nucleic acid-based drugs (Vives et al, 2003; Lim et al, 2010; Reiter & Blüml, 1994)
• Warburg effect: lactate production via enhanced glycolysis despite the presence of adequate oxygen (Warburg, 1956)
• Increase in glucose transporters and kinases, post-translational modifications of enzymes, hypoxia-inducible factor: HIF, mitochondrial defects (Gatenby & Gillies, 2004; Gillies & Gatenby, 2007; Gillies et al, 2008; Gatenby et al, 2010)
• Regulation by metabolic enzymes (Diaz-Ruiz et al, 2011)
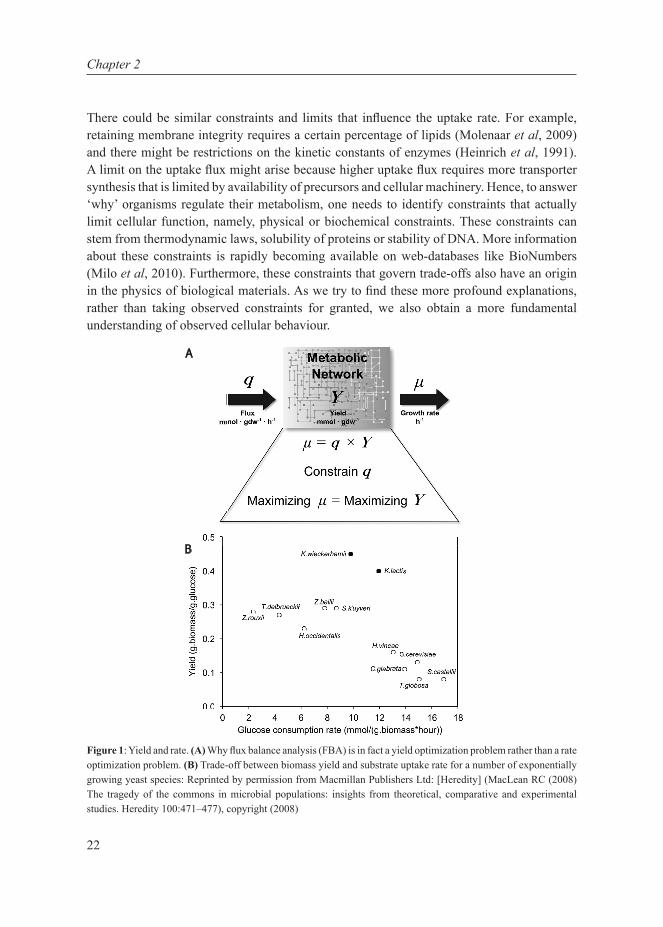
However, not all physiological states can be described by growth optimization. This is because under varying environmental settings, cells often exhibit suboptimal behaviour where their resulting growth rate is very different from what a standard FBA would predict. Schuetz et al (2012) showed that a multidimensional objective can attempt to explain suboptimal behaviour. Additionally, as pointed out by (Teusink et al, 2006), growth optimization in FBA is in fact yield optimization (Fig 1A) and therefore in scenarios where yield optimization is not the objective, standard FBA approaches will invariably fail to predict observations (Schuster et al, 2008; Santos et al, 2011). This is to be expected for biotechnologically relevant conditions such as high concentrations of rapidly fermentable sugars that lead to ATP-inefficient metabolism. Indeed, in the seminal paper from the group of Palsson, it was shown that E. coli evolves towards an in silico predicted “line of optimality” on glycerol, but, on glucose, the evolved cells increased their growth rate but moved away from the FBA-predicted line of optimality by producing acetate (Ibarra et al, 2002). The same difference between glucose and glycerol was observed for Lactobacillus plantarum (Teusink et al, 2006, 2009).
Oxidative phosphorylation
Lactate production
Secondary metabolite production
Growth and primary
metabolism
CO2 production
Ethanol fermentation

20
Chapter 2
FBA applies only a limited set of constraints, being mass-balance constraints (steady state assumption) and some capacity constraints (usually on input fluxes) to bound fluxes through the network. New approaches which apply additional constraints routed in physics and chemistry have to be used to understand metabolic strategies that FBA cannot explain. Beg et al (2007) for the first time, used the macromolecular crowding or solvent capacity constraint on the metabolic network of E. coli. This constraint limits the total intracellular space available for enzymes in cytoplasm. With this constraint, FBA was able to reproduce acetate production in E. coli. Subsequently, this approach was used to model proliferating mammalian cells to explain the Warburg effect (Vazquez et al, 2010; Shlomi et al, 2011). These approaches extend the notion of metabolic efficiency being analogous to stoichiometric ATP-yield only: different flux distributions have different implementation consequences (costs if you will), that should also be taken into account when computing optimal behaviour, as we will elaborate on later.
FBA of multiple species
Microorganisms seldom live in isolation and analysing single species metabolic networks in isolation provides little insight into microbial interactions in communities. Consequently there have been recent efforts to model competition, co-existence, and strain and species interactions using multispecies stoichiometric metabolic modelling. Zomorrodi and Maranas (2012) recently developed a comprehensive FBA framework, OptCom, capable of capturing the trade-offs between individual and community fitness criteria. This approach uses a multi-level, multi-objective optimization routine that allows for constraints of individual species in a larger scaffold of community-level objective maximization. The authors use genome-scale metabolic models of a two-species microbial system and quantify the syntrophic interaction in terms of the extent and direction of transfer of metabolites and electrons between species. Simpler approaches were also used to predict metabolic fluxes, interspecies electron transfer and the ratio of constituent species for anaerobic microorganisms (Stolyar et al, 2007) and in subsurface environments (Zhuang et al, 2011a). Tzamali et al (2011) used a graph-theoretic approach to identify metabolic interactions and their importance on growth in E. coli strain communities. Their results suggest that in certain communities, cross-feeding enhances the growth rate of participating species. The main issues in all of these approaches, that are currently being actively investigated, are how to balance fluxes that are catalyzed by species with different abundances in the population, and what would be a realistic objective for such a community. In summary, multispecies metabolic modelling is an emerging field that aims to quantify metabolic interactions, identify trade-offs and to provide insights into the impact of different substrate availability on species abundance in microbial communities. Some powerful approaches are starting to develop and are getting ready for use in biotechnological applications.

21
Metabolic shifts: a fitness perspective
Cheaters and unexpected strategies in communities
At times, the outcome of optimization of microbial fitness can be surprisingly intricate: an important additional attribute of the optimum is that it should be (evolutionarily) stable. In one such example, the lactic acid bacterium Lactococcus lactis excretes an extracellular protease to degrade milk proteins into free utilizable peptides, a feat required when the peptides in the environment are insufficient for growth. Under these conditions, one would intuitively expect this trait to be selected for. However, this protease is extracellular and the peptides produced do not merely benefit the cell secreting the protease, but in part also diffuse away from it, becoming accessible to neighbouring cells. To grow well, it would indeed be beneficial if all cells produce this protease, but imagine a scenario where one cell does not. This “cheater” cell will still consume peptides released by neighbouring cells but will have more resources (not allocated to protease production) available for growth and reproduction. This, on average, will lead to more progeny and a spread of the protease-negative trait in the population. In fact, it was shown experimentally that this leads to a population that completely loses the protease-positive trait and depending on the conditions, grows much slower (Bachmann et al, 2011). A similar study in yeast showed that the trait for enzymatic breakdown of sucrose by secreted invertase is selected against, because the glucose and fructose formed thereafter diffuse away, and can be used by other individuals (Gore et al, 2009). This is a very counterintuitive outcome of the effect of selection on the physiology of a species, even under constant conditions. A detailed theoretical analysis of this cooperative and cheating behaviour and its implications on biotechnological applications was reviewed recently (Schuster et al, 2010).
Trade-offs: the role of physical and biochemical constraints
In the previous section we discussed a modelling framework (FBA) using empirically derived uptake flux constraints and additionally an intracellular space constraint. The latter results in a shift, from efficient use of potential chemical energy in the substrate through oxidative phosphorylation to inefficient use through aerobic glycolysis, in a model of human cancer cells (Shlomi et al, 2011; Vazquez et al, 2010). In this example there are constraints (to obtain a certain flux some intracellular space is required) and limits (there is a limited amount of intracellular space), which necessitate a choice between oxidative phosphorylation and aerobic glycolysis and this we call a trade-off. Essentially, trade-offs call for a choice between two incompatible features, either of which if chosen, automatically leads to forfeiting the other. There are several biological examples of trade-offs: cells can invest in growing bigger or producing new cells, cells can be optimized for their current environment, or be prepared for possible future changes, just to mention a few.
22
Chapter 2
There could be similar constraints and limits that influence the uptake rate. For example, retaining membrane integrity requires a certain percentage of lipids (Molenaar et al, 2009) and there might be restrictions on the kinetic constants of enzymes (Heinrich et al, 1991). A limit on the uptake flux might arise because higher uptake flux requires more transporter synthesis that is limited by availability of precursors and cellular machinery. Hence, to answer ‘why’ organisms regulate their metabolism, one needs to identify constraints that actually limit cellular function, namely, physical or biochemical constraints. These constraints can stem from thermodynamic laws, solubility of proteins or stability of DNA. More information about these constraints is rapidly becoming available on web-databases like BioNumbers (Milo et al, 2010). Furthermore, these constraints that govern trade-offs also have an origin in the physics of biological materials. As we try to find these more profound explanations, rather than taking observed constraints for granted, we also obtain a more fundamental understanding of observed cellular behaviour.
Figure 1: Yield and rate. (A) Why flux balance analysis (FBA) is in fact a yield optimization problem rather than a rate optimization problem. (B) Trade-off between biomass yield and substrate uptake rate for a number of exponentially growing yeast species: Reprinted by permission from Macmillan Publishers Ltd: [Heredity] (MacLean RC (2008) The tragedy of the commons in microbial populations: insights from theoretical, comparative and experimental studies. Heredity 100:471–477), copyright (2008)
A B
23
Metabolic shifts: a fitness perspective
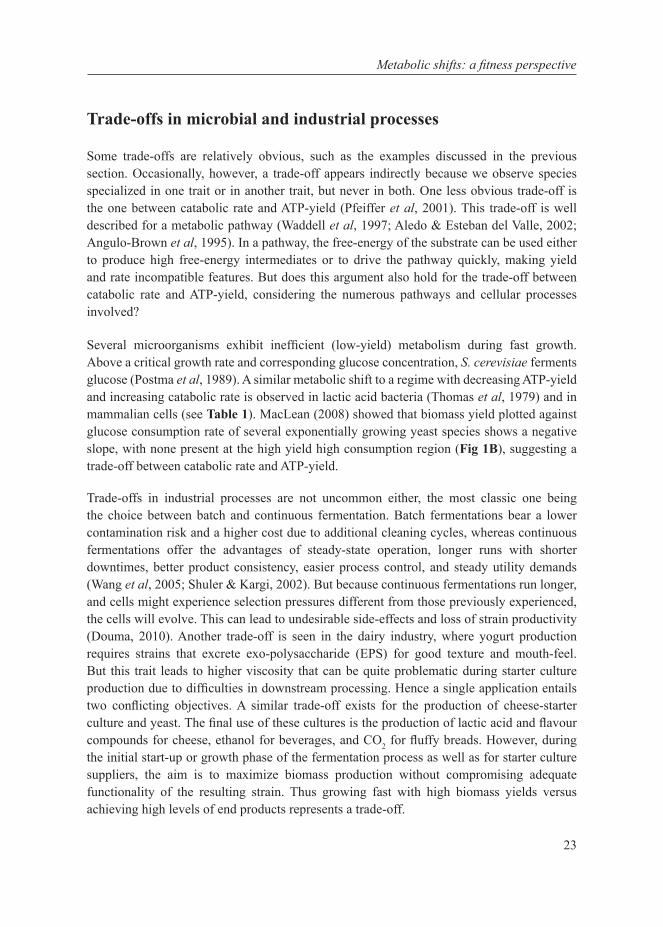
Trade-offs in microbial and industrial processes
Some trade-offs are relatively obvious, such as the examples discussed in the previous section. Occasionally, however, a trade-off appears indirectly because we observe species specialized in one trait or in another trait, but never in both. One less obvious trade-off is the one between catabolic rate and ATP-yield (Pfeiffer et al, 2001). This trade-off is well described for a metabolic pathway (Waddell et al, 1997; Aledo & Esteban del Valle, 2002; Angulo-Brown et al, 1995). In a pathway, the free-energy of the substrate can be used either to produce high free-energy intermediates or to drive the pathway quickly, making yield and rate incompatible features. But does this argument also hold for the trade-off between catabolic rate and ATP-yield, considering the numerous pathways and cellular processes involved?
Several microorganisms exhibit inefficient (low-yield) metabolism during fast growth. Above a critical growth rate and corresponding glucose concentration, S. cerevisiae ferments glucose (Postma et al, 1989). A similar metabolic shift to a regime with decreasing ATP-yield and increasing catabolic rate is observed in lactic acid bacteria (Thomas et al, 1979) and in mammalian cells (see Table 1). MacLean (2008) showed that biomass yield plotted against glucose consumption rate of several exponentially growing yeast species shows a negative slope, with none present at the high yield high consumption region (Fig 1B), suggesting a trade-off between catabolic rate and ATP-yield.
Trade-offs in industrial processes are not uncommon either, the most classic one being the choice between batch and continuous fermentation. Batch fermentations bear a lower contamination risk and a higher cost due to additional cleaning cycles, whereas continuous fermentations offer the advantages of steady-state operation, longer runs with shorter downtimes, better product consistency, easier process control, and steady utility demands (Wang et al, 2005; Shuler & Kargi, 2002). But because continuous fermentations run longer, and cells might experience selection pressures different from those previously experienced, the cells will evolve. This can lead to undesirable side-effects and loss of strain productivity (Douma, 2010). Another trade-off is seen in the dairy industry, where yogurt production requires strains that excrete exo-polysaccharide (EPS) for good texture and mouth-feel. But this trait leads to higher viscosity that can be quite problematic during starter culture production due to difficulties in downstream processing. Hence a single application entails two conflicting objectives. A similar trade-off exists for the production of cheese-starter culture and yeast. The final use of these cultures is the production of lactic acid and flavour compounds for cheese, ethanol for beverages, and CO2 for fluffy breads. However, during the initial start-up or growth phase of the fermentation process as well as for starter culture suppliers, the aim is to maximize biomass production without compromising adequate functionality of the resulting strain. Thus growing fast with high biomass yields versus achieving high levels of end products represents a trade-off.
24
Chapter 2
To predict the outcome of evolution, merely identifying a trade-off is insufficient, since we still do not know which incompatible trait the strain will specialize in. For instance, at high substrate concentrations, species will evolve towards higher growth rates, and –one may suspect– a low biomass yield. Alternatively, when the selection pressure is for a high yield, as is the case for cells in biofilms living in close proximity with their relatives (Kreft, 2004), species will attain a high yield but probably a lower growth rate. That the evolution of species depends on the selection pressure exerted by the environment is important to realise when evolving species in the laboratory or improving strains for bio-industry, because an environment that improves one trait might compromise another. Thus, to improve a trait, it becomes extremely important to find conditions with the right selection pressure. A fascinating example illustrating this is improving accumulation of storage polymers via feast-famine cycles (Chiesa et al, 1985; van Loosdrecht et al, 1997). The condition comprises subjecting cells to cycles of short-time in high substrate environment and long-time without substrate. This condition selects for cells that store substrate during the feast regime and use it in the famine regime.
From regulatory mechanisms to the underlying generic causation: fitness
A plethora of regulatory mechanisms involved in causing and regulating metabolic shifts in various organisms exist in the literature (see Table 1 for a brief summary). These studies have provided a wealth of knowledge in understanding metabolic shifts. While it is crucial to identify the regulatory and molecular mechanisms of metabolic shifts, they are different instantiations of the same phenotype that these cells seems to be selected for. In cancer this is most obvious: whilst different tumours have vastly different mutations, most of them display the Warburg effect (Hanahan & Weinberg, 2011). Therefore, besides identifying the mechanisms of metabolic shifts, we want to find a global explanation of why we see certain patterns of behaviour. In order to get a better understanding of its long-term behaviour it is also important to think about ‘why’ such a regulation system arose in the first place, in other words, what contribution it had to the fitness of the organism. As we saw earlier, trade-offs might be an underlying cause for metabolic shifts, but identifying the key trade-offs can be difficult. Several explanations suggested for growth–rate–related metabolic shifts in microorganisms are discussed in subsequent sub-sections (Fig 2). The advantage of the ATP-efficient pathway seems relatively clear because it produces more energy per substrate. We will therefore first discuss explanations for the use of ATP-inefficient pathways.
25
Metabolic shifts: a fitness perspective
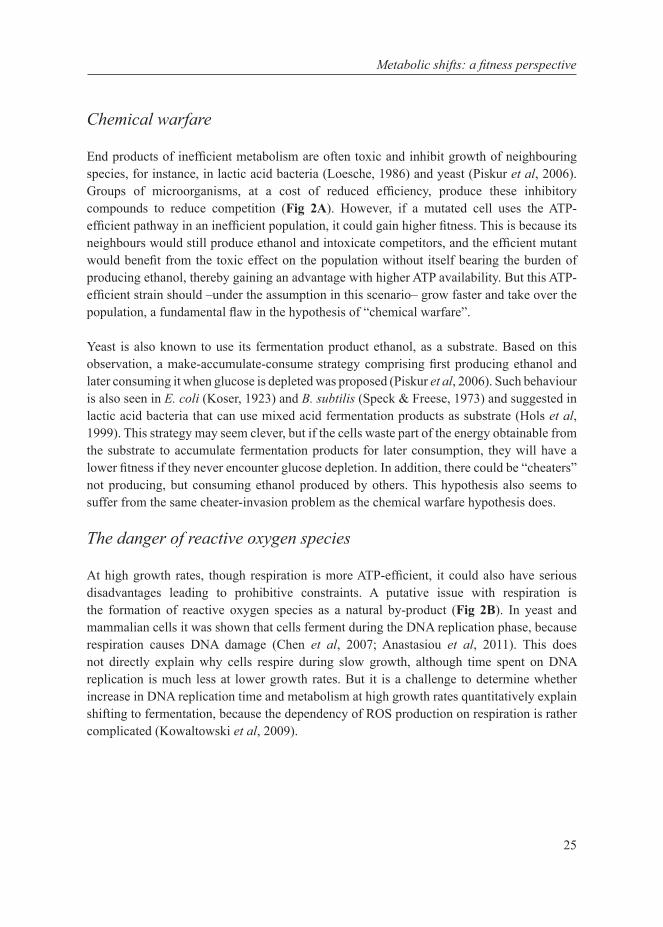
Chemical warfare
End products of inefficient metabolism are often toxic and inhibit growth of neighbouring species, for instance, in lactic acid bacteria (Loesche, 1986) and yeast (Piskur et al, 2006). Groups of microorganisms, at a cost of reduced efficiency, produce these inhibitory compounds to reduce competition (Fig 2A). However, if a mutated cell uses the ATP-efficient pathway in an inefficient population, it could gain higher fitness. This is because its neighbours would still produce ethanol and intoxicate competitors, and the efficient mutant would benefit from the toxic effect on the population without itself bearing the burden of producing ethanol, thereby gaining an advantage with higher ATP availability. But this ATP-efficient strain should –under the assumption in this scenario– grow faster and take over the population, a fundamental flaw in the hypothesis of “chemical warfare”.
Yeast is also known to use its fermentation product ethanol, as a substrate. Based on this observation, a make-accumulate-consume strategy comprising first producing ethanol and later consuming it when glucose is depleted was proposed (Piskur et al, 2006). Such behaviour is also seen in E. coli (Koser, 1923) and B. subtilis (Speck & Freese, 1973) and suggested in lactic acid bacteria that can use mixed acid fermentation products as substrate (Hols et al, 1999). This strategy may seem clever, but if the cells waste part of the energy obtainable from the substrate to accumulate fermentation products for later consumption, they will have a lower fitness if they never encounter glucose depletion. In addition, there could be “cheaters” not producing, but consuming ethanol produced by others. This hypothesis also seems to suffer from the same cheater-invasion problem as the chemical warfare hypothesis does.
The danger of reactive oxygen species
At high growth rates, though respiration is more ATP-efficient, it could also have serious disadvantages leading to prohibitive constraints. A putative issue with respiration is the formation of reactive oxygen species as a natural by-product (Fig 2B). In yeast and mammalian cells it was shown that cells ferment during the DNA replication phase, because respiration causes DNA damage (Chen et al, 2007; Anastasiou et al, 2011). This does not directly explain why cells respire during slow growth, although time spent on DNA replication is much less at lower growth rates. But it is a challenge to determine whether increase in DNA replication time and metabolism at high growth rates quantitatively explain shifting to fermentation, because the dependency of ROS production on respiration is rather complicated (Kowaltowski et al, 2009).
26
Chapter 2
27
Metabolic shifts: a fitness perspective
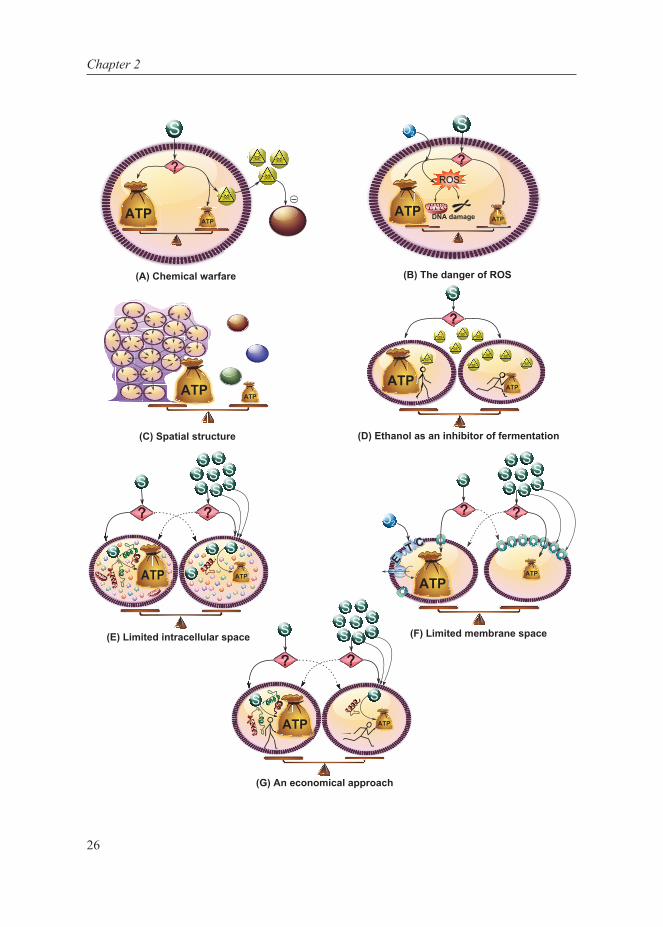
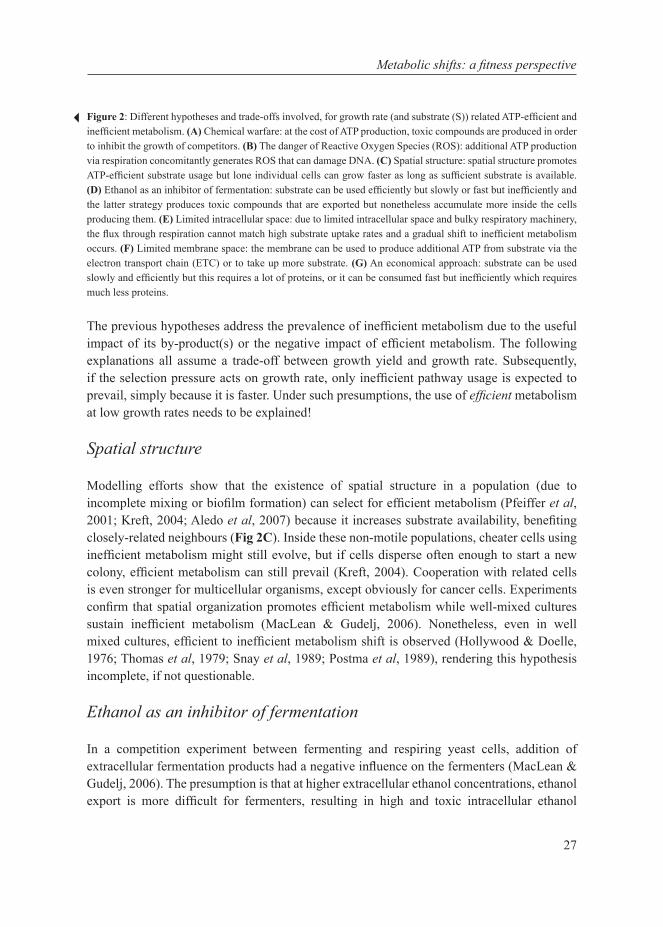
Figure 2: Different hypotheses and trade-offs involved, for growth rate (and substrate (S)) related ATP-efficient and inefficient metabolism. (A) Chemical warfare: at the cost of ATP production, toxic compounds are produced in order to inhibit the growth of competitors. (B) The danger of Reactive Oxygen Species (ROS): additional ATP production via respiration concomitantly generates ROS that can damage DNA. (C) Spatial structure: spatial structure promotes ATP-efficient substrate usage but lone individual cells can grow faster as long as sufficient substrate is available. (D) Ethanol as an inhibitor of fermentation: substrate can be used efficiently but slowly or fast but inefficiently and the latter strategy produces toxic compounds that are exported but nonetheless accumulate more inside the cells producing them. (E) Limited intracellular space: due to limited intracellular space and bulky respiratory machinery, the flux through respiration cannot match high substrate uptake rates and a gradual shift to inefficient metabolism occurs. (F) Limited membrane space: the membrane can be used to produce additional ATP from substrate via the electron transport chain (ETC) or to take up more substrate. (G) An economical approach: substrate can be used slowly and efficiently but this requires a lot of proteins, or it can be consumed fast but inefficiently which requires much less proteins.
The previous hypotheses address the prevalence of inefficient metabolism due to the useful impact of its by-product(s) or the negative impact of efficient metabolism. The following explanations all assume a trade-off between growth yield and growth rate. Subsequently, if the selection pressure acts on growth rate, only inefficient pathway usage is expected to prevail, simply because it is faster. Under such presumptions, the use of efficient metabolism at low growth rates needs to be explained!
Spatial structure
Modelling efforts show that the existence of spatial structure in a population (due to incomplete mixing or biofilm formation) can select for efficient metabolism (Pfeiffer et al, 2001; Kreft, 2004; Aledo et al, 2007) because it increases substrate availability, benefiting closely-related neighbours (Fig 2C). Inside these non-motile populations, cheater cells using inefficient metabolism might still evolve, but if cells disperse often enough to start a new colony, efficient metabolism can still prevail (Kreft, 2004). Cooperation with related cells is even stronger for multicellular organisms, except obviously for cancer cells. Experiments confirm that spatial organization promotes efficient metabolism while well-mixed cultures sustain inefficient metabolism (MacLean & Gudelj, 2006). Nonetheless, even in well mixed cultures, efficient to inefficient metabolism shift is observed (Hollywood & Doelle, 1976; Thomas et al, 1979; Snay et al, 1989; Postma et al, 1989), rendering this hypothesis incomplete, if not questionable.
Ethanol as an inhibitor of fermentation
In a competition experiment between fermenting and respiring yeast cells, addition of extracellular fermentation products had a negative influence on the fermenters (MacLean & Gudelj, 2006). The presumption is that at higher extracellular ethanol concentrations, ethanol export is more difficult for fermenters, resulting in high and toxic intracellular ethanol

28
Chapter 2
concentrations (Fig 2D). But higher accumulation of intracellular ethanol in fermenters in comparison with respirers is not proven yet, leaving this hypothesis open. Besides, it is unlikely that this is a universal explanation, because bacteria shifting between mixed acid and homolactic fermentation need to export either acetate and formate, or lactate, and it is unclear which products are more harmful.
Insofar, we have summarized explanations for the use of inefficient pathways: chemical warfare and the danger of reactive oxygen species, and efficient pathways: spatial structure and toxic effects of ethanol. But often, efficient metabolism is observed at low growth rates and inefficient metabolism at high growth rates. In the forthcoming sub-sections we will review approaches that attempt to explain the metabolic shift as a function of growth rate.
Limited space
(i) Intracellular spaceAs described in section 3, intracellular space constraints can impose a metabolic shift with increasing nutrient uptake in cancer cell models. The hypothesis is that respiration machinery requires more space and cannot match a high uptake flux, resulting in a shift to lactate production (Fig 2E). It remains to be shown that intracellular space is indeed limiting, as cells can change size or shape to tweak the uptake relative to intracellular space.
(ii) Membrane spaceUnder varying circumstances, the electron transport chain and glucose transporters compete for the limited membrane space (Fig 2F). Thus transport rate depends on the space occupied by transporters and the electron transfer chain in the membrane. FBA on the E. coli metabolic network with this dynamic constraint predicts that maximum growth is possible with efficient metabolism at low growth rates and inefficient metabolism at high growth rates, which is in agreement with experimental results (Zhuang et al, 2011b). Thus membrane constraints can explain metabolic shifts, but only in bacteria containing efficient pathway components in their membrane, and it can perhaps be adjusted to explain the shift in eukaryotes containing limited mitochondrial membrane space. This hypothesis cannot, however, explain the shift in lactic acid bacteria involving only cytosolic enzymes.
An economical approach
Molenaar et al (2009) hypothesized that the metabolic shift is in fact due to a resource allocation problem for optimal fitness, with growth rate as a proxy for fitness. They introduced a self-replicator model; a simple representation of a cell with efficient and inefficient metabolic pathways that gives insight into which strategy leads to fastest growth. By taking into account that the efficient pathway actually needs more cellular machinery to operate (a longer pathway
29
Metabolic shifts: a fitness perspective
in lactic acid bacteria, an electron transport chain in E. coli and mitochondria in yeast), the self-replicator model predicts that at low substrate concentrations efficient metabolism leads to a higher growth rate, and at high substrate concentrations inefficient metabolism leads to a higher growth rate (Fig 2G). This approach takes both, the benefits (ATP efficiency) and the associated costs, into account when considering alternative metabolic strategies and thus introduces a hypothesis for the metabolic shift as a function of nutrient availability and hence, growth rate. However, it remains to be shown that the difference in pathway costs can indeed cause this shift in optimal strategy in biological systems.
The cycle of systems biology
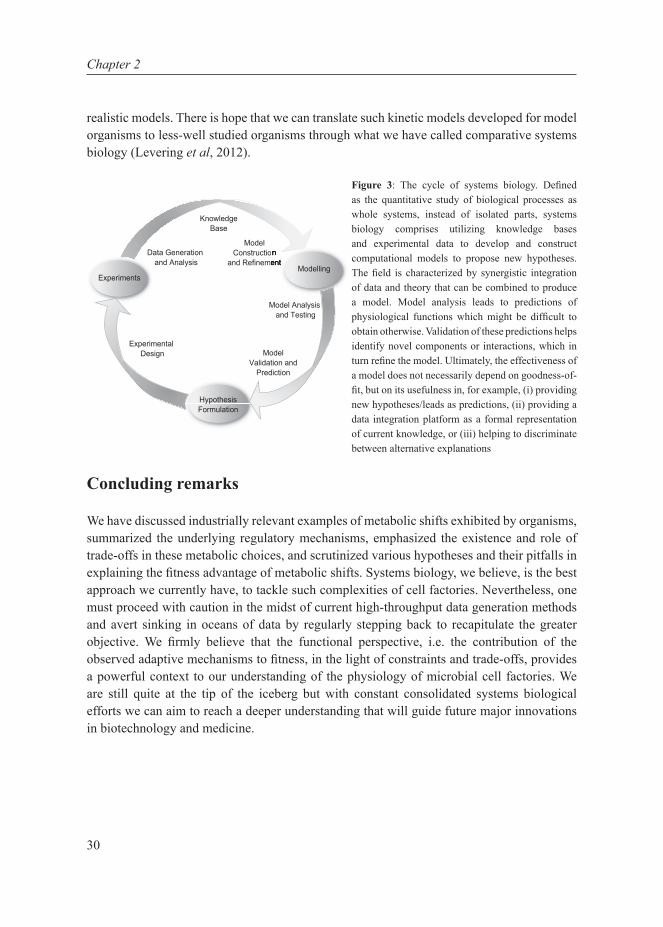
It remains a challenge to validate or falsify the hypotheses described in the previous section. Many of them look at only a specific aspect of metabolism. Nevertheless, these hypotheses call for an integrative approach, since fitness-associated costs are a systems property and cannot be inferred by studying a single component in isolation. Even then, efforts to approximate the costs of protein (Dekel & Alon, 2005; Stoebel et al, 2008; Shachrai et al, 2010) have remained inconclusive. Yet, to understand microbial physiology we believe that a systems biology approach is the best, perhaps the only, option available. Systems biology aspires to capture how systems properties emerge from orchestrated interactions between individual components in an organism, using iterative cycles of quantitative experimental data generation and mathematical modelling (Fig 3). Systems biology studies have shown the ability to address similar problems in the past. Wessely et al (2011) incorporated genome-wide ‘omics’ data into the genome-scale metabolic network of E. coli using various network and optimization tools to link protein investment and transcriptional regulation of pathways. With this integrative approach they identified and suggested an evolutionary trade-off between protein investment and rapid response time. From the industrial perspective, there have been quite a number of successes in systems metabolic engineering combining systems biology, synthetic biology and evolutionary engineering principles (Lee et al, 2011). Accumulated knowledge has been used to perform guided evolution comprising a combination of clever knockouts and selection pressures to produce industrially important compounds via stable processes.
Finally and ultimately, a systems biology approach should connect environmental conditions to genes, transcriptional regulation, transcription factor interactions and protein production to metabolism in a single model. One such example exists that proposes cell regulation via flux sensing metabolites in E. coli (Kotte et al, 2010). This is a good example of how integrated models could look, as closed-loop systems comprising all levels in the cell. Such studies are currently restricted to model organisms such as E. coli as it has been studied for decades and can boast of a rich source of detailed knowledge, unlike other microorganisms. This necessitates multi-level omics studies in the latter to be able to investigate them with
30
Chapter 2
realistic models. There is hope that we can translate such kinetic models developed for model organisms to less-well studied organisms through what we have called comparative systems biology (Levering et al, 2012).
Figure 3: The cycle of systems biology. Defi ned as the quantitative study of biological processes as whole systems, instead of isolated parts, systems biology comprises utilizing knowledge bases and experimental data to develop and construct computational models to propose new hypotheses. The fi eld is characterized by synergistic integration of data and theory that can be combined to produce a model. Model analysis leads to predictions of physiological functions which might be diffi cult to obtain otherwise. Validation of these predictions helps identify novel components or interactions, which in turn refi ne the model. Ultimately, the effectiveness of a model does not necessarily depend on goodness-of-fi t, but on its usefulness in, for example, (i) providing new hypotheses/leads as predictions, (ii) providing a data integration platform as a formal representation of current knowledge, or (iii) helping to discriminate between alternative explanations
Concluding remarks
We have discussed industrially relevant examples of metabolic shifts exhibited by organisms, summarized the underlying regulatory mechanisms, emphasized the existence and role of trade-offs in these metabolic choices, and scrutinized various hypotheses and their pitfalls in explaining the fi tness advantage of metabolic shifts. Systems biology, we believe, is the best approach we currently have, to tackle such complexities of cell factories. Nevertheless, one must proceed with caution in the midst of current high-throughput data generation methods and avert sinking in oceans of data by regularly stepping back to recapitulate the greater objective. We fi rmly believe that the functional perspective, i.e. the contribution of the observed adaptive mechanisms to fi tness, in the light of constraints and trade-offs, provides a powerful context to our understanding of the physiology of microbial cell factories. We are still quite at the tip of the iceberg but with constant consolidated systems biological efforts we can aim to reach a deeper understanding that will guide future major innovations in biotechnology and medicine.
KnowledgeBase
Experiments
Data Generation and Analysis
Model Construction
and Refinement
Model Analysis and Testing
Model Validation and
Prediction
Construction and Refinement
Modelling
Experimental Design
Hypothesis Formulation
31
Metabolic shifts: a fitness perspective
Acknowledgements
This work is supported by the Dutch Technology Foundation STW which is part of the Netherlands Organisation for Scientific Research (NWO) and partly funded by the Ministry of Economic Affairs, Agriculture and Innovation (grant 08080), the Kluyver Centre for Genomics of Industrial Fermentation and the Netherlands Consortium for Systems Biology (NCSB), within the framework of the Netherlands Genomics Initiative (NGI) / NWO.

33
Standardized Assay
Medium to Measure
Enzyme Activities of
Lactococcus lactis while
Mimicking Intracellular
Conditions
Anisha Goel,
Filipe Santos, Willem de Vos, Bas Teusink and Douwe Molenaar
CHAPTER 333 CHAPTER 3
33Published in Applied and Environmental Microbiology (2012) 78: 134-143
34
Chapter 3
Abstract
Knowledge of how the activity of enzymes is affected under in vivo conditions is essential for analysing their regulation and constructing models that yield an integrated understanding of cell behaviour. Current kinetic parameters for Lactococcus lactis are scattered through different studies and performed under different assay conditions. Furthermore, assay conditions often diverge from conditions prevailing in the intracellular environment. To establish uniform assay conditions that resemble intracellular conditions, we analysed the intracellular composition of anaerobic glucose-limited chemostat cultures of L. lactis subsp. cremoris MG1363. Based on this, we designed a new assay medium for enzyme activity measurements of growing cells of L. lactis, mimicking as closely as practically possible its intracellular environment. Procedures were optimized to be carried out in 96-well plates and the reproducibility and dynamic range was checked for all enzyme activity measurements. The effect of freezing and the carry-over of ammonium sulphate from the addition of coupling enzymes was also established. Activities of all ten glycolytic and four fermentative enzymes were measured. Remarkably, most in vivo-like activities were lower than previously published data. Yet, the ratios of Vmax over measured in vivo fluxes were above 1. With this work we have developed and extensively validated standard protocols for enzyme activity measurements for L. lactis.
Keywords: Lactic acid bacteria, Lactococcus lactis, In vivo-like enzyme assays, Standardization, Systems biology
35
In vivo-like assay medium for L. lactis
Introduction
Lactococcus lactis is an industrially important lactic acid bacterium with a prominence in the fermented dairy foods industry (Cogan & Hill, 1993). It is known to convert nearly 90% of simple sugars like glucose into lactic acid at high growth rates (Thomas et al, 1979). The genome of Lactococcus lactis ssp. cremoris MG1363 has been characterized at the sequence level (Wegmann et al, 2007; Linares et al, 2010) and recent attempts have been made to perform multilevel –omics analysis under different growth conditions (Even et al, 2003; Dressaire et al, 2009; Lahtvee et al, 2011). The integration of such multi –omics data sets in systems biology and bioinformatics studies rely crucially on well-validated standard protocols. Additionally the ability to measure many variables of the system at any given moment requires the development of sampling, storage and measurement assay methods that optimally preserve the state of the organism.
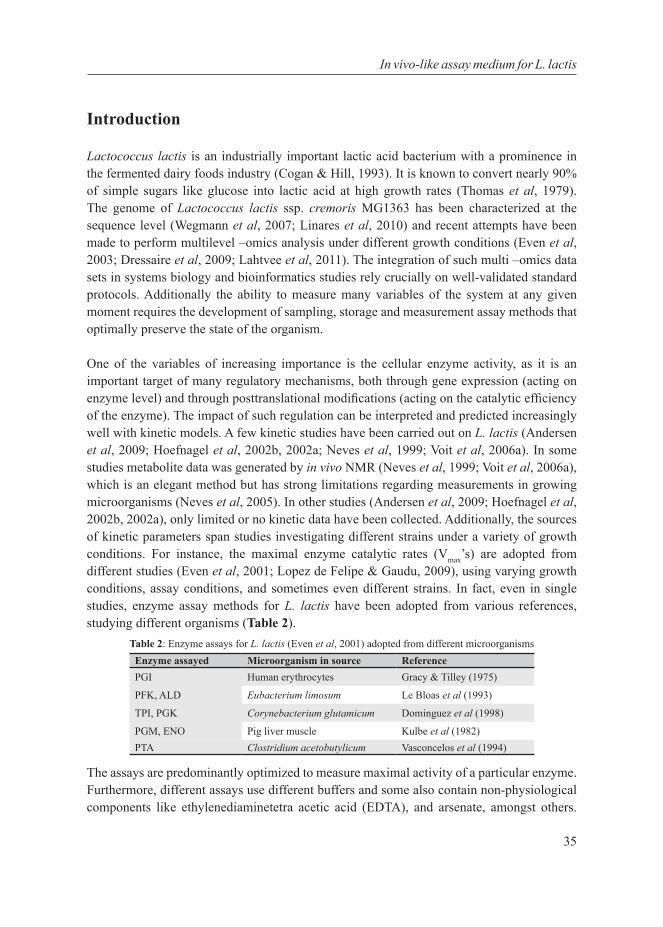
One of the variables of increasing importance is the cellular enzyme activity, as it is an important target of many regulatory mechanisms, both through gene expression (acting on enzyme level) and through posttranslational modifications (acting on the catalytic efficiency of the enzyme). The impact of such regulation can be interpreted and predicted increasingly well with kinetic models. A few kinetic studies have been carried out on L. lactis (Andersen et al, 2009; Hoefnagel et al, 2002b, 2002a; Neves et al, 1999; Voit et al, 2006a). In some studies metabolite data was generated by in vivo NMR (Neves et al, 1999; Voit et al, 2006a), which is an elegant method but has strong limitations regarding measurements in growing microorganisms (Neves et al, 2005). In other studies (Andersen et al, 2009; Hoefnagel et al, 2002b, 2002a), only limited or no kinetic data have been collected. Additionally, the sources of kinetic parameters span studies investigating different strains under a variety of growth conditions. For instance, the maximal enzyme catalytic rates (Vmax’s) are adopted from different studies (Even et al, 2001; Lopez de Felipe & Gaudu, 2009), using varying growth conditions, assay conditions, and sometimes even different strains. In fact, even in single studies, enzyme assay methods for L. lactis have been adopted from various references, studying different organisms (Table 2).
Table 2: Enzyme assays for L. lactis (Even et al, 2001) adopted from different microorganisms Enzyme assayed Microorganism in source ReferencePGI Human erythrocytes Gracy & Tilley (1975)
PFK, ALD Eubacterium limosum Le Bloas et al (1993)
TPI, PGK Corynebacterium glutamicum Dominguez et al (1998)
PGM, ENO Pig liver muscle Kulbe et al (1982)PTA Clostridium acetobutylicum Vasconcelos et al (1994)
The assays are predominantly optimized to measure maximal activity of a particular enzyme. Furthermore, different assays use different buffers and some also contain non-physiological components like ethylenediaminetetra acetic acid (EDTA), and arsenate, amongst others.
36
Chapter 3
Consequently, the dearth of well-established kinetic parameters under standardized conditions is a major setback for kinetic studies, which often limits the predictive power of models.
In the era of systems biology, we require kinetic parameters under standardized conditions, ideally reflecting as closely as possible the conditions encountered by the enzymes in the cell. In a recent study, such an attempt to standardize the assay conditions for Saccharomyces cerevisiae has been successfully made (van Eunen et al, 2010). On similar lines, in the present study, we have developed an in vivo-like assay medium to standardize enzyme activity measurements in L. lactis. In addition, we established protocols for harvesting, storage, extract preparation and specific enzyme assays of almost all enzymes in central energy metabolism in L. lactis. We apply these to measuring glycolytic and fermentative enzyme activities in batch and glucose-limited chemostat cultures of L. lactis.
Materials and methods
Strain and growth medium
Lactococcus lactis ssp. cremoris MG1363 (Gasson, 1983) was grown on chemically defined medium for prolonged cultivation (CDMPC) as described by Santos et al., (manuscript in preparation) with 25 mM glucose as the limiting nutrient and the following composition: (i) buffer (g∙L-1) KH2PO4, 2.75; Na2HPO4, 2.85; NaCl, 2.9; (ii) vitamins (mg∙L-1): DL-6,8-thioctic acid, 2; D-pantothenic acid hemicalcium salt, 0.5; biotin, 0.1; nicotinic acid, 1; pyridoxal hydrochloride, 1; pyridoxine hydrochloride, 1; thiamine hydrochloride, 1; (iii) metals (mg∙L-
1): ammonium molybdate tetrahydrate, 0.3; calcium chloride dihydrate, 3; cobalt(II) sulphate heptahydrate, 0.3; copper(II) sulphate pentahydrate, 0.3; iron(II) chloride tetrahydrate, 4; magnesium chloride hexahydrate, 200; manganese chloride tetrahydrate, 4; zinc sulphate heptahydrate, 0.3; (iv) amino acids (mg∙L-1): L-alanine, 130; L-arginine, 244; L-asparagine, 80; L-aspartic acid, 137; L-cysteine hydrochloride monohydrate, 61; L-glutamic acid, 97; L-glutamine, 96; glycine, 29; L-histidine, 24; L-isoleucine, 82; L-leucine, 117; L-lysine monohydrochloride, 187; L-methionine, 38; L-phenylalanine, 64; L-proline, 412; L-serine, 172; L-threonine, 68; L-tryptophan, 36; L-tyrosine, 50; L-valine, 86. The maximum growth rate of L. lactis in this growth medium under batch conditions is 0.7 h-1.
Culture conditions
Glucose-limited chemostat cultures were grown in 2 L bioreactors with a working volume of 1.2 L at 30 °C, under continuous stirring. The headspace was flushed at 5 headspace volume changes per hour, with a gas mixture of 95% N2 (99.998% pure) and 5% CO2 (99.7% pure) with oxygen impurity less than 34 vpm. A pH of 6.5±0.05 was maintained by automatic titration with 5 M NaOH. Fermentors were inoculated with 4% (v/v) of standardized pre-

37
In vivo-like assay medium for L. lactis
cultures consisting of 45 mL of CDMPC inoculated with 300 µL of a glycerol stock of L. lactis MG1363 and incubated for 16 h at 30 °C. After batch growth until an optical density at 600 nm (OD600) of around 1.8, medium was pumped at the appropriate dilution rate (0.5, 0.2 or 0.15 h-1). The chemostats were harvested assuming a steady state at 10 working volume changes (Even et al, 2003). For assay standardization experiments, batch cultures were grown in static 50 mL cultures in the same medium at 30 °C.
Analytical methods
Cell density was measured spectrophotometrically at 600 nm and calibrated against cell dry weight measurements performed as follows. 4 mL of culture was filtered through a pre-dried, pre-weighed 0.2 µm cellulose nitrate filter (Whatman GmbH, Dassel, Germany), washed twice with deionized water and dried to a constant weight. For one unit change of optical density, the change in dry weight was determined to be 0.31 ± 0.02 gL-1OD600
-1.
Fermentation end-product analysis
Supernatant samples from chemostat fermentations were prepared by filtering the cultures through a 0.20 µm polyethersulfone (PES) filter (VWR international B.V., Amsterdam, the Netherlands) and storing the flow-through at -20ºC until further analysis. Extracellular concentrations of lactate, acetate, ethanol, formate, and glucose were determined by High Performance Liquid Chromatography (HPLC) on a Shimadzu LC-10AT liquid chromatograph equipped with a Shimadzu RID-10A refractive index detector for ethanol and glucose, and a Shimadzu SPD-10AVP UV-Vis absorbance detector set at 210 nm for the remaining metabolites. Separation was carried out on a Bio-Rad Aminex Ion exclusion HPX-87H column equilibrated at 55ºC with an isocratic flow of 5 mM H2SO4 set to 0.5 mL/min. The injection volume used was 50 µL and concentrations were estimated by comparison of peak areas to a calibration curve obtained with standards analysed under the same conditions.
Element analysis
Harvested samples from chemostats at 0.5 and 0.2 h-1 dilution rate were centrifuged (4 °C, 5 min, 10000 g) and washed twice with 100 mM tris(hydroxymethyl)aminomethane-HCl buffer (pH 6.5). The supernatant was discarded and the cell pellet, after snap freezing in liquid nitrogen, was freeze-dried. The elemental composition of freeze-dried culture was determined by inductively coupled plasma atomic emission spectroscopy (ICP-AES), at the Energy research centre of the Netherlands (ECN Petten) (Rouf, 1964). Values obtained were converted to intracellular concentrations using 1.67 µL intracellular volume per mg cell dry weight (Thompson, 1976), assuming constant volume for both dilution rates (Supplementary material).
38
Chapter 3
Sampling and preparation of cell extracts
An amount of cell culture containing 100 mg dry weight was centrifuged (4 °C, 5 min, 8000 rpm), washed once and resuspended in 3 mL 50 mM HEPES (4-(2-hydroxyethyl)-1-piperazineethanesulfonic acid)-KOH buffer at pH 7.5, containing 15% glycerol supplemented with Halt Protease Inhibitor single-use cocktail, EDTA-free (Thermo Fischer Scientific, Rockford, IL, USA). The rationale behind the choice of this buffer is addressed in the Supplementary material. This suspension was divided into 0.5 mL aliquots added to 0.5 mg glass beads with 100 µm diameter (BioSpec Products, Bartlesville, USA) in screw capped tubes and stored at -20°C until further analysis. Frozen samples were thawed and MgCl2 was added to a final concentration of 2 mM. Cells were disrupted in a FastPrep FP120 homogenizer (BIO 101, Vista, CA, USA) at a speed setting of 6, in 3 bursts of 20 s, with 120 s intermittent cooling periods (see Fig S1 and S2 in the Supplementary material for details on optimization of this procedure). After centrifugation (4 °C, 10 min, 10000 g), the supernatant was collected and a series of dilutions were prepared, which were used immediately for enzyme assays. Protein concentrations of whole cells and cell extracts used for enzyme assays were determined on the same day by the bicinchoninic acid (BCA) method (Stoscheck, 1990) with a BCA Protein Assay Kit (Pierce, Thermo Fisher Scientific) using bovine serum albumin (BSA, 2 mg·mL−1 stock solution; Pierce), containing 2 mM MgCl2 and Halt Protease Inhibitor cocktail, as the standard.
Enzyme activity assays
Enzyme activities were assayed at 30 °C in freshly prepared cell extracts by coupling enzyme activity with the consumption or formation of NAD(P)H and monitoring its absorbance at 340 nm (A340) in Greiner flat-bottom polystyrene microplates in a Novostar spectrophotometer (BMG Labtech, Offenburg, Germany). In the P-transacetylase assay, the coenzyme-A formed in the reaction was oxidized by 5,5’-dithiobis-(2-nitrobenzoic) acid (DTNB). Reduction of DTNB was monitored at 405 nm. The enolase assay was performed in two ways. One was by coupling with NADH formation as already described. The other was by measuring absorbance of its product, phosphoenol pyruvate (PEP), at 240 nm in Greiner flat-bottom UV-transparent (UV-star) microplates. Both assays resulted in the same activity (Table S1, Supplementary material). Absorbances of DTNB and PEP were monitored in a Spectramax spectrophotometer (Molecular Devices, Sunnyvale, CA, USA). Extinction coefficients for 300 µL reagent mixtures with final composition as in the in vivo-like buffer in microplates were determined to be ε340 · L = 5.06 · 103 M-1 for NAD(P)H, ε405 · L = 10.494 · 103 M-1 for DTNB, and ε240 · L = 1.256 · 103 M-1 for PEP, where path length (L) is 8.1 mm. For each assay, activities were corrected for background rates in controls, without the start reagent, without cell extract, and without both (see Supplementary material for detailed protocol). Five dilutions in duplicate were used for all assays and their proportionality was checked. In
39
In vivo-like assay medium for L. lactis
all cases, activity values from at least two dilutions in duplicate were proportional with the amount of cell extract added and were used for calculation of mean activities. The values obtained from the assays yield the total activity of all isoenzymes in the cell extract and are expressed as the rate of substrate converted, relative to total protein in the extract. Where reported as fluxes, values were multiplied by the ratio of total protein content per dry weight estimated for the respective culture. All assay mixtures had a pH of 7.5 and contained the components of the in vivo-like buffer, i.e. 100 mM HEPES, 400 mM potassium glutamate, 50 mM NaCl, 1 mM potassium phosphate and 1/10th of concentration of metals as present in CDMPC. Additional components are described in Table 3 for each assay. ALDH was also assayed using a method for E. coli (Rudolph et al, 1968). The reaction mixture contained 50 mM potassium phosphate buffer at pH 7, 0.1 mM CoA, 10 mM DTT, 0.5 mM NAD+ and initiator 40 mM acetaldehyde.
Desalting of coupling enzymes
Enzymes obtained from commercial suppliers were desalted by centrifugal filtration in 3 kD Microcon® centrifugal filters (Millipore Corporation, Bedford, MA, USA). Enzyme solutions were centrifuged (4 °C, 60 min, 13300 rpm), washed with an equal volume of demineralised water, centrifuged again and suspended in the same volume of demineralised water. The filters were inverted and centrifuged again (4 °C, 5 min, 9000 rpm) to obtain desalted enzyme solutions.
Results
The endeavour to establish an in vivo-like assay medium for L. lactis requires analysis of its cytosolic conditions regarding two major factors, namely concentrations of ionic species and pH. We therefore started with analysing chemostat cultures of L. lactis for concentrations of various elements.
Elemental analysis of L. lactis. The intracellular concentrations of different elements in chemostat cultures of L. lactis for dilution rates 0.5 and 0.2 h1 are listed in Table 4. Two dilution rates were analysed in order to test the possibility of using a single assay medium for analysis of cultures at dilution rates within this range. Between the dilution rates, all the elements had similar concentrations, except sodium, which differed by about 23 mM with a standard deviation of 13.6 mM. It is important to point out that these values denote total ion concentrations and one cannot exclude the possibility of different proportions of liganded and free form between the dilution rates. Nevertheless, for practical purposes, an approach involving one single assay medium was chosen.

40
Chapter 3
Table 3: Composition of reagent mixtures for all enzyme assaysa
Enzyme Reaction mixture componentsGLK*EC 2.7.1.2
4 mM MgSO4, 2 mM ATP, 0.4 mM NADP+, 5 U · mL1 G6PDH and initiator: 10 mM glucose
G6PDH*EC 1.1.1.49
2 mM MgSO4, 0.4 mM NADP+ and initiator: 10 mM glucose-6P
PGI, EC 5.3.1.9 (physiological direction)
7 mM MgSO4, 5 mM ATP, 0.3 mM NADH, 1 U · mL1 PFK, 1 U · mL1 ALD, 2 U · mL1 glycerol-3P dehydrogenase (G3PD), 5 U · mL1 TPI, and initiator: 10 mM glucose-6P
PGI (non-physiological direction)
2 mM MgSO4, 0.4 mM NADP+, 1.75 U · mL1 G6PDH and initiator: 20 mM fructose-6P
PFKEC 2.7.1.11
7 mM MgSO4, 5 mM ATP, 0.3 mM NADH, 1 U · mL1 ALD, 2 U · mL1 G3PD, 5 U · mL1 TPI, and initiator: 20 mM fructose-6P
ALDEC 4.1.2.13
2 mM MgSO4, 0.3 mM NADH, 2 U · mL1 G3PD, 5 U · mL1 TPI, and initiator: 30 mM fructose-1,6BP
TPIEC 5.1.3.1
2 mM MgSO4, 0.3 mM NADH, 2 U · mL1 G3PD, and initiator: 6 mM glyceraldehyde-3P
GAPDHEC 1.2.1.12
5 mM MgSO4, 5 mM cysteine-HCl, 50 mM potassium phosphate, 3 mM ADP, 14.5 U · mL1 PGK, 5 mM NAD+ and initiator: 10 mM glyceraldehyde-3P
PGK, EC 2.7.2.3 (non-physiological direction)
7 mM MgSO4, 5 mM ATP, 0.3 mM NADH, 8 U · mL1 GAPDH, and initiator: 10 mM 3-PGA
PGMEC 5.4.2.1
5 mM MgSO4, 3 mM ADP, 0.1mM 2,3BPG, 0.3 mM NADH, 2 U · mL1 ENO, 5 U · mL1 PYK, 10 U · mL1 LDH, and initiator: 5 mM 3P-glycerate
ENOEC 4.2.1.11 PEP absorbance┼
5 mM MgSO4, 3 mM ADP, 0.3 mM NADH, 5 U · mL1 PYK, 10 U · mL1 LDH, and initiator: 5 mM 2Pglycerate2 mM MgSO4, and initiator: 5 mM 2Pglycerate
PYKEC 2.7.1.40
5 mM MgSO4, 3 mM ADP, 5 mM fructose-1,6BP, 0.3 mM NADH, 10 U · mL1 LDH, and initiator: 6 mM PEP
LDHEC 1.1.1.27
2 mM MgSO4, 3 mM fructose-1,6BP, 0.3 mM NADH, and initiator: 6 mM PYR
ACKEC 2.7.2.1
5 mM MgSO4, 3 mM ADP, 2 mM glucose, 0.4 mM NADP+, 8.5 U · mL1 hexokinase, 12.7 U · mL1 G6PDH, and initiator: 5 mM acetyl-P
PTAEC 2.3.1.8PTA control
2 mM MgSO4, 0.08 mM DTNB, and initiator: 0.4 mM acetyl-coenzyme A2 mM MgSO4, 0.008 mM DTNB, 2 mM acetyl-P, and initiator: 0.4 mM acetyl-CoA
ADHEC 1.1.1.1
2 mM MgSO4, 0.3 mM NADH, and initiator: 20 mM acetaldehyde
ALDH§ (non-physiological direction)EC 1.2.1.10
2 mM MgSO4, 0.1 mM CoA, 1 mM DTT, 0.5 mM NAD+ and initiator 40 mM acetaldehyde
a Detailed methodology can be accessed in DocS3.xls in supplementary material.*(van Eunen et al, 2010), ┼(Lee & Nowak, 1992), §(Rudolph et al, 1968), all other enzymes (Even et al, 2001)

41
In vivo-like assay medium for L. lactis
Table 4: Intracellular concentrations of different elements in L. lactis at various dilution rates
Element D (h-1) Ca K Mg Mn Na SIntracellular concentration (mM)*
0.5b 0.42 + 0.24 559 + 19 59 + 2 0.68 + 0.04 60 + 4 59 + 0.7
0.2c 0.76 + 0.44 570 + 26 53 + 2 0.67 + 0.08 37 + 13 63 + 0.6
* calculated by converting to moles obtained quantities in mg element per kg dry cells and dividing by 1.67 mL· g dry cells-1 (Thompson, 1976)b values represent the average ± standard deviation of three independent biological replicatesc values represent the average ± standard deviation of two independent biological replicates
pH of the assay medium
The pH has a strong influence on the kinetic parameters of enzymes (Dixon, 1953) and therefore it is crucial that in all assays pH is kept constant and similar to the value in the cytoplasm. The pH of the assay medium was set to 7.5, the reported internal pH (Olsen et al, 2002) at an external pH of 6.5 (the same as in CDMPC). Furthermore, it seems that the internal pH is kept relatively constant in vivo in the range of external pH’s between 6 and 7 (Molina-Gutierrez et al, 2002).
Element concentrations
Based on the data in Table 4, the composition of the ions in the medium was rationalized. Calcium and manganese ions may bind to proteins and other components in cells (Exterkate & Alting, 1999; Cossins et al, 2011) and the values in Table 4 might not represent the free ion concentrations. Furthermore, due to their low concentrations (Table 4), it was decided not to add these ions in separate solutions to the standard buffer, but as a combined solution of many metal ions at low concentrations to improve reproducibility (see section on addition of other metal ions). Although this solution has a concentration of about 2 μM each of Ca2+ and Mn2+, that is lower than that obtained by elemental analysis, it is sufficient to saturate enzymes in the assay. This is because the measured enzyme is only a fraction of the total protein content, which in the assay has a concentration of approximately 0.5 μM. For the sodium ion, an average concentration of 50 mM was selected, along with chloride as its counter ion.
The magnesium ion concentration was ~55 mM, but inside the cell it is known to be bound to nucleic acids, adenine nucleotides (Romani & Scarpa, 1992) , and cell wall teichoic acid (Lambert et al, 1975). The cytosolic free concentration of Mg2+ in L. lactis has not been reported. However, in E. coli it was reported to be the same as extracellular magnesium in a 1μM to 10 mM range (Beeler et al, 1997) and around 0.1 to 1 mM in S. cerevisiae (Hurwitz & Rosano, 1967). The concentration of Mg2+ in the growth medium is ~0.1 mM. For repro-ducibility of Mg2+ in the assay, an approximate free ion concentration of 2 mM was chosen. The ratio of ATP and ADP binding to Mg2+ is nearly 80% (Storer & Cornish-Bowden, 1976), which can consequently reduce the unbound Mg2+ concentration. Therefore, the addition of Mg2+ in assays was always 2 mM above the concentration of ATP or ADP added.

42
Chapter 3
The potassium ion concentration was by far the highest among all elements in L. lactis at approximately 550 mM. A similarly high potassium ion concentration of 600 mM and 500 mM has been reported for L. lactis (Poolman et al, 1987c) and for another Gram positive bacterium, Enterococcus faecalis respectively (Harold & Kakinuma, 1985). This value of 550 mM is representative of the free K+ concentration because K+ does not generally interact with non-covalently interacting metabolite structures, and thus may be evenly distributed in the cytoplasm (Cossins et al, 2011). Hence, after finalizing Na+, Cl-, Mg2+ and K+, it was necessary to find a suitable counter ion for K+ in the assay medium.
Phosphate: an important effector
Before proceeding further with the design, first, the workability of measuring enzymes in the standardized in vivo-like buffer designed for yeast was checked. It consists of 300 mM K+, 245 mM glutamate and 50 mM phosphate (van Eunen et al, 2010), with phosphate offering the buffering action. The same buffer components are also present in L. lactis cytoplasm albeit in different quantities. Assays of L. lactis were collected from literature and the buffers in each assay were replaced by the in vivo-like buffer of yeast at a pH of 7.5. These assays were then tested on commercially available enzymes and subsequently on cell extracts of L. lactis.
We observed no activity for pyruvate kinase with the yeast buffer. We conceived that, for L. lactis, phosphate may not be the appropriate choice as a buffer, because it is a regulator of many glycolytic enzymes, pyruvate kinase in particular (Collins & Thomas, 1974). Hence, the pyruvate kinase assay was tested with varying concentrations of phosphate to investigate its inhibitory effect in the presence of 5 mM FBP (required for activation of PYK). At a low concentration of 2 mM phosphate pyruvate kinase activity is slightly inhibited (Fig 1A). In view of the fact that the phosphate concentration in rapidly fermenting cells is substantially lower than 50 mM, (<1 mM) (Neves et al, 2002), a final concentration of 1 mM free phosphate was chosen for the in vivo-like medium, realizing that phosphate is variable and a potential effector of many enzymes.
Buffering capacity
With the lowering of phosphate, the buffering capacity of the assay medium was reduced considerably. Since a number of components are added to assays and pH changes due to reactant consumption or product formation can be expected, a buffer was needed in the assay medium. The cell has a number of salts and proteins, which together confer buffering capacity in the cytoplasm, but this is not practically reproducible in vitro. Hence we searched for a buffer with a pKa closest to the pH of the in vivo-like assay medium, i.e. 7.5. The

43
In vivo-like assay medium for L. lactis
shortlisted candidates were DIPSO and HEPES with pKa’s of 7.52 and 7.48 and effective pH ranges of 7.0 to 8.2 and 6.8 to 8.2 respectively. Of these, we chose HEPES on account of having a broader pH range and being one of the twelve Good’s buffers with numerous desirable characteristics like low absorbance between 240 nm and 700 nm, minimal change with temperature, enzymatic stability, and limited effects due to solution composition, among others (Good et al, 1966). We also compared the activities of a few enzymes in HEPES, and tris-HCl, the buffer used so far for many enzyme assays of L. lactis in Fig 1B. Activities were similar in both cases, except for PTA, where the activity in HEPES was higher. Concluding on the preceding grounds, HEPES was chosen as the buffer for the in vivo-like assay. K+ was chosen as the counter ion to account partially for the high concentration required in the in vivo-like medium.
Figure 1: (A) Relative Vmax of PYK in the presence of 5 mM FBP and varying concentrations of inorganic phosphate, normalized to PYK Vmax in the absence of phosphate. (B) Relative Vmax at pH 7.5 in HEPES buffer, normalized to Vmax in Tris-HCl buffer. (C) Relative activities of LDH (white bars), PYK (grey bars), and GAPDH (black bars) with varying potassium glutamate concentrations normalized to activities in the absence of potassium glutamate. (D) Vmax’s with 1/10th the metals present in CDMPC, relative to Vmax’s without metals added to the assay buffer. Error bars represent standard deviations of a ratio (see Supplementary material), of average activities from at least three independent dilutions of a single cell extract.
0
0.5
1
1.5
0 0.5 1 2 4 6 8 10Inorganic phosphate concentration (mM)
Rel
ativ
e Vm
ax, P
YK
0
1
2
LDH PTA ACK ADH
Rel
ativ
e V m
ax a
t pH
7.5
(HEP
ES /
Tris
-HC
l)
0
1
0 200 300 400 500Potassium glutamate concentration (mM)
Rel
ativ
e V
max
0
1
GLK
G6P
DH
PGI
PFK
ALD TP
I
GA
PDH
PGK
PGM
ENO
PYK
LDH
AC
K
PTA
AD
H
Rel
ativ
e ac
tivity
(With
met
als
/ W
ithou
t met
als)
A B
C D

44
Chapter 3
Counter ion for potassium
In view of the fact that a high amount of K+ was present in L. lactis, the next step was to find a counter ion. Glutamate was found to be the best choice because it is the most abundant free amino acid in the cytoplasm of L. lactis, accounting for up to 50% of the total amino acid pool (Thompson et al, 1986; Poolman et al, 1987d). Furthermore, it is a better alternative to inorganic counter ions that can significantly inhibit enzyme activities if present at high concentrations (Pollard & Jones, 1979). Therefore, to examine the maximum non-inhibiting concentration of glutamate, enzymes were tested with varying concentrations of potassium glutamate. Up to a concentration of 400 mM LDH was relatively insensitive, but at 500 mM, the activity dropped by 32% (Fig 1C). For PYK, between 300 and 500 mM potassium glutamate, activity dropped 18-24%. For GAPDH, above 300 mM, activity dropped around 13%. Keeping in mind that the cytoplasmic concentration of K+ in L. lactis is very high, it is important to have an ample amount of K+ in the assay medium. The consequence of this might be reduced enzyme activities. This can be supported by the fact that enzyme activities inside the cell might not actually function at the maximum rate as observed in conditions without K+. However, in order to avoid substantial inhibition, like that observed in LDH at 500 mM potassium glutamate, a final concentration of 400 mM was chosen for the in vivo-like medium.
Addition of other metal ions
With the composition of the assay medium nearly complete we thought of possible additions that would improve applicability and reproducibility. Chemically defined media for L. lactis cells always contain a concoction of metals necessary for its growth. Hence, it is possible that these metals are present in the cytoplasm. We tested the effect of adding 1/10th of the concentration of metals present in CDMPC (Table 5) to the in vivo-like medium. The activities in the presence of metals are slightly but not significantly higher, and are not inhibited by metals (Fig 1D). Since trace elements can easily enter the reaction mixture as lab contaminants, adding a known amount improves reproducibility without sacrificing the measurement. Besides, it also ensures that an enzyme will not be limited if dependent on some metal, making the assay suitable for enzymes other than those already tested. It was therefore decided to add to the in vivo-like assay medium, 1/10th the concentration of metals present in CDMPC.
Table 5: Composition of the in vivo-like assay medium (version 1.0) for L. lactis
Component ConcentrationHEPES 100 mMK+ 438 mM
Glutamate 400 mM
Phosphate 1 mM
NaCl 50 mM
MgSO42 mM
(NH4)6Mo7O240.024 μM
CaCl22.04 μM
CoSO40.107 μM
CuSO4120 μM
MgCl298.376 μM
MnCl22.021 μM
ZnSO40.104 μM
FeCl2 2.012 μM

45
In vivo-like assay medium for L. lactis
Proposed in vivo-like assay medium
The composition of the proposed in vivo-like assay medium for L. lactis growing cultures was thus finalized and is described in Table 5.
Enzyme activities in the in vivo-like assay medium
The activities of all enzymes involved in glycolysis and pyruvate metabolism were tested in the in vivo-like assay medium in cell extracts of L. lactis. At this point, we further standardized the procedure for reproducibility, recognized interfering reactions, enzyme effectors, and the effect of incoming ammonium sulphate from coupling enzymes, and effect of freezing on enzyme activities.
Proportionality and reproducibility
In order to ensure proportionality of activity with the amount of cell extract added, five serial dilutions in duplicate were used for all assays. In all cases, at least four slopes i.e. two dilutions in duplicate were linear in time, as well as proportional with amount of cell extract added, and used for calculation of activities. Fig 2 shows the proportionality between LDH activity values obtained for five dilutions of the cell extract with a Pearson’s correlation coefficient square (r2) of 0.9987. For some assays, less diluted cell extract showed activities that were not proportional with activities in more diluted cell extracts. For the less active GLK and G6PDH, only undiluted and twofold diluted cell extract could be used to detect activity. The range of activities around which measurements are linear in time and proportional with amount of cell extract are listed in Table 6.
To check the reproducibility, the assays were tested on cell extracts from three independent chemostat cultures grown at a dilution rate of 0.15 h-1. Every enzyme activity in the cell extract from each chemostat was measured at varying dilutions of cell extract, at least in four fold and up to twelve fold, to test technical variation. An ANOVA analysis on the data showed that an average technical variation of 5% was present, and that any difference above this percentage can be attributed to biological variation. Based on this, activities of the replicates are in good agreement with each other (Supplementary material, Fig S3).
1
r 2 = 0.997
0
0.5
1
1.5
2
0 0.05 0.1 0.15 0.2 0.25Concentration ratio of cell extract
V max
(μm
ol •
min
-1• m
g pr
otei
n-1)
Figure 2: Vmax of LDH at different dilutions of cell extract. The activity at each dilution is an average of duplicate measurements and error bars represent deviation from the average.
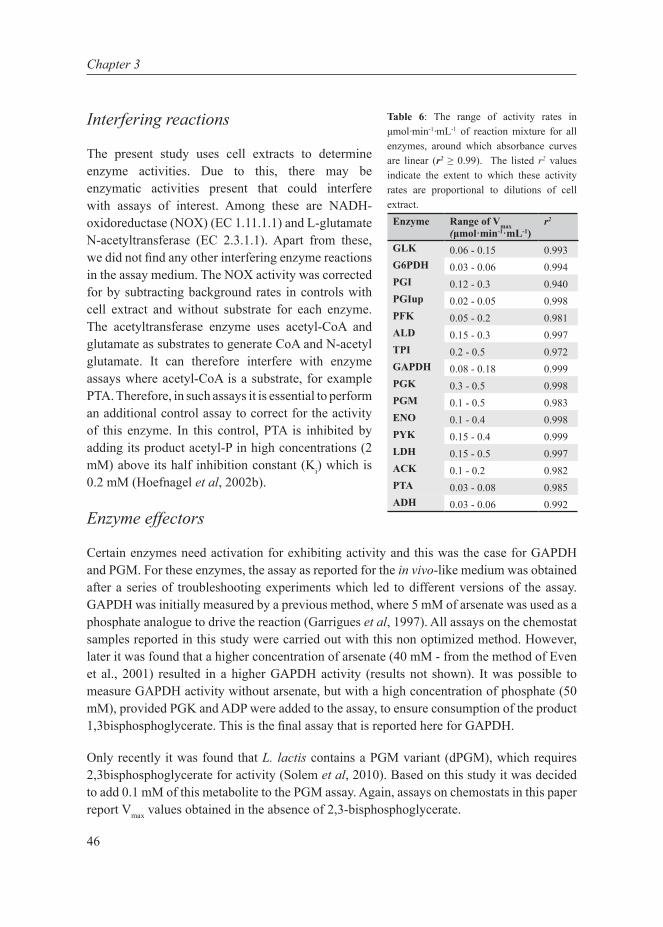
46
Chapter 3
Interfering reactions
The present study uses cell extracts to determine enzyme activities. Due to this, there may be enzymatic activities present that could interfere with assays of interest. Among these are NADH-oxidoreductase (NOX) (EC 1.11.1.1) and L-glutamate N-acetyltransferase (EC 2.3.1.1). Apart from these, we did not find any other interfering enzyme reactions in the assay medium. The NOX activity was corrected for by subtracting background rates in controls with cell extract and without substrate for each enzyme. The acetyltransferase enzyme uses acetyl-CoA and glutamate as substrates to generate CoA and N-acetyl glutamate. It can therefore interfere with enzyme assays where acetyl-CoA is a substrate, for example PTA. Therefore, in such assays it is essential to perform an additional control assay to correct for the activity of this enzyme. In this control, PTA is inhibited by adding its product acetyl-P in high concentrations (2 mM) above its half inhibition constant (Ki) which is 0.2 mM (Hoefnagel et al, 2002b).
Enzyme effectors
Certain enzymes need activation for exhibiting activity and this was the case for GAPDH and PGM. For these enzymes, the assay as reported for the in vivo-like medium was obtained after a series of troubleshooting experiments which led to different versions of the assay. GAPDH was initially measured by a previous method, where 5 mM of arsenate was used as a phosphate analogue to drive the reaction (Garrigues et al, 1997). All assays on the chemostat samples reported in this study were carried out with this non optimized method. However, later it was found that a higher concentration of arsenate (40 mM - from the method of Even et al., 2001) resulted in a higher GAPDH activity (results not shown). It was possible to measure GAPDH activity without arsenate, but with a high concentration of phosphate (50 mM), provided PGK and ADP were added to the assay, to ensure consumption of the product 1,3bisphosphoglycerate. This is the final assay that is reported here for GAPDH.
Only recently it was found that L. lactis contains a PGM variant (dPGM), which requires 2,3bisphosphoglycerate for activity (Solem et al, 2010). Based on this study it was decided to add 0.1 mM of this metabolite to the PGM assay. Again, assays on chemostats in this paper report Vmax values obtained in the absence of 2,3-bisphosphoglycerate.
Table 6: The range of activity rates in μmol·min-1·mL-1 of reaction mixture for all enzymes, around which absorbance curves are linear (r2 ≥ 0.99). The listed r2 values indicate the extent to which these activity rates are proportional to dilutions of cell extract.
Enzyme Range of Vmax (μmol·min-1·mL-1)
r2
GLK 0.06 - 0.15 0.993G6PDH 0.03 - 0.06 0.994PGI 0.12 - 0.3 0.940PGIup 0.02 - 0.05 0.998PFK 0.05 - 0.2 0.981ALD 0.15 - 0.3 0.997TPI 0.2 - 0.5 0.972GAPDH 0.08 - 0.18 0.999PGK 0.3 - 0.5 0.998PGM 0.1 - 0.5 0.983ENO 0.1 - 0.4 0.998PYK 0.15 - 0.4 0.999LDH 0.15 - 0.5 0.997ACK 0.1 - 0.2 0.982PTA 0.03 - 0.08 0.985ADH 0.03 - 0.06 0.992
47
In vivo-like assay medium for L. lactis
Effect of desalting ammonium sulphate from coupling enzymes
Many enzyme assays activities entail the usage of coupling activities of enzymes of interest to the formation of NAD(P)H. However, a majority of these coupling enzymes are commercially available in a suspension of ammonium sulphate with a concentration as high as 3.2 M. As a result, in some cases such as the PGM assay, a concentration of ammonium sulphate of up to 60 mM would be present. Since our aim is to establish standard in vivo-like conditions for enzyme assays, we checked the effect of removing the ammonium sulphate in assays using coupling enzymes (Fig 3A). The enzymes that were most sensitive were those, which had assays with high concentration of ammonium sulphate due a higher number of coupling enzymes. PGM (66 mM ammonium sulphate) and ENO (20 mM) were most affected, followed by PGI (41 mM) and PFK (41 mM). Activities of other enzymes did not differ greatly in the presence of small amounts (1 to 5 mM) of ammonium sulphate. For ENO, an alternative assay (Lee & Nowak, 1992) measuring PEP absorbance at 240 nm is a more elegant way to solve the ammonium sulphate problem if measurements in the UV range are possible. In conclusion, ammonium sulphate could have an effect on enzyme activities and it is better to work with desalted enzymes.
Effect of freezing cells
It is not always possible to measure all enzyme activities on the same day as harvesting cells. The cells have thus to be stored until they are taken for analysis. However, storage in frozen state and thawing of L. lactis cells can affect retention of enzyme activities (Kamaly & Marth, 1989) and can lead to conformational or catalytic changes of sensitive enzymes (Ray & Speck, 1973). It was therefore important to check whether cells could be frozen without change in enzyme activities. Enzyme activity measurements on fresh batch-grown cells and the same cells stored frozen for 3 days were compared (Fig 3B). Furthermore, in order to see how long cell samples could be frozen without affecting enzyme activities, samples were analysed for activities after 4 days, 12 days and 4 months from the day the cells were harvested.
For all enzymes except GLK, TPI and ADH, freezing of cell samples for 3 days did not affect enzyme activities. However, PFK, PGK and ENO activities declined between 4 to 12 days, and GAPDH declined after 4 months (Fig 3C). Other enzymes were stable until the period checked, i.e. 4 months. Therefore, for accurate estimates of Vmax’s, GLK, TPI and ADH should be measured on the same day as harvesting the cells and GAPDH, PGK and ENO must be measured within 3 days.
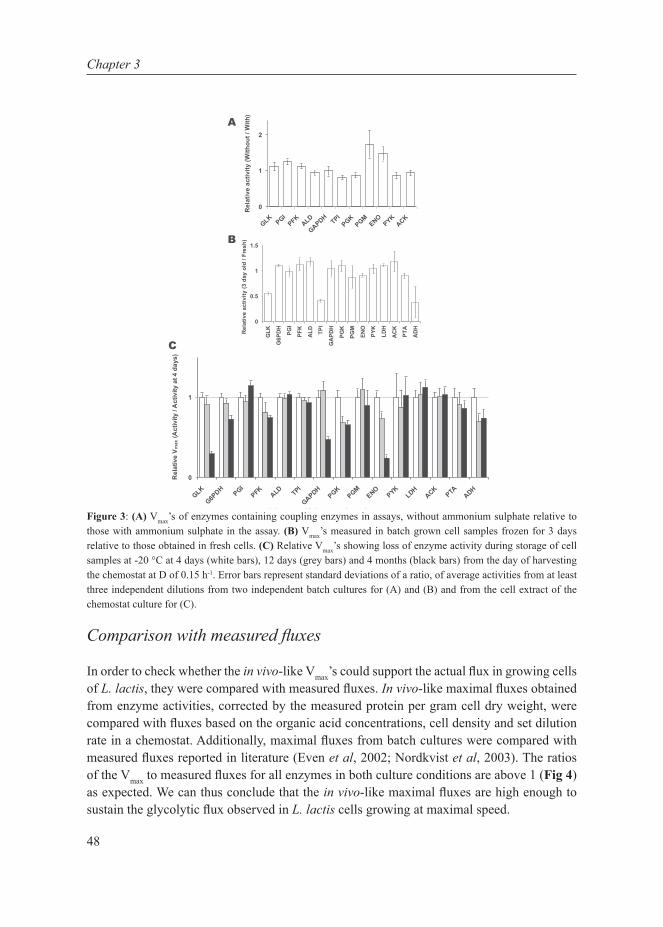
48
Chapter 3
Figure 3: (A) Vmax’s of enzymes containing coupling enzymes in assays, without ammonium sulphate relative to those with ammonium sulphate in the assay. (B) Vmax’s measured in batch grown cell samples frozen for 3 days relative to those obtained in fresh cells. (C) Relative Vmax’s showing loss of enzyme activity during storage of cell samples at -20 °C at 4 days (white bars), 12 days (grey bars) and 4 months (black bars) from the day of harvesting the chemostat at D of 0.15 h-1. Error bars represent standard deviations of a ratio, of average activities from at least three independent dilutions from two independent batch cultures for (A) and (B) and from the cell extract of the chemostat culture for (C).
Comparison with measured fluxes
In order to check whether the in vivo-like Vmax’s could support the actual flux in growing cells of L. lactis, they were compared with measured fluxes. In vivo-like maximal fluxes obtained from enzyme activities, corrected by the measured protein per gram cell dry weight, were compared with fluxes based on the organic acid concentrations, cell density and set dilution rate in a chemostat. Additionally, maximal fluxes from batch cultures were compared with measured fluxes reported in literature (Even et al, 2002; Nordkvist et al, 2003). The ratios of the Vmax to measured fluxes for all enzymes in both culture conditions are above 1 (Fig 4) as expected. We can thus conclude that the in vivo-like maximal fluxes are high enough to sustain the glycolytic flux observed in L. lactis cells growing at maximal speed.
1
0
1
2
GLK PGIPFK
ALD
GAPDH TPIPGK
PGMENO
PYKACK
Rel
ativ
e ac
tivity
(With
out /
With
)
0
0.5
1
1.5
GLK
G6P
DH
PGI
PFK
ALD TP
I
GA
PDH
PGK
PGM
ENO
PYK
LDH
AC
K
PTA
AD
H
Rel
ativ
e ac
tivity
(3 d
ay o
ld /
Fres
h )
0
1
GLK
G6PDH PGI
PFK ALD TPI
GAPDHPGK
PGMENO
PYKLDH
ACKPTA ADH
Rel
ativ
e V
max
(Act
ivity
/ A
ctiv
ity a
t 4 d
ays)
4 d 12 d 4 h
A
B
C
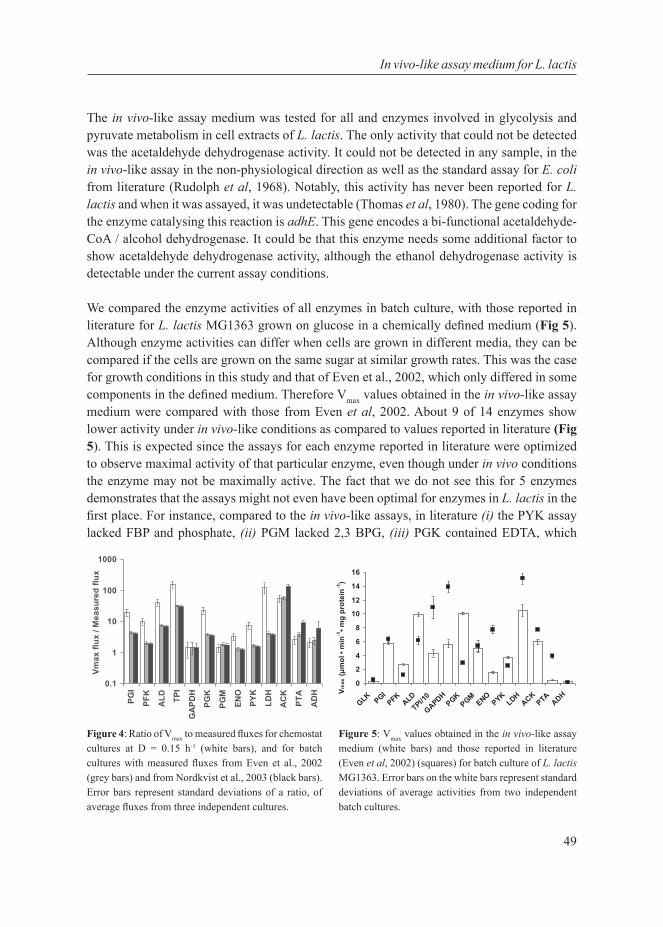
49
In vivo-like assay medium for L. lactis
The in vivo-like assay medium was tested for all and enzymes involved in glycolysis and pyruvate metabolism in cell extracts of L. lactis. The only activity that could not be detected was the acetaldehyde dehydrogenase activity. It could not be detected in any sample, in the in vivo-like assay in the non-physiological direction as well as the standard assay for E. coli from literature (Rudolph et al, 1968). Notably, this activity has never been reported for L. lactis and when it was assayed, it was undetectable (Thomas et al, 1980). The gene coding for the enzyme catalysing this reaction is adhE. This gene encodes a bi-functional acetaldehyde-CoA / alcohol dehydrogenase. It could be that this enzyme needs some additional factor to show acetaldehyde dehydrogenase activity, although the ethanol dehydrogenase activity is detectable under the current assay conditions.
We compared the enzyme activities of all enzymes in batch culture, with those reported in literature for L. lactis MG1363 grown on glucose in a chemically defined medium (Fig 5). Although enzyme activities can differ when cells are grown in different media, they can be compared if the cells are grown on the same sugar at similar growth rates. This was the case for growth conditions in this study and that of Even et al., 2002, which only differed in some components in the defined medium. Therefore Vmax values obtained in the in vivo-like assay medium were compared with those from Even et al, 2002. About 9 of 14 enzymes show lower activity under in vivo-like conditions as compared to values reported in literature (Fig 5). This is expected since the assays for each enzyme reported in literature were optimized to observe maximal activity of that particular enzyme, even though under in vivo conditions the enzyme may not be maximally active. The fact that we do not see this for 5 enzymes demonstrates that the assays might not even have been optimal for enzymes in L. lactis in the first place. For instance, compared to the in vivo-like assays, in literature (i) the PYK assay lacked FBP and phosphate, (ii) PGM lacked 2,3 BPG, (iii) PGK contained EDTA, which
0.1
1
10
100
1000
PGI
PFK
ALD TP
I
GA
PDH
PGK
PGM
ENO
PYK
LDH
AC
K
PTA
AD
H
Vmax
flux
/ M
easu
red
flux
Figure 4: Ratio of Vmax to measured fluxes for chemostat cultures at D = 0.15 h-1 (white bars), and for batch cultures with measured fluxes from Even et al., 2002 (grey bars) and from Nordkvist et al., 2003 (black bars). Error bars represent standard deviations of a ratio, of average fluxes from three independent cultures.
Figure 5: Vmax values obtained in the in vivo-like assay medium (white bars) and those reported in literature (Even et al, 2002) (squares) for batch culture of L. lactis MG1363. Error bars on the white bars represent standard deviations of average activities from two independent batch cultures.
0
2
4
6
8
10
12
14
16
GLK PGIPFK ALD
TPI/10
GAPDHPGK
PGM ENO
PYKLDH
ACKPTA ADHVm
ax (μ
mol
• m
in-1
• mg
prot
ein-1
)
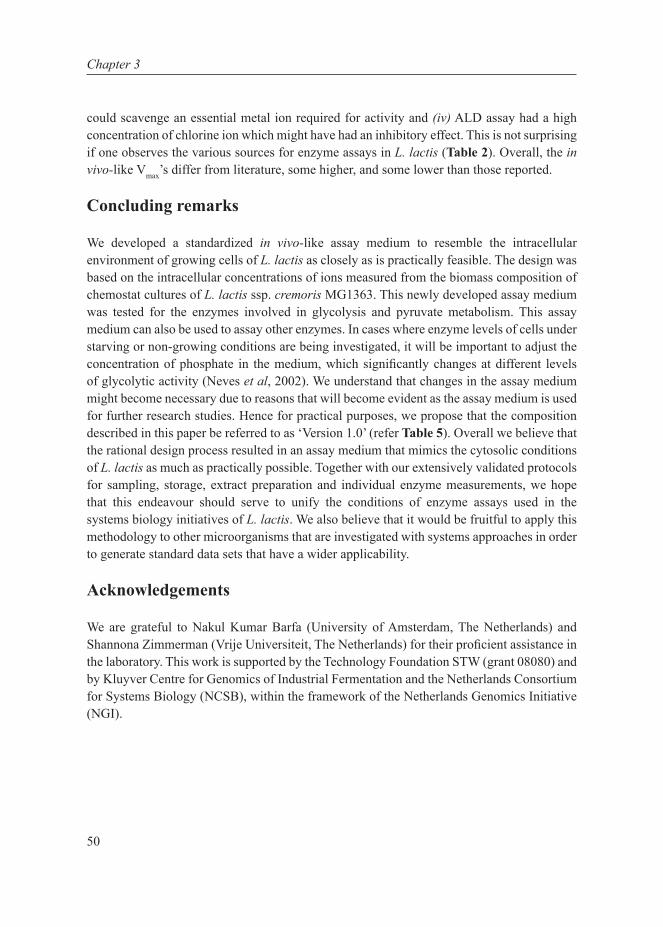
50
Chapter 3
could scavenge an essential metal ion required for activity and (iv) ALD assay had a high concentration of chlorine ion which might have had an inhibitory effect. This is not surprising if one observes the various sources for enzyme assays in L. lactis (Table 2). Overall, the in vivo-like Vmax’s differ from literature, some higher, and some lower than those reported.
Concluding remarks
We developed a standardized in vivo-like assay medium to resemble the intracellular environment of growing cells of L. lactis as closely as is practically feasible. The design was based on the intracellular concentrations of ions measured from the biomass composition of chemostat cultures of L. lactis ssp. cremoris MG1363. This newly developed assay medium was tested for the enzymes involved in glycolysis and pyruvate metabolism. This assay medium can also be used to assay other enzymes. In cases where enzyme levels of cells under starving or non-growing conditions are being investigated, it will be important to adjust the concentration of phosphate in the medium, which significantly changes at different levels of glycolytic activity (Neves et al, 2002). We understand that changes in the assay medium might become necessary due to reasons that will become evident as the assay medium is used for further research studies. Hence for practical purposes, we propose that the composition described in this paper be referred to as ‘Version 1.0’ (refer Table 5). Overall we believe that the rational design process resulted in an assay medium that mimics the cytosolic conditions of L. lactis as much as practically possible. Together with our extensively validated protocols for sampling, storage, extract preparation and individual enzyme measurements, we hope that this endeavour should serve to unify the conditions of enzyme assays used in the systems biology initiatives of L. lactis. We also believe that it would be fruitful to apply this methodology to other microorganisms that are investigated with systems approaches in order to generate standard data sets that have a wider applicability.
Acknowledgements
We are grateful to Nakul Kumar Barfa (University of Amsterdam, The Netherlands) and Shannona Zimmerman (Vrije Universiteit, The Netherlands) for their proficient assistance in the laboratory. This work is supported by the Technology Foundation STW (grant 08080) and by Kluyver Centre for Genomics of Industrial Fermentation and the Netherlands Consortium for Systems Biology (NCSB), within the framework of the Netherlands Genomics Initiative (NGI).
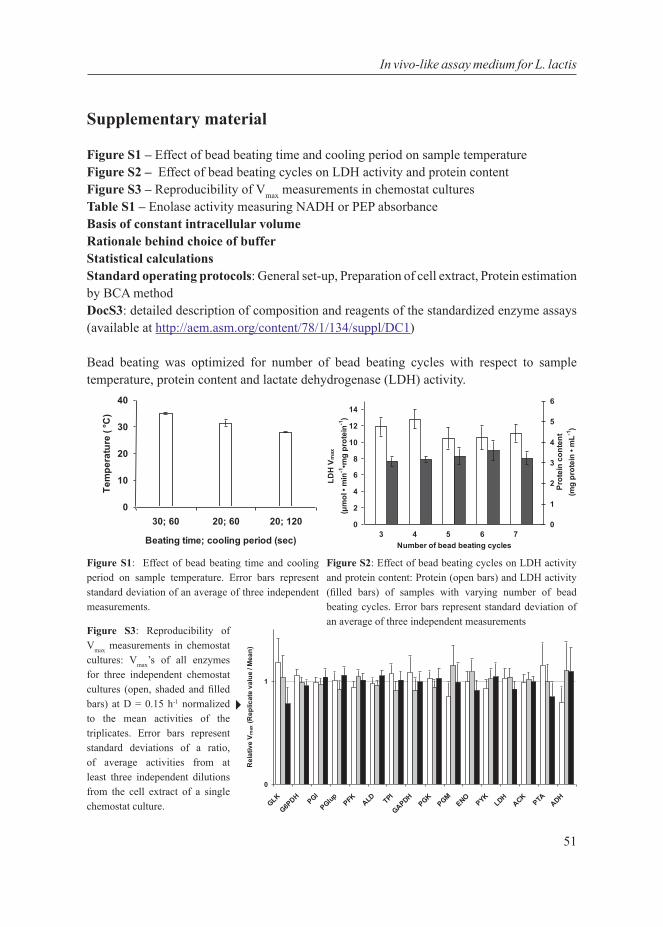
51
In vivo-like assay medium for L. lactis
Supplementary material
Figure S1 – Effect of bead beating time and cooling period on sample temperature Figure S2 – Effect of bead beating cycles on LDH activity and protein content Figure S3 – Reproducibility of Vmax measurements in chemostat cultures Table S1 – Enolase activity measuring NADH or PEP absorbance Basis of constant intracellular volume Rationale behind choice of buffer Statistical calculations Standard operating protocols: General set-up, Preparation of cell extract, Protein estimation by BCA methodDocS3: detailed description of composition and reagents of the standardized enzyme assays (available at http://aem.asm.org/content/78/1/134/suppl/DC1)
Bead beating was optimized for number of bead beating cycles with respect to sample temperature, protein content and lactate dehydrogenase (LDH) activity.
Figure S3: Reproducibility of Vmax measurements in chemostat cultures: Vmax’s of all enzymes for three independent chemostat cultures (open, shaded and filled bars) at D = 0.15 h-1 normalized to the mean activities of the triplicates. Error bars represent standard deviations of a ratio, of average activities from at least three independent dilutions from the cell extract of a single chemostat culture.
1
0
10
20
30
40
30; 60 20; 60 20; 120
Beating time; cooling period (sec)
Tem
pera
ture
( °C
)
0
2
4
6
8
10
12
14
3 4 5 6 7Number of bead beating cycles
LDH
Vm
ax
(μm
ol •
min
-1•m
g pr
otei
n-1)
0
1
2
3
4
5
6
Prot
ein
cont
ent
(mg
prot
ein
• mL-1
)LDH activity Protein
0
1
GLK
G6PDH PGI
PGIup PFK ALD TPI
GAPDHPGK
PGMENO
PYKLDH
ACKPTA ADH
Rel
ativ
e V
max
(Rep
licat
e va
lue
/ Mea
n)
Figure S2: Effect of bead beating cycles on LDH activity and protein content: Protein (open bars) and LDH activity (filled bars) of samples with varying number of bead beating cycles. Error bars represent standard deviation of an average of three independent measurements
Figure S1: Effect of bead beating time and cooling period on sample temperature. Error bars represent standard deviation of an average of three independent measurements.

52
Chapter 3
Basis of constant intracellular volume
The intracellular volume of 1.67 μL per mg dry weight (Thompson, 1976) was assumed to be independent of the growth conditions because • a similar volume with a fold difference of
only 1.15, was found for the same strain under different media conditions i.e. 2.9 μL∙mg Protein-1 which is 1.45 μL∙mg dry cell weight-1, assuming average 50% protein per dry cell weight
• the fold difference in internal volumes for similar strains, L. lactis subsp. lactis ML3 and L. lactis subsp. cremoris Wg2 was 1.24, the specific intracellular volumes being 2.9 and 3.61 respectively (Poolman et al, 1987d). Both these findings suggest that the intracellular volume can be assumed to be reasonably constant under different media and growth conditions.
Rationale behind choice of buffer for washing and storage
A variety of methods and buffers have been used to sample cells for enzyme activities. The most common is the one is to wash the cells twice with 0.2 % (v/v) KCl and then resuspend in Tris (45 mM)-tricarballylate (15 mM) buffer (pH 7.2) containing glycerol (20%), MgCl2 (4.5 mM) and dithiothreitol (DTT) (1 mM) (Even et al, 2001). In this study, the following changes were made:• The washing step was reduced to once in order to reduce sampling time and loss of
activity. • The tris buffer (pKa = 8.06, effective pH range = 7 to 9) was replaced by HEPES at pH
7.5, because it is more effective in maintaining enzyme structure and function at low temperatures (Baicu & Taylor, 2002) and is the same buffering component and pH in the in vivo-like assay medium.
• The tricarballylate component is known to inhibit the activity of the enzyme aconitate hydratase and scavenge Mg+2 (Lewis & Escalante-Semerena, 2006). It was therefore not included in the buffer.
• Glycerol was added at 15% (v/v) to ensure preservation of enzymes at -20 °C.• The next component, MgCl2 was not added in the buffer while sampling because no
enzyme activity is desired while sampling and Mg+2 is a requirement for some enzyme activities including proteases.
Table S1. Enolase activity measuring NADH or PEP absorbance: Enolase enzyme showed the same Vmax when assayed by coupling with NADH consumption or PEP formation. Values in parentheses denote standard deviations of three independent measurements.
Enzyme Activity (U·mg protein-1)
NADH absorbance 2.334 (0.117)PEP absorbance 2.252 (0.120)
53
In vivo-like assay medium for L. lactis
Statistical calculations
Ratios or relative quantities calculated from experimental data fall under the category of indirect data. Their standard deviation is different from that of observed data and depends on the mathematical operation involved during calculation. Thus standard deviation with propagating uncertainty was calculated for a ratio of means with individual standard deviations according to the standard formula
All graphs with relative activities contain error bars that represent standard deviations calculated according to the formula above.
Standard Operating Protocol
Title:Protocols for in vivo-like enzyme activity assays for L. lactis
Description:Method for and preparation of cell extracts and general protocol for enzyme activities in Lactococcus lactis
Creator:Anisha Goel
Affiliation:Systems Bioinformatics, VU University, Amsterdam
P.T.O
sy
s s xy
xy
x y= + ⋅
12
2 22
2
54
Chapter 3
General set-up
The assays are based on consumption or formation of NAD(P)H and monitoring its absorbance at 340 nm (A340) in Greiner flat-bottom polystyrene microplates in a Novostar spectrophotometer (BMG Labtech, Offenburg, Germany). This means that addition of extra enzymes and substrates might be needed to couple the reaction to one that can be monitored.
In the P-transacetylase assay, the coenzyme-A formed in the reaction is oxidized by 5,5’-dithiobis-(2-nitrobenzoic) acid (DTNB). Reduction of DTNB is monitored at 405 nm. For enolase phosphoenol pyruvate (PEP) is measured at 240 nm in the Greiner flat-bottom UV-transparent (UV-star) microplate. Absorbances of DTNB and PEP are monitored in a Spectramax spectrophotometer (Molecular Devices, Sunnyvale, CA, USA). Extinction coefficients for 300 µL reagent mixtures with final composition as in the in vivo-like buffer in microplates were determined to be ε340 · L = 5.06 · 103 M-1 for NAD(P)H, ε405 · L = 10.494 · 103 M-1 for DTNB, and ε240 · L = 1.256 · 103 M-1 for PEP.
The final volume is 300 µL, including 2, 5 or 10 µL sample and 30 µL of start reagent. First a baseline is measured with only the sample and reagent present. Then the machine pauses, allowing the addition of the start reagent (better by hand because it is faster and has less carry-over). The reaction is then followed for 10 minutes.
The details for the individual assays are given in the supplementary file DocS3.xls.
Plate reader settings:
Measurements in the Novostar are by a test protocol with the following settings: Mode: Absorbance Check: flying mode Number of kinetic windows: 2Number of cycles: 50Number of flashes per well & cycle: 3Cycle time: 10 sNumber of multichromatics: 1Excitation filter: ABS340Emission filter: emptyPause before cycle: 21
For Spectramax, the basic kinetic protocol can be used with the following specificationsWindows: 2No. of wavelengths: 1Wavelength (nm): 340 (NAD(P)H) / 240 (PEP) / 405 (DTNB) / 570 (Protein assay - BCA) Window 1: Time 3 min: 10s, Interval 0:10s, autocalibrate, column priorityWindow 2: Time 4 min: 50s, Interval 0:10s, autocalibrate, column priority
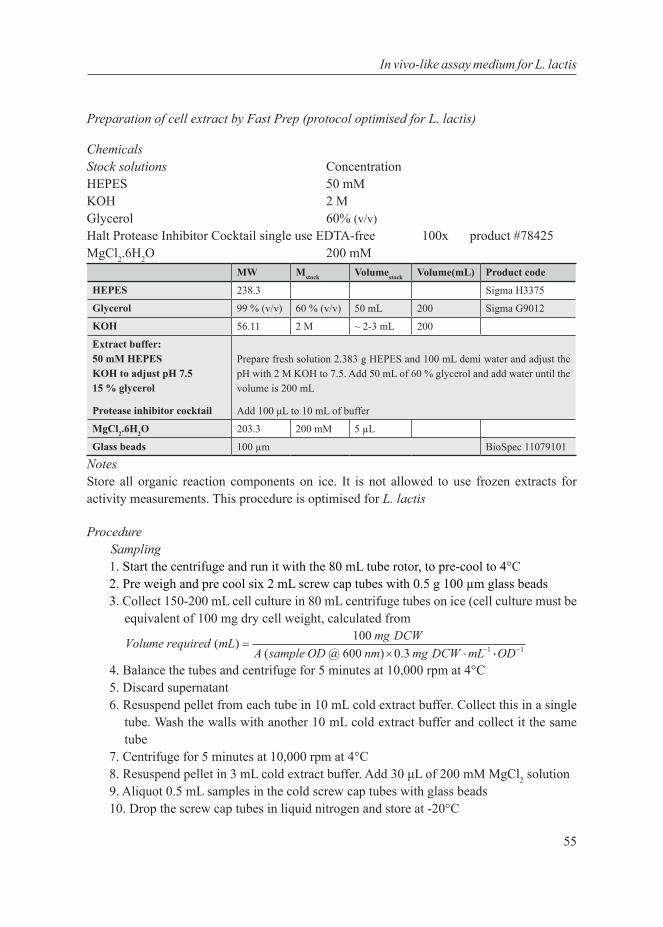
55
In vivo-like assay medium for L. lactis
Preparation of cell extract by Fast Prep (protocol optimised for L. lactis)
ChemicalsStock solutions Concentration HEPES 50 mM KOH 2 MGlycerol 60% (v/v)Halt Protease Inhibitor Cocktail single use EDTA-free 100x product #78425MgCl2.6H2O 200 mM
MW Mstock Volumestock Volume(mL) Product code
HEPES 238.3 Sigma H3375
Glycerol 99 % (v/v) 60 % (v/v) 50 mL 200 Sigma G9012
KOH 56.11 2 M ~ 2-3 mL 200
Extract buffer:50 mM HEPES KOH to adjust pH 7.515 % glycerol
Protease inhibitor cocktail
Prepare fresh solution 2.383 g HEPES and 100 mL demi water and adjust the pH with 2 M KOH to 7.5. Add 50 mL of 60 % glycerol and add water until the volume is 200 mL
Add 100 μL to 10 mL of buffer
MgCl2.6H2O 203.3 200 mM 5 µL
Glass beads 100 µm BioSpec 11079101
NotesStore all organic reaction components on ice. It is not allowed to use frozen extracts for activity measurements. This procedure is optimised for L. lactis
ProcedureSampling1. Start the centrifuge and run it with the 80 mL tube rotor, to pre-cool to 4°C 2. Pre weigh and pre cool six 2 mL screw cap tubes with 0.5 g 100 µm glass beads3. Collect 150-200 mL cell culture in 80 mL centrifuge tubes on ice (cell culture must be
equivalent of 100 mg dry cell weight, calculated from
4. Balance the tubes and centrifuge for 5 minutes at 10,000 rpm at 4°C5. Discard supernatant 6. Resuspend pellet from each tube in 10 mL cold extract buffer. Collect this in a single
tube. Wash the walls with another 10 mL cold extract buffer and collect it the same tube
7. Centrifuge for 5 minutes at 10,000 rpm at 4°C 8. Resuspend pellet in 3 mL cold extract buffer. Add 30 μL of 200 mM MgCl2 solution9. Aliquot 0.5 mL samples in the cold screw cap tubes with glass beads10. Drop the screw cap tubes in liquid nitrogen and store at -20°C
Volume required mL mg DCWA sample OD nm mg DCW mL
( )( @ ) .
=× ⋅ −
100600 0 3 1 ⋅⋅ −OD 1

56
Chapter 3
Cell extracts1. Thaw the frozen sample on ice2. Add 5 µL protease inhibitor cocktail and 5 µL of 2 M MgCl2 solution (approx. 2 mM
final concentration) to the sample3. Place the tubes in the Fastprep machine and lock and close the system 4. Shake for 3 bursts of 20 sec, at speed 6 (4.0 m·s-2)5. Between bursts cool the tubes on ice for at least 120 seconds6. Centrifuge tubes for 10 minutes at maximum speed at 4°C 7. Transfer supernatant to pre-cooled, labelled 1.5 mL eppendorf tube and keep the tube
on ice
General protocol enzyme activity (protocol optimized for Novostar / Spectramax)Procedure
1. Turn on Novostar and incubator of Novostar at 30°C2. Turn on water bath at 30°C3. Prepare cell extracts (CE)4. Make the following dilutions of cell extract in duplicate in a 96-wells plate:
Dilution Previous CE dilution (μL)
Extract buffer + MgCl2 + PIC (μL)
Total (μL) Remaining (μL)
B (blank) 0 200 200 2001x Undiluted CE 0 300 402x 130 (1x) 130 260 1605x 100 (2x) 150 250 908x 160 (5x) 96 256 8810x 168 (8x) 42 210 7012.5x 140 (10x) 35 175 7516x 100 (12.5x) 28 128 5220x 76 (16x) 19 95 5130x 44 (20x) 22 66 2440x 42 (30x) 14 56 2050x 36 (40x) 9 45 2560x 20 (50x) 4 24 24
Note: Add the buffer first, then the cell extract or dilution. Do not use the 200 µL pipette to add 25 µL or 40 µL. Use the 20 µL pipette only for adding the cell extract. For the buffer, add 160 or 170 µL with the 300 µL multi-channel pipette and the rest again with the 20 µL pipette to minimize errors.
Make the above dilutions with the appropriate set-up choosing from the following set up in the 96-wells plate: Depending on enzyme, varying combinations of 5 dilutions
1 2 3 4 5 6 7 8 9 10 11 12
A B B 1x 1x 2x 2x 5x 1x 1x 2x 2x 5x
B B B 5x 8x 8x 10x 10x 5x 8x 8x 10x 10x
Blank Sample 1 Sample 2
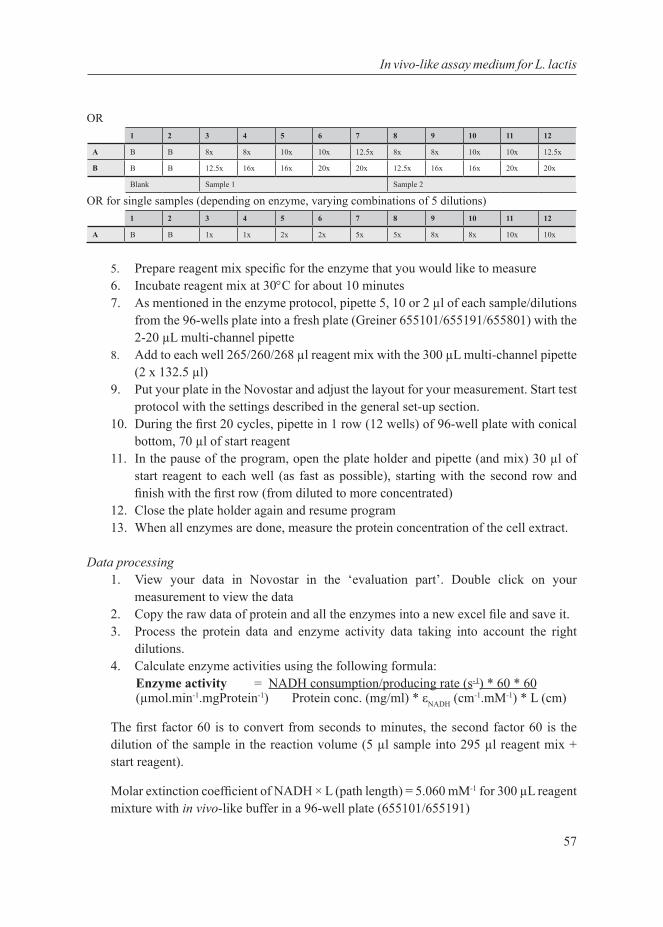
57
In vivo-like assay medium for L. lactis
OR1 2 3 4 5 6 7 8 9 10 11 12
A B B 8x 8x 10x 10x 12.5x 8x 8x 10x 10x 12.5x
B B B 12.5x 16x 16x 20x 20x 12.5x 16x 16x 20x 20x
Blank Sample 1 Sample 2
OR for single samples (depending on enzyme, varying combinations of 5 dilutions)1 2 3 4 5 6 7 8 9 10 11 12
A B B 1x 1x 2x 2x 5x 5x 8x 8x 10x 10x
5. Prepare reagent mix specific for the enzyme that you would like to measure 6. Incubate reagent mix at 30°C for about 10 minutes7. As mentioned in the enzyme protocol, pipette 5, 10 or 2 µl of each sample/dilutions
from the 96-wells plate into a fresh plate (Greiner 655101/655191/655801) with the 2-20 µL multi-channel pipette
8. Add to each well 265/260/268 µl reagent mix with the 300 µL multi-channel pipette (2 x 132.5 µl)
9. Put your plate in the Novostar and adjust the layout for your measurement. Start test protocol with the settings described in the general set-up section.
10. During the first 20 cycles, pipette in 1 row (12 wells) of 96-well plate with conical bottom, 70 µl of start reagent
11. In the pause of the program, open the plate holder and pipette (and mix) 30 µl of start reagent to each well (as fast as possible), starting with the second row and finish with the first row (from diluted to more concentrated)
12. Close the plate holder again and resume program13. When all enzymes are done, measure the protein concentration of the cell extract.
Data processing1. View your data in Novostar in the ‘evaluation part’. Double click on your
measurement to view the data2. Copy the raw data of protein and all the enzymes into a new excel file and save it.3. Process the protein data and enzyme activity data taking into account the right
dilutions. 4. Calculate enzyme activities using the following formula:
Enzyme activity = NADH consumption/producing rate (s-1) * 60 * 60(µmol.min-1.mgProtein-1) Protein conc. (mg/ml) * εNADH (cm-1.mM-1) * L (cm)
The first factor 60 is to convert from seconds to minutes, the second factor 60 is the dilution of the sample in the reaction volume (5 µl sample into 295 µl reagent mix + start reagent).
Molar extinction coefficient of NADH × L (path length) = 5.060 mM-1 for 300 µL reagent mixture with in vivo-like buffer in a 96-well plate (655101/655191)
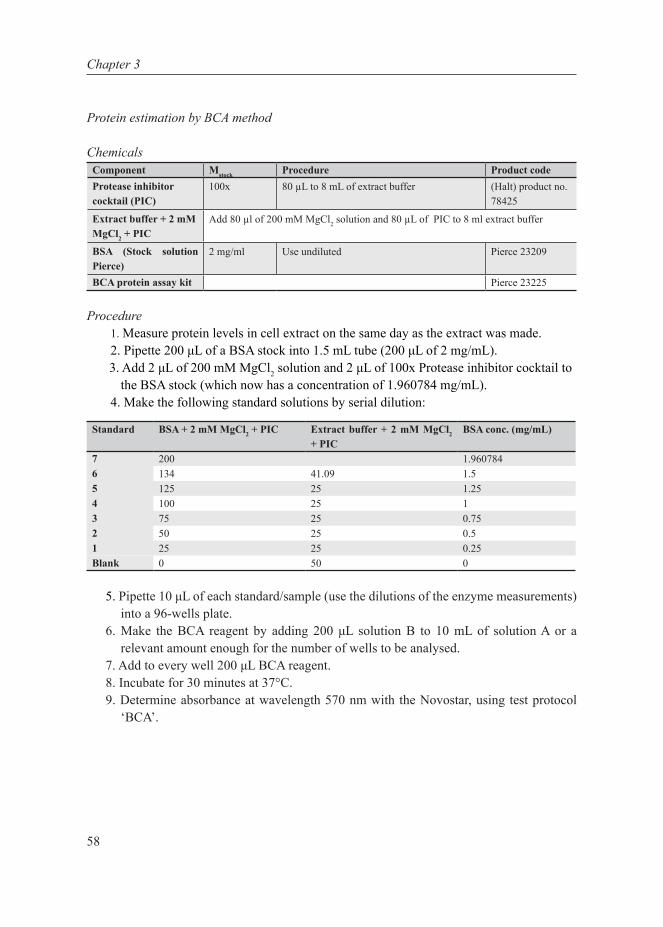
58
Chapter 3
Protein estimation by BCA method
ChemicalsComponent Mstock Procedure Product codeProtease inhibitor cocktail (PIC)
100x 80 µL to 8 mL of extract buffer (Halt) product no. 78425
Extract buffer + 2 mM MgCl2 + PIC
Add 80 µl of 200 mM MgCl2 solution and 80 µL of PIC to 8 ml extract buffer
BSA (Stock solution Pierce)
2 mg/ml Use undiluted Pierce 23209
BCA protein assay kit Pierce 23225
Procedure1. Measure protein levels in cell extract on the same day as the extract was made.2. Pipette 200 μL of a BSA stock into 1.5 mL tube (200 μL of 2 mg/mL).3. Add 2 μL of 200 mM MgCl2 solution and 2 μL of 100x Protease inhibitor cocktail to
the BSA stock (which now has a concentration of 1.960784 mg/mL).4. Make the following standard solutions by serial dilution:
Standard BSA + 2 mM MgCl2 + PIC Extract buffer + 2 mM MgCl2 + PIC
BSA conc. (mg/mL)
7 200 1.9607846 134 41.09 1.55 125 25 1.254 100 25 13 75 25 0.752 50 25 0.51 25 25 0.25Blank 0 50 0
5. Pipette 10 μL of each standard/sample (use the dilutions of the enzyme measurements) into a 96-wells plate.
6. Make the BCA reagent by adding 200 μL solution B to 10 mL of solution A or a relevant amount enough for the number of wells to be analysed.
7. Add to every well 200 μL BCA reagent.8. Incubate for 30 minutes at 37°C.9. Determine absorbance at wavelength 570 nm with the Novostar, using test protocol
‘BCA’.

59
In vivo-like assay medium for L. lactis

61
Uncoupling of
Growth-Associated
Metabolism and Protein
Expression Suggests
Binary Control Logic
Anisha Goel*,
Thomas H. Eckhardt*, Pranav Puri*, Anne de Jong, Filipe Santos, Martin Giera, Fabrizia Fusetti, Willem de Vos, Jan Kok, Bert
Poolman, Douwe Molenaar, Oscar P. Kuipers and Bas Teusink
CHAPTER 444 CHAPTER 4
61Manuscript in preparation*Contributed equally
62
Chapter 4
Abstract
We tested the hypothesis that protein investment costs affect the metabolic strategy employed, with Lactococcus lactis, a simple model bacterium showing a distinct, anaerobic version of the bacterial Crabtree/Warburg effect (from mixed-acid to homolactic fermentation). The relative transcription and protein ratios, enzyme activities and fluxes of L. lactis were determined in glucose-limited chemostats at various dilution rates. A more than threefold change in growth rate was accompanied by metabolic rerouting with, surprisingly, hardly any change in transcription, protein ratios, and enzyme activities. Even ribosomal proteins, constituting a major investment of cellular machinery, scarcely changed. Thus, contrary to the original hypothesis, central metabolism in L. lactis appears to be always prepared for high growth rate and is regulated by changing enzyme activities rather than gene expression. We observed down-regulation of stress proteins and up-regulation of glycolytic proteins only at the highest dilution rate and during batch growth. We conclude that transcription and protein expression largely follow a binary feast / famine logic during growth on glucose.
Keywords Genome scale flux balance analysis, Lactococcus lactis, Metabolic shift regula-tion, Multi-level omics, Protein investment
63
Uncoupled metabolism and protein expression
Introduction
The fact that cells adapt to their environment induces two complementary questions: what is the molecular or physiological mechanism of the adaptive response, and why does it exist? In this paper we study a metabolic shift in which cells reroute metabolic flux from one pathway to an alternative pathway, seemingly with the same function but not necessarily the same yield. Such shifts have recently gained attention because of renewed interest in the Warburg effect, which is a shift to fermentative metabolism under aerobic conditions, occurring in tumour cells (DeBerardinis & Thompson, 2012; Warburg, 1956). The occurrence of metabolic shifts in a wide variety of (micro)organisms has been investigated extensively, including Escherichia coli (Wolfe, 2005), Bacillus subtilis and Corynebacterium glutamicum (Sauer & Eikmanns, 2005), Lactococcus lactis (Thomas et al, 1979; Neves et al, 2005), Saccharomyces cerevisiae (Postma et al, 1989; Huberts et al, 2012) and tumour cells (Gatenby et al, 2010); for a recent review see Goel et al (2012b). Many of these studies explain the regulatory mechanism of the metabolic shift from changes in redox potential (Vemuri et al, 2006), gene expression (Daran-Lapujade et al, 2004), or differential enzyme activity (Thomas et al, 1979). Others focus on its competitive advantage (Piskur et al, 2006) or stress the importance of biochemical constraints (Heinrich et al, 1991), spatial structure of cells, within biofilms for example (Kreft, 2004), and limited intracellular and membrane space (Zhuang et al, 2011b). Many studies, however, emphasize the role of protein cost in overall cellular behaviour (Dean et al, 1986; Dong et al, 1995; Snoep et al, 1995; Dekel & Alon, 2005; Stoebel et al, 2008; Shachrai et al, 2010). Indeed, constraints on intracellular and membrane space influence optimal protein investment and eventually metabolic shifts. Similarly, some of us linked protein investment and metabolism and suggested that evolutionary optimization of resource allocation underlies the metabolic shift (Molenaar et al, 2009). We proposed a self-replicating system integrating several cellular subsystems. The predictions of this self-replicator model lead to the hypothesis that a trade-off between protein investment and metabolic yield ultimately governs the metabolic strategy in a growth-optimized microbial system. Depending on the proteins involved in the different metabolic pathway branches, investment of proteins (enzymes) varies with varying substrate availability and consequently growth rate, altering the metabolic profile of the microorganism.
To test this hypothesis, a good model system exhibiting a metabolic shift, the implementation of which is simple enough to be able to quantify protein investment would be necessary. Surprisingly, few experimental studies investigate the metabolic shift at multiple cellular levels (Castrillo et al, 2007; Haverkorn van Rijsewijk et al, 2011; Huberts et al, 2012). We chose the model lactic acid bacterium Lactococcus lactis, because it exhibits an anaerobic metabolic shift between lactate and a set of compounds collectively known as ‘‘mixed-acids’ (formate, acetate and ethanol). Hence, respiration with all its bioenergetics uncertainties does not play a confounding role. Moreover, the strictly fermentative growth ensures that growth
64
Chapter 4
is dependent on large fluxes through the pathways, and hence, one can expect high costs associated with the metabolic pathway employed. In L. lactis this effect is enhanced because it has a very simple metabolism in which carbon is almost exclusively used for catabolic energy demands, as the medium is supplied with all amino acids. Finally, this particular metabolic shift has direct relevance for industrial fermentations, determining biomass yields and acidification rates. L. lactis exhibits the fermentation-products-shift upon changing growth rate under steady-state environmental conditions (Thomas et al, 1979). This is inherently different from the other well-studied microbial model organisms, yeast, E. coli and B. subtilis, with respect to the fact that L. lactis does not show a diauxic shift upon using the overflow metabolites. L. lactis also lacks the citric acid cycle and an electron transport chain and therefore the capacity to respire under standard conditions. It satisfies its ATP requirement via glycolysis with net 2 ATP per glucose during lactic acid production. It gains at most 1 ATP with the metabolic shift to mixed-acids production. By contrast, yeast cells can gain up to 28 additional ATP via respiration instead of fermentation.
The data presented below consist of high-quality replicated transcriptome, proteome and enzyme activity measurements carried out on cells grown in chemostats at different dilution rates. Much to our surprise, during a smooth shift at the metabolic level from mixed-acids to lactate, and despite a threefold change in growth rate, we observed very little regulation at the gene or protein level.
Results
Bioenergetics of the metabolic shift
To study the shift from mixed-acid fermentation to homolactic fermentation we cultured L. lactis in triplicate in glucose-limited chemostat cultures at dilution rates (D, henceforth also referred to as growth rate) of 0.15 h-1, 0.3 h-1, 0.5 h-1 and 0.6 h-1. At a growth rate of 0.6 h-1, close to the maximal growth rate in this medium, the culture primarily yields lactate, whereas at a growth rate of 0.15 h-1 it mainly performs mixed-acid fermentation (Fig 1A). The fraction of carbon flux towards lactate (normalized to the total carbon flux) increased at higher growth rates, from about 10% to 75%. At intermediate growth rates (0.3 and 0.5 h-1) we observed a combination of mixed-acid and homolactic fermentation. Energetically, mixed-acid fermentation is more efficient, yielding 3 ATP per glucose, while homolactic fermentation yields only 2 ATP per glucose. Yet, a 65% increase in lactate flux -corresponding to a 33% decrease in ATP generated per glucose- was not accompanied by a drastic decrease in biomass concentration, which declined only 14% at D = 0.6 h-1 (homolactic fermentation) compared with D = 0.15 h-1 (mixed-acid fermentation) (Table 1, Supplementary material, Table S5).

65
Uncoupled metabolism and protein expression
Figure 1: (A) Fraction of total carbon flux towards homolactic and mixed-acid branches. (B) Total ATP formation rate calculated by the genome-scale stoichiometric network model. Grey areas represent standard errors.
The consumption rates of most amino acids steadily increased with increasing growth rate (Supplementary material, Table S7). Arginine consumption however, increased and then dropped with growth rate. At 0.15 h-1, arginine was consumed at a rate of 0.28 mmol∙gDW-
1∙h-1, which gradually increased up to 0.8 mmol∙gDW-1∙h-1 at D = 0.5 h-1 and abruptly dropped at D = 0.6 h-1 to a value lower than that at D = 0.15 h-1. Parallel to the consumption of arginine, production of ornithine, citrulline and ammonia steadily increased and then also dropped (Fig 2B), reflecting the activity of the arginine deiminase pathway. In this pathway arginine is converted via citrulline to ornithine, ammonia and CO2 with concomitant production of ATP (Poolman et al, 1987b; Driessen et al, 1987).
Table 1: Biomass concentration, apparent catabolic carbon balance and total carbon balance in glucose-limited che-mostat cultures of L. lactis MG1363. Values represent average of 3 replicates except for 0.5 (duplicate) and 0.45 h-1.
Dilution rate (h-1) Biomass (gDW.L-1) Catabolic C balance % 1,2 C balance % 1,3
0.15 0.81 ± 0.08 84.0 ± 10 103.4 ± 11.80.3 0.83 ± 0.09 80.0 ± 9.8 99.9 ± 11.70.45 4 0.80 ± 0.07 86.0 ± 10 104.9 ± 11.50.5 0.74 ± 0.02 81.7 ± 4.8 99.4 ± 5.50.6 0.70 ± 0.04 80.2 ± 6.7 100.3 ± 8.6
1 % C-Balance = % (qC-out / qC-in); C-moles: glucose=6, lactate=3, pyruvate=3, ethanol=2, acetate=2, succinate=4, biomass=27.8 gDW/C-mole (Oliveira et al, 2005)2 Excluding biomass, indicating % glucose simply catabolized to fermentation products3 Including biomass4 Single experiment, technical standard deviations reported
The carbon balances were closed with less than 12% standard deviation (Table 1). We also included the catabolic carbon balance (calculated without biomass output), which is a measure of the catabolism of glucose to fermentation products without any utilization in biomass. To obtain a complete view of ATP production, we calculated the ATP formation rates via a genome-scale modelling approach as described by Teusink et al (2006), using an existing genome-scale stoichiometric network model (Verouden et al, 2009 and updated by
0.00
0.25
0.50
0.75
0.2 0.3 0.4 0.5 0.6
Dilution rate h−1
Frac
tion
of to
tal c
arbo
n flu
x
Flux●
●
AcetateLactate
●
●
●
●
●
●
●
●
●
●
●
●●
●
●
●
●
●
●
●
●
●
●
●
●●●
●●●
●
●
●
●
●●
20
30
40
0.2 0.3 0.4 0.5 0.6
Dilution rate h−1
q ATP
mm
ol.g
DW
−1⋅h
−1
A B
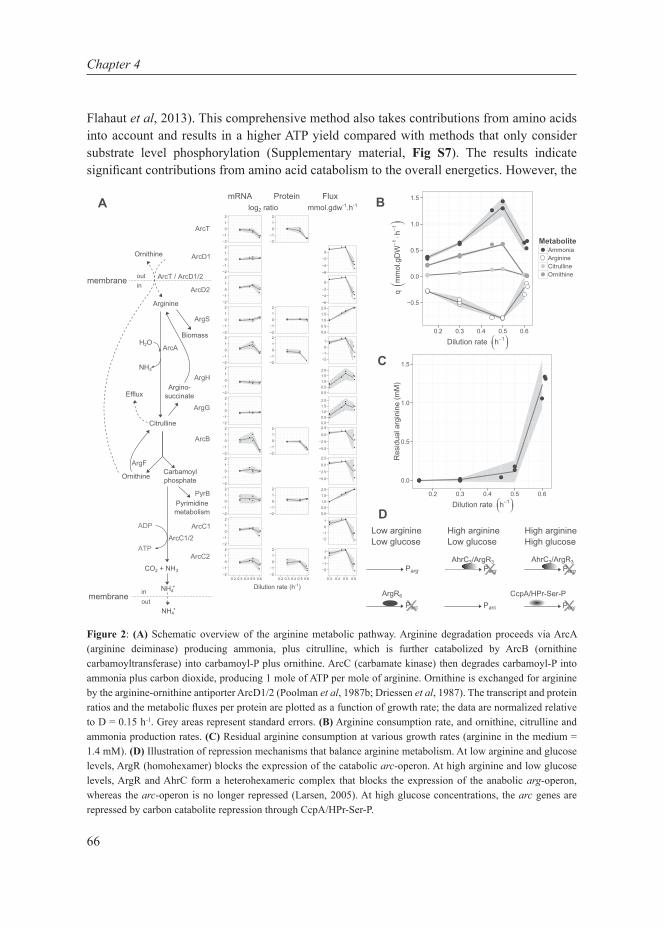
66
Chapter 4
Flahaut et al, 2013). This comprehensive method also takes contributions from amino acids into account and results in a higher ATP yield compared with methods that only consider substrate level phosphorylation (Supplementary material, Fig S7). The results indicate significant contributions from amino acid catabolism to the overall energetics. However, the
Citrulline
ArcA
ArgG
ArgH
Arginine
Ornithine
ArcD2
ArcB
ArgF
Ornithine
ArcC1
CO2 + NH3
NH4+
membraneinout
Low arginineLow glucose
High arginineLow glucose
High arginineHigh glucose
Parg
XParcArgR6
XParg
Parc
AhrC3/ArgR3
XParg
XParcCcpA/HPr-Ser-P
AhrC3/ArgR3
membrane inout
ArcC2
ArcD1
Argino-succinate
ArcT / ArcD1/2
Carbamoylphosphate
Biomass
ArgS
ADP
ATP
Pyrimidine metabolism
PyrB
ArcC1/2
Efflux
ArcT
NH4+
H2O
NH3
A
D
Dilution rate (h-1)
C
BmRNA Protein Flux log2 ratio mmol.gdw-1.h-1
●●● ●
●
●
●
●●
●●● ●● ●
●●●
●●●
●●
●
●
●●
●●● ●
● ●●●●
●●●
●
● ●
●●●
●●●●
● ●●●●
●●● ●● ● ●
●●
●
●
●
●
●
●
●
●●
●●● ●
●
●●●●
●●
●
●●
●
●●●
●●●
●●●
●
●●
●●●
●●
●
●
●●
●●● ●
●
●●●
●●●●● ●●
●
●●●
●●
●
●●●●●
●●●
●●●
●● ●●●
●
●●
●●
●
●●
●●●
●● ●
●
●
●
●●●
●● ●
●
●
●
●●●
●●
●
●●●
●●●
●● ●
●
●
●
●●●
●● ●
●
●
●
●●●
●●
●
●●●
●●●
●● ●
●●
●
●●●
●● ●
●●
●
●●●
●● ●
●
●
●
●●
●
●
●
●
●
●
●
●●
●
●
●
●
●
●
●
●●● ●●●
●
●
●
●
●●
−
●
●
●
●
●
●
●
●
●
●
●
●
●
●
●
●
●
●
●
●
●
●
●
●
●
●
●
●
●
●
●
●
●
●
●
●
●
●●
●
●
●●
●
●
●●
●
−
−
⋅−
Metabolite●
●
●
●
Figure 2: (A) Schematic overview of the arginine metabolic pathway. Arginine degradation proceeds via ArcA (arginine deiminase) producing ammonia, plus citrulline, which is further catabolized by ArcB (ornithine carbamoyltransferase) into carbamoyl-P plus ornithine. ArcC (carbamate kinase) then degrades carbamoyl-P into ammonia plus carbon dioxide, producing 1 mole of ATP per mole of arginine. Ornithine is exchanged for arginine by the arginine-ornithine antiporter ArcD1/2 (Poolman et al, 1987b; Driessen et al, 1987). The transcript and protein ratios and the metabolic fluxes per protein are plotted as a function of growth rate; the data are normalized relative to D = 0.15 h-1. Grey areas represent standard errors. (B) Arginine consumption rate, and ornithine, citrulline and ammonia production rates. (C) Residual arginine consumption at various growth rates (arginine in the medium = 1.4 mM). (D) Illustration of repression mechanisms that balance arginine metabolism. At low arginine and glucose levels, ArgR (homohexamer) blocks the expression of the catabolic arc-operon. At high arginine and low glucose levels, ArgR and AhrC form a heterohexameric complex that blocks the expression of the anabolic arg-operon, whereas the arc-operon is no longer repressed (Larsen, 2005). At high glucose concentrations, the arc genes are repressed by carbon catabolite repression through CcpA/HPr-Ser-P.
67
Uncoupled metabolism and protein expression
total ATP formation rate levels off at high growth rate (Fig 1B). Thus, at D = 0.6 h-1 cells grow faster but at the same rate of ATP formed per unit biomass as at D = 0.5 h-1, suggesting a higher yield on ATP at the higher growth rate. The physiological processes behind this apparent increase in yield remain unclear.
Glycolytic fluxes do not correlate with Vmax, protein- or transcript abundance
We estimated all metabolic fluxes by averaging the flux ranges predicted by flux variability analysis (FVA) on the genome-scale model of L. lactis MG1363, constrained by all observed nutrient consumption and product formation rates. The estimated glycolytic flux increased proportionally with growth rate (Fig 3). However, the flux through the homolactic-branch enzyme lactate dehydrogenase (LDH) increased nonlinearly, and fluxes through the mixed-acid-branch enzymes pyruvate formate lyase (PFL), acetate kinase (ACK) and alcohol dehydrogenase (ADH) increased until D = 0.3 h-1 and then decreased at the higher growth rates. In contrast to these changes in fluxes, the Vmax’s measured by enzymatic assays, as well as the protein- and transcript ratios hardly changed (Fig 3, Supplementary material, Table S1 and S2).
The Vmax’s and protein ratios were nearly constant for most glycolytic enzymes up to D = 0.5 h-1, except for PFL, whose protein ratios decreased linearly above 0.15 h-1. The Vmax of glucokinase (GLK) gradually decreased at higher D’s, while the protein ratio increased at D = 0.6 h-1 compared with other growth rates. Between 0.5 h-1 and 0.6 h-1, the Vmax’s and protein ratios of enzymes encoded by the las operon, phosphofructokinase (PFK), pyruvate kinase (PYK) and LDH, and of fructose-1,6-bisphosphate aldolase (ALD) and triosephosphate isomerase (TPI) increased. Also Vmax’s of phosphoglucose isomerase (PGI), phosphoglycerate kinase (PGK) and phosphoglycerate mutase (PGM) increased, but the changes in Vmax were small compared with the changes in glycolytic flux. The enzymes of the mixed-acid fermentation pathway showed a decreasing trend. Protein ratios of phosphotransacetylase (PTA), and Vmax’s and protein ratios of ACK and ADH dropped at D = 0.6 h-1 compared with other D’s. The two copies of acetate kinase displayed opposite behaviour, which remains unexplained. At higher growth rate, the ackA1 transcript increased, while the protein ratio was constant, whereas the ackA2 transcript was constant, while the relative AckA2 protein ratio decreased to a third compared with that at 0.3 h-1. The correlation between enzyme activities and their respective protein ratios as measured in the proteome studies are shown in Fig 4A. Except for GLK, ACK and ADH, most enzymes show excellent correspondence between regulation of protein ratios and regulation of enzyme activities. In contrast, these ratios do not correlate proportionally with the changes in fluxes. At the level of transcription, most genes encoding glycolytic enzymes showed constant levels, except for a few that increased at the highest growth rate of 0.6 h-1 (Fig 3). These exceptions were pgiA (PGI), fbaA (ALD) and gpmA (PGM). (Supplementary material, Table S1).
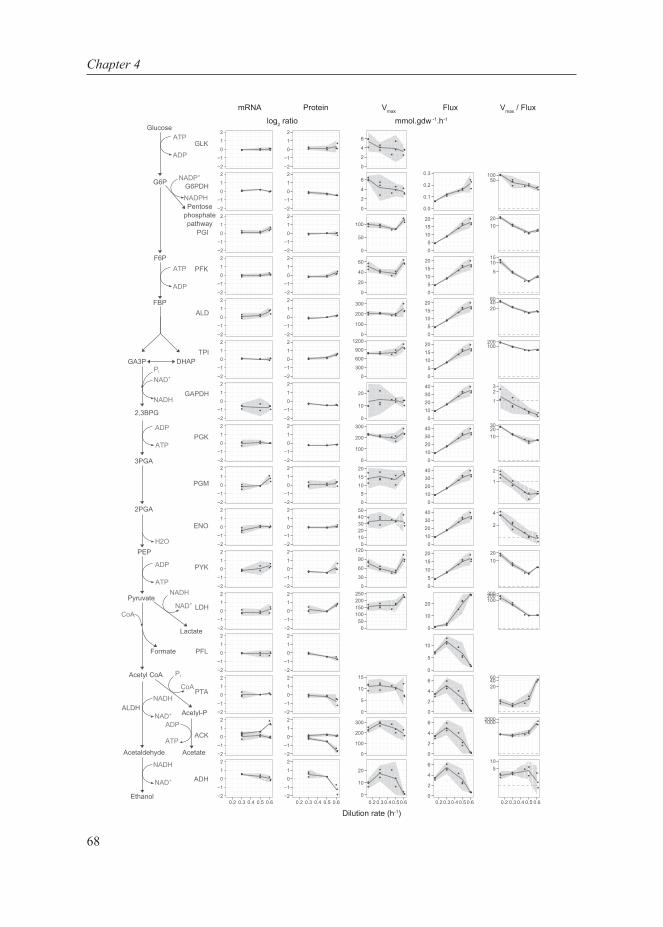
68
Chapter 4
���
���
���
���� ����
������
����
����
���
�������
������
�� ��� �� �� ��
������
�� ����
�� ������
���
���
���
���
���
�����
���
���
���
���
���
���
���
����
���
���
�����
�����
� ���� � ��� ��� ������
������
���
���
���
���
����
����
����
����
����
�������
��
���
���
����
������
���
���
���
���
���
���
�����
�����
●●● ●● ●
●●
●●●●●
●●●
●●● ●
●●
●●
●●●
●●
●●●
●●
●
●●
●●
●
●●● ●● ●●●
●●
●
●
●
●●
●
●●
●
●● ●●●
●●●
●●
●●
●
●●
●
●● ●
●●
●●● ●
●●
●●
●
●
● ●●
●
●●
●●●●●
●
●●
●
●●●●
●●●
●●
●
●● ●●●
●●● ●● ●
●●
−2
−1
0
1
2
−2
−1
0
1
2
−2
−1
0
1
2
−2
−1
0
1
2
−2
−1
0
1
2
−2
−1
0
1
2
−2
−1
0
1
2
−2
−1
0
1
2
−2
−1
0
1
2
−2
−1
0
1
2
−2
−1
0
1
2
−2
−1
0
1
2
−2
−1
0
1
2
−2
−1
0
1
2
−2
−1
0
1
2
−2
−1
0
1
2
0.2 0.3 0.4 0.5 0.6
●●●
●● ●●
●
●●●
●● ●●●
●●● ●● ●●
●
●●●●●
●●●
●●● ●● ●●●
●●● ●●●●●
●●● ●● ●●●
●●● ●● ●●●
●●
●
●●
●●
●
●●● ●●●●●
●●● ●●
●●
●
●●
●
●●
●●●
●●●
●● ●●●
●●●
●●
●●
●
●●●●●
●
●●
●
●●
●●
●
●
●
−2
−1
0
1
2
−2
−1
0
1
2
−2
−1
0
1
2
−2
−1
0
1
2
−2
−1
0
1
2
−2
−1
0
1
2
−2
−1
0
1
2
−2
−1
0
1
2
−2
−1
0
1
2
−2
−1
0
1
2
−2
−1
0
1
2
−2
−1
0
1
2
−2
−1
0
1
2
−2
−1
0
1
2
−2
−1
0
1
2
−2
−1
0
1
2
0.2 0.3 0.4 0.5 0.6
●●
●●●●
●
●
●
●
●●
●●
●
●
●
●
●
●
●●
●●
●●● ●
●●
●● ●
●●●
●
●●
●●●
●●
●
●
●●
●●● ●●
●
●●●
●
●●
●●●●●● ●
●
●
●
●●
●
●●
●
●●
●● ●
●
●
●
●●●
●●●
●
● ●
●
●●
●
●
● ●●
●
●
●
●
●●●
●
●
●
●
●
●
●●
●
●
●●
●
●●
●●
●
●●●
●
●●
●●
● ●
●●
●
●
●
●●●
●●
●
●
●
●
●
●●
●
●●
●
●●
●●●
●
●
● ●
●●
●
●●
●
●
●
●
●
●
●●●
0
2
4
6
0
2
4
6
0
50
100
0
20
40
60
0
100
200
300
0
300
600
900
1200
0
10
20
0
100
200
300
05
101520
01020304050
0
30
60
90
120
050
100150200250
0
5
10
15
0
100
200
300
0
10
20
0.2 0.3 0.4 0.5 0.6
●●●
●●●
●● ●
●
●
●
●●●
●●●
●
●
●
●
●●
●●●
●●●
●
●
●
●
●●
●●●
●●●
●
●
●
●
●●
●●●
●●●
●
●
●
●
●●
●●●
●●●
●
●
●
●
●●
●●●
●●●
●
●
●
●
●●
●●●
●●●
●
●
●
●
●●
●●●
●●●
●
●
●
●
●●
●●●
●●●
●
●
●
●
●●
●●●●●●
●
●
●
●●●
●●●
●
●●
●
●
●
●●●
●●●
●
●●
●
●
●
●●●
●●●
●
●●
●
●
●
●●●
0.0
0.1
0.2
0.3
05
101520
05
101520
05
101520
05
101520
010203040
010203040
010203040
010203040
05
101520
0
10
20
0
2
4
6
0
2
4
6
0
2
4
6
0.2 0.3 0.4 0.5 0.6
●●●
●
●●
●●●
●●●
●●●
●●●
●●●
●●●
●●●
●●●
●● ●
●●●
●●●
●●●
●● ●
●●●
●●●
●●●
●● ● ●●●
●
●●●
●●
●
●●
●●
●
●●●
●●●
●
●● ●●●
●
●
●
●●
●
●
● ● ●●●
●
●
●
●
●
●
●
●
●●●
●
●●●
●●●
●● ●
●●●
●●●
●●●
●● ● ●●●
●●●
●●●
●
●
●
●●●
●●●●●●
●●
●
●●
●
●
●●●●●
●
●●
●
●
●
50100
1020
5
1015
204060
100200
1
23
102030
1
2
2
4
1020
100200300
204060
10002000
510
0.2 0.3 0.4 0.5 0.6
●●●
●
●●
●●
●●●
0
5
10 ●
mRNA Protein Vmax Flux Vmax / Flux
log2 ratio mmol.gdw -1.h-1
Dilution rate (h-1)
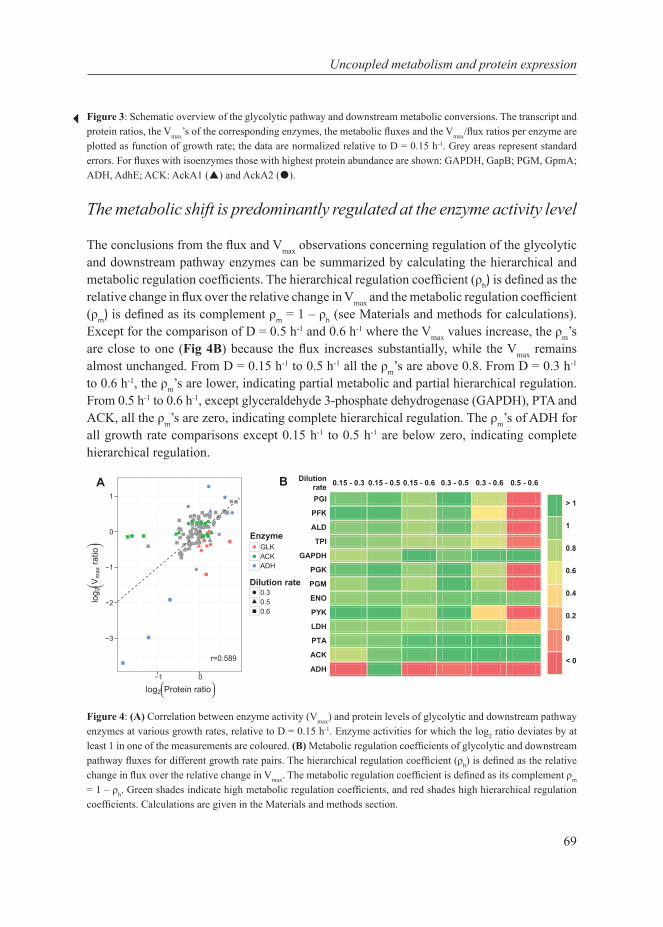
69
Uncoupled metabolism and protein expression
Figure 3: Schematic overview of the glycolytic pathway and downstream metabolic conversions. The transcript and protein ratios, the Vmax’s of the corresponding enzymes, the metabolic fluxes and the Vmax/flux ratios per enzyme are plotted as function of growth rate; the data are normalized relative to D = 0.15 h-1. Grey areas represent standard errors. For fluxes with isoenzymes those with highest protein abundance are shown: GAPDH, GapB; PGM, GpmA; ADH, AdhE; ACK: AckA1 () and AckA2 ().
The metabolic shift is predominantly regulated at the enzyme activity level
The conclusions from the flux and Vmax observations concerning regulation of the glycolytic and downstream pathway enzymes can be summarized by calculating the hierarchical and metabolic regulation coefficients. The hierarchical regulation coefficient (ρh) is defined as the relative change in flux over the relative change in Vmax and the metabolic regulation coefficient (ρm) is defined as its complement ρm = 1 – ρh (see Materials and methods for calculations). Except for the comparison of D = 0.5 h-1 and 0.6 h-1 where the Vmax values increase, the ρm’s are close to one (Fig 4B) because the flux increases substantially, while the Vmax remains almost unchanged. From D = 0.15 h-1 to 0.5 h-1 all the ρm’s are above 0.8. From D = 0.3 h-1 to 0.6 h-1, the ρm’s are lower, indicating partial metabolic and partial hierarchical regulation. From 0.5 h-1 to 0.6 h-1, except glyceraldehyde 3-phosphate dehydrogenase (GAPDH), PTA and ACK, all the ρm’s are zero, indicating complete hierarchical regulation. The ρm’s of ADH for all growth rate comparisons except 0.15 h-1 to 0.5 h-1 are below zero, indicating complete hierarchical regulation.
Figure 4: (A) Correlation between enzyme activity (Vmax) and protein levels of glycolytic and downstream pathway enzymes at various growth rates, relative to D = 0.15 h-1. Enzyme activities for which the log2 ratio deviates by at least 1 in one of the measurements are coloured. (B) Metabolic regulation coefficients of glycolytic and downstream pathway fluxes for different growth rate pairs. The hierarchical regulation coefficient (ρh) is defined as the relative change in flux over the relative change in Vmax. The metabolic regulation coefficient is defined as its complement ρm = 1 – ρh. Green shades indicate high metabolic regulation coefficients, and red shades high hierarchical regulation coefficients. Calculations are given in the Materials and methods section.
Dilution rate 0.15 - 0.3 0.15 - 0.5 0.15 - 0.6 0.3 - 0.5 0.3 - 0.6 0.5 - 0.6
PGI PFK ALD TPI
GAPDH PGK PGM ENO PYK LDH PTA ACK ADH
> 1
1
0.8
0.6
0.4
0.2
0
< 0
A B
●●
●●
●●
●●●●
●
●
●●
●●●●
●
●●●
●
●●
●●
●
●●
●●●●●
●
●●
●
●
● ●
●
●
● ●
●
●
r=0.589
−3
−2
−1
0
1
−1 0
log2Protein ratio
log 2
Vm
ax ra
tio
Enzyme●
●
●
GLKACKADH
Dilution rate●● 0.3
0.50.6
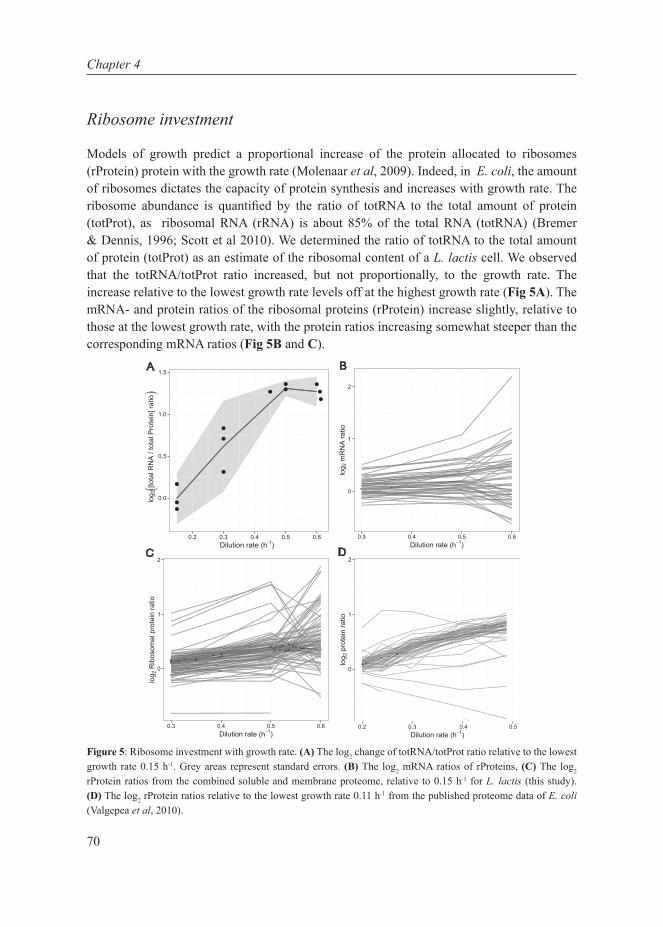
70
Chapter 4
Ribosome investment
Models of growth predict a proportional increase of the protein allocated to ribosomes (rProtein) protein with the growth rate (Molenaar et al, 2009). Indeed, in E. coli, the amount of ribosomes dictates the capacity of protein synthesis and increases with growth rate. The ribosome abundance is quantified by the ratio of totRNA to the total amount of protein (totProt), as ribosomal RNA (rRNA) is about 85% of the total RNA (totRNA) (Bremer & Dennis, 1996; Scott et al 2010). We determined the ratio of totRNA to the total amount of protein (totProt) as an estimate of the ribosomal content of a L. lactis cell. We observed that the totRNA/totProt ratio increased, but not proportionally, to the growth rate. The increase relative to the lowest growth rate levels off at the highest growth rate (Fig 5A). The mRNA- and protein ratios of the ribosomal proteins (rProtein) increase slightly, relative to those at the lowest growth rate, with the protein ratios increasing somewhat steeper than the corresponding mRNA ratios (Fig 5B and C).
−
−
−
●●
●
●
●
●
●
● ●●
●
●
Figure 5: Ribosome investment with growth rate. (A) The log2 change of totRNA/totProt ratio relative to the lowest growth rate 0.15 h-1. Grey areas represent standard errors. (B) The log2 mRNA ratios of rProteins, (C) The log2 rProtein ratios from the combined soluble and membrane proteome, relative to 0.15 h-1 for L. lactis (this study). (D) The log2 rProtein ratios relative to the lowest growth rate 0.11 h-1 from the published proteome data of E. coli (Valgepea et al, 2010).
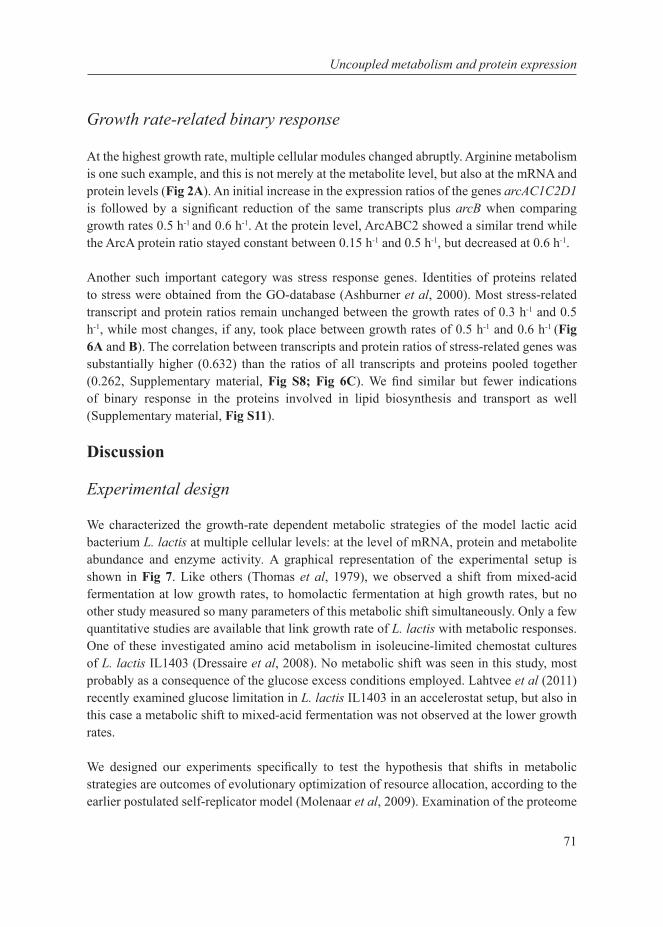
71
Uncoupled metabolism and protein expression
Growth rate-related binary response
At the highest growth rate, multiple cellular modules changed abruptly. Arginine metabolism is one such example, and this is not merely at the metabolite level, but also at the mRNA and protein levels (Fig 2A). An initial increase in the expression ratios of the genes arcAC1C2D1 is followed by a significant reduction of the same transcripts plus arcB when comparing growth rates 0.5 h-1 and 0.6 h-1. At the protein level, ArcABC2 showed a similar trend while the ArcA protein ratio stayed constant between 0.15 h-1 and 0.5 h-1, but decreased at 0.6 h-1.
Another such important category was stress response genes. Identities of proteins related to stress were obtained from the GO-database (Ashburner et al, 2000). Most stress-related transcript and protein ratios remain unchanged between the growth rates of 0.3 h-1 and 0.5 h-1, while most changes, if any, took place between growth rates of 0.5 h-1 and 0.6 h-1 (Fig 6A and B). The correlation between transcripts and protein ratios of stress-related genes was substantially higher (0.632) than the ratios of all transcripts and proteins pooled together (0.262, Supplementary material, Fig S8; Fig 6C). We find similar but fewer indications of binary response in the proteins involved in lipid biosynthesis and transport as well (Supplementary material, Fig S11).
Discussion
Experimental design
We characterized the growth-rate dependent metabolic strategies of the model lactic acid bacterium L. lactis at multiple cellular levels: at the level of mRNA, protein and metabolite abundance and enzyme activity. A graphical representation of the experimental setup is shown in Fig 7. Like others (Thomas et al, 1979), we observed a shift from mixed-acid fermentation at low growth rates, to homolactic fermentation at high growth rates, but no other study measured so many parameters of this metabolic shift simultaneously. Only a few quantitative studies are available that link growth rate of L. lactis with metabolic responses. One of these investigated amino acid metabolism in isoleucine-limited chemostat cultures of L. lactis IL1403 (Dressaire et al, 2008). No metabolic shift was seen in this study, most probably as a consequence of the glucose excess conditions employed. Lahtvee et al (2011) recently examined glucose limitation in L. lactis IL1403 in an accelerostat setup, but also in this case a metabolic shift to mixed-acid fermentation was not observed at the lower growth rates.
We designed our experiments specifically to test the hypothesis that shifts in metabolic strategies are outcomes of evolutionary optimization of resource allocation, according to the earlier postulated self-replicator model (Molenaar et al, 2009). Examination of the proteome
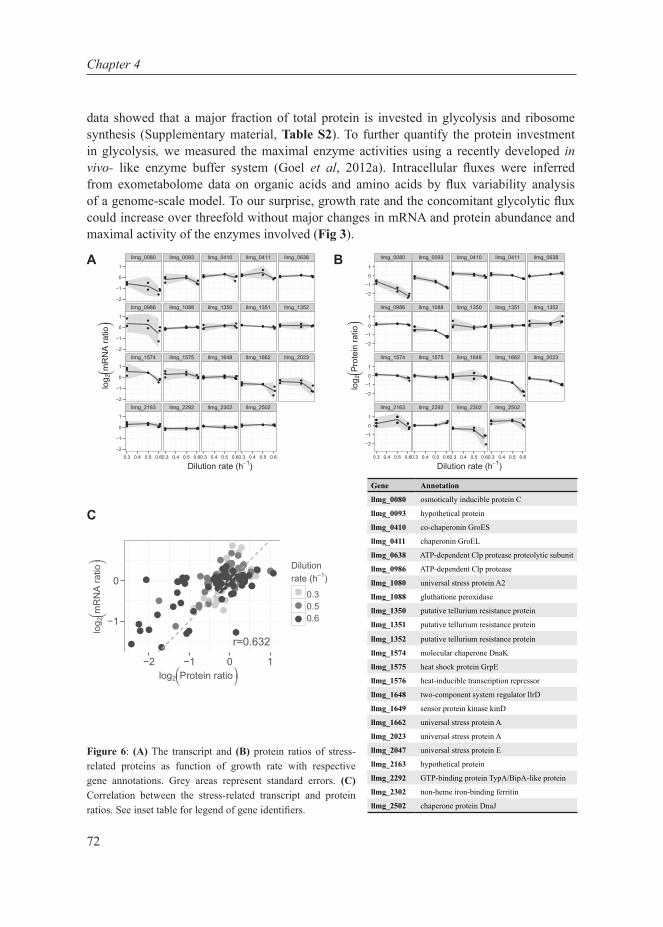
72
Chapter 4
●●● ●
●
●
●●
●
●●●●
●●●
●●● ●●
●
●●●●●
●
●
●●●●●●
●● ●●●
●●
●
●
●
●
●● ●●●●●●
●●●● ●●●●●● ●●●
●● ●●
●●●● ●● ●
●●●●●
●●
●●●
●
●
●
●●
●●●
●
●●
●● ●
●● ●●●●●● ●●
●●●●●●●●
●●● ●●
●
●
●
●●● ●
●
●
●
●
●●●●●●
●●●●
●●●●●●
●●●●● ●●●
●●● ●● ●●●
●●● ●● ●●●
llmg_0080 llmg_0093 llmg_0410 llmg_0411 llmg_0638
llmg_0986 llmg_1088 llmg_1350 llmg_1351 llmg_1352
llmg_1574 llmg_1575 llmg_1648 llmg_1662 llmg_2023
llmg_2163 llmg_2292 llmg_2302 llmg_2502
−2
−1
0
1
−2
−1
0
1
−2
−1
0
1
−2
−1
0
1
0.3 0.4 0.5 0.60.3 0.4 0.5 0.60.3 0.4 0.5 0.60.3 0.4 0.5 0.6
Dilution rate (h−1)
log 2
mR
NA
ratio
●●●
●●
●●●
●●●
●●
●●●
●●● ●● ●
●●●●● ●●
●●●●●●
●● ●●●
●●● ●● ●●●
●●●●●●
●●●●
●●●●●●
●●
●
●● ●●● ●●
●●● ●●● ●●
●●● ●●
●
●●● ●●●●●
●●● ●● ●●●
●●●●●●
●●
●●●●●●●● ●●●
●●
●●●
●●●●●
●●●
●●●●●●
●●
●● ●●
●●●●●●● ●●
●●●
●●● ●●
●●
●
●●●
●●
●
●
●
llmg_0080 llmg_0093 llmg_0410 llmg_0411 llmg_0638
llmg_0986 llmg_1088 llmg_1350 llmg_1351 llmg_1352
llmg_1574 llmg_1575 llmg_1648 llmg_1662 llmg_2023
llmg_2163 llmg_2292 llmg_2302 llmg_2502
−2
−1
0
1
−2
−1
0
1
−2
−1
0
1
−2
−1
0
1
0.3 0.4 0.5 0.60.3 0.4 0.5 0.60.3 0.4 0.5 0.60.3 0.4 0.5 0.6
Dilution rate (h−1)
log 2
Pro
tein
ratio
●
●●●
●● ●
●●
●●
●●
●●
●●●
● ●
●
●●●●●
●●
●●●●●●●
●●
●●
●●
●
●
●●●●
●
●● ●
● ●
●
●●●
●
●
●●
●
● ●
●
●●
●
●
●●● ●●●
●●
●●
●
●
●●
●● ●
●
●
●
●●
●
●●●●
●●●●●
●●
●●
●●
●
●
●
●
●
●
●
●● ●● ●
●
●●●
●
●
●●●
●●
●
●●● ●
●
●●
●
●●
●●●●
● ●
●●●●
●
●
●
●
●●●●● ●●
●
●●●●
● ●
●●
●● ●
●
●
−
●
●
●
Gene Annotation
llmg_0080 osmotically inducible protein C
llmg_0093 hypothetical protein
llmg_0410 co-chaperonin GroES
llmg_0411 chaperonin GroEL
llmg_0638 ATP-dependent Clp protease proteolytic subunit
llmg_0986 ATP-dependent Clp protease
llmg_1080 universal stress protein A2
llmg_1088 gluthatione peroxidase
llmg_1350 putative tellurium resistance protein
llmg_1351 putative tellurium resistance protein
llmg_1352 putative tellurium resistance protein
llmg_1574 molecular chaperone DnaK
llmg_1575 heat shock protein GrpE
llmg_1576 heat-inducible transcription repressor
llmg_1648 two-component system regulator llrD
llmg_1649 sensor protein kinase kinD
llmg_1662 universal stress protein A
llmg_2023 universal stress protein A
llmg_2047 universal stress protein E
llmg_2163 hypothetical protein
llmg_2292 GTP-binding protein TypA/BipA-like protein
llmg_2302 non-heme iron-binding ferritin
llmg_2502 chaperone protein DnaJ
A B
C
Figure 6: (A) The transcript and (B) protein ratios of stress-related proteins as function of growth rate with respective gene annotations. Grey areas represent standard errors. (C) Correlation between the stress-related transcript and protein ratios. See inset table for legend of gene identifiers.
data showed that a major fraction of total protein is invested in glycolysis and ribosome synthesis (Supplementary material, Table S2). To further quantify the protein investment in glycolysis, we measured the maximal enzyme activities using a recently developed in vivo- like enzyme buffer system (Goel et al, 2012a). Intracellular fluxes were inferred from exometabolome data on organic acids and amino acids by flux variability analysis of a genome-scale model. To our surprise, growth rate and the concomitant glycolytic flux could increase over threefold without major changes in mRNA and protein abundance and maximal activity of the enzymes involved (Fig 3).

73
Uncoupled metabolism and protein expression
mRNA and protein homeostasis
The homeostasis of mRNA and protein levels in the face of a three-fold increased dilution by growth is far from trivial. The rate of protein synthesis should scale up with increasing ribosome content. In order to define the relationship between growth rate and ribosomal content in L. lactis, we characterized total ribosomal RNA and total protein pools at each growth rate. The totRNA/totProt ratio, widely accepted as a measure of ribosomal content, showed a gradual, albeit non-proportional increase with increasing growth rate (Fig 5A). By contrast, Gausing reported that a rise in the growth rate of E. coli is paralleled by an increase in rProtein synthesis rate. From a specific growth rate of 0.6 h-1 to 2.2 h-1 this increase was even proportional (Gausing, 1977).
If we assume that a rather stable level of most rProtein-encoding mRNAs will recursively yield more synthesized protein at higher growth rates, our data indicate a restrained yet simple strategy for maintaining ribosomal content in the L. lactis cell. This is plausible if the turnover rate of mRNA is much higher than dilution by growth, which is in fact true because mRNA lifetime in bacteria (E. coli) is typically a few minutes (Taniguchi et al, 2010), while the fastest dilution by growth in the L. lactis cultures (used in this study) is once every 36 min. At all growth rates, there is a certain fixed amount of mRNA for rProteins that is sufficient to meet the rProtein requirement as demanded by the growth rate.
The relationship between ribosome abundance and ribosome synthesis rate is not obvious. The results presented here support the idea that the major limitation for an increase in the ribosomal content is the synthesis of rRNA. This is because rRNA has the steepest increase among totRNA, rProteins and mRNA of rProteins (Fig 5A). Moreover, even if the rProteins were limiting at high growth rates, ribosome activity would not assuredly be affected, based on two reasons. First, most rProteins are located on the outside of the ribosome, and do not play a direct role in protein synthesis (Klein et al, 2004). Second, part of the rProteins can be removed without a loss in ribosome activity (Bubunenko et al, 2006; Noller et al, 1992), pointing toward the idea that rRNA as such is functional as a ribozyme without the requirement of rProteins (Steitz & Moore, 2003). In the assembly of a ribosome, the early-assembly rProteins are thought to structure the rRNA in such a way that it functions as a ribosome (Nierhaus, 1991). In our dataset the amount of early-assembly rProteins shows a gradual increase with increasing growth rate (Supplementary material, Fig S1), but it is not proportional to the rRNA abundance (Fig 5A). So even the minimally required subset of rProteins does not follow the same trend as the rRNA abundance. In the proteomic dataset of E. coli, growing at different growth rates (Valgepea et al, 2010), the relative ratios of rProteins show trends comparable to those in our study for rProtein synthesis (Fig 5C and D). However, it might be premature to speculate that lower rProtein requirement at high growth rates is a general phenomenon for bacteria, since not many datasets of rProtein abundances
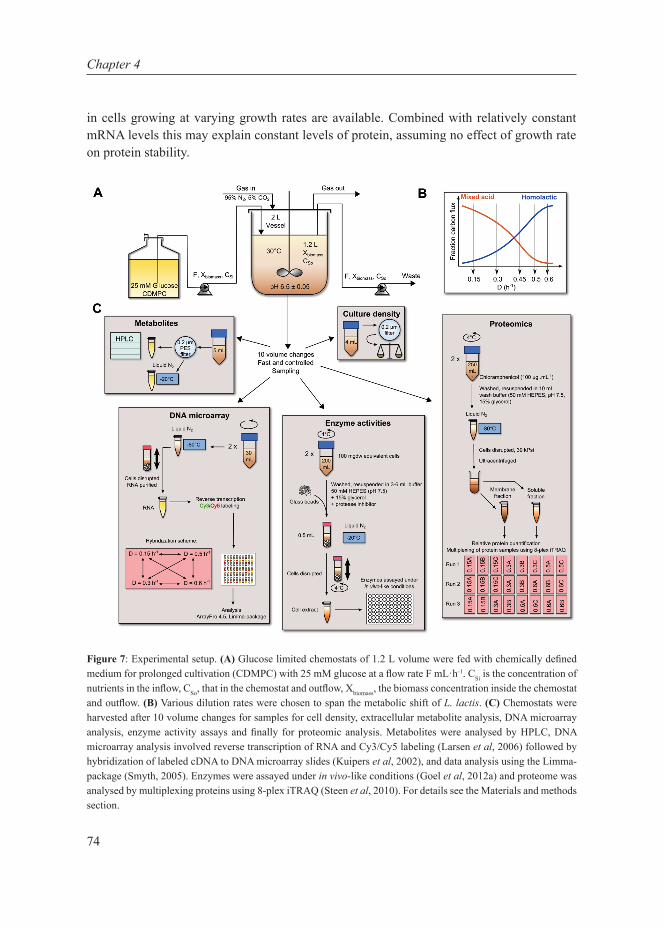
74
Chapter 4
in cells growing at varying growth rates are available. Combined with relatively constant mRNA levels this may explain constant levels of protein, assuming no effect of growth rate on protein stability.
Figure 7: Experimental setup. (A) Glucose limited chemostats of 1.2 L volume were fed with chemically defined medium for prolonged cultivation (CDMPC) with 25 mM glucose at a flow rate F mL·h-1. CSi is the concentration of nutrients in the inflow, CSo, that in the chemostat and outflow, Xbiomass, the biomass concentration inside the chemostat and outflow. (B) Various dilution rates were chosen to span the metabolic shift of L. lactis. (C) Chemostats were harvested after 10 volume changes for samples for cell density, extracellular metabolite analysis, DNA microarray analysis, enzyme activity assays and finally for proteomic analysis. Metabolites were analysed by HPLC, DNA microarray analysis involved reverse transcription of RNA and Cy3/Cy5 labeling (Larsen et al, 2006) followed by hybridization of labeled cDNA to DNA microarray slides (Kuipers et al, 2002), and data analysis using the Limma-package (Smyth, 2005). Enzymes were assayed under in vivo-like conditions (Goel et al, 2012a) and proteome was analysed by multiplexing proteins using 8-plex iTRAQ (Steen et al, 2010). For details see the Materials and methods section.
75
Uncoupled metabolism and protein expression
The relatively small increase in the abundance of ribosomes as a function of growth rate implies excess of protein synthesis capacity at low growth rate. Indeed it has been shown that the ribosomes can be stored in a hibernating state during low growth rate as observed in E. coli (Ueta et al, 2005), S. aureus (Ueta et al, 2010) and B. subtilis (Tagami et al, 2012). This mechanism of hibernating ribosomes has also been observed in mammalian cells (Krokowski et al, 2011). L. lactis has YfiA protein which belongs to the same class as SaHPF (Hibernation Promotion Factor) from S. aureus, which causes dimerization of ribosomes, thus rendering them translationally inactive (Ueta et al, 2010). Indeed we have observed higher transcripts level of YfiA at lower growth rates supporting this phenomenon. Thus at slow growth rates YfiA seems to act as a simple allosteric regulator to control protein biosynthesis at the level of ribosomes.
mRNA and protein regulation
The correlation between the transcriptome and the proteome for all chemostat data pooled together was generally low, with r = 0.262. Although this correlation increased for individual functional categories (Supplementary material, Fig S9, Table S4), overall the change in protein ratios was not proportional to the change in transcript ratios. In a recent study, where the growth rate of one culture was gradually increased using an accelerostat, a high correlation between the transcriptome and proteome was observed for L. lactis (up to 0.69) (Lahtvee et al, 2011) and E. coli (up to 0.917) (Valgepea et al, 2010). In independent chemostat cultures of Saccharomyces cerevisiae, however, transcriptional changes did not largely contribute to the change in glycolytic behaviour (de Groot et al, 2007; Daran-Lapujade et al, 2004). Some studies in yeast show that the correlation between the mRNA and protein ratio is dependent on the gene category. For example, the mRNA-protein correlation is higher for genes involved in stress-response compared with genes involved in core metabolic functions like glycolysis (Brauer et al, 2008; Castrillo et al, 2007). It is thus most likely that glycolytic fluxes are regulated at the post-transcriptional and post-translational level, partly explaining the poor correlation between transcriptome and proteome (Oliveira & Sauer, 2012). In general it is common to find decoupled mRNA and protein ratios (Picard et al, 2009; Taniguchi et al, 2010).
Correlation of fluxes with proteomics: overcapacity of enzymes over flux
The glycolytic flux increased proportionally with the growth rate. However, this was not the case for transcripts, proteins and enzyme activities. The ratio of Vmax/flux showed that the enzyme activities were generally much higher than the actual flux inside the cell at all growth rates for all enzymes except for PGM, GAPDH and enolase (ENO) (Fig 3). For these enzymes the in vitro assays had technical issues as detailed in the Materials and methods section; for instance, the activity of ENO turned out to be sensitive to ammonium sulphate, present in the buffer because of adding coupling enzymes that are suspended in ammonium
76
Chapter 4
sulphate solution (Goel et al, 2012a). For the other enzymes, their overcapacity as suggested by the Vmax/flux ratios could accommodate a four-fold increase in the flux. Presumably, an increase in residual glucose is sufficient to increase the flux through the glycolytic enzymes, as was observed also for yeast at different temperatures (Tai et al, 2007).
What is perhaps even more surprising is that the enzymes of the mixed-acid branch and the lactic acid branch also show an overcapacity. This is in direct contrast to the economic argument that the cost of proteins is a dominant factor for the implementation of a particular metabolic strategy. One exception is ADH, which seems to be dominantly regulated at the expression level. PFL activity could not be measured, as the enzyme is prone to oxidation (Melchiorsen et al, 2000). It was shown before that the protein level of PFL correlates with the flux through the mixed-acid pathway (Melchiorsen et al, 2002). Indeed, in our data, the log2 protein ratios of PFL decrease with increasing growth rate and decreasing flux through the mixed-acid pathway (Fig 3), suggesting hierarchical regulation.
From our data it therefore seems that L. lactis does not change metabolic strategy because of resource allocation optimization, but rather, it keeps both systems active and uses effectors to change flux. One candidate regulator is fructose1,6-bisphosphate (FBP) (Wolin, 1964). The concentration of FBP has been shown to increase at higher growth rate (Konings et al, 1989) which is concomitant with a decrease in the mixed-acid pathway flux. FBP activates LDH and PYK (Mou et al, 1972; Jonas et al, 1972; Thomas et al, 1979; Garrigues et al, 1997; Goel et al, 2012a), and inhibits PTA and ACK (Lopez de Felipe & Gaudu, 2009) thereby explaining the metabolic shift qualitatively. FBP also activates HPr-Ser kinase which in turn activates CcpA-dependent gene expression (repression or activation) (Lopez de Felipe & Gaudu, 2009; Zomer et al, 2007; Titgemeyer & Hillen, 2002; Luesink et al, 1998). Also in other organisms, notably E. coli and S. cerevisiae, FBP has been implicated as a “flux sensor” affecting metabolic strategies (Kotte et al, 2010; Huberts et al, 2012).
The reason for the overcapacity of enzymes is not clear, but in yeast it has been suggested that under dynamic conditions, overall it might be beneficial to switch between alternative pathways, rather than breaking down enzymes of the least optimal pathway all the time. This remains to be experimentally tested.
Another inherent assumption of the self-replicator model is that organisms are evolutionarily optimized, and one may wonder whether the chemostat conditions employed here reflect any condition that L. lactis may have met in its evolutionary history. Native to a rich environment of milk, this microorganism might have been selected for growth on high sugar (lactose) concentrations, always encountering enough substrate to support heavy investments in protein. The choice of using resources scantily and being unprepared to handle a sudden nutrient abundance might in fact be penalizing in a rich-substrate environment in the presence of many competitors.
77
Uncoupled metabolism and protein expression
Post-translational modification of enzymes
Post-translational modification of proteins as a regulatory mechanism is abundant in eukaryotes (Gnad et al, 2009; Oliveira & Sauer, 2012) as well as prokaryotes (Macek et al, 2008); see also, the PHOSIDA database (Gnad et al, 2011). A recent study revealed phosphorylation of L. lactis proteins at amino acid residues serine, threonine and tyrosine (Soufi et al, 2008). In the absence of such post-translational modification, we should find perfect correlation between the log2 ratios of Vmax’s and protein levels, since Vmax is a product of total enzyme concentration and the catalytic turnover number (kcat). We do find this, with a few exceptions (Fig 4A). Of the enzymes whose Vmax’s do not perfectly correlate with their protein ratios, one (GLK) is involved in phosphorylating glucose and two (ACK, ADH) are involved in the mixed-acid branch. The hexokinase in yeast is regulated via phosphorylation (Golbik et al, 2001). L. lactis predominantly uses PTS systems for glucose transport, while GLK is only useful when a glucose permease (GlkU) is used, and post-translational modification might be quick way of altering GLK. Post-translational modification of ACK and ADH might have an influence on the metabolic shift in L. lactis.
Behaviour at near-maximal growth rate
The limits of growth were approached in the condition with D = 0.6 h-1, as the washout kinetics indicated a maximal growth rate of 0.74 h-1 for this medium (Supplementary material Fig S5). The biomass concentration decreased at the highest growth rates (Table 1), and the concentration of residual glucose in the chemostats changed quite drastically from undetectable in the chemostats at D = 0.15 h-1 up to D = 0.5 h-1 to a few mM at the highest growth rate of 0.6 h-1 (Supplementary material, Table S5). The medium was supplemented with all components up to concentrations that would make glucose the limiting factor. This was explicitly tested in our chemostat setting (Supplementary material, Fig S3). Alongside lower biomass concentration, the ATP yield increased at D = 0.6 h-1 (Fig 1B) permitting cells to grow faster but at the same rate of ATP formed per unit biomass.
In addition, steadily increasing transcripts and proteins of the arginine catabolic pathway plummeted at D = 0.6 h-1; so also the consumption rates of arginine and the production rates of ornithine, citrulline and ammonia (Fig 2B). The upstream region of the arginine catabolic gene cluster arcABD1C1C2TD2 contains 6 ARG boxes for binding of ArgR (Larsen et al, 2008), a putative CodY operator site and a cre-site for CcpA binding (Zomer et al, 2007). It was proposed that arginine binds to the arginine regulator AhrC to promote derepression, via release of ArgR binding, of the arcABD1C1C2TD2 cluster (Larsen et al, 2004). We find that until D = 0.5 h-1, residual arginine levels are a monotonic function of the growth rate (Fig 2C): the enhanced expression of ArcA fits with such a scenario. At the highest growth rate, however, some other mechanism seems to inhibit expression and flux of arginine

78
Chapter 4
catabolism. Possibly, arginine demand at a high growth rate is so high that intracellular levels have dropped. No significant upregulation was recorded of the arginine biosynthetic genes argCJBF, argGH and gltSargE. Thus, it seems likely that CcpA-mediated carbon catabolite repression, as a result of the quick increase in residual glucose, is at the basis of the steep decrease in ADI activity (Supplementary material, Table S5).
The amounts of several stress proteins went down at the highest growth rate. This is reminiscent to the feast / famine behaviour seen in B. subtilis (Buescher et al, 2012) and E. coli (Ferenci, 2008), in which cells are prepared for all kinds of stresses at low growth rate and then abruptly invest much less in stress machineries when they suddenly encounter high glucose concentrations, at higher growth rates. The transcript ratios of the CcpA- and HPr- encoding genes increased significantly with a rising growth rate (Supplementary material, Table S1, Fig S6). Importantly, the phosphorylation state of HPr at position 46, i.e. HPr-Ser-P, increases with growth rate and this may directly impact the glycolytic flux and other metabolic rates (Gunnewijk & Poolman, 2000; Gunnewijk et al, 2001). Both the transcriptome and proteome are significantly, but not drastically, reorganized upon growth at D= 0.6 h-1 (Supplementary material, Table S1 and S2). Altogether, growing L. lactis with a rate close to maximal as compared to lower growth rates results in only mild differences in the respective proteomes and transcriptomes.
Conclusion
We set out to find experimental evidence for the optimization of resource allocation with respect to the metabolic shift. What we ended up with was completely different. Studying the metabolic shift of L. lactis from mixed-acid fermentation to homolactic fermentation at multiple cellular levels we conclude that this paradigm shift is certainly not controlled at either the protein synthesis or the transcriptional level.
From the analysis of the ribosomal protein abundance as a function of growth rate, we conclude that the strategy of L. lactis is one of overcapacity, allowing a rapid response to changing conditions, rather than economizing protein investment. Additionally, while approaching the limits of growth, L. lactis exhibits a feast or famine-like behaviour.
Choosing overcapacity means keeping life simple, which might in fact be useful in a complex, nutritionally rich environment. The behaviour of cells might not be digital per se, but possibly in discrete substrate regimes: high, low, and in between. In between high and low, mRNA is kept constant by high turnover rates, and the rest increases from the increased ribosomal capacity. One could argue that glucose is an unusually special substrate, but in uncertain and fluctuating environmental conditions, it might be pointless to track it any more precisely than a high/low presence, since it would change anyway.
79
Uncoupled metabolism and protein expression
Materials and methods
Strain and growth medium
Lactococcus lactis ssp. cremoris MG1363 (Gasson, 1983) was grown on chemically defined medium for prolonged cultivation (CDMPC) as described by Santos et al, (manuscript in preparation) with 25 mM glucose as the limiting nutrient and the medium composition as detailed in Chapter 3 (Goel et al, 2012a).
Culture conditions
Glucose-limited chemostat cultures were grown in 2 L bioreactors with a working volume of 1.2 L at 30 °C, under continuous stirring. The headspace was flushed at 5 headspace volume changes per hour, with a gas mixture of 95% N2 (99.998% pure) and 5% CO2 (99.7% pure) with oxygen impurity less than 34 vpm. A pH of 6.5±0.05 was maintained by automatic titration with 5 M NaOH. Fermenters were inoculated with 4% (v/v) of standardized pre-cultures consisting of 45 mL of CDMPC inoculated with 300 µL of a glycerol stock of L. lactis MG 1363 and incubated for 16 h at 30 °C. After batch growth until an optical density at 600 nm (OD600) of around 1.8, medium was pumped at the appropriate dilution rate (0.15, 0.3, 0.45, 0.5, 0.6 h-1). The actual dilution rate was measured shortly before harvesting. Some replicate chemostat cultures had a slightly different dilution rate. The largest deviation was found for a chemostat which ran at a D = 0.45 h-1 while being set at a D = 0.5 h-1 (Table 1). However, since the transcriptome sample derived from this chemostat did not differ significantly from the two other replicates, the three samples were, for the benefit of statistical power, treated as biological replicates in the analysis of transcriptome and proteome data.
Harvesting of cells from chemostats
The chemostats were harvested assuming a steady state at 10 working volume changes (Even et al, 2003). At harvest, the medium inflow was stopped and the entire culture in the chemostat was pumped out at a high flow rate into sampling tubes placed on ice; the whole procedure taking less than 90 s. Samples were collected for cell density, extracellular metabolite analysis, DNA microarray analysis, enzyme activity assays and finally for proteomic and fatty acid composition analysis.
Cell density
Cell density was measured spectrophotometrically at 600 nm and calibrated against cell dry weight measurements performed in triplicate for each sample as follows. 4 mL of culture was filtered through a pre-dried, pre-weighed 0.2 µm cellulose nitrate filter (Whatman GmbH,

80
Chapter 4
Dassel, Germany), washed twice with deionized water and dried to a constant weight. For one unit change of optical density, the change in dry weight was determined to be 0.31 ± 0.02 gL-1OD600
-1.
Fermentation end-product, ammonia and amino acid analysis
Supernatant samples from medium bottles and chemostat cultures were prepared by filtering through a 0.20 µm polyethersulfone (PES) filter (VWR international B.V., Amsterdam, the Netherlands) and storing the flow-through at -20ºC until further analysis. Extracellular concentrations of lactate, acetate, ethanol, formate, and glucose were determined High Performance Liquid Chromatography (HPLC) as described in Goel et al (2012a) (see Chapter 3). Residual glucose concentrations were determined by enzymatic coupling with NADP+ in an assay containing 100 mM HEPES (4-(2-hydroxyethyl)-1-piperazineethanesulfonic acid)-KOH, 5 mM MgSO4, 2 mM ATP, 4.5 mM NADP+, 1.5 U∙mL1 hexokinase, 1 U∙mL-1 glucose-6-phosphate dehydrogenase (G6PDH) and sample or standard. Ammonia concentrations were measured using a commercially available ammonia assay kit (catalogue no. AA0100, Sigma-Aldrich, St. Louis, Mo, USA). Amino acids (AA) were analysed by liquid chromatography (LC) with fluorescence detection (350 nm excitation, 450 nm emission, RF 20-A, Shimadzu, ’s Hertogenbosch, The Netherlands). Precolumn derivatization using ortho-phtalaldehyde (OPA) and 3-mercaptopropionic acid was applied. The analysis was carried out by on-line detection using a programmable SIL 10A autosampler (Shimadzu). In brief: 25 mg OPA were dissolved in 5 mL borate buffer (0.1 M, pH 10.2) containing 21 µL 3-mercaptopropionic acid. 25 µL of sample was mixed with 25 µL borate buffer (0.2M, pH 10.2) and 25 µL of a DL-norvaline internal standard solution (1 mM) was added. The sample is made up to 950 µL with MilliQ (Millipore, Amsterdam, The Netherlands) water and placed in the autosampler. To every sample the SIL 10A autosampler adds 50 µL of OPA solution before analysis. Analysis was carried out using a quaternary LC 20AB pump (Shimadzu) operated at 640 µL/min. The pump delivered a gradient of 10 mM Na2HPO4, 10 mM Na2B4O7 pH 8.2 in MilliQ water, containing 5 mM NaN3 (eluent A) and acetonitrile:methanol:water 45:45:10 (v:v:v) (eluent B). The gradient started at 2% B held for0.5 min, ramped to 57% at 30 min, then to 95% at 30.1 min, held for 3 min. The employed column was an Agilent, Zorbax Eclipse plus C18 , 150 x 3 mm x 3.5 µm (Agilent, Waldbronn, Germany), protected with a C18 precolumn, held at 40 ⁰C. The injection volume was 5 µL. Amino acids were quantified by the internal standard method against individual calibration lines obtained under the same conditions. Aspartate and glutamate measurements could not reliably be determined as the concentrations were too close to the detection limit. Fluxes qi (in mmol∙gDW-1∙h-1) were calculated as: qi = D × (Ci,supernatant - Ci,medium)/Xbiomass, where C is the concentration of compound i (mmol∙L-1), Xbiomass is the biomass concentration (gDW∙L-1), and D is the dilution rate (h-1).

81
Uncoupled metabolism and protein expression
DNA microarray analysis
Cells (2 × 30 mL) were harvested by centrifugation (5 min, 4500 g); pellets were immediately frozen in liquid nitrogen and stored at -80 °C. For RNA isolation the frozen cells were thawed on ice. Subsequent cell disruption, RNA purification, reverse transcription and Cy3/Cy5 labeling were done as described previously (Larsen et al, 2006). Labeled cDNAs were hybridized to full-genome DNA microarray slides of L. lactis MG1363 (Kuipers et al, 2002), with the addition of probes for rProteins. All reagents and glassware for RNA work were treated with DEPC. RNA, cDNA quantity and quality, and the incorporation of the cyanine-labels were examined by NanoDrop (ThermoFisher Scientific Inc.) at 260 nm for RNA and cDNA, 550 nm for Cy3, and 650 nm for Cy5. The four chemostats with increasing growth rate were run as biological triplicates. Thus, three times the samples of an increasing growth rate were compared directly with each other in combination with a dye-swap (Fig 7). DNA microarray slide images were analyzed using ArrayPro 4.5 (Media Cybernetics Inc., Silver Spring, MD). Filtering of bad- and low-intensity spots and signals, data parsing, automated grid-based Lowess normalization, scaling, data visualization and outlier detection were performed using the Limma-package (Smyth, 2005). We used the common reference design in which direct and indirect comparisons were used to increase statistical significance. Fold changes are considered to be significantly altered when the p value ≤ 0.05.
Enzyme activities: sampling, cell extract preparation and assay conditions
A volume of cell culture containing 100 mg dry weight was centrifuged (4 °C, 5 min, 8,000 rpm), washed once and resuspended in 3 to 6 mL 50 mM HEPES-KOH at pH 7.5, containing 15% glycerol supplemented with Halt Protease Inhibitor single-use cocktail, EDTA-free (Thermo Fischer Scientific, Rockford, IL, USA). This suspension was divided into 0.5 mL aliquots added to 0.5 mg glass beads with 100 µm diameter (BioSpec Products, Bartlesville, USA) in screw capped tubes, snap-frozen in liquid nitrogen and stored at -20 °C until further analysis. Frozen samples were thawed on ice and MgCl2 was added to a final concentration of 2 mM. Cells were disrupted in a FastPrep FP120 homogenizer (BIO 101, Vista, CA, USA) at a speed setting of 6, in 3 bursts of 20 s, with 120 s intermittent cooling. After centrifugation (4 °C, 10 min, 10,000 g), the supernatant was collected and a series of dilutions were prepared, which were used immediately for enzyme assays. Protein concentrations of cell extracts were determined on the same day by the bicinchoninic acid (BCA) method (Stoscheck, 1990) with a BCA Protein Assay Kit (Pierce, Thermo Fisher Scientific) using bovine serum albumin (BSA, 2 mg·mL−1 stock solution; Pierce), containing 2 mM MgCl2 and Halt Protease Inhibitor cocktail, as the standard. Enzyme activities were assayed at 30 °C at pH 7.5 in freshly prepared cell extracts within 2 weeks of harvesting the chemostats. The enzymes GLK, G6PDH, PGI, PFK, ALD, TPI, GAPDH, PGK, PGM, ENO,
82
Chapter 4
PYK, LDH, ACK, PTA, ADH and aldehyde dehydrogenase (ALDH) were assayed with the in vivo-like assay medium (version 1) as described by Goel et al (2012a) (see Chapter 3) with the following differences: the coupling enzymes were not desalted, GAPDH was assayed with 5 mM arsenate (Garrigues et al, 1997) and PGM was assayed in the absence of activator 2,3-bisphosphoglycerate. These differences arose because the chemostat samples were assayed within a week of harvesting to avoid enzyme deterioration, and we had to work with an interim version of the in vivo-like assays was further developed later on. ALDH activity was not detected. All assays were checked for linearity and proportionality with increasing cell extract, with at least 4 technical replicates. The values obtained from the assays yield the total activity of all isoenzymes in the cell extract and are expressed as the rate of substrate converted, relative to total protein in the extract. Obtained activities in μmol∙ min-1∙ mg protein-1 were converted to mmol∙gDW-1∙h-1 by multiplying activities with the ratio of total protein content per dry weight estimated for each chemostat culture.
Proteomic analysis
For protein expression profiling 2 × 250 mL of culture from each chemostat was collected by directly pouring it in pre-chilled centrifuge bottles containing chloramphenicol at a final concentration of 10 μg·mL-1 (2.5 mL stock solution, 10 mg·mL-1). The cells were harvested by centrifugation (4 °C, 5 min, 8,000 rpm). Supernatant was discarded and the pellet was washed with 50 mL of wash buffer (50 mM HEPES-NaOH pH 7.5, 15% glycerol) and centrifuged. The washed cell pellets were resuspended in 10 mL wash buffer, frozen in liquid nitrogen and stored at -80 °C. Cells corresponding to OD600 of 50 in a total volume of 6 mL with 1 mM MgCl2 were disrupted at 39 kPsi with a Constant Systems cell disrupter. The crude cell lysates were centrifuged (4 °C, 15 min, 12,000 g); the supernatant was carefully recovered and subsequently centrifuged (4 °C, 15 min, 267,000 g). The supernatant, containing the soluble fraction was removed and stored at -80 °C. The residual membrane fraction was washed once and finally resuspended in 500 μL of wash buffer and stored at -80 °C. Protein concentrations for both soluble and membrane fractions were determined with BCA kit (Pierce). For Trypsin digestion 50 µg of protein was resuspended in 50 µL of 500 mM TEAB, 2% acetonitrile and 0.08% SDS. The disulfide bonds were reduced with 3 mM Tris (2-carboxymethyl) phosphine hydrochloride, and the cysteine residues were modified with 4 mM iodoacetamide. The 8-plex iTRAQ labeling was performed three times (Fig 7), according to the manufacturer’s protocol with few modifications as described in Steen et al (2010). The peptide mixture was subjected to chromatography and spectrometric analysis. The pre-fractionation of peptides was performed on a silica based polysulfoethyl aspartamide strong cation exchange (SCX) column (catalogue number: 202SE0502 Poly LC Inc., Columbia USA).

83
Uncoupled metabolism and protein expression
Proteomic data analysis and statistics
Raw proteome for each sample data consisted of four sets of 8-plex iTRAQ signal strengths annotated with a peptide and protein identifiers. Three data sets each originated from membrane and soluble protein fractions. Membrane and soluble protein fraction were analyzed separately. Peptide identifiers could only be compared within and not between an 8-plex iTRAQ data set. Individual samples within an 8-plex dataset were signal normalized by LOESS regression on an M-A transformation of the signals, as is common in microarray analysis. The assumption that the bulk of log-transformed signal ratios between different samples or between replicates will ideally be located symmetrically around 0 (no regulation) independent of the signal strength underlies this normalization technique. Since this technique is used originally when comparing only two samples, an adaptation for 8 samples was made. LOESS normalization was performed for each of the 28 unique pairs of samples within an 8-plex set, and these normalizations were reconciled by linear modeling. The normalized data were used to fit the logarithmically transformed ratios of protein amounts at the different growth rates (relative to growth rate 0.15 h-1) taking into account the additional effects of peptide and iTRAQ 8-plex set.
Fatty acid composition analysis
Frozen cells from the proteomic sample of each chemostat were thawed, and transmethylated and analyzed on a gas chromatograph for acyl chain composition according to the methods described earlier (Muskiet et al, 1983). The data reported is an average of the biological triplicates.
Total cell protein and total RNA
Frozen cells from the proteomic sample of each chemostat were thawed and 100 µL cells were diluted to a constant OD of 0.25. These were further diluted up to a volume of 400 µL and used to estimate total protein and RNA. For total protein quantification, the cells were lysed with 2% SDS and incubated at 96 °C for 2 h. Protein concentrations in the obtained cell lysates were determined in triplicate using a BCA Protein Assay Kit (Pierce, Thermo Fisher Scientific) using BSA (2 mg·mL−1 stock solution; Pierce) as the standard (Stoscheck, 1990). For total RNA, cells were disrupted with a Qiagen Tissue Lyser (15 Hz, 2 cycles, 5 min each), and total RNA was extracted with phenol/ chloroform/ isoamylalcohol (25:24:1 v/v), and extracted again with chloroform/ isoamylalcohol (24:1 v/v). The total RNA was precipitated by the addition of isopropanol and by adding potassium acetate to a final concentration of 150 mM, supplemented with Diethyl Phosphorocyanidate (DEPC) Followed by vacuum-centrifugation for removal of the solvents from the RNA. Finally, samples were completely dissolved in MilliQ-DEPC and total RNA was quantified by measuring absorbance 260 nm using NanoDrop (Thermo Fisher Scientific Inc.). Data reported is an average of technical duplicates for each biological sample.
84
Chapter 4
Regulation analysis
We used regulation analysis (ter Kuile & Westerhoff, 2001) to investigate the growth rate-related flux regulation in L. lactis. The hierarchical regulation coefficient (ρh) represents the extent of flux regulation through gene expression and via changes in enzyme concentration. It can be defined as,
(1)
for a pathway flux J, with concentration ei of enzyme i which carries a flux at a rate Vi. The extent of flux regulation of enzyme activity by metabolite x is called the metabolic regulation coefficient (ρm) defined as,
(2)
(3)
At steady state, the sum of the regulation coefficients ρh and ρm is one. The metabolic regulation coefficient ρm was calculated via ρh which was computed for a set of two growth rates, as the ratio of the difference between the logarithms of the fluxes to the difference between the logarithms of the enzyme activities, at both growth rates.
Constraint-based modelling: flux balance analysis and flux variability analysis
The genome-scale stoichiometric network model was based on an existing model of L. lactis MG1363 (Verouden et al, 2009 and updated by Flahaut et al, 2013) with modifications in growth and maintenance energy parameters which were estimated as described earlier (Teusink et al, 2006). The network was constrained with all measured experimental fluxes with the objective of maximising ATP dissipation to estimate the maintenance coefficient as the maximum ATP dissipation rate, and the ATP requirement for precursor biosynthesis was estimated by the reduced cost of biomass flux for ATP dissipation. This exercise was repeated to calculate the ATP parameters for each chemostat culture at each growth rate resulting in 12 models (for general models, and upper and lower bounds for each simulation, see Supplementary material, and Table S9). Flux variability analysis at a fixed growth rate was carried out for all models and the flux distribution was obtained by calculating the average of the flux range for each individual flux. All analyses were carried out using the web-based modelling tool: Flux Analysis and Modelling Environment (FAME) (Boele et al, 2012).
ρhi i iV d ed J
d ed J
=∂∂
× ≅ln ln
lnlnln
ρ
ρ ρ
mx
h h
Vx
xJ
=∂∂
×∂∂
+ =
∑ lnln
lnln
1
85
Uncoupled metabolism and protein expression
Acknowledgements
This work is supported by the Dutch Technology Foundation STW (grant 08080) which is part of the Netherlands Organisation for Scientific Research (NWO) and partly funded by the Ministry of Economic Affairs, Agriculture and Innovation, the Kluyver Centre for Genomics of Industrial Fermentation and the Netherlands Consortium for Systems Biology (NCSB), within the framework of the Netherlands Genomics Initiative (NGI) / NWO. FBS is supported by NWO with VENI grant 863.11.019. BP is additionally supported by the Netherlands Proteomics Centre and a NWO-TOP GO subsidy (grant number 700.10.53)
Author Contributions
AG carried out fermentations, enzyme activity measurements and constraint based modelling, analysed the extracellular metabolome with help from FS, and wrote and drafted the manuscript. TE performed microarray analyses, with help from AdJ and DM in data analysis, total RNA extraction, fatty acid analysis and wrote the manuscript. PP carried out the total protein extraction, and proteomics analyses, with help from FF in measurements, and DM in data analysis. DM performed the multi-level data analysis. FS JK DM WdV BP OPK and BT conceived the study, co-designed the experimental approach and critically revised the manuscript. All authors read and approved the final manuscript.
Conflict of Interest
None declared.
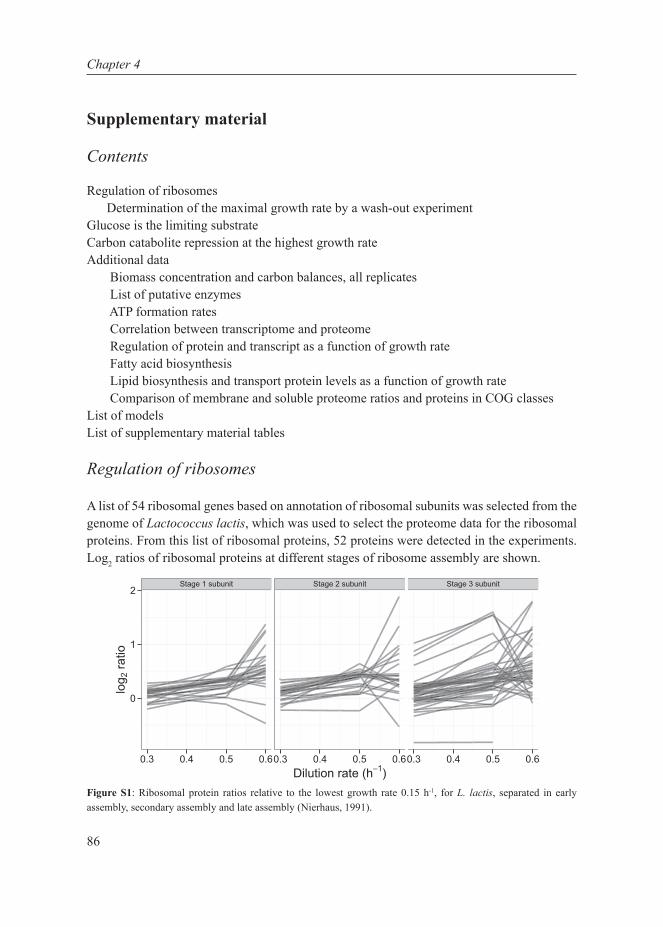
86
Chapter 4
Supplementary material
Contents
Regulation of ribosomes Determination of the maximal growth rate by a wash-out experimentGlucose is the limiting substrateCarbon catabolite repression at the highest growth rate Additional data Biomass concentration and carbon balances, all replicates List of putative enzymes ATP formation rates Correlation between transcriptome and proteome Regulation of protein and transcript as a function of growth rate Fatty acid biosynthesis Lipid biosynthesis and transport protein levels as a function of growth rate Comparison of membrane and soluble proteome ratios and proteins in COG classesList of modelsList of supplementary material tables
Regulation of ribosomes
A list of 54 ribosomal genes based on annotation of ribosomal subunits was selected from the genome of Lactococcus lactis, which was used to select the proteome data for the ribosomal proteins. From this list of ribosomal proteins, 52 proteins were detected in the experiments. Log2 ratios of ribosomal proteins at different stages of ribosome assembly are shown.
Figure S1: Ribosomal protein ratios relative to the lowest growth rate 0.15 h-1, for L. lactis, separated in early assembly, secondary assembly and late assembly (Nierhaus, 1991).
Stage 1 subunit Stage 2 subunit Stage 3 subunit
0
1
2
0.3 0.4 0.5 0.60.3 0.4 0.5 0.60.3 0.4 0.5 0.6Dilution rate (h−1)
log 2
ratio

87
Uncoupled metabolism and protein expression
Figure S2: Regulation of the ribosomal proteins in the soluble and membrane fraction. Some of the ribosomal proteins are down-regulated in the soluble fraction. One could have the hypothesis that these are the same that show a high increase in the membrane fraction. However, the figure above suggests that this relation does not exist. We also see that the correlation between the two fractions is quite poor, but significant (p-value for two-sided test on Pearson correlation moment: 0.0357).
Glucose is the limiting substrate
To test whether glucose was the limiting substrate in the chemostats, we tested different feed glucose concentrations at two dilution rates, 0.3 and 0.6 h-1. We found a proportional increase in biomass with increasing glucose concentration confirming that glucose was indeed the limiting factor (Fig S3).
Furthermore, residual concentrations of amino acids were in reasonable ranges of the expected concentrations, calculated based on the theoretical consumption of amino acids from the CDMPC medium (see Materials and methods), for biomass formation.
0
2
4
Dilution rate0.3
0.5
0.6
y = 0.0288xR2 = 0.9186
0
0.2
0.4
0.6
0.8
1
1.2
0 10 20 30 40Feed glucose (mM)
Cell
dry
wei
ght (
gdw
.L-1
)
D = 0.6 D = 0.3
Figure S3: Cell density of chemostat cultures at dilution rates 0.3 and 0.6 h-1 with varying feed glucose concentrations showing a proportional increase in biomass.
0
0.2
0.4
0.6
0.8
1
1.2
1.4
Res
idua
l con
cent
ratio
n (m
M)
Expected0.150.150.150.30.30.30.450.50.50.60.610.61333
Figure S4: Residual concentrations of amino acids: actual and expected (based on theoretical consumption for biomass formation from the genome scale stoichiometric model of L. lactis (Verouden et al, 2009 and updated by Flahaut et al, 2013), for all growth rates.
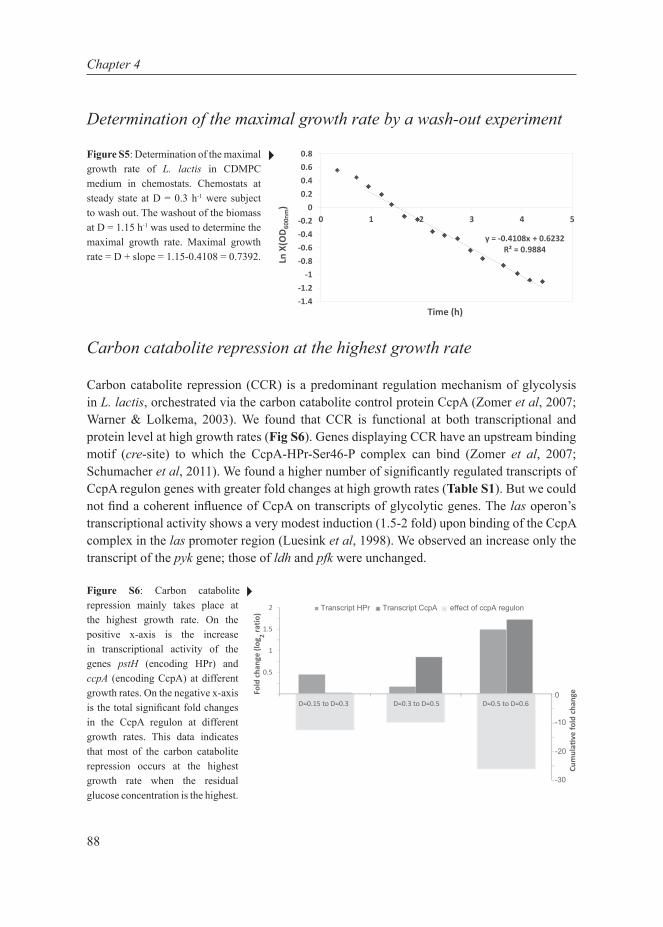
88
Chapter 4
Determination of the maximal growth rate by a wash-out experiment
Figure S5: Determination of the maximal growth rate of L. lactis in CDMPC medium in chemostats. Chemostats at steady state at D = 0.3 h-1 were subject to wash out. The washout of the biomass at D = 1.15 h-1 was used to determine the maximal growth rate. Maximal growth rate = D + slope = 1.15-0.4108 = 0.7392.
Carbon catabolite repression at the highest growth rate
Carbon catabolite repression (CCR) is a predominant regulation mechanism of glycolysis in L. lactis, orchestrated via the carbon catabolite control protein CcpA (Zomer et al, 2007; Warner & Lolkema, 2003). We found that CCR is functional at both transcriptional and protein level at high growth rates (Fig S6). Genes displaying CCR have an upstream binding motif (cre-site) to which the CcpA-HPr-Ser46-P complex can bind (Zomer et al, 2007; Schumacher et al, 2011). We found a higher number of significantly regulated transcripts of CcpA regulon genes with greater fold changes at high growth rates (Table S1). But we could not find a coherent influence of CcpA on transcripts of glycolytic genes. The las operon’s transcriptional activity shows a very modest induction (1.5-2 fold) upon binding of the CcpA complex in the las promoter region (Luesink et al, 1998). We observed an increase only the transcript of the pyk gene; those of ldh and pfk were unchanged.
Figure S6: Carbon catabolite repression mainly takes place at the highest growth rate. On the positive x-axis is the increase in transcriptional activity of the genes pstH (encoding HPr) and ccpA (encoding CcpA) at different growth rates. On the negative x-axis is the total significant fold changes in the CcpA regulon at different growth rates. This data indicates that most of the carbon catabolite repression occurs at the highest growth rate when the residual glucose concentration is the highest.
y = -0.4108x + 0.6232 R² = 0.9884
-1.4-1.2
-1-0.8-0.6-0.4-0.2
00.20.40.60.8
0 1 2 3 4 5
Ln X
(OD
600n
m)
Time (h)
0.5
1
1.5
2
0 0.3 0 0.5 0 0.6
Cm
ula
ve fo
ld c
hang
e
Transcript HPr Transcript CcpA e ect of ccpA regulon
0
-10
-20
-30
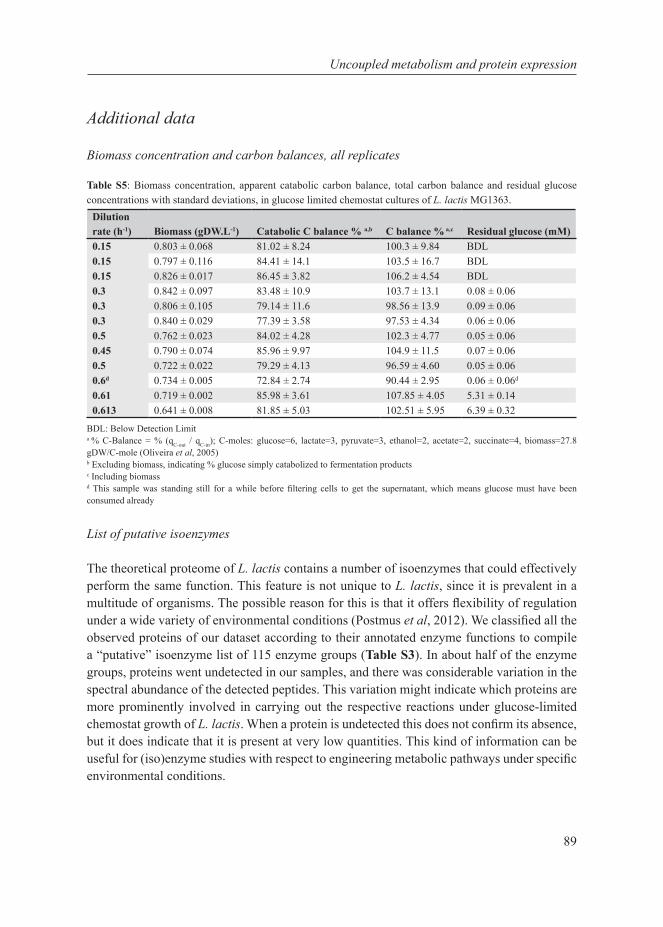
89
Uncoupled metabolism and protein expression
Additional data
Biomass concentration and carbon balances, all replicates
Table S5: Biomass concentration, apparent catabolic carbon balance, total carbon balance and residual glucose concentrations with standard deviations, in glucose limited chemostat cultures of L. lactis MG1363.
Dilution rate (h-1) Biomass (gDW.L-1) Catabolic C balance % a,b C balance % a,c Residual glucose (mM)0.15 0.803 ± 0.068 81.02 ± 8.24 100.3 ± 9.84 BDL0.15 0.797 ± 0.116 84.41 ± 14.1 103.5 ± 16.7 BDL0.15 0.826 ± 0.017 86.45 ± 3.82 106.2 ± 4.54 BDL0.3 0.842 ± 0.097 83.48 ± 10.9 103.7 ± 13.1 0.08 ± 0.060.3 0.806 ± 0.105 79.14 ± 11.6 98.56 ± 13.9 0.09 ± 0.060.3 0.840 ± 0.029 77.39 ± 3.58 97.53 ± 4.34 0.06 ± 0.060.5 0.762 ± 0.023 84.02 ± 4.28 102.3 ± 4.77 0.05 ± 0.060.45 0.790 ± 0.074 85.96 ± 9.97 104.9 ± 11.5 0.07 ± 0.060.5 0.722 ± 0.022 79.29 ± 4.13 96.59 ± 4.60 0.05 ± 0.060.6d 0.734 ± 0.005 72.84 ± 2.74 90.44 ± 2.95 0.06 ± 0.06d
0.61 0.719 ± 0.002 85.98 ± 3.61 107.85 ± 4.05 5.31 ± 0.140.613 0.641 ± 0.008 81.85 ± 5.03 102.51 ± 5.95 6.39 ± 0.32
BDL: Below Detection Limita % C-Balance = % (qC-out / qC-in); C-moles: glucose=6, lactate=3, pyruvate=3, ethanol=2, acetate=2, succinate=4, biomass=27.8 gDW/C-mole (Oliveira et al, 2005)b Excluding biomass, indicating % glucose simply catabolized to fermentation productsc Including biomassd This sample was standing still for a while before filtering cells to get the supernatant, which means glucose must have been consumed already
List of putative isoenzymes
The theoretical proteome of L. lactis contains a number of isoenzymes that could effectively perform the same function. This feature is not unique to L. lactis, since it is prevalent in a multitude of organisms. The possible reason for this is that it offers flexibility of regulation under a wide variety of environmental conditions (Postmus et al, 2012). We classified all the observed proteins of our dataset according to their annotated enzyme functions to compile a “putative” isoenzyme list of 115 enzyme groups (Table S3). In about half of the enzyme groups, proteins went undetected in our samples, and there was considerable variation in the spectral abundance of the detected peptides. This variation might indicate which proteins are more prominently involved in carrying out the respective reactions under glucose-limited chemostat growth of L. lactis. When a protein is undetected this does not confirm its absence, but it does indicate that it is present at very low quantities. This kind of information can be useful for (iso)enzyme studies with respect to engineering metabolic pathways under specific environmental conditions.

90
Chapter 4
ATP formation rates
We calculated the ATP formation rates according to the stoichiometries of substrate-level phosphorylation (VSLP) or via a genome-scale modelling approach (VGS) as described by Teusink et al (2006) using an existing genome-scale stoichiometric network model (Verouden et al, 2009 and updated by Flahaut et al, 2013). The genomic method takes contributions from amino acids into account, whereas the substrate-level phosphorylation method only considers ATP associated with lactate and acetate formation. When based on the latter method, the curve VSLP plateaus above D = 0.5 h-1 (Fig S5). Thus, at D = 0.6 h-1 cells grow faster but at the same rate of ATP formed per unit biomass, suggesting a higher yield on ATP. The curve VGS is steeper, indicating significant contributions of amino acid metabolism to overall energetics, but also levels off. Surprisingly, the maximal ATP needed for biomass formation rate increases but drops at the highest growth rate at 0.6 h-1.
Correlation between transcriptome and proteome
The correlation between the transcriptome and the proteome for all chemostat data pooled together was generally low, with r = 0.262 (Fig S8).
Figure S8: Correlation of transcripts with soluble proteome with (A) darkened ribosomal and metabolic genes, and (B) shaded according to the codon adaptation index (CAI) of the gene (Sharp & Li, 1987). Genes with high CAI usually are highly expressed. There is no clear relation between CAI and correlation.
0
5
10
15
20
25
30
35
40
45
0 0.1 0.2 0.3 0.4 0.5 0.6 0.7
q ATP
(mm
ol.g
DW-1
.h-1
)
Dilution rate (h-1)
Vtotal,GS Vtotal,SLP vATP
r=0.262
−2
0
2
−2 0 2
log2 protein ratio
log 2
mRN
A ra
tio Functionmetabolic
ribosomal
r=0.262
−2
0
2
−2 0 2 log2 protein ratio
lo
g 2 m
RN
A ra
tio
CAI0.3
0.4
0.5
0.6
0.7
0.8
Figure S7: Total ATP formation rates calculated by substrate-level phosphorylation (Vtotal, SLP), by the genome-scale stoichiometric network model (Vtotal, GS), and the maximum possible ATP production rate (vATP).
A B

91
Uncoupled metabolism and protein expression
For the CcpA regulon, a linear dependence was seen for all significantly altered transcripts and proteins (r = 0.536; Fig S9, Table S4). Similar results were obtained for several other pathways represented in the KEGG database, with the highest correlation coefficients being 0.61 for starch and sucrose metabolism and 0.56 for glycine, serine and threonine metabolism. All other pathways had lower linear dependencies or contained less than 10 genes (Table S4).
Figure S9: Correlations between mRNA and protein log2 ratios, per regulon with the (A) membrane proteome and (B) soluble proteome. NA is the class of genes that are not annotated in a regulon.
Regulation of transcript and protein as a function of growth rate
The average log2 ratios of protein, transcript and flux were calculated relative to the lowest growth rate. The data can be found in Tab1 of the excel file Table S8. Similar to the analysis done previously for yeast (Brauer et al, 2008), we fitted the protein and transcript ratio data for each gene to a single level, a straight line, or a parabola as a function of growth rate. The residuals of the fits were evaluated with an ANOVA (p-value ≤ 0.05), and the parameters of the least complicated model (with the least parameters) were reported in a table (Tab2, Table S8). The columns p0, p1, p2 give the zeroth, first and second order terms of the model fitted to the protein data. The columns t0, t1, and t2 give the zeroth, first and second order terms of the model fitted to the transcript data. The regulation curves with their respective fits are illustrated in Fig S10. Genes that fit in our experiments to the zeroth order are stable and unadaptive to growth rate, they are considered to be the core genes. While the genes that fit to the first order fit are linearly dependent on the growth rate and therefore described as adaptive to the growth rate. Finally, a group of genes fit to the second order of fit. This means that besides growth rate, the expression of these genes depends on more than one other factor.
●●●
●●
●●●
r=0.812
●●●●●●●●
●●●●●●●
●
r=0.318
●●●●●●●●●● ●●●●●●●●●●●●●●● ●●●●●●●●●●●●●●●●● ●●●●
●●●●●●●●●●
●
●●●●●●●●●●●●●●●●● ●● ●●●●●●●●●●
●●● ●●●●●●●●●●●●●●●● ●●
●●●●●●●●●●
●●● ●●
●
●●●●●●●●●●●●● ●●
●●●
●●●●●●●●●
●
●●●●●●●●
●
●
●●●●●● ●●●
●●
● ●●●●●
●
●●
●
●●●
●●●●●
●●●●●●●● ●●
●●●
●●●●●●
●
●●
●
●●
●
●●●
●●●●●●●●●● ●●●●●
●●●●●●
●
● ●
●
●●●
●●●
r=0.564
●
●
●●●●●●●●●●●●●●●●●●●●
●●●●●●
●●●●
●●
●
●●●
●●
●
● ●●●●●
● ●●● ●●
r=0.222
●●●●●●●●●● ●●●
r=0.28
●●●●●●●●●●●●
●
●●●●●●●●
●●●●●●●●●●●●●●●●●● ●●●●●●●●●
●●●
●●●●●●●●
●●
●●●
●●●●● ●●
●●●●●●●
●●●●●●●●
●●●●
●●●●●●●
●●●●●●
●
r=−0.105
●●●●●●●●●●●●●●●●
●
●●●●●●●●● ●●●●
●● ●●
●
●●●
●●●●
●● ●●●●
r=−0.09
●●●●●●●●●● ●●●
r=0.28
●●●●●●●●●●●●●● ●●
r=−0.523
●●●●●●● ●●●●●●● ●●●
●●●●
●●●●●●●
●●●
●●●●
●●●●●●● ●●●●●●●●●
●
●●●●
r=0.61
●●●●●●●●●●●
●●●
●●● ●●●●●●●
●
●●●●
●● ●●●
r=0.104
●●
●
●●●●●
●
●●●●●●●●●●●●●●●●●●●
●
●●●●●●●●
●
●●●●●●●
●
●
●
●●●●●
●
●● ●
●●●●●●●●
●● ●●● ●
●● ●
r=0.306
●
●
●●●●●●●●●●●●
●●
r=−0.34
●●●
●●●●●
r=0.74
●●●●●●●●
r=−0.297
●●●●●●●●●●●●●●●●●●●●●●●●●●●●●●●
●●●●● ●●●●●● ●●●
●●●●●●●● ●●●●●●● ●
●●●●●
●●●●●
● ●●●●
●●●●●●●
●●●●
●
●●●
●●●●●●●
●●●● ●●● ●
●●●●● ●●●●●●●●●
r=0.244
●●●●●
●●●●●●●●●●●●●●
●●●●●●●●●●●●●●
●●●●●●●●●● ●●●● ●●●●●●●
●●
r=−0.013
●●●●●●●●●●●●●●●●●●●●●●●●
●●●●●●●●●●●
●●●●●●●●●●● ●
●●●●●●●●
●●●
●
●
●●●●●●●●●●
●●
●●●●●●●●●●
●●
●●●●
●●●●●●
●●
r=0.364
●●●●●●●● ●●
●●●
r=−0.162
●●●●●●●●●
●●●●●●●●●●●●●●●●●●●●●●●●●●●●
●●●●●●
●●●●●●●●●●●
●●●●●●●●●●●●●●●●●●●●●●●●●●●●●●●●●●●●●●●●●● ●●●●●●●●●●●●
●
●●●●
●●●●●● ●●●●●●●●●●●●●●●●●
●●●●●
●●●●●●●● ●●●●●●●●
●●●●●●●●
●●●●●●●●●●●●●●
●●●
●●●●●●●●●●●●●●●
●●●●●●●●●●●●●●●●●●●●●●●●
●●●●●●●●●●●●●●
●●●●
●●●●●●●●●
●●●●●●●●●●
●●●●●●●●●●●●●●●●●●●
●●●●●●●●●●●●● ●●●●●●●●●●●●● ●●●●●●●●●●●●●●●
●●●●●●●●●●●●●●●●●●●●●●●●●●●●●
●
●●●●●●●●●●●● ●●●●●●●●●●●●●
●●●●●●●●●●●●●●
●
●●●
●●●●●●●● ●
●●●●●●●●●●●●●
●
●●●● ●●●●●●●●●●●●●●●●●●●●●●●●●
●●●●●●●●●●●●●●●●●●●
●●●
●●●●●●●●●●●●●●●●●●●●●●●●●●●●●●●
● ●●●●●●●●●●●●●●●●●●●●●●●●●●●●● ●●●●●●●●●●●●●●●●●●●●●●●●●●●●●●●●●●●●●
●●●●●●●●●●●●
●●●●●●●● ●●●●● ●●
●●●●●●●●●●●●●●●●● ●●●●●●●●●●●●●●●●●●●●● ●●●●●
●●●●●●●●●●●●●●●●●●●●
●●●●●●●●●●●●●●●●●●●●●●●●●●●●●●
●●●●●●●●●●●●●●● ●●●●●●
●●●●●●●●●●● ●●●●●●●●●●●●
●●●●●●●●●●●●●●●●●●●●●●●●●
●●●●●●●●
●●●
●●●●●●●●●●●●●●
●●●●●●●●●●●●●●●●●●●●●●●●●●●●●●●
●●●●●●●●●●●●●●●●●●●●●●●●●●●●●●●●●●●●●●●●●●●
●●●
●
●●●●
●●
●●●●●●●●●●●●●
●
●●●●●● ●●●●●●●●●●●●●●
●●●●●●●●●●●●●●●●●●●●●●●●●●●●●●●●●●●●●●●●●●●●●●●●●●●●●●●●●●
●●●●●●●●●●●●●●●●●●●●●●●
●●●●●●●●●●●●●●●●●●●●●●●●●●●●●●●●●●●●●●●●●●●●● ●●
●●●●●●●●●●●●●●●
●●●●●●●●●●●●●●●●●●●●●●●●●●●●●●●●●●
●●●●●●●●●●●●●●●●●●●●●●●●●●●●●●●●●●●●
●●●●●●●●●●●●●●●●●●●●●●●●●●●●●●●●●●●●●●●●●●●●●●●●●●●●●●●●●●●●●●●●●●●●●●●●●●●●●●●●●●●●●●●●●●●●●●●●●●●●●●●●●●●●●●●●●●●●●●●●●●●●●●●●●●
●●●●●●●●●●●●●●●●●●●●●●●●●●●●●●●●●●●●●●●●●●●●●●●●●●●●●●●●●●●●●●● ●●●●●●●●●●●●●●●●●●●●
●●●●●●●●●●●●●●●●●●●●●●●●●●●●●●●●●●●●●●●●
●
●●●●●●●●●●●●●●●●●●●●●●●●●●●●●●●●●●●●
●
●●
●●●●●●●●●●●●●●●●●●●●●
●●●● ●●●●●●●●●●●●●●●●●●●●●●●●●●●●●●●●● ●●●●● ●●●
● ●●●●●
●●●●●●●
●●●●●●●●●●●●●● ●●●●●●●●●●●●●●●●●●●●●●●●●●●●●● ●●●●●●●●●●●
●●●●●●●●●●● ●●
● ●●●
●●●●●●
●●●● ●●●●●●●●●●
●
●●●●
●●
●●● ●● ●●●●●●●●●
●●●●
●● ●●●●●●●●●●●●●●●●●●● ●●●●●● ●●●●
●●●
●
●
●●●●●●●●●●●●
●●
●●●
●●●●
●●●●●
●●●● ●●●●●●●●
●●
●●●●● ●●●●●●●●●
●● ●●●●
●●●●
●●●●●●●●●●●●●●●●●●●●●●●●●●●●●●●
●●●●●●●●●● ●●●●●●●●●●●●●●●
●●●●●●● ●●●● ●●●●●●●●●●●
●●●●●●●●●●●●●●●●●●●● ●●●●●●●●●●●●●●●●●●●●
●●●●●●●●
●●
●
●●●●●●●●●●●●●●● ●●●●●●●●●●●●●●●●●●●●●●●●●●●●●●●●●●●●
●●● ●●●●●●●●●●●●●●●●●
●●
●
●●●●●●●●●●●●●●●●●●●●●●●●●●●●●●
●● ●●●●● ●●
●●●●●●●●●●●●●●●●
●●●● ●● ●●
●●●●●●●
●●●●●●●●●●●●●●●●●●
● ●●●●●●●●●
●●●●●●●●●●●●●●●●●●●● ●●●●● ●●●●●●●●●●●●
●●●● ●●●●●●●●●
●●●●●● ●●●●●●●●●●●● ●●●●●●●●●●
●●
●●●●●●●●●●
●●●
●●●●●●
●●●●●●●●●●●●●●●●● ●
●
●●●●
●●●●●●●●●●●●●
●●●●●●●●●●●●●●●●●●● ●
●●●●●
●●●●●●●●●
●●●●●●●●●●●
●●●● ●●●●●●●●●●●●●●●●●●●●●●●
●●●●●●●●●
●●●●●● ●●●●●●●●●●●●
●
●
●●●
●●●●●● ●●●●●●●●●
●●●●●●●●●●●●●
●●
●●●●●
●●●●●●●●
●
●●●
●
●●●●
●●●●●●●●●●●●●●●●●●●●● ●●●●●●●●
●●
●●●●●●●● ●●●●●●●
●●●●●●●●●●●●●●
●
●●●●●
●●●●● ●
● ●●●●●●●● ●●●●●●
●●●●● ●●●●●●
●●●●●●●● ●●●●●●●●●●●●●●●
● ●●●●●●●●●●
●●
●●●
● ●●●●●●●●●●●●●● ●●●● ●●●●●●●●●●●●
●●●●●●●●●●●●●●
●
●●●●●●● ●●●●●●●
●●●
●●●●
●●
●●●●●●●●●●●●●●●●●
●
●●
●●●●●●●●●
●●●
●●●●●●●●●●●●●●
●● ●●●●
●●●●●
●●●●●●●●●●●● ●●●●● ●
●●●●●●●●●●●●●●●
●●●●
●●●●●●●●●●●●●●
●●●●●●●●●●●●●●●●
●●●
●●●● ●●●●●●●●●●● ●●
●●●
●●●
●●●●●●●●●●●●●●●●
●●●●● ●●●●●●●●●
●●●●●● ●●●●●●●●●●●●●●●●
●●
●●●●●●●● ●●●●● ●
●●●●●●●●●●●●●●
●●●●●●●●
●●●●●●●●●●●●●●●●●●●●●●●●●●●●●
●●●●●●●●●●●●●
●●●●●●●●●● ●●●●●●●●●●●●
●●●●●●●●●
● ●●●●●●●●●●●●●
●●●●●●●●●●●●●●●●●
●● ●
●
●●●
●●●
●●
●●●●
●●●
●●●●●●●●●●●●●●●●●●
●●
●●●●●●●●●●●●●
●●●●●●
●●●●●●●●●●●●●●●●●●●●●●●●
●
●●●●●●●●
●●●●●●
●●●● ●●●
●●●●●●
●
●●●●
●●
●●● ●●
●●●●●●●●●
●
●●
●●●
●●●●●●●●●●●●●●
●●●●●●●●●●●
●●●●● ●●●●●●●●●●● ●●●●●
●●
●●●●● ●●●
●●●●
●●
●
●
●●●●●
●●
●
● ●●
●●●●
●●●●
●
●● ●●●●● ●●●
●●●●●●● ●●●●
●●●●●●●●●●●●●●●●●●
●●● ●●●●
●
●●●
●●●●● ● ●●
●●●●
●●●●●●●● ●●
● ●●●●
●●●●●●●●
●●●●●●●●●●●●●●●
●●●●●●
●●●●●●
●●●
● ●●●● ●●●●
●●●
●●●●●●
●●●●
●● ●●
●●
●
●●●●●●●●
●●●●●
●● ●●●●●●●●
●●●
●●
●●
●●●●●●●
●●●●●●●●●●●● ●●
●●● ●●●●●●●●●●●●●●●●●
●● ●
●●●●●●●●●●●●●●●●●●●●●●
●●●● ●●●●●
●●
●●●
●●●●
●●●●●●
●●●●●●●●●
●●●●●●
●●●●●●●●●●●
●●●●●●●●●●●●●●●●
● ●●●●
●●●●●
●●●
●●●●●●●●●●●●●●●●●
●●●●●
●●●●●●●
●
●●●
●
●●●● ●
● ●●●●●●
●●●
●●●●
●●●●●●●●●●●●●●●●●●●●●●●●
●
●●●●●●●●●●●●●●●●●●● ●●●●●●●●●●
●●●
●●● ●
●
●●
●●●
●●
●●●●●●●●●●
●●●
●●●●●●●●●●●
●●●●●
●
●●●
●
●●●●
●
●●●●●
●
●●
●●●●●●●●●●●● ●●●
●●●●●●●●●●●●●●●●●●●●●●● ●●●●●●● ●●●●●●●●●●●●
●● ●●●●●●
●●
●●●
●
●●
●
●●●●
●●● ●●●●
●●●●●●
●●●●●●●●
●
●
●
● ●● ●
●
●●●●●●● ●●
●
●●● ●●●●
●●●●
●●●●●●●●●●●●●● ●●●●●
●●
●●
●●● ●●
●●●●●●
●
●●
●●
●●●
●
●●
●
●
●●●●●●
●
●●●●●
●
●●●● ●●●●●●●●●
●
●●● ●●●●●●●●●●●●●●●●●●●●●●●
●●
●●
●
●●
● ●●
●●●●
● ●●●●●●●●
●
● ●
●●●●●● ●●●●●● ●
●●●●●●●●●●●●●
●●●●●●●●
●●●●●●
● ●
●
●● ●●●●● ●●● ●●●●●
●●●
●●●●
●
● ●●●●
●
●
●●●●
●
●●●
●●●●●●
●
●●●
●●●
●●
●
●
●●●●
●
●●●●●●
●●
●●●●●
●
●●
●●●●●●●●●●●●●●●●●●●●●
●
●●●●●●●●●●●●
●
●●●
●●●●●●●
●●●●●●
●
●
●●●●●
●
●
●●●●●●
●●●
●●●
●
●●●● ●●●●●●●●●●●●●●
●●●●●●●●
●● ●●● ●●●●●●●●●●
●●●
●●●●●●●
●●
●●
●●
●●●
●● ●●● ●
●●●●●
●●
●●●●●
●●●
●●●●●●●
●●●
●●●●●●●●
●● ●●●
●●●●●●●●●
●
●
●●●●●●●●●●
●●
●●●●●●●●● ●
●●●●●●●●
● ●●●●●
●
●
●●● ●●●
●●
●
●●●●●
● ●●
●●●● ●●●●
●●
●
●●●●●●●●●●●●●●●
●
●●●●●●●●●●●●●
●
●●● ●●●
●
●●●
●
●●●
●
●●●
●
●
●
● ●●●●●●●●●●●● ●●
●●
●●●●●●●●●●●●●●
●●● ●●●●●● ●
●●●●●● ●●●●●●●●●●●●●● ●●●●
●●●●
●●●
●
●●
●●
●●●
●●● ●●●●
●●●
●●
●● ●● ●●●●●●●●● ●● ●
●●●●●● ●●●●
●
●●● ●●●●
●●●●
●
●●●●●●●●●●●●● ●●●●
●
●●●●
●●● ●●● ●●
●●●
●
●●●●
●●●
●
●● ●●
●●●●●●
●
●●●●●●●●●●
●●●●
●●●●●
●●●●
●●●●●●●●●●●●●●●
●
●●●●●
●
●●●
●●
●●●
● ●●●●●●● ●●●●●●● ●
●
●●
●●●
●●●●
●●●●
●●●
●●●●●●●●●●●●●●●●●●●● ●●●●● ●●●
●
●● ●●●●●●●● ●
●●
●●
●●●
●●●●
●
●●●●●● ●●●●
●
●
● ●
●
●●●●●
●
●
●
●●
●●●
●●
●●●●●
●
●
●●●●●●
●
●● ●●●●
●●●●●●●●●●●●●● ●●●●●●●●●
●●
●●●●● ●●●● ●●●●●●●●●●●●●●●●●●●●
●
●
●●●●● ●●●●●●●●
●
●●●●●
●
●●●● ●● ●●●
●●●●●●●●
●●●●●●●●●●● ●●● ●
●●●●●● ●●●
●●●
●●●●● ●●
●●
●●
●●●●●
●● ●●● ●●●●●●
●
●●●●
●●
●●●●●●
●●●●●
●
●●●●●●●
●●●●●●
●●
●●●●●●●●
●
●
●●●●●●●●●
●
●●●●●●●
●
●●●
●●●●● ●●●●●●
●●●●
●
●
●●● ●
●●●●●
●
●●●●●
●
●
●●
●● ●●●● ●● ●●
●●●●●●●●●●●●●●
●
●●●●●●●●●●●●●●
●●●●●
●
●
●●
●
●●●
●
●
●●●
●●
●
● ●●●●●●●●●●●●●●
●●
●●●●●●●●●●●●●●●●● ● ●● ●● ●●
●●●●●● ●●●●●●●●●●●●●
●● ●●● ●●●●●●●●
● ●●●
●●●●●● ●●●●
●●●
●●
●● ●●●●●●●●●●
● ●●●
●●●●●● ●
●●●
●
●●●● ●● ●● ●●●
●
●●● ●●●●●●●●●● ●●●● ●
●●
●●
●●●●●● ●● ●●
●
●
●
●●●
●●●
●
●●●●
● ●●●●●●
●●●● ●●●●●●●●●●
●● ●●●
●
●●● ●● ●●●●● ●●●●●●●●●
●●●●
●
●●●
●●●
●●●●
●●●●
●●●●●●●● ●
●●●
●●●●●●
●●●● ●
● ●●●●●●●●●●●●●● ●●● ●●●●●●●● ● ●
●●
●
●● ●●●●● ●
●● ●●●●●
●●●
●● ●●
●
●●●●●●● ● ●●
●
●
● ●●
●●●●●●
●●
●●
●●●●
●
●
●●●●
●●
●●●●● ●●●
● ●●
●
●●
●●● ●●●● ●●●
●● ●●●●●●●●●
●
●
●●● ●●● ●●● ●●● ●
●●●●●●●●
●●●●● ●●
●
●● ●●
●●●●●●
●●●●
●●●
●●
●
●
●●●● ●● ●●●●●●●●●
●● ●●●●●●● ●●●●● ●● ●●●●
●●●●●
●
●●●
●●●●● ●●
●●
●●●●●●●
●●
●●●● ●●●● ●
●
●●●
●
●●
●●●
●●●
●●
●●● ●
●●●●●●●●●●
●●●●●●●●●●●●
●●
●
●●●●●●●●●●
●●●●●●● ●●
●● ●● ●●● ●●●●● ●● ●●
●
●
●
●●
●●●
●●●●
●●●●●
●
●●
●●
● ●●●●●
●●
●●
●●●
●●●
r=0.234
AhrC BusR CcpA CesR CmbR
CodY CtsR FhuR FruR GlnR
HrcA LlrD LmrR MalR PadR
PurR PyrR RmaG ZitR NA
−2
0
2
−2
0
2
−2
0
2
−2
0
2
−2 0 2 4 −2 0 2 4 −2 0 2 4 −2 0 2 4 −2 0 2 4
log 2
mR
NA
ratio
log 2
mR
NA
ratio
●●●●●●●●●●●●●●●●●●●
●
●●●●●
●●●●●●●●●● ●●●●●
r=0.464
●●●●●●● ●●●
●●●●●●●●●●●●●●●●●●●●●●●●●●●●●●●●●●●●●●
● ●●●●●●●●●●●
●
●●●●●●●●●●●●●●●●
●●●●●●●●●●
●●●●●●●●●●●●●●
●●●●●●●●●●●●●●●
●●●●●●● ●●●
●●●●●●●●●●●● ●●●●●●
●
●●●●●●●●●
●
●●●●●●● ●●● ●●●
●●●●●●
●●
●
●●●●●●●●●●
●●●●●●
●●
●●●●●● ●
●●
●●
●●●●●●
●●
●
●●
●●●●●
●●●●●●●●●●●●●●●● ●
●
●●●
●●●●●●●●
●
●●
●●●●●
●●●
●●●●●●●●●●●●●●●●
●●●●●●●●
●
●●●●●●●
●●●
●●●●●●
r=0.536●
●●●●
●●●●●●●●
●●
●●●●
●
●●●●
●
●●●●
●
● ●●●●● ●●●●
r=0.25
●●●●●
r=−0.226
●●●●●●●●●●●●●●●●●●●●●●
●●●●●●●●●
●●●●●●●●●●●●●●●●●●●●●●●●
●●●●●●●●●●●●
●●●●●●●●●●●●●●●●●●●●●●●●●●●
●● ●●●●●●●
●●●●●●●●●●●●●●
●●●●●●●●●
●●●●
●●●●●
●●●●
●●●●●●●●●
●
●●●●●●●●
●●●●●●● ●●●●●●●●●●●●
●●●
●●●●●●
●
r=0.349
●●●●●●●●●●●●●
●
●●●●● ●●●●●●
●●●
●
●● ●
●●●
●●●●●
r=0.081
●●●●●●●●
●●
r=−0.178
●●●●●●●●●●●●●
●●●●●●●●●●●●
●●●●
●●●●●●●●●●●● ●●
●●●●
●
r=0.233
●●●●●●●●●●●
●●●●●●● ●●●●● ●●
●●●●●●●●●●●●●
●●
r=0.326●
●●●●●
●●●●●●●●●
●●●●
●● ●●●
●●●●
●
●
●●●●
●
●●●●●●●●●●
r=0.34
●●●●●
●●●
r=0.877
●●●●●●●●
r=−0.543
●●●●●●●●●●●●●●●●●●●●
●● ●●
●●●●●●●●●●●●●●●●●●●●●
●●●●●●●●●●●●●●●●●●●
●●●●●●●● ●●●●●● ●●
●●●●●●●●●●●●
●●●● ●
●●●●●●●●●●●●
●●●●●●●●●●● ●
●●●●●●●●●●●●●●
●●●●●
●●● ●
●●●●●●●●●●●●
●●
●●●●●●●● ●
●●●●●●●●●●●●●●●●●● ●●●
r=0.044
●●●●●●●●●●●●●●
●●●●●●●●●●●
●●●●●●●●●●●●●●●●●●
●●●●●●●●●●●●●●●●
●
●●●● ●●●●●●●●
r=0.101
●●●●●●●●●●●●
●●●●●● ●●●●●●●●●●●●●●●●●●●●●●
●●●●●●●●●●●●●●●
●●●●●●●●
●●●
●●
●
●●●●●●●●
●●●
●●
● ●●●●●●●●●●
●●●●●●●●●●●●●
●●
●
r=0.33
●●●●●●●●
r=0.39
●●●●●●●●●
●●●●●●●●●●●●●●●●●●●●●
●●●● ●●●●●●●●●●●●●●●●●●●●●●●●●●●●●●●●●●●●●●●●●●●●●●●●●●●●●●
●
●●●●●●●●●●●●●●●●●●●●●●●●●
●●●
● ●●●●●●●●●
●●●●●●●●●●●●●●●●●●●●●●●●●●●●●●●●●●●●●●●●●●●●●●●●●●●●
●●●●●
● ●●●●●
●●●●●●●●●●●●●●●●●●●●●●●●●●●●●●●●●●●●●●●●●●●●●●●●●●●●●●●●●●●●●●●●●●●●●●●●●●●●●●●●●●●●●●●●●●●●●●●●●●●●●●●●●●●●
●●●●●●
●●●●●
●●●●●●●●●●●
●●●●●●●●●●●●●●●●●● ●●●●●●●●●●●●●●
●
●●●●●●●●●●●●●●●●●●●●●●●●●●●●●●●●●
●●●●●●●●●●●●●●●●●●●●●●●●●●
●●●●●●●●●●●●●●●●●●
●●●●●●●●●●●●●●●●●●●●●●●●●●●●●●●●●●●●●●●●●●●●●●●●●● ●●●●●●●● ●●●●●●●●●●●● ●●●●●●●●●●●●●●●●●●●●●●●●●●●●●●●●●●●●●●●●●●●●●
●●●
●●●●●●●
●●●●●●●●●●●●●●●●●●●●●
●●●●●
●●●●●●●●●●●●●
●
●●●●●●●●●●●●●●●●●●
●●●
● ●●●●●●●●●●●●●●●●●●●●●●●●●●●●●●
●●●●●●●●●●
●●●●●●●●●●●●●●●●●●●●●●●●●●●●●●●●
●●●●●●●●●●●●●●●●●●●●●●●●●●●●●●●●●●●●●●●●●●●●●●●● ●●●●●●●●●●●●●●●●●●●●●●●
●●
●●●●●●●●●●●●●
●●●●●●●●●●●●●●●●●●●●●●●●●●●●●●●●●●●●●●●●●●●●●●●●●●●●●●●●●●●●●●●
●●●●●●●●●●●●●●●●●●●●●●●●●●●●●●●●●●●●●●●●●●●●●●●●●●●●
● ●●●●●●●●●●●●●●●●●●●●●●●●●●●●●●●●●●●●●●●●●●●●●●●●●●●●●●●
●●●●●●●●●●●●●●●●●●●●●●●●●●●●●●●●●●●●●●●●●●●●●●●●●●●●●●●●●●●●●●●●●●●●●●●●●●●●●●●●●●●●●●●
●●●●●●●●●●●●●●●
●●●●●●●●●●●
●●●●●●●●●●●●●●●●●●●●●●●●●●●●●●●●●●●●●●●●●●●●●●●●●●●●●●●●●●●●●●●●●●●●
●●●●●●●●●●●●●●●●●●●●●●
●●●●●●●●●●●●●●
●
●●●●●●●●●●●●●●●●●●●●●●●●●●●●●
●●●●●●●●●
●
●●●●●●●
●●●●●●●●●●●
●●●●●● ●●●●●●●●●●●●●●●●●●●●●●
●●● ●
●●●●●●
● ●●●●●●●●●●●●●●●●●
●●●●●●●●●●●●●●●●●●●●●●●●●●●●●●●●●●●●●●●●●●●●●●●●●●●●
●●●●●●●
●●●●●●●●●●●●●●●●●●●●●●●●●●●●●● ●●●●●●●●●●●●●●●●●●●●●●●●●
●●●●●●●●●●●●
●●
●●●●●●●●●●●●●
●●●●●●●●●●●●●●●●●●●●●●
●
●●●●●●●●●●●
●●
●●●●●●
●●●
●●●●●●●●●
●●●
●●●●●
●●
●●●●●●●●●●●●●●●●●●●●●●●●●●●●●●●●●●●● ●●●●●●●●●●●●●●●●●●●●●●●●●●●
●●●●●●●●●●●●●●●●●●●●●●●
●●●●●●● ●●●●●●●●●●
●●●●●●●●● ●●●●●●●●●●●●●●●●●
●●●●●●●●●●●●●●●●●●●●●●●●●
●●
●
●●●●●●●●● ●●●●●●●●●●●●●●●●●●●●●●●●●●●●●●●●●●●●●●●●
●●●●●●●●
●●●
●●●●●●●●●●●●●●●●●●●
●●●●●
●●●●●●●●●●
●●●●●●●●●●●●●●●●●●●●●●●●●●●
●●●●● ●●●●●●●●●●●●●●●●●●●●●●●●●●●
●●●●●●●
●●●
●●●●●●●●●●●●●●●●●●●●● ●●●
●●●●●
●●●●●●●●●
●●●●●●●●●
●●●
●●●●●●●●●●●●●●●●●●●●●●●●●●●
●
●●●●
●● ●●
●●●●
●●●●●●●●●●●●●●● ●
●
●●●●●●●●●●
●●●●●●●●● ●●●●●●●●●
●●●●●●●●●●●●●● ●●●●
●●●
●
●●●
●●●●●●●●
●●●●●●●●●●●●
●●●●●●●●●●●●●●●●●●●●●
●●●●●●●●●●●●●
●●●●●
●●●●●
●●●●●●● ●●●●●●
●●
● ●●
● ●●●●●●●●
●
●●●●●●●●●●●●●●●●●●●●●●●●●●●●●● ●●●●●●
●●●●●●●●●●●●●●
●●●●● ●●●●●●●
●●● ●●●●
●● ●●●●●●●●●●● ●●●●●● ●●
●●●●●●●●●●●●●●●●●●●●●●●
●●●●●●●●●●●●●●●●●●●●●●●●●●●●●
●●●●●●●●● ●●●●●●●
●●●● ●
●●
●●●●●●●●
●
●●●●
●●●●●●●●●●
●●●●●●●●●●●●●●●●●●●●
●●●●●●●●●●●●●
●●●●●●●●●●●
●●●●●●●●●●●●●●●●●●●●●
●●●●●●
●●●●●●●●●●●●●●●●
●●●●●●
●●●● ●●●●●●●●●●●●●●●●●●●● ●●●●●●●●●●
●●●●●●●●●●●●●
●●
●●●●●●●●●●●●●●●● ●●● ●●●●●
●●●●●●●●●●●● ●●
●●●●●●●●●●●●●●●●●●●●●●●●●●●●●●●●●● ●●
●●●●●●
● ●●●●
●●●●●●
●●●●●●●
● ●●●●●
●●● ●●●●●●●●● ●●●●
●●●●●●●●●●
●●● ●●●●●●●●● ●●●●●●●
●
●●●
●●●●●●● ●
●●●●
●●
●
●●● ●●●●
●●●●●● ●●●●●●●●●●
●●●●●●●●●●●●●●●●●●●●
●
●
●●●
●●●
●●●●
●●●●●●●●●●●●●
●
●●●●●●●●●●●●●●●●●●
● ●●●●●●●●●●●●●●
●●●●●●●●●●
●●●●●●●
●●●●●●
●●
●●●
●●●●●●●●●
●
●● ●●●●●●●
●●●●●●●●●●●●●●●●●●●●● ●●●●
●●
●●●●●●●●●●●●●●
●●●●●●●●●●●●
●●●
●●●●●
●
●●●●●●●●●●●
●●●●●●●●●●●●●●
●●●●●●●●●●●●●●●●●
●● ●
●●●●
●●●●●●●●●●●●●
●●●●●●●●●●●●●●●●●●
●●●●●
●●●●●●
●●●
●●
●●●
●● ●
●●●●●●●
●●●●●●●
●●●●
●●
●●●●●●●●●●●●●●●●●●●●●●●●●
●●●
●●●●●●●●●●●●●●●●●●●●●●●●●●● ●●●●●
●●●●
●●●●●●●●●●●●●●●●●●●●●●
●●
●●●● ●●●●●●●●●●●
●●●●●●●●
●●●●●●●●●●●●
●●●●●●
●●●●●●●●●●●●●●●●●●●
●●●●●●●
●
●●
●
●●●●●●●●●●●●●●●●●●●●●●●●●●●●●●●
●
●●●●●●●●●●●●●●●●●●●●●●●●●●●
●
●
●●●
●●●●●
●
●
●●●●●●
●
●●●●●●●●
●●
●●●●
●●●●●●●●●●●●●●●●●
●●●●●
●●●●
●●● ●
●●●●●●
●●●●●
●●●●●
●
●
●
●●●
●●
●
●●
●●●●●●
●●●●●
●●●●●●●●●●
●●●
●●●●●●●●●●●
●●●●●
●
●
●●
●
●●
●
●●●●●●●●
●●●●●●●●●●
●●●●●●●●●●●●●
●●●● ●●●●●●●●●●●●
●●●
●
●●
●●●
●
●
●
●●●●●
●●●
●●●●
●
●●●●●●●
●
●
●
●●●●●●●
●●●●
● ●●●●●●●●●●●●●● ●●●●●
●●
●●●●●●
●●●●●●
●
●
●●
●●●●●
●
●●● ●
●●●●
●
●●●●●●●●●●●● ●●● ●●●●●●●●●●●●●●●●
●●●●●
●●
●●
●●
●
●●●●
●●●●●●●
●●●●●●●●● ●●●●●●
●●●●●●●●●●●●●●
●●●
●
●
●●
●●●
●
●●●
●●●
●
●●●
●●●●
●
●●●●●●
●●●
●●
●
●
●●
●
●●●●●
●●●●●●●●●●●●●●
●
●●●●●
●●●●●
●●●
●●●●●●●●●●●●● ●●●●●●
●
●●●
●●●●●●●●
●
●●●●●●
●
●●●●●
●●
●●●●●●●●●●●●
●●●
● ●●●●
●
●●●● ●●●●●●●
●●●
●●●●●●●
●●
●●
●●
●●●●●●●●●●●●
●●●●●●●●
●●●●●●●●●●●●●●
●●
●●●●●●●●●●
●
●
●●●●●●●●●
●●
●●●●●●●●●●●●● ●●●
●
●
●
●●●●●●
●
●●●●
● ●●
●● ●
●●●
●●●
●
●●
●
●●●●●●●●●●●●
●
●●●●
●●●●● ●
●●
●●●●
●
●● ●●●●●●
●
●●●
●
●
●
●
●●●●●●●●●●●●●● ●●●●●●●●●
●
●●●●●●●●●●●●●●
●●●●●
●
●
●●●
●●
●
●● ●●
●
●●●
●●●●●●●●●
●
●●●●●●●●●●●●● ●●●●
●●●●● ●●●●●●●
●●●●●●
●●●
●
●
●●
●●●● ●●
●
●●●●
●● ●●●●●●● ●●
●●●
●
●●
●
●● ●●
● ●●●●●●●●●●●●●● ●●●●●
●●●●
●●●●●●●●●
●
●
●●●
●●●●●
●
●●● ●●
●●●
●
●●●●●●●●●●●
●●●●●●●●●●●
●
●●●● ●●●●●
●●●
●
●●
●●
●● ●
●●●●●●●●●●●
●
●●●●●●●
●●● ●●●●●●●●●●●●●●
●●●●●●●●
●
●●●
●●●
●●●
●●●
●
●●●●●
●●●
●●●●●●
●●●
●●
●●●●
●
●●●●●
●● ●●●●●●●●●●●
●●
●●●●●●●● ●
●●●●●●●●●●●●●●●●● ●●●●●●
●
●●●
●●●●●●●●●●●
●●●●
●
●●●●●
●●
●
●● ●●●
●●●●●●●●
●●●●●●
● ●●●● ●●●●●●●
●●●
●●●●●●●
●●
●●
●●●●● ●●●●●●●●● ●
●
●●●●●●
●●●●●●●●●●●● ●●
●●
●●
●●●●●●●●
●
●
●●●●●●●●● ●●●●●●●●
●●●●●●●●●●●
●
●
●●●●●●
●
●
●●●● ●●
●●●●●● ●
●●
●
●●●
●●●●●●●●●●●●● ●●
●●
●●●
●●●
●●●●●●
●●●
●●●●●●
●
●●●
●●
●
●
●●
●●●●●●●●
●●
●●●●●●●●●●●●
●●●●●●●●●●●●●
●●●●
●
●
●●
●
●●
●
●●●●
●●●●
●●●●●●●●●
●
●●●●●● ●●●●●●
●●●●● ●● ●●● ●●●●●●●
●●●●●●
●●●●
●●●
●●● ●●●●●
●●
●●● ●●●●●
●●● ●●●● ●●
●
●●●●
● ●●●●●●●●●●●●●● ●●●●●●●
●●
●●●●●●●
●
●
●●●
●●●
●●
●
●●●●●
● ●●●
●●●●● ●●●
●●●● ●●● ●●●●●●●●
●●●●●●●●●●●●
●
●●
●●●
●●●●●
●●●●●●●
●●●●●●●●
● ●● ●●●●●●●●●● ●●●●●●●●● ●●
●
●
●●●●●
●
●●●
●●●
●
●●●●●
●●●
●●●●●●
●●●●
●
●
●●●●
●●●●●
●●
●●●●●●●●●
●
●
●
●●●●●●●●●●●●●●●●●●●●●●●●●●●●
● ●●●
●
●●●●●●●●●●●●●
●●● ●
●●●●
●
●
●
●
●● ●●●●●●●●●●● ●
●●●●●●●●●●
●●●
●●●
●●●
●●●●●●●
●●
●●●●●●
●●●●●●●●●● ●
●
●●
●
●●●
●●●●●
● ●●●●●●● ●
●●
●●●●●●●●●
●●
●
●●●●●●●●● ●●●●●●●●●
●●●●●●●
●●
●
●
●
●●●
● ●●
●
●●●●
● ●●
●●●
●●●●
●●
●
●●●
●● ●●●●●●●●●●
●
●● ●●●●
●
●●●
●●
●●●●
●●● ●●●
●
●●●
●●
●
●
●●●●●●
●
●●●
r=0.333
AhrC CcpA CesR CmbR CodY
CtsR FhuR GlnR HrcA LlrD
MalR PadR PurR PyrR RmaG
ZitR NA
−2
0
2
−2
0
2
−2
0
2
−2
0
2
−2 0 2 −2 0 2
log2 protein ratio log2
protein ratio
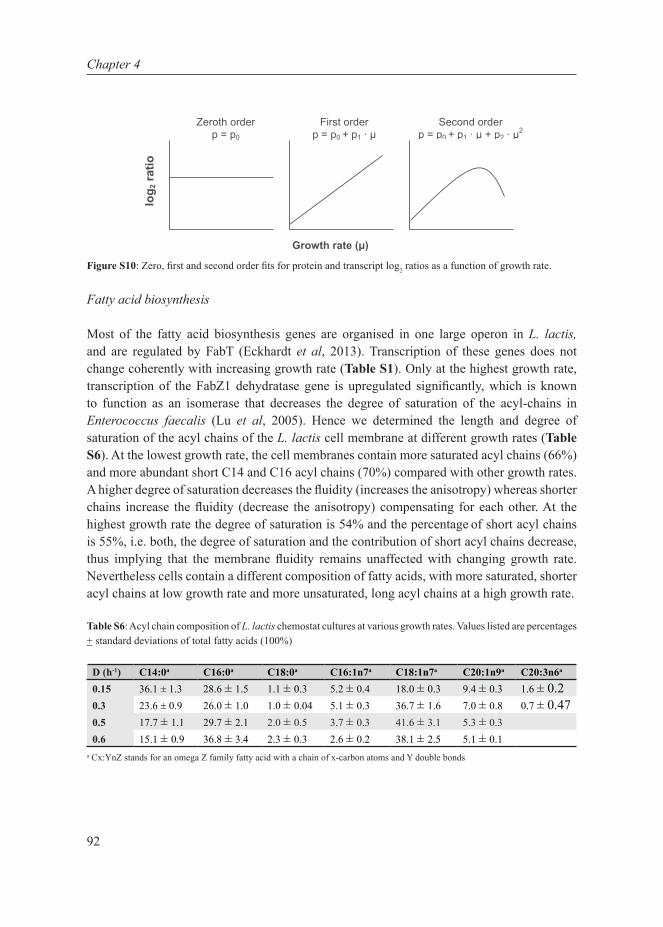
92
Chapter 4
Figure S10: Zero, first and second order fits for protein and transcript log2 ratios as a function of growth rate.
Fatty acid biosynthesis
Most of the fatty acid biosynthesis genes are organised in one large operon in L. lactis, and are regulated by FabT (Eckhardt et al, 2013). Transcription of these genes does not change coherently with increasing growth rate (Table S1). Only at the highest growth rate, transcription of the FabZ1 dehydratase gene is upregulated significantly, which is known to function as an isomerase that decreases the degree of saturation of the acyl-chains in Enterococcus faecalis (Lu et al, 2005). Hence we determined the length and degree of saturation of the acyl chains of the L. lactis cell membrane at different growth rates (Table S6). At the lowest growth rate, the cell membranes contain more saturated acyl chains (66%) and more abundant short C14 and C16 acyl chains (70%) compared with other growth rates. A higher degree of saturation decreases the fluidity (increases the anisotropy) whereas shorter chains increase the fluidity (decrease the anisotropy) compensating for each other. At the highest growth rate the degree of saturation is 54% and the percentage of short acyl chains is 55%, i.e. both, the degree of saturation and the contribution of short acyl chains decrease, thus implying that the membrane fluidity remains unaffected with changing growth rate. Nevertheless cells contain a different composition of fatty acids, with more saturated, shorter acyl chains at low growth rate and more unsaturated, long acyl chains at a high growth rate.
Table S6: Acyl chain composition of L. lactis chemostat cultures at various growth rates. Values listed are percentages + standard deviations of total fatty acids (100%)
D (h-1) C14:0a C16:0a C18:0a C16:1n7a C18:1n7a C20:1n9a C20:3n6a
0.15 36.1 ± 1.3 28.6 ± 1.5 1.1 ± 0.3 5.2 ± 0.4 18.0 ± 0.3 9.4 ± 0.3 1.6 ± 0.20.3 23.6 ± 0.9 26.0 ± 1.0 1.0 ± 0.04 5.1 ± 0.3 36.7 ± 1.6 7.0 ± 0.8 0.7 ± 0.470.5 17.7 ± 1.1 29.7 ± 2.1 2.0 ± 0.5 3.7 ± 0.3 41.6 ± 3.1 5.3 ± 0.30.6 15.1 ± 0.9 36.8 ± 3.4 2.3 ± 0.3 2.6 ± 0.2 38.1 ± 2.5 5.1 ± 0.1
a Cx:YnZ stands for an omega Z family fatty acid with a chain of x-carbon atoms and Y double bonds
Growth rate (μ)
log 2
ratio
Zeroth order p = p0
First order p = p0 + p1 ∙ μ
Second order p = p0 + p1 ∙ μ + p2 ∙ μ2

93
Uncoupled metabolism and protein expression
Lipid biosynthesis and transport protein levels as a function of growth rate
Figure S11: Log2 ratios of proteins involved in lipid biosynthesis (A) from the membrane proteome and (B) soluble proteome, and (C) substrate transport protein ratios, as a function of growth rate. Grey areas represent standard error. A majority of these proteins show no change. The few that do, mostly show an abrupt change from 0.5 h-1 to 0.6 h-1.
●●●●●●●●●●●●●●●
●●●●●●●●●●
●●●●●●●●●●●●●●●
●●
●
●●
●
●
●
●●●●
●●
●●
●●
●●●●
●●●●
●●●● ●●●●
●●
●●
●●
●●●
●●●●
● ●●●●
●
●
●
●
●●● ●
● ●●● ●●● ●
●●●
●
●●● ●● ●
●●
●●● ●●
●●
● ●●● ●●
●●
●
●●●
●●●●
●
llmg_0071 llmg_0075 llmg_0119 llmg_0335
llmg_0935 llmg_1114 llmg_1450 llmg_1558
llmg_2161 llmg_2224 llmg_2272 llmg_2421
−2
−1
0
1
2
−2
−1
0
1
2
−2
−1
0
1
2
0.3 0.4 0.5 0.6 0.3 0.4 0.5 0.6 0.3 0.4 0.5 0.6 0.3 0.4 0.5 0.6
Dilution rate (h−1)
log 2
Pro
tein
ratio
●●●●●●●●●●●●●●●
●●●●●●●●●●
●●●●●●●●●●
●●●●●
●
●●
●●
●●
●
●●●
●
●
●●●
●
● ●●● ●●●
●
●●●●
●●
● ●●●●●
●●● ●
●
llmg_0071 llmg_0075 llmg_0445
llmg_0935 llmg_1114 llmg_2161
llmg_2421
−2
−1
0
1
−2
−1
0
1
−2
−1
0
1
0.3 0.4 0.5 0.6Dilution rate (h−1)
log 2
Pro
tein
ratio
●●● ●● ●●● ●●● ●● ●●●
●●●●● ●●
●
●●● ●● ●●● ●● ●●● ●●● ●● ●●
●●●● ●● ●●
●●●●
●● ●●● ●●●
●● ●●
●
●●● ●●●●● ●●● ●● ●●●
●●●●●● ●●●●●●●●●●
●●● ●● ●●●
●●● ●●
●●●
●●● ●● ●● ●●●
●●● ●● ●●● ●●● ●● ●●●
●●● ●● ●●●
●●● ●● ●●●
●●● ●● ●●● ●●● ●●
●●●
●●● ●●
●●●
●●● ●● ●
●
●
●●● ●● ●●●
●●● ●●●●● ●
●● ●●●●●
●●● ●●●●● ●●● ●● ●●● ●●● ●● ●●
●●●● ●● ●●
●●●● ●●
●●●
●●● ●● ●●● ●
●● ●●
●●● ●● ●●
●●●● ●●
●●●
●●● ●● ●●●●●● ●● ●●
●●●● ●●
●●●●●●
●● ●●●●●● ●● ●●
●
●●● ●●●●●
●●●
●● ●●● ●●● ●● ●●●
●●●●● ●●●
●●● ●● ●●●
●●● ●● ●●● ●●●●●
●●
●●●● ●●
●●●
●●● ●● ●●●
●●● ●● ●●● ●● ●●
●
●●●●●● ●●●● ●●●●●●
●●●●●
●●●
●●●●●
●●●
●●● ●●●●●
●● ●●● ●●● ●● ●●●
●●● ●●●●● ●●● ●
●●●● ●●● ●● ●●● ●●● ●● ●●
●●●●
●● ●●●
●●●
●● ●●●
●●●●●
●●●
llmg_0085 llmg_0106 llmg_0118 llmg_0199 llmg_0214 llmg_0287 llmg_0288 llmg_0289 llmg_0312
llmg_0324 llmg_0325 llmg_0335 llmg_0341 llmg_0446 llmg_0507 llmg_0547 llmg_0588 llmg_0697
llmg_0698 llmg_0699 llmg_0701 llmg_0738 llmg_0739 llmg_0891 llmg_0948 llmg_1048 llmg_1049
llmg_1064 llmg_1086 llmg_1123 llmg_1202 llmg_1203 llmg_1325 llmg_1328 llmg_1452 llmg_1467
llmg_1468 llmg_1546 llmg_1552 llmg_1553 llmg_1635 llmg_1675 llmg_1694 llmg_1699 llmg_1853
llmg_1861 llmg_1862 llmg_1865 llmg_1895 llmg_1896 llmg_1897 llmg_1898 llmg_1900 llmg_1916
llmg_1942 llmg_1943 llmg_1960 llmg_1974 llmg_2270 llmg_2271 llmg_2279 llmg_2330 llmg_2400
llmg_2477 llmg_2547
−20246
−20246
−20246
−20246
−20246
−20246
−20246
−20246
0.3 0.4 0.5 0.60.3 0.4 0.5 0.6
Dilution rate (h−1)
log 2
Pro
tein
ratio
A B
C

94
Chapter 4
Comparison of membrane and soluble proteome ratios and proteins in COG classes
Figure S12: Quality control for proteomics data: for all the chemostats, cells were lysed and the soluble and membrane proteome was isolated as described in Materials and methods. For each growth rate the relative quantification for proteins was performed on soluble and membrane fractions in independent experiments. This figure shows that the log2 ratio of a protein in soluble or membrane proteome is correlated. Thus a change in the ratio for a protein is equally well represented in both the fractions. The number of spectra obtained for a particular protein indicates its enrichment in either soluble or membrane fraction. Proteomics on exclusive membrane fractions allows investigating the minor changes in the abundance of membrane proteins with high confidence.
Figure S13: (A) Fraction of proteins in each COG category observed in the proteomics measurements. Whether a protein is membrane-associated or located in the cytoplasm located may be derived from the number of spectra in each of the fractions. (B) The number of proteins in each COG category that has either the maximum number of spectra in the membrane or in the soluble proteome. See inset table for legend of identifiers.
r=0.604
−2
0
2
−2 0 2 4log2 ratio in membrane fraction
log 2
ratio
in s
olub
le fr
actio
n
Dilution rate0.3
0.5
0.6
0.0
0.2
0.4
0.6
0.8
C D E F G H I J K L M N O P Q R S T U VCOG category
Frac
tion
of p
rote
ins
obse
rved
0
20
40
60
80
COG category
Num
ber o
f pro
tein
s
Membrane fractionSoluble fraction
C D E F G H I J K L M N O P Q R S T U V
A
B
Identifier COG class[C] Energy production and conversion[D] Cell cycle control, cell division, chromosome partitioning[E] Amino acid transport and metabolism[F] Nucleotide transport and metabolism[G] Carbohydrate transport and metabolism[H] Coenzyme transport and metabolism[I] Lipid transport and metabolism[J] Translation, ribosomal structure & biogenesis[K] Transcription[L] Replication, recombination and repair[M] Cell wall/membrane/envelope biogenesis[N] Cell motility[O] Posttranslational modification, protein turnover, chaperones[P] Inorganic ion transport and metabolism[Q] Secondary metabolites biosynthesis, transport and
catabolism[R] General function prediction only[S] Function unknown[T] Signal transduction mechanisms[U] Intracellular trafficking, secretion & vesicular transport[V] Defence mechanisms
95
Uncoupled metabolism and protein expression
List of models
R_ATPM_general_model.xml
Stoichiometric model of L. lactis subsp. cremoris MG1363, with a modified biomass equation excluding ATP consumption, and objective of maximizing ATP hydrolysis. Constraints used for analysing individual growth rates are listed in Table S9, Tab1.
FVA_general_model.xml
General stoichiometric model of L. lactis subsp. cremoris MG1363 with the objective of maximizing biomass formation. Constraints used for analysing individual growth rates are listed in Table S9, Tab2.
List of supplementary material Tables
All tables (except Tables S5 and S6, already presented in the previous sections) are available for download at the following link: https://www.dropbox.com/s/1uhigboxsh0o7t8/Chapter4_Supplementary_Tables.zip
Table S1: Transcriptome analysis of L. lactis MG1363 at varying growth rates. Tab1 (all) contains all genes sorted in ascending order of the accession number. Tab2 (regulon) contains the genes sorted based on their regulon and Tab3 (COG-cat) based on their COG-category.
Table S2: Proteome analysis of L. lactis MG1363 at varying growth rates. All measured proteins are sorted on their accession number. Indicated are the number of spectral reads and degrees of freedoms from the membrane (mem) and soluble (sol) fractions of every measured protein.
Table S3: List of (iso)enzymes of L. lactis MG1363 obtained from the proteome analysis. Table S4: Correlations between transcripts and proteins of KEGG-categories (Tab1) and
regulons (Tab2). Table S5: Biomass concentration, apparent catabolic carbon balance, total carbon balance
and residual glucose concentrations with standard deviations, in glucose-limited chemostat cultures of L. lactis MG1363.
Table S6: Acyl chain composition of L. lactis chemostat cultures at various growth rates. Values listed are percentages + standard deviations of total fatty acids (100%)
Table S7: All amino acid consumption rates (q-rates) at various growth rates. Aspartate and glutamate measurements could not reliably be determined as the concentrations were too close to the detection limit.
Table S8: Average log2 ratios of protein, transcript and flux calculated relative to the lowest growth rate (Tab1) and parameters of the least complicated regulation fit model of transcript and protein as a function of growth rate (Tab2).
Table S9: Constraints for all R_ATPM FBA’s (Tab 1) and FVA’s (Tab 2).


97
The Fructose Analogue
2,5-Anhydromannitol
Redirects Metabolism in a
Lactose-Utilizing L. lactis
MG1363 Derivative
Towards Homolactic
Fermentation
Anisha Goel,
Filipe Santos, Willem de Vos, Douwe Molenaar, Bas Teusink and Herwig Bachmann
CHAPTER 555 CHAPTER 5
97Manuscript in preparation
98
Chapter 5
Abstract
The metabolic shift from homolactic to mixed-acid metabolism in Lactococcus lactis has been intensively studied, and several mechanisms have been suggested based on in vitro kinetic data or gene expression studies. Here we aim to connect the in vitro mechanism to the metabolic shift in vivo. We show that there is a strong positive correlation between the glycolytic flux and the extent of homolactic fermentation in a mixed-acid fermentative lactose-utilizing L. lactis MG1363 derivative. This correlation was caused by metabolic regulation. We subsequently provide new evidence for a causal relationship between the concentration of fructose-1,6-bisphosphate (FBP) and the metabolic shift. We show that 2,5-anhydromannitol, which converts to a non-metabolizable FBP analogue in vivo, almost doubles the flux towards lactate when taken up by the cells. In vitro the activating effect of the analogue on lactate dehydrogenase (LDH) is similar to native FBP, whereas up to 5 mM concentrations of the analogue had no effect on the enzyme phosphotransacetylase (PTA). The activation concentration, however, was much lower than normal intracellular FBP concentrations. In conclusion, the alteration of FBP levels in L. lactis has a major influence on metabolic fluxes after the pyruvate branch, which suggests a causal effect of FBP. Whether this is a consequence of LDH activation or PTA inhibition still needs to be determined.
Keywords: Fructose analogue, Lactococcus lactis, Metabolic regulation, Metabolic shift, Non-metabolizable FBP analogue
99
FBP analogue redirects metabolism in L. lactis
Introduction
Organisms often shift from one mode of metabolism to another in the process of metabolizing substrates. Classical examples include the Warburg effect in mammalian cells that shift from aerobic respiration to lactic acid fermentation (Warburg, 1956), aerobic respiration versus ethanol fermentation in yeast (Postma et al, 1989) and the oxidative phosphorylation versus acetate secretion in Escherichia coli (Wolfe, 2005). Similarly, the metabolic shift in the lactic acid bacterium Lactococcus lactis comprising the change from mixed-acid to homolactic metabolism is also such an example (Thomas et al, 1979). Due to its relative simplicity, genetic accessibility and easy growth, the predominantly fermentative L. lactis is an ideal model to study the metabolic shift. Under a variety of conditions, L. lactis exhibits a metabolic shift from producing a mixture of acids and ethanol (mixed-acid pathway) at low growth rates, to producing almost exclusively lactic acid (homolactic pathway) at high growth rates.
The metabolic shift in L. lactis, has received considerable attention (for reviews on regulatory mechanisms see Thompson (1987), Cocaign-Bousquet et al (1996), Neves et al (2005), Kowalczyk & Bardowski (2007), Teusink et al (2011). The shift in L. lactis was first observed in carbon-limited chemostats at low growth rates (Thomas et al, 1979) who explained it based on lower enzyme activity of lactate dehydrogenase, the enzyme responsible for the homolactic pathway. The authors also highlighted the activation of lactate dehydrogenase (LDH) by the glycolytic intermediate fructose-1,6-bisphosphate (FBP), as already reported earlier (Mou et al, 1972; Jonas et al, 1972). Mixed-acid fermentation was also observed during growth on slowly fermentable sugars like galactose, maltose, ribose and xylose, also under carbon excess conditions (Thomas et al, 1980; Lohmeier-Vogel et al, 1986; Cocaign-Bousquet et al, 1996). These results indicate that the rate of sugar uptake might be a causative factor and in the case of limiting glycolytic rate, the ATP production rate is maximized by utilizing the mixed-acid fermentative pathway. The presence of oxygen is also associated with heterofermentative behaviour (producing acetate, CO2 and other products) and high acetate production in particular, attributed to the activation of NADH-oxidising enzymes (Smart & Thomas, 1987; Cogan et al, 1989). Other factors include the inhibition of mixed-acid pathway enzymes by triose phosphates (Thomas et al, 1980; Takahashi et al, 1982), activation of LDH by the NADH/NAD+ ratio (Garrigues et al, 1997), the imbalance between catabolism and anabolism (Garrigues et al, 2001) and the controlling effect of glyceraldehyde-3-phosphate dehydrogenase (GAPDH) activity (Poolman et al, 1987a; Even et al, 1999). All the above studies have been crucial in elucidating in vitro, the detailed mechanisms involved in the metabolic shift. Apart from these approaches, the in vivo kinetics of a glucose pulse has been monitored through in vivo-NMR shedding light on the dynamics of nicotinamide adenine nucleotides, inorganic phosphate, glycolytic intermediates and pathways downstream of pyruvate. The most important conclusions were that the glycolytic flux was not primarily controlled at the level of GAPDH by NADH, and that the ATP/ADP/Pi levels could have a significant role (Neves et al, 2002).
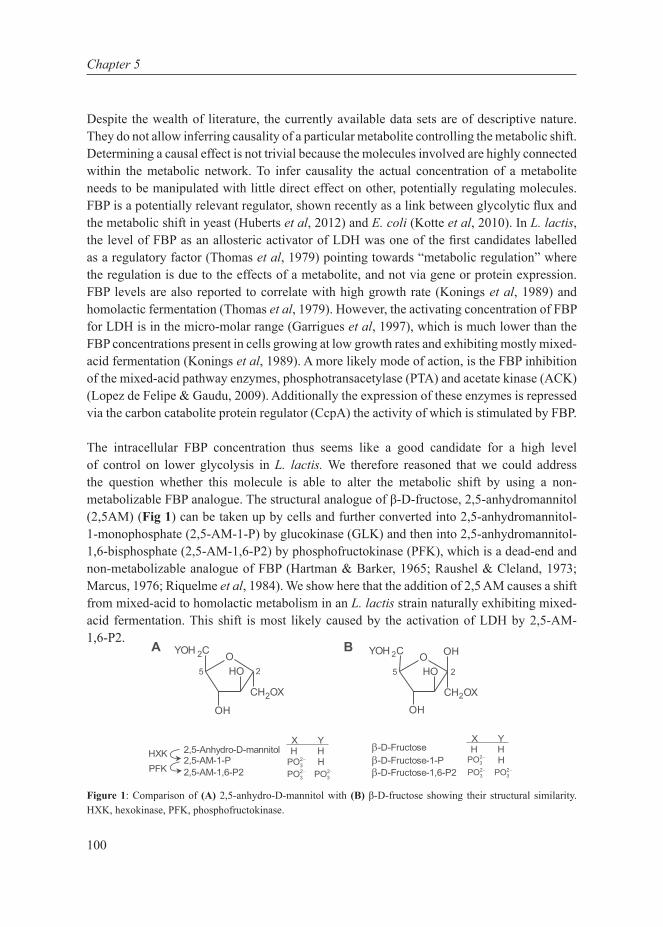
100
Chapter 5
Despite the wealth of literature, the currently available data sets are of descriptive nature. They do not allow inferring causality of a particular metabolite controlling the metabolic shift. Determining a causal effect is not trivial because the molecules involved are highly connected within the metabolic network. To infer causality the actual concentration of a metabolite needs to be manipulated with little direct effect on other, potentially regulating molecules. FBP is a potentially relevant regulator, shown recently as a link between glycolytic flux and the metabolic shift in yeast (Huberts et al, 2012) and E. coli (Kotte et al, 2010). In L. lactis, the level of FBP as an allosteric activator of LDH was one of the first candidates labelled as a regulatory factor (Thomas et al, 1979) pointing towards “metabolic regulation” where the regulation is due to the effects of a metabolite, and not via gene or protein expression. FBP levels are also reported to correlate with high growth rate (Konings et al, 1989) and homolactic fermentation (Thomas et al, 1979). However, the activating concentration of FBP for LDH is in the micro-molar range (Garrigues et al, 1997), which is much lower than the FBP concentrations present in cells growing at low growth rates and exhibiting mostly mixed-acid fermentation (Konings et al, 1989). A more likely mode of action, is the FBP inhibition of the mixed-acid pathway enzymes, phosphotransacetylase (PTA) and acetate kinase (ACK) (Lopez de Felipe & Gaudu, 2009). Additionally the expression of these enzymes is repressed via the carbon catabolite protein regulator (CcpA) the activity of which is stimulated by FBP.
The intracellular FBP concentration thus seems like a good candidate for a high level of control on lower glycolysis in L. lactis. We therefore reasoned that we could address the question whether this molecule is able to alter the metabolic shift by using a non-metabolizable FBP analogue. The structural analogue of β-D-fructose, 2,5-anhydromannitol (2,5AM) (Fig 1) can be taken up by cells and further converted into 2,5-anhydromannitol-1-monophosphate (2,5-AM-1-P) by glucokinase (GLK) and then into 2,5-anhydromannitol-1,6-bisphosphate (2,5-AM-1,6-P2) by phosphofructokinase (PFK), which is a dead-end and non-metabolizable analogue of FBP (Hartman & Barker, 1965; Raushel & Cleland, 1973; Marcus, 1976; Riquelme et al, 1984). We show here that the addition of 2,5 AM causes a shift from mixed-acid to homolactic metabolism in an L. lactis strain naturally exhibiting mixed-acid fermentation. This shift is most likely caused by the activation of LDH by 2,5-AM-1,6-P2.
Figure 1: Comparison of (A) 2,5-anhydro-D-mannitol with (B) β-D-fructose showing their structural similarity. HXK, hexokinase, PFK, phosphofructokinase.
OYOH 2C
CH2OX
OH
OH
OYOH 2C
CH2OX
OH
OH
OH
25 25
X Y H H H
2,5-Anhydro-D-mannitol2,5-AM-1-P2,5-AM-1,6-P2
�-D-Fructose�-D-Fructose-1-P�-D-Fructose-1,6-P2
HXKPFK 2
3PO � 23PO �
23PO � 2
3PO �
23PO � 2
3PO �
X Y H H H
A B
101
FBP analogue redirects metabolism in L. lactis
Materials and methods
Strain and growth conditions
Lactococcus lactis subsp. cremoris MG1363 (Gasson, 1983) and its isogenic derivative Lactococcus lactis subsp. cremoris HB34 was grown on chemically defined medium for prolonged cultivation (CDMPC) as described by Santos et al, (manuscript in preparation) with 25 mM glucose or 12.5 mM lactose as carbon source and the medium composition as detailed previously (Goel et al, 2012a). Strain HB34 is a lactose positive isolate of MG1363 which carries a point mutation in the celB promoter identical to the one described for strain HB21 (Solopova et al, 2012). For enzyme activity assays, batch cultures were grown at 30 °C in 50 mL tubes either static with 50 mL volume (called static cultures) or aerobically, shaken at 100 rpm with 10 mL volume (called aerobic cultures).
Fermentation end-product analysis
Supernatant samples from cultures were prepared by filtering through a 0.20 µm polyethersulfone (PES) filter (VWR international B.V., Amsterdam, the Netherlands) and storing the flow-through at -20ºC until further analysis. Extracellular concentrations of lactate, acetate, ethanol, formate, and glucose were determined High Performance Liquid Chromatography (HPLC) as described previously (Goel et al, 2012a).
Acidification experiments
Mid-logarithmic cells grown on glucose-CDMPC were washed twice with saline supplemented with 5 μg · mL-1 chloramphenicol and subsequently re-suspended in CDMPC without a carbon source. The CDMPC was supplemented with 10 µM of 5-(6)-Carboxyfluorescein (#21877, Sigma-Aldrich, Netherlands) and 5 μg · mL-1 chloramphenicol. Multiple wells of a black microplate with a transparent bottom were filled with 190 μL of this suspension and the optical density (OD) of each well was determined at 600 nm. Subsequently 10 μL of 0.5 M or 1 M solutions of investigated di- or monosaccharides respectively were added. The buffer capacity of CDMPC is limited and therefore cell metabolism leads to acidification which was detected as a drop in the fluorescence signal with an emission wavelength of 520 nm (excitation 485 nm) measured every 5 min for at least 3 hrs. Acidification rates were determined as the maximum value of the negative slope of the decreasing fluorescence value for a 30 min time interval. The values obtained were normalized to the OD.

102
Chapter 5
Enzyme activities: sampling, cell extract preparation and assay conditions
All procedures for enzyme activity measurements were essentially the same as described earlier (Goel et al, 2012a). Enzymes were assayed in freshly prepared cell extracts (11 mg protein • mL-1) at 30 °C. Except for experiments with the FBP analogue, all enzymes were assayed in the in vivo-like assay medium (version 1). NADH oxidase activity was assayed by the addition of cell extract to a mix of the in vivo-like assay medium and 3 mM NADH, and monitoring NADH consumption at 340 nm.
FBP analogue synthesis and enzyme assays
30 mM of 2,5-anhydromannitol (#sc-220807, Santa Cruz Biotechnology, Germany) was mixed with 30 mM ATP (#A2383, Sigma-Aldrich, Netherlands), 12 U · mL-1 hexokinase (#1426362001, Roche Diagnostics, Netherlands) 12 U · mL-1 phosphofructokinase (#F0137, Sigma-Aldrich, Netherlands) in 100 mM HEPES-KOH buffer (pH 7) and incubated for 30 min at 30 °C. The pH was adjusted to 7 with KOH and the mixture was incubated again for 10 min. This mixture was treated as a 30 mM stock solution for the FBP analogue, assuming complete conversion of 2,5-anhydromannitol. Various dilutions of the FBP analogue mix were added to the assay mixtures of LDH and PTA. LDH assay mixture contained 5 μL of 12, 20 and 30 times diluted cell extract, 100 mM HEPES-KOH buffer, 2 mM MgSO4, 0.3 mM NADH, 0-2.17 mM concentrations of the FBP analogue and the reaction initiator, 6 mM pyruvate in a total volume of 300 μL. PTA assay mixture contained 5 μL of 2, 4 and 8 times diluted cell extract, 100 mM phosphate buffer, 2 mM MgSO4, 1/100th concentration of CDMPC metals solution, 0.08 mM DTNB, 0-2.17 mM concentrations of the FBP analogue and reaction initiator 0.4 mM acetyl-coenzyme A in a total volume of 300 μL.
Growth experiments testing the effect of 2,5-anhydromannitol
In the first well of a 6-well plate, 2 mL of no-carbon CDMPC (nc-CDMPC) was mixed with 2 mL of 20 mM 2,5-anhydromannitol (prepared in nc-CDMPC), and serially diluted in 2 mL nc-CDMPC to obtain 10, 5, 2.5, 1.25 and 0.625 mM concentrations of 2,5-anhydromannitol, and none in the last well. 50 μL of 0.5 M lactose was added to each well to get a final concentration of 12.5 mM. 20 μL of Lactococcus lactis ssp. cremoris HB34 fully grown (48 hrs at 30 °C) in lactose CDMPC was added to each well and cell mixtures were distributed in 384 well plate. Growth was monitored at 30ºC, at optical density 600 nm with 10 min intervals in a Multiskan GO UV/Vis microplate spectrophotometer (#51119300, Thermo Scientific, Rockford, IL, USA).
Growth rate analysis was performed as described elsewhere (Bachmann et al, 2013). In short, the R software package was used to determine the slope of a log transformed time series of optical density readings obtained from microplate experiments.
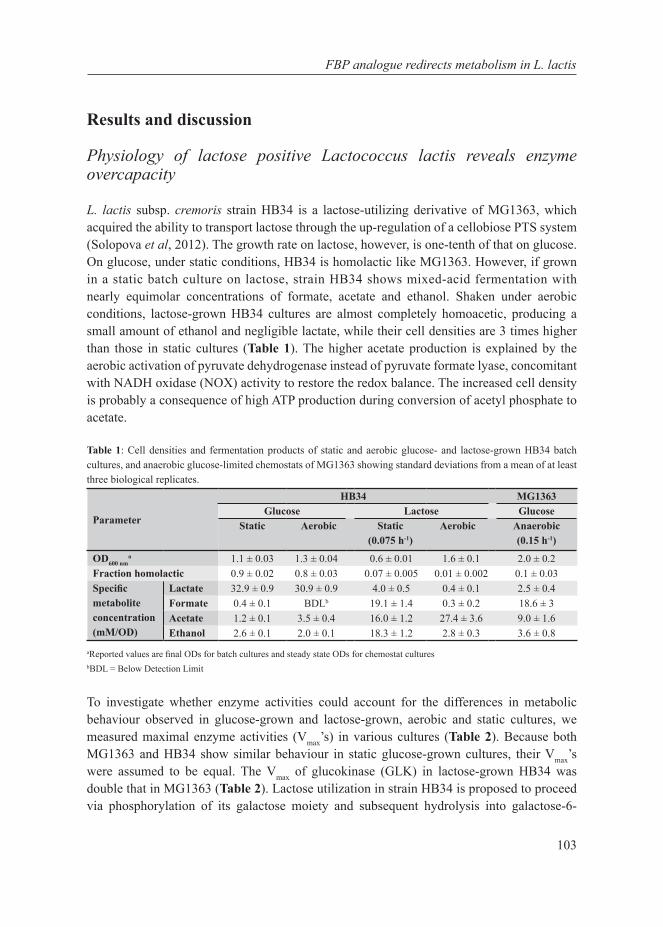
103
FBP analogue redirects metabolism in L. lactis
Results and discussion
Physiology of lactose positive Lactococcus lactis reveals enzyme overcapacity
L. lactis subsp. cremoris strain HB34 is a lactose-utilizing derivative of MG1363, which acquired the ability to transport lactose through the up-regulation of a cellobiose PTS system (Solopova et al, 2012). The growth rate on lactose, however, is one-tenth of that on glucose. On glucose, under static conditions, HB34 is homolactic like MG1363. However, if grown in a static batch culture on lactose, strain HB34 shows mixed-acid fermentation with nearly equimolar concentrations of formate, acetate and ethanol. Shaken under aerobic conditions, lactose-grown HB34 cultures are almost completely homoacetic, producing a small amount of ethanol and negligible lactate, while their cell densities are 3 times higher than those in static cultures (Table 1). The higher acetate production is explained by the aerobic activation of pyruvate dehydrogenase instead of pyruvate formate lyase, concomitant with NADH oxidase (NOX) activity to restore the redox balance. The increased cell density is probably a consequence of high ATP production during conversion of acetyl phosphate to acetate.
Table 1: Cell densities and fermentation products of static and aerobic glucose- and lactose-grown HB34 batch cultures, and anaerobic glucose-limited chemostats of MG1363 showing standard deviations from a mean of at least three biological replicates.
Parameter
HB34 MG1363Glucose Lactose Glucose
Static Aerobic Static (0.075 h-1)
Aerobic Anaerobic (0.15 h-1)
OD600 nma 1.1 ± 0.03 1.3 ± 0.04 0.6 ± 0.01 1.6 ± 0.1 2.0 ± 0.2
Fraction homolactic 0.9 ± 0.02 0.8 ± 0.03 0.07 ± 0.005 0.01 ± 0.002 0.1 ± 0.03Specific metabolite concentration (mM/OD)
Lactate 32.9 ± 0.9 30.9 ± 0.9 4.0 ± 0.5 0.4 ± 0.1 2.5 ± 0.4Formate 0.4 ± 0.1 BDLb 19.1 ± 1.4 0.3 ± 0.2 18.6 ± 3Acetate 1.2 ± 0.1 3.5 ± 0.4 16.0 ± 1.2 27.4 ± 3.6 9.0 ± 1.6Ethanol 2.6 ± 0.1 2.0 ± 0.1 18.3 ± 1.2 2.8 ± 0.3 3.6 ± 0.8
aReported values are final ODs for batch cultures and steady state ODs for chemostat culturesbBDL = Below Detection Limit
To investigate whether enzyme activities could account for the differences in metabolic behaviour observed in glucose-grown and lactose-grown, aerobic and static cultures, we measured maximal enzyme activities (Vmax’s) in various cultures (Table 2). Because both MG1363 and HB34 show similar behaviour in static glucose-grown cultures, their Vmax’s were assumed to be equal. The Vmax of glucokinase (GLK) in lactose-grown HB34 was double that in MG1363 (Table 2). Lactose utilization in strain HB34 is proposed to proceed via phosphorylation of its galactose moiety and subsequent hydrolysis into galactose-6-
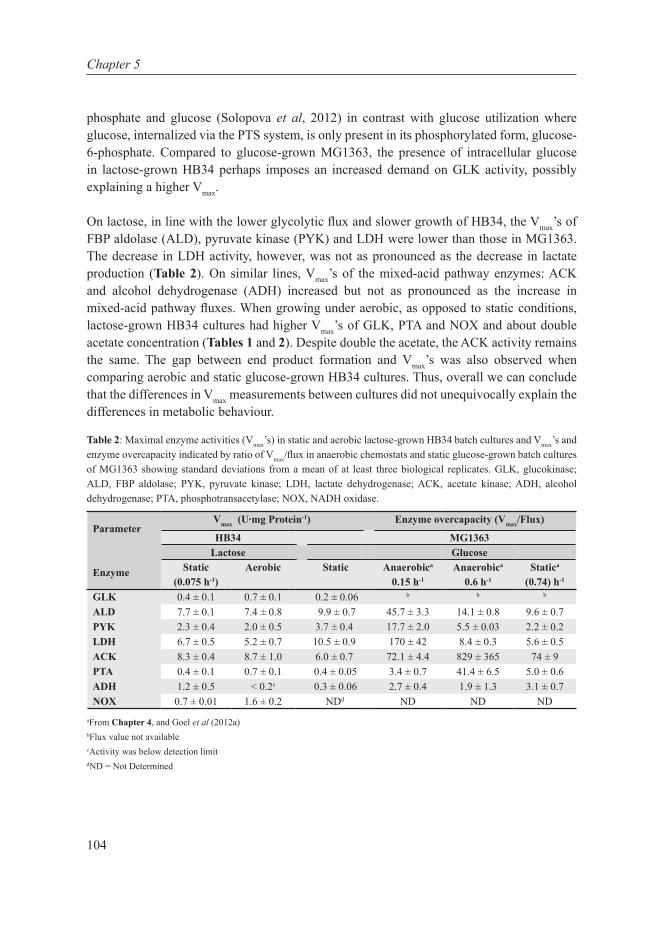
104
Chapter 5
phosphate and glucose (Solopova et al, 2012) in contrast with glucose utilization where glucose, internalized via the PTS system, is only present in its phosphorylated form, glucose-6-phosphate. Compared to glucose-grown MG1363, the presence of intracellular glucose in lactose-grown HB34 perhaps imposes an increased demand on GLK activity, possibly explaining a higher Vmax.
On lactose, in line with the lower glycolytic flux and slower growth of HB34, the Vmax’s of FBP aldolase (ALD), pyruvate kinase (PYK) and LDH were lower than those in MG1363. The decrease in LDH activity, however, was not as pronounced as the decrease in lactate production (Table 2). On similar lines, Vmax’s of the mixed-acid pathway enzymes: ACK and alcohol dehydrogenase (ADH) increased but not as pronounced as the increase in mixed-acid pathway fluxes. When growing under aerobic, as opposed to static conditions, lactose-grown HB34 cultures had higher Vmax’s of GLK, PTA and NOX and about double acetate concentration (Tables 1 and 2). Despite double the acetate, the ACK activity remains the same. The gap between end product formation and Vmax’s was also observed when comparing aerobic and static glucose-grown HB34 cultures. Thus, overall we can conclude that the differences in Vmax measurements between cultures did not unequivocally explain the differences in metabolic behaviour.
Table 2: Maximal enzyme activities (Vmax’s) in static and aerobic lactose-grown HB34 batch cultures and Vmax’s and enzyme overcapacity indicated by ratio of Vmax/flux in anaerobic chemostats and static glucose-grown batch cultures of MG1363 showing standard deviations from a mean of at least three biological replicates. GLK, glucokinase; ALD, FBP aldolase; PYK, pyruvate kinase; LDH, lactate dehydrogenase; ACK, acetate kinase; ADH, alcohol dehydrogenase; PTA, phosphotransacetylase; NOX, NADH oxidase.
Parameter
Enzyme
Vmax (U∙mg Protein-1) Enzyme overcapacity (Vmax/Flux)
HB34 MG1363Lactose Glucose
Static(0.075 h-1)
Aerobic Static Anaerobica 0.15 h-1
Anaerobica 0.6 h-1
Statica (0.74) h-1
GLK 0.4 ± 0.1 0.7 ± 0.1 0.2 ± 0.06 b b b
ALD 7.7 ± 0.1 7.4 ± 0.8 9.9 ± 0.7 45.7 ± 3.3 14.1 ± 0.8 9.6 ± 0.7PYK 2.3 ± 0.4 2.0 ± 0.5 3.7 ± 0.4 17.7 ± 2.0 5.5 ± 0.03 2.2 ± 0.2LDH 6.7 ± 0.5 5.2 ± 0.7 10.5 ± 0.9 170 ± 42 8.4 ± 0.3 5.6 ± 0.5ACK 8.3 ± 0.4 8.7 ± 1.0 6.0 ± 0.7 72.1 ± 4.4 829 ± 365 74 ± 9PTA 0.4 ± 0.1 0.7 ± 0.1 0.4 ± 0.05 3.4 ± 0.7 41.4 ± 6.5 5.0 ± 0.6ADH 1.2 ± 0.5 < 0.2c 0.3 ± 0.06 2.7 ± 0.4 1.9 ± 1.3 3.1 ± 0.7NOX 0.7 ± 0.01 1.6 ± 0.2 NDd ND ND ND
aFrom Chapter 4, and Goel et al (2012a)bFlux value not available cActivity was below detection limitdND = Not Determined

105
FBP analogue redirects metabolism in L. lactis
We have shown earlier that the parent strain MG1363 possesses enzyme overcapacity, where a five-fold increase in glycolytic flux and 75% increase in lactate formation could be achieved with nearly unchanging enzyme capacities (Fig 2: Chapter 4). The enzymes are capable of supporting between 2 to 200 times the observed fluxes even at growth rates as low as 0.15 h-1. We could similarly analyse the enzyme overcapacity in HB34 if its measured fluxes were available. But since we have only metabolite concentrations of the metabolites downstream of pyruvate, we attempted an indirect analysis of those pathways as follows. MG1363 has enzyme overcapacity, and lactose-grown HB34 grows at one-tenth the speed of MG1363. So if the Vmax’s, cell densities and metabolite concentrations in the two cases were identical, we could conclude that HB34 also exhibits enzyme overcapacity. For Vmax’s this is indeed the case, as the Vmax’s in HB34 are mostly the same or higher than those in MG1363, (except ALD, LDH and PYK, which are lower by a factor 0.8, 0.6 and 0.6, respectively). The cell densities of aerobic HB34 batch-cultures and MG1363 in anaerobic chemostats at 0.15 h-1 are comparable; the specific metabolite concentrations of ethanol are comparable, of lactate are lower, and of acetate are 3 fold higher (Table 1). When combined together though, these differences in Vmax and metabolite concentrations are small (Table 2). Moreover a drastic increase of acetate in aerobic cultures of HB34 was not accompanied by a corresponding increase in the Vmax of ACK. We can thus conclude that lactose-grown HB34 also exhibits enzyme overcapacity for the lactic acid and mixed-acid pathways.
Glycolytic rate determines metabolic end product formation
A question that arises from the results in the previous section is what determines the fraction of carbon converted to lactate when all key enzymes are present in excess? Aeration and slowly fermentable sugar substrates are known to induce mixed-acid fermentation, while anaerobic conditions and rapidly fermentable sugar substrates induce homolactic behaviour (Cocaign-Bousquet et al, 1996). Rapidly fermentable sugars support a higher glycolytic flux, and possibly this glycolytic flux causes, through “flux sensing” (Huberts et al, 2012), a shift in lactate formation from mixed-acid pathway products. This would be consistent with the chemostat data in Chapter 4. To test whether the redirection of glycolytic flux towards lactate is predominantly caused by metabolic regulation, we used exponentially growing HB34 cell cultures with arrested protein synthesis, and tested the acidification rates on different sugars. The arrest of protein synthesis makes it possible to look at metabolic regulation only. The acidification rates, indicative of the glycolytic rate, were found to correlate positively with the fraction of lactate (Fig 2). Such a direct correlation between glycolytic rate and lactate formation with identical cellular machinery is strong and unique support for the hypothesis that the shift is metabolically regulated to a large extent.
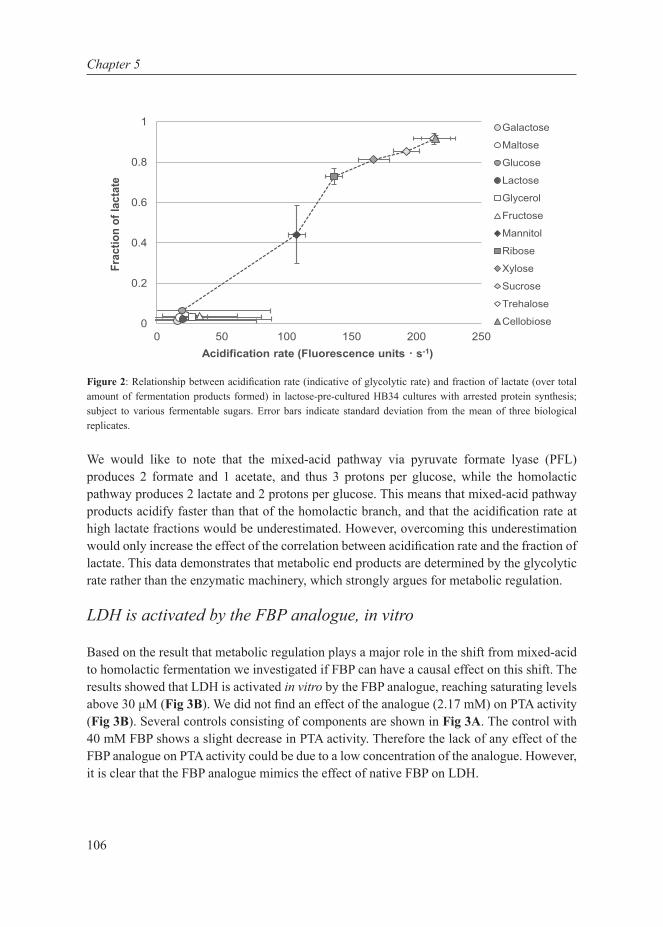
106
Chapter 5
Figure 2: Relationship between acidification rate (indicative of glycolytic rate) and fraction of lactate (over total amount of fermentation products formed) in lactose-pre-cultured HB34 cultures with arrested protein synthesis; subject to various fermentable sugars. Error bars indicate standard deviation from the mean of three biological replicates.
We would like to note that the mixed-acid pathway via pyruvate formate lyase (PFL) produces 2 formate and 1 acetate, and thus 3 protons per glucose, while the homolactic pathway produces 2 lactate and 2 protons per glucose. This means that mixed-acid pathway products acidify faster than that of the homolactic branch, and that the acidification rate at high lactate fractions would be underestimated. However, overcoming this underestimation would only increase the effect of the correlation between acidification rate and the fraction of lactate. This data demonstrates that metabolic end products are determined by the glycolytic rate rather than the enzymatic machinery, which strongly argues for metabolic regulation.
LDH is activated by the FBP analogue, in vitro
Based on the result that metabolic regulation plays a major role in the shift from mixed-acid to homolactic fermentation we investigated if FBP can have a causal effect on this shift. The results showed that LDH is activated in vitro by the FBP analogue, reaching saturating levels above 30 μM (Fig 3B). We did not find an effect of the analogue (2.17 mM) on PTA activity (Fig 3B). Several controls consisting of components are shown in Fig 3A. The control with 40 mM FBP shows a slight decrease in PTA activity. Therefore the lack of any effect of the FBP analogue on PTA activity could be due to a low concentration of the analogue. However, it is clear that the FBP analogue mimics the effect of native FBP on LDH.
0
0.2
0.4
0.6
0.8
1
0 50 100 150 200 250
Frac
tion
of la
ctat
e
Acidification rate (Fluorescence units · s-1)
Galactose
Maltose
Glucose
Lactose
Glycerol
Fructose
Mannitol
Ribose
Xylose
Sucrose
Trehalose
Cellobiose

107
FBP analogue redirects metabolism in L. lactis
Lactate formation increases with higher concentrations of the non-metabolizable FBP analogue
After confirmation of the activating effect of the FBP analogue on LDH activity, we tested the effect of the precursor of FBP, a fructose analogue, 2,5-anhydromannitol (2,5AM) on L. lactis HB34. We supplemented the cells with lactose and various concentrations of the precursor. As the metabolism of 2,5AM is a dead-end, all transported 2,5AM and downstream metabolites will be in equilibrium, and since the equilibrium constants for GLK and PFK are very large, virtually all 2,5AM will be converted to its bisphosphate form. FBP concentrations increase at higher growth rates (Thomas et al, 1979; Konings et al, 1989) and therefore an excess of the FBP analogue should mimic high FBP concentrations that cells normally face at high growth rates. This should elicit a metabolic response akin to fast growth in the lower glycolysis and downstream pathways and a potential feedback inhibition of upper glycolysis and / or glucose transport. We confirmed that HB34 was unable to grow with 2,5AM as the sole carbon source, which is not surprising since 2,5AM can only be converted to a non-metabolizable FBP analogue. When HB34 was grown on lactose the fraction of lactate over the total fermentation products increased linearly with increasing 2,5AM concentrations up to 5 mM, after which the fraction of lactate remained constant at 10 mM (Fig 4A). Interestingly, such a shift in metabolism is accompanied by slower growth and also a lower final cell density (Fig 4B).
Interestingly the flux through the lactate branch increases with increasing 2,5AM concentrations, while at the same time the growth rate decreases. This is in contrast with what is normally seen and corroborates the notion that the activation of LDH through FBP has a major effect on the metabolic shift. Thus we conclude that the FBP analogue is able to shift metabolism towards lactate formation, providing new evidence for the role of FBP in the shift.
( )
0
2
4
6
8
10
V max
(μm
ol.m
in-1
.mg
Prot
ein-
1 )
* *
0
2
4
6
8
10
12
0.001 0.01 0.1 1 10
V max
(μm
ol.m
in-1
.mg
Prot
ein-
1 )
FBP analogue concentration (mM)
A
B
Figure 3: (A) All relevant controls testing the effect of various combinations of metabolites and enzymes on maximal activity of LDH (white bars) and PTA (grey bars). *PTA and LDH were not tested at 0.1 mM and 40 mM FBP respectively. (B) Effect of the FBP analogue on maximal enzyme activities of LDH (♦) and PTA (■). Error bars indicate standard deviation from the mean of three activity measurements.

108
Chapter 5
The effect of 2,5AM has also been tested in yeast and E. coli where the glucose consumption rate and ethanol production rate were inhibited at 2,5AM concentrations above 2.5 mM, but the yield of ethanol on glucose increased (Nghiem & Cofer, 2007). In rat hepatocytes 2,5AM also resulted an increase in lactate formation (Riquelme et al, 1983).
Figure 4: Effect of addition of the fructose analogue: 2,5-anhydromannitol, on lactose-supplemented HB34 cultures. (A) Fraction of lactate formed over total amount of fermentative products, error bars indicate standard deviation from the mean of at least three biological replicates (B) Growth curves at varying 2,5AM concentrations showing standard deviations (grey areas)
An intricate metabolic regulation mechanism
Using a heterofermentative L. lactis strain with arrested protein synthesis, and supplemented with various sugars, we could show strong metabolic regulation of the homolactic–mixed-acid shift for the first time in L. lactis: the glycolytic flux correlated positively with the fraction of lactate produced (Fig 2). Several studies reported the correlation of intracellular FBP levels with lactate production (Thomas et al, 1979; Konings et al, 1989; Bond & Russell,
0
0.2
0.4
0.6
0.8
0 2 4 6 8 10
Frac
tion
tow
ards
lact
ate
2,5-Anhydromannitol concentration (mM)
Opt
ical
den
sity
at 6
00 n
m
A
B
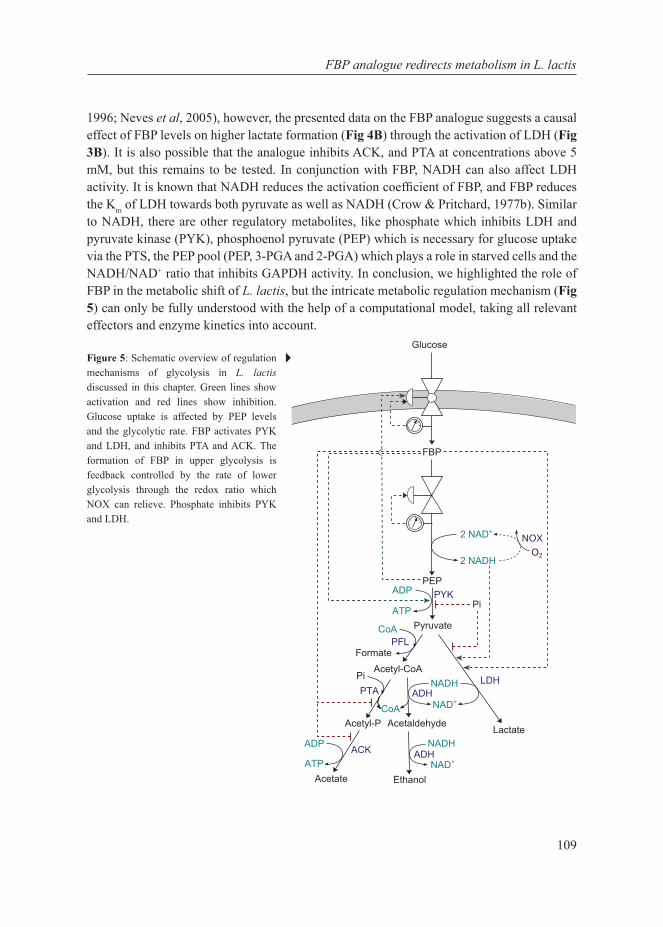
109
FBP analogue redirects metabolism in L. lactis
1996; Neves et al, 2005), however, the presented data on the FBP analogue suggests a causal effect of FBP levels on higher lactate formation (Fig 4B) through the activation of LDH (Fig 3B). It is also possible that the analogue inhibits ACK, and PTA at concentrations above 5 mM, but this remains to be tested. In conjunction with FBP, NADH can also affect LDH activity. It is known that NADH reduces the activation coefficient of FBP, and FBP reduces the Km of LDH towards both pyruvate as well as NADH (Crow & Pritchard, 1977b). Similar to NADH, there are other regulatory metabolites, like phosphate which inhibits LDH and pyruvate kinase (PYK), phosphoenol pyruvate (PEP) which is necessary for glucose uptake via the PTS, the PEP pool (PEP, 3-PGA and 2-PGA) which plays a role in starved cells and the NADH/NAD+ ratio that inhibits GAPDH activity. In conclusion, we highlighted the role of FBP in the metabolic shift of L. lactis, but the intricate metabolic regulation mechanism (Fig 5) can only be fully understood with the help of a computational model, taking all relevant effectors and enzyme kinetics into account.
Figure 5: Schematic overview of regulation mechanisms of glycolysis in L. lactis discussed in this chapter. Green lines show activation and red lines show inhibition. Glucose uptake is affected by PEP levels and the glycolytic rate. FBP activates PYK and LDH, and inhibits PTA and ACK. The formation of FBP in upper glycolysis is feedback controlled by the rate of lower glycolysis through the redox ratio which NOX can relieve. Phosphate inhibits PYK and LDH.

111
A Kinetic Model of L. lactis
Combining Data from
Chemostat and Glucose
Pulse Experiments Exhibits
the Metabolic Shift as a
Function of Growth Rate
Anisha Goel*,
Domenico Bellomo*, Douwe Molenaar and Bas Teusink
CHAPTER 666 CHAPTER 6
111Manuscript in preparation*Contributed equally

112
Chapter 6
Abstract
There exist a variety of explanations for the metabolic shift from mixed-acid to homolactic fermentation in L. lactis and in Chapter 5 we unravelled the relationships between glycolytic flux, FBP and allosteric effectors on enzymes of the glycolytic and downstream pathways. The next step would naturally be to put the relationships together in a mathematical model to test and investigate whether these interactions can explain the metabolic shift. Kinetic models for primary metabolism exist for many organisms, including L. lactis, but also for other organisms like E. coli yeast and fungi. The most recently developed kinetic model of L. lactis was fitted to in vivo NMR data of metabolite dynamics during glycolytic pulse experiments. This model, however, did not exhibit the shift, and also had a few unresolved discrepancies with respect to kinetics of some enzymes. We therefore developed a new model and used steady-state chemostat data of L. lactis MG1363 in addition to the dynamic in vivo NMR data for fitting. The fitted model reproduced the metabolic shift allowing us to gain insight into parameters influencing the metabolic shift. In particular the importance of FBP and Pi were reiterated. Moreover there is still scope for improvement and these are summarized here to guide future modelling endeavours.
Keywords: Chemostat, Kinetic model, Glycolysis, Lactococcus lactis, Metabolic shift
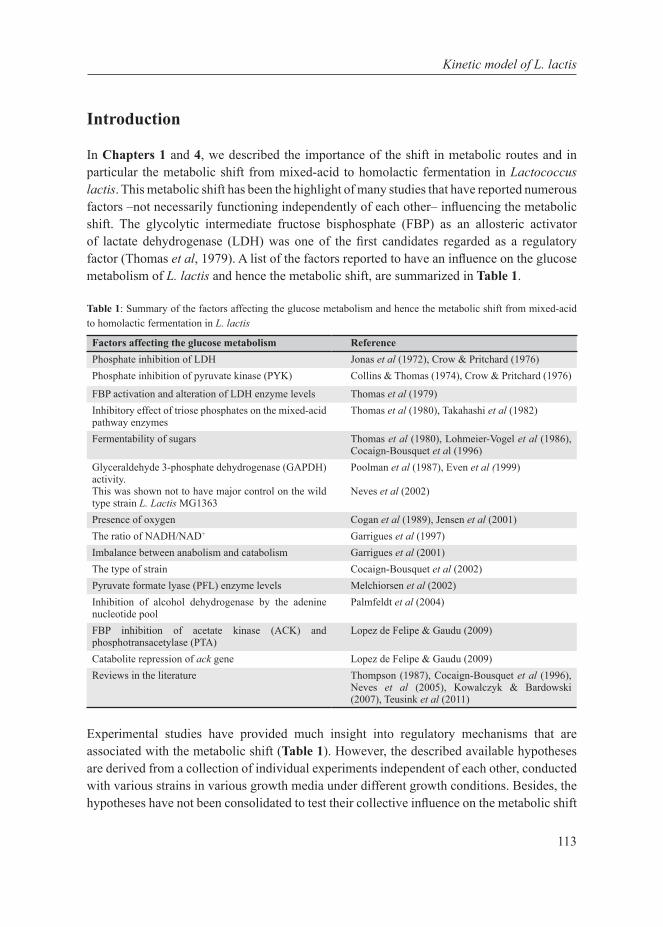
113
Kinetic model of L. lactis
Introduction
In Chapters 1 and 4, we described the importance of the shift in metabolic routes and in particular the metabolic shift from mixed-acid to homolactic fermentation in Lactococcus lactis. This metabolic shift has been the highlight of many studies that have reported numerous factors –not necessarily functioning independently of each other– influencing the metabolic shift. The glycolytic intermediate fructose bisphosphate (FBP) as an allosteric activator of lactate dehydrogenase (LDH) was one of the first candidates regarded as a regulatory factor (Thomas et al, 1979). A list of the factors reported to have an influence on the glucose metabolism of L. lactis and hence the metabolic shift, are summarized in Table 1.
Table 1: Summary of the factors affecting the glucose metabolism and hence the metabolic shift from mixed-acid to homolactic fermentation in L. lactis
Factors affecting the glucose metabolism ReferencePhosphate inhibition of LDH Jonas et al (1972), Crow & Pritchard (1976)Phosphate inhibition of pyruvate kinase (PYK) Collins & Thomas (1974), Crow & Pritchard (1976)
FBP activation and alteration of LDH enzyme levels Thomas et al (1979)Inhibitory effect of triose phosphates on the mixed-acid pathway enzymes
Thomas et al (1980), Takahashi et al (1982)
Fermentability of sugars Thomas et al (1980), Lohmeier-Vogel et al (1986), Cocaign-Bousquet et al (1996)
Glyceraldehyde 3-phosphate dehydrogenase (GAPDH) activity. This was shown not to have major control on the wild type strain L. Lactis MG1363
Poolman et al (1987), Even et al (1999)
Neves et al (2002)
Presence of oxygen Cogan et al (1989), Jensen et al (2001)The ratio of NADH/NAD+ Garrigues et al (1997)Imbalance between anabolism and catabolism Garrigues et al (2001)The type of strain Cocaign-Bousquet et al (2002)Pyruvate formate lyase (PFL) enzyme levels Melchiorsen et al (2002)Inhibition of alcohol dehydrogenase by the adenine nucleotide pool
Palmfeldt et al (2004)
FBP inhibition of acetate kinase (ACK) and phosphotransacetylase (PTA)
Lopez de Felipe & Gaudu (2009)
Catabolite repression of ack gene Lopez de Felipe & Gaudu (2009)Reviews in the literature Thompson (1987), Cocaign-Bousquet et al (1996),
Neves et al (2005), Kowalczyk & Bardowski (2007), Teusink et al (2011)
Experimental studies have provided much insight into regulatory mechanisms that are associated with the metabolic shift (Table 1). However, the described available hypotheses are derived from a collection of individual experiments independent of each other, conducted with various strains in various growth media under different growth conditions. Besides, the hypotheses have not been consolidated to test their collective influence on the metabolic shift
114
Chapter 6
as a function of growth rate. Due to the complexity, such a test is practically only possible via a computational model. Every model is built with a specific purpose, and the models available in the literature all attempted to answer different questions. It is not atypical but rather usual that these models were built to address a specific question and unfortunately none specifically aimed to explain the metabolic shift.
The first model of L. lactis was a simplified kinetic model fitted to in vivo 13C- and 31P-NMR data from glucose pulse experiments on L. lactis MG5267, that could predict qualitative behaviour under aerobic and anaerobic conditions (Neves et al, 1999). The next model of L. lactis (Hoefnagel et al, 2002b) treated glycolysis as a single reaction and evaluated control points of pyruvate metabolism in the wild-type and mutants of LDH and NADH oxidase (NOX). This approach combined metabolic control analysis, kinetic modelling and experiments and achieved drastic increase in flux towards flavour compounds. The subsequent model from the same authors was a detailed glycolytic model that could predict qualitative behaviour of glucose pulse experiments from Neves et al (1999) (Hoefnagel et al, 2002a). The authors suggested that determination of kinetic parameters would be necessary for quantitative predictions. Another model simulated L. lactis in aerobic conditions using flux distribution analysis, kinetic modelling and metabolic control analysis (Nam et al, 2004), and subsequently assessed the effect of grouped enzyme kinetics as suggested for large biochemical networks (Jin & Lee, 2005). Other models combined nonlinear dynamic analyses with in vivo NMR data from glucose pulse experiments on L. lactis MG1363 to elucidate recovery of glucose uptake after a period of starvation (Voit et al, 2006a, 2006b). The in vivo 13C-NMR data on extracellular glucose and lactate extrusion rate was used to model the effect of extracellular pH on non-growing cells of L. lactis MG1363 by appending a pH module to the Hoefnagel model (Andersen et al, 2009), and more recently also by a qualitative model (Carvalho et al, 2013). Another recent study used L. lactis to benchmark a new approach of identifying a metabolic reaction network from time-series data by combining mathematical modelling and statistical technique (Sriyudthsak et al, 2013). One of the latest available kinetic models of L. lactis (Levering et al, 2012) focussed on the importance of phosphate transport. The model was fitted to the in vivo NMR data from glucose pulse experiments (Neves et al, 2002) and Vmax’s collected from the literature from various strains. Model fitting in an underdetermined problem comes at a price: some parameters were outside the physiological range (Supplementary material, section S4, Table S1). Furthermore this model had a lumped mixed-acid pathway branch, and did not exhibit the metabolic shift.
We therefore could not simply refine an existing model, and had to take a few steps back to formulate a new model, namely one that (i) had physiologically consistent parameters, (ii) had a detailed mixed-acid pathway, (iii) could exhibit the metabolic shift, and ultimately provide a kinetic explanation for it.
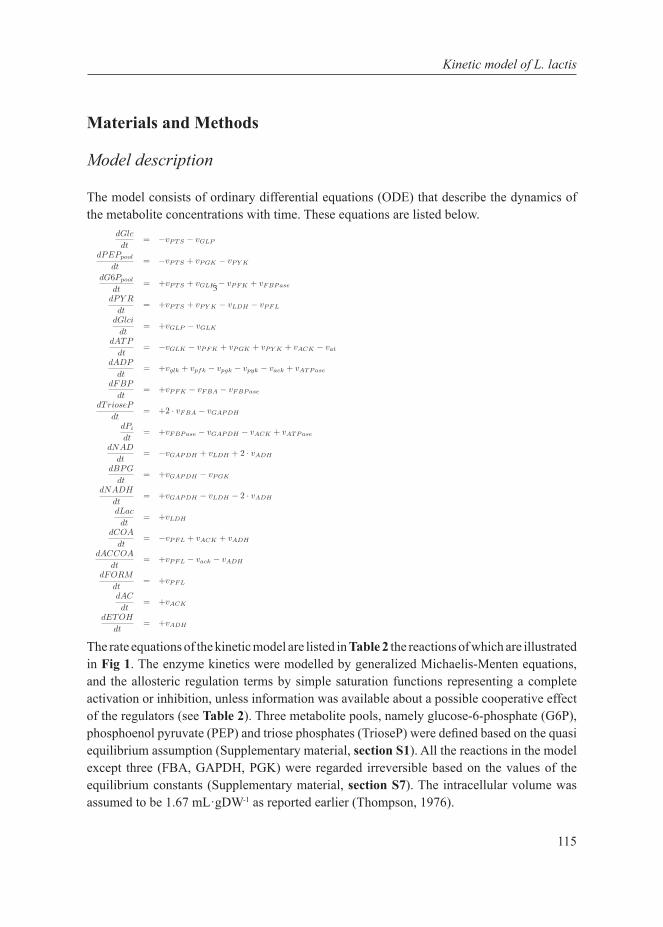
115
Kinetic model of L. lactis
Materials and Methods
Model description The model consists of ordinary differential equations (ODE) that describe the dynamics of the metabolite concentrations with time. These equations are listed below.
The rate equations of the kinetic model are listed in Table 2 the reactions of which are illustrated in Fig 1. The enzyme kinetics were modelled by generalized Michaelis-Menten equations, and the allosteric regulation terms by simple saturation functions representing a complete activation or inhibition, unless information was available about a possible cooperative effect of the regulators (see Table 2). Three metabolite pools, namely glucose-6-phosphate (G6P), phosphoenol pyruvate (PEP) and triose phosphates (TrioseP) were defined based on the quasi equilibrium assumption (Supplementary material, section S1). All the reactions in the model except three (FBA, GAPDH, PGK) were regarded irreversible based on the values of the equilibrium constants (Supplementary material, section S7). The intracellular volume was assumed to be 1.67 mL·gDW-1 as reported earlier (Thompson, 1976).
dG6Ppool
dt= +vPTS + vGLK − vPFK + vFBPase
dPY R
dt= +vPTS + vPYK − vLDH − vPFL
dGlci
dt= +vGLP − vGLK
dATP
dt= −vGLK − vPFK + vPGK + vPYK + vACK − vat
dADP
dt= +vglk + vpfk − vpgk − vpyk − vack + vATPase
dFBP
dt= +vPFK − vFBA − vFBPase
dTrioseP
dt= +2 · vFBA − vGAPDH
dPi
dt= +vFBPase − vGAPDH − vACK + vATPase
dNAD
dt= −vGAPDH + vLDH + 2 · vADH
dBPG
dt= +vGAPDH − vPGK
dNADH
dt= +vGAPDH − vLDH − 2 · vADH
dLac
dt= +vLDH
dCOA
dt= −vPFL + vACK + vADH
dACCOA
dt= +vPFL − vack − vADH
dFORM
dt= +vPFL
dAC
dt= +vACK
dETOH
dt= +vADH
7 Rate equations
vPTS =V PTSmaxf · Glc
KPTSmGlc
· PEPKPTS
mPEP(1 + Glc
KPTSmGlc
+ G6PKPTS
mG6P
)·(1 + PEP
KPTSmPEP
+ PY RKPTS
mPY R
) ·Pi
KPTSaPi
1 + Pi
KPTSaPi
· 1
1 + FBPKPTS
iFBP
vGLP =V GLPmaxf ·
(Glc
KGLPmGlc
− 1KGLP
eq· GlciKGLP
mGlci
)
1 + GlcKGLP
mGlc
+ GlciKGLP
mGlci
4
9. PYK: adp+ h+ pep −→ atp+ pyr
10. LDH: lac+ nad −→ nadh+ pyr
11. PFL: coa+ pyr −→ accoa+ for
12. ACK: accoa+ pi+ adp −→ ac+ coa+ atp
13. ADH: accoa+ 2 · nadh −→ etoh+ coa+ 2 · nad
14. ATPase: adp+ pi ←→ atp
4 EquivalencesFBP ≡ fdpGA3P ≡ g3pBPG ≡ 13dpg3PGA ≡ 3pg2PGA ≡ 2pgglc-D[e] ≡ glclac ≡ lac-LGLCpts ≡ ptsHEX1 ≡ GLKALD ≡ FBAGAPD ≡ GAPDHLDH ≡ LDH-LATPS3r ≡ ATPaseACK ≡ ACK + PTArADH ≡ ADHA + ADHE ≡ ALCD2x+ACALD
5 Simplifications– h and h2o are removed from the reactions
– Based on the equilibrium constant values only the 3 reactions are treated as re-versible: FBA, GAPDH, PGK.
– Compartment notation ( [c], [e]) removed
– No phosphate transport is included in the model.
6 Balance equations (ODE model)
dGlc
dt= −vPTS − vGLP
dPEPpool
dt= −vPTS + vPGK − vPYK
3
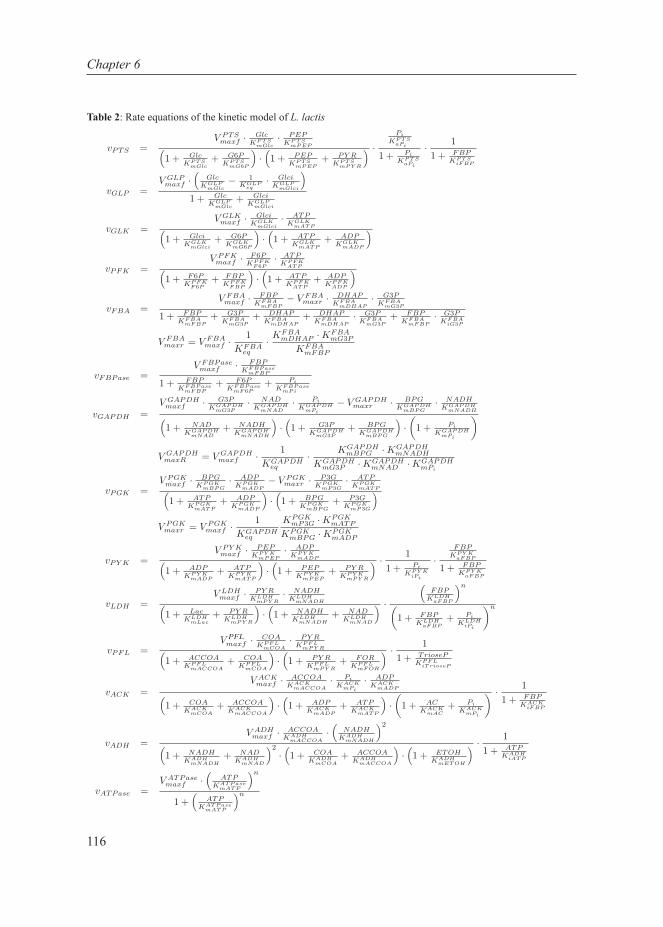
116
Chapter 6
Table 2: Rate equations of the kinetic model of L. lactis
vGLK =V GLKmaxf · Glci
KGLKmGlci
· ATPKGLK
mATP(1 + Glci
KGLKmGlci
+ G6PKGLK
mG6P
)·(1 + ATP
KGLKmATP
+ ADPKGLK
mADP
)
vPFK =V PFKmaxf · F6P
KPFKF6P
· ATPKPFK
ATP(1 + F6P
KPFKF6P
+ FBPKPFK
FBP
)·(1 + ATP
KPFKATP
+ ADPKPFK
ADP
)
vFBA =V FBAmaxf · FBP
KFBAmFBP
− V FBAmaxr · DHAP
KFBAmDHAP
· G3PKFBA
mG3P
1 + FBPKFBA
mFBP
+ G3PKFBA
mG3P
+ DHAPKFBA
mDHAP
+ DHAPKFBA
mDHAP
· G3PKFBA
mG3P
+ FBPKFBA
mFBP
· G3PKFBA
iG3P
V FBAmaxr = V FBA
maxf · 1
KFBAeq
· KFBAmDHAP ·KFBA
mG3P
KFBAmFBP
vFBPase =V FBPasemaxf · FBP
KFBPasemFBP
1 + FBPKFBPase
mFBP
+ F6PKFBPase
mF6P
+ Pi
KFBPasemPi
vGAPDH =V GAPDHmaxf · G3P
KGAPDHmG3P
· NADKGAPDH
mNAD
· Pi
KGAPDHmPi
− V GAPDHmaxr · BPG
KGAPDHmBPG
· NADHKGAPDH
mNADH(1 + NAD
KGAPDHmNAD
+ NADHKGAPDH
mNADH
)·(1 + G3P
KGAPDHmG3P
+ BPGKGAPDH
mBPG
)·(1 + Pi
KGAPDHmPi
)
V GAPDHmaxR = V GAPDH
maxf · 1
KGAPDHeq
· KGAPDHmBPG ·KGAPDH
mNADH
KGAPDHmG3P ·KGAPDH
mNAD ·KGAPDHmPi
vPGK =V PGKmaxf · BPG
KPGKmBPG
· ADPKPGK
mADP
− V PGKmaxr · P3G
KPGKmP3G
· ATPKPGK
mATP(1 + ATP
KPGKmATP
+ ADPKPGK
mADP
)·(1 + BPG
KPGKmBPG
+ P3GKPGK
mP3G
)
V PGKmaxr = V PGK
maxf · 1
KGAPDHeq
KPGKmP3G ·KPGK
mATP
KPGKmBPG ·KPGK
mADP
vPYK =V PYKmaxf · PEP
KPY KmPEP
· ADPKPY K
mADP(1 + ADP
KPY KmADP
+ ATPKPY K
mATP
)·(1 + PEP
KPY KmPEP
+ PY RKPY K
mPY R
) · 1
1 + Pi
KPY KiPi
·FBP
KPY KaFBP
1 + FBPKPY K
aFBP
vLDH =V LDHmaxf · PY R
KLDHmPY R
· NADHKLDH
mNADH(1 + Lac
KLDHmLac
+ PY RKLDH
mPY R
)·(1 + NADH
KLDHmNADH
+ NADKLDH
mNAD
) ·
(FBP
KLDHaFBP
)n
(1 + FBP
KLDHaFBP
+ Pi
KLDHiPi
)n
vPFL =V LDHmaxf · COA
KPFLmCOA
· PY RKPFL
mPY R(1 + ACCOA
KPFLmACCOA
+ COAKPFL
mCOA
)·(1 + PY R
KPFLmPY R
+ FORKPFL
mFOR
) · 1
1 + TriosePKPFL
iTrioseP
vACK =V ACKmaxf · ACCOA
KACKmACCOA
· Pi
KACKmPi
· ADPKACK
mADP(1 + COA
KACKmCOA
+ ACCOAKACK
mACCOA
)·(1 + ADP
KACKmADP
+ ATPKACK
mATP
)·(1 + AC
KACKmAC
+ Pi
KACKmPi
) · 1
1 + FBPKACK
iFBP
vADH =V ADHmaxf · ACCOA
KADHmACCOA
·(
NADHKADH
mNADH
)2
(1 + NADH
KADHmNADH
+ NADKADH
mNAD
)2
·(1 + COA
KADHmCOA
+ ACCOAKADH
mACCOA
)·(1 + ETOH
KADHmETOH
) · 1
1 + ATPKADH
iATP
dt= +vADH
7 Rate equations
vPTS =V PTSmaxf · Glc
KPTSmGlc
· PEPKPTS
mPEP(1 + Glc
KPTSmGlc
+ G6PKPTS
mG6P
)·(1 + PEP
KPTSmPEP
+ PY RKPTS
mPY R
) ·Pi
KPTSaPi
1 + Pi
KPTSaPi
· 1
1 + FBPKPTS
iFBP
vGLP =V GLPmaxf ·
(Glc
KGLPmGlc
− 1KGLP
eq· GlciKGLP
mGlci
)
1 + GlcKGLP
mGlc
+ GlciKGLP
mGlci
9. PYK: adp+ h+ pep −→ atp+ pyr
10. LDH: lac+ nad −→ nadh+ pyr
11. PFL: coa+ pyr −→ accoa+ for
12. ACK: accoa+ pi+ adp −→ ac+ coa+ atp
13. ADH: accoa+ 2 · nadh −→ etoh+ coa+ 2 · nad
14. ATPase: adp+ pi ←→ atp
4 EquivalencesFBP ≡ fdpGA3P ≡ g3pBPG ≡ 13dpg3PGA ≡ 3pg2PGA ≡ 2pgglc-D[e] ≡ glclac ≡ lac-LGLCpts ≡ ptsHEX1 ≡ GLKALD ≡ FBAGAPD ≡ GAPDHLDH ≡ LDH-LATPS3r ≡ ATPaseACK ≡ ACK + PTArADH ≡ ADHA + ADHE ≡ ALCD2x+ACALD
5 Simplifications– h and h2o are removed from the reactions
– Based on the equilibrium constant values only the 3 reactions are treated as re-versible: FBA, GAPDH, PGK.
– Compartment notation ( [c], [e]) removed
– No phosphate transport is included in the model.
6 Balance equations (ODE model)
dGlc
vATPase =V ATPasemaxf ·
(ATP
KATPasemATP
)n
1 +(
ATPKATPase
mATP
)n
8 Allosteric regulation
Effector Interaction type Target reaction
PFL
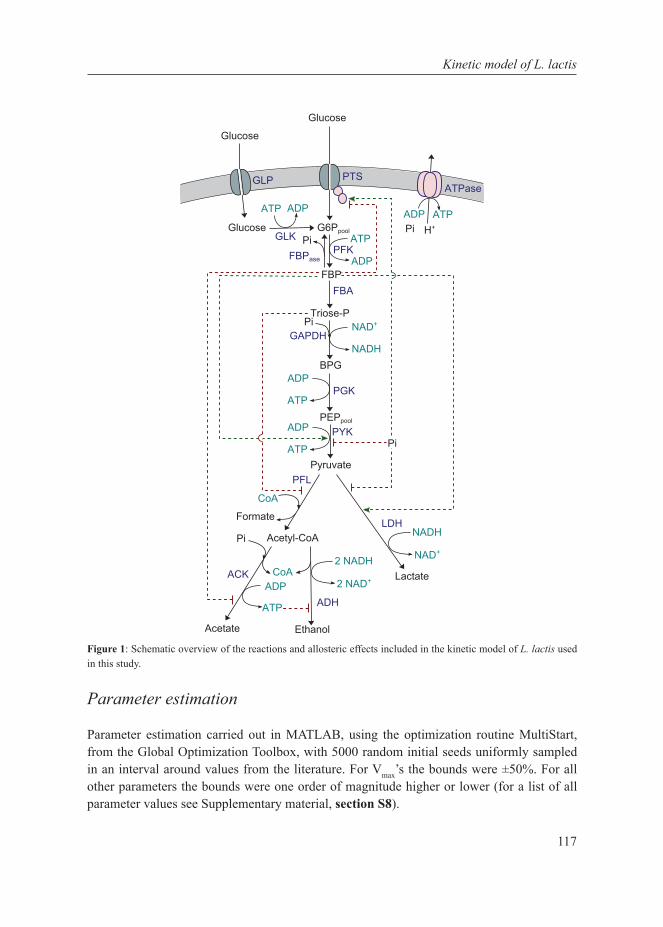
117
Kinetic model of L. lactis
Figure 1: Schematic overview of the reactions and allosteric effects included in the kinetic model of L. lactis used in this study.
Parameter estimation
Parameter estimation carried out in MATLAB, using the optimization routine MultiStart, from the Global Optimization Toolbox, with 5000 random initial seeds uniformly sampled in an interval around values from the literature. For Vmax’s the bounds were ±50%. For all other parameters the bounds were one order of magnitude higher or lower (for a list of all parameter values see Supplementary material, section S8).
118
Chapter 6
Sensitivity analysis
For identifying which parameters have a major influence on the metabolic shift we performed a local sensitivity analysis. First, we defined a performance index to score the “size” of the shift, as the difference between the ratio of lactate production and glycolytic flux at high (D = 0.6 h-1) and low dilution rate (D = 0.15 h-1). For an ideal metabolic shift (no lactate production at low dilution rate and only lactate production at high dilution rate) this ratio difference is 2. From the measured flux ratios, the ratio difference is about 1.3 (at low D lactate is not zero, and at high D, part of the glycolytic flux is directed towards biomass and therefore not entirely towards lactate). Then, we individually perturbed all the estimated kinetic parameters while keeping the other parameters fixed (i.e. local sensitivity analysis), by a finite perturbation (+/- %), calculated the ratio between the produced effect (shift score variation) and the perturbation and finally normalized all the ratios by the reference values (of the parameters and of the score function).
Results
Based largely on the Hoefnagel model, the Levering model could fit the data from Neves et al, (2002). We used the same approach and we based our model on the Hoefnagel model. All models need data to fit unknown parameters. We had a complete set of in vivo-like Vmax’s for almost all glycolytic and downstream pathway enzymes available for one strain, L. lactis MG1363 grown at standard steady-state conditions (Chapters 3 and 4). These Vmax’s were measured under the same in vivo-like assay conditions for all enzymes making it an ideal set for a model. With defined mixed-acid pathway reactions, and the in vivo-like Vmax’s (allowed to vary by only ± 50%), we commenced fitting the model with in vivo 13C- and 31P-NMR data from glucose pulse experiments in L. lactis MG1363 under anaerobic conditions (Neves et al, 2002).
Glucose pulse experiment with non-growing cells
We estimated the parameters in the kinetic model with the in vivo concentrations of intracellular metabolites from non-growing cells of L. lactis MG1363 pulsed with 80 mM glucose under anaerobic conditions (Neves et al, 2002), in buffers with and without phosphate. We could not, however, use both because of Pi mass imbalance (Levering et al, 2012), which might be due to mobilization of Pi from phospholipids. A fictitious reaction to achieve Pi recovery would be required to overcome this, but it would bring in additional uncertainty in the model. Therefore, we only use glucose pulse experiments without the phosphate buffer.
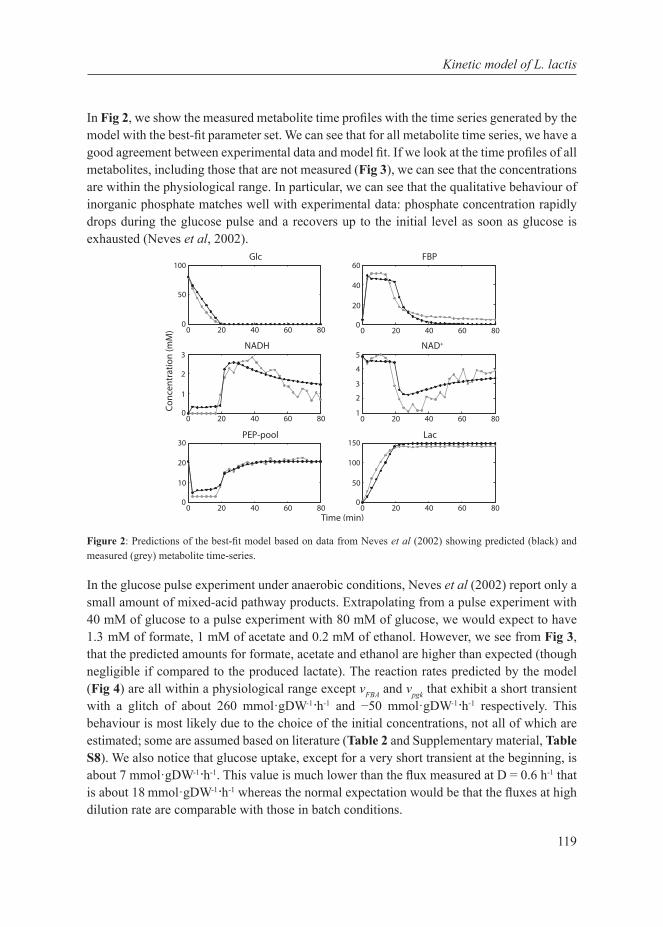
119
Kinetic model of L. lactis
In Fig 2, we show the measured metabolite time profiles with the time series generated by the model with the best-fit parameter set. We can see that for all metabolite time series, we have a good agreement between experimental data and model fit. If we look at the time profiles of all metabolites, including those that are not measured (Fig 3), we can see that the concentrations are within the physiological range. In particular, we can see that the qualitative behaviour of inorganic phosphate matches well with experimental data: phosphate concentration rapidly drops during the glucose pulse and a recovers up to the initial level as soon as glucose is exhausted (Neves et al, 2002).
0 20 40 60 800
50
Glc FBP
NADH NAD+
PEP-pool Lac
Time (min)
100
0 20 40 60 800
50
150
100
0 20 40 60 800
10
30
20
0 20 40 60 800
20
60
40
0 20 40 60 800
1
3
2
0 20 40 60 801
2
4
3
5
Conc
entr
atio
n (m
M)
Figure 2: Predictions of the best-fit model based on data from Neves et al (2002) showing predicted (black) and measured (grey) metabolite time-series.
In the glucose pulse experiment under anaerobic conditions, Neves et al (2002) report only a small amount of mixed-acid pathway products. Extrapolating from a pulse experiment with 40 mM of glucose to a pulse experiment with 80 mM of glucose, we would expect to have 1.3 mM of formate, 1 mM of acetate and 0.2 mM of ethanol. However, we see from Fig 3, that the predicted amounts for formate, acetate and ethanol are higher than expected (though negligible if compared to the produced lactate). The reaction rates predicted by the model (Fig 4) are all within a physiological range except vFBA and vpgk that exhibit a short transient with a glitch of about 260 mmol·gDW-1·h-1 and −50 mmol·gDW-1·h-1 respectively. This behaviour is most likely due to the choice of the initial concentrations, not all of which are estimated; some are assumed based on literature (Table 2 and Supplementary material, Table S8). We also notice that glucose uptake, except for a very short transient at the beginning, is about 7 mmol·gDW-1·h-1. This value is much lower than the flux measured at D = 0.6 h-1 that is about 18 mmol·gDW-1·h-1 whereas the normal expectation would be that the fluxes at high dilution rate are comparable with those in batch conditions.
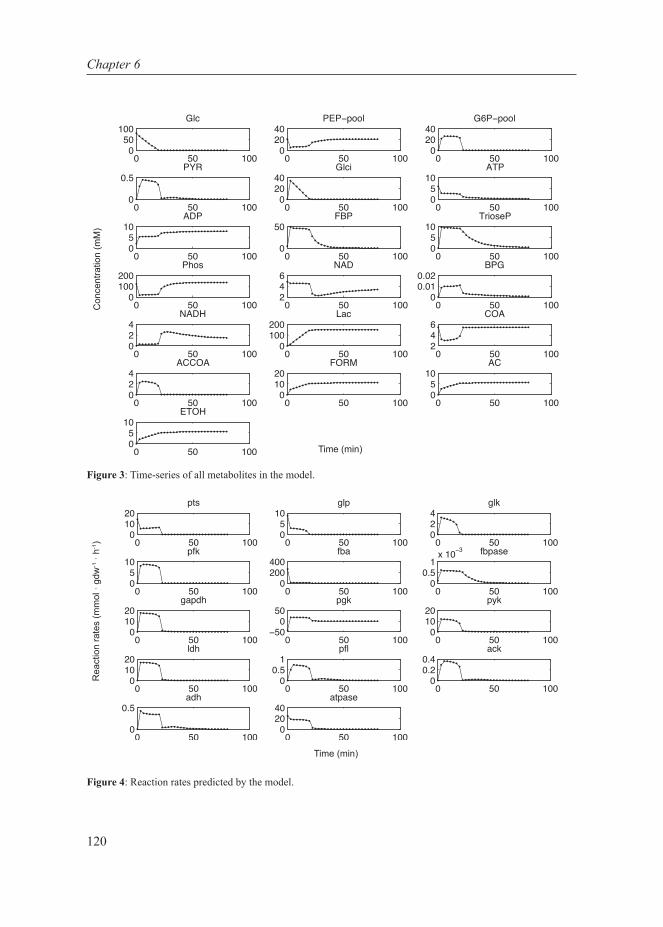
120
Chapter 6
Figure 3: Time-series of all metabolites in the model.
Figure 4: Reaction rates predicted by the model.
0 50 1000
50100
Glc
0 50 1000
2040
PEP pool
0 50 1000
2040
G6P pool
0 50 1000
0.5PYR
0 50 1000
2040
Glci
0 50 10005
10ATP
0 50 10005
10ADP
0 50 1000
50FBP
0 50 10005
10TrioseP
0 50 1000
100200
Phos
0 50 100246
NAD
0 50 1000
0.010.02
BPG
0 50 100024
NADH
0 50 1000
100200
Lac
0 50 100246
COA
0 50 100024
ACCOA
0 50 1000
1020
FORM
0 50 10005
10AC
0 50 10005
10ETOH
Time (min)
Con
cent
ratio
n (m
M)
0 50 1000
1020
pts
0 50 10005
10glp
0 50 100024
glk
0 50 10005
10pfk
0 50 1000
200400
fba
0 50 1000
0.51
x 10 3 fbpase
0 50 1000
1020
gapdh
0 50 10050
050
pgk
0 50 1000
1020
pyk
0 50 1000
1020
ldh
0 50 1000
0.51
pfl
0 50 1000
0.20.4
ack
0 50 1000
0.5adh
0 50 1000
2040
atpase
Time (min)
Rea
ctio
n ra
tes
(mm
ol ·
gdw
-1 ·
h-1)
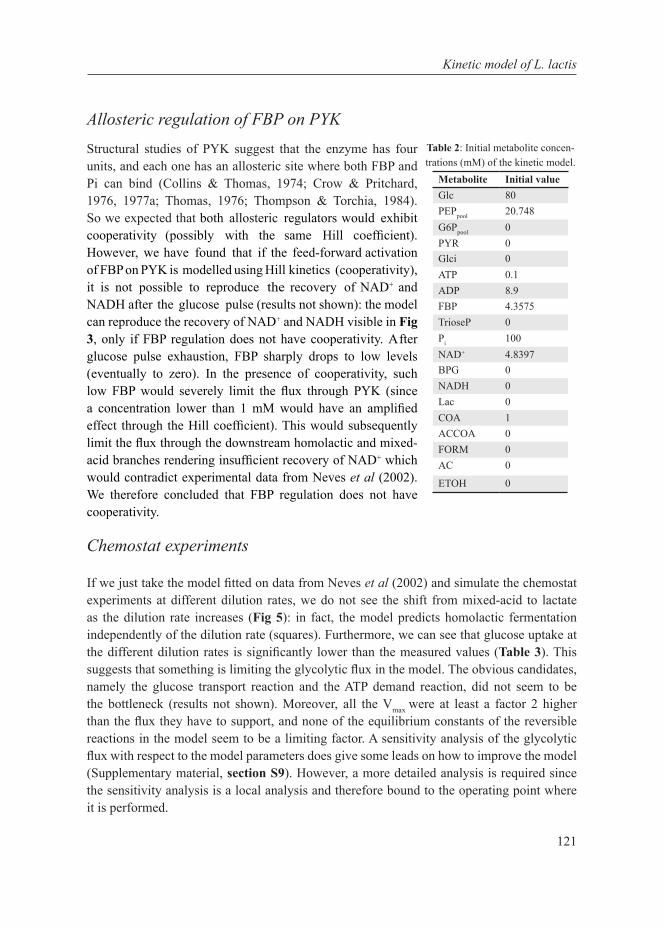
121
Kinetic model of L. lactis
Allosteric regulation of FBP on PYK
Chemostat experiments
If we just take the model fitted on data from Neves et al (2002) and simulate the chemostat experiments at different dilution rates, we do not see the shift from mixed-acid to lactate as the dilution rate increases (Fig 5): in fact, the model predicts homolactic fermentation independently of the dilution rate (squares). Furthermore, we can see that glucose uptake at the different dilution rates is significantly lower than the measured values (Table 3). This suggests that something is limiting the glycolytic flux in the model. The obvious candidates, namely the glucose transport reaction and the ATP demand reaction, did not seem to be the bottleneck (results not shown). Moreover, all the Vmax were at least a factor 2 higher than the flux they have to support, and none of the equilibrium constants of the reversible reactions in the model seem to be a limiting factor. A sensitivity analysis of the glycolytic flux with respect to the model parameters does give some leads on how to improve the model (Supplementary material, section S9). However, a more detailed analysis is required since the sensitivity analysis is a local analysis and therefore bound to the operating point where it is performed.
Table 2: Initial metabolite concen-trations (mM) of the kinetic model.
Metabolite Initial valueGlc 80PEPpool 20.748G6Ppool 0PYR 0Glci 0ATP 0.1ADP 8.9FBP 4.3575TrioseP 0Pi 100NAD+ 4.8397BPG 0NADH 0Lac 0COA 1ACCOA 0FORM 0AC 0
ETOH 0
Structural studies of PYK suggest that the enzyme has four units, and each one has an allosteric site where both FBP and Pi can bind (Collins & Thomas, 1974; Crow & Pritchard, 1976, 1977a; Thomas, 1976; Thompson & Torchia, 1984). So we expected that both allosteric regulators would exhibit cooperativity (possibly with the same Hill coefficient). However, we have found that if the feed-forward activation of FBP on PYK is modelled using Hill kinetics (cooperativity), it is not possible to reproduce the recovery of NAD+ and NADH after the glucose pulse (results not shown): the model can reproduce the recovery of NAD+ and NADH visible in Fig 3, only if FBP regulation does not have cooperativity. After glucose pulse exhaustion, FBP sharply drops to low levels (eventually to zero). In the presence of cooperativity, such low FBP would severely limit the flux through PYK (since a concentration lower than 1 mM would have an amplified effect through the Hill coefficient). This would subsequently limit the flux through the downstream homolactic and mixed-acid branches rendering insufficient recovery of NAD+ which would contradict experimental data from Neves et al (2002). We therefore concluded that FBP regulation does not have cooperativity.

122
Chapter 6
If we estimate the parameters based on both glucose pulse data and flux data from chemostat experiments we cannot achieve a good fit for both. By varying the relative weight of the prediction error for the two data sets, we can go from a model that reproduces data from Neves et al (2002) (see previous section) to a model that exhibits a metabolic shift (Fig 5). The predicted metabolic shift shows higher lactate than that in experimental data (Fig 5). It is likely that such a difference just reflects the fact that we have neglected the fluxes from the glycolytic intermediate toward biomass. However, the absolute values of the predicted fluxes are much lower than the measured fluxes (Table 3). In particular, the glucose uptake is much lower than expected, a feature also observed with the model fitted only on data from Neves et al (2002) (Table 3).
Fig 5: Ratio of lactate production and glycolytic flux (▲) based on measured fluxes; (■) as predicted by the model fitted with in vivo NMR data from Neves et al (2002) and (●) as predicted by the model fitted with in vivo NMR data and chemostat data (Chapters 3 and 4, this thesis).
Table 3: Measured and predicted glycolytic fluxes in mmol·gDW-1·h-1
Model fitted on Flux \ D (h-1) 0.15 0.3 0.45 0.5 0.6Data from Neves et al (2002)
J measured 4.6396 9.0459 14.2330 16.8662 18.3204J predicted 4.7749 7.5422 7.5516 7.5972 7.6448
Chemostat data (this thesis)
J measured 4.6396 9.0459 14.2330 16.8662 18.3204J predicted 1.9048 3.4126 7.7288 8.0477 8.2673
Sensitivity analysis of parameters affecting the metabolic shift
For the best-fit model (Fig 5●) (fitted on glucose pulse and chemostat data), we performed a sensitivity analysis to identify which parameters affect the metabolic shift from homolactic to mixed-acid fermentation. Fig 6 shows the histogram of the normalized sensitivities. It is evident that a vast majority of the parameters (about 60 out of 83 have no significant influence on the metabolic shift). In Table 4, we report the top list of parameters with the highest influence on the metabolic shift (scaled sensitivity higher than 0.2). The distribution plots of parameters for all enzymes are provided in the Supplementary material, section S10.
0.1 0.15 0.2 0.25 0.3 0.35 0.4 0.45 0.5 0.55 0.60.2
0.4
0.6
0.8
1
1.2
1.4
1.6
1.8
2
D [h-1]
Flux
ratio

123
Kinetic model of L. lactis
The presence of the Hill coefficient nldh in the top of the list seems to suggest that any potential cooperativity in the regulation of LDH by FBP and Pi can have huge effect on the metabolic shift. LDH is known to be a tetramer with four active sites but just two allosteric sites. The phosphate can compete for all sites, so competing with FBP for the allosteric site as well as with the substrate for the active site (Feldman-Salit et al, 2013). So potentially LDH regulation can exhibit cooperativity, but this has not been characterized yet. In general, we can see that FBP and Pi seem to play a crucial role in the metabolic shift. In fact, the kinetic parameters representing the allosteric regulation of these molecules on PTS, LDH and PYK are present in the list. In particular, the long debated role of FBP activation on LDH seems to find a confirmation: KaFBP,ldh is the parameter with the third highest sensitivity. In the list, we also find the Vmax of glucose transport (PTS). This is not very surprising, if we consider that glycolytic flux influences the fraction towards lactate or mixed-acids (Goel et al, Chapter 5). Similarly, we could have anticipated sensitive parameters from the pyruvate branches (LDH, ADH) although not necessarily the Vmax.
Discussion
Our first research question was whether adapting the remaining model parameters with the new Vmax’s from chemostat experiments and glucose pulse experiments would yield a good fit to the experimental results, as we could not conclude a priori whether the new Vmax’s would change the model predictions. Having enough parameters, one might expect that any model would fit any data. However, it is not this simple, since structural aspects of the model, i.e. stoichiometric and allosteric interactions, will restrict the types of qualitative behaviour that a model can display (Gunawardena, 2010). We could indeed fit the model with the new Vmax’s. Doing so, we gained a valuable insight into the FBP-Pi-PYK cooperativity: the two allosteric regulators of PYK, FBP and Pi, have a different cooperativity, though they bind to the same allosteric site on each of the four active units of the enzyme.
0 0.2 0.4 0.6 0.8 1 1.2 1.4 1.6 1.8 20
10
20
30
40
50
60
70
Num
ber o
f fits
Fig 6: Kinetic parameters with the highest normalized sensitivity for the metabolic shift.
Table 4: Top list of the kinetic parameters with the highest normalized sensitivity for the metabolic shift.
Parameter Normalized sensitivitynldh 1.8316
Vmax, pts 1.1893KaFBP, ldh 1.1299Vmax, ldh -1.0270KiPi, ldh -0.9961
KmPEP, pts -0.7956KmPYR, ldh 0.6174KiFBP, pts 0.4020KaPi, pts -0.3187Vmax, adh -0.2910KaFBP, pyk -0.2856KmLac, ldh -0.2489KiPi, pyk 0.2363
npyk -0.2319KmETOH, adh -0.2223
Normalized Sensitivity

124
Chapter 6
So we reached the same point as the Levering model with respect to fitting glucose pulse data, but with physiologically consistent parameters, and with Vmax’s from a single strain under steady state conditions. The model, however, does not include pH as do most kinetic models of L. lactis glycolysis. The pH kinetics in L. lactis have indeed been characterized after a glucose pulse (Molenaar et al, 1991; Andersen et al, 2009), but to incorporate it into the model, knowledge of the buffer capacity of the cytoplasm is essential. Therefore, the ATPase in the model (the only ATP sink) did not include proton transport. Due to this simplification, however, we were unable to assess the possible influence of pH on pyruvate metabolism.
The next step was to investigate the metabolic shift. Since the model fitted with dynamic glucose pulse data alone did not predict the chemostat data correctly, we had to include chemostat fluxes in combination with dynamic glucose pulse data as input for the error function minimized during the parameter fitting. This model reproduced the metabolic shift (Fig 5). The sensitivity analysis performed on this model indicated that the activation coefficient of LDH by FBP had a high influence on the metabolic shift, besides any potential cooperativity in the regulation of LDH by FBP and Pi. This reiterates the role of FBP and Pi in regulating the metabolic shift (Table 4). It is interesting to note here that the Lactobacillus plantarum, another lactic acid bacterium, does not exhibit the metabolic shift and its LDH is not activated by FBP (Feldman-Salit et al, 2013).
A limitation of the model is that the glycolytic flux is somehow constrained and does not increase above a certain value (Table 3). Thus the model always has lower glucose consumption rate than measured. The cause for this is not yet obvious. There could, however, be a few possible explanations:
1. The glucose pulse experiments are conducted in batch, non-growing conditions, whereas all chemostat experiments are in growing conditions. The difference between growing and non-growing conditions could probably account for the difference in glucose uptake between glucose pulse and the chemostat data at D = 0.6 h-1 (we would expect the fluxes at the high dilution rate to be comparable with those in batch conditions). Therefore, we should include the fluxes towards biomass while modelling chemostat conditions.
2. One could ask : is it physiologically meaningful at all to combine non-growing dynamic glucose pulse data and glucose-limited steady state data? There might be a correction factor, which could depend on differences in the expression of transporters between the two conditions. This expression data, however, is not available for glucose pulse experiments.
3. The difference in glycolytic control of growing and non-growing cells is quite dramatic. In growing cells, glycolysis runs at the maximal rate and ATP demanding processes do not have significant control on the glycolytic flux, whereas in non-growing cells ATP demand has a high control (Koebmann et al, 2002). Currently, only the same ATPase
125
Kinetic model of L. lactis
reaction is used for both batch and chemostat conditions. Thus the ATPase reaction (serving as the only ATP sink in the model) might have different parameters (or even functional forms) under different experimental conditions. In conclusion, while fitting the model to data from growing and non-growing conditions, we might need to also model the ATP demand with different reactions.
4. Certain missing Vmax’s could have an influence. Although we have evidence that the Vmax of glycolytic enzymes change by no more than 20%, a variation that cannot account for the changes in fluxes, we do not have measurements for Vmax of PTS and PFL. The protein level and consequently maximal rate of PFL* (Melchiorsen et al, 2002) and possibly PTS* might change significantly as a function of the dilution rate (or equivalently growth rate) and these changes might play a significant role in the mechanism of the metabolic shift. But the effect of PFL on the maximal glycolytic flux might probably be negligible because at high glycolytic rates PFL flux is generally low (Goel et al, Chapter 4).
The difference between growing and non-growing conditions could also be investigated by gathering information about the kinetic parameters for growing cells by measuring dynamic behaviour of metabolites on batch growing cells pulsed with glucose in the same medium as that of the chemostats. Alternatively, additional in vivo NMR data of mutant strains pulsed under aerobic and/or anaerobic conditions that have flux through the mixed-acid branch can be used to gather information about the kinetic parameters of this branch for non-growing cells.
In conclusion, we successfully obtained a kinetic model of L. lactis capable of reproducing the metabolic shift. The model provided leads for modelling growing and non-growing cells and reconfirmed the importance of FBP and Pi. But additional efforts are required to get a complete mechanistic understanding of the metabolic shift.
Acknowledgements
We thank WM de Vos for critically reading the manuscript. This work is supported by the SysMO-LAB (Systems Biology of Microorganisms – Lactic Acid Bacteria), the Dutch Technology Foundation STW which is part of the Netherlands Organisation for Scientific Research (NWO) and partly funded by the Ministry of Economic Affairs, Agriculture and Innovation (grant 08080), the Kluyver Centre for Genomics of Industrial Fermentation and the Netherlands Consortium for Systems Biology (NCSB), within the framework of the Netherlands Genomics Initiative (NGI) / NWO.
*For PTS, the changes are slightly modest: the transcripts indicate that from D = 0.5 to 0.6 h-1, mannose PTS and glucose permease expression are upregulated significantly by 43% and 18% respectively. Proteome analysis shows that the mannose PTS increases about 17% from D = 0.15 to 0.5 h-1, but the change at 0.6 h-1 is not significant. The protein level of PFL does change significantly: at D = 0.6 h-1, it decreases to one-fourth of that at 0.15 (Goel et al, Chapter 4).

126
Chapter 6
Supplementary material
In this section, we describe our assumptions and simplifications (e.g. quasi equilibrium reactions and metabolite pools definitions); we present the results of the sensitivity analysis for glucose uptake; and finally the estimated kinetic parameters and their distributions.
Contents
S1 Quasi-equilibrium reactions and metabolite pools S2 Equivalences S3 Simplifications S4 Comparison of Vmax
S5 Allosteric regulation S6 Cell volume S7 Equilibrium constants S8 Parameter estimation
S8.1 Km
S8.2 Vmax
S8.3 Keq
S8.4 Ki and Ka
S8.5 Initial concentrationsS9 Sensitivity analysis for glucose uptakeS10 Parameter distributions
S10.1 Glucose pulse experiment with non-growing cellsS10.2 Chemostat experiments
S1 Quasi-equilibrium reactions and metabolite pools
1. PGI: [c] : g6p ↔ f 6pg6p pool: g6p, f6p
2. TPI: [c] : dhap ↔ g3ptriosep pool: dhap, g3p
3. PGK+ PGM+ ENO:[c] : 13dpg + adp ↔ 3pg + atp[c] : 3pg ↔ 2pg[c] : 2pg ↔ peppep pool: 3pg, 2pg, pep
S2 Equivalences FBP ≡ fdpGA3P ≡ g3pBPG ≡ 13dpg3PGA ≡ 3pg2PGA ≡ 2pgglc-D[e] ≡ glclac ≡ lac-LGLCpts ≡ ptsHEX1 ≡ GLKALD ≡ FBAGAPD ≡ GAPDHLDH ≡ LDH-LATPS3r ≡ ATPaseACK ≡ ACK + PTArADH ≡ ADHA + ADHE ≡ ALCD2x+ACALD

127
Kinetic model of L. lactis
S3 Simplifications
• H+ and H2O are removed from the reactions• Based on the equilibrium constant values only 3 reactions are treated as reversible: FBA,
GAPDH, PGK.• Compartment notation ([c], [e]) removed• No phosphate transport is included in the model.
S4 Comparison of Vmax
Table S1: The table shows the values for Vmax from the literature and this thesis. The units are mmol·Lcyt-1·s-1.
ACALDH = Acetaldehyde dehydrogenase, MAB= Mixed-acid branch.Vmax Levering et al, 2012 Hoefnagel et al, 2002a Chapter 5,
this thesisChapter 4, this thesis
PTS 4.8117 2.6667 - -GLK - 1 0.9686 0.9078PFK 20.1788 3.7833 11.1045 11.6134FBA ⇓ 2.64502 18.3333 41.9518 42.6821FBPase 183.348 1.6667e-04 - -GAPDH ⇓ 37.1894 83.0667 3.6331 17.3988PGK - 15.3333 41.5165 43.4278PGM - 22.3333 28.1663 21.5267ENO ⇓ - 26.6667 8.3120 15.0667PGK+PGM+ENO ⇓ 5.96394 - - -PGK+PGM+ENO ⇑ 60.3524 - - -PYK 28.4132 33.8333 15.3480 19.3584LDH 20848 55 38.2039 45.4426PFL - 1.9 - -ACALDH - 1.6667 - -ADH - 4.5 0.8508 1.09697PTA - 12 1.4396 1.74634ACK - 8.3333 32.0556 25.9487MAB 41.6241 - - -ATPase 0.0124696 16.6667 - -
• Vmax are expressed in mmol·Lcyt-1·s-1. For the unit conversion, a volume ratio of 0.0478 is assumed as in Neves et al
(2002).• For the data in this thesis, the volume ratio (0.0012 ÷ 0.0014) is calculated by using the dry weight measurement and
the cytosolic volume 1.67 mL·gDW-1.• For the Vmax of PTS reaction, Castro et al (2009) report values of 0.25 µmol·min-1·mgprot
-1 for mannose PTS and 0.31 µmol·min-1·mgprot
-1 for the combination of cellobiose PTS and the glucose permease. If we assume the overall Vmax to be the sum of the two, namely, 0.56 µmol·min-1·mgprot
-1, a cytosolic volume of 1.67 mL·gDW-1 and 43% protein composition gives a Vmax of 2.4 mmol·Lcyt
-1·s-1. This is in agreement with the value from Hoefnagel et al (2002a) where the Vmax was assumed to be equal to the maximum measured flux of 160 mmol·lcyt
-1·min-1 = 2.67 mmol·Lcyt-1·s-1
for aerobic conditions (and 190 mmol·Lcyt-1·min-1 = 3.167 mmol·Lcyt
-1·s-1 for anaerobic conditions).
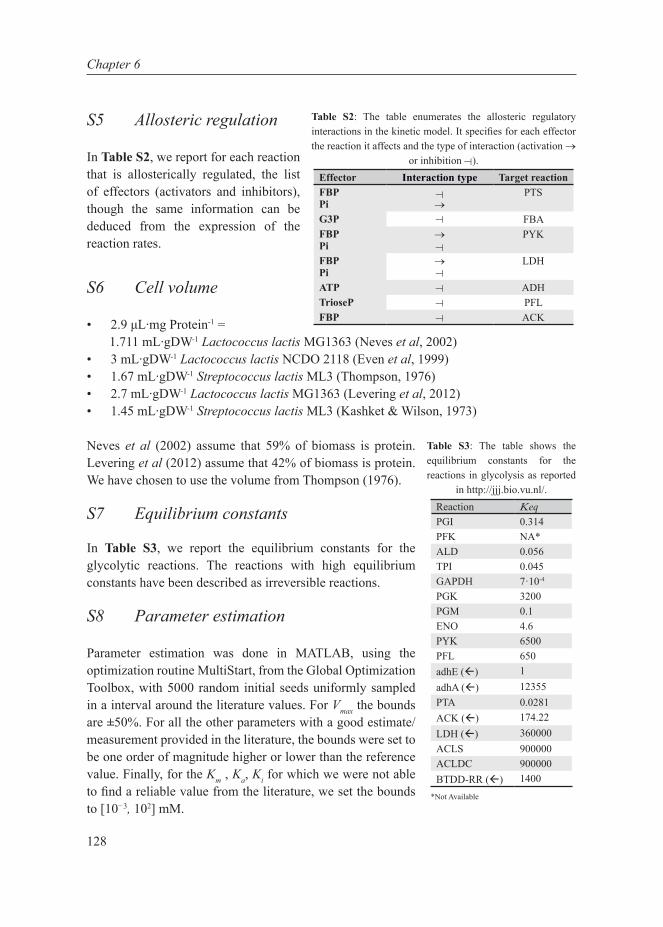
128
Chapter 6
S5 Allosteric regulation
In Table S2, we report for each reaction that is allosterically regulated, the list of effectors (activators and inhibitors), though the same information can be deduced from the expression of the reaction rates.
S6 Cell volume
• 2.9 μL∙mg Protein-1 = 1.711 mL∙gDW-1 Lactococcus lactis MG1363 (Neves et al, 2002)
• 3 mL∙gDW-1 Lactococcus lactis NCDO 2118 (Even et al, 1999)• 1.67 mL∙gDW-1 Streptococcus lactis ML3 (Thompson, 1976)• 2.7 mL∙gDW-1 Lactococcus lactis MG1363 (Levering et al, 2012)• 1.45 mL∙gDW-1 Streptococcus lactis ML3 (Kashket & Wilson, 1973)
Neves et al (2002) assume that 59% of biomass is protein. Levering et al (2012) assume that 42% of biomass is protein. We have chosen to use the volume from Thompson (1976).
S7 Equilibrium constants
In Table S3, we report the equilibrium constants for the glycolytic reactions. The reactions with high equilibrium constants have been described as irreversible reactions.
S8 Parameter estimation Parameter estimation was done in MATLAB, using the optimization routine MultiStart, from the Global Optimization Toolbox, with 5000 random initial seeds uniformly sampled in a interval around the literature values. For Vmax the bounds are ±50%. For all the other parameters with a good estimate/measurement provided in the literature, the bounds were set to be one order of magnitude higher or lower than the reference value. Finally, for the Km , Ka, Ki for which we were not able to find a reliable value from the literature, we set the bounds to [10−3, 102] mM.
Table S2: The table enumerates the allosteric regulatory interactions in the kinetic model. It specifies for each effector the reaction it affects and the type of interaction (activation →
or inhibition ).Effector Interaction type Target reactionFBPPi →
PTS
G3P FBAFBPPi
→ PYK
FBPPi
→ LDH
ATP ADHTrioseP PFLFBP ACK⊥
⊥⊥⊥⊥⊥
⊥
⊥
Table S3: The table shows the equilibrium constants for the reactions in glycolysis as reported
in http://jjj.bio.vu.nl/. Reaction KeqPGI 0.314PFK NA*ALD 0.056TPI 0.045GAPDH 7·10-4
PGK 3200PGM 0.1ENO 4.6PYK 6500PFL 650adhE () 1adhA () 12355PTA 0.0281ACK () 174.22LDH () 360000ACLS 900000ACLDC 900000BTDD-RR () 1400
*Not Available
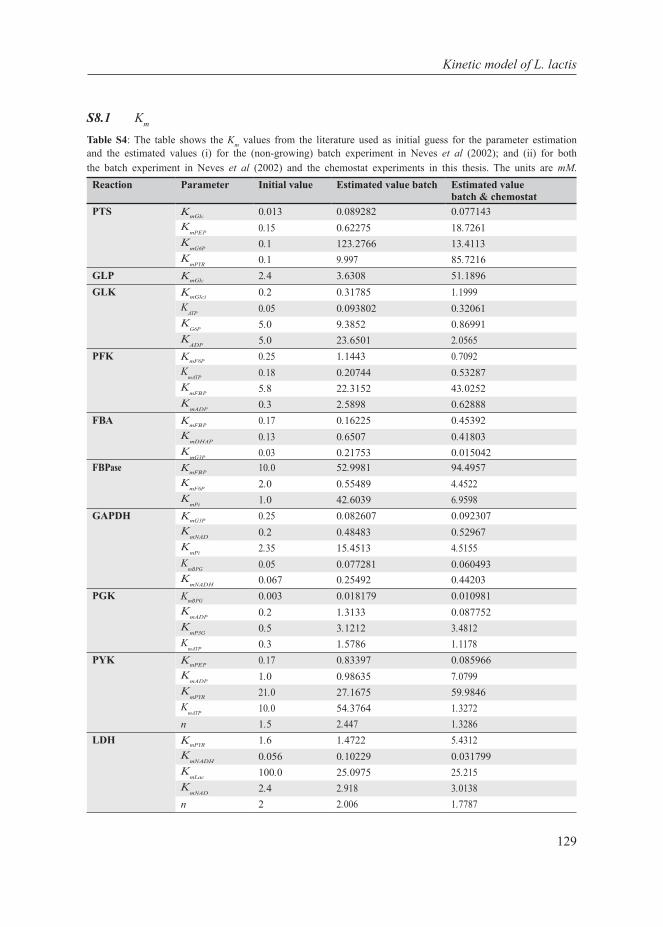
129
Kinetic model of L. lactis
S8.1 Km
Table S4: The table shows the Km values from the literature used as initial guess for the parameter estimation and the estimated values (i) for the (non-growing) batch experiment in Neves et al (2002); and (ii) for both the batch experiment in Neves et al (2002) and the chemostat experiments in this thesis. The units are mM.
Reaction Parameter Initial value Estimated value batch Estimated valuebatch & chemostat
PTS KmGlc 0.013 0.089282 0.077143K
mPEP 0.15 0.62275 18.7261K
mG6P 0.1 123.2766 13.4113K
mPYR 0.1 9.997 85.7216GLP KmGlc 2.4 3.6308 51.1896GLK KmGlci 0.2 0.31785 1.1999
KATP 0.05 0.093802 0.32061
KG6P 5.0 9.3852 0.86991
KADP 5.0 23.6501 2.0565
PFK KmF6P 0.25 1.1443 0.7092K
mATP 0.18 0.20744 0.53287K
mFBP 5.8 22.3152 43.0252K
mADP 0.3 2.5898 0.62888FBA KmFBP 0.17 0.16225 0.45392
KmDH AP 0.13 0.6507 0.41803
KmG3P 0.03 0.21753 0.015042
FBPase KmFBP 10.0 52.9981 94.4957K
mF6P 2.0 0.55489 4.4522K
mPi 1.0 42.6039 6.9598GAPDH KmG3P 0.25 0.082607 0.092307
KmNAD 0.2 0.48483 0.52967
KmPi 2.35 15.4513 4.5155
KmBPG 0.05 0.077281 0.060493
KmNADH 0.067 0.25492 0.44203
PGK KmBPG 0.003 0.018179 0.010981K
mADP 0.2 1.3133 0.087752K
mP3G 0.5 3.1212 3.4812K
mATP 0.3 1.5786 1.1178PYK KmPEP 0.17 0.83397 0.085966
KmADP 1.0 0.98635 7.0799
KmPYR 21.0 27.1675 59.9846
KmATP 10.0 54.3764 1.3272
n 1.5 2.447 1.3286LDH KmPYR 1.6 1.4722 5.4312
KmN ADH 0.056 0.10229 0.031799
KmLac 100.0 25.0975 25.215
KmNAD 2.4 2.918 3.0138
n 2 2.006 1.7787

130
Chapter 6
PFL KmCOA 0.007 0.037644 0.015887K
mPYR 1.0 6.6222 6.8645K
mAC COA 0.05 0.21784 0.063781K
mFOR 24.0 145.0798 180.0808ACK KmAC COA 0.06 0.19203 0.2979
KmPi 5.0 42.8965 5.7407
KmADP 0.5 1.3117 1.6392
KmCOA 0.1 0.23667 0.058144
KmATP 7.0 52.3291 36.2953
KmAC 7.0 5.0463 25.0661
ADH KmAC COA 0.007 0.0022651 0.0058509K
mNADH 0.025 0.038001 0.18006K
mCOA 0.008 0.032929 0.036061K
mNAD 0.08 0.25376 0.60243K
mETOH 1.0 2.3496 7.3836ATPase KmATP 1.5 8.1534 8.3166
n 1 2.9742 2.6217
S8.2 Vmax
Table S5: The table shows the Vmax values from the literature used as initial guess for the parameter estimation and the estimated values (i) for the (non-growing) batch experiment in Neves et al (2002); and (ii) for both the batch experiment in Neves et al (2002) and the chemostat experiments in this thesis. The units are mmol·Lcyt
-1·s-1
S8.3 Keq
Table S6: The table shows the Keq values from the literature used as initial guess for the parameter estimation and the estimated values (i) for the (non-growing) batch experiment in Neves et al (2002); and (ii) for both the batch experiment in Neves et al, (2002) and the chemostat experiments in this thesis.
Reaction Initial Keq Estimated keq
batchEstimated keq
batch & chemostat
GLP 1 0.90374 0.95184FBA 0.056 0.071992 0.035276GAPDH 7 · 10−4 0.00063166 0.00080527
PGK 3200.0 105.6077 1505.3406
Reaction Initial Vmax Estimated Vmax
batch Estimated Vmax
batch & chemostat
PTS 0.94 4.3712 9.373GLP 0.34 0.24741 0.14986GLK 0.9 1.0528 0.67818PFK 11.61 6.8929 15.6825FBA 42.68 46.7356 29.6565FBPaseGAPDH
1.67 · 10-4
17.49.7228 · 10-5
19.55482.3592 · 10-4
21.4867PGK 43.43 57.5963 30.65PYK 19.36 11.1317 16.3218LDH 45.44 40.0955 34.6019PFL 1.9 4.6293 1.6775ACK 13.85 7.5659 12.8883ADH 1.1 1.3676 1.6005ATPase 5.0 28.9044 83.4745

131
Kinetic model of L. lactis
S8.4 Ki and Ka
Table S7: The table shows the Ki and Ka values from the literature used as initial guess for the parameter estimation and the estimated values (i) for the (non-growing) batch experiment in Neves et al (2002); and (ii) for both the batch experiment in Neves et al (2002) and the chemostat experiments in this thesis. The units are mM.
Reaction Parameter Initial value Estimated value batch
Estimated valuebatch & chemostat
PTS KiFBP 6.0 30.2477 41.2149K
aPi 1.5 0.97435 20.7536FBA KiG3P 0.23 1.0483 64.6267PYK KaFBP 9.1 2.2247 11.1105
KiPi 0.77 6.8302 87.6483
LDH KaFBP4 · 10−4 6.3486 3.346
KiPi 1.0 30.266 9.6469
PFL KiTrioseP 0.2 5.4449 4.302ACK KiFBP 1.0 8.2737 25.6607ADH KiATP 1.0 35.8222 53.7522
S8.5 Initial concentrations
Table S8: Initial metabolite concentrations of the kinetic model (i) for the (non-growing) batch experiment in Neves et al (2002); and (ii) for both the batch experiment in Neves et al (2002) and the chemostat experiments in this thesis. The units are mM.
Metabolite Initial value Estimated value batch
Estimated valuebatch & chemostat
Glc 80 NA NAPEPpool 20.748 NA NAG6Ppool 0 NA NAPYR 0 NA NAGlci 0 NA NAATP 0.1 14.2277 1.115ADP 8.9 1.3805 1.1757FBP 4.3575 NA NATrioseP 0 NA NAPi 100 70.4991 61.9526NAD 4.8397 NA NABPG 0 NA NANADH 0 NA NALac 0 NA NACOA 1 0.39387 13.1624ACCOA 0 NA NAFORM 0 NA NAAC 0 NA NAETOH 0 NA NA
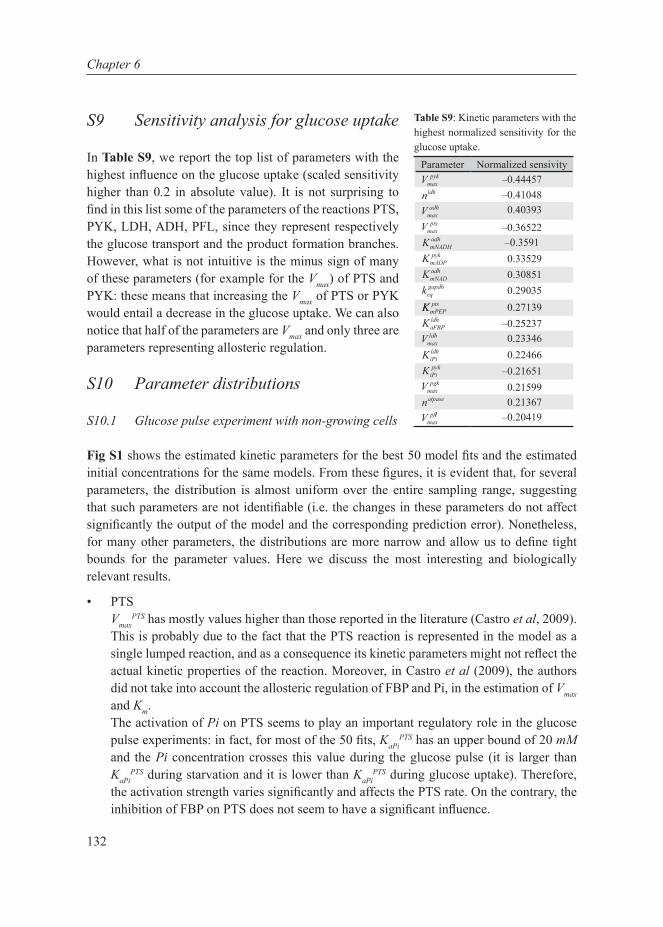
132
Chapter 6
S9 Sensitivity analysis for glucose uptake
In Table S9, we report the top list of parameters with the highest influence on the glucose uptake (scaled sensitivity higher than 0.2 in absolute value). It is not surprising to find in this list some of the parameters of the reactions PTS, PYK, LDH, ADH, PFL, since they represent respectively the glucose transport and the product formation branches. However, what is not intuitive is the minus sign of many of these parameters (for example for the Vmax) of PTS and PYK: these means that increasing the Vmax of PTS or PYK would entail a decrease in the glucose uptake. We can also notice that half of the parameters are Vmax and only three are parameters representing allosteric regulation.
S10 Parameter distributions
S10.1 Glucose pulse experiment with non-growing cells
Fig S1 shows the estimated kinetic parameters for the best 50 model fits and the estimated initial concentrations for the same models. From these figures, it is evident that, for several parameters, the distribution is almost uniform over the entire sampling range, suggesting that such parameters are not identifiable (i.e. the changes in these parameters do not affect significantly the output of the model and the corresponding prediction error). Nonetheless, for many other parameters, the distributions are more narrow and allow us to define tight bounds for the parameter values. Here we discuss the most interesting and biologically relevant results.
• PTSVmax
PTS has mostly values higher than those reported in the literature (Castro et al, 2009). This is probably due to the fact that the PTS reaction is represented in the model as a single lumped reaction, and as a consequence its kinetic parameters might not reflect the actual kinetic properties of the reaction. Moreover, in Castro et al (2009), the authors did not take into account the allosteric regulation of FBP and Pi, in the estimation of Vmax and Km.The activation of Pi on PTS seems to play an important regulatory role in the glucose pulse experiments: in fact, for most of the 50 fits, KaPi
PTS has an upper bound of 20 mM and the Pi concentration crosses this value during the glucose pulse (it is larger than KaPi
PTS during starvation and it is lower than KaPiPTS during glucose uptake). Therefore,
the activation strength varies significantly and affects the PTS rate. On the contrary, the inhibition of FBP on PTS does not seem to have a significant influence.
Table S9: Kinetic parameters with the highest normalized sensitivity for the glucose uptake.
Parameter Normalized sensivity–0.44457–0.41048 0.40393
–0.36522–0.3591 0.33529 0.30851 0.29035 0.27139–0.25237 0.23346 0.22466–0.21651 0.21599 0.21367–0.20419
VnVVKKKk
maxpyk
ldh
maxadh
maxpts
mNADHadh
mADPpyk
mNADadh
eqgapdh
KKKVKKVnV
mPEPpts
aFBPldh
maxldh
iPildh
iPipyk
maxpgk
atpase
maxpfll
133
Kinetic model of L. lactis
• GLPThe affinity for glucose of the permease (mean around 30 mM) is higher than in the PTS.
• GLKThe glucose kinase has high affinity for ATP and low product inhibition from G6P and ADP.
• PFKThe product inhibition of ADP is significant for all the best fits (Km is less than 3mM). This is interesting, since it has been reported in Fordyce et al (1982) that ADP might have an activating function. We have chosen to model PFK with a classical Michaelis-Menten-like kinetics as in Hoefnagel et al (2002).
• FBPaseThe very low values of the Vmax confirm that the flux through the FBPase is negligible consistent with experimental evidence. This is in contrast with Levering et al (2012), where the Vmax was significantly high and so was the corresponding flux (see Table S1).
• PGKThe values of the equilibrium constant of PGK are mostly lower than the 3200 reported for yeast and used in Hoefnagel et al (2002).
• PYKIf we look at Pi inhibition on PYK, we can see that for most of the fits Ki is lower than 25 mM. As already observed for the PTS, the Pi concentration in glucose pulse experiments varies from values higher than Ki to values lower than Ki, so we can expect, Pi inhibition to have a different effect during the glucose pulse experiment. Contrary to the PTS regulation, for PYK, the feed-forward regulation of FBP might play a role, since for a significant fraction of the model fits, the activation of PYK can be modulated by the variation in concentration of FBP. Moreover, it is interesting to note that the Pi allosteric inhibition always shows some degree of cooperativity, whereas FBP activation cannot have any cooperativity in order to reproduce the NAD/NADH recovery observed experimentally.
• LDHThe FBP activation constant Ka is for the majority of the model below 5 mM, suggesting that FBP is always activating LDH. On the other hand, Pi inhibition takes values all over the range, thus we cannot draw any conclusion about its role.
• PFLThe concentration of TrioseP varies between 0 and 10 mM during the glucose pulse experiments. Therefore, Fig S1 suggests that the for a large fraction of the fits, the inhibition by TrioseP is not significant.
• ACKFor most of the models, there is no modulation of the inhibition of ACK by FBP, since FBP concentration is mostly higher than the Ki.
134
Chapter 6
• ADHATP inhibition does not seem to be significant.
• ATPaseFrom Fig S1 it is evident that ATPase requires a high degree of cooperativity (always higher than 2).
• Initial concentrationsIt is interesting to note that the initial concentration of inorganic phosphate has a mean value around 100 mM, almost double of what is reported in Neves et al (2002) where the phosphate balance before and after the glucose pulse was not closed.
S10.2 Chemostat experiments
Fig S2 shows the estimated kinetic parameters for the best 15 model fits (the only model that exhibits a metabolic shift); and the estimated initial concentrations for the same models. In general, we can see that the parameter distributions are often multimodal contrary to what we have seen for the parameter estimated based only on the data in Neves et al (2002). This may be due to the different sample size (50 vs 15). Therefore, we should be careful in comparing the results of the two different estimations. Here we discuss some of the parameter distributions.
• PTSThe Vmax is higher than the estimate based exclusively on the non-growing batch data in Neves et al (2002). The role of phosphate activation seems to be less important. Moreover, the affinity for PEP is higher.• PGKThe equilibrium constant is higher than the estimate exclusively based on the non-growing batch data in Neves et al (2002). • PYKThe role of phosphate inhibition seems to be less important.
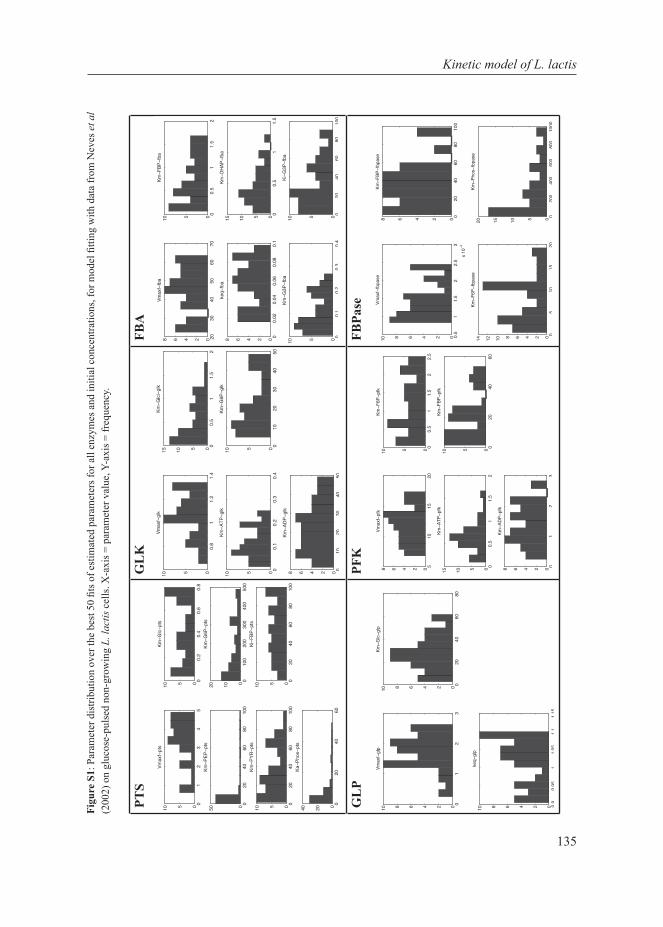
135
Kinetic model of L. lactis
Figu
re S
1: P
aram
eter
dis
tribu
tion
over
the
best
50
fits o
f est
imat
ed p
aram
eter
s for
all
enzy
mes
and
initi
al c
once
ntra
tions
, for
mod
el fi
tting
with
dat
a fr
om N
eves
et a
l (2
002)
on
gluc
ose-
puls
ed n
on-g
row
ing
L. la
ctis
cel
ls. X
-axi
s = p
aram
eter
val
ue, Y
-axi
s = fr
eque
ncy.
PTS
GL
KFB
A
GL
PPF
KFB
Pase
2030
4050
6070
02468Vm
axffba
00.5
11.5
20510
KmFB
Pfba
00.02
0.04
0.06
0.08
0.1
02468keqfba
00.5
11.5
051015Km
DHAP
fba
00.1
0.2
0.3
0.4
0510Km
G3P
fba
020
4060
80100
0510Ki
G3P
fba
0.5
11.
52
2.5
3x
104
0246810Vm
axf
fbpa
se
020
4060
8010
002468
KmFB
Pfb
pase
05
1015
2002468101214
KmF6
Pfb
pase
020
040
060
080
010
0005101520
KmPh
osfb
pase
0.8
11.2
1.4
0510Vm
axfglk
00.5
11.5
2051015
KmGlciglk
00.1
0.2
0.3
0.4
0510Km
ATPglk
010
2030
4050
0510Km
G6P
glk
010
2030
4050
02468Km
ADPglk
01
23
0246810Vm
axfglp
020
4060
800246810
KmGlc
glp
0.9
0.95
11.05
1.1
1.15
0246810keqglp
510
1520
02468Vm
axfpfk
00.5
11.5
22.5
0510Km
F6Ppfk
00.5
11.5
2051015
KmAT
Ppfk
020
4060
0510Km
FBPpfk
01
23
02468Km
ADPpfk
01
23
45
0510Vm
axfpts
00.2
0.4
0.6
0.8
0510Km
Glc
pts
020
4060
80100
050Km
PEPpts
0100
200
300
400
500
01020Km
G6P
pts
020
4060
80100
0510Km
PYR
pts
020
4060
80100
0510Ki
FBPpts
020
4060
02040Ka
Phos
pts
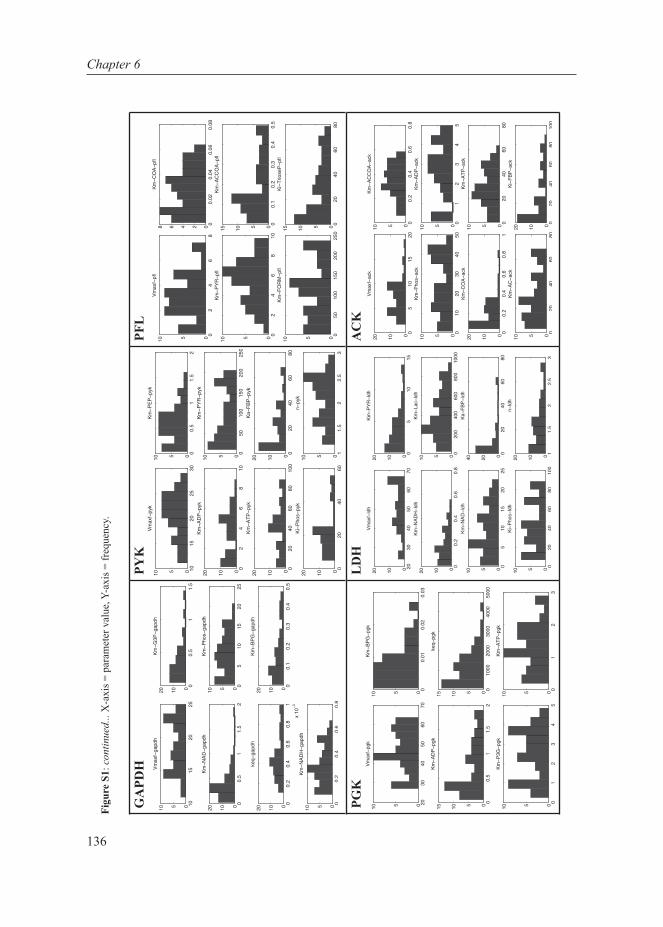
136
Chapter 6
Figu
re S
1: c
ontin
ued.
.. X
-axi
s = p
aram
eter
val
ue, Y
-axi
s = fr
eque
ncy.
GA
PDH
PYK
PFL
PGK
LD
HA
CK
02
46
80510
Vmaxfpfl
00.02
0.04
0.06
0.08
02468Km
COApfl
02
46
810
0510Km
PYR
pfl
00.1
0.2
0.3
0.4
0.5
051015Km
ACCO
Apfl
050
100
150
200
250
0510Km
FORM
pfl
020
4060
80051015
KiTriosePpfl
05
1015
2001020
Vmaxfack
00.2
0.4
0.6
0.8
0510Km
ACCO
Aack
010
2030
4050
0510Km
Phos
ack
01
23
45
0510Km
ADPack
00.2
0.4
0.6
0.8
101020
KmCO
Aack
020
4060
800510
KmAT
Pack
020
4060
800510
KmAC
ack
020
4060
80100
01020Ki
FBPack
1015
2025
300510
Vmax
fpy
k
00.5
11.5
20510
KmPE
Ppy
k
02
46
810
01020Km
ADP
pyk
050
100
150
200
250
0510Km
PYR
pyk
020
4060
8010
001020
KmAT
Ppy
k
020
4060
8001020
KaFB
Ppy
k
020
4060
01020Ki
Phos
pyk
11.5
22.5
30510
npy
k
2030
4050
6070
0510Vm
axfpgk
00.01
0.02
0.03
0510Km
BPG
pgk
00.5
11.5
2051015
KmAD
Ppgk
01000
2000
3000
4000
5000
051015keqpgk
01
23
45
0510Km
P3G
pgk
01
23
0510Km
ATPpgk
2030
4050
6070
01020Vm
axfldh
05
1015
01020Km
PYR
ldh
00.2
0.4
0.6
0.8
01020Km
NAD
Hldh
0200
400
600
800
1000
0510Km
Lacldh
05
1015
2025
0510Km
NAD
ldh
020
4060
8002040
KaFB
Pldh
020
4060
80100
0510Ki
Phos
ldh
11.5
22.5
301020
nldh
1015
2025
0510Vm
axf
gapd
h
00.
51
1.5
01020Km
G3P
gapd
h
00.
51
1.5
201020
KmN
ADga
pdh
05
1015
2025
0510Km
Phos
gapd
h
00.
20.
40.
60.
81
x 10
3
01020ke
qga
pdh
00.
10.
20.
30.
40.
501020
KmBP
Gga
pdh
00.
20.
40.
60.
80510
KmN
ADH
gapd
h
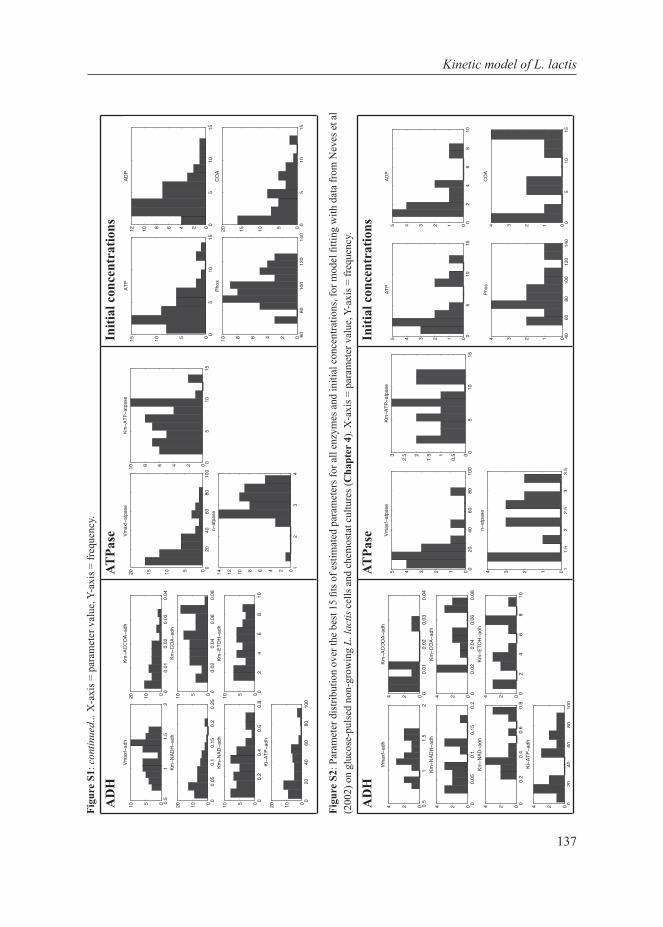
137
Kinetic model of L. lactis
Figu
re S
1: c
ontin
ued.
.. X
-axi
s = p
aram
eter
val
ue, Y
-axi
s = fr
eque
ncy.
AD
HAT
Pase
Initi
al c
once
ntra
tions
Figu
re S
2: P
aram
eter
dis
tribu
tion
over
the
best
15
fits o
f est
imat
ed p
aram
eter
s for
all
enzy
mes
and
initi
al c
once
ntra
tions
, for
mod
el fi
tting
with
dat
a fr
om N
eves
et a
l (2
002)
on
gluc
ose-
puls
ed n
on-g
row
ing
L. la
ctis
cel
ls a
nd c
hem
osta
t cul
ture
s (C
hapt
er 4
). X
-axi
s = p
aram
eter
val
ue, Y
-axi
s = fr
eque
ncy.
AD
HAT
Pase
Initi
al c
once
ntra
tions
05
1015
051015AT
P
05
1015
024681012AD
P
6080
100
120
140
0246810Phos
05
1015
05101520COA
020
4060
80100
05101520Vm
axfatpase
05
1015
0246810Km
ATPatpase
12
34
02468101214natpase
0.5
11.5
20510
Vmaxfadh
00.01
0.02
0.03
0.04
01020Km
ACCO
Aadh
00.05
0.1
0.15
0.2
0.25
01020Km
NADH
adh
00.02
0.04
0.06
0.08
0510Km
COAadh
00.2
0.4
0.6
0.8
0510Km
NAD
adh
02
46
810
0510Km
ETOH
adh
020
4060
80100
01020Ki
ATPadh
05
1015
012345AT
P
02
46
810
012345AD
P
4060
80100
120
140
01234Phos
05
1015
01234COA
020
4060
80100
012345Vm
axfatpase
05
1015
0
0.51
1.52
2.53
KmAT
Patpase
11.5
22.5
33.5
01234natpase
0.5
11.5
2024
Vmaxfadh
00.01
0.02
0.03
0.04
024Km
ACCO
Aadh
00.05
0.1
0.15
0.2
024Km
NADH
adh
00.02
0.04
0.06
0.08
024Km
COAadh
00.2
0.4
0.6
0.8
024Km
NAD
adh
02
46
810
024Km
ETOH
adh
020
4060
80100
024Ki
ATPadh

138
Chapter 6
Figu
re S
2: c
ontin
ued.
.. X
-axi
s = p
aram
eter
val
ue, Y
-axi
s = fr
eque
ncy.
PTS
GL
KFB
A
GL
PPF
KFB
Pase
2030
4050
600123
Vmaxffba
00.5
11.5
01234Km
FBPfba
0.02
0.04
0.06
0.08
0.1
0123keqfba
00.5
11.5
0123Km
DHAP
fba
00.05
0.1
0.15
0.2
0.25
01234Km
G3P
fba
020
4060
800123
KiG3P
fba
0.5
11.
52
2.5
3x
104
0
0.51
1.52
2.53
Vmax
ffb
pase
020
4060
8010
001234
KmFB
Pfb
pase
05
1015
200
0.51
1.52
2.53
KmF6
Pfb
pase
020
040
060
080
010
0001234
KmPh
osfb
pase
0.4
0.6
0.8
11.2
1.4
0246Vm
axfglk
00.5
11.5
201234
KmGlciglk
00.1
0.2
0.3
0.4
0123Km
ATPglk
010
2030
4050
01234Km
G6P
glk
010
2030
4050
01234Km
ADPglk
00.5
11.5
22.5
012345Vm
axfglp
2040
6080
100
01234Km
Glc
glp
0.9
0.95
11.05
1.1
1.15
0
0.51
1.52
2.53
keqglp
510
1520
0123Vm
axfpfk
00.5
11.5
22.5
01234Km
F6Ppfk
00.5
11.5
01234Km
ATPpfk
010
2030
4050
0123Km
FBPpfk
01
23
0123Km
ADPpfk
010
2030
40024
Vmaxfpts
00.2
0.4
0.6
0.8
05Km
Glc
pts
020
4060
80100
024Km
PEPpts
0100
200
300
400
500
024Km
G6P
pts
020
4060
80100
024Km
PYR
pts
020
4060
80100
024Ki
FBPpts
020
4060
012Ka
Phos
pts

139
Kinetic model of L. lactis
Figu
re S
2: c
ontin
ued.
.. X
-axi
s = p
aram
eter
val
ue, Y
-axi
s = fr
eque
ncy.
GA
PDH
PYK
PFL
PGK
LD
HA
CK
02
46
810
01234Vm
axfpfl
00.02
0.04
0.06
0.08
01234Km
COApfl
02
46
810
0123Km
PYR
pfl
00.1
0.2
0.3
0.4
0123Km
ACCO
Apfl
050
100
150
200
250
01234Km
FORM
pfl
020
4060
80100
0246Ki
TriosePpfl
05
1015
2025
05Vm
axfack
00.2
0.4
0.6
0.8
024Km
ACCO
Aack
010
2030
4050
024Km
Phos
ack
01
23
45
024Km
ADPack
00.2
0.4
0.6
0.8
10510
KmCO
Aack
020
4060
024Km
ATPack
020
4060
80024
KmAC
ack
010
2030
0510Ki
FBPack
1015
2025
30024
Vmax
fpy
k
00.5
11.5
0510Km
PEP
pyk
02
46
8012
KmAD
Ppy
k
050
100
150
200
250
024Km
PYR
pyk
020
4060
80024
KmAT
Ppy
k
020
4060
024Ka
FBP
pyk
020
4060
8010
0012
KiPh
ospy
k
11.5
22.5
3024
npy
k
2030
4050
600123
Vmaxfpgk
00.01
0.02
0.03
0246Km
BPG
pgk
00.5
11.5
202468
KmAD
Ppgk
01000
2000
3000
4000
0246keqpgk
01
23
45
0123Km
P3G
pgk
00.5
11.5
22.5
01234Km
ATPpgk
2030
4050
6070
0510Vm
axfldh
05
1015
024Km
PYR
ldh
00.1
0.2
0.3
0.4
0.5
0510Km
NAD
Hldh
0200
400
600
800
024Km
Lacldh
05
1015
2025
024Km
NAD
ldh
010
2030
4050
024Ka
FBP
ldh
020
4060
80100
024Ki
Phos
ldh
11.5
22.5
30510
nldh
1015
2025
024Vm
axf
gapd
h
00.
51
1.5
024Km
G3P
gapd
h
00.
51
1.5
2024
KmN
ADga
pdh
05
1015
2025
0510Km
Phos
gapd
h
00.
20.
40.
60.
81
x 10
3
024ke
qga
pdh
00.
10.
20.
30.
40.
5024
KmBP
Gga
pdh
00.
20.
40.
60.
8012
KmN
ADH
gapd
h


141
Summary, Discussion
and Concluding Remarks
“If I find 10,000 ways something won’t work, I haven’t failed. I am not discouraged, because every wrong attempt discarded is another
step forward.”
Thomas A. Edison
CHAPTER 777 CHAPTER 7
141

Chapter 7
142

143
Summary, discussion and concluding remarks
The research project encompassing this thesis was a systems biology effort to understand growth strategies in Lactococcus lactis with a focus on the metabolic shift from mixed-acid to homolactic fermentation as a function of growth rate. The project was a collaborative effort between three research groups across three universities, Wageningen University, VU University Amsterdam, and Groningen University, with a central theme of validating the optimal resource allocation (self-replicator) model with experimental data on L. lactis. The project therefore required careful planning and coordination, and as the hub of modelling and fermentation activities, this responsibility was ours. As necessary with any wet-dry collaboration, the experimental expectations for model validation were communicated at the very start to ensure availability of protocols during sampling. Subsequent experimentation and analysis with intense collaborative effort led to the results laid out in this thesis. As stated in the introduction, the aim of this thesis was to answer the following questions:• How is the growth-dependent metabolic shift regulated in L. lactis?• How does this shift correlate with protein investment in L. lactis?• Why does L. lactis exhibit the metabolic shift?Parts of the first and third question and the second question and were addressed in Chapter 4. The ‘how’ question was investigated further in Chapters 5 and 6. In the subsequent sections, we review the answers to the above questions with a broader perspective.
Standardization is crucial for systems biology
For an integrated and inter-laboratory approach it is imperative that cell samples are reproducible, and physiological states are well defined (Canelas et al, 2010). We therefore set high priority to standardization of experimental procedures. In particular, we established protocols for harvesting, storage, extract preparation and specific enzyme assays in L. lactis. Going a step further we developed an in vivo-like assay medium to standardize enzyme activity measurements to mimic cytosolic conditions of L. lactis as close as was practically possible (Goel et al, 2012a); see Chapter 3). We also standardized the sampling procedures and tested for reproducibility before commencing the actual experiments. That apart considerable efforts into the cryopreservation, inoculation and cultivation conditions of strain, medium optimization and setting up of mini-fermentors for prolonged cultivation by colleagues resulted in a complete set of standardized protocols as elaborated further below.
Strain
The importance of cultivation history of bacterial strains cannot be stressed enough, even more so, when collaborative efforts are involved. Having stocks from a single strain isolate ensures the same strain background to start with, and makes data comparison much easier and more reliable. Getting rid of variation due to cultivation history decreases an important parameter that could cause variability. It ensures that results obtained are in fact an outcome of the experimental design and not an unknown phenomenon that occurred in the course of the strain history.
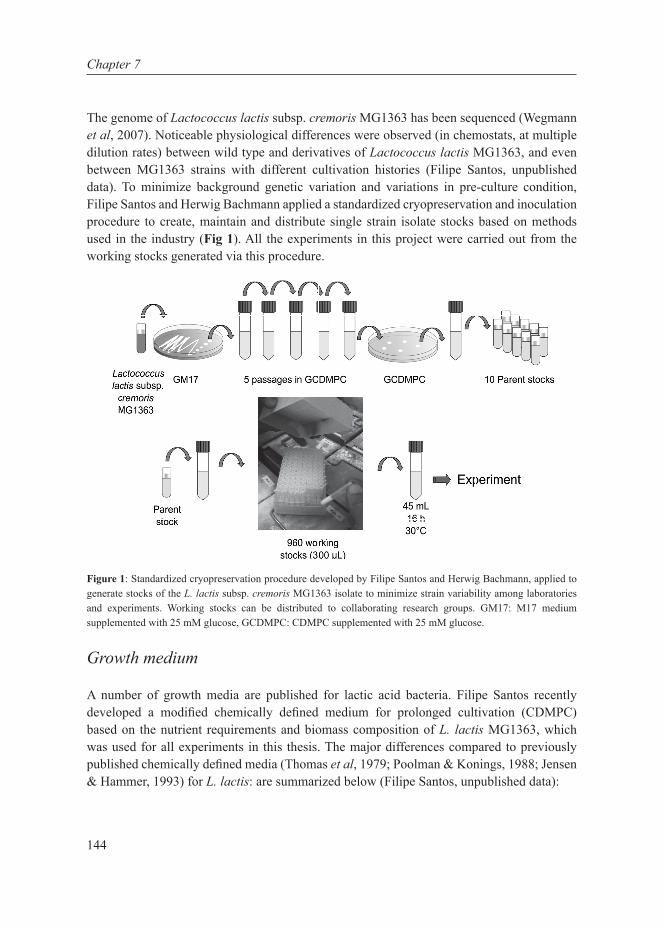
144
Chapter 7
The genome of Lactococcus lactis subsp. cremoris MG1363 has been sequenced (Wegmann et al, 2007). Noticeable physiological differences were observed (in chemostats, at multiple dilution rates) between wild type and derivatives of Lactococcus lactis MG1363, and even between MG1363 strains with different cultivation histories (Filipe Santos, unpublished data). To minimize background genetic variation and variations in pre-culture condition, Filipe Santos and Herwig Bachmann applied a standardized cryopreservation and inoculation procedure to create, maintain and distribute single strain isolate stocks based on methods used in the industry (Fig 1). All the experiments in this project were carried out from the working stocks generated via this procedure.
Figure 1: Standardized cryopreservation procedure developed by Filipe Santos and Herwig Bachmann, applied to generate stocks of the L. lactis subsp. cremoris MG1363 isolate to minimize strain variability among laboratories and experiments. Working stocks can be distributed to collaborating research groups. GM17: M17 medium supplemented with 25 mM glucose, GCDMPC: CDMPC supplemented with 25 mM glucose.
Growth medium
A number of growth media are published for lactic acid bacteria. Filipe Santos recently developed a modified chemically defined medium for prolonged cultivation (CDMPC) based on the nutrient requirements and biomass composition of L. lactis MG1363, which was used for all experiments in this thesis. The major differences compared to previously published chemically defined media (Thomas et al, 1979; Poolman & Konings, 1988; Jensen & Hammer, 1993) for L. lactis: are summarized below (Filipe Santos, unpublished data):
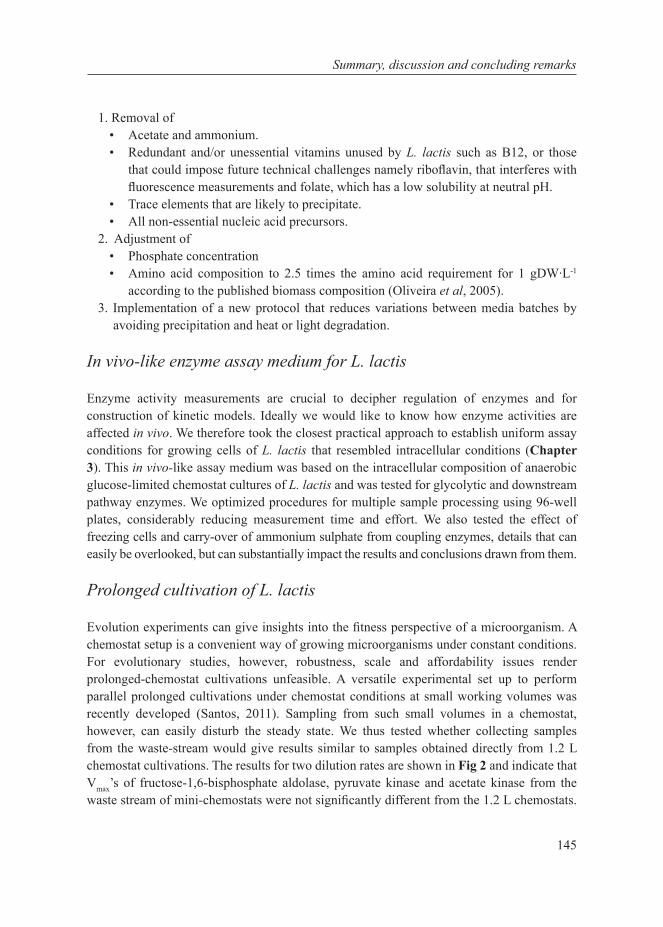
145
Summary, discussion and concluding remarks
1. Removal of • Acetate and ammonium.• Redundant and/or unessential vitamins unused by L. lactis such as B12, or those
that could impose future technical challenges namely riboflavin, that interferes with fluorescence measurements and folate, which has a low solubility at neutral pH.
• Trace elements that are likely to precipitate.• All non-essential nucleic acid precursors.
2. Adjustment of • Phosphate concentration • Amino acid composition to 2.5 times the amino acid requirement for 1 gDW∙L-1
according to the published biomass composition (Oliveira et al, 2005).3. Implementation of a new protocol that reduces variations between media batches by
avoiding precipitation and heat or light degradation.
In vivo-like enzyme assay medium for L. lactis
Enzyme activity measurements are crucial to decipher regulation of enzymes and for construction of kinetic models. Ideally we would like to know how enzyme activities are affected in vivo. We therefore took the closest practical approach to establish uniform assay conditions for growing cells of L. lactis that resembled intracellular conditions (Chapter 3). This in vivo-like assay medium was based on the intracellular composition of anaerobic glucose-limited chemostat cultures of L. lactis and was tested for glycolytic and downstream pathway enzymes. We optimized procedures for multiple sample processing using 96-well plates, considerably reducing measurement time and effort. We also tested the effect of freezing cells and carry-over of ammonium sulphate from coupling enzymes, details that can easily be overlooked, but can substantially impact the results and conclusions drawn from them.
Prolonged cultivation of L. lactis
Evolution experiments can give insights into the fitness perspective of a microorganism. A chemostat setup is a convenient way of growing microorganisms under constant conditions. For evolutionary studies, however, robustness, scale and affordability issues render prolonged-chemostat cultivations unfeasible. A versatile experimental set up to perform parallel prolonged cultivations under chemostat conditions at small working volumes was recently developed (Santos, 2011). Sampling from such small volumes in a chemostat, however, can easily disturb the steady state. We thus tested whether collecting samples from the waste-stream would give results similar to samples obtained directly from 1.2 L chemostat cultivations. The results for two dilution rates are shown in Fig 2 and indicate that Vmax’s of fructose-1,6-bisphosphate aldolase, pyruvate kinase and acetate kinase from the waste stream of mini-chemostats were not significantly different from the 1.2 L chemostats.
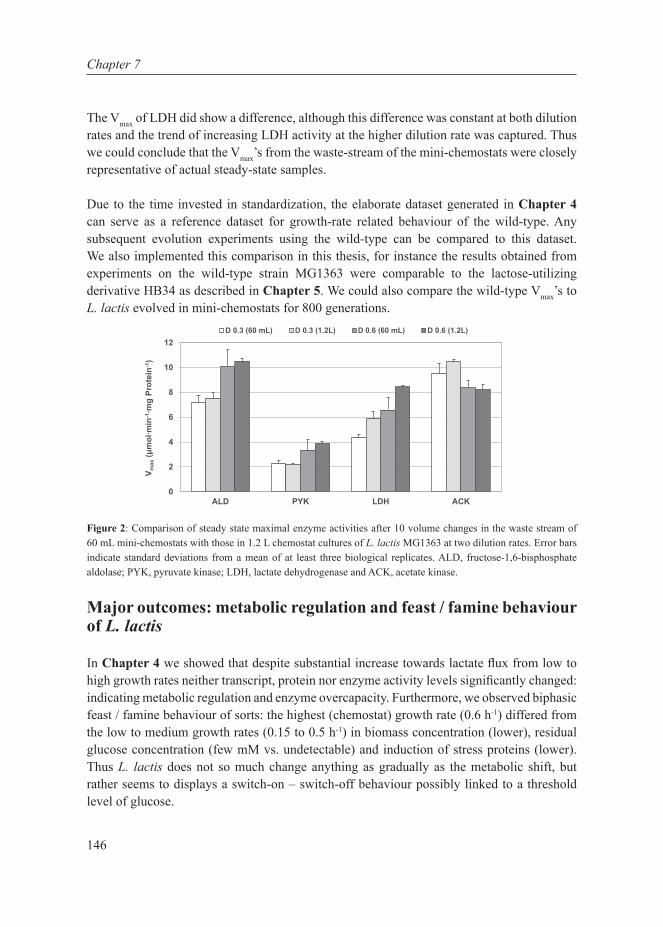
146
Chapter 7
The Vmax of LDH did show a difference, although this difference was constant at both dilution rates and the trend of increasing LDH activity at the higher dilution rate was captured. Thus we could conclude that the Vmax’s from the waste-stream of the mini-chemostats were closely representative of actual steady-state samples.
Due to the time invested in standardization, the elaborate dataset generated in Chapter 4 can serve as a reference dataset for growth-rate related behaviour of the wild-type. Any subsequent evolution experiments using the wild-type can be compared to this dataset. We also implemented this comparison in this thesis, for instance the results obtained from experiments on the wild-type strain MG1363 were comparable to the lactose-utilizing derivative HB34 as described in Chapter 5. We could also compare the wild-type Vmax’s to L. lactis evolved in mini-chemostats for 800 generations.
Figure 2: Comparison of steady state maximal enzyme activities after 10 volume changes in the waste stream of 60 mL mini-chemostats with those in 1.2 L chemostat cultures of L. lactis MG1363 at two dilution rates. Error bars indicate standard deviations from a mean of at least three biological replicates. ALD, fructose-1,6-bisphosphate aldolase; PYK, pyruvate kinase; LDH, lactate dehydrogenase and ACK, acetate kinase.
Major outcomes: metabolic regulation and feast / famine behaviour of L. lactis
In Chapter 4 we showed that despite substantial increase towards lactate flux from low to high growth rates neither transcript, protein nor enzyme activity levels significantly changed: indicating metabolic regulation and enzyme overcapacity. Furthermore, we observed biphasic feast / famine behaviour of sorts: the highest (chemostat) growth rate (0.6 h-1) differed from the low to medium growth rates (0.15 to 0.5 h-1) in biomass concentration (lower), residual glucose concentration (few mM vs. undetectable) and induction of stress proteins (lower). Thus L. lactis does not so much change anything as gradually as the metabolic shift, but rather seems to displays a switch-on – switch-off behaviour possibly linked to a threshold level of glucose.
0
2
4
6
8
10
12
ALD PYK LDH ACK
V max
(μm
ol∙m
in-1
∙mg
Prot
ein-1
)
D 0.3 (60 mL) D 0.3 (1.2L) D 0.6 (60 mL) D 0.6 (1.2L)
147
Summary, discussion and concluding remarks
We investigated the metabolic regulation mechanism further using a lactose-positive heterofermentative L. lactis MG1363 derivative strain (Chapter 5). Arresting its protein synthesis and supplementing it with various sugars, we showed that glycolytic flux correlated positively with the fraction of lactate produced indicating strong metabolic regulation of the shift. Furthermore, we could elegantly connect higher FBP analogue levels to higher lactate levels, providing the first evidence of the causal effect of FBP towards lactate formation. The next step was to conglomerate the allosteric interactions in L. lactis glycolysis and downstream pathways into a kinetic model and test the effect on the metabolic shift (Chapter 6). The fitted model reproduced the metabolic shift and sensitivity analysis highlighted the central role of the glycolytic intermediate FBP and inorganic phosphate in the metabolic shift.
(Non)optimal protein allocation in L. lactis?
The endeavour of characterizing the metabolic shift of L. lactis was undertaken to test the hypothesis of optimal resource allocation (see Chapter 4), also called optimal protein allocation (Molenaar et al, 2009). The metabolic shift of L. lactis was, however, mostly ‘metabolically regulated’ and was characterized by barely any change in protein levels associated with the two metabolic branches. These results falsify the hypothesis of optimal protein allocation. This finding can and should not be underestimated, as any other negative result in science. Negative results force us to question the initial assumptions underlying the hypothesis, one of which is that L. lactis exhibits optimal behaviour under all growth rates, which, as the results suggest, is incorrect. The unchanging enzyme levels with the metabolic shift indicate that indeed, L. lactis does not follow the optimal resource allocation strategy at low substrate concentrations, but the hypothesis that its protein allocation might be optimal at high substrate concentrations and high growth rates is still open. This is because the predictions of the self-replicator model based on the hypothesis of optimal protein allocation are applicable to a system that is optimized for growth rate. We grew L. lactis (i) in glucose supplemented defined medium, (ii) in carbon-limited chemostat conditions, (iii) at various growth rates – three aspects which one could question whether L. lactis would have been optimized for in the course of its evolutionary history.
Besides the ease of analysing samples generated under well-defined conditions, the initial reasons for choosing these conditions were the existing evidence of altering LDH levels with higher lactate in L. lactis in glucose-limited chemostat conditions (Thomas et al, 1979) and the intention to reproduce this data along with multilevel characterization. Thomas et al used the strain L. lactis ML3 while we used the strain L. lactis MG1363; both strains are derivatives of the same ancestral strain NCDO712 (Le Bourgeois et al, 2000). However, the data disagree and this was a result we did not expect. A major cause could be the genetic difference between these two strains that developed in the course of strain history (Le Bourgeois et al, 2000). The medium composition was also different with potential impact on

148
Chapter 7
gene expression. This does reiterate that strain diversity is not trivial and that standardization for strain usage and medium is extremely important. In any case, these differences between Thomas et al and our work indicates that the protein allocation model as originally proposed may not be as general as it was intended to be: MG1363 does not seem to adhere to it.
At this stage, the integrated multilevel omics approach to test the protein allocation hypothesis does raise a few retrospective questions. Was this in fact the right approach? And what did we really gain from it? As stated in the preceding paragraph, we obtained a negative result, and this implies that regulation of the metabolic shift was not as simple as we thought initially. In the following sections we discuss such reflections and the hypotheses that come out of the results from this thesis.
A reflection on the approach
In today’s systems biology era a variety of tools are available and multiple tools can be combined and used to solidify data further. Such combined multi-level omics studies have successfully investigated a variety of microbial responses in Escherichia coli (Ishii et al, 2007), Bacillus subtilis (Buescher et al, 2012) and also the metabolic shift in yeast (de Groot et al, 2007; Castrillo et al, 2007; Canelas et al, 2010). Similar to our observation in L. lactis (Chapter 4) robust metabolic regulation was observed in yeast and in E. coli at varying growth-limiting substrate levels. Buescher et al (2012) revealed global regulatory reconfiguration during a dynamic shift from malate to glucose, and concluded that adaptation is subject to a trade-off between complex and imprecise regulation, each bearing condition-specific evolutionary advantage in B. subtilis.
However, the metabolic shift in relation to the growth rate and protein allocation under controlled chemostat conditions was investigated here for the first time in Lactococcus lactis. One could still argue that testing the metabolite levels, enzyme activities and/or protein levels alone would suffice to verify the hypothesis of protein allocation. But if we were to analyse the various dilution rates merely for metabolite levels, enzyme activities and protein levels, we would miss important regulatory information like that of glucose repression or arginine catabolism. In retrospect it was therefore useful to include transcriptome analysis.
Setting up and execution of chemostat fermentations, combined with sampling for multiple measurements, is a very time-consuming process. Moreover, once the sample is taken at the steady state and the fermentor is ‘killed’ no more samples from this biological replicate are possible. Thus we feel it is essential to envisage ahead of time, the possible outcomes of an experiment (questioning a hypothesis) and the corresponding analytical tools that may become necessary; this can save a lot of fermentor setup time and effort.

149
Summary, discussion and concluding remarks
The multi-level omics approach does have a drawback though. Generation of vast amounts of data can be overwhelming and appropriate data mining and visualization tools are becoming a necessity (for a review of available tools see Gehlenborg et al (2010)). Indeed if data are mined carefully, they can be good pointers toward interesting phenomena that would otherwise go completely unnoticed –the examples being (see Chapter 4), (i) metabolic regulation of the metabolic shift (investigated further in Chapters 5 and 6) (ii) the effect of the YfiA protein on ribosome dimerization in L. lactis, an outcome of looking for genes specifically not changing with growth rate, (iii) antagonistic behaviour of two isoenzymes of acetate kinase (ACK). Subsequently, detailed studies are essential to supplement pointers from these global studies to gain a molecular level understanding, which are currently underway (Puri et al, manuscript submitted; Puri et al, manuscript in preparation).
Additional analyses
One of the major set of variables missing from the characterization of the metabolic shift in L. lactis is intracellular metabolites under steady-state conditions. Metabolomics is an important platform but a good quenching protocol is essential to quantify intracellular metabolites. Such a quenching protocol is available for Saccharomyces cerevisiae (Canelas et al, 2009), but is unfortunately not applicable to L. lactis. To gain any further insight into the metabolic regulation of the shift, such an analysis is crucial. Additionally, while the stoichiometries in metabolism are well established, we need better mapping of all allosteric feedback loops in metabolism (the ‘regulatory wiring’ of the system). Hence systematic screening of all glycolytic and downstream pathway enzymes for the effect of variety of important metabolites would be useful to accurately characterize intracellular enzyme behaviour. Both of these analyses would greatly improve the accuracy of the kinetic model described in Chapter 6.
Glycolytic overcapacity in L. lactis evolved in a constant environment
L. lactis seems to show a high overcapacity of enzymes. We conclude this based on the results from Chapter 4: an increase in glycolytic flux is not accompanied by increase in glycolytic enzyme capacities. This phenomenon has also been observed in the yeast Saccharomyces cerevisiae where glycolytic flux changing due to the absence of oxygen (Daran-Lapujade et al, 2007), change in temperature (Tai et al, 2007) and switch from aerobic chemostat growth to anaerobic glucose excess condition (van den Brink et al, 2008) showed predominantly metabolic regulation. It may be explained by the fact that microbes generally live in dynamic as opposed to stable environments. The form and abundance of nutrients and competitors in their environment frequently fluctuate. Based on the premise that continually-altering protein levels to adapt to the fluctuating environment is unfavourable –either due to high protein turnover costs or slow response times–, one could hypothesize that L. lactis maintains high capacity as an ‘always-prepared’ strategy to cope with a dynamic environment. If this

150
Chapter 7
hypothesis were true, evolving L. lactis under constant environments should eventually lead to a decrease in overcapacity of enzymes. Such a decrease has in fact been observed in S. cerevisiae, where cells evolved for 200 generations in a constant environment of aerobic glucose-limited chemostats (at dilution rate 0.1 h-1) had lower capacity of glycolytic enzymes (Jansen et al, 2005).
We therefore tested the maximal enzyme activities in L. lactis evolved at two different dilution rates, 0.3 h-1 (mixed-acid pathway metabolism) for 230 generations, and 0.6 h-1 (homolactic metabolism) for 785 generations respectively, in anaerobic (95% N2, 5% CO2) glucose-limited mini-chemostats with 60 mL working volume in CDMPC medium (in collaboration with Filipe Santos). Surprisingly we did not observe a decrease in maximal enzyme activities of FBP aldolase (ALD), pyruvate kinase (PYK), lactate dehydrogenase (LDH) and acetate kinase (ACK) in any of the evolved cultures (Fig 3). In fact at dilution rate 0.6 h-1 the ACK activity increased (Fig 3B) and the metabolism shifted towards mixed-acid fermentation, accompanied by lower residual glucose, higher biomass, and higher ATP yield on glucose (unlike dilution rate 0.3 h-1 where neither Vmax nor metabolism changed) (Santos et al, manuscript in preparation).
That the metabolism shifts to more ATP-efficient substrate utilization is easy to explain based on the competition for the growth-limiting substrate in a chemostat. This has also been observed in S. cerevisiae where the metabolism shifted from glucose fermentation to glucose oxidation resulting in higher biomass yield (Brown et al, 1998; Ferea et al, 1999). However, the unchanging enzymatic overcapacity of L. lactis even after 785 generations is very intriguing indeed. One could argue that overcapacity of reversible enzymes is more likely to decrease as suggested for yeast (Mashego et al, 2005), and that pyruvate kinase did not change in evolved yeast either (Jansen et al, 2005). But that still does not explain why aldolase levels remain unchanged.
So in a constant environment does the apparent overcapacity of L. lactis have any evolutionary advantage at all? It would be interesting to test this with a competition experiment between the wild type strain and one without overcapacity. But until the result of such an experiment is available, we can only speculate about the plausible reasons for the sustained overcapacity of evolved L. lactis, some of which are outlined below:
(i) Eukaryotes and prokaryotes differ in their regulation of gene expression (Phillips, 2008) due to structural differences like the presence or absence of nucleus, chromatin structure, genome size and operon organisation among others. Thus, compared to yeast, L. lactis might regulate differently the gene expression affecting its protein levels.
(ii) The measured Vmax’s might not be representative of those in vivo. This could be due to missing knowledge of enzyme effectors, or the presence of certain isoenzymes which might show enzyme assay activity in vitro, but their in vivo function might differ.

151
Summary, discussion and concluding remarks
Figure 3: Maximal enzyme activities (Vmax’s) of FBP aldolase (ALD), pyruvate kinase (PYK), lactate dehydrogenase (LDH) and acetate kinase (ACK) in L. lactis MG1363 evolved under constant environment. Cultures were grown under anaerobic (95% N2, 5% CO2) conditions in four independent glucose-limited mini-chemostats with 60 mL working volume in CDMPC medium at dilution rates (A) 0.3 h-1 and (B) 0.6 h-1. Error bars indicate technical standard deviation from mean enzyme activity determined from at least 3 replicates.
(iii) The role of glycolytic enzymes might not be limited to their glycolytic function alone. They could also have a regulatory function like transcriptional regulation for instance, or glucose homeostasis as reviewed recently in tumour cells (Kim & Dang, 2005).
(iv) The metabolism of L. lactis seems to be robust that it does not respond to any changes. Natively it has survived in a rich environment with a constant possibility of plentiful substrate. This could have shaped it to be robust to changes in substrate over long periods by developing regulation mechanisms to circumvent changes in proteins. The dimerization and subsequent stalling of ribosomes rather their breakdown, for lower ribosomal activity at low growth rates (Puri et al, manuscript submitted) also seems like an adaptation to maintain constant protein levels.
02468
10
0 100 200 300
LDH
0
5
10
15
0 100 200 30 0
ACK0
5
10
15 ALD
0
1
2
3 PYK
Number of generations
V max
(µm
ol·m
in-1
·mg
Prot
ein-
1 )
A
02468
10
0 250 500 750 1000
LDH
0
5
10
15
0 250 500 750 1000
ACK0
5
10
15 ALD
0
1
2
3
4
5PYK
F1
F2
F3
F4
Number of generations
V max
(µm
ol·m
in-1
·mg
Prot
ein-
1 )
BF1
F2
F3
F4
F1
F2
F3
F4
F1
F2
F3
F4
152
Chapter 7
Such additional regulation mechanisms might alter protein costs altogether, and maybe the present definition of protein costs simply does not hold for L. lactis due to additional constraints (imposed by the explanations above) that are as yet not known or accounted for.
Coexistence of mixed strategies at the single cell level
The vast majority of experimental studies thus far involve measurements that reflect averaged cell population behaviour (e.g. metabolite concentrations, enzymatic activity and transcriptome levels). Population averages of variables that are not normally distributed hamper the type of understanding that is generally investigated with systems biology approaches. Therefore, the concept of cell population heterogeneity has received increasing attention in the last decade (Dubnau & Losick, 2006; Smits et al, 2006; Veening et al, 2008) and a number of examples have been reported, e.g. bistability of the lac operon (Ozbudak et al, 2004), competence development and sporulation (Veening et al, 2006) and persister phenotypes (Balaban et al, 2004). It is not unlikely that other phenotypes such as metabolic strategies might be heterogeneously distributed amongst a population but they have not been reported so far.
There is also theoretical evidence that from a specific growth rate optimization point of view mixed strategies are not optimal: only one strategy is optimal under defined steady state conditions (Wortel et al, manuscript in preparation). In that respect the mixed metabolism (part mixed-acid and part homolactic) that occurs at intermediate dilution rates in L. lactis (see Chapter 5) could be a result of measuring population means: they might not actually occur within a single cell. The conclusion that L. lactis has a binary feast or famine kind of behaviour also supports an “on-off” character and thus the hypothesis of heterogeneous subpopulations.
An elegant way of tracking single cell behaviour is by measuring expression of fluorescent proteins (like green fluorescent protein, GFP) under control of the promoter of the gene of interest (Chalfie et al, 1994). This principle can also be applied to verify the hypothesis of heterogeneous subpopulations in L. lactis exhibiting mixed strategies. The averages of transcript and protein fold changes of acetate kinase (ackA2) at different growth rates are shown in Fig 4A (Chapter 4). Single-cell fluorescence measurements of engineered L. lactis cells transformed with a plasmid harbouring GFP under control of ACK promoter can illuminate how the different metabolic strategies of L. lactis are distributed amongst the population. The population could be homogeneous (Fig 4B) with the same level of ACK expression (grey), or, it could be a mixture of subpopulations (Fig 4C): one that expresses ACK (dark grey) and one with a much reduced or no expression (white).

153
Summary, discussion and concluding remarks
Figure 4: (A) Log2 fold change ratios of ackA2 transcripts and protein levels at various dilution rates (Chapter 4). (B) Probability distribution of fluorescence intensity in single cells in a homogeneous population and (C) heterogeneous population with single cells expressing (dark grey) and not expressing (white) ackA2.
This has in fact been tested by measuring on-line steady-state single-cell fluorescence in vivo (method developed by Filipe Santos and Herwig Bachmann) on engineered L. lactis cells in anaerobically grown glucose-limited chemostats at various dilution rates. The fluorescence intensities decreased with lower mixed-acid pathway fluxes but showed no signs of heterogeneity (Filipe Santos, unpublished data). This result indicates that mixed strategies coexist in individual L. lactis cells, rendering the hypothesis of heterogeneous subpopulations false. It thus questions the assumption behind the original approach, which is the optimization of growth rate. One could therefore conclude that L. lactis might not be optimized for growth rate under low substrate concentrations.
Concluding remarks
We studied both, the ‘how’ and the ‘why’ behind the metabolic shift in L. lactis. In terms of the ‘how’ we have tread further with respect to the causal effect of FBP. An improved kinetic model however, is necessary to fully illuminate the mechanism of the shift. It will most likely be necessary to validate the model with independent experiments or data other than those used for fitting to understand the shift at a broader level to drive model-predicted metabolic engineering of L. lactis.
-2-1.5
-1-0.5
00.5
0.2 0.3 0.4 0.5 0.6 0.7Lo
g 2 fo
ld c
hang
e D (h-1)
Transcript
ProteinFr
eque
ncy
0
0.02
0.04
0.06
0.08
0 0.5 1 1.5 2 2.5 3 -0.3 0.2 0.7 1.2 1.7 2.2 2.70 1 2 3
-0.5 0 0.5 1 1.5 2 2.5log [GFP fluorescence intensity]
-0.5 0.5 1.5 2.5GFP fluorescence intensity 0
0.02
0.04
0.06
0.08
0.1
0 1 2 3log [GFP fluorescence intensity]
A B C
154
Chapter 7
For the ‘why’, we have learnt that the metabolic shift as we define it in L. lactis (under artificial steady-state chemostat environment) cannot be explained by optimal resource allocation. It has been five years since the project started and the field has moved on since then. Possibly if we can pin point the right proxy for fitness, we might be able to explain the shift, which could be an “anticipatory response” beneficial for a future challenge as was shown for yeast with respect to its diauxic shift (Mitchell et al, 2009). Recently, the well-established view of “regulation in microorganisms is optimized” (Schuetz et al, 2012) has been challenged to shift to “regulation is often suboptimal, at least under laboratory conditions” (Price et al, 2013). Based on this we could conclude that L. lactis might in fact not be an optimized lab organism. It would be very interesting to see how further research shapes these statements.
Systems biology is a cycle and this thesis has thus contributed to one cycle. It is time for the next one to start spinning!
(Castro et al, 2009)cellobiose-PTS and the novel GlcU permease”,”container-ti-tle”:”Molecular microbiology”,”page”:”795-806”,”volume”:”71”,”issue”:”3”,”-source”:”NCBI PubMed”,”abstract”:”According to previous reports, Lactococcus lactis imports glucose via two distinct phosphoenolpyruvate:phosphotransferase systems (mannose-PTS and cellobiose-PTS
155
Bibliography
Bibliography
Aggarwal K & Lee KH (2003) Functional genomics and proteomics as a foundation for systems biology. Brief. Funct. Genomic. Proteomic. 2: 175–184
Aledo JC & Esteban del Valle A (2002) Glycolysis in wonderland: the importance of energy dissipation in metabolic pathways. J. Chem. Educ. 79: 1336
Aledo JC, Pérez-Claros JA & Esteban del Valle A (2007) Switching between cooperation and competition in the use of extracellular glucose. J. Mol. Evol. 65: 328–339
Anastasiou D, Poulogiannis G, Asara JM, Boxer MB, Jiang J, Shen M, Bellinger G, Sasaki AT, Locasale JW, Auld DS, Thomas CJ, Vander Heiden MG & Cantley LC (2011) Inhibition of pyruvate kinase M2 by reactive oxygen species contributes to cellular antioxidant responses. Science 334: 1278–1283
Andersen AZ, Carvalho AL, Neves AR, Santos H, Kummer U & Olsen LF (2009) The metabolic pH response in Lactococcus lactis: an integrative experimental and modelling approach. Comput. Biol. Chem. 33: 71–83
Angulo-Brown F, Santillán M & Calleja-Quevedo E (1995) Thermodynamic optimality in some biochemical reactions. Il Nuovo Cimento 17: 87–90
Ashburner M, Ball CA, Blake JA, Botstein D, Butler H, Cherry JM, Davis AP, Dolinski K, Dwight SS, Eppig JT, Harris MA, Hill DP, Issel-Tarver L, Kasarskis A, Lewis S, Matese JC, Richardson JE, Ringwald M, Rubin GM & Sherlock G (2000) Gene ontology: tool for the unification of biology. The Gene Ontology Consortium. Nat. Genet. 25: 25–29
Bachmann H, Fischlechner M, Rabbers I, Barfa N, Branco Dos Santos F, Molenaar D & Teusink B (2013) Availability of public goods shapes the evolution of competing metabolic strategies. Proc. Natl. Acad. Sci. U. S. A. 110: 14302–14307
Bachmann H, Molenaar D, Kleerebezem M & van Hylckama Vlieg JET (2011) High local substrate availability stabilizes a cooperative trait. ISME J. 5: 929–932
Baicu SC & Taylor MJ (2002) Acid-base buffering in organ preservation solutions as a function of temperature: new parameters for comparing buffer capacity and efficiency. Cryobiology 45: 33–48
Balaban NQ, Merrin J, Chait R, Kowalik L & Leibler S (2004) Bacterial persistence as a phenotypic switch. Science 305: 1622–1625
Beeler T, Bruce K & Dunn T (1997) Regulation of cellular Mg2+ by Saccharomyces cerevisiae. BBA-Biomembr. 1323: 310–318
Beg QK, Vazquez A, Ernst J, de Menezes MA, Bar-Joseph Z, Barabási A-L & Oltvai ZN (2007) Intracellular crowding defines the mode and sequence of substrate uptake by Escherichia coli and constrains its metabolic activity. Proc. Natl. Acad. Sci. U. S. A. 104: 12663–12668
Bennett MR, Pang WL, Ostroff NA, Baumgartner BL, Nayak S, Tsimring LS & Hasty J (2008) Metabolic gene regulation in a dynamically changing environment. Nature 454: 1119–1122
Berlec A, Ravnikar M & Strukelj B (2012) Lactic acid bacteria as oral delivery systems for biomolecules. Pharm. 67: 891–898
Bertalanffy L von (1950) An outline of general system theory. Br. J. Philos. Sci. 1: 134–165
Bertalanffy L von (1969) General system theory: foundations, development, applications Revised. George Braziller, Inc.
156
Le Bloas P, Guilbert N, Loubiere P & Lindley ND (1993) Growth inhibition and pyruvate overflow during glucose metabolism of Eubacterium limosum are related to a limited capacity to reassimilate CO2 by the acetyl-CoA pathway. Microbiology 139: 1861–1868
Boele J, Olivier BG & Teusink B (2012) FAME, the Flux Analysis and Modeling Environment. BMC Syst. Biol. 6: 8
Bond DR & Russell JB (1996) A role for fructose 1,6-diphosphate in the ATPase-mediated energy-spilling reaction of Streptococcus bovis. Appl. Environ. Microbiol. 62: 2095–2099
Braat H, Rottiers P, Hommes DW, Huyghebaert N, Remaut E, Remon J-P, van Deventer SJH, Neirynck S, Peppelenbosch MP & Steidler L (2006) A phase I trial with transgenic bacteria expressing interleukin-10 in Crohn’s disease. Clin. Gastroenterol. Hepatol. Off. Clin. Pr. J. Am. Gastroenterol. Assoc. 4: 754–759
Brauer MJ, Huttenhower C, Airoldi EM, Rosenstein R, Matese JC, Gresham D, Boer VM, Troyanskaya OG & Botstein D (2008) Coordination of growth rate, cell cycle, stress response, and metabolic activity in yeast. Mol. Biol. Cell 19: 352–367
Bremer H & Dennis PP (1996) Modulation of chemical composition and other parameters of the cell by growth rate. In Escherichia coli and Salmonella pp 1553–1569. Washington, DC: ASM Press
Britten RJ (1954) Extracellular metabolic products of Escherichia coli during rapid growth. Science 119: 578
Brockmeier U, Caspers M, Freudl R, Jockwer A, Noll T & Eggert T (2006) Systematic screening of all signal peptides from Bacillus subtilis: a powerful strategy in optimizing heterologous protein secretion in Gram-positive bacteria. J. Mol. Biol. 362: 393–402
Brown CJ, Todd KM & Rosenzweig RF (1998) Multiple duplications of yeast hexose transport genes in response to selection in a glucose-limited environment. Mol. Biol. Evol. 15: 931–942
Bubunenko M, Korepanov A, Court DL, Jagannathan I, Dickinson D, Chaudhuri BR, Garber MB & Culver GM (2006) 30S ribosomal subunits can be assembled in vivo without primary binding ribosomal protein S15. RNA New York N 12: 1229–1239
Buescher JM, Liebermeister W, Jules M, Uhr M, Muntel J, Botella E, Hessling B, Kleijn RJ, Chat LL, Lecointe F, Mäder U, Nicolas P, Piersma S, Rügheimer F, Becher D, Bessieres P, Bidnenko E, Denham EL, Dervyn E, Devine KM, et al (2012) Global network reorganization during dynamic adaptations of Bacillus subtilis metabolism. Science 335: 1099–1103
Canelas AB, Harrison N, Fazio A, Zhang J, Pitkänen J-P, van den Brink J, Bakker BM, Bogner L, Bouwman J, Castrillo JI, Cankorur A, Chumnanpuen P, Daran-Lapujade P, Dikicioglu D, van Eunen K, Ewald JC, Heijnen JJ, Kirdar B, Mattila I, Mensonides FIC, et al (2010) Integrated multilaboratory systems biology reveals differences in protein metabolism between two reference yeast strains. Nat. Commun. 1: 145
Canelas AB, ten Pierick A, Ras C, Seifar RM, van Dam JC, van Gulik WM & Heijnen JJ (2009) Quantitative evaluation of intracellular metabolite extraction techniques for yeast metabolomics. Anal. Chem. 81: 7379–7389
Carr FJ, Chill D & Maida N (2002) The lactic acid bacteria: a literature survey. Crit. Rev. Microbiol. 28: 281–370
Carvalho AL, Turner DL, Fonseca LL, Solopova A, Catarino T, Kuipers OP, Voit EO, Neves AR & Santos H (2013) Metabolic and transcriptional analysis of acid stress in Lactococcus lactis, with a focus on the kinetics of lactic acid pools. PLoS ONE 8: e68470
Castrillo JI, Zeef LA, Hoyle DC, Zhang N, Hayes A, Gardner DCJ, Cornell MJ, Petty J, Hakes L, Wardleworth L, Rash B, Brown M, Dunn WB, Broadhurst D, O’Donoghue K, Hester SS, Dunkley TPJ, Hart SR, Swainston N, Li P, et al (2007) Growth control of the eukaryote cell: a systems biology study in yeast. J. Biol. 6: 4
157
Bibliography
Castro R, Neves AR, Fonseca LL, Pool WA, Kok J, Kuipers OP & Santos H (2009) Characterization of the individual glucose uptake systems of Lactococcus lactis: mannose-PTS, cellobiose-PTS and the novel GlcU permease. Mol. Microbiol. 71: 795–806
Chalfie M, Tu Y, Euskirchen G, Ward WW & Prasher DC (1994) Green fluorescent protein as a marker for gene expression. Science 263: 802–805
Chen Z, Odstrcil EA, Tu BP & McKnight SL (2007) Restriction of DNA replication to the reductive phase of the metabolic cycle protects genome integrity. Science 316: 1916–1919
Chiesa SC, Irvine RL & Manning JF Jr (1985) Feast/famine growth environments and activated sludge population selection. Biotechnol. Bioeng. 27: 562–568
Cocaign-Bousquet M, Even S, Lindley ND & Loubière P (2002) Anaerobic sugar catabolism in Lactococcus lactis: genetic regulation and enzyme control over pathway flux. Appl. Microbiol. Biotechnol. 60: 24–32
Cocaign-Bousquet M, Garrigues C, Loubiere P & Lindley ND (1996) Physiology of pyruvate metabolism in Lactococcus lactis. Antonie Van Leeuwenhoek 70: 253–267
Cogan J f., Walsh D & Condon S (1989) Impact of aeration on the metabolic end-products formed from glucose and galactose by Streptococcus lactis. J. Appl. Microbiol. 66: 77–84
Cogan TM & Hill C (1993) Cheese starter cultures. In Cheese: Chemistry, Physics and Microbiology, Fox PF (ed) pp 193–255. Springer
Collins LB & Thomas TD (1974) Pyruvate kinase of Streptococcus lactis. J. Bacteriol. 120: 52–58
Cossins BP, Jacobson MP & Guallar V (2011) A new view of the bacterial cytosol environment. PLoS Comput. Biol. 7: e1002066–e1002066
Crow VL & Pritchard GG (1976) Purification and properties of pyruvate kinase from Streptococcus lactis. Biochim. Biophys. Acta 438: 90–101
Crow VL & Pritchard GG (1977a) The effect of monovalent and divalent cations on the activity of Streptococcus lactis C10 pyruvate kinase. Biochim. Biophys. Acta 481: 105–114
Crow VL & Pritchard GG (1977b) Fructose 1,6-diphosphate-activated L-lactate dehydrogenase from Streptococcus lactis: kinetic properties and factors affecting activation. J. Bacteriol. 131: 82–91
Daran-Lapujade P, Jansen MLA, Daran J-M, Gulik W van, Winde JH de & Pronk JT (2004) Role of transcriptional regulation in controlling fluxes in central carbon metabolism of Saccharomyces cerevisiae A chemostat culture study. J. Biol. Chem. 279: 9125–9138
Daran-Lapujade P, Rossell S, van Gulik WM, Luttik MAH, de Groot MJL, Slijper M, Heck AJR, Daran J-M, de Winde JH, Westerhoff HV, Pronk JT & Bakker BM (2007) The fluxes through glycolytic enzymes in Saccharomyces cerevisiae are predominantly regulated at posttranscriptional levels. Proc. Natl. Acad. Sci. U. S. A. 104: 15753–15758
Dean AM, Dykhuizen DE & Hartl DL (1986) Fitness as a function of beta-galactosidase activity in Escherichia coli. Genet. Res. 48: 1–8
DeBerardinis RJ & Thompson CB (2012) Cellular metabolism and disease: what do metabolic outliers teach us? Cell 148: 1132–1144
Dekel E & Alon U (2005) Optimality and evolutionary tuning of the expression level of a protein. Nature 436: 588–592
158
de Deken RH (1966) The Crabtree effect: a regulatory system in yeast. J. Gen. Microbiol. 44: 149–156
de Groot MJL, Daran-Lapujade P, van Breukelen B, Knijnenburg TA, de Hulster EAF, Reinders MJT, Pronk JT, Heck AJR & Slijper M (2007) Quantitative proteomics and transcriptomics of anaerobic and aerobic yeast cultures reveals post-transcriptional regulation of key cellular processes. Microbiology 153: 3864–3878
de Vos WM (2011) Systems solutions by lactic acid bacteria: from paradigms to practice. Microb. Cell Factories 10 Suppl 1: S2
de Vos WM & Hugenholtz J (2004) Engineering metabolic highways in Lactococci and other lactic acid bacteria. Trends Biotechnol. 22: 72–79
Diaz-Ruiz R, Rigoulet M & Devin A (2011) The Warburg and Crabtree effects: On the origin of cancer cell energy metabolism and of yeast glucose repression. Biochim. Biophys. Acta 1807: 568–576
Dominguez H, Rollin C, Guyonvarch A, Guerquin-Kern J-L, Cocaign-Bousquet M & Lindley ND (1998) Carbon-flux distribution in the central metabolic pathways of Corynebacterium glutamicum during growth on fructose. Eur. J. Biochem. FEBS 254: 96–102
Donalies UEB, Nguyen HTT, Stahl U & Nevoigt E (2008) Improvement of Saccharomyces yeast strains used in brewing, wine making and baking. Adv. Biochem. Eng. Biotechnol. 111: 67–98
Dong H, Nilsson L & Kurland CG (1995) Gratuitous overexpression of genes in Escherichia coli leads to growth inhibition and ribosome destruction. J. Bacteriol. 177: 1497–1504
Douma RD (2010) Regulation, transport aspects and degeneration of penicillin biosynthesis in Penicillium chrysogenum . Available at: http://repository.tudelft.nl/view/ir/uuid:b9e00c77-26c8-423f-a5c2-6ac5092c7bb6
Dressaire C, Gitton C, Loubiere P, Monnet V, Queinnec I & Cocaign-Bousquet M (2009) Transcriptome and proteome exploration to model translation efficiency and protein stability in Lactococcus lactis. PLoS Comput. Biol. 5: e1000606–e1000606
Dressaire C, Redon E, Milhem H, Besse P, Loubière P & Cocaign-Bousquet M (2008) Growth rate regulated genes and their wide involvement in the Lactococcus lactis stress responses. BMC Genomics 9: 343
Driessen AJ, Poolman B, Kiewiet R & Konings W (1987) Arginine transport in Streptococcus lactis is catalyzed by a cationic exchanger. Proc. Natl. Acad. Sci. U. S. A. 84: 6093–6097
Dubnau D & Losick R (2006) Bistability in bacteria. Mol. Microbiol. 61: 564–572
Eckhardt TH, Skotnicka D, Kok J & Kuipers OP (2013) Transcriptional regulation of fatty acid biosynthesis in Lactococcus lactis. J. Bacteriol. 195: 1081–1089
Edwards JS, Ibarra RU & Palsson BO (2001) In silico predictions of Escherichia coli metabolic capabilities are consistent with experimental data. Nat. Biotechnol. 19: 125–130
Even S, Garrigues C, Loubiere P, Lindley ND & Cocaign-Bousquet M (1999) Pyruvate metabolism in Lactococcus lactis is dependent upon glyceraldehyde-3-phosphate dehydrogenase activity. Metab. Eng. 1: 198–205
Even S, Lindley ND & Cocaign-bousquet M (2003) Transcriptional, translational and metabolic regulation of glycolysis in Lactococcus lactis subsp. cremoris MG 1363 grown in continuous acidic cultures. Microbiology 149: 1935–1944
Even S, Lindley ND & Cocaign-Bousquet M (2001) Molecular physiology of sugar catabolism in Lactococcus lactis IL1403. J. Bacteriol. 183: 3817–3824
Even S, Lindley ND, Loubiere P & Cocaign-Bousquet M (2002) Dynamic response of catabolic pathways to
159
Bibliography
autoacidification in Lactococcus lactis: transcript profiling and stability in relation to metabolic and energetic constraints. Mol. Microbiol. 45: 1143–52
Exterkate FA & Alting AC (1999) Role of calcium in activity and stability of the Lactococcus lactis cell envelope proteinase. Appl. Environ. Microbiol. 65: 1390–1396
Feldman-Salit A, Hering S, Messiha H, Veith N, Cojocaru V, Sieg A, Westerhoff H, Kreikemeyer B, Wade RC & Fiedler T (2013) Regulation of the activity of lactate dehydrogenases from four lactic acid bacteria. J. Biol. Chem. Available at: http://www.jbc.org/content/early/2013/05/17/jbc.M113.458265
Ferea TL, Botstein D, Brown PO & Rosenzweig RF (1999) Systematic changes in gene expression patterns following adaptive evolution in yeast. Proc. Natl. Acad. Sci. 96: 9721–9726
Ferenci T (2008) The spread of a beneficial mutation in experimental bacterial populations: the influence of the environment and genotype on the fixation of rpoS mutations. Heredity 100: 446–452
Flahaut NAL, Wiersma A, van de Bunt B, Martens DE, Schaap PJ, Sijtsma L, Dos Santos VAM & de Vos WM (2013) Genome-scale metabolic model for Lactococcus lactis MG1363 and its application to the analysis of flavor formation. Appl. Microbiol. Biotechnol. 97: 8729–8739
Fordyce AM, Moore CH & Pritchard GG (1982) Phosphofructokinase from Streptococcus lactis. Methods Enzymol. 90: 77–82
Fujita Y (2009) Carbon catabolite control of the metabolic network in Bacillus subtilis. Biosci. Biotechnol. Biochem. 73: 245–259
Garrigues C, Loubiere P, Lindley ND & Cocaign-Bousquet M (1997) Control of the shift from homolactic acid to mixed-acid fermentation in Lactococcus lactis: predominant role of the NADH/NAD+ ratio. J. Bacteriol. 179: 5282–5287
Garrigues C, Mercade M, Cocaign-Bousquet M, Lindley ND & Loubiere P (2001) Regulation of pyruvate metabolism in Lactococcus lactis depends on the imbalance between catabolism and anabolism. Biotechnol. Bioeng. 74: 108–115
Gasson MJ (1983) Plasmid complements of Streptococcus lactis NCDO712 and other lactic streptococci after protoplast-induced curing. J. Bacteriol. 154: 1–9
Gatenby RA & Gillies RJ (2004) Why do cancers have high aerobic glycolysis? Nat. Rev. Cancer 4: 891–899
Gatenby RA, Gillies RJ & Brown JS (2010) Evolutionary dynamics of cancer prevention. Nat. Rev. Cancer 10: 526–527
Gausing K (1977) Regulation of ribosome production in Escherichia coli: Synthesis and stability of ribosomal RNA and of ribosomal protein messenger RNA at different growth rates. J. Mol. Biol. 115: 335–354
Gehlenborg N, O’Donoghue SI, Baliga NS, Goesmann A, Hibbs MA, Kitano H, Kohlbacher O, Neuweger H, Schneider R, Tenenbaum D & Gavin A-C (2010) Visualization of omics data for systems biology. Nat. Methods 7: S56–68
Gillies RJ & Gatenby RA (2007) Adaptive landscapes and emergent phenotypes: why do cancers have high glycolysis? J. Bioenerg. Biomembr. 39: 251–257
Gillies RJ, Robey I & Gatenby RA (2008) Causes and consequences of increased glucose metabolism of cancers. J. Nucl. Med. 49 Suppl 2: 24S–42S
Gnad F, de Godoy LMF, Cox J, Neuhauser N, Ren S, Olsen JV & Mann M (2009) High-accuracy identification and bioinformatic analysis of in vivo protein phosphorylation sites in yeast. Proteomics 9: 4642–4652
160
Gnad F, Gunawardena J & Mann M (2011) PHOSIDA 2011: the posttranslational modification database. Nucleic Acids Res. 39: D253–260
Goel A, Santos F, Vos WM de, Teusink B & Molenaar D (2012a) Standardized assay medium to measure Lactococcus lactis enzyme activities while mimicking intracellular conditions. Appl. Environ. Microbiol. 78: 134–143
Goel A, Wortel MT, Molenaar D & Teusink B (2012b) Metabolic shifts: a fitness perspective for microbial cell factories. Biotechnol. Lett. 34: 2147–2160
Golbik R, Naumann M, Otto A, Müller E, Behlke J, Reuter R, Hübner G & Kriegel TM (2001) Regulation of phosphotransferase activity of hexokinase 2 from Saccharomyces cerevisiae by modification at serine-14. Biochemistry (Mosc.) 40: 1083–1090
Good NE, Winget GD, Winter W, Connolly TN, Izawa S & Singh RMM (1966) Hydrogen ion buffers for biological research. Biochemistry (Mosc.) 5: 467–477
Gore J, Youk H & van Oudenaarden A (2009) Snowdrift game dynamics and facultative cheating in yeast. Nature 459: 253–256
Gracy RW & Tilley BE (1975) Phosphoglucose isomerase of human erythrocytes and cardiac tissue. Methods Enzymol. 41: 392–400
Gunawardena J (2010) Models in systems biology: the parameter problem and the meanings of robustness. In Elements of Computational Systems Biology, Lodhi HM & Muggleton SH (eds) pp 19–47. John Wiley & Sons, Inc. Available at: http://onlinelibrary.wiley.com/doi/10.1002/9780470556757.ch2/summary [Accessed July 3, 2013]
Gunnewijk MG, van den Bogaard PT, Veenhoff LM, Heuberger EH, de Vos WM, Kleerebezem M, Kuipers OP & Poolman B (2001) Hierarchical control versus autoregulation of carbohydrate utilization in bacteria. J. Mol. Microbiol. Biotechnol. 3: 401–413
Gunnewijk MG & Poolman B (2000) Phosphorylation state of HPr determines the level of expression and the extent of phosphorylation of the lactose transport protein of Streptococcus thermophilus. J. Biol. Chem. 275: 34073–34079
Hamilton WD (1967) Extraordinary sex ratios. A sex-ratio theory for sex linkage and inbreeding has new implications in cytogenetics and entomology. Science 156: 477–488
Hanahan D & Weinberg RA (2011) Hallmarks of cancer: the next generation. Cell 144: 646–674
Harold FM & Kakinuma Y (1985) Primary and secondary transport of cations in bacteria. Ann. N. Y. Acad. Sci. 456: 375–383
Hartman FC & Barker R (1965) An exploration of the active site of aldolase using structural analogs of fructose diphosphate. Biochemistry (Mosc.) 4: 1068–1075
Haverkorn van Rijsewijk BRB, Nanchen A, Nallet S, Kleijn RJ & Sauer U (2011) Large-scale 13C-flux analysis reveals distinct transcriptional control of respiratory and fermentative metabolism in Escherichia coli. Mol. Syst. Biol. 7: 477
Heinrich R, Schuster S & Holzhütter HG (1991) Mathematical analysis of enzymic reaction systems using optimization principles. Eur. J. Biochem. FEBS 201: 1–21
Hoefnagel MHN, van Der Burgt A, Martens DE, Hugenholtz J & Snoep JL (2002a) Time dependent responses of glycolytic intermediates in a detailed glycolytic model of Lactococcus lactis during glucose run-out experiments. Mol Biol Rep 29: 157–161

161
Bibliography
Hoefnagel MHN, Starrenburg MJC, Martens DE, Hugenholtz J, Kleerebezem M, Van Swam II, Bongers R, Westerhoff H V & Snoep JL (2002b) Metabolic engineering of lactic acid bacteria, the combined approach: kinetic modelling, metabolic control and experimental analysis. Microbiology 148: 1003–13
Hoffmeister D & Keller NP (2007) Natural products of filamentous fungi: enzymes, genes, and their regulation. Nat. Prod. Rep. 24: 393–416
Hollywood N & Doelle HW (1976) Effect of specific growth rate and glucose concentration on growth and glucose metabolism of Escherichia coli K-12. Microbios 17: 23–33
Hols P, Ramos A, Hugenholtz J, Delcour J, de Vos WM, Santos H & Kleerebezem M (1999) Acetate utilization in Lactococcus lactis deficient in lactate dehydrogenase: a rescue pathway for maintaining redox balance. J. Bacteriol. 181: 5521–5526
Huberts DHEW, Niebel B & Heinemann M (2012) A flux-sensing mechanism could regulate the switch between respiration and fermentation. FEMS Yeast Res. 12: 118–128
Hurwitz C & Rosano CL (1967) The intracellular concentration of bound and unbound magnesium ions in Escherichia coli. J. Biol. Chem. 242: 3719–22
Ibarra RU, Edwards JS & Palsson BO (2002) Escherichia coli K-12 undergoes adaptive evolution to achieve in silico predicted optimal growth. Nature 420: 186–189
Ikeda M (2006) Towards bacterial strains overproducing L-tryptophan and other aromatics by metabolic engineering. Appl. Microbiol. Biotechnol. 69: 615–626
Ishii N, Nakahigashi K, Baba T, Robert M, Soga T, Kanai A, Hirasawa T, Naba M, Hirai K, Hoque A, Ho PY, Kakazu Y, Sugawara K, Igarashi S, Harada S, Masuda T, Sugiyama N, Togashi T, Hasegawa M, Takai Y, et al (2007) Multiple high-throughput analyses monitor the response of E. coli to perturbations. Science 316: 593–597
Jansen MLA, Diderich JA, Mashego M, Hassane A, Winde JH de, Daran-Lapujade P & Pronk JT (2005) Prolonged selection in aerobic, glucose-limited chemostat cultures of Saccharomyces cerevisiae causes a partial loss of glycolytic capacity. Microbiology 151: 1657–1669
Jensen NB, Melchiorsen CR, Jokumsen KV & Villadsen J (2001) Metabolic behavior of Lactococcus lactis MG1363 in microaerobic continuous cultivation at a low dilution rate. Appl. Environ. Microbiol. 67: 2677–2682
Jensen PR & Hammer K (1993) Minimal requirements for exponential growth of Lactococcus lactis. Appl. Environ. Microbiol. 59: 4363–4366
Jin JH & Lee J (2005) In silico analysis of lactic acid secretion metabolism through the top-down approach: Effect of grouping in enzyme kinetics. Biotechnol. Bioprocess Eng. 10: 462–469
Jonas HA, Anders RF & Jago GR (1972) Factors affecting the activity of the lactate dehydrognease of Streptococcus cremoris. J. Bacteriol. 111: 397–403
Kamaly KM & Marth EH (1989) Enzyme activities of cell-free extracts from mutant strains of lactic streptococci subjected to sublethal heating or freeze-thawing. Cryobiology 26: 496–507
Kashket ER & Wilson TH (1973) Proton-coupled accumulation of galactoside in Streptococcus lactis 7962. Proc. Natl. Acad. Sci. 70: 2866–2869
Khalil AS & Collins JJ (2010) Synthetic biology: applications come of age. Nat. Rev. Genet. 11: 367–379
Kim J-W & Dang CV (2005) Multifaceted roles of glycolytic enzymes. Trends Biochem. Sci. 30: 142–150
Kitano H (2002) Systems biology: a brief overview. Science 295: 1662–1664
162
Klein DJ, Moore PB & Steitz TA (2004) The roles of ribosomal proteins in the structure assembly, and evolution of the large ribosomal subunit. J. Mol. Biol. 340: 141–177
Koebmann BJ, Andersen HW, Solem C & Jensen PR (2002) Experimental determination of control of glycolysis in Lactococcus lactis. Antonie Van Leeuwenhoek 82: 237–248
Konings WN, Poolman B & Driessen AJ (1989) Bioenergetics and solute transport in lactococci. Crit. Rev. Microbiol. 16: 419–476
Koser SA (1923) Utilization of the salts of organic acids by the colon-aerogenes group. J. Bacteriol. 8: 493–520
Kotte O, Zaugg JB & Heinemann M (2010) Bacterial adaptation through distributed sensing of metabolic fluxes. Mol. Syst. Biol. 6: 355
Kowalczyk M & Bardowski J (2007) Regulation of sugar catabolism in Lactococcus lactis. Crit. Rev. Microbiol. 33: 1–13
Kowaltowski AJ, de Souza-Pinto NC, Castilho RF & Vercesi AE (2009) Mitochondria and reactive oxygen species. Free Radic. Biol. Med. 47: 333–343
Kreft J-U (2004) Biofilms promote altruism. Microbiology (Reading, Engl.) 150: 2751–2760
Krokowski D, Gaccioli F, Majumder M, Mullins MR, Yuan CL, Papadopoulou B, Merrick WC, Komar AA, Taylor D & Hatzoglou M (2011) Characterization of hibernating ribosomes in mammalian cells. Cell Cycle Georget. Tex 10: 2691–2702
Kuipers OP, de Jong A, Baerends RJS, van Hijum SAFT, Zomer AL, Karsens HA, den Hengst CD, Kramer NE, Buist G & Kok J (2002) Transcriptome analysis and related databases of Lactococcus lactis. Antonie Van Leeuwenhoek 82: 113–122
Kuipers OP & Kok J (2007) Optimizing growth rate, biomass and product formation of Lactococcus lactis by a Systems Biology approach. STW Proposal
Kuipers OP, de Ruyter PGG., Kleerebezem M & de Vos WM (1998) Quorum sensing-controlled gene expression in lactic acid bacteria. J. Biotechnol. 64: 15–21
Kulbe KD, Foellmer H & Fuchs J (1982) Simultaneous purification of glyceraldehyde-3-phosphate dehydrogenase, 3-phosphoglycerate kinase, and phosphoglycerate mutase from pig liver and muscle. Methods Enzymol. 90: 498–511
Lahtvee P-J, Adamberg K, Arike L, Nahku R, Aller K & Vilu R (2011) Multi-omics approach to study the growth efficiency and amino acid metabolism in Lactococcus lactis at various specific growth rates. Microb. Cell Factories 10: 12
Lambert PA, Hancock IC & Baddiley J (1975) The interaction of magnesium ions with teichoic acid. Biochem. J. 149: 519–24
Larsen R (2005) Transcriptional regulation of central acid metabolism in Lactococcus lactis PhD Thesis: University of Groningen
Larsen R, Buist G, Kuipers OP & Kok J (2004) ArgR and AhrC are both required for regulation of arginine metabolism in Lactococcus lactis. J. Bacteriol. 186: 1147–1157
Larsen R, van Hijum SAFT, Martinussen J, Kuipers OP & Kok J (2008) Transcriptome analysis of the Lactococcus lactis ArgR and AhrC regulons. Appl. Environ. Microbiol. 74: 4768–4771
Larsen R, Kloosterman TG, Kok J & Kuipers OP (2006) GlnR-mediated regulation of nitrogen metabolism in

163
Bibliography
Lactococcus lactis. J. Bacteriol. 188: 4978–4982
Le Bourgeois P, Daveran-Mingot M-L & Ritzenthaler P (2000) Genome plasticity among related Lactococcus strains: identification of genetic events associated with macrorestriction polymorphisms. J. Bacteriol. 182: 2481–2491
Lee BH & Nowak T (1992) Influence of pH on the Mn2+ activation of and binding to yeast enolase: a functional study. Biochemistry (Mosc.) 31: 2165–2171
Lee JW, Kim TY, Jang Y-S, Choi S & Lee SY (2011) Systems metabolic engineering for chemicals and materials. Trends Biotechnol. 29: 370–378
Leuchtenberger W, Huthmacher K & Drauz K (2005) Biotechnological production of amino acids and derivatives: current status and prospects. Appl. Microbiol. Biotechnol. 69: 1–8
Levering J, Musters MWJM, Bekker M, Bellomo D, Fiedler T, de Vos WM, Hugenholtz J, Kreikemeyer B, Kummer U & Teusink B (2012) Role of phosphate in the central metabolism of two lactic acid bacteria--a comparative systems biology approach. FEBS J. 279: 1274–1290
Lewis JA & Escalante-Semerena JC (2006) The FAD-dependent tricarballylate dehydrogenase (TcuA) enzyme of Salmonella enterica converts tricarballylate into cis-aconitate. J Bacteriol 188: 5479–86
Lim Y, Wong NSC, Lee YY, Ku SCY, Wong DCF & Yap MGS (2010) Engineering mammalian cells in bioprocessing - current achievements and future perspectives. Biotechnol. Appl. Biochem. 55: 175–189
Linares DM, Kok J & Poolman B (2010) Genome sequences of Lactococcus lactis MG1363 (revised) and NZ9000 and comparative physiological studies. J. Bacteriol. 192: 5806–5812
Loesche WJ (1986) Role of Streptococcus mutans in human dental decay. Microbiol. Rev. 50: 353–380
Lohmeier-Vogel EM, Hahn-Hägerdahl B & Vogel HJ (1986) Phosphorus-31 NMR studies of maltose and glucose metabolism in Streptococcus lactis. Appl. Microbiol. Biotechnol. 25: 43–51
Lopez de Felipe F & Gaudu P (2009) Multiple control of the acetate pathway in Lactococcus lactis under aeration by catabolite repression and metabolites. Appl. Microbiol. Biotechnol. 82: 1115–1122
Lu Y-J, White SW & Rock CO (2005) Domain swapping between Enterococcus faecalis FabN and FabZ proteins localizes the structural determinants for isomerase activity. J. Biol. Chem. 280: 30342 –30348
Luesink EJ, van Herpen RE, Grossiord BP, Kuipers OP & de Vos WM (1998) Transcriptional activation of the glycolytic las operon and catabolite repression of the gal operon in Lactococcus lactis are mediated by the catabolite control protein CcpA. Mol. Microbiol. 30: 789–798
Macek B, Gnad F, Soufi B, Kumar C, Olsen JV, Mijakovic I & Mann M (2008) Phosphoproteome analysis of E. coli reveals evolutionary conservation of bacterial Ser/Thr/Tyr phosphorylation. Mol. Cell. Proteomics MCP 7: 299–307
MacLean RC (2008) The tragedy of the commons in microbial populations: insights from theoretical, comparative and experimental studies. Heredity 100: 471–477
MacLean RC & Gudelj I (2006) Resource competition and social conflict in experimental populations of yeast. Nature 441: 498–501
Marcus CJ (1976) Inhibition of bovine hepatic fructose-1,6-diphosphatase by substrate analogs. J. Biol. Chem. 251: 2963–2966
Mashego MR, Jansen MLA, Vinke JL, van Gulik WM & Heijnen JJ (2005) Changes in the metabolome of

164
Saccharomyces cerevisiae associated with evolution in aerobic glucose-limited chemostats. FEMS Yeast Res. 5: 419–430
McGovern PE, Zhang J, Tang J, Zhang Z, Hall GR, Moreau RA, Nuñez A, Butrym ED, Richards MP, Wang C, Cheng G, Zhao Z & Wang C (2004) Fermented beverages of pre- and proto-historic China. Proc. Natl. Acad. Sci. U. S. A. 101: 17593–17598
Melchiorsen CR, Jokumsen KV, Villadsen J, Israelsen H & Arnau J (2002) The level of pyruvate-formate lyase controls the shift from homolactic to mixed-acid product formation in Lactococcus lactis. Appl. Microbiol. Biotechnol. 58: 338–344
Melchiorsen CR, Jokumsen KV, Villadsen J, Johnsen MG, Israelsen H & Arnau J (2000) Synthesis and posttranslational regulation of Pyruvate Formate-Lyase in Lactococcus lactis. J. Bacteriol. 182: 4783–4788
Meyer V, Wu B & Ram AFJ (2011) Aspergillus as a multi-purpose cell factory: current status and perspectives. Biotechnol. Lett. 33: 469–476
Milo R, Jorgensen P, Moran U, Weber G & Springer M (2010) BioNumbers–the database of key numbers in molecular and cell biology. Nucleic Acids Res. 38: D750–753
Mitchell A, Romano GH, Groisman B, Yona A, Dekel E, Kupiec M, Dahan O & Pilpel Y (2009) Adaptive prediction of environmental changes by microorganisms. Nature 460: 220–224
Molenaar D, Abee T & Konings WN (1991) Continuous measurement of the cytoplasmic pH in Lactococcus lactis with a fluorescent pH indicator. Biochim. Biophys. Acta 1115: 75–83
Molenaar D, van Berlo R, de Ridder D & Teusink B (2009) Shifts in growth strategies reflect tradeoffs in cellular economics. Mol. Syst. Biol. 5: 323
Mou L, Mulvena DP, Jonas HA & Jago GR (1972) Purification and properties of nicotinamide adenine dinucleotide-dependent D- and L- lactate dehydrogenases in a group N streptococcus. J. Bacteriol. 111: 392–396
Muskiet FA, van Doormaal JJ, Martini IA, Wolthers BG & van der Slik W (1983) Capillary gas chromatographic profiling of total long-chain fatty acids and cholesterol in biological materials. J. Chromatogr. 278: 231–244
Nam JW, Han KH, Yoon ES, Shin DI, Jin JH, Lee DH, Lee SY & Lee J (2004) In silico analysis of lactate producing metabolic network in Lactococcus lactis. Enzyme Microb. Technol. 35: 654–662
Neves AR, Pool WA, Kok J, Kuipers OP & Santos H (2005) Overview on sugar metabolism and its control in Lactococcus lactis - the input from in vivo NMR. FEMS Microbiol. Rev. 29: 531–554
Neves AR, Ramos A, Nunes MC, Kleerebezem M, Hugenholtz J, de Vos WM, Almeida J & Santos H (1999) In vivo nuclear magnetic resonance studies of glycolytic kinetics in Lactococcus lactis. Biotechnol. Bioeng. 64: 200–212
Neves AR, Ventura R, Mansour N, Shearman C, Gasson MJ, Maycock C, Ramos A & Santos H (2002) Is the glycolytic flux in Lactococcus lactis primarily controlled by the redox charge? Kinetics of NAD+ and NADH pools determined in vivo by 13C NMR. J. Biol. Chem. 277: 28088–28098
Nevoigt E (2008) Progress in metabolic engineering of Saccharomyces cerevisiae. Microbiol. Mol. Biol. Rev. MMBR 72: 379–412
Nghiem NP & Cofer TM (2007) Effect of a nonmetabolizable analog of fructose-1,6-bisphosphate on glycolysis and ethanol production in strains of Saccharomyces cerevisiae and Escherichia coli. Appl. Biochem. Biotechnol. 141: 335–347

165
Bibliography
Nierhaus KH (1991) The assembly of prokaryotic ribosomes. Biochimie 73: 739–755
Noller HF, Hoffarth V & Zimniak L (1992) Unusual resistance of peptidyl transferase to protein extraction procedures. Science 256: 1416–1419
Nordkvist M, Jensen NBS & Villadsen J (2003) Glucose metabolism in Lactococcus lactis MG1363 under different aeration conditions: requirement of acetate to sustain growth under microaerobic conditions. Appl. Environ. Microbiol. 69: 3462–8
Oliveira AP, Nielsen J & Förster J (2005) Modeling Lactococcus lactis using a genome-scale flux model. BMC Microbiol. 5: 39
Oliveira AP & Sauer U (2012) The importance of post-translational modifications in regulating Saccharomyces cerevisiae metabolism. FEMS Yeast Res. 12: 104–117
Orth JD, Thiele I & Palsson BØ (2010) What is flux balance analysis? Nat. Biotechnol. 28: 245–248
Ozbudak EM, Thattai M, Lim HN, Shraiman BI & Van Oudenaarden A (2004) Multistability in the lactose utilization network of Escherichia coli. Nature 427: 737–740
Palmfeldt J, Paese M, Hahn-Hägerdal B & Van Niel EWJ (2004) The pool of ADP and ATP regulates anaerobic product formation in resting cells of Lactococcus lactis. Appl. Environ. Microbiol. 70: 5477–5484
Papp B, Teusink B & Notebaart RA (2009) A critical view of metabolic network adaptations. HFSP J. 3: 24–35
Park JH & Lee SY (2010) Metabolic pathways and fermentative production of L-aspartate family amino acids. Biotechnol. J. 5: 560–577
Pfeiffer T, Schuster S & Bonhoeffer S (2001) Cooperation and competition in the evolution of ATP-producing pathways. Science 292: 504–507
Phillips T (2008) Regulation of transcription and gene expression in eukaryotes. Nat. Educ. 1: Available at: http://www.nature.com/scitable/topicpage/regulation-of-transcription-and-gene-expression-in-1086
Picard F, Dressaire C, Girbal L & Cocaign-Bousquet M (2009) Examination of post-transcriptional regulations in prokaryotes by integrative biology. C. R. Biol. 332: 958–973
Piskur J, Rozpedowska E, Polakova S, Merico A & Compagno C (2006) How did Saccharomyces evolve to become a good brewer? Trends Genet. 22: 183–186
Pohl S & Harwood CR (2010) Heterologous protein secretion by Bacillus species from the cradle to the grave. Adv. Appl. Microbiol. 73: 1–25
Pollard A & Jones RGW (1979) Enzyme activities in concentrated solutions of glycinebetaine and other solutes. Planta 144: 291–298
Poolman B, Bosman B, Kiers J & Konings WN (1987a) Control of glycolysis by glyceraldehyde-3-phosphate dehydrogenase in Streptococcus cremoris and Streptococcus lactis. J. Bacteriol. 169: 5887–5890
Poolman B, Driessen AJ & Konings WN (1987b) Regulation of arginine-ornithine exchange and the arginine deiminase pathway in Streptococcus lactis. J. Bacteriol. 169: 5597–5604
Poolman B, Hellingwerf KJ & Konings WN (1987c) Regulation of the glutamate-glutamine transport system by intracellular pH in Streptococcus lactis. J. Bacteriol. 169: 2272–2276
Poolman B & Konings WN (1988) Relation of growth of Streptococcus lactis and Streptococcus cremoris to amino acid transport. J. Bacteriol. 170: 700–707
166
Poolman B, Smid EJ, Veldkamp H & Konings WN (1987d) Bioenergetic consequences of lactose starvation for continuously cultured Streptococcus cremoris. J. Bacteriol. 169: 1460–1468
Postma E, Verduyn C, Scheffers WA & Van Dijken JP (1989) Enzymic analysis of the crabtree effect in glucose-limited chemostat cultures of Saccharomyces cerevisiae. Appl. Environ. Microbiol. 55: 468–477
Postmus J, Aardema R, de Koning LJ, de Koster CG, Brul S & Smits GJ (2012) Isoenzyme expression changes in response to high temperature determine the metabolic regulation of increased glycolytic flux in yeast. FEMS Yeast Res. 12: 571–581
Price C, Santos F, Molenaar D, Teusink B, Poolman B & Kuipers OP (2010) Characterization of cellular composition of evolved strains of Lactococcus lactis: Poster Presentations. FEBS J. 277: 114
Price MN, Deutschbauer AM, Skerker JM, Wetmore KM, Ruths T, Mar JS, Kuehl JV, Shao W & Arkin AP (2013) Indirect and suboptimal control of gene expression is widespread in bacteria. Mol. Syst. Biol. 9: 660
Pronk JT, Yde Steensma H & Van Dijken JP (1996) Pyruvate metabolism in Saccharomyces cerevisiae. Yeast Chichester Engl. 12: 1607–1633
Raushel FM & Cleland WW (1973) The substrate and anomeric specificity of fructokinase. J. Biol. Chem. 248: 8174–8177
Ray B & Speck ML (1973) Freeze-injury in bacteria. Crit. Rev. Clin. Lab. Sci. 4: 161–213
Reiter M & Blüml G (1994) Large-scale mammalian cell culture. Curr. Opin. Biotechnol. 5: 175–179
Riquelme PT, Wernette-Hammond ME, Kneer NM & Lardy HA (1983) Regulation of carbohydrate metabolism by 2,5-anhydro-D-mannitol. Proc. Natl. Acad. Sci. U. S. A. 80: 4301–4305
Riquelme PT, Wernette-Hammond ME, Kneer NM & Lardy HA (1984) Mechanism of action of 2,5-anhydro-D-mannitol in hepatocytes. Effects of phosphorylated metabolites on enzymes of carbohydrate metabolism. J. Biol. Chem. 259: 5115–5123
Romani A & Scarpa A (1992) Regulation of cell magnesium. Arch. Biochem. Biophys. 298: 1–12
Rouf MA (1964) Spectrochemical analysis of inorganic elements in bacteria. J Bacteriol 88: 1545–9
Rudolph FB, Purich DL & Fromm HJ (1968) Coenzyme A-linked aldehyde dehydrogenase from Escherichia coli. J. Biol. Chem. 243: 5539–5545
Russell JB (1986) Heat production by ruminal bacteria in continuous culture and its relationship to maintenance energy. J. Bacteriol. 168: 694–701
Russell JB (1992) The effect of pH on the heat production and membrane resistance of Streptococcus bovis. Arch. Microbiol. 158: 54–58
Santos F (2011) Understanding adaptive evolution strategies of microbes in dynamic environments through laboratory evolution Amsterdam
Santos F, Boele J & Teusink B (2011) A practical guide to genome-scale metabolic models and their analysis. Methods Enzymol. 500: 509–532
Sauer U & Eikmanns BJ (2005) The PEP-pyruvate-oxaloacetate node as the switch point for carbon flux distribution in bacteria. FEMS Microbiol. Rev. 29: 765–794
Schuetz R, Zamboni N, Zampieri M, Heinemann M & Sauer U (2012) Multidimensional optimality of microbial metabolism. Science 336: 601–604
167
Bibliography
Schumacher MA, Sprehe M, Bartholomae M, Hillen W & Brennan RG (2011) Structures of carbon catabolite protein A–(HPr-Ser46-P) bound to diverse catabolite response element sites reveal the basis for high-affinity binding to degenerate DNA operators. Nucleic Acids Res. 39: 2931–2942
Schuster S, Kreft J-U, Brenner N, Wessely F, Theissen G, Ruppin E & Schroeter A (2010) Cooperation and cheating in microbial exoenzyme production - theoretical analysis for biotechnological applications. Biotechnol. J. 5: 751–758
Schuster S, Pfeiffer T & Fell DA (2008) Is maximization of molar yield in metabolic networks favoured by evolution? J. Theor. Biol. 252: 497–504
Shachrai I, Zaslaver A, Alon U & Dekel E (2010) Cost of unneeded proteins in E. coli is reduced after several generations in exponential growth. Mol. Cell 38: 758–767
Sharp PM & Li WH (1987) The codon Adaptation Index--a measure of directional synonymous codon usage bias, and its potential applications. Nucleic Acids Res. 15: 1281–1295
Shiloach J & Rinas U (2009) Glucose and acetate metabolism in E. coli – system level analysis and biotechnological applications in protein production processes. In Systems Biology and Biotechnology of Escherichia coli, Lee SY (ed) pp 377–400. Dordrecht: Springer Netherlands Available at: http://www.springerlink.com/content/h1lv357266482wn1/ [Accessed February 28, 2012]
Shimizu S (2008) Vitamins and Related Compounds: Microbial Production. In Biotechnology: Special Processes, Rehm H-J & Reed G (eds) pp 318–340. Weinheim, Germany: Wiley‐VCH Verlag GmbH Available at: http://onlinelibrary.wiley.com/doi/10.1002/9783527620937.ch11/summary [Accessed March 12, 2012]
Shlomi T, Benyamini T, Gottlieb E, Sharan R & Ruppin E (2011) Genome-scale metabolic modeling elucidates the role of proliferative adaptation in causing the Warburg effect. PLoS Comput. Biol. 7: e1002018
Shuler ML & Kargi F (2002) Bioprocess engineering: basic concepts Prentice Hall
Smart JB & Thomas TD (1987) Effect of oxygen on lactose metabolism in lactic streptococci. Appl. Environ. Microbiol. 53: 533–541
Smid EJ, van Enckevort FJH, Wegkamp A, Boekhorst J, Molenaar D, Hugenholtz J, Siezen RJ & Teusink B (2005) Metabolic models for rational improvement of lactic acid bacteria as cell factories. J. Appl. Microbiol. 98: 1326–1331
Smith JM & Price GR (1973) The logic of animal conflict. Nature 246: 15–18
Smits WK, Kuipers OP & Veening J-W (2006) Phenotypic variation in bacteria: the role of feedback regulation. Nat. Rev. Microbiol. 4: 259–271
Smyth G (2005) Limma: Linear Models for Microarray Data. In Bioinformatics and Computational Biology Solutions Using R and Bioconductor, Gentleman R Carey VJ Huber W Irizarry RA & Dudoit S (eds) pp 397–420. Springer New York Available at: http://www.springerlink.com/content/g26110k024423738/abstract/
Snay J, Jeong JW & Ataai MM (1989) Effects of growth conditions on carbon utilization and organic by-product formation in B. subtilis. Biotechnol. Prog. 5: 63–69
Snoep JL, Yomano LP, Westerhoff HV & Ingram LO (1995) Protein burden in Zymomonas mobilis: negative flux and growth control due to overproduction of glycolytic enzymes. Microbiology 141: 2329–2337
Solem C, Petranovic D, Koebmann B, Mijakovic I & Jensen PR (2010) Phosphoglycerate mutase is a highly efficient enzyme without flux control in Lactococcus lactis. J. Mol. Microbiol. Biotechnol. 18: 174–180

168
Solopova A, Bachmann H, Teusink B, Kok J, Neves AR & Kuipers OP (2012) A specific mutation in the promoter region of the silent cel cluster accounts for the appearance of lactose-utilizing Lactococcus lactis MG1363. Appl. Environ. Microbiol. 78: 5612–5621
Sonenshein AL (2007) Control of key metabolic intersections in Bacillus subtilis. Nat. Rev. Microbiol. 5: 917–927
Soufi B, Gnad F, Jensen PR, Petranovic D, Mann M, Mijakovic I & Macek B (2008) The Ser/Thr/Tyr phosphoproteome of Lactococcus lactis IL1403 reveals multiply phosphorylated proteins. Proteomics 8: 3486–3493
Speck EL & Freese E (1973) Control of metabolite secretion in Bacillus subtilis. J. Gen. Microbiol. 78: 261–275
Sriyudthsak K, Shiraishi F & Hirai MY (2013) Identification of a metabolic reaction network from time-series data of metabolite concentrations. PloS One 8: e51212
Steen A, Wiederhold E, Gandhi T, Breitling R & Slotboom DJ (2010) Physiological adaptation of the bacterium Lactococcus lactis in response to the production of human CFTR. Mol. Cell. Proteomics MCP
Steitz TA & Moore PB (2003) RNA, the first macromolecular catalyst: the ribosome is a ribozyme. Trends Biochem. Sci. 28: 411–418
Stoebel DM, Dean AM & Dykhuizen DE (2008) The cost of expression of Escherichia coli lac operon proteins is in the process, not in the products. Genetics 178: 1653–1660
Stolyar S, Van Dien S, Hillesland KL, Pinel N, Lie TJ, Leigh JA & Stahl DA (2007) Metabolic modeling of a mutualistic microbial community. Mol. Syst. Biol. 3: 92
Storer AC & Cornish-Bowden A (1976) Concentration of MgATP2- and other ions in solution. Calculation of the true concentrations of species present in mixtures of associating ions. Biochem. J. 159: 1–5
Stoscheck CM (1990) Quantitation of protein. Methods Enzymol. 182: 50–68
Stülke J & Hillen W (2000) Regulation of carbon catabolism in Bacillus species. Annu. Rev. Microbiol. 54: 849–880
Synowiecki J, Grzybowska B & Zdziebło A (2006) Sources, properties and suitability of new thermostable enzymes in food processing. Crit. Rev. Food Sci. Nutr. 46: 197–205
Tagami K, Nanamiya H, Kazo Y, Maehashi M, Suzuki S, Namba E, Hoshiya M, Hanai R, Tozawa Y, Morimoto T, Ogasawara N, Kageyama Y, Ara K, Ozaki K, Yoshida M, Kuroiwa H, Kuroiwa T, Ohashi Y & Kawamura F (2012) Expression of a small (p)ppGpp synthetase, YwaC, in the (p)ppGpp(0) mutant of Bacillus subtilis triggers YvyD-dependent dimerization of ribosome. Microbiologyopen 1: 115–134
Tai SL, Daran-Lapujade P, Luttik MAH, Walsh MC, Diderich JA, Krijger GC, van Gulik WM, Pronk JT & Daran J-M (2007) Control of the glycolytic flux in Saccharomyces cerevisiae grown at low temperature: a multi-level analysis in anaerobic chemostat cultures. J. Biol. Chem. 282: 10243–10251
Takahashi S, Abbe K & Yamada T (1982) Purification of pyruvate formate-lyase from Streptococcus mutans and its regulatory properties. J. Bacteriol. 149: 1034–1040
Taniguchi Y, Choi PJ, Li G-W, Chen H, Babu M, Hearn J, Emili A & Xie XS (2010) Quantifying E. coli proteome and transcriptome with single-molecule sensitivity in single cells. Science 329: 533–538
ter Kuile BH & Westerhoff HV (2001) Transcriptome meets metabolome: hierarchical and metabolic regulation of the glycolytic pathway. FEBS Lett. 500: 169–171
Teusink B, Bachmann H & Molenaar D (2011) Systems biology of lactic acid bacteria: a critical review. Microb. Cell Factories 10: S11

169
Bibliography
Teusink B & Smid EJ (2006) Modelling strategies for the industrial exploitation of lactic acid bacteria. Nat. Rev. Microbiol. 4: 46–56
Teusink B, Wiersma A, Jacobs L, Notebaart RA & Smid EJ (2009) Understanding the adaptive growth strategy of Lactobacillus plantarum by in silico optimisation. PLoS Comput. Biol. 5: e1000410
Teusink B, Wiersma A, Molenaar D, Francke C, de Vos WM, Siezen RJ & Smid EJ (2006) Analysis of growth of Lactobacillus plantarum WCFS1 on a complex medium using a genome-scale metabolic model. J. Biol. Chem. 281: 40041–40048
Thomas TD (1976) Activator specificity of pyruvate kinase from lactic streptococci. J. Bacteriol. 125: 1240–1242
Thomas TD, Ellwood DC & Longyear VM (1979) Change from homo- to heterolactic fermentation by Streptococcus lactis resulting from glucose limitation in anaerobic chemostat cultures. J. Bacteriol. 138: 109–117
Thomas TD, Turner KW & Crow VL (1980) Galactose fermentation by Streptococcus lactis and Streptococcus cremoris: pathways, products, and regulation. J. Bacteriol. 144: 672–682
Thompson J (1976) Characteristics and energy requirements of an alpha-aminoisobutyric acid transport system in Streptococcus lactis. J. Bacteriol. 127: 719–730
Thompson J (1987) Regulation of sugar transport and metabolism in lactic acid bacteria. FEMS Microbiol. Lett. 46: 221–231
Thompson J, Curtis MA & Miller SP (1986) N5-(1-carboxyethyl)-ornithine, a new amino acid from the intracellular pool of Streptococcus lactis. J. Bacteriol. 167: 522–9
Thompson J & Torchia DA (1984) Use of 31P nuclear magnetic resonance spectroscopy and 14C fluorography in studies of glycolysis and regulation of pyruvate kinase in Streptococcus lactis. J. Bacteriol. 158: 791–800
Titgemeyer F & Hillen W (2002) Global control of sugar metabolism: a gram-positive solution. Antonie Van Leeuwenhoek 82: 59–71
Tzamali E, Poirazi P, Tollis IG & Reczko M (2011) A computational exploration of bacterial metabolic diversity identifying metabolic interactions and growth-efficient strain communities. BMC Syst. Biol. 5: 167
Ueta M, Wada C & Wada A (2010) Formation of 100S ribosomes in Staphylococcus aureus by the hibernation promoting factor homolog SaHPF. Genes Cells Devoted Mol. Cell. Mech. 15: 43–58
Ueta M, Yoshida H, Wada C, Baba T, Mori H & Wada A (2005) Ribosome binding proteins YhbH and YfiA have opposite functions during 100S formation in the stationary phase of Escherichia coli. Genes Cells Devoted Mol. Cell. Mech. 10: 1103–1112
Valgepea K, Adamberg K, Nahku R, Lahtvee P-J, Arike L & Vilu R (2010) Systems biology approach reveals that overflow metabolism of acetate in Escherichia coli is triggered by carbon catabolite repression of acetyl-CoA synthetase. BMC Syst. Biol. 4: 166
van Dam K, Berden JA, Raamsdonk LM, Diderich JA & Kruckeberg AL (2002) Process for the production of yeast biomass comprising functionally deleted HXK2 genes. Available at: http://www.freepatentsonline.com/EP1169432A1.html [Accessed March 6, 2012]
van den Brink J, Canelas AB, van Gulik WM, Pronk JT, Heijnen JJ, de Winde JH & Daran-Lapujade P (2008) Dynamics of glycolytic regulation during adaptation of Saccharomyces cerevisiae to fermentative metabolism. Appl. Environ. Microbiol. 74: 5710–5723
van Eunen K, Bouwman J, Daran-Lapujade P, Postmus J, Canelas AB, Mensonides FIC, Orij R, Tuzun I, van Den
170
Brink J, Smits GJ, van Gulik WM, Brul S, Heijnen JJ, de Winde JH, de Mattos MJT, Kettner C, Nielsen J, Westerhoff HV & Bakker BM (2010) Measuring enzyme activities under standardized in vivo-like conditions for systems biology. FEBS J. 277: 749–60
van Hoek P, van Dijken JP & Pronk JT (1998) Effect of specific growth rate on fermentative capacity of baker’s yeast. Appl. Environ. Microbiol. 64: 4226–4233
van Loosdrecht M, Pot M & Heijnen J (1997) Importance of bacterial storage polymers in bioprocesses. Water Sci. Technol. 35: 41–47
Varma A, Boesch BW & Palsson BO (1993) Stoichiometric interpretation of Escherichia coli glucose catabolism under various oxygenation rates. Appl. Environ. Microbiol. 59: 2465–2473
Vasconcelos I, Girbal L & Soucaille P (1994) Regulation of carbon and electron flow in Clostridium acetobutylicum grown in chemostat culture at neutral pH on mixtures of glucose and glycerol. J. Bacteriol. 176: 1443–50
Vazquez A, Liu J, Zhou Y & Oltvai ZN (2010) Catabolic efficiency of aerobic glycolysis: the Warburg effect revisited. BMC Syst. Biol. 4: 58
Veening J-W, Smits WK, Hamoen LW & Kuipers OP (2006) Single cell analysis of gene expression patterns of competence development and initiation of sporulation in Bacillus subtilis grown on chemically defined media. J. Appl. Microbiol. 101: 531–541
Veening J-W, Smits WK & Kuipers OP (2008) Bistability, epigenetics, and bet-hedging in bacteria. Annu. Rev. Microbiol. 62: 193–210
Vemuri GN, Altman E, Sangurdekar DP, Khodursky AB & Eiteman MA (2006) Overflow metabolism in Escherichia coli during steady-state growth: transcriptional regulation and effect of the redox ratio. Appl. Environ. Microbiol. 72: 3653–3661
Vemuri GN, Eiteman MA, McEwen JE, Olsson L & Nielsen J (2007) Increasing NADH oxidation reduces overflow metabolism in Saccharomyces cerevisiae. Proc. Natl. Acad. Sci. U. S. A. 104: 2402–2407
Verouden MPH, Notebaart RA, Westerhuis JA, van der Werf MJ, Teusink B & Smilde AK (2009) Multi-way analysis of flux distributions across multiple conditions. J. Chemom. 23: 406–420
Vives J, Juanola S, Cairó JJ & Gòdia F (2003) Metabolic engineering of apoptosis in cultured animal cells: implications for the biotechnology industry. Metab. Eng. 5: 124–132
Voit EO, Almeida J, Marino S, Lall R, Goel G, Neves AR & Santos H (2006a) Regulation of glycolysis in Lactococcus lactis: an unfinished systems biological case study. Syst. Biol. 153: 286–298
Voit EO, Neves AR & Santos H (2006b) The intricate side of systems biology. Proc. Natl. Acad. Sci. U. S. A. 103: 9452–9457
Waddell TG, Repovic P, Melendez-Hevia E, Heinrich R & Montero F (1997) Optimization of glycolysis: A new look at the efficiency of energy coupling. Biochem. Educ. 25: 204–205
Wang L, Ridgway D, Gu T & Moo-Young M (2005) Bioprocessing strategies to improve heterologous protein production in filamentous fungal fermentations. Biotechnol. Adv. 23: 115–129
Warburg O (1956) On the origin of cancer cells. Science 123: 309–314
Warner JB & Lolkema JS (2003) CcpA-dependent carbon catabolite repression in bacteria. Microbiol. Mol. Biol. Rev. 67: 475 –490
Weckowicz TE (1988) Ludwig von Bertalanffy (1901-1972): A pioneer of general systems theory.

171
Bibliography
Wegmann U, O’Connell-Motherway M, Zomer A, Buist G, Shearman C, Canchaya C, Ventura M, Goesmann A, Gasson MJ, Kuipers OP, Sinderen D van & Kok J (2007) Complete genome sequence of the prototype lactic acid bacterium Lactococcus lactis subsp. cremoris MG1363. J. Bacteriol. 189: 3256–3270
Wells JM & Mercenier A (2008) Mucosal delivery of therapeutic and prophylactic molecules using lactic acid bacteria. Nat. Rev. Microbiol. 6: 349–362
Wessely F, Bartl M, Guthke R, Li P, Schuster S & Kaleta C (2011) Optimal regulatory strategies for metabolic pathways in Escherichia coli depending on protein costs. Mol. Syst. Biol. 7: 515
West GB, Brown JH & Enquist BJ (1997) A general model for the origin of allometric scaling laws in biology. Science 276: 122–126
Westerhoff HV & Palsson BO (2004) The evolution of molecular biology into systems biology. Nat. Biotechnol. 22: 1249–1252
Whitman WB, Coleman DC & Wiebe WJ (1998) Prokaryotes: the unseen majority. Proc. Natl. Acad. Sci. U. S. A. 95: 6578–6583
Wolfe AJ (2005) The acetate switch. Microbiol. Mol. Biol. Rev. 69: 12–50
Wolin MJ (1964) Fructose-1,6-diphosphate requirement of Streptococcal lactic dehydrogenases. Science 146: 775–777
Zhuang K, Izallalen M, Mouser P, Richter H, Risso C, Mahadevan R & Lovley DR (2011a) Genome-scale dynamic modeling of the competition between Rhodoferax and Geobacter in anoxic subsurface environments. ISME J. 5: 305–316
Zhuang K, Vemuri GN & Mahadevan R (2011b) Economics of membrane occupancy and respiro-fermentation. Mol. Syst. Biol. 7: 500
Zomer AL, Buist G, Larsen R, Kok J & Kuipers OP (2007) Time-resolved determination of the CcpA regulon of Lactococcus lactis subsp. cremoris MG1363. J. Bacteriol. 189: 1366–1381
Zomorrodi AR & Maranas CD (2012) OptCom: A multi-level optimization framework for the metabolic modeling and analysis of microbial communities. PLoS Comput. Biol. 8: e1002363

172
Samenvatting*
Een veel waargenomen reactie van organismen bij een veranderende groeisnelheid, is een verschuiving van het metabolismepatroon. Dit fenomeen is potentieel interessant voor zowel academisch onderzoek als voor industriële toepassingen omdat veranderingen in metabolisme van invloed zijn op beslissingen van de cel. Voor de industrie zijn de verschillende metabolische toestanden vooral interessant daar deze van grote invloed zijn op de productielimieten van gewenste eindproducten. De mechanistische oorzaak van de metabolische verschuiving kan variëren tussen soorten onderling, maar de aanwezigheid van deze metabolische verschuiving suggereert een functionele relevantie, welke kan worden begrepen vanuit een evolutionair perspectief. Een van de vele hypothesen om de metabolische verschuiving te verklaren (zoals besproken in Hoofdstuk 2) veronderstelt dat de kosten van de eiwitinvestering van invloed is op de metabolische strategie. De uiteindelijk gebruikte metabolische strategie is dan een resultaat van een kosten-batenanalyse. Om dit experimenteel te toetsen hebben we een globale multilevel analyse uitgevoerd op het merkzuurbacteriemodel Lactococcus lactis MG1363. Deze bacterie vertoont een typische, anaerobe versie van het Crabtree/Warburg effect: bij lage groeisnelheden produceert het voornamelijk acetaat, formaat en ethanol (de gemengde zuurfermentatie) en op hoge groeisnelheden produceert het hoofdzakelijk melkzuur van glucose.
Allereerst werden alle mogelijke groeicondities gestandaardiseerd. Een speciaal ontwikkeld in vivo-achtig enzym assay medium bootst de intracellulaire omgeving na voor het bepalen van de enzymactiviteiten van groeiende L. lactis cellen (Hoofdstuk 3). Door gestandaardiseerde experimentele procedures hebben we op meerdere cellulaire niveaus een nauwkeurige karakterisering verkregen van glucose-gelimiteerde chemostaat L. lactis culturen bij verschillende groeisnelheden. Meer dan een verdrievoudiging in groeisnelheid had als gevolg dat er een metabolische verschuiving plaatsvond in de cel, maar dat dit verrassend genoeg niet leidde tot verschillen in transcriptie-, eiwitratio’s en de enzymactiviteiten (Hoofdstuk 4). Zelfs ribosomale eiwitten vertoonden nauwelijks verandering ten opzichte van de verschillende groeisnelheden, terwijl dit een groot gedeelte is van de totale eiwitinvestering die een cel doet. Om deze redenen, en in tegenstelling tot de originele hypothese lijkt L. lactis eerder een strategie te bezitten waarbij het centrale metabolisme altijd klaar is voor hoge groeisnelheden en zal het eerder de enzymactiviteit reguleren dan de genexpressie van de metabolismegenen. Alleen op de hoogste groeisnelheden en gedurende fed-batch culture –condities geassocieerd met ruim voldoende glucose– observeerden we naar beneden bijgestelde eiwitniveaus geassocieerd met stress en naar boven afgestelde eiwitniveaus van glycolytische enzymen. Hieruit concluderen we dat L. lactis voor glucose, de transcriptie- en eiwitexpressie over het algemeen een binair tekort/overschot-logica volgt.

173
Samenvatting
Om het regulatiemechanisme van de metabolische verschuiving van L. lactis beter te begrijpen, testten we een L. lactis MG1363 derivaat, welke lactose omzet in gemengde zuren. We laten zien dat er een sterke positieve correlatie is tussen de glycolytische flux en de omvang van homolactaatfermentatie, veroorzaakt door metabolische regulatie (Hoofdstuk 5). Vervolgens geven we nieuw bewijs van een causaal verband tussen de concentratie van het glycolytische halffabricaat fructose-1,6-bifosfaat (FBP) en de metabolische verschuiving. We tonen aan dat 2,5-anhydromannitol, welke fungeert als niet-metaboliseerbaar analoog in vivo, de flux naar lactaat bijna verdubbelt wanneer het wordt toegevoegd aan cellen. In vitro heeft dit analoog een activerend effect op lactaatdehydrogenase dat vergelijkbaar is met FBP. De concentratie waarbij activatie optreedt is veel lager dan de vergelijkbare concentraties van intracellulaire FBP. Dit kan impliceren dat de activering van lactaatdehydrogenase in vivo een veel hogere FBP concentratie vereist, maar dit moet nog worden aangetoond. Vervolgens plaatsten we de regulerende verhoudingen van glycolytische flux, FBP de redox potentiaal, de allostere effecten van de glycolytische en de downstream enzymroutes samen in een wiskundig model om na te gaan of deze interacties de metabolische verschuiving kunnen uitleggen (Hoofdstuk 6). Hoewel het model niet consistent passend was voor de gecombineerde data van de chemostaten van verschillende groeisnelheden, en in vivo-NMR data van glucose- niet-groeiende cellen pulseerde, vonden we dat bij het best passende model de metabolische verschuiving vooral werd beïnvloed door regulatie van FBP en anorganisch fosfaat.
Uit dit proefschrift blijk dat, L. lactis altijd voorbereid lijkt te zijn op hoge groeisnelheden doordat het een grote overcapaciteit van glycolytische enzymen bezit. Deze eigenschappen hebben de cellen behouden, zelfs na evolueren voor 800 generaties onder constante omstandigheden. Bovendien lijkt de groeisnelheid-gerelateerde metabolische verschuiving niet voortgekomen uit een optimalisatie van de groeisnelheid met eiwitkosten als belangrijkste drijfveer. Op het mechanistische niveau is de keuze van metabolische strategie gereguleerd door veranderingen in metabolietenniveaus zelf, met FBP (en waarschijnlijk fosfaat) als belangrijkste componenten.
*Kindly translated from English to Dutch by T. H. Eckhardt and edited by P. T. N. van Dam and S. J. A. van Dam

174
175
Acknowledgements
Acknowledgements
The storms come and go, the waves crash overhead, the big fish eat the little fish, and I keep on paddling
– Lord Varys, Game of Thrones
It’s been five years and more… seems like such a long journey. But a really good one: one of realizing a childhood dream. A dream that many people have been instrumental in helping me realize. And here, I take the opportunity to thank every one of them.
Willem, your scientific achievements have deeply inspired me and I am proud to have pursued an important chapter of my scientific career under your guidance. Your experienced supervision greatly helped in streamlining my work and our meetings equipped me with a better perspective and renewed enthusiasm. Most of all, I want to thank you for being there when I needed you the most – while writing up! It was by far the toughest phase of my journey and without your efforts – your almost instant responses, constant corrections, suggestions, comments, and most of all, encouragement – I find it hard to fathom how I could have accomplished this thesis!
My stay at VU University Amsterdam has been such a joy, and I have met some of the most open-hearted and genuine people in my life. To start with, Bas Teusink, thank you for sending that “better late than never” email asking if I was still available to join the PhD position in the STW project, and being patient with my assertive queries! And then with a few phone calls, how could I refuse an offer in Amsterdam!? You’ve been my inspiration, my supervisor, my mentor, my guide, my colleague, and most of all, a great friend. I have very fond memories of all our scientific, casual and “spiritual” conversations. Thanks for lending an ear when I simply wanted to speak out and being ever ready to help in whatever way to smoothen things for me. Most of all, thanks for the immense confidence and faith you showed in my abilities, even granting me the status of supervising my supervisor! And then of course, listening to my “requests”, organizing the best barbecue parties of all time, and making sure I got my “last one” before I leave! I also want to thank your wonderful wife, Femke for being the person that she is, so affectionate and sweet, and your “300” kids for allowing you to spare the extra hours we needed to tackle difficult scientific problems at times!
Douwe, I confess: for me, your most adorable quality is your humour! Of course that is besides your incredible experience in research, your vast expertise, meticulous working style and amazing programming skills, all of which helped me learn a lot during my PhD. More than a supervisor, I enjoyed your company as a colleague and friend and I have been most fortunate to have you right next door to discuss anything ranging from a not-so-short-short question, to ‘this makes no sense’, to ‘wow, this is so cool!’ to ‘help me overcome the writer’s block!’. Thanks for being so patient Douwe, especially in fulfilling each of my persistent task lists for the ‘big’ paper! Last but not least, thanks to your amazing culinary skills, I will drool every time I remember your scones, ‘boterkoekjes’ and pesto!

176
Meike and Pınar, my roommates, my best buddies! What would my days have been without sharing every thought in my mind with you? Meike, I really do admire your phenomenal variety of talents and your dedication to pursue each one of them! Pınar, you made sure I did not miss having my sister around! Whether it was about statistics or stoichiometry, conferences or holiday, weekend, dinner or party plans, you both were always there to lend a hand. It is only befitting that the two of you are my paranymphs!
Filipe, I have thoroughly enjoyed your ever-ready supervision, inventive ideas, and your constant encouragment has meant a lot to me. Our discussions have been exciting, eye-opening, even confronting at times, but I am really happy to say that they have helped to achieve great results. Thanks also to Joanna and Sam for their welcoming nature especially when I had to crash at your place at very short notice! Herwig, your creativity and insight into experiments and data analysis coupled with your working speed never cease to amaze me. It has been a pleasure collaborating with you on the FBP analogue story. Thanks also for the wonderful opportunity of cooking for your family get-together – it sprung a good idea for a side business! Domenico, I know it has been tough with the modelling chapter, but we made it! Thanks for all your efforts and wonderful discussions, both work- and otherwise.
Thanks to the IBIVU colleagues: Nicolas Bonzanni, Anton, Jaap, Bart, Bernd, Hannes, Thomas, for sharing their workplace, their friendliness and all the help when I started at the VU Amsterdam. Thanks to everyone at the MicFys, VU: thanks Jeannet and Floor for taking care of ALL the administrative stuff so smoothly. Thank you my BSc students: Bas Stringer and Faruk, for your input and especially to Shannona and Merel for your relentless efforts in doing innumerable enzyme assays! Thank you for helping me learn more about my own personality and love for teaching while supervising you. Evert, it’s been great having you as a roommate and getting to know you better as a friend. Thanks for the lovely discussions and company at our “roomie dinners”! Joost, thanks for your great company (and candy), help and discussions (not and) about work and thanks for figuring out that H2O was the culprit in the genome scale model of L. lactis – who would’ve thought (right Bas?)! Thanks Brett for your explanations and output on the FVA of the genome-scale model of L. lactis. Karen for all your advice on the in vivo-like assay medium; Rodolfo, Jan Berkhout, Johan and Koen, thanks for the interesting discussions in as well as outside the lab; José, thanks for your efficient assistance in the lab especially with the (problematic) HPLC! Martijn Moné, I will remember your vast knowledge and amazing stories for a long time... Thanks for all the wonderful discussions and great advice! Hans, Frank, Barbara, Wilfred, Fred, Jan Lankelma, Rob, Marijke, Klaas, Martin, Susana, Neslihan, thank you for helping me out whenever I needed it; thanks Alexey, Jeantine, Katja, Raqael, Ruchir and the relatively new members: Timo, Susanne, Nilgun, Joep, Iraes, Mark Haanemaijer (and anyone else I forgot to mention!) for the feedback during work discussions, for lively atmosphere, happening lunches and enjoyable borrels, dinners and dances! Most of all, thank you Systems Bioinformatics for the amazing food and science in our group retreats!
177
Acknowledgements
The work in this thesis is a result of intense collaboration. Thank you Oscar, Jan Kok and Bert for your expert feedback, energy and enthusiasm, that was crucial for the success of the STW project. Thanks Jeroen, Mark Musters and Martijn for the LAB meetings that gave me a head-start on lactic acid bacteria research. Thanks Anne de Jong for your input in the project. Thanks to the user committee: Richard, Paul and Ronnie for their active input during the biannual project meetings. But the strength of this collaboration was the synergy with my fellow PhDs in the project: Tom Eckhardt and Pranav. Thanks to both of you for taking care of the organization in Groningen and for my stay-overs with your families! Tom, it’s been a sheer pleasure working with you, sharing knowledge, expertise, plans, frustrations and also recipes! I do hope we have a chance to work together again. I can’t say in what way, but Beatrix and Elize have somehow inspired me to finish my thesis – love to both of them! Pranav, your super calm attitude is admirable and I’ve really enjoyed jabbering with you in Hindi during our discussions! That apart, thanks for your constant efforts in the project and also for pursuing the ACK story. Claire and Ana, thanks for the discussions and your enjoyable company during my visits to Groningen. Petra, I thank you for your input when I was synthesizing the FBP analogue. I enjoyed our discussions and I only wish we could have collaborated more.
My ‘yearly’ visits to Wageningen on the Strategy day including the phenomenal Christmas dinner are worth remembering here – thanks Nees and everyone involved in its organization! Anja, thanks for being such a wonderful person and so efficiently managing all my administrative issues at Wageningen, I cannot imagine how I would have managed sitting 85 km away from WUR without you! Thanks to the microbiology department for giving me the opportunity to join the PhD trip to the North-East coast of USA. I made good friends during this trip! Nicolas Flahaut, thanks for all your help on the genome-scale model of L. lactis and the figures for visualizing our huge dataset. Tom van den Bogert – thank you for promptly answering all my last minute queries about thesis submission and even about the party! Ourania, Milkha, thanks for your wonderful company during the PhD trip; Milkha and Lisa, thanks for arranging a place for me to sleep when the Dutch train network came to a halt in the snow, twice!
I’ve thoroughly enjoyed being part of various organisations during my PhD – Kluyver Centre for Genomics of Industrial fermentation, Netherlands Institute for Systems Biology, Nether-lands Consortium for Systems Biology – I thank the participants of these organizations for their feedback during the various symposia. I really enjoyed being in the YISB (Young In-vestigators in Systems Biology) and organising the workshop: thanks Luisa, Karen, Margriet, Ruchir, Johan and Milan. Volunteering at the 10th symposium of LAB, the iGEM European jamboree and the FEBS courses was a lot of fun! Thanks to their organizers and volunteers!
In the tough period of finishing my thesis after the end of my PhD contract, I thank Aljoscha and Sef for granting me the opportunity to work as a postdoc at Cell Systems Engineering, TU Delft. Performing two jobs at the same time was not easy and I thank everyone at CSE, especially Hugo, Camilo, Francisca and Michel for their help and support.

178
Staying in the Netherlands has been fun with so many good friends. Thanks Andreas, Alice, Kornel, Azmat, Poonam, Kush, Fien, Esther, Ishwar, Vaishali, and my Vipassana friends, Margreet Noordhof, Priya Satalkar, Katrin & Berry for your wonderful friendship. Ruchir and Mikita, we should put up an Indian snack stall again sometime! Han and Wouter, thanks for being my ‘band’ partners! It’s been so much fun making music with you guys. I hope we can continue doing so more often! I need to thank Blackmill, MTV Coke studio and some other random people for amazing chill-out and fusion music without which writing this thesis would have been unbelievably tough! Thanks Priya Malshe, Asmita and Shweta for just being the best-est friends ever, inspite of being so far away I feel you are still near!
My life is incomplete without extra activities. Thanks Nakul for introducing me to the UvA Karate group, and thanks Robbert, Jaap for being such wonderful Sensei! I still miss the tiring but satisfying classes at the dojo and the relaxing sauna after! Thanks Caroline, for your guidance and all the fun I had while being part of the VU Choir at the VU culture centre. My heart-felt thanks to Rohini maám, my Guru in Hindustani music. Thank you for appreciating me so much, and kindling my path towards my ultimate dream of being a singer.
I thank my school teachers being instrumental in kindling my curiosity for science. Thank you Ms. Philomena, wherever you are, I wish I could have personally told you that you were my favourite science teacher. Thanks ICT, for the grilling 4 years in Mumbai making me a chemical engineer. I consider joining ICT as one of the best decisions in my career. Thanks to everyone at the Biochemical Engineering department, IIT Delhi for strengthening my foundation in microbiology and biotechnology. Neha and Aditi, I still remember our group studies! Thank you Sreekrishnan sir and Prof. Uhl for introducing me to research during my Masters internship. You inspired me to start a PhD and become a scientist!
My deepest gratitude to my whole family, especially to my parents and sister, for their loving care and for making me the person I am today. Apupa, Ammama, Kunjamma, Dadi, and Dadaji, you are always in my thoughts. Amma, your steadfast thinking and tireless working attitude always did and still inspires me! Papa, our bond has grown much deeper through the years and you are a special friend to me. I love your ‘hatke’ perspective on the variety of discussions we have! Didi, your capacity of showing me the mirror has made me grow by leaps and bounds. Amma, Papa, Didi, your unending enthusiasm, confidence, support and spiritual discussions are my guiding light every single day. It is your love that has helped me sail through the toughest of times. Thank you…
Mummy, Pappa, I am so grateful to you for regarding me as your own daughter; Kavita Didi, Kamal Jiju, Padma Didi, Vishal Jiju, thanks for appreciating me as a person, and loving and accepting me as I am. Thanks to all the kids Yuvi, Avi, Jiya and Shreya for your adoration and all the fun times!
179
Acknowledgements
Nakul… where and how do I start? Thank you for coming into my life, and sharing my dreams as they were your own. Your patience and understanding has meant a lot to me, whether it was for working late in the lab or spending sleepless nights behind the PC! Your input both at work (Chapter 3) and at home have been most crucial: thanks for being there when I needed you the most, and for becoming such an awesome cook! Your enthusiasm, fun-attitude and support have helped keep my sanity especially during the last phase of my PhD. We’ve grown so much together and I am excited to enter the next phase of our lives together with a special someone who has also waited very patiently for the completion of this PhD thesis…

180

181
About the author
About the author
Anisha Goel (1984) grew up in Belgaum, a small Indian city bordering Goa, India. She graduated in Chemical Engineering from the Institute of Chemical Technology (ICT) Mumbai, India in 2006 and did her Masters at the Department of Biochemical Engineering and Biotechnology in the Indian Institute of Technology (IIT) Delhi, New Delhi, India. During her internship at the Wastewater Treatment Laboratory, IIT Delhi, she was awarded the DAAD (German Academic Exchange Service) scholarship to conduct part of her internship at the Department of Urban Water Management, Dresden University of Technology, Germany. Her work culminated in a thesis titled “Effect of Immobilization on microbial cell cultures to withstand adverse environment”. After getting married to Nakul Barfa in August 2008, she moved to the Netherlands to pursue her PhD on Systems Biology of Lactococcus lactis. Employed by Wageningen University, she conducted her research at the VU University Amsterdam, which resulted in this thesis. Currently Anisha is working as a Post-Doctoral researcher on synthetic biology of yeast in the Cell Systems Engineering section at the Department of Biotechnology, Delft University of Technology.
182
List of Publications
List of Publications
Goel A & Uhl W (2009) Investigation and modelling of attachment and detachment of bacteria on granular surfaces. Proceedings of Wasser 2009, Annual water conference of Water chemistry society, 18-20 May 2009, Stralsund, Germany
Goel A, Santos F, de Vos WM, Teusink B & Molenaar D (2012) Standardized assay medium to measure Lactococcus lactis enzyme activities while mimicking intracellular conditions. Appl. Environ. Microbiol. 78: 134–143
Goel A, Wortel MT, Molenaar D & Teusink B (2012) Metabolic shifts: a fitness perspective for microbial cell factories. Biotechnol. Lett. 34: 2147–2160
Goel A, Eckhardt TH, Puri P, de Jong A, Santos F, Giera M, Fusetti F, de Vos WM, Kok J, Poolman B, Molenaar D, Kuipers OP & Teusink B (2013) Uncoupling of growth-associated metabolism and protein expression suggests binary control logic. Manuscript in preparation
Goel A, Santos F, de Vos WM, Molenaar D, Teusink B & Bachmann H (2013) A causal effect of FBP on lactate formation in lactose positive L. lactis using the fructose analogue, 2,5-anhydromannitol. Manuscript in preparation
Goel A, Bellomo D, Molenaar D & Teusink B (2013) A kinetic model describing the metabolic shift in Lactococcus lactis. Manuscript in preparation
Puri P, Goel A, Bochynska A & Poolman B (2013) Characterisation of Acetate Kinase 1 and 2 from Lactococcus lactis. Manuscript in preparation
Price CE, Santos F, Hesseling A, Uusitalo J, Bachmann H, Goel A, Berkhout J, Bruggeman F, Molenaar D, Marrink S-J, Kok J, Poolman B, Teusink B & Kuipers OP (2013) Global regulators play a pivotal role in the adaptation to constant growth conditions. Manuscript in preparation
183
Overview of Completed Training Activies
Overview of Completed Training Activities Discipline specific activities
• Advanced course on Applied Genomics of Industrial Fermentation, BODL, Wageningen, NL, 2008
• Introduction to gPROMS, Optimization and Model Validation, PS Enterprise, London, UK, 2008
• Ab-initio modelling course, VU University Amsterdam, NL, 2008• 6th – 10th Kluyver Symposium, Kluyver Centre for Genomics of Industrial Fermentation
(oral presentation), Noorwijkerhout, NL, 2008-12• FEBS Advanced Lecture Course on Systems Biology (poster presentations), Alpbach
and Innsbruck, Austria, 2009, 2011• 10th International Symposium on Lactic Acid Bacteria (poster presentations), Egmond
aan Zee, NL, 2011• Netherlands Biotechnology Congress, 14th edition (oral presentation), Ede, NL, 2012• The 13th International Conference on Systems Biology (poster presentation), Toronto,
Canada, 2012
General activities
• VLAG PhD week, Bilthoven, NL, 2009• Techniques for Writing and Presenting a Scientific Paper, WGS, Wageningen, NL, 2009• PhD Competence assessment, WGS, Wageningen, NL, 2009• Statistics in R, VU University/NCSB, Amsterdam, NL, 2011• PhD/Postdoc Retreat for Life Sciences, PCDI, Heeze, NL, 2013
Optional activities
• Lactic Acid Bacteria meetings, VU / UvA, Amsterdam, NL, 2008-10• Weekly Group meetings, VU University Amsterdam, NL, 2008-12• NISB / NCSB Symposia, NL, 2008-12• STW project meetings (biannual), 2008-12• Attendance of WUR Microbiology PhD study trip to the North-east coast USA, 2009• Organization and attendance of YISB (Young Investigators in Systems Biology)
workshop, Arnhem, NL, 2012

184
Cover Design
Anisha Goel
The cover is an artistic impression of a metabolic network and the trade-offs involved in metabolic choices displayed by a cell. Depending on substrate abundance, the cell could display a pathway with high protein requirement that would run at a limited speed but would yield more cellular energy currency, Adenosine triphosphate (ATP); or a pathway with a low protein requirement that could run faster, but yield lesser ATP; or something else. For a review on various hypotheses of metabolic shifts in microorganisms, see Chapter 2. The background image is a scanning electron micrograph of full fat (front cover) and low fat (back cover) cheddar cheese showing a creative impression of Lactococcus lactis in the cavities of the cheese matrix. The image showing metabolic choices was modified and reprinted from Biotechnology Letters, vol. 34 (12), 2012, 2147-2160, Metabolic shifts: a fitness perspective for microbial cell factories, A. Goel, M. T. Wortel, D. Molenaar and B. Teusink, Fig 2G (original copyright notice), with kind permission from Springer Science and Business Media and the background image was modified and reprinted from International Dairy Journal, vol. 11, Vikram V. Mistry, Low fat cheese technology, 413-22, Copyright (2001), with permission from Elsevier.
Thesis printing
GVO drukkers & vormgevers B.V. | Ponsen & Looijen
Financial support
This research described in this thesis was financially supported by the Dutch Technology Foundation STW, which is part of the Netherlands Organisation for Scientific Research (NWO) and partly funded by the Ministry of Economic Affairs (project number 08080)
Financial support from Wageningen University and STW for printing this thesis is gratefully acknowledged.
This work was also part of the Kluyver Centre for Genomics of Industrial Fermentation, and it was carried out at the Systems Bioinformatics group, Faculty of Earth and Life Sciences, VU University Amsterdam, The Netherlands.