physiological response of lactococcus lactis to high-pressure
TRANSCRIPT

TECHNISCHE UNIVERSITÄT MÜNCHEN
LEHRSTUHL FÜR TECHNISCHE MIKROBIOLOGIE
Physiological response of Lactococcus lactis to high-pressure
Adriana Molina-Höppner
Vollständiger Abdruck von der Fakultät Wissenschaftszentrum Weihenstephan für
Ernährung, Landnutzung und Umwelt der Technischen Universität München zur Erlangung
des akademischen Grades eines
Doktor-Ingenieurs
genehmigten Dissertation.
Vorsitzender:
Univ.-Prof. Dr.-Ing. habil. Antonio Delgado
Prüfer der Dissertation:
1. Univ.-Prof. Dr.rer.nat.habil. Rudi F. Vogel
2. Univ.-Prof. Dr.-Ing., Dr.-Ing.habil. Ulrich Kulozik
Die Dissertation wurde am 25.06.02 bei der Technischen Universität München eingereicht
und durch die Fakultät Wissenschaftszentrum Weihenstephan für Ernährung, Landnutzung
und Umwelt am 16.09.02 angenommen.

Abbreviations
Symbol Mean Units
AcmA autolysin muramidase
ATP adenosintriphosphat
aw water activity [-]
b universal constant [9.2 Pa-1]
cFDASE 5(and 6-)-carboxyfluorescein diacetate N-succimidyl ester
cFSE 5(and 6-)-carboxyfluorescein succimidyl ester
CFU colony forming units
Csps cold-shock proteins
DAPI 4',6-diamidino-2-phenylindole, dihydrochloride
DDBJ Japanese Genetic Center
DEEP-BATH deep-sea baro/thermophiles collecting and cultivating system
DAN desoxyribonuclein acid
∆V reaction volume [cm3 mol-1]
∆Vm molar volume change between the associated and dissociated forms of the
buffering acid in solution [cm3 mol-1]
∆V# activation volume [cm3 mol-1]
EB ethidium bromide
EDTA ethylenediaminetetraacetic acid
FT-IR Fourier transform infrared spectroscopy
GP generalized polarization
HEPES N-[2-Hydroxyethyl]piperazine-N´-[2-ethanesulfonic acid]
HorA ABC-membrane-bound enzyme of Lactobacillus plantarum
HPLC high-pressure liquid chromatography
Hsps heat-shock proteins
IFM immunofluorescence microscopy
INT 2-(p-iodophenyl)-3-(p-nitrophenyl)5-phenyltetrazolium chloride
K equilibrium constant [s-1]
λ lag-phase
Laurdan 6-dodecanoyl-2-dimethylaminonaphtalene
LmrP secondary drug transporter located in the membrane of Lactococcus lactis
µ specific growth rate
MDR multidrug resistance transporter

MES 2-[N-morpholin]ethanesulfonic acid
N viable counts [CFU/ml]
No initial viable counts [CFU/ml]
NCBI National Center for Biotechnology Information
OD optical density
p pressure [MPa]
PI propidium iodide
pLP712 plasmid where the ability to ferment lactose is encoded
R gas constant [8,3145 J mol-1 K-1]
T absolute temperature [°K]
Tm transition temperature [°C]
to initial time [h]
td detection time [h]
TRIS tris (hydroxymethil)-aminomethan
TMW Technische Mikrobiologie Weihenstephan
SDS sodium n-dodecyl sulfat.
Sv FtsZ antibodies from Shewanella violacea DSS12

Contents 1. Introduction .......................................................................................................................... 1 1.1 General principle of high-pressure ....................................................................................... 1 1.2 Effects of high-pressure on microorganisms........................................................................ 4
1.2.1 Mechanisms and limits of adaptation............................................................................ 4 1.2.2 Mechanisms of inactivation .......................................................................................... 5
1.3 Effects and interactions of treatment variables .................................................................... 7 1.3.1 Microorganisms............................................................................................................. 7 1.3.2 Pressure level and time.................................................................................................. 8 1.3.3 Temperature .................................................................................................................. 9 1.3.4 pH.................................................................................................................................. 9 1.3.5 Composition of medium.............................................................................................. 10 1.3.6 Antimicrobial compounds ........................................................................................... 10
1.4 Kinetics of microbial inactivation ...................................................................................... 11 1.5 Aim of this thesis………………………………………………………………….………13 2. Material and methods ........................................................................................................ 14
2.1.1 Abreviations and solutions .......................................................................................... 14 2.1.2 Chemicals .................................................................................................................... 14
2.2 Bacterial strains and media ................................................................................................ 14 2.3.1 Milk buffer .................................................................................................................. 15 2.3.2 Milk filtrate ................................................................................................................. 15
2.4 Determination of water activity (aw) of milk buffers ......................................................... 15 2.5 Pressurization of cell suspensions ...................................................................................... 15 2.6 Methods for characterization of pressure-induced inactivation on cells............................ 15
2.6.1 Enumeration of viable cells......................................................................................... 16 2.6.2 Membrane integrity assay ........................................................................................... 16 2.6.3 Metabolic activity assay .............................................................................................. 17 2.6.4 LmrP activity assay ..................................................................................................... 17 2.6.5 Measurement of detection time of growth .................................................................. 17
2.7 Methods for characterization of growth under high-pressure conditions .......................... 18 2.7.1 Determination of maximal pressure of growth ........................................................... 18 2.7.2 Determination of growth rate under pressure.............................................................. 18 2.7.3 Measurements of optical density................................................................................. 18 2.7.4 Microscopic counts of cells......................................................................................... 19 2.7.5 Determination of maximal and optimal temperature of growth.................................. 19 2.7.6 Indirect immunofluorescence microscopy .................................................................. 19
2.8 Method for measurement of internal pH ............................................................................ 19 2.8.1 Labeling of cells with cFSE for pHin determination ................................................... 19 2.8.2 Offline measurement of pHin at ambient pressure....................................................... 20 2.8.3 In-situ measurement of pHin........................................................................................ 20 2.8.4 Reversibility test.......................................................................................................... 21 2.8.5 Computation of the pH-values during pressure treatment .......................................... 21
2.9 Methods for measurement of membrane phase state ......................................................... 22 2.9.1 Determination of temperature-dependent phase state of the membrane by FT-IR spectroscopy ......................................................................................................................... 22 2.9.2 Determination of the temperature and pressure-dependent phase state of the membrane by fluorescence spectroscopy............................................................................. 23
2.10 Determination of accumulated osmolytes after hyper-osmotic shock ............................. 23 2.10.1 Cell extract ................................................................................................................ 23
2.10.2 Determination of accumulated osmolytes by HPLC analysis of cell extracts .......... 24

3. Results ................................................................................................................................. 25 3.1 Growth under high-pressure conditions ............................................................................. 25
3.1.1 Effect of temperature and pressure on growth rate ..................................................... 26 3.1.2 Morphologic changes and immunofluorescence microscopy ..................................... 29
3.2 Pressure inactivation. Development of model system and strain selection........................ 37 3.2.1 Validation of milk buffer as food system.................................................................... 37 3.2.2 Selection of strain........................................................................................................ 39
3.3 Detection time .................................................................................................................... 41 3.4 Effect of sucrose and sodium chloride on the survival and metabolic activity of Lactococcus lactis under high-pressure conditions.................................................................. 43
3.4.1 Inactivation of Lactococcus lactis cells in milk buffer at different pressure levels .... 43 3.4.2 Metabolic activity and membrane integrity after high-pressure treatments................ 44
3.4.3 Inactivation kinetics of Lactococcus lactis in milk buffer and milk buffer with additives ............................................................................................................................... 46
3.4.4 Effect of low molecular solutes on metabolic activity and membrane integrity......... 49 3.5 In-situ determination of intracellular pH of Lactococcus lactis and Lactobacillus plantarum during pressure treatment ....................................................................................... 51
3.5.1 Inactivation of Lactococcus lactis in milk buffer with different pH........................... 51 3.5.2 Inactivation of Lactobacillus plantarum in milk buffer with different pH ................. 53 3.5.3 Effect of the buffer pH (pHex) on the internal pH (pHin)............................................. 54 3.5.4 Calibration curve for measuring pHin under high-pressure......................................... 55 3.5.5 Effect of high-pressure on the internal pH of Lactococcus lactis ............................... 56 3.5.6 Effect of high-pressure on the internal pH of Lactobacillus plantarum ..................... 60 3.5.7 Effect of high-pressure on the intracellular pH of Lactococcus lactis in presence of osmolytes.............................................................................................................................. 63
3.6 Investigation of mechanisms of baroprotection of sodium chloride and sucrose .............. 64 3.6.1 Comparison of inactivation kinetiks of Lactococcus lactis in presence of different solutes................................................................................................................................... 64 3.6.2 LmrP activity of pressurized cells in milk buffer and milk buffer with additives ...... 67 3.6.3 Intracellular accumulation of osmolytes by osmotic upshock .................................... 68 3.6.4 Effect of osmolytes on the membrane phase state at different temperatures measured by FT-IR spectroscopy ......................................................................................................... 69
3.6.5 Effect of osmolytes on the membrane phase state at different temperatures and pressures as measured by Laurdan fluorescence spectroscopy…………………………….70 4. Discussion ............................................................................................................................ 73
4.1 Effect of high-pressure during growth ........................................................................... 74 4.2 Effects of high-pressure during inactivation .................................................................. 76
4.3 General remarks………………………...………………………………………….….. 84 5. Summary ...………………………………………………………………………………..86 6. Zusammenfassung………………………………………………………….……………..89 7. References ………………………………………………….……………………………..92

Introduction
1
1. Introduction
The increasing demand for products that maintain the quality of fresh foods has led to a
search for new technologies of food preservation. These technologies aim to replace those that
involve heat treatment, which can result in a decrease in the nutritional value and a change in
the sensory characteristics of the products (Smelt, 1998). In this sense, high-pressure has been
investigated in order to create products of high quality and microbiological stability. Unlike
heat, high-pressure affects only a few covalent bonds and therefore has little effect on ester
molecules and other compounds responsible for food flavour and taste. Pressure also has
negligible effects on vitamins. However pressure does cause denaturation or unfolding of
proteins by disrupting hydrophobic interactions and causes phase changes in biological
membranes (Rosenthal, 2002; Ulmer et al., 2002).
Food preservation by high-pressure is based on the effect of pressure on spoilage
microorganisms and enzymes. High-pressure allows the destruction of most vegetative
microbial cells and at higher level and multiple pressure cycles the destruction of most
bacterial spores (Smelt, 1998).
High-pressure induces physiological imbalances due to the internal and external structural
damages, which are responsible for inactivation of microorganisms. The effect of pressure
was also associated to a permanent shrinkage of cell volume, which was related to an
irreversible mass transfer that occurs between the cell and pressure medium, because of a
disruption or an increase in membrane permeability. Adiabatic expansion of water was also
reported to be associated with inactivation of microorganisms (Alemán, 1996).
However, many aspects of the technology still have to be clarified, mainly related to the
mechanism of inactivation, variation in pressure resistance of microorganisms according to
the type and composition of the product, and the adaptation response to high-pressure
conditions.
1.1 General principle of high-pressure
Two principles underlie the effect of high-pressure. First, the principle of le Chatelier,
according to which any phenomenon (phase transition, chemical reactivity, change in
molecular configuration, chemical reaction) accompanied by a decrease in volume will be
enhanced by pressure (and vice versa). An antagonistic effect of temperature is expected from
the fact that a temperature increase induces a volume increase through dilation. However, an
increase in temperature also increases the rate of reaction according to Arrhenius´ law.
Secondly, the isostatic principle (isostatic pressure), which indicates that pressure is
Introduction
2
transmitted in a uniform and quasi-instantaneous manner throughout the whole biological
sample (whether the latter is in direct contact with the pressurization medium or located in an
hermetic and flexible container that transmits pressure). Independent of the size and the
geometry of the food, pressure is instantaneously and uniformly transmitted (Cheftel, 1995;
Smelt, 1998).
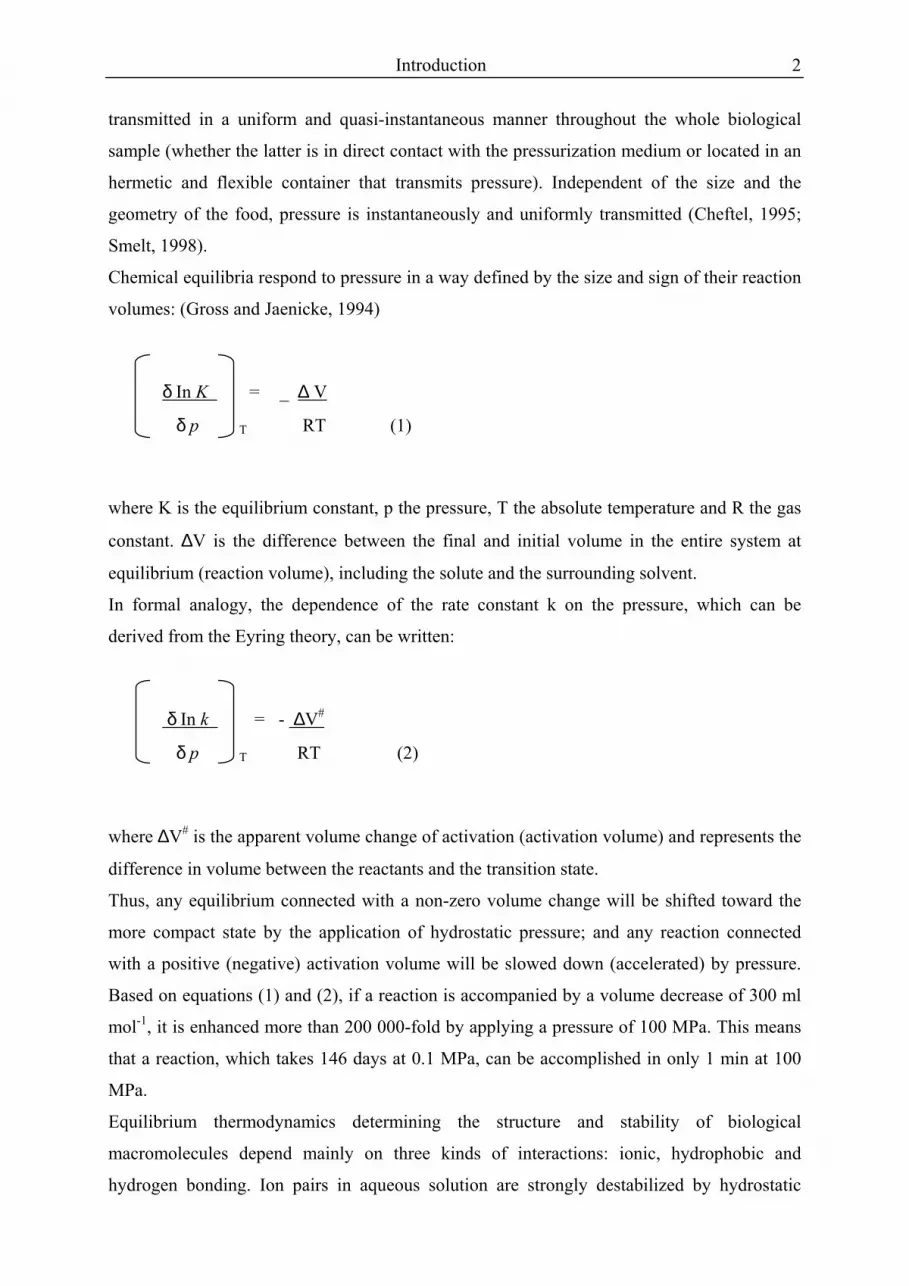
Chemical equilibria respond to pressure in a way defined by the size and sign of their reaction
volumes: (Gross and Jaenicke, 1994)
δ In K = _ ∆ V
δ p T RT (1)
where K is the equilibrium constant, p the pressure, T the absolute temperature and R the gas
constant. ∆V is the difference between the final and initial volume in the entire system at
equilibrium (reaction volume), including the solute and the surrounding solvent.
In formal analogy, the dependence of the rate constant k on the pressure, which can be
derived from the Eyring theory, can be written:
δ In k = - ∆V#
δ p T RT (2)
where ∆V# is the apparent volume change of activation (activation volume) and represents the
difference in volume between the reactants and the transition state.
Thus, any equilibrium connected with a non-zero volume change will be shifted toward the
more compact state by the application of hydrostatic pressure; and any reaction connected
with a positive (negative) activation volume will be slowed down (accelerated) by pressure.
Based on equations (1) and (2), if a reaction is accompanied by a volume decrease of 300 ml
mol-1, it is enhanced more than 200 000-fold by applying a pressure of 100 MPa. This means
that a reaction, which takes 146 days at 0.1 MPa, can be accomplished in only 1 min at 100
MPa.
Equilibrium thermodynamics determining the structure and stability of biological
macromolecules depend mainly on three kinds of interactions: ionic, hydrophobic and
hydrogen bonding. Ion pairs in aqueous solution are strongly destabilized by hydrostatic

Introduction
3
pressure. This effect is attributed to the electrostrictive effect of the separated charges: each of
it arranges water molecules in its vicinity more densely than bulk water. Thus, the overall
volume change favours the dissociation of ionic interactions under pressure. For the same
reason the pH of water is shifted by 0.3 when pressure is raised form 0.1 to 100 MPa; in
certain buffer systems the effect is even larger (for buffer systems with low pressure
coefficients, cf. Kitamura et al., 1987)
Similarly, the exposure of hydrophobic groups to water disturbs the “loosely packed”
structure of pure water and leads to a hydrophobic solvation layer, which is assumed to be
more densely packed. Hence, the exposure of hydrophobic residues occurring, for instance,
during the unfolding of proteins is favoured at elevated pressure. In this context, the well
established fact that van der Waals´ forces contribute significantly to hydrophobic interactions
should be kept in mind. Since they tend to maximize packing density, one would predict their
pressure coefficient to be positive.
Formation of hydrogen bonds in biomacromolecules is connected to a negligibly small
reaction volume, which may be positive or negative, depending on the model system.
Table 1.1 gives some typical values for the volume effects connected with biochemical
reactions involving the various interactions. From the previous discussion of the size and sign
of ∆V and ∆V#, it is obvious that water as the main component of the cell and as a standard
solvent in biochemistry plays a major role in the understanding of high-pressure effect (Gross
and Jaenicke, 1994). Compared with gases, water is nearly incompressible, adiabatic
compression of water increases the temperature by about 3°C per 100 MPa (Tauscher, 1995),
while the freezing point decreases to –22°C at 207.5 MPa (Palou, 1999).
The effects of pressure on metabolic processes in living organisms are thought to be very
complex. Even in the case of a well-known metabolic pathway such as glycolysis, elevated
hydrostatic pressure might result in enhanced, neutral or inhibitory effects as a result of the
variation in sign and size of the volume changes at each step. Although the value of ∆V or
∆V# for biochemical reactions are known, it is still difficult to predict how elevated
hydrostatic pressure would affect metabolic pathways or alter the pool sizes of metabolites in
living organisms (Abe et al.,1999).

Introduction
4
Table 1.1 Reaction volumes associated with selected biochemically important reactions (25°C). (Gross and Jaenicke, 1994) Reaction Example ∆V
ml/mol
Protonation/ion-pair formation H+ + OH- H2O + 21.3 imidazole + H+ imidazole· H+ - 1.1 Tris + H+ Tris· H+ - 1.1 HPO4
-2 + H+ H2PO4- + 24.0
CO3-2 + 2H+ HCO3
- + H+ H2CO3 + 25.5a
Protein-COO- + H+ protein-COOH + 10.0 Protein-NH3
+ + OH- protein-NH2 + H2O + 20.0 Hydrogen-bond formation poly(L-lysine)(helix formation) - 1.1 poly(A + U)(helix formation) + 1.1b Hydrophobic hydration C6H6 (C6H6)water - 6.2 (CH4)hexane (CH4)water - 22.7 Hydration of polar groups n-propanol (n-propanol)water - 4.5 Protein dissociation/association lactate dehydrogenase (M4 4M) apoenzyme - 500 holoenzyme (satured with NADH) - 390 microtubule formation (tubulin propagation; ∆V per subunit + 90 ribosome association (E. coli 70S) ≥ 200c
Protein denaturation myoglobin (pH 5, 20°C) - 98 a ∆V for each ionization step b for DNA denaturation: 0-3 ml/mol base pair c 200-850 ml/mol, depending on pressure and state of charging 1.2 Effects of high-pressure on microorganisms
1.2.1 Mechanisms and limits of adaptation
Adaptation response toward high hydrostatic pressure is still far from being understood. Most
bacteria are capable of growth at pressures around 20-30 MPa, piezophiles are
microorganisms that possess optimal growth rates at pressures above atmospheric pressure.
Piezotolerant microorganisms are capable of growth at high-pressure, as well as at
atmospheric pressure, but can be distinguished from piezophiles because they do not have
optimal growth rates at pressures above one atmosphere. Piezotolerant microbes can also be
distinguished from piezosensitive microorganisms (whose growth is sensitive to elevated
pressure) because they can grow at 50 MPa at a rate that is above 30% of their growth rate at
atmospheric pressure, as long as they have otherwise optimal growth conditions (Abe and
Horikoshi, 2001).

Introduction
5
Non-adapted (mesophilic) microorganisms commonly show growth inhibition at about 40-50
MPa. The cessation of growth is accompanied by morphological changes such as formation of
filaments in Escherichia coli (Sato et al., 2002) and cell chains or pseudomycelia in the
marine yeast Rhodosporidium sphaerocarpum (Lorenz, 1993).
In the case of Escherichia coli, three kinds of pressure- responses are observed, categorized as
pressure-inducible, pressure-independent, and pressure-repressible responses (Kato et al.
2000). Welch et al. (1993) report a unique stress response of Escherichia coli to abrupt shifts
in hydrostatic pressure that result in higher levels of heat-shock proteins (Hsps) and cold-
shock proteins (Csps), as well as many proteins that are produced only in response to high-
pressure. A pressure of 30 MPa activates the lac promoter region of Escherichia coli and
induces gene expression controlled by this promoter on a plasmid, but represses expression
initiated from malK-lamB and malEFG promoters (Sato et al., 1996b).
In the yeast Saccharomyces cerevisiae it has been found that a short period of heat-shock
treatment allows the cells to survive at lethal level of pressure. Exposition to a temperature
higher than optimum enhances the synthesis of heat shock proteins (Hsps104) and trehalose
preventing protein denaturation and promoting stabilisation of membrane fluidity (Iwahashi et
al., 1997).
The maintenance of appropriate membrane fluidity is thought to be one of the key factors for
survival and growth under high-pressure conditions. High-pressures exert effects on
membrane systems that are comparable to the effects of low temperature. The more-ordered,
less bulky crystalline (gel) state of membrane lipids is stabilized by high hydrostatic pressure,
as indicated by the increasing melting points of lipids with increasing pressure. At constant
temperature, high-pressure will cause a transition in the lipid bilayer to the gel state. An
organism adapted to high-pressure might be expected to adjust its membrane phospholipid
composition to offset these lipid-solidifying effects, perhaps by increasing the proportion of
unsaturated fatty acids. This would be analogous to homeoviscous adaptation to changes in
temperature (Delong and Yayanos, 1985).
1.2.2 Mechanisms of inactivation
To explain the response of microorganisms to different pressures, high-pressure effects on
several biological molecules have been studied. High-pressure is known to cause
morphological, biochemical, and genetic alterations in vegetative microorganisms (Cheftel,
1995). Protein denaturation, lipid phase change and enzyme inactivation can perturb the cell

Introduction
6
morphology, genetic mechanisms, and biochemical reactions. However, the mechanisms that
damage the cells are still not fully understood (Perrier-Cornet et al., 1995).
Niven et al. (1999) have observed a correlation between loss of cell viability and decrease in
ribosome-associated enthalpy in cells subjected to pressures of 50-250 MPa for 20 min and
suggest that the ribosome may be a critical target of lethal as well as growth-inhibitory effects
of high-pressure on bacteria. Yayanos and Pollar (1969) found that in Escherichia coli DNA
synthesis stopped approximately at 50 MPa, protein synthesis around 58 MPa and RNA
synthesis at 77 MPa.
However, it is commonly acknowledged that membrane damage is the main cause of cell
inactivation under pressure. Physical damage to the bacterial cell membrane has been
demonstrated as leakage of ATP or UV-absorbing material from bacterial cells subjected to
pressure or increased uptake of fluorescent dyes as propidium iodide (PI) that do not normally
penetrate the membranes of healthy cells (Isaacs et al., 1995; Pagan and Mackey, 2000;
Ulmer et al., 2000).
The intracellular pH in Saccharomyces cerevisiae can be measured under high-pressure
conditions using pH-sensitive fluorescent probes. Hydrostatic pressure promotes the
acidification of vacuoles in a manner dependent on the magnitude of the pressure applied up
to 60 MPa (Abe and Horikoshi, 1997). Pressure-induced vacuole acidification is caused by
the production of carbon dioxide. Hydration and ionization of CO2 is facilitated by elevated
pressure because a negative volume change (∆V < 0) accompanies the chemical reaction. Abe
et al. (1997) suggest that the yeast vacuole works as a proton sequestrant under high-pressure
conditions to maintain a favourable cytoplasmic pH.
The similarity between pressure-induced protein denaturation and pressure-induced
inactivation of microorganisms and the observations of membrane damage and decrease of
intracellular pH at high-pressure suggest that membrane-bound enzymes are one of the major
target for pressure-inactivation (Smelt, 1998; Ulmer et al., 2000, 2002; Wouters et al., 1998).
In Lactobacillus plantarum, pressure treatment causes partial inactivation of the F0F1 ATPase
such that the ability of cells to maintain a ∆pH is reduced, and the acid efflux mechanism is
impaired (Wouters et al., 1998). Ulmer et al. (2000, 2002) report a reduction of the
membrane-bound enzyme HorA activity prior loss of cell viability of Lactobacillus plantarum
during high-pressure treatment, indicating loss of hop resistance of pressurized cells. The
effects of pressure on the activity of membrane proteins have been studied also with the
Na+/K+-ATPase from teleost gills (Gibbs and Somero, 1989). The decrease of activity was
found to correlate with the reduction of membrane fluidity. The physical state of the lipids

Introduction
7
that surround membrane proteins plays a crucial role in the activity of membrane-bound
enzymes, and there is considerable evidence that pressure tends to loosen the contact between
attached enzymes and membrane surfaces as a consequence of the changes in the physical
state of lipids that control enzyme activity (Heremans, 1995).
Loss of membrane functions such as active transport or passive permeability would be
expected to impair the cell homeostasis and this might account for the increased sensitivity to
environmental conditions.
High-pressure treatment also induces morphological changes in microbial cells. Separation of
the cell wall and disruption in the homogeneity of the intermediate layer between the cell wall
and the cytoplasmic membrane occur. Isaacs et al. (1995) have demonstrated with electron
microscopy studies that ribosomal destruction in cells of E. coli and L. monocytogenes results
in metabolic malfunctions that can cause cell death. For Schizosaccharomyces pombe, after a
treatment at 100 MPa the nuclear membrane is damaged and fragmented (Sato et al., 1996a).
In the same study, a pressure treatment above 250 MPa dramatically changes the cytoplasmic
substance, the cellular organelles can hardly be detected, and the fragmented nuclear
membrane is barely visible (Sato et al., 1996a). In Lactobacillus viridescens empty cavities
between cytoplasmic membrane and outer cell wall and DNA denaturation are observed after
pressure treatment above 400 MPa (Park et al., 2001).
1.3 Effects and interactions of treatment variables
The extent of high-pressure inactivation depends on several parameters, such as the type of
microorganism, the pressure level, the process temperature and time, and the composition of
the dispersion medium (Cheftel, 1995).
1.3.1 Microorganisms
The pressure sensitivity of microorganisms varies with the species and probably with the
strain of the same species and with the stage of the growth cycle at which the organisms are
subjected to the high-pressure treatment. Generally, yeasts and moulds are most sensitive to
high-pressure, gram-positive microorganisms are most resistant, possibly because of their cell
wall structure, and gram-negative microorganisms are moderately sensitive. Vegetative forms
are inactivated by pressures between 400 and 600 MPa, while bacterial spores are extremely
resistant and can survive pressures in excess of 1,000 MPa. Among the gram-positive bacteria
Staphylococcus is one of the most resistant and can survive treatment at 500 MPa for more

Introduction
8
than 60 min (Earnshaw, 1995). The stage of growth of microorganisms is also important in
determining sensitivity to high-pressure, as cells in the exponential phase are more sensitive
than stationary-phase cells. (Cheftel, 1995). Table 1.2 shows the comparison of pressure and
heat inactivation of some pathogens at different conditions.
Cheftel (1995) reports that when the pressure resistance of various microorganisms is
compared, the survival fractions determined by different investigators vary by a factor of 1 to
>8 for different species of the same genus (Salmonella) or by a factor 1.5-3.5 for different
strains of the same microorganism (L. monocytogenes).
Table 1.2 Approximate heat resistance and pressure resistance for some pathogenic bacteria Table from Smelt, 1998.
Original data from Mossel et al., 1995; Patterson et al., 1995; Metrick et al., 1989 and Styles et al., 1991. For food preservation it is important to notice that species of foodborne pathogens contain
strains that are relatively resistant to pressure (Alpas et al., 1999, 2000). Listeria
monocytogenes and Staphylococous aureus required for a 6 log reduction in the initial
inoculum treatments for 20 minutes at 340 and 400 MPa, respectively (Patterson et al., 1995).
Another pressure-tolerant pathogenic bacterium is Escherichia coli O157:H7. Takahashi et al.
(1993) report that for a 6 log cycle reduction of Escherichia coli O157:H7, a treatment at 700
MPa for 13 min is required.
Organism
D value at 60 °C (minutes)
Inactivation (log cycles) after 15 min pressure treatmentPressure (MPa)
300 400 500 600
Aeuromonas hydrophila 0.1-0.2 > 6
Pseudomonas aeruginosa 0.1-0.2 > 6
Campylobacter 0.1-0.2 > 6
Salmonella spp. 0.1-2.5 1-4.5
Yersinia entrocolitica 2-3 > 6
Escherichia coli 4-6 1-2
Escherichia coli O157:H7 2.5 2.5
Salmonella senftenberg 6-10 3
Staphylococcus aureus 1-10 0.1 1.9 2.1
Listeria monocytogenes 3-8 1-3 > 6

Introduction
9
1.3.2 Pressure level and time
The magnitude of inactivation depends on pressure level and time of pressurization. In most
cases, at ambient temperatures it is necessary to apply pressures above 200 MPa in order to
induce inactivation of vegetative microbial cells (Cheftel, 1995). For each microorganism,
there is a pressure level at which increasing treatment time causes significant reductions in the
initially inoculated microbial counts (Palou et al., 1999). However, there is no proportional
relationship between the increase in pressure and the reduction of the bacterial population.
This relation appears to follow a nonlinear pattern becoming sigmoid. The inactivation curve
for microorganisms subjected to high-pressure treatments is similar to that one observed for
heat treatment, with a shoulder representing a period during which the cells are able to
resynthesize a vital component. Inactivation ensues only when the rate of destruction exceeds
the rate of resynthesis. Heinz and Knorr (1996) postulated a two-step-model for the kinetic
analysis of the survivor data after a high-pressure treatment. The transition of the bacterial cell
from a stable, actively proton-releasing state A to a metastable intermediate state B with lower
internal pH is assumed to take place after a certain period of time, primarily dependent on the
temperature and the pressure applied. The second step in the model (B C) describes the cell
death in consequence of the internal pH decrease as a combined action of pressure,
temperature and pH.
The “tailing” presented in these curves suggests that the microorganism population produced
from a bacterial culture are non-homogenous (Ritz et al., 2000). Pressure inactivation as
function of treatment time follows the same nonlinear pattern: shoulder, exponential
inactivation and tail.
1.3.3 Temperature
The temperature during pressurization can have a significant effect on the inactivation of
microbial cells. Microorganisms are less sensitive to pressurization at temperatures around
their optimal temperature of growth. This resistance decreases significantly at higher or lower
temperatures presumably because of phase transition of membrane lipids. At sub-zero
temperatures moderately pressure levels are sufficient to inactivate microorganisms such as
Saccharomyces cerevisiae, Aspergillus niger, Escherichia coli (Hayakawa et al., 1998).
The effects of temperature are of great practical interest, because combined pressure-
temperature processing may cause equivalent microbial inactivation ratios while operating at
lower pressure levels and/or for shorter periods of time (Cheftel, 1995).

Introduction
10
1.3.4 pH
Mackey et al. (1995) indicate that a reduction in the pH of the suspending medium causes a
progressive increase in cell sensitivity to pressure. Stewart et al. (1997) reported an additional
3 log cycle reduction in L. monocytogenes CA when pressurized in buffer at pH 4.0 as
compared with pH 6.0 at 353 MPa and 45°C for 10 min. Pressurization in the presence of
either citric or lactic acid increases the viability loss of four foodborne pathogens by an
additional 1.2-3.9 log cycles at pH 4.5 for both acids at 345 MPa (Alpas et al., 2000). The
inactivation does not appear to depend on the type of organic acid (citric, tartaric, lactic or
acetic) used for acidification (Ogawa et al., 1990). An interesting hypothesis is that pressure
treatment could restrict the pH range that the bacteria can tolerate, possibly because of the
inhibition of ATPase-dependent transfer of protons and cations, or their direct denaturation or
the dislocation of bound ATPase in the membrane (Pagan et al., 2001; Wouters et al., 1998).
1.3.5 Composition of medium
The composition of the medium where the microorganisms are dispersed at the moment of
pressurization significantly influences the efficiency of inactivation. The addition of solutes
increases the number of viable cells in a high-pressure treated sample.
A protective effect of sucrose against pressure inactivation is reported by Oxen and Knorr
(1993) in experiments with the yeast Rhodoturula rubra. A high-pressure treatment at room
temperature and 400 MPa for 15 minutes inactivates the yeast Rhodoturula rubra when the aw
of the suspension media is higher than 0.96, while the number of survivors is higher when the
aw is depressed.
The work from Takahashi et al. (1993) shows a marked protective effect of 2-4 M sodium
chloride against the pressure inactivation of Escherichia coli or Saccharomyces cerevisiae
dispersed in a pH 7 buffer solution. Significant baroprotective effects of NaCl or glucose are
also observed by Hayakawa et al. (1994) with suspensions of Zygosccharomyces rouxii and
Saccharomyces cerevisiae. Ogawa et al. (1990) report that for Saccharomyces cerevisiae
inoculated in concentrated fruit juices, the number of surviving microorganisms depends on
the juice-soluble solids concentration and observe that the inactivation effect at pressure ≤ 200
MPa decreases as juice concentration increases. These effects are suggested to relate to the
decrease in water activity. A reduced aw may originate a cell shrinkage because of
dehydration thickening the cell membrane and reducing the cell size (Knorr, 1992; Palou et
al., 1997). However, the influence of NaCl or of sugars on the osmotic pressure of foods or

Introduction
11
suspension media is not sufficient to explain the marked baroprotective effects of these
solutes and the mechanism of protection remains unknown.
Several mono-, and disaccharides are significantly effective in providing protection against
hydrostatic pressure and high temperature damage in Saccharomyces cerevisiae. The extend
of barotolerance and thermotolerance with different sugars shows a linear relation to the mean
number of equatorial OH groups (Fujii et al., 1996). Same linear relationship is seen when
sugars protect protein molecules against elevating temperatures in vitro. These results suggest
that sugars may protect cells against hydrostatic pressure and high temperature in the similar
manner probably by stabilizing macromolecule(s) (Fujii et al., 1996).
1.3.6 Antimicrobial compounds
The intensity of pressure required to inactivate microorganisms can be reduced in the
presence of antimicrobial compounds, since moderate pressurization or short exposures can
cause sublethal injury to cells, making them more susceptible to antibacterial compounds,
such as bacteriocins and lysozyme (Kalchayanand et al. 1998a-b; Karatzas et al., 2001). At
ambient pressure, lysozyme is completely inactive against most gram-negative bacteria
because it cannot penetrate the outer membrane to reach its target, the peptidoglycan.
However, high-pressure can sensitise Escherichia coli and some other gram-negative bacteria
to lysozyme probably through pressure-assisted self-promoted uptake (Masschalck et al.,
2000, 2001). The increased efficacy of the synergistic combination of high-pressure and nisin
may also be explained by changes in membrane fluidity. Steeg et al. (1999) propose that the
binding of nisin would directly increase the susceptibility of microorganisms during high-
pressure treatment because of an assumed local immobilization of phospholipids. In addition,
the high-pressure treatment may still cause indirect (sublethal) injury by facilitating the access
of nisin to the cytoplasm membrane as a result of cell wall (and/or outer membrane for gram-
negative microorganisms) permeabilization (Hauben et al., 1996; Patterson et al., 1995; Steeg
et al., 1999).
Some studies on microbial inactivation by high-pressure in combination with additives like
ethanol (Tamura et al., 1992), chitosan (Papineau et al., 1991), nisin (Hauben et al., 1996;
Masschalck et al., 2000, 2001; Steeg et al., 1999), carvacrol (Karatzas et al., 2001), CO2
(Erkmen 2000; Haas et al., 1989; Hong et al., 1997; Karaman und Erkmen 2001), hop bitter
compounds (Ulmer et al., 2000) and EDTA (Hauben et al., 1996) have been reported.

Introduction
12
1.4 Kinetics of microbial inactivation
The patterns of high-pressure inactivation kinetics observed with different microorganisms
are quite variable. Some investigators indicate first-order kinetics in the case of several
bacteria and yeast (Carlez et al., 1993; Cheftel, 1995; Hashizume et al., 1995). Other authors
observe a change in the slope and a two-phase inactivation phenomenon, the first fraction of
the population being quickly inactivated, whereas the second fraction appears to be much
more resistant (Cheftel, 1995; Heinz and Knorr, 1996). The pattern of inactivation kinetics is
also influenced by pressure, temperature, and composition of the medium (Ludwing et al.,
1992).
For the use of high-pressure in food processing, it is of special interest to determine the
process conditions for pressure pasteurisation in view of industrial application (Cheftel,
1995). In heat processing, inactivation is based on the assumption that death of
microorganisms is log-linear with time. Although deviations from log-linearity have been
found in heat inactivation, such deviations seem to be more common in pressure inactivation.
Deviation from log-linearity could be explained as a two step reaction passing through an
intermediate stage. This metastable intermediate state is reached after endogenous
homeostatic mechanisms cannot longer balance the pressure induced displacements of
equilibrium (Heinz and Knorr, 1996). A satisfactory description is possible by applying
distribution models used in toxicology (Smelt, 1998).
Survival curves of pressure inactivation often show pronounced survivor tails (Patterson et
al., 1995). There are a number of possible theories to explain this “tail effect” in pressure-
inactivation: tailing is a normal characteristic associated with the inactivation or resistance
mechanisms, is the result of microbial population heterogeneity or is the result of
experimental errors (Earnshaw, 1995). Another possible reason for tailing is microbial
adaptation and recovery during and after pressure treatment (Palou et al., 1999). Isolated,
cultivated, and subjected to a second pressurization step, the pressure resistant fraction often
displays again two-phase inactivation kinetics (Ulmer et al., 2000).
Ritz et al. (2001) have shown that even if the microbial population appears totally inactivated
by treatment and no culture growth is recorded, variable degrees of injury can be inflicted on
the cells by high-pressure treatment. This heterogeneity of the treated cell population suggests
that reversible damage may occur and cellular repair and/or growth under favourable
conditions should not be ruled out. Those conditions are determining factors in further high-
pressure applications in the food preservation industry. To design appropriate processing
conditions for high-pressure treatments, it is essential to know the precise barotolerance levels

Introduction
13
of different microbial species and the mechanisms by which that barotolerance can be
minimized (Tewari et al., 1999).
1.5 Aim of this thesis
The aim of this thesis was to study the mechanism of high-pressure induced growth inhibition
and cell death distinguishing primary from secondary pressure effects. The lactic acid
bacterium Lactococus lactis was chosen as a model system and its responses to high-pressure
were to be characterised during growth and after pressure-induced inactivation.
Therefore, using pressures between 0.1 and 100 MPa the growth under pressure conditions
should be investigated. Temperature and pressure upper limits of growth were to be
determined and the changes of morphology and growth rate to be reported. DAPI-staining and
indirect immunofluorescence microscopy should be applied to characterise the growth of
Lactococcus lactis under sublethal pressure.
Treatments above 200 MPa should be used to study the pressure-induced inactivation. Cells
were to be characterised after high-pressure treatment by means of metabolic activity,
membrane damage and viability. Modifying the composition of the medium, the effect of
ionic and non-ionic solutes on the barotolerance of Lactococcus lactis was to be investigated.
Alterations on the membrane resulting from high-pressure treatment should be investigated by
online measurements of intracellular pH and membrane potential. Furthermore, the
inactivation of the membrane-bound enzyme LmrP should be studied.

Material and methods 14
2. Material and methods
2.1.1 Abbreviations and solutions
cFDASE: 5(and 6-)-Carboxyfluorescein diacetate N-succimidyl ester; cFSE: 5(and 6-)-
Carboxyfluorescein succimidyl ester; DAPI: 4',6-diamidino-2-phenylindole, dihydrochloride;
EB: Ethidium bromide; EDTA: Ethylenediaminetetraacetic acid; HEPES: (N-[2-
Hydroxyethyl]piperazine-N´-[2-ethanesulfonic acid]); Laurdan: 6-dodecanoyl-2-
dimethylaminonaphtalene; MES: (2-[N-Morpholin]ethanesulfonic acid); TRIS: Tris
(hydroxymethil)-aminomethan; SDS: Sodium n-Dodecyl sulfat.
Poly-L-lysine solution: 1 mg/ml; lysozyme solution: 25mM Tris-HCl (pH 8), 50 mM glucose,
10mM EDTA, 2 mg/ml lysozyme; PBSTE: 140mM NaCl, 2mM KCl, 8mM Na2HPO4, 0.05%
Tween 20, 10mM EDTA.
2.1.2 Chemicals
EDTA, HEPES, MES, valinomycin and nigericin were obtained from Sigma-Aldrich
(Steinheim, Germany); cFDASE from Fulka (Buchs, Switzerland); DAPI, Alexa Fluor® 488
goat anti-rabbit IgG, LIVE/DEAD BacLight, Laurdan from Molecular Probes (Eugene,
USA); EB and TRIS from Boehringer (Mannheim, Germany). All other chemicals and M17
and MRS broths were analytical grade from Merck (Darmstadt, Germany).
2.2 Bacterial strains and media
The bacteria used in this work are shown in Table 2.1.
Table 2.1 Bacterial strains
Microorganisms Origin Reference
Lactococcus lactis ssp. cremoris TMW 1.1085 MG1363 plasmid cured strain of NCDO 712
Gasson, M.J
Lactococcus lactis TMW 2.26 dairy
Lactococcus lactis TMW 2.27 dairy
Lactococcus lactis TMW 2.28 dairy
Lactococcus lactis TMW 2.29 dairy
Lactococcus lactis TMW 2.118 DSM 20661 Garvie, E.I., and Farrow, J.A.E.
Lactococcus lactis ssp. cremoris TMW 1.234 NCDO 712 Davies, F.L. et al.
Lactobacillus sanfranciscensis TMW 1.53 DSM 20451 Kline, L., and Sugihara, T. F.
Lactobacillus plantarum TMW1.460 spoiled beer

Material and methods 15
Lactococcus lactis strains were grown anaerobic at 30°C in M17 broth (Terzaghi and Sandine,
1975) supplemented with 1% glucose (GM17 broth).
Lactobacillus plantarum TMW1.460 and Lactobacillus sanfranciscensis TMW1.53 were
grown at 30°C under anaerobic conditions in MRS and MRS-4 broth, respectively (De Man et
al., 1960; Stolz et al., 1995).
2.3.1 Milk buffer
The milk buffer was chosen to contain the same amounts of minerals and lactose as whey
from rennet casein; the buffer contained the following compounds (g⋅l-1): KCl, 1.1;
MgSO4⋅7H20, 0.7110; Na2HPO4⋅2 H20, 1.874; CaSO4⋅2 H20, 1; CaCl2⋅2 H20, 0.99; citric
acid, 2; lactose, 52. The pH was adjusted to 6.5 with KOH (2 M)
2.3.2 Milk filtrate
Milk filtrate was prepared by ultrafiltration (Filtron, Germany), the filtration surface was 0.35
m2. The membrane type was minisette, omega open channel made up of polyethylensulfon
(10000 dalton). The process parameters were:
volume flow: 610 l/h
pressure difference at plate-input: 3-4 bar
pressure difference at plate-output: approx. 2.3 bar
temperature: 50°C
2.4 Determination of water activity (aw) of milk buffers
The water activity was determined by measuring the freezing point depression with a
Crioscope (Type A0284, Knauer GmbH, Berlin).
2.5 Pressurization of cell suspensions
The cells of an overnight culture were harvested by centrifugation (15 min at 5500 rcf⋅g),
washed and resuspended in milk buffer or milk filtrate to about 109 cfu⋅ml-1. The cells were
suspended in 2 ml portions in sterile plastic micro test tubes, sealed with silicon stoppers and
stored on ice until they were pressurized. The pressure chamber was heated/cooled to a
desired level prior to pressurization with a thermostat jacket connected to a water bath. A
computer program controlled the pressure level, time and temperature of pressurization. The
compression/decompression rate was 200 MPa min-1, the temperature was 20°C and the
temperature rise due to compression was 12 °C or less. Samples were placed in the pressure

Material and methods 16
chamber 5 min prior to treatment to equilibrate the sample temperature. Cells were exposed to
a pressure of 200, 300, 400 or 600 MPa for various time intervals (0-120 min). Following the
release of pressure the samples were stored on ice for determination of viable counts and
membrane integrity. For each HP inactivation kinetics, untreated cultures and cultures
sterilized by treatment with 800 MPa for 10 min or 15 min at 80°C were used for preparation
of “calibration samples” containing 100, 50, 25, 12.5, 6.25, 3.125 and 0% viable cells.
2.6 Methods for characterization of pressure-induced inactivation on cells
2.6.1 Enumeration of viable cells
The cell suspensions from each vial were serially diluted with saline immediately after the
pressurization treatment. Lactococcus lactis strains were surface plated on GM17 agar,
Lactobacillus plantarum TMW1.460 on MRS agar, and Lactobacillus sanfranciscensis TMW
1.53 on MRS-4 agar. The plates were incubated at 30° under anaerobic conditions, plates of
Lactococcus lactis strains were counted after 24 h, plates of Lactobacillus plantarum and
Lactobacillus sanfranciscensis after 48 h.
Selective agars were obtained with the addition of 3% NaCl to GM17 agar and 4% to MRS
agar. Data presented are mean ± standard deviation obtained from two to three independent
experiments.
2.6.2 Membrane integrity assay
1 ml pressure-treated cell suspensions were harvested by centrifugation at 6000 rcf⋅g for 10
min. The supernatant was removed and the pellet resuspended in 1 ml of phosphate buffer. A
stock solution of the LIVE/DEAD BacLight was prepared, the final concentration of each
dye was 33.4 µM SYTO 9 and 200 µM propidium iodide (PI). 100 µl of each of the bacterial
cell suspensions were mixed in 100 µl of the stock solution, mixed thoroughly and incubated
at 30°C in the dark for 5 min. The fluorescence intensities of SYTO 9 and PI were measured
with excitation and emission wavelengths of 485 and 520 nm, and 485 and 635 nm,
respectively, using a spectraflour microtiter plate reader (TECAN, Grödig, Austria). The ratio
of SYTO 9 to PI fluorescence intensity was used as measure for membrane integrity. A
calibration curve was established for each inactivation kinetics using the “calibration
samples” described above and the results are reported as % intact membranes.

Material and methods 17
2.6.3 Metabolic activity assay
The method developed by Ulmer et al. (2000) was used to determine the metabolic activity. 1
ml pressure-treated cell suspensions were harvested by centrifugation. The supernatant was
removed and the pellet resuspended in 1 ml of phosphate buffer. A stock solution of
tetrazolium was prepared mixing 4-iodonitrotetrazolium violet (INT; 2-(4-iodophenyl)-3-(-4-
nitrophenyl)-5-phenyltetrazolium chlorid) and glucose in phosphate buffer. The final
concentration of each was 4 mM and 20 mM respectively. 100 µl of each of the bacterial cell
suspensions were mixed with 100 µl of the stock solution of tetrazolium salt. The absorbance
was measured at 590 nm during 30 min with a spectraflour microtiter plate reader (TECAN,
Grödig, Austria). A calibration curve was established for each inactivation kinetics using the
“calibration samples” described above and the results are reported as % metabolic activity.
2.6.4 LmrP activity assay
The method developed by Ulmer et al. (2000) was used to determine the LmrP activity. 1 ml
pressure-treated cell suspensions were harvested by centrifugation. The supernatant was
removed and the pellet resuspended in 1 ml of phosphate buffer with 40 µM ethidium
bromide. Samples were mixed and incubated at 30°C for 2 h in the dark. After incubation,
cells were harvested, resuspended in phosphate buffer and transferred to black microtiter
plates. The fluorescence of cell suspensions was measured after addition of glucose using
excitation and emission wavelengths of 485 and 595nm, respectively. The slope of the curves
were calculated with the Software Sigma Plot, and the difference between slope of starved
cells and that of untreated energized cells was considered to indicate LmrP activity.
2.6.5 Measurement of detection time of growth
Cells were pressurized as described above during 0 or 20 min at 300 MPa and 20°C.
Untreated and pressurized cells were diluted in GM17 broth to obtain statistical probability of
one cell per well. The total volume of each well was 150 µl, and the media were overlaid with
100 µl of paraffin to achieve anoxic growth conditions and to avoid evaporation losses of
water. The growth of the organisms was monitored at 30°C by measuring the optical density
(OD) of the growth media at 590 nm with a spectraflour microtiter plate reader (TECAN,
Grödig, Austria). Measurements were taken every 30 min for 48 h with preshaking at high
intensity for 10 s prior to OD reading. The initial OD was substrated of each measurement.
Results were reported as td (h) and defined as the time required for the spectrafluormeter to
record a 0.03 increase in optical density from to.

Material and methods 18
2.7 Methods for characterization of growth under high-pressure conditions
2.7.1 Determination of maximal pressure of growth
Fresh broth were inoculated with 0.1% of cells in stationary phase and placed in
polypropylene tubes (Cryotubes; Nunc). After being sealed with parafilm, the samples were
stored on ice until the application of hydrostatic pressure. The samples were put into titanium
pressure vessels and subjected to hydrostatic pressure between 10 and 100 MPa at 30°C. The
required hydrostatic pressures were reached within 2 min using a hand pump (Teramecs,
Kyoto). The pressure was released in approximately 15 s. According to Abe and Horikoshi
(1997) the changes in temperature because of the increase and decrease of pressure were
negligible. The decrease of temperature because of decompression was about 0.5°C. Each
chamber was opened after 20 and 48 h for Lactococcus lactis MG1363 and 25 and 48 h for
Lactobacillus sanfranciscensis, the samples were stored on ice until they were required for
further analysis. A control was kept at atmospheric pressure (0.1 MPa) at 30°C.
2.7.2 Determination of growth rate under pressure
For the determination of growth rate under pressure fresh broth was inoculated with 0.1% of
cells in stationary phase and cultivated up to 48 h in the large-scale cultivation system
“DEEP-BATH” (deep-sea baro/thermophiles collecting and cultivating system). This
cultivation system has been designed to work within a 0-300°C range and up to 68 MPa, it is
suitable for continuous sampling without decompression of the culture (Canganella et al.,
1997; Moriya et al., 1995). Sample were taken at regular intervals, aseptically transferred to
sterile vials and stored on ice until further measurements were performed. From each growth
curve, the maximum growth rate µmax was obtained by fitting the OD readings to the logistic
growth curve (Gänzle et al., 1998). Sigma Plot 4.0 software was used for all curve fit
routines.
2.7.3 Measurements of optical density
The optical density (OD) of the cells was measured using a U-2000A spectrometer (Hitachi,
Japan) at 660 nm. If the OD was higher than 1.0, the samples were diluted in GM17 or MRS-
4 broths.

Material and methods 19
2.7.4 Microscopic counts of cells
Samples were diluted with saline solution and the cells were counted using a Bacteria
counting chamber (deep 0.02 mm, Erma, Tokyo) under a 3-phase-contrast microscope
(Nikon, Japan).
2.7.5 Determination of maximal and optimal temperature of growth
Fresh broth was inoculated with 0.1% of an overnight culture. 15 ml were placed in each test
tube from a bio-photorecorder (Temperature Gradient Bio-Photorecorder, Advantec, Japan)
and incubated for 24 h. The first temperature gradient was between 12 and 57°C, the second
between 25 and 45°C.
2.7.6 Indirect immunofluorescence microscopy
Immunofluorescence microscopy was performed as described by Sato et al. (2002) with the
following modifications. Cells of Lactococcus lactis in exponential phase (OD 0.6) were fixed
with 70% ethanol during 24 h at 4°C, washed and affixed to poly-L-lysine-treated slides. The
slides were air dried, treated for 7.5 min with lysozyme solution and washed with PBSTE.
The wells were pretreated with 2% (w/v) bovine serume albumin in phosphate buffered saline
prior to incubation with the primary antibodies. The slides were incubated with α-Sv FtsZ
rabbit IgG (1:3500 dilution) for 1 h, washed with PBSTE and treated with bovine serum
albumin solution, before treatment for 1 h in dark with the secondary antibodies Alexa Fluor®
488 goat anti-rabbit IgG (1:1000 dilution). After washing the slides with PBSTE 5µl of DAPI
stock solution (1mg/ml) was added to each well.
2.8 Method for measurement of internal pH
2.8.1 Labeling of cells with cFSE for pHin determination
The fluorescence method developed by Breeuwer et al. (1996) was adapted to Lactococcus
lactis ssp. cremoris MG1363 and Lactobacillus plantarum. Harvested cells were washed and
resuspended in 50mM HEPES buffer, pH 8.0. Subsequently, the cells were incubated for 15
min at 30°C in the presence of 10.0µM cFDASE, washed, and resuspended in 50mM
potassium phosphate buffer, pH 7.0. To eliminate nonconjugated cFSE, glucose (final
concentration 10mM) was added and the cells were incubated for an additional 30 min at
30°C. The cells were then washed twice, resuspended in corresponding milk buffer and
placed on ice until required.

Material and methods 20
2.8.2 Offline measurement of pHin at ambient pressure
Stained cells were pipeted in a 2ml cuvette (Sarstedt, Nümbrecht, Germany) and placed in the
cuvette holder of a spectofluorometer (Perkin-Elmer Luminescence Spectometer LS-50B,
Überlingen, Germany). Fluorescence intensities were measured at excitation wavelengths of
485 and 410nm by rapidly alternating the monochromator between both wavelengths. The
emission wavelength was 520, and the excitation and emission slit widths were 5 and 4nm,
respectively. The 485-to-410-nm ratios were corrected for the background of the buffer. The
incubation temperature was 30°C. Calibration curves were determined in buffers with pH
values ranging from 4.0 to 8.0. Buffers were prepared from citric acid pH 4.0 and 5.0
(50mM), MES pH 5.5, 6.0 and 6.5 (50mM) and HEPES pH 7.0, 7.5 and 8.0 (50mM). The pH
was adjusted with either NaOH or HCl. The pHin and pHout were equilibrated by addition of
valinomycin (1µM) and nigericin (1µM), and the ratios were determined as described
previously. Calibration curves were established for experiments performed on a single day.
2.8.3 In-situ measurement of pHin
Fluorescence measurements under hydrostatic pressures were performed in a pressure
chamber equipped with a cylindrical sapphire window (10 x 8mm). 2ml stained cells were
placed in the pressure chamber and energized with 10mM glucose. The lid was closed and
connected with an optical fiber to a spectofluorometer (Perkin-Elmer Luminescence
Spectometer LS-50B, Überlingen, Germany). Fluorescence intensities were measured at
excitation wavelengths of 485 and 410nm by rapidly alternating the monochromator between
both wavelengths. The emission wavelength was 520, and the excitation and emission slit
widths were 15nm to compensate the loss of fluorescence intensity caused by the optical
fiber. The incubation temperature was 20°C, 5 min were allowed prior to high-pressure
treatment to equilibrate the temperature.
Calibration curves were determined in buffers with pH values ranging from 4.0 to 8.0. Buffers
were prepared from milk buffer pH 4.0, 5.0 and 6.0, and 50 mM HEPES buffer at pH 7.0 and
8.0. The pH was adjusted with either NaOH or HCl for HEPES buffers and with KOH for the
milk buffers. The pHin and pHout were equilibrated by addition of valinomycin (1µM) and
nigericin (1µM), and the fluorescence was determined as described above. Since the signal to
noise ratio during measurements in the pressure chamber decreased compared to the
measurement in cuvette, the fluorescence intensities were measured over a period of 5 min at
either 0.1, 200, or 300 MPa, and the means were calculated for each buffer. A calibration
curve was established for each culture stained and pressure treated on a single day.

Material and methods 21
2.8.4 Reversibility test
After the pressure treatment at pH 6.5, 1ml of the samples was placed in a cuvette and the
fluorescence intensities were determined as described above. After 3 min of equilibration,
glucose was added to a final concentration of 10mM and the changes in internal pH were
monitored over up to 30 min.
2.8.5 Computation of the pH-values during pressure treatment
The measurements of the pressure-induced changes of pH in buffers used in this work were
carried out by Volker Stippl at the Technische Universität München, Lehrstuhl für
Fluidmechanik und Prozessautomation.
Various approaches have been proposed to calculate changes in pKa values of water and weak
acids (Lown et al., 1970; Owen and Brinkley, 1941). The pKa values were calculated using
the following relation described by Hamman and El'yanov (1975):
equation 1
where the superscript 0 denotes the value at atmospheric pressure, ∆Vm is the molar volume
change between the associated and dissociated forms of the buffering acid in solution, R is the
universal gas constant (8,3145 J/K mol), T the absolute temperature and b an universal
constant (9.2 Pa-1). Hamman and El'yanov (1975) showed that this equation fits very well to
experimental data obtained with various buffers and pressures of up to 120 MPa. This
equation was found empirically, is in good agreement to the electrostatic theory of Born for
the interactions between ions in solutions (Born, 1920).
The application of equation 1 to mixtures of buffer salts exploits the balance of H3O+ ions.
The pH value at ambient pressure, e.g. measured with a pH glass electrode must be known.
Furthermore, the pKw, pKa and ∆V values at ambient pressure for all reactions must be
available from literature data. It is sufficient to know the sum of the concentrations c° at
ambient pressure of all components from one species e.g. 0PO
0HPO
0POH
0POH 3
4244243 −−− +++ cccc to
calculate the concentration of all components upon pressure shift with the law of mass action.
Equation 1 can be used to calculate the pKw and pKa values at high-pressure. For a starting
pHi (subscript i for iteration) the concentration of all components are calculated based on the
law of mass action. Based on the change of these concentrations, the number of H3O+ ions
)1(303,2
00
bpRTpV
pKpK m
aa +∆
+=

Material and methods 22
i
formed or consumed by a reaction is calculated. Equation 2 shows an example for calculation
of ∆H3O+ for phosphoric acid and its salts:
−−
−−
−⋅−⋅
−+⋅+⋅=∆ +
244243
244243)4(PO
HPOPOHPOH
0HPO
0POH
0POH3
23
23OH
ccc
ccc equation 2
where c° and c denote the concentrations at ambient and high-pressure of the subscripted
component, respectively. Water is treated like an acid (equation 3).
0OHOH3 O)2(HOH −− −=∆ + cc equation 3
The iteration has converged, if the predicted sum of H3O+ formed by individual dissociation
reactions is equal to the predicted change of pH (in equation 3 and fig. 1 shorted with
∆H3O+pH)
∑ ∆H3Oi+-(10-pH-10-pH0) = 0
= ∆H3O+pH equation 4
If the difference in equation 3 (with pHi instead of pH) is lower than 0 one has to start the
calculation with a smaller value of pHi, and vice versa.
2.9 Methods for measurement of membrane phase state
2.9.1 Determination of temperature-dependent phase state of the membrane by FT-IR
spectroscopy
Lipid phase transitions were measured by Fourier transform infrared (FT-IR) spectroscopy
following methods described previously (Leslie et al., 1995; Ulmer et al., 2002). 2 ml cell
suspension were harvested by centrifugation (3 min at 10000 rcf·g), washed twice and
incubated 30 min in milk buffer, milk buffer with 0.5 M sucrose or milk buffer with 4 M
NaCl. After incubation, the cells were harvested and the pellets were poured into a 20 µm
thick infrared cell with CaF2 windows. The FT-IR spectra were recorded with an Equinox 55
spectrometer (Bruker, Ettlingen, Germany) equipped with a liquid-nitrogen-cooled MCT
(HgCdTe) detector. Twenty scans were averaged at each temperature point. Spectra were
taken every 2°C between 0 and 30°C, and every 5°C between 30 and 40°C. The infrared cell
was controlled by an external water thermostat.

Material and methods 23
2.9.2 Determination of the temperature and pressure-dependent phase state of the
membrane by fluorescence spectroscopy
To study the polarity of the lipid interface and to detect phase changes of the lipid bilayer
membrane Laurdan fluorescence spectroscopy was used. Laurdan (6-dodecanoyl-2-
dimethylaminonaphtalene) (Molecular Probes, Eugene, USA) is an amphiphilic fluorescence
probe, which allows the determination of gel-to-fluid phase transitions in biological
membranes (Parasassi et al., 1990, 1991, 1995, 1998). The cells of an overnight culture were
harvested by centrifugation (15 min at 5500 rcf⋅g), washed twice and resuspended in milk
buffer or milk buffer with additives. The cell suspensions were diluted to an optical density of
1 (OD590). Laurdan stock solution in ethanol (2 mmol liter-1) was added to the cell suspension
to obtain an effective staining concentration of 40 µmol liter-1. The cells were stained for 30
min at 30°C in the dark. After the incubation the cells were washed twice, resuspended in
corresponding milk buffer and placed on ice until required.
For the determination of the temperature-dependent phase state of the membrane, stained cells
were pipeted in a 2ml cuvette (Sarstedt, Nümbrecht, Germany) and placed in the cuvette
holder of a spectofluorometer (Perkin-Elmer Luminescence Spectometer LS-50B, Überlingen,
Germany). The excitation wavelength was 360 nm, and emission spectra were collected from
380 to 550 nm with steps of 1nm. The steady-state fluorescence parameter known as
generalized polarization (GP) was calculated as follows:
GP = (I440nm-I490nm)/ (I440nm+I490nm)
where I is the relative fluorescence intensity at the respective wavelengths (Parasassi et al.,
1990). The temperature was controlled by a circulation water bath. Spectra were taken every
10°C between 10 and 40°C. For the high-pressure fluorescence studies the pressure chamber
described above, equipped with a cylindrical sapphire window (10 x 8mm) was used. The
pressure steps were 50 MPa with a ramp of 200 MPa min-1. The time left for equilibration
after each pressure step was 3 min. Data presented are mean ± standard deviation obtained
from two to three independent experiments.
2.10 Determination of accumulated osmolytes after hyper-osmotic shock
2.10.1 Cell extract
Cells in the stationary phase (109 cfu⋅ml-1) were harvested (3 min at 9000 rcf·g) after
incubation for 30 min in milk buffer or milk buffer with additives. Cell pellets were

Material and methods 24
resuspended in SDS-Puffer (100 mM Tris/HCl pH 9.5, 1% SDS (w/v)). Cell lysis was
performed with ultrasonification (Bandelin Sonoplus), 3 x 1 min, 30% cycle and 100% power.
After centrifugation at 14.000 rcf·g for 30 min at 4°C, the total supernatant fraction was
recovered for analysis.
2.10.2 Determination of accumulated osmolytes by HPLC analysis of cell extracts
The method developed by Clarke et al. (1999) was used for the detection of sugars and amino
acids in cell extracts of Lactococcus lactis. All experiments were performed using a high-
pressure liquid chromatograph from Gynkotek. The system consisted of a gradient pump
model 480, a Gina 50 autosampler, a column thermostat and an ED40 electrochemical
detector containing a gold working electrode and a pH reference electrode. Norleucin was
used as internal standard.

Results
25
3. Results
3.1 Growth under high-pressure conditions
Many surface-dwelling bacteria are able to grow, albeit slowly, at pressures of up to 60 MPa.
Above that pressure, however, growth will cease as a result of the complete inhibition of
protein synthesis and the occurrence of abnormal phenomena, such as the formation of
filaments and the disorganization of the cytoplasm (Mozhaev et al., 1994; Sato et al., 2002).
The potential use of high-pressure in biotechnological processes depends on the elucidation of
the mechanisms of high-pressure adaptation of microorganisms. Therefore, the effect of
pressure on mesophilic bacteria used in food biotechnology, i.e. Lactococcus lactis and
Lactobacillus sanfranciscensis at the level of growth rate, cell morphology and cellular
organization was investigated. Pressures between 0.1 and 100 MPa were used to determine
the pressure upper limit of growth of Lactococcus lactis and Lactobacillus sanfranciscensis
cells. Figure 3.1 shows the results for Lactococcus lactis after 20 and 48 h of incubation at
different pressure levels. The cell densities were reduced according to the increase of
pressure. At 50 MPa the cell density was just 2.3% of the control at atmospheric pressure. 60
to 100 MPa caused a 2-3 log cycle reduction of CFU. After 48 h the cells incubated between
0.1 and 40 MPa already went in the lysis phase, an increase of the CFU at 50 MPa comparing
to the CFU after 20 h was observed. 60-100 MPa reduced the CFU by 3-5 log cycles.
Lactobacillus sanfranciscensis was more piezosensitive than Lactococcus lactis, this strain
did not grow at 50 MPa (Fig. 3.1). 10 MPa had no significant effect on the CFU, 30 and 40
MPa showed a strong inhibitory effect on the growth after 25 h of incubation. 50 to 100 MPa
inhibited the growth, but did not inactivate the inoculation cells. Cells grown at 0.1 MPa went
into the lysis phase after 48 h of incubation, whereas cells grown between 10 and 40 MPa
showed an increase of the CFU. At 40 MPa, the generation time was about 24 h and the final
density after 48 h was 1% of the culture at ambient pressure. 50 MPa inhibited the growth, but
did not inactive the cells, 60 to 100 MPa caused a 1 log cycle reduction of CFU.

Results
26
pressure in MPa0 20 40 60 80 100
CFU
100
101
102
103
104
105
106
107
108
109
100
101
102
103
104
105
106
107
108
109A
B
Fig. 3.1 Effect of pressure on growth and survival of Lactococcus lactis MG1363 (A) after 20 ( ) and 48 h ( ) and Lactobacillus sanfranciscensis (B) after 25 ( ) and 48 h ( ). Corresponding results were achieved by counts and optical density measurements.
3.1.1 Effect of temperature and pressure on growth rate
The specific growth rate profiles of deep-sea bacteria have indicated that they exhibit optimal
high-pressure growth near their upper temperature limit for growth (Kato et al., 1997, 2000).
Therefore, the effect of increasing the temperature of growth under high-pressure conditions
for Lactococcus lactis and Lactobacillus sanfranciscensis was determined.
The optimal and maximal temperature of growth for Lactococcus lactis was determined using
a bio-photorecorder (Temperature Gradient Bio-Photorecorder, Advantec, Japan). The results
are shown in Fig. 3.2, an optimal range was observed between 30 and 33°C with a growth rate
of 1.7 1/h. Temperatures above the optimal range showed to have stronger inhibitory effect on
the growth rate than sub-optimal temperatures.

Results
27
temperature in °C
0 10 20 30 40 50 60
grow
th ra
te in
1/h
r
0,0
0,5
1,0
1,5
2,0
Fig. 3.2 Effect of temperature on the growth rate of Lactococcus lactis MG1363.
The effects of pressure and temperature on the growth rate are shown in Fig. 3.3. The
experiments were performed in the “DEEP-BATH”. The temperature error was ± 1°C. The
growth rate at 0.1 MPa and 30°C was 1.7 1/h and agreed with the result obtained by bio-
photorecorder. The growth rate was reduced with an increase of pressure. 50 MPa was the
upper limit of pressure for growth, the growth rate was 14% of that one at optimal conditions.
The growth rate at 40°C and 0.1 MPa was higher than expected according to our results with
the bio-photorecorder. This can be explained because the anaerobic conditions in the “DEEP-
BATH” System were more favourable for the bacteria than the continuous aeration produced
by shaking in the bio-photorecorder. A rapid reduction of the growth rate was observed with
the raise of pressure, at 50 MPa the cell growth was inhibited.
Further experiments were performed at 35°C to determine the inhibitory effect under high-
pressure conditions caused by a temperature between the optimal range and the upper limit.
The growth rate at 0.1 MPa was 1.39 1/h approaching the value obtained by the bio-
photorecorder. At 50 MPa the cells were still able to growth, but the growth rate was lower
than the rate at 30°C. A raise of the temperature did not increase the piezotolerance of
Lactococcus lactis.

Results
28
pressure in MPa
0 10 20 30 40 50 60 70
grow
th ra
te in
1/h
r
0,0
0,5
1,0
1,5
2,0
Fig. 3.3 Effect of pressure and temperature on the growth rate of Lactococcus lactis MG1363. (●) Growth rate at 30°C, (○) at 35°C and (▼) at 40°C.
The growth rate of Lactobacillus sanfranciscensis at 30°C is shown in Fig. 3.4. The growth
rate at 30°C and 0.1 MPa was 0.66 1/h and was reduced proportional to the increase of the
pressure. Since the strain Lactobacillus sanfranciscensis grows in anaerobic conditions, it was
not possible to determine the upper limit growth temperature with the bio-photorecorder,
which works under continuous shaking. According to Gänzle et al. (1998) we chose 38°C as
upper limit temperature.
The results of the “DEEP-BATH” System did not show any apparent growth or inactivation at
0.1 MPa and 38°C after 48 h. 30 MPa caused a reduction of 1 log cycle after 24 h of
incubation. The effect on the growth rate at atmospheric pressure of a temperature between
the upper limit and the optimal was determined. The growth rates at 35 and 37°C were 85 and
58% of the growth at 30°C, respectively. As in the case of Lactococcus lactis increasing the
temperature of growth of Lactobacillus sanfranciscensis did not increase its piezotolerance.

Results
29
pressure in MPa
0 10 20 30 40 50
grow
th ra
te in
1/h
r
0,0
0,1
0,2
0,3
0,4
0,5
0,6
0,7
Fig. 3.4 Effect of pressure and temperature on the growth rate of Lactobacillus sanfranciscensis TMW1.53. (●) Growth rate at 30°C, (○) at 35°C and (▼) at 37°C. 3.1.2 Morphologic changes and immunofluorescence microscopy
Pressure induced changes in morphology of Escherichia coli cells have been observed by Sato
et al. (2002). Therefore, cells of Lactococcus lactis and Lactobacillus sanfranciscensis grown
between 0.1 and 100 MPa were observed with a 3-phase-contrast microscope. Additional
observations were made after staining cells of Lactococcus lactis with FtsZ antibodies and
DAPI by fluorescence microscopy.
Fig. 3.5A-C show cells of Lactococcus lactis grown at 0.1, 30 and 50 MPa. Under normal
growth conditions Lactococcus lactis cells are present in form of diplococci and form chains
in response to stress conditions such as insufficient energy sources. Our experiments showed
that an increase of growth pressure also produced a chain formation. The size and incidence
of the chains depended on the level of pressure. At 10 and 20 MPa 3-4 cells chains were
observed, but the diplococcal appearance was predominant. At 30 MPa approximately 50% of
the cells were in chains, these chains were formed with 4-6 cells. In addition a deformation of
cell morphology was observed, the cells adopted a slight rod shape form (Fig. 3.5B).
Cells grown at 40-50 MPa were mainly in chains, the length varied from 3 to 14 cells, the
exact count of the cells was difficult to determine because there was no clear septum between
cells. A change in the cell morphology was noticed, they lost their spherical shape adopting a
rod shape in the direction of the chain length. The presence of oversized cells was apparent

Results
30
(Fig. 3.5C). At 60 MPa and higher pressures the cells did not grow, therefore they did not
present noticeable morphological changes.
A
B
C
Fig. 3.5 3-phase-contrast microscopic images of Lactococcus lactis MG1363 grown at 0.1 MPa (A), 30 MPa (B) and 50 MPa (C).

Results
31
Chain formation and changes in the cell morphology were also observed at temperatures of
growth above the optimal range. The combination of higher pressure and temperature
enhanced the changes of cell morphology.
Lactobacillus sanfranciscensis cells under normal conditions of growth have a short rod-
shaped form. Cells grown at 10 MPa did not show any change of morphology. At 20 MPa the
morphology of the cells did not change after 25 h of incubation, but after 48 h the cells were
elongated. At 30 and 40 MPa elongated cells and nodal formation were apparent. Comparable
morphological changes were observed during growth at temperatures above the optimum
(data not shown).
Fig. 3.6 to 3.8 show microscopic immunofluorescence and DAPI-staining images of
Lactococcus lactis cells grown at 0.1, 20 and 50 MPa in the exponential phase. The method
used for the immunofluorescence microscopy (IFM) was developed for the gram-negative
bacterium Escherichia coli, thus the following modifications were realised.
According to the National Center for Biotechnology Information (NCBI) and the Japanese
Genetic Center (DDBJ), Lactococcus lactis FtsZ (Y15422) shares approximately 40% DNA-
identity and 30% protein-identity with Escherichia coli FtsZ (X55034), and 57.5% DNA-
identity and 48% protein-identity with Shewanella violacea FtsZ (AB052554). A Western
blotting analysis was performed to verify the immunoreaction and to select the antibodies
(data not shown). Lactococcus lactis FtsZ reacted positive to FtsZ antibodies of Escherichia
coli and stronger to the antibodies of the piezophilic bacterium Shewanella violacea DSS12.
Therefore, the antibodies of Shewanella violacea DSS12 were used for the IFM.
Cells in exponential phase grown at 0.1 MPa were harvested, washed and resuspended either
in saline solution (0.85% NaCl) or in PBSTE and fixed 24 h at 4°C with 80% methanol or
70% ethanol. The fixation with methanol damaged the cells impairing the formation of pellets
after fixation. Both treatments with ethanol were effective for cell fixation, but superior
imagines were obtained with ethanol/PBSTE. Fixation of cells grown at 20 and 50 MPa were
made with 70% ethanol and PBSTE during 24 h at 4°C.
The target of the lysozyme treatment is the permeabilization of the cell membrane to the
antibodies. To determine the optimal duration of treatment, cells were exposed to the
lysozyme solution during 0, 1.5, 3, 5 and 7.5 min. The best permeabilization was obtained
after 7.5 min of treatment, and a slight cell shape deformation was also observed. This
elongation did not interfere with the observation of high-pressure induced changes.
The morphological changes observed with a 3-phase-contrast microscope were confirmed.
Diplococci were the prevalent form in cells grown at 0.1 and 20 MPa, filament were present

Results
32
at 50 MPa. Chains of 4 cells were also observed at 20 MPa. Oversized cells were present at
both high-pressure conditions.
DAPI staining did not show differences between growth conditions. Cells grown at high-
pressure were stained and showed separated nucleoids, even though they formed chains and
cell division was not apparent by light microscopy. The blue fluorescence of DAPI upon
binding to AT regions of DNA indicated that the chromosomal DNA segregation and
condensation was independent of the changes in morphology.
IFM exhibited relevant differences between Lactococcus lactis FtsZ at atmospheric and high-
pressure conditions. Whenever all samples were in the exponential phase (OD600 0.6), the
presence of FtsZ rings was noticeable just in cells grown at 0.1 MPa. FtsZ rings are shown in
Fig. 3.6C. At 20 MPa FtsZ rings were not observed. A reduced number of FtsZ rings was
observed in slide areas where the cell density was high (Fig. 3.9).
To emphasise differences between cells grown at 0.1 and 50 MPa, Fig. 3.10 shows selected
cells observed with light microscopy, DAPI staining and IFM. Fig. 3.10B and C show cells
before and during cell division at 0.1 MPa. During division the segregation and condensation
of DNA indicated by separated nucleoids is accompanied with the presence of FtsZ ring
between cells. Whereas in cells prior division the intensity of DAPI fluorescence increases
because of DNA replication, the nucleoids are not clearly divided and no FtsZ ring was
observed. Fig. 3.10D-F show cells grown at 50 MPa, the division between cells is difficult to
determine with light microscopy, but DAPI staining indicates the presence of several
nucleoids in one chain corresponding to duplication, segregation and condensation of DNA.
However, FtsZ rings were not observed between cells.

Results
33
A
B
C
Fig. 3.6 Light contrast microscopic image of Lactococcus lactis MG1363 grown at 0.1 MPa (A), cells stained with DAPI (B) and immunofluorescence microscopy with Sv FtsZ antibodies (C).

Results
34
A
B
C
Fig. 3.7 Light contrast microscopic image of Lactococcus lactis MG1363 grown at 20 MPa (A), cells stained with DAPI (B) and immunofluorescence microscopy with Sv FtsZ antibodies (C).

Results
35
A
B
C
Fig. 3.8 Light contrast microscopic image of Lactococcus lactis MG1363 grown at 50 MPa (A), cells stained with DAPI (B) and immunofluorescence microscopy with Sv FtsZ antibodies (C).

Results
36
A
B
C Fig. 3.9 Presence of FtsZ rings in cells grown at 50 MPa. A: light contrast microscopic image. B: DAPI staining. C: immunofluorescence microscopy with Sv FtsZ antibodies.
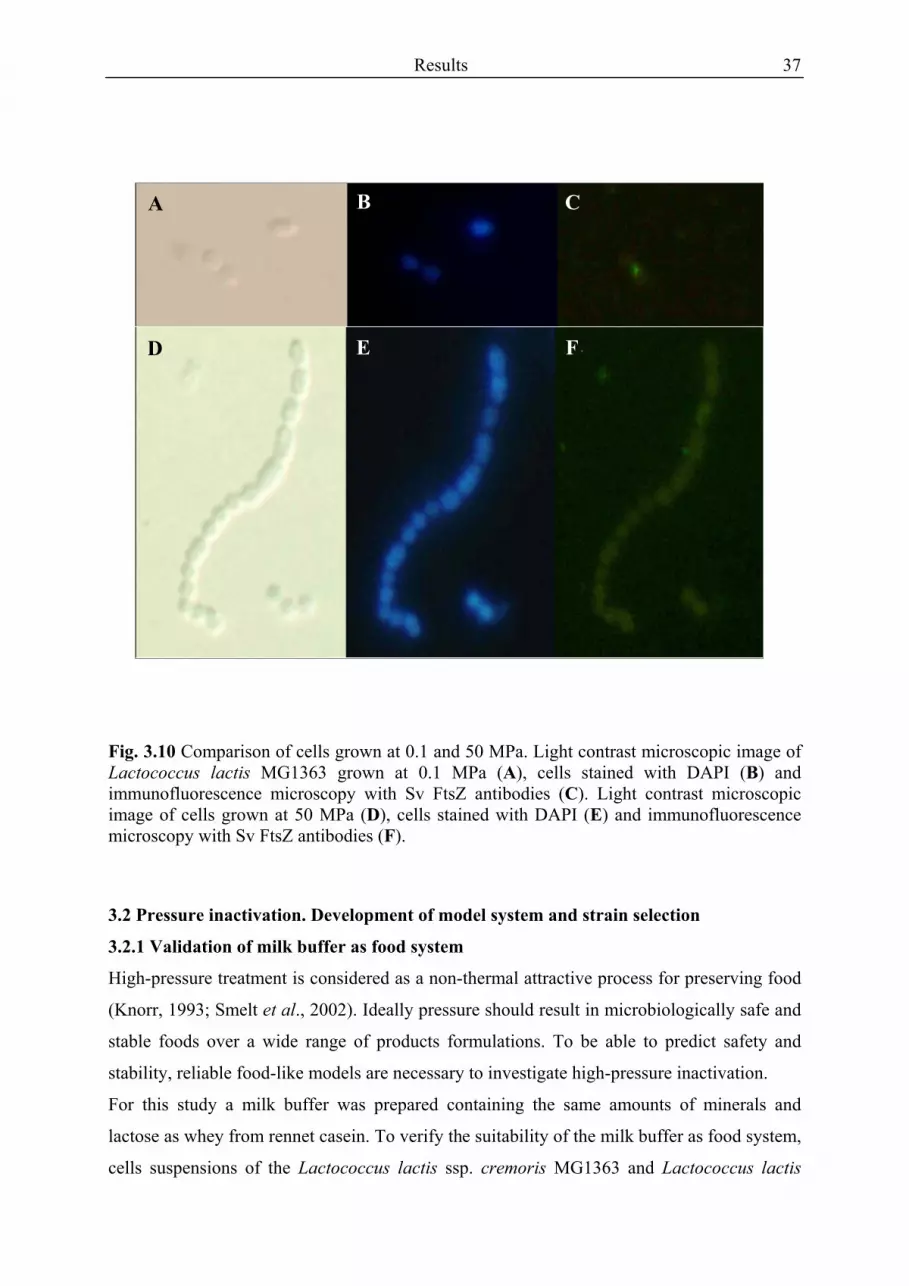
Results
37
Fig. 3.10 Comparison of cells grown at 0.1 and 50 MPa. Light contrast microscopic image of Lactococcus lactis MG1363 grown at 0.1 MPa (A), cells stained with DAPI (B) and immunofluorescence microscopy with Sv FtsZ antibodies (C). Light contrast microscopic image of cells grown at 50 MPa (D), cells stained with DAPI (E) and immunofluorescence microscopy with Sv FtsZ antibodies (F).
3.2 Pressure inactivation. Development of model system and strain selection
3.2.1 Validation of milk buffer as food system
High-pressure treatment is considered as a non-thermal attractive process for preserving food
(Knorr, 1993; Smelt et al., 2002). Ideally pressure should result in microbiologically safe and
stable foods over a wide range of products formulations. To be able to predict safety and
stability, reliable food-like models are necessary to investigate high-pressure inactivation.
For this study a milk buffer was prepared containing the same amounts of minerals and
lactose as whey from rennet casein. To verify the suitability of the milk buffer as food system,
cells suspensions of the Lactococcus lactis ssp. cremoris MG1363 and Lactococcus lactis
FD E
B A C

Results
38
subsp. lactis TMW 2.118 were exposed to a treatment at 300 MPa for different times intervals
at 20°C in milk buffer and in milk filtrate, the results are shown in Fig. 3.11A-B. The
inactivation curves of the bacteria in both media showed sigmoid asymmetric shapes when
plotted in logarithmic scale. Within the inactivation curves two parts can be distinguished: an
initial shoulder and an inactivation phase followed by tailing (Heinz and Knorr, 1996) (Fig.
3.11A-B). The inactivation curves of both microorganisms in milk buffer and in milk
permeate did not show significant deviation, the differences were within the standard
deviation of experiments. Further experiments were realized in the chemically defined milk
buffer.
Fig. 3.11 Kinetics of inactivation of Lactococcus lactis cells in milk buffer ( ) and milk filtrate ( ) after pressure treatments at 300 MPa and 20°C. A: Treatments of Lactococcus lactis ssp. cremoris MG1363. B: Treatments of Lactococcus lactis subsp. lactis TMW 2.118.
% v
iabl
e ce
lls
10-4
10-3
10-2
10-1
100
101
102
cont
rol c
ells
A
pressure holding time (min)
0 5 10 15 20
10-4
10-3
10-2
10-1
100
101
102 B

Results
39
3.2.2 Selection of strain
The choice of test strain is of paramount importance to facilitate the comparison of studies
and to estimate the microbial behaviour outside the measured data points. In Fig. 3.12A-B the
inactivation kinetics of six strains of Lactococcus lactis are shown. The cell suspensions were
subjected to hydrostatic pressure at 300 MPa and 20°C for different time intervals (0-20 min).
The inactivation curves of all strains showed sigmoid asymmetric shapes (Fig. 3.12A-B).
However, three of the strains showed to be more resistant, Lactococcus lactis ssp. lactis TMW
2.118, Lactococcus lactis TMW 2.29, Lactococcus lactis TMW 2.27 had a shoulder phase of
5 min (Fig. 3.12A). Meanwhile, the shoulder phase of Lactococcus lactis ssp. cremoris
MG1363, Lactococcus lactis TMW 2.26 and Lactococcus lactis TMW 2.28 was
approximately 3 min (Fig. 3.12B). Within 12 min all strains had a microbial reduction of 4
log cycles.

Results
40
0 5 10 15 20
10-5
10-4
10-3
10-2
10-1
100
101
102
cont
rol c
ells
pressure holding time (min)
% v
iabl
e ce
lls 10-5
10-4
10-3
10-2
10-1
100
101
102 A
B
Fig. 3.12 Comparison of inactivation kinetics of Lactococcus lactis species at 300 MPa and 20°C. A: Lactococcus lactis TMW 2.27 ( ), Lactococcus lactis TMW 2.29 ( ), Lactococcus lactis ssp. lactis TMW 2.118 ( ). B: Lactococcus lactis TMW 2.26 ( ), Lactococcus lactis TMW 2.28 ( ), Lactococcus lactis ssp. cremoris MG1363 ( ). The results show the mean ± standard deviation of 2 or more independent experiments. The pressure resistance of the strains showed to correlate to their ability to utilise lactose, the
more resistant strains are lactose positive. The ability to ferment lactose is encoded in the
plasmid pLP712 (Gasson, 1983). The effect of this plasmid on the barotolerance of
Lactococcus lactis was studied through inactivation kinetics of Lactococcus lactis NCDO712
and Lactococcus lactis MG1363, plasmid-cured strain of NCDO 712. As shown in Fig. 3.13
no significant difference was observed between inactivation kinetics.

Results
41
This strain of Lactococcus lactis ssp. cremoris MG1363 has been subject of several genetical
and physiological studies (Bolhuis et al, 1994, 1995, 1996; Buist et al., 1995; Le Bourgeois et
al., 1995; Kilstrup et al., 1997), thus further experiments were performed with this strain as
model microorganism.
pressure holding time (min)
0 10 20 30 40 50 60
% v
iabl
e ce
lls
10-4
10-3
10-2
10-1
100
101
102
cont
rol c
ells
Fig. 3.13 Inactivation kinetic of Lactococcus lactis ssp. cremoris MG1363 ( ) and Lactococcus lactis ssp. cremoris NCDO 712 ( ).The results show the mean ± standard deviation of 2 or more independent experiments. 3.3 Detection time
In order to characterise the physiological heterogeneity of cultures of Lactococcus lactis prior
and after high-pressure treatment, the physiological state of individual cells was studied by
means of detection times. Untreated cells and cells after a treatment at 300 MPa during 0 and
20 min were diluted in GM17 broth and incubated 48h at 30°C in a microtiter plate. The
inoculum level approached the statistical probability of one cell per well. Fig. 3.14A-C show
the distribution of detection times of untreated cells and cells treated for 0 and 20 min; D-F
the distribution of detection times of cells cultivated after 20 min of pressure treatment (300
MPa, 20°C), and subjected to a second pressurization for 0 and 20 min. The results show a
broad distribution of detection times without normal distribution. The pairwise multiple
comparison procedure (Dunn´s Method) indicates statistically significant difference between
the distribution of untreated cells and 20 min pressurized cells, and 0 min and 20 min
pressurized cells, but there is not significant difference between untreated cells and 0 min

Results
42
pressurized cells. The median of detection time is extended by almost 2.5 h in cells treated
during 20 min.
detection time (h)
10 15 20 25 30 35
freq
uenc
y (%
)
0
5
10
15
20
detection time (h)
10 15 20 25 30 35
freq
uenc
y (%
)
0
5
10
15
20
freq
uenc
y (%
)
0
5
10
15
20
25A
B
C F
E
D
Fig. 3.14 Distribution of detection times of control and pressurized cells of Lactococcus lactis grown at 30°C in GM17 broth. A: untreated cells; B: 0 min treated cells at 300 MPa and 20°C; C: 20 min treated cells at 300 MPa at 20°C. D-F experiments were performed with an outgrowth of surviving L. lactis populations after a treatment for 20 min at 300 MPa and 20°C; D: untreated cells; E: 0 min treated cells at 300 MPa and 20°C; F: 20 min treated cells at 300 MPa at 20°C.
High-pressure inactivation kinetics are in many cases characterised by tailing, representing a
more barotolerant fraction of the initial population. To determine the reversibility of this
phenotypical baroresistance an incubation between pressure cycles was allowed. Fig. 3.15
shows inactivation kinetics of two pressure profiles at 300 MPa and 20°C. In profile C the
pressure was hold without interruption up to 120 min. The results indicated that the extension
of holding time from 5 to 120 min inactived just 1 cycle log indicating a prolonged tailing

Results
43
effect. Between 104 and 105 cells were pressure-resistant. In profile B the pressure-resistant
fraction obtained after 30 min of pressure treatment at 300 MPa and 20°C was allowed to
recover during 30 min in GM17 broth at 30°C and 0.1 MPa. After this incubation time the
cells were pressurized during 0, 45 and 90 min at 300 MPa and 20°C. The results showed an
extensive inactivation by the second pressure treatment pointing to a loss of the pressure
resistance of the cells.
% v
iabl
e ce
lls
10-6
10-5
10-4
10-3
10-2
10-1
100
101
102
2D Graph 4
process holding time (min)
0 20 40 60 80 100 120 140 160
0
300
pres
sure
in M
Pa
0
300
A
B
C
profile Ccontinuos process
profile Bcycle process
cycle process
continuos process
Fig. 3.15 Comparison of two pressure profiles to inactive Lactococcus lactis at 300 MPa and 20°C. A: inactivation kinetics; B: two-cycle treatment with 30 min incubation at 0.1 MPa in GM17 broth to recover; C: continuous treatment with holding time from 0 to 120 min. The results show the mean ± standard deviation of 2 or more independent experiments. 3.4 Effect of sucrose and sodium chloride on the survival and metabolic activity of
Lactococcus lactis under high-pressure conditions
3.4.1 Inactivation of Lactococcus lactis cells in milk buffer at different pressure levels
Besides the type of microorganism the extent of pressure inactivation depends on several
factors, such as pressure level, process temperature and time, and composition of the

Results
44
dispersion medium (Cheftel, 1995). To verify the effect of pressure level and time
suspensions of Lactococcus lactis ssp. cremoris MG1363 were exposed to 200, 300, 400 and
600 MPa at 20°C for different time intervals (Fig. 3.16). Pressure treatment at 200 MPa upon
60 min did not affect the viability of Lactococcus lactis. The inactivation curves of the
bacteria at 300, 400 and 600 MPa showed the typical sigmoid asymmetric shape. The
shoulder of the inactivation curves was reduced with the increase of the pressure but the level
of survivors after 60 min was the same for all pressure treatments.
cont
rol c
ells
pressure holding time (min)
0 10 20 30 40 50 60
% v
iabl
e ce
lls
10-4
10-3
10-2
10-1
100
101
102
Fig. 3.16 Effect of pressure on inactivation of Lactococcus lactis ssp. cremoris MG1363 in milk buffer at 20 °C. 200 MPa ( ), 300 MPa ( ), 400 MPa (▲), (◊) 600 MPa. The results show the mean ± standard deviation of 2 or more independent experiments. 3.4.2 Metabolic activity and membrane integrity after high-pressure treatments
The cells from the treatments at 200 and 300 MPa were analysed to determine their metabolic
activity and membrane integrity (Fig. 3.17A-B). After a treatment for 5 min at 300 MPa the
metabolic activity is 10-12% of the activity of untreated microorganisms, and after 12 min of
treatment the cells did not show any metabolic activity. Treatments at 200 MPa up to 60 min
did not inactivate the microorganisms, but reduced their metabolic activity to 50%. This
reduction occurred in the first 20 min of treatment (Fig. 3.17A). During treatment at 300 MPa,
cell death was closely followed by the loss of metabolic activity, however cultures retained
about 25% of the metabolic activity, even after a 3 log reduction in cell counts (Fig. 3.17B).

Results
45
The cytoplasmic membrane of Lactococcus lactis remained impermeable to PI even after cell
death. Treatment at 200 MPa did not result in a reduction of membrane integrity after 20 min
and cultures retained 30% of membrane integrity after 20 min at 300 MPa, corresponding to 4
log reduction of viable cell counts. These results show that the treatment of Lactococcus lactis
ssp. cremoris MG1363 with high-pressure initially affects metabolic activity and subsequently
damages membrane integrity.
pressure holding time (min)0 5 10 15 20 25
0
20
40
60
80
100
120
140
% o
f met
abol
ic a
ctiv
ity, m
embr
ane
inte
grity
and
redu
ctio
n of
via
ble
cells
0
20
40
60
80
100
120
140
cont
rol c
ells
A
B
Fig. 3.17 Effect of pressure treatment at 200 MPa (A) and 300 MPa (B) on the metabolic activity ( ), membrane integrity ( ) and viability ( ) of Lactococcus lactis ssp. cremoris MG1363. The results show the mean ± standard deviation of 2 or more independent experiments.

Results
46
3.4.3 Inactivation kinetics of Lactococcus lactis in milk buffer and milk buffer with
additives
The protective effect of a reduction of the water activity (aw) against pressure inactivation was
determined. Since Lactococcus lactis confronted with decreased aw responds differently if the
reduction was achieved with an ionic or nonionic solute, the effect of NaCl and sucrose were
compared. 1 and 1.5 mol⋅l-1 sucrose provided complete protection against cell death at either
400 or 600 MPa (Fig. 3.18B, Fig. 3.19).
No difference was observed between the baroprotective effect of 0.5 and 1 mol⋅l-1 and 0.5 and
1 mol⋅l-1 lactose at 300 MPa during 0, 15 and 30 min pressure holding time, respectively
(Tab. 3.1). Due to the low solubility of lactose further experiments were carried out with
sucrose.
A sudden increase in the concentration of salts of the environment results in the movement of
water from the cell to the outside medium, which causes turgor pressure loss, intracellular
solute concentration and cell volume changes. Such hyperosmotic conditions are detrimental
to any living cell (van der Heide and Poolman, 2000). However, the addition of high
concentration of salts showed a protective effect during high-pressure treatment. 2, 3 and 4
mol⋅l-1 NaCl protected the cells against inactivation at 300 MPa (Tab. 3.1) as well as 400 and
600 MPa (Fig. 3.18A, Fig. 3.19). A comparison of the baroprotective effect of 2 and 3 mol⋅l-1
NaCl and 2 and 3 mol⋅l-1 KCl at 300 MPa during 0, 15 and 30 min pressure holding time
showed no difference between these salts. The cytoplasmic accumulation of exogenous
glycine betaine upon an osmotic upshift restores the cellular volume and increases the
hydration of the cytoplasm of Lactococcus lactis (Obis et al., 1999). If the compatible solute
glycine betaine was added at a concentration of 2.5 mM, the baroprotective effect of 2 mol⋅l-1
NaCl was increased in treatments at 400 MPa (Fig. 3.18A).

Results
47
% v
iabl
e ce
lls 10-5
10-4
10-3
10-2
10-1
100
101
102
103
pressure holding time (min)
0 10 20 30 40 50 60
10-5
10-4
10-3
10-2
10-1
100
101
102
103
A
B
cont
rol c
ells
Fig. 3.18A Effects of NaCl in milk buffer at concentration of 1 M ( ), 2 M ( ), 2 M with 2.5 mM glycine betaine ( ), 3 M ( ), 4 M ( ) and control ( ), B. Effects of sucrose in milk buffer at concentration of 0.5 M ( ), 1 M ( ), 1.5 M ( ) and control ( ) on the pressure resistance of Lactococcus lactis ssp. cremoris MG1363 at 400 MPa (20°C). Symbols represent means ± standard deviations for 2 independent experiments.
The baroprotective effect of solutes was proportional to the increase of their concentration in
the buffer, but it is not proportional to the decrease of the aw. The buffers with NaCl showed
lower aw than the buffers with sucrose, however the protective effect from sucrose at the same
molar level was much higher (Tab. 3.1). In contrast to sucrose, even the highest NaCl
concentration failed to achieve complete protection against cell death at 600 MPa (Fig. 3.19).

Results
48
pressure holding time (min)
0 10 20 30 40 50 60
% v
iabl
e ce
lls
10-4
10-3
10-2
10-1
100
101
102
103
cont
rol c
ells
Fig. 3.19 Effect of low molecular solutes in treatment at 600 MPa (20°C). 4 M NaCl ( ), 1.5 M sucrose ( ), control ( ). Symbols represent means ± standard deviations for 2 independent experiments.
Table 3.1 Comparison of water activity and baroprotective effect of solutes in milk buffer
Solute CFU ml-1 after a treatment at 300MPa,
15 min, 20°C
aw -Value
Milk buffer 2.0 x 10⁴ 0.9960
NaCl
1 mol 5.6 x 10⁴ 0.9659
2 mol 1.0 x 10⁷ 0.9408
3 mol 1.7 x 10⁸ 0.9167
4 mol 2.5 x 10⁸ 0.8954
Sucrose
0.5 mol 1.6 x 10⁸ 0.9849
1 mol 4.8 x 10⁸ 0.9760
1.5 mol 2.7 x 10⁸ 0.9663

Results
49
3.4.4 Effect of low molecular solutes on metabolic activity and membrane integrity
The cells from the treatments at 300 MPa with 4 mol⋅l-1 NaCl and 1.5 mol⋅l-1 sucrose were
analysed to determine the effect of the solutes on the metabolic activity and membrane
integrity. The results with sucrose showed a protective effect on the metabolic activity and
membrane integrity, which decreased to 90 and 50%, respectively within 60 min of pressure
holding time (Fig. 3.20A). NaCl protected the membrane integrity to the same level, but the
metabolic activity decreased rapidly (Fig. 3.20B).

Results
50
% m
etab
olic
act
ivity
, mem
bran
e in
tegr
ity a
nd re
duct
ion
of v
iabl
e ce
lls
0
20
40
60
80
100
120
0
20
40
60
80
100
120
pressure holding time (min)
0 10 20 30 40 50 600
20
40
60
80
100
120
140
160
cont
rol c
ells
A
B
C
Fig. 3.20 Effect of solutes on the metabolic activity ( ), membrane integrity ( ) and viability ( ) of Lactococcus lactis ssp. cremoris MG1363 after treatment with 300 MPa and 20 °C. A: milk buffer, B: 4 M NaCl, C:1.5 M Sucrose. Symbols represent means ± standard deviations for 2 independent experiments.

Results
51
3.5 In-situ determination of intracellular pH of Lactococcus lactis and Lactobacillus
plantarum during pressure treatment
3.5.1 Inactivation of Lactococcus lactis in milk buffer with different pH
Hydrostatic pressure may affect the intracellular pH of microorganisms by (i) enhanced
dissociation of weak organic acids and (ii) increased permeability of the cytoplasmic
membrane and inactivation of enzymes required for pH homeostasis (Cheftel, 1995; Wouters
et al., 1998; Ulmer et al., 2000, 2002). Therefore, the internal pH of Lactococcus lactis and
Lactobacillus plantarum during and after pressure treatment, and pH values ranging from pH
4.0 to 6.5 was determined using the internally conjugated fluorescent probe 5 (and 6-)-
carboxyfluorescein succinimidyl ester (cFSE) (Breeuwer et al., 1996).
The influence of cFDASE incorporation on the viability of L. lactis was determined by
comparing inactivation curves from stained and unstained cells at 300 MPa. No significant
differences in the number of viable cell counts were observed in treatments carried out with
stained or native cells (data not show). Further inactivation kinetics were performed with
stained cells.
Cell counts of L. lactis were reduced by 0%, 60 ± 40%, and 75 ± 30% upon treatment in milk
buffer (pH 6.5) at 200 MPa for 20, 40, and 60 min, respectively. The inactivation curves at
300 MPa of L. lactis in milk buffer with different pH values showed the typical sigmoid
asymmetric shapes when plotted in logarithmic scale (Fig. 3.21). The shoulder of the
inactivation curves was reduced with the decrease of the pH but the level of survivors after
120 min was the same for all pH treatments. At pH 4.0 no shoulder was observed and
inactivation occurred already after 1 min of treatment. After 8 min of pressure treatment, 2 log
inactivation were observed at pH 6.5 whereas more than 5 log inactivation were observed at
pH 4.0.
The sublethal injury of the cells is shown in Fig. 3.21B. Cell counts of untreated cells on
GM17 agar with and without 3% NaCl were not different, therefore, failure of L. lactis to
grow on GM17-NaCl plates indicates sublethal injury. The cell counts of pressure treated
cells on GM17-NaCl were generally lower than cell counts of the same samples on non
selective medium, indicating a sublethal injury prior to irreversible cell damage. This
sublethal injury was most pronounced during the exponential inactivation phase. In the
tailing, the counts on selective agar approached the counts on non-selective agar. As opposed
to pH effects on viable cell counts on non-selective medium, the pH did not affect on the cell
counts on selective agar.

Results
52
pressure holding time (min)
0 10 20 30 60 120
10-5
10-4
10-3
10-2
10-1
100
101
102
% v
iabl
e ce
lls 10-5
10-4
10-3
10-2
10-1
100
101
102
cont
rol c
ells
A
B
Fig. 3.21 Inactivation kinetics of Lactococcus lactis ssp. cremoris MG1363 (A) and sublethal injury (B) in milk buffer pH 6.5 (● ), pH 6.0 (❍ ), pH 5.0 (▼) and pH 4.0 (▼) after pressure treatments at 300MPa and 20°C. Shown is the viable cell count on GM17 (A) and GM17 with 3% NaCl compared to that of untreated cultures. The cell count of untreated cultures was 3.8 ± 0.9 x 10⁹ CFU ml-1. Symbols represent means ± standard deviations for 2 independent experiments.

Results
53
3.5.2 Inactivation of Lactobacillus plantarum in milk buffer with different pH
No significant changes in viability were observed if Lactobacillus plantarum was treated in
milk buffer (pH 6.5) at 200 MPa over 1 h (data not shown). Survival and sublethal injury of
Lactobacillus plantarum during treatment at 300 MPa at various pH values is shown in Fig.
3.22A and 3.22B, respectively. L. plantarum showed a greater resistance than L. lactis to
pressure inactivation at 300MPa, but was more sensitive to a reduction of pH. Treatment at
pH 4.0 and 5.0 showed a sharp inactivation phase, within 20 min of treatment the curves
achieved a 5 log cycles reduction followed by tailing. The slope of the inactivation phase was
smaller in treatments at pH 6.0 and 6.5. After 120 min of treatment at pH 6.0 a reduction of 5
log cycles was obtained, at pH 6.5 the reduction was 3 log cycles only. Ulmer et al. (2000)
had shown that failure of L. plantarum TMW1.460 to grow on MRS with 4% salt indicates
sublethal injury. Almost no difference was observed between selective and non-selective agar
in treatment at pH 4.0 and 5.0 indicating that cells with sublethal injury were not able to
survive. During the exponential inactivation phase a sublethal injury of 1 and 3 log cycles
could be observed at pH 6.0 and 6.5. Independent from pH the same level of tailing on
selective agar was noticed in all four treatments.

Results
54
pressure holding time (min)
0 10 20 30 60 120
10-5
10-4
10-3
10-2
10-1
100
101
102
% v
iabl
e ce
lls
10-5
10-4
10-3
10-2
10-1
100
101
102 A
B
cont
rol c
ells
Fig. 3.22 Inactivation kinetics of Lactobacillus plantarum TMW1.460 (A) and sublethal injury (B) in milk buffer pH 6.5 (● ), pH 6.0 (❍ ), pH 5.0 (▼) and pH 4.0 (▼) after pressure treatments at 300MPa and 20°C. Shown is the viable cell count on MRS (A) and MRS with 4% NaCl compared to that of untreated cultures. The cell count of untreated cultures was 1.1 ± 0.9 x 10⁹ CFU ml-1. Symbols represent means ± standard deviations for 2 independent experiments.
3.5.3 Effect of the buffer pH (pHex) on the internal pH (pHin)
The pHin of energized cells of L. lactis and L. plantarum were measured in HEPES, MES and
citrate buffer with pHex values ranging from 4.0 to 8.0 at atmospheric pressure (Fig. 3.23).
Both lactic acid bacteria decreased their pHin as a function of pHex. The observed values of
pHin of L. plantarum were slightly lower than the corresponding values of L. lactis. Both

Results
55
organisms maintained an internal pH between values of 6.3 and pH 8.0 at a buffer pH of 4.0
and 8.0, respectively. Consequently, under acidic conditions (pHex<5) the ∆pH across the cell
membrane was maintained at around 2.0, whereas it was dissipated at alkaline conditions.
extracellular pH
4 5 6 7 8
intra
cellu
lar p
H
4
5
6
7
8
Fig. 3.23 pHin of Lactococcus lactis ssp. cremoris MG1363 cells (● ) and Lactobacillus plantarum TMW1.460 cells (❍ ) in the presence of 10mM glucose at different pHex. The assays were performed at 30°C and 0.1MPa pressure. The buffers were prepared from citric acid (50mM), MES (50mM) and HEPES (50mM). The pH was adjusted with either NaOH or HCl. Symbols represent means ± standard deviations for 2 independent experiments.
3.5.4 Calibration curve for measuring pHin under high-pressure
For the determination of pH effects on internal pH values during high-pressure treatment it
must be taken into account that both temperature and pressure cause a pH shift and each
buffer exhibits a characteristic response to shifts in the p / T plane. Considering these effects,
the changes of pH in buffers induced by high-pressure were calculated and taken in to account
for the calibration of internal pH values at 200 and 300 MPa. The final values of the pH of the
various buffers under high-pressure conditions are shown in Table 3.2. The calibration curves
for measuring pHin under high-pressure conditions were obtained by addition of valionomycin
and nigericin (1µM) to cells of L. lactis or L. plantarum suspended in milk buffer with pH
4.0, 5.0, 6.0, or HEPES buffer at pH 7.0 and 8.0. The relationship between R485/410 and pHin is
non-linear. The sensitivity of the probe is greatest between pH 6.0 and 8.0. The fluorescence
ratios determined at 0.1, 200 and 300 MPa for L. 1actis and L. plantarum at the various pH
values is indicated on the y-axes of Figures 3.24 to 3.27.

Results
56
Table 3.2 Changes of buffer pH at 20°C induced by high-pressure. The values were kindly provided by Volker Stippl1
0.1MPaa) 100MPab) 200MPab) 300MPa b)
Phosphate buffer 7.00 6.58 6.22 5.92
HEPES buffer 8.00 7.92 7.86 7.80
HEPES buffer 7.00 6.92 6.86 6.80
Milk buffer 4.00 3.64 3.49
Milk buffer 5.00 4.54 4.35
Milk buffer 6.00 5.34 5.09
Milk buffer 6.50 5.79 5.52
a) reference values determined with glass electrode b) calculated values 1) TU München, Lehrstuhl für Fluidmechanik und Prozessautomation, 85350 Freising, Germany
3.5.5 Effect of high-pressure on the internal pH of Lactococcus lactis
Fluorescence traces of cFSE labelled L. lactis during pressure treatment at 300 MPa are
shown in Figure 3.24. Shown are the fluorescence ratios of (485 / 419) nm. The fluorescence
ratios of the calibration samples at pH 8.0, 7.0, 6.0, 5.0, and 4.0 at 0.1 and 300 MPa are
indicated on separate y-axes to allow the conversion to pHin values. The considerable base line
noise of the ratio data collection was mainly caused by the rapid alteration of the emission
monochromator between the two wavelengths. This mode of data collection was nevertheless
preferred over a mere intensity measurement because differences in fluorescence intensity
between individual samples / pressure ramps do not affect the fluorescence ratios.
The pHin measured at normal pressure corresponded within experimental error to those values
shown in Fig. 3.23. Pressure treatment at 300 MPa and pH values ranging from 3.5 to 5.5
resulted in a drop in the internal pH of L. lactis cells (Fig. 3.24A-D), which indicated that the
regulation of the internal pH was impaired in these cells. The pHin approached the respective
values of pHex during the first 90 seconds of treatment, corresponding to the compression of
the samples to 300MPa. Thereafter, the pHin values remained constant. To control the
reversibility of the damage, the cells from treatments at pH 6.5 were incubated with glucose
(10mM) after releasing the pressure and the pH was monitored. Cells with a pressure
treatment of more than 2 min were not able to restore the ∆pH. After 0, 1 and 2 min of
treatment the cells were able to restore a partial ∆pH, but the value was below the value of

Results
57
untreated cells. The ∆pH was restored to 63, 50 and 37 and 0% after 0, 1, 2 and 4 min of
pressure treatment, respectively.
The measurements of treatment at 200MPa are shown in Fig. 3.25. A decrease in pHin was
observed during compression of the sample. As opposed to the treatments at 300 MPa, the
∆pH was not fully dissipated after the ramp up time but only after 1 min of pressure holding
time. Thereafter, the values of pHin corresponded to the external pH. The cells were able to
restore 77, 73, 46, 44, 50 and 0% of the ∆pH after 0, 1, 4, 8, 20 and 30 min of treatment,
respectively.
Despite this fast drop of pHin during treatments at 200 or 300 MPa, a reduction of cell
viability at pH 6.5 was not observed until 4 and 40 min of pressure holding time at 300 and
200 MPa, respectively. Mild pressure treatments (200-300MPa and 0 min) sufficed to reduce
the capacity of the cells to restore a pH gradient upon pressure treatment and inflicted
sublethal injury, but failed to reduce cell viability. The pressure holding time irreversibly
inactivating cellular systems required for pH homeostasis at 200 and 300 MPa (4 and 30 min,
respectively) correlated to the pressure holding time required for a decrease in cell viability (4
and 40 min at 300 and 200 MPa, respectively).

Results
58
2.5
3.0
3.5
pH (0
.1 M
Pa)
8.0
7.0
5.04.0
pH (3
00 M
Pa)
7.8
6.8
4.43.5
2.5
3.0
3.5pH
(0.1
MPa
)
8.0
7.0
5.04.0
pH (3
00 M
Pa)
7.8
6.8
4.43.5
Time (min)
0 3 6 9 12
2.5
3.0
3.5
pH (0
.1 M
Pa)
8.0
7.0
5.04.0
pH (3
00 M
Pa)
7.8
6.8
4.43.5
A
B
C
D
Rat
io 4
85nm
/410
nm
2.5
3.0
3.5
pH (0
.1 M
Pa)
8.0
7.0
5.04.0
pH (3
00 M
Pa)
7.8
6.8
4.43.5
Fig. 3.24 Fluorescence trace of cFSE labelled Lactococcus lactis ssp. cremoris MG1363 during treatment at 300MPa and 20°C in milk buffer at pH values ranging from 4.0 to 6.5. Samples were energized with 10mM glucose and placed in the pressure chamber 5 min prior to treatment to equilibrate the sample temperature. A:pH 4.0, B: pH 5.0, C: pH 6.0, D: pH 6.5. The compression rate was 200MPa min-1, the ramp-up time 90 sec. The shaded area indicates the ramp-up time. The pH-axes to the left and right of the panels indicate the fluorescence ratios at 0.1 and 300 MPa of cells pressure treated at the respective pH values in the presence of valinomycin and nigericin to equilibrate internal and external pH values. Data are representative for two independent experiments.

Results
59
Rat
io 4
85nm
/410
nm
3.0
3.5
4.0
pH (0
.1 M
Pa)
8.0
7.06.04.0
pH (2
00 M
Pa)
7.9
6.9
4.53.6
3.0
3.5
4.0
pH (0
.1 M
Pa)
8.0
7.06.04.0
pH (2
00 M
Pa)
7.9
6.9
4.53.6
3.0
3.5
4.0
pH (0
.1 M
Pa)
8.0
7.06.04.0
pH (2
00 M
Pa)
7.9
6.9
4.53.6
Time (min)
0 3 6 9 12
3.0
3.5
4.0
pH (2
00 M
Pa)
7.9
6.9
4.53.6
pH (0
.1 M
Pa)
8.0
7.06.04.0
A
B
C
D
5.3
5.3
5.3
5.3
Fig. 3.25 Fluorescence trace of cFSE labelled Lactococcus lactis ssp. cremoris MG1363 during treatment at 200MPa and 20°C in milk buffer at pH values ranging from 4.0 to 6.5. Samples were energized with 10mM glucose and placed in the pressure chamber 5 min prior to treatment to equilibrate the sample temperature. A:pH 4.0, B: pH 5.0, C: pH 6.0, D: pH 6.5. The compression rate was 200MPa min-1, the ramp-up time 60 sec. The shaded area indicates the ramp-up time. The pH-axes to the left and right of the panels indicate the fluorescence ratios at 0.1 and 200 MPa of cells pressure treated at the respective pH values in the presence of valinomycin and nigericin to equilibrate internal and external pH values. Data are representative for two independent experiments.

Results
60
3.5.6 Effect of high-pressure on the internal pH of Lactobacillus plantarum
The internal pH values of Lactobacillus plantarum during treatments at 200 are shown in Fig.
3.26. In accordance with data shown in Fig. 3.23, values of pHin prior to compression to either
200 MPa or 300 MPa (Fig. 3.27) were about 8 at a buffer pH of 6.5 and 6.0, and about 7.5 and
7 at a buffer pH of 5.0 and 4.0, respectively. During the pressure treatment the pHin dropped
with the build-up time of pressure, the final value of pHin is reached after the 60 sec of the
ramp. The final value of pHin at pH 4.0 corresponded to the external pH. However, at a buffer
pH of 5.0, 6.0, and 6.5, the internal pH remained above the external pH throughout the
pressure treatment. This indicates that L. plantarum, as opposed to L. lactis, was able to
maintain a transmembrane proton potential even during incubation at 200 MPa. Accordingly,
the internal pH of L. plantarum treated in milk buffer, pH 6.5 at 200 MPa for 0, 1, 2 or 4 min
corresponded to the value determined with untreated, energized cells (data not shown).
The changes of L. plantarum internal pH during pressure treatment at 300 MPa are shown in
Fig. 3.27. At 300MPa, the pHin dropped concomitant with compression time to 300 MPa and
reached the value of the buffer pH within 90 sec of pressure holding time, i.e., during
treatments at various buffer pH values, the pHin was between 3.5 and 5.1. As opposed to L.
lactis, cells of Lactobacillus plantarum were not able to restore a partial ∆pH after pressure
treatments at 300 MPa. The results of the reversibility test did not show an increase of the
pHin after pressure release. Even mild treatments, 0 min at 300MPa, caused an irreversible
reduction of the internal pH.

Results
61
Time (min)
0 3 6 9 12
2.5
3.0 pH (
0.1
MPa
)
8.0
6.0; 5.04.0
pH (2
00 M
Pa)
7.9
6.9
5.3; 4.53.6
2.5
3.0 pH (
0.1
MPa
)
8.0
6.0; 5.04.0
pH (2
00 M
Pa)
7.9
6.9
5.3; 4.53.6
2.5
3.0 pH (
0.1
MPa
)
8.0
6.0; 5.04.0
pH (2
00 M
Pa)
7.9
6.9
5.3; 4.53.6
Rat
io 4
85nm
/410
nm
2.5
3.0 pH (
0.1
MPa
)
8.0
6.0; 5.04.0
pH (2
00 M
Pa)
7.9
6.9
5.3; 4.53.6
A
B
C
D
7.0
7.0
7.0
7.0
Fig. 3.26 Fluorescence trace of cFSE labelled Lactobacillus plantarum TMW1.460 during treatment at 200MPa and 20°C in milk buffer at pH values ranging from 4.0 to 6.5. Samples were energized with 10mM glucose and placed in the pressure chamber 5 min prior to treatment to equilibrate the sample temperature. A:pH 4.0, B: pH 5.0, C: pH 6.0, D: pH 6.5. The compression rate was 200MPa min-1, the ramp-up time 60 sec. The shaded area indicates the ramp-up time. The pH-axes to the left and right of the panels indicate the fluorescence ratios at 0.1 and 200 MPa of cells pressure treated at the respective pH values in the presence of valinomycin and nigericin to equilibrate internal and external pH values. Data are representative for two independent experiments.

Results
62
Time (min)
0 3 6 9 12
2.5
3.0
pH (0
.1 M
Pa)
8.07.06.0
4.0
pH (3
00 M
Pa)
6.8
5.1
3.5
2.5
3.0
pH (0
.1 M
Pa) 8.0
7.06.0
4.0
pH (3
00 M
Pa)
6.8
5.1
3.5
2.5
3.0
pH (0
.1 M
Pa) 8.0
7.06.0
4.0
pH (3
00 M
Pa)
6.8
5.1
3.5
2.5
3.0
pH (0
.1 M
Pa) 8.0
7.06.0
4.0
pH (3
00 M
Pa)
6.8
5.1
3.5
Rat
io 4
85nm
/410
nm
A
B
C
D
7.8
7.8
7.8
7.8
Fig. 3.27 Fluorescence trace of cFSE labelled Lactobacillus plantarum TMW1.460 during treatment at 300MPa and 20°C in milk buffer at pH values ranging from 4.0 to 6.5. Samples were energized with 10mM glucose and placed in the pressure chamber 5 min prior to treatment to equilibrate the sample temperature. A:pH 4.0, B: pH 5.0, C: pH 6.0, D: pH 6.5. The compression rate was 200MPa min-1, the ramp-up time 90 sec. The shaded area indicates the ramp-up time. The pH-axes to the left and right of the panels indicate the fluorescence ratios at 0.1 and 300 MPa of cells pressure treated at the respective pH values in the presence of valinomycin and nigericin to equilibrate internal and external pH values. Data are representative for two independent experiments.

Results
63
3.5.7 Effect of high-pressure on the intracellular pH of Lactococcus lactis in presence of
osmolytes
The effect of high-pressure treatment at 200 MPa on the intracellular pH (pHin) of
Lactococcus lactis in milk buffer, milk buffer with 4M NaCl and milk buffer with 0.5M
sucrose are shown in Fig. 3.28A-C.
Comparing the initial pHin of the cells, the addition of sucrose and NaCl caused a decrease of
the pHin reducing the ∆pH of the cells. The addition of glucose increased the ∆pH of cells in
milk buffer with sucrose, but not to the level of cells in milk buffer without additives. In milk
buffer with NaCl the addition of glucose did not show to have any effect.
A drop of the pHin occurred immediately within the raise of pressure reaching the final value
after 120 sec in treatments in milk buffer and milk buffer with sucrose. In treatment with 4M
NaCl the pHin reached the final value after 60 sec corresponding to the build-up time of
pressure. The end value of pHin was for all treatments about 4.5 and correlated to the pH of
buffer at 200 MPa. The dissipation of ∆pH indicated that the regulation of the pHin was
impaired in these cells.
The reversibility test of cells in milk buffer indicated that upon 20 min of treatment the cells
were able to restore a partial ∆pH. The build-up time of pressure caused a reduction of the
capacity to restore a ∆pH, the cells were able to restore just 77% of ∆pH. After 30 min of
treatments the cells were not able to restore the ∆pH. The loss of capacity to restore a ∆pH
was prevented with the addition of sucrose to milk buffer. After 120 min of treatment in milk
buffer with 0.5M sucrose the cells were still able to restore around 60% of ∆pH. The addition
of 4M NaCl dissipated the ∆pH of the cells. Untreated and pressurized cells in milk buffer
with NaCl were not able to increase the pHin after addition of glucose.

Results
64
Time (min)
0 2 4 6 8 10 12
Rat
io 4
85nm
/410
nm
2.6
2.7
2.8
2.9
3.0
3.1
3.2
3.3
3.4
3.5
pH (0
.1 M
Pa)
pH7.0
pH6.0
pH4.020
0 M
Pa
pH6.9
pH5.3pH4.5
pH3.6
Rat
io 4
85nm
/410
nm
2.7
2.8
2.9
3.0
3.1
3.2
3.3
3.4
3.5
pH (0
.1 M
Pa)
pH7.0
pH6.0pH5.0
pH4.0
200
MPapH6.9
pH5.3pH4.5
pH3.6
Rat
io 4
85nm
/410
nm
2.8
3.0
3.2
3.4
3.6
3.8
4.0
pH (0
.1 M
Pa)
pH8.0
pH7.0
pH6.0
pH4.0
200
MPa
pH7.9
pH6.9
pH4.5pH3.6
pH5.3
A
C
B
Fig. 3.28 Change in the pHin of Lactococcus lactis ssp. cremoris MG1363 during treatment at 200MPa and 20°C in milk buffer with additives. Samples were energized with 10 mM glucose and placed in the pressure chamber 5 min prior to treatment to equilibrate the sample temperature. A: milk buffer without additives, B: milk buffer with 4 M NaCl, C: milk buffer with 0.5 M sucrose. The compression rate was 200 MPa min-1, the ramp-up time 60 sec. The shaded area indicates the ramp-up time. 3.6 Investigation of mechanisms of baroprotection of sodium chloride and sucrose
3.6.1 Comparison of inactivation kinetics of Lactococcus lactis in presence of different
solutes
The addition of ionic and nonionic solutes has shown to protect Lactococcus lactis cells
against high-pressure inactivation. The results of metabolic activity, membrane damage and
internal pH showed differences in the mechanism of baroprotection. Therefore, the effects of
sucrose and NaCl were studied at the level of viability, membrane phase transition and
inactivation of the membrane-bound enzyme LmrP. Molar concentration and aw failed to give
a basis to compare the baroprotective effect of osmolytes. Further comparative experiments

Results
65
were realised using ionic and non-ionic osmolytes in approx. the same weight/volume
concentration. Inactivation kinetics of Lactococcus lactis in milk buffer, milk buffer with 0.5
mol⋅l-1 sucrose (171.15 g⋅l-1), 4 mol⋅l-1 NaCl (233.76 g⋅l-1) and 1 mol⋅l-1 (182.17 g⋅l-1)
mannitol were performed.
Treatments at 200MPa (Fig. 3.29A) did not show to be effective for the inactivation of
Lactococcus lactis. The first reduction of CFU in milk buffer was observed after 40 min of
treatment, after 120 min the reduction was 2 log cycles. The addition of 0.5 M sucrose, 4 M
NaCl and 1 M mannitol protected the cells against inactivation. For all treatments with solutes
the reduction of CFU was not significant after 120 min of treatment. The inactivation curves
of the bacteria at 300MPa in milk buffer and milk buffer with 0.5 M sucrose showed the
typical sigmoid asymmetric shape (Fig. 3.29B). In milk buffer the inactivation phase started
after 2 min of treatment. The effectivity of the treatment is reduced after 20 min reaching a
tailing. Increasing the time of pressurization to 120 min enhanced the inactivation just in 1 log
cycle. The results with sucrose showed a protective effect on the viability of Lactococcus
lactis. The shoulder of the sigmoid asymmetric shape was extended until 8 min and the
inactivation phase was retarded. After 20 min of treatment the level of survivors in milk
buffer with sucrose was 2 log cycles above the level in milk buffer without additives. An
increase of pressurization time dissipated the difference between inactivation in milk buffer
and milk buffer with sucrose. The addition of 4M NaCl showed a strong protective effect in
treatment at 300MPa. Treatments upon to 60 min did not show a significant reduction of
CFU. 120 min of treatment achieved 1 log cycle reduction of viable cells. The inactivation
curves at 600MPa are shown in Fig. 3.29C. Treatments in milk buffer showed a rapid
inactivation. The build-up time of pressure achieved a 5 log cycles inactivation. Increasing the
time of treatment to 60 min did not enhance the inactivation. Treatments in milk buffer with
0.5M sucrose also showed a rapid inactivation. However, the level of survivors after the
build-up time of pressure was 1 log cycle above the level in milk buffer. In accordance with
our previous results, an increase of the pressurization time reduced the difference between
curves. After 10 min of treatment there was not difference between levels of survivors in milk
buffer and milk buffer with sucrose. The protective effect of 4M NaCl was reduced at
600MPa. A reduction of about 1 log cycle was achieved with the build-up time of pressure.
Contradictory to the results in milk buffer and milk buffer with sucrose, the slope of the
inactivation phase was rather small. Just 0.5 log cycle further inactivation was reached after
15 min. 60 min of treatment did not reach the same level of inactivation as treatment in milk
buffer and milk buffer with sucrose.

Results
66
pressure holding time (min)
0 10 20 30 40 60 90 120
% v
iabl
e ce
lls
10-4
10-3
10-2
10-1
100
101
102
103
10-4
10-3
10-2
10-1
100
101
102
103
10-4
10-3
10-2
10-1
100
101
102
103 A
B
C
cont
rol c
ells
Fig. 3.29 Inactivation kinetics of Lactococcus lactis ssp. cremoris MG1363 in milk buffer ( ), milk buffer with 0.5 M sucrose ( ), milk buffer with 4M NaCl ( ) and milk buffer with 1M Mannitol ( ) after pressure treatments at 200 MPa (A), 300MPa (B), 600MPa (C) and 20°C. Shown is the viable cell count on GM17 compared to that of untreated cultures. The cell count of control cultures was (2.4 ± 0.8) x 109 CFU ml-1. Symbols represent means ± standard deviations for 2 independent experiments.

Results
67
B3.6.2 LmrP activity of pressurized cells in milk buffer and milk buffer with additives
In the gram-positive bacterium Lactococcus lactis at least four drug extrusion activities have
been detected (Molenaar et al., 1992; Bolhuis et al., 1994). One of these systems, LmrP, is a
secondary drug transporter located in the membrane. This system utilises the membrane
potential and the transmembrane proton gradient mediating an electrogenic nH+/drug antiport
reaction (n ≥ 2) to drive the extrusion of drugs of the cell (Bolhuis et al., 1996; Putman et al.,
1999a-b). The extrusion of ethidium bromide in the wild-type strain of Lactococcus lactis
MG1363 occurs predominantly by the LmrP transporter being inhibited by ionophores that
dissipate the proton motive force (Bolhuis et al., 1994, 1995, 1996). According to the HorA
assay by Ulmer et al. (2000, 2002) the effect of pressure on LmrP activity can be determined
comparing the ethidium bromide efflux of pressurized cells with the efflux of starved and
untreated cells. Fig. 3.30 shows the comparison of LmrP activity after treatments at 200 MPa
in milk buffer and milk buffer with additives. Cells in milk buffer and milk buffer with
sucrose did not show a significant difference of activity in untreated cells. High-pressure
impaired the activity of the enzyme. In treatments in milk buffer the LmrP activity was
reduced after 8 min and reached the level of starved cells after 40 min. This effect correlated
with the loss of capacity to restore a ∆pH and the first reduction of CFU. With the addition of
0.5M sucrose the activity of LmrP was protected. The pressure inactivation of the enzyme
was retarded, cells showed activity after 40 and 60 min of treatment, but lost the activity after
120 min. However, no reduction of CFU was reported and the cells were able to restore a
partial ∆pH after 120 min of treatment. Untreated cells in milk buffer with 4M NaCl showed
reduced LmrP activity. The activity was reduced already during the build-up time of pressure,
after 1 min of treatment the activity reached the level of starved cells. These results agreed
with the lower pHin and the absence of ∆pH, but the viability of the cells was not affected.
Untreated cells in milk buffer with 1M mannitol showed also a reduced LmrP activity. The
build-up time of pressure was sufficient to reduce the activity, but the cells retained a partial
activity upon 60 min of treatment. After 120 min of treatment the cells lost the LmrP activity
without reduction of CFU.

Results
68
pressure holding time (min)
0 20 40 60 80 100 120
LmrP
-Act
ivity
0,00
0,05
0,10
0,15
0,20
cont
rol c
ells
cont
rol d
ead
cells
Fig. 3.30 Baroprotective effects of additives on the LmrP activity during high-pressure treatment at 200MPa and 20°C. Shown is the activity of LmrP of pressurizated cells compared to that of untreated in milk buffer ( ), milk buffer with 0.5 M sucrose ( ), milk buffer with 4M NaCl ( ) and milk buffer with 1M Mannitol ( ). Symbols represent means ± standard deviations of 2 independent experiments.
3.6.3 Intracellular accumulation of osmolytes by osmotic upshock
Bacteria respond to changes in medium osmolarity by varying the intracellular concentrations
of specific solutes in order to maintain constant turgor. Sugar- and salt-stressed Lactococcus
lactis cells accumulate different osmolytes (Molenaar et al., 1993). We determined
qualitatively the main accumulated osmolytes in cells exposed to 30 min incubation in milk
buffer, milk buffer with 0.5M sucrose and milk buffer with 4M NaCl. Furthermore, we
determined the effect of the addition of 2.5mM glycine betaine to the 4M NaCl milk buffer.
The HPLC detection of sugars showed that sucrose, glucose and fructose were the major
osmolytes in cells incubated in milk buffer with sucrose. The cells exhibited a sucrose uptake
as physiological response against the nonelectrolyte stress. Inside the cells the sucrose was
cleaved into glucose and fructose. None of these sugars was present in cells incubated in milk
buffer or milk buffer with 4M NaCl. The level of lactose did not show significant difference
between cells incubated in milk buffer and milk buffer with 0.5M sucrose. However, cells
incubated with NaCl without glycine betaine contained a higher level of lactose. Glycine
betaine was accumulated if it was added to the buffer, cells incubated in milk buffer with 4M

Results
69
NaCl and glycine betaine showed a high level of this osmolyte and lower level of lactose than
cells incubated just with 4M NaCl. The accumulation of an unknown osmolyte was apparent
in cells incubated in milk buffer with 4M NaCl.
3.6.4 Effect of osmolytes on the membrane phase state at different temperatures
measured by FT-IR spectroscopy
The presence of sugars aids to protect cell membranes against stresses. Adding disaccharides
to cells before drying lowers the transition temperature (Tm) of the dry membranes preventing
the phase transition and its accompanying leakage upon rehydration (Crowe et al., 1988,
1997). Since one of the principal targets of high-pressure inactivation is the membrane, we
determined and compared the effect of adding osmolytes on the membrane phase state at
different temperatures and pressure levels.
The Tm of the phase transition was determined by measuring the wave number of the
symmetric CH2 absorbance peak at wave numbers around 2, 850 at various temperatures and
then plotting the wave number against temperature (Fig. 3.31). The internal vibrational modes
of the lipid acyl chains are assigned on the basis of the well-known studies of polymethylenes
and polymethylene chain compounds (Reis et al., 1996; Snyder, 1961). In the 2,800- to 3,100-
cm-1 region, there are infrared absorption bands due to symmetric and antisymmetric modes
of the methylene chain at about 2,850 and 2,920 cm-1, respectively. The wave numbers of
these bands are conformation sensitive and thus respond to temperature- and pressure-induced
changes of the trans/gauche ration in acyl chains. The vibration mode (antisymmetric stretch)
of the terminal CH3 group occurs at about 2,960 cm-1. The FT-IR melting curves were fitted
to the following logistic function:
y = yo + A
1 + e - (T-Tm)/b
where yo and A denote the lower and upper asymptotes, respectively, and b is a shape
coefficient. The melting temperature of the membranes was defined as the turning point of the
melting curve. All of the liquid crystalline or gel phase regions are characterised by a nearly
horizontal slope. This method has been used successfully to measure the Tm s of Escherichia
coli (Leslie et al., 1995) and Lactobacillus plantarum (Ulmer et al., 2002).
Lactococcus lactis cells in milk buffer have a Tm of 21.4°C. Addition of sucrose and NaCl to
the buffer lowers the Tm of the phase transition. The sucrose lowered the Tm of the cells from
21.4 to around 16.8°C, while NaCl lowered to 16.6°C.

Results
70
temperature (°C)
0 10 20 30 40
wav
e nu
mbe
r (cm
-1)
2852
2853
2854
2855
Fig. 3.31 Vibrational frequencies for the CH2 symmetric stretch from Lactococcus lactis cells in milk buffer ( ), milk buffer with 0.5 M sucrose ( ) and milk buffer with 4 NaCl ( ) as a function of temperature. Data are representative for two independent experiments. Every experiment was done by heating the cells from 0 to 40°C. The curves represent the best fit of the logistic function (r2 ≥ 0.96).
3.6.5 Effect of osmolytes on the membrane phase state at different temperatures and
pressures as measured by Laurdan fluorescence spectroscopy
The temperature-dependent membrane phase behaviour obtained by FT-IR spectroscopy was
confirmed by Laurdan fluorescence spectroscopy. The Laurdan fluorescence spectra depend
on changes in environmental polarity induced by membrane phase transitions (Bagatolli et al.,
1999; Parasassi et al., 1995). The temperature dependence of the GP values of cells in milk
buffer and milk buffer with additives is shown in Fig. 3.32. With decreasing the temperature,
the polarity around the fluorophor in fluid membranes decreases, resulting in higher GP
values. The change can be interpreted as temperature-induced phase transition from liquid
crystalline to gel phase. Cells in milk buffer without additives showed the higher values of GP
at 10°C indicating a rigid state of the membrane. At the same temperature the values of GP in
presence of additives were lower indicating the coexistence in the membrane of the liquid
crystalline and gel phases.
The pressure-dependent membrane phase behaviour was determined also by Laurdan
fluorescece spectroscopy (Fig. 3.33). An increment of pressure decreases the polarity around
the fluorophor in fluid membranes increasing the GP values. By analogy to temperature assay,
the change can be interpreted as pressure-induced phase transition from liquid crystalline to

Results
71
coexistence of liquid crystalline and gel phase regions. Cells in milk buffer without additives
showed the greatest increase of GP values with pressure indicating a rapid phase transition.
Cells in milk buffer with sucrose or NaCl did not show an increase of GP values exhibiting no
significant changes of membrane phase state with pressure. Up to 300 MPa their membranes
stayed in a liquid crystalline phase.
temperatur in °C
5 10 15 20 25 30 35 40 45
GP
valu
es
0,46
0,48
0,50
0,52
0,54
0,56
0,58
0,60
0,62
0,64
Fig. 3.32 GP values of Lactococcus lactis cells stained with Laurdan in milk buffer ( ), milk buffer with 0.5 M sucrose ( ) and milk buffer with 4 NaCl ( ) as a function of temperature. Data are representative for two or more independent experiments. Symbols represent means ± standard deviations of 2 measurements.

Results
72
presure (MPa)
0 50 100 150 200 250 300 350
GP
valu
es
0,46
0,48
0,50
0,52
0,54
0,56
0,58
0,60
0,62
Fig. 3.33 GP values of Lactococcus lactis cells stained with Laurdan under pressure conditions. The treatments were performed in milk buffer ( ), milk buffer with 0.5 M sucrose ( ) and milk buffer with 4 NaCl ( ). Data are representative for two or more independent experiments. Symbols represent means ± standard deviations of 2 measurements.

Discussion 73
4. Discussion
This study provides insights in the mechanism of high-pressure induced growth inhibition and
cell inactivation of Lactococcus lactis. This was achieved by using newly developed and
adapted in-situ measurement techniques distinguishing between primary and secondary
pressure effects, reversible and irreversible reactions as well as responses at organizational
and physiological level.
Fig. 4.1 summarises the methods used in this work to assess various aspects of the physiology
of bacterial cells after and during high-pressure treatment. Fluorescent determination of
microbial physiology enables in-situ, kinetic determination of pressure inflicted injury and
thus enables the distinction between reversible and irreversible pressure effects (Gänzle and
Vogel, 2001).
Fig. 4.1 Methods to characterise the high-pressure induced responses of Lactococcus lactis. This figure was kindly provided by Michael Gänzle.
The examination of the metabolic activity after pressure treatment was implemented through
staining with tetrazolium. Active enzyme cascades reduce tetrazolium to formazan. This
changes optical density of cells indicating intact metabolic activity. Membrane integrity was
measured with propidium iodide and fluorescence of DNA-propidium-iodide-complex.
The membrane-bound enzyme LmrP is an unspecific substrate transporter. The extrusion of
the fluorescent dye ethidium bromide in the wild-type strain of Lactococcus lactis occurs
predominantly by the LmrP transporter. This enabled to measure LmrP activity after
pressurization by fluorescence kinetic experiment (Ulmer et al., 2000, 2002).
Membrane potential Metabolic activity
PI, TOTO-1
PI*DNA
DiSC3(5)
pH
LAURDAN
INT
INT Formazan
[K+]
DAPI*DNAEB*DNA
EBLmrP
ATP
ADP TOTO-1*DNA
cFDASE,
DAPI
FtsZ
Growth
Membrane - integrity - fluidity

Discussion 74
The internal pH of the cells was determined with the fluorescent probe cFSE, which
conjugates with the aliphatic amines of intracellular proteins. Changes of the membrane phase
state during pressure treatment were measured by Laurdan fluorescence spectroscopy.
Additionally, the growth under sublethal pressure was characterised with respect to
chromosomal replication by DAPI-staining and FtsZ ring formation by immunofluorescence.
4.1 Effect of high-pressure during growth
High-pressure can be used for cold pasteurization of foods as well as in biotechnological food
processes. Casal et al. (1999) suggested the use of lactic acid bacteria cells attenuated by
high-pressure to accelerate cheese ripening. The use of sublethal pressure on cells lowered the
lactic-acid producing activity without causing damage to the peptidolytic activity (Casal et al.,
1999). On account of this, we investigated the effect of pressure and temperature on
mesophilic bacteria used in food biotechnology, i.e. Lactococcus lactis and Lactobacillus
sanfranciscensis at the level of growth rate, cell morphology and cellular organization.
Non-adapted (mesophilic) microorganisms commonly show growth inhibition at about 40-50
MPa (Fujii et al., 1996; Gross and Jaenicke, 1994). This study has shown that at optimal
temperature of growth the mesophilic strains Lactococcus lactis MG1363 and Lactobacillus
sanfranciscensis were able to grow at pressures up to 50 and 40 MPa, respectively. According
to the definition of Abe and Horikoshi (2001) both strains are piezosensitive. Lactobacillus
sanfranciscensis failed to grow at 50 MPa and the growth rate of Lactococcus lactis at 50
MPa was less than 30% of the growth rate at atmospheric pressure. The cell morphology was
affected during the growth under pressure conditions, the cells were elongated and the cell
division was affected. This is in accordance with findings for the gram-negative bacterium
Escherichia coli for which it was shown that its growth under pressure conditions is
accompanied by formation of filaments (Sato et al., 2002). Sharma et al. (2002) observed
residual formate oxidation by Escherichia coli and Shewanella oneidensis at pressures
ranging up to 1600 MPa and suggested that any pressure encountered on earth is not a
limiting factor for microbial life. However, comparison of the data presented in this work
with Lactococcus lactis and Lactobacillus sanfranciscensis (Korakli et al., 2002) and E. coli
(Sato et al., 2002) and S. cerevisiae (Abe and Horikoshi, 1997) clearly demonstrate that
multiplication of organisms is inhibited at much lower pressures that overall metabolic
activity or even the activity of a single enzyme.
The morphologic changes observed under pressure conditions suggest that some of the
cytoskeleton or autolytic proteins were affected by high-pressure. McDonald (1971) noted

Discussion 75
that in L. lactis, filament formation was associated with decreased autolysin activity, an
observation later confirmed by Langsrud et al. (1987). Furthermore, autolytic activity in L.
lactis is involved in cell separation. Buist et al. (1995) showed that the muramidase AcmA is
required for cell separation of L. lactis as an acmA deletion mutant grew in long chains. Acm
A is essential for cell separation and is the only autolysin in L. lactis. Therefore, our
microscopic observation of L. lactis suggests that the biosynthesis or the activity of AcmA
enzyme was impaired by high-pressure.
Chromosal DNA stained by DAPI was observed in all cells indicating that DNA was
replicated and segregated independently of morphological changes and high-pressure
conditions. The inhibitory effect of pressure on the cell division was also found in
Lactobacillus sanfranciscensis, cells under pressure formed filaments.
Protein-protein interactions are important in various biological systems including multimeric
enzymes, ribosomes, cytoskeleton proteins and proteins that act in signal transduction
pathways; such interactions are thought to be sensitive to increasing pressure. Hydrostatic
pressure causes the dissociation of numerous multimeric proteins because the processes are
typically accompanied by negative volume changes (Abe and Horikoshi, 2001; Gross et al,
1993; Gross and Jaenicke, 1994). Ribosome dissociation has been demonstrated using light-
scattering analysis in vitro under high-pressure (Gross et al, 1993; Gross and Jaenicke, 1994).
This has led to the suggestion that ribosome dissociation may be one of the principal causes of
growth inhibition at high-pressure. Gross et al. (1993) investigated the effects of high-
pressure on elongation-cycle intermediates and observed ribosome dissociation starting at 40-
60 MPa. They suggested that the post-translational complex is the most pressure-sensitive
component of the elongation cycle and is possibly the limiting factor for the pressure-induced
block of protein biosynthesis and bacterial growth. Ribosome dissociation was observed in
vivo during incubation of Escherichia coli at pressures ranging from 50 – 250 MPa (Niven et
al., 1999). Because levels of extracellular Mg2+ influenced ribosome conformation after
pressure treatment, Niven et al. (1999) suggested that, in addition to effects of pressure on
multimeric proteins only, the stability of ribosomes in vivo is affected by the loss of ion
gradients resulting from a permeabilised cytoplasmic membrane.
Immunofluorescence microscopy indicated that aggregation of the FtsZ protein also was
affected by high-pressure. The images of IFM demonstrated a reduction of the number of FtsZ
rings in exponential cells of Lactococcus lactis MG1363 at high-pressure conditions. These
observations correlate with the work of Sato et al. (2002) with Escherichia coli. They
reported almost no FtsZ rings in the elongated cells under high-pressure and suggested that

Discussion 76
the cells under pressure might be “frozen” at early stage in the cell cycle, since the FtsZ ring
does not form just before septation, rather it is assembled very early in the cell cycle
(Erickson, 1997; Losick and Shapiro, 1999; Sun and Margolin, 1998). Whether the presence
of ions also affects FtsZ ring formation and thus depends on intact membrane remains to be
elucidated.
The physiological adaptation of microorganisms from the deep-sea involves the regulation of
the membrane fluidity by incorporation of increased proportions of unsaturated fatty acids
(Allen et al., 1999; Delong and Yayanos, 1985; Marteinsson et al., 1997; Somero, 1992;
Tanaka et al., 2001). High hydrostatic pressure has been shown to enhance the growth rate
and produce a shift of the optimal temperature of growth from piezophilic bacteria
(Canganella et al., 1997; Kato et al., 1995, 1997, 2000; Marquis, 1984). This extension in
growth pressure with temperature could be explained by mechanisms involving membrane
viscosity in cells, since pressure and heat are parameters, which interact with membrane
fluidity. However, this adaptation response seemed to be reduced in mesophilic bacteria, since
the piezoresistence of Lactococcus lactis MG1363 and Lactobacillus sanfranciscensis was not
improved at temperatures above their optimal range. Whereas piezophilies regulate their
synthesis of poly- and monounsaturated fatty acids depending on pressure and temperature
conditions of growth, lactic acid bacteria tend to accept a variety of fatty acids present in the
media rather than synthesising them being e.g. oleic acid-auxotrophic microorganisms (Allen
et al., 1999; Foucaud et al., 1997; Sugihara and Kline, 1975).
High-pressure induces unique stress responses in mesophilies, such synthesis of specific
proteins, accumulation of osmolytes and changes in metabolismus (Abe and Horikoshi, 2000;
Fujii et al., 1996; Iwahashi et al., 1997a-b, 2000; Korakli et al., 2002; Welch et al., 1993).
Our work has shown that pressure also alters morphology and cytoskeleton proteins. This
study provides insights into pressure-induced response of lactic acid bacteria.
4.2 Effects of high-pressure during inactivation
High-pressure has been investigated as new promising technique for sterilizing and processing
food. As a non-thermal process it inactivates microorganisms and enzymes with reduced
adverse effects on taste, flavour and nutrient content. However, microbial inactivation by
high-pressure is a complex phenomenon, which involves more than one physiological
reactions and is still not completely understood. Inactivation of microorganisms is initiated by
membrane damage, but the changes observed after a pressure treatment, further involve
ribosome denaturation, coagulation of cytoplasmic protein, enzyme inactivation, inhibition of

Discussion 77
transcription and protein synthesis (Cheftel, 1995; Kalchayanand et al., 1998b; Pagan and
Mackey, 2000).
In this study the effect of high-pressure inactivation on Lactococcus lactis cells was
evaluated. The pressure-treated cells were characterised with respect to viability, metabolic
activity, membrane integrity, detection time and inactivation of the membrane-bound enzyme
LmrP. The effects of external factors such as addition of ionic and nonionic solutes and
changes of external pH on the pressure inactivation were determined. Furthermore, the
baroprotective mechanisms of salt and sucrose were studied.
The composition of the medium where the microorganisms are dispersed in at the moment of
pressurization influences significantly the efficiency of inactivation, the loss of viability is
lower in food systems than in phosphate buffer (Kalchayanand et al., 1998a-b). The milk
buffer was selected to achieve i) a food-like system and ii) a chemical defined buffer without
variations. Our results indicated that the inactivation kinetic in milk buffer correlated with the
inactivation kinetic in milk permeate, allowing to use the buffer as chemically defined milk
model system.
The patterns of pressure-inactivation kinetics have been frequently discussed. Some
investigators indicate first-order kinetics [log(N/NO) being linear as a function of time] in the
case of yeast and bacteria (Butz et al., 1990; Carlez et al., 1992; Ludwig et al., 1992; Raffalli
et al., 1994). Other investigators observed a change in slope and a two-phase inactivation
phenomenon, with a shoulder and tailing (Cheftel, 1995; Heinz and Knorr, 1996). In this
case, the first fraction of the population is quickly inactivated, whereas the second fraction
appears to be much more resistant to pressure. Our results corroborate these observations and
thus provide further evidence that first order kinetics does not adequately describe pressure
inactivation time.
The inactivation kinetics of all strains had the same rate of inactivation and the same level of
baroresistent bacteria (tailing of 105 cfu). The difference between them was the length of the
shoulder. This shoulder with approximately no inactivation suggests a certain resistance
mechanism. This phase was explained by phenotypic heterogeneity in the population for the
transition from “stable” to “metastable” state during pressure treatments (Oxen and Knorr,
1993). Aside from this difference, a treatment at 300MPa for 12 min at 20°C is sufficient for
a microbial reduction of 4 log cycles of all tested strains. Studies with bacteria have revealed
that the loss of cell viability increased with increase in pressure and time. Treatments up to
200 MPa inactivated, even after 30 min, less than 1 log cycle (Kalchayanand et al., 1998a-b;
Oxen and Knorr, 1993). This correlate with our finding that treatments at 200 MPa up to 60

Discussion 78
min did not reduce the number of microorganisms. An increase of pressure reduced the length
of the shoulder and increased the rate of inactivation, but it did not affect the tailing.
High-pressure inactivation kinetics are in many cases characterised by tailing, suggesting a
more barotolerant fraction of the initial population. The growth of “tailing” cells during
storage represents a risk for the consumers. Accordingly to this, one aim of this work was the
characterization of the “tailing” cells of Lactococcus lactis.
Modelling of bacterial growth using viable counts is time consuming, therefore researchers
have explored more simple and rapid methods. One of the simplest methods to detect bacterial
growth is the use of optical density (OD) measurements, where growth can be related to the
increase in turbidity of a bacterial culture (McKellar and Knight, 2000). The detection time
(td) for a turbidimetric instrument can be defined as the time required for an initial measurable
increase in OD (Wu et al., 2000). Baranyi and Pin (1999) have proposed a method for
calculating lag-phase (λ) and specific growth rate (µ) from td. Their method is based on the
biological interpretation that lag is a period of adjustment of the initial physiological state of
the cells to the new environment during which only the intracellular conditions changes
(Baranyi and Roberts, 1995; Baranyi, 1998; Baranyi and Pin, 1999). Buchanan et al. (1997)
proposed that the time required for the transition between lag and exponential phases reflects
biological variation among individual cells of the bacteria population. Assuming pure
exponential growth until the time of detection, preceded by the lag period only, the
distribution of the detection times reflects the distribution of the population lag times which is
more and more scattered for lower inoculum levels (Baranyi, 1998). Measurement of lag or
detection times of individual cells allows useful and convenient comparison of heterogeneity
of cultures.
The characteristic tailing effect of pressure inactivation can be related to heterogeneity in the
cells of the same population corresponding to the existence of a more pressure-resistant
subfraction (Earnshaw, 1995). When this apparent subfraction was isolated by culturing the
surviving cells after extended pressure exposure, no significant difference in pressure
sensitivity to the original culture was observed (Metrick et al., 1989; Ulmer et al., 2000). This
indicates that the barotolerant fraction is determined rather to physiological heterogeneity than
to genetical diversity.
The extension of lag phase as result of physical injury of bacterial cells has been frequently
reported (Mackey and Derrick, 1982, 1984; Stephens et al., 1997; Augustin et al., 2000;
Smelt et al., 2002). Mackey and Derrick (1982) indicated that sublethally injured bacteria
inoculated into growth media undergo a prolonged lag phase during which time injury is

Discussion 79
repaired and the ability to grow restored. Populations of injured cells are heterogeneous and
contain individuals with varying degrees of injury (van Shothorst & van Leusden, 1975). The
measured lag time of such populations may therefore reflect the lag times of the least severely
injured individuals which are first to repair injury and to begin multiplication.
Our results show a considerable heterogeneity of the distribution time of untreated cultures,
suggesting that physiological variation within the initial population may account for tailing.
Furthermore, a significant difference between detection time of cells from original culture and
from the pressure-resistant fraction was observed. This difference can be explained by
sublethal injury of surviving cells or by survival of those cells of the initial population with an
extended detection time. Allowing 30 min of incubation for repair of sublethal injury or
activation of resting cells, a rapid inactivation upon a second pressure cycle was observed.
Therefore, we favour the interpretation of presence of resting cells, which were activated
during the first cycle of treatment.
Although screening by enumeration of the survivors e.g. by plate counts is a quite acceptable
selection method for the high-pressure inactivation, it is labour intensive and it requires some
days before the results can be read. Additional screening methods have shown to assess in
more detail the physiological state of the cell (Smelt et al., 2002). Methods involving dyes
have been successfully used to determine the loss of membrane integrity after treatment with
high-pressure. Pagan and Mackey (2000) used propidium iodide to determine the loss of
membrane integrity in pressure-treated Escherichia coli, in our laboratory Ulmer et al. (2000)
used propidium iodide to analyse Lactobacillus plantarum after high-pressure treatment. The
LIVE/DEAD BacLight Bacterial Viability Kit (Molecular Probes) utilise mixtures of their
SYNTO 9 green fluorescent nucleic acid stain and the red fluorescent nucleic acid stain,
propidium iodide. With an appropriate mixture of both stains, bacteria with intact cell
membrane stain fluorescent green, whereas bacteria with damaged membrane stain
fluorescent red (Anonymous, 1999).
Tetrazolium salt offers a rapid, culture–independent means to determine viability and relative
rate of reducing equivalent production in microorganisms (Thom et al., 1993). The use of the
redox dye 2-(p-iodophenyl)-3-(p-nitrophenyl)5-phenyltetrazolium chloride (INT) as an
indicator of microbial metabolic activity has become a standard laboratory method. This
compound is reduced by the electron transport system in active bacteria to an insoluble purple
tetrazolium crystal within the cell witch can be visualised using bright field microscopy
(Thom et al. 1993; Walsh et al., 1995). This method has been used to determine the metabolic
activity of pressure-treated Lactobacillus plantarum (Ulmer et al., 2000).

Discussion 80
Treatment of Lactococcus lactis at 200 MPa did not affect viability but reduced metabolic
activity to 50%. Cell death observed during treatment at 300 MPa was followed closely by
loss of metabolic activity whereas dead cells conserved membrane integrity. These results
suggested that the high-pressure treatment of Lactococcus lactis affects metabolic activity and
subsequently damages membrane integrity.
The addition of NaCl and sugars protects microorganisms during high-pressure treatments.
This increased barotolerance was attributed to cell shrinkage, which probably causes a
thickening in the cell membrane reducing membrane permeability and fluidity (Hayakawa et
al., 1994; Knorr, 1994; Oxen and Knorr, 1993; Takahashi et al., 1993). However, the effect
of NaCl or sugars on the osmotic pressure of foods or suspension media is not sufficient to
explain the marked baroprotective effects of these solutes on microbial inactivation (Cheftel,
1995). Our work supports this statement because 1.5 M sucrose with a higher water activity
had a stronger baroprotective effect than 4 M NaCl.
In general, sugars had a stronger protective effect than salts on the inactivation of Lactococcus
lactis and this effect did not only rely on the lowering of aw. High concentrations of sugars
(lactose or sucrose) impose only a transient osmotic stress in Lactococcus lactis, because the
cells are able to equilibrate the extra- and intracellular concentrations of sucrose and lactose
(Glaasker et al., 1998). Disaccharides stabilize proteins in their native state and preserve the
integrity of membranes during stresses (Leslie et al., 1995). Adding a disaccharide lowers the
transition temperature Tm of the membranes by replacing the water between the lipid
headgroups, preventing the phase transition, and inhibiting the fusion between the liposomes
due to glass formation (vitrification) (Crowe et al., 1997). Furthermore, the addition of
sucrose raises the internal pressure of the solvent, forcing the protein to overcome a greater
energy barrier in unfolding (Timasheff et al., 1976) and stabilizes the proteins because of
preferential exclusion of sucrose. As our results show that the high-pressure inactivation of
the membrane-bound enzyme LmrP was retarded with the addition of 0.5 M sucrose to the
buffer. The results of the HPLC indicate an internal accumulation of sucrose and
glucose/fructose produced by its hydrolysis during hyperosmotic conditions with 0.5 M
sucrose. Therefore, we suggest that the intracellular sucrose accumulation protected the
metabolic enzyme and the lipids of the membrane during the high-pressure treatment.
High salt concentration is detrimental for microorganisms, however the addition of NaCl was
shown to protect the cells during high-pressure treatments. Microorganisms accumulate
compatible solutes upon challenge by decreased water activity. The intracellular accumulation
of compatible solutes maintains the osmotic balance with the extracellular environment, the

Discussion 81
integrity of biological membranes and enhances the stability of enzymes (Kets et al., 1997).
Lactococcus lactis accumulates glycine betaine when subjected to salt stress. However, since
Lactococcus lactis is unable to synthesize this compound, it is replaced by unknown
osmolytes, unless it is added to the medium. The increase of the baroprotective effect of 2
NaCl in presence of glycine betaine indicated that the intracellular accumulation of
compatible solutes played a major role in the baroprotective effect of NaCl. In the treatments
with NaCl without glycine betaine the baroprotective effect could be explained by an
accumulation of unknown osmolytes from the milk buffer. The results of the HPLC support
this, since cells accumulated glycine betaine by osmotic upshock with NaCl if glycine betaine
was added to the buffer, whereas cells without glycine betaine accumulated lactose and
unknown osmolytes.
Hydrostatic pressure affects the intracellular pH of microorganisms by (i) enhanced
dissociation of weak organic acids and (ii) increased permeability of the cytoplasmic
membrane and inactivation of enzymes required for pH homeostasis. In this study it was
shown by in-situ determination of pHin values that sublethal high-pressure treatments
decreased the internal pH of Lactococcus lactis and Lactobacillus plantarum cells to the level
of the external pH. A reversible reduction of the pHin occurred concomitantly with
compression prior to a reduction of viable cell counts. Furthermore, the regeneration of the
∆pH upon pressure release was monitored.
The cFSE method for pH determination is based on the internal conjugation of cFSE in the
cytoplasm of cells, followed by the elimination of free probe by an incubation in the presence
of a fermentable sugar. Efflux of fluorescent probe during high-pressure treatment, that may
permeabilize the cells envelope were avoided because the succinimidyl group of cFSE is
conjugated with the aliphatic amines of intracellular proteins (Haugland, 1992). The useful
range of fluorescent pH indicators is determined by their pKa, cFSE hat a pKa of 6.5,
compatible to work in the range expected for the pHin of our microorganims. For lower pHin
the cFSE may be replaced with 5(and 6-)-carboxy-2´,7´-dichlorofluorescein succinimidyl
ester, which has a pKa of 3.9 in buffer and 4.9 when incorporated in bacterial cells (Breeuwer
et al., 1995; Siegumfeldt et al., 2000). The effects of cFSE incorporation on the cells prior to
high-pressure treatments were negligible, since the viable counts of cells stained with cFSE
were not different from those observed with unstained cells. Furthermore, the external pH did
not affect either cell viability or the internal pH during storage of cells for up to 3 h at ambient
pressure. The values for the internal pH at atmospheric pressure of L. lactis and L. plantarum
at external pH values ranging from 4.0 to 8.0 determined in this work were comparable to

Discussion 82
those reported previously for L. lactis and L. plantarum (Belguendouz et al., 1997; Breeuwer
et al., 1996; Siegumfeldt et al., 2000; Wouters et al., 1998). In both species investigated in
this work, the internal pH decreased with decreasing buffer pH, resulting in ∆pH values
between 1.9 and 2.1 pH unit at pH 4.0.
It is well established that a reduction in the pH of the suspending medium causes a
progressive increase in the sensitivity of bacteria to pressure (Alpas et al., 2000; Garcia-
Graells et al., 1998; Mackey et al., 1995; Nannen and Hutkins, 1991; Rademacher, 1999; Ritz
et al., 2000). For example, pressurization at 345 MPa and a pH values of 4.5 increased the
viability loss of Staphylococcus aureus, Listeria monocytogenes, Escherichia coli and
Salmonella enteritidis by an additional 1.2-3.9 log cycles compared to pressurization at pH
6.5 (Alpas et al., 2000). The data on pressure inactivation kinetics at acidic and near neutral
pH values presented in this study are consistent with these literature data. Both L. lactis and L.
plantarum were less pressure sensitive at pH 6.5 than at pH 4.0. However, independent of the
buffer pH, a fraction of about 1 in 106 cells withstood pressure treatment for up to 120 min.
For either strain, a greater degree of sublethal injury was observed at pH values of 6.5 and 6.0
compared to pressure treatment at pH 4.0 and 5.0. This indicates that at a pH value near
neutral, sublethally injured cells survive and recover eventually upon transfer to a rich
medium. At acidic pH values, sublethally injured cells are inactivated during pressure
treatment.
Wouters et al. (1998) reported a decrease on pHin of Lactobacillus plantarum after high-
pressure treatment. Our results confirmed and extended these observations by pH
measurements during pressure treatment, which allow the distinction between reversible and
irreversible effects of pressure treatment on pH homeostasis. Compression of the samples
resulted in a fast and reversible decrease of the internal pH. At 300 MPa, the internal pH was
equal to the external pH with completion of the pressure up ramp, prior to a reduction of
viable cell counts. The observation that the decrease of internal pH occurred virtually in
equilibrium with the pressure build up suggests that both the membrane permeability and the
activity of proton pumps were affected by high-pressure treatment. Wouters et al. (1998) also
found that cells grown at lower pH were more resistant to pressure than cells grown at optimal
pH. This difference in resistance may be explained by a higher F0F1 ATPase activity, better
ability to maintain a ∆pH, or a higher acid efflux of cells grown at low pH. A correlation
between acid stress and barotolerance was also observed in our laboratory with sublethal acid
shock on cells of Lactobacillus sanfranciscensis indicating that pressure stress may involve
acid stress (Scheyhing, 2002).

Discussion 83
Membrane and membrane-bound enzymes are a major target for the pressure inactivation of
microorganisms (Smelt et al., 1994). Under high-pressure the membrane lipids undergo a
phase transitions from the liquid crystalline phase to the gel phase. This phase transition
enhances the permeability of the membrane to ions, and inflicts cell injury because some
transport proteins only function in a liquid crystalline membrane (Beney and Gervais, 2001).
The sensitivity of bacteria is markedly affected by membrane properties (ter Steeg et al.,
1999; Ulmer et al., 2002).
In L. plantarum, pressure treatment caused partial inactivation of the F0F1 ATPase such that
the ability of cells to maintain a ∆pH was reduced, and the acid efflux mechanism was
impaired (Wouters et al., 1998). Direct denaturation, dissociation of the quaternary structure,
or the dislocation of the enzyme from the membrane may account for this effect. Ulmer et al.
(2000, 2002) reported that inactivation of transport proteins is an early event during
pressurization of microorganisms.
The findings in this work confirmed the pressure inactivation of the membrane-bound
multidrug transporter LmrP in L. lactis before a reduction on the CFU was observed.
Remarkable differences in barotolerance pH homeostasis during pressure treatment were
observed between L. lactis and L. plantarum. The minimum pH permissive for growth of L.
lactis is 4.0, whereas L. plantarum is a highly acid tolerant beer spoiling organism growing at
pH values of 3.5 or lower (Gänzle et al., 2001). In L. lactis, pH homeostasis was irreversibly
disturbed after 4 min of pressure holding time at 300 MPa and after 30 min at 200 MPa. The
addition of sucrose to milk buffer increased the capacity of the cells to restore a ∆pH, whereas
the addition of NaCl dissipated the transmembrane proton potential prior pressure treatment.
The loss of viability related not to the decrease of the internal pH but to the loss of ability to
restore the ∆pH after pressure treatment. L. plantarum was more pressure tolerant that L.
lactis at any pH value. The transmembrane proton potential was not fully dissipated by
treatments at 200 MPa. The sensitivity of L. plantarum to treatments at 300 MPa was affected
to a greater extend by low pH conditions than that of L. lactis. This observation may relate to
the inability of L. plantarum to restore a ∆pH upon pressurization at 300 MPa even after 0
min treatment time. Our data thus support the hypothesis that pressure treatment restricts the
pH range tolerated by bacteria as a consequence of the irreversible inhibition of ATPase-
dependent transfer of protons and cations (Ritz et al., 2000). Pagán et al. (2000, 2001)
reported a sensitisation of E. coli cells to acid by a pressure treatment. Because the lowering
of the internal pH upon pressure treatment did not explain the death of pressure damaged cells
under acidic conditions, the authors suggested that this acid sensitivity is caused by the loss of

Discussion 84
protective or repair functions rather than to the loss a transmembrane ∆pH per se. Garcia-
Graells et al. (1998) reported a secondary inactivation of E. coli during storage in fruit juices
at low pH after a primary pressure treatment inflicting sublethal injury to a large proportion of
cells. This observation was confirmed for pressure resistant strains of E. coli O157-H7 and
Listeria monocytogenes (Jordan et al., 2001). Survival and growth of lactic acid bacteria in
beer was prevented by pressure treatments that resulted in a reduction of 50 – 99% of viable
cell counts only but fully eliminated hop resistance of lactobacilli (Gänzle et al., 2001; Ulmer
et al., 2002). Schweininger (2002) also reported an inactivation of lactic acid bacteria during
storage at low pH in apple juice, yoghurt and milk buffer after a sublethal pressure treatment.
The observation that the ability of microorganisms to survive in harsh environments is
eliminated by pressure treatment allows the distinction between primary and secondary effects
of high-pressure treatments. The reversible or irreversible loss of concentration gradients
across the cytoplasmic membrane may be considered as a primary effect of pressure
treatment. Cell death may be considered a secondary event depending not primarily on
pressure or pressure holding time, but on the environmental conditions during and after
pressure treatment. This concept may prove useful to study the relevance of membrane
properties in the bacterial response to environmental stress.
4.3 General remarks
In conclusion, evidence is provided that primary pressure effects are related to or initiated by
changes of the phase behaviour and permeability of cytoplasmic membranes. These changes
occur fast during the build-up time of pressure and are often reversible at low pressures. They
cause the inactivation of multi-drug transport enzymes and dissipate pH gradient, which are
important for the survival of microorganisms under adverse conditions encountered in food
(Gänzle et al., 2001). The inactivation of MDR transport activity by high-pressure can be
measured before the loss of viability, indicating that survival or inactivation of
microorganisms will depend on further environment conditions. The baroprotective effect of
salts and sugars rests on their properties to retard the changes of membrane fluidity during
high-pressure treatment and the protection against protein denaturation. A model for the
pressure induced bacterial injury based on the results presented in this thesis and literature
data is shown in Fig. 4.2. The high-pressure induced membrane effects occur concomitant to
build-up time of pressure and reversible effects, e.g. dissipation of ∆pH, are observed prior to
irreversible cellular damage. The reversibility of the effects will depend on holding time of
treatment, and the lethal effects result from the combination of damaged membrane transport

Discussion 85
systems and detrimental environmental parameters. High-pressure treated cells are impaired
to maintain vital concentration gradients of ions and metabolites. Therefore, cell death will
occur as secondary effect of high-pressure depending on the environmental conditions.
These results provide insights into the mechanism of high-pressure inactivation that is
especially relevant for the design of high-pressure processes for food preservation.
Furthermore, the study of the cellular responses under growth at sublethal pressure conditions
can be used for novel biotechnological processes and possibly the synchronisation of cultures.
Fig. 4.2 Pressure ramp profile is shown for 20 minutes at 200 MPa (▬) distinguishing primary from secondary effects.

Summary 86
5. Summary
The aim of this thesis was to study the mechanism of high-pressure induced growth inhibition
and cell death distinguishing primary from secondary pressure effects. The lactic acid
bacterium Lactococcus lactis was chosen as a model system and its responses to high-pressure
were characterised during growth and after pressure-induced inactivation.
The piezosensitivity of Lactococcus lactis grown under sublethal pressure was characterised
with respect to chromosomal replication by DAPI-staining and FtsZ ring formation by
immunofluorescence. The cell morphology was affected during the growth under pressure
conditions, the cells were elongated and the cell division was affected. These morphological
changes suggest that some of the cytoskeleton or autolytic proteins are affected by pressure.
Since the muramidase AcmA is essential for cell separation and is the only autolysin in
Lactococcus lactis, we suggest that the biosynthesis or the activity of AcmA enzyme was
impaired by high-pressure. The aggregation of FtsZ protein required for cell division was also
affected by pressure, whereas DNA replication and segregation were independent of
morphological changes. An increase of growth temperature did not improve the
piezotolerance of Lactococcus lactis. The adaptation mechanisms to higher temperature and
pressure observed in deep-sea microorganisms is reduced in lactic acid bacteria, because they
are not able to regulate the synthesis of poly- and monounsaturated fatty acids.
The selection of a specific model for the study of high-pressure kinetics is necessary to
facilitate the identification of future optimised preservation strategies and will provide a basis
for estimates of microbial behaviour outside the measured data points. The milk buffer
developed for these experiments allowed to investigate the impact of single factors without
losing the similarity to a food system, facilitating the observation of pressure induced
inactivation under well-defined conditions.
The inactivation kinetics of different strains of Lactococcus lactis were qualitatively similar in
their sigmoid asymmetric shapes with an initial shoulder and an inactivation phase followed
by tailing. Pressures above 200 MPa were effective for inactivating Lactococcus lactis. An
increase of pressure reduced the length of the shoulder, but it did not affect the tailing. The
tailing effect of high-pressure inactivation was characterised by means of detection time. The
physiological variation of the original population was demonstrated by a considerable
heterogeneity of the distribution time of untreated cultures. The detection time of pressure
treated cells was extended, this effect can be explained by sublethal injury in surviving cells
or presence of resting cells within the initial culture. The baroresistance of the tailing showed

Summary 87
to be rather physiologically determined than genetically, since the pressure sensitivity of
cultures generated by cells isolated from tailing was not different from the original culture.
The methods involving dyes and absorbance measurements were successful to identify the
effect of high-pressure on Lactococcus lactis cells. Ex-situ and in-situ methods were adapted
to characterise the physiological changes of the cells. These methods provided evidences to
the mechanism of pressure induced inactivation distinguishing primary and secondary
pressure effects, reversible and irreversible reactions as well as responses at organizational
and physiological level. It was shown that a loss of metabolic activity, membrane damage,
reduction of internal pH, dissipation of K+-membrane potential and inactivation of the
membrane-bound enzyme LmrP occurred prior to cell inactivation. Therefore, cell
inactivation may be considered a secondary event not only depending on pressure or pressure
holding time, but on the environmental conditions during and after pressure treatment.
Addition of ionic and nonionic osmolytes exhibited a baroprotective effect against the loss of
viability of Lactococcus lactis. The baroprotective effect of sucrose is stronger compared on a
molar basis. While sucrose protected the metabolic activity, membrane integrity and LmrP
activity, salt did not show any protection on metabolic activity and LmrP activity. This work
suggested the accumulation of compatible solutes to understand the baroprotective effect of
low molecular solutes. Intracellular sucrose accumulation protected the metabolic enzyme and
the lipids of the membrane during the high-pressure treatment. Sucrose protects enzyme by
preferential exclusion of water, whereas it lowers the transition temperature of membrane.
NaCl protects by an accumulation of lactose and unknown compatible solutes from the milk
buffer. Addition of glycine betaine to the milk buffer with NaCl improved the baroprotection
because of its functionality as compatible solute.
A reduction in the pH of the milk buffer increased the cell sensitivity to pressure. With a
decrease of external pH the shoulder of inactivation kinetics was reduced and the inactivation
phase was accelerated. The first in-situ measurement of internal pH during high-pressure
treatment was performed in this work. Sublethal high-pressure treatments decreased the
internal pH of the cells to the level of external pH. The reduction occurred concomitantly with
the compression prior to a reduction of viable cells counts. A reduction of viable cells counts
was related to the loss of capacity to restore a ∆pH. The addition of sucrose improved the
ability to restore the ∆pH. These findings suggested that both the membrane permeability and
the activity of proton pumps were affected by high-pressure treatment.
Membrane and membrane-bound enzymes are a major target for the pressure inactivation of
microorganisms (Smelt et al., 1994). The reduction of internal pH, dissipation of K+-

Summary 88
membrane potential and inactivation of the membrane-bound enzyme LmrP corroborated this
hypothesis. The effects can be explained by direct denaturation, dissociation of the quaternary
structure or the dislocation of the enzyme from the membrane. Pressure causes phase
transitions of membrane lipids from the liquid crystalline phase to the gel phase (Ulmer et al.,
2002). Changes of membrane fluidity affect the activity of membrane-bound enzyme because
some transport proteins only function in a liquid crystalline membrane. In this case, cell
inactivation will occur if those changes are irreversible and the environmental conditions are
adverse.
This work provides evidence that primary pressure effects are related to or initiated by
changes of the phase behaviour and permeability of cytoplasmic membranes. These changes
occur fast during the build-up time of pressure and are often reversible at low pressures. They
cause the inactivation of multi-drug transport enzymes and dissipate the pH gradient, which
are important for the survival of microorganisms under adverse conditions encountered in
food (Gänzle et al., 2001). These insights into the mechanism of high-pressure inactivation
are especially relevant for the design of high-pressure processes for food preservation.

Zusammenfassung 89
6. Zusammenfassung
Das Ziel der Arbeit war die Untersuchung der Mechanismen der druckinduzierten
Wachstumshemmung und Zellinaktivierung von Lactococcus lactis. Während des
Wachstums, sowie während und nach der Hochdruckinaktivierung, wurden die Reaktionen
dieses Organismus auf Hochdruck charakterisiert. Dies ermöglichte die Unterscheidung
primärer und sekundärer Druckeffekte, sowie reversibler und irreversibler Reaktionen.
Die Empfindlichkeit unter subletalem Druck wurde bezüglich der chromosomalen Replikation
durch DAPI-Färbung und der FtsZ-Ringbildung durch Immunofluoreszenz untersucht.
Während des Wachstums unter Hochdruck traten Veränderungen der Zellmorphologie auf.
Die Zellen verlängerten sich, und die Zellteilung wurde beeinträchtigt. Die morphologischen
Veränderungen lassen vermuten, dass der Druck Auswirkungen auf einige der Cytoskelett-
oder Autolyse-Proteine hat. Da die Muramidase AcmA wesentlich zur Zellteilung beiträgt
und das einzige Autolysin in Lactococcus lactis ist, ist davon auszugehen, dass die
Biosynthese oder die Aktivität des AcmA-Enzyms beeinflusst wird. Die für die Zellteilung
notwendige Aggregation des FtsZ-Proteins wurde ebenfalls beeinträchtigt, während die DNA-
Replikation und Seggregation unabhängig von morphologischen Veränderungen waren. Eine
Erhöhung der Wachstumstemperatur bewirkte keine Verbesserung der Drucktoleranz des
Lactococcus lactis. Der bei Tiefseemikroorganismen beobachtete Adaptionsmechanismus für
höhere Temperaturen und Drücke wurde bei Milchsäurebakterien nicht beobachtet. Diesen
Bakterien fehlt die Fähigkeit, die Synthese von mehrfach gesättigten und einfach gesättigten
Fettsäuren zu regulieren.
Die Auswahl eines spezifischen Modells für die Untersuchung der
Hochdruckinaktivierungskinetik ist notwendig, um zukunftsweisende
Konservierungsstrategien in Lebensmitteln abzuleiten und das mikrobiologische Verhalten zu
ermitteln. Der für diese Arbeit etablierte Milchpuffer ermöglichte die Untersuchung von
Einzelfaktoren in einem lebensmittelähnlichen System unter definierten Bedingungen.
Drücke höher als 200 MPa waren effektiv für die Inaktivierung von Lactococcus lactis. Die
Inaktivierungskinetiken unterschiedlicher Stämme von Lactococcus lactis waren qualitativ
ähnlich. Alle Kurven zeigten eine sigmoide Form mit einer Schulter und einer
Inaktivierungsphase gefolgt von einem „Tailing“. Ein Anstieg des Druckes reduzierte die
Dauer der Schulter, hat aber keine Auswirkung auf das „Tailing“. Dieser „Tailing“-Effekt der
Hochdruckinaktivierung wurde durch die Untersuchung der Detektionszeit charakterisiert.
Die physiologische Variation der ursprünglichen Population wurde durch eine heterogene
Verteilung der Detektionszeit von unbehandelten Zellen nachgewiesen. Die Zeit, um die

Zusammenfassung 90
behandelten Zellen zu detektieren, verlängerte sich. Dieses Phänomen kann durch subletale
Schädigung oder die Anwesenheit von ruhenden Zellen in der ursprünglichen Kultur erklärt
werden. Die Baroresistenz der Zellen in „Tailing“ weist eher einen physiologischen als einen
genetischen Charakter auf, da die von Zellen aus dem „Tailing“ gezüchteten Kulturen keine
erhöhte Baroresistenz zeigten.
Die fluoreszenz-basierten und optischen Methoden waren gut geeignet für die Kennzeichnung
der Hochdruckauswirkungen auf Zellen von Lactococcus lactis. Ex situ und in situ Methoden
wurden angepasst, um die physiologischen Veränderungen der Zellen zu charakterisieren. Mit
Hilfe dieser Methoden gelang die Unterscheidung von primären und sekundären
Druckeffekten, reversiblen und irreversiblen Reaktionen, sowie von Reaktionen der
intrazellulären Organisation und der Physiologie. Es wurde gezeigt, dass Phänomene wie die
Reduzierung der Stoffwechselaktivität, die Membranschädigung, die Senkung des
intrazellulären pH-Wertes, der Verlust des Kaliummembranpotentials und die Inaktivierung
des membrangebunden Enzyms LmrP vor dem Zelltod auftreten. Deswegen kann die
Zellinaktivierung als sekundärer Effekt betrachtet werden, die nicht nur von Druck und
Druckhaltezeit, sondern auch von Milieubedingungen während und nach der
Hochdruckbehandlung abhängig ist.
Die Zugabe von ionischen und nicht-ionischen Osmolyten ergab eine Schutzfunktion gegen
die Hochdruckinaktivierung von Lactococcus lactis. Bei gleicher Molarität sind die
baroprotektiven Effekte von Saccharose stärker als die von Kochsalz ausgeprägt. Während
Saccharose die Stoffwechselaktivität, die Membranintegrität und die LmrP-Aktivität schützte,
trat für Salz keine Schutzfunktion hinsichtlich der metabolischen und der LmrP-Aktivitäten
auf. Aus dieser Arbeit ergaben sich Hinweise auf den Schutzmechanismus nicht-ionischer
Osmolyten: die intrazelluläre Akkumulation von Saccharose schützt die metabolischen
Enzyme und die Membranlipide während der Hochdruckbehandlung. Saccharose setzt die
Phasenübergangstemperatur der Membran herab. Die Vermutung liegt nahe, dass die
Schutzfunktion der Saccharose auf die Proteine auf den Ausschluss von Wasser
zurückzuführen ist. Die baroprotektiven Effekte von NaCl beruhen auf der Akkumulation von
Laktose und unbekannten „compatible solutes“ des Milchpuffers. Zugabe von Glycin Betain
zu dem Milchpuffer mit NaCl verbesserte den Schutzeffekt durch dessen Funktionalität als
„compatible solute“.
Eine Absenkung des pH-Wertes des Milchpuffers erhöhte die Druckempfindlichkeit der
Zellen. Mit der Abnahme des externen pH-Wertes wurde die Schulter der
Inaktivierungskinetik reduziert und die Inaktivierungsphase beschleunigt. In dieser Arbeit

Zusammenfassung 91
wurde die erste in situ Messung des internen pH-Wertes während der Hochdruckbehandlung
ausgeführt. Subletale Hochdruckbehandlungen senkten den intrazellulären pH-Wert auf den
externen pH-Wert ab. Die Absenkung des intrazellulären pH-Wertes erfolgte rasch bereits
während der Rampe und trat vor der Abnahme der Lebendkeimzahl auf. Die Abnahme der
Lebendkeimzahl war mit der Fähigkeit der Wiederherstellung des Membranpotentials (∆pH)
verbunden. Die Zugabe von Saccharose verbesserte diese Fähigkeit. Diese Erkenntnisse legen
nahe, dass sowohl die Membranpermeabilität als auch die Aktivität der Protonenpumpen
durch die Hochdruckbehandlung beeinflusst werden.
Membranen- und membranengebundene Enzyme sind wichtige Wirkungszentren der
Hochdruckinaktivierung von Mikroorganismen. Die Reduzierung des intrazellulären pH-
Wertes, der Verlust des Kaliummembranpotentials und die Inaktivierung des
membrangebundenen Enzyms LmrP unterstützen diese Hypothese. Auswirkungen lassen sich
durch unmittelbare Denaturierung, Dissoziation der quartären Struktur oder die Verlagerung
der Membranenzyme erklären. Druckbehandlung führt bei Membranlipiden zu
Phasenübergängen von der flüssig-kristallinen zur Gel-Phase. Veränderungen der
Membranfluidität beeinflussen die Aktivität membrangebundener Enzyme, da die
Funktionalität einiger Membrantransporter an einen flüssig-kristallinen Membranzustand
gebunden ist. In diesem Fall tritt die Zellinaktivierung bei irreversiblen Veränderungen ein,
wenn die Milieubedingungen ungünstig sind.
Diese Arbeit beweist, dass das Auftreten von primären Druckeffekten mit Veränderungen im
Phasenverhalten und der Permeabilität von Zytoplasmamembranen verbunden ist oder
dadurch initiiert wird. Die Veränderungen vollziehen sich schnell während der Zeit des
Druckaufbaus und sind bei niedrigem Druck oft reversibel. Sie führen zur Inaktivierung von
Multi-Drug-Transport-Enzymen und dem Verlust des pH-Gradienten der
Zytoplasmamembran. Beides ist bedeutend für das Überleben von Mikroorganismen unter
ungünstigen Bedingungen, wie sie in Lebensmitteln vorhanden sein können.
Diese Einblicke in den Mechanismus der Hochdruckinaktivierung sind von besonderem
Interesse für die Entwicklung von Hochdruckverfahren für die Konservierung von
Lebensmitteln.

References 92
7. References 1. Abe, F., Horikoshi, K. (1997) Vacuolar acidification in Saccharomyces cerevisiae
induced by elevated hydrostatic pressure is transient and is mediated by vacuolar H+-ATPase. Extremophiles 1:89-93.
2. Abe, F., Kato, C., Horikoshi, K. (1999) Pressure-regulated metabolism in
microorganisms. Trends Microbiol 7(11):447-453.
3. Abe, F., Horikoshi, K. (2000) Tryptophan permease gene TAT2 confers high-pressure growth in Saccharomyces cerevisiae. Molecular Cellular Biology 20(21):8093-8102.
4. Abe, F., Horikoshi, K. (2001) The biotechnological potential of piezophiles. Trends in
Biotechnology 19(3):83-122. 5. Alemán, G.D., Ting, E.Y., Mordre, S.C., Hawes, A.C.O., Walker, M., Farkas, D.F.,
Torres, J.A. (1996) Pulsed ultra high pressure treatments for pasteurization of pineapple juice. J Food Sci 61(2):388-390.
6. Allen, E.E., Facciotti, D., Bartlett, D.H. (1999) Monounsaturated but not
polyunsaturated fatty acids are required for growth of the deep-sea bacterium Photobacterium profundum SS9 at high pressure and low temperature Appl Environ Microbiol 65(4):1710-1720.
7. Alpas, H., Kalchayanand, N., Bozoglu, F., Sikes, A., Dunne, C.P., Ray, B. (1999)
Variations in resistance to hydrostatic pressure among strains of food-borne pathogens. Appl Environ Microbiol 65(9):4248-4251.
8. Alpas, H., Kalchayanand, N., Bozoglu, F., Ray, B. (2000) Interactions of high
hydrostatic pressure, pressurization, temperature and pH on death and injury of pressure-resistant and pressure-sensitive strains of foodborne pathogens. Int J Food Microbiol 60:33-42.
9. Anonymous (1999) Molecular Probes (1999) LIVE/DEAD BacLight Bacterial
Viability Kits, Product information, pp. 1-8. Eugene, OR, USA.
10. Augustin, J.C., Brouillaud-Delattre, A., Rosso, L., Carlier, V. (2000) Significance of inoculum size in the lag time of Listeria monocytogenes. Appl Environ Microbiol 66(4):1706-1710.
11. Bagatolli, L.A., Parasassi, T., Fidelio, G.D., Gratton, E. (1999) A model for the
interaction of 6-lauroyl-2-(N,N-dimethylamino)naphtalene with lipid environments: implications for spectral properties. Photochem Photobiol 70:557-564.
12. Baranyi, J., Roberts, T.A. (1995) Mathematics of predictive food microbiology. Int J
Food Microbiol 26:199-218.
13. Baranyi, J. (1998) Comparison of stochastic and deterministic concepts of bacterial lag. J theor Biol 192:403-408.

References 93
14. Baranyi, J., Pin, C. (1999) Estimating bacterial growth parameters by means of detection times. Appl Environ Microbiol 65(2):732-736.
15. Belguendouz, T., Cachon, R., Diviès, C. (1997) pH homeostasis and citric acid
utilization: differences between Leuconostoc mesenteroides and Lactococcus lactis. Current Microbiol 35:233-236.
16. Beney, L., Gervais, P. (2001) Influence of the fluidity of the membrane on the
response of microorganisms to environmental stresses. Appl Microbiol Biotechnol 57:34-42.
17. Bolhuis, H., Molenaar, D., Poelarends, G., van Veen, H.W., Poolman, B., Driessen,
A.J.M., Konings, W.N. (1994) Proton motive force-driven and ATP-dependent drug extrusion systems in multidrug resistant Lactococcus lactis. J Bacteriol 176:6957-6964.
18. Bolhuis, H., Poelarends, G., van Veen, H.W., Poolman, B., Driessen, A.J.M., Konings,
W.N. (1995) The lactococcal lmrP gene encodes a proton motive force-dependent drug transporter. J Biol Chem 270:26092-26098.
19. Bolhuis, H., van Veen, H.W., Brands, J.R., Putman, M., Poolman, B., Driessen,
A.J.M., Konings, W.N. (1996) Energetics and mechanism of drug transport mediated by the lactococcal multidrug transport LmrP. J Biological Chemistry 271(39):24123-24128.
20. Born, M. (1920) Volumen und Hydratationswärme der Ionen. Z Physik 1:45.
21. Breeuwer, P., Drocourt, J.L., Bunschoten, N., Zwietering, H.M., Rombouts, F., Abee,
T. (1995) Characterization of uptake and hydrolysis of fluorescein diacetate and carboxyfluorescein diacetate by intracellular esterases in Saccharomyces cerevisiae, which result in accumulation of fluorescent product. Appl Environ Microbiol 61:1614-1619.
22. Breeuwer, P., Drocourt, J.L., Rombouts, F., Abee, T. (1996) A novel method for
continuous determination of the intracellular pH in bacteria with the internally conjugated fluorescent probe 5 (and 6-)-carboxyfluorescein succinimidyl ester. Appl Environ Microbiol 62:178-183.
23. Buchanan, R.L., Whiting, R.C., Damert, W.C. (1997) When is simple good enough: a
comparison of the Gompertz, Baranyi, and three-phase linear models for fitting bacterial growth curves. Food Microbiol 14:313-326.
24. Buist, G., Kok, J., Leenhouts, K.J., Dabrowska, M., Venema, G., Haandrikman, A.J.
(1995) Molecular cloning and nucleotide sequence of the gene encoding the major peptidoglycan hydrolase of Lactococcus lactis, a muramidase needed of cell separation J Bacteriology 177(6):1554-1563.
25. Butz, P., Ries, J., Traugott, U., Weber, H., Ludwig, H. (1990)
Hochdruckinaktivierung von Bakterien und Bakteriensporen. Pharm Ind 52:487-491.

References 94
26. Canganella, F., Gonzalez, J.M., Yanagibayashi, M., Kato, C., Horikoshi, K. (1997) Pressure and temperature effects on growth and viability of the hyperthermophilic archaeon Thermococcus peptonophilus. Arch Microbio 168:1-7.
27. Carlez. A., Cheftel, J.C., Rosec, J.P., Richard, N., Saldana, J.L., Balny, C. (1992)
Effects of high pressure and bacteriostatic agents on the destruction of Citrobacter freundii in minced beef muscle. In: High Pressure and Biotechnology. Eds. Balny, C., Hayashi, R., Heremans, K., Masson, P. INSERM and John Libbey. Paris, p. 365-368.
28. Carlez, A., Rosec, J.P., Richard, N., Cheftel, J.C. (1993) High pressure inactivation of
Citrobacter freundii, Pseudomonas fluorescens and Listeria innocua in inoculated minced beef muscle. Lebensm Wiss Technol 26:357-363.
29. Casal, V., Gómez, R. (1999) Effect of high pressure on the viability and enzymatic
activity of mesophilic lactic acid bacteria isolated from caprine cheese. J Dairy Sci 82:1092-1098.
30. Cheftel, J.C. (1995) Review: high-pressure, microbial inactivation and food
preservation. Food Sci Technol Int 1:75-90.
31. Clarke, A.P., Jandik, P., Rocklin, R.D., Liu Y., Avdalovic, N. (1999) An integrated amperometry waveform for the direct, sensitive detection of amino acids and amino sugars following anion-exchange chromatography. Anal Chem 71:2774-2781.
32. Crowe, J.H., Crowe, L.M., Carpenter, J.F., Rudolph, A.S., Aurell Winstrom, C.,
Spargo, B.J., Anchordoguy, T.J. (1988) Interaction of sugars with membranes. Biochim Biophys Acta 947:367-384.
33. Crowe, J.H., Oliver, A.E., Hoekstra, F.A., Crowe, L.M. (1997) Stabilization of dry
membranes by mixtures of hydroxyethyl starch and glucose: the role of vitrification. Criobiology 35:20-30.
34. Davies, F.L., Underwood, H.M., Gasson, M.J. (1981) The value of plasmid profiles
for strain identification in lactic streptococci and the relationship between Streptococcus lactis 712, ML3, and C2. J Appl Bacteriol 51:325-337.
35. Delong, E.F., Yayanos, A.A. (1985) Adaptation of the membrane lipids of a deep-sea
bacterium to changes in hydrostatic pressure. Science 228:1101-1103.
36. De Man, J.D., Rogosa, M., Sharpe, M.E. (1960) A medium for the cultivation of lactobacilli. J Appl Bacteriol 23:130-135.
37. Earnshaw, R.G. (1995) Kinetics of high pressure inactivation of microorganism. In:
High Pressure Processing of Foods. Eds. Ledward, D.A., Johnston, D.E., Earnshaw, R.G., Hasting, A.P.M. Nottingham University Press. Nottingham, p.37.
38. El'yanov, B.S., Hamann, S.D. (1975) Some quantitative relationships for ionization
reactions at high pressures. Austral J Chem 28:945-954.
39. Erickson, H.P. (1997) FtsZ, a tubulin homologue in prokaryote cell division. Trends in Cell Biology 7:362-367.

References 95
40. Erkmen, O. (2000) Inactivation of Salmonella typhimurium by high pressure carbon dioxide. Food Microbiol 17:225-232.
41. Foucaud, C., Francois, A., Richard, J. (1997) Development of a chemically defined
medium for the growth of Leuconostoc mesenteroids. Appl Environ Microbiol, 63(1):301-304.
42. Fujii, S., Obuchi, K., Iwahashi, H., Fujii, T., Komatsu, Y., (1996) Saccharides protect
yeast against pressure correlated to the mean number of equatorial OH groups. In: High Pressure Bioscience and Biotechnology. Eds. Hayashi, R., Balny, C. Elsevier. Amsterdam, p. 245-252.
43. Gänzle, M.G., Ehmann, M., Hammes, W.P. (1998) Modeling of growth of
Lactobacillus sanfranciscensis and Candida milleri in response to process parameters of sourdough fermentation. Appl Environ Microbiol 64(7):2616-2623.
44. Gänzle, M.G., Vogel, R.F. (2001) On-line fluorescence determination of pressure
mediated outer membrane damage in Escheriachia coli. Systematic Appl Microbiol 24:477-485.
45. Gänzle, M.G., Ulmer, H.M., Vogel, R.F. (2001) High pressure inactivation of
Lactobacillus plantarum in a model beer system. J Food Sci 66:1174-1181.
46. Garcia-Graells, C., Hauben, K.J.A., Michiels, C.W. (1998) High-pressure inactivation and sublethal injury of pressure-resistant Escherichia coli mutants in fruit juices. Appl Environ Microbiol 64:1566-1568.
47. Garvie, E.I., Farrow, J.A.E. (1982) Streptococcus lactis subsp. cremoris (Orla-Jensen)
comb. nov. and Streptococcus lactis subsp. diacetilactis (Matuszewski et al.) nom. rev., comb. nov. Int J Syst Bacteriol 32:453-455.
48. Gasson, M.J. (1983) Plasmid complements of Streptococcus lactis NCDO 712 and
other lactic streptococci after protoplast-induced curing. J Bacteriol 154(1):1-9.
49. Gibbs, A., Somero, G.N. (1989) Pressure adaptation of Na+/K+-ATPase in gills of marine teleosts. J Exp Biol 143:475-92.
50. Glaasker, E., Tjan, F.S.B., Ter Steeg, P.F., Konings, W.N., Poolman, B. (1998)
Physiological response of Lactobacillus plantarum to salt and nonelectrolyte stress. J Bacteriol 180(17):4718-4723.
51. Gross, M., Lehle, K., Jaenicke, R., Nierhaus, N.H. (1993) Pressure-induced
dissociation of ribosomes and elongation cycle intermediates. Stabilizing conditions and identification the most sensitive functional state. Eur J Biochem 218(2):463-468.
52. Gross, M., Jaenicke, R. (1994) Proteins under pressure. The influence of high hydrostatic pressure on structure, function and assembly of proteins and protein complexes. Eur J Biochem 221(2):617-630.

References 96
53. Hashizume, C., Kimura, K., Hayashi, R. (1995) Kinetic analysis of yeast inactivation by high pressure treatment at low teperatures. Biosci Biotechnol Biochem 59:1455-1458.
54. Hass, G.J., Prescott, H.E., Dudley, E., Dik, R., Hintlian, C., Keane, L. (1989)
Inactivation of microorganisms by carbon dioxide under pressure. J Food Safety 9:253-265.
55. Hauben, K.J.A., Wuytack, E.Y., Soontjens, C.C.F., Michiels, C.W. (1996) High-
pressure transient sensitization of Escherichia coli to lysozyme and nisin by disruption of outer-membrane permeability. J Food Protection 59(4):350-355.
56. Haugland, R. P. (1992) Succinimidyl esters and carboxylic acids. In: Handbook of
fluorescent probes and research chemicals. Ed. Larison, K.D. Molecular Probes Inc., Eugene, Oregon, p. 24-33
57. Hayakawa K, Ueno Y, Nakanishi S, Miyano Y, Kikushima S, Shou S (1994) High
pressure treatment for preservation of shiromiso. In: High Pressure Bioscience (Hayashi R, Kunigi S, Shimada S, Suzuki A, eds.), pp. 320-327. Kyoto: San-Ei Suppan Co.
58. Hayakawa, K., Ueno, Y., Kawamura, S., Kato, T., Hayashi, R. (1998) Microorganism
inactivation using high-pressure generation in sealed vessels under sub-zero temperature. Appl Microbiol Biotechnol 50:415-418.
59. Heinz, V., Knorr, D. (1996) High pressure inactivation kinetics of Bacillus subtilis
cells by a three-state-model considering distributed resistance mechanisms. Food Bitoechnol 10(2):149-161.
60. Heremans, K. (1995) High pressure effects on biomolecules. In: High Pressure
Processing of Foods. Eds. Ledward, D.A., Johnston, D.E., Earnshaw, R.G., Hasting, A.P.M. Nottingham University Press. Nottingham, p.81.
61. Hong, S.I., Park, W.S., Pyun, Y.R. (1997) Inactivation of Lactobacillus sp. From
Kimchi by high pressure carbon dioxide. Lebensm Wiss Technol 30:681-685.
62. Isaacs, N.S., Chilton, P., Mackey, B. (1995) Studies on the inactivation by high pressure of microorganisms, In: High Pressure Processing of Foods. Eds. D.A. Ledward, D.E. Johnston, R.G. Earnshaw, A.P.M. Hasting, Nottingham University Press, Nottingham, p. 65.
63. Iwahashi, H., Obuchi, K., Fujii, S., Komatsu, Y. (1997a) Barotolerance is dependent
on both trehalose and heat shock protein 104 but is essentially different from thermotolerance in Saccharomyces cerevisiae. Lett Appl Microbiol 25:43-47.
64. Iwahashi, H., Obuchi, K., Fujii, S., Komatsu, Y. (1997b) Effect of temperature on the
role of Hsp104 and trehalose in barotolerance of Saccharomyces cerevisiae. FEBS Lett 416:1-5.

References 97
65. Iwahashi, H., Nwaka, S., Obuchi, K. (2000) Evidence of contribution of neutral trehalasa in barotolerance of Saccharomyces cerevisiae. Appl Environ Microbiol 66(12):5182-5185.
66. Jordan, S.L., Cascual, C., Bracey, E., Mackey, B.M. (2001). Inactivation and injury of
pressure-resistant strains of Escherichia coli O157 and Listeria monocytogenes in fruit juices. J Appl Microbiol 91:463-469.
67. Kalchayanand, N., Sikes, A., Dunne, C.P., Ray, B. (1998a) Interaction of hydrostatic
pressure, time and temperature of pressurization and pediocin AcH on inactivation of foodborne bacteria. J Food Proteccion 61(4):425-431.
68. Kalchayanand, N., Sikes, A., Dunne, C.P., Ray, B. (1998b) Factors influencing death
and injury of foodborne pathogens by hydrostatic pressure pasteurization. Food Microbiol 15:207-214.
69. Karaman, H., Erkmen, O. (2001) High carbon dioxide pressure inactivation kinetics of
Escherichia coli in broth. Food Microbiol 18:11-16.
70. Karatzas, A.K., Kets, E.P.W., Smid, E.J., Bennik, M.H.J. (2001) The combined action of carvacrol and high hydrostatic pressure on Listeria monocytogenes Scott A. J Appl Microbiol 90:463-469.
71. Kato, C., Sato, T., Horikoshi, K. (1995) Isolation and properties of barophilic and
barotolerant bacteria from deep-sea mud samples. Biodiv Conserv 4:1-9.
72. Kato, C., Barlett, D.H. (1997) The molecular biology of barophilic bacteria. Extremophiles 1:111-116.
73. Kato, C., Nakasone, K., Qureshi, M.H., Horikoshi, K. (2000) How do deep-sea
microorganisms respond to changes in environmental pressure? In: Environmental stressors and gene responses. Eds. Storey, K.B., Storey, J. p. 277-291.
74. Kets, E.P.W., Groot, M.N., Galinski, E.A., De Bont, J.A.M. (1997) Choline and
acetylcholine: novel cationic osmolytes in Lactobacillus plantarum. Appl Microbiol Biotechnol 48:94-98.
75. Kilstrup, M., Jacobsen, S., Hammer, K., Vogensen, F.K. (1997) Induction of heat
shock proteins Dank, GroEL, and GroES by salt stress in Lactococcus lactis. Appl Environ Microbiol 63(5):1826-1837.
76. Kitamura, Y., Itoh, T. (1987) Reaction volume of protonic ionization for buffering
agents. Prediction of pressure dependence of pH and pOH. J Solution Chem 18(9): 715-725.
77. Kline, L., Sugihara, T.F. (1971) Microorganisms of the San Francisco sour dough
bread process. II. Isolation and characterization of undescribed bacterial species responsible for the souring activity. Appl Microbiol 21:459-465.
78. Knorr, D. (1993) Effects of high-hydrostatic pressure processes on food safety and
quality. Food Technol 47(6):156-161.

References 98
79. Knorr, D. (1994) Hydrostatic pressure treatment of food: microbiology. In: New Methods of Food Preservation. Ed.Gould, G.W. Blackie. London, p. 159-175.
80. Korakli, M., Gänzle, M.G., Knorr, R., Frank, M., Rossmann, A., Vogel, R.F. (2002)
Metabgolism of Lactobacillus sanfranciscensis under high-pressure: investigations using stable carbon isotopes. In: Trends in High Pressure Bioscience and Biotechnology. Ed. Hayashi, R. Elsevier. Amsterdam, p. 287-294.
81. Langsrud, T., Landaas, A., Castberg, H.B. (1987) Autolytic properties of different
strains of group N streptococci. Milchwissenschaft 42:689-685.
82. Le Bourgeois, P., Lautier, M., van den Berghe, L., Gasson, M.J., Ritzenthaler, P. (1995) Physical and genetic map of the Lactococcus lactis subsp. cremoris MG1363 chromosome: comparison whit that of Lactococcus lactis subsp. lactis IL 1403 reveals a large genome inversion. J Bacteriol 177(10);2840-2850.
83. Leslie, S.B, Israeli, E., Lighthart, B., Crowe, J.H., Crowe, L.M. (1995) Trehalose and
sucrose protect both membranes and proteins in intact bactteria during drying. Appl Environ Microbiol 61(10);3592-3597.
84. Lorenz, R. (1993) Kultivierung mariner Pilze unter erhöhtem hydrostatischem Druck.
Dissertation, University of Regensburg, Germany.
85. Losick, R., Shapiro, L. (1999) Changing views on the nature of the bacterial cell: from biochemistry to cytology. J Bacteriology 181(14):4143-4145.
86. Lown, D. A., Thiersk, H.R., Wynne-Jones, L. (1970) Temperature and pressure
dependence of volume of ionization of acetic acid in water from 25 to 225°C and 1 to 3000 bars. Trans Faraday Soc 66:51.
87. Ludwig, H., Bieller, C., Hallbauer, K., Scigalla, W. (1992) Inactivation of
microorganisms by hydrostatic pressure. In: High Pressure and Biotechnlogy. Eds. Balny, C., Hayashi, R., Heremans, K., Masson, P. Colloque INSERM. John Libbey Eurotext. Montrouge, Vol. 224, p. 25-32.
88. Mackey, B.M., Derrick, C.M. (1982) The effect of sublethal injury by heating,
freezing, drying and gamma-radiation on the duration of the lag phase of Salmonella typhimurium. J Appl Bacteriol 53:243-251.
89. Mackey, B.M., Derrick, C.M. (1984) Conductance measurements of the lag phase of
injured Salmonella typhimurium. J Appl Bacteriol 57:299-308.
90. Mackey, B.M., Forestiera, K., Isaacs, N. (1995) Factors affecting the resistance of Listeria monocytogenes to high hydrostatic pressure. Food Biotechnol 9(1/2):1-11.
91. Marquis, R.E. (1984) Reversible actions of hydrostatic pressure and compressed gases
on microorganisms. In: Repairable lesions in microorganisms. Eds. Hurst, A., Nasim, A. Academic Press Inc. London, p. 273-301.

References 99
92. Marteinsson, V.T., Moulin, P., Birrien, J.L., Gambacorta, A., Vernet, M., Prieur, D. (1997) Physiological responses to stress conditions and barophilic behavior of the hyperthermophilic vent Archaeon Pyrococcus abyssi. Appl Environ Microbiol, 63(4):1230-1236.
93. Masschalck, B., García-Graells, C., Van Haver, E.G.R., Michiels, C.W. (2000)
Inactivation of high pressure resistant Escheriachia coli by lysozyme and nisin under high pressure. Innov Food Sci Emerg Technol 1:39-47.
94. Masschalck, B., Van Houdt, R., Van Haver, E.G.R., Michiels, C.W. (2001)
Inactivation of gram-negative bacteria by lysozyme, denatured lysozyme, and lysozyme-derived peptides under high hydrostatic pressure. Appl Environ Microbiol 67(1):339-344.
95. Masschalck, B., Van Houdt, R., Michiels, C.W. (2001) High pressure increases
bactericidal activity and spectrum of lactoferrin, lactoferricin and nisin. Int J Food Microbiol 64:325-332.
96. McDonald, I.J. (1971) Filamentous forms of Streptococcus cremoris and
Streptococcus lactis: observations on structure and susceptibility to lysis. Can J Microbiol 17:897-902.
97. McKellar, R.C., Knight, K. (2000) A combined discrete-continuous model describing
the lag phase of Listeria monocytogenes. Int J Food Microbiol 54:171-180.
98. Metrick, C., Hoover, D.G., Farkas, D.F. (1989) Effects of high hydrostatic pressure on heat-resistant and heat-sensitive strains of Salmonella. J Food Sci 54:1547-1549,1564.
99. Molenaar, D., Bolhuis, H., Abee, T., Poolman, B., Konings, W.N. (1992) The efflux
of a fluorescent probe is catalyzed by an ATP-driven extrusion system in Lactococus lactis. J Bacteriol 174(10):3118-3124.
100. Molenaar, D., Hagting, A., Alkema, H., Driessen, A.J.M., Konings, W.N. (1993)
Characteristics and osmoregulatory roles of uptake systems for proline and glycine beteine in Lactococcus lactis. J Bacteriol 175(17):5438-5444.
101. Moriya, K., Inada, T., Kyo, M., Horikoshi, K. (1995) Large-scale fermentation under
high hydrostatic pressure using a newly developed Deep-sea Baro/Thermophile collection and cultivation system. J Mar Biotechnol 2:175-177.
102. Mossel, D.A.A., Corry, J.E.L., Struijk, C.B., Baird, R.M. (1995) In: Essentials of the
microbiology of foods. Eds. Mossel, D.A.A., Corry, J.E.L., Struijk, C.B., Baird, R.M. John Wiley and Sons. Chicester, New York, p. 88-89.
103. Mozhaev, V.V., Heremans, K., Frank, J., Masson, P., Balny, C. (1994) Exploiting the
effects of high hydrostatic pressure in biotechnological application. Trends Biotechnol 12:493-501.
104. Nannen, N.L., Hutkins, R.W. (1991) Proton-translocating adenosine triphosphatase
activity in lactic acid bacteria. J Dairy Sci 74:747-751.

References 100
105. Niven, G.W., Miles, C.A., Mackey, B.M. (1999) The effects of hydrostatic pressure on ribosome conformation in Escherichia coli: an in vivo study using differential scanning calorimetry. Microbiology 145:419-425.
106. Obis, D., Guillot, A., Gripon, J.C., Renault, P., Bolotin, A., Mistou, M.Y. (1999)
Genetic and biochemical characterization of a high-affinity betaine uptake system (Bus A) in Lactococcus lactis reveals a new functional organization within bacterial ABC transporter. J Bacteriol 181(20):6238-6246.
107. Ogawa, H., Fukuhisa, K., Kubo, Y., Fukumoto, H. (1990) Pressure inactivation of
yeast, molds, and pectinesterase in Satsuma mandarin juice: effects of juice concentration, pH, organic acids, and comparison with heat sanitation. Agric Biol Chem 54:1219-1225.
108. Owen, B.B, Brinkley, S.R. (1941) Calculation of the effect of pressure upon ionic
equilibria in pure water and in salt solutions. Chem Rev 29:461-474.
109. Oxen, P., Knorr, D. (1993) Baroprotective effects of high solute concentrations against inactivation of Rhodoturula rubra. Lebensm Wiss Technol 26:220-223.
110. Pagán, R., Mackey, B. (2000) Relationship between membrane damage and cell death
in pressure-treated Escherichia coli cells: differences between exponential- and stationary-phase cells and variation among strains. Appl Environ Microbiol 66(7):2829-2834.
111. Pagán, R., Jordan, S., Benito, A., Mackey, B. (2001) Enhanced acid sensitivity of
pressure-damaged Escherichia coli 0157 cells. Appl Environ Microbiol 67(4):1983-1985.
112. Palou, E., López-Malo, A., Barbosa-Cánovas, G.V., Welti-Chanes, J., Swanson, B.G.
(1997) Combined effect of high hydrsotatic pressure and water activity on Zygosaccharomyces bailii inhibition. Lett Appl Microbiol 24: 417-420.
113. Palou, E., López-Malo, A., Barbosa-Cánovas, G.V., Swanson, G. (1999) High-
pressure treatment in food preservation. In: Handbook of food preservation Ed. Rahman, M.S. Marcel De, Inc. New York-Basel.
114. Papineau, A.M., Hoover, D.G., Knorr, D., Farkas, D.F. (1991) Antimicrobial effect of
water-soluble chitosans with high hydrostatic pressure. Food Biotechnol 5(1):45-57.
115. Parasassi, T., de Stasio, G., d´Ubaldo, Gratton, E. (1990) Phase fluctuation in phospholipid membranes revealed by Laurdan fluorescence. Biophys J 57:1179-1186.
116. Parasassi, T., de Stasio, G., Ravagnan, G., Rusch, R.M., Gratton, E. (1991)
Quantitation of lipid phases in phospholipid vesicles by the generalized polarization of Laurdan fluorescence. Biophys J 60:179-189.
117. Parasassi, T., Gratton, E. (1995) Membrane lipid domains and dynamics as detected
by Laurdan fluorescence. J Fluoresc 5:59-68.

References 101
118. Parasassi, T., Krasnowska, E.K., Bagatolli, L., Gratton, E. (1998) Laurdan and Prodan as polarity-sensitive fluorescent membrane probes. J Fluoresc 8:365-373.
119. Park, S.W., Sohn, K.H., Shin, J.H., Lee, H.J. (2001) High hydrostatic pressure
inactivation of Lactobacillus viridscens and its effects on ultrastructure of cells. Int J Food Sci Technol 36:775-781.
120. Patterson, M.F., Quinn, M., Simpson, R., Gilmour, A. (1995) Effects of high pressure
on vegetative pathogens. In: High Pressure Processing of Foods. Eds. Ledward, D.A., Johnston, D.E., Earnshaw, R.G., Hasting, A.P.M. Nottingham University Press. Nottingham, p. 47-63.
121. Patterson, M.F., Quinn, M., Simpson, R., Gilmour, A. (1995) The sensitivity of
vegetative pathogens to high hydrostatic pressure pressure treatment in phosphate buffered saline and foods. J Food Prot 58:529-542.
122. Perrier-Cornet, J.P., Marénchal, P.A., Gervais, P. (1995) A new design intended to
relate high pressure treatment to yeast cell mass transfer. J Biotechnol 41-49.
123. Putman, M., van Veen, H.W., Poolman, B., Konings, W.N. (1999a) Restrictive use of detergents in the functional reconstitution of the secondary multidrug transporter LmrP. Biochemistry 38(3):1002-1008.
124. Putman, M., Koole, L.A., van Veen, H.W., Konings, W.N. (1999b) The secondary
multidrug transporter LmrP contains multiple drug interaction sites. Biochemistry 38(42):13900-13905.
125. Rademacher, B. (1999) Hochdruckbehandlung von Milch, Untersuchungen zur
Inaktivierung von Mikroorganismen und Enzymen und deren kinetische Beschreibung. Dissertation, Technische Universität München, Germany.
126. Raffalli, J., Rosec, J.P., Carlez, A., Dumay, E., Richard, N., Cheftel, J.C. (1994) Stress
et inactivation par haute pression de Listeria innocua introduites dans une crème laitière. Sci Aliment 14:349-358.
127. Reis, O., Winter, R., Zerda, T.W. (1996) The effect of high external pressure on
DPPC-cholesterol multilamellar vesicles: a pressure-tuning Fourier transform infrared spectroscopy study. Biochim Biophys Acta 1279:5-16.
128. Rosenthal, A., Mackey, B., Bird, A. (2002) Effect of ultra-high pressure on fruit juices
contaminant yeast. Trends in High Pressure Bioscience and Biotechnology Ed. R. Hayashi. Elsevier. Amsterdam, p. 511-516.
129. Ritz, M., Jugiau, F., Rama, F., Courcoux, P., Semenou, M., Federighi, M. (2000)
Inactivation of Listeria monocytogenes by high hydrostatic pressure : effects and interactions of treatment variables sutided by analysis of variance. Food Microbiology 17:375-382.
130. Ritz, M., Tholozan, J.L., Federighi, M.,Pilet, M.F. (2001) Morphological and
physiological characterization of Listeria monocytogenes subjected to high hydrostatic pressure. Appl Environ Microbiol 67(5):2240-2247.

References 102
131. Sato, M., Kobori, H., Ishijima, S.A., Feng, Z.H., Hamada, K., Shimada, S., Osumi, M. (1996a) Schizosaccharomyces pombe is more sensitive to pressure stress than Saccharomyces cerevisiae. Cell Struct Fun 21:167.
132. Sato, T., Nakamura, Y., Nakashima, K.K., Kato, C., Horikoshi, K. (1996b) High
pressure represses expression of the malB operon in Escherichia coli. FEMS Microbiology Letters 135:111-116.
133. Sato, T., Miwa, T., Ishii, A., Kato, C., Wachi, M., Nagai, M., Aizawa, M., Horikoshi
K. (2002) The dynamism of Escherichia coli under high hydrostatic pressure repression of the FtsZ-ring formation and chromosomal DNA condensation. In: Trends in High Pressure Bioscience and Biotechnology. Ed. Hayashi, R. Elsevier. Amsterdam, p. 233-238.
134. Scheyhing, C. (2002) Dissertation, Technische Universität München, Germany. 135. Schweininger, M. (2002) Überleben hochdruckbehandelter Milchsäurebakterien in
Lebensmitteln während der Lagerung. Diplomarbeit, Technische Universität München, Germany.
136. Siegumfeldt, H., Rechingerand, K.B., Jakobsen, M. (2000) Dynamic changes of intracellular pH in individual lactic acid bacterium cells in response to a rapid drop in extracellular pH. Appl Environ Microbiol 66:2330-2335.
137. Smelt, J.P.P.M., Rijke, A.G.F., Hayhurst, A. (1994) Possible mechanism of high-
pressure inactivation of microorganisms. High Pressure Res. 12:199-203.
138. Smelt, J.P.P.M. (1998) Recent advances in the microbiology of high pressure processing. Trends Food Sci Technol 9:152-158.
139. Smelt, J.P.P.M., Otten, G.D., Bos, A.P. (2002) Modelling the effect of sublethal injury
on the distribution of the lag times of individual cells of Lactobacillus plantarum. Int J Food Microbiol 73:207-212.
140. Smelt, J.P.P.M., Hellemons, J.C., Brul, S. (2002) Physiological aspects of pressure
decontamination in building inactivation models. In: Trends in High Pressure Bioscience and Biotechnology. Ed. Hayashi, R. Elsevier. Amsterdam, p. 487-496.
141. Snyder, G.R. (1961) Vibrational spectra of crystalline n-paraffins. J Mol Spectrosc
7:116-144. 142. Somero, G.N. (1992) Adaptations to high hydrostatic pressure. Annu Rev Physiol
54:557-577.
143. ter Steeg, P.F., Hellemons, J.C., Kok, A.E. (1999) Synergistic actions of nisin, sublethal ultrahigh pressure, and reduced temperature on bacteria and yeast. Appl Environ Microbiol 65(9):4148-4154.
144. Stephens, P.J., Joynson, J.A., Davies, K.W., Holbrook, R., Lappin-Scott, H.M.,
Humphrey, T.J. (1997) The use of an automated growth analyser to measure recover times of single heat-injured Salmonella cells. J Appl Microbiol 83(4):445-455.

References 103
145. Stewart, C.J., Jewett, F.F., Dunne, C.P., Hoover, G.H. (1997) Effect of concurrent high hydrostatic pressure, acidity and heat on the injury and destruction of Listeria monocytogenes. J Food Safety 17:23-36.
146. Stolz, P., Böcker, G., Hammes, W.P., Vogel, R.F. (1995) Utilization of electron
acceptors by lactobacilli isolated from sourdough I. Lactobacillus sanfrancisco. Z Lebensm Unters Forsch 201:91-96.
147. Styles, M.F., Hoover, D.G., Farkas, D.F. (1991) Response of Listeria monocytogenes
and Vibrio parahemolyticus to high hydrostatic pressure. J Food Sci 56:1404-1407.
148. Sugihara, T.F., Kline, L. (1975) Further studies on a growth medium for Lactobacillus sanfrancisco. J Milk Food Technol 38:667-672.
149. Sun, Q., Margolin, W. (1998) FtsZ Dynamics during the division cycle of live
Escherichia coli cells. J Bacteriology 180(8):2050-2056.
150. Takahashi K, Ishii H, Ishikawa H (1993) Sterilization of bacteria and yeast by hydrostatic pressurization at low temperature: effect of temperature, pH and the concentration of proteins, carbohydrates and lipids. In: High Pressure Bioscience and Food Science. Ed. Hayashi, R. San-Ei Pub. Co. Kyoto, p. 244-249.
151. Takahashi, Y., Ohta, H., Yonei, H., Ifuku, Y. (1993) Microbicidal effect of hydrostatic
pressure on satsuma mandarin juice. Int J Food Sci Technol 28:95-102.
152. Tamura, K., Otani, N., Fukumura, S. (1992) Reduced barotolerance and thermotolerance of heat-shocked yeast in medium containing ethanol. In: High pressure and biotechnology. Eds. Balny, C., Hayashi, R., Heremans, K., Masson, P.. Colloque INSERM. John Libbey Eurotext. Montrouge, Vol. 224, p. 309-313.
153. Tanaka, T., Burgess, J.G., Wright, P.C. (2001) High-pressure adaptacion by salt stress
in a moderately halophilic bacterium obtained from open seawater. Appl Microbiol Biotechnol 57:200-204.
154. Tauscher, B. (1995) Pasteurization of food by hydrostatic pressure: chemical aspect. Z
Lebensm Unters Forsch 200:3.
155. Terzaghi, B.E., Sandine, W.E. (1975) Improved medium for lactic streptococci and their bacteriophages. Appl Microbiol 29:807-813.
156. Tewari, G., Jayas, D.S., Holley, R.A. (1999) High pressure processing of foods: an
overview. Sciences des Aliments 19:619-661.
157. Timasheff, S.N., Lee, J.C., Pittz, E.P., Tweedy, N. (1976) The interaction of tubulin and other proteins with structure-stabilizing solvents. J Colloid Inter Sci 55:658-663.
158. Thom, S.M., Horobin, R.W., Seidler, E., Barer, M.R. (1993) Factors affecting the
selection and use of tetrazolium salts as cytochemical indicators of microbial viability and activity. J Appl Bacteriol 74:433-443.

References 104
159. Ulmer, H.M, Gänzle, M., Vogel, R. (2000) High pressure effects on survival and metabolic activity of Lactobacilllus plantarum TMW1.460. Appl Environ Microbiol 66(9):3966-3973.
160. Ulmer, H.M., Herberhold, H., Fahsel, S., Gänzle, M.G., Winter, R., Vogel, R.F.
(2002) Effects of pressure induced membrane phase transitions on inactivation of HorA, an ATP-dependent multidrug resistance transporter, in Lactobacillus plantarum. Appl Environ Microbiol 68(3):1088-1095.
161. van der Heide, T., Poolman, B. (2000) Glycine betaine transport in Lactococcus lactis
is osmotically regulated at the level of expression and translocation activity. J Bacteriol 182(1):203-206.
162. van Schothorst, M., van Leusden, F.M. (1975) Further studies on the isolation of
injured salmonellae from foods. Zentralblatt für Bakteriologie, Parasitenkunde, Infektionskrankheiten und Hygiene, Abt. 1, Originale A 230:186-191.
163. Walsh, S., Lappin-Scott, H.M., Stockdale, H., Herbert, B.N. (1995) An assessment of
the metabolic activity of starved and vegetative bacteria using two redox dyes. J Microbiological Methods 24:1-9.
164. Welch, T.J., Farewell, A., Neidhardt, F.C., Barlett, D.H. (1993) Stress response of
Escherichia coli to elevated hydrostatic pressure. J Bacteriol 175(22):7170-7177.
165. Wouters, P.C., Glaasker, E., Smelt, J.P.P.M. (1998) Effects of high-pressure on inactivation kinetics and events related to proton efflux in Lactobacillus plantarum. Appl Environ Microbiol 64(2):509-514.
166. Wu, Y., Griffiths, M.W., McKellar, R.C. (2000) A comparison of the Bioscreen
method and microscopy for the determination of lag times of individual cells of Listeria monocytogenes. Lett Appl Microbiol 30:468-472.
167. Yayanos, A.A., Pollard, E.C. (1969) A study of the effects of hydrostatic pressure on
macromolecular synthesis in Escherichia coli. J Biophysics 9:1464-1482.

Mein besonderer Dank gilt
Herrn Prof. Dr. R. F. Vogel für die Überlassung des Themas, die zahlreichen Anregungen und
die fachlichen Diskussionen.
Herrn Prof. Dr.-Ing. A. Delgado für seine motivierende Unterstützung und die Tätigkeit als
Vorsitzender der Prüfungskommission.
Dr. Michael Gänzle für seine ausgezeichnete Betreuung, die zahlreichen Diskussionen in den
gemeinsamen Raucherpausen und die kritischen Korrekturen des Manuskripts.
Dr. Helge Ulmer für seine Weitergabe der Methoden und die thematische Einarbeitung.
Dr. Chiaki Kato und Dr. Takako Sato für ihre Unterstürzung, Hilfe und Betreuung während
meines Aufenthalts am JAMSTEC.
Dem Lehrstuhl für Technische Mikrobiologie für die schönen 3 Jahre: Angi, Andreas,
Claudia, Claudin, Dirk, Ellen, Helge U., Holger, Georg W., Georg, Ludwig, Maher, Markus,
Matthias, Michael, Monika, Rudi, Sandy, Uli.
Angi, Sandy, Georg, Natalie, Sibylle, Uli, Ersan, Frank und Helge für ihre tolle Freundschaft
und die gemeinsam verbrachte Zeit.
Bernhard, Klaus, Dominika, Sabine, Michaela, Lydia, Micha für ihre guten Semester- und
Diplomarbeiten, ihre Beiträge zu dieser Arbeit und die lustige Zusammenarbeit.
Volker Stippel für seinen Beitrag zur pH-Messung.
Meiner Familie, welche diese Arbeit in den letzten Jahren mit Freude und Interesse unterstützt
hat.
Freising, im November 2002 Adriana Molina-Höppner

Lebenslauf Adriana Molina-Höppner Adresse: Fabrikstr. 12, 85354 Freising geboren am: 21.04.1972 in Oaxaca, Mexiko Familienstand: verheiratet mit Erik Höppner Schulbildung: 1978-1990 Instituto Carlos Gracida, Oaxaca, Mexiko Studium: Seit 10.1999 Promotion mit dem Thema „Physiological response of Lactococcus lactis to
high-pressure“ am Lehrstuhl für Technische Mikrobiologie der TU-München in Freising
3 Monate Forschungsaufenthalt am Japan Marine Science and Technology Center in Yokosuka, Japan
2000-2002 Aufbaustudium Biotechnologie an der TU-München 1997-1999 Dipl.-Ing. Verarbeitungs- und Verfahrenstechnik mit Vertiefungsrichtung Lebensmitteltechnik an der TU-Dresden
Diplomarbeit mit dem Thema „Lebensmitteltechnische Untersuchungen zur Herstellung von Russisch Brot für Diabetiker“
1991-1995 Food Industries Engineering am Instituto Tecnológico y de Estudios Superiores de Monterrey (ITESM), Monterrey, Mexiko
2 Semester Austauschstudentin an der University of Nebraska, Lincoln, Nebraska, USA
Beruflicher Werdegang: 02.98-06.99 Arbeit als studentische Hilfskraft am Institut für Verfahrens- und
Umwelttechnik der TU-Dresden 10.97-06.99 Arbeit als studentische Hilfskraft am Institut für Lebensmittel- und
Bioverfahrenstechnik der TU-Dresden 08.98-10.98 Praktikum bei Grumbacher Kartoffeln Spezialitäten, Grumbach 09.97-02.98 Praktikum bei der Dr. Quendt Backwaren GmbH, Dresden 02.-05.1995 Arbeit als Physik- und Chemielehrerin an der Madison- Schule in
Monterrey, Mexiko 01.-06.1995 Praktikum am Obst- und Gemüsetechnologielaboratorium des ITESM 08.-12.1994 Praktikum am Fleischtechnologielaboratorium des ITESM
Freising, 19.11.2002 Adriana Molina-Höppner