mehdi maleki rhéologie et migration de particules
TRANSCRIPT

THÈSEPour obtenir le grade de
DOCTEUR DE L’UNIVERSITÉ GRENOBLE ALPESSpécialité : MEP : Mécanique des fluides Energétique, ProcédésArrêté ministériel : 25 mai 2016
Présentée par
Mehdi MALEKI
Thèse dirigée par Hugues BODIGUEL, Professeur, Université Grenoble Alpeset codirigée par Marc LEONETTI, chercheur CNRS, CNRSet Clément DE LOUBENS, Chargé de Recherche, CNRS
préparée au sein du Laboratoire Laboratoire Rhéologie et Procédésdans l'École Doctorale I-MEP2 - Ingénierie - Matériaux, Mécanique, Environnement, Energétique, Procédés, Production
Rhéologie et migration de particules déformables dans les suspensions denses
Rheology and migration of deformable particles in dense suspensions
Thèse soutenue publiquement le 30 mars 2021,devant le jury composé de :
Monsieur Hugues BODIGUELPROFESSEUR, Université Grenoble Alpes, LRP UMR 5520, Directeur de thèseMonsieur Guillaume OvarlezDIRECTEUR DE RECHERCHE, Université de Bordeaux, Laboratoire de futur (LOF), UMR 5258, RapporteurMadame Annie ColinPROFESSEUR, Université Paris sciences et lettres, ESPCI Paris UMR 8231, RapportriceMonsieur Laurent OrgéasDIRECTEUR DE RECHERCHE, Université Grenoble Alpes, 3SR Lab UMR 5521,PrésidentMonsieur Frédéric BlancMAITRE DE CONFERENCE, Université Côte d'Azur, INPHYNI UMR 7010, Examinateur
Abstract
Deformable particles migrate in a sheared suspension. A source of this phenomena would bethe collective interactions between particles which rheologically means the emergence of normalstresses generated by direct contact between particles. In this thesis the particle normal stresshas been experimentally investigated as an origin of migration of deformable particles. Non-Brownian droplets and microcapsules were used as a model system of deformable particles. Amembrane emulsification process was adapted to produce uniform suspensions of microcapsulesat high throughput. Then an automatic microfluidic system was developed to measure theelasticity of their shell. In microcapsule suspensions, it was found that the contact viscositiesshow a shear-thinning behavior. In high volume fraction, the contact viscosity, which originatefrom normal stress, is the principal contributor to the apparent viscosity. Migration and normalstress of buoyant particles were inferred by measuring the vertical concentration profile in viscousresuspension experiments in a vertical Couette cell. The normal stress varies linearly with theShields number for droplets and non-linearly with a 0.7 power law for microcapsules as rigidparticles. The dependency of the normal stress on the volume fraction is in agreement withthe models proposed in the literature for solid particles. All of these results suggest that themigration of deformable particles in dense suspension under shear can be explained by thesame rheological laws as for rigid particles, regardless of their deformability (for Ca < 0.4).Furthermore, in the case of capsules, these rheological laws are governed by the solid contactsbetween the particles.
Key words: Microcapsule, Emulsion, Normal stress, Interfacial properties, Viscous resus-pension, Shear-induced migration
2
Resume
Les particules deformables migrent dans une suspension cisaillee. Une source de ce phenomeneserait les interactions collectives entre particules ce qui signifie rheologiquement l’emergence decontraintes normales generees par le contact direct entre les particules. Dans cette these, lacontrainte normale des particules a ete etudiee experimentalement comme une origine de mi-gration de particules deformables. Des gouttes et des microcapsules non browniennes ont eteutilisees comme systeme modele de particules deformables. Un procede d’emulsification mem-branaire a ete adapte pour produire des suspensions uniformes de microcapsules a haut debit.Puis un systeme microfluidique automatique a ete developpe pour mesurer l’elasticite de leurcoque. Dans les suspensions de microcapsules, il a ete trouve que la viscosite de contact presenteun comportement de rheofluidification. Pour des fractions volumiques elevees, la viscosite decontact, qui provient de contraintes normales, est le principal contributeur a la viscosite appar-ente. La migration et la contrainte normale des particules non-isodenses ont ete deduites enmesurant le profil de concentration vertical dans des experiences de resuspension visqueuse dansune cellule de Couette verticale. La contrainte normale varie lineairement avec le nombre deShields pour les gouttes et non-linearement avec la puissance 0.7 comme les particules solides.La dependance de La contrainte normale a la fraction volumique est en accord avec les modelesproposes dans la litterature pour des particules solides. L’ensemble de ces resultats suggere quela migration de particules deformables en suspension dense sous cisaillement s’explique par lesmemes lois rheologiques que pour des particules rigides, independamment de leur deformabilite(pour Ca < 0.4). De plus, dans le cas des capsules, ces lois rheologiques sont gouvernees par lescontacts solides entre les particules.
Mot cles: Microcapsule, Emulsion, Stresse normale, Proprietes interfaciales, Resuspensionvisqueuse, Migration des particules induites par l’ecoulement
3
Contents
Abstract 2
Resume 3
Introduction 6
1 State of the art and objectives 8
1.1 Rheology and migration in suspensions of hard particles . . . . . . . . . . . . . . 8
1.1.1 Migration observations in suspensions . . . . . . . . . . . . . . . . . . . . 8
1.1.2 Rheology of suspensions of rigid spheres . . . . . . . . . . . . . . . . . . . 9
1.1.3 Connecting migration and rheology . . . . . . . . . . . . . . . . . . . . . . 11
1.2 Rheology and migration in suspensions of soft particles . . . . . . . . . . . . . . . 13
1.2.1 Migration of soft particles: the blood . . . . . . . . . . . . . . . . . . . . . 13
1.2.2 Dynamics of isolated soft particles in flow . . . . . . . . . . . . . . . . . . 14
1.2.3 Suspension of soft particles in flow: highlights from numerical simulations 15
1.3 Objectives . . . . . . . . . . . . . . . . . . . . . . . . . . . . . . . . . . . . . . . . 16
2 Materials and Methods 17
2.1 Inrtroduction . . . . . . . . . . . . . . . . . . . . . . . . . . . . . . . . . . . . . . 17
2.2 Chemicals and solutions . . . . . . . . . . . . . . . . . . . . . . . . . . . . . . . . 17
2.3 Droplet and Microcapsule synthesis . . . . . . . . . . . . . . . . . . . . . . . . . . 18
2.3.1 Microfluidics for droplets . . . . . . . . . . . . . . . . . . . . . . . . . . . 18
2.3.2 Membrane emulsification for microcapsules . . . . . . . . . . . . . . . . . 19
2.4 Characterization of physical properties of suspensions . . . . . . . . . . . . . . . 19
2.4.1 Size variation . . . . . . . . . . . . . . . . . . . . . . . . . . . . . . . . . . 19
2.4.2 Volume fraction . . . . . . . . . . . . . . . . . . . . . . . . . . . . . . . . . 20
2.4.3 Microcapsules shell elasticity Gs . . . . . . . . . . . . . . . . . . . . . . . 20
2.4.4 Rheometry and details about the rheometer . . . . . . . . . . . . . . . . . 24
2.5 Resuspension experiments . . . . . . . . . . . . . . . . . . . . . . . . . . . . . . . 24
2.5.1 Transparent Taylor-Couette cell . . . . . . . . . . . . . . . . . . . . . . . . 24
2.5.2 Visualization and parallax issue . . . . . . . . . . . . . . . . . . . . . . . . 25
2.5.3 Concentration profile measurement by light absorption . . . . . . . . . . . 26
2.5.4 Tuning refractive index of droplets . . . . . . . . . . . . . . . . . . . . . . 27
4
3 Production and characterization of microcapsules 29
4 Rheology of attractive suspensions of microcapsules 41
4.1 Introduction . . . . . . . . . . . . . . . . . . . . . . . . . . . . . . . . . . . . . . . 42
4.2 Materials and Methods . . . . . . . . . . . . . . . . . . . . . . . . . . . . . . . . . 42
4.2.1 Chemicals and Solutions . . . . . . . . . . . . . . . . . . . . . . . . . . . . 42
4.2.2 Production and Preparation of suspensions . . . . . . . . . . . . . . . . . 42
4.2.3 Characterization of physical properties . . . . . . . . . . . . . . . . . . . . 43
4.2.4 Rheometer and the measurement method . . . . . . . . . . . . . . . . . . 44
4.3 Results . . . . . . . . . . . . . . . . . . . . . . . . . . . . . . . . . . . . . . . . . . 45
4.3.1 Steady State Rheology . . . . . . . . . . . . . . . . . . . . . . . . . . . . . 45
4.3.2 Shear-reversal rheology . . . . . . . . . . . . . . . . . . . . . . . . . . . . 51
4.3.3 Discussion . . . . . . . . . . . . . . . . . . . . . . . . . . . . . . . . . . . . 56
4.4 Conclusion . . . . . . . . . . . . . . . . . . . . . . . . . . . . . . . . . . . . . . . 58
5 Viscose resuspension of droplets 59
6 Viscous resuspension of attractive microcapsules 74
6.1 Introduction . . . . . . . . . . . . . . . . . . . . . . . . . . . . . . . . . . . . . . . 74
6.2 Materials and methods . . . . . . . . . . . . . . . . . . . . . . . . . . . . . . . . . 74
6.3 Results . . . . . . . . . . . . . . . . . . . . . . . . . . . . . . . . . . . . . . . . . . 75
6.4 Discussion and concluding remarks . . . . . . . . . . . . . . . . . . . . . . . . . . 77
7 Conclusion and Perspectives 79
Bibliography 82
5
Introduction
Suspensions of particles dispersed in a liquid are omnipresent in nature, in industry and inbiology. Their flow properties are rich and complex and depend both on the particles constitutingthem, on their volume fraction and on the shear rate.
As soon as the particle size exceeds the micrometer scale, the Peclet numbers are generallyhigh and the suspensions are then considered non-Brownian. The flow of this type of suspensionhas long been considered to be essentially governed by hydrodynamic forces in the fluid in whichthey are dispersed, today we know that contact interactions as well as colloidal interactionsalso play a role, which becomes major when the volume fraction exceeds 35-40%. Rheologycan then exhibit various behaviors such as shear thinning, shear thickening (which is sometimesvery sudden), and tends towards jamming when approaching a concentration where congestionprevents the flow.
The other characteristic of non-Brownian suspensions is that spatial repartition of the par-ticles can be non-uniform and is influenced by the flow. This is particularly the case withheterogeneous flows, where particles migrate from highly sheared areas to less sheared ones.Due to the strong dependence of the rheological properties of suspensions on the concentration,this shear-induced migration is crucial in order to understand and predict the properties of theflows.
In this thesis, we focus on deformable particles. In fact, in various industrial sectors (agro-food, cosmetics, etc.) but above all in biology, there are suspensions of particles which can beeasily deformed. These may be made of drops (emulsions), soft solid particles, vesicles, cells, etc.In all these systems, the easily deformable nature of the particles leads to additional phenomena.At very high volume fraction, the rheology becomes that of a yield stress fluid. Indeed, if rigidparticles can no longer flow beyond a certain size, these softer particles can deform and can besheared if the stress is sufficient.
Regarding the spatial distribution of the particles in the flow, the coupling between theshape of the particle and the hydrodynamic forces leads to migration phenomena (i.e., thetrajectory of the particles deviates from that of the streamlines), even for isolated particles.This phenomenon has been studied in detail for vesicles and red blood cells, as it is probablythe cause of the Fahræus – Lindqvist effect: the red blood cells concentrate in the center of theblood vessels, leaving a layer of depletion near the walls, which significantly facilitates bloodcirculation. The description of these effects, even for isolated particles, is complex and has beenthe subject of numerous studies: it is necessary to account for the coupling between the shapeof the particle, its mechanical properties, those of its surface, and the hydrodynamic constraintsof the suspending fluid.
In addition to these fluid-structure-type mechanisms, we can also expect collective effectssimilar to those existing in the case of solid particles: interactions between particles (hydrody-namic, contact, colloidal), exacerbated by shear, should lead to shear-induced migration, whichhas been little studied in the case of deformable particles. In recent years, experimental ap-proaches have been developed to manufacture and characterize elastic capsules. These objects,made up of an elastic membrane enveloping a liquid, are intermediate between vesicles which
6
have negligible bending modulus, drops for which there are no contacts, and solid particles.These systems are considered to be adequate models for red blood cells. It therefore seemsinteresting to study the rheological properties and the migration properties under flow of thesesystems, in order to extend the knowledge acquired on solid particles to this type of deformableobjects.
One of the major bottlenecks for this type of study lies in our ability to produce capsulesin large quantities. Indeed, the approaches developed so far are essentially based on micro- ormillifluidic methods, which have many advantages, but can only with difficulty be implementedto produce sufficient quantities for the study of collective effects, both on rheology and onmigration phenomena. The mass production of elastic particles has been the subject of a specificdevelopment during this thesis, and will be detailed in this manuscript.
In order to study the migration induced by the shearing of deformable objects, we havechosen to decouple the multiple origins of migration phenomena, by avoiding the effects linkedto the migration due to the proximity of a wall, and to that induced by a shear rate gradient,those two mechanisms being at work even for isolated objects. For this, we propose to use aCouette geometry to study the viscous resuspension of deformable and buoyant particles. Thisapproach, which has been already used for solid particles, makes it possible to precisely deter-mine the normal stresses at the origin of the shear-induced migration. We have chosen to startwith a system that is in principle simpler than capsule suspensions, namely emulsions. One ofthe experimental advantages of these systems is the possibility of making them completely trans-parent to light, and of using an absorption measurement to simply and precisely determine thelocal volume fraction. Then, we extended this approach to suspensions of deformable capsules.
In parallel, and because the capsule suspensions constitute an original system, we havespecifically studied the rheology of these suspensions by standard rheometric approaches (flowcurves in particular), but also by using a shear reversal protocol. The latter allows in the case ofsolid particles to dissociate the hydrodynamic contribution to the stress from that of contacts.
This manuscript is organized as follows: In Chapter 1, I summarize the state of the artrelating to the questions raised above, concerning the rheological and migration properties ofsuspensions of non-Brownian particles, solid or deformable. In Chapter 2 ”Materials and meth-ods”, I detail the choices and the developments made both on the different systems used toconduct the study, and both on the experimental methods used. The Chapter 3 is taken from ascientific article, entitled ”Membrane emulsification for the production of suspensions of uniformmicrocapsules with tunable mechanical properties”, which describes the methodology we havespecifically developed to produce large quantities of elastic capsules. The Chapter 4 concernsthe rheological properties of capsule suspensions. It will also be the subject of a publication,and is presented as an article in preparation. The last part of the manuscript is Chapter 5shows the results obtained on the viscous resuspension of emulsions, which is also the subjectof a scientific article. Finally, we present the results obtained on the resuspension of capsules,before concluding and presenting some perspectives.
Since part of this thesis manuscript consists of articles, and since these are the result of acollective work, it seems important to me to clarify my contribution to these articles:
• Chapter 3: I performed all the experiments and analyzes, and prepared the figures.
• Chapter 4: I performed all the experiments and analyzes, prepared the figures and wrotethe first version of the manuscript.
• Chapter 5: I performed all the experiments and analyzes, prepared the figures and wrotethe first version of the manuscript.
7
Chapter 1
State of the art and objectives
1.1 Rheology and migration in suspensions of hard particles
1.1.1 Migration observations in suspensions
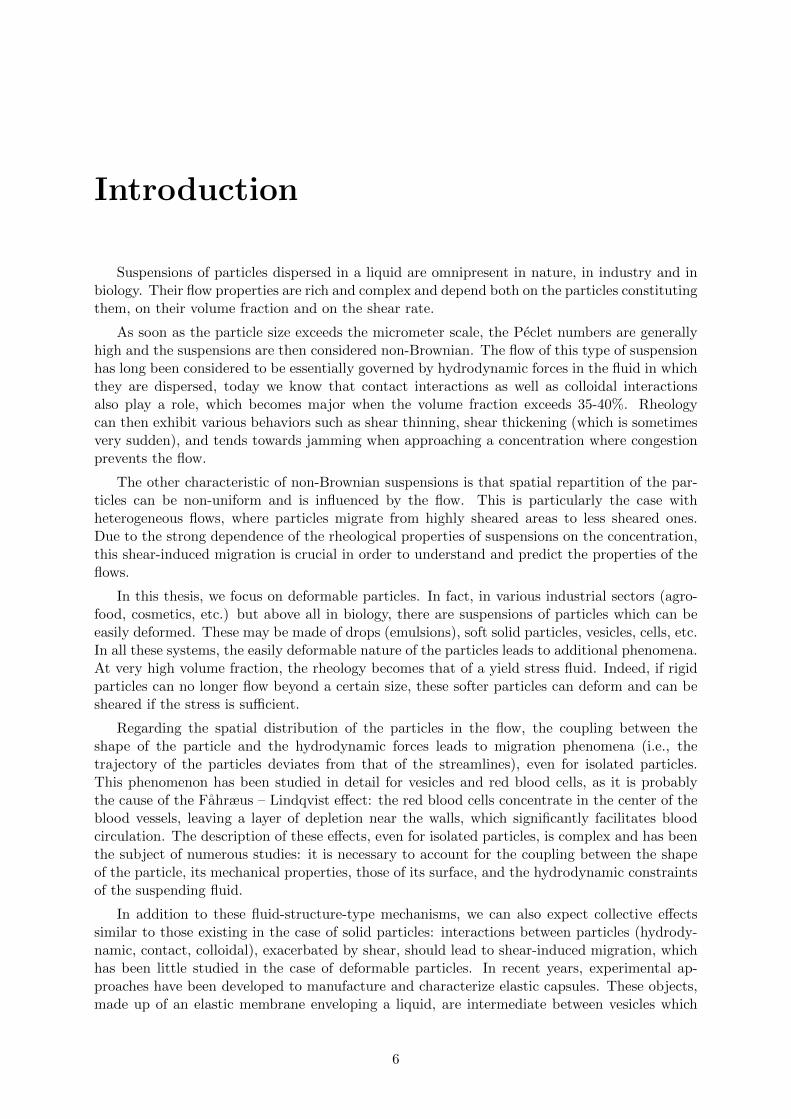
The question of how suspensions of particles flow in tubes is a rather old problem that hasbeen the focused of many studies for 50 years. It has been early observed that when flowingin a tube, particles do accumulate in the center, leading to a nearly plug flow [1, 2] . Morerecent work quantified more accurately the velocity and concentration profiles [3, 4]. In a slitchannel, the same phenomenon is observed and has been well characterized [5, 6], see Figure1.1. Extension to Brownian particles has also been reported by some authors [7, 8]. Althoughdiffusion in this case has to be considered, it is not sufficient to suppress particle migration.
Figure 1.1: Migration and velocity field in straight channel (from [5])
The work of Leighton and Acrivos brought essential observations to this problem [9]. Byobserving and analyzing the migration phenomenon in a Couette cell, they show that particlesmigrate towards low shear zones of the flow, consistently with the observations in tubes. Theseobservations have been refined by several authors [10, 11].
In plane-plane configuration however, no migration is observed [12, 13], although a ratherimportant gradient of shear rate exists in this geometry. This paradox has been partly resolvedby the a tonsorial and mechanical description of the migration [14], even though it remains aphenomenological issue. Let us point out that some more recent experiments report that there is
8
an outward migration at a volume fraction lower than 0.2 [15]. In square geometry, it seems thatsecondary currents are rather important [16, 17]. The shear-induced migration mechanism is alsoresponsible for the resuspension that is observed when a suspension undergoing sedimentationis sheared [18].
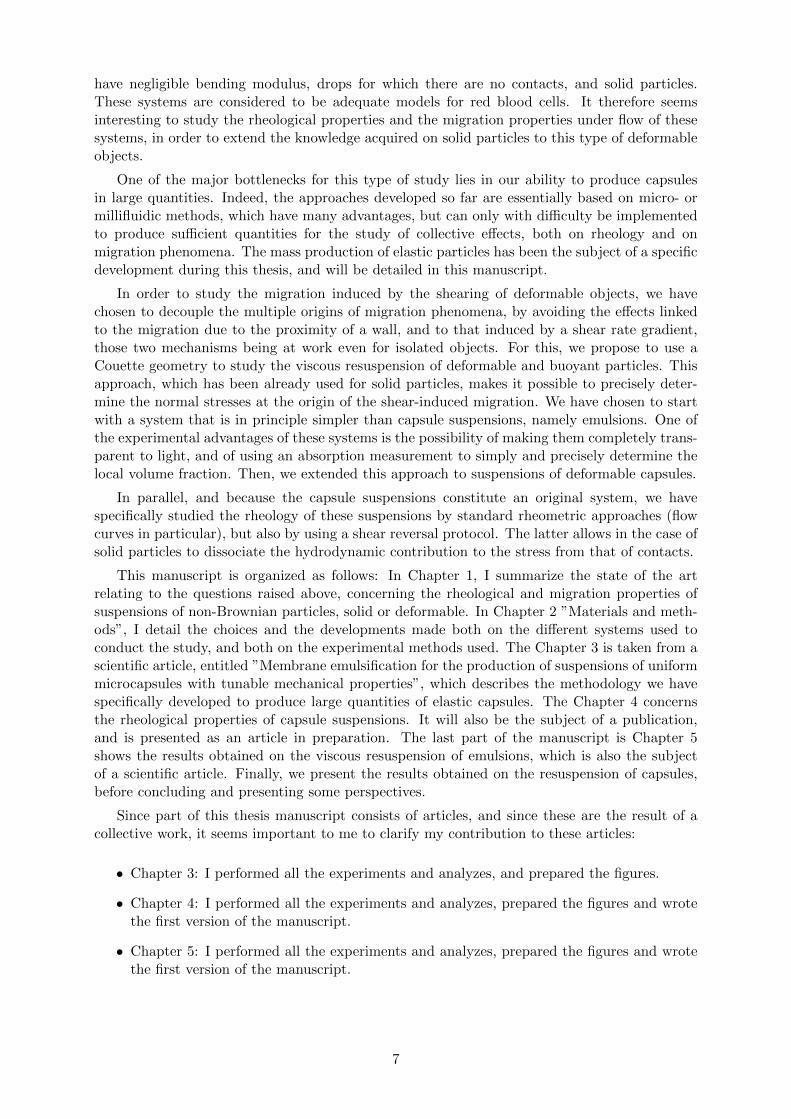
Migration from low to high shear zone in non-homogeneous flows such as Couette flow orpressure driven tube flow is a rather generic feature. Indeed, it has been evidenced in manysystems, not restricted to solid particles. For instance, it also exists emulsions [19], in polymersolutions [20, 21], DNA solutions [22] and in more complex systems such as blood [23]. Althoughsome specific systems features should be taken into account, such as particle anisotropy, surfaceroughness, and particle deformation (e.g. in the case of droplets or polymers) and Brownianmotion. The fact that this phenomenon appears to be general is rather striking. For example,semi-dilute emulsions made of droplets that are 6 orders of magnitude more viscous than thecontinuous phase exhibits an axial migration towards the center [24], as shown in figure 1.2.This result might be interpreted as an indication that the shear-induced migration also existswithout contact forces neither deformable objects. A possibility is that this migration is comingfrom second order hydrodynamic interactions that can be large in confinement.
Figure 1.2: Concentration profile of a semi-dilute emulsion made of highly viscous droplets flowingin a straight channel (preliminary result from [24]).
1.1.2 Rheology of suspensions of rigid spheres
Presence of suspended particles generates non-Newtonian effects in suspension flows evenwith a Newtonian suspending fluid. Behavior of the suspensions in macroscopic scale is stronglyinfluenced by microscopic configuration of particles inside the suspension, which is generallyreferred as the microstructure. The complex rheological behavior of sheared suspensions is inpart driven by the deviation from an equilibrium microstructure of the particles [25, 26, 27].
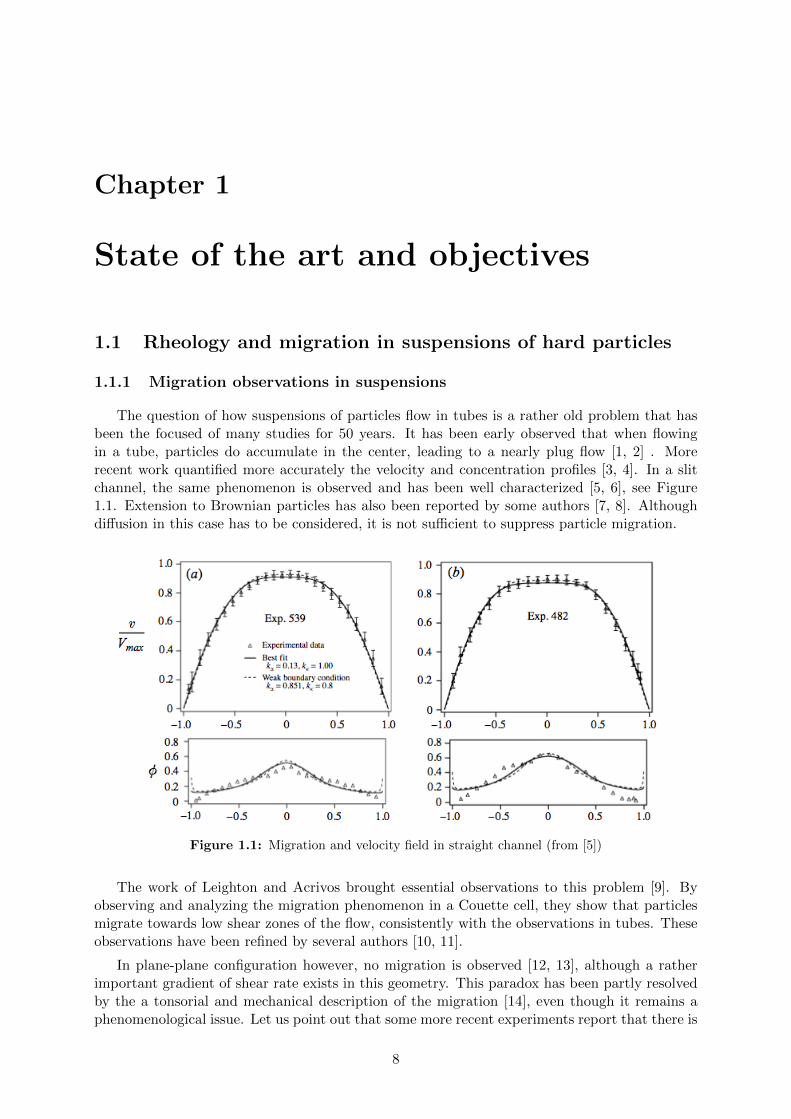
For the same volume fraction of the particles, the suspension shows different viscosity relativeto the particle shape [28, 29]. Figure 1.3 represents an example of suspensions with differentparticle shapes. In general, increase of the suspension viscosity relative to the particle shape is inthe following fashion: rods > plates > cubes/grains > spheres. In low volume fractions φ < 0.05where the particles are completely isolated, the increase in the viscosity comes from the viscousdissipation of deviated streamlines passing around the particles. When the particles are notspherical, this viscous dissipation increases and the result is the growth of suspension viscosity[30]. In large φ the impact of the particle shape on the rheology can be captured thought itseffect on φm which is highest for spherical particles and decreases systemically for particles thatare increasingly prolate or oblate. Consequently, a suspension of spherical particles has a lowerviscosity compared to that of prolate or oblate particles [28].
9
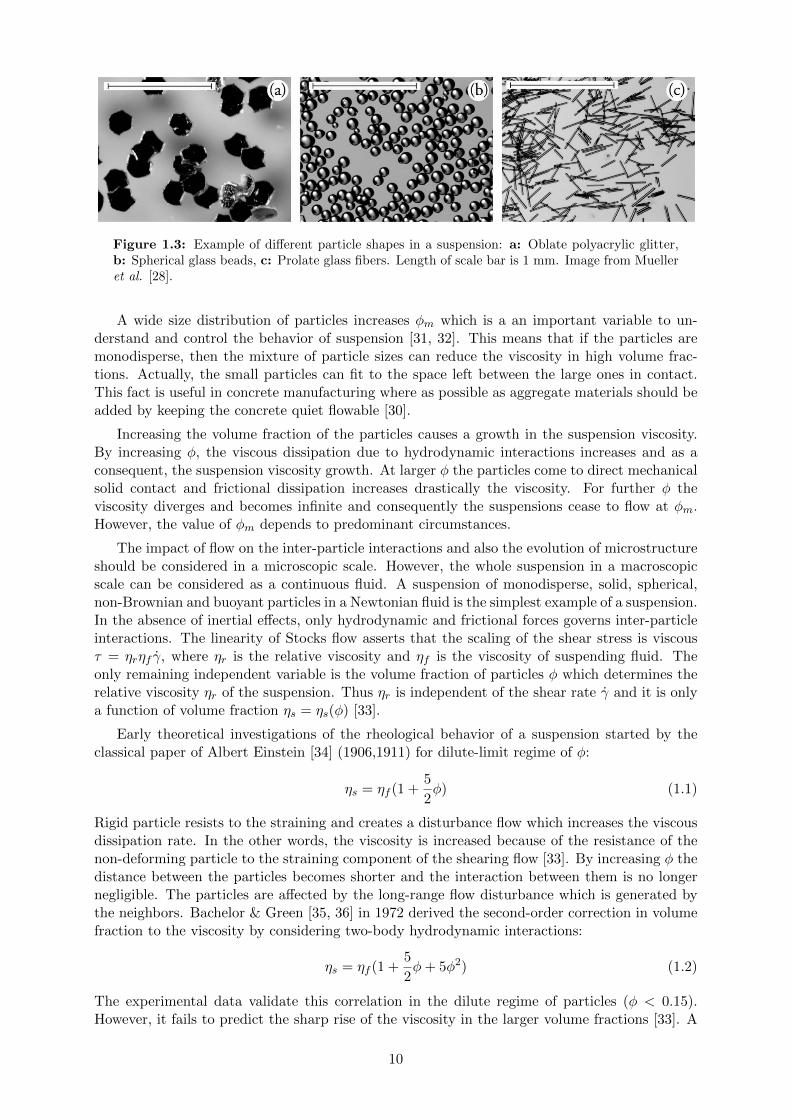
Figure 1.3: Example of different particle shapes in a suspension: a: Oblate polyacrylic glitter,b: Spherical glass beads, c: Prolate glass fibers. Length of scale bar is 1 mm. Image from Muelleret al. [28].
A wide size distribution of particles increases φm which is a an important variable to un-derstand and control the behavior of suspension [31, 32]. This means that if the particles aremonodisperse, then the mixture of particle sizes can reduce the viscosity in high volume frac-tions. Actually, the small particles can fit to the space left between the large ones in contact.This fact is useful in concrete manufacturing where as possible as aggregate materials should beadded by keeping the concrete quiet flowable [30].
Increasing the volume fraction of the particles causes a growth in the suspension viscosity.By increasing φ, the viscous dissipation due to hydrodynamic interactions increases and as aconsequent, the suspension viscosity growth. At larger φ the particles come to direct mechanicalsolid contact and frictional dissipation increases drastically the viscosity. For further φ theviscosity diverges and becomes infinite and consequently the suspensions cease to flow at φm.However, the value of φm depends to predominant circumstances.
The impact of flow on the inter-particle interactions and also the evolution of microstructureshould be considered in a microscopic scale. However, the whole suspension in a macroscopicscale can be considered as a continuous fluid. A suspension of monodisperse, solid, spherical,non-Brownian and buoyant particles in a Newtonian fluid is the simplest example of a suspension.In the absence of inertial effects, only hydrodynamic and frictional forces governs inter-particleinteractions. The linearity of Stocks flow asserts that the scaling of the shear stress is viscousτ = ηrηf γ, where ηr is the relative viscosity and ηf is the viscosity of suspending fluid. Theonly remaining independent variable is the volume fraction of particles φ which determines therelative viscosity ηr of the suspension. Thus ηr is independent of the shear rate γ and it is onlya function of volume fraction ηs = ηs(φ) [33].
Early theoretical investigations of the rheological behavior of a suspension started by theclassical paper of Albert Einstein [34] (1906,1911) for dilute-limit regime of φ:
ηs = ηf (1 +5
2φ) (1.1)
Rigid particle resists to the straining and creates a disturbance flow which increases the viscousdissipation rate. In the other words, the viscosity is increased because of the resistance of thenon-deforming particle to the straining component of the shearing flow [33]. By increasing φ thedistance between the particles becomes shorter and the interaction between them is no longernegligible. The particles are affected by the long-range flow disturbance which is generated bythe neighbors. Bachelor & Green [35, 36] in 1972 derived the second-order correction in volumefraction to the viscosity by considering two-body hydrodynamic interactions:
ηs = ηf (1 +5
2φ+ 5φ2) (1.2)
The experimental data validate this correlation in the dilute regime of particles (φ < 0.15).However, it fails to predict the sharp rise of the viscosity in the larger volume fractions [33]. A
10
theoretical approach to the viscosity of the suspensions for larger φ is a an extreme challenge.The many-body hydrodynamic interactions between the particle through the suspending fluidshould be considered and a detailed description of the microstructure is required [25]. Anothercomplexity is that the particles can interact by direct mechanical contacts which increases theanisotropy of the microstructure [37].
Many empirical equations have been developed which relates the suspension viscosity tovolume fraction of particles. Generally they followed Einstein’s analytical effort to extend thevolume fraction into a more practical region and aim to account for the divergence of the viscosityat φm. The most popular one is known as the Kreigee-Doupherty equation:
ηs = η0(1−φ
φm)−2 (1.3)
Surprisingly, the only real variable is φm. This variable depends on the size distribution ofparticles, deformability and also the flow condition [30].
Numerous studies show that in concentrated regime the contact forces become dominantand overcome the long-range hydrodynamic interactions [38, 39, 40, 41]. In order to understandthis mechanism, some experimental approaches have been developed to connect the rheology ofdense suspensions to the rheology of dry granular media [42, 43, 44]. In the suspension bothfrictional contacts and long-range hydrodynamic interactions present and in the granular mediathe rheological behavior is determined only by direct frictional contacts [33, 44].
1.1.3 Connecting migration and rheology
Two different classes of models have been proposed to describe migration in non-Browniansuspensions. The first one is based on scaling arguments and on the concept of shear-induceddiffusion [9, 45], and has been referred to in the literature as “diffusive models”. The second classis on the contrary based on mass and momentum conservation of the suspension componentsand has been referred to as the “suspension balance model” [46, 14]. Though diffusive modelshave been occasionally used [15, 47], the suspension balance model has the merit to relate themigration to the rheological properties that could be independently measured [48]. We will thuslimit ourselves in this state of art to the latter.
The suspension balance model was introduced two decades ago in order to relate the migra-tion properties to the rheology of the suspensions [46, 14, 49]. Its formalism allows to predictthe migration is various geometries [50]. Although the model has been recently questioned byseveral authors [51, 52], it is however worthwhile starting by describing the initial version ofthe model, since it may still apply in some cases, and since it has been widely used to interpretexperimental and numerical results.
Although the model could be detailed in the presence of buoyancy forces [49], we presenthere for the sake of simplicity the governing equations for the particular case of density-matchedparticles, where the buoyancy force is neglected.
It relies on the decomposition of the stress into a particle stress σp and a fluid stress σf sothat the total stress σ is the sum of these two stresses. Note that these stresses are ensembleaveraged ones. This decomposition allows to write the momentum balance for the two sub-systems and thus to relate the particle stress to the mean force fI exerted by the fluid on theparticles, i.e. ∇ · σp + fI = 0 (and similarly, ∇ · σf − fI = 0). The main interest of this stressdecomposition is then to be able to relate the interaction force to velocity differences. With amean-field description and for density-matched particles, this force is given by
fI = −9ηf2a2
φ
f(φ)(up − u) (1.4)
where ηf is the viscosity of suspending fluid, a is the radius of particles, up is the mean velocity ofthe particles, u is the volume average velocity of the whole suspension, and f(φ) is the decreasing
11
function of the particle volume fraction, similar to the sedimentation hindrance function [53].Refinements have been proposed for this function, e.g. in [54], where
f(φ) = (1− φ
φm)(1− φ)m (1.5)
The fluid stress is in the case of a Newtonian surrounding fluid and simply given by
σf = −PfI + ηf γ (1.6)
where γij = ∂xjui + ∂xiuj and Pf is the fluid pressure. Note that the fluid pressure could berather different from the pressure itself.
The particle stress has been modeled using the following semi-empiric expression [14]:
σp = ηf
ηp(φ)γ − ηn(φ)γ
1 0 00 λ2 00 0 λ3
(1.7)
where the first term is the particle contribution to the shear viscosity, while the second onereflects the anisotropy of the normal stress. In the second term, γ =
√2γ : γ is the amplitude
of the shear rate. Since ηp(φ) is directly deduced from the suspension viscosity, it is rather wellestablished and well approximated by the form proposed by Krieger, i.e. ηp(φ) = (1− φ/φm)−2
in the semi-dilute regime. Let us mention that many variants of this function have been proposed[14, 55, 56].
The anisotropic part of the normal stress tensor (second term of equation 1.7) has been amatter of debate during the last years. In the framework of the suspension balance model, it isindeed possible to measure it more or less directly, since the anisotropy of particle normal stresstensor coincides with the total stress one (given the form of the fluid stress in equation 1.6,only the particle stress could exhibit non-zero normal stress differences). In this framework, theparticle stress is thus closely linked to the global rheology of the suspension. Measurements ofthe normal stress differences N1 and N2 have thus been conducted to determine empirically theparticle stress variations with the volume fraction. Parallel plate rheometry [55, 57], rotating rodexperiments [11, 55], tilted trough [58], Couette cell [59]. These experiments are rather difficult,but agree on two main facts : the second normal stress coefficient is negative and increases whenthe volume fraction is higher than 0.2, with no divergence at the maximum packing fractionφm, and the first normal stress coefficient is also negative but much lower than the second one.A set of parameters in equations that appear to be compatible with these observations is [58]:λ2 ≈ 0.8− 1, λ3 ≈ 0.5 , and ηn(φ) = 3.3(φ− 0.22) for φ > 0.22, and ηn(φ) ≈ 0 otherwise. Notethat the value of 0.5 for λ3 is coming from the observation that there is almost no migrationin rotating parallel plate geometry [14]. However, many quantitative discrepancies arise fromdifferent experiments and simulations (see e.g. [59]), so that the problem of global normalstresses of a sheared suspension remains an open issue.
The isotropic contribution could be measured similarly to the osmotic pressure of a colloidalsuspension, i.e. by measuring the pressure difference between the sheared suspension and thesurrounding liquid separated by a grid smaller than the particles [60, 59].
The migration flux, which is given by the velocity difference between the particles and thesurrounding fluid thus directly involves the particle stress. Indeed, the particle flux j definedby j = φ(up − u) , under the assumption of validity of equation 1.4, j =
(2a2/9ηf
)f(φ)∇ · σp.
Particle conservation then allows to close the problem and reads
∂φ
∂t+ u · ∇φ = −∇ · j =
2a2
9ηf∇ · (f(φ)∇ · σp) (1.8)
Thus the particle migration is directly linked to the variations of the particle stress tensor.It is thus possible to compare the concentration profiles determined experimentally with the
12
predictions of the suspension balance model. Depending on the geometry, although a qualitativeagreement is always found, a good quantitative agreement is found for the Couette geometry[11], but rather poor agreement in the case of tube channels [54, 7].
Equation 1.8 provides an understanding of important features of the migration, especiallyconcerning the time scale of the migration (e.g. in the case of Couette flow) or the entrancelength (in the case of tube flows). The time scale of the migration is given by h2/a2γ, whereh is the characteristic size of the flow (i.e. the channel height, or the cell gap) and a theparticle size. For small particles compared to the gap (and corresponding to the limit where acontinuum theory could apply), the migration is thus very slow. Similarly, the entrance lengthis given by h3/a2, and could thus be very long expect in confinement. These time and lengthscales underline the crucial role played by the confinement (i.e. the aspect ratio between thechannel size and the particle diameter). We expect fast migration and short entrance length inconfinement.
In a channel, several attempts have been made to validate this theory. Though qualitativelyacceptable, it seems that a quantitative agreement is not reached [5, 7], as could be seen infigure 1.1. The model usually underpredicts the migration close to the wall and overpredictsit in the center. In the center, the fact that the shear rate vanishes leads to a divergence inthe concentration. It is thus necessary to smooth the center part of the profile. This issue issupposed to come from the limit of an effective continuum medium, which should not apply atthe scale of a particle.
1.2 Rheology and migration in suspensions of soft particles
1.2.1 Migration of soft particles: the blood
A well-documented case of migration in suspensions of soft particles concerns the blood [23].Blood can be considered as a dilute suspension of macromolecules (fibronectin, 100 nm length)and deformable particles of different sizes and stiffness: red blood cells (RBC, 7 µm), leukocytes(10 µm) and platelets (2 µm). On the macroscopic scale, this leads to a highly non-linearrheology of the blood: the resistance of blood to flow in capillaries (i.e. its apparent viscosity)shows a non-linear dependence with the flow confinement, the Fahræus–Lindqvist effect [61, 62].The apparent viscosity of the blood shows a minimum for a typical size of the capillaries of theorder of RBC size (figure 1.4). These effects are closely related to the spatial organization of thedifferent constituents of this suspension. On the microscopic scale, blood exhibits segregation,as the volume fraction of the different particles depends on the lateral position in the vessel: redblood cells are concentrated in the center of the channel, leaving a depletion layer near the wall(also referred as cell-free layer), where rigid particles are more likely to be found figure 1.5. Theprocess by which platelets and leukocytes migrate from the center of the vessel towards the wallis called margination [63, 64, 65]. Recent theoretical and numerical simulations show that thedeformability of RBCs is probably the salient physical ingredient to explain this phenomenon[66, 67, 68].
13
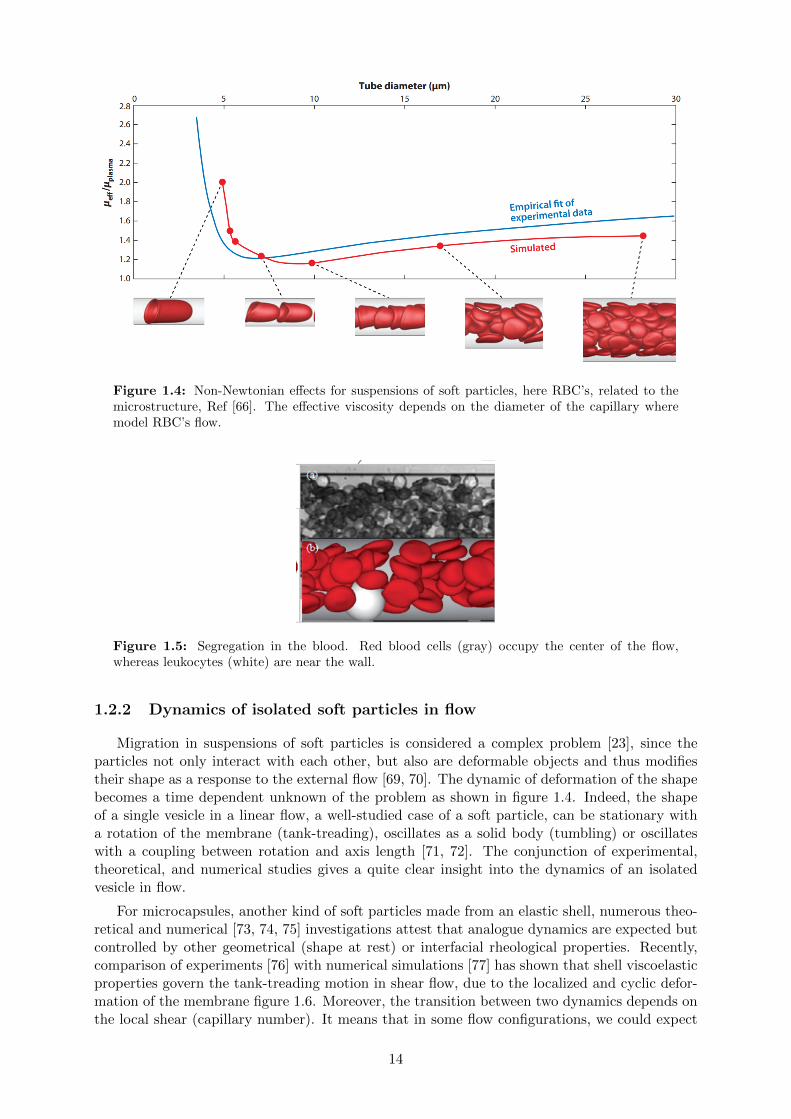
Figure 1.4: Non-Newtonian effects for suspensions of soft particles, here RBC’s, related to themicrostructure, Ref [66]. The effective viscosity depends on the diameter of the capillary wheremodel RBC’s flow.
Figure 1.5: Segregation in the blood. Red blood cells (gray) occupy the center of the flow,whereas leukocytes (white) are near the wall.
1.2.2 Dynamics of isolated soft particles in flow
Migration in suspensions of soft particles is considered a complex problem [23], since theparticles not only interact with each other, but also are deformable objects and thus modifiestheir shape as a response to the external flow [69, 70]. The dynamic of deformation of the shapebecomes a time dependent unknown of the problem as shown in figure 1.4. Indeed, the shapeof a single vesicle in a linear flow, a well-studied case of a soft particle, can be stationary witha rotation of the membrane (tank-treading), oscillates as a solid body (tumbling) or oscillateswith a coupling between rotation and axis length [71, 72]. The conjunction of experimental,theoretical, and numerical studies gives a quite clear insight into the dynamics of an isolatedvesicle in flow.
For microcapsules, another kind of soft particles made from an elastic shell, numerous theo-retical and numerical [73, 74, 75] investigations attest that analogue dynamics are expected butcontrolled by other geometrical (shape at rest) or interfacial rheological properties. Recently,comparison of experiments [76] with numerical simulations [77] has shown that shell viscoelasticproperties govern the tank-treading motion in shear flow, due to the localized and cyclic defor-mation of the membrane figure 1.6. Moreover, the transition between two dynamics depends onthe local shear (capillary number). It means that in some flow configurations, we could expect
14
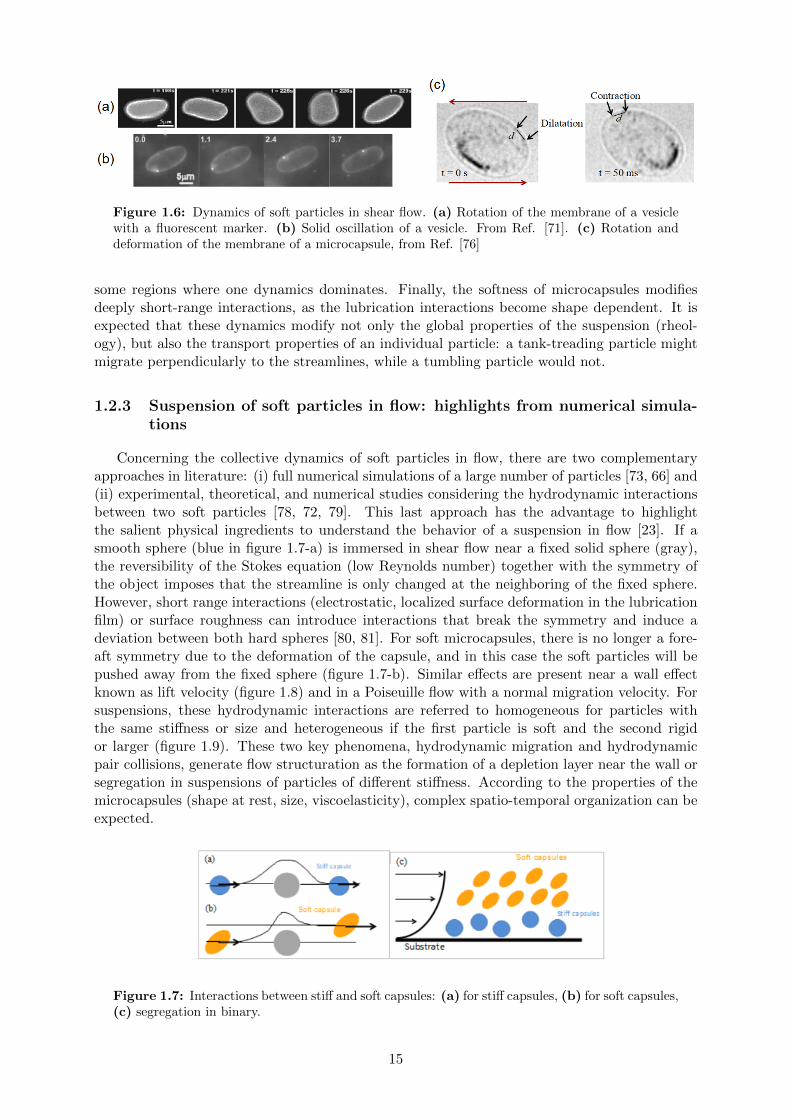
Figure 1.6: Dynamics of soft particles in shear flow. (a) Rotation of the membrane of a vesiclewith a fluorescent marker. (b) Solid oscillation of a vesicle. From Ref. [71]. (c) Rotation anddeformation of the membrane of a microcapsule, from Ref. [76]
some regions where one dynamics dominates. Finally, the softness of microcapsules modifiesdeeply short-range interactions, as the lubrication interactions become shape dependent. It isexpected that these dynamics modify not only the global properties of the suspension (rheol-ogy), but also the transport properties of an individual particle: a tank-treading particle mightmigrate perpendicularly to the streamlines, while a tumbling particle would not.
1.2.3 Suspension of soft particles in flow: highlights from numerical simula-tions
Concerning the collective dynamics of soft particles in flow, there are two complementaryapproaches in literature: (i) full numerical simulations of a large number of particles [73, 66] and(ii) experimental, theoretical, and numerical studies considering the hydrodynamic interactionsbetween two soft particles [78, 72, 79]. This last approach has the advantage to highlightthe salient physical ingredients to understand the behavior of a suspension in flow [23]. If asmooth sphere (blue in figure 1.7-a) is immersed in shear flow near a fixed solid sphere (gray),the reversibility of the Stokes equation (low Reynolds number) together with the symmetry ofthe object imposes that the streamline is only changed at the neighboring of the fixed sphere.However, short range interactions (electrostatic, localized surface deformation in the lubricationfilm) or surface roughness can introduce interactions that break the symmetry and induce adeviation between both hard spheres [80, 81]. For soft microcapsules, there is no longer a fore-aft symmetry due to the deformation of the capsule, and in this case the soft particles will bepushed away from the fixed sphere (figure 1.7-b). Similar effects are present near a wall effectknown as lift velocity (figure 1.8) and in a Poiseuille flow with a normal migration velocity. Forsuspensions, these hydrodynamic interactions are referred to homogeneous for particles withthe same stiffness or size and heterogeneous if the first particle is soft and the second rigidor larger (figure 1.9). These two key phenomena, hydrodynamic migration and hydrodynamicpair collisions, generate flow structuration as the formation of a depletion layer near the wall orsegregation in suspensions of particles of different stiffness. According to the properties of themicrocapsules (shape at rest, size, viscoelasticity), complex spatio-temporal organization can beexpected.
Figure 1.7: Interactions between stiff and soft capsules: (a) for stiff capsules, (b) for soft capsules,(c) segregation in binary.
15
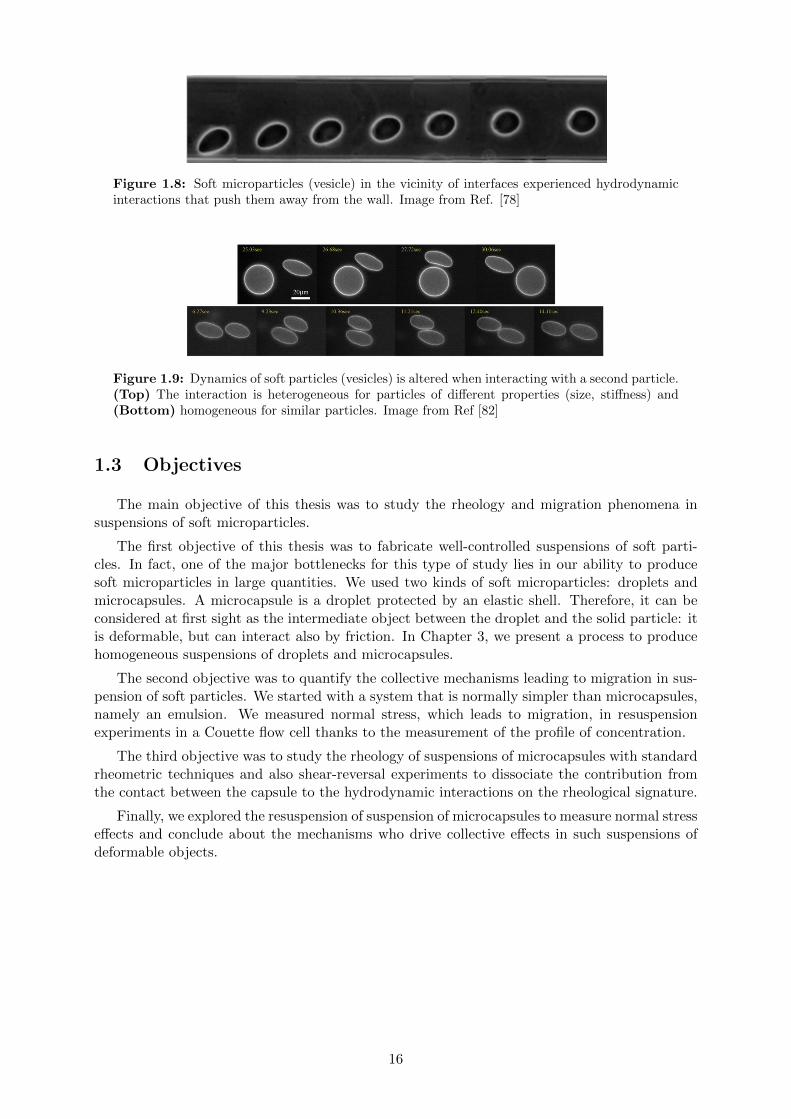
Figure 1.8: Soft microparticles (vesicle) in the vicinity of interfaces experienced hydrodynamicinteractions that push them away from the wall. Image from Ref. [78]
Figure 1.9: Dynamics of soft particles (vesicles) is altered when interacting with a second particle.(Top) The interaction is heterogeneous for particles of different properties (size, stiffness) and(Bottom) homogeneous for similar particles. Image from Ref [82]
1.3 Objectives
The main objective of this thesis was to study the rheology and migration phenomena insuspensions of soft microparticles.
The first objective of this thesis was to fabricate well-controlled suspensions of soft parti-cles. In fact, one of the major bottlenecks for this type of study lies in our ability to producesoft microparticles in large quantities. We used two kinds of soft microparticles: droplets andmicrocapsules. A microcapsule is a droplet protected by an elastic shell. Therefore, it can beconsidered at first sight as the intermediate object between the droplet and the solid particle: itis deformable, but can interact also by friction. In Chapter 3, we present a process to producehomogeneous suspensions of droplets and microcapsules.
The second objective was to quantify the collective mechanisms leading to migration in sus-pension of soft particles. We started with a system that is normally simpler than microcapsules,namely an emulsion. We measured normal stress, which leads to migration, in resuspensionexperiments in a Couette flow cell thanks to the measurement of the profile of concentration.
The third objective was to study the rheology of suspensions of microcapsules with standardrheometric techniques and also shear-reversal experiments to dissociate the contribution fromthe contact between the capsule to the hydrodynamic interactions on the rheological signature.
Finally, we explored the resuspension of suspension of microcapsules to measure normal stresseffects and conclude about the mechanisms who drive collective effects in such suspensions ofdeformable objects.
16
Chapter 2
Materials and Methods
2.1 Inrtroduction
In this chapter we will discuss general materials and methods employed in this study. Herewe will give the description of the tools and techniques essential for this study and commonbetween different experiments conducted in this work. Specifics and details of the employedtechniques will be given for each study individually in the following chapters. First we will listand elaborate on the products used and preparation protocols of the essential solutions in thisstudy. We will briefly describe the different methods employed in microcapsule fabrication andhighlight the important differences between them. In the next section we will talk about themass production of microcapules via membrane emulsification process. Then we will describethe capsule characterisation and parameter control. In this section we will disclose the methodsused to quantify the mechanical properties of the capsule elastic shell. We will present as wellthe microfluidic chamber used for the capsule characterisation and explain choice of microfluidicdesign. The last section of this chapter is dedicated to the resuspention experiments. Herewe will describe all the essential details of experimental setup. Special accent will be madeon the metrological analysis required in order to ensure the accuracy and scientific validity ofexperimental results.
2.2 Chemicals and solutions
Microcapsules are made by two different physicochemical process:
• interfacial complexation of chitosan (CH) with phosphatidic fatty acid (PFacid)[83, 84]
• interfacial cross-linking of bovine serum albumin (BSA) with terephthaloyl chloride (TC)[85]
CH / PFacid microcapsules
PFacid was used in a form of a commercial lecithin known as lecithin YN (Palsgaard 4455,food-grade, E442) which was kindly provided by Palsgaard. PFacid was dissolved in food-graderapeseed oil (Geant Casino) at a concentration of 20% at 35 C during the night to create a stocksolution. Then PFacid solution was centrifuged at 3500 g to remove the insoluble residuals. Thestock solution was further diluted with rapeseed oil at the required concentrations (0.1 or 5 %w/w).
Chitosan (CAS n 9012-76-4, Sigma-Aldrich) with medium molecular weight and 75-85%deacetylation was dissolved in Millipore water (Resistivity > 18.2 mΩ.cm) at a concentration of1 % w/w by adjusting the pH with hydrochloric acid (1 mol/L) to 3.0. The chitosan solutionwas then filtered to remove undissolved particles through Minisart syringe filters (pore size 5.0
17
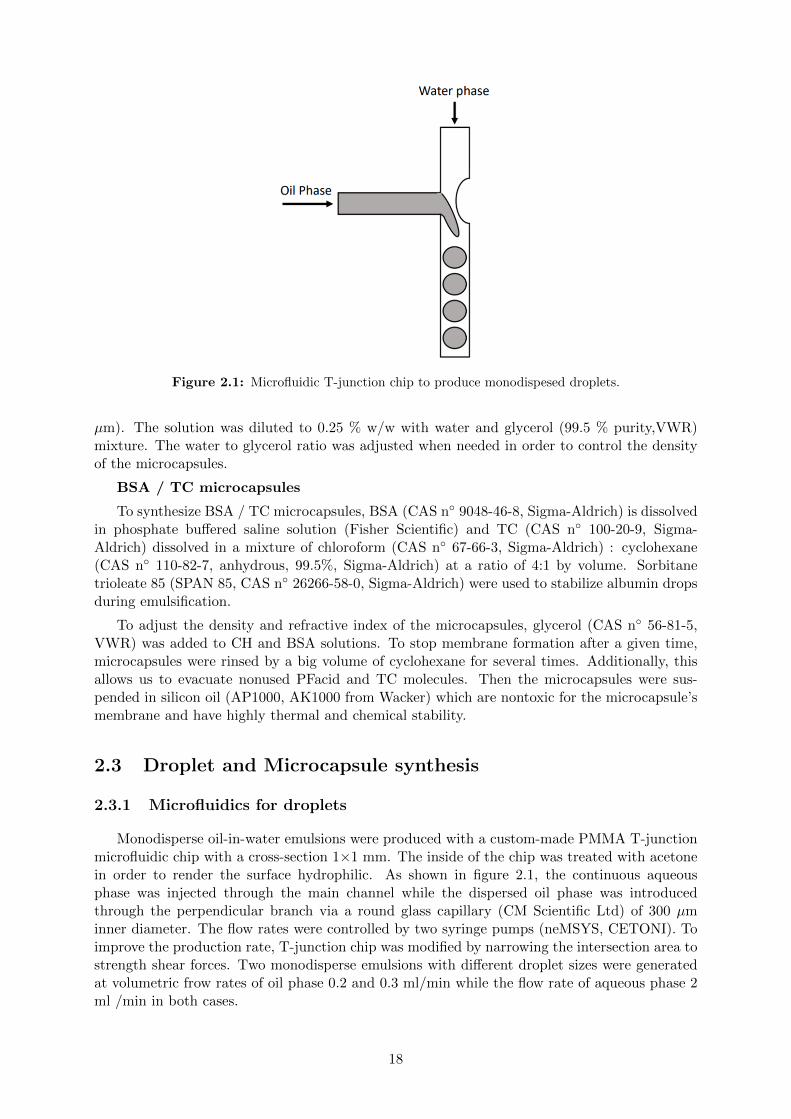
Figure 2.1: Microfluidic T-junction chip to produce monodispesed droplets.
µm). The solution was diluted to 0.25 % w/w with water and glycerol (99.5 % purity,VWR)mixture. The water to glycerol ratio was adjusted when needed in order to control the densityof the microcapsules.
BSA / TC microcapsules
To synthesize BSA / TC microcapsules, BSA (CAS n 9048-46-8, Sigma-Aldrich) is dissolvedin phosphate buffered saline solution (Fisher Scientific) and TC (CAS n 100-20-9, Sigma-Aldrich) dissolved in a mixture of chloroform (CAS n 67-66-3, Sigma-Aldrich) : cyclohexane(CAS n 110-82-7, anhydrous, 99.5%, Sigma-Aldrich) at a ratio of 4:1 by volume. Sorbitanetrioleate 85 (SPAN 85, CAS n 26266-58-0, Sigma-Aldrich) were used to stabilize albumin dropsduring emulsification.
To adjust the density and refractive index of the microcapsules, glycerol (CAS n 56-81-5,VWR) was added to CH and BSA solutions. To stop membrane formation after a given time,microcapsules were rinsed by a big volume of cyclohexane for several times. Additionally, thisallows us to evacuate nonused PFacid and TC molecules. Then the microcapsules were sus-pended in silicon oil (AP1000, AK1000 from Wacker) which are nontoxic for the microcapsule’smembrane and have highly thermal and chemical stability.
2.3 Droplet and Microcapsule synthesis
2.3.1 Microfluidics for droplets
Monodisperse oil-in-water emulsions were produced with a custom-made PMMA T-junctionmicrofluidic chip with a cross-section 1×1 mm. The inside of the chip was treated with acetonein order to render the surface hydrophilic. As shown in figure 2.1, the continuous aqueousphase was injected through the main channel while the dispersed oil phase was introducedthrough the perpendicular branch via a round glass capillary (CM Scientific Ltd) of 300 µminner diameter. The flow rates were controlled by two syringe pumps (neMSYS, CETONI). Toimprove the production rate, T-junction chip was modified by narrowing the intersection area tostrength shear forces. Two monodisperse emulsions with different droplet sizes were generatedat volumetric frow rates of oil phase 0.2 and 0.3 ml/min while the flow rate of aqueous phase 2ml /min in both cases.
18
MembraneAqueous phase
Organic phase
Shell formation
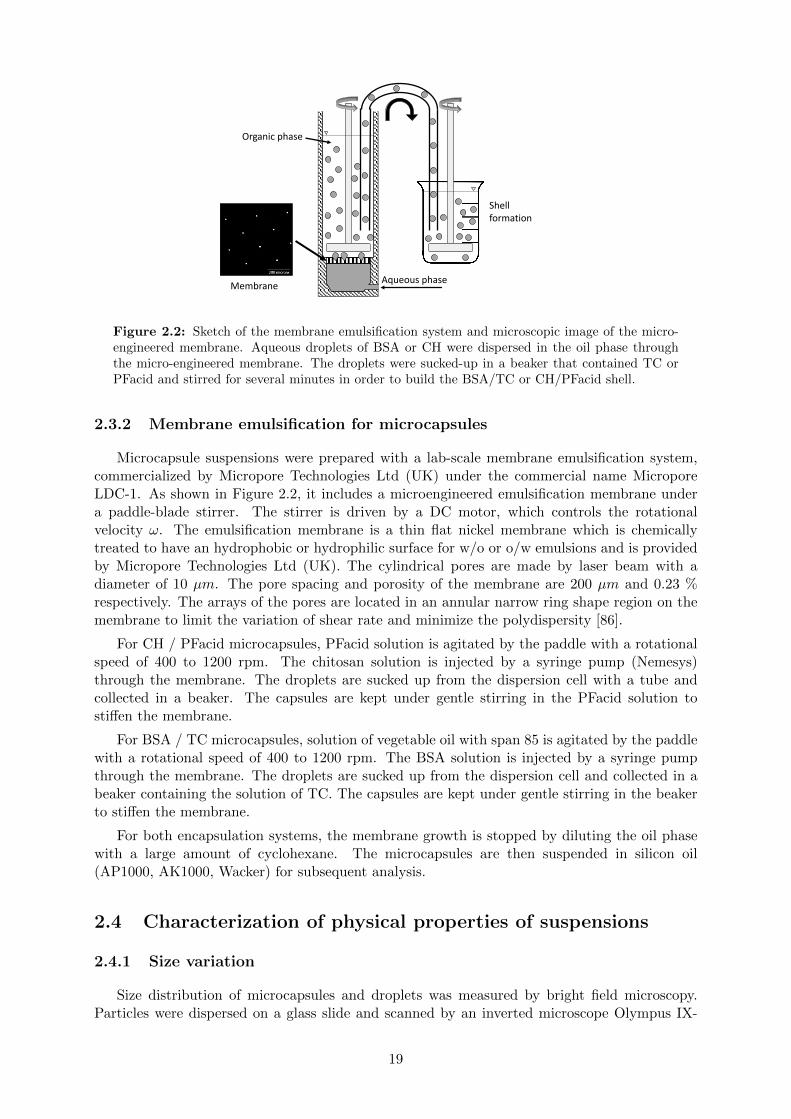
Figure 2.2: Sketch of the membrane emulsification system and microscopic image of the micro-engineered membrane. Aqueous droplets of BSA or CH were dispersed in the oil phase throughthe micro-engineered membrane. The droplets were sucked-up in a beaker that contained TC orPFacid and stirred for several minutes in order to build the BSA/TC or CH/PFacid shell.
2.3.2 Membrane emulsification for microcapsules
Microcapsule suspensions were prepared with a lab-scale membrane emulsification system,commercialized by Micropore Technologies Ltd (UK) under the commercial name MicroporeLDC-1. As shown in Figure 2.2, it includes a microengineered emulsification membrane undera paddle-blade stirrer. The stirrer is driven by a DC motor, which controls the rotationalvelocity ω. The emulsification membrane is a thin flat nickel membrane which is chemicallytreated to have an hydrophobic or hydrophilic surface for w/o or o/w emulsions and is providedby Micropore Technologies Ltd (UK). The cylindrical pores are made by laser beam with adiameter of 10 µm. The pore spacing and porosity of the membrane are 200 µm and 0.23 %respectively. The arrays of the pores are located in an annular narrow ring shape region on themembrane to limit the variation of shear rate and minimize the polydispersity [86].
For CH / PFacid microcapsules, PFacid solution is agitated by the paddle with a rotationalspeed of 400 to 1200 rpm. The chitosan solution is injected by a syringe pump (Nemesys)through the membrane. The droplets are sucked up from the dispersion cell with a tube andcollected in a beaker. The capsules are kept under gentle stirring in the PFacid solution tostiffen the membrane.
For BSA / TC microcapsules, solution of vegetable oil with span 85 is agitated by the paddlewith a rotational speed of 400 to 1200 rpm. The BSA solution is injected by a syringe pumpthrough the membrane. The droplets are sucked up from the dispersion cell and collected in abeaker containing the solution of TC. The capsules are kept under gentle stirring in the beakerto stiffen the membrane.
For both encapsulation systems, the membrane growth is stopped by diluting the oil phasewith a large amount of cyclohexane. The microcapsules are then suspended in silicon oil(AP1000, AK1000, Wacker) for subsequent analysis.
2.4 Characterization of physical properties of suspensions
2.4.1 Size variation
Size distribution of microcapsules and droplets was measured by bright field microscopy.Particles were dispersed on a glass slide and scanned by an inverted microscope Olympus IX-
19
73 equipped with a 4, 10, or 20 times objective, a Marzhauser motorized stage, and a cameraHamamatsu ORCA-Flash 4.0. The sizes of the particles were measured with an home-madealgorithm based on the image processing toolbox of Matlab (Mathworks) with several thousandsof microcapsules for each batch.
2.4.2 Volume fraction
To determine the volume fraction of the particle suspensions, firstly the suspension was mixedwell to be homogenized, and then at least three samples with precise volumes were retrieved fromdifferent places.The samples were diluted in the suspending fluid and entirely scanned under themicroscope to find the total volume of particles.
2.4.3 Microcapsules shell elasticity Gs
We work under an assumption that microcapsules at rest have a spherical shape with aradius R. In the stagnation point, the major axis of the deformed microcapsule align with thedirection of elongational flow in cross-slot branches. The projection of the deformed microcapsuleprofile in x − y plane forms an ellipsoid with semi-principal axes L and S. The deformation ischaracterized by Taylor parameter
D =L− SL+ S
(2.1)
Based on the theory of Barthes-Biesel [87, 88] we can relate the steady state deformation ofmicrocapsules D∞ and the surface elasticity modulus Gs. In the regime of small deformationsD∞ < 0.1 and for Capillary number Ca 1,
Gs =25
6
ηεR
D∞(2.2)
where η is viscosity of the continuous phase.
Microfluidic device
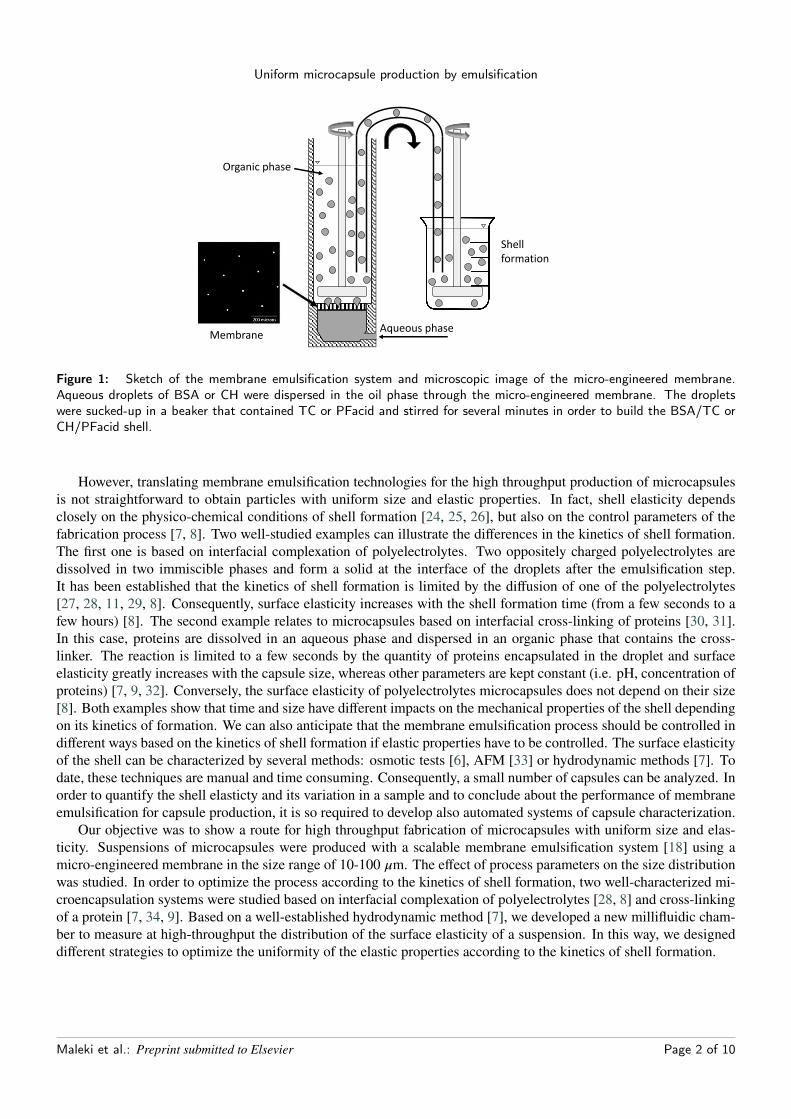
In short, the microfluidic device is comprised of a 2D flow-focusing geometry in series witha cross-slot chamber, Figure 2.3-b. The flow-focusing geometry is used to center the capsules inthe middle of the channel. The cross-slot with two opposite inlets and two opposite outlets isused to generate an extensional flow in which microcapsules are deformed and analyzed. Themicrofluidic design with a square cross section (1×1 and 0.5×0.5 mm2) was milled in PMMAmold that was further glued to a glass slide and connected to four syringe pumps (Nemesys).Microcapsules are injected in the central channel of the flow focusing and are centered by thetwo perpendicular jets (Figure 2.3-c). They travel with the flow to the center of the cross-slotchamber to be deformed in the region where hydrodynamic stress is constant and controlledwith precision (Figure 2.3-d).
The microfluidic device is placed on an inverted microscope (Olympus IX-71) which isequipped with 20 and 40 fold objectives. A fast camera (Photron Fastcom SA3) allows usto take images up to 2000 frames per second. In order to minimize the transient time in themicrofluidic system the usage of deformable tubings should be avoided as well as the air pocketsin the system.
Cross-slot chamber
To determine the mechanical properties of a microcapsule’s membrane, we should study theresponse of the membrane to exerted hydrodynamic stress. A planar extension flow in a cross-slotchamber allows us to impose the desired hydrodynamic stress on microcapsule’s membrane in acontrolled way. Figure 2.3-d shows a microcapsule brought by a flow to the center of elongationalregion. If the microcapsule passes through the center of the cross, it deforms as response to the
20
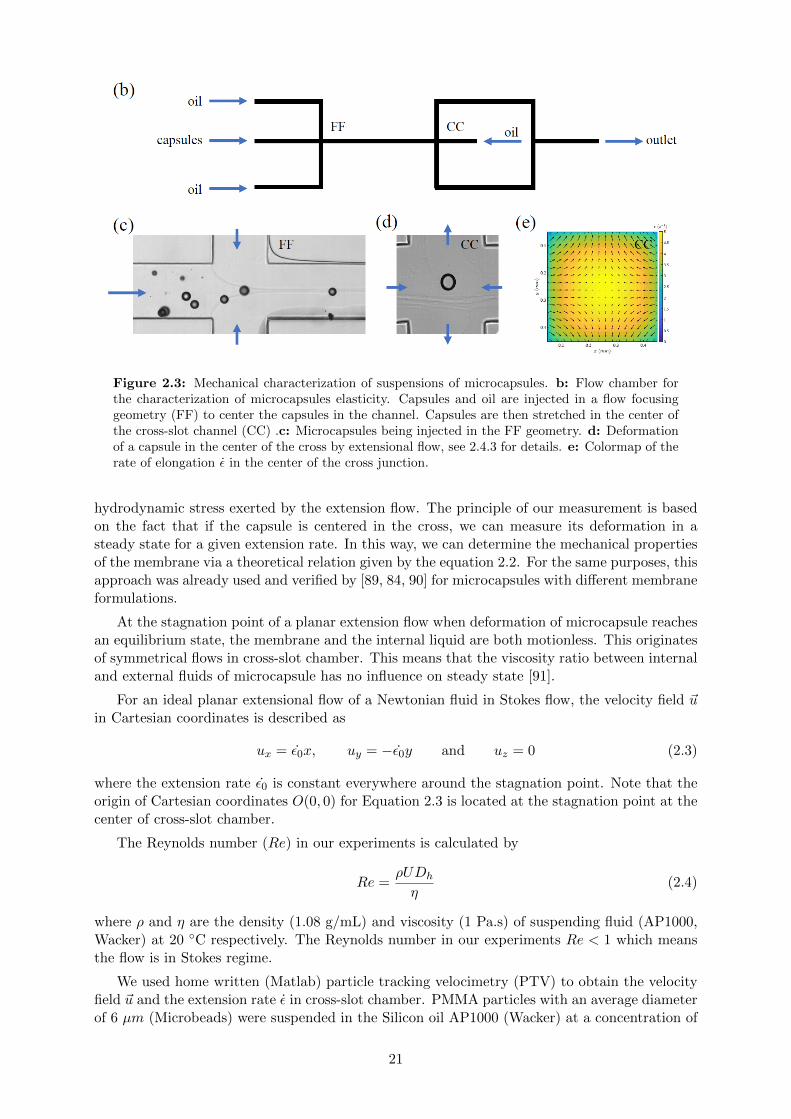
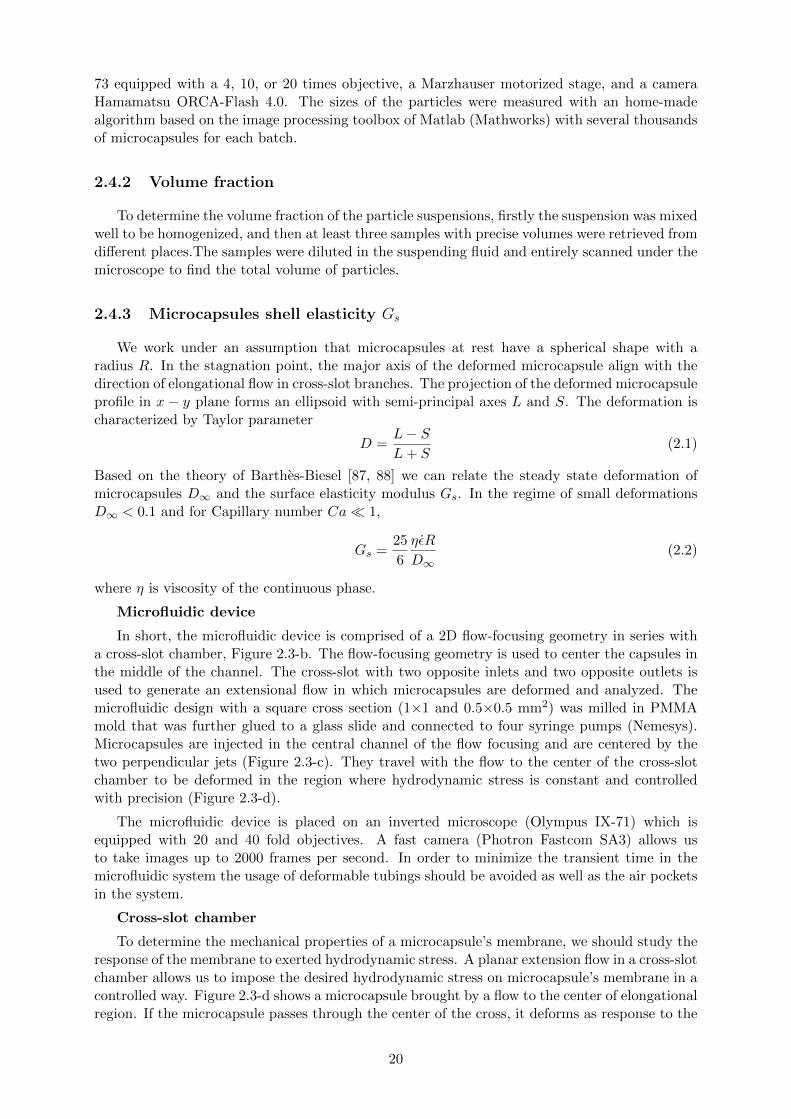
Figure 2.3: Mechanical characterization of suspensions of microcapsules. b: Flow chamber forthe characterization of microcapsules elasticity. Capsules and oil are injected in a flow focusinggeometry (FF) to center the capsules in the channel. Capsules are then stretched in the center ofthe cross-slot channel (CC) .c: Microcapsules being injected in the FF geometry. d: Deformationof a capsule in the center of the cross by extensional flow, see 2.4.3 for details. e: Colormap of therate of elongation ε in the center of the cross junction.
hydrodynamic stress exerted by the extension flow. The principle of our measurement is basedon the fact that if the capsule is centered in the cross, we can measure its deformation in asteady state for a given extension rate. In this way, we can determine the mechanical propertiesof the membrane via a theoretical relation given by the equation 2.2. For the same purposes, thisapproach was already used and verified by [89, 84, 90] for microcapsules with different membraneformulations.
At the stagnation point of a planar extension flow when deformation of microcapsule reachesan equilibrium state, the membrane and the internal liquid are both motionless. This originatesof symmetrical flows in cross-slot chamber. This means that the viscosity ratio between internaland external fluids of microcapsule has no influence on steady state [91].
For an ideal planar extensional flow of a Newtonian fluid in Stokes flow, the velocity field ~uin Cartesian coordinates is described as
ux = ε0x, uy = −ε0y and uz = 0 (2.3)
where the extension rate ε0 is constant everywhere around the stagnation point. Note that theorigin of Cartesian coordinates O(0, 0) for Equation 2.3 is located at the stagnation point at thecenter of cross-slot chamber.
The Reynolds number (Re) in our experiments is calculated by
Re =ρUDh
η(2.4)
where ρ and η are the density (1.08 g/mL) and viscosity (1 Pa.s) of suspending fluid (AP1000,Wacker) at 20 C respectively. The Reynolds number in our experiments Re < 1 which meansthe flow is in Stokes regime.
We used home written (Matlab) particle tracking velocimetry (PTV) to obtain the velocityfield ~u and the extension rate ε in cross-slot chamber. PMMA particles with an average diameterof 6 µm (Microbeads) were suspended in the Silicon oil AP1000 (Wacker) at a concentration of
21
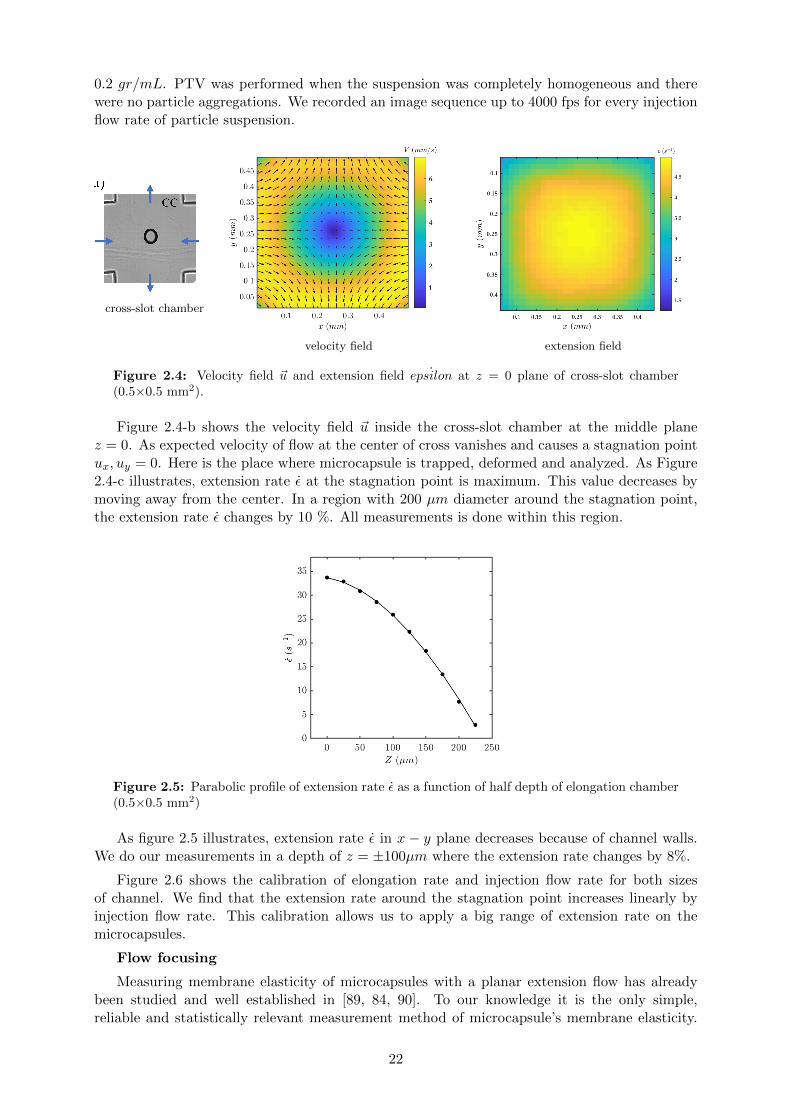
0.2 gr/mL. PTV was performed when the suspension was completely homogeneous and therewere no particle aggregations. We recorded an image sequence up to 4000 fps for every injectionflow rate of particle suspension.
cross-slot chamber
velocity field extension field
Figure 2.4: Velocity field ~u and extension field ˙epsilon at z = 0 plane of cross-slot chamber(0.5×0.5 mm2).
Figure 2.4-b shows the velocity field ~u inside the cross-slot chamber at the middle planez = 0. As expected velocity of flow at the center of cross vanishes and causes a stagnation pointux, uy = 0. Here is the place where microcapsule is trapped, deformed and analyzed. As Figure2.4-c illustrates, extension rate ε at the stagnation point is maximum. This value decreases bymoving away from the center. In a region with 200 µm diameter around the stagnation point,the extension rate ε changes by 10 %. All measurements is done within this region.
Figure 2.5: Parabolic profile of extension rate ε as a function of half depth of elongation chamber(0.5×0.5 mm2)
As figure 2.5 illustrates, extension rate ε in x − y plane decreases because of channel walls.We do our measurements in a depth of z = ±100µm where the extension rate changes by 8%.
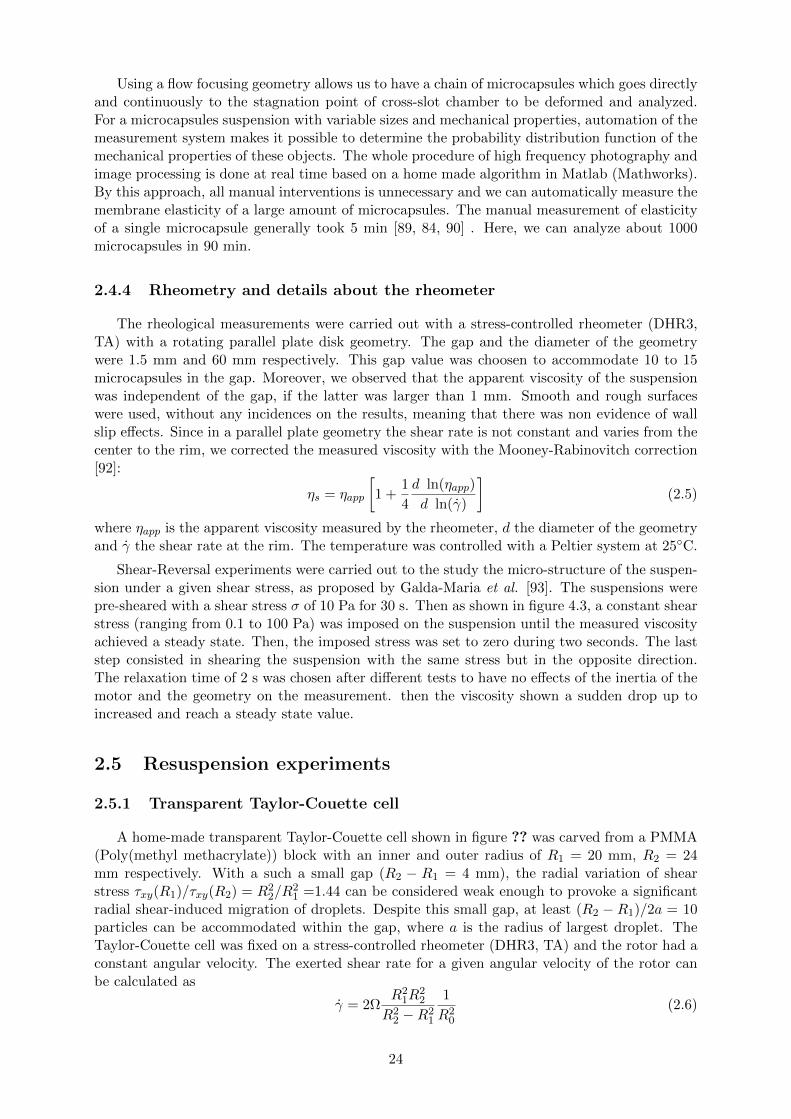
Figure 2.6 shows the calibration of elongation rate and injection flow rate for both sizesof channel. We find that the extension rate around the stagnation point increases linearly byinjection flow rate. This calibration allows us to apply a big range of extension rate on themicrocapsules.
Flow focusing
Measuring membrane elasticity of microcapsules with a planar extension flow has alreadybeen studied and well established in [89, 84, 90]. To our knowledge it is the only simple,reliable and statistically relevant measurement method of microcapsule’s membrane elasticity.
22
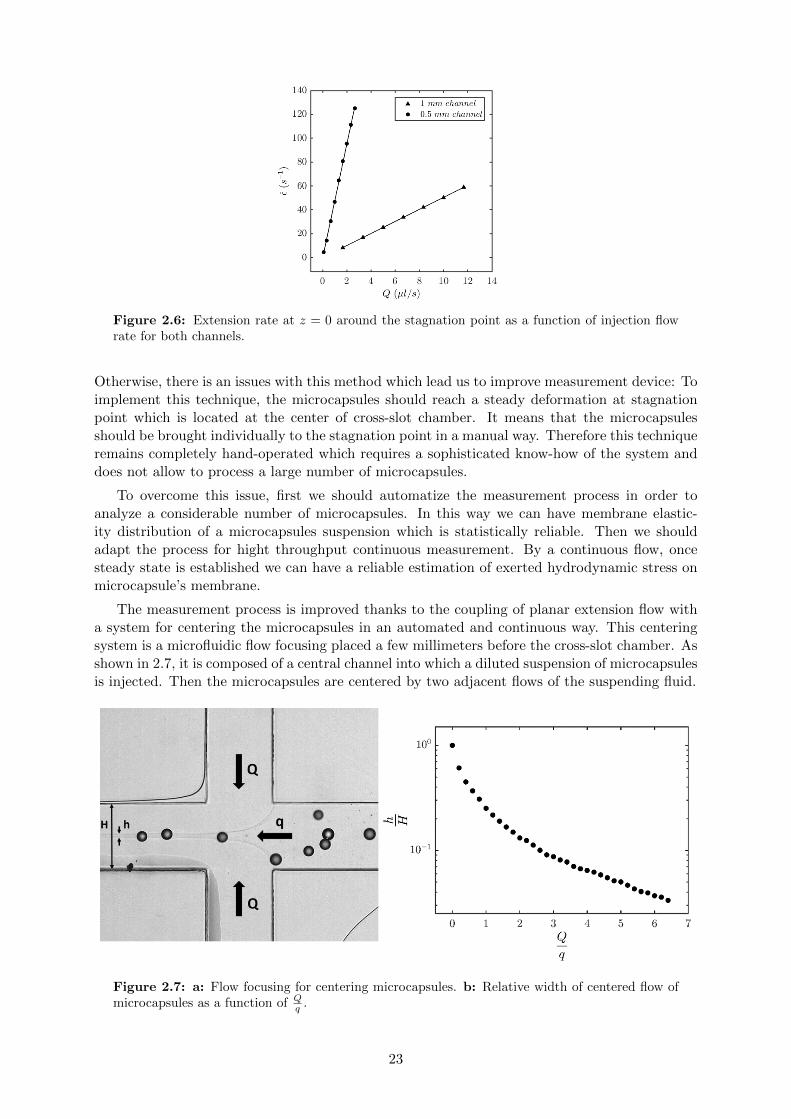
Figure 2.6: Extension rate at z = 0 around the stagnation point as a function of injection flowrate for both channels.
Otherwise, there is an issues with this method which lead us to improve measurement device: Toimplement this technique, the microcapsules should reach a steady deformation at stagnationpoint which is located at the center of cross-slot chamber. It means that the microcapsulesshould be brought individually to the stagnation point in a manual way. Therefore this techniqueremains completely hand-operated which requires a sophisticated know-how of the system anddoes not allow to process a large number of microcapsules.
To overcome this issue, first we should automatize the measurement process in order toanalyze a considerable number of microcapsules. In this way we can have membrane elastic-ity distribution of a microcapsules suspension which is statistically reliable. Then we shouldadapt the process for hight throughput continuous measurement. By a continuous flow, oncesteady state is established we can have a reliable estimation of exerted hydrodynamic stress onmicrocapsule’s membrane.
The measurement process is improved thanks to the coupling of planar extension flow witha system for centering the microcapsules in an automated and continuous way. This centeringsystem is a microfluidic flow focusing placed a few millimeters before the cross-slot chamber. Asshown in 2.7, it is composed of a central channel into which a diluted suspension of microcapsulesis injected. Then the microcapsules are centered by two adjacent flows of the suspending fluid.
Figure 2.7: a: Flow focusing for centering microcapsules. b: Relative width of centered flow ofmicrocapsules as a function of Q
q .
23
Using a flow focusing geometry allows us to have a chain of microcapsules which goes directlyand continuously to the stagnation point of cross-slot chamber to be deformed and analyzed.For a microcapsules suspension with variable sizes and mechanical properties, automation of themeasurement system makes it possible to determine the probability distribution function of themechanical properties of these objects. The whole procedure of high frequency photography andimage processing is done at real time based on a home made algorithm in Matlab (Mathworks).By this approach, all manual interventions is unnecessary and we can automatically measure themembrane elasticity of a large amount of microcapsules. The manual measurement of elasticityof a single microcapsule generally took 5 min [89, 84, 90] . Here, we can analyze about 1000microcapsules in 90 min.
2.4.4 Rheometry and details about the rheometer
The rheological measurements were carried out with a stress-controlled rheometer (DHR3,TA) with a rotating parallel plate disk geometry. The gap and the diameter of the geometrywere 1.5 mm and 60 mm respectively. This gap value was choosen to accommodate 10 to 15microcapsules in the gap. Moreover, we observed that the apparent viscosity of the suspensionwas independent of the gap, if the latter was larger than 1 mm. Smooth and rough surfaceswere used, without any incidences on the results, meaning that there was non evidence of wallslip effects. Since in a parallel plate geometry the shear rate is not constant and varies from thecenter to the rim, we corrected the measured viscosity with the Mooney-Rabinovitch correction[92]:
ηs = ηapp
[1 +
1
4
d ln(ηapp)
d ln(γ)
](2.5)
where ηapp is the apparent viscosity measured by the rheometer, d the diameter of the geometryand γ the shear rate at the rim. The temperature was controlled with a Peltier system at 25C.
Shear-Reversal experiments were carried out to the study the micro-structure of the suspen-sion under a given shear stress, as proposed by Galda-Maria et al. [93]. The suspensions werepre-sheared with a shear stress σ of 10 Pa for 30 s. Then as shown in figure 4.3, a constant shearstress (ranging from 0.1 to 100 Pa) was imposed on the suspension until the measured viscosityachieved a steady state. Then, the imposed stress was set to zero during two seconds. The laststep consisted in shearing the suspension with the same stress but in the opposite direction.The relaxation time of 2 s was chosen after different tests to have no effects of the inertia of themotor and the geometry on the measurement. then the viscosity shown a sudden drop up toincreased and reach a steady state value.
2.5 Resuspension experiments
2.5.1 Transparent Taylor-Couette cell
A home-made transparent Taylor-Couette cell shown in figure ?? was carved from a PMMA(Poly(methyl methacrylate)) block with an inner and outer radius of R1 = 20 mm, R2 = 24mm respectively. With a such a small gap (R2 − R1 = 4 mm), the radial variation of shearstress τxy(R1)/τxy(R2) = R2
2/R21 =1.44 can be considered weak enough to provoke a significant
radial shear-induced migration of droplets. Despite this small gap, at least (R2 − R1)/2a = 10particles can be accommodated within the gap, where a is the radius of largest droplet. TheTaylor-Couette cell was fixed on a stress-controlled rheometer (DHR3, TA) and the rotor had aconstant angular velocity. The exerted shear rate for a given angular velocity of the rotor canbe calculated as
γ = 2ΩR2
1R22
R22 −R2
1
1
R20
(2.6)
24
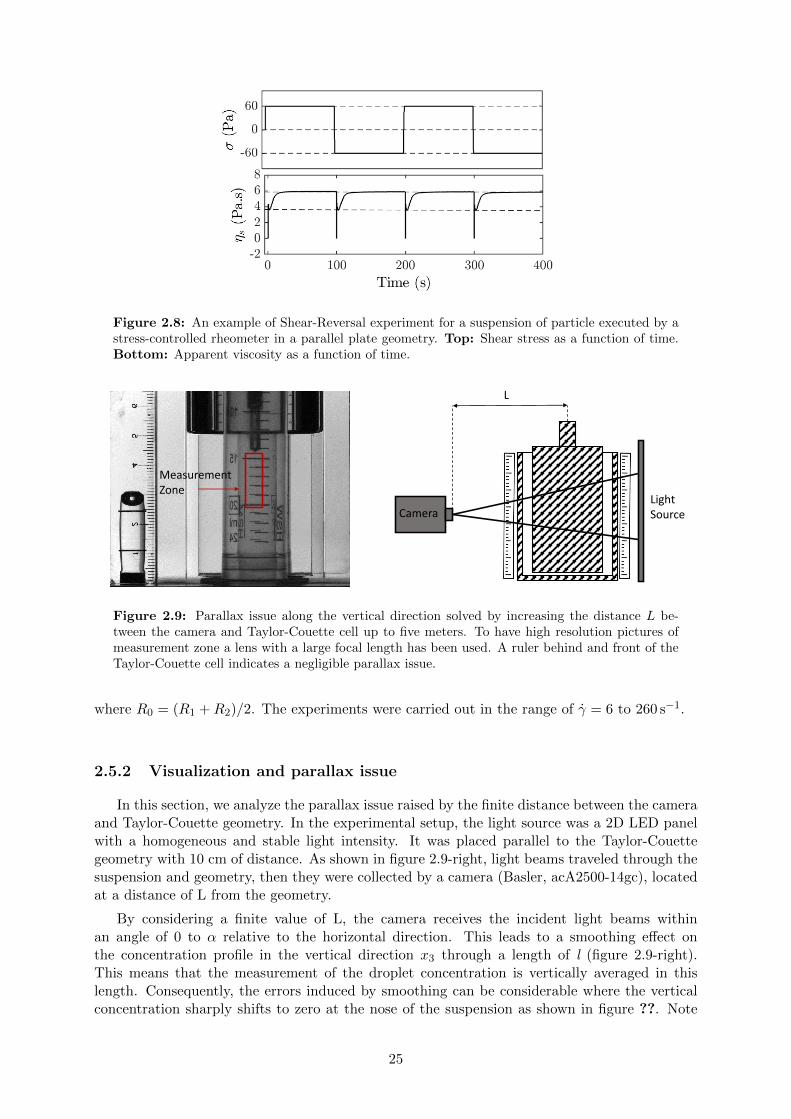
Figure 2.8: An example of Shear-Reversal experiment for a suspension of particle executed by astress-controlled rheometer in a parallel plate geometry. Top: Shear stress as a function of time.Bottom: Apparent viscosity as a function of time.
MeasurementZone
Light SourceCamera
L
Figure 2.9: Parallax issue along the vertical direction solved by increasing the distance L be-tween the camera and Taylor-Couette cell up to five meters. To have high resolution pictures ofmeasurement zone a lens with a large focal length has been used. A ruler behind and front of theTaylor-Couette cell indicates a negligible parallax issue.
where R0 = (R1 +R2)/2. The experiments were carried out in the range of γ = 6 to 260 s−1.
2.5.2 Visualization and parallax issue
In this section, we analyze the parallax issue raised by the finite distance between the cameraand Taylor-Couette geometry. In the experimental setup, the light source was a 2D LED panelwith a homogeneous and stable light intensity. It was placed parallel to the Taylor-Couettegeometry with 10 cm of distance. As shown in figure 2.9-right, light beams traveled through thesuspension and geometry, then they were collected by a camera (Basler, acA2500-14gc), locatedat a distance of L from the geometry.
By considering a finite value of L, the camera receives the incident light beams withinan angle of 0 to α relative to the horizontal direction. This leads to a smoothing effect onthe concentration profile in the vertical direction x3 through a length of l (figure 2.9-right).This means that the measurement of the droplet concentration is vertically averaged in thislength. Consequently, the errors induced by smoothing can be considerable where the verticalconcentration sharply shifts to zero at the nose of the suspension as shown in figure ??. Note
25
that, measurement of normal viscosity ηn,3 and determining exponent n in SBM model dependsstrongly on the provided precision to detect the curvature of the concentration transition tozero.
By increasing the distance L between the camera and geometry, the angle α and the verticalaveraging length l reduce. Consequently, the spatial smoothing of the concentration profile inthe vertical direction becomes less effective. The experiments were performed with a distance ofL up to 5 m, whereas the height of the suspension in the measurement zone was 2 cm. To havehigh resolution images (5 pixels for a droplet diameter) we used a lens with a large focal length.Figure 2.9-left represents an image of the geometry with two similar rulers placed at two sides ofthe geometry. We can observe that the parallax in the measurement zone is negligible howeverby approaching to the bottom of geometry, it becomes more decisive. In such configuration ofthe experimental setup, we estimate α = 0.11 degree and vertical averaging length l = 96µm.The ratio of l to the diameter of monodisperse and polydisperse droplets is l/a = 1/3 and 1respectively. These small ratios indicate a negligible effect of the parallax on the concentrationprofile measurement where it experiences a sharp transition to zero. Consequently, the parallaxdoes not impact the comparison of our measurements with SBM model.
2.5.3 Concentration profile measurement by light absorption
Vertical concentration profile of the resuspended emulsion φ(x3) was determined based onthe difference of light absorbance degree between the internal and external phase of droplets.This measurement relies on the fact that the intensity of light decreases as it travels througha liquid. This is due to absorption of light energy by medium’s molecules. A large absorbancemeans that the light is quickly absorbed and a small absorbance means that the medium isrelatively transparent to the light.
Initially since both mediums are completely transparent, there is no measurable light ab-sorbance difference. Adding a colorant to the suspending fluid can provide a contrast in lightabsorbance degree between two phases. A non-fluorescent food-grade additive, E122 (Breton)used as the colorant. The idea is that the suspending fluid with a specific concentration ofcolorant c has an exact light absorbance degree. By inserting transparent droplets into thesuspending fluid, the local concentration of the colorant c decreases and subsequently the lightabsorbance inclines. Thus characterizing absorbance of suspending fluid as a function of colorantconcentration leads us to measure the local volume concentration of droplets φ.
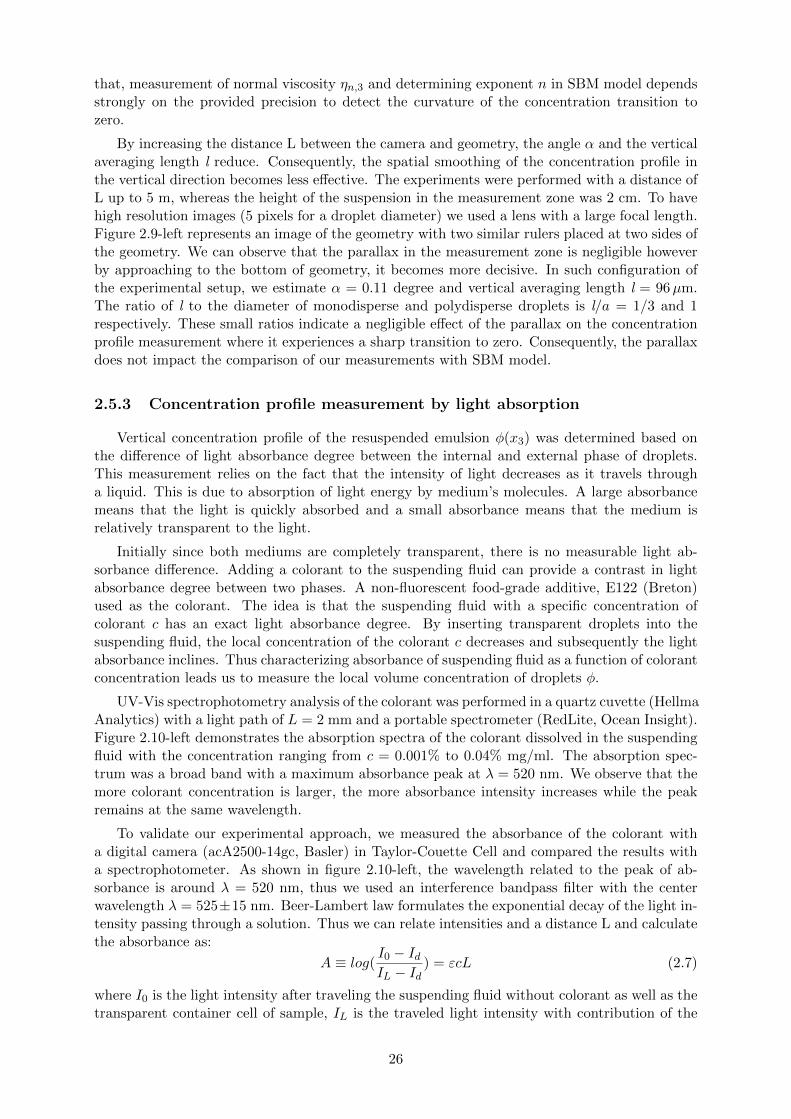
UV-Vis spectrophotometry analysis of the colorant was performed in a quartz cuvette (HellmaAnalytics) with a light path of L = 2 mm and a portable spectrometer (RedLite, Ocean Insight).Figure 2.10-left demonstrates the absorption spectra of the colorant dissolved in the suspendingfluid with the concentration ranging from c = 0.001% to 0.04% mg/ml. The absorption spec-trum was a broad band with a maximum absorbance peak at λ = 520 nm. We observe that themore colorant concentration is larger, the more absorbance intensity increases while the peakremains at the same wavelength.
To validate our experimental approach, we measured the absorbance of the colorant witha digital camera (acA2500-14gc, Basler) in Taylor-Couette Cell and compared the results witha spectrophotometer. As shown in figure 2.10-left, the wavelength related to the peak of ab-sorbance is around λ = 520 nm, thus we used an interference bandpass filter with the centerwavelength λ = 525±15 nm. Beer-Lambert law formulates the exponential decay of the light in-tensity passing through a solution. Thus we can relate intensities and a distance L and calculatethe absorbance as:
A ≡ log(I0 − IdIL − Id
) = εcL (2.7)
where I0 is the light intensity after traveling the suspending fluid without colorant as well as thetransparent container cell of sample, IL is the traveled light intensity with contribution of the
26
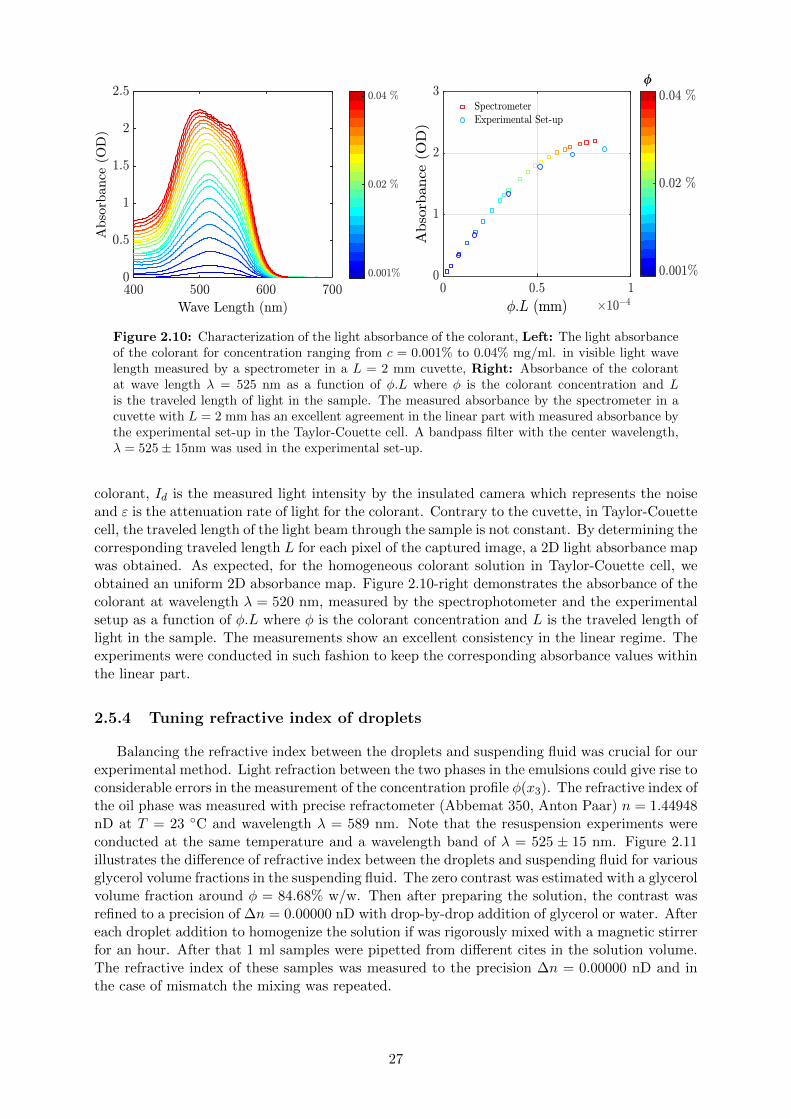
Figure 2.10: Characterization of the light absorbance of the colorant, Left: The light absorbanceof the colorant for concentration ranging from c = 0.001% to 0.04% mg/ml. in visible light wavelength measured by a spectrometer in a L = 2 mm cuvette, Right: Absorbance of the colorantat wave length λ = 525 nm as a function of φ.L where φ is the colorant concentration and Lis the traveled length of light in the sample. The measured absorbance by the spectrometer in acuvette with L = 2 mm has an excellent agreement in the linear part with measured absorbance bythe experimental set-up in the Taylor-Couette cell. A bandpass filter with the center wavelength,λ = 525± 15nm was used in the experimental set-up.
colorant, Id is the measured light intensity by the insulated camera which represents the noiseand ε is the attenuation rate of light for the colorant. Contrary to the cuvette, in Taylor-Couettecell, the traveled length of the light beam through the sample is not constant. By determining thecorresponding traveled length L for each pixel of the captured image, a 2D light absorbance mapwas obtained. As expected, for the homogeneous colorant solution in Taylor-Couette cell, weobtained an uniform 2D absorbance map. Figure 2.10-right demonstrates the absorbance of thecolorant at wavelength λ = 520 nm, measured by the spectrophotometer and the experimentalsetup as a function of φ.L where φ is the colorant concentration and L is the traveled length oflight in the sample. The measurements show an excellent consistency in the linear regime. Theexperiments were conducted in such fashion to keep the corresponding absorbance values withinthe linear part.
2.5.4 Tuning refractive index of droplets
Balancing the refractive index between the droplets and suspending fluid was crucial for ourexperimental method. Light refraction between the two phases in the emulsions could give rise toconsiderable errors in the measurement of the concentration profile φ(x3). The refractive index ofthe oil phase was measured with precise refractometer (Abbemat 350, Anton Paar) n = 1.44948nD at T = 23 C and wavelength λ = 589 nm. Note that the resuspension experiments wereconducted at the same temperature and a wavelength band of λ = 525 ± 15 nm. Figure 2.11illustrates the difference of refractive index between the droplets and suspending fluid for variousglycerol volume fractions in the suspending fluid. The zero contrast was estimated with a glycerolvolume fraction around φ = 84.68% w/w. Then after preparing the solution, the contrast wasrefined to a precision of ∆n = 0.00000 nD with drop-by-drop addition of glycerol or water. Aftereach droplet addition to homogenize the solution if was rigorously mixed with a magnetic stirrerfor an hour. After that 1 ml samples were pipetted from different cites in the solution volume.The refractive index of these samples was measured to the precision ∆n = 0.00000 nD and inthe case of mismatch the mixing was repeated.
27
Figure 2.11: The difference of refractive index between the droplets and suspending fluid as afunction of glycerol volume fraction at 23 C and wavelength λ = 589 nm. A zero contrast ofrefractive index was estimated with glycerol concentration φ = 84.6888%. The final contrast wasrefined to a precision of ∆n = 0.00000 nD by adding some drops of glycerol or water.
28
Chapter 3
Production and characterization ofmicrocapsules
29
Membrane emulsification for the production of suspensions ofuniform microcapsules with tunable mechanical propertiesMehdi Malekia, Clément de Loubensa,∗, Kaili Xiea, Emeline Talansiera, Hugues Bodiguelaand Marc LeonettiaaUniv. Grenoble Alpes, CNRS, Grenoble INP, LRP, 38000 Grenoble, France
ART ICLE INFOKeywords:membrane emulsificationmicrocapsulesinterfacial rheologymicrofluidiccapillaritycore-shell particle
ABSTRACTA way forward for high throughput fabrication of microcapsules with uniform size and mechan-ical properties was reported irrespective of the kinetic process of shell assembly. Microcapsuleswere produced using lab-scale emulsification equipment with a micro-engineered membrane inthe size range 10-100m. The shell of themicrocapsules was assembled at thewater-oil interfaceby complexation of polyelectrolytes or cross-linking of proteins providing two different kineticprocesses. Elasticity of microcapsules was characterized with an automated extensional flowchamber. Process parameters were optimized to obtain suspensions with size variations of 15%.Some strategies were developed to obtain uniform elastic properties according to the kinetics ofshell assembly. If kinetics is limited by diffusion, membrane emulsification and shell assemblyhave to be split into two steps. If kinetics is limited by the quantity of reactants encapsulated inthe droplet, variations of elastic properties result only from size variations.
1. IntroductionTuning the physical properties of microcapsules is of prime importance to control their stability and the delivery of
encapsulated compounds in biological or industrial processes [1, 2, 3, 4]. Microcapsules’ shells are ultra-thin elasticfilms characterized by a surface shear elastic modulus Gs ∼ Gℎ, where ℎ is the shell thickness and G the bulk shearelastic modulus. Deformation of a microcapsule of radius R in a shear flow of hydrodynamic stress is controlledby a capillary number Ca = R∕Gs that represents the ratio of viscous stress over the elastic shell response [5].Consequently both size and shell rheology control the fate of microcapsules in processes such as break-up. Releaseof encapsulated compounds by osmotic pressure differences is also controlled by both shell elasticity and capsule size[6].
The simplest process for the fabrication of microcapsules is based on the emulsification with a rotor of two immis-cible fluids with chemicals in each phase and their subsequent reaction at the interface leading to the formation of theshell [7, 8]. The major drawback of this process is the large variations of size and elasticity of produced microcapsules[7, 9]. Up to now, the gold standard method to control the properties of microcapsules is the layer-by-layer assemblyof polyelectrolytes on dissolvable particles [10]. However this method is long and complex if several layers have tobe deposited in order to stiffen the shell. Recently, several research groups have developed microfluidics techniquesto generate microcapsules with highly uniform size and elasticity based on flow-focusing systems [8, 11, 12, 13, 14].These techniques have clearly demonstrated their usefulness in understanding the relationships between the assembly ofmicrocapsules and their interfacial rheological properties [8, 15], but were limited to research tools as their throughputwas very low (a few L/min) and were not easily scalable for industrial applications. Designing high throughput pro-cesses for the fabrication of microcapsule suspensions with uniform physical properties should open new perspectivesfor the optimization of microencapsulation technologies, e.g. drug delivery systems.
On the other hand, producing high-quality emulsions at pilot and industrial scales was made possible by the de-velopment of membrane emulsification systems with micro-engineered membranes [16, 17, 18]. Briefly, membraneemulsification consists in passing the dispersed phase through a membrane made of regular array of pores to formdroplets that are detached by hydrodynamic stress. The pores size and surface properties have to be chosen carefullyin order to produce monodisperse drops [19]. To some extent, membrane emulsification is a scaled-up version of mi-crofluidic T-junction chips. Using this technique, suspensions of particles [20], multiple emulsions [21], soft beads[22] and liposomes [23] were produced at lab and pilot scales with an excellent control of the size uniformity.
∗Corresponding author: [email protected](s): 0000-0002-4988-9168 ( Clément de Loubens)
Maleki et al.: Preprint submitted to Elsevier Page 1 of 10
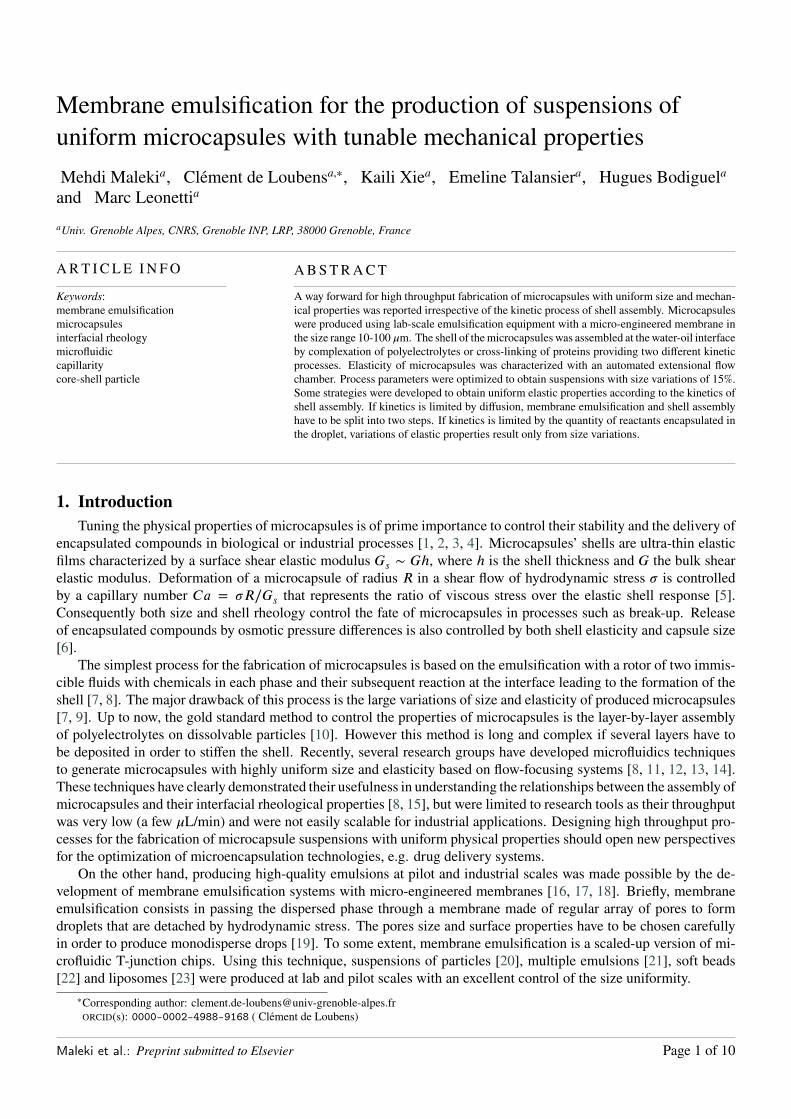
Uniform microcapsule production by emulsification
MembraneAqueous phase
Organic phase
Shell formation
Figure 1: Sketch of the membrane emulsification system and microscopic image of the micro-engineered membrane.Aqueous droplets of BSA or CH were dispersed in the oil phase through the micro-engineered membrane. The dropletswere sucked-up in a beaker that contained TC or PFacid and stirred for several minutes in order to build the BSA/TC orCH/PFacid shell.
However, translating membrane emulsification technologies for the high throughput production of microcapsulesis not straightforward to obtain particles with uniform size and elastic properties. In fact, shell elasticity dependsclosely on the physico-chemical conditions of shell formation [24, 25, 26], but also on the control parameters of thefabrication process [7, 8]. Two well-studied examples can illustrate the differences in the kinetics of shell formation.The first one is based on interfacial complexation of polyelectrolytes. Two oppositely charged polyelectrolytes aredissolved in two immiscible phases and form a solid at the interface of the droplets after the emulsification step.It has been established that the kinetics of shell formation is limited by the diffusion of one of the polyelectrolytes[27, 28, 11, 29, 8]. Consequently, surface elasticity increases with the shell formation time (from a few seconds to afew hours) [8]. The second example relates to microcapsules based on interfacial cross-linking of proteins [30, 31].In this case, proteins are dissolved in an aqueous phase and dispersed in an organic phase that contains the cross-linker. The reaction is limited to a few seconds by the quantity of proteins encapsulated in the droplet and surfaceelasticity greatly increases with the capsule size, whereas other parameters are kept constant (i.e. pH, concentration ofproteins) [7, 9, 32]. Conversely, the surface elasticity of polyelectrolytes microcapsules does not depend on their size[8]. Both examples show that time and size have different impacts on the mechanical properties of the shell dependingon its kinetics of formation. We can also anticipate that the membrane emulsification process should be controlled indifferent ways based on the kinetics of shell formation if elastic properties have to be controlled. The surface elasticityof the shell can be characterized by several methods: osmotic tests [6], AFM [33] or hydrodynamic methods [7]. Todate, these techniques are manual and time consuming. Consequently, a small number of capsules can be analyzed. Inorder to quantify the shell elasticty and its variation in a sample and to conclude about the performance of membraneemulsification for capsule production, it is so required to develop also automated systems of capsule characterization.
Our objective was to show a route for high throughput fabrication of microcapsules with uniform size and elas-ticity. Suspensions of microcapsules were produced with a scalable membrane emulsification system [18] using amicro-engineered membrane in the size range of 10-100 m. The effect of process parameters on the size distributionwas studied. In order to optimize the process according to the kinetics of shell formation, two well-characterized mi-croencapsulation systems were studied based on interfacial complexation of polyelectrolytes [28, 8] and cross-linkingof a protein [7, 34, 9]. Based on a well-established hydrodynamic method [7], we developed a new millifluidic cham-ber to measure at high-throughput the distribution of the surface elasticity of a suspension. In this way, we designeddifferent strategies to optimize the uniformity of the elastic properties according to the kinetics of shell formation.
Maleki et al.: Preprint submitted to Elsevier Page 2 of 10
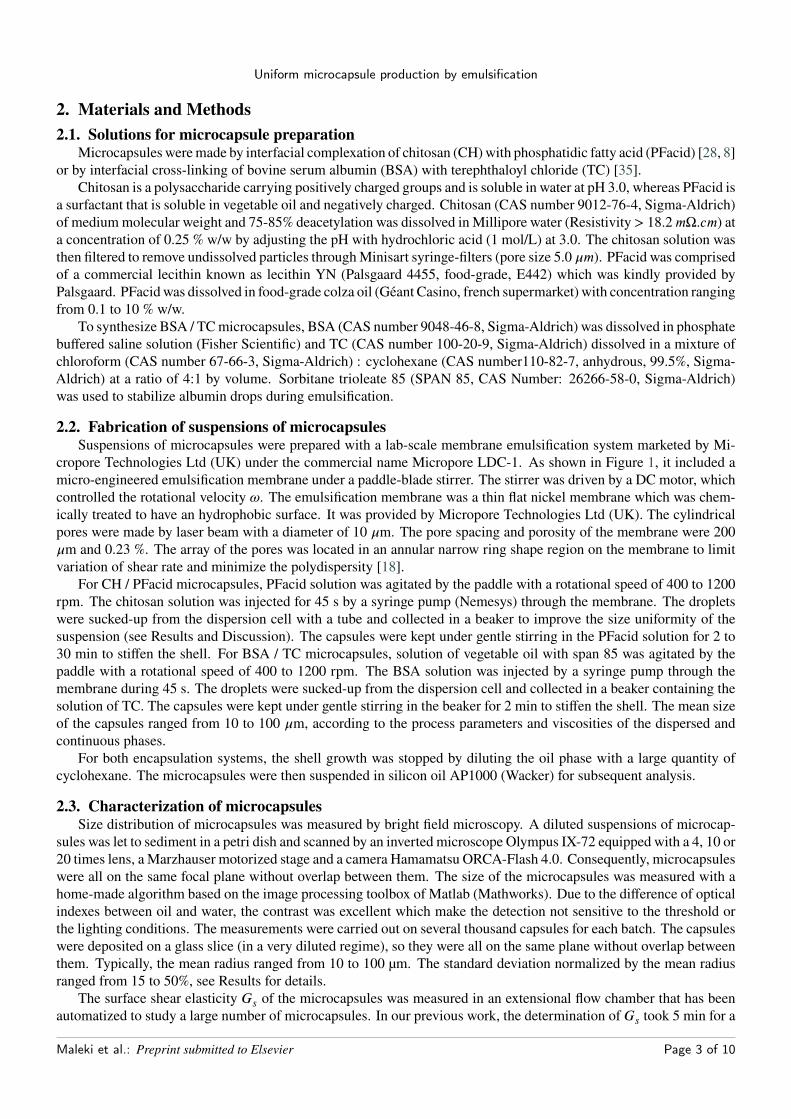
Uniform microcapsule production by emulsification
2. Materials and Methods2.1. Solutions for microcapsule preparation
Microcapsules weremade by interfacial complexation of chitosan (CH)with phosphatidic fatty acid (PFacid) [28, 8]or by interfacial cross-linking of bovine serum albumin (BSA) with terephthaloyl chloride (TC) [35].
Chitosan is a polysaccharide carrying positively charged groups and is soluble in water at pH 3.0, whereas PFacid isa surfactant that is soluble in vegetable oil and negatively charged. Chitosan (CAS number 9012-76-4, Sigma-Aldrich)of mediummolecular weight and 75-85% deacetylation was dissolved in Millipore water (Resistivity > 18.2mΩ.cm) ata concentration of 0.25 % w/w by adjusting the pH with hydrochloric acid (1 mol/L) at 3.0. The chitosan solution wasthen filtered to remove undissolved particles throughMinisart syringe-filters (pore size 5.0 m). PFacid was comprisedof a commercial lecithin known as lecithin YN (Palsgaard 4455, food-grade, E442) which was kindly provided byPalsgaard. PFacidwas dissolved in food-grade colza oil (Géant Casino, french supermarket) with concentration rangingfrom 0.1 to 10 % w/w.
To synthesize BSA / TCmicrocapsules, BSA (CAS number 9048-46-8, Sigma-Aldrich) was dissolved in phosphatebuffered saline solution (Fisher Scientific) and TC (CAS number 100-20-9, Sigma-Aldrich) dissolved in a mixture ofchloroform (CAS number 67-66-3, Sigma-Aldrich) : cyclohexane (CAS number110-82-7, anhydrous, 99.5%, Sigma-Aldrich) at a ratio of 4:1 by volume. Sorbitane trioleate 85 (SPAN 85, CAS Number: 26266-58-0, Sigma-Aldrich)was used to stabilize albumin drops during emulsification.2.2. Fabrication of suspensions of microcapsules
Suspensions of microcapsules were prepared with a lab-scale membrane emulsification system marketed by Mi-cropore Technologies Ltd (UK) under the commercial name Micropore LDC-1. As shown in Figure 1, it included amicro-engineered emulsification membrane under a paddle-blade stirrer. The stirrer was driven by a DC motor, whichcontrolled the rotational velocity !. The emulsification membrane was a thin flat nickel membrane which was chem-ically treated to have an hydrophobic surface. It was provided by Micropore Technologies Ltd (UK). The cylindricalpores were made by laser beam with a diameter of 10 m. The pore spacing and porosity of the membrane were 200m and 0.23 %. The array of the pores was located in an annular narrow ring shape region on the membrane to limitvariation of shear rate and minimize the polydispersity [18].
For CH / PFacid microcapsules, PFacid solution was agitated by the paddle with a rotational speed of 400 to 1200rpm. The chitosan solution was injected for 45 s by a syringe pump (Nemesys) through the membrane. The dropletswere sucked-up from the dispersion cell with a tube and collected in a beaker to improve the size uniformity of thesuspension (see Results and Discussion). The capsules were kept under gentle stirring in the PFacid solution for 2 to30 min to stiffen the shell. For BSA / TC microcapsules, solution of vegetable oil with span 85 was agitated by thepaddle with a rotational speed of 400 to 1200 rpm. The BSA solution was injected by a syringe pump through themembrane during 45 s. The droplets were sucked-up from the dispersion cell and collected in a beaker containing thesolution of TC. The capsules were kept under gentle stirring in the beaker for 2 min to stiffen the shell. The mean sizeof the capsules ranged from 10 to 100 m, according to the process parameters and viscosities of the dispersed andcontinuous phases.
For both encapsulation systems, the shell growth was stopped by diluting the oil phase with a large quantity ofcyclohexane. The microcapsules were then suspended in silicon oil AP1000 (Wacker) for subsequent analysis.2.3. Characterization of microcapsules
Size distribution of microcapsules was measured by bright field microscopy. A diluted suspensions of microcap-sules was let to sediment in a petri dish and scanned by an inverted microscope Olympus IX-72 equipped with a 4, 10 or20 times lens, a Marzhauser motorized stage and a camera Hamamatsu ORCA-Flash 4.0. Consequently, microcapsuleswere all on the same focal plane without overlap between them. The size of the microcapsules was measured with ahome-made algorithm based on the image processing toolbox of Matlab (Mathworks). Due to the difference of opticalindexes between oil and water, the contrast was excellent which make the detection not sensitive to the threshold orthe lighting conditions. The measurements were carried out on several thousand capsules for each batch. The capsuleswere deposited on a glass slice (in a very diluted regime), so they were all on the same plane without overlap betweenthem. Typically, the mean radius ranged from 10 to 100 µm. The standard deviation normalized by the mean radiusranged from 15 to 50%, see Results for details.
The surface shear elasticity Gs of the microcapsules was measured in an extensional flow chamber that has beenautomatized to study a large number of microcapsules. In our previous work, the determination of Gs took 5 min for aMaleki et al.: Preprint submitted to Elsevier Page 3 of 10
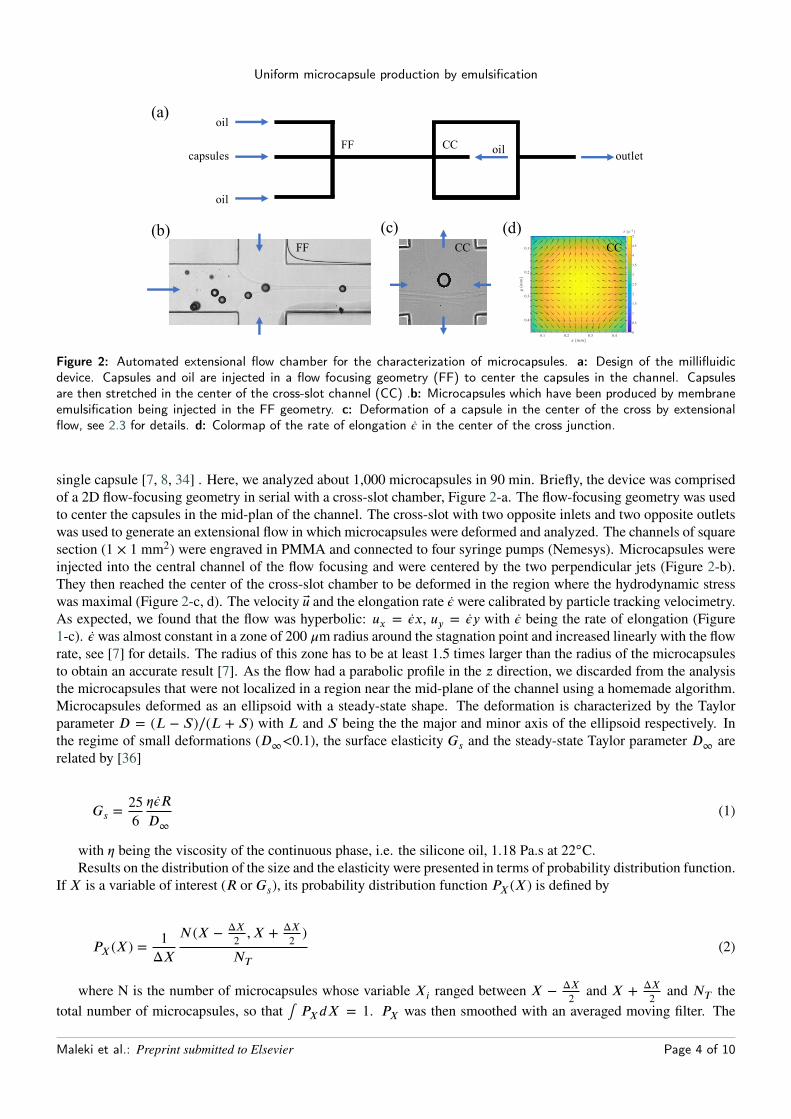
Uniform microcapsule production by emulsification
oil
oil
capsules oil outlet
(a)
(b) (c) (d)
0.1 0.2 0.3 0.4
0.1
0.2
0.3
0.4
0
0.5
1
1.5
2
2.5
3
3.5
4
4.5
5
FF CC
FF CC CC
Figure 2: Automated extensional flow chamber for the characterization of microcapsules. a: Design of the millifluidicdevice. Capsules and oil are injected in a flow focusing geometry (FF) to center the capsules in the channel. Capsulesare then stretched in the center of the cross-slot channel (CC) .b: Microcapsules which have been produced by membraneemulsification being injected in the FF geometry. c: Deformation of a capsule in the center of the cross by extensionalflow, see 2.3 for details. d: Colormap of the rate of elongation in the center of the cross junction.
single capsule [7, 8, 34] . Here, we analyzed about 1,000 microcapsules in 90 min. Briefly, the device was comprisedof a 2D flow-focusing geometry in serial with a cross-slot chamber, Figure 2-a. The flow-focusing geometry was usedto center the capsules in the mid-plan of the channel. The cross-slot with two opposite inlets and two opposite outletswas used to generate an extensional flow in which microcapsules were deformed and analyzed. The channels of squaresection (1 × 1 mm2) were engraved in PMMA and connected to four syringe pumps (Nemesys). Microcapsules wereinjected into the central channel of the flow focusing and were centered by the two perpendicular jets (Figure 2-b).They then reached the center of the cross-slot chamber to be deformed in the region where the hydrodynamic stresswas maximal (Figure 2-c, d). The velocity u and the elongation rate were calibrated by particle tracking velocimetry.As expected, we found that the flow was hyperbolic: ux = x, uy = y with being the rate of elongation (Figure1-c). was almost constant in a zone of 200 m radius around the stagnation point and increased linearly with the flowrate, see [7] for details. The radius of this zone has to be at least 1.5 times larger than the radius of the microcapsulesto obtain an accurate result [7]. As the flow had a parabolic profile in the z direction, we discarded from the analysisthe microcapsules that were not localized in a region near the mid-plane of the channel using a homemade algorithm.Microcapsules deformed as an ellipsoid with a steady-state shape. The deformation is characterized by the Taylorparameter D = (L − S)∕(L + S) with L and S being the the major and minor axis of the ellipsoid respectively. Inthe regime of small deformations (D∞<0.1), the surface elasticity Gs and the steady-state Taylor parameter D∞ arerelated by [36]
Gs =256RD∞
(1)
with being the viscosity of the continuous phase, i.e. the silicone oil, 1.18 Pa.s at 22C.Results on the distribution of the size and the elasticity were presented in terms of probability distribution function.
If X is a variable of interest (R or Gs), its probability distribution function PX(X) is defined by
PX(X) =1ΔX
N(X − ΔX2 , X + ΔX
2 )NT
(2)
where N is the number of microcapsules whose variable Xi ranged between X − ΔX2 and X + ΔX
2 and NT thetotal number of microcapsules, so that ∫ PXdX = 1. PX was then smoothed with an averaged moving filter. The
Maleki et al.: Preprint submitted to Elsevier Page 4 of 10
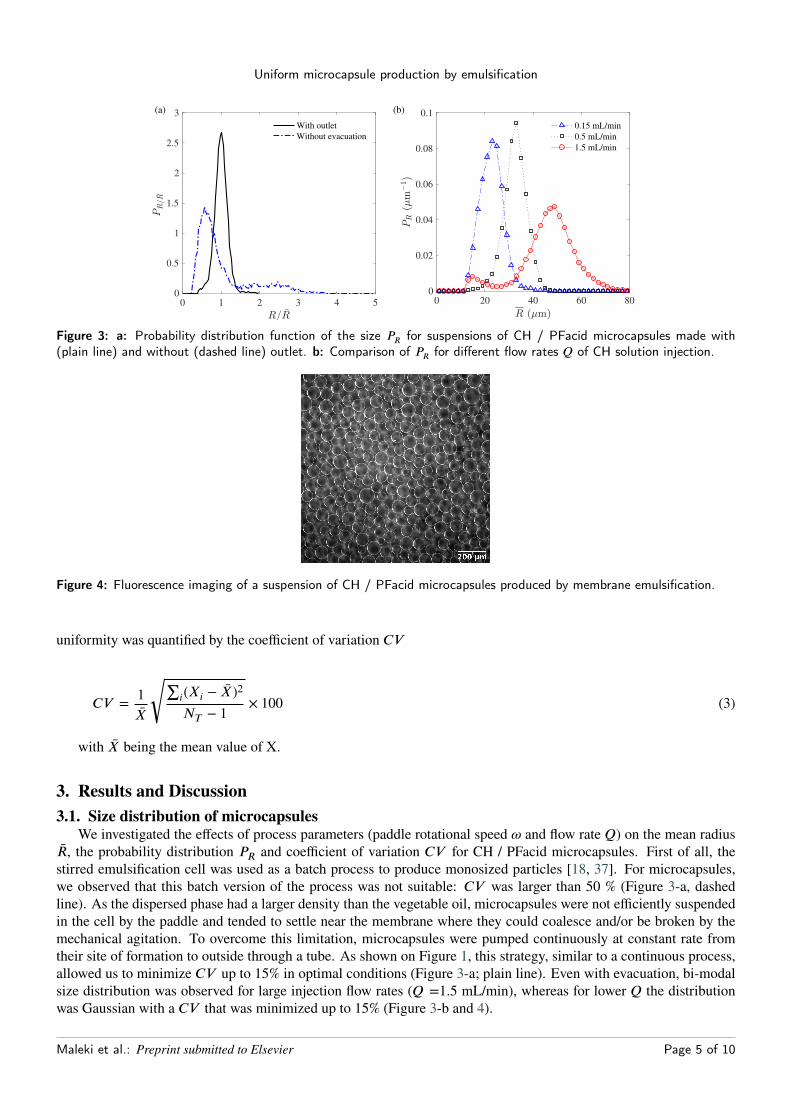
Uniform microcapsule production by emulsification
0 1 2 3 4 50
0.5
1
1.5
2
2.5
3
With outlet
Without evacuation
0 20 40 60 800
0.02
0.04
0.06
0.08
0.1
0.15 mL/min
0.5 mL/min
1.5 mL/min
(a) (b)
Figure 3: a: Probability distribution function of the size PR for suspensions of CH / PFacid microcapsules made with(plain line) and without (dashed line) outlet. b: Comparison of PR for different flow rates Q of CH solution injection.
Figure 4: Fluorescence imaging of a suspension of CH / PFacid microcapsules produced by membrane emulsification.
uniformity was quantified by the coefficient of variation CV
CV = 1X
√∑i(Xi − X)2
NT − 1× 100 (3)
with X being the mean value of X.
3. Results and Discussion3.1. Size distribution of microcapsules
We investigated the effects of process parameters (paddle rotational speed ! and flow rate Q) on the mean radiusR, the probability distribution PR and coefficient of variation CV for CH / PFacid microcapsules. First of all, thestirred emulsification cell was used as a batch process to produce monosized particles [18, 37]. For microcapsules,we observed that this batch version of the process was not suitable: CV was larger than 50 % (Figure 3-a, dashedline). As the dispersed phase had a larger density than the vegetable oil, microcapsules were not efficiently suspendedin the cell by the paddle and tended to settle near the membrane where they could coalesce and/or be broken by themechanical agitation. To overcome this limitation, microcapsules were pumped continuously at constant rate fromtheir site of formation to outside through a tube. As shown on Figure 1, this strategy, similar to a continuous process,allowed us to minimize CV up to 15% in optimal conditions (Figure 3-a; plain line). Even with evacuation, bi-modalsize distribution was observed for large injection flow rates (Q =1.5 mL/min), whereas for lower Q the distributionwas Gaussian with a CV that was minimized up to 15% (Figure 3-b and 4).
Maleki et al.: Preprint submitted to Elsevier Page 5 of 10
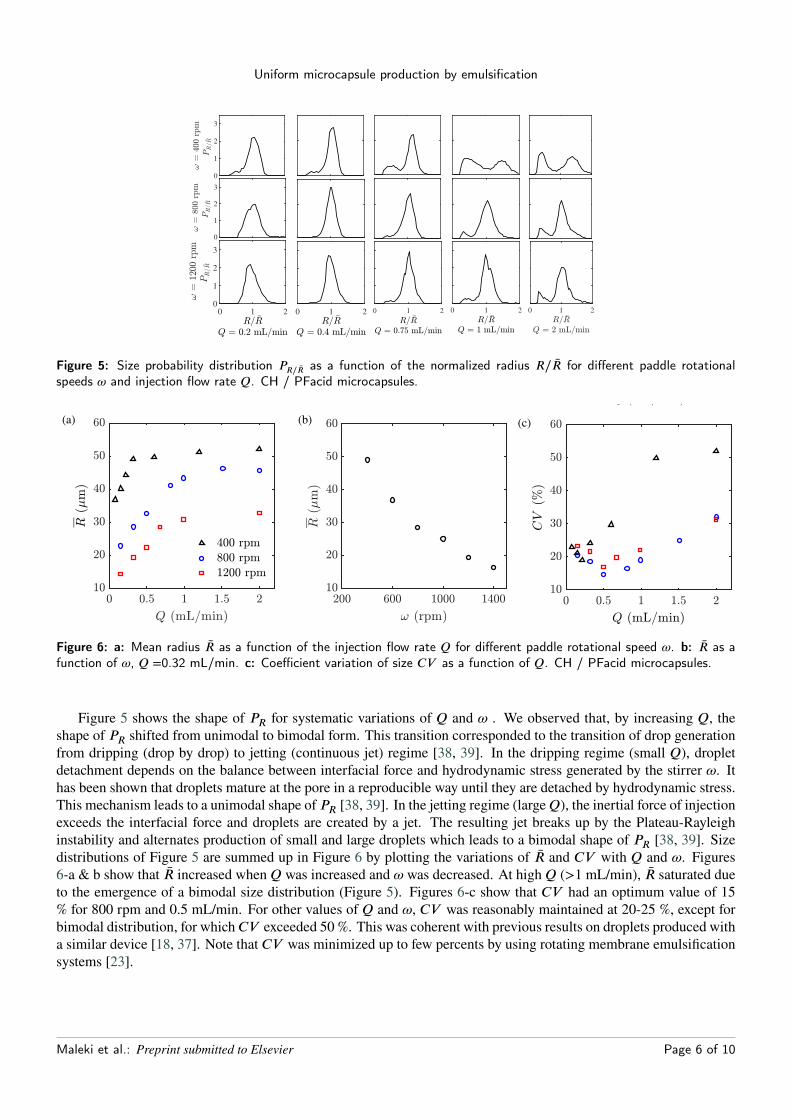
Uniform microcapsule production by emulsification
0
1
2
3
0
1
2
3
0 1 2
0
1
2
3
0 1 2 0 1 2 0 1 2 0 1 2
Figure 5: Size probability distribution PR∕R as a function of the normalized radius R∕R for different paddle rotationalspeeds ! and injection flow rate Q. CH / PFacid microcapsules.
(c)
(a) (b)
(d)
(c)
(a) (b)
(d)
Figure 6: a: Mean radius R as a function of the injection flow rate Q for different paddle rotational speed !. b: R as afunction of !, Q =0.32 mL/min. c: Coefficient variation of size CV as a function of Q. CH / PFacid microcapsules.
Figure 5 shows the shape of PR for systematic variations of Q and ! . We observed that, by increasing Q, theshape of PR shifted from unimodal to bimodal form. This transition corresponded to the transition of drop generationfrom dripping (drop by drop) to jetting (continuous jet) regime [38, 39]. In the dripping regime (small Q), dropletdetachment depends on the balance between interfacial force and hydrodynamic stress generated by the stirrer !. Ithas been shown that droplets mature at the pore in a reproducible way until they are detached by hydrodynamic stress.This mechanism leads to a unimodal shape of PR [38, 39]. In the jetting regime (largeQ), the inertial force of injectionexceeds the interfacial force and droplets are created by a jet. The resulting jet breaks up by the Plateau-Rayleighinstability and alternates production of small and large droplets which leads to a bimodal shape of PR [38, 39]. Sizedistributions of Figure 5 are summed up in Figure 6 by plotting the variations of R and CV with Q and !. Figures6-a & b show that R increased when Q was increased and ! was decreased. At high Q (>1 mL/min), R saturated dueto the emergence of a bimodal size distribution (Figure 5). Figures 6-c show that CV had an optimum value of 15% for 800 rpm and 0.5 mL/min. For other values of Q and !, CV was reasonably maintained at 20-25 %, except forbimodal distribution, for which CV exceeded 50 %. This was coherent with previous results on droplets produced witha similar device [18, 37]. Note that CV was minimized up to few percents by using rotating membrane emulsificationsystems [23].
Maleki et al.: Preprint submitted to Elsevier Page 6 of 10
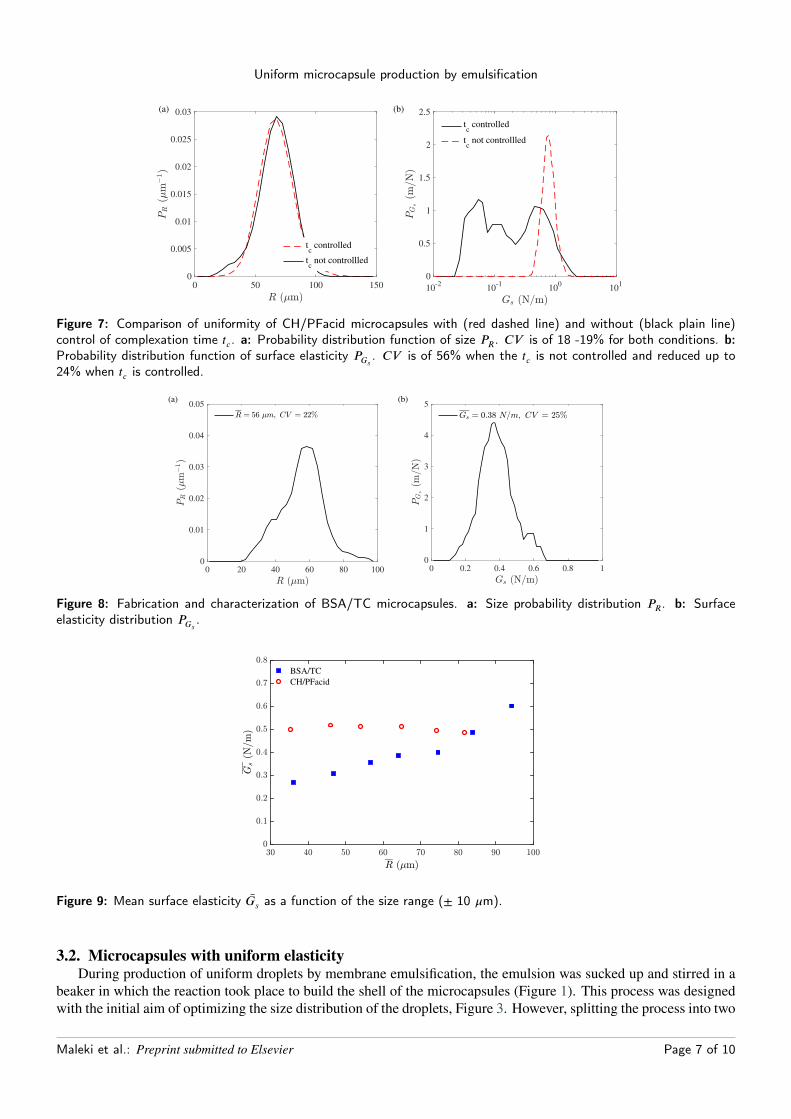
Uniform microcapsule production by emulsification
0 50 100 1500
0.005
0.01
0.015
0.02
0.025
0.03
tc controlled
tc not controllled
10-2
10-1
100
101
0
0.5
1
1.5
2
2.5
tc controlled
tc not controllled
(b)(a)
Figure 7: Comparison of uniformity of CH/PFacid microcapsules with (red dashed line) and without (black plain line)control of complexation time tc . a: Probability distribution function of size PR. CV is of 18 -19% for both conditions. b:Probability distribution function of surface elasticity PGs . CV is of 56% when the tc is not controlled and reduced up to24% when tc is controlled.
0 20 40 60 80 1000
0.01
0.02
0.03
0.04
0.05
0 0.2 0.4 0.6 0.8 10
1
2
3
4
5(a) (b)
Figure 8: Fabrication and characterization of BSA/TC microcapsules. a: Size probability distribution PR. b: Surfaceelasticity distribution PGs .
BSA/TC
CH/PFacid
Figure 9: Mean surface elasticity Gs as a function of the size range (± 10 m).
3.2. Microcapsules with uniform elasticityDuring production of uniform droplets by membrane emulsification, the emulsion was sucked up and stirred in a
beaker in which the reaction took place to build the shell of the microcapsules (Figure 1). This process was designedwith the initial aim of optimizing the size distribution of the droplets, Figure 3. However, splitting the process into two
Maleki et al.: Preprint submitted to Elsevier Page 7 of 10
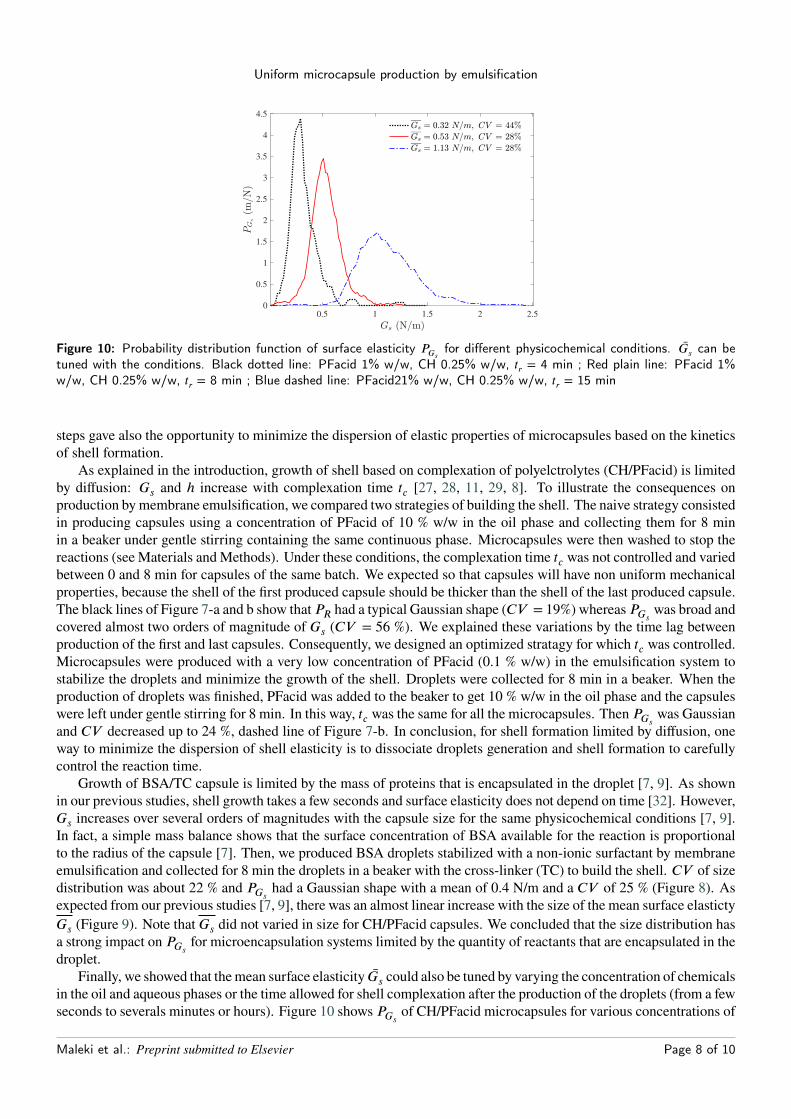
Uniform microcapsule production by emulsification
0.5 1 1.5 2 2.5
0
0.5
1
1.5
2
2.5
3
3.5
4
4.5
Figure 10: Probability distribution function of surface elasticity PGs for different physicochemical conditions. Gs can betuned with the conditions. Black dotted line: PFacid 1% w/w, CH 0.25% w/w, tr = 4 min ; Red plain line: PFacid 1%w/w, CH 0.25% w/w, tr = 8 min ; Blue dashed line: PFacid21% w/w, CH 0.25% w/w, tr = 15 min
steps gave also the opportunity to minimize the dispersion of elastic properties of microcapsules based on the kineticsof shell formation.
As explained in the introduction, growth of shell based on complexation of polyelctrolytes (CH/PFacid) is limitedby diffusion: Gs and ℎ increase with complexation time tc [27, 28, 11, 29, 8]. To illustrate the consequences onproduction bymembrane emulsification, we compared two strategies of building the shell. The naive strategy consistedin producing capsules using a concentration of PFacid of 10 % w/w in the oil phase and collecting them for 8 minin a beaker under gentle stirring containing the same continuous phase. Microcapsules were then washed to stop thereactions (see Materials and Methods). Under these conditions, the complexation time tc was not controlled and variedbetween 0 and 8 min for capsules of the same batch. We expected so that capsules will have non uniform mechanicalproperties, because the shell of the first produced capsule should be thicker than the shell of the last produced capsule.The black lines of Figure 7-a and b show that PR had a typical Gaussian shape (CV = 19%) whereas PGs was broad andcovered almost two orders of magnitude of Gs (CV = 56 %). We explained these variations by the time lag betweenproduction of the first and last capsules. Consequently, we designed an optimized stratagy for which tc was controlled.Microcapsules were produced with a very low concentration of PFacid (0.1 % w/w) in the emulsification system tostabilize the droplets and minimize the growth of the shell. Droplets were collected for 8 min in a beaker. When theproduction of droplets was finished, PFacid was added to the beaker to get 10 % w/w in the oil phase and the capsuleswere left under gentle stirring for 8 min. In this way, tc was the same for all the microcapsules. Then PGs was Gaussianand CV decreased up to 24 %, dashed line of Figure 7-b. In conclusion, for shell formation limited by diffusion, oneway to minimize the dispersion of shell elasticity is to dissociate droplets generation and shell formation to carefullycontrol the reaction time.
Growth of BSA/TC capsule is limited by the mass of proteins that is encapsulated in the droplet [7, 9]. As shownin our previous studies, shell growth takes a few seconds and surface elasticity does not depend on time [32]. However,Gs increases over several orders of magnitudes with the capsule size for the same physicochemical conditions [7, 9].In fact, a simple mass balance shows that the surface concentration of BSA available for the reaction is proportionalto the radius of the capsule [7]. Then, we produced BSA droplets stabilized with a non-ionic surfactant by membraneemulsification and collected for 8 min the droplets in a beaker with the cross-linker (TC) to build the shell. CV of sizedistribution was about 22 % and PGs had a Gaussian shape with a mean of 0.4 N/m and a CV of 25 % (Figure 8). Asexpected from our previous studies [7, 9], there was an almost linear increase with the size of the mean surface elastictyGs (Figure 9). Note that Gs did not varied in size for CH/PFacid capsules. We concluded that the size distribution hasa strong impact on PGs for microencapsulation systems limited by the quantity of reactants that are encapsulated in thedroplet.
Finally, we showed that themean surface elasticity Gs could also be tuned by varying the concentration of chemicalsin the oil and aqueous phases or the time allowed for shell complexation after the production of the droplets (from a fewseconds to severals minutes or hours). Figure 10 shows PGs of CH/PFacid microcapsules for various concentrations of
Maleki et al.: Preprint submitted to Elsevier Page 8 of 10
Uniform microcapsule production by emulsification
PFacid and/or complexation times. Gs and CV ranged from 0.32 to 1.13 N/m and 28 and 44 %, respectively. Details ofthe effects of physicochemical conditions on shell elasticity and thickness were described in our previous publications[7, 8, 9].
4. ConclusionA lab-scale emulsification system with micro-engineered membrane was optimized to produce suspensions of
microcapsules with variations in size and elasticity of 15-20 % in optimal conditions at throughput of a few mL/min.We concluded that the production of the droplets by membrane emulsification and capsule shell formation have tobe split into two steps when shell growth is limited by diffusion (e.g. complexation of polyelectrolytes, CH/PFacid).If shell growth is limited by the quantity of reactants encapsulated in the droplet, variations of elastic properties aredirectly related to size variations (e.g. cross-linking of proteins, BSA/TC). Finally, membrane emulsification is apowerful method which can be easily scaled-up for the high throughput production of microcapsules with uniform andtunable physical properties, irrespective of the kinetics of shell formation.
5. AcknowledgmentsLRP is part of the LabEx Tec21 (ANR-11-LABX-0030) and of the PolyNat Carnot Institute (ANR-11-CARN-007-
01). This work has benefited from financial support from the ANR 2DVISC (ANR-18-CE06-0008).
References[1] S. Anandhakumar, V. Nagaraja, A. M. Raichur, Reversible polyelectrolyte capsules as carriers for protein delivery, Colloids Surf., B 78 (2)
(2010) 266–74. doi:10.1016/j.colsurfb.2010.03.016.[2] D. J. McClements, Nanoscale nutrient delivery systems for food applications: Improving bioactive dispersibility, stability, and bioavailability,
J. Food Sci. 80 (7) (2015) N1602–N1611. doi:10.1111/1750-3841.12919.[3] M. A. Trojer, L. Nordstierna, J. Bergek, H. Blanck, K. Holmberg, M. Nyden, Use of microcapsules as controlled release devices for coatings,
Adv. Colloid Interface Sci. 222 (2015) 18–43.[4] M. P. Neubauer, M. Poehlmann, A. Fery, Microcapsule mechanics: from stability to function, Adv Colloid Interface Sci 207 (2014) 65–80.
doi:10.1016/j.cis.2013.11.016.[5] K. S. Chang, W. L. Olbricht, Experimental studies of the deformation and breakup of a synthetic capsule in steady and unsteady simple shear
flow, J. Fluid Mech. 250 (1993) 609–633. doi:10.1017/s0022112093001582.[6] C. Gao, E. Donath, S. Moya, V. Dudnik, H. Möhwald, Elasticity of hollow polyelectrolyte capsules prepared by the layer-by-layer technique,
Eur. Phys. J. E: Soft Matter Biol. Phys. 5 (1) (2001) 21–27.[7] C. de Loubens, J. Deschamps, M. Georgelin, A. Charrier, F. Edwards-Lévy, M. Leonétti, Mechanical characterization of cross-linked serum
albumin microcapsules, Soft Matter 10 (25) (2014) 4561–4568.[8] K. Xie, C. De Loubens, F. Dubreuil, D. Z. Gunes, M. Jaeger, M. Léonetti, Interfacial rheological properties of self-assembling biopolymer
microcapsules, Soft matter 13 (36) (2017) 6208–6217.[9] J. Gubspun, P.-Y. Gires, C. De Loubens, D. Barthes-Biesel, J. Deschamps, M. Georgelin, M. Leonetti, E. Leclerc, F. Edwards-Levy, A.-V.
Salsac, Characterization of the mechanical properties of cross-linked serum albumin microcapsules: effect of size and protein concentration,Colloid Polym. Sci. 294 (8) (2016) 1381–1389.
[10] J. J. Richardson, J. Cui, M. Björnmalm, J. A. Braunger, H. Ejima, F. Caruso, Innovation in layer-by-layer assembly, Chemical Reviews 116 (23)(2016) 14828–14867.
[11] S. Sivakumar, J. K. Gupta, N. L. Abbott, F. Caruso,Monodisperse emulsions through templating polyelectrolytemultilayer capsules, Chemistryof Materials 20 (6) (2008) 2063–2065.
[12] Y. Hennequin, N. Pannacci, C. P. de Torres, G. Tetradis-Meris, S. Chapuliot, E. Bouchaud, P. Tabeling, Synthesizing microcapsules withcontrolled geometrical and mechanical properties with microfluidic double emulsion technology, Langmuir 25 (14) (2009) 7857–7861.
[13] G. Kaufman, S. Nejati, R. Sarfati, R. Boltyanskiy, M. Loewenberg, E. R. Dufresne, C. O. Osuji, Soft microcapsules with highly plastic shellsformed by interfacial polyelectrolyte-nanoparticle complexation, Soft matter 11 (38) (2015) 7478–7482.
[14] J. D. de Baubigny, C. Trégouët, T. Salez, N. Pantoustier, P. Perrin, M. Reyssat, C. Monteux, One-step fabrication of ph-responsive membranesand microcapsules through interfacial h-bond polymer complexation, Scientific Reports 7 (1) (2017) 1265.
[15] C. Tregouët, T. Salez, C. Monteux, M. Reyssat, Microfluidic probing of the complex interfacial rheology of multilayer capsules, Soft matter15 (13) (2019) 2782–2790.
[16] S. M. Joscelyne, G. Trägårdh, Membrane emulsification—a literature review, Journal of Membrane Science 169 (1) (2000) 107–117.[17] G. Vladisavljević, I. Kobayashi, M. Nakajima, Production of uniform droplets using membrane, microchannel and microfluidic emulsification
devices, Microfluidics and nanofluidics 13 (1) (2012) 151–178.[18] S. R. Kosvintsev, G. Gasparini, R. G. Holdich, I. W. Cumming, M. T. Stillwell, Liquid-liquid membrane dispersion in a stirred cell with and
without controlled shear, Industrial & Engineering Chemistry Research 44 (24) (2005) 9323–9330. arXiv:https://doi.org/10.1021/ie0504699, doi:10.1021/ie0504699.
Maleki et al.: Preprint submitted to Elsevier Page 9 of 10
Uniform microcapsule production by emulsification
[19] N. Christov, D. Ganchev, N. Vassileva, N. Denkov, K. Danov, P. Kralchevsky, Capillary mechanisms in membrane emulsification: oil-in-wateremulsions stabilized by tween 20 and milk proteins, Colloids and Surfaces A: Physicochemical and Engineering Aspects 209 (1) (2002) 83 –104. doi:https://doi.org/10.1016/S0927-7757(02)00167-X.
[20] A. Imbrogno, M. Dragosavac, E. Piacentini, G. Vladisavljević, R. Holdich, L. Giorno, Polycaprolactone multicore-matrix particle for thesimultaneous encapsulation of hydrophilic and hydrophobic compounds produced bymembrane emulsification and solvent diffusion processes,Colloids and Surfaces B: Biointerfaces 135 (2015) 116 – 125. doi:https://doi.org/10.1016/j.colsurfb.2015.06.071.
[21] G. T. Vladisavljević, B. Wang, M. M. Dragosavac, R. G. Holdich, Production of food-grade multiple emulsions with high encapsulation yieldusing oscillating membrane emulsification, Colloids and Surfaces A: Physicochemical and Engineering Aspects 458 (2014) 78 – 84, formulaVII: How Does Your Formulation Work? doi:https://doi.org/10.1016/j.colsurfa.2014.05.011.
[22] M. P. Hanga, R. G. Holdich, Membrane emulsification for the production of uniform poly-n-isopropylacrylamide-coated alginate particlesusing internal gelation, Chemical Engineering Research and Design 92 (9) (2014) 1664 – 1673. doi:https://doi.org/10.1016/j.cherd.2013.12.010.
[23] G. T. Vladisavljević, A. Laouini, C. Charcosset, H. Fessi, H. C. Bandulasena, R. G. Holdich, Production of liposomes using microengineeredmembrane and co-flowmicrofluidic device, Colloids and Surfaces A: Physicochemical and Engineering Aspects 458 (2014) 168 – 177, formulaVII: How Does Your Formulation Work? doi:https://doi.org/10.1016/j.colsurfa.2014.03.016.
[24] A. Fery, R.Weinkamer, Mechanical properties of micro-and nanocapsules: Single-capsule measurements, Polymer 48 (25) (2007) 7221–7235.[25] F. Dubreuil, N. Elsner, A. Fery, Elastic properties of polyelectrolyte capsules studied by atomic-force microscopy and ricm, Eur. Phys. J. E:
Soft Matter Biol. Phys. 12 (2) (2003) 215–221.[26] A. Walter, H. Rehage, H.Leonhard, Shear-induced deformations of polyamide microcapsules, Colloid Polym. Sci. 278 (2000) 169–175.[27] D. Grigoriev, T. Bukreeva, H. Möhwald, D. Shchukin, New method for fabrication of loaded micro-and nanocontainers: emulsion encapsula-
tion by polyelectrolyte layer-by-layer deposition on the liquid core, Langmuir 24 (3) (2008) 999–1004.[28] D. Z. Gunes, M. Pouzot, M. Rouvet, S. Ulrich, R. Mezzenga, Tuneable thickness barriers for composite o/w and w/o capsules, films, and their
decoration with particles, Soft Matter 7 (19) (2011) 9206–9215. doi:10.1039/c1sm05997a.[29] M. Rinaudo, N. Kil’deeva, V. Babak, Surfactant-polyelectrolyte complexes on the basis of chitin, Russian Journal of General Chemistry 78 (11)
(2008) 2239–2246.[30] M. C. Andry, F. Edwards-Levy, M. C. Levy, Free amino group content of serum albumin microcapsules. iii. a study at low ph values, Int. J.
Appl. Pharm. 128 (1996) 197–202.[31] G. Lu, Z. An, C. Tao, J. Li, Microcapsule assembly of human serum albumin at the liquid/liquid interface by the pendent drop technique,
Langmuir 20 (19) (2004) 8401–8403.[32] K. Xie, Instabilities of microcapsules in flow: breakup and wrinkles, Ph.D. thesis, Centrale Marseille (2019).[33] A. Fery, F. Dubreuil, H. Möhwald, Mechanics of artificial microcapsules, New journal of Physics 6 (1) (2004) 18.[34] C. de Loubens, J. Deschamps, G. Boedec, M. Leonetti, Stretching of capsules in an elongation flow, a route to constitutive law, J. Fluid Mech.
767 (2015) R3.[35] F. Edwards-Lévy, M.-C. Andry, M.-C. Lévy, Determination of free amino group content of serum albumin microcapsules using trini-
trobenzenesulfonic acid: effect of variations in polycondensation ph, International Journal of Pharmaceutics 96 (1-3) (1993) 85–90. doi:10.1016/0378-5173(93)90215-2.
[36] D. Barthes-Biesel, H. Sgaier, Role of membrane viscosity in the orientation and deformation of a spherical capsule suspended in shear flow,J. Fluid Mech. 160 (1985) 119–135.
[37] E. Egidi, G. Gasparini, R. G. Holdich, G. T. Vladisavljević, S. R. Kosvintsev, Membrane emulsification using membranes of regular porespacing: Droplet size and uniformity in the presence of surface shear, Journal of Membrane Science 323 (2) (2008) 414–420.
[38] A. Bertrandias, H. Duval, J. Casalinho, M. L. Giorgi, Dripping to jetting transition for cross-flowing liquids, Physics of Fluids 29 (4) (2017)044102. doi:10.1063/1.4979266.
[39] R. F. Meyer, J. C. Crocker, Universal dripping and jetting in a transverse shear flow, Phys. Rev. Lett. 102 (2009) 194501. doi:10.1103/PhysRevLett.102.194501.
Maleki et al.: Preprint submitted to Elsevier Page 10 of 10
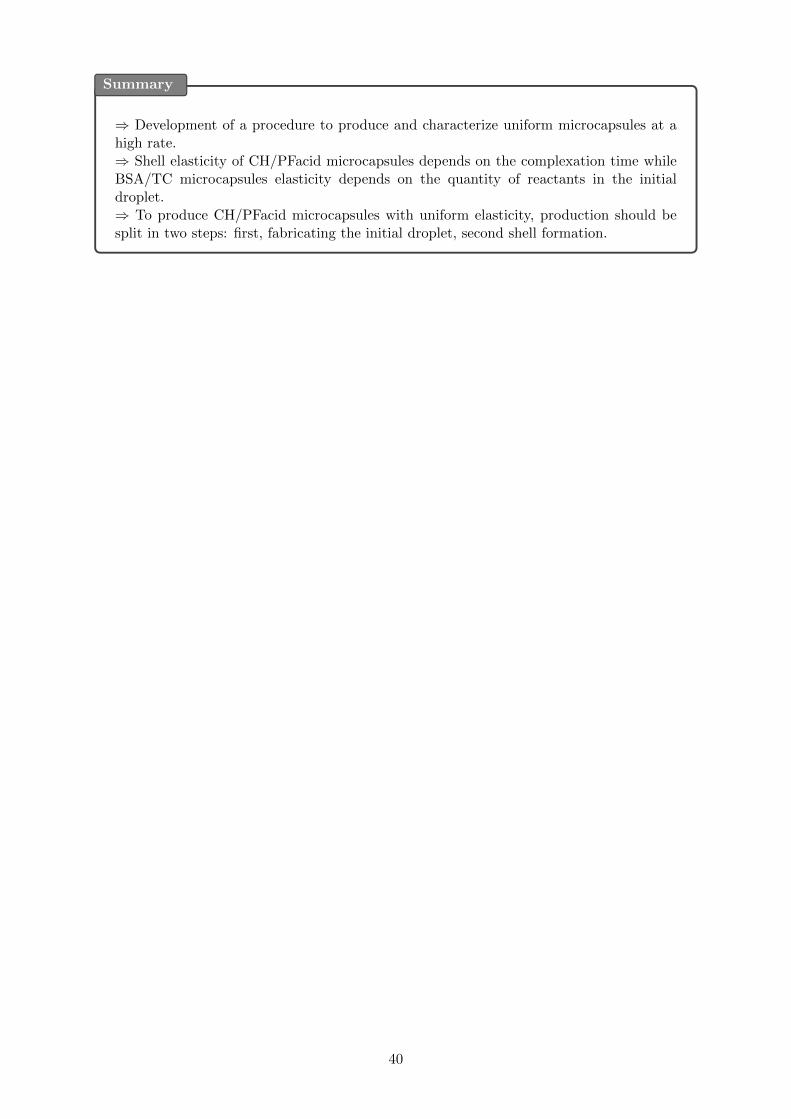
Summary
⇒ Development of a procedure to produce and characterize uniform microcapsules at ahigh rate.⇒ Shell elasticity of CH/PFacid microcapsules depends on the complexation time whileBSA/TC microcapsules elasticity depends on the quantity of reactants in the initialdroplet.⇒ To produce CH/PFacid microcapsules with uniform elasticity, production should besplit in two steps: first, fabricating the initial droplet, second shell formation.
40
Chapter 4
Rheology of attractive suspensions ofmicrocapsules
This chapter is dedicated to the rheological characterization of suspensions of polyelectrolytesmicrocapsules (CH / PF acid) with uniform size and elastic properties, which have been intro-duced in Chapter 3 and for which we have a knowledge of the mechanical properties of theirshell [84]. This chapter is presented as a draft article.
41
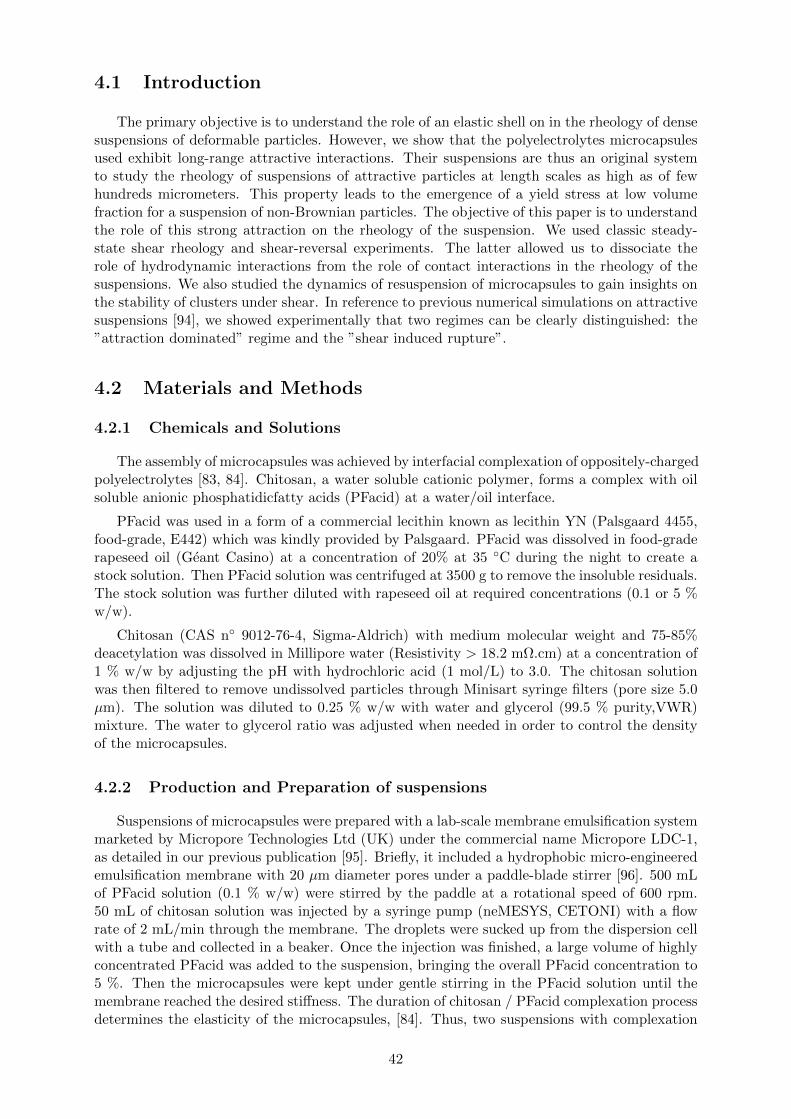
4.1 Introduction
The primary objective is to understand the role of an elastic shell on in the rheology of densesuspensions of deformable particles. However, we show that the polyelectrolytes microcapsulesused exhibit long-range attractive interactions. Their suspensions are thus an original systemto study the rheology of suspensions of attractive particles at length scales as high as of fewhundreds micrometers. This property leads to the emergence of a yield stress at low volumefraction for a suspension of non-Brownian particles. The objective of this paper is to understandthe role of this strong attraction on the rheology of the suspension. We used classic steady-state shear rheology and shear-reversal experiments. The latter allowed us to dissociate therole of hydrodynamic interactions from the role of contact interactions in the rheology of thesuspensions. We also studied the dynamics of resuspension of microcapsules to gain insights onthe stability of clusters under shear. In reference to previous numerical simulations on attractivesuspensions [94], we showed experimentally that two regimes can be clearly distinguished: the”attraction dominated” regime and the ”shear induced rupture”.
4.2 Materials and Methods
4.2.1 Chemicals and Solutions
The assembly of microcapsules was achieved by interfacial complexation of oppositely-chargedpolyelectrolytes [83, 84]. Chitosan, a water soluble cationic polymer, forms a complex with oilsoluble anionic phosphatidicfatty acids (PFacid) at a water/oil interface.
PFacid was used in a form of a commercial lecithin known as lecithin YN (Palsgaard 4455,food-grade, E442) which was kindly provided by Palsgaard. PFacid was dissolved in food-graderapeseed oil (Geant Casino) at a concentration of 20% at 35 C during the night to create astock solution. Then PFacid solution was centrifuged at 3500 g to remove the insoluble residuals.The stock solution was further diluted with rapeseed oil at required concentrations (0.1 or 5 %w/w).
Chitosan (CAS n 9012-76-4, Sigma-Aldrich) with medium molecular weight and 75-85%deacetylation was dissolved in Millipore water (Resistivity > 18.2 mΩ.cm) at a concentration of1 % w/w by adjusting the pH with hydrochloric acid (1 mol/L) to 3.0. The chitosan solutionwas then filtered to remove undissolved particles through Minisart syringe filters (pore size 5.0µm). The solution was diluted to 0.25 % w/w with water and glycerol (99.5 % purity,VWR)mixture. The water to glycerol ratio was adjusted when needed in order to control the densityof the microcapsules.
4.2.2 Production and Preparation of suspensions
Suspensions of microcapsules were prepared with a lab-scale membrane emulsification systemmarketed by Micropore Technologies Ltd (UK) under the commercial name Micropore LDC-1,as detailed in our previous publication [95]. Briefly, it included a hydrophobic micro-engineeredemulsification membrane with 20 µm diameter pores under a paddle-blade stirrer [96]. 500 mLof PFacid solution (0.1 % w/w) were stirred by the paddle at a rotational speed of 600 rpm.50 mL of chitosan solution was injected by a syringe pump (neMESYS, CETONI) with a flowrate of 2 mL/min through the membrane. The droplets were sucked up from the dispersion cellwith a tube and collected in a beaker. Once the injection was finished, a large volume of highlyconcentrated PFacid was added to the suspension, bringing the overall PFacid concentration to5 %. Then the microcapsules were kept under gentle stirring in the PFacid solution until themembrane reached the desired stiffness. The duration of chitosan / PFacid complexation processdetermines the elasticity of the microcapsules, [84]. Thus, two suspensions with complexation
42
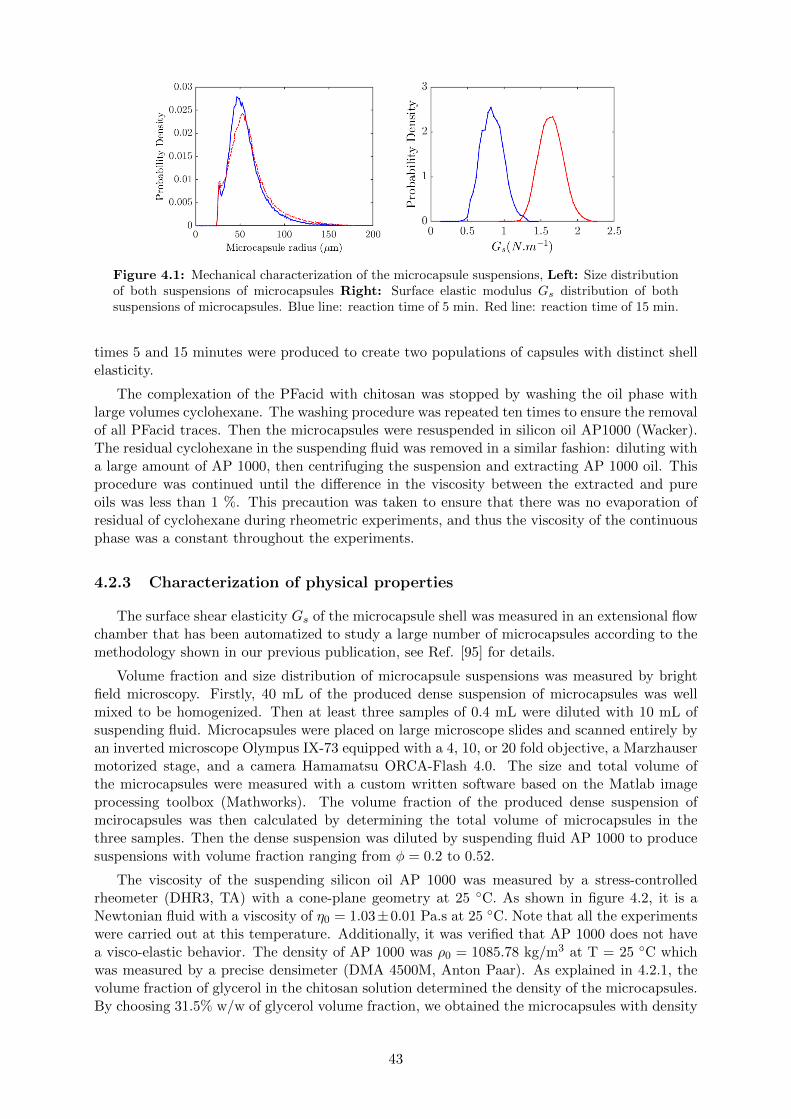
Figure 4.1: Mechanical characterization of the microcapsule suspensions, Left: Size distributionof both suspensions of microcapsules Right: Surface elastic modulus Gs distribution of bothsuspensions of microcapsules. Blue line: reaction time of 5 min. Red line: reaction time of 15 min.
times 5 and 15 minutes were produced to create two populations of capsules with distinct shellelasticity.
The complexation of the PFacid with chitosan was stopped by washing the oil phase withlarge volumes cyclohexane. The washing procedure was repeated ten times to ensure the removalof all PFacid traces. Then the microcapsules were resuspended in silicon oil AP1000 (Wacker).The residual cyclohexane in the suspending fluid was removed in a similar fashion: diluting witha large amount of AP 1000, then centrifuging the suspension and extracting AP 1000 oil. Thisprocedure was continued until the difference in the viscosity between the extracted and pureoils was less than 1 %. This precaution was taken to ensure that there was no evaporation ofresidual of cyclohexane during rheometric experiments, and thus the viscosity of the continuousphase was a constant throughout the experiments.
4.2.3 Characterization of physical properties
The surface shear elasticity Gs of the microcapsule shell was measured in an extensional flowchamber that has been automatized to study a large number of microcapsules according to themethodology shown in our previous publication, see Ref. [95] for details.
Volume fraction and size distribution of microcapsule suspensions was measured by brightfield microscopy. Firstly, 40 mL of the produced dense suspension of microcapsules was wellmixed to be homogenized. Then at least three samples of 0.4 mL were diluted with 10 mL ofsuspending fluid. Microcapsules were placed on large microscope slides and scanned entirely byan inverted microscope Olympus IX-73 equipped with a 4, 10, or 20 fold objective, a Marzhausermotorized stage, and a camera Hamamatsu ORCA-Flash 4.0. The size and total volume ofthe microcapsules were measured with a custom written software based on the Matlab imageprocessing toolbox (Mathworks). The volume fraction of the produced dense suspension ofmcirocapsules was then calculated by determining the total volume of microcapsules in thethree samples. Then the dense suspension was diluted by suspending fluid AP 1000 to producesuspensions with volume fraction ranging from φ = 0.2 to 0.52.
The viscosity of the suspending silicon oil AP 1000 was measured by a stress-controlledrheometer (DHR3, TA) with a cone-plane geometry at 25 C. As shown in figure 4.2, it is aNewtonian fluid with a viscosity of η0 = 1.03±0.01 Pa.s at 25 C. Note that all the experimentswere carried out at this temperature. Additionally, it was verified that AP 1000 does not havea visco-elastic behavior. The density of AP 1000 was ρ0 = 1085.78 kg/m3 at T = 25 C whichwas measured by a precise densimeter (DMA 4500M, Anton Paar). As explained in 4.2.1, thevolume fraction of glycerol in the chitosan solution determined the density of the microcapsules.By choosing 31.5% w/w of glycerol volume fraction, we obtained the microcapsules with density
43
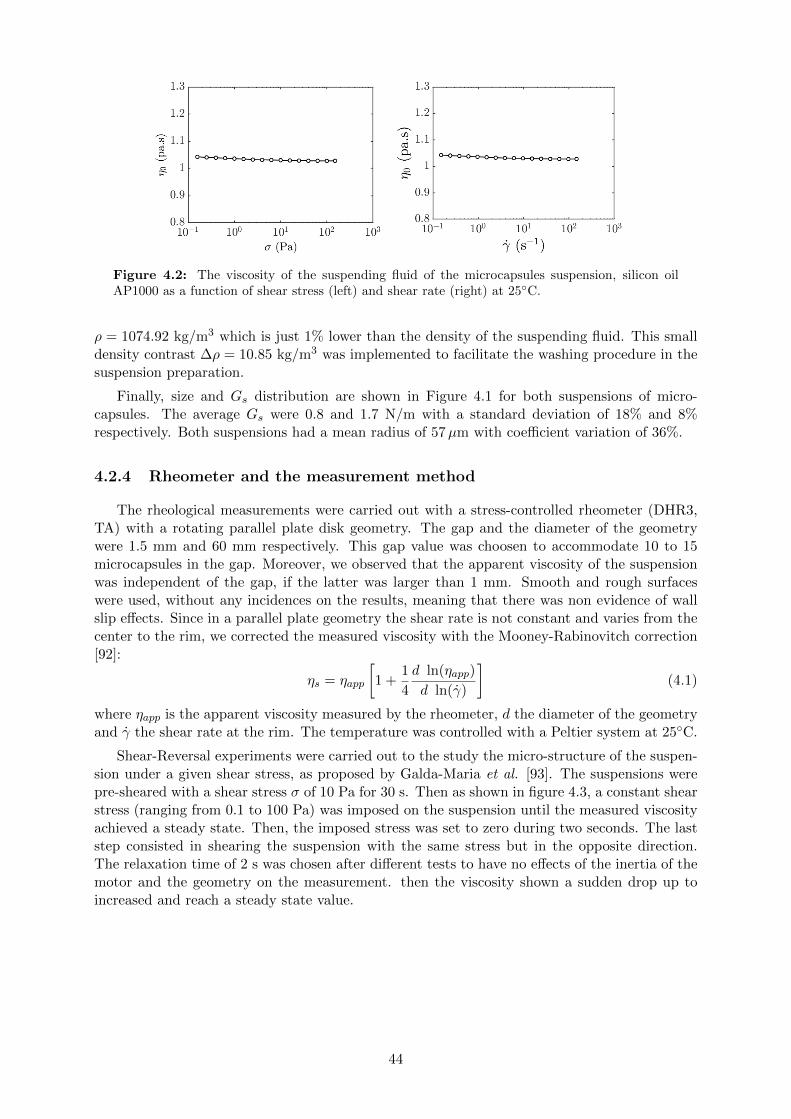
Figure 4.2: The viscosity of the suspending fluid of the microcapsules suspension, silicon oilAP1000 as a function of shear stress (left) and shear rate (right) at 25C.
ρ = 1074.92 kg/m3 which is just 1% lower than the density of the suspending fluid. This smalldensity contrast ∆ρ = 10.85 kg/m3 was implemented to facilitate the washing procedure in thesuspension preparation.
Finally, size and Gs distribution are shown in Figure 4.1 for both suspensions of micro-capsules. The average Gs were 0.8 and 1.7 N/m with a standard deviation of 18% and 8%respectively. Both suspensions had a mean radius of 57µm with coefficient variation of 36%.
4.2.4 Rheometer and the measurement method
The rheological measurements were carried out with a stress-controlled rheometer (DHR3,TA) with a rotating parallel plate disk geometry. The gap and the diameter of the geometrywere 1.5 mm and 60 mm respectively. This gap value was choosen to accommodate 10 to 15microcapsules in the gap. Moreover, we observed that the apparent viscosity of the suspensionwas independent of the gap, if the latter was larger than 1 mm. Smooth and rough surfaceswere used, without any incidences on the results, meaning that there was non evidence of wallslip effects. Since in a parallel plate geometry the shear rate is not constant and varies from thecenter to the rim, we corrected the measured viscosity with the Mooney-Rabinovitch correction[92]:
ηs = ηapp
[1 +
1
4
d ln(ηapp)
d ln(γ)
](4.1)
where ηapp is the apparent viscosity measured by the rheometer, d the diameter of the geometryand γ the shear rate at the rim. The temperature was controlled with a Peltier system at 25C.
Shear-Reversal experiments were carried out to the study the micro-structure of the suspen-sion under a given shear stress, as proposed by Galda-Maria et al. [93]. The suspensions werepre-sheared with a shear stress σ of 10 Pa for 30 s. Then as shown in figure 4.3, a constant shearstress (ranging from 0.1 to 100 Pa) was imposed on the suspension until the measured viscosityachieved a steady state. Then, the imposed stress was set to zero during two seconds. The laststep consisted in shearing the suspension with the same stress but in the opposite direction.The relaxation time of 2 s was chosen after different tests to have no effects of the inertia of themotor and the geometry on the measurement. then the viscosity shown a sudden drop up toincreased and reach a steady state value.
44
Figure 4.3: An example of Shear-Reversal experiment for a suspension of particle executed by astress-controlled rheometer in a parallel plate geometry. Top: Shear stress as a function of time.Bottom: Apparent viscosity as a function of time.
4.3 Results
4.3.1 Steady State Rheology
Flow curve
The steady state viscosity ηs was measured for two homogeneous suspensions of microcapsulewith the average surface elastic shear moduli of Gs = 0.8 and 1.7 N/m, figure 4.1. ηs wasmeasured by applying a shear stress ranging from σ = 10−2 to 102 Pa. The average size ofmicrocapsules for both suspensions was the same R = 57 µm for a gap between the two platesof 1.5 mm. The volume fraction of suspensions ranged from φ = 20% to 52%. Figure 4.4illustrates the flow curves of the suspensions as a function of shear stress. Above a volumefraction φ of 25%, both suspensions of microcapsules behaved like a yield stress fluid, i.e. theviscosity diverges when σ tends to a threshold. It means that the suspension did not flow undera shear stress lower than a threshold values, called the yield stress σy. Both suspensions wereNewtonian with a viscosity of 1.7 Pa.s for φ = 20%. Figure 4.5 shows that the data were wellfitted by the Herschel-Bulkley model, σ = σy +Kγn where K is the consistency factor and theexponent n reflects the degree to which the fluid is shear-thinning (n < 1) or shear-thickening(n > 1).
Figures 4.6 shows that n decreased from 0.97 to 0.77 when the volume fraction φ increasedfrom 0.2 to 0.52. The yield stress σy increased from 0.02 to 2 Pa when φ increased from 0.25 to0.52. However, the elasticity of the microcapsules in the range of Gs = 0.8 and 1.7 N/m did nothave a significant influence on n. Moreover, the yield stress for both suspensions were the samefor φ lower than 0.35. Above φ = 0.35, σy increased of a factor 1.5 when Gs was dived by 2.
45
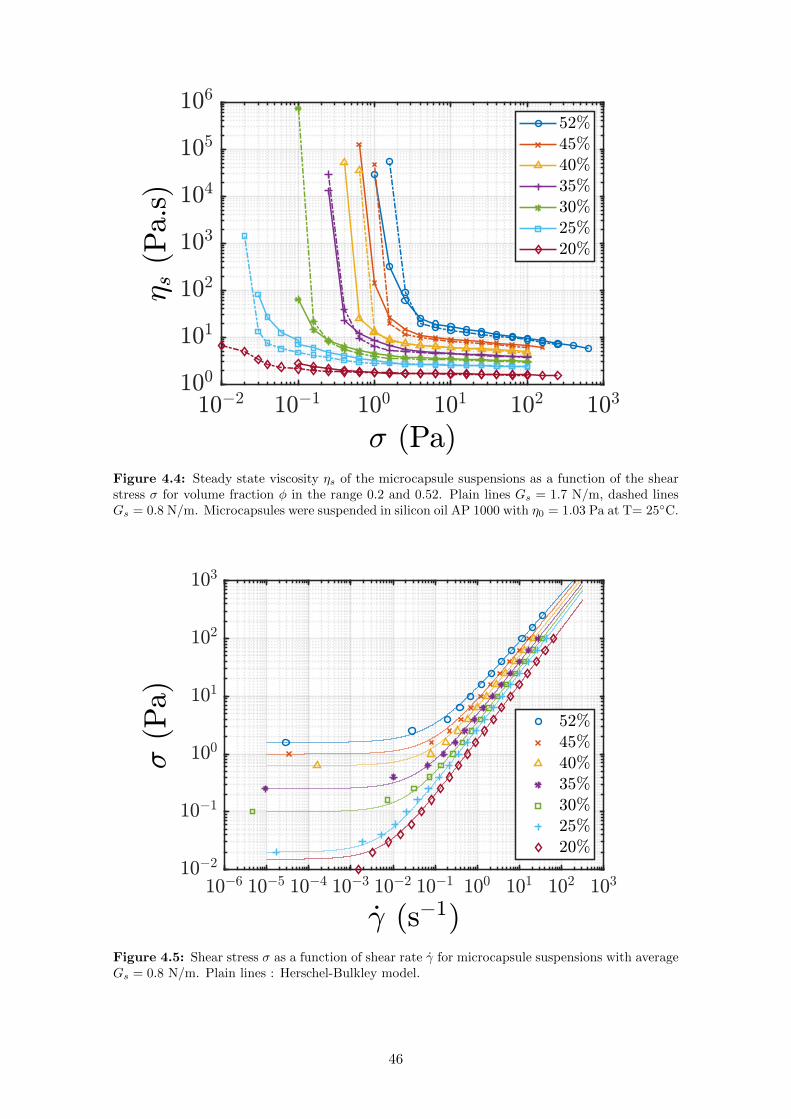
Figure 4.4: Steady state viscosity ηs of the microcapsule suspensions as a function of the shearstress σ for volume fraction φ in the range 0.2 and 0.52. Plain lines Gs = 1.7 N/m, dashed linesGs = 0.8 N/m. Microcapsules were suspended in silicon oil AP 1000 with η0 = 1.03 Pa at T= 25C.
Figure 4.5: Shear stress σ as a function of shear rate γ for microcapsule suspensions with averageGs = 0.8 N/m. Plain lines : Herschel-Bulkley model.
46
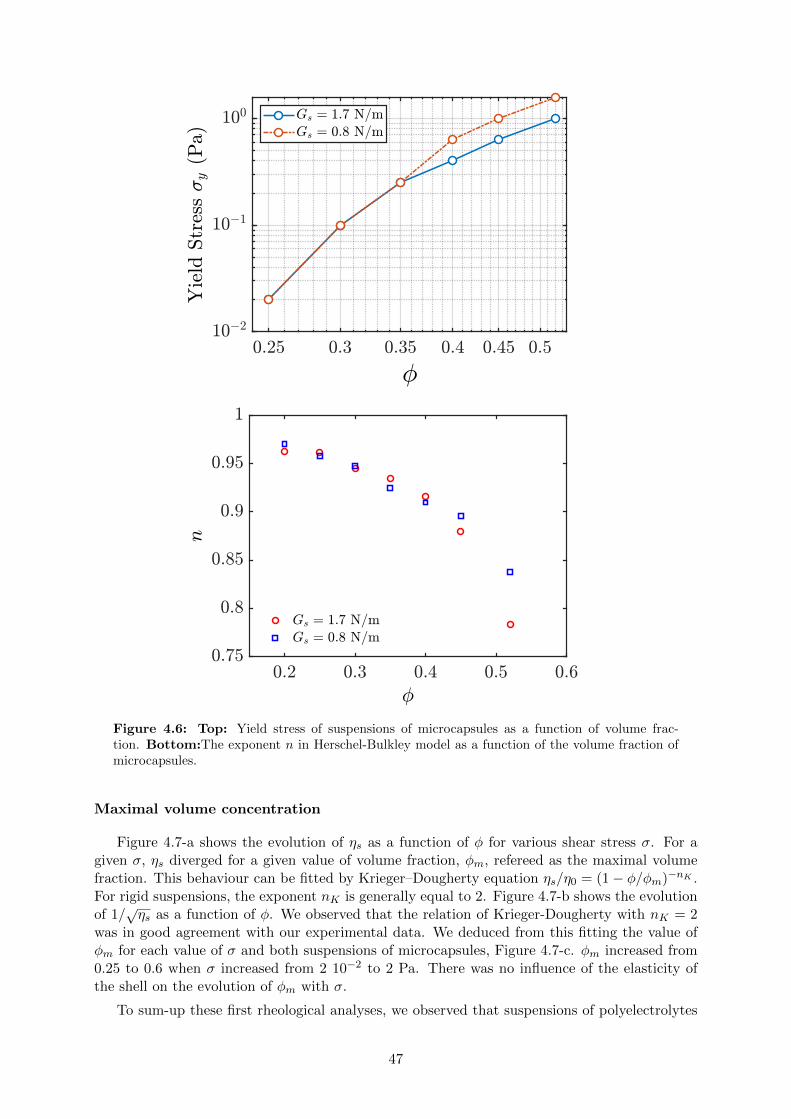
Figure 4.6: Top: Yield stress of suspensions of microcapsules as a function of volume frac-tion. Bottom:The exponent n in Herschel-Bulkley model as a function of the volume fraction ofmicrocapsules.
Maximal volume concentration
Figure 4.7-a shows the evolution of ηs as a function of φ for various shear stress σ. For agiven σ, ηs diverged for a given value of volume fraction, φm, refereed as the maximal volumefraction. This behaviour can be fitted by Krieger–Dougherty equation ηs/η0 = (1− φ/φm)−nK .For rigid suspensions, the exponent nK is generally equal to 2. Figure 4.7-b shows the evolutionof 1/
√ηs as a function of φ. We observed that the relation of Krieger-Dougherty with nK = 2
was in good agreement with our experimental data. We deduced from this fitting the value ofφm for each value of σ and both suspensions of microcapsules, Figure 4.7-c. φm increased from0.25 to 0.6 when σ increased from 2 10−2 to 2 Pa. There was no influence of the elasticity ofthe shell on the evolution of φm with σ.
To sum-up these first rheological analyses, we observed that suspensions of polyelectrolytes
47
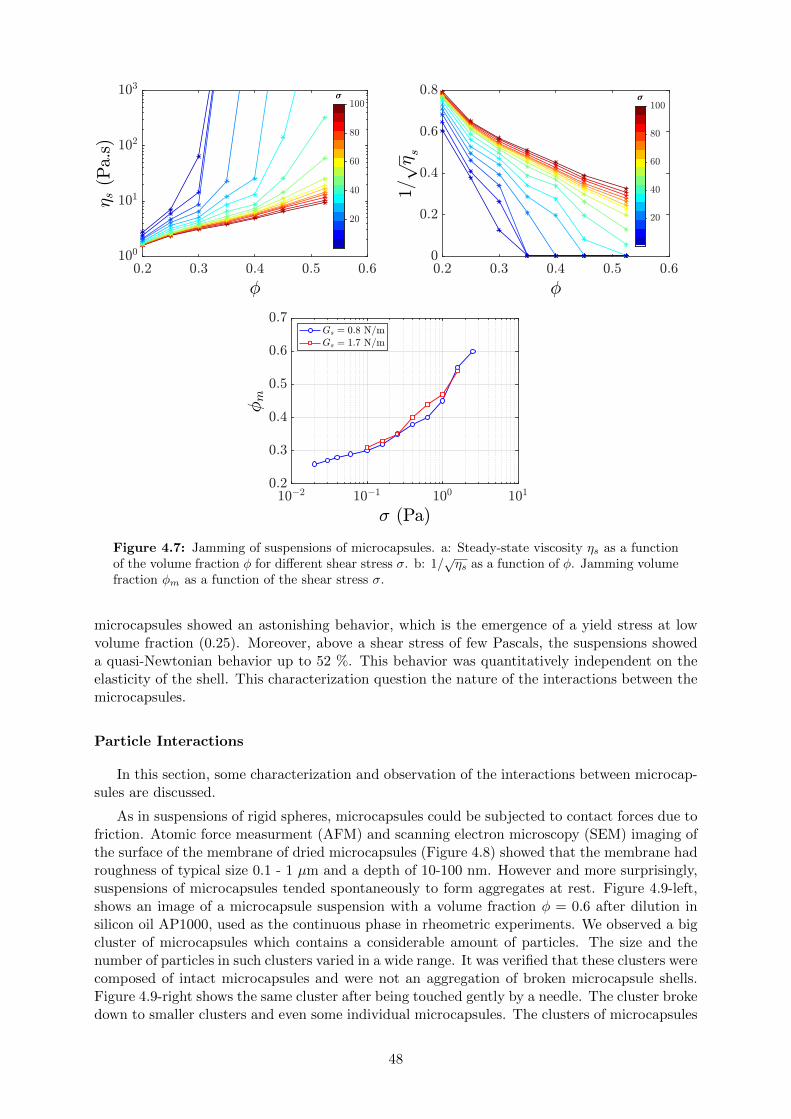
Figure 4.7: Jamming of suspensions of microcapsules. a: Steady-state viscosity ηs as a functionof the volume fraction φ for different shear stress σ. b: 1/
√ηs as a function of φ. Jamming volume
fraction φm as a function of the shear stress σ.
microcapsules showed an astonishing behavior, which is the emergence of a yield stress at lowvolume fraction (0.25). Moreover, above a shear stress of few Pascals, the suspensions showeda quasi-Newtonian behavior up to 52 %. This behavior was quantitatively independent on theelasticity of the shell. This characterization question the nature of the interactions between themicrocapsules.
Particle Interactions
In this section, some characterization and observation of the interactions between microcap-sules are discussed.
As in suspensions of rigid spheres, microcapsules could be subjected to contact forces due tofriction. Atomic force measurment (AFM) and scanning electron microscopy (SEM) imaging ofthe surface of the membrane of dried microcapsules (Figure 4.8) showed that the membrane hadroughness of typical size 0.1 - 1 µm and a depth of 10-100 nm. However and more surprisingly,suspensions of microcapsules tended spontaneously to form aggregates at rest. Figure 4.9-left,shows an image of a microcapsule suspension with a volume fraction φ = 0.6 after dilution insilicon oil AP1000, used as the continuous phase in rheometric experiments. We observed a bigcluster of microcapsules which contains a considerable amount of particles. The size and thenumber of particles in such clusters varied in a wide range. It was verified that these clusters werecomposed of intact microcapsules and were not an aggregation of broken microcapsule shells.Figure 4.9-right shows the same cluster after being touched gently by a needle. The cluster brokedown to smaller clusters and even some individual microcapsules. The clusters of microcapsules
48
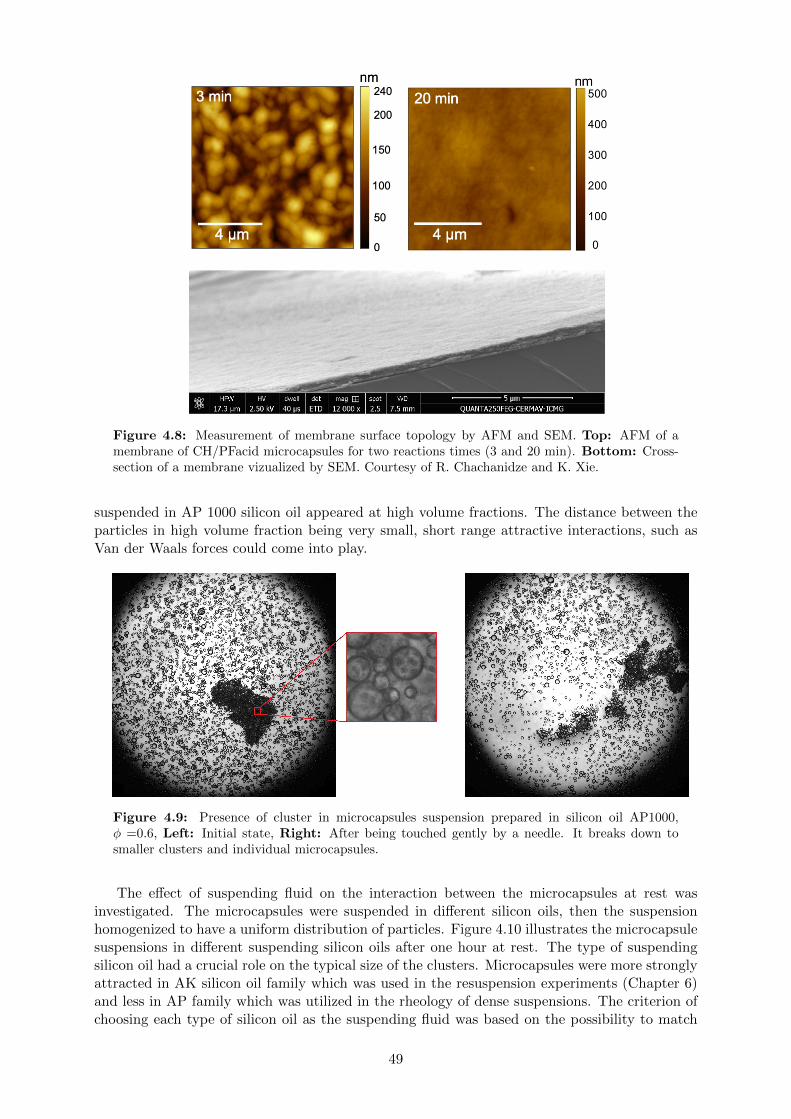
Figure 4.8: Measurement of membrane surface topology by AFM and SEM. Top: AFM of amembrane of CH/PFacid microcapsules for two reactions times (3 and 20 min). Bottom: Cross-section of a membrane vizualized by SEM. Courtesy of R. Chachanidze and K. Xie.
suspended in AP 1000 silicon oil appeared at high volume fractions. The distance between theparticles in high volume fraction being very small, short range attractive interactions, such asVan der Waals forces could come into play.
Figure 4.9: Presence of cluster in microcapsules suspension prepared in silicon oil AP1000,φ =0.6, Left: Initial state, Right: After being touched gently by a needle. It breaks down tosmaller clusters and individual microcapsules.
The effect of suspending fluid on the interaction between the microcapsules at rest wasinvestigated. The microcapsules were suspended in different silicon oils, then the suspensionhomogenized to have a uniform distribution of particles. Figure 4.10 illustrates the microcapsulesuspensions in different suspending silicon oils after one hour at rest. The type of suspendingsilicon oil had a crucial role on the typical size of the clusters. Microcapsules were more stronglyattracted in AK silicon oil family which was used in the resuspension experiments (Chapter 6)and less in AP family which was utilized in the rheology of dense suspensions. The criterion ofchoosing each type of silicon oil as the suspending fluid was based on the possibility to match
49
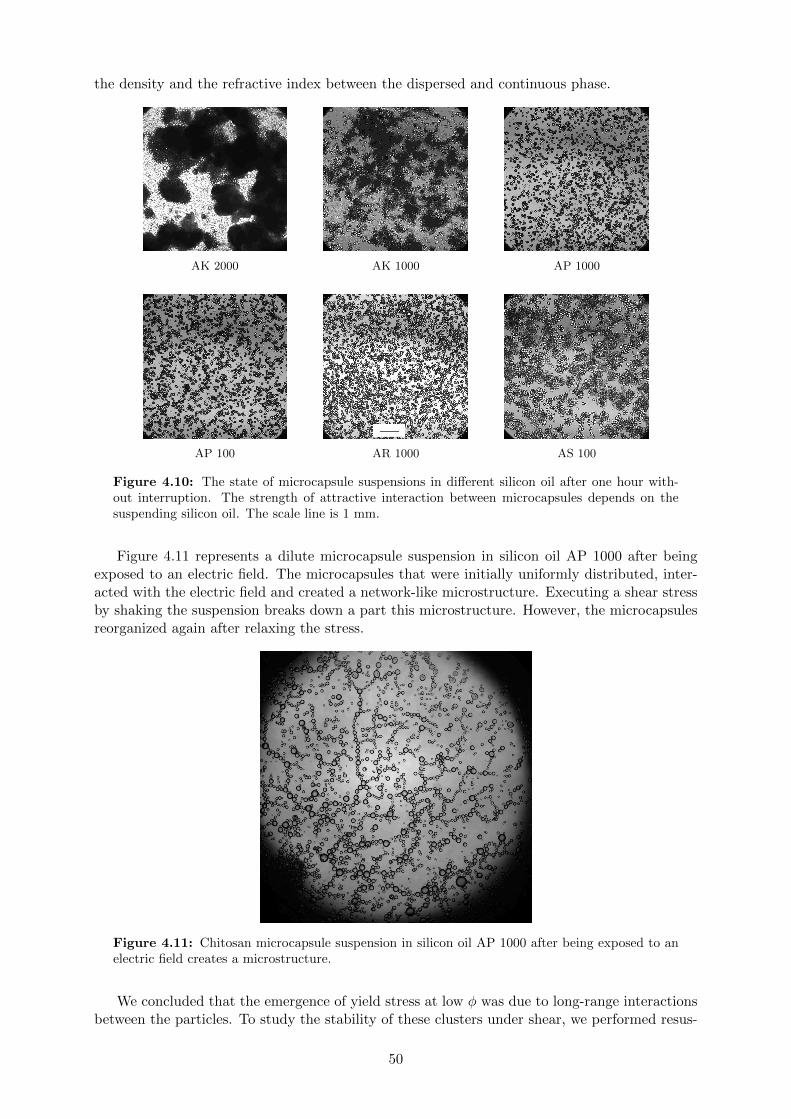
the density and the refractive index between the dispersed and continuous phase.
AK 2000 AK 1000 AP 1000
AP 100 AR 1000 AS 100
Figure 4.10: The state of microcapsule suspensions in different silicon oil after one hour with-out interruption. The strength of attractive interaction between microcapsules depends on thesuspending silicon oil. The scale line is 1 mm.
Figure 4.11 represents a dilute microcapsule suspension in silicon oil AP 1000 after beingexposed to an electric field. The microcapsules that were initially uniformly distributed, inter-acted with the electric field and created a network-like microstructure. Executing a shear stressby shaking the suspension breaks down a part this microstructure. However, the microcapsulesreorganized again after relaxing the stress.
Figure 4.11: Chitosan microcapsule suspension in silicon oil AP 1000 after being exposed to anelectric field creates a microstructure.
We concluded that the emergence of yield stress at low φ was due to long-range interactionsbetween the particles. To study the stability of these clusters under shear, we performed resus-
50
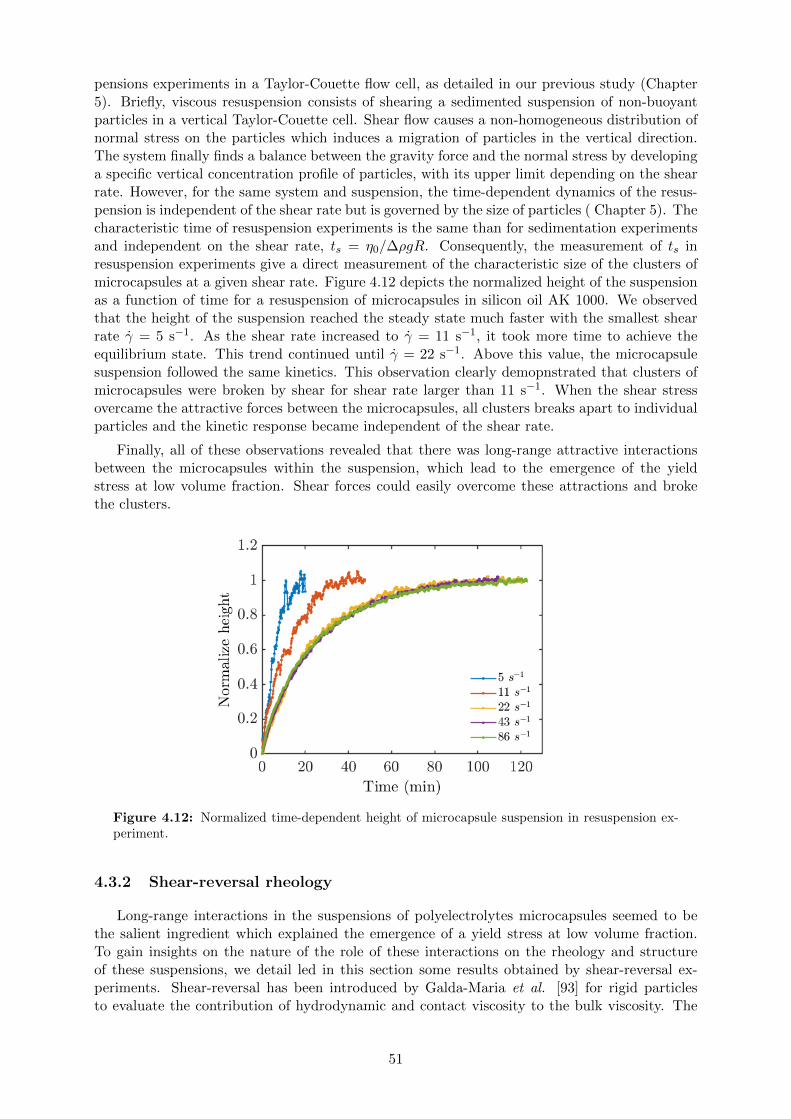
pensions experiments in a Taylor-Couette flow cell, as detailed in our previous study (Chapter5). Briefly, viscous resuspension consists of shearing a sedimented suspension of non-buoyantparticles in a vertical Taylor-Couette cell. Shear flow causes a non-homogeneous distribution ofnormal stress on the particles which induces a migration of particles in the vertical direction.The system finally finds a balance between the gravity force and the normal stress by developinga specific vertical concentration profile of particles, with its upper limit depending on the shearrate. However, for the same system and suspension, the time-dependent dynamics of the resus-pension is independent of the shear rate but is governed by the size of particles ( Chapter 5). Thecharacteristic time of resuspension experiments is the same than for sedimentation experimentsand independent on the shear rate, ts = η0/∆ρgR. Consequently, the measurement of ts inresuspension experiments give a direct measurement of the characteristic size of the clusters ofmicrocapsules at a given shear rate. Figure 4.12 depicts the normalized height of the suspensionas a function of time for a resuspension of microcapsules in silicon oil AK 1000. We observedthat the height of the suspension reached the steady state much faster with the smallest shearrate γ = 5 s−1. As the shear rate increased to γ = 11 s−1, it took more time to achieve theequilibrium state. This trend continued until γ = 22 s−1. Above this value, the microcapsulesuspension followed the same kinetics. This observation clearly demopnstrated that clusters ofmicrocapsules were broken by shear for shear rate larger than 11 s−1. When the shear stressovercame the attractive forces between the microcapsules, all clusters breaks apart to individualparticles and the kinetic response became independent of the shear rate.
Finally, all of these observations revealed that there was long-range attractive interactionsbetween the microcapsules within the suspension, which lead to the emergence of the yieldstress at low volume fraction. Shear forces could easily overcome these attractions and brokethe clusters.
Figure 4.12: Normalized time-dependent height of microcapsule suspension in resuspension ex-periment.
4.3.2 Shear-reversal rheology
Long-range interactions in the suspensions of polyelectrolytes microcapsules seemed to bethe salient ingredient which explained the emergence of a yield stress at low volume fraction.To gain insights on the nature of the role of these interactions on the rheology and structureof these suspensions, we detail led in this section some results obtained by shear-reversal ex-periments. Shear-reversal has been introduced by Galda-Maria et al. [93] for rigid particlesto evaluate the contribution of hydrodynamic and contact viscosity to the bulk viscosity. The
51
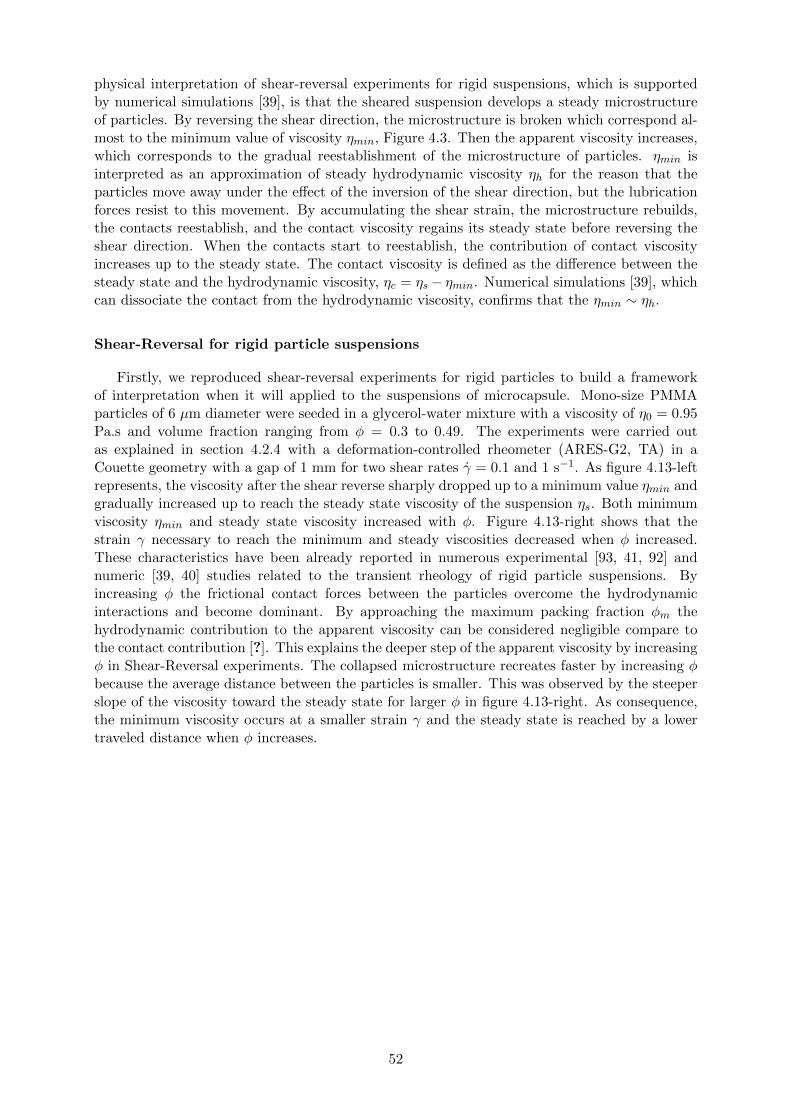
physical interpretation of shear-reversal experiments for rigid suspensions, which is supportedby numerical simulations [39], is that the sheared suspension develops a steady microstructureof particles. By reversing the shear direction, the microstructure is broken which correspond al-most to the minimum value of viscosity ηmin, Figure 4.3. Then the apparent viscosity increases,which corresponds to the gradual reestablishment of the microstructure of particles. ηmin isinterpreted as an approximation of steady hydrodynamic viscosity ηh for the reason that theparticles move away under the effect of the inversion of the shear direction, but the lubricationforces resist to this movement. By accumulating the shear strain, the microstructure rebuilds,the contacts reestablish, and the contact viscosity regains its steady state before reversing theshear direction. When the contacts start to reestablish, the contribution of contact viscosityincreases up to the steady state. The contact viscosity is defined as the difference between thesteady state and the hydrodynamic viscosity, ηc = ηs− ηmin. Numerical simulations [39], whichcan dissociate the contact from the hydrodynamic viscosity, confirms that the ηmin ∼ ηh.
Shear-Reversal for rigid particle suspensions
Firstly, we reproduced shear-reversal experiments for rigid particles to build a frameworkof interpretation when it will applied to the suspensions of microcapsule. Mono-size PMMAparticles of 6 µm diameter were seeded in a glycerol-water mixture with a viscosity of η0 = 0.95Pa.s and volume fraction ranging from φ = 0.3 to 0.49. The experiments were carried outas explained in section 4.2.4 with a deformation-controlled rheometer (ARES-G2, TA) in aCouette geometry with a gap of 1 mm for two shear rates γ = 0.1 and 1 s−1. As figure 4.13-leftrepresents, the viscosity after the shear reverse sharply dropped up to a minimum value ηmin andgradually increased up to reach the steady state viscosity of the suspension ηs. Both minimumviscosity ηmin and steady state viscosity increased with φ. Figure 4.13-right shows that thestrain γ necessary to reach the minimum and steady viscosities decreased when φ increased.These characteristics have been already reported in numerous experimental [93, 41, 92] andnumeric [39, 40] studies related to the transient rheology of rigid particle suspensions. Byincreasing φ the frictional contact forces between the particles overcome the hydrodynamicinteractions and become dominant. By approaching the maximum packing fraction φm thehydrodynamic contribution to the apparent viscosity can be considered negligible compare tothe contact contribution [?]. This explains the deeper step of the apparent viscosity by increasingφ in Shear-Reversal experiments. The collapsed microstructure recreates faster by increasing φbecause the average distance between the particles is smaller. This was observed by the steeperslope of the viscosity toward the steady state for larger φ in figure 4.13-right. As consequence,the minimum viscosity occurs at a smaller strain γ and the steady state is reached by a lowertraveled distance when φ increases.
52
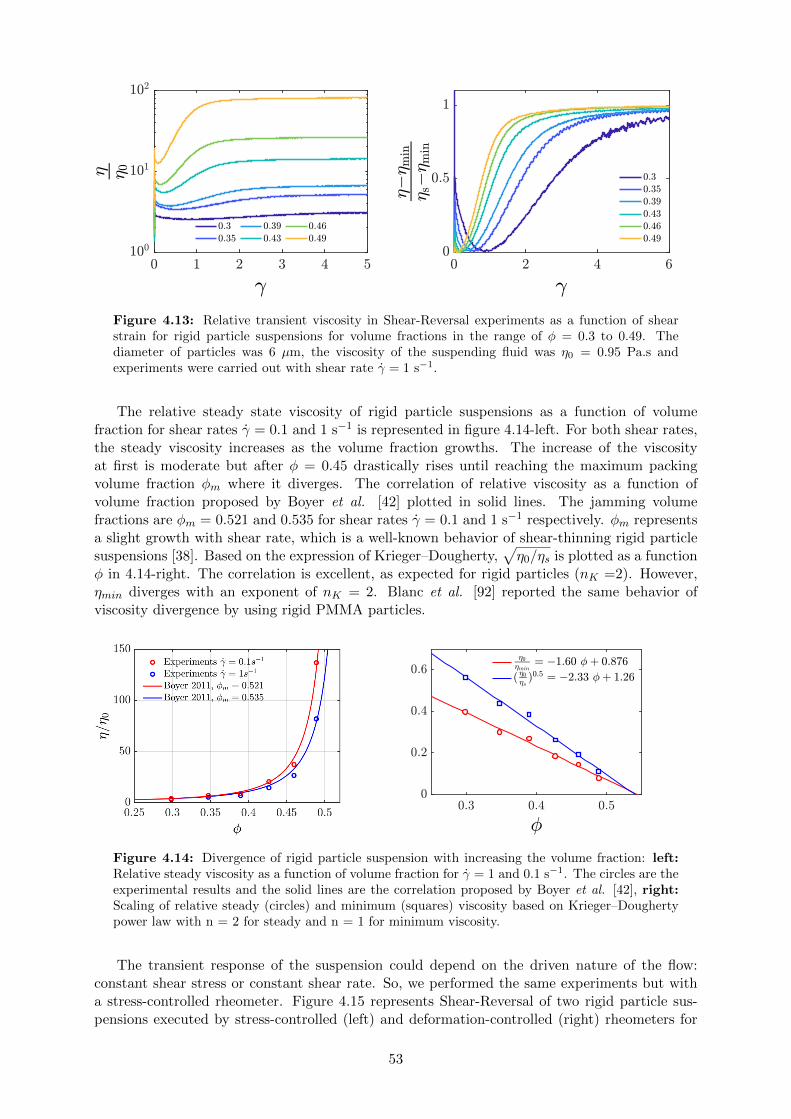
Figure 4.13: Relative transient viscosity in Shear-Reversal experiments as a function of shearstrain for rigid particle suspensions for volume fractions in the range of φ = 0.3 to 0.49. Thediameter of particles was 6 µm, the viscosity of the suspending fluid was η0 = 0.95 Pa.s andexperiments were carried out with shear rate γ = 1 s−1.
The relative steady state viscosity of rigid particle suspensions as a function of volumefraction for shear rates γ = 0.1 and 1 s−1 is represented in figure 4.14-left. For both shear rates,the steady viscosity increases as the volume fraction growths. The increase of the viscosityat first is moderate but after φ = 0.45 drastically rises until reaching the maximum packingvolume fraction φm where it diverges. The correlation of relative viscosity as a function ofvolume fraction proposed by Boyer et al. [42] plotted in solid lines. The jamming volumefractions are φm = 0.521 and 0.535 for shear rates γ = 0.1 and 1 s−1 respectively. φm representsa slight growth with shear rate, which is a well-known behavior of shear-thinning rigid particlesuspensions [38]. Based on the expression of Krieger–Dougherty,
√η0/ηs is plotted as a function
φ in 4.14-right. The correlation is excellent, as expected for rigid particles (nK =2). However,ηmin diverges with an exponent of nK = 2. Blanc et al. [92] reported the same behavior ofviscosity divergence by using rigid PMMA particles.
Figure 4.14: Divergence of rigid particle suspension with increasing the volume fraction: left:Relative steady viscosity as a function of volume fraction for γ = 1 and 0.1 s−1. The circles are theexperimental results and the solid lines are the correlation proposed by Boyer et al. [42], right:Scaling of relative steady (circles) and minimum (squares) viscosity based on Krieger–Doughertypower law with n = 2 for steady and n = 1 for minimum viscosity.
The transient response of the suspension could depend on the driven nature of the flow:constant shear stress or constant shear rate. So, we performed the same experiments but witha stress-controlled rheometer. Figure 4.15 represents Shear-Reversal of two rigid particle sus-pensions executed by stress-controlled (left) and deformation-controlled (right) rheometers for
53
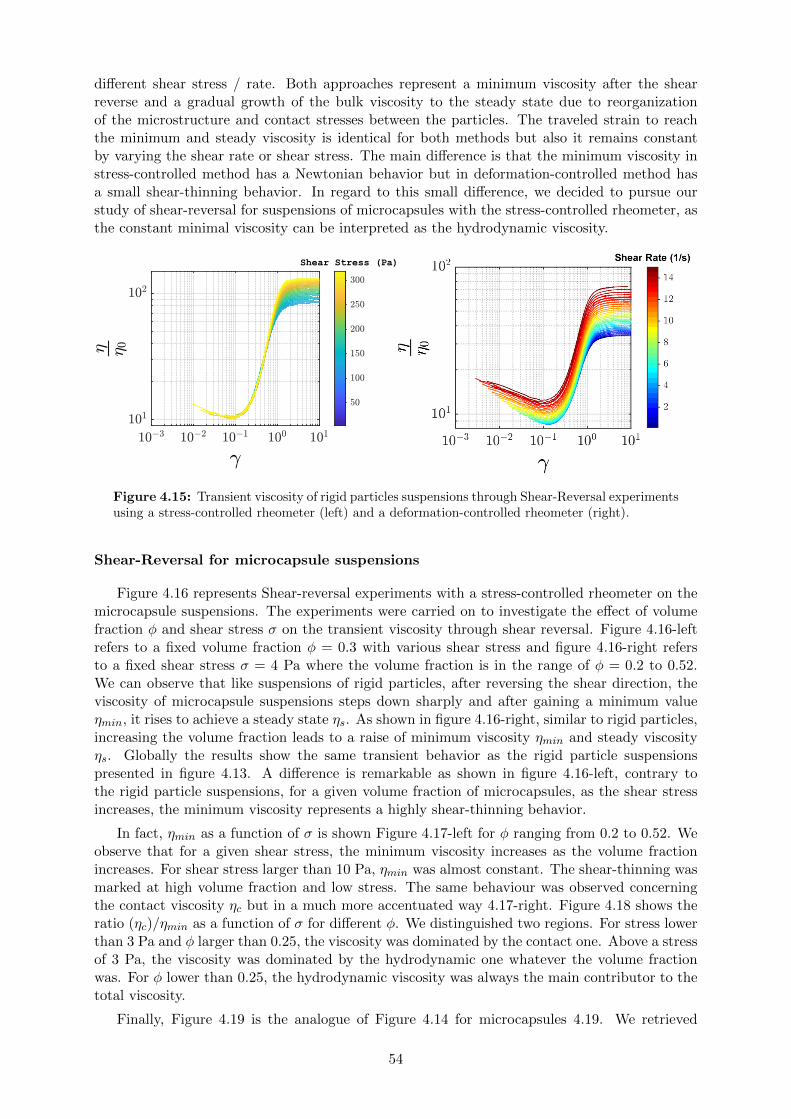
different shear stress / rate. Both approaches represent a minimum viscosity after the shearreverse and a gradual growth of the bulk viscosity to the steady state due to reorganizationof the microstructure and contact stresses between the particles. The traveled strain to reachthe minimum and steady viscosity is identical for both methods but also it remains constantby varying the shear rate or shear stress. The main difference is that the minimum viscosity instress-controlled method has a Newtonian behavior but in deformation-controlled method hasa small shear-thinning behavior. In regard to this small difference, we decided to pursue ourstudy of shear-reversal for suspensions of microcapsules with the stress-controlled rheometer, asthe constant minimal viscosity can be interpreted as the hydrodynamic viscosity.
Figure 4.15: Transient viscosity of rigid particles suspensions through Shear-Reversal experimentsusing a stress-controlled rheometer (left) and a deformation-controlled rheometer (right).
Shear-Reversal for microcapsule suspensions
Figure 4.16 represents Shear-reversal experiments with a stress-controlled rheometer on themicrocapsule suspensions. The experiments were carried on to investigate the effect of volumefraction φ and shear stress σ on the transient viscosity through shear reversal. Figure 4.16-leftrefers to a fixed volume fraction φ = 0.3 with various shear stress and figure 4.16-right refersto a fixed shear stress σ = 4 Pa where the volume fraction is in the range of φ = 0.2 to 0.52.We can observe that like suspensions of rigid particles, after reversing the shear direction, theviscosity of microcapsule suspensions steps down sharply and after gaining a minimum valueηmin, it rises to achieve a steady state ηs. As shown in figure 4.16-right, similar to rigid particles,increasing the volume fraction leads to a raise of minimum viscosity ηmin and steady viscosityηs. Globally the results show the same transient behavior as the rigid particle suspensionspresented in figure 4.13. A difference is remarkable as shown in figure 4.16-left, contrary tothe rigid particle suspensions, for a given volume fraction of microcapsules, as the shear stressincreases, the minimum viscosity represents a highly shear-thinning behavior.
In fact, ηmin as a function of σ is shown Figure 4.17-left for φ ranging from 0.2 to 0.52. Weobserve that for a given shear stress, the minimum viscosity increases as the volume fractionincreases. For shear stress larger than 10 Pa, ηmin was almost constant. The shear-thinning wasmarked at high volume fraction and low stress. The same behaviour was observed concerningthe contact viscosity ηc but in a much more accentuated way 4.17-right. Figure 4.18 shows theratio (ηc)/ηmin as a function of σ for different φ. We distinguished two regions. For stress lowerthan 3 Pa and φ larger than 0.25, the viscosity was dominated by the contact one. Above a stressof 3 Pa, the viscosity was dominated by the hydrodynamic one whatever the volume fractionwas. For φ lower than 0.25, the hydrodynamic viscosity was always the main contributor to thetotal viscosity.
Finally, Figure 4.19 is the analogue of Figure 4.14 for microcapsules 4.19. We retrieved
54
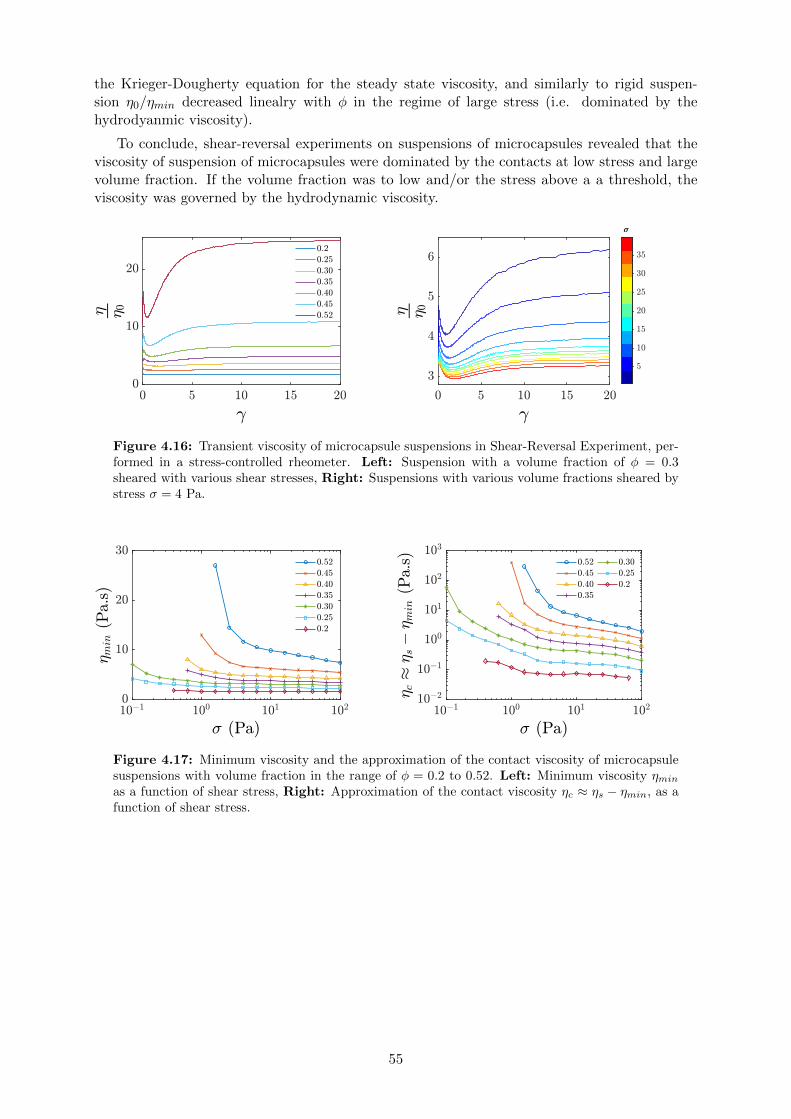
the Krieger-Dougherty equation for the steady state viscosity, and similarly to rigid suspen-sion η0/ηmin decreased linealry with φ in the regime of large stress (i.e. dominated by thehydrodyanmic viscosity).
To conclude, shear-reversal experiments on suspensions of microcapsules revealed that theviscosity of suspension of microcapsules were dominated by the contacts at low stress and largevolume fraction. If the volume fraction was to low and/or the stress above a a threshold, theviscosity was governed by the hydrodynamic viscosity.
Figure 4.16: Transient viscosity of microcapsule suspensions in Shear-Reversal Experiment, per-formed in a stress-controlled rheometer. Left: Suspension with a volume fraction of φ = 0.3sheared with various shear stresses, Right: Suspensions with various volume fractions sheared bystress σ = 4 Pa.
Figure 4.17: Minimum viscosity and the approximation of the contact viscosity of microcapsulesuspensions with volume fraction in the range of φ = 0.2 to 0.52. Left: Minimum viscosity ηmin
as a function of shear stress, Right: Approximation of the contact viscosity ηc ≈ ηs − ηmin, as afunction of shear stress.
55
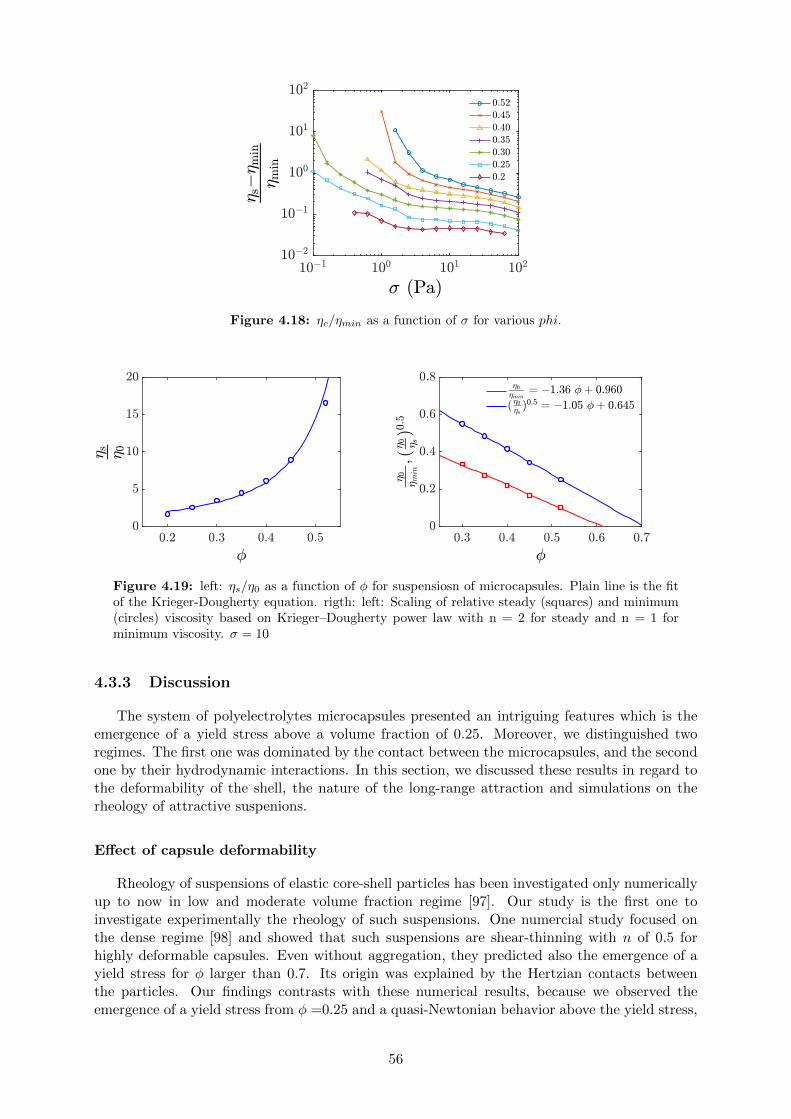
Figure 4.18: ηc/ηmin as a function of σ for various phi.
Figure 4.19: left: ηs/η0 as a function of φ for suspensiosn of microcapsules. Plain line is the fitof the Krieger-Dougherty equation. rigth: left: Scaling of relative steady (squares) and minimum(circles) viscosity based on Krieger–Dougherty power law with n = 2 for steady and n = 1 forminimum viscosity. σ = 10
4.3.3 Discussion
The system of polyelectrolytes microcapsules presented an intriguing features which is theemergence of a yield stress above a volume fraction of 0.25. Moreover, we distinguished tworegimes. The first one was dominated by the contact between the microcapsules, and the secondone by their hydrodynamic interactions. In this section, we discussed these results in regard tothe deformability of the shell, the nature of the long-range attraction and simulations on therheology of attractive suspenions.
Effect of capsule deformability
Rheology of suspensions of elastic core-shell particles has been investigated only numericallyup to now in low and moderate volume fraction regime [97]. Our study is the first one toinvestigate experimentally the rheology of such suspensions. One numercial study focused onthe dense regime [98] and showed that such suspensions are shear-thinning with n of 0.5 forhighly deformable capsules. Even without aggregation, they predicted also the emergence of ayield stress for φ larger than 0.7. Its origin was explained by the Hertzian contacts betweenthe particles. Our findings contrasts with these numerical results, because we observed theemergence of a yield stress from φ =0.25 and a quasi-Newtonian behavior above the yield stress,
56
which was independent on the elasticity of the shell.
In fact, in our experiments, the maximal capillary numbers Ca = σR/Gs was of the order of10−3 for σ = 20 Pa. For such values of Ca, we did not expect that microcapsules could take anon-spherical shape due to the field of shear stress [76]. However, this low value of Ca did notpreclude local deformation of the membrane near the contact between two microcapsules dueto compressive stress, which could modify lubrication interaction in the thin film. To promoteeffects due to the deformability of the microcapsules, we should either reduce the Gs or reducethe size. However the lowest value of Gs with this biphasic system was limited by the water/ oil surface tension, i.e. of the order of 0.1 N/m. However, these capsules break very easilyunder shear for low Gs values [84]. Increasing the size of the capsule will have a minor effecton the range of Ca if one want to keep the ratio of the size over the gap sufficiently small tocharacterize the bulk properties of the suspension. A solution could be to use microcapsuleswith the same inner and outer phase and then to reduce Gs values of several orders of magnitude[89]. However, such systems are very difficult to produce in mass and in a control way.
Finally, the rheology of our system of microcapsules was clearly dominated by the non-hydrodynamic interactions between the capsules.
The nature of long-range interactions
We have shown experimental evidence of long-range attractions in the suspensions of cap-sule at rest. Whereas depletion and van der Walls interactions can cause aggregation for sub-micrometric particles, we did not expect that such interactions play any role for particles of fewhundreds of micrometers [99]. Moreover, the external phase (silicone oil) has been washed forresidue of surfactant, and we cannot expect any depletion. A last hypothesis to explain theselong-range interactions is the nature of the molecules used to form the capsules. Chitosan isa positively charged poly-electrolytes and was always present in the inner phase. It has beenobserved that such systems of polyelectrolytes can cause a strong dipolar interaction because oftheir large dipole moment [100, 101]. This also explain why our capsules formed chains under amoderate electric field. We can so speculate that chitosan form dipole and was so responsibleof the long-range attractive interactions. These interactions can be modulated according to thekind of silicone oil, because they present different dielectric properties.
Rheology of attractive suspensions
The system of polyelectrolytres microcapsules is an original one due to its ability to interactat length scale of few hundreds of micrometer. The rheology of adhesive / attractive particleshas been studied for sub-micrometer droplets [102], but to the best of our knowledge not forsub-millimetric particles. For sub-micrometric adhesive particles, it is accepted that there isno unviersal flow behvaiour of such jammed materials [102], as experimental results can beconflicting. However, it is expected that such materials presents slip at the wall and shearbanding. Although we did not measured the velocity field, our system of attractive microcapsulesobey well to the Herschel-Bulkley law and do not present non-monotonic variations of stressrate with the shear rate, which is a signature of shear banding [102]. However, without localmeasurement of the velocity field we cannot exclude slip at the wall and shear banding in oursystem.
Inrani conducts numerical simulations for attractive non-brownian suspensions [94]. Ourexperimental results confirms most of their findings. The general picture of the rheology ofattractive particle is the presence of two regimes. The ”attraction dominated” regime whichleads to yield stress below the jamming volume fraction. For a given attraction strength, theyield stress increases with φ and for a given φ, the yield stress increases with the magnitudeof the attraction potential. Note, that the simulations of [94] did not cover φ lower than 0.7,
57
whereas in our experiments φm was of 0.25. The second regime is the ”shear-induced rupture”regime in which the clusters are broken and the viscosity collapse on a master curve for a givenφ and whatever the strength of the attraction potential. Thus, the results of [94] shows thatabove a critical shear rate, the attraction do not play any role on the rheology of attractive sus-pensions. Our steady-state and shear reversal experiments confirms expeirmentally this pictureof attractive suspensions. At low stress and high volume fraction, we showed that the rheologyis dominated by the contact, and so the long-range attraction. Above a stress of few Pa, resus-pension experiments shows that the clusters were broken and the rheology was dominated bythe hydrodynamic interactions between the particles with a low shear-thinning behavior for themost concentrated suspensions. We cannot exclude also that non-Coulombian friction betweenthe particles at high volume fraction [103, 38] or capsule deformability [98] was responsible forthis small shear thinning.
Moreover, the numerical of Irani et al. [94] give also some insights on shear banding for suchattractive systems. They showed that at high volume fraction there is no shear banding and therheological behavior can be fitted with the Herschell-Bulkley model. At low volume fraction,shear banding and non monotonic shear stress can appear. However, shear-banding depends onthe particle confinement: shear bands can be avoided if the wavelength of the unstable modes donot fit with the lateral size of the system. Due to the relatively high confinement in our system(∼10 particles in the gap), we could expect that it precluded the formation of shear bands.Finally, in agreement with numerical simulations [94], we show that suspensions of attractiveparticle have a yield stress at volume fractions far below where the corresponding repulsivesystems would be fluid.
4.4 Conclusion
We have studied the rheology of a suspension of non-Brownian microcapsules which presentedlong-range attractions. The originality of our system was to present these attractions at lengthscales of few hundreds of micrometers. The physical origin of this attraction is an open issue,but we can reasonably speculate, in light of the literature, that the polyelectrolyte present in thecapsule was able to generate a strong dipolar moment. Such attraction has for consequence theemergence of a yield stress at volume fraction of 0.25, where the corresponding repulsive systemswould be fluid. Moreover, there was no apparent sign of shear banding, which is probably due tothe fact that the particles were relatively confined in the plane-plane geometry. The rheologicalresponse of this system can be depicted into two different regimes. The ”attraction dominated”regime, where there is a yield stress even when we are fare from the close packing. this regimecorrespond to low stress value and large volume fraction. The second regime is the shear-inducedrupture of the aggregates for which we have an almost Newtonian behavior and attraction donot play a significant role on the viscosity of the suspension.
Summary
⇒ CH/PFacid microcapsules exhibit long-range attractive interactions with a few hundredmicrometers length scale resulting a yield stress at φ = 0.25.⇒ Rheology of microcapsule suspensions is divided into two regimes: attraction domi-nated regime showing a yield stress and Newtonian regime.
58
Chapter 5
Viscose resuspension of droplets
59
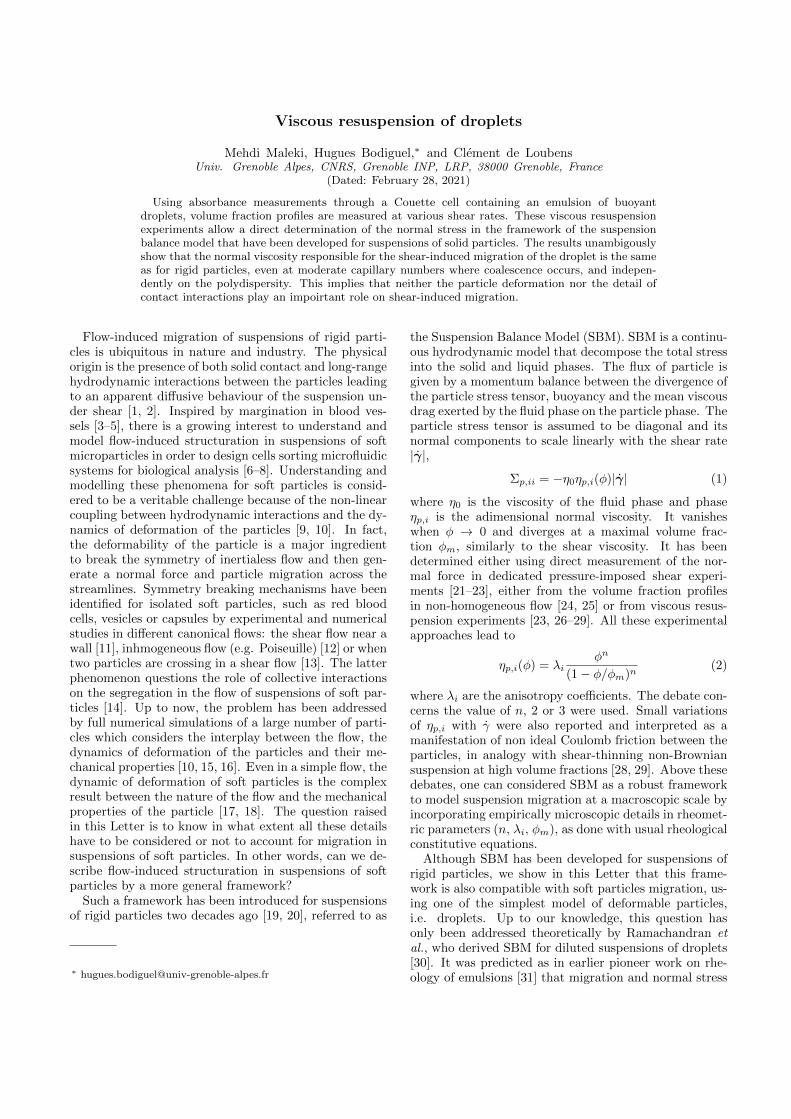
Viscous resuspension of droplets
Mehdi Maleki, Hugues Bodiguel,∗ and Clement de LoubensUniv. Grenoble Alpes, CNRS, Grenoble INP, LRP, 38000 Grenoble, France
(Dated: February 28, 2021)
Using absorbance measurements through a Couette cell containing an emulsion of buoyantdroplets, volume fraction profiles are measured at various shear rates. These viscous resuspensionexperiments allow a direct determination of the normal stress in the framework of the suspensionbalance model that have been developed for suspensions of solid particles. The results unambigouslyshow that the normal viscosity responsible for the shear-induced migration of the droplet is the sameas for rigid particles, even at moderate capillary numbers where coalescence occurs, and indepen-dently on the polydispersity. This implies that neither the particle deformation nor the detail ofcontact interactions play an impoirtant role on shear-induced migration.
Flow-induced migration of suspensions of rigid parti-cles is ubiquitous in nature and industry. The physicalorigin is the presence of both solid contact and long-rangehydrodynamic interactions between the particles leadingto an apparent diffusive behaviour of the suspension un-der shear [1, 2]. Inspired by margination in blood ves-sels [3–5], there is a growing interest to understand andmodel flow-induced structuration in suspensions of softmicroparticles in order to design cells sorting microfluidicsystems for biological analysis [6–8]. Understanding andmodelling these phenomena for soft particles is consid-ered to be a veritable challenge because of the non-linearcoupling between hydrodynamic interactions and the dy-namics of deformation of the particles [9, 10]. In fact,the deformability of the particle is a major ingredientto break the symmetry of inertialess flow and then gen-erate a normal force and particle migration across thestreamlines. Symmetry breaking mechanisms have beenidentified for isolated soft particles, such as red bloodcells, vesicles or capsules by experimental and numericalstudies in different canonical flows: the shear flow near awall [11], inhmogeneous flow (e.g. Poiseuille) [12] or whentwo particles are crossing in a shear flow [13]. The latterphenomenon questions the role of collective interactionson the segregation in the flow of suspensions of soft par-ticles [14]. Up to now, the problem has been addressedby full numerical simulations of a large number of parti-cles which considers the interplay between the flow, thedynamics of deformation of the particles and their me-chanical properties [10, 15, 16]. Even in a simple flow, thedynamic of deformation of soft particles is the complexresult between the nature of the flow and the mechanicalproperties of the particle [17, 18]. The question raisedin this Letter is to know in what extent all these detailshave to be considered or not to account for migration insuspensions of soft particles. In other words, can we de-scribe flow-induced structuration in suspensions of softparticles by a more general framework?
Such a framework has been introduced for suspensionsof rigid particles two decades ago [19, 20], referred to as
the Suspension Balance Model (SBM). SBM is a continu-ous hydrodynamic model that decompose the total stressinto the solid and liquid phases. The flux of particle isgiven by a momentum balance between the divergence ofthe particle stress tensor, buoyancy and the mean viscousdrag exerted by the fluid phase on the particle phase. Theparticle stress tensor is assumed to be diagonal and itsnormal components to scale linearly with the shear rate|γ|,
Σp,ii = −η0ηp,i(φ)|γ| (1)
where η0 is the viscosity of the fluid phase and phaseηp,i is the adimensional normal viscosity. It vanisheswhen φ → 0 and diverges at a maximal volume frac-tion φm, similarly to the shear viscosity. It has beendetermined either using direct measurement of the nor-mal force in dedicated pressure-imposed shear experi-ments [21–23], either from the volume fraction profilesin non-homogeneous flow [24, 25] or from viscous resus-pension experiments [23, 26–29]. All these experimentalapproaches lead to
ηp,i(φ) = λiφn
(1− φ/φm)n(2)
where λi are the anisotropy coefficients. The debate con-cerns the value of n, 2 or 3 were used. Small variationsof ηp,i with γ were also reported and interpreted as amanifestation of non ideal Coulomb friction between theparticles, in analogy with shear-thinning non-Browniansuspension at high volume fractions [28, 29]. Above thesedebates, one can considered SBM as a robust frameworkto model suspension migration at a macroscopic scale byincorporating empirically microscopic details in rheomet-ric parameters (n, λi, φm), as done with usual rheologicalconstitutive equations.
Although SBM has been developed for suspensions ofrigid particles, we show in this Letter that this frame-work is also compatible with soft particles migration, us-ing one of the simplest model of deformable particles,i.e. droplets. Up to our knowledge, this question hasonly been addressed theoretically by Ramachandran etal., who derived SBM for diluted suspensions of droplets[30]. It was predicted as in earlier pioneer work on rhe-ology of emulsions [31] that migration and normal stress
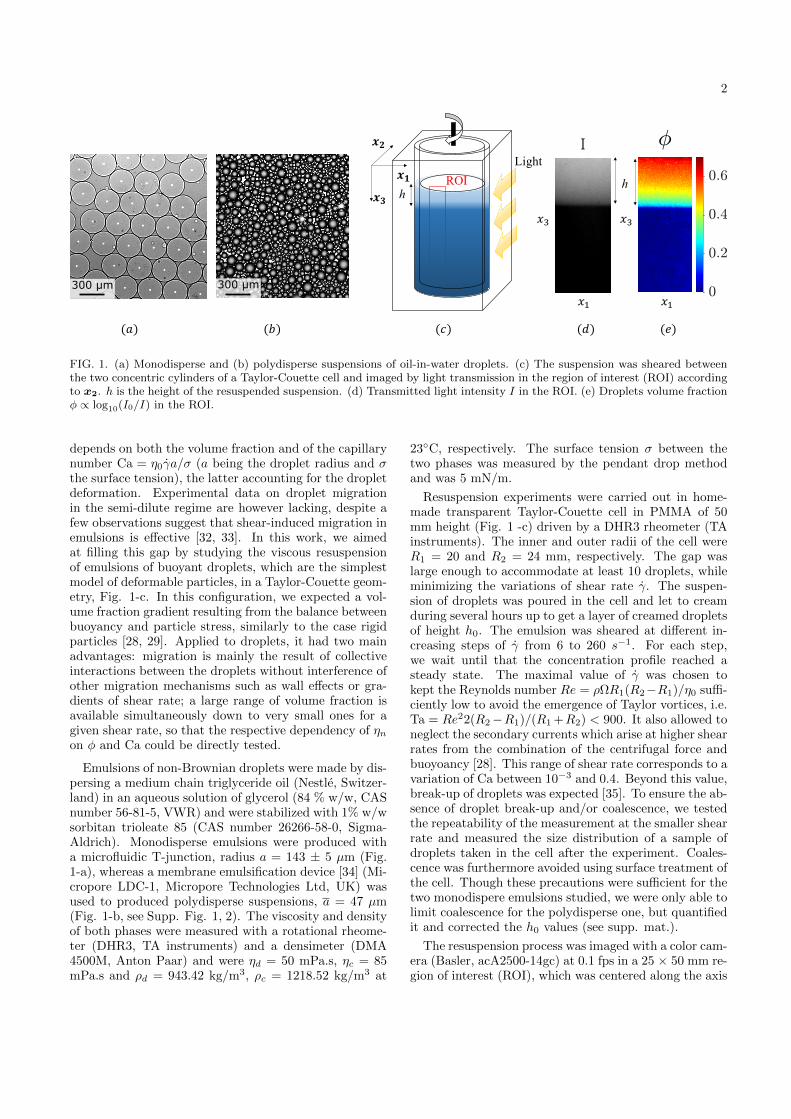
2
𝒙𝟏𝒙𝟑
𝒙𝟐
ROIh
Light
300 µm300 µm
a b d ec300 µm300 µm
a b d ec 𝑥$
𝑥%
𝑥$
𝑥%
(𝑎) (𝑏) (𝑐) (𝑑) (𝑒)
h
FIG. 1. (a) Monodisperse and (b) polydisperse suspensions of oil-in-water droplets. (c) The suspension was sheared betweenthe two concentric cylinders of a Taylor-Couette cell and imaged by light transmission in the region of interest (ROI) accordingto x2. h is the height of the resuspended suspension. (d) Transmitted light intensity I in the ROI. (e) Droplets volume fractionφ ∝ log10(I0/I) in the ROI.
depends on both the volume fraction and of the capillarynumber Ca = η0γa/σ (a being the droplet radius and σthe surface tension), the latter accounting for the dropletdeformation. Experimental data on droplet migrationin the semi-dilute regime are however lacking, despite afew observations suggest that shear-induced migration inemulsions is effective [32, 33]. In this work, we aimedat filling this gap by studying the viscous resuspensionof emulsions of buoyant droplets, which are the simplestmodel of deformable particles, in a Taylor-Couette geom-etry, Fig. 1-c. In this configuration, we expected a vol-ume fraction gradient resulting from the balance betweenbuoyancy and particle stress, similarly to the case rigidparticles [28, 29]. Applied to droplets, it had two mainadvantages: migration is mainly the result of collectiveinteractions between the droplets without interference ofother migration mechanisms such as wall effects or gra-dients of shear rate; a large range of volume fraction isavailable simultaneously down to very small ones for agiven shear rate, so that the respective dependency of ηnon φ and Ca could be directly tested.
Emulsions of non-Brownian droplets were made by dis-persing a medium chain triglyceride oil (Nestle, Switzer-land) in an aqueous solution of glycerol (84 % w/w, CASnumber 56-81-5, VWR) and were stabilized with 1% w/wsorbitan trioleate 85 (CAS number 26266-58-0, Sigma-Aldrich). Monodisperse emulsions were produced witha microfluidic T-junction, radius a = 143 ± 5 µm (Fig.1-a), whereas a membrane emulsification device [34] (Mi-cropore LDC-1, Micropore Technologies Ltd, UK) wasused to produced polydisperse suspensions, a = 47 µm(Fig. 1-b, see Supp. Fig. 1, 2). The viscosity and densityof both phases were measured with a rotational rheome-ter (DHR3, TA instruments) and a densimeter (DMA4500M, Anton Paar) and were ηd = 50 mPa.s, ηc = 85mPa.s and ρd = 943.42 kg/m3, ρc = 1218.52 kg/m3 at
23C, respectively. The surface tension σ between thetwo phases was measured by the pendant drop methodand was 5 mN/m.
Resuspension experiments were carried out in home-made transparent Taylor-Couette cell in PMMA of 50mm height (Fig. 1 -c) driven by a DHR3 rheometer (TAinstruments). The inner and outer radii of the cell wereR1 = 20 and R2 = 24 mm, respectively. The gap waslarge enough to accommodate at least 10 droplets, whileminimizing the variations of shear rate γ. The suspen-sion of droplets was poured in the cell and let to creamduring several hours up to get a layer of creamed dropletsof height h0. The emulsion was sheared at different in-creasing steps of γ from 6 to 260 s−1. For each step,we wait until that the concentration profile reached asteady state. The maximal value of γ was chosen tokept the Reynolds number Re = ρΩR1(R2−R1)/η0 suffi-ciently low to avoid the emergence of Taylor vortices, i.e.Ta = Re22(R2−R1)/(R1 +R2) < 900. It also allowed toneglect the secondary currents which arise at higher shearrates from the combination of the centrifugal force andbuoyoancy [28]. This range of shear rate corresponds to avariation of Ca between 10−3 and 0.4. Beyond this value,break-up of droplets was expected [35]. To ensure the ab-sence of droplet break-up and/or coalescence, we testedthe repeatability of the measurement at the smaller shearrate and measured the size distribution of a sample ofdroplets taken in the cell after the experiment. Coales-cence was furthermore avoided using surface treatment ofthe cell. Though these precautions were sufficient for thetwo monodispere emulsions studied, we were only able tolimit coalescence for the polydisperse one, but quantifiedit and corrected the h0 values (see supp. mat.).
The resuspension process was imaged with a color cam-era (Basler, acA2500-14gc) at 0.1 fps in a 25 × 50 mm re-gion of interest (ROI), which was centered along the axis
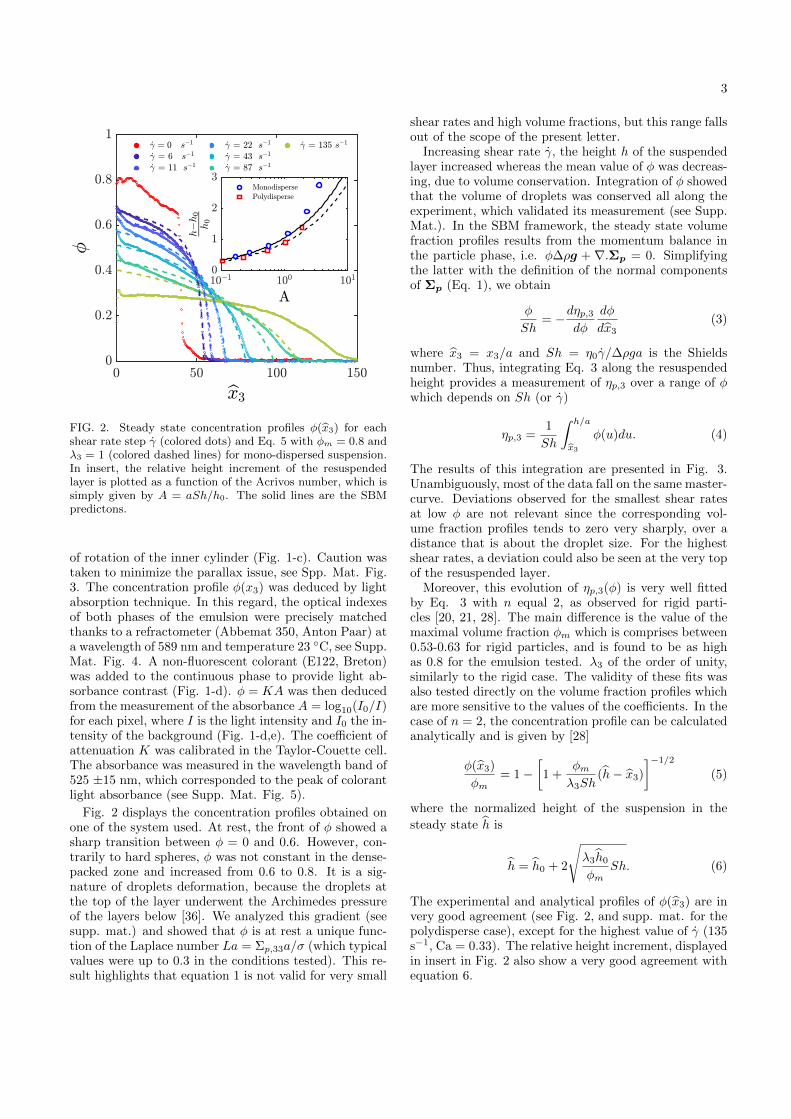
3
FIG. 2. Steady state concentration profiles φ(x3) for eachshear rate step γ (colored dots) and Eq. 5 with φm = 0.8 andλ3 = 1 (colored dashed lines) for mono-dispersed suspension.In insert, the relative height increment of the resuspendedlayer is plotted as a function of the Acrivos number, which issimply given by A = aSh/h0. The solid lines are the SBMpredictons.
of rotation of the inner cylinder (Fig. 1-c). Caution wastaken to minimize the parallax issue, see Spp. Mat. Fig.3. The concentration profile φ(x3) was deduced by lightabsorption technique. In this regard, the optical indexesof both phases of the emulsion were precisely matchedthanks to a refractometer (Abbemat 350, Anton Paar) ata wavelength of 589 nm and temperature 23 C, see Supp.Mat. Fig. 4. A non-fluorescent colorant (E122, Breton)was added to the continuous phase to provide light ab-sorbance contrast (Fig. 1-d). φ = KA was then deducedfrom the measurement of the absorbance A = log10(I0/I)for each pixel, where I is the light intensity and I0 the in-tensity of the background (Fig. 1-d,e). The coefficient ofattenuation K was calibrated in the Taylor-Couette cell.The absorbance was measured in the wavelength band of525 ±15 nm, which corresponded to the peak of colorantlight absorbance (see Supp. Mat. Fig. 5).
Fig. 2 displays the concentration profiles obtained onone of the system used. At rest, the front of φ showed asharp transition between φ = 0 and 0.6. However, con-trarily to hard spheres, φ was not constant in the dense-packed zone and increased from 0.6 to 0.8. It is a sig-nature of droplets deformation, because the droplets atthe top of the layer underwent the Archimedes pressureof the layers below [36]. We analyzed this gradient (seesupp. mat.) and showed that φ is at rest a unique func-tion of the Laplace number La = Σp,33a/σ (which typicalvalues were up to 0.3 in the conditions tested). This re-sult highlights that equation 1 is not valid for very small
shear rates and high volume fractions, but this range fallsout of the scope of the present letter.
Increasing shear rate γ, the height h of the suspendedlayer increased whereas the mean value of φ was decreas-ing, due to volume conservation. Integration of φ showedthat the volume of droplets was conserved all along theexperiment, which validated its measurement (see Supp.Mat.). In the SBM framework, the steady state volumefraction profiles results from the momentum balance inthe particle phase, i.e. φ∆ρg + ∇.Σp = 0. Simplifyingthe latter with the definition of the normal componentsof Σp (Eq. 1), we obtain
φ
Sh= −dηp,3
dφ
dφ
dx3(3)
where x3 = x3/a and Sh = η0γ/∆ρga is the Shieldsnumber. Thus, integrating Eq. 3 along the resuspendedheight provides a measurement of ηp,3 over a range of φwhich depends on Sh (or γ)
ηp,3 =1
Sh
∫ h/a
x3
φ(u)du. (4)
The results of this integration are presented in Fig. 3.Unambiguously, most of the data fall on the same master-curve. Deviations observed for the smallest shear ratesat low φ are not relevant since the corresponding vol-ume fraction profiles tends to zero very sharply, over adistance that is about the droplet size. For the highestshear rates, a deviation could also be seen at the very topof the resuspended layer.
Moreover, this evolution of ηp,3(φ) is very well fittedby Eq. 3 with n equal 2, as observed for rigid parti-cles [20, 21, 28]. The main difference is the value of themaximal volume fraction φm which is comprises between0.53-0.63 for rigid particles, and is found to be as highas 0.8 for the emulsion tested. λ3 of the order of unity,similarly to the rigid case. The validity of these fits wasalso tested directly on the volume fraction profiles whichare more sensitive to the values of the coefficients. In thecase of n = 2, the concentration profile can be calculatedanalytically and is given by [28]
φ(x3)
φm= 1−
[1 +
φmλ3Sh
(h− x3)
]−1/2
(5)
where the normalized height of the suspension in the
steady state h is
h = h0 + 2
√λ3h0φm
Sh. (6)
The experimental and analytical profiles of φ(x3) are invery good agreement (see Fig. 2, and supp. mat. for thepolydisperse case), except for the highest value of γ (135s−1, Ca = 0.33). The relative height increment, displayedin insert in Fig. 2 also show a very good agreement withequation 6.
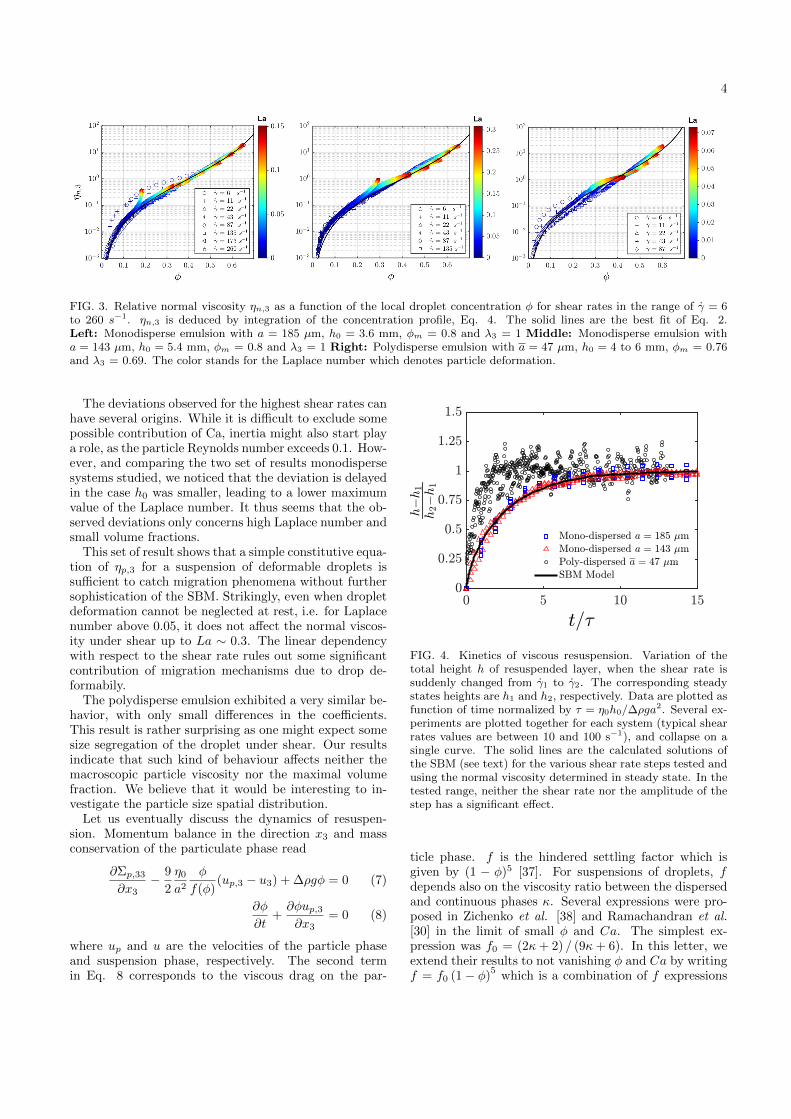
4
FIG. 3. Relative normal viscosity ηn,3 as a function of the local droplet concentration φ for shear rates in the range of γ = 6to 260 s−1. ηn,3 is deduced by integration of the concentration profile, Eq. 4. The solid lines are the best fit of Eq. 2.Left: Monodisperse emulsion with a = 185 µm, h0 = 3.6 mm, φm = 0.8 and λ3 = 1 Middle: Monodisperse emulsion witha = 143 µm, h0 = 5.4 mm, φm = 0.8 and λ3 = 1 Right: Polydisperse emulsion with a = 47 µm, h0 = 4 to 6 mm, φm = 0.76and λ3 = 0.69. The color stands for the Laplace number which denotes particle deformation.
The deviations observed for the highest shear rates canhave several origins. While it is difficult to exclude somepossible contribution of Ca, inertia might also start playa role, as the particle Reynolds number exceeds 0.1. How-ever, and comparing the two set of results monodispersesystems studied, we noticed that the deviation is delayedin the case h0 was smaller, leading to a lower maximumvalue of the Laplace number. It thus seems that the ob-served deviations only concerns high Laplace number andsmall volume fractions.
This set of result shows that a simple constitutive equa-tion of ηp,3 for a suspension of deformable droplets issufficient to catch migration phenomena without furthersophistication of the SBM. Strikingly, even when dropletdeformation cannot be neglected at rest, i.e. for Laplacenumber above 0.05, it does not affect the normal viscos-ity under shear up to La ∼ 0.3. The linear dependencywith respect to the shear rate rules out some significantcontribution of migration mechanisms due to drop de-formabily.
The polydisperse emulsion exhibited a very similar be-havior, with only small differences in the coefficients.This result is rather surprising as one might expect somesize segregation of the droplet under shear. Our resultsindicate that such kind of behaviour affects neither themacroscopic particle viscosity nor the maximal volumefraction. We believe that it would be interesting to in-vestigate the particle size spatial distribution.
Let us eventually discuss the dynamics of resuspen-sion. Momentum balance in the direction x3 and massconservation of the particulate phase read
∂Σp,33
∂x3− 9
2
η0a2
φ
f(φ)(up,3 − u3) + ∆ρgφ = 0 (7)
∂φ
∂t+∂φup,3∂x3
= 0 (8)
where up and u are the velocities of the particle phaseand suspension phase, respectively. The second termin Eq. 8 corresponds to the viscous drag on the par-
FIG. 4. Kinetics of viscous resuspension. Variation of thetotal height h of resuspended layer, when the shear rate issuddenly changed from γ1 to γ2. The corresponding steadystates heights are h1 and h2, respectively. Data are plotted asfunction of time normalized by τ = η0h0/∆ρga
2. Several ex-periments are plotted together for each system (typical shearrates values are between 10 and 100 s−1), and collapse on asingle curve. The solid lines are the calculated solutions ofthe SBM (see text) for the various shear rate steps tested andusing the normal viscosity determined in steady state. In thetested range, neither the shear rate nor the amplitude of thestep has a significant effect.
ticle phase. f is the hindered settling factor which isgiven by (1 − φ)5 [37]. For suspensions of droplets, fdepends also on the viscosity ratio between the dispersedand continuous phases κ. Several expressions were pro-posed in Zichenko et al. [38] and Ramachandran et al.[30] in the limit of small φ and Ca. The simplest ex-pression was f0 = (2κ+ 2) / (9κ+ 6). In this letter, weextend their results to not vanishing φ and Ca by writingf = f0 (1− φ)
5which is a combination of f expressions
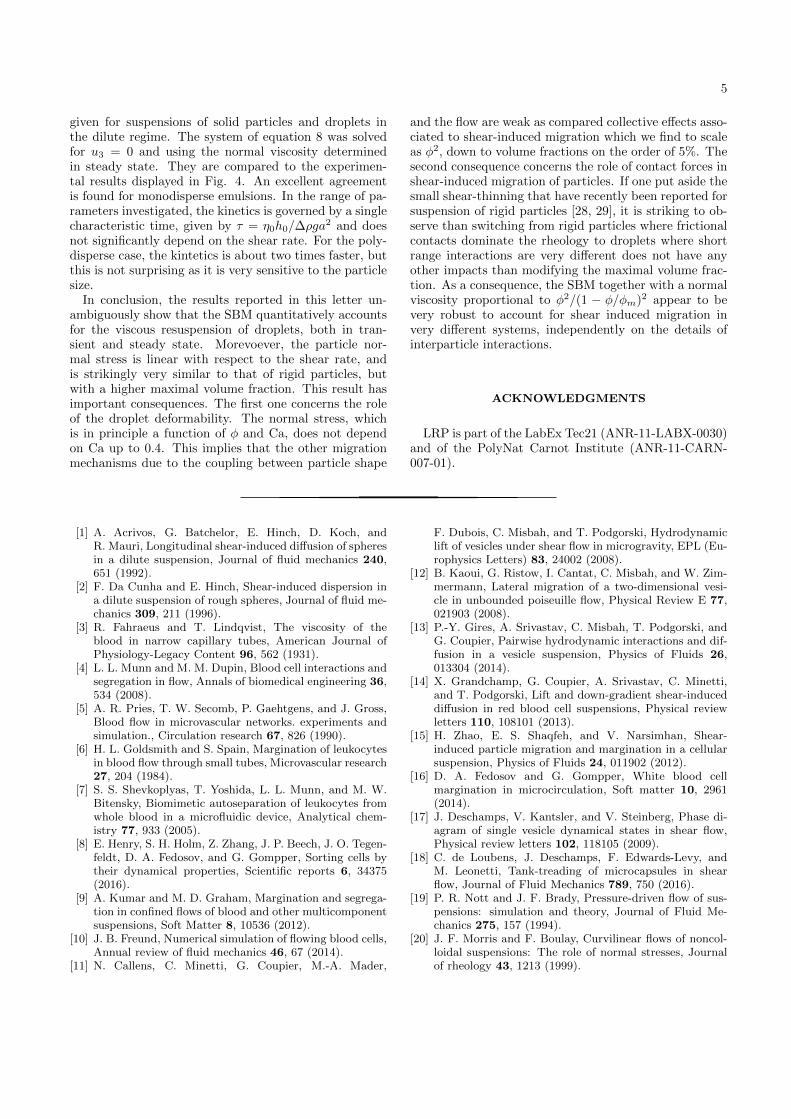
5
given for suspensions of solid particles and droplets inthe dilute regime. The system of equation 8 was solvedfor u3 = 0 and using the normal viscosity determinedin steady state. They are compared to the experimen-tal results displayed in Fig. 4. An excellent agreementis found for monodisperse emulsions. In the range of pa-rameters investigated, the kinetics is governed by a singlecharacteristic time, given by τ = η0h0/∆ρga
2 and doesnot significantly depend on the shear rate. For the poly-disperse case, the kintetics is about two times faster, butthis is not surprising as it is very sensitive to the particlesize.
In conclusion, the results reported in this letter un-ambiguously show that the SBM quantitatively accountsfor the viscous resuspension of droplets, both in tran-sient and steady state. Morevoever, the particle nor-mal stress is linear with respect to the shear rate, andis strikingly very similar to that of rigid particles, butwith a higher maximal volume fraction. This result hasimportant consequences. The first one concerns the roleof the droplet deformability. The normal stress, whichis in principle a function of φ and Ca, does not dependon Ca up to 0.4. This implies that the other migrationmechanisms due to the coupling between particle shape
and the flow are weak as compared collective effects asso-ciated to shear-induced migration which we find to scaleas φ2, down to volume fractions on the order of 5%. Thesecond consequence concerns the role of contact forces inshear-induced migration of particles. If one put aside thesmall shear-thinning that have recently been reported forsuspension of rigid particles [28, 29], it is striking to ob-serve than switching from rigid particles where frictionalcontacts dominate the rheology to droplets where shortrange interactions are very different does not have anyother impacts than modifying the maximal volume frac-tion. As a consequence, the SBM together with a normalviscosity proportional to φ2/(1 − φ/φm)2 appear to bevery robust to account for shear induced migration invery different systems, independently on the details ofinterparticle interactions.
ACKNOWLEDGMENTS
LRP is part of the LabEx Tec21 (ANR-11-LABX-0030)and of the PolyNat Carnot Institute (ANR-11-CARN-007-01).
[1] A. Acrivos, G. Batchelor, E. Hinch, D. Koch, andR. Mauri, Longitudinal shear-induced diffusion of spheresin a dilute suspension, Journal of fluid mechanics 240,651 (1992).
[2] F. Da Cunha and E. Hinch, Shear-induced dispersion ina dilute suspension of rough spheres, Journal of fluid me-chanics 309, 211 (1996).
[3] R. Fahraeus and T. Lindqvist, The viscosity of theblood in narrow capillary tubes, American Journal ofPhysiology-Legacy Content 96, 562 (1931).
[4] L. L. Munn and M. M. Dupin, Blood cell interactions andsegregation in flow, Annals of biomedical engineering 36,534 (2008).
[5] A. R. Pries, T. W. Secomb, P. Gaehtgens, and J. Gross,Blood flow in microvascular networks. experiments andsimulation., Circulation research 67, 826 (1990).
[6] H. L. Goldsmith and S. Spain, Margination of leukocytesin blood flow through small tubes, Microvascular research27, 204 (1984).
[7] S. S. Shevkoplyas, T. Yoshida, L. L. Munn, and M. W.Bitensky, Biomimetic autoseparation of leukocytes fromwhole blood in a microfluidic device, Analytical chem-istry 77, 933 (2005).
[8] E. Henry, S. H. Holm, Z. Zhang, J. P. Beech, J. O. Tegen-feldt, D. A. Fedosov, and G. Gompper, Sorting cells bytheir dynamical properties, Scientific reports 6, 34375(2016).
[9] A. Kumar and M. D. Graham, Margination and segrega-tion in confined flows of blood and other multicomponentsuspensions, Soft Matter 8, 10536 (2012).
[10] J. B. Freund, Numerical simulation of flowing blood cells,Annual review of fluid mechanics 46, 67 (2014).
[11] N. Callens, C. Minetti, G. Coupier, M.-A. Mader,
F. Dubois, C. Misbah, and T. Podgorski, Hydrodynamiclift of vesicles under shear flow in microgravity, EPL (Eu-rophysics Letters) 83, 24002 (2008).
[12] B. Kaoui, G. Ristow, I. Cantat, C. Misbah, and W. Zim-mermann, Lateral migration of a two-dimensional vesi-cle in unbounded poiseuille flow, Physical Review E 77,021903 (2008).
[13] P.-Y. Gires, A. Srivastav, C. Misbah, T. Podgorski, andG. Coupier, Pairwise hydrodynamic interactions and dif-fusion in a vesicle suspension, Physics of Fluids 26,013304 (2014).
[14] X. Grandchamp, G. Coupier, A. Srivastav, C. Minetti,and T. Podgorski, Lift and down-gradient shear-induceddiffusion in red blood cell suspensions, Physical reviewletters 110, 108101 (2013).
[15] H. Zhao, E. S. Shaqfeh, and V. Narsimhan, Shear-induced particle migration and margination in a cellularsuspension, Physics of Fluids 24, 011902 (2012).
[16] D. A. Fedosov and G. Gompper, White blood cellmargination in microcirculation, Soft matter 10, 2961(2014).
[17] J. Deschamps, V. Kantsler, and V. Steinberg, Phase di-agram of single vesicle dynamical states in shear flow,Physical review letters 102, 118105 (2009).
[18] C. de Loubens, J. Deschamps, F. Edwards-Levy, andM. Leonetti, Tank-treading of microcapsules in shearflow, Journal of Fluid Mechanics 789, 750 (2016).
[19] P. R. Nott and J. F. Brady, Pressure-driven flow of sus-pensions: simulation and theory, Journal of Fluid Me-chanics 275, 157 (1994).
[20] J. F. Morris and F. Boulay, Curvilinear flows of noncol-loidal suspensions: The role of normal stresses, Journalof rheology 43, 1213 (1999).
6
[21] F. Boyer, O. Pouliquen, and E. Guazzelli, Dense suspen-sions in rotating-rod flows: normal stresses and particlemigration, Journal of Fluid Mechanics 686, 5 (2011).
[22] F. Boyer, E. Guazzelli, and O. Pouliquen, Unifying sus-pension and granular rheology, Physical Review Letters107, 188301 (2011).
[23] I. E. Zarraga, D. A. Hill, and D. T. Leighton Jr, The char-acterization of the total stress of concentrated suspen-sions of noncolloidal spheres in newtonian fluids, Journalof Rheology 44, 185 (2000).
[24] M. Lyon and L. Leal, An experimental study of themotion of concentrated suspensions in two-dimensionalchannel flow. part 1. monodisperse systems, Journal ofFluid Mechanics 363, 25 (1998).
[25] B. Snook, J. E. Butler, and E. Guazzelli, Dynamics ofshear-induced migration of spherical particles in oscil-latory pipe flow, Journal of Fluid Mechanics 786, 128(2016).
[26] D. Leighton and A. Acrivos, Viscous resuspension, Chem-ical engineering science 41, 1377 (1986).
[27] A. Acrivos, R. Mauri, and X. Fan, Shear-induced resus-pension in a couette device, International journal of mul-tiphase flow 19, 797 (1993).
[28] B. Saint-Michel, S. Manneville, S. Meeker, G. Ovarlez,and H. Bodiguel, X-ray radiography of viscous resuspen-sion, Physics of Fluids 31, 103301 (2019).
[29] E. d’Ambrosio, F. Blanc, and E. Lemaire, Viscous re-suspension of non-brownian particles: determination ofthe concentration profiles and particle normal stresses,Journal of Fluid Mechanics 911, A22 (2021).
[30] A. Ramachandran, M. Loewenberg, and D. T.
Leighton Jr, A constitutive equation for droplet distri-bution in unidirectional flows of dilute emulsions for lowcapillary numbers, Physics of Fluids 22, 083301 (2010).
[31] W. Schowalter, C. Chaffey, and H. Brenner, Rheologi-cal behavior of a dilute emulsion, Journal of colloid andinterface science 26, 152 (1968).
[32] K. Hollingsworth and M. Johns, Droplet migration inemulsion systems measured using mr methods, Journalof colloid and interface science 296, 700 (2006).
[33] M. Abbas, A. Pouplin, O. Masbernat, A. Line, andS. Decarre, Pipe flow of a dense emulsion: Homo-geneous shear-thinning or shear-induced migration?,AIChE Journal 63, 5182 (2017).
[34] S. R. Kosvintsev, G. Gasparini, R. G. Holdich, I. W.Cumming, and M. T. Stillwell, Liquid- liquid membranedispersion in a stirred cell with and without controlledshear, Industrial & engineering chemistry research 44,9323 (2005).
[35] B. Bentley and L. G. Leal, An experimental investiga-tion of drop deformation and breakup in steady, two-dimensional linear flows, Journal of Fluid Mechanics 167,241 (1986).
[36] M. Henschke, L. H. Schlieper, and A. Pfennig, Determi-nation of a coalescence parameter from batch-settling ex-periments, Chemical Engineering Journal 85, 369 (2002).
[37] J. Richardson and W. Zaki, Sedimentation and fluidisa-tion: Part i, Chemical Engineering Research and Design75, S82 (1997).
[38] A. Zinchenko, Effect of hydrodynamic interactions be-tween the particles on the rheological properties of diluteemulsions, Journal of Applied Mathematics and Mechan-ics 48, 198 (1984).
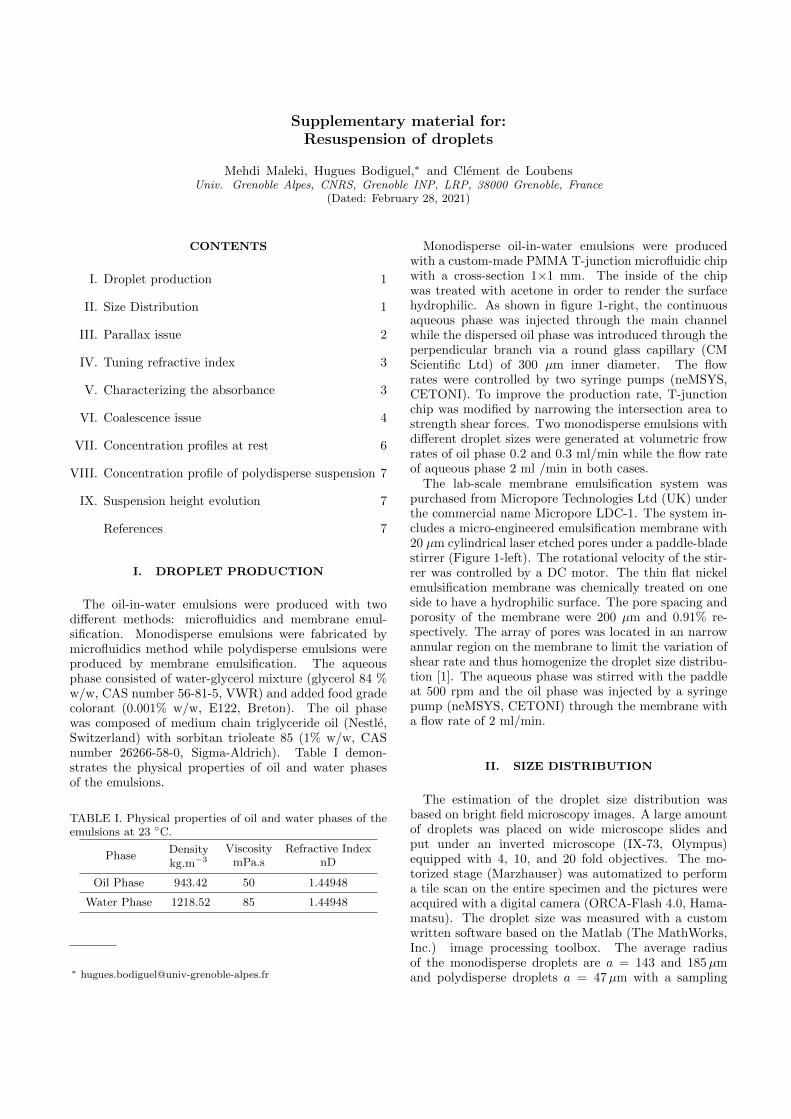
Supplementary material for:Resuspension of droplets
Mehdi Maleki, Hugues Bodiguel,∗ and Clement de LoubensUniv. Grenoble Alpes, CNRS, Grenoble INP, LRP, 38000 Grenoble, France
(Dated: February 28, 2021)
CONTENTS
I. Droplet production 1
II. Size Distribution 1
III. Parallax issue 2
IV. Tuning refractive index 3
V. Characterizing the absorbance 3
VI. Coalescence issue 4
VII. Concentration profiles at rest 6
VIII. Concentration profile of polydisperse suspension 7
IX. Suspension height evolution 7
References 7
I. DROPLET PRODUCTION
The oil-in-water emulsions were produced with twodifferent methods: microfluidics and membrane emul-sification. Monodisperse emulsions were fabricated bymicrofluidics method while polydisperse emulsions wereproduced by membrane emulsification. The aqueousphase consisted of water-glycerol mixture (glycerol 84 %w/w, CAS number 56-81-5, VWR) and added food gradecolorant (0.001% w/w, E122, Breton). The oil phasewas composed of medium chain triglyceride oil (Nestle,Switzerland) with sorbitan trioleate 85 (1% w/w, CASnumber 26266-58-0, Sigma-Aldrich). Table I demon-strates the physical properties of oil and water phasesof the emulsions.
TABLE I. Physical properties of oil and water phases of theemulsions at 23 C.
PhaseDensitykg.m−3
ViscositymPa.s
Refractive IndexnD
Oil Phase 943.42 50 1.44948
Water Phase 1218.52 85 1.44948
Monodisperse oil-in-water emulsions were producedwith a custom-made PMMA T-junction microfluidic chipwith a cross-section 1×1 mm. The inside of the chipwas treated with acetone in order to render the surfacehydrophilic. As shown in figure 1-right, the continuousaqueous phase was injected through the main channelwhile the dispersed oil phase was introduced through theperpendicular branch via a round glass capillary (CMScientific Ltd) of 300 µm inner diameter. The flowrates were controlled by two syringe pumps (neMSYS,CETONI). To improve the production rate, T-junctionchip was modified by narrowing the intersection area tostrength shear forces. Two monodisperse emulsions withdifferent droplet sizes were generated at volumetric frowrates of oil phase 0.2 and 0.3 ml/min while the flow rateof aqueous phase 2 ml /min in both cases.
The lab-scale membrane emulsification system waspurchased from Micropore Technologies Ltd (UK) underthe commercial name Micropore LDC-1. The system in-cludes a micro-engineered emulsification membrane with20 µm cylindrical laser etched pores under a paddle-bladestirrer (Figure 1-left). The rotational velocity of the stir-rer was controlled by a DC motor. The thin flat nickelemulsification membrane was chemically treated on oneside to have a hydrophilic surface. The pore spacing andporosity of the membrane were 200 µm and 0.91% re-spectively. The array of pores was located in an narrowannular region on the membrane to limit the variation ofshear rate and thus homogenize the droplet size distribu-tion [1]. The aqueous phase was stirred with the paddleat 500 rpm and the oil phase was injected by a syringepump (neMSYS, CETONI) through the membrane witha flow rate of 2 ml/min.
II. SIZE DISTRIBUTION
The estimation of the droplet size distribution wasbased on bright field microscopy images. A large amountof droplets was placed on wide microscope slides andput under an inverted microscope (IX-73, Olympus)equipped with 4, 10, and 20 fold objectives. The mo-torized stage (Marzhauser) was automatized to performa tile scan on the entire specimen and the pictures wereacquired with a digital camera (ORCA-Flash 4.0, Hama-matsu). The droplet size was measured with a customwritten software based on the Matlab (The MathWorks,Inc.) image processing toolbox. The average radiusof the monodisperse droplets are a = 143 and 185µmand polydisperse droplets a = 47µm with a sampling
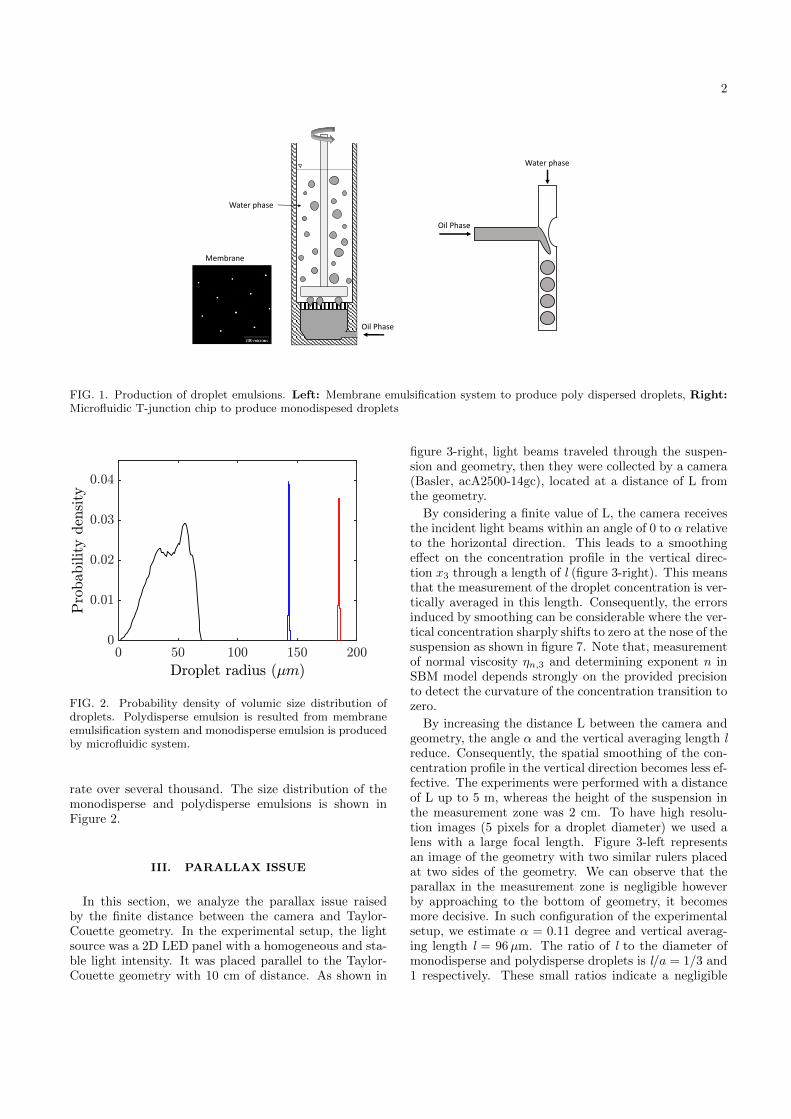
2
Oil Phase
Membrane
Water phase
Oil Phase
Water phase
FIG. 1. Production of droplet emulsions. Left: Membrane emulsification system to produce poly dispersed droplets, Right:Microfluidic T-junction chip to produce monodispesed droplets
FIG. 2. Probability density of volumic size distribution ofdroplets. Polydisperse emulsion is resulted from membraneemulsification system and monodisperse emulsion is producedby microfluidic system.
rate over several thousand. The size distribution of themonodisperse and polydisperse emulsions is shown inFigure 2.
III. PARALLAX ISSUE
In this section, we analyze the parallax issue raisedby the finite distance between the camera and Taylor-Couette geometry. In the experimental setup, the lightsource was a 2D LED panel with a homogeneous and sta-ble light intensity. It was placed parallel to the Taylor-Couette geometry with 10 cm of distance. As shown in
figure 3-right, light beams traveled through the suspen-sion and geometry, then they were collected by a camera(Basler, acA2500-14gc), located at a distance of L fromthe geometry.
By considering a finite value of L, the camera receivesthe incident light beams within an angle of 0 to α relativeto the horizontal direction. This leads to a smoothingeffect on the concentration profile in the vertical direc-tion x3 through a length of l (figure 3-right). This meansthat the measurement of the droplet concentration is ver-tically averaged in this length. Consequently, the errorsinduced by smoothing can be considerable where the ver-tical concentration sharply shifts to zero at the nose of thesuspension as shown in figure 7. Note that, measurementof normal viscosity ηn,3 and determining exponent n inSBM model depends strongly on the provided precisionto detect the curvature of the concentration transition tozero.
By increasing the distance L between the camera andgeometry, the angle α and the vertical averaging length lreduce. Consequently, the spatial smoothing of the con-centration profile in the vertical direction becomes less ef-fective. The experiments were performed with a distanceof L up to 5 m, whereas the height of the suspension inthe measurement zone was 2 cm. To have high resolu-tion images (5 pixels for a droplet diameter) we used alens with a large focal length. Figure 3-left representsan image of the geometry with two similar rulers placedat two sides of the geometry. We can observe that theparallax in the measurement zone is negligible howeverby approaching to the bottom of geometry, it becomesmore decisive. In such configuration of the experimentalsetup, we estimate α = 0.11 degree and vertical averag-ing length l = 96µm. The ratio of l to the diameter ofmonodisperse and polydisperse droplets is l/a = 1/3 and1 respectively. These small ratios indicate a negligible
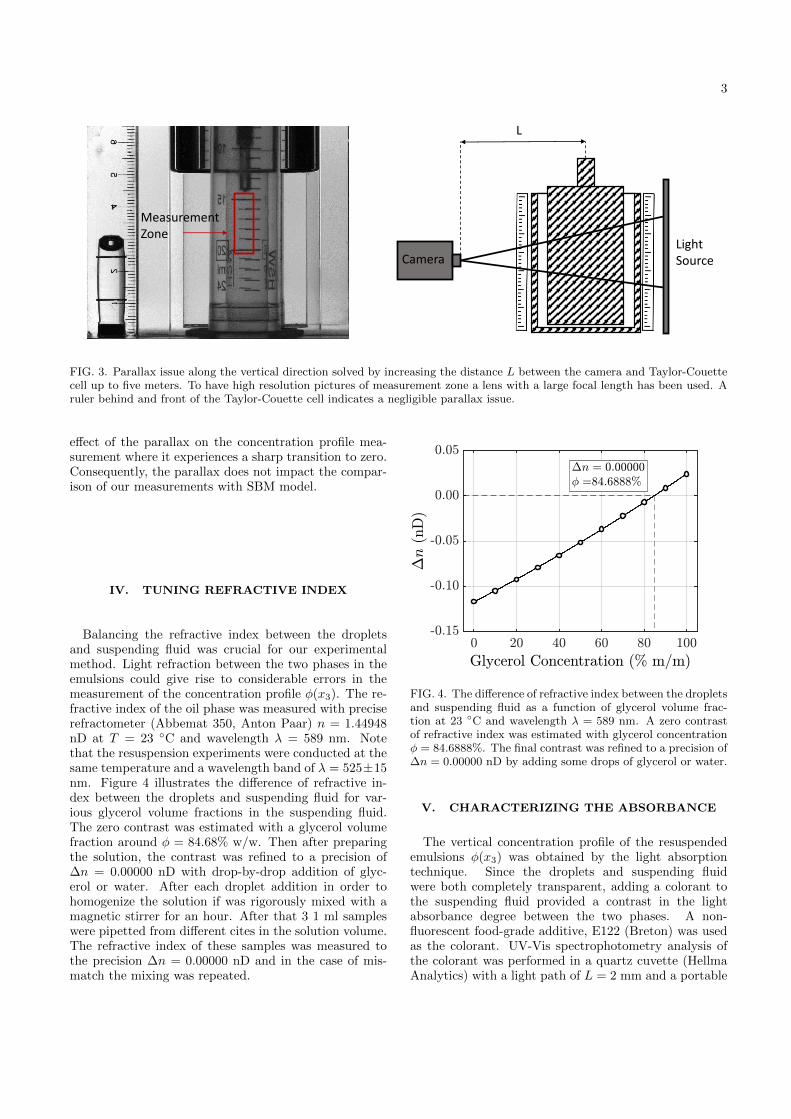
3
MeasurementZone
Light SourceCamera
L
FIG. 3. Parallax issue along the vertical direction solved by increasing the distance L between the camera and Taylor-Couettecell up to five meters. To have high resolution pictures of measurement zone a lens with a large focal length has been used. Aruler behind and front of the Taylor-Couette cell indicates a negligible parallax issue.
effect of the parallax on the concentration profile mea-surement where it experiences a sharp transition to zero.Consequently, the parallax does not impact the compar-ison of our measurements with SBM model.
IV. TUNING REFRACTIVE INDEX
Balancing the refractive index between the dropletsand suspending fluid was crucial for our experimentalmethod. Light refraction between the two phases in theemulsions could give rise to considerable errors in themeasurement of the concentration profile φ(x3). The re-fractive index of the oil phase was measured with preciserefractometer (Abbemat 350, Anton Paar) n = 1.44948nD at T = 23 C and wavelength λ = 589 nm. Notethat the resuspension experiments were conducted at thesame temperature and a wavelength band of λ = 525±15nm. Figure 4 illustrates the difference of refractive in-dex between the droplets and suspending fluid for var-ious glycerol volume fractions in the suspending fluid.The zero contrast was estimated with a glycerol volumefraction around φ = 84.68% w/w. Then after preparingthe solution, the contrast was refined to a precision of∆n = 0.00000 nD with drop-by-drop addition of glyc-erol or water. After each droplet addition in order tohomogenize the solution if was rigorously mixed with amagnetic stirrer for an hour. After that 3 1 ml sampleswere pipetted from different cites in the solution volume.The refractive index of these samples was measured tothe precision ∆n = 0.00000 nD and in the case of mis-match the mixing was repeated.
FIG. 4. The difference of refractive index between the dropletsand suspending fluid as a function of glycerol volume frac-tion at 23 C and wavelength λ = 589 nm. A zero contrastof refractive index was estimated with glycerol concentrationφ = 84.6888%. The final contrast was refined to a precision of∆n = 0.00000 nD by adding some drops of glycerol or water.
V. CHARACTERIZING THE ABSORBANCE
The vertical concentration profile of the resuspendedemulsions φ(x3) was obtained by the light absorptiontechnique. Since the droplets and suspending fluidwere both completely transparent, adding a colorant tothe suspending fluid provided a contrast in the lightabsorbance degree between the two phases. A non-fluorescent food-grade additive, E122 (Breton) was usedas the colorant. UV-Vis spectrophotometry analysis ofthe colorant was performed in a quartz cuvette (HellmaAnalytics) with a light path of L = 2 mm and a portable
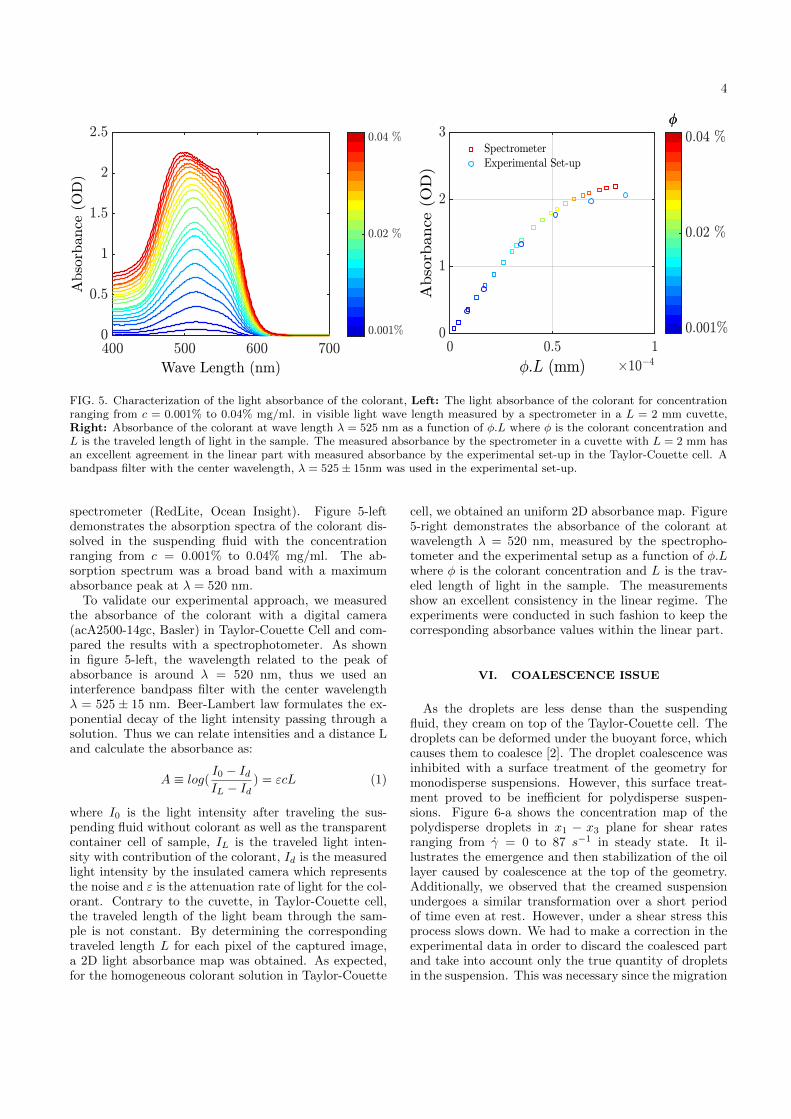
4
FIG. 5. Characterization of the light absorbance of the colorant, Left: The light absorbance of the colorant for concentrationranging from c = 0.001% to 0.04% mg/ml. in visible light wave length measured by a spectrometer in a L = 2 mm cuvette,Right: Absorbance of the colorant at wave length λ = 525 nm as a function of φ.L where φ is the colorant concentration andL is the traveled length of light in the sample. The measured absorbance by the spectrometer in a cuvette with L = 2 mm hasan excellent agreement in the linear part with measured absorbance by the experimental set-up in the Taylor-Couette cell. Abandpass filter with the center wavelength, λ = 525 ± 15nm was used in the experimental set-up.
spectrometer (RedLite, Ocean Insight). Figure 5-leftdemonstrates the absorption spectra of the colorant dis-solved in the suspending fluid with the concentrationranging from c = 0.001% to 0.04% mg/ml. The ab-sorption spectrum was a broad band with a maximumabsorbance peak at λ = 520 nm.
To validate our experimental approach, we measuredthe absorbance of the colorant with a digital camera(acA2500-14gc, Basler) in Taylor-Couette Cell and com-pared the results with a spectrophotometer. As shownin figure 5-left, the wavelength related to the peak ofabsorbance is around λ = 520 nm, thus we used aninterference bandpass filter with the center wavelengthλ = 525 ± 15 nm. Beer-Lambert law formulates the ex-ponential decay of the light intensity passing through asolution. Thus we can relate intensities and a distance Land calculate the absorbance as:
A ≡ log(I0 − IdIL − Id
) = εcL (1)
where I0 is the light intensity after traveling the sus-pending fluid without colorant as well as the transparentcontainer cell of sample, IL is the traveled light inten-sity with contribution of the colorant, Id is the measuredlight intensity by the insulated camera which representsthe noise and ε is the attenuation rate of light for the col-orant. Contrary to the cuvette, in Taylor-Couette cell,the traveled length of the light beam through the sam-ple is not constant. By determining the correspondingtraveled length L for each pixel of the captured image,a 2D light absorbance map was obtained. As expected,for the homogeneous colorant solution in Taylor-Couette
cell, we obtained an uniform 2D absorbance map. Figure5-right demonstrates the absorbance of the colorant atwavelength λ = 520 nm, measured by the spectropho-tometer and the experimental setup as a function of φ.Lwhere φ is the colorant concentration and L is the trav-eled length of light in the sample. The measurementsshow an excellent consistency in the linear regime. Theexperiments were conducted in such fashion to keep thecorresponding absorbance values within the linear part.
VI. COALESCENCE ISSUE
As the droplets are less dense than the suspendingfluid, they cream on top of the Taylor-Couette cell. Thedroplets can be deformed under the buoyant force, whichcauses them to coalesce [2]. The droplet coalescence wasinhibited with a surface treatment of the geometry formonodisperse suspensions. However, this surface treat-ment proved to be inefficient for polydisperse suspen-sions. Figure 6-a shows the concentration map of thepolydisperse droplets in x1 − x3 plane for shear ratesranging from γ = 0 to 87 s−1 in steady state. It il-lustrates the emergence and then stabilization of the oillayer caused by coalescence at the top of the geometry.Additionally, we observed that the creamed suspensionundergoes a similar transformation over a short periodof time even at rest. However, under a shear stress thisprocess slows down. We had to make a correction in theexperimental data in order to discard the coalesced partand take into account only the true quantity of dropletsin the suspension. This was necessary since the migration
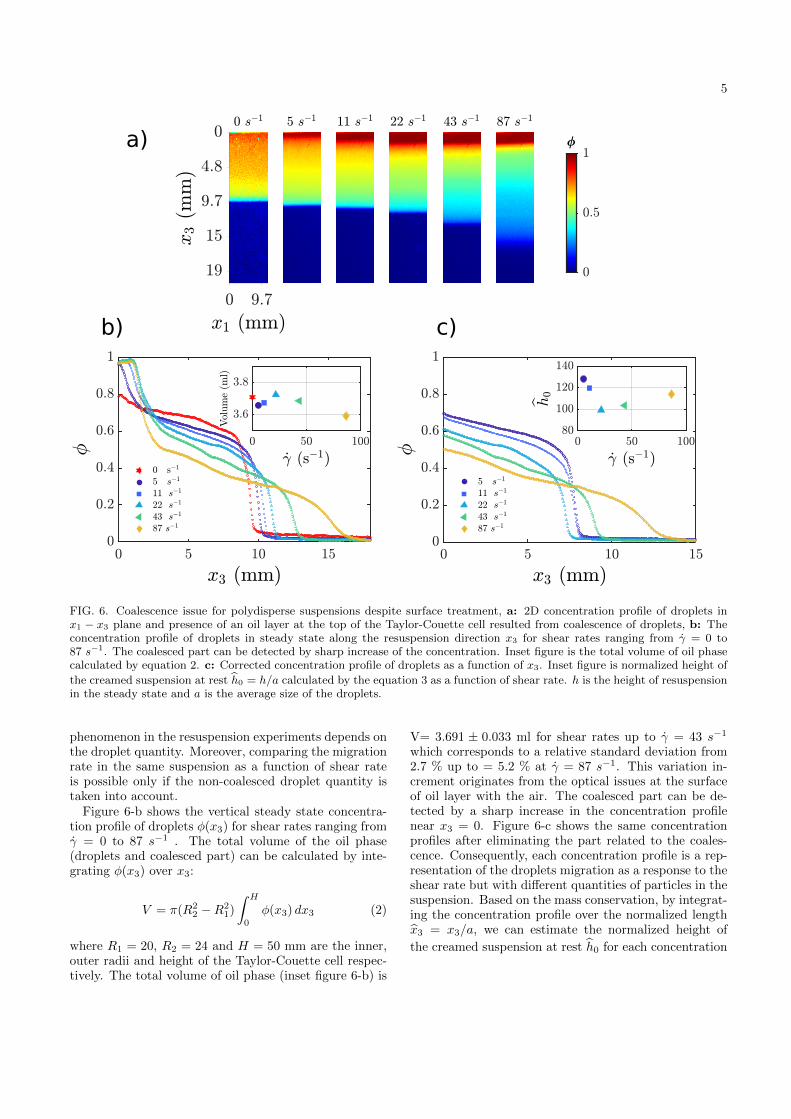
5
a)
b) c)
FIG. 6. Coalescence issue for polydisperse suspensions despite surface treatment, a: 2D concentration profile of droplets inx1 − x3 plane and presence of an oil layer at the top of the Taylor-Couette cell resulted from coalescence of droplets, b: Theconcentration profile of droplets in steady state along the resuspension direction x3 for shear rates ranging from γ = 0 to87 s−1. The coalesced part can be detected by sharp increase of the concentration. Inset figure is the total volume of oil phasecalculated by equation 2. c: Corrected concentration profile of droplets as a function of x3. Inset figure is normalized height of
the creamed suspension at rest h0 = h/a calculated by the equation 3 as a function of shear rate. h is the height of resuspensionin the steady state and a is the average size of the droplets.
phenomenon in the resuspension experiments depends onthe droplet quantity. Moreover, comparing the migrationrate in the same suspension as a function of shear rateis possible only if the non-coalesced droplet quantity istaken into account.
Figure 6-b shows the vertical steady state concentra-tion profile of droplets φ(x3) for shear rates ranging fromγ = 0 to 87 s−1 . The total volume of the oil phase(droplets and coalesced part) can be calculated by inte-grating φ(x3) over x3:
V = π(R22 −R2
1)
∫ H
0
φ(x3) dx3 (2)
where R1 = 20, R2 = 24 and H = 50 mm are the inner,outer radii and height of the Taylor-Couette cell respec-tively. The total volume of oil phase (inset figure 6-b) is
V= 3.691 ± 0.033 ml for shear rates up to γ = 43 s−1
which corresponds to a relative standard deviation from2.7 % up to = 5.2 % at γ = 87 s−1. This variation in-crement originates from the optical issues at the surfaceof oil layer with the air. The coalesced part can be de-tected by a sharp increase in the concentration profilenear x3 = 0. Figure 6-c shows the same concentrationprofiles after eliminating the part related to the coales-cence. Consequently, each concentration profile is a rep-resentation of the droplets migration as a response to theshear rate but with different quantities of particles in thesuspension. Based on the mass conservation, by integrat-ing the concentration profile over the normalized lengthx3 = x3/a, we can estimate the normalized height of
the creamed suspension at rest h0 for each concentration
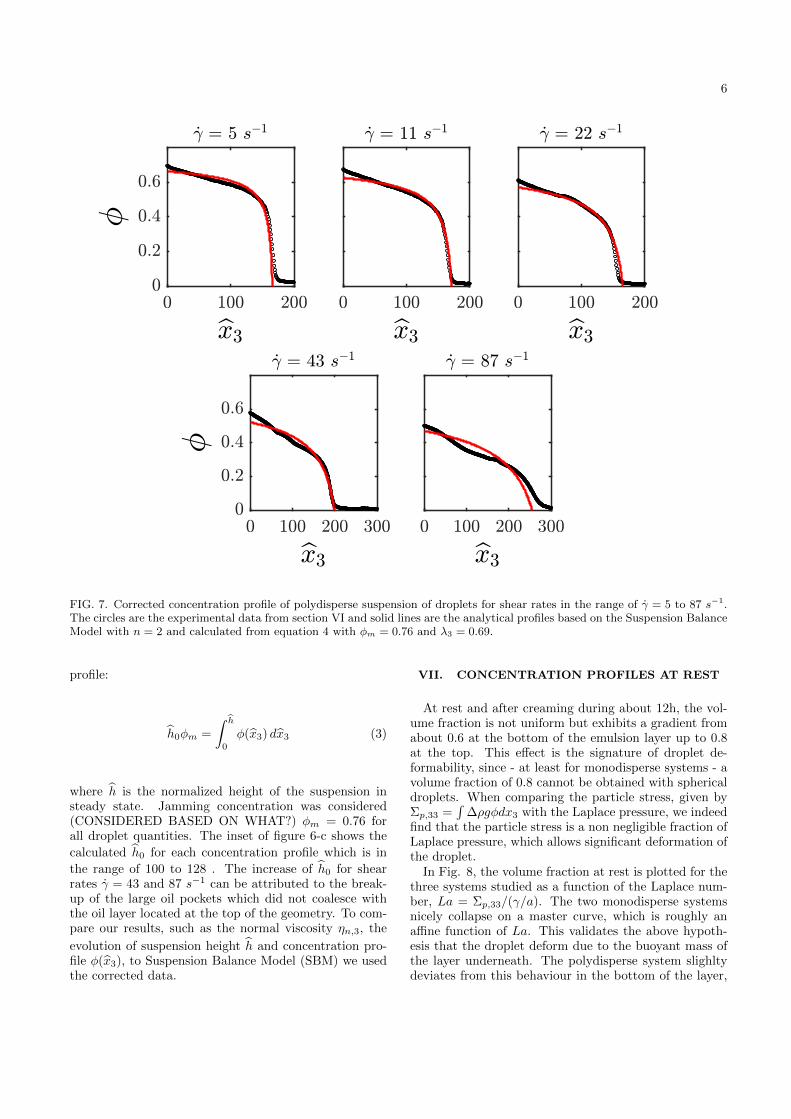
6
FIG. 7. Corrected concentration profile of polydisperse suspension of droplets for shear rates in the range of γ = 5 to 87 s−1.The circles are the experimental data from section VI and solid lines are the analytical profiles based on the Suspension BalanceModel with n = 2 and calculated from equation 4 with φm = 0.76 and λ3 = 0.69.
profile:
h0φm =
∫ h
0
φ(x3) dx3 (3)
where h is the normalized height of the suspension insteady state. Jamming concentration was considered(CONSIDERED BASED ON WHAT?) φm = 0.76 forall droplet quantities. The inset of figure 6-c shows the
calculated h0 for each concentration profile which is in
the range of 100 to 128 . The increase of h0 for shearrates γ = 43 and 87 s−1 can be attributed to the break-up of the large oil pockets which did not coalesce withthe oil layer located at the top of the geometry. To com-pare our results, such as the normal viscosity ηn,3, the
evolution of suspension height h and concentration pro-file φ(x3), to Suspension Balance Model (SBM) we usedthe corrected data.
VII. CONCENTRATION PROFILES AT REST
At rest and after creaming during about 12h, the vol-ume fraction is not uniform but exhibits a gradient fromabout 0.6 at the bottom of the emulsion layer up to 0.8at the top. This effect is the signature of droplet de-formability, since - at least for monodisperse systems - avolume fraction of 0.8 cannot be obtained with sphericaldroplets. When comparing the particle stress, given byΣp,33 =
∫∆ρgφdx3 with the Laplace pressure, we indeed
find that the particle stress is a non negligible fraction ofLaplace pressure, which allows significant deformation ofthe droplet.
In Fig. 8, the volume fraction at rest is plotted for thethree systems studied as a function of the Laplace num-ber, La = Σp,33/(γ/a). The two monodisperse systemsnicely collapse on a master curve, which is roughly anaffine function of La. This validates the above hypoth-esis that the droplet deform due to the buoyant mass ofthe layer underneath. The polydisperse system slighltydeviates from this behaviour in the bottom of the layer,
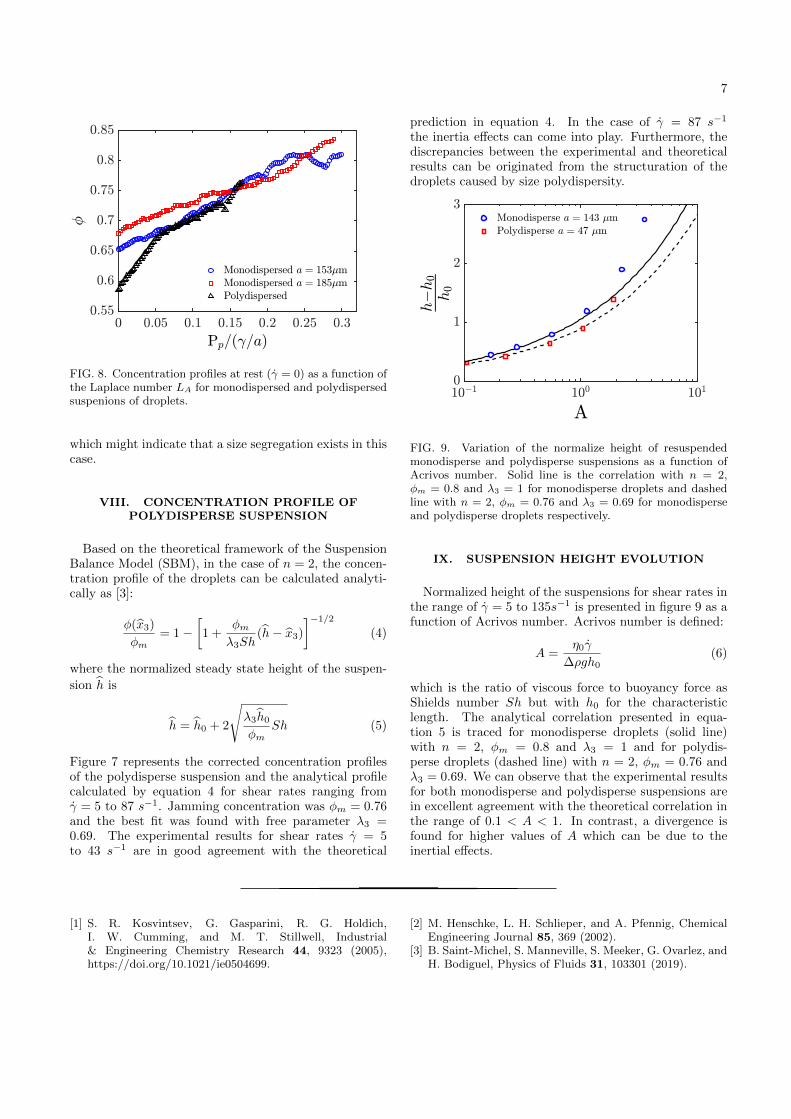
7
FIG. 8. Concentration profiles at rest (γ = 0) as a function ofthe Laplace number LA for monodispersed and polydispersedsuspenions of droplets.
which might indicate that a size segregation exists in thiscase.
VIII. CONCENTRATION PROFILE OFPOLYDISPERSE SUSPENSION
Based on the theoretical framework of the SuspensionBalance Model (SBM), in the case of n = 2, the concen-tration profile of the droplets can be calculated analyti-cally as [3]:
φ(x3)
φm= 1 −
[1 +
φmλ3Sh
(h− x3)
]−1/2
(4)
where the normalized steady state height of the suspen-
sion h is
h = h0 + 2
√λ3h0φm
Sh (5)
Figure 7 represents the corrected concentration profilesof the polydisperse suspension and the analytical profilecalculated by equation 4 for shear rates ranging fromγ = 5 to 87 s−1. Jamming concentration was φm = 0.76and the best fit was found with free parameter λ3 =0.69. The experimental results for shear rates γ = 5to 43 s−1 are in good agreement with the theoretical
prediction in equation 4. In the case of γ = 87 s−1
the inertia effects can come into play. Furthermore, thediscrepancies between the experimental and theoreticalresults can be originated from the structuration of thedroplets caused by size polydispersity.
FIG. 9. Variation of the normalize height of resuspendedmonodisperse and polydisperse suspensions as a function ofAcrivos number. Solid line is the correlation with n = 2,φm = 0.8 and λ3 = 1 for monodisperse droplets and dashedline with n = 2, φm = 0.76 and λ3 = 0.69 for monodisperseand polydisperse droplets respectively.
IX. SUSPENSION HEIGHT EVOLUTION
Normalized height of the suspensions for shear rates inthe range of γ = 5 to 135s−1 is presented in figure 9 as afunction of Acrivos number. Acrivos number is defined:
A =η0γ
∆ρgh0(6)
which is the ratio of viscous force to buoyancy force asShields number Sh but with h0 for the characteristiclength. The analytical correlation presented in equa-tion 5 is traced for monodisperse droplets (solid line)with n = 2, φm = 0.8 and λ3 = 1 and for polydis-perse droplets (dashed line) with n = 2, φm = 0.76 andλ3 = 0.69. We can observe that the experimental resultsfor both monodisperse and polydisperse suspensions arein excellent agreement with the theoretical correlation inthe range of 0.1 < A < 1. In contrast, a divergence isfound for higher values of A which can be due to theinertial effects.
[1] S. R. Kosvintsev, G. Gasparini, R. G. Holdich,I. W. Cumming, and M. T. Stillwell, Industrial& Engineering Chemistry Research 44, 9323 (2005),https://doi.org/10.1021/ie0504699.
[2] M. Henschke, L. H. Schlieper, and A. Pfennig, ChemicalEngineering Journal 85, 369 (2002).
[3] B. Saint-Michel, S. Manneville, S. Meeker, G. Ovarlez, andH. Bodiguel, Physics of Fluids 31, 103301 (2019).
Summary
⇒ Shear-induced migration of monodisperse and polydisperse droplet suspensions was in-vestigated in viscose resuspension in the framework of Suspension Balance Model (SBM).⇒ Particle normal stress was calculated by measuring the concentration profile thanks tolight absorption method.⇒ Particle normal stress scales linearly with shear rate up to Capillary Ca < 0.4 similarto rigid particles which implies negligible effects of deformability compare to collectiveeffects.
73
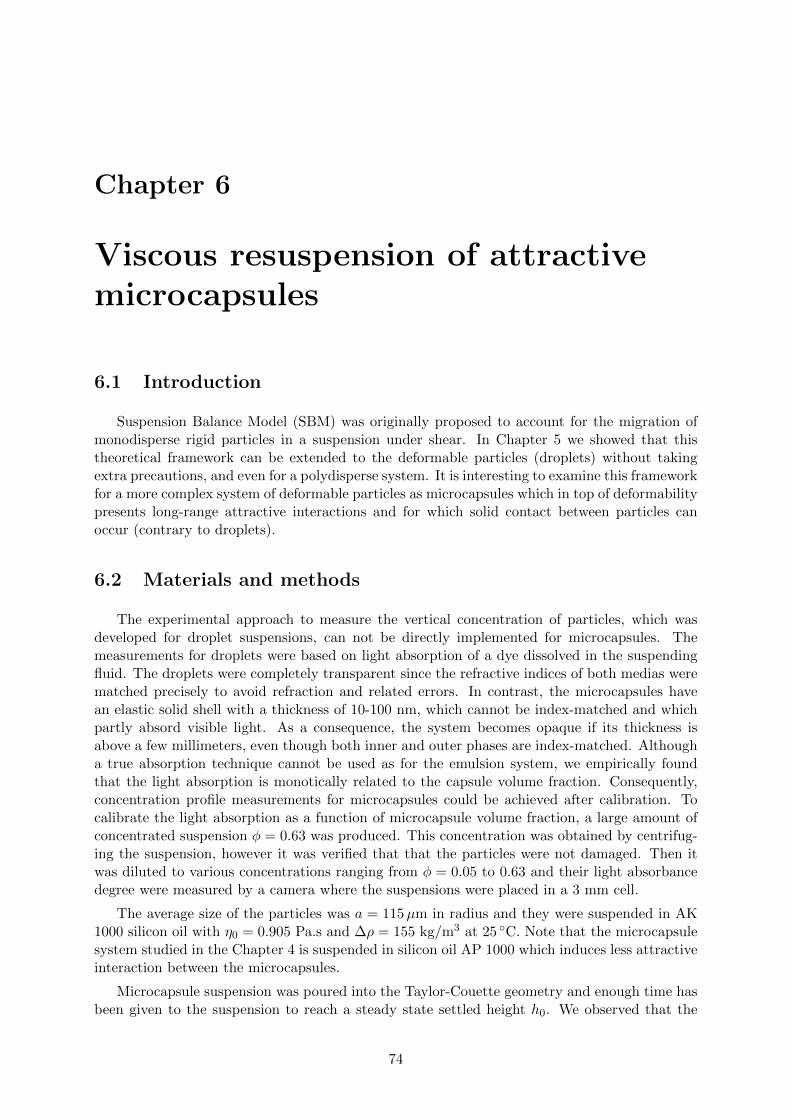
Chapter 6
Viscous resuspension of attractivemicrocapsules
6.1 Introduction
Suspension Balance Model (SBM) was originally proposed to account for the migration ofmonodisperse rigid particles in a suspension under shear. In Chapter 5 we showed that thistheoretical framework can be extended to the deformable particles (droplets) without takingextra precautions, and even for a polydisperse system. It is interesting to examine this frameworkfor a more complex system of deformable particles as microcapsules which in top of deformabilitypresents long-range attractive interactions and for which solid contact between particles canoccur (contrary to droplets).
6.2 Materials and methods
The experimental approach to measure the vertical concentration of particles, which wasdeveloped for droplet suspensions, can not be directly implemented for microcapsules. Themeasurements for droplets were based on light absorption of a dye dissolved in the suspendingfluid. The droplets were completely transparent since the refractive indices of both medias werematched precisely to avoid refraction and related errors. In contrast, the microcapsules havean elastic solid shell with a thickness of 10-100 nm, which cannot be index-matched and whichpartly absord visible light. As a consequence, the system becomes opaque if its thickness isabove a few millimeters, even though both inner and outer phases are index-matched. Althougha true absorption technique cannot be used as for the emulsion system, we empirically foundthat the light absorption is monotically related to the capsule volume fraction. Consequently,concentration profile measurements for microcapsules could be achieved after calibration. Tocalibrate the light absorption as a function of microcapsule volume fraction, a large amount ofconcentrated suspension φ = 0.63 was produced. This concentration was obtained by centrifug-ing the suspension, however it was verified that that the particles were not damaged. Then itwas diluted to various concentrations ranging from φ = 0.05 to 0.63 and their light absorbancedegree were measured by a camera where the suspensions were placed in a 3 mm cell.
The average size of the particles was a = 115µm in radius and they were suspended in AK1000 silicon oil with η0 = 0.905 Pa.s and ∆ρ = 155 kg/m3 at 25 C. Note that the microcapsulesystem studied in the Chapter 4 is suspended in silicon oil AP 1000 which induces less attractiveinteraction between the microcapsules.
Microcapsule suspension was poured into the Taylor-Couette geometry and enough time hasbeen given to the suspension to reach a steady state settled height h0. We observed that the
74
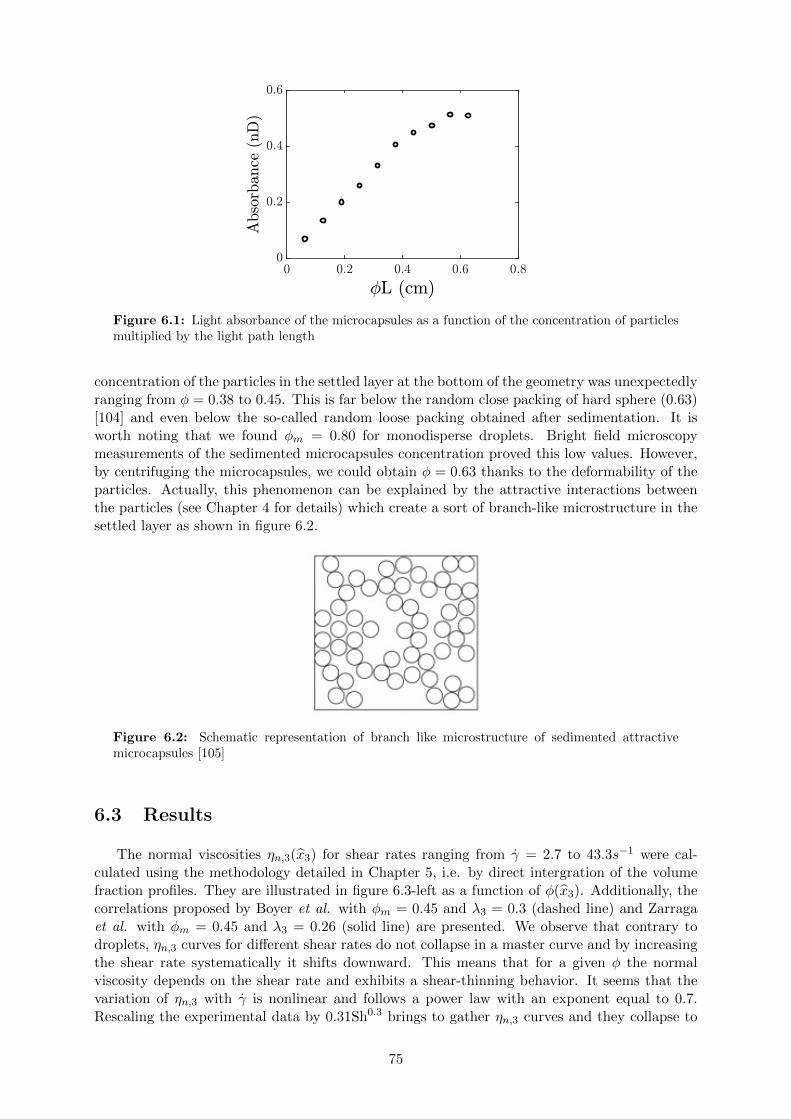
Figure 6.1: Light absorbance of the microcapsules as a function of the concentration of particlesmultiplied by the light path length
concentration of the particles in the settled layer at the bottom of the geometry was unexpectedlyranging from φ = 0.38 to 0.45. This is far below the random close packing of hard sphere (0.63)[104] and even below the so-called random loose packing obtained after sedimentation. It isworth noting that we found φm = 0.80 for monodisperse droplets. Bright field microscopymeasurements of the sedimented microcapsules concentration proved this low values. However,by centrifuging the microcapsules, we could obtain φ = 0.63 thanks to the deformability of theparticles. Actually, this phenomenon can be explained by the attractive interactions betweenthe particles (see Chapter 4 for details) which create a sort of branch-like microstructure in thesettled layer as shown in figure 6.2.
Figure 6.2: Schematic representation of branch like microstructure of sedimented attractivemicrocapsules [105]
6.3 Results
The normal viscosities ηn,3(x3) for shear rates ranging from γ = 2.7 to 43.3s−1 were cal-culated using the methodology detailed in Chapter 5, i.e. by direct intergration of the volumefraction profiles. They are illustrated in figure 6.3-left as a function of φ(x3). Additionally, thecorrelations proposed by Boyer et al. with φm = 0.45 and λ3 = 0.3 (dashed line) and Zarragaet al. with φm = 0.45 and λ3 = 0.26 (solid line) are presented. We observe that contrary todroplets, ηn,3 curves for different shear rates do not collapse in a master curve and by increasingthe shear rate systematically it shifts downward. This means that for a given φ the normalviscosity depends on the shear rate and exhibits a shear-thinning behavior. It seems that thevariation of ηn,3 with γ is nonlinear and follows a power law with an exponent equal to 0.7.Rescaling the experimental data by 0.31Sh0.3 brings to gather ηn,3 curves and they collapse to
75
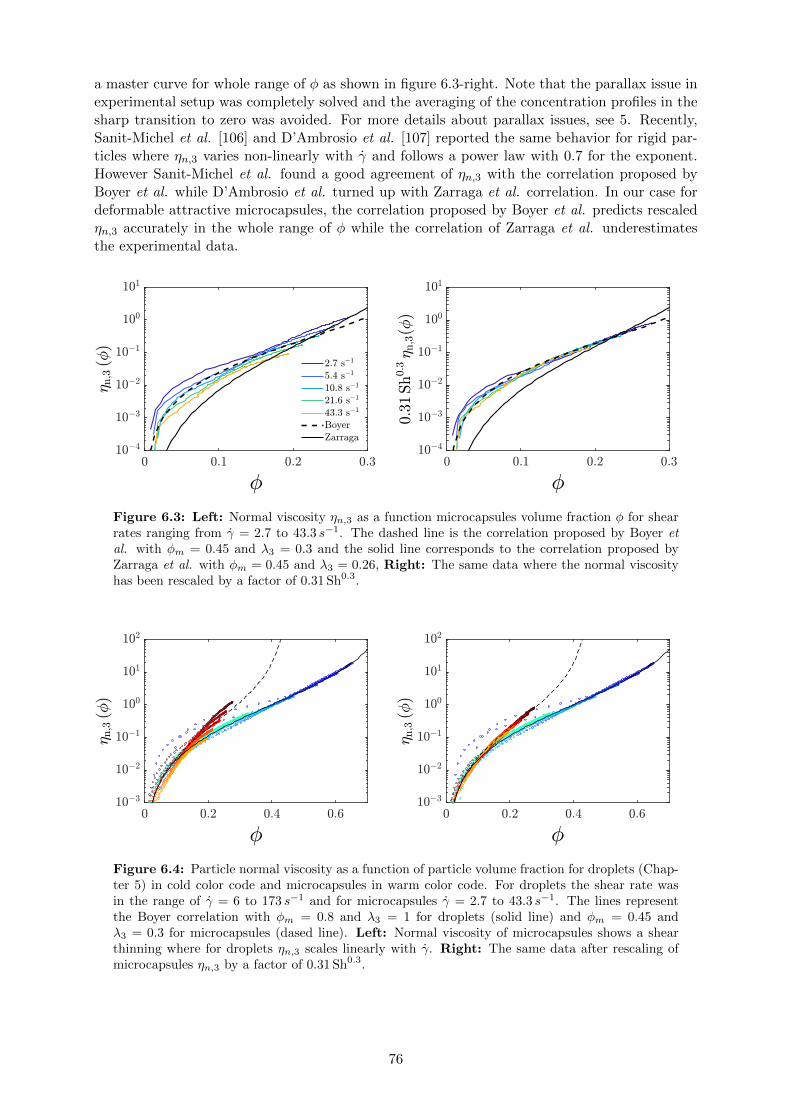
a master curve for whole range of φ as shown in figure 6.3-right. Note that the parallax issue inexperimental setup was completely solved and the averaging of the concentration profiles in thesharp transition to zero was avoided. For more details about parallax issues, see 5. Recently,Sanit-Michel et al. [106] and D’Ambrosio et al. [107] reported the same behavior for rigid par-ticles where ηn,3 varies non-linearly with γ and follows a power law with 0.7 for the exponent.However Sanit-Michel et al. found a good agreement of ηn,3 with the correlation proposed byBoyer et al. while D’Ambrosio et al. turned up with Zarraga et al. correlation. In our case fordeformable attractive microcapsules, the correlation proposed by Boyer et al. predicts rescaledηn,3 accurately in the whole range of φ while the correlation of Zarraga et al. underestimatesthe experimental data.
Figure 6.3: Left: Normal viscosity ηn,3 as a function microcapsules volume fraction φ for shearrates ranging from γ = 2.7 to 43.3 s−1. The dashed line is the correlation proposed by Boyer etal. with φm = 0.45 and λ3 = 0.3 and the solid line corresponds to the correlation proposed byZarraga et al. with φm = 0.45 and λ3 = 0.26, Right: The same data where the normal viscosityhas been rescaled by a factor of 0.31 Sh0.3.
Figure 6.4: Particle normal viscosity as a function of particle volume fraction for droplets (Chap-ter 5) in cold color code and microcapsules in warm color code. For droplets the shear rate wasin the range of γ = 6 to 173 s−1 and for microcapsules γ = 2.7 to 43.3 s−1. The lines representthe Boyer correlation with φm = 0.8 and λ3 = 1 for droplets (solid line) and φm = 0.45 andλ3 = 0.3 for microcapsules (dased line). Left: Normal viscosity of microcapsules shows a shearthinning where for droplets ηn,3 scales linearly with γ. Right: The same data after rescaling ofmicrocapsules ηn,3 by a factor of 0.31 Sh0.3.
76
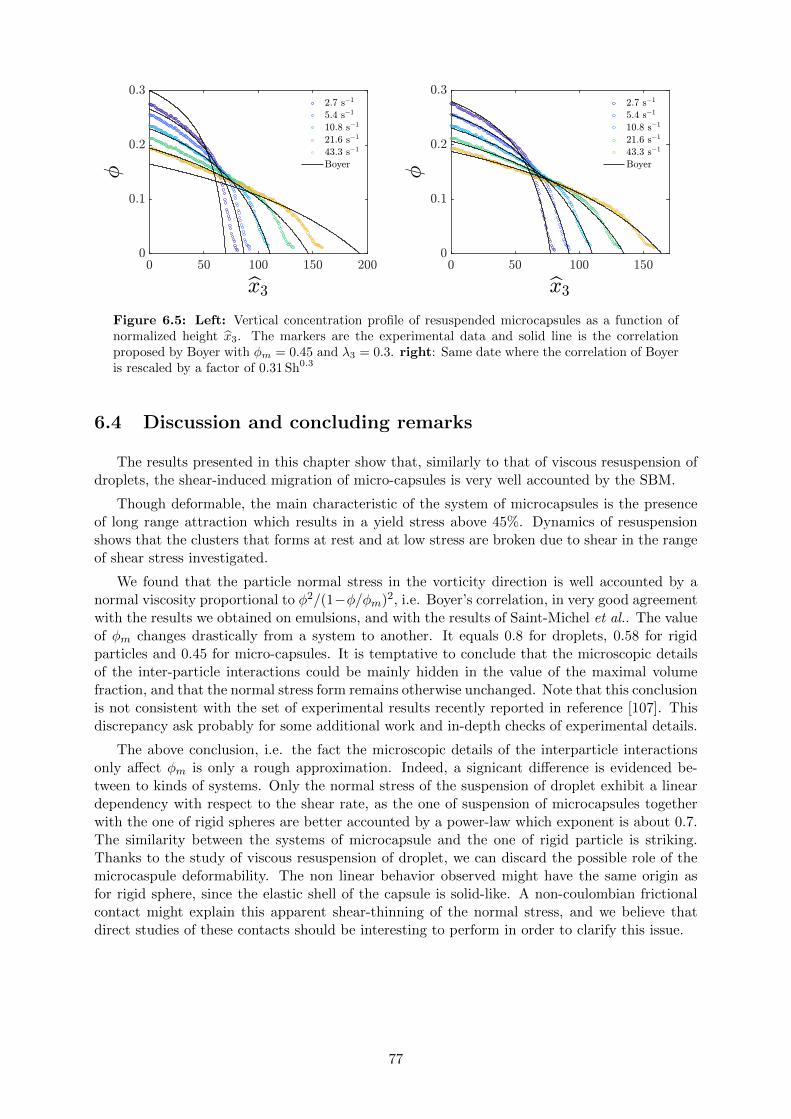
Figure 6.5: Left: Vertical concentration profile of resuspended microcapsules as a function ofnormalized height x3. The markers are the experimental data and solid line is the correlationproposed by Boyer with φm = 0.45 and λ3 = 0.3. right: Same date where the correlation of Boyeris rescaled by a factor of 0.31 Sh0.3
6.4 Discussion and concluding remarks
The results presented in this chapter show that, similarly to that of viscous resuspension ofdroplets, the shear-induced migration of micro-capsules is very well accounted by the SBM.
Though deformable, the main characteristic of the system of microcapsules is the presenceof long range attraction which results in a yield stress above 45%. Dynamics of resuspensionshows that the clusters that forms at rest and at low stress are broken due to shear in the rangeof shear stress investigated.
We found that the particle normal stress in the vorticity direction is well accounted by anormal viscosity proportional to φ2/(1−φ/φm)2, i.e. Boyer’s correlation, in very good agreementwith the results we obtained on emulsions, and with the results of Saint-Michel et al.. The valueof φm changes drastically from a system to another. It equals 0.8 for droplets, 0.58 for rigidparticles and 0.45 for micro-capsules. It is temptative to conclude that the microscopic detailsof the inter-particle interactions could be mainly hidden in the value of the maximal volumefraction, and that the normal stress form remains otherwise unchanged. Note that this conclusionis not consistent with the set of experimental results recently reported in reference [107]. Thisdiscrepancy ask probably for some additional work and in-depth checks of experimental details.
The above conclusion, i.e. the fact the microscopic details of the interparticle interactionsonly affect φm is only a rough approximation. Indeed, a signicant difference is evidenced be-tween to kinds of systems. Only the normal stress of the suspension of droplet exhibit a lineardependency with respect to the shear rate, as the one of suspension of microcapsules togetherwith the one of rigid spheres are better accounted by a power-law which exponent is about 0.7.The similarity between the systems of microcapsule and the one of rigid particle is striking.Thanks to the study of viscous resuspension of droplet, we can discard the possible role of themicrocaspule deformability. The non linear behavior observed might have the same origin asfor rigid sphere, since the elastic shell of the capsule is solid-like. A non-coulombian frictionalcontact might explain this apparent shear-thinning of the normal stress, and we believe thatdirect studies of these contacts should be interesting to perform in order to clarify this issue.
77
Summary
⇒ Shear-induced migration of deformable attractive microcapsules was investigated inthe framework of Suspension Balance Model (SBM).⇒ Particle normal stress exhibits a small shear-thinning, which can be scaled by a powerlaw with an exponent 0.7 as for rigid particles.⇒ Long-range attractive interparticle interaction apparently does not play a role in shear-induced migration and frictional contacts may be the origin of non-linearity of particlenormal stress.
78
Chapter 7
Conclusion and Perspectives
This thesis is mainly dedicated to experimental study of the collective behavior of deformableparticles in a dense suspension under shear. Non-Brownian droplets and microcapsules were usedas deformable particles. The thesis consists of three main axes: 1. High throughput productionand mechanical characterization of microcapsules, 2. Shear-induced migration of droplets andmicrocapsules in viscous resuspension by measuring the particle normal stress, 3. Steady stateand transient rheology of dense microcapsule suspensions.
We developed a method to produce monodisperse microcapsule suspensions in large quan-tities with tunable size and shell elasticity. The microcapsules were produced by a membraneemulsification system and their shell elasticity were measured in a microfluidic extensional flow.The shell of the microcapsules was assembled at the water-oil interface by complexation of poly-electrolytes or cross-linking of proteins providing two different kinetic processes. The methodhas two important characteristics: first, a high production rate up to 2 ml/min and a fullyautomatized measurement of shell elasticity which is capable of treating 1000 microcapsules inone hour, second, the capacity of coupling the production and characterization steps to developan in-line procedure in order to tune the shell elasticity and studying different kinetics of shellformation. We concluded that the production of the droplets containing chemicals and micro-capsule shell formation have to be split into two steps when shell growth is limited by diffusion(e.g. complexation of polyelectrolytes, CH/PFacid). If shell growth is limited by the quantityof reactants encapsulated in the droplet, the variations of elastic properties are directly relatedto size variations (e.g. cross-linking of proteins, BSA/TC).
Shear-induced migration of droplets and microcapsules was investigated in viscous resus-pension which simply consists of shearing a settled suspension in a Taylor-Couette geometry.In such flow, the migration is related to collective effects while other migration mechanismslike wall effect and shear rate gradient are discarded. It allows a precise determination of theparticle normal stress, since the volume fraction gradient which appears under shear directlybalances buoyancy. Though very simple in principle, this experimental approach needed to beconducted with great care. First, the physical properties of the system should be chosen in anarrow range in order to be able to neglect inertial effects, secondary currents, but also to limitviscous dissipation which tend to increase the temperature, and to limit the duration of the ex-periments. Second, and when applied to soft systems such as emulsions or capsules, additionalrequirements were to be taken into account. Not only the system needed to be index matchedin order to determine directly the local volume fraction, but also to prevent early coalescenceof the particles. The results were consistent both in transient and steady state and with theSuspension Balance Model (SMB) which was originally proposed for rigid particles. We foundthat the particle normal stress is linear with shear rate for droplets, but microcapsules showeda non-linearity with a power law equal to 0.7, exactly as what was recently reported for rigidparticles [107, 106]. These results lead to several conclusions. First, up to Ca 0.4, particle de-formability does not play any significant role since the particle normal stress is perfectly linear
79
with the shear rate for droplets. To our point of view, it would be very difficult to increase Cafurther as coalescence or droplet break up would then occur. Second, the same scaling of theparticle normal stress found for droplets, microcapsules and rigid particles with φ2/(1−φ/φm)2
suggests that the exact nature of the short range interparticle interactions do not have a majorrole in shear-induced migration. The SBM, together with Boyer’s correlation for the normalstress, appear to be a very robust framework. Looking into more details, the differences con-cerning the particle normal stress between those systems are twofolds. On the one hand, theyall exhibit a different maximal volume fraction φm. This was already the conclusions of somesimulations on rigid particles where the friction coefficient was varied [108]. This concept mightthus be pushed further: the details of interparticle interaction mainly influence the value ofφm. On the other hand, this conclusion is only a rough approximation since both microcapsulesand rigid particles exhibit a small but non-negligible shear thinning behavior. The similaritybetween those systems might come from non-Coulombian friction between the particles.
We have also studied the rheology of a suspension of non-Brownian microcapsules. Similarlyto shear-induced migration, we did not observe any influence of particle deformability by varyingthe shell elasticity. However, we realized that this is likely due to the fact that the systeminvestigated exhibit strong long-range attraction between particles, which clearly dominate therheological properties. The length scale of these interactions is strikingly huge, a few hundredsof nanometers, and is an originality of the system studied. The physical origin of this attractionremains an open issue, but we can reasonably speculate, in light of the literature and of thespectacular response of the capsules to any electric field, that the polyelectrolyte present in thecapsule was able to generate a strong dipolar moment. Such attraction has for consequencethe emergence of a yield stress at a volume fraction as low of 0.25, a concentration where anysuspension of non-interacting particles would very easily flow. There was no evidence of shearbanding, which is probably due to the fact that the particles were relatively confined in theplane-plane geometry. The rheological response of this system can be depicted into two mainregimes. An ”attraction dominated” regime at low stress is found, where the magnitude ofthe interparticle interaction dominates the viscous stress, and where big clusters of capsulespercolate. The second regime is the shear-induced rupture of the aggregates for which we havean almost Newtonian behavior and where attraction does not play a significant role on theviscosity of the suspension.
In the thesis, we answered many questions, but several others remain unanswered. Addi-tionally, it also opens numerous perspectives. A few are listed below.
1. We focused on viscous resuspension in the vorticity direction, and thus determined Σp,33.It would be interesting to investigate with a similar approach viscous resuspension in theshear direction. This could be done thanks to an annular Couette geometry, as in thepioneer work of Leighton and Acrivos. However, the experimental difficulty would thenbe to determine the volume fraction gradient as accurately as in the Couette cell wheredirect observation is easier. A possible alternative approach would be to use a shear cellmounted on a confocal microscope.
2. We found that shear-induced migration of deformable particles in a simple flow can beexplained in the framework of Suspension Balance Model (SBM) without taking cautionof deformability effects. However, other mechanisms for migration exist for deformableparticle, such as migration due to the vicinity of a wall in a simple shear, and migrationdue to shear rate gradients, such as in Poiseuille flow. This rises a question: In a flowof dense deformable suspensions where shear rate gradient is present, do the collectiveeffects dominate yet the effects of the other mechanism ? This will probably depend onthe volume fraction. It would be interesting to study droplet migration in a Poiseuille flowfor example.
3. In viscous resuspension we could measure the concentration profile of a polydisperse sus-
80
pension of droplets. We found that shear induced-migration of such suspension is in agree-ment with SBM predictions in steady state. However we did not have access to spatialsize distribution of particles induced by the flow. This rise another question: A suspensionwith a polydisperse size distribution does show a particle-size structuration under shear? An extension of the experimental approach used in this thesis would be interesting todevelop in that regard. Adding a dye which preferentially goes at the interface betweenthe tho phase and with a different wavelength would allow to combine measurement of thevolume fraction together with the amount of interface, and thus to a mean particle size.Other experimental approaches could also possible, using high resolution and tomographyor confocal imaging.
4. The long-range interaction we evidence for the micro-capsule system clearly asks for morein-depth studies as we were able to observe it directly only qualitatively. Direct forcemeasurements would be interesting and one could reuse the various approach used inbiophysics to measure forces : suction with a pipette, optical tweezers ...
5. We were able to characterize the strength of the interaction using rheology (yield stressVS volume fraction, dynamics of the viscous resuspension ...). We limit ourselves to onesystem, but observed that the interaction can be controlled rather simply by varying thedielectric properties of the suspending fluid. It would therefore be interesting to investigatethe rheology of these systems, where the strength of the long-range interaction could bevaried. Since some shear-banding and slippage at the wall might happen for attractivesystems, it would be important to couple rheometry with some velocimetry techniques, inorder to verify these issues.
6. The effect of an electric field on the microcapsules made with a polyelectrolyte are spectac-ular. We observed some alignments, some odd flow patterns, and huge electric mobilities.These effects were out of the scope of the thesis but are certainly a rich subject of inves-tigations that might deserve some attention.
81
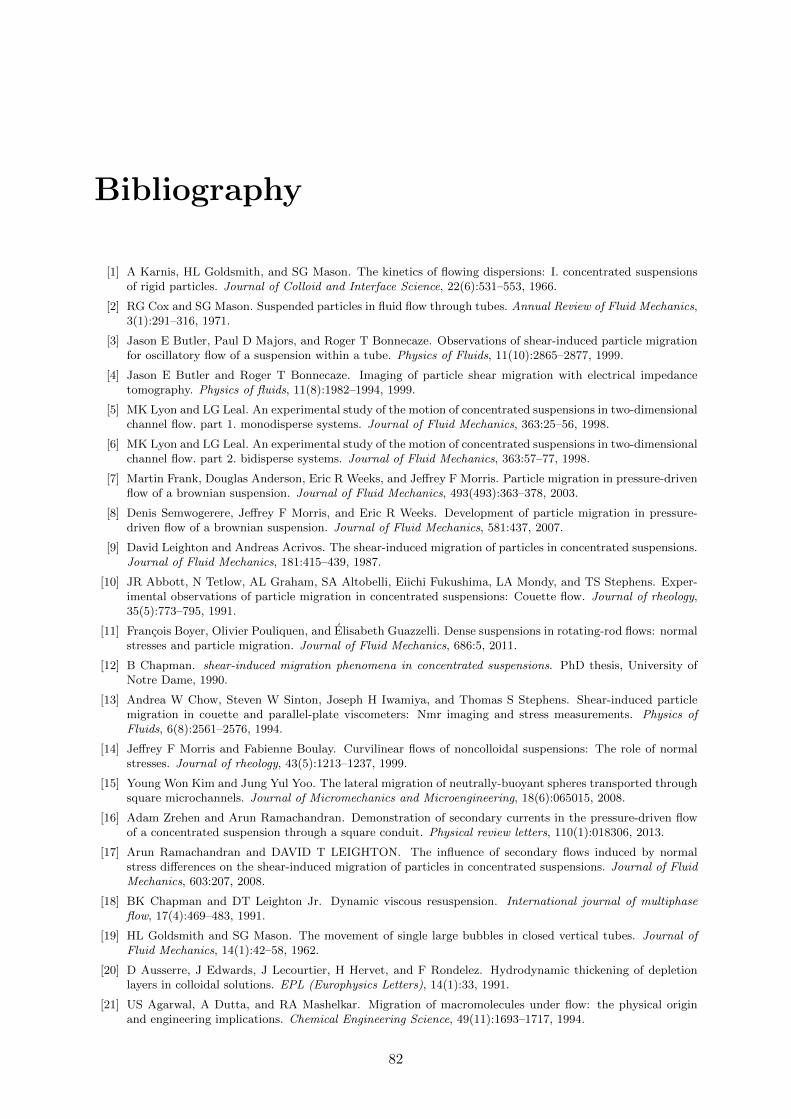
Bibliography
[1] A Karnis, HL Goldsmith, and SG Mason. The kinetics of flowing dispersions: I. concentrated suspensionsof rigid particles. Journal of Colloid and Interface Science, 22(6):531–553, 1966.
[2] RG Cox and SG Mason. Suspended particles in fluid flow through tubes. Annual Review of Fluid Mechanics,3(1):291–316, 1971.
[3] Jason E Butler, Paul D Majors, and Roger T Bonnecaze. Observations of shear-induced particle migrationfor oscillatory flow of a suspension within a tube. Physics of Fluids, 11(10):2865–2877, 1999.
[4] Jason E Butler and Roger T Bonnecaze. Imaging of particle shear migration with electrical impedancetomography. Physics of fluids, 11(8):1982–1994, 1999.
[5] MK Lyon and LG Leal. An experimental study of the motion of concentrated suspensions in two-dimensionalchannel flow. part 1. monodisperse systems. Journal of Fluid Mechanics, 363:25–56, 1998.
[6] MK Lyon and LG Leal. An experimental study of the motion of concentrated suspensions in two-dimensionalchannel flow. part 2. bidisperse systems. Journal of Fluid Mechanics, 363:57–77, 1998.
[7] Martin Frank, Douglas Anderson, Eric R Weeks, and Jeffrey F Morris. Particle migration in pressure-drivenflow of a brownian suspension. Journal of Fluid Mechanics, 493(493):363–378, 2003.
[8] Denis Semwogerere, Jeffrey F Morris, and Eric R Weeks. Development of particle migration in pressure-driven flow of a brownian suspension. Journal of Fluid Mechanics, 581:437, 2007.
[9] David Leighton and Andreas Acrivos. The shear-induced migration of particles in concentrated suspensions.Journal of Fluid Mechanics, 181:415–439, 1987.
[10] JR Abbott, N Tetlow, AL Graham, SA Altobelli, Eiichi Fukushima, LA Mondy, and TS Stephens. Exper-imental observations of particle migration in concentrated suspensions: Couette flow. Journal of rheology,35(5):773–795, 1991.
[11] Francois Boyer, Olivier Pouliquen, and Elisabeth Guazzelli. Dense suspensions in rotating-rod flows: normalstresses and particle migration. Journal of Fluid Mechanics, 686:5, 2011.
[12] B Chapman. shear-induced migration phenomena in concentrated suspensions. PhD thesis, University ofNotre Dame, 1990.
[13] Andrea W Chow, Steven W Sinton, Joseph H Iwamiya, and Thomas S Stephens. Shear-induced particlemigration in couette and parallel-plate viscometers: Nmr imaging and stress measurements. Physics ofFluids, 6(8):2561–2576, 1994.
[14] Jeffrey F Morris and Fabienne Boulay. Curvilinear flows of noncolloidal suspensions: The role of normalstresses. Journal of rheology, 43(5):1213–1237, 1999.
[15] Young Won Kim and Jung Yul Yoo. The lateral migration of neutrally-buoyant spheres transported throughsquare microchannels. Journal of Micromechanics and Microengineering, 18(6):065015, 2008.
[16] Adam Zrehen and Arun Ramachandran. Demonstration of secondary currents in the pressure-driven flowof a concentrated suspension through a square conduit. Physical review letters, 110(1):018306, 2013.
[17] Arun Ramachandran and DAVID T LEIGHTON. The influence of secondary flows induced by normalstress differences on the shear-induced migration of particles in concentrated suspensions. Journal of FluidMechanics, 603:207, 2008.
[18] BK Chapman and DT Leighton Jr. Dynamic viscous resuspension. International journal of multiphaseflow, 17(4):469–483, 1991.
[19] HL Goldsmith and SG Mason. The movement of single large bubbles in closed vertical tubes. Journal ofFluid Mechanics, 14(1):42–58, 1962.
[20] D Ausserre, J Edwards, J Lecourtier, H Hervet, and F Rondelez. Hydrodynamic thickening of depletionlayers in colloidal solutions. EPL (Europhysics Letters), 14(1):33, 1991.
[21] US Agarwal, A Dutta, and RA Mashelkar. Migration of macromolecules under flow: the physical originand engineering implications. Chemical Engineering Science, 49(11):1693–1717, 1994.
82
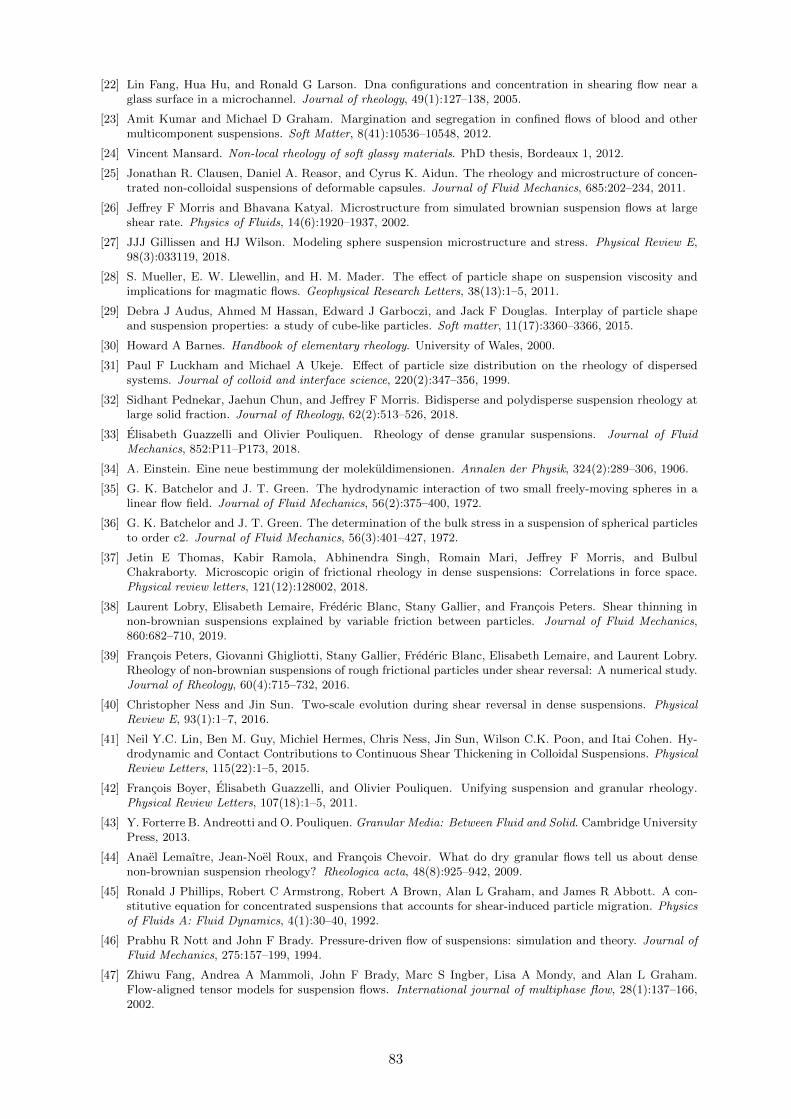
[22] Lin Fang, Hua Hu, and Ronald G Larson. Dna configurations and concentration in shearing flow near aglass surface in a microchannel. Journal of rheology, 49(1):127–138, 2005.
[23] Amit Kumar and Michael D Graham. Margination and segregation in confined flows of blood and othermulticomponent suspensions. Soft Matter, 8(41):10536–10548, 2012.
[24] Vincent Mansard. Non-local rheology of soft glassy materials. PhD thesis, Bordeaux 1, 2012.
[25] Jonathan R. Clausen, Daniel A. Reasor, and Cyrus K. Aidun. The rheology and microstructure of concen-trated non-colloidal suspensions of deformable capsules. Journal of Fluid Mechanics, 685:202–234, 2011.
[26] Jeffrey F Morris and Bhavana Katyal. Microstructure from simulated brownian suspension flows at largeshear rate. Physics of Fluids, 14(6):1920–1937, 2002.
[27] JJJ Gillissen and HJ Wilson. Modeling sphere suspension microstructure and stress. Physical Review E,98(3):033119, 2018.
[28] S. Mueller, E. W. Llewellin, and H. M. Mader. The effect of particle shape on suspension viscosity andimplications for magmatic flows. Geophysical Research Letters, 38(13):1–5, 2011.
[29] Debra J Audus, Ahmed M Hassan, Edward J Garboczi, and Jack F Douglas. Interplay of particle shapeand suspension properties: a study of cube-like particles. Soft matter, 11(17):3360–3366, 2015.
[30] Howard A Barnes. Handbook of elementary rheology. University of Wales, 2000.
[31] Paul F Luckham and Michael A Ukeje. Effect of particle size distribution on the rheology of dispersedsystems. Journal of colloid and interface science, 220(2):347–356, 1999.
[32] Sidhant Pednekar, Jaehun Chun, and Jeffrey F Morris. Bidisperse and polydisperse suspension rheology atlarge solid fraction. Journal of Rheology, 62(2):513–526, 2018.
[33] Elisabeth Guazzelli and Olivier Pouliquen. Rheology of dense granular suspensions. Journal of FluidMechanics, 852:P11–P173, 2018.
[34] A. Einstein. Eine neue bestimmung der molekuldimensionen. Annalen der Physik, 324(2):289–306, 1906.
[35] G. K. Batchelor and J. T. Green. The hydrodynamic interaction of two small freely-moving spheres in alinear flow field. Journal of Fluid Mechanics, 56(2):375–400, 1972.
[36] G. K. Batchelor and J. T. Green. The determination of the bulk stress in a suspension of spherical particlesto order c2. Journal of Fluid Mechanics, 56(3):401–427, 1972.
[37] Jetin E Thomas, Kabir Ramola, Abhinendra Singh, Romain Mari, Jeffrey F Morris, and BulbulChakraborty. Microscopic origin of frictional rheology in dense suspensions: Correlations in force space.Physical review letters, 121(12):128002, 2018.
[38] Laurent Lobry, Elisabeth Lemaire, Frederic Blanc, Stany Gallier, and Francois Peters. Shear thinning innon-brownian suspensions explained by variable friction between particles. Journal of Fluid Mechanics,860:682–710, 2019.
[39] Francois Peters, Giovanni Ghigliotti, Stany Gallier, Frederic Blanc, Elisabeth Lemaire, and Laurent Lobry.Rheology of non-brownian suspensions of rough frictional particles under shear reversal: A numerical study.Journal of Rheology, 60(4):715–732, 2016.
[40] Christopher Ness and Jin Sun. Two-scale evolution during shear reversal in dense suspensions. PhysicalReview E, 93(1):1–7, 2016.
[41] Neil Y.C. Lin, Ben M. Guy, Michiel Hermes, Chris Ness, Jin Sun, Wilson C.K. Poon, and Itai Cohen. Hy-drodynamic and Contact Contributions to Continuous Shear Thickening in Colloidal Suspensions. PhysicalReview Letters, 115(22):1–5, 2015.
[42] Francois Boyer, Elisabeth Guazzelli, and Olivier Pouliquen. Unifying suspension and granular rheology.Physical Review Letters, 107(18):1–5, 2011.
[43] Y. Forterre B. Andreotti and O. Pouliquen. Granular Media: Between Fluid and Solid. Cambridge UniversityPress, 2013.
[44] Anael Lemaıtre, Jean-Noel Roux, and Francois Chevoir. What do dry granular flows tell us about densenon-brownian suspension rheology? Rheologica acta, 48(8):925–942, 2009.
[45] Ronald J Phillips, Robert C Armstrong, Robert A Brown, Alan L Graham, and James R Abbott. A con-stitutive equation for concentrated suspensions that accounts for shear-induced particle migration. Physicsof Fluids A: Fluid Dynamics, 4(1):30–40, 1992.
[46] Prabhu R Nott and John F Brady. Pressure-driven flow of suspensions: simulation and theory. Journal ofFluid Mechanics, 275:157–199, 1994.
[47] Zhiwu Fang, Andrea A Mammoli, John F Brady, Marc S Ingber, Lisa A Mondy, and Alan L Graham.Flow-aligned tensor models for suspension flows. International journal of multiphase flow, 28(1):137–166,2002.
83
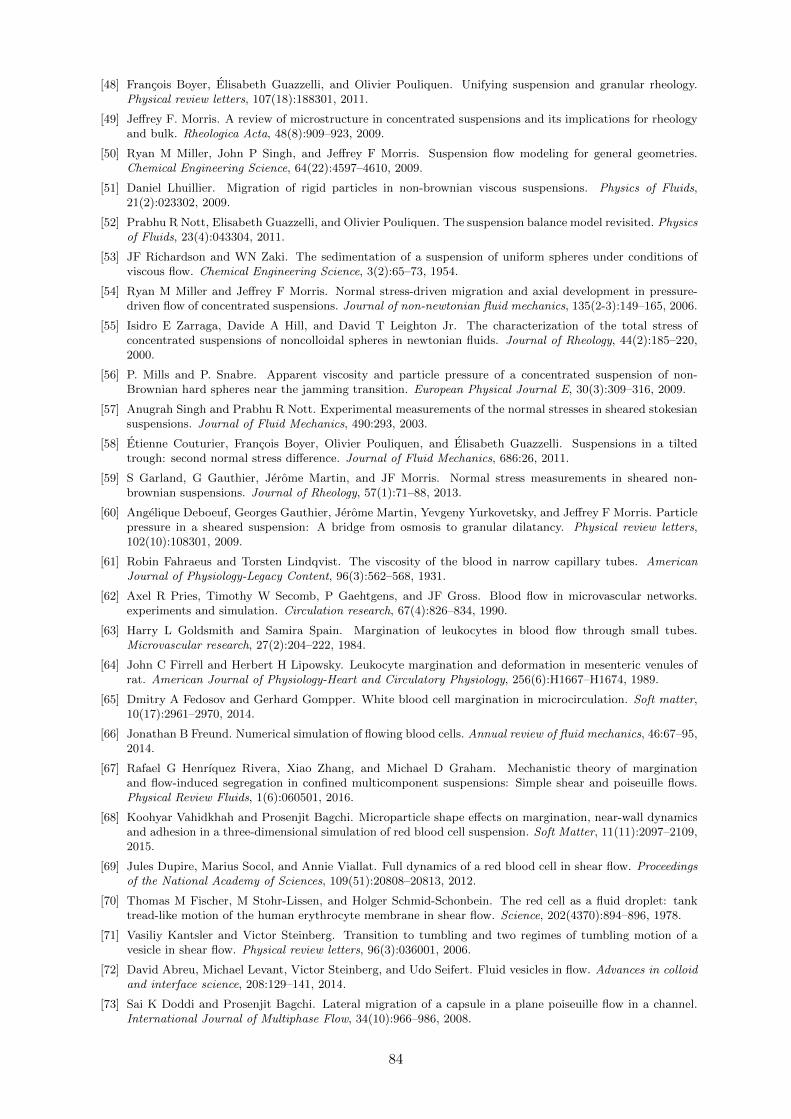
[48] Francois Boyer, Elisabeth Guazzelli, and Olivier Pouliquen. Unifying suspension and granular rheology.Physical review letters, 107(18):188301, 2011.
[49] Jeffrey F. Morris. A review of microstructure in concentrated suspensions and its implications for rheologyand bulk. Rheologica Acta, 48(8):909–923, 2009.
[50] Ryan M Miller, John P Singh, and Jeffrey F Morris. Suspension flow modeling for general geometries.Chemical Engineering Science, 64(22):4597–4610, 2009.
[51] Daniel Lhuillier. Migration of rigid particles in non-brownian viscous suspensions. Physics of Fluids,21(2):023302, 2009.
[52] Prabhu R Nott, Elisabeth Guazzelli, and Olivier Pouliquen. The suspension balance model revisited. Physicsof Fluids, 23(4):043304, 2011.
[53] JF Richardson and WN Zaki. The sedimentation of a suspension of uniform spheres under conditions ofviscous flow. Chemical Engineering Science, 3(2):65–73, 1954.
[54] Ryan M Miller and Jeffrey F Morris. Normal stress-driven migration and axial development in pressure-driven flow of concentrated suspensions. Journal of non-newtonian fluid mechanics, 135(2-3):149–165, 2006.
[55] Isidro E Zarraga, Davide A Hill, and David T Leighton Jr. The characterization of the total stress ofconcentrated suspensions of noncolloidal spheres in newtonian fluids. Journal of Rheology, 44(2):185–220,2000.
[56] P. Mills and P. Snabre. Apparent viscosity and particle pressure of a concentrated suspension of non-Brownian hard spheres near the jamming transition. European Physical Journal E, 30(3):309–316, 2009.
[57] Anugrah Singh and Prabhu R Nott. Experimental measurements of the normal stresses in sheared stokesiansuspensions. Journal of Fluid Mechanics, 490:293, 2003.
[58] Etienne Couturier, Francois Boyer, Olivier Pouliquen, and Elisabeth Guazzelli. Suspensions in a tiltedtrough: second normal stress difference. Journal of Fluid Mechanics, 686:26, 2011.
[59] S Garland, G Gauthier, Jerome Martin, and JF Morris. Normal stress measurements in sheared non-brownian suspensions. Journal of Rheology, 57(1):71–88, 2013.
[60] Angelique Deboeuf, Georges Gauthier, Jerome Martin, Yevgeny Yurkovetsky, and Jeffrey F Morris. Particlepressure in a sheared suspension: A bridge from osmosis to granular dilatancy. Physical review letters,102(10):108301, 2009.
[61] Robin Fahraeus and Torsten Lindqvist. The viscosity of the blood in narrow capillary tubes. AmericanJournal of Physiology-Legacy Content, 96(3):562–568, 1931.
[62] Axel R Pries, Timothy W Secomb, P Gaehtgens, and JF Gross. Blood flow in microvascular networks.experiments and simulation. Circulation research, 67(4):826–834, 1990.
[63] Harry L Goldsmith and Samira Spain. Margination of leukocytes in blood flow through small tubes.Microvascular research, 27(2):204–222, 1984.
[64] John C Firrell and Herbert H Lipowsky. Leukocyte margination and deformation in mesenteric venules ofrat. American Journal of Physiology-Heart and Circulatory Physiology, 256(6):H1667–H1674, 1989.
[65] Dmitry A Fedosov and Gerhard Gompper. White blood cell margination in microcirculation. Soft matter,10(17):2961–2970, 2014.
[66] Jonathan B Freund. Numerical simulation of flowing blood cells. Annual review of fluid mechanics, 46:67–95,2014.
[67] Rafael G Henrıquez Rivera, Xiao Zhang, and Michael D Graham. Mechanistic theory of marginationand flow-induced segregation in confined multicomponent suspensions: Simple shear and poiseuille flows.Physical Review Fluids, 1(6):060501, 2016.
[68] Koohyar Vahidkhah and Prosenjit Bagchi. Microparticle shape effects on margination, near-wall dynamicsand adhesion in a three-dimensional simulation of red blood cell suspension. Soft Matter, 11(11):2097–2109,2015.
[69] Jules Dupire, Marius Socol, and Annie Viallat. Full dynamics of a red blood cell in shear flow. Proceedingsof the National Academy of Sciences, 109(51):20808–20813, 2012.
[70] Thomas M Fischer, M Stohr-Lissen, and Holger Schmid-Schonbein. The red cell as a fluid droplet: tanktread-like motion of the human erythrocyte membrane in shear flow. Science, 202(4370):894–896, 1978.
[71] Vasiliy Kantsler and Victor Steinberg. Transition to tumbling and two regimes of tumbling motion of avesicle in shear flow. Physical review letters, 96(3):036001, 2006.
[72] David Abreu, Michael Levant, Victor Steinberg, and Udo Seifert. Fluid vesicles in flow. Advances in colloidand interface science, 208:129–141, 2014.
[73] Sai K Doddi and Prosenjit Bagchi. Lateral migration of a capsule in a plane poiseuille flow in a channel.International Journal of Multiphase Flow, 34(10):966–986, 2008.
84
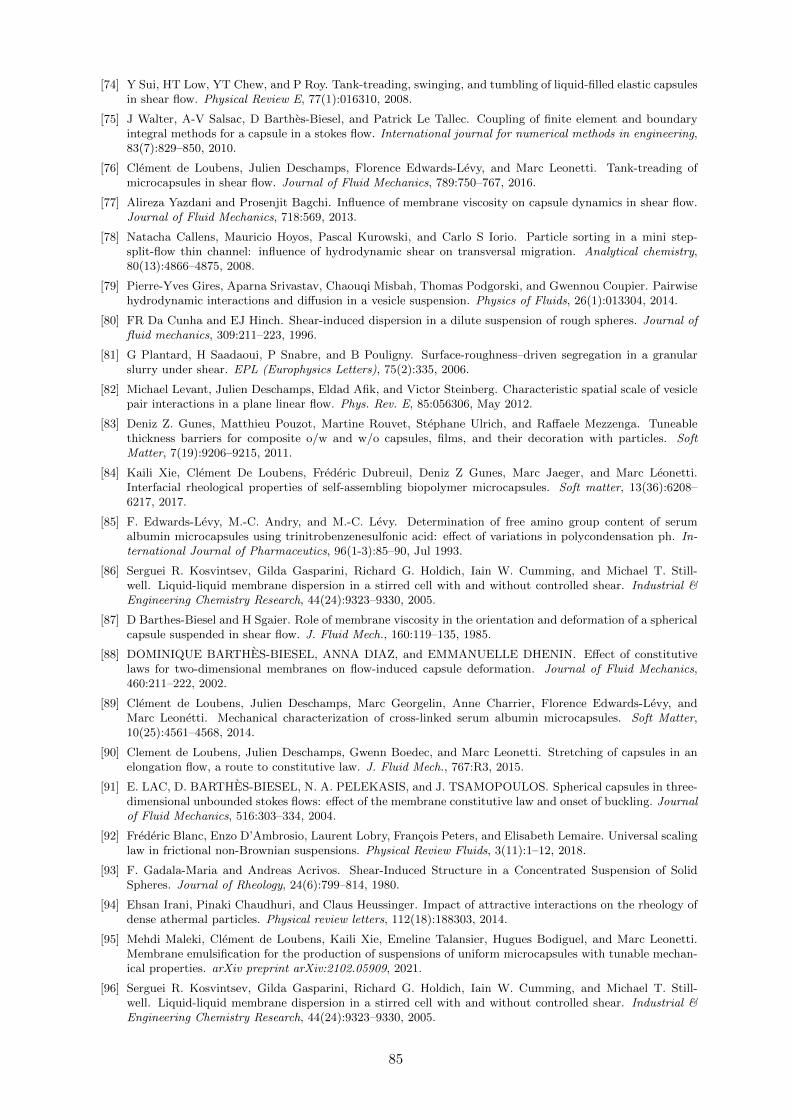
[74] Y Sui, HT Low, YT Chew, and P Roy. Tank-treading, swinging, and tumbling of liquid-filled elastic capsulesin shear flow. Physical Review E, 77(1):016310, 2008.
[75] J Walter, A-V Salsac, D Barthes-Biesel, and Patrick Le Tallec. Coupling of finite element and boundaryintegral methods for a capsule in a stokes flow. International journal for numerical methods in engineering,83(7):829–850, 2010.
[76] Clement de Loubens, Julien Deschamps, Florence Edwards-Levy, and Marc Leonetti. Tank-treading ofmicrocapsules in shear flow. Journal of Fluid Mechanics, 789:750–767, 2016.
[77] Alireza Yazdani and Prosenjit Bagchi. Influence of membrane viscosity on capsule dynamics in shear flow.Journal of Fluid Mechanics, 718:569, 2013.
[78] Natacha Callens, Mauricio Hoyos, Pascal Kurowski, and Carlo S Iorio. Particle sorting in a mini step-split-flow thin channel: influence of hydrodynamic shear on transversal migration. Analytical chemistry,80(13):4866–4875, 2008.
[79] Pierre-Yves Gires, Aparna Srivastav, Chaouqi Misbah, Thomas Podgorski, and Gwennou Coupier. Pairwisehydrodynamic interactions and diffusion in a vesicle suspension. Physics of Fluids, 26(1):013304, 2014.
[80] FR Da Cunha and EJ Hinch. Shear-induced dispersion in a dilute suspension of rough spheres. Journal offluid mechanics, 309:211–223, 1996.
[81] G Plantard, H Saadaoui, P Snabre, and B Pouligny. Surface-roughness–driven segregation in a granularslurry under shear. EPL (Europhysics Letters), 75(2):335, 2006.
[82] Michael Levant, Julien Deschamps, Eldad Afik, and Victor Steinberg. Characteristic spatial scale of vesiclepair interactions in a plane linear flow. Phys. Rev. E, 85:056306, May 2012.
[83] Deniz Z. Gunes, Matthieu Pouzot, Martine Rouvet, Stephane Ulrich, and Raffaele Mezzenga. Tuneablethickness barriers for composite o/w and w/o capsules, films, and their decoration with particles. SoftMatter, 7(19):9206–9215, 2011.
[84] Kaili Xie, Clement De Loubens, Frederic Dubreuil, Deniz Z Gunes, Marc Jaeger, and Marc Leonetti.Interfacial rheological properties of self-assembling biopolymer microcapsules. Soft matter, 13(36):6208–6217, 2017.
[85] F. Edwards-Levy, M.-C. Andry, and M.-C. Levy. Determination of free amino group content of serumalbumin microcapsules using trinitrobenzenesulfonic acid: effect of variations in polycondensation ph. In-ternational Journal of Pharmaceutics, 96(1-3):85–90, Jul 1993.
[86] Serguei R. Kosvintsev, Gilda Gasparini, Richard G. Holdich, Iain W. Cumming, and Michael T. Still-well. Liquid-liquid membrane dispersion in a stirred cell with and without controlled shear. Industrial &Engineering Chemistry Research, 44(24):9323–9330, 2005.
[87] D Barthes-Biesel and H Sgaier. Role of membrane viscosity in the orientation and deformation of a sphericalcapsule suspended in shear flow. J. Fluid Mech., 160:119–135, 1985.
[88] DOMINIQUE BARTHES-BIESEL, ANNA DIAZ, and EMMANUELLE DHENIN. Effect of constitutivelaws for two-dimensional membranes on flow-induced capsule deformation. Journal of Fluid Mechanics,460:211–222, 2002.
[89] Clement de Loubens, Julien Deschamps, Marc Georgelin, Anne Charrier, Florence Edwards-Levy, andMarc Leonetti. Mechanical characterization of cross-linked serum albumin microcapsules. Soft Matter,10(25):4561–4568, 2014.
[90] Clement de Loubens, Julien Deschamps, Gwenn Boedec, and Marc Leonetti. Stretching of capsules in anelongation flow, a route to constitutive law. J. Fluid Mech., 767:R3, 2015.
[91] E. LAC, D. BARTHES-BIESEL, N. A. PELEKASIS, and J. TSAMOPOULOS. Spherical capsules in three-dimensional unbounded stokes flows: effect of the membrane constitutive law and onset of buckling. Journalof Fluid Mechanics, 516:303–334, 2004.
[92] Frederic Blanc, Enzo D’Ambrosio, Laurent Lobry, Francois Peters, and Elisabeth Lemaire. Universal scalinglaw in frictional non-Brownian suspensions. Physical Review Fluids, 3(11):1–12, 2018.
[93] F. Gadala-Maria and Andreas Acrivos. Shear-Induced Structure in a Concentrated Suspension of SolidSpheres. Journal of Rheology, 24(6):799–814, 1980.
[94] Ehsan Irani, Pinaki Chaudhuri, and Claus Heussinger. Impact of attractive interactions on the rheology ofdense athermal particles. Physical review letters, 112(18):188303, 2014.
[95] Mehdi Maleki, Clement de Loubens, Kaili Xie, Emeline Talansier, Hugues Bodiguel, and Marc Leonetti.Membrane emulsification for the production of suspensions of uniform microcapsules with tunable mechan-ical properties. arXiv preprint arXiv:2102.05909, 2021.
[96] Serguei R. Kosvintsev, Gilda Gasparini, Richard G. Holdich, Iain W. Cumming, and Michael T. Still-well. Liquid-liquid membrane dispersion in a stirred cell with and without controlled shear. Industrial &Engineering Chemistry Research, 44(24):9323–9330, 2005.
85
[97] Roland G Winkler, Dmitry A Fedosov, and Gerhard Gompper. Dynamical and rheological properties ofsoft colloid suspensions. Current opinion in colloid & interface science, 19(6):594–610, 2014.
[98] Markus Gross, Timm Kruger, and Fathollah Varnik. Rheology of dense suspensions of elastic capsules:normal stresses, yield stress, jamming and confinement effects. Soft matter, 10(24):4360–4372, 2014.
[99] Shirley C Tsai and Kamel Zammouri. Role of interparticular van der waals force in rheology of concentratedsuspensions. Journal of Rheology, 32(7):737–750, 1988.
[100] Chen Shi, Bin Yan, Lei Xie, Ling Zhang, Jingyi Wang, Atsushi Takahara, and Hongbo Zeng. Long-rangehydrophilic attraction between water and polyelectrolyte surfaces in oil. Angewandte Chemie InternationalEdition, 55(48):15017–15021, 2016.
[101] Lei Xie, Chen Shi, Xin Cui, and Hongbo Zeng. Surface forces and interaction mechanisms of emulsion dropsand gas bubbles in complex fluids. Langmuir, 33(16):3911–3925, 2017.
[102] Lydiane Becu, Sebastien Manneville, and Annie Colin. Yielding and flow in adhesive and nonadhesiveconcentrated emulsions. Physical review letters, 96(13):138302, 2006.
[103] Adolfo Vazquez-Quesada, Roger I. Tanner, and Marco Ellero. Shear thinning of noncolloidal suspensions.Phys. Rev. Lett., 117:108001, Aug 2016.
[104] Andrew P. Shapiro and Ronald F. Probstein. Random packings of spheres and fluidity limits of monodisperseand bidisperse suspensions. Phys. Rev. Lett., 68:1422–1425, Mar 1992.
[105] Sumer M. Peker, Serife S. Helvacı, H. Banu Yener, Berrin Ikizler, and Alp Alparslan. Solid-liquid two phaseflow. pages 167–243. Elsevier, Amsterdam, 2008.
[106] Brice Saint-Michel, Sebastien Manneville, Steven Meeker, Guillaume Ovarlez, and Hugues Bodiguel. X-rayradiography of viscous resuspension. Physics of Fluids, 31(10), 2019.
[107] Enzo D’Ambrosio, Frederic Blanc, and Elisabeth Lemaire. Viscous resuspension of non-Brownian particles:Determination of the concentration profiles and particle normal stresses. Journal of Fluid Mechanics,911:1–25, 2021.
[108] William Chevremont, Bruno Chareyre, and Hugues Bodiguel. Quantitative study of the rheology of frictionalsuspensions: Influence of friction coefficient in a large range of viscous numbers. Physical Review Fluids,4(6):1–17, 2019.
86