relative deprivation and migration
TRANSCRIPT
Relative Deprivation and Migration in an AgriculturalSetting of Nepal
Prem BhandariThe Pennsylvania State University
Are individuals from a relatively more deprived household more likely to migrate forwork reasons compared to those from a relatively less deprived household? In thispaper, I have empirically tested the relative deprivation hypothesis of migration putforth by Oded Stark and his colleagues. I used data from 1465 farming households ina rural agricultural setting of Nepal. The data was collected from the westernChitwan Valley in 1996. With these data, I used a logistic regression analysistechnique to examine the influence of relative deprivation on migration. My findingssupport the hypothesis that individuals from households with relatively less access tocultivated land are more likely to migrate in search of work compared to those froma relatively well-off household with more land holdings. My findings can be useful inunderstanding the significance of relative deprivation in household migrationdecisions where access to cultivable land is declining due to land fragmentation as aresult of population growth and land division by inheritance.
KEY WORDS: relative deprivation, migration, farming, Chitwan Valley, Nepal.
INTRODUCTION
Are individuals from a relatively more deprived household more likelyto migrate compared to those from a relatively less deprived household?There are various theories as to why people migrate (Massey 1990; Masseyet al. 1993). However, in this study, I focused on the relative deprivationapproach put forth by Stark (1984, 1991), Stark and Bloom (1985), Stark and
Please address correspondence to Prem Bhandari, 307 Armsby Building, Department ofAgricultural Economics and Rural Sociology, The Pennsylvania State University, Pennsylvania16801, USA; e-mail: [email protected].
475Population and Environment, Vol. 25, No. 5, May 2004 � 2004 Human Sciences Press, Inc.
Taylor (1989, 1991), and Stark and Yitzhaki (1988), to explain why indi-viduals move in a particular agricultural setting in Nepal.
The relative deprivation theory of migration builds upon the neweconomics of the migration framework (Stark, 1991; Stark & Bloom, 1985).Proponents of the relative deprivation approach argue that individuals orhouseholds migrate not only to maximize absolute income, but also toimprove their position compared to other relevant reference groups (e.g.,Stark, 1984, 1991; Stark & Taylor, 1991). These proponents use the termrelative deprivation, which refers to lower incomes earned by individualscompared to those of their neighbors. However, in this study, I conceptu-alize relative deprivation that is related to limited access to cultivated land.I use this conceptualization because in an agricultural setting, access tocultivated land is one of the important sources of household income. Asthere is a close relationship between income and farm size, access to andownership of farmland are the important factors in determining rural pros-perity in Nepal (Karan & Ishii, 1996). A household is ranked into differentlevels of the socio-economic hierarchy based on ownership of cultivatedland and access to it. Therefore, I considered access to agricultural pro-duction resources, particularly the size of cultivated land, to be one of theimportant measures of relative deprivation for this study. I hypothesize thatindividuals migrate due to relative ‘land’ deprivation because of differentialaccess to cultivated land in an agricultural society.
Such a test of the relative deprivation hypothesis of migration isimportant in the Nepalese condition, where the economy is agriculturebased and migration is common. Until recently, about 80% of the eco-nomically active labor force was engaged in agriculture (DHS/N, 2002). Atthe same time, both internal and international migrations are commonphenomena in the country (Gurung, 1998; Karan & Ishii, 1996; Silwal,1995; Shrestha, 1990). The 1981 population census recorded that 8.6% ofthe native-born population migrated within the country’s boundaries. Thevolume of this migration increased to 9.6% in 1991. Better access to agri-culture, trade, and commerce were reported as the major reasons for such alarge internal migration. Specifically, Karan and Ishii (1996) reported pooragricultural land, low productivity, lack of alternative employment oppor-tunities, lack of market, and high population pressure on the land as some ofthe factors contributing to migration within Nepal. Before the 1950s, thevolume and direction of internal migration was toward the Eastern Hills.After the eradication of malaria and the initiation of rehabilitation programsin the Tarai Plains, the direction of the migration movement changed to-ward the Tarai region in the south. International migration is equallyimportant. About 2.7% of native-born individuals crossed the Nepalese
476
POPULATION AND ENVIRONMENT
border in 1981 in search of jobs. This figure increased to 3.6% in 1991. Themajority of international migration is directed toward India. In 1981, Indiareceived over 93% of the native-born international migrants from Nepal.However, migration particularly to East Asia and Arab countries is a recenttrend and is increasing over time. In 1991, the volume of Nepalese immi-grants to countries other than India increased to about 11%.
The Western Chitwan Valley, the focus of this study, is no exception tothis migration pattern. A survey conducted in 1996 indicated that over 80%of the households in this valley engaged in farming activities, but thatapproximately one-fourth (23.9%) of the farming households sent individ-uals away to find work. Considering that such a large number of migrantscome from agrarian households in the Western Chitwan Valley, the par-ticular interest in this study was to examine the various factors that haveaffected the migration of individuals in this setting. Particularly, I attemptedto answer the question of whether the migration of individuals is associatedwith relative ‘land’ deprivation because of limited access to cultivated land.Building upon the theory of relative deprivation, while adjusting for theeffects of other independent factors, I tested the hypothesis that individualsfrom relatively ‘land’ deprived households are more likely to migratecompared to individuals from relatively less ‘land’ deprived households.
THEORETICAL REVIEWS AND EMPIRICAL EVIDENCE
Massey (1990) and Massey et al. (1993) provided an excellent reviewof theories explaining the initiation of migration in developed as well as indeveloping countries. These theories have been grouped according to threedifferent levels: macro-, meso-, and micro-level (Faist, 1997). At the macro-level are neoclassical macro-economics, the dual labor market theory, theworld systems theory, the institutional theory, and the migration systemstheory. The neoclassical macro-economic theory, perhaps the oldest andmost widely known theory of migration, suggests that people migrate fromlow-wage to high-wage (or from capital-poor to capital-rich) countries inorder to maximize income. The wage differential between sending andreceiving countries is the important factor in initiating migration. In the duallabor market theory, immigration is linked to structural requirements ofmodern industrial economics. The world systems theory sees migration orimmigration as a consequence of globalization and market penetrationacross boundaries. In the process of the globalization of the market econ-omy of recent decades, capitalist (core) countries penetrate the developingor non-capitalist (periphery) countries in search of land, raw material, labor,
477
PREM BHANDARI
and new consumer markets; thus the economic organization of theperiphery gets disrupted and transformed. This encourages (international)migration of individuals. The institutional theory deals with private insti-tutions and voluntary organizations that are established to help promotemigration once it is initiated. Finally, migration systems theory deals withthe linkages between core receiving regions and a set of sending countries.
Migrant networks theory, cumulative causation, and gender theoriesare categorized at the meso-level. The network theory focuses on theimportance of interpersonal ties or migrant networks that help initiate orperpetuate migration. These networks facilitate the migration of individualsby lowering the associated costs (social, psychic and economic) and therisks of movement. The cumulative causation theory highlights the pro-motion of chain migration and describes the role of relative deprivation inperpetuating migration. The gender theory provides insights on powerstructure and gender discrimination in the migration process.
The micro-level explanations of migration processes include theneoclassical micro-economics, new economics of migration, and thevalue expectancy framework. These theories or frameworks deal withthe migration process at the individual and household level. Proponentsof the neoclassical micro-economics approach argue that individualsmake rational decisions to maximize their individual utility (specifically tomaximize expected income). In this framework, individuals are consid-ered rational actors who decide to migrate based on cost–benefit calcu-lations. The movers expect a positive net return from their migration.However, the advocates of the new economics of migration theory crit-icize the micro-economics theory on the grounds that migration decisionsare not made individually. They believe that migration decisions are notmade solely by individual actors but by larger units of families orhouseholds. These decisions are driven to maximize income as well as tominimize risks (Massey, 1990; Massey et al., 1993). The risks might berelated to crop insurance, unemployment, market opportunities, capitalmarkets, and so on. In Grindle’s (1988) view, such migration is a keycomponent of household economic strategy. On the other hand, thevalue expectancy framework deals with individual motivations and goals(De Jong, 2000). De Jong believed that expectations and valued goalsdefine motivations for migration. Households decide to send individualsor move themselves with the expectation of attaining valued goals. In hisview, migration intentions are the primary determinants of actual migra-tion, whereas expectations of attaining valued goals in an alternativelocation vs. the home community are the major determinants of migrationintentions.
478
POPULATION AND ENVIRONMENT
Theory of Relative Deprivation and Migration
Crosby, in 1982, provided a detailed description of the theory of rel-ative deprivation, which in his view is based on common sense. In his book,Crosby indicated the existence of at least five different models pertaining torelative deprivation. Of these models, the one presented by Runciman in1966 is commonly known and used in migration studies (Stark, 1984). InRunciman’s words, an individual feels relatively deprived if (i) a person doesnot have X, (ii) he sees some other person or persons as having X, (iii) hewants X, and (iv) he sees it as feasible that he should have X. The relativityconcept is due to conditions (ii) and (iv) and a feeling of deprivation is dueto conditions (i) and (iii) (Crosby, 1982; Stark, 1984, 1991; Stark & Taylor,1991).
Building upon Runciman’s definition, the basic notion of the relativedeprivation theory in relation to migration is well explained by Stark (1984,1991) and Stark and Taylor (1991). In Stark’s (1984, 1991) view, relativedeprivation is a feeling that develops from social inequality. Stark and hisfollowers believe that a relatively deprived individual in his or her com-munity has an incentive to migrate. The individuals migrate not necessarilyto increase their household’s absolute income, but rather to improve thehousehold’s position with respect to a certain reference group. Stark and hisproponents believe that migration is observed when relative deprivationassociated with migration is greater than the relative deprivation in theabsence of migration. Regarding migration incentives, Stark and Yitzhaki(1988) argue that the richest individuals may have a weak incentive tomigrate but may not have strong incentive to migrate, while poor individ-uals have a both strong and weak incentive to migrate. But the incentive tomigrate is stronger for the poorest individuals compared to the richest.
Empirically, Stark and Taylor (1989, 1991) tested the relative depri-vation hypothesis using information from Mexico collected in 1983. Theyconsidered migrants as individuals crossing the international boundary tothe United States. Based on the observations of 423 individuals in 61 ruralhouseholds, they provided evidence to support the hypothesis that greaterhousehold relative deprivation in terms of income was associated with ahigher probability of a household member’s labor time allocation to Mex-ico–US migration. At the same time, they observed a significant negativecoefficient of the relative-deprivation-squared term, indicating that indi-viduals at the very bottom of the village income distribution were less likelyto migrate because they might be unable to afford migration. Although notanalyzed in terms of relative deprivation, Connell et al. (1976) also provideevidence from India that individuals from households with inadequate
479
PREM BHANDARI
access to income-generating land in a village were more likely to move.Ives and Messerli (1989) also reported that one of the reactions of thefarming population to a declining per capita land is to migrate.
In Landlessness and Migration in Nepal, Shrestha (1990) offered twostructural perspectives of migration in developing countries: social relationsof production and uneven geographical development. From the first per-spective, he argued that technological change (improvement) in agricultureleads to change in mode of production—from traditional to commercialproduction. Technology tends to favor those who control the means ofproduction other than labor. In such a situation, the economic viability ofthe dominating class of people is enhanced and that of the subordinate classis questioned giving rise to dominating class more control over resources.This situation compels the subordinate class to migrate (migratory choice)for survival as a result of land sale or indebtedness. In the second per-spective, Shrestha argued that uneven development of geographical areasalso leads to migration of people: from less developed to relatively moredeveloped areas, or toward areas where capital is concentrated. He pro-vides evidence of the migration of landless or near landless people from thehills to the Terai region of Nepal, which is considered the ‘‘granary’’ of thecountry. Particularly since the 1960s, massive migration has taken placefrom the hills and high hills in the north to the Terai region in the south ofNepal (Gurung, 1998; Shrestha, 1990). From the view of geographical(regional) development Shrestha might be correct. However, I argue thatfrom the perspective of a household or an individual, it is the relative ‘land’deprivation, a source of livelihood that encourages households to decide formigration.
THE SETTING FOR THIS STUDY
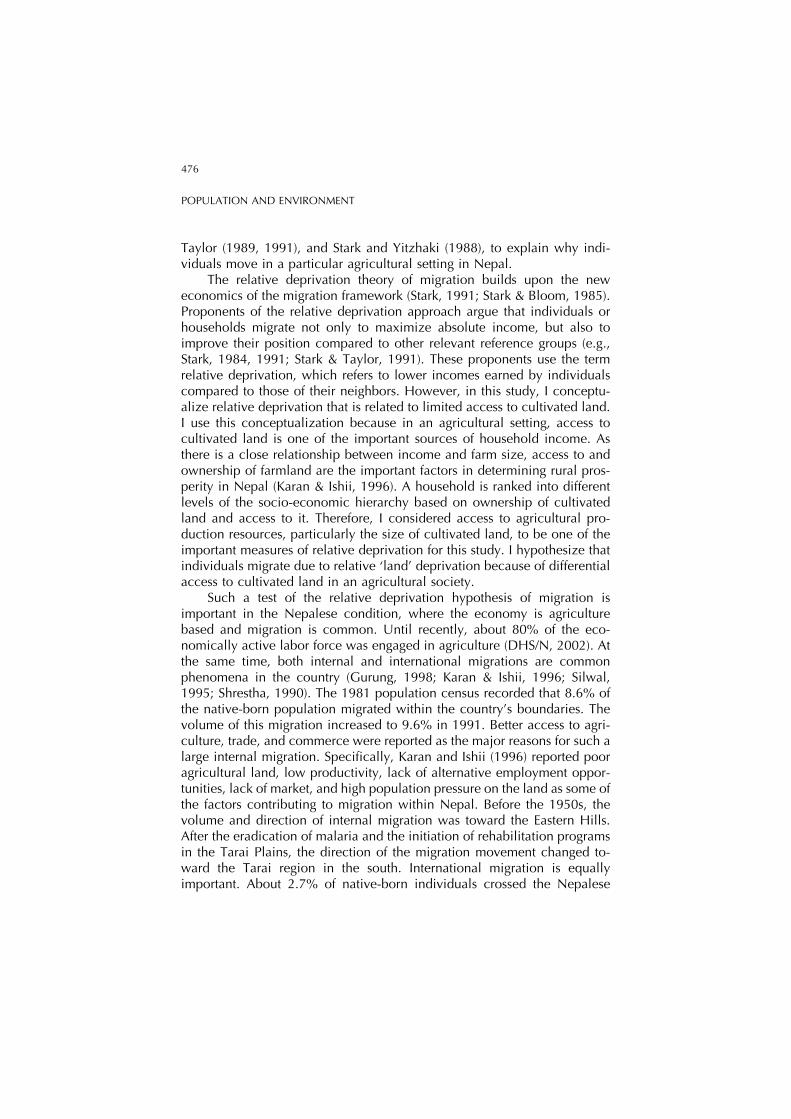
The setting for this study is the Chitwan Valley situated in the southernplain of Nepal (Figure 1). The Chitwan Valley is surrounded by the RaptiRiver and the Royal Chitwan National Park on the south, the Narayani Riveron the west and north, and Barandabar Forest on the east. The Terai regionin general and the Chitwan Valley in particular, once known as the DeathValley, is now one of the fastest growing areas in the country. Before the1960s, the valley was malaria infested and known as the place of BlackWater (the literal meaning of Kala Pani in Nepali, means a cause of death).The Nepalese government initiated the Malaria Eradication Program in1956 (2013 B.S.) and started rehabilitation programs in the valley byclearing the forest. As a result of this success, the population grew very
480
POPULATION AND ENVIRONMENT
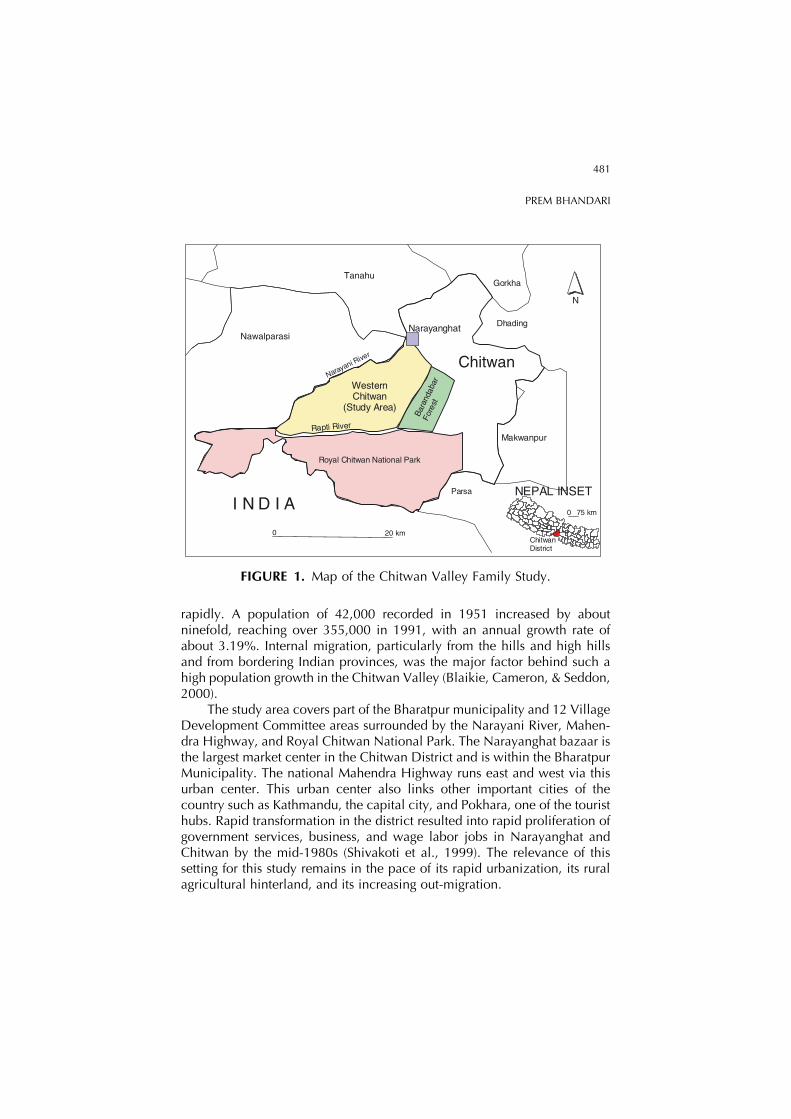
rapidly. A population of 42,000 recorded in 1951 increased by aboutninefold, reaching over 355,000 in 1991, with an annual growth rate ofabout 3.19%. Internal migration, particularly from the hills and high hillsand from bordering Indian provinces, was the major factor behind such ahigh population growth in the Chitwan Valley (Blaikie, Cameron, & Seddon,2000).
The study area covers part of the Bharatpur municipality and 12 VillageDevelopment Committee areas surrounded by the Narayani River, Mahen-dra Highway, and Royal Chitwan National Park. The Narayanghat bazaar isthe largest market center in the Chitwan District and is within the BharatpurMunicipality. The national Mahendra Highway runs east and west via thisurban center. This urban center also links other important cities of thecountry such as Kathmandu, the capital city, and Pokhara, one of the touristhubs. Rapid transformation in the district resulted into rapid proliferation ofgovernment services, business, and wage labor jobs in Narayanghat andChitwan by the mid-1980s (Shivakoti et al., 1999). The relevance of thissetting for this study remains in the pace of its rapid urbanization, its ruralagricultural hinterland, and its increasing out-migration.
Nawalparasi
Tanahu
Parsa
Makwanpur
Chitwan
Dhading
Gorkha
Bara
ndab
arF
ores
t
Royal Chitwan National Park
WesternChitwan
(Study Area)
Narayanghat
I N D I A
Rapti River
Narayani River
N
NEPAL INSET
ChitwanDistrict
0 20 km
0 75 km
FIGURE 1. Map of the Chitwan Valley Family Study.
481
PREM BHANDARI
DATA AND METHODS
The data for this study came from the Chitwan Valley Family Study andPopulation and Environment Study collected from 1805 households (1475farming households) in 1996. (Please refer to Barber et al. (1997) for adetailed description of the sample selection procedure.) I utilized theirhousehold level baseline agriculture and census data in order to test thehypothesis of this study. A structured interviewer assisted schedule was usedto collect these data with a response rate of 100%.
The dependent variable used in this study was the household migrationstatus. Broadly, migration is defined as a permanent or semi-permanentchange of residence (Lee, 1966). In this study, I have considered a migrantindividual to be one staying away from his or her home for most of the timein the past 6 months, at the time of survey. Thus, a household where anindividual is away is considered a migrant household. Other households areconsidered non-migrant households. To measure this variable, eachhousehold was first asked whether ‘‘there are any household members whostay away from home most of the time in the past six months.’’ Uponconfirmation, the reasons for the move were confirmed by further asking,‘‘Is (name) away because of work, study, or for some other reason?’’ In theanalysis, this variable is dichotomously coded as: migrant households 1 andotherwise 0, taking into account the response of work reasons.
Relative deprivation was the major independent variable used in test-ing the hypothesis. In this study, relative deprivation is defined in termsof access to cultivated land (measured in Kattha; 1 ha = 30 Kattha).
#Y#Y#Y#Y#Y#Y#Y#Y#Y#Y#Y#Y#Y#Y#Y#Y#Y#Y#Y#Y#Y#Y#Y#Y#Y#Y#Y#Y#Y#Y#Y#Y#Y#Y#Y#Y#Y#Y#Y#Y#Y#Y#Y#Y#Y#Y#Y#Y#Y#Y
#Y#Y#Y#Y#Y#Y#Y#Y
#Y
#Y
#Y
#Y
#Y
#Y
#Y
#Y#Y
#Y#Y
#Y
#Y
#Y
#Y
#Y
#Y
#Y
#Y
#Y
#Y
#Y#Y
#Y
#Y
#Y
#Y
#Y
#Y
#Y
#Y
#Y#Y
#Y
#Y#Y#Y
#Y#Y#Y #Y
#Y
#Y#Y
#Y
#Y #Y#Y #Y
#Y
;;;;
; ;;;
;;;;;
;
;
; ;
;;
;;
;
;;
;
; ;;;
; ;;
;
;; ;;
;;; ;
;;;;;
;;;
;
;;
;;
;
;
;;;;
;;;
;;
;;;;
;; ;; ;
;
;
;
;
;; ;
;;; ; ; ;
;; ;
;;
;; ; ;
;;;;
; ;;;;
; ;
;;; ; ;
;; ;;
;;;;;; ;;
; ;; ;
; ; ;;
N
Na rayanghat
BarandabarForest
The Royal Chitwan National Park
Strata 1
Strata 2
Strata 3
;
#Y
Neighborhoods
Forest plots
0 10 km
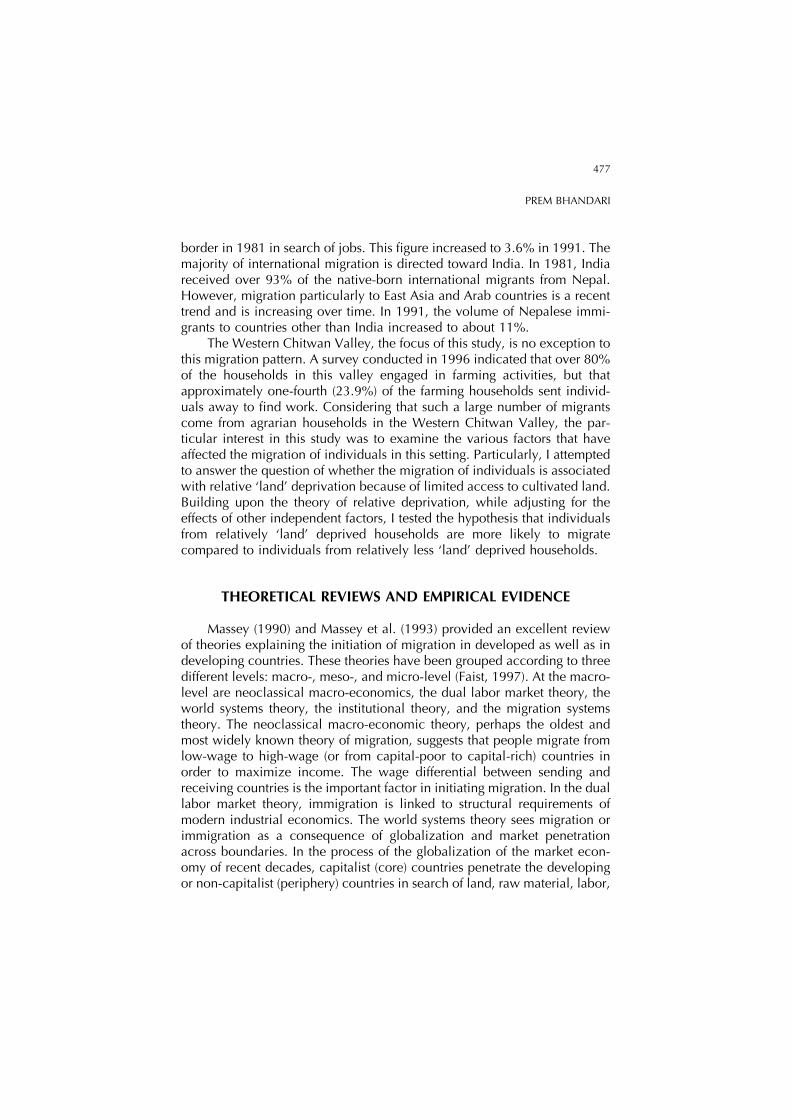
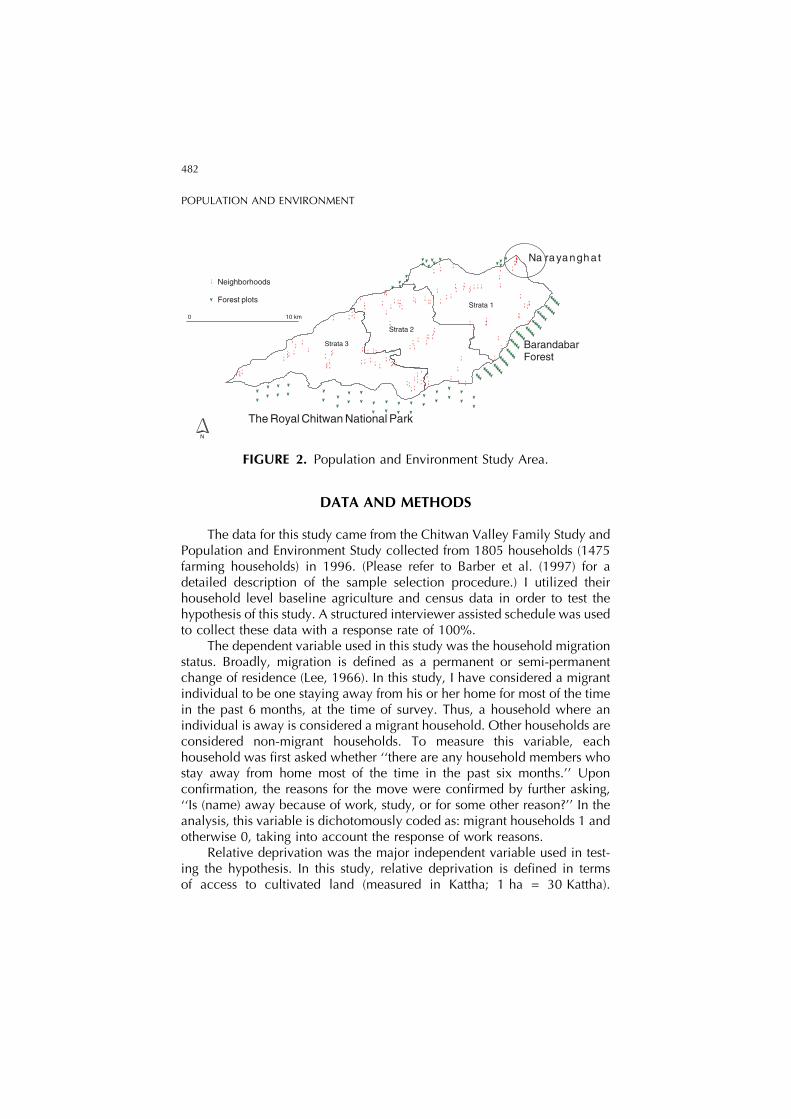
FIGURE 2. Population and Environment Study Area.
482
POPULATION AND ENVIRONMENT
Households compare themselves with their reference group based on ac-cess to and ownership of cultivated land and rank themselves relativelymore or less deprived as compared to the reference group. I believe thataccess to cultivated land is one of the stronger and more valid measures ofrelative deprivation in this setting. Furthermore, it is the major source ofemployment, income, and livelihood. In this study, households are cate-gorized into six relative deprivation categories as follows: households withcultivated land holding (i) less than 10 Kattha, (ii) 10–19.99 Kattha, (iii)20–29.99 Kattha, (iv) 30–39.99 Kattha, (v) 40–49.99 Kattha, and (vi)50 Kattha and above. In the analysis, as the average size of a cultivatedholding fell into category (iii) (20–29.99 Kattha, i.e., two-thirds to 1 ha), Iused this group as a reference category. This land size is also consideredenough for a household of about 4–6 persons in the valley.
Several other variables might confound the relationships between thedependent variable migration and the explanatory variable relative depri-vation. The variables I controlled in this study were as follows. Relativedeprivation is associated with the number of members present in a house-hold. For instance, a farming household in a given locality having 1 ha(30 Kattha) of land with 10 household members may be relatively moredeprived compared to another farming household with the same amount ofland but with only five household members. This is because householdneeds differ by family/household size. As the household size affects agri-cultural density, which has a positive impact on migration (Connell et al.,1976; Lee, 1985), it is considered one important factor in determiningmigration. Furthermore, Findlay (1986) hypothesized that the greater thequantity and quality of the family labor force, the greater the probability ofadopting migration by a household. He also expected a greater chance ofmigration from a household with a greater number of adults in the family.Therefore, in this study, I presumed that the presence of more adults in afamily would increase the chances of migration.
Sex composition is also equally important in household migrationdecisions. Lee (1985) argued that migration is sex-selective in less devel-oped countries. However, he further asserted that whether migration ismale-dominant or female-dominant depends on the specific context. SinceNepal in general and the study area in particular are patriarchal societies, Iexpected a differential effect from the presence of male/female members inmigration decisions because males are more likely to move compared tofemales in such settings. Therefore, I also controlled for the effect of sexcomposition in the analysis. I expected a positive association between thenumber of household members and migration with a strong effect by malescompared to females. To examine the curvilinear effect of the number of
483
PREM BHANDARI
males and females on dependent variables, squared terms of these variableswere also used in the analysis. Since the unit of analysis is a household, thisstudy did not take into account other individual level decision factors suchas age, sex ratio, and marital status.
Land ownership is another important factor affecting the migration ofindividuals. In general, land resources such as home and land ownershipare often negatively associated with the migration decision (De Jong et al.,2002). Therefore, it is logical to expect that land ownership should have anegative effect on migration in an agricultural setting. Land is the source ofhousehold employment as well as livelihood in an agricultural setting.Landowners, instead of looking for outside jobs, have to work on their landand, therefore, have little incentive to move. As land ownership is alsoconsidered one of the indicators of social status, it is likely that landownersmay have little incentive to move.
Empirically, the effect of landownership on migration is mixed (Find-lay, 1986; Lee, 1985). According to Bilsborrow (1981), on the one hand,households with large amounts of land tend to have higher income, whichfacilitates their financing an out-migration by a family member. On theother hand, families, which are very poor and have little land, may find itnecessary to send a household member to work elsewhere as a laborer sothat all members of the household can survive (cited by Lee, 1985). Forsome, it is a source of commitment to a place. To others, it is an asset to helpfinance migration. However, if a household owns too little land, such assmall and marginal farmers, its effect on a migration decision may be po-sitive. In Nepal’s situation, I expect that individuals with a small landholding might have more incentive to out-migrate. On the one hand, theycannot produce enough food and income from the land. On the other, thosehaving some land may borrow on credit from the market, which may helpthem finance their migration. Also, the effect of the sharecropping status of ahousehold may differ. Household members’ decision to share crop insteadof adopt migration may influence their migration behavior negatively.
In this study, I defined land ownership status as owning or sharecrop-ping some or all of the bari and khet land, separately. A household isconsidered an owner of a bari or khet land if that household owns at leastsome cultivated bari or khet land. I separated ownership for bari and khetland because of the quality of land they denote. Khet is suitable for ricecultivation and is considered good quality farmland, whereas, bari is suit-able for upland crops such as maize, millet, or mustard and is relatively lowquality farmland. In the Chitwan Valley Study, this information was col-lected by asking, ‘‘Does your household own the land, is it sharecropped,… or are there some other arrangements?’’ These questions were asked
484
POPULATION AND ENVIRONMENT
separately for bari and khet land. As sharecropping is also practiced, I usedsharecropping as another category in my analysis. Based on this informa-tion, I recoded household ownership status as owns bari land, share cropsbari land, owns khet land and sharecrops khet land. The variables weredichotomously coded as: owns bari/khei = 1 and otherwise = 0. Similarly, ifa household share crops part or all of the bari/khet land, this variable wascoded as sharecrops bari/khet = 1 vs. otherwise = 0.
On the effect of household socio-economic status on migration, Find-lay (1986) and Lee (1985) reported a mixed contribution. Lee provided twocontrasting perspectives. First, people with relatively low incomes are morelikely to move because they are more responsive to a given income dif-ferential than people with high incomes. The second perspective is asso-ciated with the human capital approach. In this perspective, it is expectedthat people with higher incomes are more likely to be educated and are alsomore likely to move because they can afford the cost of moving. In Chit-wan’s agricultural setting, I expected that household socio-economic statusincreases affordability of migration. Therefore, I expected a positive con-tribution of household socio-economic status on migration. I used avail-ability of toilet and electric facilities in the household as proxy measures ofhousehold socio-economic status. These measures are widely used asproxies for a household living standard, particularly in developing countries(Montgomery et al., 2000). Pebley, Goldman and Rodriguez (1996)also used the presence of a toilet facility as one of the indicators of socio-economic status in a study of prenatal and delivery care and childhoodimmunization in Guatemala. Information on these variables were collectedby asking, ‘‘Do you have a toilet?’’ and ‘‘Do you have electricity in yourhouse?’’ and measured as ‘‘yes’’ and ‘‘no’’ responses. In this analysis, thesevariables were coded yes = 1 vs. no/otherwise = 0.
Ethnicity might also have a significant influence on the migrationbehavior of individuals. As Axinn and Barber (2001) reported wide vari-ation in family formation patterns by ethnicity in this setting, I also ex-pected migration patterns to vary widely among these ethnic groups. Inthe Chitwan Valley, people of various ethnic backgrounds such as Brah-min, Chhetri, Newar, Gurung, Magar, Tharu, and many others reside anddo farming. Some ethnic groups such as Tharus are indigenous to thissetting and practice mostly traditional farming, whereas other ethnicgroups in general are in-migrants and vary in farming practices. As iswidely used (e.g., Axinn & Barber, 2001; Gajurel, 2001), the ethnicity ofeach household is grouped into High Caste Hindu, Low Caste Hindu,Newar, Hill Tibeto Burmese, and indigenous Terai or Terai Tibeto-Bur-mese groups.
485
PREM BHANDARI
The geographic proximity of a household from the main market center(urban area) might also influence the household migration decision. In Lawsof Migration, Ravenstein argued that the individuals living in towns are lessmigratory than those who live in rural areas of the country (cited in Lee,1966). This is because residential location measures the level of accessi-bility to various community opportunities and services (Lee, 1985). How-ever, he further argued that the effects are not uniform. On the one hand,individuals living in urban areas of developing countries are educated andhave access to information. Therefore, they may be more likely to move. Onthe other hand, they may have more access to opportunities and servicesand, therefore, be less likely to move. As opportunities are concentrated inan urban area, I expected that households in rural areas would be morelikely to move compared to those in an urban area.
In this study, the geographic proximity of a household from the districtmarket/urban center was defined by broadly dividing the study area intothree different geographical strata as used by Matthews et al. (2000).Households in stratum 1 refer to those located in and around the districtmarket center (also the district headquarter) of Narayanghat/Bharatpur.Stratum 3 refers to the area farthest from this market center. Stratum 2households are located in between Stratum 1 and 3. This variable wascoded as a three-category dummy variable—Stratum 1, Stratum 2, andStratum 3. Stratum 1, the area close to the market center was considered thereference category in the analysis.
I used both descriptive as well as inferential statistical tools to analyzethe data. However, to examine the relationship between migration andrelative deprivation, I used a logistic regression analysis technique as thedependent variable, migration for work, which is dichotomous and wascoded as: yes ¼ 1 vs. otherwise ¼ 0. Both unstandardized logistic regres-sion coefficients and odds ratios are presented here for easy understandingand interpretation. Unstandardized logistic regression coefficients wereinterpreted based on the direction and magnitude of the coefficients (Me-nard, 1995; Pampel, 2000). A positive coefficient indicates that each one-unit increase in the independent variable is associated with an increase inthe dependent variable by a given coefficient (logged odds or logit). Simi-larly, a negative coefficient is interpreted as each one-unit increase in theindependent variable reduces the logit (logged odds) of the dependentvariable by a given unit of logit coefficient. Whereas odds ratios (theprobability divided by 1 minus the probability) are interpreted as follows:‘‘an odds ratio greater than 1 indicates that the odds of being … increaseswhen the independent variable increases; and an odds ratio of less than 1indicates that the odds of being… decreases when the independent variable
486
POPULATION AND ENVIRONMENT
increases’’ (Menard, 1995). As Pampel (2000) noted, these odds ratios canalso be expressed as a percentage increase or decrease in the dependentvariable due to a one-unit change in the independent variable as:
Percentage Change ¼ ðeb � 1Þ � 100; Or; ðOddsratio � 1Þ � 100
RESULTS
Comparative Scenarios of Migrant and Non-migrant Households
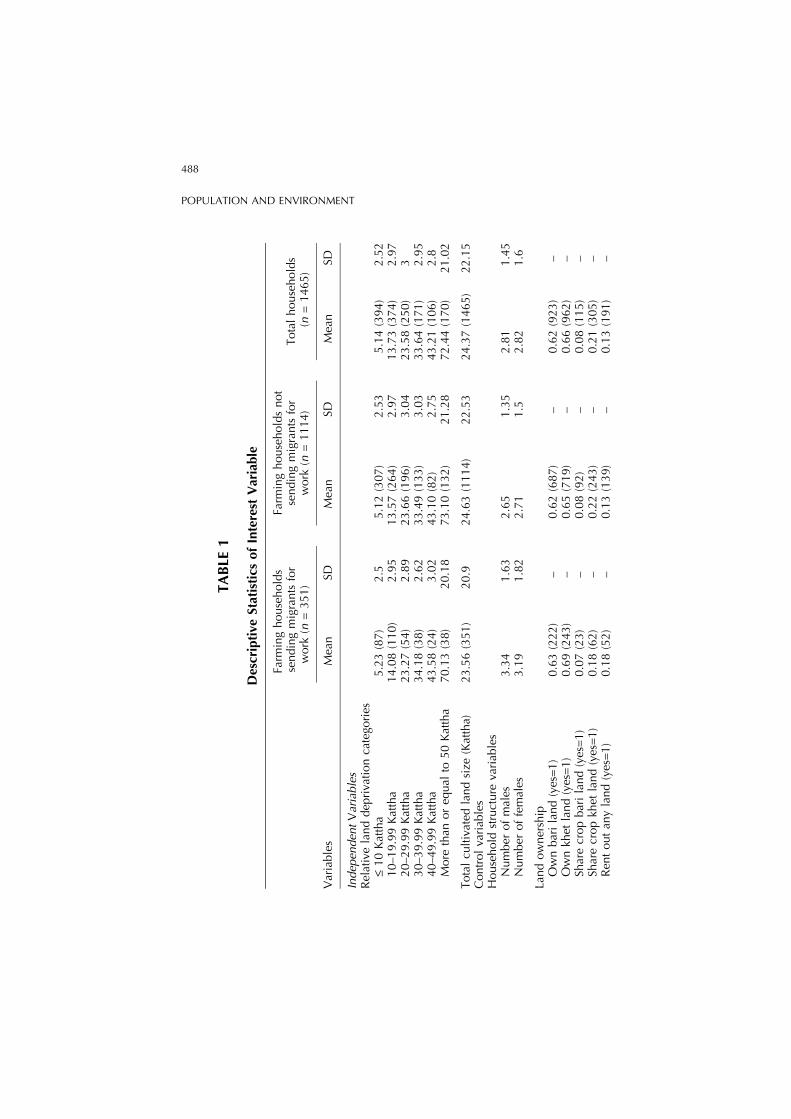
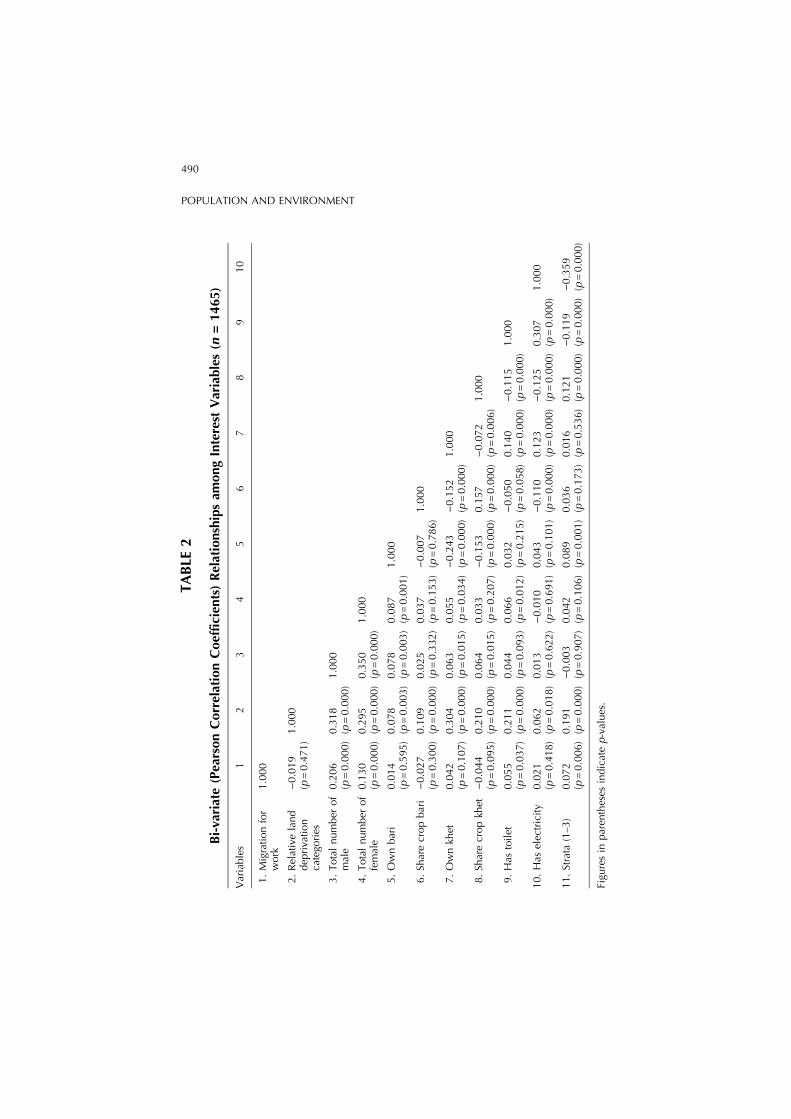
Descriptive statistics and the bi-variate associations among interestvariables are presented in Tables 1 and 2, respectively. Among the 1475farming households in the Chitwan Valley Study, 1465 were included in thisanalysis; 10 were excluded because of some missing values. Overall, thedistribution of land is highly skewed. Over two-thirds of the households hadless than 1 ha of cultivated land. This clearly signifies that most of thefarming households are subsistence farmers. In total, the average size of thecultivated holding was 24.37 Kattha, less than 1 ha of land (1 ha =30 Kattha). Among different relative deprivation categories, the distributionof households was as follows: 27% (n = 394) of the households had lessthan 10 Kattha; about 26% (n = 374) of the households had 10–19.99 Kattha; about 17% (n = 250) had 20–29.99 Kattha; about 12%(n = 171) had 30–39.99 Kattha; 7% (n = 106) had 40–49.99 Kattha, andabout 12 % (n = 170) had 50 Kattha and above of cultivated land. In otherwords, over half of the households (52%) had access to only about 20% ofthe cultivated land, whereas less than 20% of the households had access toabout half (47%) of the land.
Comparatively, the average size of a cultivated holding was marginallysmall for migrant households, i.e., 23.56 vs. 24.63 Kattha for non-migranthouseholds. Although statistically not significant (results not shown), thisfinding is not consistent with Stark and Taylor’s (1991) evidence of impetusfor Mexico–US migration, where migrants had a marginally large sizeholding. Obviously, households with a large number of individuals havemore flexibility for labor allocation for various purposes, for example,migration for work. Consistent with the results of Stark and Taylor’s re-search, the average number of males and females were larger in migranthouseholds (3.34 males and 3.19 females) compared to non-migranthouseholds (2.65 males and 2.71 females). Although access to land wasquite small, a fairly large number of households, about two-thirds, owned
487
PREM BHANDARI
TABLE
1
Descriptive
Statistics
ofInterest
Variable
Farm
inghouseholds
sendingmigrantsfor
work
(n=351)
Farm
inghouseholdsnot
sendingmigrantsfor
work
(n=1114)
Totalhouseholds
(n=1465)
Variables
Mea
nSD
Mea
nSD
Mea
nSD
Indep
enden
tVariables
Relativelanddep
riva
tionca
tego
ries
£10Kattha
5.23(87)
2.5
5.12(307)
2.53
5.14(394)
2.52
10–1
9.99Kattha
14.08(110)
2.95
13.57(264)
2.97
13.73(374)
2.97
20–2
9.99Kattha
23.27(54)
2.89
23.66(196)
3.04
23.58(250)
330–3
9.99Kattha
34.18(38)
2.62
33.49(133)
3.03
33.64(171)
2.95
40–4
9.99Kattha
43.58(24)
3.02
43.10(82)
2.75
43.21(106)
2.8
More
than
oreq
ual
to50Kattha
70.13(38)
20.18
73.10(132)
21.28
72.44(170)
21.02
Totalcu
ltivated
landsize
(Kattha)
23.56(351)
20.9
24.63(1114)
22.53
24.37(1465)
22.15
Controlva
riab
les
Household
structure
variab
les
Number
ofmales
3.34
1.63
2.65
1.35
2.81
1.45
Number
offemales
3.19
1.82
2.71
1.5
2.82
1.6
Landownership
Ownbariland(yes=1)
0.63(222)
–0.62(687)
–0.62(923)
–Ownkh
etland(yes=1)
0.69(243)
–0.65(719)
–0.66(962)
–Sh
arecropbariland(yes=1)
0.07(23)
–0.08(92)
–0.08(115)
–Sh
arecropkh
etland(yes=1)
0.18(62)
–0.22(243)
–0.21(305)
–Ren
toutan
yland(yes=1)
0.18(52)
–0.13(139)
–0.13(191)
–
488
POPULATION AND ENVIRONMENT
TABLE
1(C
ontinued
)
Farm
inghouseholds
sendingmigrants
for
work
(n=351)
Farm
inghouseholdsnot
sendingmigrants
for
work
(n=1114)
Totalhouseholds
(n=1465)
Variables
Mea
nSD
Mea
nSD
Mea
nSD
Socio-eco
nomic
status
Toilet
facility
athome(yes
¼1)
0.70(246)
–0.64(713)
–0.66(959)
–Elec
tricityfacility
athome(yes=1)
0.34(120)
–0.32(355)
–0.32(475)
–
Ethnicity
Highca
steHindu
0.24(167)
–0.76(540)
–0.48(707)
–Lo
wca
steHindu
0.31(54)
–0.69(121)
–0.12(175)
–HillTibetoBurm
ese
0.28(75)
–0.72(194)
–0.18(269)
–New
ar0.26(21)
–0.74(60)
–0.06(81)
–Terai
TibetoBurm
ese
0.15(34)
–0.85(199)
–0.16(233)
–
Byge
ograp
hic
loca
tion
Close
tomarke
tce
nter:Strata
10.17(50)
–0.83(240)
–0.20(290)
–Betwee
nStrata
1an
d3:Strata
20.25(155)
–0.75(467)
–0.43(622)
–Fa
rfrom
marke
tce
nter:Strata
30.26(146)
–0.74(407)
–0.38(553)
–
Figu
resin
paren
thesisindicatenumber
ofobservations.30Kattha¼
1ha;
20Kattha¼
1Bigha.
489
PREM BHANDARI
TABLE
2
Bi-variate(PearsonCorrelationCoefficien
ts)Relationshipsam
ongInterest
Variables(n
=1465)
Variables
12
34
56
78
910
1.Migrationfor
work
1.000
2.Relativeland
dep
rivation
catego
ries
)0.019
(p=0.471)1.000
3.Totalnumber
of
male
0.206
(p=0.000)0.318
(p=0.000)1.000
4.Totalnumber
of
female
0.130
(p=0.000)0.295
(p=0.000)0.350
(p=0.000)1.000
5.Ownbari
0.014
(p=0.595)0.078
(p=0.003)0.078
(p=0.003)0.087
(p=0.001)1.000
6.Sh
arecropbari
)0.027
(p=0.300)0.109
(p=0.000)0.025
(p=0.332)0.037
(p=0.153))0.007
(p=0.786)1.000
7.Ownkh
et0.042
(p=0.107)0.304
(p=0.000)0.063
(p=0.015)0.055
(p=0.034))0.243
(p=0.000))0.152
(p=0.000)1.000
8.Sh
arecropkh
et)0.044
(p=0.095)0.210
(p=0.000)0.064
(p=0.015)0.033
(p=0.207))0.153
(p=0.000)0.157
(p=0.000))0.072
(p=0.006)1.000
9.Has
toilet
0.055
(p=0.037)0.211
(p=0.000)0.044
(p=0.093)0.066
(p=0.012)0.032
(p=0.215))0.050
(p=0.058)0.140
(p=0.000))0.115
(p=0.000)1.000
10.Has
electricity
0.021
(p=0.418)0.062
(p=0.018)0.013
(p=0.622))0.010
(p=0.691)0.043
(p=0.101))0.110
(p=0.000)0.123
(p=0.000))0.125
(p=0.000)0.307
(p=0.000)1.000
11.Strata
(1–3
)0.072
(p=0.006)0.191
(p=0.000))0.003
(p=0.907)0.042
(p=0.106)0.089
(p=0.001)0.036
(p=0.173)0.016
(p=0.536)0.121
(p=0.000))0.119
(p=0.000))0.359
(p=0.000)
Figu
resin
paren
theses
indicatep-values.
490
POPULATION AND ENVIRONMENT
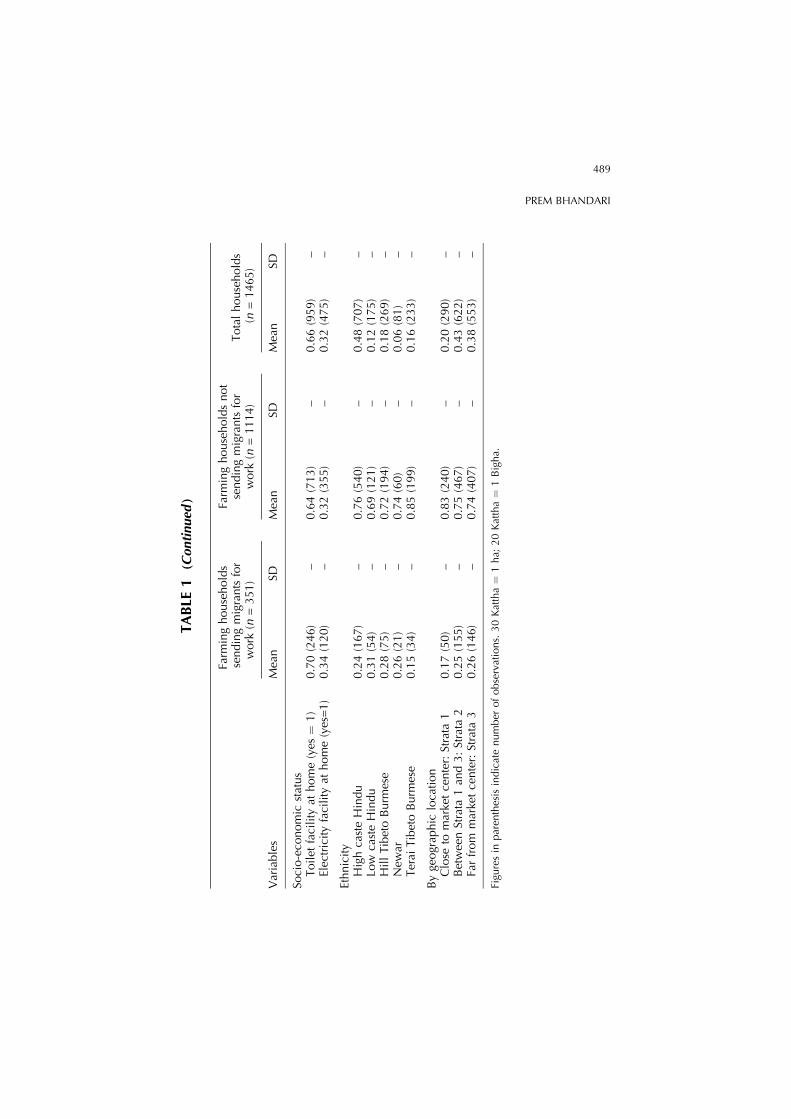
either khet or bari, or both types of land. Interestingly, relatively more mi-grant households owned some form of khet or bari land compared to non-migrants. In total, the proportion of households owning some form of landwas quite high. Almost 95% of the migrant households and 92% of the non-migrant households owned khet and/or bari land. However, the proportionof sharecropper households was slightly larger for non-migrant households.This result indicates that sharecroppers are, by nature, more likely to stayhome.
A slightly large proportion of the migrant households had a toiletfacility (70%) and electricity (34%) compared to non-migrant households(toilet, 64% and electricity, 32%). Availability of electricity at home alsosignifies a higher level of consumption in migrant households. By ethnicity,the proportions of migrant households were slightly large for the lower casteHindu, Hill Tibeto Burmese, and Newar, whereas it was slightly lower forTerai Tibeto Burmese and almost the same for high caste Hindu. As most ofthe services and facilities are concentrated in urban areas, a relatively lowerproportion of households sent individuals from an urban area for workreasons (strata 1) compared to households in rural areas (strata 2 and strata3). Of the total, only 17% of the agricultural households were engaged inmigration in areas close to the main market center (strata 1), whereas theproportions of migrant households in rural areas (strata 2 and 3) were 25and 26%, respectively.
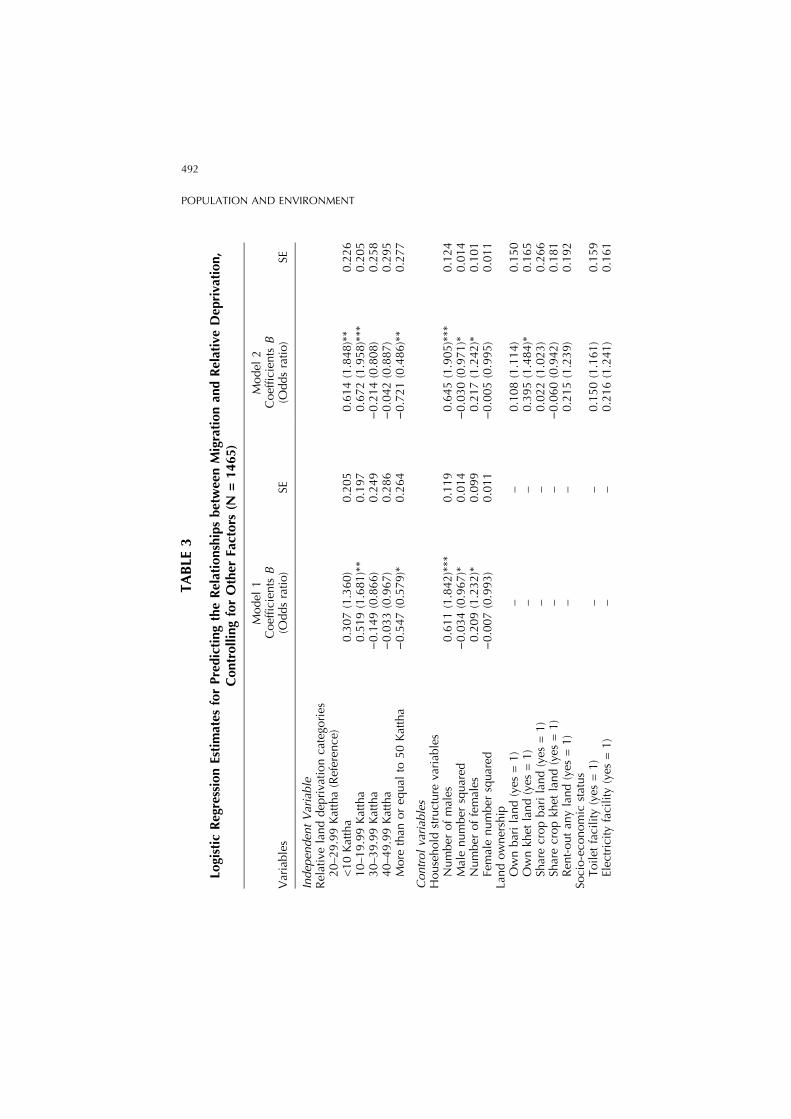
Relative Deprivation and Migration: Multivariate Results
Table 3 presents logistic regression estimates for predicting the rela-tionships between migration for work and relative deprivation, controllingfor the effects of other independent factors. Both logit coefficients (unstan-dardized B) and odds ratios are presented. In Model 1, I have shown therelationship between relative deprivation and migration after controlling forthe effects of household structure variables, number of males, number offemales, and their squared terms. Because relativity is associated with thenumber of household members, I have included this variable in this model.The results clearly indicate that relative ‘land’ deprivation is a considerationin household migration decision-making. Compared to the reference cate-gory, relatively ‘land’ deprived households were more likely to send indi-viduals away for work. Although statistically not significant, highly ‘land’deprived households (<10 Kattha) were about 36% more likely to sendindividuals away for work (odds ratio = 1.360; p > 0.10) compared to thereference category (20–29.99 Kattha). However, the likelihood of sendingindividuals away for work was positive and statistically significant for the
491
PREM BHANDARI
TABLE
3
Logistic
RegressionEstimates
forPredictingtheRelationshipsbetweenMigrationan
dRelativeDep
rivation,
ControllingforOther
Factors
(N=1465)
Model
1Model
2
Variables
Coefficien
tsB
(Oddsratio)
SECoefficien
tsB
(Oddsratio)
SE
Indep
enden
tVariable
Relativelanddep
riva
tionca
tego
ries
20–2
9.99Kattha(Referen
ce)
<10Kattha
0.307(1.360)
0.205
0.614(1.848)**
0.226
10–1
9.99Kattha
0.519(1.681)**
0.197
0.672(1.958)***
0.205
30–3
9.99Kattha
)0.149(0.866)
0.249
)0.214(0.808)
0.258
40–4
9.99Kattha
)0.033(0.967)
0.286
)0.042(0.887)
0.295
More
than
oreq
ual
to50Kattha
)0.547(0.579)*
0.264
)0.721(0.486)**
0.277
Controlva
riab
les
Household
structure
variab
les
Number
ofmales
0.611(1.842)***
0.119
0.645(1.905)***
0.124
Malenumber
squared
)0.034(0.967)*
0.014
)0.030(0.971)*
0.014
Number
offemales
0.209(1.232)*
0.099
0.217(1.242)*
0.101
Femalenumber
squared
)0.007(0.993)
0.011
)0.005(0.995)
0.011
Landownership
Ownbariland(yes
=1)
––
0.108(1.114)
0.150
Ownkh
etland(yes
=1)
––
0.395(1.484)*
0.165
Sharecropbariland(yes
=1)
––
0.022(1.023)
0.266
Sharecropkh
etland(yes
=1)
––
)0.060(0.942)
0.181
Ren
t-outan
yland(yes
=1)
––
0.215(1.239)
0.192
Socio-eco
nomic
status
Toilet
facility
(yes
=1)
––
0.150(1.161)
0.159
Elec
tricityfacility
(yes
=1)
––
0.216(1.241)
0.161
492
POPULATION AND ENVIRONMENT
TABLE
3(C
ontinued
)
Model
1Model
2
Variables
Coefficien
tsB
(Oddsratio)
SECoefficien
tsB
(Oddsratio)
SE
Ethnicity
Terai
TibetoBurm
ese(Referen
ce)
Highca
steHindu
––
0.898(2.454)***
0.250
Low
casteHindu
––
1.134(3.107)***
0.28
HillTibetoBurm
ese
––
1.141(3.131)***
0.267
New
ar–
–1.049(2.854)**
0.358
Householdsbyge
ograp
hic
loca
tion
Close
tomarke
tce
nter:Strata
1(Ref)
–Betwee
nStrata
1an
d3:Strata2
––
0.651(1.917)***
0.201
Farfrom
marke
tce
nter:Strata
3–
–1.004(2.728)***
0.217
Intercep
t)3.284(0.037)***
0.331
)5.632(0.004)***
0.517
Model
v296.376***
157.891***
Deg
rees
offree
dom
922
-2LL
1516.904
1455.389
PseudoR2(%
)6.35%
10.85%
Figu
resin
paren
thesisindicateoddsratios
***p
<.001;**p<.01;*p
<.05p<.10.
30Kattha=1Ha;
20Kattha=1Bigha.
493
PREM BHANDARI
second (10–19.99 Kattha) relatively deprived category (odds ratio = 1.661;p < 0.01). On the other side, individuals from relatively well-off householdswere less likely to migrate compared to the reference category. However,the results were statistically significant only for the top category (more thanor equal to 50 Kattha), the most well-off households. Individuals from thesehouseholds were about 42% less likely to migrate (odds ratio = 0.579;p < 0.05). The effect of household structure variables, number of males andfemales, and their squared terms, except for females, were statisticallysignificant and positive. The negative effect of the squared terms for malesand females signifies that the effect is curvilinear.
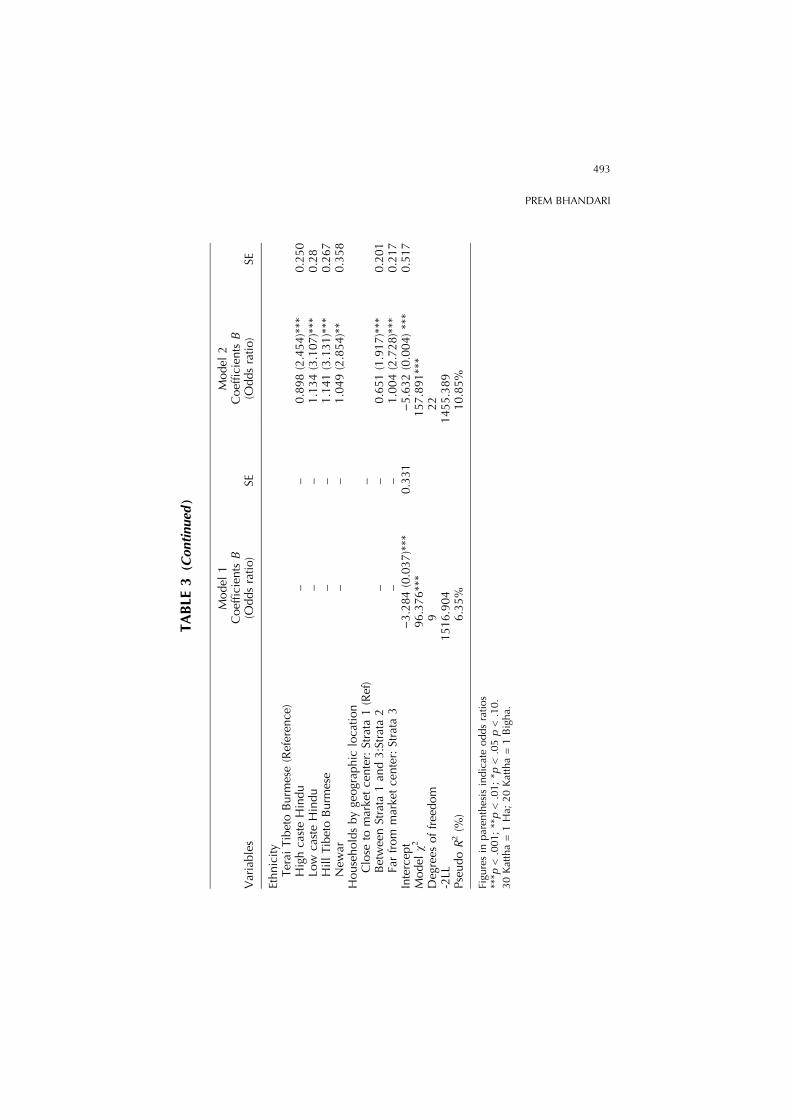
In Model 2, the relationships between migration for work and relativedeprivation turned out to be even stronger after adjusting for the effects ofadditional control variables such as land ownership, socio-economic status ormodernization, ethnicity, and geographic proximity of households from themain market center. After controlling for the effects of these variables, theresults for the most relatively deprived households (i.e., <10 Kattha) alsoturned out to be statistically significant. The results indicate that the house-holds at the bottom of the hierarchy comprised about 85% (odds ratio =1.848; p < .05), while those from the second category (10–19.99 Kattha)were about 96% more likely (odds ratio = 1.958, p < 0.010) to send indi-viduals away forwork compared to the reference category (20–29.99 Kattha).On the other hand, relatively well-off households (above the reference cate-gory) were less likely to send individuals away for work. However, the resultswere statistically significant (odds ratio = 0.486; p < 0.01) for households atthe top of the relative deprivation hierarchy (more than or equal to 50 Kattha).This finding provides empirical support for the relative deprivation hypothesisof migration put forth by Stark and his colleagues. The results of my study arealso consistent with the finding of Shrestha (1990) that landless or nearlandless people in Nepal are more likely to migrate.
Household structure variables, number of males and females, stronglycontributed to household migration. In both models (Model 1 and Model 2),the number of males and females were significantly and positively associ-ated with migration. These positive estimates indicate that the probability ofbeing a migrant household increases with every unit increase in the numberof males and females in the household. This also implies that individualsfrom a large household are more likely to move. However, the number ofmale members was a stronger determinant than the number of females inmigration decisions. This finding is consistent with that of Kanaskar Thapain a research conducted in the hills of Nepal in 1992 (cited in Marquette& Bilsborrow, 1994). I also included the effect of the squared terms ofthe number of males and females to capture any non-linearity of the
494
POPULATION AND ENVIRONMENT
relationship. The results indicate that for bothmales and females the directionof the relationship is negative. Such a relationship suggests that the proba-bilities increased at a decreasing rate. However, only the effect of the malesquared term is statistically significant. It implies that the effect of the numberof males on migration is non-linear, whereas for females it is linear.
Interestingly, ownership of bari and khet land had a positive relation-ship with migration in this study. However, only the effect of the ownershipof khet land significantly contributed to the household migration decision.Households owning some khet land were over 48% (odds ratio = 1.484;p < 0.05) more likely to send individuals away for work compared to thosewho did not own khet land, controlling for other factors. This result indi-cates that land ownership, particularly of khet land, may act as an asset formaking the move affordable. From the descriptive statistics, we understandthat the majority of the households own at least some bari or khet land.Further, the distribution of land is skewed. About 70% of the householdshad access to less than 1 ha of cultivated land, which may not be enoughfor their sustenance. Therefore, it is logical that households that can affordmigration are likely to send individuals away from home for work reasons.Such pressure to migrate becomes intense if they have less land than theirneighbors, as expected by Stark and his associates. Households owningsome land may sell it or rent it out or borrow credit more easily by mort-gaging it as a security. This increases the affordability of household indi-viduals to migrate. Table 2 indicates that about 18% of the migranthouseholds had rented-out some land compared to only 13% of the non-migrant households. A situation such as this is common in Nepal. It is alsoindicated by a positive association between renting-out land and migration,although statistically not significant.
A positive association between the availability of toilet and electricalfacilities, the proxies for socio-economic status, and migration also supportsthis fact. This indicates that even at the lower level of the relative depri-vation hierarchy, individuals with relatively better socio-economic condi-tions are more likely to move. In contrast, households that have decided onsharecropping, although statistically not significant, are less likely to sendindividuals away for work. The negative relationship between sharecrop-ping and migration for work indicates that individuals from householdsengaged in sharecropping might have decided to stay at home and share-crop the land, which seems plausible.
The migration of individuals from households also differed significantlyby ethnicity. Individuals of households from all other ethnic groups aresignificantly more likely to migrate than those in the Terai Tibeto Burmesegroups, the reference category. These groups, particularly the Tharu, are the
495
PREM BHANDARI
local indigenous people residing in the valley. Other ethnic groups are thein-migrants, particularly from the hills and high hills. Individuals inhouseholds of other ethnic groups, except for the reference category, al-ready have had some migration experience. This finding also provides someindication of the role of previous migration experience in the householdmigration decision. As expected, the distance of the households from themain market (urban) center was also strongly and positively associated withthe migration decision. Households in strata 2 were about two times morelikely to send individuals out for work than the households in strata 1, thereference category (odds ratio = 1.917, p < 0.001). Similarly, households instrata 3 were about three times (odds ratio = 2.728, p < 0.000) more likelyto send members out for work than the households in strata 1. This result isconsistent with the expectation of Lee (1966, 1985) that individuals in urbanareas are less likely to move to seek work.
SUMMARY AND CONCLUSION
The aim of this study was to empirically examine the relative depri-vation hypothesis of migration, using previously collected household leveldata from a rural agricultural setting in the Chitwan Valley of Nepal. I testedthe hypothesis that relatively deprived households are more likely to sendaway their member(s) for work reasons than from relatively less deprived (orrelatively well-off) households. As expected, the findings of this study pro-vide support for the relative deprivation hypothesis of migration even afteradjusting for the effects of other important factors such as land ownership,household socio-economic status, ethnicity, and the household’s proximityto the urban center.
The findings of this study have both theoretical and practical impli-cations. From a theoretical perspective, I tested the relative deprivationhypothesis put forth by Stark (1984), Stark and Taylor (1989, 1991), andtheir followers, using household level data from an agricultural setting inNepal. Very few studies have empirically tested this hypothesis at the mi-cro-level. Since the access to cultivated land is one of the important sourcesof household employment and income in an agricultural setting, I consid-ered the relative ‘land’ deprivation by households to have been due torelatively limited access to cultivated holdings. Stark and Taylor tested thishypothesis by using relative income. In this sense, my study adds a newdimension in this area of research, taking into account the relative access tothe source of household income rather than income itself. It is because it isdifficult to measure income in an rural subsistence settings of developing
496
POPULATION AND ENVIRONMENT
countries. Further, this study has utilized a fairly large sample of 1465households.
From a practical point of view, this study is useful in understanding theinfluence of relative deprivation, including other factors in migrationdecisions at the household level. Because migration is one of the importantcomponents of household economic strategies (Grindle, 1988), the role ofcollective decision-making by household members in broader issues offamily sustenance and improvement (Massey, 1990) is important. Harbin-son in 1981 suggested household as the appropriate unit of analysis, or insome contexts, the family, not the individual (cited in Massey, 1990). Ashouseholds are the ultimate decision makers, as conceived by the neweconomics of migration, understanding such a phenomenon is importantfrom a national policy-making perspective as well.
In Nepal’s perspective, landlessness or near landlessness is everincreasing (Karan & Ishii, 1996; Shrestha, 1990). Although the country isagriculturally based, the majority of the farming households are subsistencefarmers (small or marginal farmers) who own less than 1 ha of land. Theaccess to cultivated land is diminishing over time as a result of rapid pop-ulation growth as well as land fragmentation due to the land inheritancesystem. Farmland is divided among sons during household division. Once ason wishes to separate from his parents, the property is sub-divided. Thispractice increases land fragmentation and reduces the sons’ access to cul-tivated land, which can lead to transformation to a relatively deprivedhousehold over time. In such a context, understanding the contribution ofrelative access to farmland on household-level migration decision-makingis quite important.
Overall, the findings provide indications that relatively deprivedhouseholds require attention in order to regulate or control migration.Arrangement of employment opportunities or alternative income-generatingactivities in the source as well as destination place might be an importantpolicy for improving the economic status of such relatively ‘land’ deprivedhouseholds as relatively deprived people are more likely to move to searchfor jobs. However, migration is likely to perpetuate in the area as long ashousehold members feel deprived of as compared to their neighbors in thecommunity.
ACKNOWLEDGMENTS
A short version of this paper was presented as a poster at the PopulationAssociation of America 2003 Annual Meeting, Minneapolis, Minnesota(May 1–3, 2003). I would like to thank Dr. William G. Axinn, Professor of
497
PREM BHANDARI
Sociology, University of Michigan, for providing the data used in this study.Thanks are also due to Dr. Stephen Matthews, Director, GeographicInformation Core (GIA Core), Population Research Institute and AssociateProfessor of Demography, The Pennsylvania State University for providingstudy area maps for this study. I would also like to thank Dr. Gordon F. DeJong, Distinguished Professor, Population Research Institute, The Pennsyl-vania State University, for his encouragement for writing this paper.
REFERENCES
Axinn, W. G., & Barber, J. S. (2001). Mass education and fertility transition. American Socio-logical Review, 66, 481–505.
Barber, J. S., Shivakoti, G., Axinn, W. G., & Gajurel, K. (1997). Sampling strategies for ruralsettings: A detailed example from the Chitwan Valley Family Study, Nepal. Nepal Popu-lation Journal, 6, 193–203.
Bilsborrow, R. E. (1981). Surveys of internal migration in low-income countries: The need forand content of community level variables. Geneva: International Labour Office.
Blaikie, P. M., Cameron, J., & Seddon, J. (2000). The struggle for basic needs in Nepal. NewDelhi: Adroit Publishers.
Connell, J., Dasgupta, B., Laishley, R., & Lipton, M. (1976). Migration from rural areas: Theevidence from village studies. New Delhi: Oxford University Press.
Crosby, F. J. (1982). Relative deprivation and working women. New York: Oxford UniversityPress.
De Jong, G., Chamratrithirong, A., & Tran, Q. (2002). For better, for worse: Life satisfactionconsequences of migration in Thailand. International Migration Review, 36, 838–863.
De Jong, Gordon F. (2000). Expectations, gender, and norms in migration decision making.Population Studies, 54, 307–319.
DHS/N (2002). Nepal Demographic and Health Survey 2001. Calverton, Maryland, USA:Family Health Division, Ministry of Health, New Era, and ORC Macro.
Faist, T. (1997). The crucial meso-level. In T. Hammar, G. Brochmann, K. Tamas, & T. Faist(Eds.), International migration, immobility and development: Multidisciplinary perspec-tives. Oxford, New York: BERG.
Findlay, S. E. (1986). Rural development and migration: A study of family choices in thePhilippines. Boulder and London: West View Press.
Gajurel, K. P. (2001). Organization of agricultural production and human fertility.Unpublished Ph.D. Dissertation submitted to the Department of Agricultural Economics and
Rural Sociology, The Pennsylvania State University, Pennsylvania.Grindle, M. (1988). Searching for rural development: labor migration and employment in
Mexico. Ithaca, New York: Cornell University Press.Gurung, H. (1998). Nepal social demography and expressions. Kathmandu: New Era.Ives, D., Messerli, B. (1989). The Himalayan dilemma: Reconciling development and con-
servation. London and New York: The United Nations University: Routledge.Karan, P., & Ishii, H. (1996). Nepal: A Himalayan kingdom in transition. Tokyo, New York,
Paris: United Nations University Press.Lee, E. S. (1966). A theory of migration, Demography, 3, 45–57.Lee, S. (1985). Why people intend to move: Individual and community level factors of out-
migration in the Philippines. Boulder and London: Westview Press.Marquette, C. M., & Bilsborrow, R. (1994). Population and the environment in developing
countries: literature survey and research bibliography. Preliminary, unedited version pre-pared for the Population Division of the Department for Economic and Social Informationand Policy analysis, United Nations Secretariat. ESA/P/WP.123.
498
POPULATION AND ENVIRONMENT
Massey, D. S. (1990). Social structure, household strategies, and the cumulative causation ofmigration. Population Index, 56, 3–26.
Massey, D. S., Arango, J., Hugo, G., Kouaouci, A., Pellegrino, A. & Taylor, J. E. (1993). Theoriesof International Migration: A review and appraisal. Population and Development Review,19, 431–466.
Matthews, S., Ganesh, A., Shivakoti, P. & Chhetri, N. (2000). Population forces and environ-mental change: observations from western Chitwan, Nepal. Society and Natural Re-sources, 13, 763–775.
Menard, S. (1995). Applied logistic regression analysis. Thousand Oaks, California: SagePublications, International Educational and Professional Publisher.
Montgomery, M. R., Gragnolati, M., Burke, K. A. & Paredes, E. (2000). Measuring LivingStandards with Proxy Variables. Demography, 37, 155–174.
Pampel, F. C. (2000). Logistic regression: A primer. Thousand Oaks, California: Sage Publi-cations, International Educational and Professional Publisher.
Pebley, A., Goldman, N. & Rodriguez, G. (1996). Prenatal and delivery care and childhoodimmunization in Guatemala: Do family and community matter? Demography 33, 231–247.
Shivakoti, G. P., Axinn, W. G., Bhandari, P. & Chhetri, N. (1999). The impact of communitycontext on land use in an agricultural society. Population and Environment, 20, 191–213.
Shrestha, N. R. (1990). Landlessness and migration in Nepal. Boulder, San Francisco, Oxford:Westview Press.
Silwal, U. (1995). Population growth and agricultural change in Nepal. New Delhi: VikasPublishing House Pvt. Ltd..
Stark, O. (1984). Rural-to-urban migration in LDCs: A relative derivation approach. EconomicDevelopment and Cultural Change.
Stark, O. (1991). The migration of labor. Cambridge, Massachusetts: Blackwell Publishers.Stark, O. & Bloom, D. E. (1985). The new economics of labor migration. American Economic
Review 75 (2), 173–178.Stark, O. & Taylor, J. E. (1989). Relative deprivation and international migration. Demography,
26, 1–14.Stark, O. & Taylor, J. E. (1991). Relative deprivation and migration: theory, evidence, and
policy implications. Policy, Research, and External Affairs Working Papers—656, WorldBank.
Stark, O., Yitzhaki, S. (1988). Labour migration as a response to relative deprivation. Journal ofPopulation Economics, 1 (1), 57–70.
499
PREM BHANDARI