measuring multiple deprivation at the small-area level
TRANSCRIPT
IntroductionIn this paper we draw together the key principles which underpin the indices ofmultiple deprivation that have been created for the different countries within theUnited Kingdom over the last five years The paper relates to the English Indices ofDeprivation 2000 (ID 2000) (Noble et al 2000a 2000b 2000c 2000d) its successorthe English Indices of Deprivation 2004 (ID 2004) (Noble et al 2004) the Welsh Indexof Multiple Deprivation 2000 (Noble et al 2000d) the Northern Ireland Measures ofMultiple Deprivation 2001 (Noble et al 2001) and the Scottish Indices of Deprivation2003 (SID 2003) (Noble et al 2003a 2003b) Though at the time of production each ofthe indices was accompanied by a government report this paper considers all fiveindices and documents the key principles that informed them A detailed account ofthe components of the various indices falls beyond the scope of this paper Also ratherthan reporting on the research findings which are available for all to explore as theindices themselves have been publicly released this paper focuses on the innovationsto the model of multiple deprivation and the statistical techniques that were employedin the development of these particular indices
Small-area indices of deprivation are not peculiar to the United Kingdom and thispaper will therefore also be of relevance beyond these particular boundaries (see forexample Hirschowitz et al 2000 McIntyre et al 2000 Madhya Pradesh Human Devel-opment Report Project Office 1995 Salmond et al 1998 Social Research and WesternCape Population Unit 1999)
All developments of this type are evolutionary in their origins The indices that wedescribe are no exception yet in some respects they do represent a break from thepast and offer a fresh view of measuring multiple deprivation As a background to thispaper we begin with an overview of the rationale for measuring multiple deprivationat an area level and present a brief history of the UK predecessors of the indices Thenew model of multiple deprivation is then described and the statistical techniques that
Measuring multiple deprivation at the small-area level
Michael Noble Gemma Wright George Smith Chris DibbenDepartment of Social Policy and Social Work University of Oxford Barnett HouseWellington Square Oxford OX1 2ER England e-mail michaelnoblesocresoxacukgeorgesmithsocresoxacuk gemmawrightsocresoxacukReceived 31 May 2004 in revised form 6 December 2004
Environment and Planning A 2006 volume 38 pages 169 ^ 185
Abstract Indices to measure deprivation at a small-area level have been used in the United Kingdomto target regeneration policy for over thirty years The development of the Indices of Deprivation 2000for England and comparable indices for Northern IrelandWales and Scotland involved a fundamentalreappraisal and reconceptualisation of small-area level multiple deprivation and its measurementMultiple deprivation is articulated as an accumulation of discrete dimensions or `domains of depriva-tion This paper presents the key principles that were taken into consideration when constructing thesefour indices and the more recent English Indices of Deprivation 2004 and provides an account of thestatistical techniques that were used to operationalise them
DOI101068a37168
Corresponding authorCurrent address School of Geography and Geosciences University of St Andrews St AndrewsFife KY16 9AL Scotland e-mail cjldst-andrewsacuk
were developed to operationalise the model are discussed The concluding remarksinclude suggestions for areas of research that would further enhance the theoreticalrigour of future indices
Background area-level multiple deprivationSome commentators ascribe three different meanings to area deprivation a composi-tional meaning a collective meaning and an environmental meaning (Cemlyn et al2002 page 13) A compositional meaning of area deprivation is where an area isconsidered to be deprived if it contains a large number or proportion of deprivedpeople A collective meaning refers to the possible presence of `area effects that isthe additional deprivation in an area which is above and beyond those attributableto the concentration of deprived people in the area The environmental meaningrefers to the deprivation in an area flowing from the lack of facilities in that area orsome other area feature In a summary area measure it is difficult to imagine that thecollective meaning could exist independently of the compositional meaning The fiveindices referred to in this paper are compositional in the sense outlined above Noassumption has been made about the possibility of area effects in the indices as it isan empirical question as to whether such effects exist (Kleinman 1999 McCulloch2001)
The conceptual framework presented in this paper is based on the premise thatdeprivation is ultimately suffered or experienced by individuals and hence that it istheoretically possible to account for the entirety of deprivation by measuring depriva-tion at the individual level However this does not entail a commitment to the viewthat individual-level explanations of deprivation can account for the entirety of thecauses of deprivation Even if the concentration of deprived people in an area doeshave a compounding effect on the overall level of deprivation in that area we wouldargue that this deprivation must still be experienced by individuals
Whereas area measures derived from individual data might be criticised for failing toallow for the possibility of area effects the converse argument has also been made That isthat area measures in themselves imply that the causes of deprivation lie at the area levelThe new indices referred to in this paper entail no conclusions on the causes of depriva-tion Area-level aggregates are one way of obtaining a further understanding of theseprocesses but they do not assume in advance which level is most important
An area measured as relatively deprived by an index may contain large numbers ofpeople who are not deprived and conversely areas which are relatively less deprived mightcontain deprived people (Smith 1999) Area-based policies have often been criticised ontwo grounds first because the majority of deprived people do not live in deprived areasso policies which focus exclusively on such areas will not be effective in solving widerdeprivation (Kleinman 1999) second such policies are less cost-effective than generalantideprivation policies that target deprived individuals wherever they live (PIU 2000)These are pertinent points however they do not undermine the approach in the newindices to measuring multiple deprivation at the small-area level The presentation ofdata at different geographical levels should not be taken to imply assumptions aboutthe fundamental causes of deprivation nor should it be taken to imply assumptionsabout the appropriate solutions The identification of deprived areas may be necessaryif area-based solutions to deprivation are to be pursued but identifying deprived areasin no way assumes that such solutions are the only ones
At least since the mid-1960s the aim of creating an index (or indices) to measuredeprivation at the local level to identify priority areas and target programmes more effec-tively has been a consistent feature of government policy in the United Kingdom Attimes these indices have been concerned with specific areas of policy such as education
170 M Noble G Wright G Smith C Dibben
or health but since the 1980s the idea of a national index of `multiple deprivation at thelocal level has become a central concern The publication of the decennial Census ofPopulation in electronic form with data available for small geographical areas undoubtedlycontributed to this development
As early as 1974 Holterman (1975) undertook an analysis of multiple deprivationusing data from the 1971 Census In England following the 1981 Census of Populationthe Inner Cities Directorate of the then Department of the Environment undertookan analysis ` to assess the relative levels of deprivation in individual local authorities inEngland (DoE 1983) The reasons for the work related specifically to aspects of urbanpolicy including guiding expenditure under the Urban Programme and to informdecisions on the designation of authorities under the 1978 Inner Urban Areas ActThis index was based on eight indicators seven of which were derived from the censusThe approach was largely to focus on what were termed `surrogates for deprivationoumlthat is predominantly what might be described as groups `at risk for example loneparents lone pensioners and those born in the New Commonwealth This wide-ranging set of indicators was selected to pin down `area deprivation in its major formsIts proponents may have been reluctant to claim that they had measured `multipledeprivation as such but as they observed ` it is reasonable to assume that areas whichdo not appear deprived on the eight indicators examined in this analysis are unlikely tohave high overall levels of deprivation (DoE 1983)
In the 1991 English Index of Local Conditions (ILC) (DoE 1994) this multidimen-sional view of area deprivation was continued and the idea of different dimensions or`domains of deprivation was developed However in several important respects itdiffered from its 1981 predecessor First following the recommendations of a reviewundertaken by the Centre for Urban and Regional Development Studies at theUniversity of Newcastle upon Tyne (Coombes et al 1995) its emphasis moved awayfrom groups `at risk of deprivation to more direct measures referred to as `incidenceindicators Second the index was built up from the small area to the larger area withlarger-area values being aggregates of smaller-area values (with additions of other`deprivation variables where these were not available at the smaller-area level) Thirdthe basic method for standardisation prior to summation moved from z-scores to thesigned w2 technique (Robson et al 1995) The 1997 review (DETR 1998) of the ILC wasprimarily an exercise in updating It was not a fundamental review in the sense that nonew subdistrict indicators were introduced (though some were removed)
Other parts of the United Kingdom have also used Census of Population informa-tion to generate measures of small-area deprivation Thus each of the three Censusesof Population in 1971 1981 and 1991 were used to produce information on deprivationin Northern Ireland The result of the 1991 analysis was the construction of a series ofdeprivation measures (Robson 1994) which followed closely the methodology adoptedin England (DoE 1994 Robson et al 1995) These measures have been used by a widevariety of programmes and projects to direct resources to areas with high levels ofsocial and economic deprivation
Moving away from a census-based approachThough the Census of Population offers indicators which are comprehensive in small-areacoverage they can be problematic as components of a deprivation index or source ofdeprivation scores In the first place the census contains few direct measures of depriva-tion For example the census contains no measures of income Previous indices have used`no access to a car as a problematic proxy for income deprivation Second the census isdecennial The data rapidly become out of date and for example the release of data for the1991Census was two years after the census date Data release for the 2001Census was even
Measuring multiple deprivation at the small-area level 171
slower with some output-area-level data delayed until 2004 Updating of indicators thatare derived from the census is therefore only possible on a ten-year cycle
However advances in the collection and use of other data sources such as admin-istrative data have allowed analysis of deprivation at the small-area level in the intercensalperiod Such advances have also released the analysis from using proxy indicators fromthe census in favour of using more direct measures of deprivation such as low income
Creating measures of multiple deprivation at the small-area level by harnessingnew data sources is not however simply a case of trawling for indicators of depriva-tion from administrative sources and combining them in a hotchpotch manner In thefirst place there should be a clear theoretical or conceptual framework which under-pins a model of small area deprivation Second the methodology for the index orsummary measure must be an operationalisation of that model Third however gooda measure or set of measures might be it must also if commissioned to serve a specificpurpose be fit for that purpose
An index should be neither driven by available data nor by statistical techniquesOnce a clear model has been developed data to provide indicators for the dimensionsof deprivation should be sought and statistical techniques utilised which are consistentwith the model
Establishing a clear theoretical framework for the measurement of small-area deprivation`We must first know what poverty is before we can identify where and when it isoccurring or attempt to measure it and before we can begin to do anything toalleviate it
Alcock (1997 page 57)
In his 1979 account of Poverty in the United Kingdom Townsend sets out the case fordefining poverty in terms of relative deprivation Thus his definition of poverty is
` Individuals families and groups can be said to be in poverty if they lack theresources to obtain the types of diet participate in the activities and have the livingconditions and amenities which are customary or at least widely encouraged orapproved in the societies to which they belong (Townsend 1979 page 31)
Though `poverty and deprivation have often been used interchangeably many haveargued that a clear distinction should be made between them (see for example thediscussion in Nolan and Whelan 1996) It could be argued that the condition of povertymeans not having enough financial resources to meet needs Deprivation on the otherhand refers to unmet need which is caused by a lack of resources of all kinds not justfinancial In a similar vein Atkinson (1998) notes that in recent debates on `social Europethe terms `poverty and `social exclusion have been on occasions used interchangeablybut he defines poverty as a ` lack of money or material possessions Townsend himselfconcurs In his article ` Deprivation Townsend argues that
` people can be said to be deprived if they lack the types of diet clothing housinghousehold facilities and fuel and environmental educational working and socialconditions activities and facilities which are customary People are in poverty ifthey lack the resources to escape deprivation (Townsend 1987 pages 131 and 140 ouritalics)In his 1987 article Townsend elaborates distinctions between social and material
deprivation The formeroumlwhich he acknowledges is more difficult to measureoumlhedescribes as ` providing a useful means of generalising the condition of those who donot or cannot enter into ordinary forms of family or other relationships The moreeasily measured material deprivation relates to diet health clothing housing house-hold facilities environment and work (Townsend 1987 page 136) By identifying bothsocial and material deprivation he is anticipating some aspects of what one might now
172 M Noble G Wright G Smith C Dibben
call `social exclusion Townsend also lays down the foundation for articulating multipledeprivation as an accumulation of single deprivations
Townsends formulation of multiple deprivation is the starting point for our model ofsmall-area deprivation which is presented here in respect of the design of new measuresof deprivation for the United Kingdom Though Townsends work mainly (though notentirely) referred to individuals experiencing deprivationoumlsingle or multipleoumlthearguments can in modified form extend to area-based measures However limitationsof data availability inevitably cause some of the sophistication of his original conceptto be lost in practice It is currently difficult to measure the percentage of the popula-tion experiencing more than one type of deprivation in such a way as to reflect the manydifferent domains of deprivation though this can be accomplished within the parametersof the variables available in the census by commissioning special census tables (andsee Atkins et al 1996) There may also be scope for more comprehensive individual-level analyses of multiple deprivation in future if the United Kingdom develops itsadministrative data systems in for example the Swedish style (for more on this seeSmith et al 2004) It is possible to look at single deprivations at an area level and statethat a certain proportion of the population experiences that deprivation or a propor-tion experiences some other form of deprivation and at an area-level describe thecombination of single deprivations as area-level multiple deprivation This approachthus conceptualises multiple deprivation as a composite of different dimensionsor domains of deprivation It however says little about the individual experience ofmultiple deprivation
The use of the word `domains in respect of indices of deprivation is not ourinvention Robson used the term to describe the areas of socioeconomic life fromwhich indicators were selected He specifically mentions `environment `education`income and `jobs (Robson et al 1995) In another part of the report he groups thesefurther into environment `skillssocialisation and `resource base They are not wewould argue intended to convey discrete dimensions of deprivation as a starting pointfor constructing an index but rather the `sphere from which the indicators of depriva-tion are drawn (further implications of this approach are given in the section ondomain weights below) We use the term `domain quite differently Domains for usare area-level dimensions of deprivation which need to be measured as accuratelyas possible and which aggregate to a measure of multiple deprivation Thus eachdimension is measured independently with the best indicators available to generate ascore or domain measure for each aspect of deprivation These domain scores are thencombined with explicit weighting to generate a multiple-deprivation measure As will bediscussed the availability of new data has allowed these domains to be described withmore precision and in a more robust and consistent way than has been possible before
The approach allows the separate measurement of different dimensions of depriva-tion such as housing deprivation education deprivation and health deprivation Thereis a question whether there should be an additional domain for low income or one thatmeasures the lack of socially perceived necessities (Gordon et al 2000) (for exampleadequate diet consumer durables and ability to afford social activities) To followTownsend within a multiple-deprivation measure only the deprivations resultingfrom a low income would be included so low income itself would not be a componentbut lack of socially perceived necessities would However there are no readily availablesmall-area data on the lack of socially perceived necessities and therefore low incomeis an important indicator for these aspects of material deprivation Moreover thereare arguments that measures of consumption are themselves problematic as lack ofcertain items may be by choice rather than inability to pay for them Therefore it isappropriate to measure low income itself rather than the possession of certain items
Measuring multiple deprivation at the small-area level 173
We therefore recognise income deprivation in its own right but would not arguethat it should be the only measure of area deprivation Other dimensions of depriva-tion contribute crucial further information about an area However low incomeremains a central component of the definition of multiple deprivation for our workin the United Kingdom As Townsend writes ` while people experiencing some formsof deprivation may not all have low income people experiencing multiple or single butvery severe forms of deprivation are in almost every instance likely to have very littleincome and little or no other resources (1987 page 131)
`Multiple deprivation is thus not some separate form of deprivation It is simplya combination of more specific forms of deprivation which themselves can be moreor less directly measurable It is an empirical question whether combinations of thesedifferent forms of deprivation are more than the sum of their parts that is whetherthey are not simply additive but interact and may have greater impact if found incertain combinations
This perspective accommodates the reality of varying combinations of deprivationand disadvantage in different types of areas which has been a persistent finding on thegeographical distribution of different forms of deprivation and disadvantage sincethe pioneering work of Webber (1975) in Liverpool in the 1970s But it does raisequestions about the addition of items to form a measure of `multiple deprivationAnd if multiple deprivation cannot be directly quantified then there are problems intechnically validating any overall multiple-deprivation measure as this would requiresomething against which the multiple-deprivation measure can itself be compared Ifthis is correct then the question of how components in the overall multiple-deprivationmeasure might be weighted becomes a central question
Measuring different aspects of deprivation and combining these into an overallmultiple-deprivation measure raises a number of questions Perhaps the most importantis the extent to which area deprivation in one dimension can cancel out deprivation inanother Thus if an area is found to have high levels of income deprivation but relativelylow levels of education deprivation should the latter cancel out the former and if so towhat extent Our model is essentially a weighted cumulative one and we argue for limitedcancellation effects
Another question concerns the extent to which the same people or households arerepresented in more than one of the dimensions of deprivation In previous indiceswhich used census data no explicit information is available on this aspect of theconceptual framework The `households with no access to a car may well have beenthe same households who `live in overcrowded accommodation The combination inearlier indices takes no account of possible double counting nor do the publishedaccounts address the potential problem Our position is that if a family or areaexperiences more than one form of deprivation this is `worse than experiencing onlyone deprivation We are therefore not concerned with eliminating double countingbetween domainsoumlwe want this if it is appropriate To summarise the model whichemerges from this theoretical framework is of a series of unidimensional domains ofdeprivation which may be combined with appropriate weighting into a single measureof multiple deprivation
Having agreed upon this model the methodology and statistical techniques shouldbe selected to facilitate its operation There are a number of steps to this process(1) The dimensions of deprivation which can reasonably be combined into a measureof multiple deprivation must be identified(2) These dimensions or domains must be measured as accurately as possible withindicators which pass certain tests of fitness
174 M Noble G Wright G Smith C Dibben
(3) Problems of unacceptable standard error must be dealt with in a way which doesnot introduce unintended consequences(4) The indicators must be combined in such a way as to best measure the construct inquestion(5) The scores of each domain must be capable of being ranked to generate a relativepicture for that aspect of deprivation(6) The domain scores or ranks must be standardised and transformed in a way whichallows for their weighted combination into an overall index This transformation mustavoid generating implicit weights All weighting should be explicit Finally the trans-formation should take into account rules from the model about the cancellationproperties desired when combining the domains(7) Appropriate weights for the domains should be selected
This approach implies rather more items in total than in earlier overall measures ofdeprivation It also requires `domain specific items (and not what often happens whenfor example `educational deprivation is measured by a mix of education social andeconomic factors in combination) It also requires procedures for combining itemswithin any domain index according to clear rules
The spatial scaleA measure of area deprivation should be able to quantify deprivation at a spatiallevel lower than local authority so that policymakers can target resources effectivelyIn an ideal world these would approximate to `neighbourhoods or at least be smallareas with similar characteristics and a standard population size It is also importantthat wherever possible the indicators and their denominators are available or can beconstructed at that spatial level The availability of data for small areas in the inter-censal period has improved with the increasing availability of welfare benefitsand other data at the individual anonymised level which can then be aggregated tosub-local-authority-level areas
At the time of the construction of the ID 2000 there were two possible sub-local-authority geographies available The first consisted of 1991 Census wards andthe enumeration districts which comprise them The second were the then current(1998) wards Because there had been considerable local-authority-boundary andward-boundary changes in England in the mid-1990s and following consultation the1998 ward boundaries were selected In Wales and Scotland where boundary changeshad also occurred the then current wards (known as `electoral divisions in Wales) wereused In Northern Ireland where boundary changes were much less frequent the 1984boundaries on which the 1991 Census was based were used Wards are howeverproblematic They vary greatly in population size (from less than 1000 to over 30 000)and do not always meet the criteria of homogeneity
Since the construction of these indices there have been major developments in theconstruction of statistical geographies Following the introduction in the 2001 Censusof an output statistical geography where homogeneity and even population size wereimportant characteristics (Martin 2001) the Office for National Statistics (2003) hasdeveloped a statistical geography known as `Super Output Areas (SOAs) The lowerlevel SOAs are combinations of adjacent output areas nest within 2003 ward bounda-ries have a relatively tight population specification (mean population of 1519 andstandard deviation of 200) and are relatively homogenous They were constructedwith a modified version of the algorithm used to generate output areas These moreclosely resemble our `ideal geographical unit and were used in the English ID 2004(Noble et al 2004 page 16)
Measuring multiple deprivation at the small-area level 175
Domains and indicatorsAs we have indicated it follows from the conceptualisation of multiple deprivation wehave articulated that indicators of a particular aspect of deprivation should be com-bined initially to form domains of deprivation This process produces a score for eachof the domainsoumla domain deprivation measure or `domain indexoumlwhich can beranked across the country in question to give a relative picture of each dimension ofdeprivation The domain deprivation measures can then be combined into an overallmultiple-deprivation measure
The domains comprising the multiple-deprivation measures have varied in the differ-ent indices we have constructed This variation has been driven partly by the availabilityand robustness of data and partly by developments in the conceptualisation of eachdomain (for a list of the domains in each index please see table 2) The domains wereeach presented as a separate deprivation measure or score as each domain reflects aparticular aspect of deprivation For example the employment domain captures exclu-sion from the world of paid workoumlnot the low income that may flow from it Similarlythe education domain does not include markers of income deprivation such aschildren in receipt of free school meals as children living in low-income families aremeasured within the income domain This approach avoids the need to make anyjudgments about the complex links between different types of deprivation (for examplethe links between poor health and unemployment)
The domains each represent a type of deprivation that is measured as directly aspossible rather than comprising a set of `vulnerable groups (that is groups of peopleat risk of deprivation) Each domain contains a number of indicators The criteria forthese indicators were that they should be(1) `domain specific and appropriate for the purpose (as direct as possible measures forthat form of deprivation)(2) measuring major features of that deprivation (not conditions just experienced bya very small number of people or areas)(3) up-to-date(4) capable of being updated on a regular basis(5) statistically robust and(6) available for the whole of the country in question at a small-area level in aconsistent form
The indicators that were included in the measures of deprivation have been con-structed using a range of techniques Some of the data were obtained at the individuallevel (with due regard to issues of confidentiality) and aggregated to ward or SOA levelsome were obtained at other levels (for example the Labour Force Survey at local-authority-area level) and then `modelled down to ward or SOA level Postcoded datawere assigned to relevant wards or SOAs by using appropriate postcode look-up tablesAs far as possible all the data included relate to one time point (199899 for Englandand Wales 1999 for Northern Ireland and 2001 for Scotland and the later English ID2004 which relates to 2001)
One problem which had to be addressed at the outset of the construction of themultiple-deprivation measure was the question of how the indicators should be scoredor scaled (if at all) to allow fair comparisons between areas and appropriate combina-tion with other indicators The data were not all in the same units of measurement andif the raw data had been used the results would have been driven largely by the size ofthe population For these reasons it was not possible to count the numbers of peopleexperiencing each deprivation and add them together Instead where possible rates orsome other standard form of measurement were used which allows areas of differentsizes to be compared
176 M Noble G Wright G Smith C Dibben
The small-numbers problem and the shrinkage techniqueIn some areas particularly where populations at risk are small data may be `unreliablethat is more likely to be affected by measurement error or sampling error with particularwards getting unrepresentatively low or high scores on certain indicators The extent ofthe `unreliability of a score can be measured by calculating its standard error
This problem emerged in the construction of other indices or measures of multi-ple deprivation in the past and this prompted the use of the signed w2 statistic (seefor example Robson 1994) However this technique has been much criticised for itsuse in this context because it conflates population size with levels of deprivation (seefor example Connolly and Chisholm 1999) Given the problems with the signed w2
approach another techniqueouml`shrinkage estimation that is empirical Bayesianestimationoumlhas been used subsequently to deal with the problem (for England seeNoble et al 2000a page 16 for Wales see Noble et al 2000e page 8 for NorthernIreland see Noble et al 2001 page 11 for Scotland see Noble et al 2003a page 15)
Shrinkage involves moving `unreliable ward scores (that is those with a highstandard error) towards another more robust score This may be towards more depriva-tion or less deprivation There are many possible candidates for the `more robust scoreto which an unreliable score could moveWe have selected the district mean but otherscould in theory include the national mean the means of areas of similar characteristicsor the mean of adjacent wards
It is our view that moving unreliable scores towards the mean score for the wholecountry in question would be inappropriate because of the large variation acrossthe country and because we wanted to take into account local circumstances `Borrow-ing strength from adjacent wards is technically straightforward but is problematicespecially near the edges of towns or other heterogeneous areas where the adjacentwards may have different characteristics (Clayton and Kaldor 1987) Though shrinkingto the mean of wards with similar characteristics is superficially attractive there arealso problems First at the time of construction of each of the indices there wereno classification systems based on the boundaries which were used Second any newclassification of `similarity would have been contentious and would have warranteda project and consultation process in its own right Shrinkage to the district mean(which is in essence the same as shrinking to the population-weighted ward mean fora district) has advantages Like shrinking to adjacent wards shrinking to the districtmean takes into account local socioeconomic features but by effectively pooling thedistrict wards this overcomes some of the disadvantages of shrinking to adjacent wardsin that the impact of heterogeneity is reduced
It could be argued that `shrinkage estimation is inappropriate for administrativedata which are in effect a census This is not correct The problem exists not onlywhere data are derived from samples but also where scans of administrative dataeffectively mean that we have an entire census of a particular group This is becausesuch censuses can be regarded as samples from `super populationsoumlone could con-sider these to be samples in time For example in an area there may have only beenthree babies born in a year one of which had a low birth weight If we took anotheryear there may have been four babies born one of which had a low birth weight Theproportions thus fluctuate between a third and a quarter probably by chance eventhough the underlying at-risk population (that is health-deprived women) is the sameBy contrast another area might have 200 live births a year with twenty children whosebirth weight is low The 10 this represents is less likely to be the result of randomfluctuation We measure the extent of the `unreliability of a score by calculating itsstandard error
Measuring multiple deprivation at the small-area level 177
The actual mechanism of the procedure is to estimate deprivation in a particularward with a weighted combination of (a) data from that ward and (b) data fromanother more robust source [for example the local authority (LA) mean] The weightattempts to increase the efficiency of the estimation while not increasing its bias If theward has a high standard error and a district appears to be an unbiased estimation ofthe ward score then the ward score moves towards the district score
Although most scores move a small amount only `unreliable scores that is thosewith a large standard error move significantly The amount of movement depends onboth the size of the standard error and the amount of heterogeneity amongst the wardsin an LA
The `shrunken estimate of a ward-level proportion (or ratio) is a weighted averageof the two `raw proportions for the ward and for the corresponding LA(1) The weightsused are determined by the relative magnitudes of within-ward and between-wardvariability The `shrunken ward-level estimate is the weighted average
z j wj zj 1yuml wj z where zj is the ward-level proportion z is the LA-level proportion wj is the weightgiven to the `raw ward-j data and (1yuml wj ) the weight given to the overall proportionfor the LA The formula used to determine wj is
wj 1
s 2j
1
s 2j 1
t 2
where sj is the standard error of the ward-level proportion and t 2 is the interwardvariance for the k wards in the LA calculated as
t 2 1
kyuml 1
Xk
j 1
zj yuml z2
Combining the indicators into domain deprivation measures or domain indicesFor each domain of deprivation (for example income and employment) the aim isto obtain a single summary measure whose interpretation is straightforward in that itis if possible expressed in meaningful units (for example proportions of people or ofhouseholds experiencing that form of deprivation) In some domains (for exampleincome and employment) where the underlying metric is the same and where theindicators are nonoverlapping the indicators can be simply summed and divided bythe population at risk to create an area rate In other domains deprivations tend toexist in different spatial and temporal forms so for example an area will be educationdeprived if the young people have poor educational performance or poor schoolattendance These two situations coexist in an area but relate to different individualsat any given point in time In these cases it is hypothesised that an underlying factorexists at an ecological level that makes these different states likely to exist together ina local area This underlying factor cannot be measured directly but can be identifiedthrough its effect on individuals These variables need to be combined at an ecologicallevel to create an area score
There are a number of ways in which a set of indicators might be used to identify asingle dimension of deprivation The indicators could be combined after appropriatestandardisation with weights determined by researcher judgment This judgment might
(1)Where appropriate the weighted average is calculated on the logit scale for technical reasonsprincipally because the logit of a proportion is more nearly normally distributed than the proportionitself
178 M Noble G Wright G Smith C Dibben
be based on some theoretical premise of the relationship between the various indicatorsand the latent component or it might be possible to assign weights based on the scrutinyof the intercorrelations of the indicators This method has been used in such a way as toidentify the indicator that had the highest correlation within the set of indicators andthen to use this as a `headline indicator (Robson et al 2001)
Alternatively if we assume the existence of a latent construct of the domain ofdeprivation in question factor analysis can be used to generate weights for the indica-tors There are a number of problems associated with the accurate identification ofsuch an underlying factor The variables (1) are measured on different scales (2) havedifferent levels of statistical accuracy (3) have different distributions and (4) measureto different degrees the underlying factor imperfectly Maximum-likelihood (ML) factoranalysis was used with a view to overcoming these problems Other methods such asapplying a linear-scaling model (that is adding a large number of items that purport tomeasure the same construct together to increase the reliability of a scaleoumlassuming errorelements to be nonadditive and random) deal with only some Alternative statisticalmethods such as principal components analysis (PCA) do not address all these problemsPCA for example ignores measurement error (error variance) or the variables imperfectmeasuring of the underlying construct (specific variance) This is because it does notattempt to separate common variance (that is variance shared between three or morevariables) from specific variance and error variance The appropriate technique wherespecific and error variance are suspected [that is problems (2) and (4)] is a form ofcommon-factor analysis of which ML factor analysis is a type
The premise behind a simple one-common-factor model is that the underlyingfactor is imperfectly measured by each of the variables in the dataset but that thevariables that are most highly correlated with the underlying factor will also be highlycorrelated with the other variables By analysing the correlation between variables it istherefore possible to make inferences about the common factor and indeed to estimatea factor score for each case (that is ward) This of course assumes that the variablesthemselves are all related to the underlying factor to some extent and are in most casesfairly strongly related to it
It is not the aim of this analysis to reduce a large number of variables into anumber of theoretically significant factors as is usual in much social science use offactor analysis (that is exploratory factor analysis) The variables are chosen becausethey are believed to measure a single-area deprivation factor The analysis thereforeinvolves testing a one-common-factor model against the possibility of there being morethan one factor If a meaningful second common factor is found it would suggest theneed for a new domain or the removal of variables Decisions over whether a mean-ingful second common factor exists are aided by standard tests and criteria such asexamination of eigenvalues Before factor analysis was applied the indicators weresubjected to the shrinkage technique as described above and transformed to a normaldistribution
Once a satisfactory solution has been achieved a factor score can be estimated foreach ward or SOA That is the combined indicators with weights generated by thefactor analysis process are then used as the domain score
Standardising and transforming the domain deprivation measures or domain indicesHaving obtained a set of domain deprivation measures or domain indices we neededto combine them into an overall `index of multiple deprivation As domain deprivationmeasures are each based on very different units of measurement there needed to besome way to standardise the scores before any combination could take place A formof standardisation and transformation was required that met the following criteria
Measuring multiple deprivation at the small-area level 179
First it must ensure that each domain has a common distribution second it must notbe scale dependent (that is conflate size with level of deprivation) third it must havean appropriate degree of cancellation built into it (discussed below) and fourth it mustfacilitate the identification of the most deprived wards Transformation of the ranks toan exponential distribution met these criteria
Other procedures were considered such as z-scores or untransformed ranks Use ofthe ranks for each domain would solve some problems but would introduce othersRanks would certainly put domains onto the same metric The symmetrical nature ofranks and `z-scores of normally distributed data means that a `good score on onedomain could fully cancel out a `bad score on another This means that a relative lackof deprivation in one domain would have had a major impact on a more severedeprivation in another domain when combined into an overall deprivation result
The exponential distribution selected meets the criteria set out above in the follow-ing ways First the technique involves the transformation of each domain so that theyeach have a common distribution the same range and identical maximum and mini-mum values so that when the domains are weighted and combined into a singlemultiple-deprivation measure the impact of the weights is much clearer Second theresults are not affected by the size of the population of the ward Third the part ofdistribution in which there is most interestoumlthat is the `tail which contains the mostdeprived wards in each domainoumlis spread out Fourth it enables one to determine thedesired cancellation properties
The transformation to an exponential distribution was carried out by first rankingthe scores in each domain The ranking standardised the domain scores These rankswere then transformed to a truncated exponential distribution For any ward denoteits rank on the domain scaled to the range [0 1] by R (with R 1=N for the leastdeprived and R N=N that is R 1 for the most deprived where N is the numberof wards in the country in question)
The transformed domain X say is given by
X yumldln1yuml R
1yuml expyuml
100
23
where d is a constant and represents a `family of transformations with differentcancellation properties and in this case equals 23
Each transformed domain has a range of 0 to 100 with a score of 100 for themost deprived ward The chosen exponential distribution is one of an infinite numberof possible distributions The constant (23) determines that approximately 10 ofwards have a score higher than 50 When transformed scores from different domainsare combined by averaging them the skewness of the distribution reduces the extentto which deprivation on one domain can be cancelled by lack of deprivation onanother For example if the transformed scores on two domains are simply averagedwith equal weights a (hypothetical) ward that scored 100 on one domain and 0 onthe other would have a combined score of 50 and would thus be ranked at the 90thpercentile (Averaging the untransformed ranks or after transformation to a normaldistribution would result in such a ward being ranked instead at the 50th percentilethe high deprivation in one domain would have been fully cancelled by the lowdeprivation in the other) Thus the extent to which deprivation in some domainscan be cancelled by lack of deprivation in others is by design reduced The expo-nential distribution stretches out the distribution so that greater levels of deprivationscore more highly
The issue of cancellation is clearly important for understanding the nature ofmultiple deprivation If for example there were data on an individual who was
180 M Noble G Wright G Smith C Dibben
known to be at the top of the income distribution but who had no educationalqualifications an argument might be made that the lack of income deprivation shouldcancel out fully the education deprivation and that this individual should be judged tobe not deprived (However even here there would be arguments against such a directand full cancellation) Our approach in the measures of deprivation has been to con-ceptualise the various deprivations as measured by each domain as separate anddistinct though they may have cumulative effects in an area (or for any individual)Thus to be poor and in ill health is clearly a worse state than experiencing just one ofthese deprivations on their own It would be conceptually inappropriate for someonewho is poor but healthy to have their income deprivation discounted because they arefortunate enough to be in good health (though this is in effect what many previousindices of multiple deprivation have sometimes done)
The significant advantage of the family of transformations used is that it givescontrol over the extent to which lack of deprivation in one domain cancels or compen-sates for deprivation in another domain In particular it allows precise regulation(though not the elimination) of these cancellation effects The transformation techniquehas been used in a way that reflects a level of cancellation appropriate for thisapproach to multiple deprivation
Weighting the domainsOne of the most difficult and contentious issues faced by all who seek to constructan overall index of multiple deprivation is the question of what `explicit weight shouldbe attached to the various components (Coombes et al 1995 Noble et al 2004)The weight is the measure of importance that is attached to each component in theoverall composite measure
In the English Index of Local Conditions (ILC) 1991 (DoE 1994) and the EnglishIndex of Local Deprivation (ILD) 1998 (DETR 1998) indicators were simply summedthat is to say given equal weight Because these previous indices contained morevariables relating to some aspects of deprivation than others they in fact weightedthose aspects of deprivation more than others To take the ILC 1991 as an example thishad seven indicators at ward level which were given equal weight In fact three ofthe indicators related to what might be termed `housing deprivationouml(overcrowdinglacking amenities and children in unsuitable accommodation) two to `income depri-vationouml(no car children in low-earner households) one relating to employmentdeprivation (unemployment) and one relating to education deprivation (low educa-tion participation) In the 1998 update one of the housing indicators was dropped(children in unsuitable accommodation) The resulting weights for the ILC 1991 andILD 1998 at ward level are shown in table 1
In fact even that is not the whole storyoumlas has been discussed above the actualprocess by which indicators or domain scores are standardised and transformed before
Table 1 Domain weights for the Index of Local Conditions (ILC) 1991 and the Index of LocalDeprivation (ILD) 1998 for England
Domain weight ()
ILC 1991 ILD 1998
Income deprivation 2850 3333Employment deprivation 1425 1667Education deprivation 1425 1667Housing deprivation 4275 3333
Measuring multiple deprivation at the small-area level 181
combination is important as some standardisation techniques such as z-scores canresult in the introduction of unintended `implicit weights
How can one attach weights to the various aspects of deprivation That is howcan one determine which aspects are more important than others As has beenshown simply summing indicators can itself lead to weighting which may bedriven more by the availability of indicators rather than by any conceptual modelof multiple deprivation
There are at least five possible approaches to weighting(1) driven by considerations emerging from the literature on multiple deprivation andsocial exclusion(2) empirically driven(3) determined by policy relevance(4) determined by consensus or(5) entirely arbitrary
In the first approach account is taken of the available research evidence which informsthe conceptual model of multiple deprivation and weights are selected which reflect thisresearch (Coombes et al 1995) There are two sorts of empirical approaches that might beapplicable First a commissioned survey or reanalysis of an existing survey might generateweights Here one might generate a proxy for multiple deprivation or exclusionoumlperhapsin terms of socially perceived necessitiesoumland use multivariate predictive modelling toderive weights A possible recent data set for reanalysis in this way is the MillenniumPoverty and Social Exclusion Survey (Gordon et al 2000) Second one might apply atechnique such as factor analysis to extract some latent `factor called `multiple depriva-tion assuming that is that the analysis permitted a single-factor solution (see Coombeset al 1995 Senior 2002)
Alternatively the individual domain scores could be released and weighted forcombination in accordance and (proportion) to the focus of particular policy initia-tives or weighted in accordance with public expenditure on particular areas of policyAnother approach would be for policymakers and other customers or experts to beconsulted for their views and the results examined for consensus (Coombes et al 1995)
Finally simply choosing weights without reference to the above or even selectingequal weights in the absence of empirical evidence would come into the category ofentirely arbitrary Weighting always takes place when elements are combined togetherThus if the domains are summed together to create a multiple deprivation measurethis means they are given equal weight It would be incorrect to assume that items canbe combined without weighting
For the English ID 2000 and ID 2004 and theWelsh Northern Ireland and Scottishindices we attempted to take into account relevant research literature (Townsend 1987and discussed at length in Bradshaw et al 2004) as well as views emerging from theconsultation process Both the literature and the consultation processes supportedthe assignment of the greatest weights to the income and employment domains Basedon these criteria the weights shown in table 2 were used For each index extensivesensitivity tests using various weight combinations were undertaken Because of thehigh correlation between many of the domains the differently constructed indices ofmultiple deprivation themselves correlated highly (see for example Noble et al 2000b)
ConclusionThe aim of this paper was to provide an account of the key principles that weretaken into consideration when constructing five recent indices of multiple depriva-tion within the United Kingdom and of the statistical techniques that were used tooperationalise them It has been argued that in order to measure multiple deprivation
182 M Noble G Wright G Smith C Dibben
at a small-area level it is essential to have a clear conceptual model and translate thisinto a series of measures with the best data available The measures should be drivenby the conceptual framework not by the data The statistical techniques selected tostandardise and combine the data should also be chosen to support the conceptualframework Inevitably these techniques aim to balance statistical integrity with areasonable level of transparency
Setting aside issues relating to specific domains and indicators which fall beyondthe scope of this paper there are a number of issues relating to the methodology whichwould benefit from further research These include possible refinements to the shrinkageestimation technique and in particular investigation as to the most appropriate areasfrom which to `borrow strength to increase the robustness of small-area-level indicatorsThere is also a need for further work on the selection of domain weightsoumla promisingempirical direction for such research relates weighting to subjective wellbeing (Kingdonand Knight 2003)
AcknowledgementsWe would like to thank Professor David Firth and Clive Payne who providedus with statistical advice We would also like to thank all members of the Social DisadvantageResearch Centre in the Department of Social Policy and Social Work who participated in eachof these projects Finally we would like to thank the Office of the Deputy Prime Ministerthe National Assembly for Wales the Northern Ireland Statistics and Research Agency and theScottish Executive who funded each of these projects
ReferencesAlcock P 1997 Understanding Poverty (Macmillan Basingstoke Hants)Atkins D Champion T Coombes M G Dorling DWoodward R 1996 Urban Trends in England
Latest Evidence from the 1991Census (The Stationery Office London)Atkinson A B 1998 ` Social exclusion poverty and unemployment in Exclusion Employment and
Opportunity Eds A BAtkinson J Hills Centre for Analysis of Social Exclusion London Schoolof Economics London pp 1 ^ 20
Bradshaw J Kemp P Baldwin S Rowe A 2004 The Drivers of Social Exclusion A Review of theLiterature Office of the Deputy Prime Minister London
Table 2 Domain weights for recent UK indices
Domain weights ()
English Welsh Northern Ireland Scottish EnglishIndices Index Measures Indices Indicesof Depri- of Multiple of Multiple of Depri- of Depri-vation Deprivation Deprivation vation vation2000 2000 2001 2003 2004
Income deprivation 25 25 25 30 225Employment deprivation 25 25 25 30 225Health deprivation 15 15 15 15 135and disability
Education skills and 15 15 15 15 135training deprivation
Geographical access 10 10 10 10 nato services
Social environment na na 5 na naHousing stress 10 10 5 na naBarriers to housing na na na na 93and services
Living environment na na na na 93Crime na na na na 93
Note naETHnot applicable
Measuring multiple deprivation at the small-area level 183
Cemlyn S Fahmy E Gordon D Bennett S 2002 Poverty and Neighbourhood Renewal inWestCornwall Final Report University of Bristol Bristol and Cornwall Health Research UnitCornwall College Camborne Cornwall
Clayton D Kaldor J 1987 ` Empirical Bayes estimates of age standardized relative risks for usein disease mapping Biometrics 43 671 ^ 682
Connolly C ChisholmM1999 ` The use of indicators for targeting public expenditure the Index ofLocal Deprivation Environment and Planning C Government and Policy 17 463 ^ 482
Coombes M Raybould SWong C Openshaw S 1995 ` Towards an index of deprivation areview of alternative approaches part 1 of 1991Deprivation Index A Review of Approachesand a Matrix of Results Department of the Environment (The Stationery Office London)
DETR1998Updating and Revising the Index of Local DeprivationDepartment of the EnvironmentTransport and the Regions London
DoE 1983 ``Urban deprivation information note 2 Inner Cities Directorate Department ofthe Environment London
DoE 1994 Index of Local Conditions An Analysis Based on 1991Census Data Department ofthe Environment London
Gordon D Adelman L Ashworth K Bradshaw J Levitas R Middleton S Pantazis C Patsios DPayne STownsend PWilliams J 2000 Poverty and Social Exclusion in Britain Joseph RowntreeFoundation The Homestead 40 Water EndYork YO30 6WP
Hirschowitz R Orkin M Alberts P 2000 ` Key baseline statistics for poverty measurement inMeasuring Poverty in South Africa Ed R Hirschovitz Statistics South Africa Pretoria
Holterman S 1975 `Areas of urban deprivation in Great Britain an analysis of the 1971 censusdata Social Trends 6 Office for National Statistics London 33 ^ 47
Inner Urban Areas Act 1978 Public General ActsoumlElizabeth II chapter 50 (HMSO London)Kingdon G G Knight J 2003 ``Well-being poverty versus income poverty and capabilities
poverty CSAE WPS2003-16 Global Poverty Reduction Group Centre for the Study ofAfrican Economies University of Oxford Oxford
Kleinman M 1999 ` There goes the neighbourhood area policies and social exclusionNewEconomy 6 188 ^ 192
McCulloch A 2001 ` Ward-level deprivation and individual social and economic outcomes inthe British Household Panel Study Environment and Planning A 33 667 ^ 684
McIntyre D Muirhead D Gilson L Govender V Mbatsha S Goudge JWadee H Ntutela P2000 ` Geographic patterns of deprivation and health inequities in South Africa informingpublic resource allocation strategies Health Economics Unit University of Cape TownCape Town
Madhya Pradesh Human Development Report Project Office 1995 Madhya Pradesh HumanDevelopment Report Directorate of Institutional FinanceVindhyachal
Martin D 2001 ` Geography for the 2001 census in England and Wales paper prepared forCensus Geography Roadshow Office for National Statistics London
Noble M Penhale B Smith G A NWright G Dibben C Lloyd M 2000a ` Indices of deprivation2000 Regeneration research summary 31 Department of the EnvironmentTransport and theRegions London
Noble M Penhale B Smith G A NWright G Dibben C Lloyd M 2000b ` Response to theformal consultations on the indices of deprivation 2000 Department of the EnvironmentTransport and the Regions London
Noble M Smith G A N Penhale BWright G Dibben C Owen T Lloyd M 2000c ``Measuringmultiple deprivation at the local level the indices of deprivation 2000 Department of theEnvironment Transport and the Regions London
Noble M Smith G A N Penhale BWright G Dibben C Owen T Lloyd M 2000d ``Measuringmultiple deprivation at the small area level the indices of deprivation 2000 Regenerationresearch summary 37 Department of the Environment Transport and the Regions London
Noble M Smith GA NWright G Dibben C Lloyd M Penhale B 2000e ` Welsh index of multipledeprivation 2000 National Assembly for Wales Cardiff
Noble M Smith G A NWright G Dibben C Lloyd M 2001 ` The Northern Ireland multipledeprivation measure 2001 OP18 Northern Ireland Statistics and Research Agency Belfast
Noble MWright G Lloyd M Dibben C Smith G A N Ratcliffe A McLennan D Sigala MAnttila C 2003a Scottish Index of Deprivation 2003 Summary Report Scottish ExecutiveEdinburgh
184 M Noble G Wright G Smith C Dibben
Noble MWright G Lloyd M Dibben C Smith G A N Ratcliffe A McLennan D Sigala MAnttila C 2003b Scottish Index of Deprivation 2003 Full Report Scottish Executive webdocument available from httpwwwscotlandgovuklibrary5socialsiod-00asp
Noble MWright G Dibben C Smith G A N McLennan D Anttila C Barnes H Mokhtar CNoble S Avenell D Gardner J Covizzi I Lloyd M 2004 The English Indices of Deprivation2004 Office of the Deputy Prime Minister Neighbourhood Renewal Unit London
Nolan BWhelan C 1996 Resources Deprivation and Poverty (Clarendon Press Oxford)Office for National Statistics 2003 A Guide to the Neighbourhood Statistics Geography Policy
Office for National Statistics LondonPIU 2000 Reaching Out The Role of Central Government at the Regional and Local Level
Performance and Innovation Unit LondonRobson B 1994 Relative Deprivation in Northern Ireland Northern Ireland Statistics and Research
Agency BelfastRobson B BradfordMTye R 1995 `A matrix of deprivation in English authorities 1991 part 2 of
1991Deprivation Index A Review of Approaches and a Matrix of Results Department of theEnvironment (The Stationery office London)
Robson B Deas I Bradford MWong C Andersen M June 2001Deprivation in London AnAlternative to IMD2000Centre forUrbanPolicy StudiesUniversityofManchesterManchester
Salmond C Crampton P Sutton F 1998 NZDep96 Index of Deprivation Health Services ResearchCentreVictoria University of WellingtonWellington
Senior M 2002 ` Deprivation indicators in The Census Data System Eds P Rees D MartinP Williamson (JohnWiley Chichester Sussex) pp 123 ^ 139
Smith G 1999 `Area based initiatives the rationale and options for area targetting CASEpaper 25 London School of Economics London
Smith GAN NobleM Anttila C Gill L Zaidi AWright G Dibben C Barnes H 2004 ` The valueof linked administrative records for longitudinal analysis report to the ESRC NationalLongitudinal StrategyCommittee available fromDepartment of Social Policy and SocialWorkUniversity of Oxford Oxford wwwccsracukmethodseventsLSdocumentsnoble2 000pdf
Social Research and Western Cape Population Unit 1999 Poverty in theWestern Cape An Analysisof Poverty in theWestern Cape as Enumerated in the 1996 Census Department of Health andSocial ServicesWestern Cape Provincial Government Private Bag X9043 Cape Town 8000
Townsend P 1979 Poverty in the United Kingdom (Penguin Books Harmondsworth Middx)Townsend P 1987 ` Deprivation Journal of Social Policy 16 125 ^ 146Webber R 1975 Liverpool Social Area Study 1971Data Final Report Centre for Environmental
Studies London
Measuring multiple deprivation at the small-area level 185
szlig 2006 a Pion publication printed in Great Britain
Conditions of use This article may be downloaded from the EampP website for personal researchby members of subscribing organisations This PDF may not be placed on any website (or otheronline distribution system) without permission of the publisher
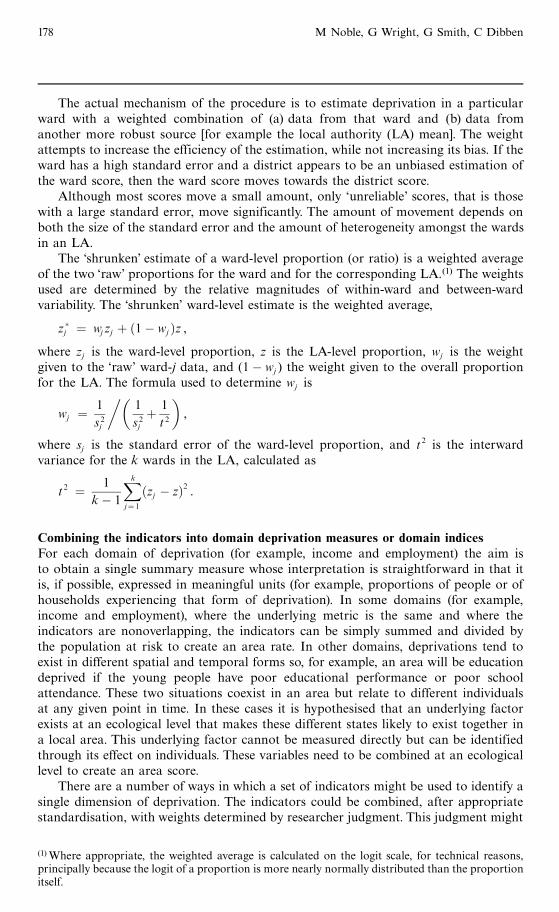
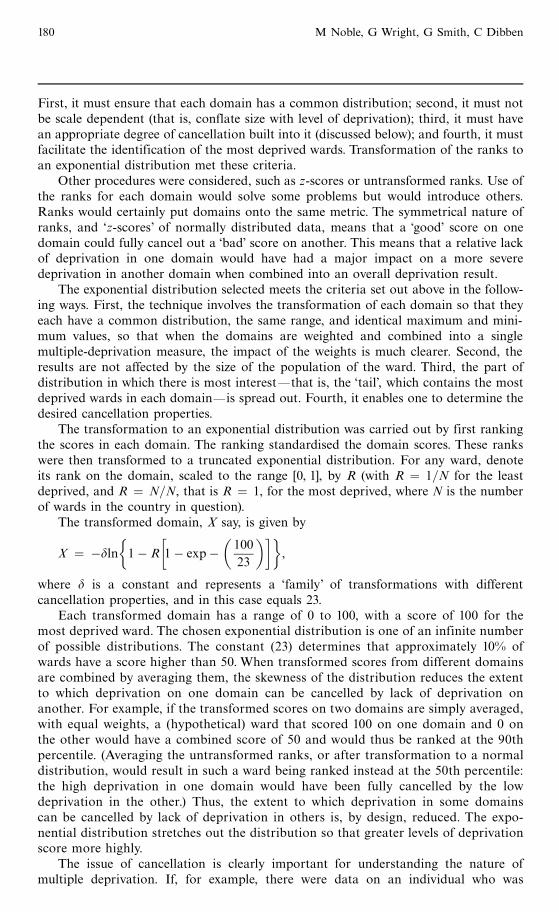
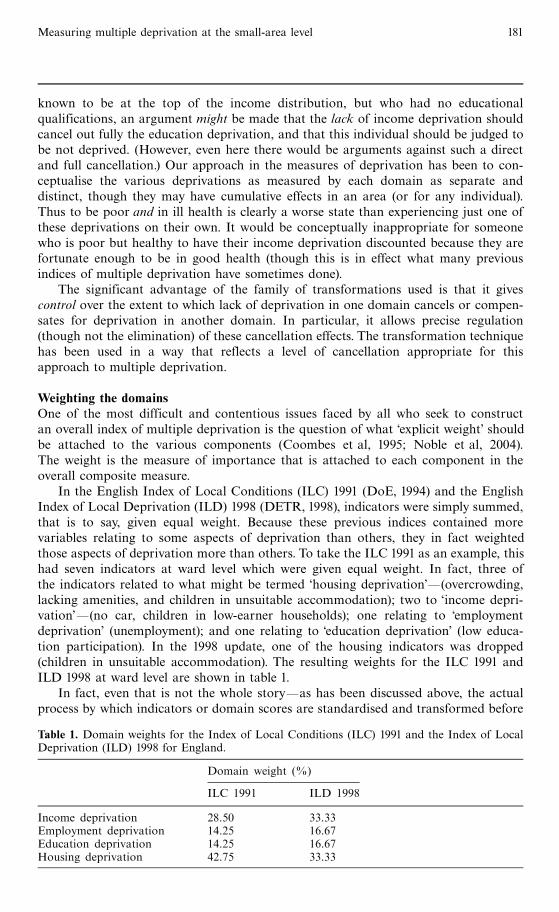
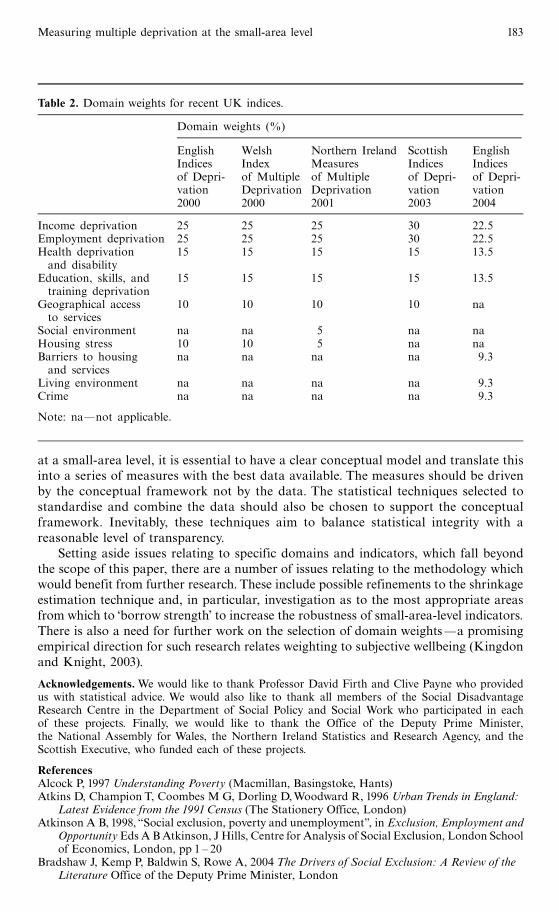

Conditions of use This article may be downloaded from the EampP website for personal researchby members of subscribing organisations This PDF may not be placed on any website (or otheronline distribution system) without permission of the publisher