epilepsy and deprivation, a data linkage study
TRANSCRIPT

Online Proofing System Instructions The Wiley Online Proofing System allows authors and proof reviewers to review PDF proofs, mark corrections, respond to queries, upload replacement figures, and submit these changes directly from the PDF proof from the locally saved file or while viewing it in your web browser.
1. For the best experience reviewing your proof in the Wiley Online Proofing System please ensure you are connected to the internet. This will allow the PDF proof to connect to the central Wiley Online Proofing System server. If you are connected to the Wiley Online Proofing System server you should see the icon with a green check mark above in the yellow banner.
2. Please review the article proof on the following pages and mark any corrections, changes, and query responses using the Annotation Tools outlined on the next 2 pages.
3. To save your proof corrections, click the “Publish Comments” button appearing above in the yellow banner. Publishing your comments saves your corrections to the Wiley Online Proofing System server. Corrections don’t have to be marked in one sitting, you can publish corrections and log back in at a later time to add more before you click the “Complete Proof Review” button below.
4. If you need to supply additional or replacement files bigger than 5 Megabytes (MB) do not attach them directly to the PDF Proof, please click the “Upload Files” button to upload files:
5. When your proof review is complete and you are ready to submit corrections to the publisher, please click the “Complete Proof Review” button below:
IMPORTANT: Do not click the “Complete Proof Review” button without replying to all author queries found on the last page of your proof. Incomplete proof reviews will cause a delay in publication.
IMPORTANT: Once you click “Complete Proof Review” you will not be able to publish further corrections.
Online Proofing System Instructions
Connected Disconnected
USING e-ANNOTATION TOOLS FOR ELECTRONIC PROOF CORRECTION
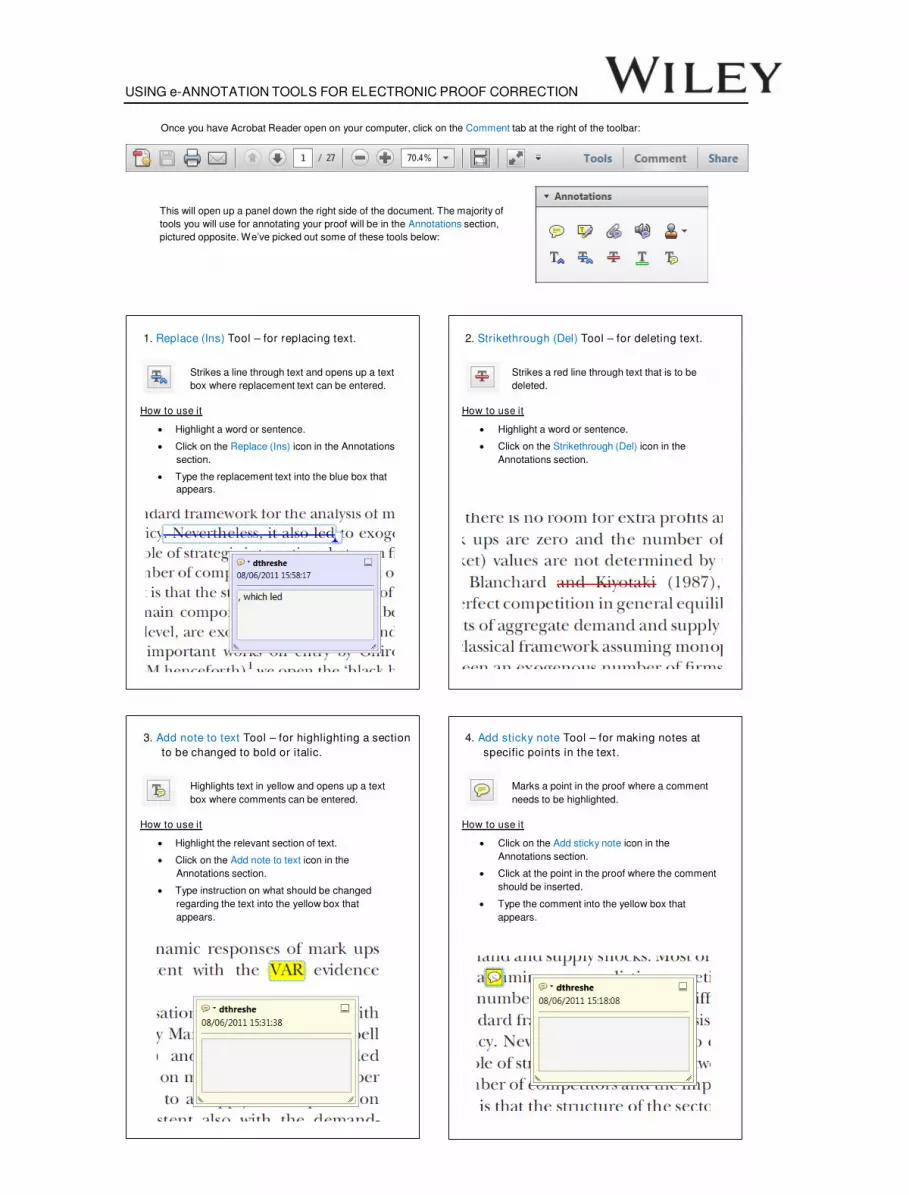
Once you have Acrobat Reader open on your computer, click on the Comment tab at the right of the toolbar:
This will open up a panel down the right side of the document. The majority of
tools you will use for annotating your proof will be in the Annotations section,
pictured opposite. We’ve picked out some of these tools below:
1. Replace (Ins) Tool – for replacing text.
Strikes a line through text and opens up a text
box where replacement text can be entered.
How to use it
‚ Highlight a word or sentence.
‚ Click on the Replace (Ins) icon in the Annotations
section.
‚ Type the replacement text into the blue box that
appears.
2. Strikethrough (Del) Tool – for deleting text.
Strikes a red line through text that is to be
deleted.
How to use it
‚ Highlight a word or sentence.
‚ Click on the Strikethrough (Del) icon in the
Annotations section.
3. Add note to text Tool – for highlighting a section
to be changed to bold or italic.
Highlights text in yellow and opens up a text
box where comments can be entered.
How to use it
‚ Highlight the relevant section of text.
‚ Click on the Add note to text icon in the
Annotations section.
‚ Type instruction on what should be changed
regarding the text into the yellow box that
appears.
4. Add sticky note Tool – for making notes at
specific points in the text.
Marks a point in the proof where a comment
needs to be highlighted.
How to use it
‚ Click on the Add sticky note icon in the
Annotations section.
‚ Click at the point in the proof where the comment
should be inserted.
‚ Type the comment into the yellow box that
appears.
USING e-ANNOTATION TOOLS FOR ELECTRONIC PROOF CORRECTION
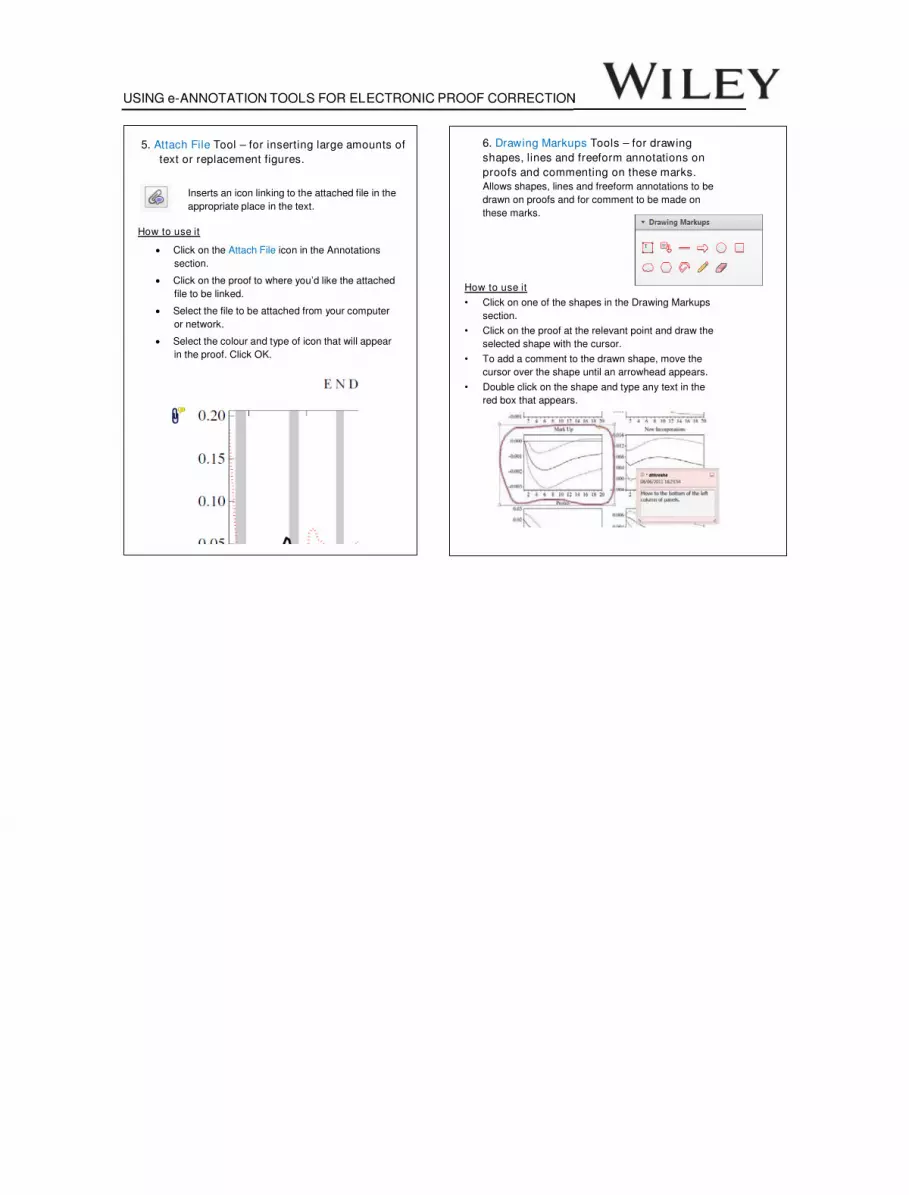
5. Attach File Tool – for inserting large amounts of
text or replacement figures.
Inserts an icon linking to the attached file in the
appropriate place in the text.
How to use it
‚ Click on the Attach File icon in the Annotations
section.
‚ Click on the proof to where you’d like the attached
file to be linked.
‚ Select the file to be attached from your computer
or network.
‚ Select the colour and type of icon that will appear
in the proof. Click OK.
6. Drawing Markups Tools – for drawing
shapes, lines and freeform annotations on
proofs and commenting on these marks.
Allows shapes, lines and freeform annotations to be
drawn on proofs and for comment to be made on
these marks.
How to use it
" Click on one of the shapes in the Drawing Markups
section.
" Click on the proof at the relevant point and draw the
selected shape with the cursor.
" To add a comment to the drawn shape, move the
cursor over the shape until an arrowhead appears.
" Double click on the shape and type any text in the
red box that appears.
Epilepsy and deprivation, a data linkage study*WilliamO. Pickrell, †Arron S. Lacey, ‡OwenG. Bodger, †JoanneC. Demmler,
¶RhysH. Thomas, †RonanA. Lyons, §Phil E. M. Smith, *Mark I. Rees, and ¶Mike P. Kerr1
Epilepsia, **(*):1–7, 2015
doi: 10.1111/epi.12942
Owen Pickrell is a
clinical lecturer in
neurology.
SUMMARY
Objective: To investigate whether the link between epilepsy and deprivation is due to
factors associated with deprivation (social causation) or factors associated with a diag-
nosis of epilepsy (social drift).
Methods: We reviewed electronic primary health care records from 2004 to 2010,
identifying prevalent and incident cases of epilepsy and recording linked deprivation
scores. Logistic and Poisson regression models were used to calculate odds ratios and
incidence rate ratios. The change in deprivation was measured 10 years after the ini-
tial diagnosis of epilepsy for a cohort of people.
Results: Between 2004 and 2010, 8.1 million patient-years of records were reviewed.
Epilepsy prevalence and incidence were significantly associated with deprivation.
Epilepsy prevalence ranged from 1.13% (1.07–1.19%) in the most deprived decile to
0.49% (0.45–0.53%) in the least deprived decile (adjusted odds ratio 0.92, p < 0.001).
Epilepsy incidence ranged from 40/100,000 per year in the most deprived decile to 19/
100,000 per year in the least deprived decile (adjusted incidence rate ratio 0.94,
p < 0.001). There was no statistically significant change in deprivation index decile
10 years after a new diagnosis of epilepsy (mean difference�0.04, p = 0.85).
Significance: Epilepsy prevalence and incidence are strongly associated with depriva-
tion; the deprivation score remains unchanged 10 years after a diagnosis of epilepsy.
These findings suggest that increasing rates of epilepsy in deprived areas are more
likely explained by social causation than by social drift. The nature of the association
between incident epilepsy and social deprivation needs further exploration.
KEYWORDS: Epilepsy, Deprivation, Incidence, Prevalence.
Identifying links between disease epidemiology and
deprivation is important for understanding disease etiology,
planning health service provision, and reducing inequalities
in health. There is a well-known association between
increasing deprivation and the prevalence of many common
chronic diseases.1–3 Unfortunately, health care provision
does not always reflect the increased burden of disease in
more socioeconomically deprived areas—the inverse care
law.4 Several national and international strategies have
attempted to address this inequality.5,6
Epilepsy is a common chronic disorder with many under-
lying causes7 ; several studies confirm the association
between epilepsy prevalence and deprivation,8–11 but have
been unable to explain the link. An increased epilepsy prev-
alence in areas of high deprivation could be explained by
social drift, where factors associated with an epilepsy diag-
nosis, such as decreased employability or educational
attainment, cause a “downward drift” to a more deprived
status. An alternative explanation is social causation, where
factors associated with increased deprivation cause an
increased incidence of epilepsy;12,13 for example, perinatal
hypoxic injury, head trauma, and cerebrovascular disease
Accepted January 15, 2015.*Wales Epilepsy Research Network, Neurology and Molecular
Neuroscience Research Group, College of Medicine, Swansea University,Swansea, United Kingdom; †Farr Institute of Health InformaticsResearch, College of Medicine, Swansea University, Swansea, UnitedKingdom; ‡Institute of Life Sciences, College of Medicine, SwanseaUniversity, Swansea, United Kingdom; §Wales Epilepsy ResearchNetwork, Department of Neurology, University Hospital of Wales, Cardiff,United Kingdom; and ¶Wales Epilepsy Research Network, Institute ofPsychological Medicine and Clinical Neuroscience, Cardiff University,Cardiff, United Kingdom 2
Address correspondence to Owen Pickrell, Neurology and MolecularNeuroscience, College of Medicine, Institute of Life Science, Swansea_University, Swansea, Wales SA2 8PP, U.K. E-mail: [email protected]
Wiley Periodicals, Inc.© 2015 International League Against Epilepsy
1
2
3
4
5
6
7
8
9
10
11
12
13
14
15
16
17
18
19
20
21
22
23
24
25
26
27
28
29
30
31
32
33
34
35
36
37
38
39
40
41
42
43
44
45
46
47
48
49
50
51
52
53
54
55
1
FULL-LENGTHORIGINALRESEARCH
EP
I12942
Dispa
tch:
13.2.15
CE:Liyag
athAli
JournalCode
ManuscriptNo.
No.
ofpa
ges:
7PE:Vidya
cause epilepsy and are associated with increased depriva-
tion.2,7,14 Currently, there is conflicting evidence as to
whether differences in epilepsy prevalence result from
social drift or social causation.
We aimed to investigate the relationship between
epilepsy prevalence and incidence and deprivation to iden-
tify evidence of social causation or social drift. We
analyzed linked anonymized primary-care medical records
and deprivation scores as measured by the Welsh Index of
Multiple Deprivation (WIMD). In addition to determining
the variation of epilepsy prevalence and incidence with
WIMD, we determined the change in WIMD for a cohort of
people 10 years after a new diagnosis of epilepsy.
Methods
Eligible population
In the United Kingdom, every individual is assigned a
National Health Service (NHS) general practitioner (GP).
GPs provide primary health care, prescribe short- and long-
term medication, and maintain health records for individu-
als (including prescribing data and details of encounters
with other health care providers). Although many individu-
als with epilepsy will also see a secondary care epilepsy spe-
cialist, their GP will prescribe their ongoing antiepileptic
medication in almost all cases.
In Wales, anonymized GP primary care electronic health
records are collated and linked with other data within the
Secure Anonymised Information Linkage (SAIL) system,
operated by the Health Information Research Unit (HIRU)
at Swansea University.15,16 The 8,100,232 person-years of
GP records stored on the SAIL system between January 1,
2004, and December 31, 2010, formed the population for
this study (representing around 40% of the Welsh popula-
tion).
Epilepsy diagnosis
We defined a person as having a diagnosis of epilepsy
if their GP record contained an epilepsy diagnosis code
and they had been prescribed an antiepileptic drug on at
least two consecutive occasions within 12 months of the
diagnosis date. (See Tables S1 and S2 for a full list of epi-
lepsy diagnosis codes and antiepileptic drug names used).
Several other large-scale studies have used similar defini-
tions.17,18
We compared the GP records with records from a special-
ist epilepsy center as a measure of the validity of the epi-
lepsy diagnosis. Records from a patient database at the Alan
Richens/Wales Epilepsy Centre (WEC) at the University
Hospital of Wales Cardiff were anonymized, imported into
the SAIL system, and linked to the GP records used for the
primary analysis, using an anonymized linking field.15,16
The patients in the WEC database had been diagnosed with
epilepsy by a consultant neurologist or other epileptologist
(the current gold standard for epilepsy diagnosis).19 For
those from the WEC with a diagnosis of epilepsy who also
had a valid GP record after the date of diagnosis, we calcu-
lated the proportion with a diagnosis of epilepsy in both data
sets.
Deprivation score
The Welsh Index of Multiple Deprivation (WIMD) is
based on the Index of Multiple Deprivation (IMD) and is the
Welsh Government’s official measure of deprivation.20
Wales (population 3.2 million) is divided into 1896 lower-
layer super-output areas (LSOAs), each with around 1,500
people. Weighted scores from eight domains, representing
different types of deprivation, are aggregated to form a
WIMD score for each LSOA (see Table S3). Each LSOA in
Wales has been ranked from most deprived to least deprived
according to its WIMD score and then grouped into deciles,
with decile 1 being the most deprived and decile 10 the least
deprived. Each person in the study population was assigned
aWIMD decile according to their LSOA.
WIMD scores are recalculated occasionally. WIMD ver-
sions from 2005 and 2011 were available within SAIL. We
used the 2011 WIMD version for all deprivation data in this
study.
Epilepsy incidence and prevalence
We calculated the epilepsy prevalence for each group by
dividing the number of people with a diagnosis of epilepsy
by the total number of people within that group on January
1st each year. We calculated epilepsy incidence for each
group by dividing the number of new diagnoses of epilepsy
by the number of patient years at risk within that group.
New cases of epilepsy were defined as people having a diag-
nosis of epilepsy (and prescription of an AED on at least
two occasions) for the first time (no previous recorded epi-
lepsy diagnosis).
We recorded sex and age as covariates in incidence and
prevalence measurements and used age groups of 0–5;
6–12; 13–21; 22–45; 25–45; 46–64, and 65 years or over.
Cohort study
We selected a cohort of adults aged older than 18 years
given a new diagnosis of epilepsy between January 1, 2000
and December 31, 2002. We selected only adults, as a
child’s deprivation status is determined by their parents’
deprivation status and children move with their parents. For
each person in this cohort who remained within the study
population, we recorded the WIMD decile at the time of
diagnosis and 10 years later, or at the time of death (which-
ever was soonest).
Analysis and statistical tests
We calculated mean prevalence and incidence for each
WIMD decile together with confidence limits 3using
binomial and Poisson models, respectively. Adjusted odds
ratios for prevalence and adjusted incidence rate ratios for
Epilepsia, **(*):1–7, 2015doi: 10.1111/epi.12942
2
W.O. Pickrell et al.
1
2
3
4
5
6
7
8
9
10
11
12
13
14
15
16
17
18
19
20
21
22
23
24
25
26
27
28
29
30
31
32
33
34
35
36
37
38
39
40
41
42
43
44
45
46
47
48
49
50
51
52
53
54
55
incidence were calculated using multiple logistic and
Poisson regression models. A Wilcoxon signed-rank test
was used in the cohort study to test the null hypothesis that
there was no significant change in WIMD decile following
diagnosis. We used a 2001 LSOA border file from the office
of national statistics,21 together with the LSOAWIMD dec-
ile information to produce a geographical representation of
deprivation, epilepsy prevalence, and epilepsy incidence.
We excluded geographical areas where GP information was
not available for at least 5% of the population of that area.
We used R version 3.0.1 to produce the maps and to perform
the statistical analysis.
Ethical approval4
This study was approved by HIRU’s independent Infor-
mation Governance Review Panel (project 0202). The
National Research Ethics Service has confirmed that HIRU
projects using anonymized data do not need require specific
NHS research ethics committee approval.
Results
Study population
We analyzed 8,100,232 patient years of GP records.
Table 1 compares the study population in 2010 with that of
theWelsh population.
Validating the epilepsy diagnosis
There were 9,263 people with epilepsy in the study
population. In 2012, there were 4,128 people with a con-
firmed diagnosis of epilepsy in the database from the
Welsh Epilepsy Centre (WEC); 1,834 (20% of the 9,263
people with epilepsy in the study population) visited a GP
within the study population after WEC diagnosis. A total
of 1,660 (90.5%) of the 1,834 people had a diagnosis of
epilepsy recorded in the GP records and received at least
two prescriptions of an antiepileptic drug: thus, our diag-
nosis algorithm had a sensitivity of 90.5% for confirming
an epilepsy diagnosis within the WEC population tested.
Because we could not upload definite control cases with-
out a diagnosis of epilepsy, we could not calculate the
specificity or positive predictive value of our diagnosis
algorithm.
Epilepsy prevalence, incidence and deprivation
The mean epilepsy prevalence was 0.77% (95% CI 0.76
to 0.79% 5). There were 2,390 incident cases of epilepsy dur-
ing the study period, giving an incidence rate of 29.5/
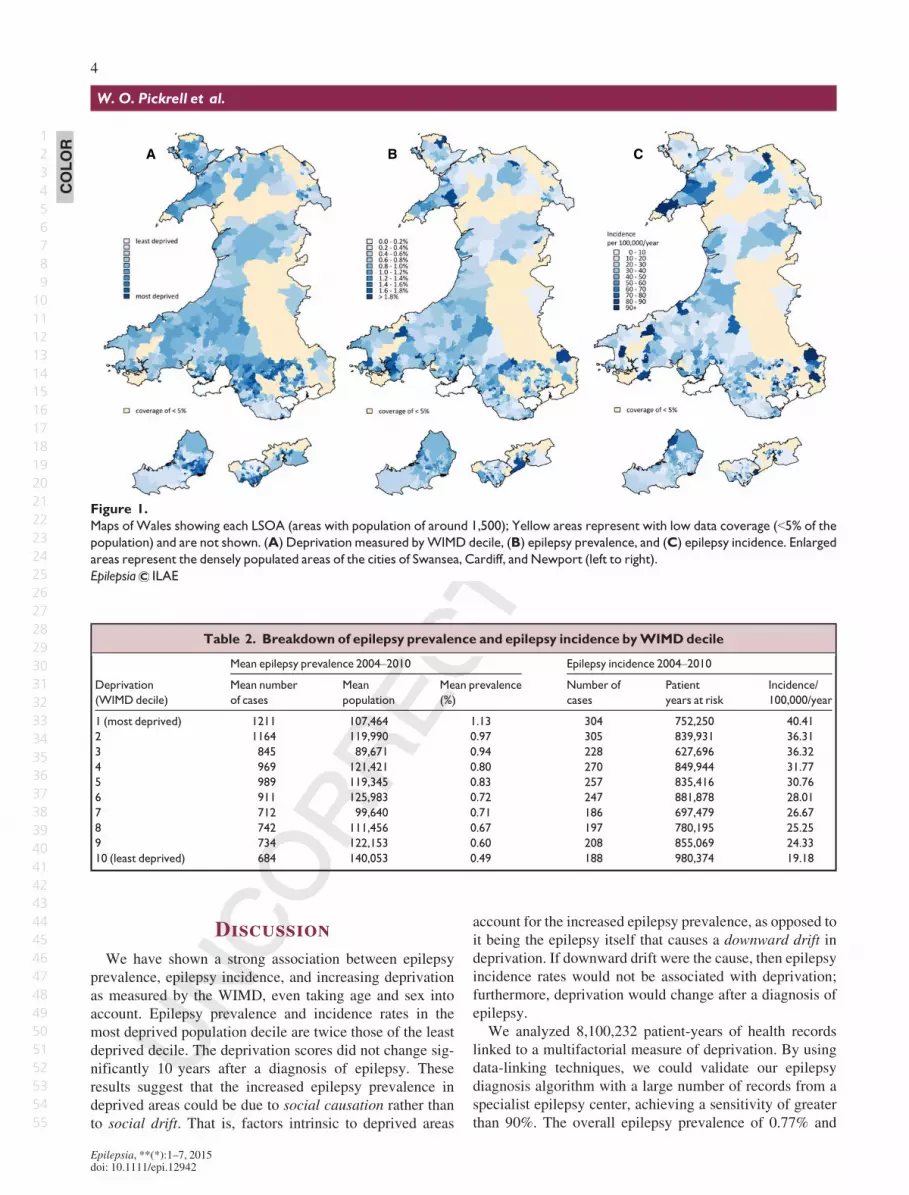
100,000 per year (95% CI 28.3 to 30.7). Figure 1 illustrates
how deprivation, epilepsy prevalence, and incidence rates
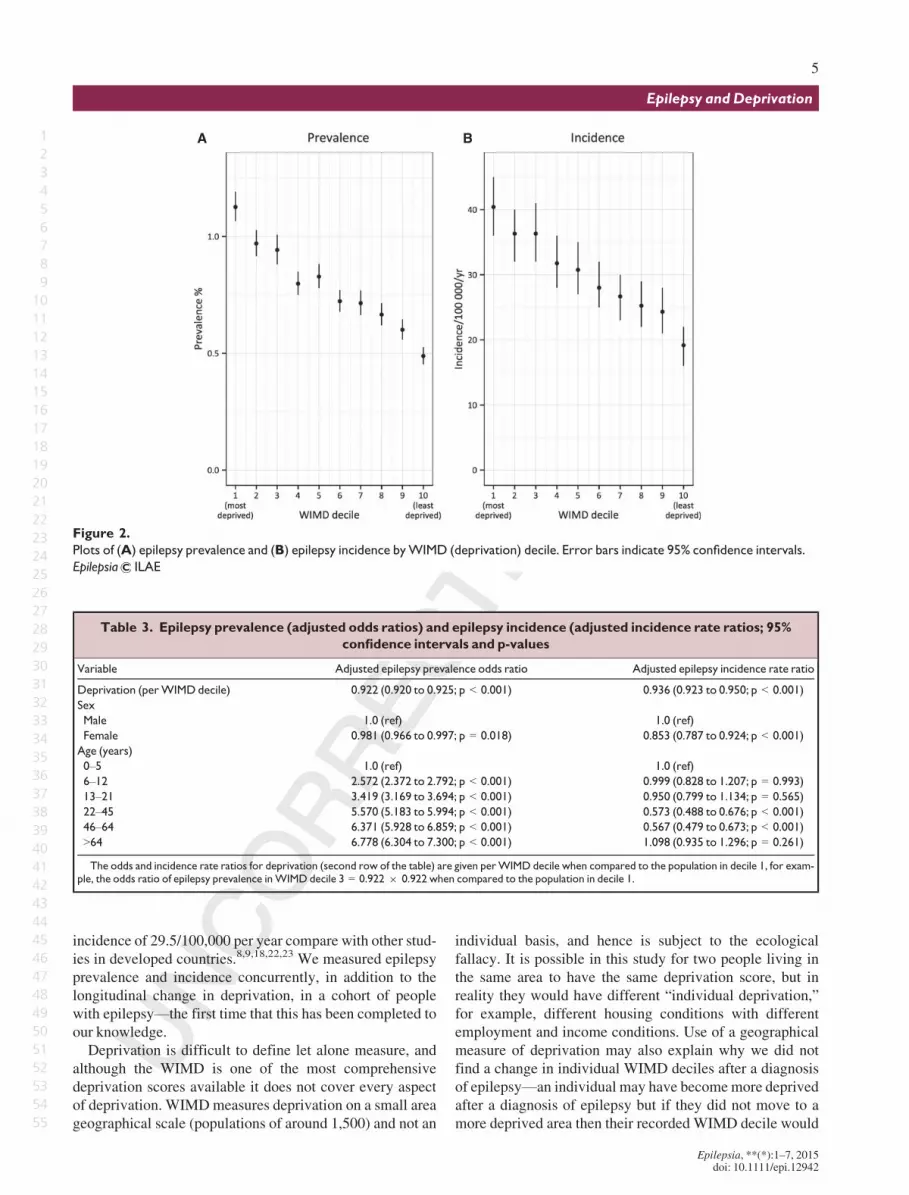
vary geographically. Table 2 and Figure 2 illustrate how
epilepsy prevalence and incidence vary by deprivation
decile. Table 3 shows prevalence ORs and incidence rate
ratios.
Cohort study
Six hundred thirteen new cases of epilepsy were iden-
tified in adults between January 1, 2000 and December
31, 2002. Thirty one patients (5%) had moved out of the
study population. Of the remaining 582 cases: 352
(60%) remained alive and were followed for 10 years;
230 (40%) died and were followed for a mean of
4.7 years (standard deviation [SD] 3.3 years). Table 4
summarizes the cohort population and Figure S1 (Sup-
porting Information) shows a graph of the change in
WIMD decile.
Table 1. Study population characteristics in 2010 as compared to theWelsh population
(measured by the 2011WIMDdata)20
Study population in 2010 Wales population
Total Number 1,178,558 3,169,594
Sex Male 588,476 (49.9%) 1,582,144 (49.9%)
Female 590,082 (50.1%) 1,587,446 (50.1%)
Age (years) 0-5 73,716 (6.3%) 206,148 (6.5%)
6-12 86,809 (7.4%) 235,681 (7.4%)
13-21 142,333 (12.1%) 367,981 (11.6%)
22-45 374,090 (31.7%) 999,254 (31.5%)
46-64 290,612 (24.7%) 793,247 (25.0%)
>64 210,998 (17.9%) 567,282 (17.9%)
Deprivation (WIMD decile) 1 (most deprived) 109,703 (9.3%) 318,275 (10.0%)
2 122,291 (10.4%) 315,689 (10.0%)
3 91,478 (7.8%) 315,983 (10.0%)
4 124,033 (10.5%) 317,000 (10.0%)
5 121,894 (10.3%) 313,995 (9.9%)
6 127,573 (10.8%) 325,662 (10.3%)
7 101,077 (8.6%) 309,675 (9.8%)
8 113,994 (9.7%) 324,457 (10.2%)
9 124,752 (10.6%) 307,093 (9.7%)
10 (least deprived) 141,763 (12.0%) 321,954 (10.2%)
Epilepsia, **(*):1–7, 2015doi: 10.1111/epi.12942
3
Epilepsy and Deprivation
1
2
3
4
5
6
7
8
9
10
11
12
13
14
15
16
17
18
19
20
21
22
23
24
25
26
27
28
29
30
31
32
33
34
35
36
37
38
39
40
41
42
43
44
45
46
47
48
49
50
51
52
53
54
55
Discussion
We have shown a strong association between epilepsy
prevalence, epilepsy incidence, and increasing deprivation
as measured by the WIMD, even taking age and sex into
account. Epilepsy prevalence and incidence rates in the
most deprived population decile are twice those of the least
deprived decile. The deprivation scores did not change sig-
nificantly 10 years after a diagnosis of epilepsy. These
results suggest that the increased epilepsy prevalence in
deprived areas could be due to social causation rather than
to social drift. That is, factors intrinsic to deprived areas
account for the increased epilepsy prevalence, as opposed to
it being the epilepsy itself that causes a downward drift in
deprivation. If downward drift were the cause, then epilepsy
incidence rates would not be associated with deprivation;
furthermore, deprivation would change after a diagnosis of
epilepsy.
We analyzed 8,100,232 patient-years of health records
linked to a multifactorial measure of deprivation. By using
data-linking techniques, we could validate our epilepsy
diagnosis algorithm with a large number of records from a
specialist epilepsy center, achieving a sensitivity of greater
than 90%. The overall epilepsy prevalence of 0.77% and
A B C
Figure 1.
Maps of Wales showing each LSOA (areas with population of around 1,500); Yellow areas represent with low data coverage (<5% of the
population) and are not shown. (A) Deprivation measured byWIMD decile, (B) epilepsy prevalence, and (C) epilepsy incidence. Enlarged
areas represent the densely populated areas of the cities of Swansea, Cardiff, and Newport (left to right).
Epilepsia ILAE
Table 2. Breakdown of epilepsy prevalence and epilepsy incidence byWIMDdecile
Deprivation
(WIMD decile)
Mean epilepsy prevalence 2004–2010 Epilepsy incidence 2004–2010
Mean number
of cases
Mean
population
Mean prevalence
(%)
Number of
cases
Patient
years at risk
Incidence/
100,000/year
1 (most deprived) 1211 107,464 1.13 304 752,250 40.41
2 1164 119,990 0.97 305 839,931 36.31
3 845 89,671 0.94 228 627,696 36.32
4 969 121,421 0.80 270 849,944 31.77
5 989 119,345 0.83 257 835,416 30.76
6 911 125,983 0.72 247 881,878 28.01
7 712 99,640 0.71 186 697,479 26.67
8 742 111,456 0.67 197 780,195 25.25
9 734 122,153 0.60 208 855,069 24.33
10 (least deprived) 684 140,053 0.49 188 980,374 19.18
COLOR
Epilepsia, **(*):1–7, 2015doi: 10.1111/epi.12942
4
W.O. Pickrell et al.
1
2
3
4
5
6
7
8
9
10
11
12
13
14
15
16
17
18
19
20
21
22
23
24
25
26
27
28
29
30
31
32
33
34
35
36
37
38
39
40
41
42
43
44
45
46
47
48
49
50
51
52
53
54
55
incidence of 29.5/100,000 per year compare with other stud-
ies in developed countries.8,9,18,22,23 We measured epilepsy
prevalence and incidence concurrently, in addition to the
longitudinal change in deprivation, in a cohort of people
with epilepsy—the first time that this has been completed to
our knowledge.
Deprivation is difficult to define let alone measure, and
although the WIMD is one of the most comprehensive
deprivation scores available it does not cover every aspect
of deprivation. WIMDmeasures deprivation on a small area
geographical scale (populations of around 1,500) and not an
individual basis, and hence is subject to the ecological
fallacy. It is possible in this study for two people living in
the same area to have the same deprivation score, but in
reality they would have different “individual deprivation,”
for example, different housing conditions with different
employment and income conditions. Use of a geographical
measure of deprivation may also explain why we did not
find a change in individual WIMD deciles after a diagnosis
of epilepsy—an individual may have becomemore deprived
after a diagnosis of epilepsy but if they did not move to a
more deprived area then their recorded WIMD decile would
A B
Figure 2.
Plots of (A) epilepsy prevalence and (B) epilepsy incidence byWIMD (deprivation) decile. Error bars indicate 95% confidence intervals.
Epilepsia ILAE
Table 3. Epilepsy prevalence (adjusted odds ratios) and epilepsy incidence (adjusted incidence rate ratios; 95%
confidence intervals and p-values
Variable Adjusted epilepsy prevalence odds ratio Adjusted epilepsy incidence rate ratio
Deprivation (perWIMD decile) 0.922 (0.920 to 0.925; p < 0.001) 0.936 (0.923 to 0.950; p < 0.001)
Sex
Male 1.0 (ref) 1.0 (ref)
Female 0.981 (0.966 to 0.997; p = 0.018) 0.853 (0.787 to 0.924; p < 0.001)
Age (years)
0–5 1.0 (ref) 1.0 (ref)
6–12 2.572 (2.372 to 2.792; p < 0.001) 0.999 (0.828 to 1.207; p = 0.993)
13–21 3.419 (3.169 to 3.694; p < 0.001) 0.950 (0.799 to 1.134; p = 0.565)
22–45 5.570 (5.183 to 5.994; p < 0.001) 0.573 (0.488 to 0.676; p < 0.001)
46–64 6.371 (5.928 to 6.859; p < 0.001) 0.567 (0.479 to 0.673; p < 0.001)
>64 6.778 (6.304 to 7.300; p < 0.001) 1.098 (0.935 to 1.296; p = 0.261)
The odds and incidence rate ratios for deprivation (second row of the table) are given perWIMD decile when compared to the population in decile 1, for exam-ple, the odds ratio of epilepsy prevalence inWIMD decile 3 = 0.922 9 0.922 when compared to the population in decile 1.
Epilepsia, **(*):1–7, 2015doi: 10.1111/epi.12942
5
Epilepsy and Deprivation
1
2
3
4
5
6
7
8
9
10
11
12
13
14
15
16
17
18
19
20
21
22
23
24
25
26
27
28
29
30
31
32
33
34
35
36
37
38
39
40
41
42
43
44
45
46
47
48
49
50
51
52
53
54
55

not change. These factors may have led to a lack of recogni-
tion of a drift in deprivation in people with epilepsy within
their original geographically derived deprivation area.
We chose to include prescription of an antiepileptic drug
when defining our epilepsy cases to increase our specific-
ity18; however, this probably meant that we decreased our
sensitivity and excluded the small minority of people with
epilepsy who were not prescribed an antiepileptic drug.
General practitioners do not repeat diagnoses of chronic dis-
orders every visit and our algorithm may have missed cases
where only treatment codes were included. Although we
were able to obtain a measure of the sensitivity of our epi-
lepsy diagnosis algorithm, we were not able to obtain fig-
ures for the specificity, and it is possible that our algorithm
may have included a proportion of cases without epilepsy.
This was also a retrospective study and it was also not possi-
ble to classify accurately the type of epilepsy from the pri-
mary care records used.
A prospective study in the South-East of England identi-
fied an association between epilepsy incidence and depriva-
tion, although the association was weaker inside London.9
Cardiff, the largest city in Wales, has a population of
325,000 and so we were unable to study the “London
effect,”9 where the association between incidence and
deprivation is weakened in very large cities. A population-
based case–control study in Iceland found a link between
epilepsy and deprivation in adults but not children,23 and a
retrospective study in Wales found a link between epilepsy
prevalence and deprivation.8 The South-East England and
Iceland study were prospective studies. Prospective studies
have many advantages and permit contemporaneous valida-
tion such as by telephone questionnaire.24 However, we are
confident that our case ascertainment identified people with
epilepsy who were prescribed antiepileptic medication and
we were able to study more cases of incident epilepsy
(2,390 in this study compared to 1909 and 41824) because of
our retrospective study design.
There are several reasons that epilepsy incidence may
be higher in more deprived areas. Epilepsy is a heteroge-
neous condition with many underlying causes, and many
of these are genetic in origin.25 Given this fact, more chil-
dren with epilepsies of a predominately genetic etiology
will be born in deprived areas, as these areas have a
higher prevalence of parents with epilepsy. The preva-
lence of several factors associated with the development
of acquired epilepsy,26 for example, perinatal hypoxic
injury, head trauma, and cerebrovascular disease, is
increased in areas of deprivation.2,7,14 Thankfully, in
recent years, much has been done in the United Kingdom
as in other countries to address factors that may be associ-
ated with social drift; for example, reducing the stigma
associated with epilepsy, and introducing legislation and
schemes to protect people with epilepsy and other condi-
tions in the workplace and to assist with transport.27,28
The fact that increased epilepsy prevalence in deprived
areas seems more likely to be caused by social causation
than social drift should alert clinicians and policymakers
toward targeting resources in these areas.
This study adds new evidence to support the argument
that social causation could be responsible for the link
between epilepsy and deprivation. This provides the
opportunity to identify potentially remediable risk factors
and to target areas of deprivation. This may well have
health benefits beyond epilepsy prevalence. Further ques-
tions remain, however, and it would be useful for future
studies to address deprivation on an individual basis
(perhaps through linkage to earnings or tax records) and
to follow patients for a longer period. Analyzing the link
between deprivation and the different types of epilepsy
would help untangle cause and effect in this area and
highlight factors that could be prioritized for research and
investment.
Acknowledgments
We also acknowledge the support from the Farr Institute @ CIPHER.The Farr Institute @ CIPHER is supported by a 10-funder consortium:Arthritis Research UK, the British Heart Foundation, Cancer Research UK,the Economic and Social Research Council, the Engineering and PhysicalSciences Research Council, the Medical Research Council, the NationalInstitute of Health Research, the National Institute for Social Care andHealth Research (Welsh Assembly Government), the Chief Scientist Office
Table 4. Summary of a cohort of people with incident epilepsy diagnosed between January 1, 2000 andDecember 31,
2002
Number Mean age at diagnosis (SD) Mean length of follow up in years (SD) Mean change inWIMD decilea (p-value*)
All 582 52.42 (20.2) 7.9 (3.3) 0.04 (p = 0.85)
Alive 352 42.96 (16.4) 10 (0.0) �0.02 (p = 0.83)
Younger than
41 years at diagnosis
172 28.85 (6.4) 10 (0.0) 0.05 (p = 0.87)
41 years or
older at diagnosis
180 56.44 (10.7) 10 (0.0) �0.08 (p = 0.56)
Dead 230 66.91 (16.7) 4.7 (3.3) 0.13 (p = 0.62)
SD, standard deviation.aThe change in WIMD decile = (WIMD decile at time of diagnosis) – (WIMD decile at end of follow up), this change is calculated for each individual in the
cohort.*The p-value is for the null-hypothesis that there is no change inWIMD decile.
Epilepsia, **(*):1–7, 2015doi: 10.1111/epi.12942
6
W.O. Pickrell et al.
1
2
3
4
5
6
7
8
9
10
11
12
13
14
15
16
17
18
19
20
21
22
23
24
25
26
27
28
29
30
31
32
33
34
35
36
37
38
39
40
41
42
43
44
45
46
47
48
49
50
51
52
53
54
55
(Scottish Government Health Directorates), the Wellcome Trust, (MRCGrant No: MR/K006525/1). WERN and HIRU are funded by the NationalInstitute for Social Care and Health Research (NISCHR).
Disclosure
None of the authors has any conflict of interest to disclose. We confirmthat we have read the Journal’s position on issues involved in ethical publi-cation and affirm that this report is consistent with those guidelines.
Additional Contributors
WOP, AL, RHT, and MK were responsible for study design. ALacquired the data that were analyzed by WOP, AL, MK, and OB. MK,PEMS, MIR, and RAL provided senior support, study supervision, andsecured funding and infrastructure for the project. OB provided advice andsupport for the statistical analysis. JCD analyzed the data and produced Fig-ure 1. WOP drafted the initial manuscript. All authors reviewed and criti-cally revised the manuscript.
References
1. Eachus J, Williams M, Chan P, et al. Deprivation and cause specificmorbidity: evidence from the Somerset and Avon survey of health.BMJ 1996;312:287–292.
2. Lawlor DA, Davey Smith G, Patel R, et al. Life-course socioeconomicposition, area deprivation, and coronary heart disease: findings fromthe British Women’s Heart and Health Study. Am J Public Health
2005;95:91–97.3. Stewart WF, Lipton RB, Celentano DD, et al. Prevalence of migraine
headache in the United States. Relation to age, income, race, and othersociodemographic factors. JAMA 1992;267:64–69.
4. Hart JT. The inverse care law. Lancet 1971;1:405–412.5. National Health Service Health Development Agency. Health
inequalities: concepts, frameworks and policy. Available at:http://www.nice.org.uk/niceMedia/documents/health_inequalities_concepts.pdf. Accessed October, Xxxx 2013.6
6. World Health Organisation. Social determinants of health. Availableat: http://www.who.int/social_determinants/en/. Accessed Feburary28, 2014.
7. Newton CR, Garcia HH. Epilepsy in poor regions of the world. Lancet2012;380:1193–1201.
8. Morgan CL, Ahmed Z, Kerr MP. Social deprivation and prevalence ofepilepsy and associated health usage. J Neurol Neurosurg Psychiatry
2000;69:13–17.9. Heaney DC, MacDonald BK, Everitt A, et al. Socioeconomic variation
in incidence of epilepsy: prospective community based study in southeast England. BMJ 2002;325:1013–1016.
10. Li X, Sundquist J, Sundquist K. Socioeconomic and occupational riskfactors for epilepsy: a nationwide epidemiological study in Sweden.Seizure 2008;17:254–260.
11. Kaiboriboon K, Bakaki PM, Lhatoo SD, et al. Incidence andprevalence of treated epilepsy among poor health and low-incomeAmericans. Neurology 2013;80:1942–1949.
12. Liberatos P, Link BG, Kelsy JL. The measure of social class inepidemiology. Epidemiol Rev 1988;10:87–121.
13. Stewart WF, Roy J, Lipton RB. Migraine prevalence, socioeconomicstatus, and social causation.Neurology 2013;81:948–955.
14. Liao CC, Chang HC, Yeh CC, et al. Socioeconomic deprivation andassociated risk factors of traumatic brain injury in children. J TraumaAcute Care Surg 2012;73:1327–1331.
15. Ford DV, Jones KH, Verplancke JP, et al. The SAIL Databank:building a national architecture for e-health research and evaluation.BMCHealth Serv Res 2009;9:157.
16. Lyons RA, Jones KH, John G, et al. The SAIL databank: linkingmultiple health and social care datasets. BMC Med Inform Decis Mak
2009;9:3.17. Hesdorffer DC, Ishihara L, Mynepalli L, et al. Epilepsy, suicidality,
and psychiatric disorders: a bidirectional association. Ann Neurol
2012;72:184–189.18. Meeraus WH, Petersen I, Chin RF, et al. Childhood epilepsy recorded
in primary care in the UK. Arch Dis Child 2013;98:195–202.19. National Institute for Health and Care Excellence. The epilepsies: the
diagnosis and management of the epilepsies in adults and children in
primary and secondary care. London: National Institute for Health andCare Excellence; 2012: CG137.
20. The Welsh index of multiple deprivation. Available at:http://wales.gov.uk/topics/statistics/theme/wimd/?lang=en. AccessedFebruary, 28, 2014.
21. Office for national statistics. Available at: www.ons.gov.uk. AccessedApril 23, 2014.
22. Ngugi AK, Kariuki SM, Bottomley C, et al. Incidence of epilepsy: asystematic review and meta-analysis. Neurology 2011;77:1005–1012.
23. Hesdorffer DC, Tian H, Anand K, et al. Socioeconomic status is a riskfactor for epilepsy in Icelandic Adults but not in Children. Epilepsia2005;46:1297–1303.
24. Olafsson E, Ludvigsson P, Gudmundsson G, et al. Incidence ofunprovoked seizures and epilepsy in Iceland and assessment of theepilepsy syndrome classification: a prospective study. Lancet Neurol2005;4:627–634.
25. Thomas RH, Berkovic SF. The hidden genetics of epilepsy-a clinicallyimportant new paradigm. Nat Rev Neurol 2014;10:283–292.
26. Berg AT, Berkovic SF, Brodie MJ, et al. Revised terminology andconcepts for organization of seizures and epilepsies: report of the ILAECommission on Classification and Terminology, 2005–2009.Epilepsia 2010;51:676–685.
27. The Disability Discrimination Act 1995. UK government. Availableat: http://www.legislation.gov.uk/ukpga/1995/50/introduction. AccessedFebruary, 28, 2014.
28. Access to Work Scheme. UK government. Available at: https://www.gov.uk/access-to-work/overview. Accessed February 28, 2014.
Supporting Information
Additional Supporting Information may be found in the
online version of this article:
Figure S1. Change in WIMD score 10 years after diag-
nosis for a cohort of 352 adults with incident epilepsy
between 1/1/2000 and 31/12/2002.
Table S1. List of Read codes used to signify a diagnosis
of epilepsy.
Table S2.A list of antiepileptic drugs and their read codes
used to identify cases of epilepsy.
Table S3. Domains, weightings, and indicators used to
calculate theWIMD score.
Epilepsia, **(*):1–7, 2015doi: 10.1111/epi.12942
7
Epilepsy and Deprivation
1
2
3
4
5
6
7
8
9
10
11
12
13
14
15
16
17
18
19
20
21
22
23
24
25
26
27
28
29
30
31
32
33
34
35
36
37
38
39
40
41
42
43
44
45
46
47
48
49
50
51
52
53
54
55

Author Query Form
Journal: EPI
Article: 12942
Dear Author,
During the copy-editing of your paper, the following queries arose. Please respond to these by marking up your proofs with
the necessary changes/additions. Please write your answers on the query sheet if there is insufficient space on the page
proofs. Please write clearly and follow the conventions shown on the attached corrections sheet. If returning the proof by
fax do not write too close to the paper's edge. Please remember that illegible mark-ups may delay publication.
Many thanks for your assistance.
Query reference Query Remarks
1 AUTHOR: Please confirm that given names (red) and surnames/family
names (green) have been identified correctly.
2 AUTHOR: Please check that authors and their affiliations are correct.
3 AUTHOR: Or confidence intervals?
4 AUTHOR: Ethical approval section has been repeated twice. Hence it has
been deleted before contributors section. Please check.
5 AUTHOR: Note you have described confidence limits (see previous query –
change to intervals) in text of this article but you are in fact presenting
ranges (confidence intervals).
6 AUTHOR: Please provide accessed date for reference [5].