measuring business excellence
TRANSCRIPT

Measuring Business ExcellenceBalanced scorecard: a rising trend in strategic performance measurementKhim Ling SimHian Chye Koh
Article information:To cite this document:Khim Ling SimHian Chye Koh, (2001),"Balanced scorecard: a rising trend in strategic performance measurement", Measuring BusinessExcellence, Vol. 5 Iss 2 pp. 18 - 27Permanent link to this document:http://dx.doi.org/10.1108/13683040110397248
Downloaded on: 17 March 2015, At: 22:44 (PT)References: this document contains references to 19 other documents.To copy this document: [email protected] fulltext of this document has been downloaded 6045 times since 2006*
Users who downloaded this article also downloaded:Helen Atkinson, (2006),"Strategy implementation: a role for the balanced scorecard?", Management Decision, Vol. 44 Iss 10 pp.1441-1460 http://dx.doi.org/10.1108/00251740610715740Meena Chavan, (2009),"The balanced scorecard: a new challenge", Journal of Management Development, Vol. 28 Iss 5 pp. 393-406http://dx.doi.org/10.1108/02621710910955930Ulf Johanson, Matti Skoog, Andreas Backlund, Roland Almqvist, (2006),"Balancing dilemmas of the balanced scorecard", Accounting,Auditing & Accountability Journal, Vol. 19 Iss 6 pp. 842-857 http://dx.doi.org/10.1108/09513570610709890
Access to this document was granted through an Emerald subscription provided by 516270 []
For AuthorsIf you would like to write for this, or any other Emerald publication, then please use our Emerald for Authors serviceinformation about how to choose which publication to write for and submission guidelines are available for all. Please visitwww.emeraldinsight.com/authors for more information.
About Emerald www.emeraldinsight.comEmerald is a global publisher linking research and practice to the benefit of society. The company manages a portfolio of more than290 journals and over 2,350 books and book series volumes, as well as providing an extensive range of online products and additionalcustomer resources and services.
Emerald is both COUNTER 4 and TRANSFER compliant. The organization is a partner of the Committee on Publication Ethics (COPE)and also works with Portico and the LOCKSS initiative for digital archive preservation.
*Related content and download information correct at time of download.
Dow
nloa
ded
by U
nive
rsiti
Keb
angs
aan
Mal
aysi
a A
t 22:
44 1
7 M
arch
201
5 (P
T)

BALANCED SCORECARD: A RISING TRENDIN STRATEGIC PERFORMANCE
MEASUREMENT
Khim Ling Sim and Hian Chye KohKhim L. Sim, PhD, is an Assistant Professor of Accountancy at Western New England College. Her research interests
include management control systems, organizational learning, organizational reengineering in new manufacturingpractices, performance measures and performance evaluations. She has published in journals such as Journal of
Management Accounting Research, International Review of Accounting, International Journal of Operationsand Production Management, among others. She is currently a member of Institute of Management Accounting,
American Accounting Association, and Institute of Decision Sciences. Dr Sim can be contacted at [email protected] ortel: (413) 782 1506. Hian Chye Koh, PhD, a Certified Public Accountant, is an Associate Professor and Vice-Dean
(Business) of the Nanyang Business School (Singapore). He has published widely in international journals andconferences and serves as a consultant to several statutory boards and organizations. His current interest is in strategic
data analysis. Dr Koh can be contacted at [email protected] or tel: (65) 790 5646.
Abstract The long-term survival of a business is dependent upon
meeting market needs through a long-term value creation process.
Traditional performance measurement systems have been criticized
as being too narrowly focused on financial figures and functional
level performance such that they often fail to capture organizational
long-term business success. In contrast, the balanced scorecard calls
on managers to first make a commitment to introduce an array of
measures or scorecards that will guide their decisions away from the
narrowly focused financial measures. These scorecards, in turn, serve
as dials on a dashboard and guide businesses into greater
profitability as managers position themselves to better serve their
employees, customers, and shareholders at large. Using information
collected from 83 electronics companies located within the USA,
results from the study provide support for the balanced scorecard.
Specifically, findings show that manufacturing plants that have
strategically linked their corporate goals or objectives to their
performance measurement systems, via the scorecard, performed
better than those that do not.
Keywords Balanced scorecard, Performance measurement,
Just-in-time, TQM, Electronics industry,
Performance improvement
Do your performance measurement systems
measure up?
The pressure of reporting corporate performance based
on non-financial as well as financial measures has
intensified over the last few years. For example, the
Conference Board of the Canadian Institute of
Chartered Accountants (CICA) reported that traditional
accounting-based performance measures are excessively
historical; they lack predictive power and reward the
wrong behavior and do not capture key business changes
until it is too late. The Conference Board also concludes
that these measures give inadequate consideration to
such resources as intellectual capital (Waterhouse,
1999). Accordingly, the Board suggests that strategically
oriented performance measurement systems should
measure non-financial as well as financial outcomes.
Likewise, a report by the American Institute of Certified
Public Accountants (AICPA) recommends that
companies should disclose leading, non-financial
measures on key business processes such as product
quality, cycle time, innovation, and employee
satisfaction (AICPA Report, 1994, p. 143).
Coincidentally, a survey conducted by the Institute of
Management Accounting in the USA, lends some
support for the recommendations made by the CICA
and AICPA (IMA, 1996). For example, the survey
shows that only 15 percent of the respondents indicated
that their measurement systems supported top
management's business objectives well, while 43 percent
of the respondents rated their measurement systems as
less than adequate or poor. On the other hand, 60
percent of these respondents reported that they were
undertaking a major overhaul or were planning to
replace their current performance measurement systems.
It is generally believed that the best performance
measures are those linked to a business' strategy. In
addition, performance measures should be focused, and
should reward behavior that contributes to business
M e a s u r i n g B u s i n e s s E x c e l l e n c e 5 , 2 2 0 0 1 , p p . 1 8 - 2 6 , # M C B U n i v e r s i t y P r e s s , 1 3 6 8 - 3 0 4 7
The current issue and full text archive of this journal is available athttp://www.emerald-library.com/ft
1 8
Dow
nloa
ded
by U
nive
rsiti
Keb
angs
aan
Mal
aysi
a A
t 22:
44 1
7 M
arch
201
5 (P
T)

success (see Kaplan and Norton, 1992; 1996a; 1996b;
Atkinson and Epstein, 2000). Given recent development
in the performance measurement literature (see above),
more executives around the world have begun to
question whether their performance measurement
systems measure up. There is also a growing interest in
whether non-financial measures such as customer
satisfaction, employee satisfaction, or innovation, are
useful indicators of a firm's future performance.
Likewise, practitioners have begun to look into the
implementation of balanced scorecards as a means to
overcome the limitations of the traditional performance
measurement system. Accordingly, the purpose of this
study is to investigate whether
there are any linkages between
business success and the use of
strategically linked performance
measures, which include both
non-financial and financial
performance measures.
What Is a balanced scorecard?
Proponents of the balanced
scorecard (see Kaplan and
Norton 1992; 1996a; 1996b)
have long suggested the use of
non-financial performance
measures via three additional
perspectives (i.e. customer,
internal business process, and
learning and innovation) to
supplement traditional financial
measures. According to Kaplan
and Norton (1996b, p. 75),
`̀ Used this way, the scorecard
addresses a serious deficiency in
traditional management
systems: their inability to link a
company's long-term strategy
with its short-term actions''. According to a recent
balanced scorecard report, various surveys estimate that
40-50 percent of large organizations have begun
implementing this concept (Balanced Scorecard Report,
1999a). So, what is a balanced scorecard?
Robert Kaplan, of the Harvard Business School, and
David Norton, the president of a Massachusetts
consulting firm, developed the balanced scorecard
(BSC) in the early 1990s. It was built around the
premise that companies can no longer gain sustainable
competitive advantage solely by developing tangible
assets. To phrase it differently, the ability of a company
to build its `̀ intangible assets'' or `̀ intellectual capital''
has become a critical success factor in creating and
sustaining competitive advantage (see also MobilizingInvisible Assets by Hiroyuki Itami, 1987). According to
Kaplan and Norton (1996a; 1996b), the four
perspectives of the BSC, as presented in Figure 1, will
enable companies to track financial results and
simultaneously monitor progress in building the
capabilities that are necessary for acquiring the
`̀ intellectual capital'' or `̀ intangible assets'' needed for
future business growth and for providing keener
competition (Kaplan and Norton (1992; 1996a; 1996b)
provide further discussion on the balanced scorecard).
Many big corporations in the USA have implemented
the BSC. Although the satisfaction rate varies across
companies, many have achieved some phenomenal
results. These companies include the Mobil US
Marketing and Refining (Mobil USM&R) Division,
Chadwick Inc., the City of
Charlotte (see Harvard Business
School Publishing, cases
number 9-197-025, 9-196-124,
and 9-199-036, respectively),
and Sears Roebuck and
Company, among others. For
example, within two years after
the implementation of the BSC,
Mobil's growth and productivity
strategy has dramatically
improved Mobil USM&R
division's position from the last
place (in 1992 and 1993) to first
place in the industry with profits
of 56 percent above the industry
average. The productivity
strategy also created a
20 percent reduction in the cost
to refine, market, and deliver a
gallon of gasoline. With better
utilization of the existing
resources, Mobil showed an
annual improvement in cash
flow of almost $1.2 billion in
1996. According to Brian Baker (the president of the
North America Marketing and Refining Division), six
years later, the company remains on course towards its
strategic vision (Balanced Scorecard Report, 1999b).
The experience of Sears Roebuck and Company was
equally encouraging. During the early 1990s, Sears
Roebuck and Company had some of the worst
performance in its history. For example, the company
net loss was $3.9 billion in 1992. Within two years after
the implementation of the BSC, Sears reported a 4
percent increase in employee satisfaction and customer
satisfaction. The increase in customer satisfaction led to
an estimated $200 million increase in revenue. The extra
revenues also increase Sears' market capitalization by
almost $250 million (Rucci et al., 1998).
Despite an increased interest from practitioners in the
implementation of the BSC, large scale empirical
findings on BSC implementation remains scarce. In a
M e a s u r i n g B u s i n e s s E x c e l l e n c e 5 , 2 2 0 0 1
``Accordingly, the
purpose of this study is
to investigate whether
there are any linkages
between business
success and the use of
strategically linked
performance measures,
which include both
non-financial and
financial performance
measures.''
1 9
Dow
nloa
ded
by U
nive
rsiti
Keb
angs
aan
Mal
aysi
a A
t 22:
44 1
7 M
arch
201
5 (P
T)

1996 survey conducted by Tower Perrin Consulting
firm, 64 percent of the respondents rated `̀ satisfaction or
value received'' from BSC implementation higher than
that from performance measurement approaches used in
the past. In contrast, only 37 percent of the respondents
reported `̀ employee understanding of performance
measures and goals'' from BSC implementation higher
than that from performance measurement systems used
in the past (Ittner and Larcker, 1998). However, a
survey of vice presidents of quality for major US firms
conducted by professors from the Wharton School fails
to relate customer and quality measures to accounting
and stock returns (Ittner and Larcker, 1998).
Because of the mixed findings, this study aims to
provide additional information related to the use of non-
financial performance measures. The findings are based
on the experiences of 83 electronic companies that were
located in the USA, with an annual sales ranging from
$10 million to $2 billion. A survey instrument was used
and a majority of the respondents in this study are top-
level executives or directors of manufacturing. The
results of this study provide further evidence that
manufacturing plants that have strategically linked their
corporate goals or objectives to their performance
measurement systems, via the scorecard in the four
perspectives, performed better than those that do not.
Descriptive statistics of sample companies
Table I (Panel A) provides information on the job title of
the respondents in this study. As noted, a majority of the
respondents belong to middle and upper management,
who tend to be closely involved in strategic planning and
decision making. Table I (Panel B) provides descriptive
statistics of workplace practices of the sample
companies. It is noted that 70 percent of the 83 sample
companies have some kind of total quality management
(TQM) program, 64 percent have implemented a just-
in-time (JIT) program, while about 75 percent are
heavily involved in work team practices. Finally, more
than half of the companies are using some kind of
workers' incentive plans. Using this database, Sim et al.(1999) reported that companies that made use of
incentive plans while focusing on the implementation of
TQM, JIT, and work teams, were associated with better
customer, delivery, and quality performance. Given this
finding, the database is expected to be a good source to
validate the BSC framework.
The theoretical framework
Consistent with the latest developments in the
performance measurement literature such as those
advocated by proponents of the BSC, it is expected that
companies that continuously improve their capabilities
(e.g. by implementing advanced workplace practices,
which are to be monitored via the innovation and
learning perspective) should achieve better performance
in their internal business process perspective which will,
in turn, lead to better performance in their customer
perspective. All such efforts should lead to improved
financial performance. Accordingly, Figure 2 provides a
BSC framework relevant to this study, keeping in mind
that the focus of the scorecard is on business unit
performance (i.e. performance of the manufacturing
division)[1]. Finally, Table II provides detailed
information or the scorecard (i.e. goals and measures)
used in this study.
M e a s u r i n g B u s i n e s s E x c e l l e n c e 5 , 2 2 0 0 1
Figure 1 Ð The balanced scorecard
2 0
Dow
nloa
ded
by U
nive
rsiti
Keb
angs
aan
Mal
aysi
a A
t 22:
44 1
7 M
arch
201
5 (P
T)

M e a s u r i n g B u s i n e s s E x c e l l e n c e 5 , 2 2 0 0 1
Table I Ð Summary statistics of the 83 electronics companies
A. Job title of respondents
Job title used by respondents Number of respondents Percentage
Plant manager, manufacturing manager, or operations manager 23 28
VP of operations, VP of engineering, VP of manufacturing, or VP of quality 24 29
Director of operations, director of manufacturing, or director of manufacturing and engineering 14 17
CEO, president and CEO, executive VP, or president 5 6
Miscellaneous titles used, e.g. material manager, test manager, sourcing and fabricationmanager, or product integrity manager 11 13
No information on job title 6 7
Total respondents 83 100
B. Advanced workplace practices (n = 83)
Variable No formal program 1-2 years 3-4 years > 4 years
Years of TQM experience 25 (30%) 19 (23%) 22 (27%) 17 (20%)
Years of JIT experience 30 (36%) 22 (27%) 15 (18%) 16 (19%)
Variable Fixed payFixed + noncash reward
Fixed + individual-basedcash reward
Fixed + group-basedcash reward
Worker compensation 37 (45%) 7 (8%) 13 (16%) 26 (31%)
Scale ranging from 1-7 (strongly disagree = 1, 4 = neither disagree or agree, 7 = strongly agree)
Variable 1-3 3.1-4.9 5-7
Work team practices 3 (3%) 18 (22%) 62 (75%)
Figure 2 Ð The balanced scorecard for a manufacturing division ± a theoretical model
2 1
Dow
nloa
ded
by U
nive
rsiti
Keb
angs
aan
Mal
aysi
a A
t 22:
44 1
7 M
arch
201
5 (P
T)

Are the analyses holding up?
Kaplan and Norton (1996b) suggest the use of
correlation analysis to test the expected relationships in
the scorecards. Accordingly, results of correlation are
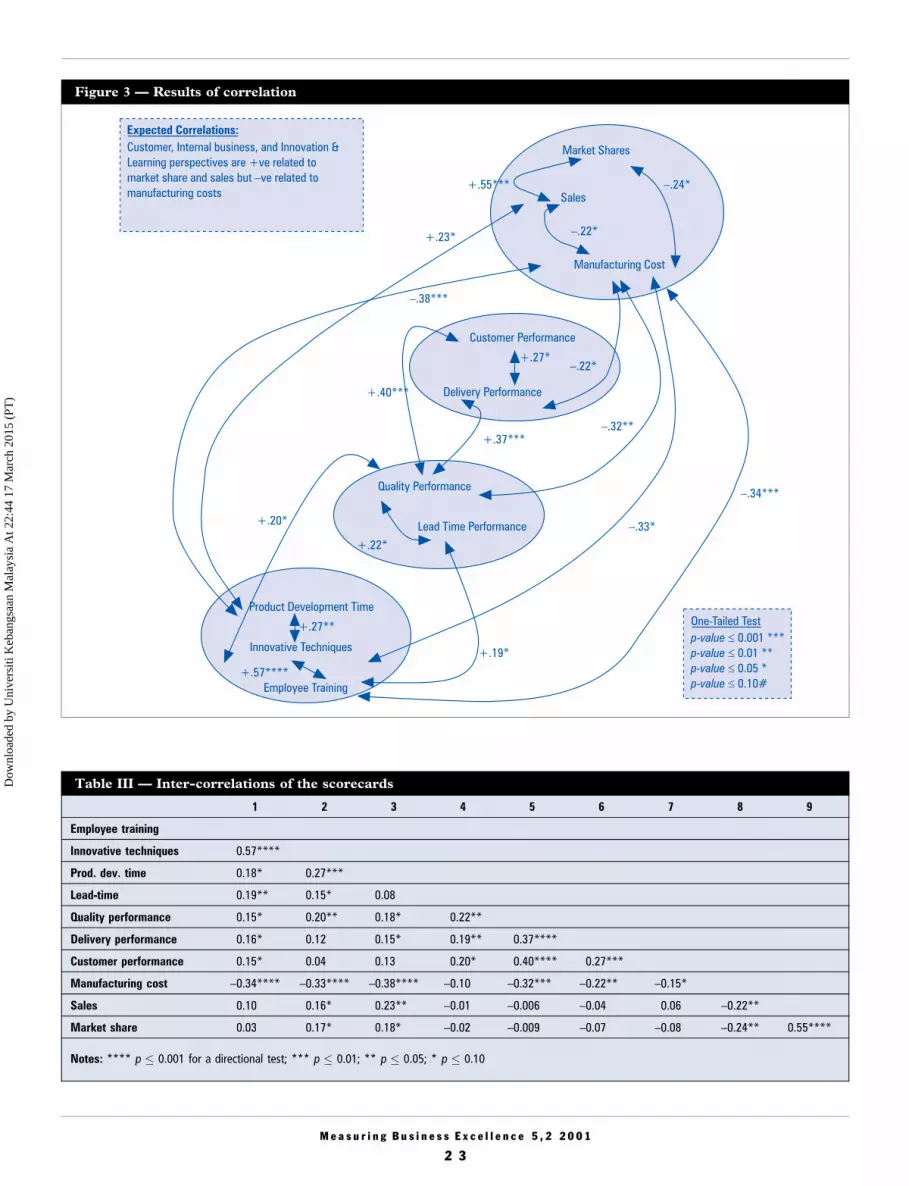
presented in Figure 3 as well as Table III. Figure 3
shows how the four perspectives are interrelated, while
Table III presents results of inter-correlations among the
scorecards (i.e. goals and measures). For example,
innovative techniques and employee training are
positively correlated to shorter product development
time. In many instances, innovative techniques and
shorter product development time are positively related
to internal business process perspective (i.e. quality
performance and lead time performance), while quality
performance is positively related to the customer
perspective (customer and delivery performance).
Finally, customer performance is negatively related to
manufacturing costs (i.e. lower manufacturing costs are
associated with higher customer satisfaction), while
manufacturing costs are negatively related to sales
(i.e. lower manufacturing costs are associated with
higher sales) and market share (i.e. lower manufacturing
costs are associated with higher market share).
Accordingly, the results are consistent with many of the
expectations outlined in Figure 2, the theoretical model.
Nevertheless, what appear to be equally if not more
interesting are the correlations of the innovation and
learning perspective with the other perspectives. Given
the importance of the innovation and learning
perspective, the next section discusses these
relationships.
Core competencies ± innovation and continuous
employee training
Long-term survival of a business is dependent upon
meeting market needs through long-term value creation
process. Historically, the operations process, or
operational excellence, has been the focus of this value
creation process. In contrast, recent developments in the
literature have called for a shift in emphasis to the
`̀ innovation process'' (see Kaplan and Norton, 1996a;
Simons, 2000). In the innovation process, managers
identify new customers, new markets, and the emerging
needs of the existing and future customers. With intense
competition, current technology and employee skills
often quickly become obsolete or inadequate to keep
pace with the changing needs of the customers.
Accordingly, businesses continue to invest in employee
training while searching for breakthrough technology in
order to excel. Proponents for BSC have suggested that
the innovation and learning perspective could be used to
monitor this long-term value creation process.
Surprisingly, few organizations have maintained a good
scorecard that is relevant to this important process. For
example, Frigo and Krumwiede (1999) reported that the
majority of BSC users in their study rate the
effectiveness of their organization's performance
measures in the innovation perspective as `̀ less than
adequate to poor''.
M e a s u r i n g B u s i n e s s E x c e l l e n c e 5 , 2 2 0 0 1
Table II Ð A framework of the balanced scorecard for a manufacturing division
Perspective Goals Performance measures
Innovation and learning Be innovative and continually improveour manufacturing skills
Employee training (average across three indicators)(1) management devotion to quality improvement(2) quality related training provided to employees(3) Percent of employees who have quality as a major responsibility
Innovative techniques (average across three indicators):(1) quality function deployment technique(2) Taguchi methods(3) continuous process improvement technique
New product development time
Internal business process To improve manufacturing efficiency Quality performance (average across five indicators)(1) cost of scrap(2) units reworked(3) units of defect(4) warranty cost(5) sales returned
Performance in manufacturing lead time
Customer Delight the customers Customer performance (average across three indicators)(1) customer perceived product durability and reliability(2) customer perceived overall product performance(3) customer complaints
Delivery performance(1) Percent delivered to schedule
Financial Reward shareholders by cutting costsand improving sales
Manufacturing costsSalesMarket share
2 2
Dow
nloa
ded
by U
nive
rsiti
Keb
angs
aan
Mal
aysi
a A
t 22:
44 1
7 M
arch
201
5 (P
T)
M e a s u r i n g B u s i n e s s E x c e l l e n c e 5 , 2 2 0 0 1
Figure 3 Ð Results of correlation
Table III Ð Inter-correlations of the scorecards
1 2 3 4 5 6 7 8 9
Employee training
Innovative techniques 0.57****
Prod. dev. time 0.18* 0.27***
Lead-time 0.19** 0.15* 0.08
Quality performance 0.15* 0.20** 0.18* 0.22**
Delivery performance 0.16* 0.12 0.15* 0.19** 0.37****
Customer performance 0.15* 0.04 0.13 0.20* 0.40**** 0.27***
Manufacturing cost ±0.34**** ±0.33**** ±0.38**** ±0.10 ±0.32*** ±0.22** ±0.15*
Sales 0.10 0.16* 0.23** ±0.01 ±0.006 ±0.04 0.06 ±0.22**
Market share 0.03 0.17* 0.18* ±0.02 ±0.009 ±0.07 ±0.08 ±0.24** 0.55****
Notes: **** p � 0.001 for a directional test; *** p � 0.01; ** p � 0.05; * p � 0.10
2 3
Dow
nloa
ded
by U
nive
rsiti
Keb
angs
aan
Mal
aysi
a A
t 22:
44 1
7 M
arch
201
5 (P
T)

Contributions
One major contribution of this study lies in the
identification of the performance measures for the
innovation and learning perspective. Consistent with the
BSC literature (e.g. Kaplan and Norton, 1992; 1996a;
1996b; Atkinson and Epstein, 2000), employee training
is included as one of the performance measures.
However, it must also be borne in mind that a good
scorecard should not lead to `̀ information overload''.
Thus, this study includes only techniques that are truly
innovative (see Table II for the three techniques selected
for this study). Finally, product development time is
included as the third measure for the innovation and
learning perspective, because
both empirical and anecdotal
evidence have increasingly
viewed `̀ time to market'' as a key
to success and profitability
(Cooper and Kleinschmidt,
1994; Choperana, 1996; DroÈge
et al., 2000)[2].
Our results as presented in
Figure 3 show that employee
training is positively related to
delivery and customer
performance; it is also related to
lower manufacturing costs.
Similarly, innovative techniques
are related to lower
manufacturing costs, higher
sales, and greater market share,
while shorter product
development time[3] is related
to lower manufacturing costs,
higher sales, and greater market
share. These results are further
illustrated in Table IV. For
example, companies that
reported that their
manufacturing costs `̀ decreased
tremendously'' also scored
higher in the scale of 1-7 in employee training and
innovative techniques; they also reported better
improvement in product development time as compared
to companies that reported that their manufacturing
costs only `̀ increased slightly''. These results were
statistically significant. Likewise, companies that
reported `̀ tremendous increase'' in their market share
and sales also reported a higher score in innovative
techniques as well as a better improvement in product
development time as compared to companies that
reported only `̀ slightly decrease'' in market share and
sales. Again, except for one result which is marginally
supported, the remaining results are statistically
significant.
Although many of the results are consistent with
theories in the performance literature, a correlation test
does not allow us to make statements about cause and
effect. Accordingly, additional analysis that allows us to
make better inferences was conducted. When collecting
the above data, we were also interested in whether
advanced workplace practices add value to businesses.
Thus, we asked questions related to these issues. Results
of regression analysis are presented in Table V.
In the above analysis, we predicted that the
implementation of advanced workplace practices
(i.e. years of implementing TQM and JIT, the use of
incentive plans, work team, TQM and JIT) are positively
related to business performance,
such as higher market share,
higher sales and lower
manufacturing costs. Results of
regression analysis provide
support for our expectations.
For example, findings show that
`̀ years of implementing TQM''
and `̀ years of implementing
JIT'' are positively related to
greater market share. In
addition, the implementation of
work team is also positively
related to greater marker share.
Similarly, results indicate that
work team and TQM are
positively related to lower
manufacturing costs. On the
other hand, it appears that
companies in their early stage of
JIT implementation show
greater reduction in
manufacturing costs than
companies that had
implemented JIT for a longer
period. It is plausible that these
results are due to `̀ diminishing
returns'' after implementing JIT
for a longer period of time.
Although not directly related to the primary objective of
this study, results of regression analysis enhance the
current study by providing important insights into
business strategy (i.e. the implementation of advanced
workplace practices), performance measures, and
business success.
Conclusion
Using information collected from 83 companies,
correlation and regression results provide support for the
BSC. Specifically, findings suggest that the BSC can be
used as a tool for monitoring the long-term value
creation process. Undoubtedly, providing training to
employees or implementing innovative techniques
M e a s u r i n g B u s i n e s s E x c e l l e n c e 5 , 2 2 0 0 1
``Although not directly
related to the primary
objective of this study,
results of regression
analysis enhance the
current study by
providing important
insights into business
strategy (i.e. the
implementation of
advanced workplace
practices),performance
measures, and business
success.''
2 4
Dow
nloa
ded
by U
nive
rsiti
Keb
angs
aan
Mal
aysi
a A
t 22:
44 1
7 M
arch
201
5 (P
T)

M e a s u r i n g B u s i n e s s E x c e l l e n c e 5 , 2 2 0 0 1
Table V Ð Further evidence ± advanced workplace practicesa are value-added to businesses
Change in market share Change in salesChange in manufacturing
costs
Expected signsa Coefficient (t-value) Coefficient (t-value) Coefficient (t-value)
Intercept 3.61 (44.4)*** 4.06 (43.9)*** 1.99 (23.3)***TQM-time + 0.12 (1.98)* 0.11(1.60) ±0.06 (±0.87)JIT-time + 0.11 (2.07)* ±0.07 (±1.12) 0.11 (1.94)*Incentive plans + 0.10 (0.55) 0.23 (1.13) ±0.07 (±0.40)Work team + 0.21 (2.29)** 0.21 (2.07)* ±0.18 (±1.94)*TQM + ±0.6 (±0.53) ±0.001 (±0.01) ±0.24 (±1.90)*JIT + ±0.27 (±1.66) ±0.24 (±1.25) 0.06 (0.35)
Adj R2 0.128 0.095 0.17Overall F 2.96** 2.37* 3.67**n 81 80 79
Notes:TQM-time and JIT-time were measured in years of implementing the TQM or JIT program. Incentive plans is a dichotomous variable, with `̀ 1'' representing theuse of incentive pay while `̀ 0'' representing the use of fixed-pay for the employees. Finally, work team, TQM, and JIT were measured using a scale of 1-7a The expected signs are for sales and market share. These signs will be negative for manufacturing costsAll t-tests were one-tailed tests: *** p � 0.001; ** p � 0.01; * p � 0.05
Table IV Ð Interrelationship of the innovation and learning perspective with the financial perspective
Performance measures from innovation andlearning perspective
Manufacturing costsincrease slightly
(= 4)
Manufacturing costdecreased tremendously
(=1) t-value Results supported?
Mean score for employee training 3.96 (n = 6) 5.49 (n = 21) 3.02**** SupportedMean score for innovative techniques 2.71 (n = 7) 4.08 (n = 21) 3.08**** SupportedMean score for percent change in product
development timea 9% (n = 6) 39% (n = 19) 3.16**** Supported
Performance measures from innovation andlearning perspective
Sales decreased slightly(=2)
Sales increasedtremendously (=5) t-value Results supported?
Mean score for innovative techniques 2.78 (n = 6) 3.81 (n = 26) 2.09** SupportedMean score for percent change in product
development time 18% (n = 4) 38% (n = 25) 1.61* Marginally supported
Performance measures from innovation andlearning perspective
Market share decreasedslightly (=2)
Market share increasedtremendously (=5) t-value Results supported?
Mean score for innovative techniques 3.38 (n = 7) 4.48 (n = 7) 1.89** SupportedMean score for percent change in product
development time 12% (n = 5) 37% (n = 8) 2.31** Supported
Notes:Respondents were asked to identify changes in manufacturing costs, sales, and market share in the last 3 years using the scale of 1-5 (decreased tremendously =1, no change = 3, increased tremendously = 5). Similar questions were asked with respect to the use of innovative techniques and employee training using thescale of 1-7 (strongly disagree/little or none = 1, neither disagree or agree = 4, strongly agree/consistent use = 7). It is interesting to note that no respondentmarked increased tremendously in manufacturing cost in the survey; similarly, no respondent marked decreased tremendously in sales or market share. Consistentwith the theories from BSC, it is hypothesized that manufacturing plants that reported tremendous decrease in manufacturing costs should score higher in theinnovation and learning perspectives than those plants that reported slightly increase in manufacturing costs. Likewise, it is hypothesized that manufacturingplants that reported tremendous increase in sales or market share should score higher in the innovation and learning perspectives than those plants that reportedslightly decrease in sales and market share. Results from t-statistics supported the expectationsAll t-tests were one-tailed tests: **** p � 0.001; *** p � 0.01; ** p � 0.05; * p � 0.10a Respondents were asked to report the average time to market a new product for the most recent year (t) and two years ago (t-2). Percent change in
product development time was calculated using the following formula: [(time to market in yeart±2 ± time to market in yeart)/time to market in yeart±2 * 100percent]
2 5
Dow
nloa
ded
by U
nive
rsiti
Keb
angs
aan
Mal
aysi
a A
t 22:
44 1
7 M
arch
201
5 (P
T)

consumes a significant amount of resources. Top
management often wonders about the payback of this
type of investment. The findings of this study provide
useful information in this regard. Finally, the significant
correlations of product development time with the three
financial indicators are consistent with the current body
of literature. For example, prior research studies have
shown that first-to-market products often command
higher initial prices and then garner dominant market
share and greater customer loyalty. Significant cost
benefits are also associated with compressing the new
product development process (DroÈge et al., 2000).
Accordingly, managers may want to closely monitor
their time to market new products. A slack in this
indicator often signals retarding sales or a sluggish
market share ahead.
One limitation of our study is the small sample size.
Nevertheless, results in this study have shown that
manufacturing plants that have strategically linked their
corporate goals or objectives to their performance
measurement systems, via the scorecard in the four
perspectives, performed better than those that do not.
Consistent with the current body of literature, this study
has also demonstrated that non-financial measures are
often useful indicators of financial performance for
manufacturing companies. Most important, it is hoped
that the study will encourage more managers to
strategically link their long-term value creation process
to the performance measurement system. Last but not
least, it should be added that the model presented in this
study should be considered as a template and not a
`̀ cure-all'' solution. MBE
Notes
1. Although return on investment is an important performance
measure for a business unit, it is not captured in our study due to
perceived difficulties in getting this information from the
respondents, a majority of whom are plant managers or directors
of operations.
2. Employee satisfaction is a good measure for the innovation and
learning perspective. Its exclusion from this study is mainly due
to the perceived difficulties in collecting this information, since
the questionnaire was sent to the director of manufacturing.
3. Shorter product development time is often the end results of
increased employee training and the use of innovative
techniques.
References
American Institute of Certified Public Accountants (1994), Improving
Business Reporting ± A Customer Focus, AICPA, New York, NY.
Atkinson, A. and Epstein, M. (2000), `̀ Measure for measure'', CMA
Magazine, Vol. 74 No. 7, pp. 22-8.
Balanced Scorecard Report (1999a), Insight, Experience and Ideas for
Strategy-focused Organizations, Article Reprint No. B9911F,
Harvard Business School Publishing, Boston, MA.
Balanced Scorecard Report (1999b), Insight, Experience and Ideas for
Strategy-focused Organizations, Article Reprint No. B9911B,
Harvard Business School Publishing, Boston, MA.
Choperana, A.M. (1996), `̀ Fast cycle time ± driver of innovation and
cycle time'', Research Technology Management, May-June,
pp. 36-49.
Cooper, R.G. and Kleinschmidt, E.J. (1994), `̀ Determinants of
timeliness in product development'', Journal of Product Innovation
Management, Vol. 11, pp. 381-96.
DroÈge, C., Jayaram, J. and Vickery, S. (2000), `̀ The ability to minimize
the timing of new product development and introduction: an
examination of antecedent factors in the North American
automobile supplier industry'', Journal of Production Innovation
Management, Vol. 17, pp. 24-40.
Frigo, M.L. and Krumwiede, K.R. (1999), `̀ Balanced scorecards: a
rising trend in strategic performance measurement'', Journal of
Strategic Performance Measurement, Vol. 3, February-March,
pp. 42-8.
Institute of Management Accountants (IMA) (1996), Are Corporate
America's Financial Measurements Outdated?, IMA, Montvale, NJ.
Itami, H. (1987), Mobilizing Invisible Assets, Harvard University Press,
Cambridge, MA.
Ittner, C.D. and Larcker, D.F. (1998), `̀ Innovations in performance
measurement: trends and research implications'', Journal of
Management Accounting Research, Vol. 10, pp. 205-38.
Ittner, C.D., Larcker, D.F. and Meyer, M. (1997), `̀ Performance,
compensation, and the balanced scorecard'', working paper,
University of Pennsylvania.
Kaplan, R.S. and Norton, D.P. (1992), `̀ The balanced scorecard ±
measures that drive performance'', Harvard Business Review,
January-February, pp. 71-9.
Kaplan, R.S. and Norton, D.P. (1996a), Translating Strategy into
Actions: The Balanced Scorecard, Harvard Business School Press,
Boston, MA.
Kaplan, R.S. and Norton, D.P. (1996b), `̀ Using the balanced
scorecard as a strategic management systems'', Harvard Business
Review, January-February, pp. 75-85.
Rucci, A.J., Kirn, S.P. and Quinn, R.T. (1998), `̀ The employee-
customer-profit chain at Sears'', Harvard Business Review,
Vol. 76, January-February, pp. 82-97.
Sim, K.L., Killough, L.N. and Curatola, A.P. (1999), `̀ An
examination of organizational design and performance
improvement in the manufacturing industry'', International
Review of Accounting, Vol. 4, pp. 1-21.
Simons, R. (2000), Performance Measurement and Control Systems for
Implementing Strategy, Prentice-Hall, Englewood Cliffs, NJ.
Waterhouse, J.M. (1999), `̀ Reporting practices: measuring up'',
CA Magazine, March, pp. 41-8.
M e a s u r i n g B u s i n e s s E x c e l l e n c e 5 , 2 2 0 0 1
2 6
Dow
nloa
ded
by U
nive
rsiti
Keb
angs
aan
Mal
aysi
a A
t 22:
44 1
7 M
arch
201
5 (P
T)

This article has been cited by:
1. Mohamed El-Mekawy, Lazar Rusu, Erik Perjons. 2015. An evaluation framework for comparing business-IT alignmentmodels: A tool for supporting collaborative learning in organizations. Computers in Human Behavior . [CrossRef]
2. Bruce Gurd, Panayiotis Ifandoudas. 2014. Moving towards agility: the contribution of a modified balanced scorecard system.Measuring Business Excellence 18:2, 1-13. [Abstract] [Full Text] [PDF]
3. Adrian Payne, Pennie Frow. 2014. Developing superior value propositions: a strategic marketing imperative. Journal of ServiceManagement 25:2, 213-227. [Abstract] [Full Text] [PDF]
4. Adrian Payne, Pennie Frow. 2014. Deconstructing the value proposition of an innovation exemplar. European Journal ofMarketing 48:1/2, 237-270. [Abstract] [Full Text] [PDF]
5. Sangjae Lee, Sung Bum Park, Gyoo Gun Lim. 2013. Using balanced scorecards for the evaluation of “Software-as-a-service”.Information & Management 50, 553-561. [CrossRef]
6. André de Waal, Karima Kourtit. 2013. Performance measurement and management in practice. International Journal ofProductivity and Performance Management 62:5, 446-473. [Abstract] [Full Text] [PDF]
7. Naqi Sayed. 2013. Ratify, reject or revise: balanced scorecard and universities. International Journal of Educational Management27:3, 203-220. [Abstract] [Full Text] [PDF]
8. Sany Sanuri Mohd Mokhtar. 2013. The effects of customer focus on new product performance. Business Strategy Series 14:2/3,67-71. [Abstract] [Full Text] [PDF]
9. Bunjongjit Rompho, Sununta Siengthai. 2012. Integrated performance measurement system for firm's human capital building.Journal of Intellectual Capital 13:4, 482-514. [Abstract] [Full Text] [PDF]
10. Fu-Hsiang Chen, Tsung-Shin Hsu, Gwo-Hshiung Tzeng. 2011. A balanced scorecard approach to establish a performanceevaluation and relationship model for hot spring hotels based on a hybrid MCDM model combining DEMATEL and ANP.International Journal of Hospitality Management 30, 908-932. [CrossRef]
11. Samuel Azasu. 2011. Ownership and size as predictors of incentive plans within Swedish real estate firms. Property Management29:5, 454-467. [Abstract] [Full Text] [PDF]
12. Md Habib‐Uz‐Zaman Khan, Abdel K. Halabi, Kurt Sartorius. 2011. The use of multiple performance measures and thebalanced scorecard (BSC) in Bangladeshi firms. Journal of Accounting in Emerging Economies 1:2, 160-190. [Abstract] [FullText] [PDF]
13. Milind T. Phadtare. 2010. Developing Balanced Scorecard: Case of Three Construction Firms of Small Size. Journal of Asia-Pacific Business 11, 135-157. [CrossRef]
14. Mar Vila, Gerard Costa, Xari Rovira. 2010. The creation and use of scorecards in tourism planning: A Spanish example.Tourism Management 31, 232-239. [CrossRef]
15. 강강강, 강강강. 2010. Analysis of the Casual Relationships between Service Business Performance using Performance Measures.Jounal of Korea Service Management Society 11, 87-110. [CrossRef]
16. André de Waal, Karima Kourtit, Peter Nijkamp. 2009. The relationship between the level of completeness of a strategicperformance management system and perceived advantages and disadvantages. International Journal of Operations & ProductionManagement 29:12, 1242-1265. [Abstract] [Full Text] [PDF]
17. Meena Chavan. 2009. The balanced scorecard: a new challenge. Journal of Management Development 28:5, 393-406. [Abstract][Full Text] [PDF]
18. Karima Kourtit, Peter Nijkamp, Andre A. de Waal. 2009. Strategic Performance Management and creative industry.International Journal of Foresight and Innovation Policy 5, 65. [CrossRef]
19. Scott B. Jackson, Thomas J. Lopez, Austin L. Reitenga. 2008. Accounting fundamentals and CEO bonus compensation.Journal of Accounting and Public Policy 27, 374-393. [CrossRef]
20. Ruzita Jusoh, Daing Nasir Ibrahim, Yuserrie Zainuddin. 2008. The performance consequence of multiple performancemeasures usage. International Journal of Productivity and Performance Management 57:2, 119+-136. [Abstract] [Full Text][PDF]
21. Monica Franco‐Santos, Mike Kennerley, Pietro Micheli, Veronica Martinez, Steve Mason, Bernard Marr, Dina Gray, AndrewNeely. 2007. Towards a definition of a business performance measurement system. International Journal of Operations &Production Management 27:8, 784-801. [Abstract] [Full Text] [PDF]
Dow
nloa
ded
by U
nive
rsiti
Keb
angs
aan
Mal
aysi
a A
t 22:
44 1
7 M
arch
201
5 (P
T)

22. Tariq H. Ismail. 2007. Performance evaluation measures in the private sector: Egyptian practice. Managerial Auditing Journal22:5, 503-513. [Abstract] [Full Text] [PDF]
23. Nagarajah Lee. 2006. Measuring the performance of public sector organisations: a case study on public schools in Malaysia.Measuring Business Excellence 10:4, 50-64. [Abstract] [Full Text] [PDF]
24. Mohd Zulkifli Mokhtar, Yusuf Karbhari, Kamal Naser. 2005. Company Financial Performance and ISO 9000 Registration:Evidence from Malaysia. Asia Pacific Business Review 11, 349-367. [CrossRef]
25. Ramakrishnan Ramanathan. 2004. Business excellence of industrial groups in Oman. Measuring Business Excellence 8:4, 34-44.[Abstract] [Full Text] [PDF]
26. Silvia Ondategui-Parra, Jui G. Bhagwat, Kelly H. Zou, Adheet Gogate, Lisa A. Intriere, Pauline Kelly, Steven E. Seltzer,Pablo R. Ros. 2004. Practice Management Performance Indicators in Academic Radiology Departments1. Radiology 233,716-722. [CrossRef]
27. Rodney A Stewart, Sherif Mohamed. 2004. Evaluating web-based project information management in construction: capturingthe long-term value creation process. Automation in Construction 13, 469-479. [CrossRef]
28. Kamal Naser, Yusuf Karbhari, Mohammad Zulkifli Mokhtar. 2004. Impact of ISO 9000 registration on company performance.Managerial Auditing Journal 19:4, 509-516. [Abstract] [Full Text] [PDF]
Dow
nloa
ded
by U
nive
rsiti
Keb
angs
aan
Mal
aysi
a A
t 22:
44 1
7 M
arch
201
5 (P
T)