massive sze-selected clusters from the atacama cosmology
TRANSCRIPT
CL2010, IPMU July 2 2010
Massive SZE-selected clusters from the Atacama Cosmology Telescope
Felipe Menanteau (Rutgers)and the ACT collaboration
(Menanteau et al. 2010, in arXiv:1006.5126)
CL2010, IPMU July 2 2010
Outline
• Why Clusters and the SZ Cluster Selection.
• Optical Identification of SZ-selected clusters
• The observed “purity” of the ACT SZ-sample.
• Conclusions
CL2010, IPMU July 2 2010
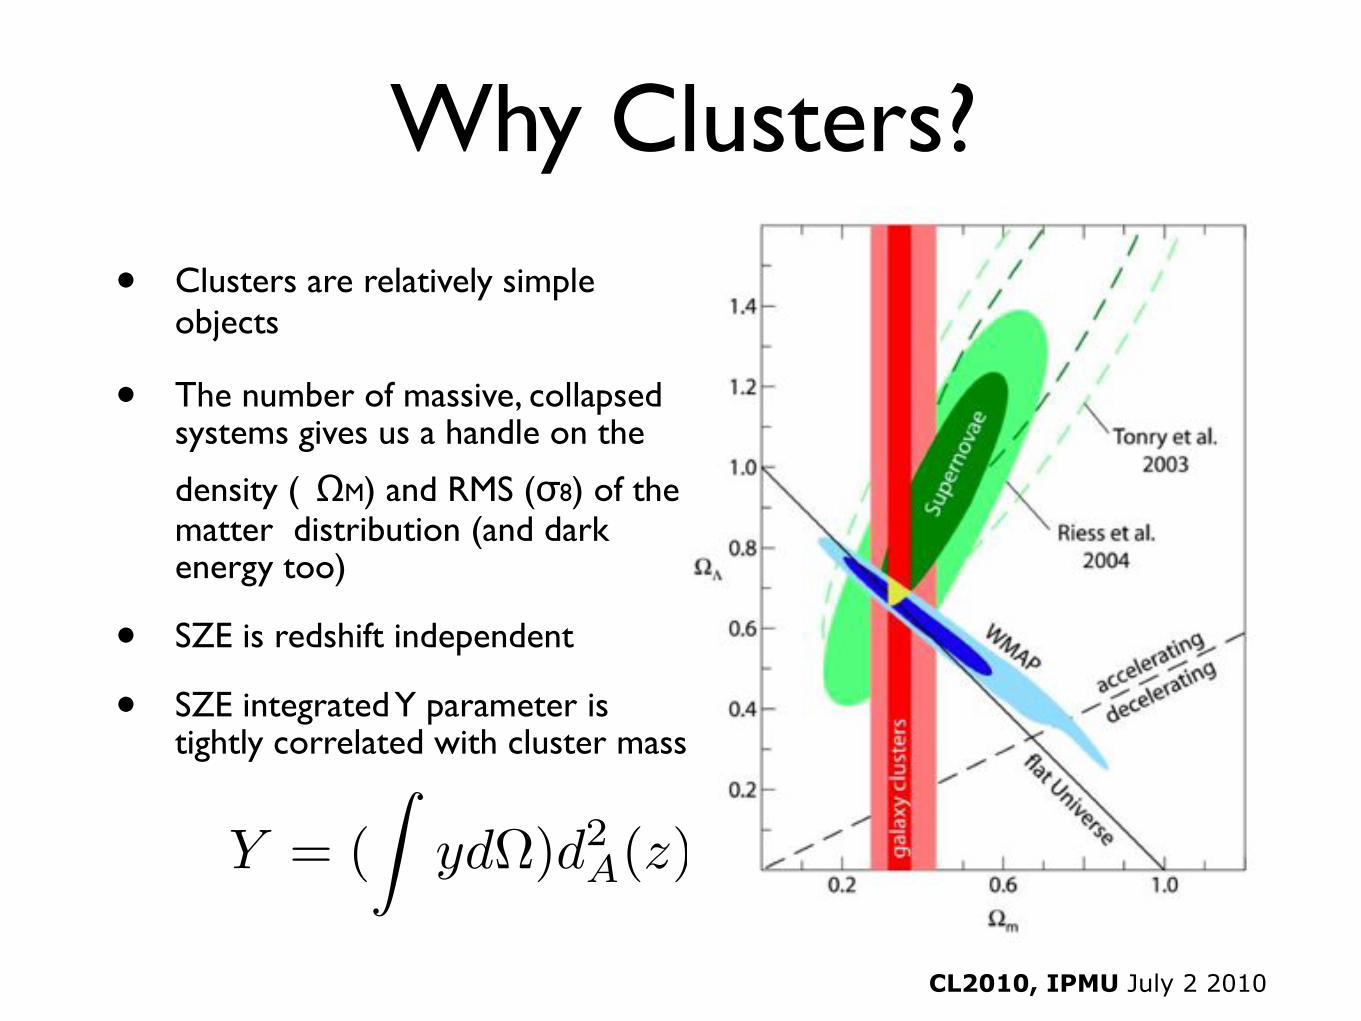
Why Clusters?
• Clusters are relatively simple objects
• The number of massive, collapsed systems gives us a handle on the
density ( !M) and RMS ("8) of the matter distribution (and dark energy too)
• SZE is redshift independent
• SZE integrated Y parameter is tightly correlated with cluster mass
Y = (!
yd!)d2A(z)
CL2010, IPMU July 2 2010
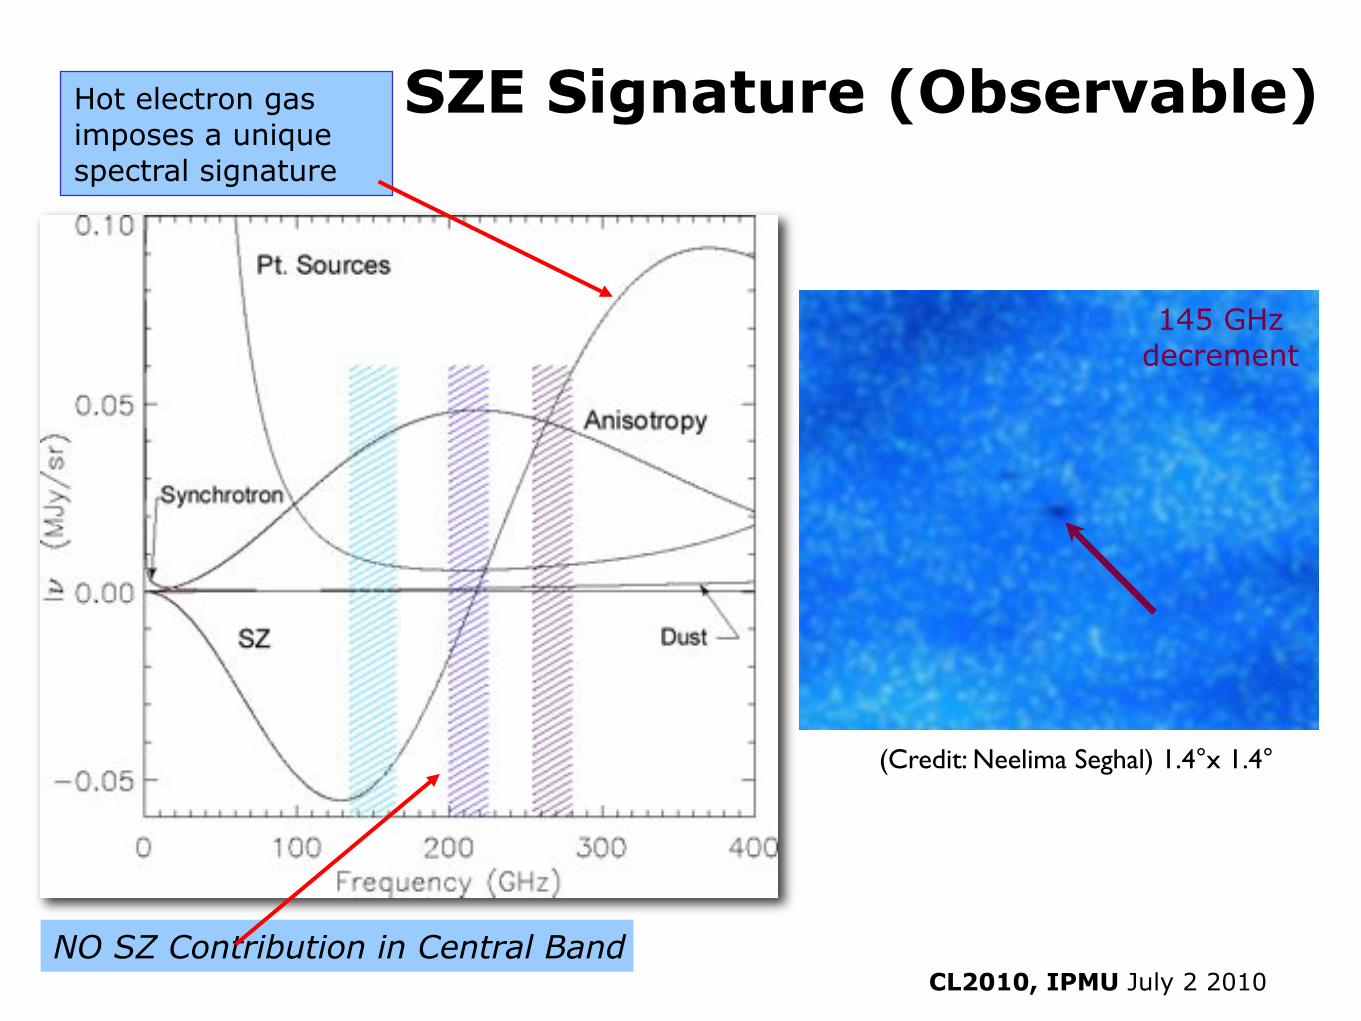
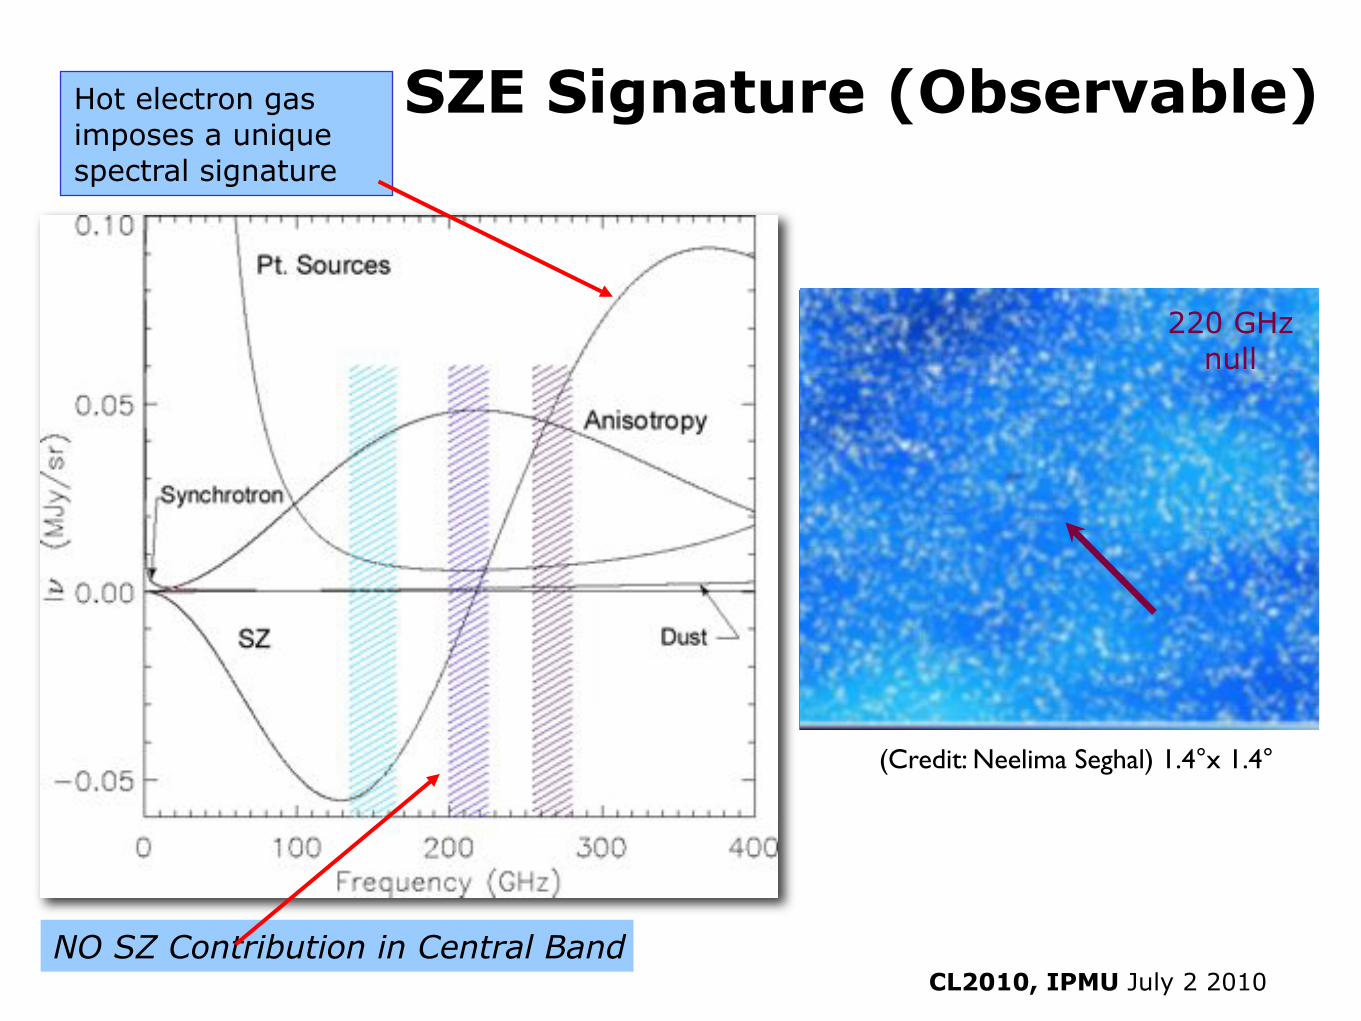
SZE Signature (Observable)Hot electron gas
imposes a unique
spectral signature
NO SZ Contribution in Central Band
(Credit: Neelima Seghal) 1.4°x 1.4°
145 GHz
decrement
CL2010, IPMU July 2 2010
SZE Signature (Observable)Hot electron gas
imposes a unique
spectral signature
NO SZ Contribution in Central Band
(Credit: Neelima Seghal) 1.4°x 1.4°
145 GHz
decrement220 GHz
null
CL2010, IPMU July 2 2010
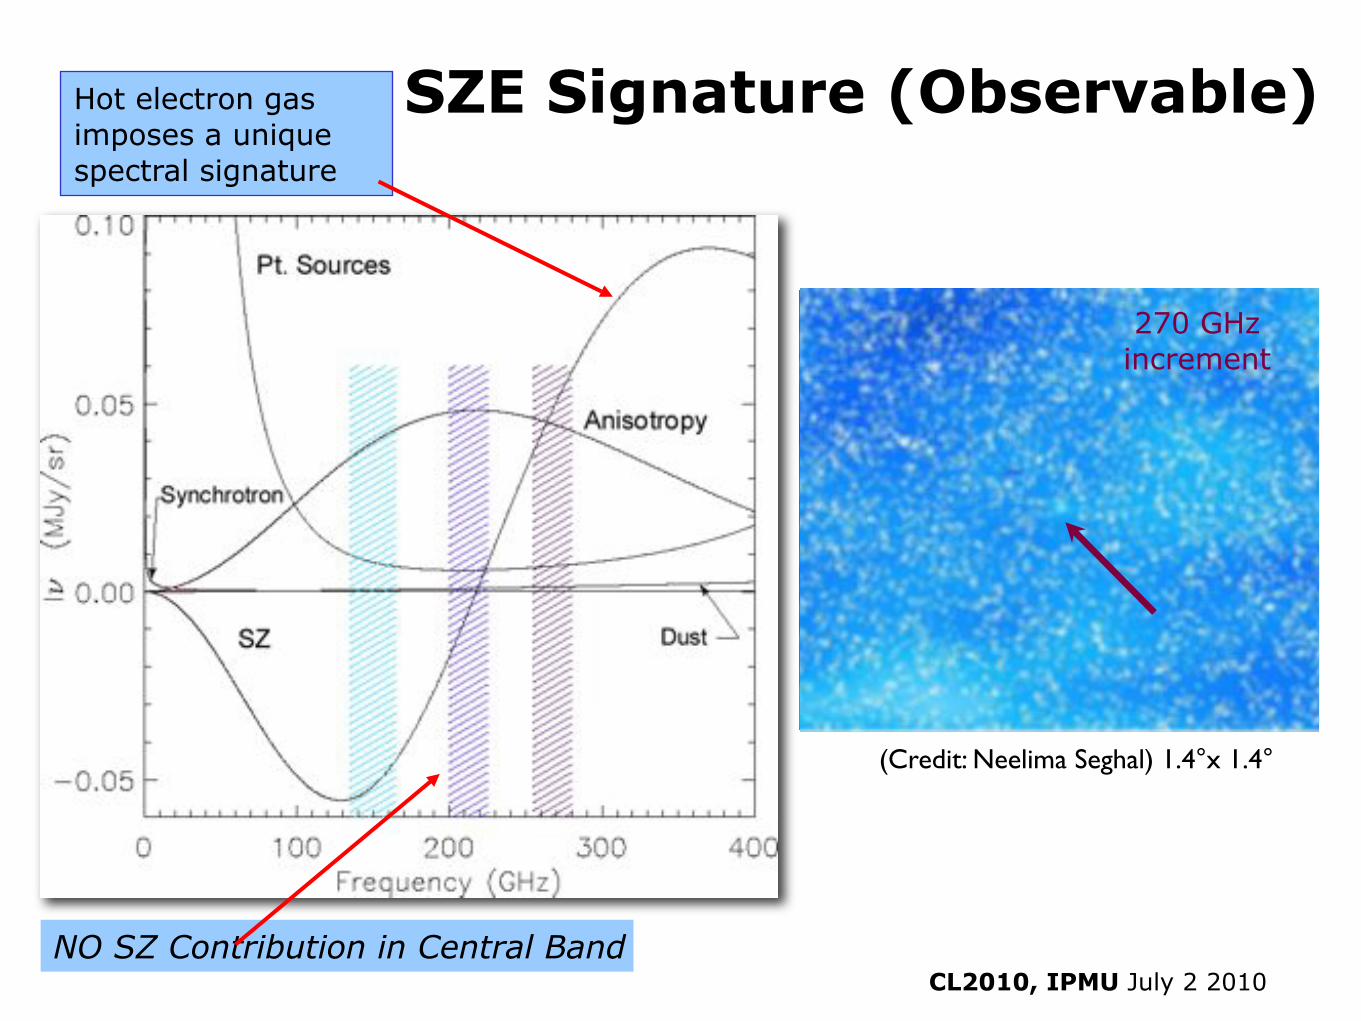
SZE Signature (Observable)Hot electron gas
imposes a unique
spectral signature
NO SZ Contribution in Central Band
(Credit: Neelima Seghal) 1.4°x 1.4°
145 GHz
decrement220 GHz
null
270 GHz
increment
CL2010, IPMU July 2 2010
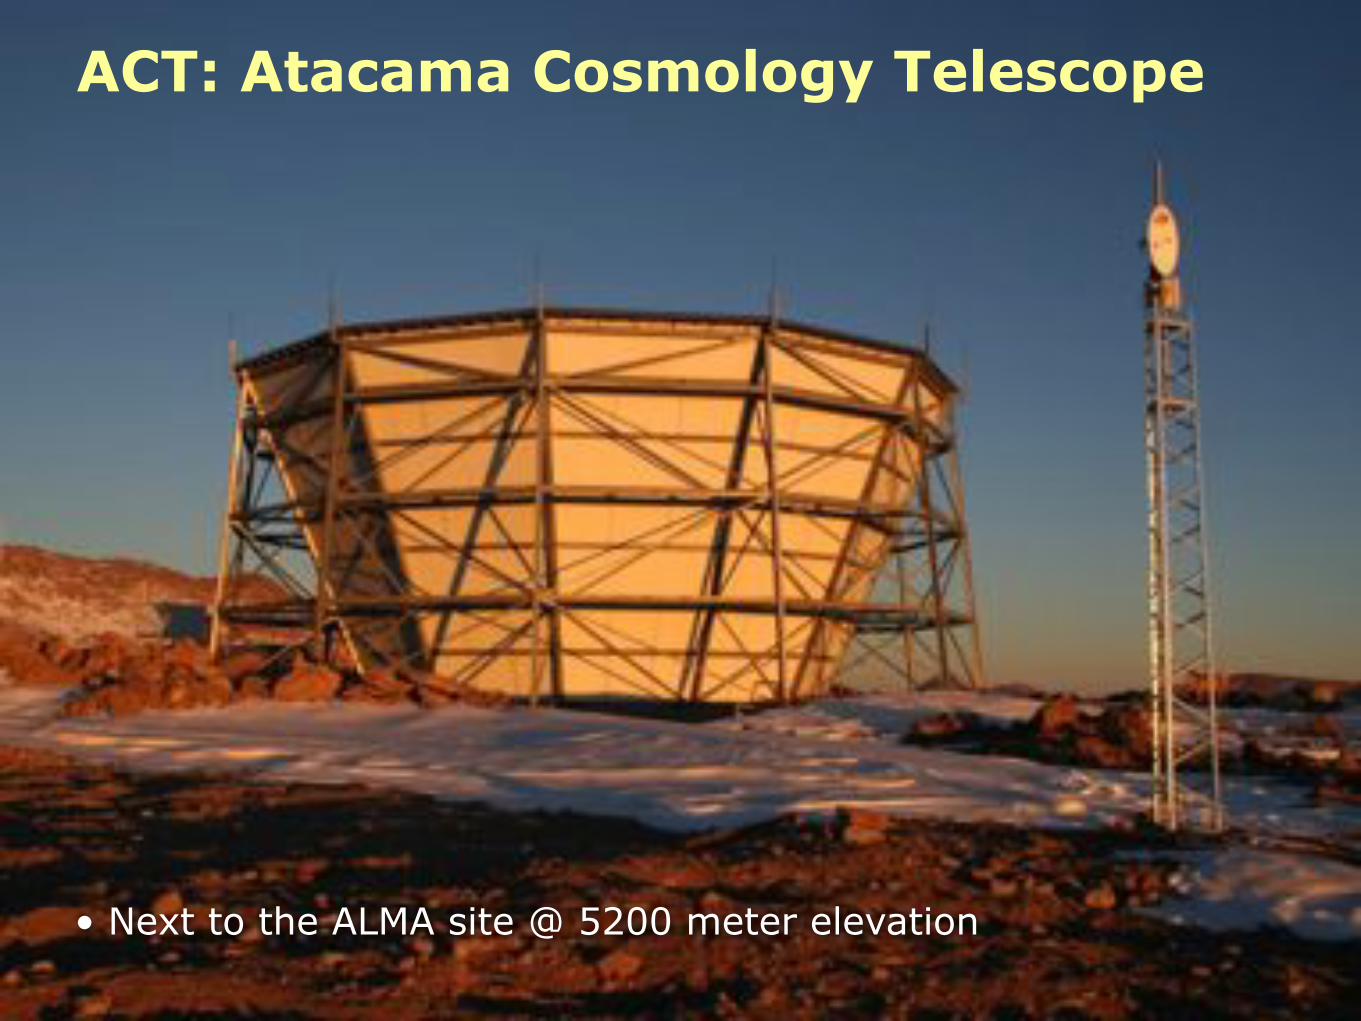
ACT: Atacama Cosmology Telescope
• Next to the ALMA site @ 5200 meter elevation
CL2010, IPMU July 2 2010
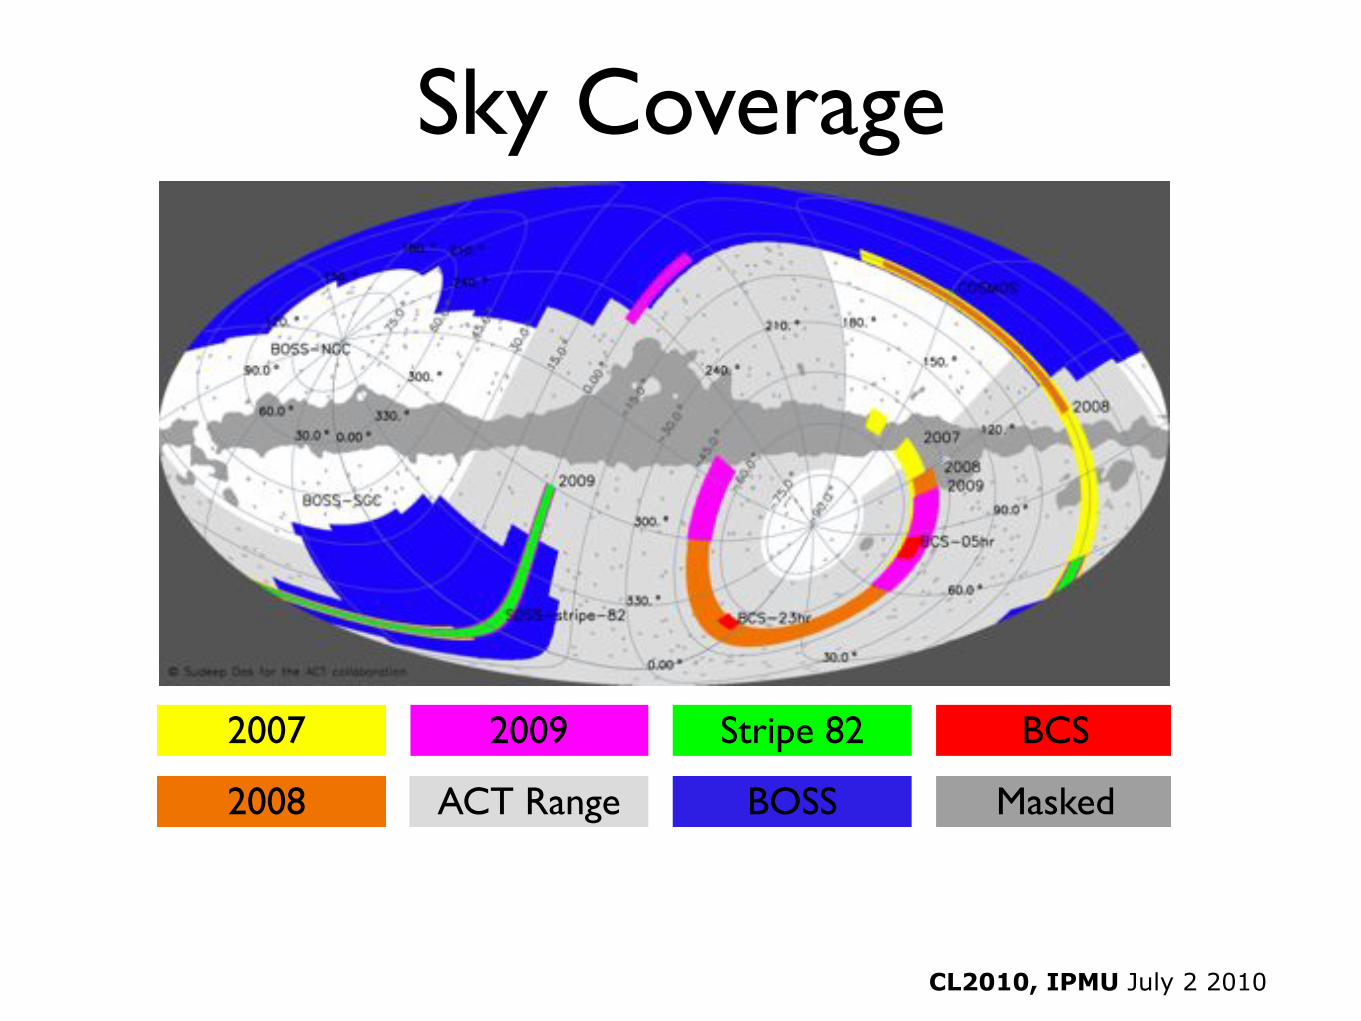
Sky CoverageSky Coverage!
ACT observes in the south (ACT strip at -55o) and at the equator (includes SDSS Stripe 82) !
ACT Survey Coverage
2007
2008
2009 Stripe 82
ACT Range BOSS
BCS
Masked
Tobias A. Marriage Fall 2009
CL2010, IPMU July 2 2010
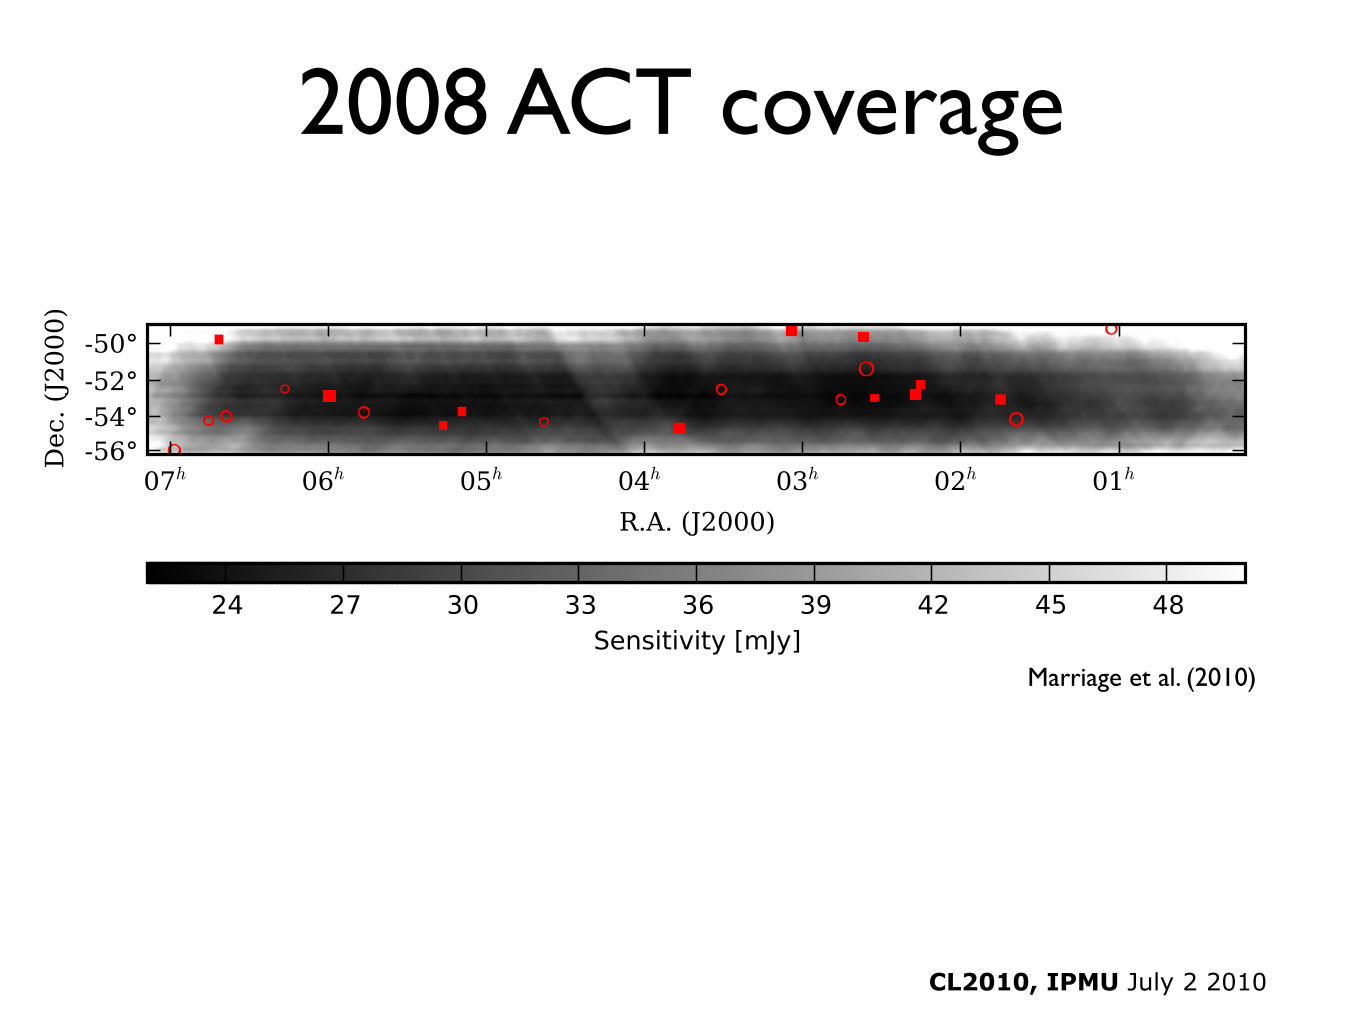
2008 ACT coverage
Marriage et al. (2010)
CL2010, IPMU July 2 2010
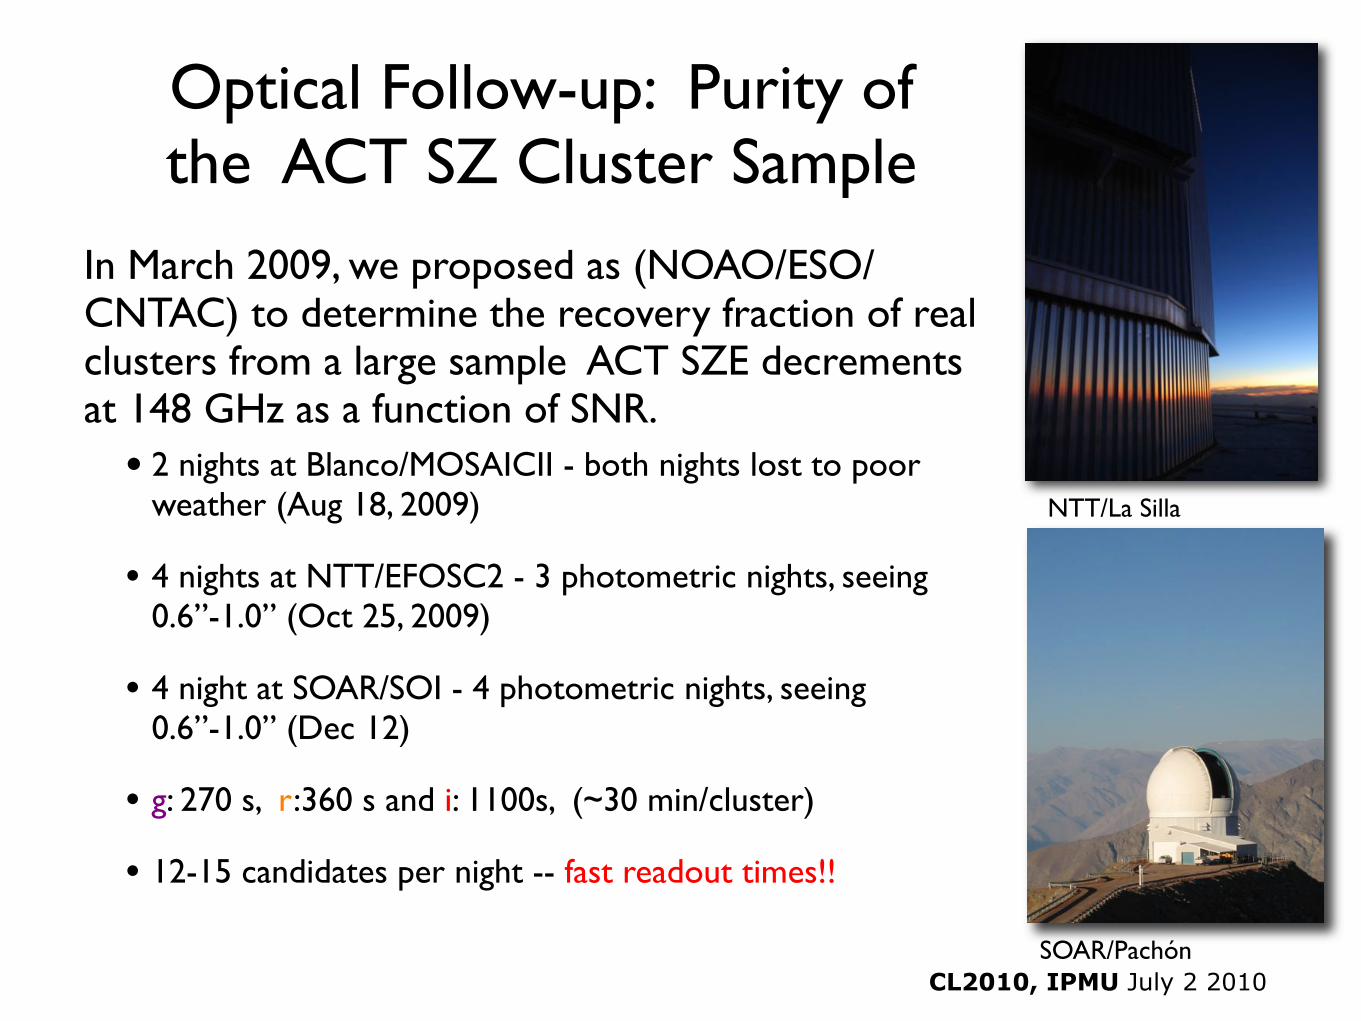
• 2 nights at Blanco/MOSAICII - both nights lost to poor weather (Aug 18, 2009)
• 4 nights at NTT/EFOSC2 - 3 photometric nights, seeing 0.6”-1.0” (Oct 25, 2009)
• 4 night at SOAR/SOI - 4 photometric nights, seeing 0.6”-1.0” (Dec 12)
• g: 270 s, r:360 s and i: 1100s, (~30 min/cluster)
• 12-15 candidates per night -- fast readout times!!
Optical Follow-up: Purity of the ACT SZ Cluster Sample
In March 2009, we proposed as (NOAO/ESO/CNTAC) to determine the recovery fraction of real clusters from a large sample ACT SZE decrements at 148 GHz as a function of SNR.
CL2010, IPMU July 2 2010
• 2 nights at Blanco/MOSAICII - both nights lost to poor weather (Aug 18, 2009)
• 4 nights at NTT/EFOSC2 - 3 photometric nights, seeing 0.6”-1.0” (Oct 25, 2009)
• 4 night at SOAR/SOI - 4 photometric nights, seeing 0.6”-1.0” (Dec 12)
• g: 270 s, r:360 s and i: 1100s, (~30 min/cluster)
• 12-15 candidates per night -- fast readout times!!
Optical Follow-up: Purity of the ACT SZ Cluster Sample
In March 2009, we proposed as (NOAO/ESO/CNTAC) to determine the recovery fraction of real clusters from a large sample ACT SZE decrements at 148 GHz as a function of SNR.
Cluster
CL2010, IPMU July 2 2010
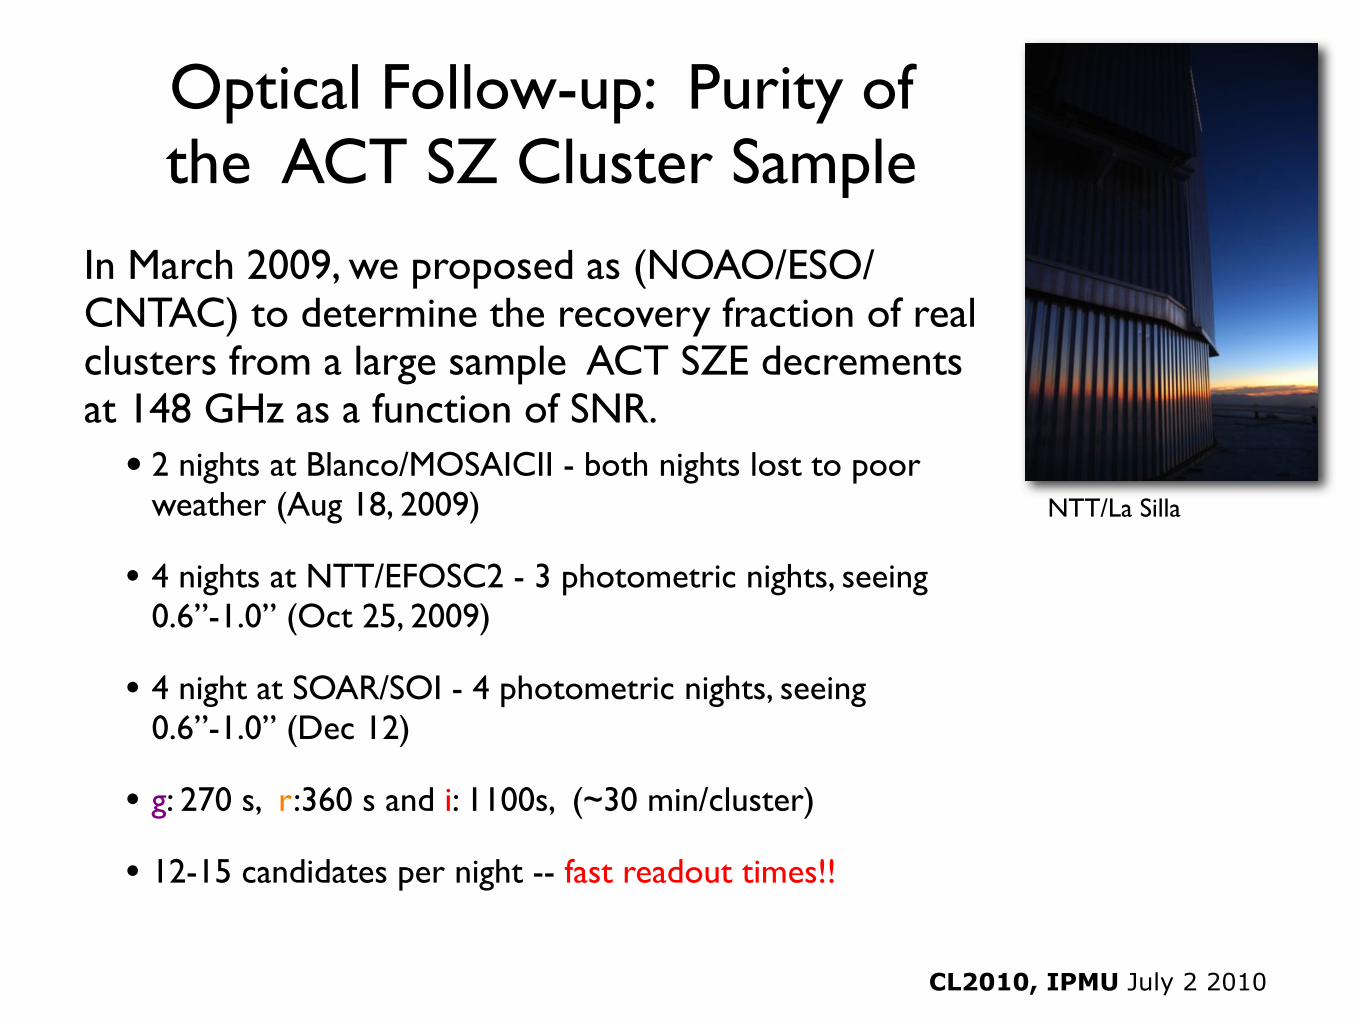
• 2 nights at Blanco/MOSAICII - both nights lost to poor weather (Aug 18, 2009)
• 4 nights at NTT/EFOSC2 - 3 photometric nights, seeing 0.6”-1.0” (Oct 25, 2009)
• 4 night at SOAR/SOI - 4 photometric nights, seeing 0.6”-1.0” (Dec 12)
• g: 270 s, r:360 s and i: 1100s, (~30 min/cluster)
• 12-15 candidates per night -- fast readout times!!
Optical Follow-up: Purity of the ACT SZ Cluster Sample
In March 2009, we proposed as (NOAO/ESO/CNTAC) to determine the recovery fraction of real clusters from a large sample ACT SZE decrements at 148 GHz as a function of SNR.
NTT/La Silla
CL2010, IPMU July 2 2010
• 2 nights at Blanco/MOSAICII - both nights lost to poor weather (Aug 18, 2009)
• 4 nights at NTT/EFOSC2 - 3 photometric nights, seeing 0.6”-1.0” (Oct 25, 2009)
• 4 night at SOAR/SOI - 4 photometric nights, seeing 0.6”-1.0” (Dec 12)
• g: 270 s, r:360 s and i: 1100s, (~30 min/cluster)
• 12-15 candidates per night -- fast readout times!!
Optical Follow-up: Purity of the ACT SZ Cluster Sample
In March 2009, we proposed as (NOAO/ESO/CNTAC) to determine the recovery fraction of real clusters from a large sample ACT SZE decrements at 148 GHz as a function of SNR.
SOAR/Pachón
NTT/La Silla
CL2010, IPMU July 2 2010
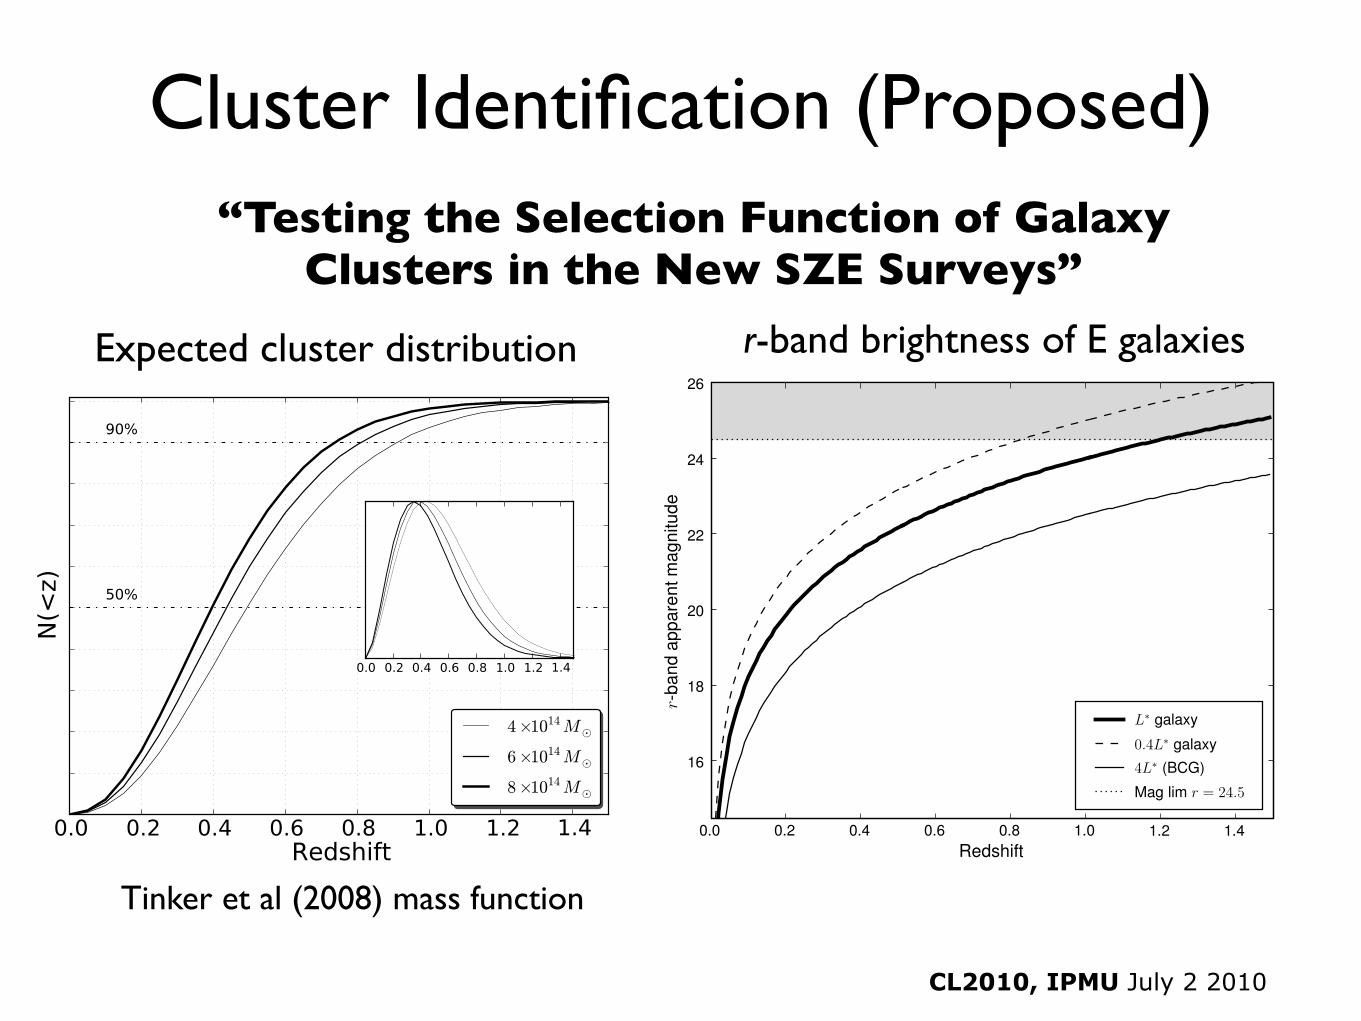
“Testing the Selection Function of Galaxy Clusters in the New SZE Surveys”
r-band brightness of E galaxiesExpected cluster distribution
Tinker et al (2008) mass function
Cluster Identification (Proposed)
CL2010, IPMU July 2 2010
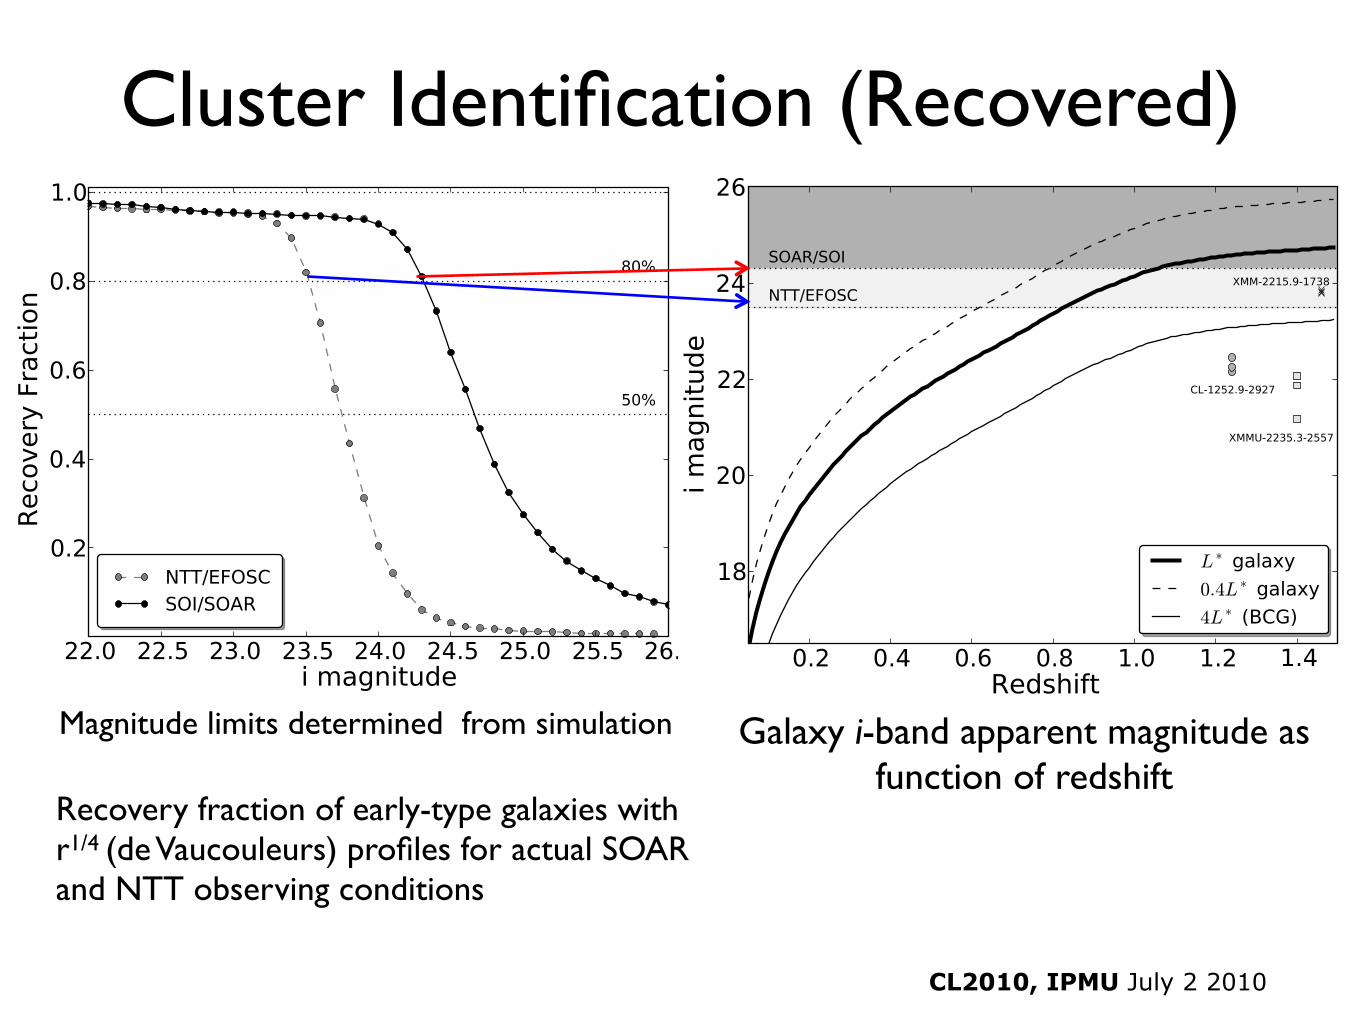
Cluster Identification (Recovered)
Recovery fraction of early-type galaxies with r1/4 (de Vaucouleurs) profiles for actual SOAR and NTT observing conditions
Magnitude limits determined from simulation Galaxy i-band apparent magnitude as function of redshift
CL2010, IPMU July 2 2010
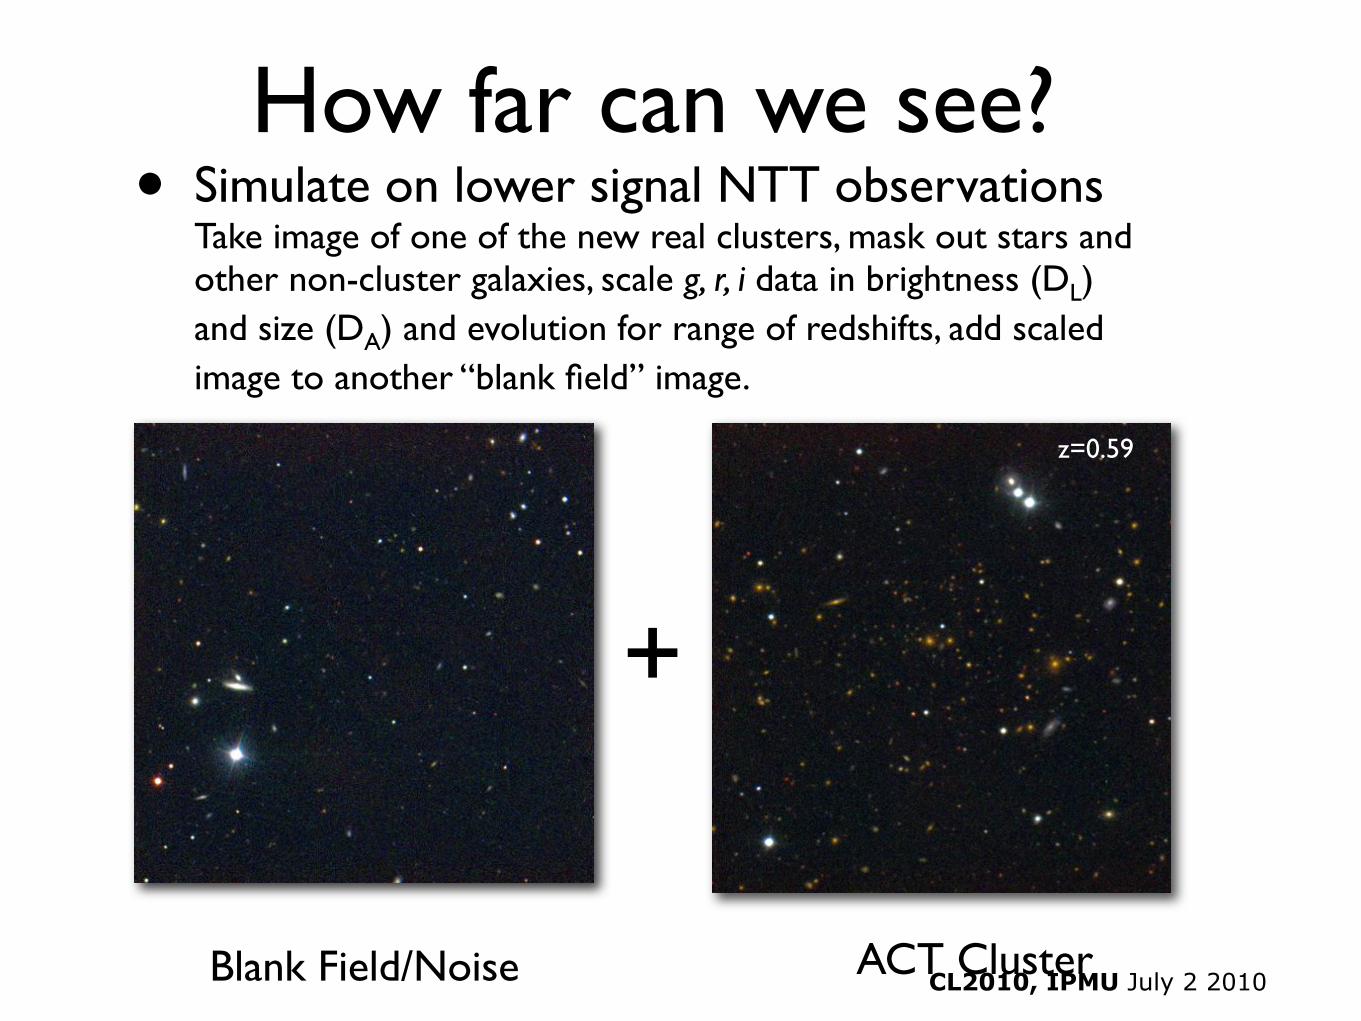
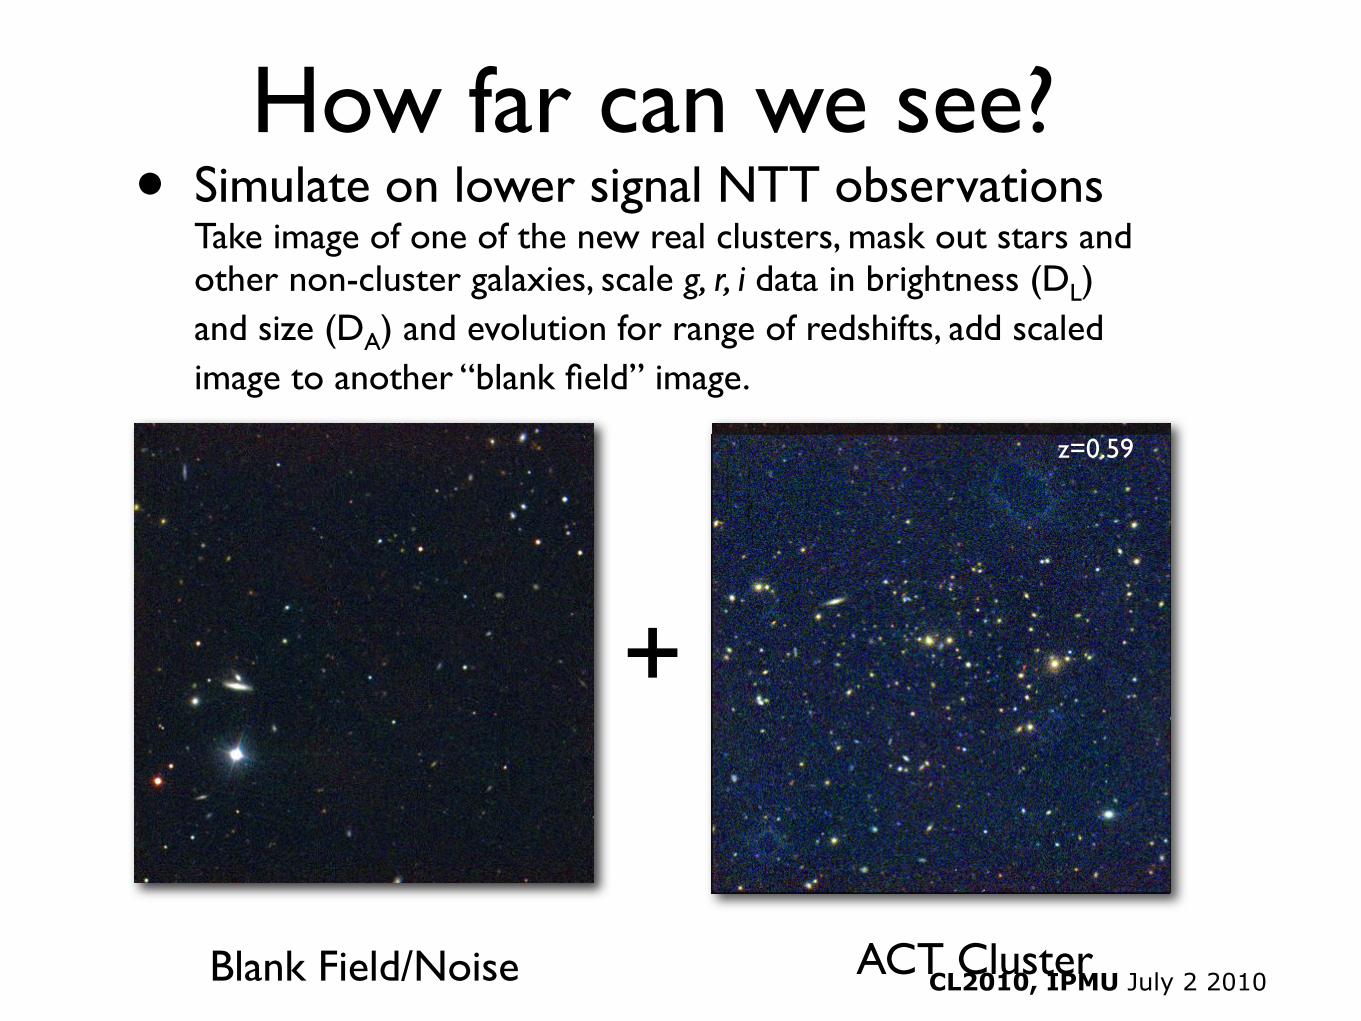
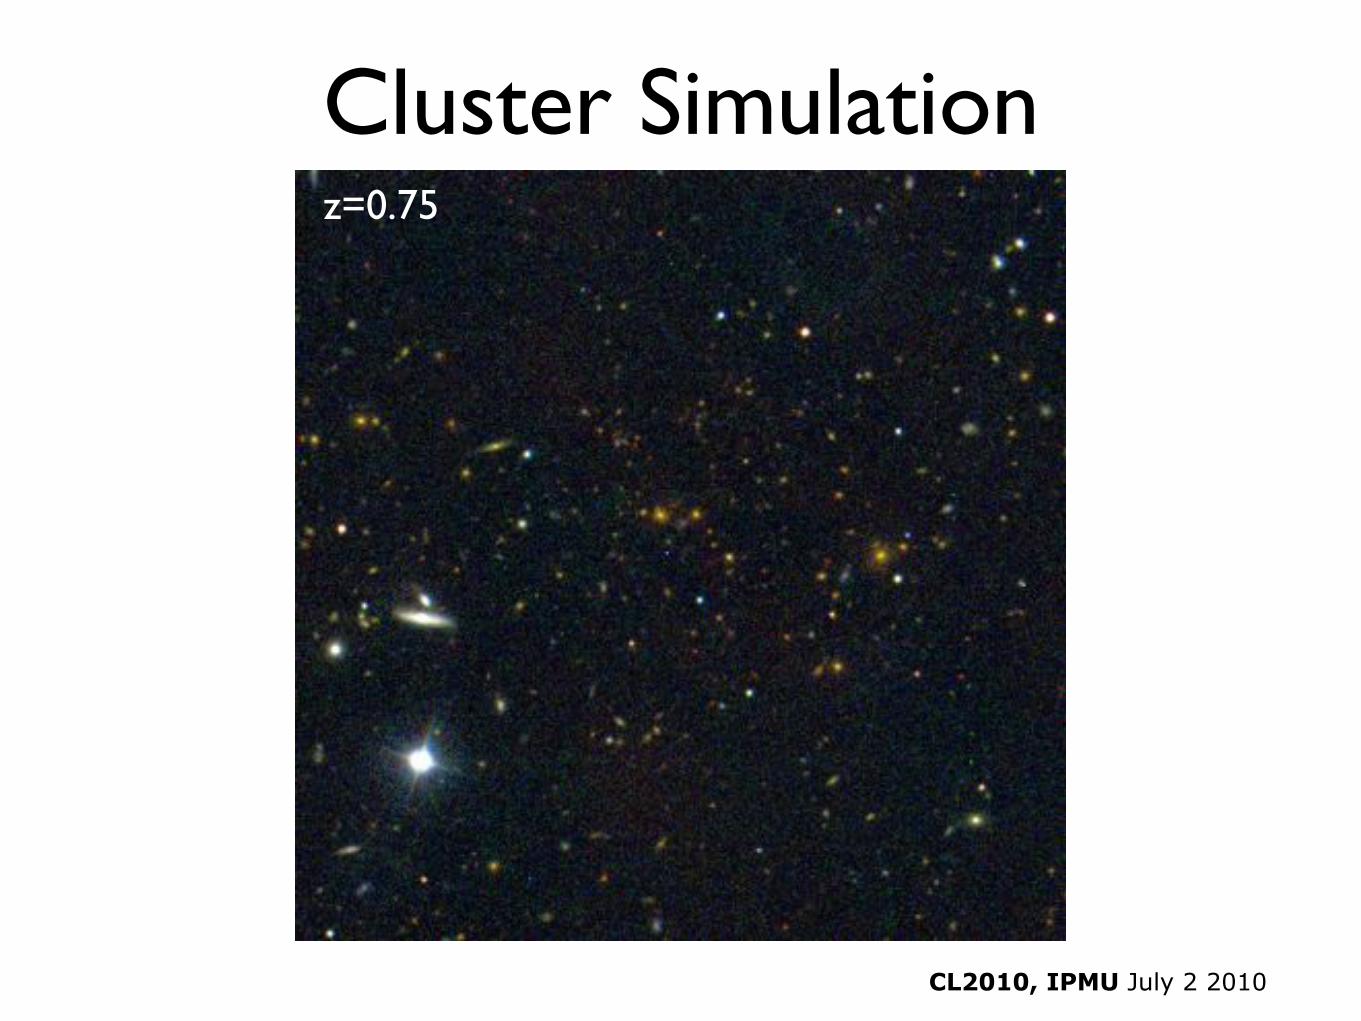
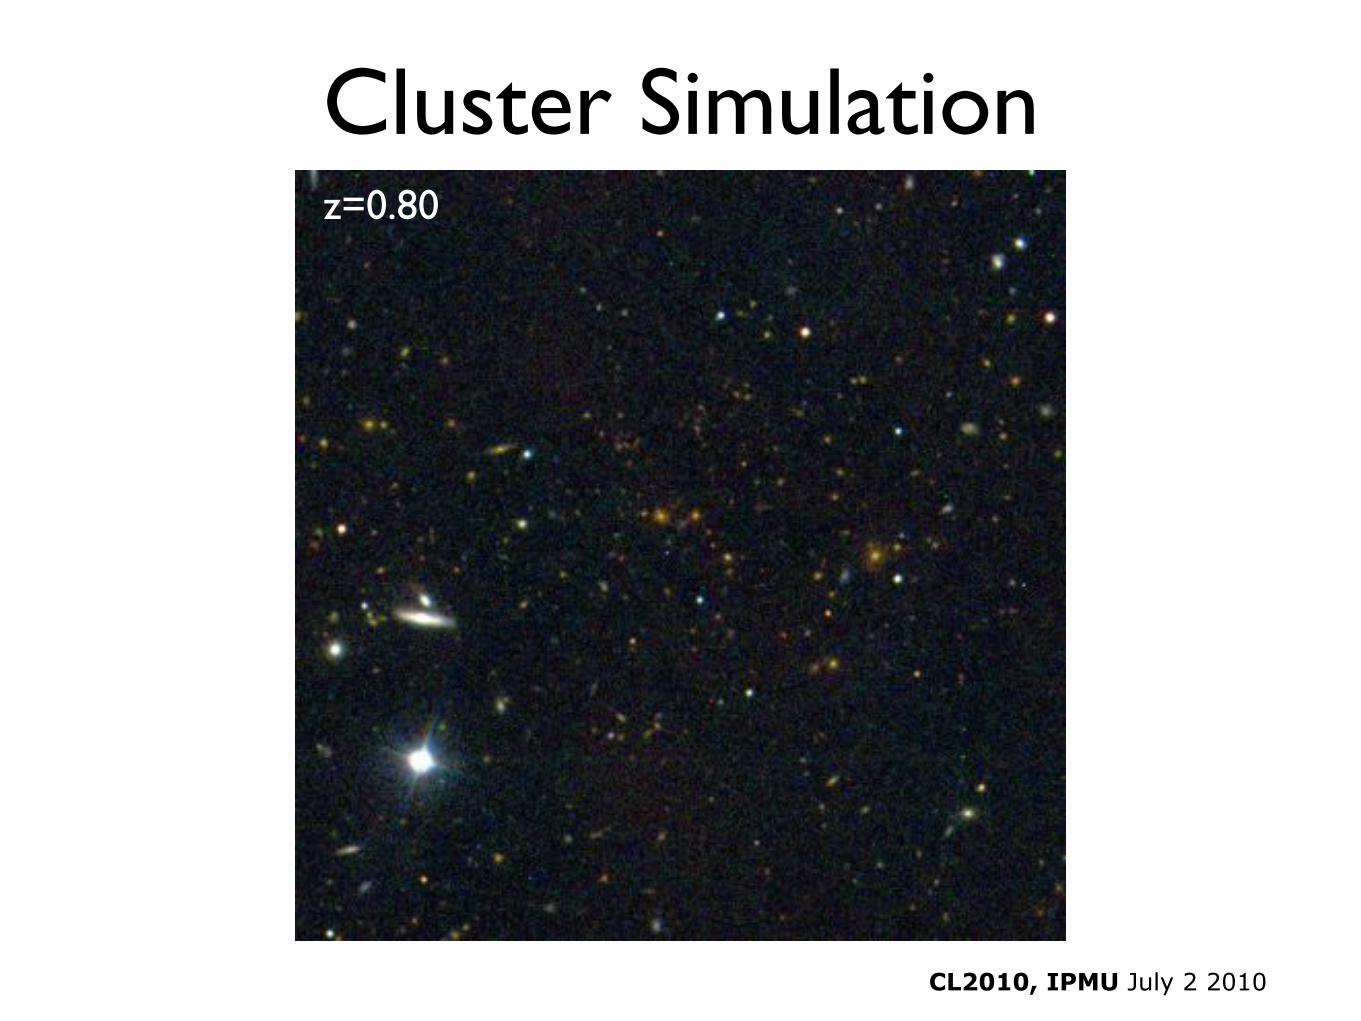
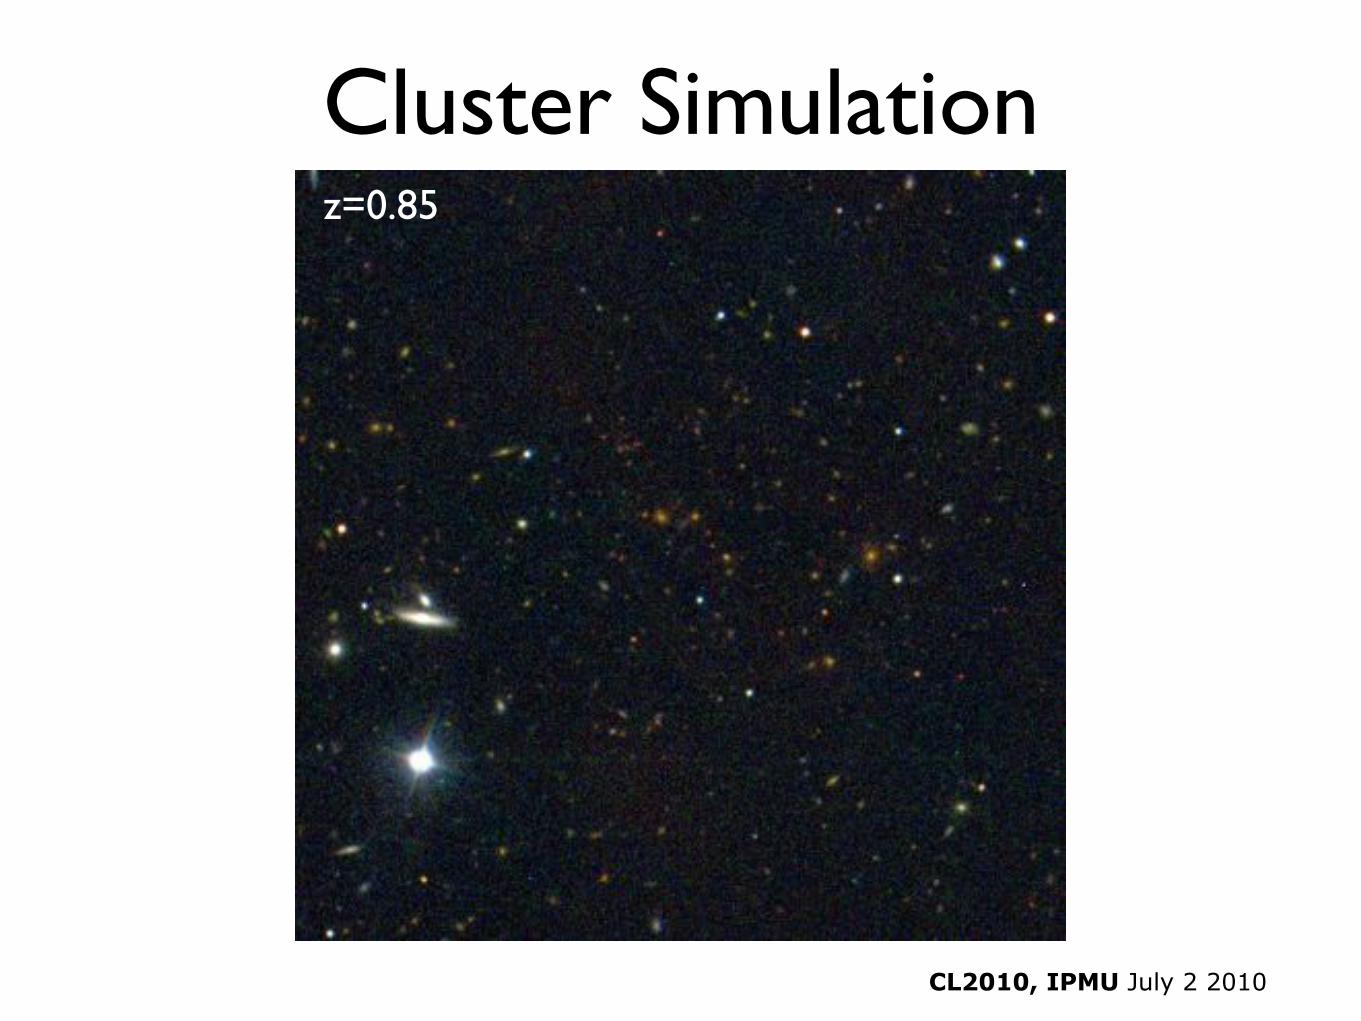
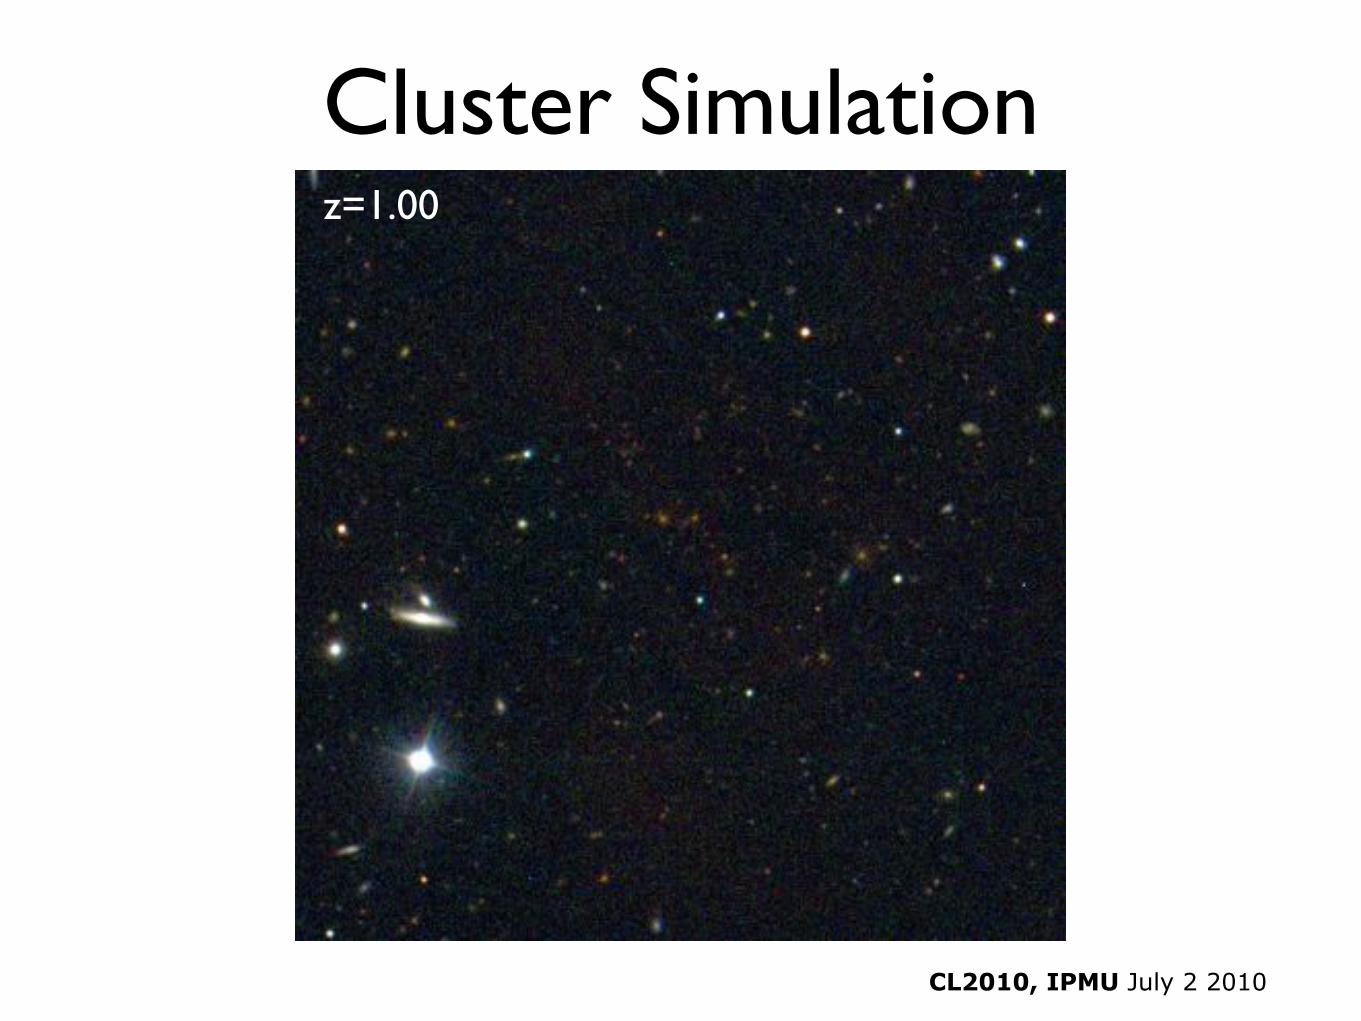
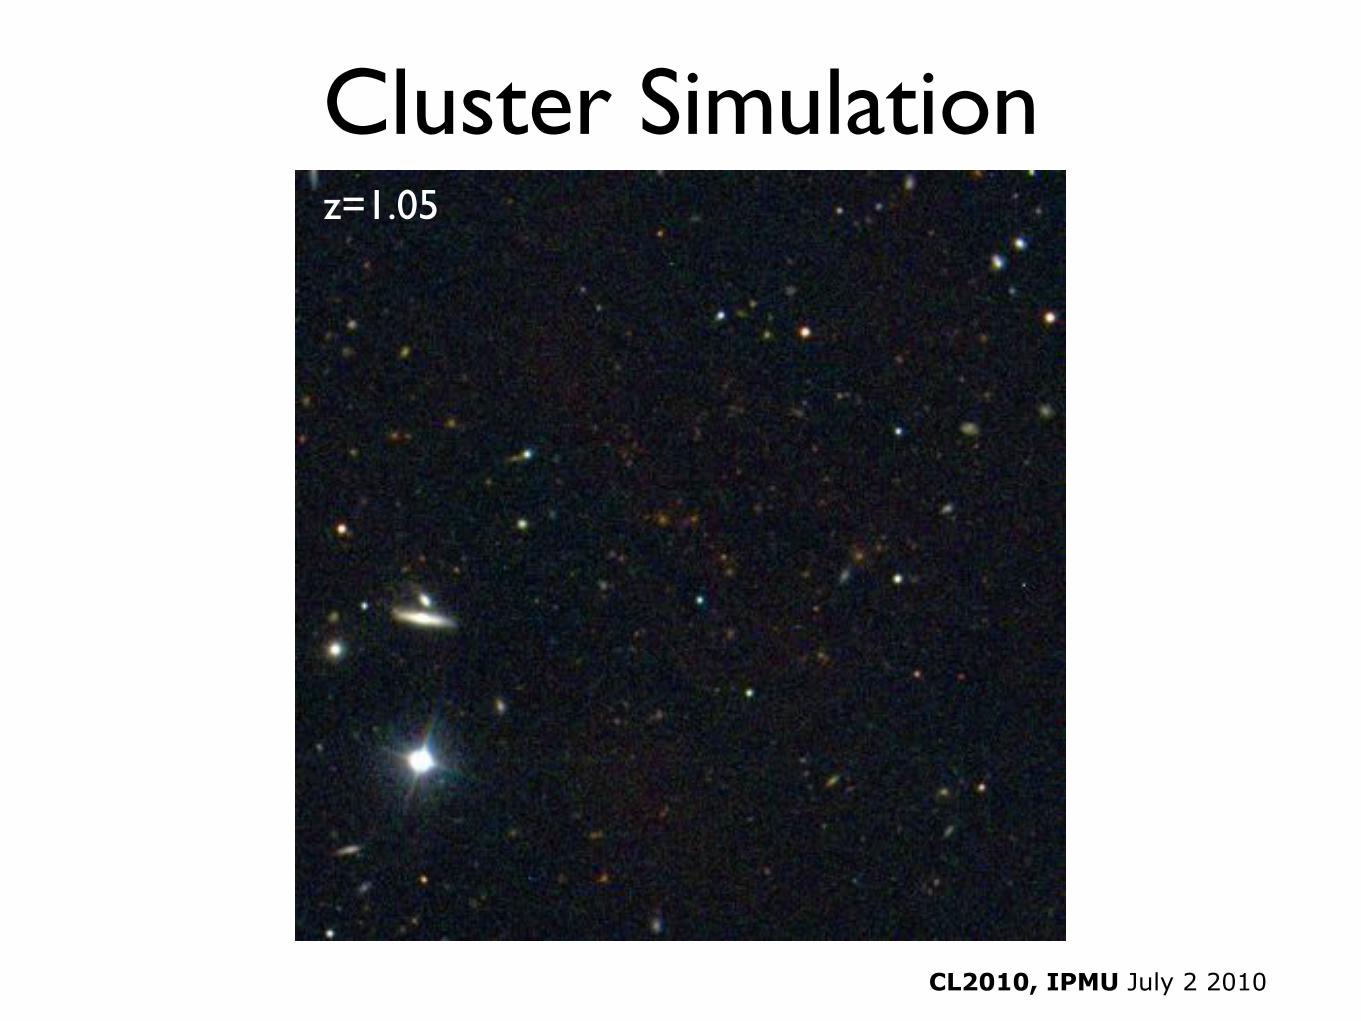
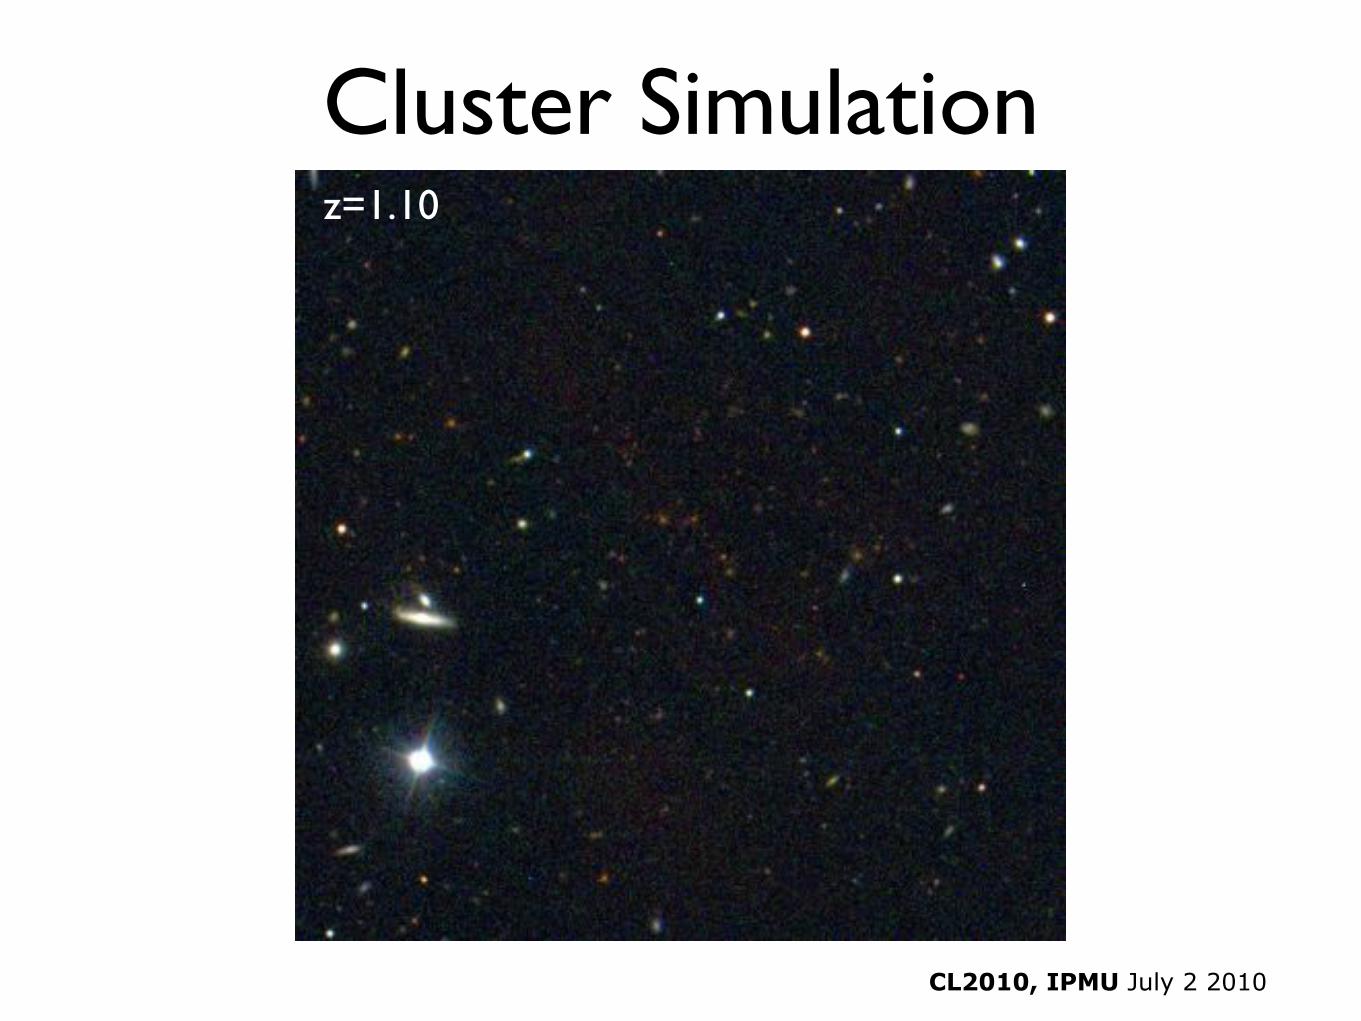
How far can we see?• Simulate on lower signal NTT observations
Take image of one of the new real clusters, mask out stars and other non-cluster galaxies, scale g, r, i data in brightness (DL)
and size (DA) and evolution for range of redshifts, add scaled
image to another “blank field” image.
Blank Field/Noise ACT Cluster
+
z=0.59
CL2010, IPMU July 2 2010
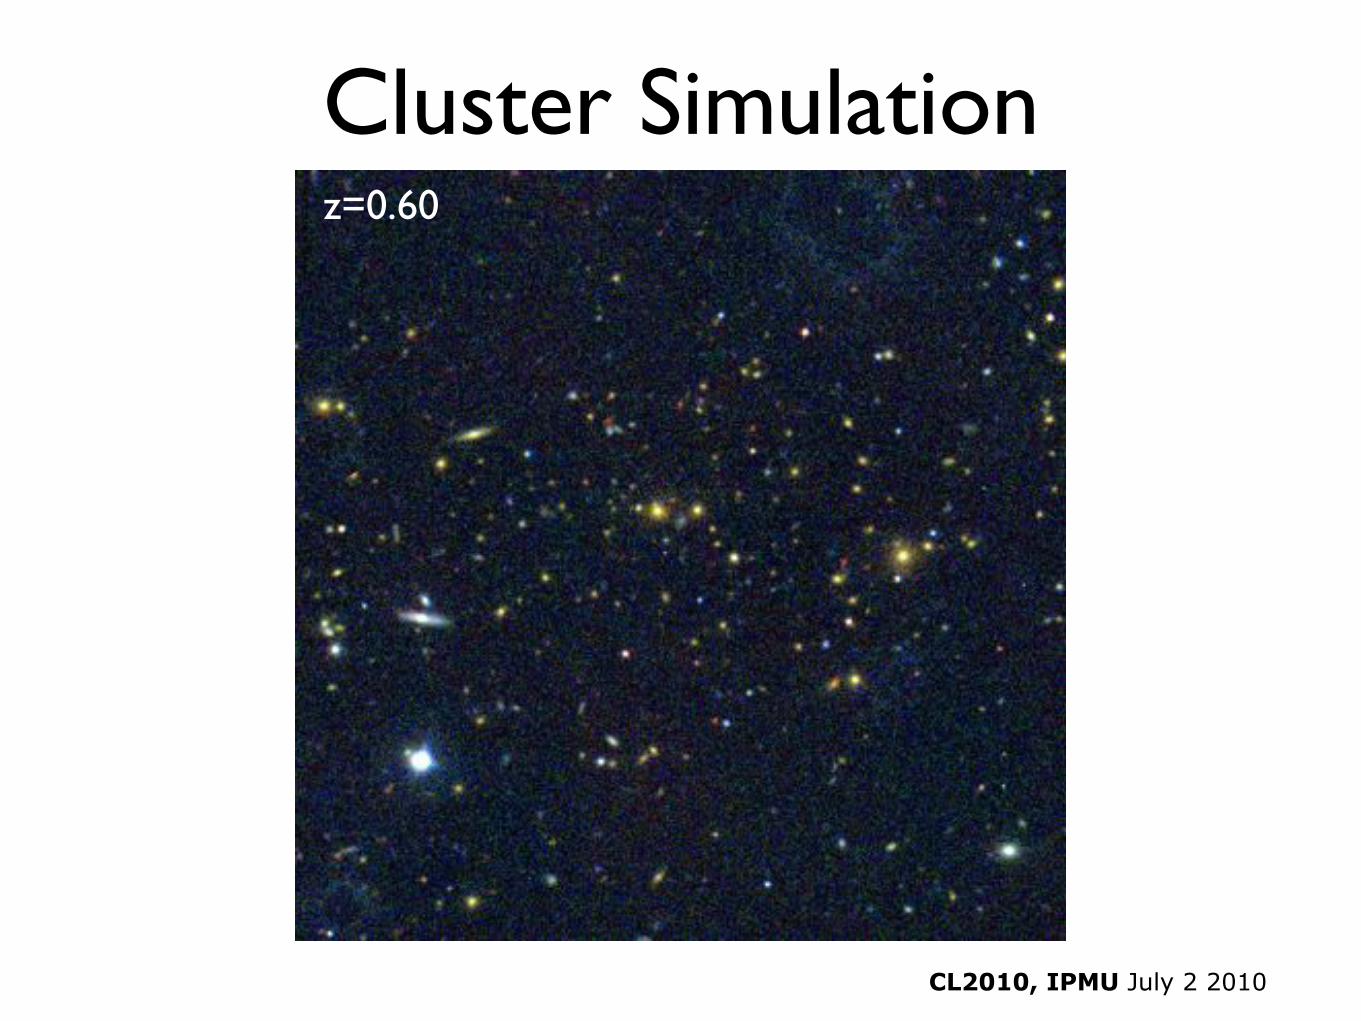
Cluster Simulationz=0.60
CL2010, IPMU July 2 2010
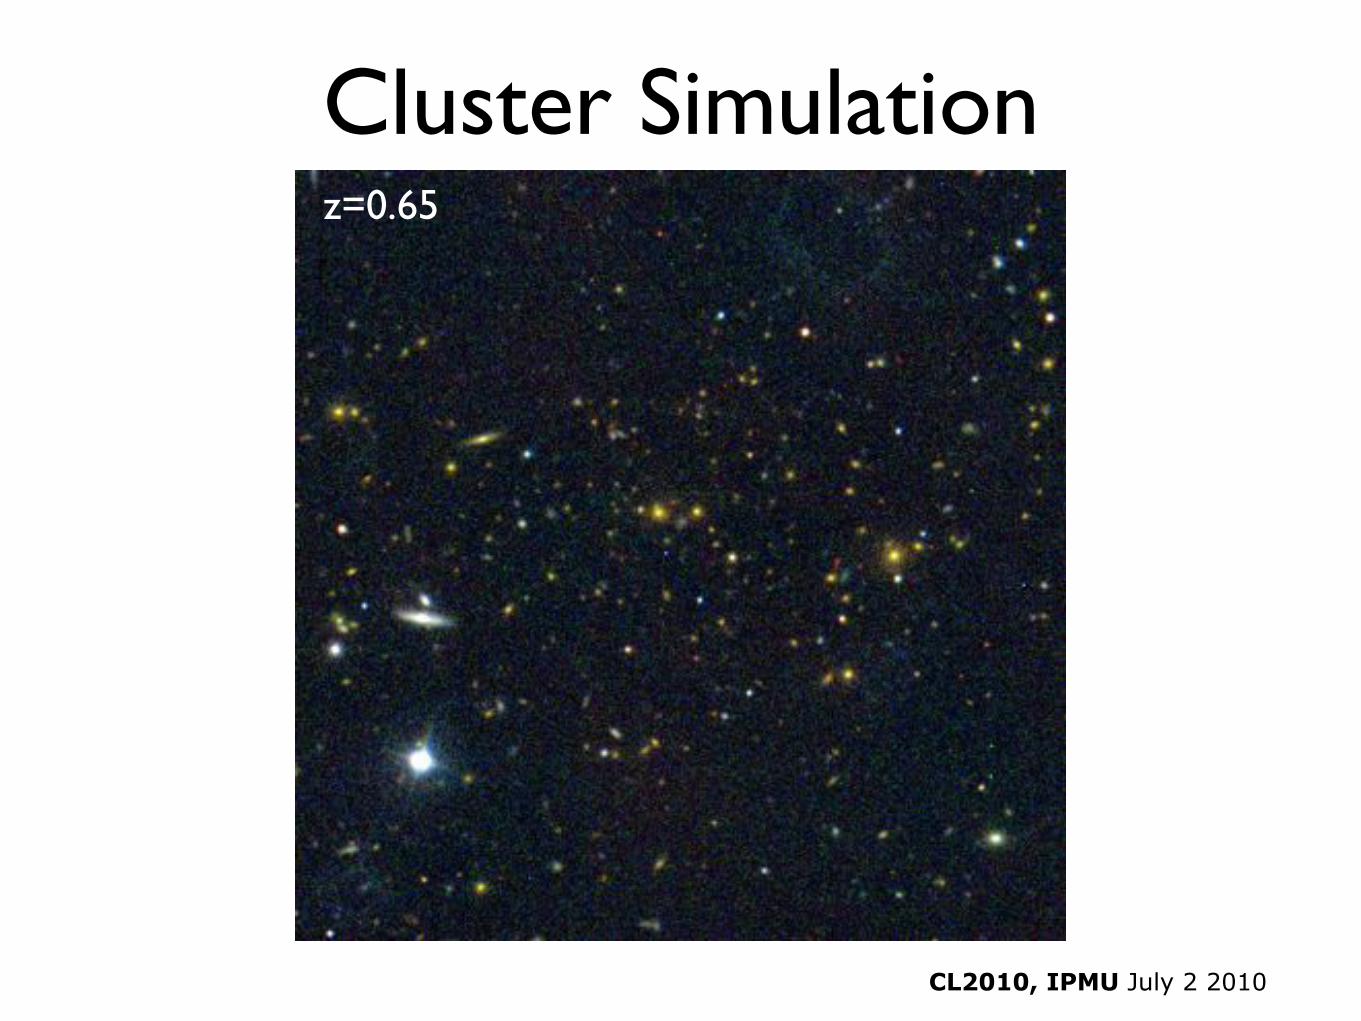
Cluster Simulationz=0.65
CL2010, IPMU July 2 2010
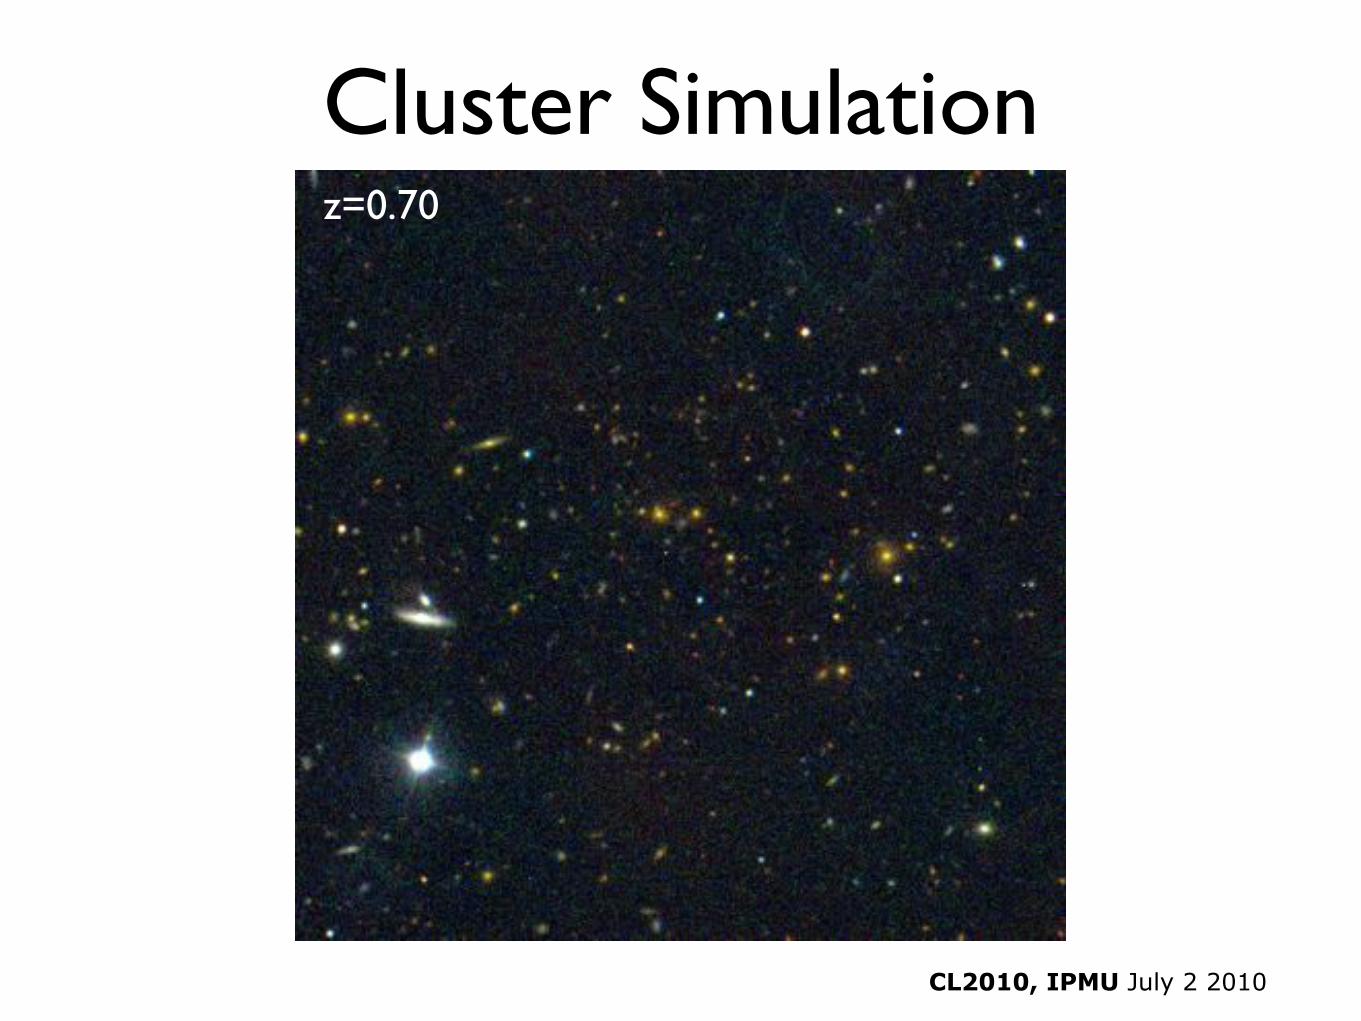
Cluster Simulationz=0.70
CL2010, IPMU July 2 2010
Cluster Simulationz=0.75
CL2010, IPMU July 2 2010
Cluster Simulationz=0.80
CL2010, IPMU July 2 2010
Cluster Simulationz=0.85

CL2010, IPMU July 2 2010
Cluster Simulationz=0.90

CL2010, IPMU July 2 2010
Cluster Simulationz=0.95
CL2010, IPMU July 2 2010
Cluster Simulationz=1.00
CL2010, IPMU July 2 2010
Cluster Simulationz=1.05
CL2010, IPMU July 2 2010
Cluster Simulationz=1.10

CL2010, IPMU July 2 2010
Cluster Simulationz=1.15

CL2010, IPMU July 2 2010
Cluster Simulationz=1.20
6 Menanteau et al.
Table 2ACT 2008 clusters
ACT Descriptor R.A. (J2000) Dec. (J2000) Redshift SNR Alt Name
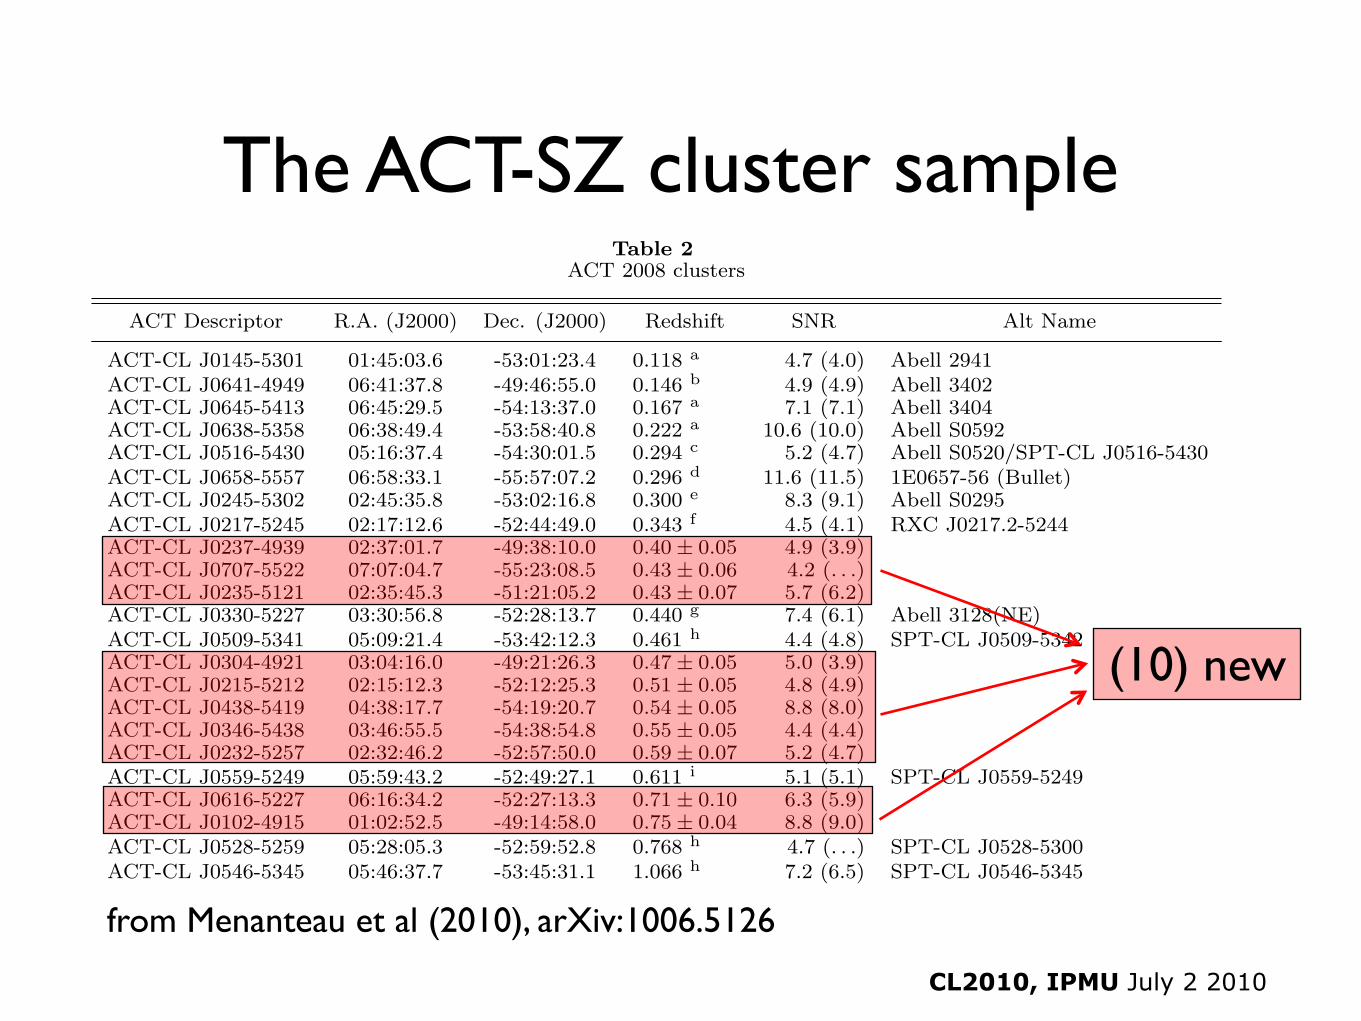
ACT-CL J0145-5301 01:45:03.6 -53:01:23.4 0.118 a 4.7 (4.0) Abell 2941ACT-CL J0641-4949 06:41:37.8 -49:46:55.0 0.146 b 4.9 (4.9) Abell 3402ACT-CL J0645-5413 06:45:29.5 -54:13:37.0 0.167 a 7.1 (7.1) Abell 3404ACT-CL J0638-5358 06:38:49.4 -53:58:40.8 0.222 a 10.6 (10.0) Abell S0592ACT-CL J0516-5430 05:16:37.4 -54:30:01.5 0.294 c 5.2 (4.7) Abell S0520/SPT-CL J0516-5430ACT-CL J0658-5557 06:58:33.1 -55:57:07.2 0.296 d 11.6 (11.5) 1E0657-56 (Bullet)ACT-CL J0245-5302 02:45:35.8 -53:02:16.8 0.300 e 8.3 (9.1) Abell S0295ACT-CL J0217-5245 02:17:12.6 -52:44:49.0 0.343 f 4.5 (4.1) RXC J0217.2-5244ACT-CL J0237-4939 02:37:01.7 -49:38:10.0 0.40± 0.05 4.9 (3.9)ACT-CL J0707-5522 07:07:04.7 -55:23:08.5 0.43± 0.06 4.2 (. . .)ACT-CL J0235-5121 02:35:45.3 -51:21:05.2 0.43± 0.07 5.7 (6.2)ACT-CL J0330-5227 03:30:56.8 -52:28:13.7 0.440 g 7.4 (6.1) Abell 3128(NE)ACT-CL J0509-5341 05:09:21.4 -53:42:12.3 0.461 h 4.4 (4.8) SPT-CL J0509-5342ACT-CL J0304-4921 03:04:16.0 -49:21:26.3 0.47± 0.05 5.0 (3.9)ACT-CL J0215-5212 02:15:12.3 -52:12:25.3 0.51± 0.05 4.8 (4.9)ACT-CL J0438-5419 04:38:17.7 -54:19:20.7 0.54± 0.05 8.8 (8.0)ACT-CL J0346-5438 03:46:55.5 -54:38:54.8 0.55± 0.05 4.4 (4.4)ACT-CL J0232-5257 02:32:46.2 -52:57:50.0 0.59± 0.07 5.2 (4.7)ACT-CL J0559-5249 05:59:43.2 -52:49:27.1 0.611 i 5.1 (5.1) SPT-CL J0559-5249ACT-CL J0616-5227 06:16:34.2 -52:27:13.3 0.71± 0.10 6.3 (5.9)ACT-CL J0102-4915 01:02:52.5 -49:14:58.0 0.75± 0.04 8.8 (9.0)ACT-CL J0528-5259 05:28:05.3 -52:59:52.8 0.768 h 4.7 (. . .) SPT-CL J0528-5300ACT-CL J0546-5345 05:46:37.7 -53:45:31.1 1.066 h 7.2 (6.5) SPT-CL J0546-5345
Note. — R.A. and Dec. positions denote the BCG position in the optical images of the cluster. The SZE positionwas used to construct the ACT descriptor identifiers. Clusters with uncertainty estimates on their redshifts are thosesystems for which only photometric redshifts are available from the NTT and SOAR gri imaging. The values of SNRin parentheses are the current values from Marriage et al. (2010), while the others are the ones used in this studya spec-z from de Grandi et al. (1999)b spec-z from Jones et al. (2009)c spec-z from Guzzo et al. (1999)d spec-z from Tucker et al. (1998)e spec-z from Edge et al. (1994)f spec-z from Bohringer et al. (2004)g spec-z from Werner et al. (2007)h spec-z from Infante et al. (2010)i spec-z from High et al. (2010)
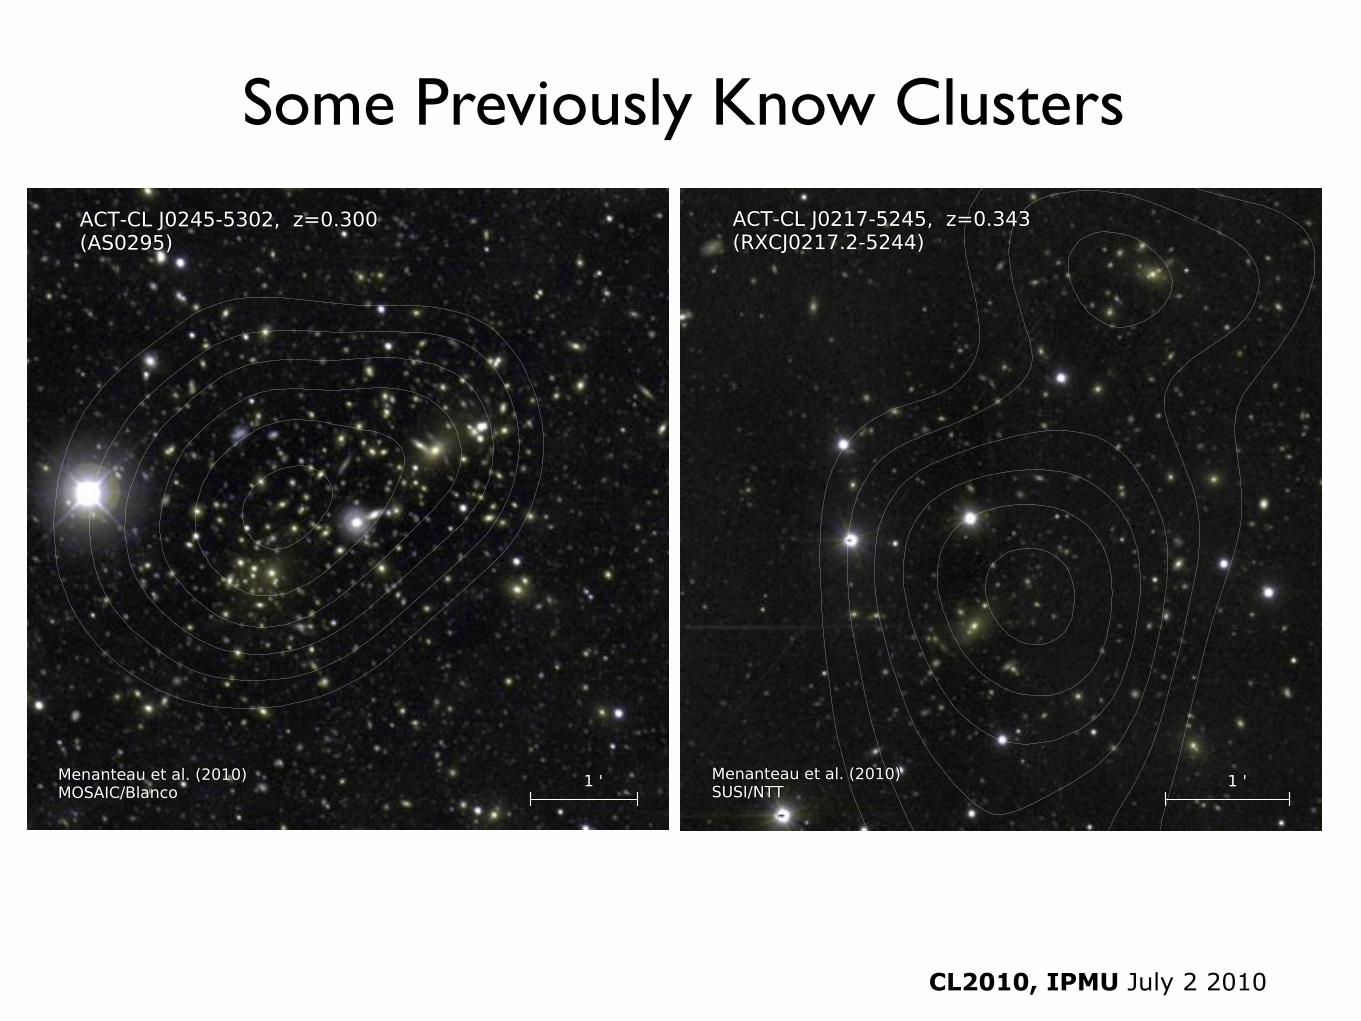
For a few of these we obtained new NTT/SOAR gri ob-servations in order to calibrate our photometric redshiftand to test our identification procedure; however, for themost part these were avoided and we relied on publicarchival imaging and on data from other existing pro-grams to compare with the SZE sources.
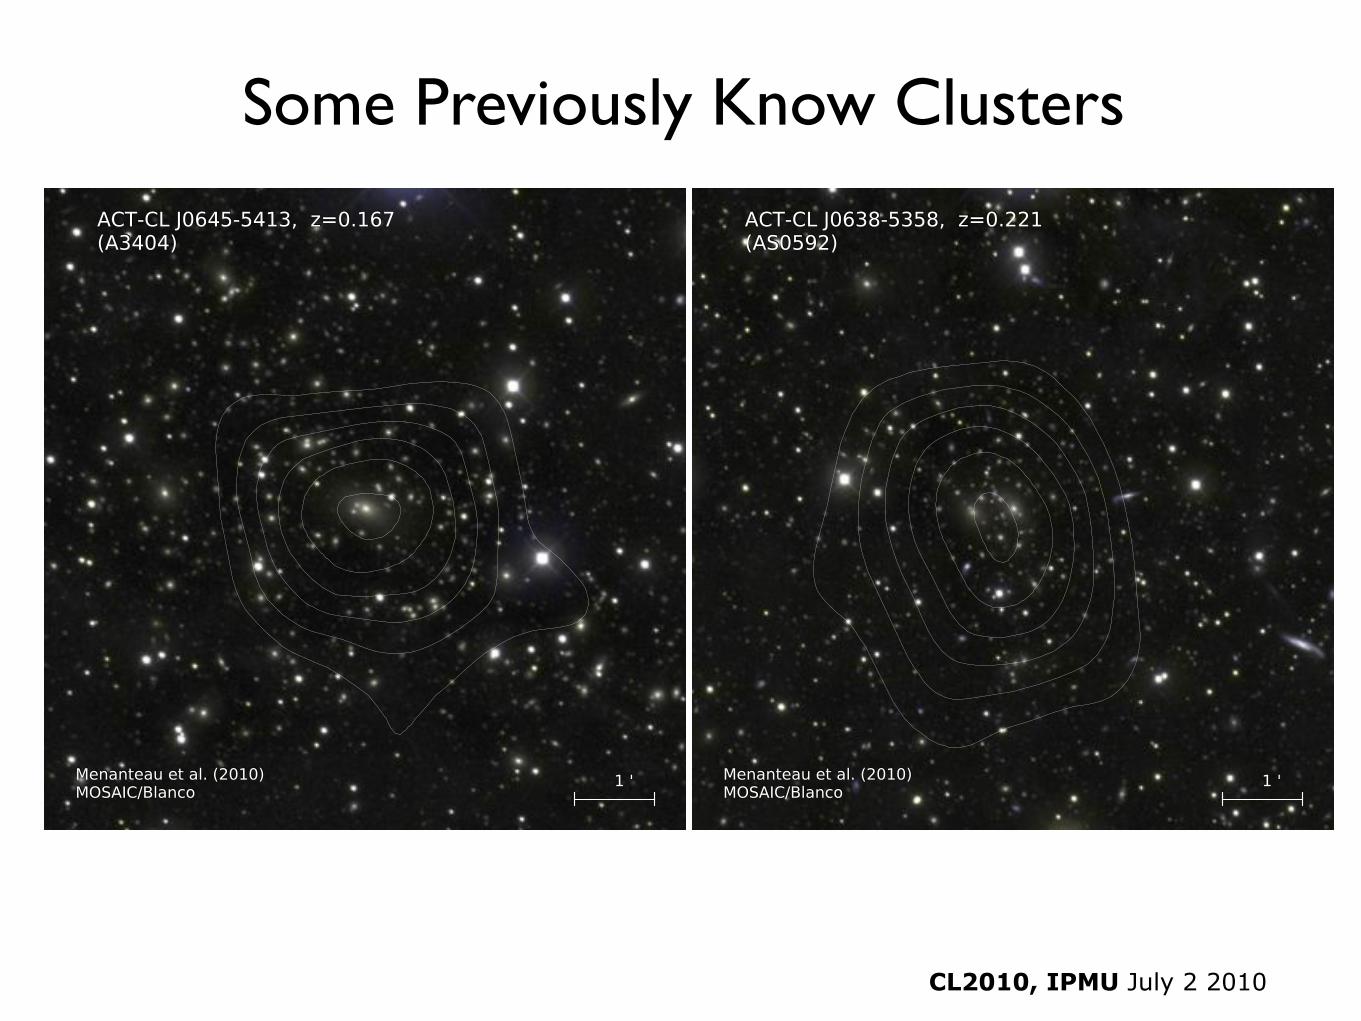
AS0295 and AS0592 are included among the low red-shift SZE clusters reported by Hincks et al. (2009) andare the focus of a separate observing program by ourgroup (09B-0389, PI:Hughes) aimed at obtaining weaklensing masses using deep V and R observations. Thesewere obtained using the MOSAIC camera on the Blanco4-m telescope on January 9, 2010 under photometric con-ditions.
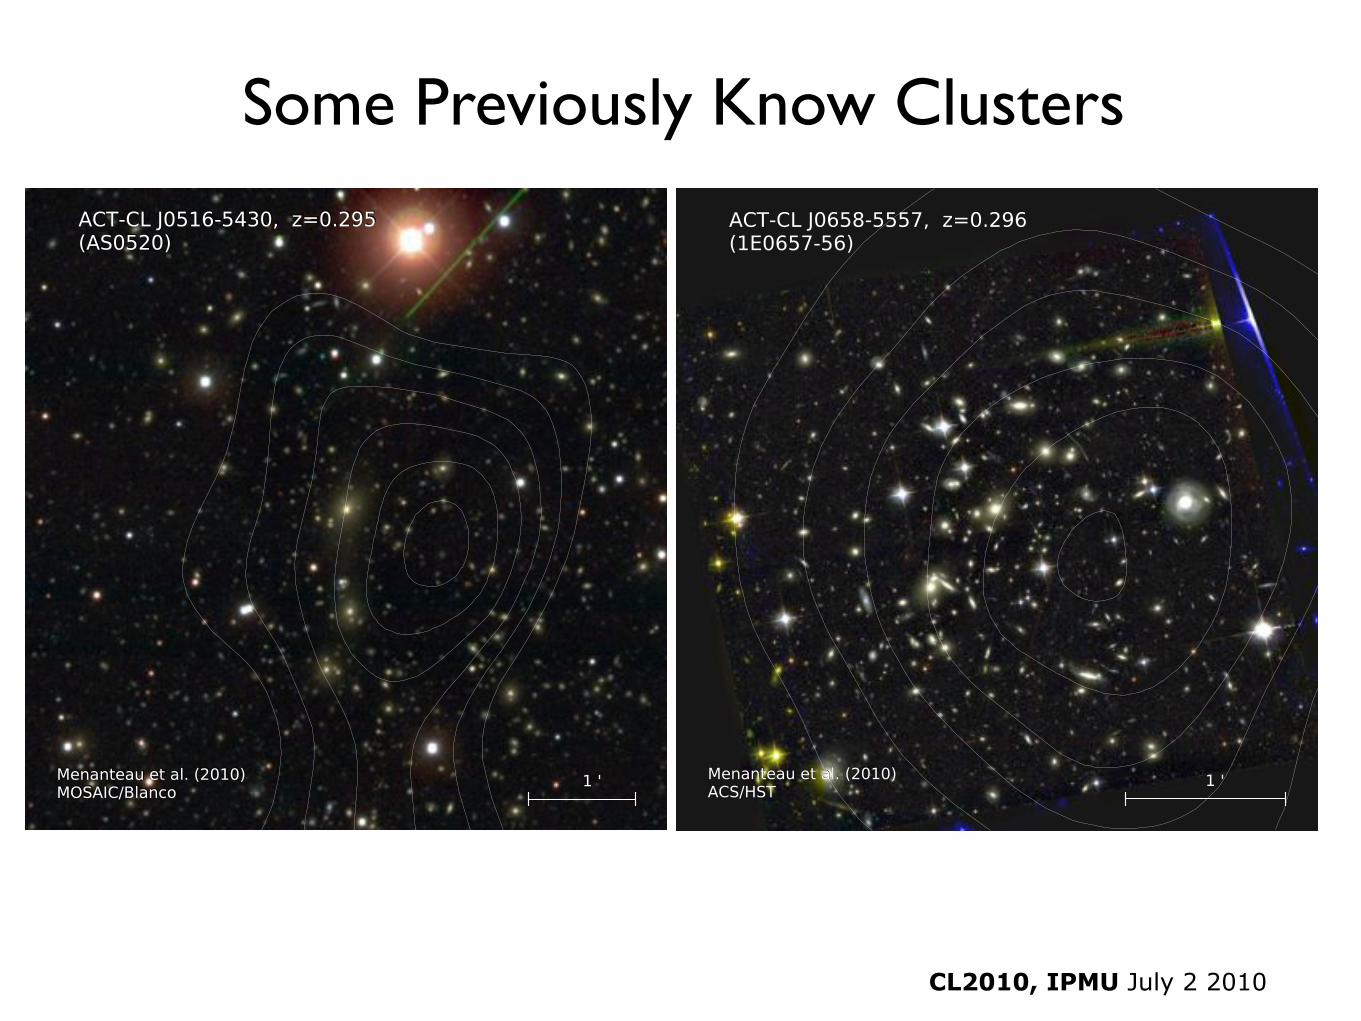
1E0657!56 (the Bullet Cluster) has been extensivelyobserved at di!erent wavelengths. Here we show theoptical observations of the cluster central region takenwith the Advanced Camera for Surveys aboard the Hub-ble Space Telescope (HST) (GO:10200, PI:Jones andGO:10863, PI:Gonzalez) using the F606W (V ), F814W(I) and F850LP (z) filters which were taken from theHST archive27.
For RXCJ0217.2!5244 we used our own pipeline toprocess raw V (720s) and R (1200s) images obtained from
27 http://archive.stsci.edu/
the ESO archive28 (70.A-0074-A, PI:Edge) utilizing theSUSI camera on the NTT on Oct 7 and 12, 2002.
A fraction of the area covered by ACT overlaps withthe 41 deg2 griz imaging from the CTIO 4-m telescopeMOSAIC camera on the 05hr field from the SouthernCosmology Survey (Menanteau et al. 2010). We usedthese data to search for optical identification of SZE clus-ter candidates in the region to avoid re-targeting with theNTT and SOAR telescopes.
4. RESULTS
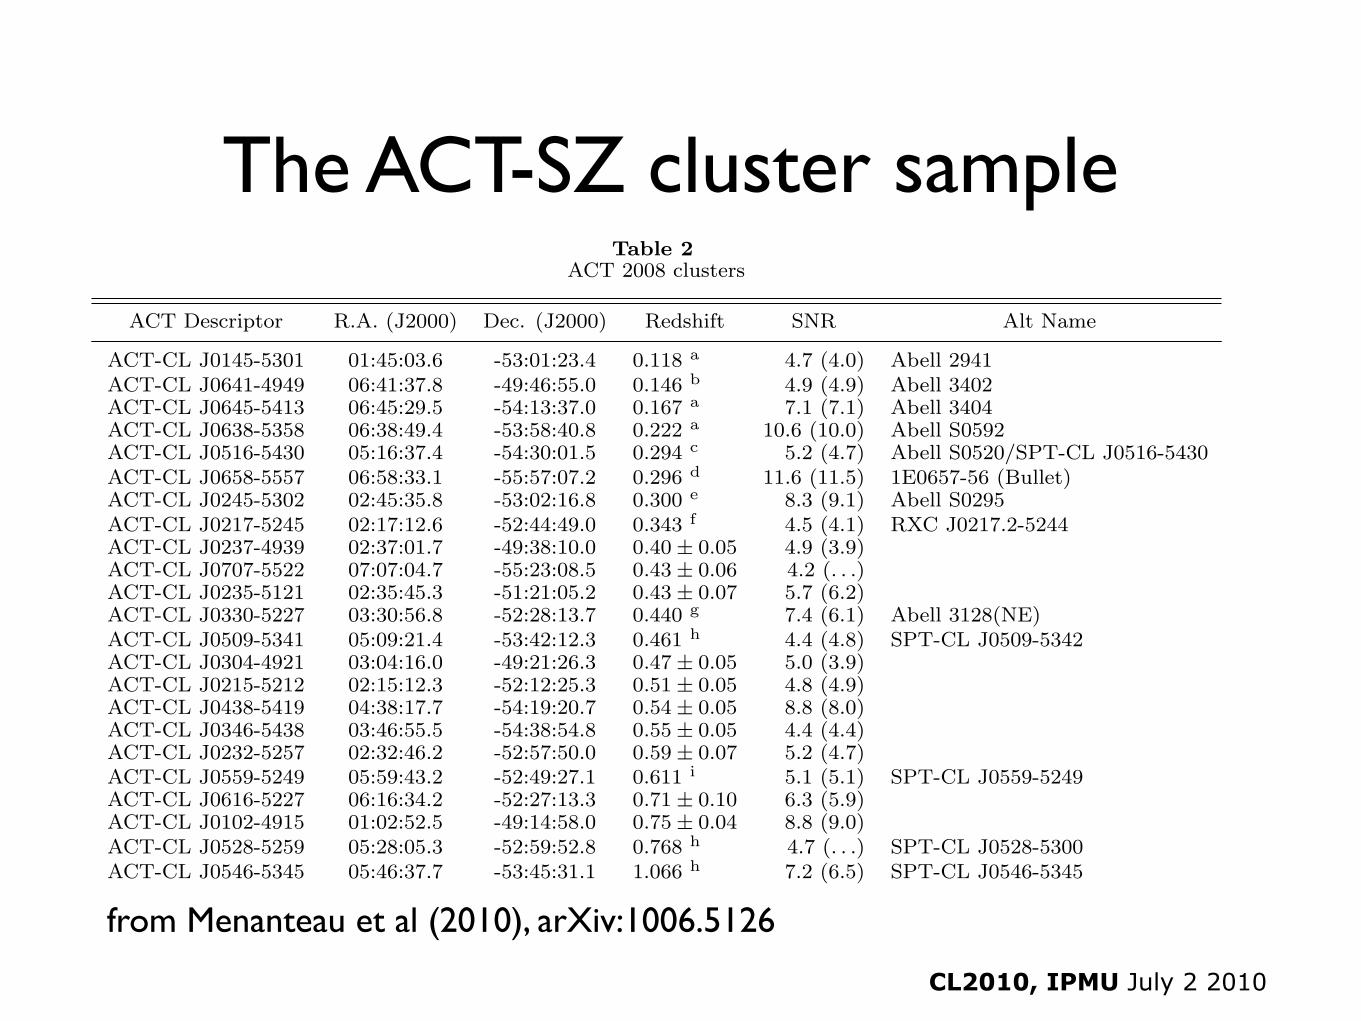
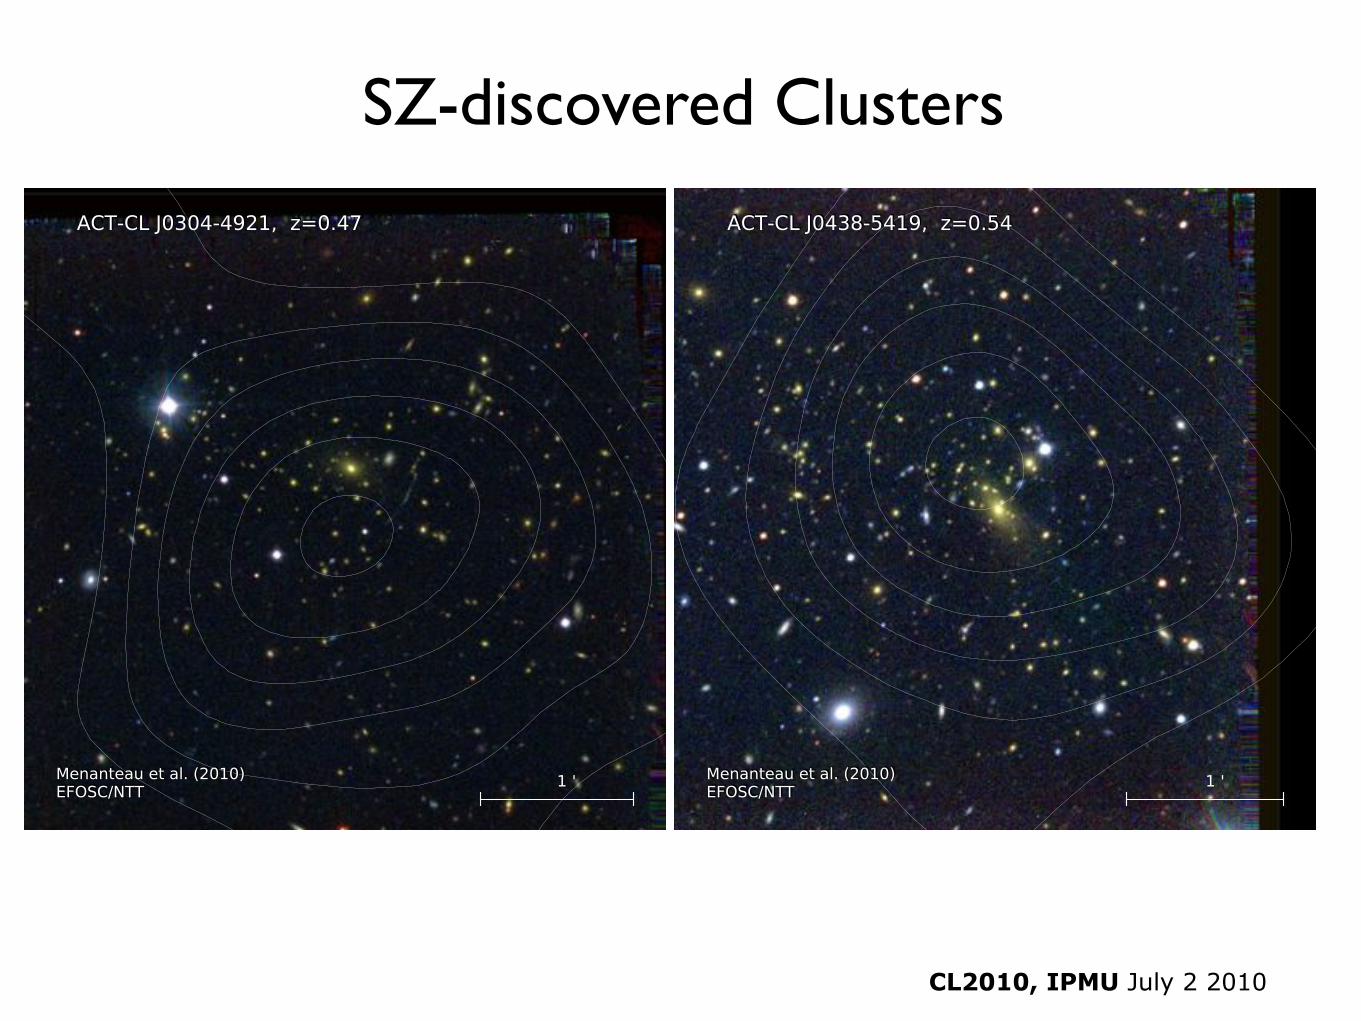
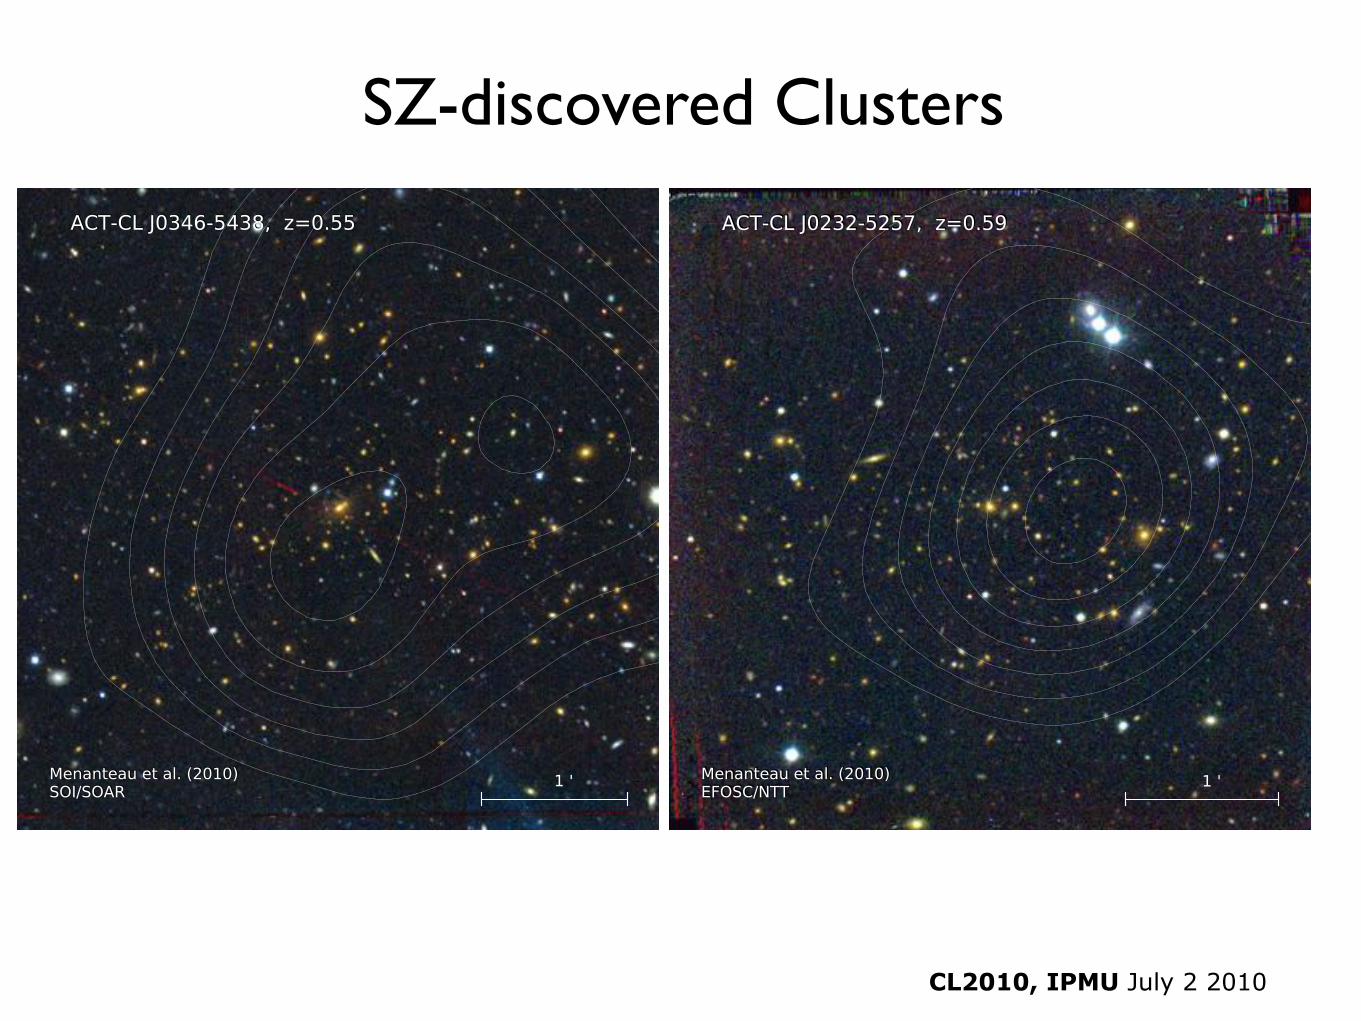
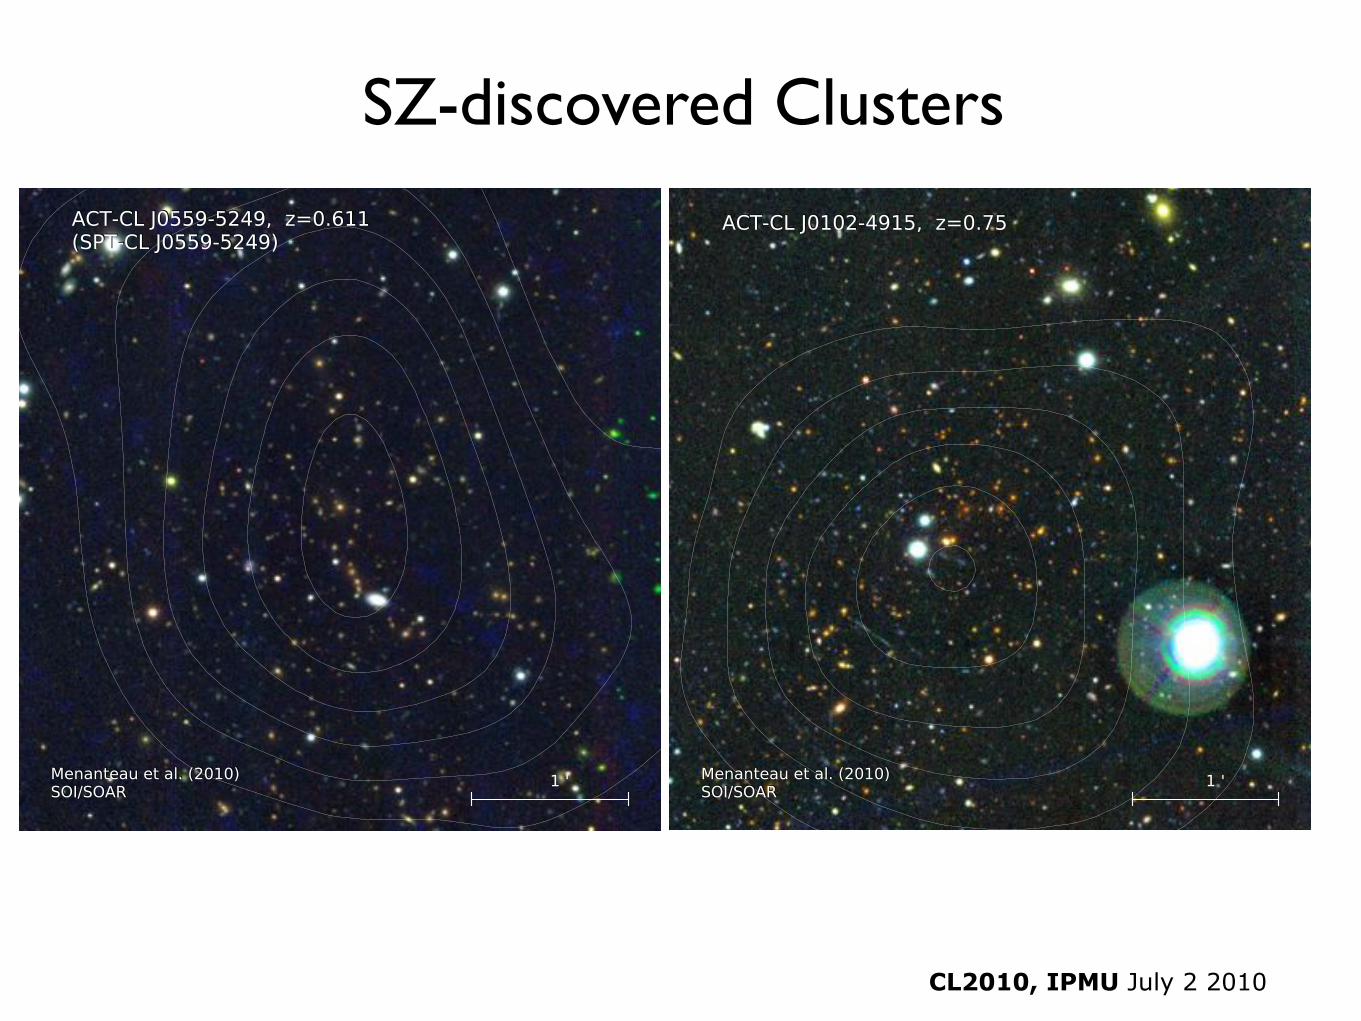
4.1. The ACT SZE Cluster SampleOur analysis has resulted in a sample of 23 optically-
confirmed SZE clusters selected from 455 square-degreesof ACT data between 0.1 < z < 1.1. Nine of theseclusters, such as 1E0657!56 (the Bullet Cluster), AbellS0592, and Abell 3404 are well known and appear at lowredshift (z < 0.4); and four systems in our sample havebeen reported as SZE-selected clusters by SPT in theirarea overlapping with the ACT coverage. Three of thesesystems (ACT-CL J0509!5341, ACT-CL J0528!5259,and ACT-CL J0546!5345) were originally reported asSZE-selected clusters by Staniszewski et al. (2009), withoptical and X-ray properties subsequently studied by us
28 http://archive.eso.org/
CL2010, IPMU July 2 2010
The ACT-SZ cluster sample
from Menanteau et al (2010), arXiv:1006.5126
6 Menanteau et al.
Table 2ACT 2008 clusters
ACT Descriptor R.A. (J2000) Dec. (J2000) Redshift SNR Alt Name
ACT-CL J0145-5301 01:45:03.6 -53:01:23.4 0.118 a 4.7 (4.0) Abell 2941ACT-CL J0641-4949 06:41:37.8 -49:46:55.0 0.146 b 4.9 (4.9) Abell 3402ACT-CL J0645-5413 06:45:29.5 -54:13:37.0 0.167 a 7.1 (7.1) Abell 3404ACT-CL J0638-5358 06:38:49.4 -53:58:40.8 0.222 a 10.6 (10.0) Abell S0592ACT-CL J0516-5430 05:16:37.4 -54:30:01.5 0.294 c 5.2 (4.7) Abell S0520/SPT-CL J0516-5430ACT-CL J0658-5557 06:58:33.1 -55:57:07.2 0.296 d 11.6 (11.5) 1E0657-56 (Bullet)ACT-CL J0245-5302 02:45:35.8 -53:02:16.8 0.300 e 8.3 (9.1) Abell S0295ACT-CL J0217-5245 02:17:12.6 -52:44:49.0 0.343 f 4.5 (4.1) RXC J0217.2-5244ACT-CL J0237-4939 02:37:01.7 -49:38:10.0 0.40± 0.05 4.9 (3.9)ACT-CL J0707-5522 07:07:04.7 -55:23:08.5 0.43± 0.06 4.2 (. . .)ACT-CL J0235-5121 02:35:45.3 -51:21:05.2 0.43± 0.07 5.7 (6.2)ACT-CL J0330-5227 03:30:56.8 -52:28:13.7 0.440 g 7.4 (6.1) Abell 3128(NE)ACT-CL J0509-5341 05:09:21.4 -53:42:12.3 0.461 h 4.4 (4.8) SPT-CL J0509-5342ACT-CL J0304-4921 03:04:16.0 -49:21:26.3 0.47± 0.05 5.0 (3.9)ACT-CL J0215-5212 02:15:12.3 -52:12:25.3 0.51± 0.05 4.8 (4.9)ACT-CL J0438-5419 04:38:17.7 -54:19:20.7 0.54± 0.05 8.8 (8.0)ACT-CL J0346-5438 03:46:55.5 -54:38:54.8 0.55± 0.05 4.4 (4.4)ACT-CL J0232-5257 02:32:46.2 -52:57:50.0 0.59± 0.07 5.2 (4.7)ACT-CL J0559-5249 05:59:43.2 -52:49:27.1 0.611 i 5.1 (5.1) SPT-CL J0559-5249ACT-CL J0616-5227 06:16:34.2 -52:27:13.3 0.71± 0.10 6.3 (5.9)ACT-CL J0102-4915 01:02:52.5 -49:14:58.0 0.75± 0.04 8.8 (9.0)ACT-CL J0528-5259 05:28:05.3 -52:59:52.8 0.768 h 4.7 (. . .) SPT-CL J0528-5300ACT-CL J0546-5345 05:46:37.7 -53:45:31.1 1.066 h 7.2 (6.5) SPT-CL J0546-5345
Note. — R.A. and Dec. positions denote the BCG position in the optical images of the cluster. The SZE positionwas used to construct the ACT descriptor identifiers. Clusters with uncertainty estimates on their redshifts are thosesystems for which only photometric redshifts are available from the NTT and SOAR gri imaging. The values of SNRin parentheses are the current values from Marriage et al. (2010), while the others are the ones used in this studya spec-z from de Grandi et al. (1999)b spec-z from Jones et al. (2009)c spec-z from Guzzo et al. (1999)d spec-z from Tucker et al. (1998)e spec-z from Edge et al. (1994)f spec-z from Bohringer et al. (2004)g spec-z from Werner et al. (2007)h spec-z from Infante et al. (2010)i spec-z from High et al. (2010)
For a few of these we obtained new NTT/SOAR gri ob-servations in order to calibrate our photometric redshiftand to test our identification procedure; however, for themost part these were avoided and we relied on publicarchival imaging and on data from other existing pro-grams to compare with the SZE sources.
AS0295 and AS0592 are included among the low red-shift SZE clusters reported by Hincks et al. (2009) andare the focus of a separate observing program by ourgroup (09B-0389, PI:Hughes) aimed at obtaining weaklensing masses using deep V and R observations. Thesewere obtained using the MOSAIC camera on the Blanco4-m telescope on January 9, 2010 under photometric con-ditions.
1E0657!56 (the Bullet Cluster) has been extensivelyobserved at di!erent wavelengths. Here we show theoptical observations of the cluster central region takenwith the Advanced Camera for Surveys aboard the Hub-ble Space Telescope (HST) (GO:10200, PI:Jones andGO:10863, PI:Gonzalez) using the F606W (V ), F814W(I) and F850LP (z) filters which were taken from theHST archive27.
For RXCJ0217.2!5244 we used our own pipeline toprocess raw V (720s) and R (1200s) images obtained from
27 http://archive.stsci.edu/
the ESO archive28 (70.A-0074-A, PI:Edge) utilizing theSUSI camera on the NTT on Oct 7 and 12, 2002.
A fraction of the area covered by ACT overlaps withthe 41 deg2 griz imaging from the CTIO 4-m telescopeMOSAIC camera on the 05hr field from the SouthernCosmology Survey (Menanteau et al. 2010). We usedthese data to search for optical identification of SZE clus-ter candidates in the region to avoid re-targeting with theNTT and SOAR telescopes.
4. RESULTS
4.1. The ACT SZE Cluster SampleOur analysis has resulted in a sample of 23 optically-
confirmed SZE clusters selected from 455 square-degreesof ACT data between 0.1 < z < 1.1. Nine of theseclusters, such as 1E0657!56 (the Bullet Cluster), AbellS0592, and Abell 3404 are well known and appear at lowredshift (z < 0.4); and four systems in our sample havebeen reported as SZE-selected clusters by SPT in theirarea overlapping with the ACT coverage. Three of thesesystems (ACT-CL J0509!5341, ACT-CL J0528!5259,and ACT-CL J0546!5345) were originally reported asSZE-selected clusters by Staniszewski et al. (2009), withoptical and X-ray properties subsequently studied by us
28 http://archive.eso.org/
CL2010, IPMU July 2 2010
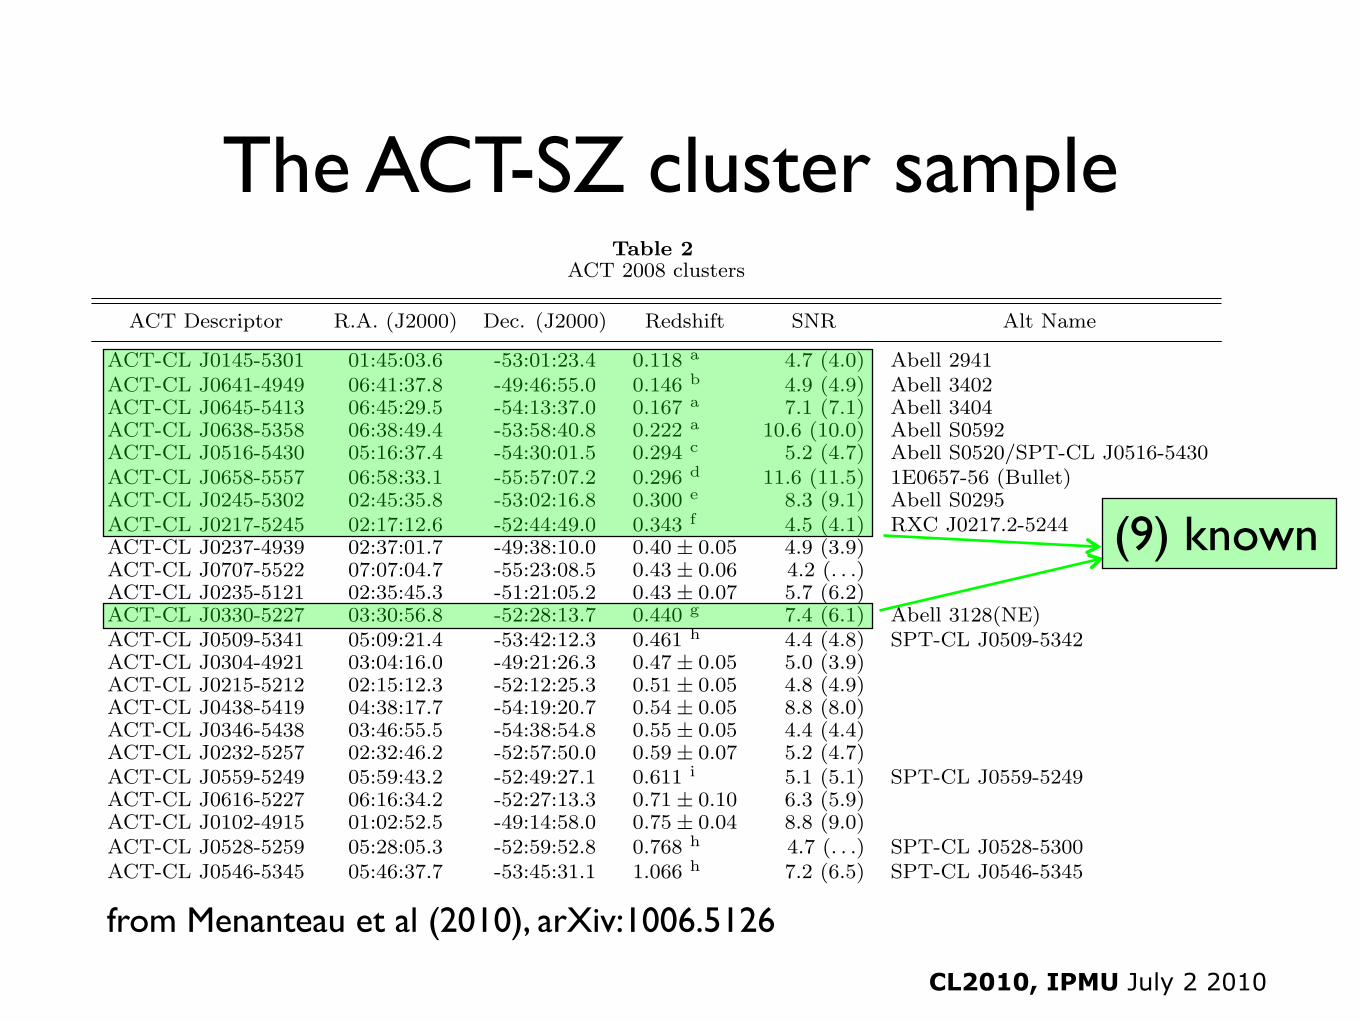
The ACT-SZ cluster sample
from Menanteau et al (2010), arXiv:1006.5126
(9) known
6 Menanteau et al.
Table 2ACT 2008 clusters
ACT Descriptor R.A. (J2000) Dec. (J2000) Redshift SNR Alt Name
ACT-CL J0145-5301 01:45:03.6 -53:01:23.4 0.118 a 4.7 (4.0) Abell 2941ACT-CL J0641-4949 06:41:37.8 -49:46:55.0 0.146 b 4.9 (4.9) Abell 3402ACT-CL J0645-5413 06:45:29.5 -54:13:37.0 0.167 a 7.1 (7.1) Abell 3404ACT-CL J0638-5358 06:38:49.4 -53:58:40.8 0.222 a 10.6 (10.0) Abell S0592ACT-CL J0516-5430 05:16:37.4 -54:30:01.5 0.294 c 5.2 (4.7) Abell S0520/SPT-CL J0516-5430ACT-CL J0658-5557 06:58:33.1 -55:57:07.2 0.296 d 11.6 (11.5) 1E0657-56 (Bullet)ACT-CL J0245-5302 02:45:35.8 -53:02:16.8 0.300 e 8.3 (9.1) Abell S0295ACT-CL J0217-5245 02:17:12.6 -52:44:49.0 0.343 f 4.5 (4.1) RXC J0217.2-5244ACT-CL J0237-4939 02:37:01.7 -49:38:10.0 0.40± 0.05 4.9 (3.9)ACT-CL J0707-5522 07:07:04.7 -55:23:08.5 0.43± 0.06 4.2 (. . .)ACT-CL J0235-5121 02:35:45.3 -51:21:05.2 0.43± 0.07 5.7 (6.2)ACT-CL J0330-5227 03:30:56.8 -52:28:13.7 0.440 g 7.4 (6.1) Abell 3128(NE)ACT-CL J0509-5341 05:09:21.4 -53:42:12.3 0.461 h 4.4 (4.8) SPT-CL J0509-5342ACT-CL J0304-4921 03:04:16.0 -49:21:26.3 0.47± 0.05 5.0 (3.9)ACT-CL J0215-5212 02:15:12.3 -52:12:25.3 0.51± 0.05 4.8 (4.9)ACT-CL J0438-5419 04:38:17.7 -54:19:20.7 0.54± 0.05 8.8 (8.0)ACT-CL J0346-5438 03:46:55.5 -54:38:54.8 0.55± 0.05 4.4 (4.4)ACT-CL J0232-5257 02:32:46.2 -52:57:50.0 0.59± 0.07 5.2 (4.7)ACT-CL J0559-5249 05:59:43.2 -52:49:27.1 0.611 i 5.1 (5.1) SPT-CL J0559-5249ACT-CL J0616-5227 06:16:34.2 -52:27:13.3 0.71± 0.10 6.3 (5.9)ACT-CL J0102-4915 01:02:52.5 -49:14:58.0 0.75± 0.04 8.8 (9.0)ACT-CL J0528-5259 05:28:05.3 -52:59:52.8 0.768 h 4.7 (. . .) SPT-CL J0528-5300ACT-CL J0546-5345 05:46:37.7 -53:45:31.1 1.066 h 7.2 (6.5) SPT-CL J0546-5345
Note. — R.A. and Dec. positions denote the BCG position in the optical images of the cluster. The SZE positionwas used to construct the ACT descriptor identifiers. Clusters with uncertainty estimates on their redshifts are thosesystems for which only photometric redshifts are available from the NTT and SOAR gri imaging. The values of SNRin parentheses are the current values from Marriage et al. (2010), while the others are the ones used in this studya spec-z from de Grandi et al. (1999)b spec-z from Jones et al. (2009)c spec-z from Guzzo et al. (1999)d spec-z from Tucker et al. (1998)e spec-z from Edge et al. (1994)f spec-z from Bohringer et al. (2004)g spec-z from Werner et al. (2007)h spec-z from Infante et al. (2010)i spec-z from High et al. (2010)
For a few of these we obtained new NTT/SOAR gri ob-servations in order to calibrate our photometric redshiftand to test our identification procedure; however, for themost part these were avoided and we relied on publicarchival imaging and on data from other existing pro-grams to compare with the SZE sources.
AS0295 and AS0592 are included among the low red-shift SZE clusters reported by Hincks et al. (2009) andare the focus of a separate observing program by ourgroup (09B-0389, PI:Hughes) aimed at obtaining weaklensing masses using deep V and R observations. Thesewere obtained using the MOSAIC camera on the Blanco4-m telescope on January 9, 2010 under photometric con-ditions.
1E0657!56 (the Bullet Cluster) has been extensivelyobserved at di!erent wavelengths. Here we show theoptical observations of the cluster central region takenwith the Advanced Camera for Surveys aboard the Hub-ble Space Telescope (HST) (GO:10200, PI:Jones andGO:10863, PI:Gonzalez) using the F606W (V ), F814W(I) and F850LP (z) filters which were taken from theHST archive27.
For RXCJ0217.2!5244 we used our own pipeline toprocess raw V (720s) and R (1200s) images obtained from
27 http://archive.stsci.edu/
the ESO archive28 (70.A-0074-A, PI:Edge) utilizing theSUSI camera on the NTT on Oct 7 and 12, 2002.
A fraction of the area covered by ACT overlaps withthe 41 deg2 griz imaging from the CTIO 4-m telescopeMOSAIC camera on the 05hr field from the SouthernCosmology Survey (Menanteau et al. 2010). We usedthese data to search for optical identification of SZE clus-ter candidates in the region to avoid re-targeting with theNTT and SOAR telescopes.
4. RESULTS
4.1. The ACT SZE Cluster SampleOur analysis has resulted in a sample of 23 optically-
confirmed SZE clusters selected from 455 square-degreesof ACT data between 0.1 < z < 1.1. Nine of theseclusters, such as 1E0657!56 (the Bullet Cluster), AbellS0592, and Abell 3404 are well known and appear at lowredshift (z < 0.4); and four systems in our sample havebeen reported as SZE-selected clusters by SPT in theirarea overlapping with the ACT coverage. Three of thesesystems (ACT-CL J0509!5341, ACT-CL J0528!5259,and ACT-CL J0546!5345) were originally reported asSZE-selected clusters by Staniszewski et al. (2009), withoptical and X-ray properties subsequently studied by us
28 http://archive.eso.org/
CL2010, IPMU July 2 2010
The ACT-SZ cluster sample
from Menanteau et al (2010), arXiv:1006.5126
(10) new
6 Menanteau et al.
Table 2ACT 2008 clusters
ACT Descriptor R.A. (J2000) Dec. (J2000) Redshift SNR Alt Name
ACT-CL J0145-5301 01:45:03.6 -53:01:23.4 0.118 a 4.7 (4.0) Abell 2941ACT-CL J0641-4949 06:41:37.8 -49:46:55.0 0.146 b 4.9 (4.9) Abell 3402ACT-CL J0645-5413 06:45:29.5 -54:13:37.0 0.167 a 7.1 (7.1) Abell 3404ACT-CL J0638-5358 06:38:49.4 -53:58:40.8 0.222 a 10.6 (10.0) Abell S0592ACT-CL J0516-5430 05:16:37.4 -54:30:01.5 0.294 c 5.2 (4.7) Abell S0520/SPT-CL J0516-5430ACT-CL J0658-5557 06:58:33.1 -55:57:07.2 0.296 d 11.6 (11.5) 1E0657-56 (Bullet)ACT-CL J0245-5302 02:45:35.8 -53:02:16.8 0.300 e 8.3 (9.1) Abell S0295ACT-CL J0217-5245 02:17:12.6 -52:44:49.0 0.343 f 4.5 (4.1) RXC J0217.2-5244ACT-CL J0237-4939 02:37:01.7 -49:38:10.0 0.40± 0.05 4.9 (3.9)ACT-CL J0707-5522 07:07:04.7 -55:23:08.5 0.43± 0.06 4.2 (. . .)ACT-CL J0235-5121 02:35:45.3 -51:21:05.2 0.43± 0.07 5.7 (6.2)ACT-CL J0330-5227 03:30:56.8 -52:28:13.7 0.440 g 7.4 (6.1) Abell 3128(NE)ACT-CL J0509-5341 05:09:21.4 -53:42:12.3 0.461 h 4.4 (4.8) SPT-CL J0509-5342ACT-CL J0304-4921 03:04:16.0 -49:21:26.3 0.47± 0.05 5.0 (3.9)ACT-CL J0215-5212 02:15:12.3 -52:12:25.3 0.51± 0.05 4.8 (4.9)ACT-CL J0438-5419 04:38:17.7 -54:19:20.7 0.54± 0.05 8.8 (8.0)ACT-CL J0346-5438 03:46:55.5 -54:38:54.8 0.55± 0.05 4.4 (4.4)ACT-CL J0232-5257 02:32:46.2 -52:57:50.0 0.59± 0.07 5.2 (4.7)ACT-CL J0559-5249 05:59:43.2 -52:49:27.1 0.611 i 5.1 (5.1) SPT-CL J0559-5249ACT-CL J0616-5227 06:16:34.2 -52:27:13.3 0.71± 0.10 6.3 (5.9)ACT-CL J0102-4915 01:02:52.5 -49:14:58.0 0.75± 0.04 8.8 (9.0)ACT-CL J0528-5259 05:28:05.3 -52:59:52.8 0.768 h 4.7 (. . .) SPT-CL J0528-5300ACT-CL J0546-5345 05:46:37.7 -53:45:31.1 1.066 h 7.2 (6.5) SPT-CL J0546-5345
Note. — R.A. and Dec. positions denote the BCG position in the optical images of the cluster. The SZE positionwas used to construct the ACT descriptor identifiers. Clusters with uncertainty estimates on their redshifts are thosesystems for which only photometric redshifts are available from the NTT and SOAR gri imaging. The values of SNRin parentheses are the current values from Marriage et al. (2010), while the others are the ones used in this studya spec-z from de Grandi et al. (1999)b spec-z from Jones et al. (2009)c spec-z from Guzzo et al. (1999)d spec-z from Tucker et al. (1998)e spec-z from Edge et al. (1994)f spec-z from Bohringer et al. (2004)g spec-z from Werner et al. (2007)h spec-z from Infante et al. (2010)i spec-z from High et al. (2010)
For a few of these we obtained new NTT/SOAR gri ob-servations in order to calibrate our photometric redshiftand to test our identification procedure; however, for themost part these were avoided and we relied on publicarchival imaging and on data from other existing pro-grams to compare with the SZE sources.
AS0295 and AS0592 are included among the low red-shift SZE clusters reported by Hincks et al. (2009) andare the focus of a separate observing program by ourgroup (09B-0389, PI:Hughes) aimed at obtaining weaklensing masses using deep V and R observations. Thesewere obtained using the MOSAIC camera on the Blanco4-m telescope on January 9, 2010 under photometric con-ditions.
1E0657!56 (the Bullet Cluster) has been extensivelyobserved at di!erent wavelengths. Here we show theoptical observations of the cluster central region takenwith the Advanced Camera for Surveys aboard the Hub-ble Space Telescope (HST) (GO:10200, PI:Jones andGO:10863, PI:Gonzalez) using the F606W (V ), F814W(I) and F850LP (z) filters which were taken from theHST archive27.
For RXCJ0217.2!5244 we used our own pipeline toprocess raw V (720s) and R (1200s) images obtained from
27 http://archive.stsci.edu/
the ESO archive28 (70.A-0074-A, PI:Edge) utilizing theSUSI camera on the NTT on Oct 7 and 12, 2002.
A fraction of the area covered by ACT overlaps withthe 41 deg2 griz imaging from the CTIO 4-m telescopeMOSAIC camera on the 05hr field from the SouthernCosmology Survey (Menanteau et al. 2010). We usedthese data to search for optical identification of SZE clus-ter candidates in the region to avoid re-targeting with theNTT and SOAR telescopes.
4. RESULTS
4.1. The ACT SZE Cluster SampleOur analysis has resulted in a sample of 23 optically-
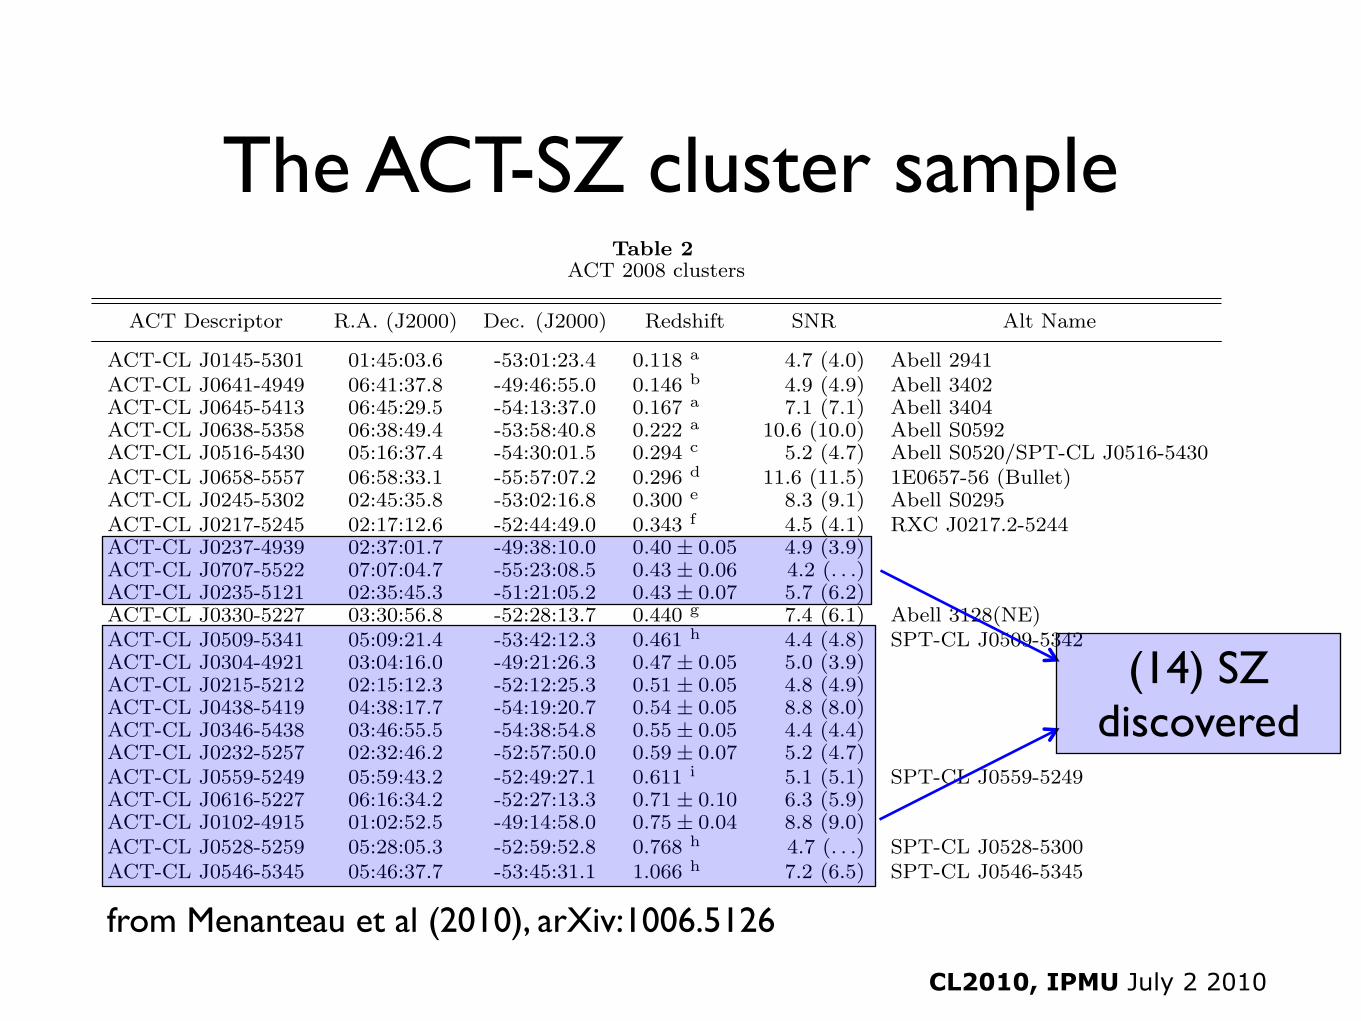
confirmed SZE clusters selected from 455 square-degreesof ACT data between 0.1 < z < 1.1. Nine of theseclusters, such as 1E0657!56 (the Bullet Cluster), AbellS0592, and Abell 3404 are well known and appear at lowredshift (z < 0.4); and four systems in our sample havebeen reported as SZE-selected clusters by SPT in theirarea overlapping with the ACT coverage. Three of thesesystems (ACT-CL J0509!5341, ACT-CL J0528!5259,and ACT-CL J0546!5345) were originally reported asSZE-selected clusters by Staniszewski et al. (2009), withoptical and X-ray properties subsequently studied by us
28 http://archive.eso.org/
CL2010, IPMU July 2 2010
The ACT-SZ cluster sample
from Menanteau et al (2010), arXiv:1006.5126
(14) SZ discovered
CL2010, IPMU July 2 2010
Menanteau et al. (2010) in prep Menanteau et al. (2010) in prep
Some Previously Know Clusters
CL2010, IPMU July 2 2010
ACT-J0658-5557, z=0.296(Bullet Cluster)
Menanteau & Hughes (2009)
Some Previously Know Clusters
CL2010, IPMU July 2 2010
Menanteau et al. (2010) in prep Menanteau et al. (2010) in prep
Some Previously Know Clusters
CL2010, IPMU July 2 2010
Menanteau & Hughes (2009) Menanteau et al. (2010) in prep
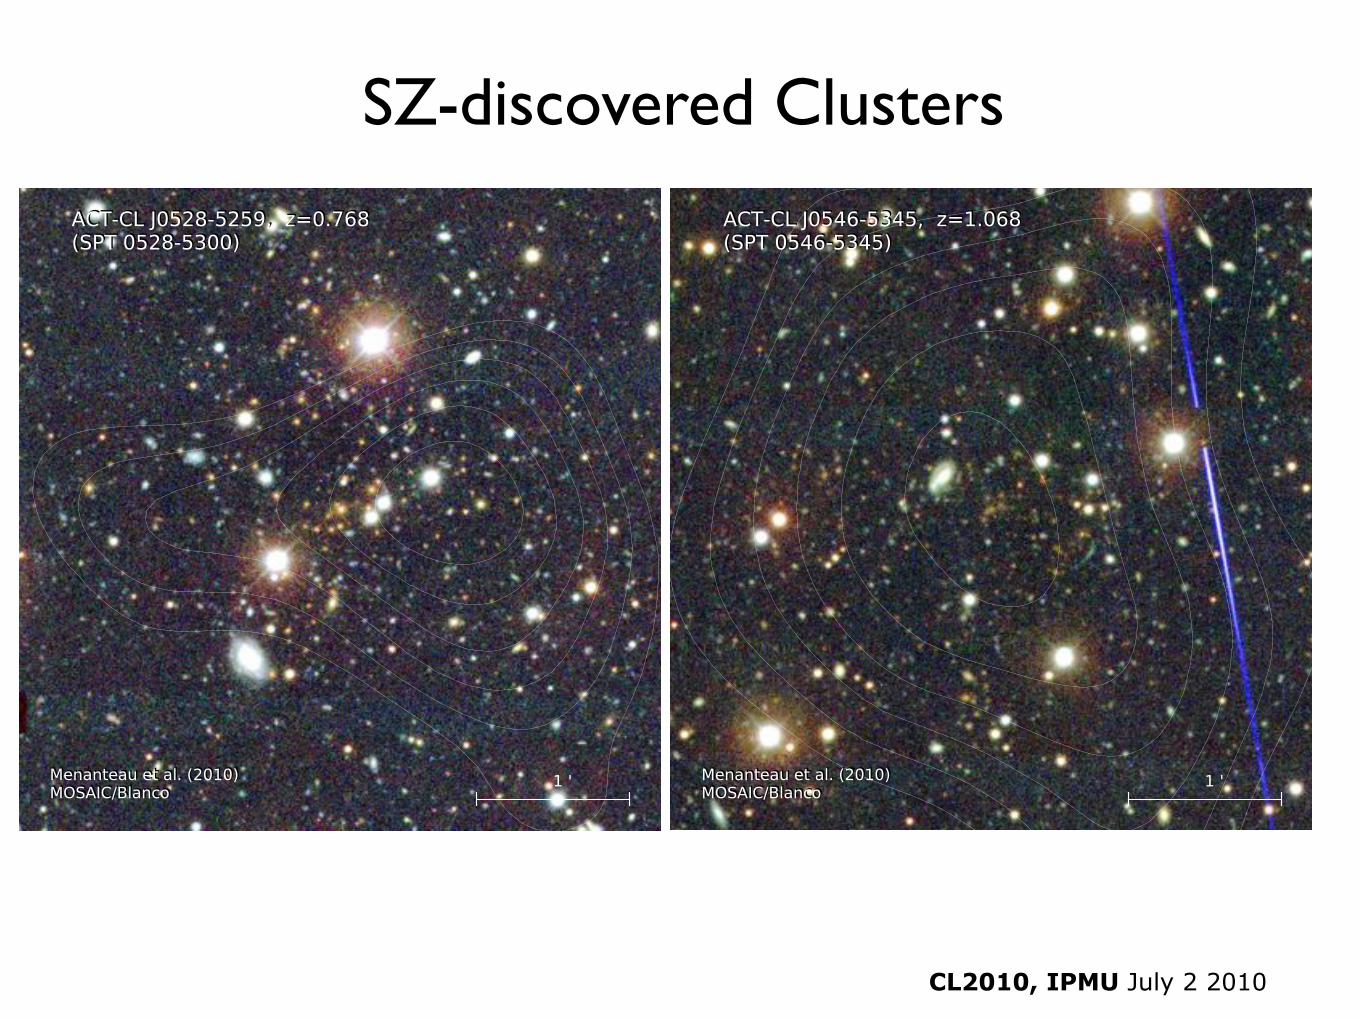
SZ-discovered Clusters
CL2010, IPMU July 2 2010
(A3128-NE)
Menanteau et al. (2010) in prep Menanteau et al. (2010) in prepMenanteau et al. (2010) in prep
SZ-discovered Clusters
CL2010, IPMU July 2 2010
(A3128-NE)
Menanteau et al. (2010) in prep Menanteau et al. (2010) in prepMenanteau et al. (2010) in prep
SZ-discovered Clusters
CL2010, IPMU July 2 2010
Menanteau et al. (2010) in prep Menanteau et al. (2010) in prepMenanteau et al. (2010) in prep
SZ-discovered Clusters
CL2010, IPMU July 2 2010
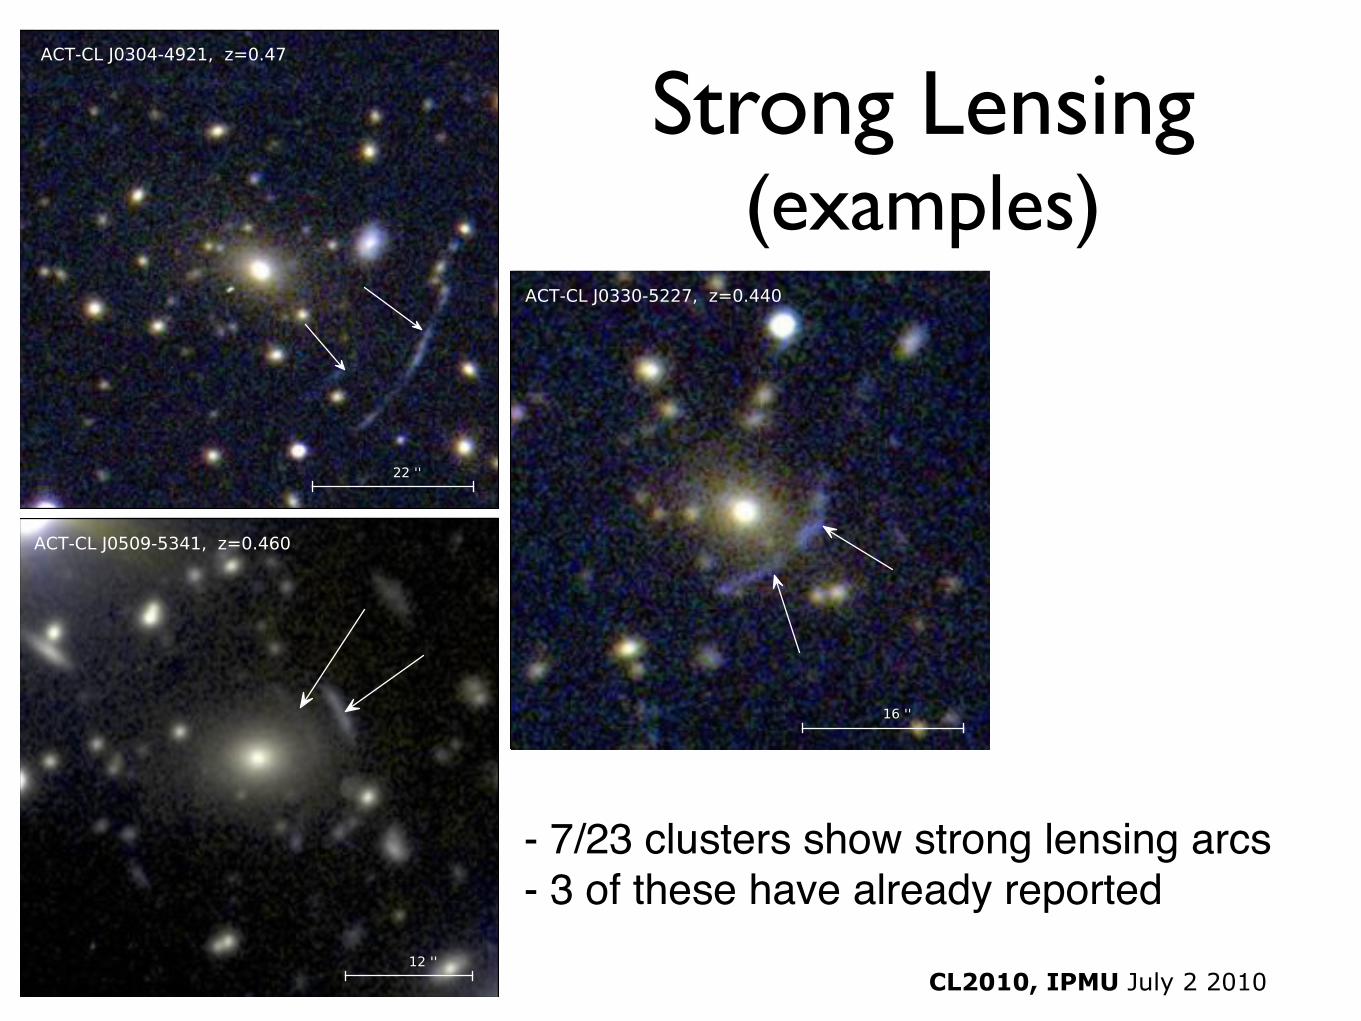
Strong Lensing(examples)
- 7/23 clusters show strong lensing arcs- 3 of these have already reported
CL2010, IPMU July 2 2010
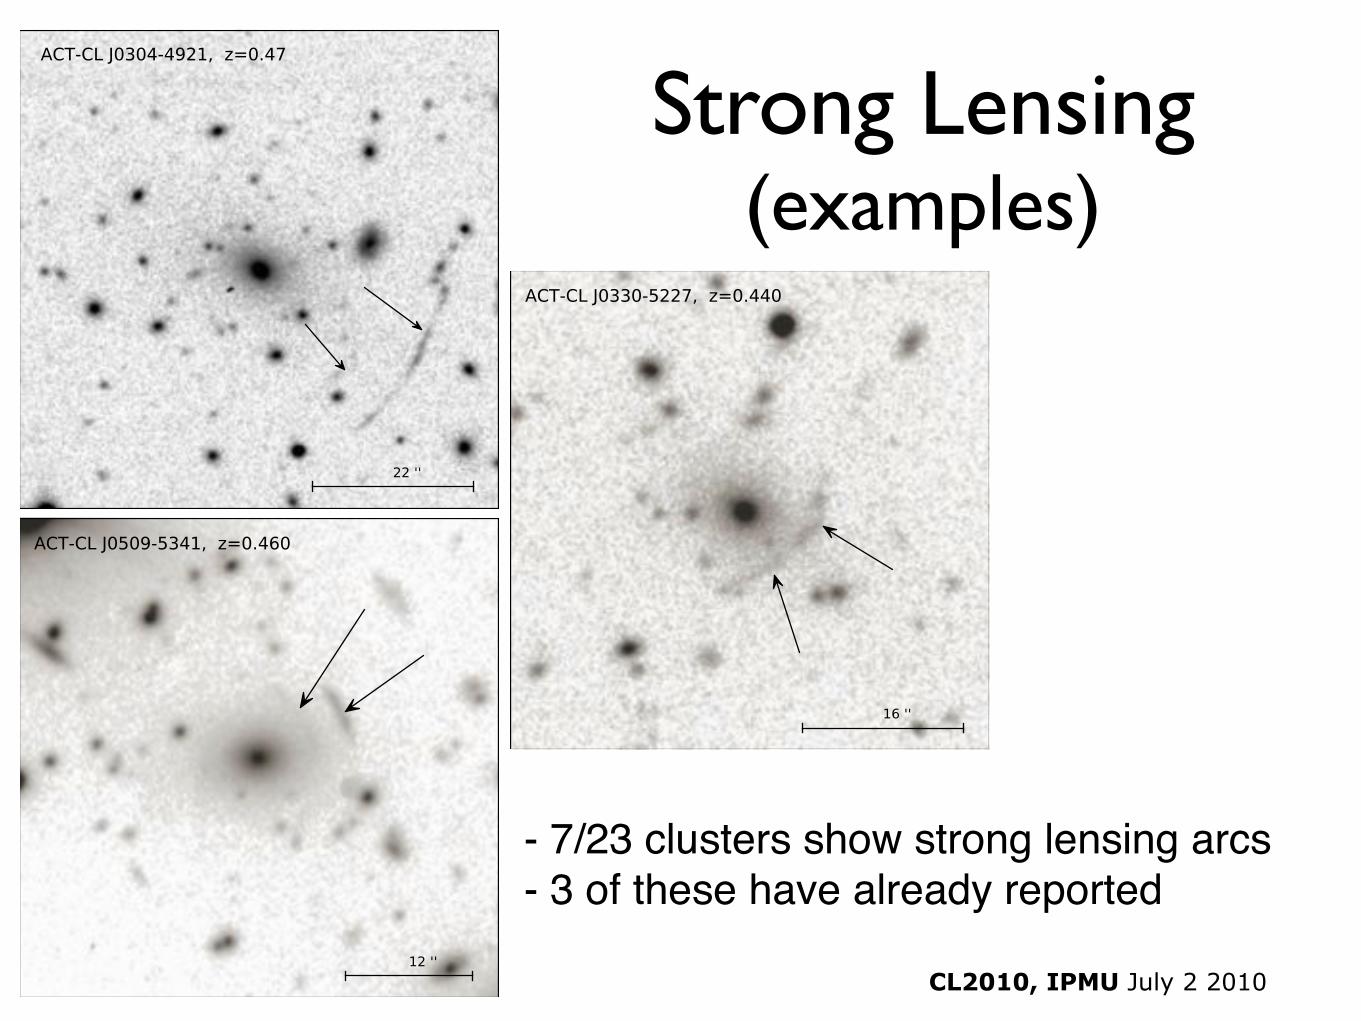
Strong Lensing(examples)
- 7/23 clusters show strong lensing arcs- 3 of these have already reported
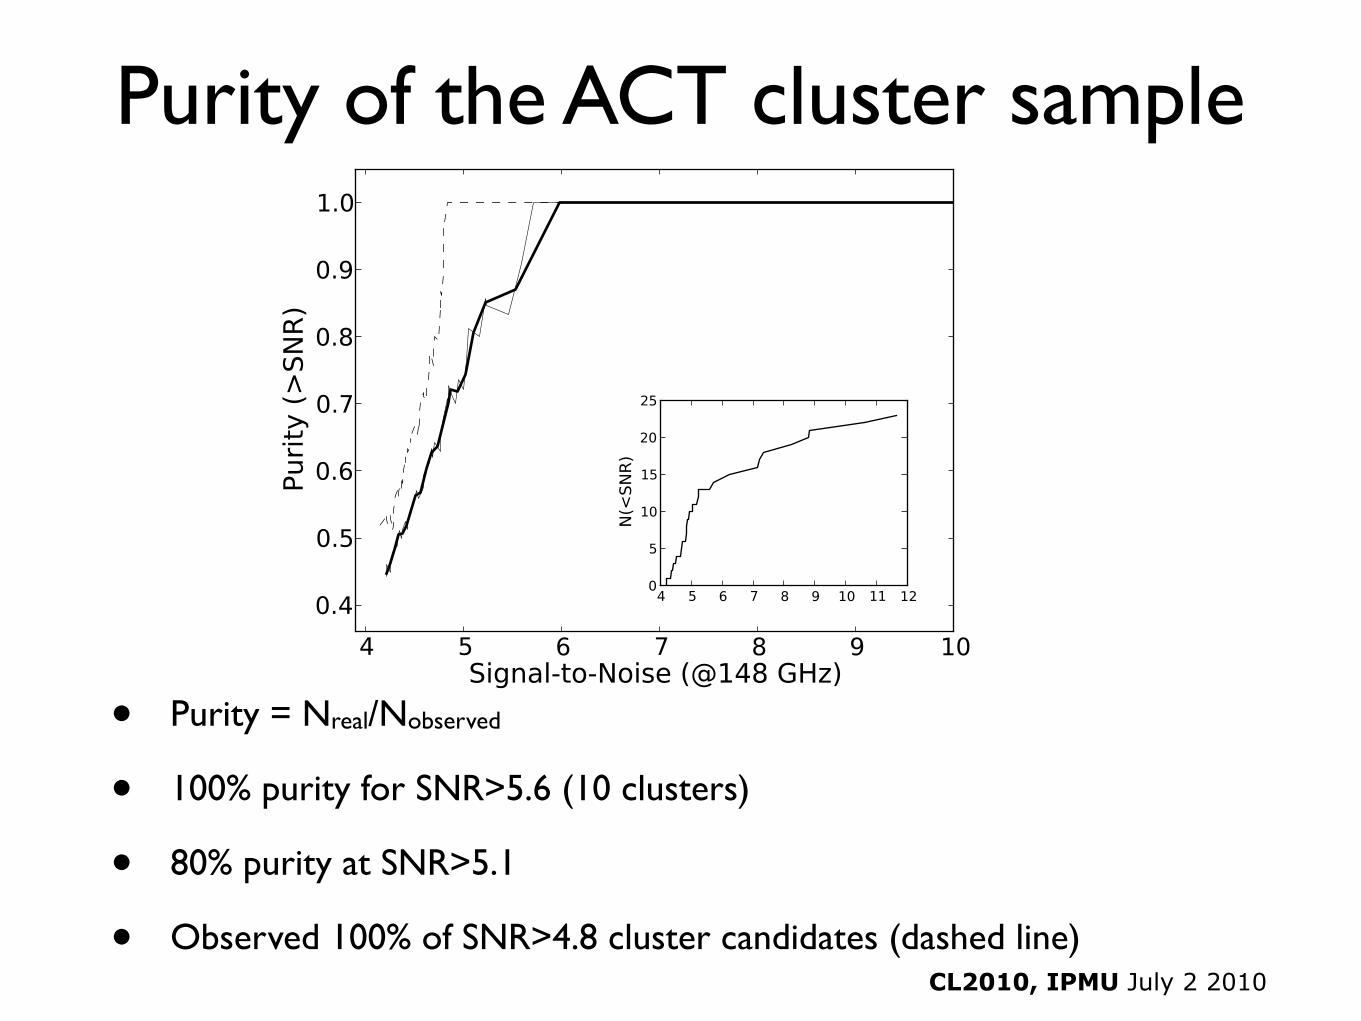
• Purity = Nreal/Nobserved
• 100% purity for SNR>5.6 (10 clusters)
• 80% purity at SNR>5.1
• Observed 100% of SNR>4.8 cluster candidates (dashed line)CL2010, IPMU July 2 2010
Purity of the ACT cluster sample
CL2010, IPMU July 2 2010
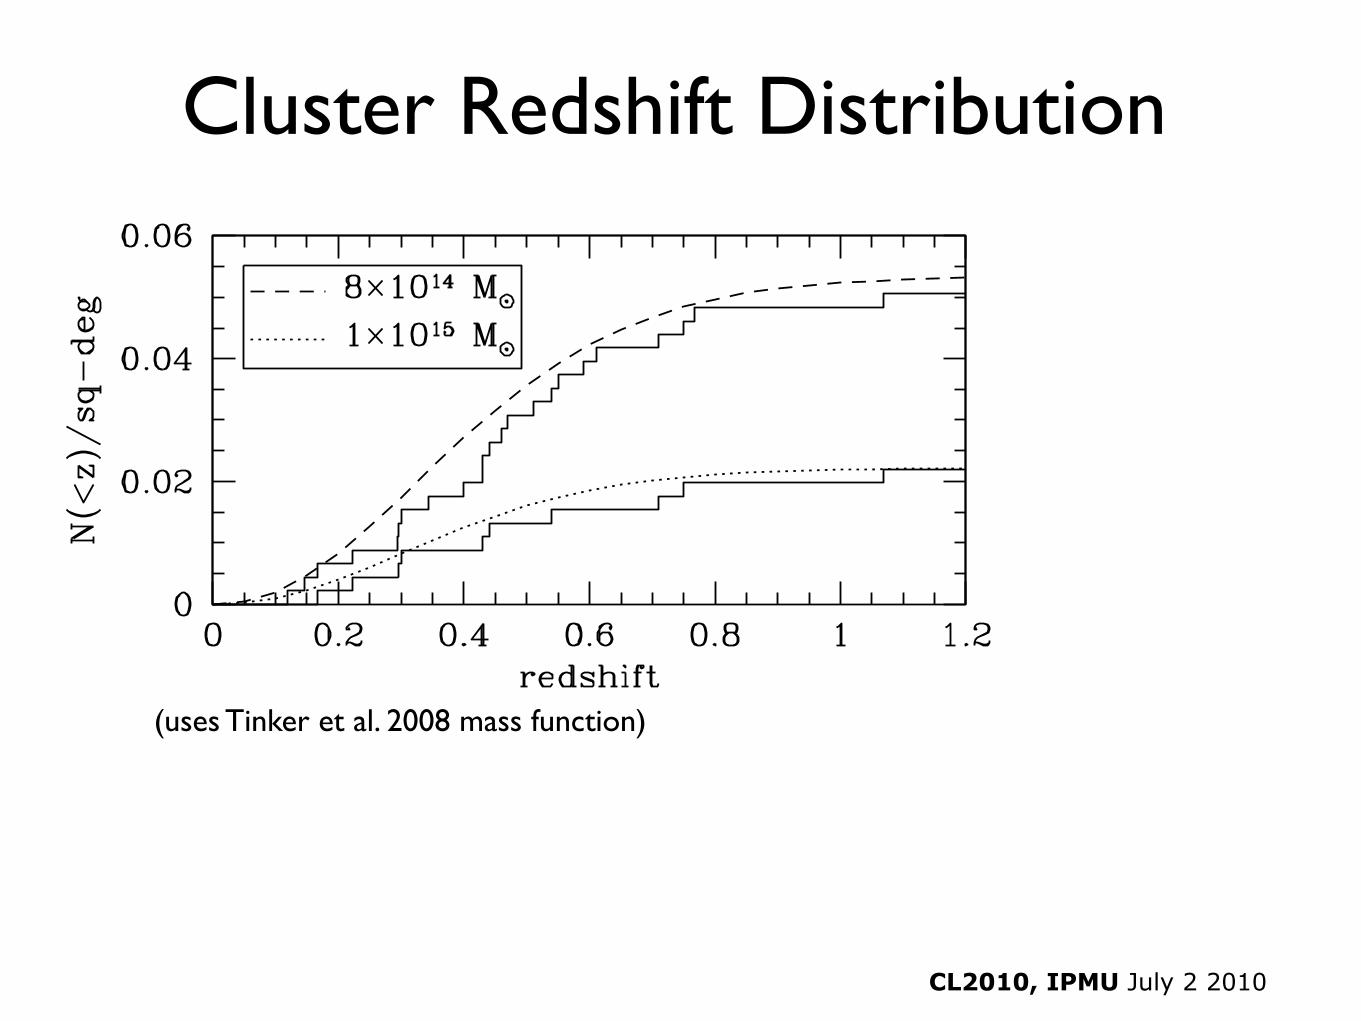
Cluster Redshift Distribution
(uses Tinker et al. 2008 mass function)
CL2010, IPMU July 2 2010
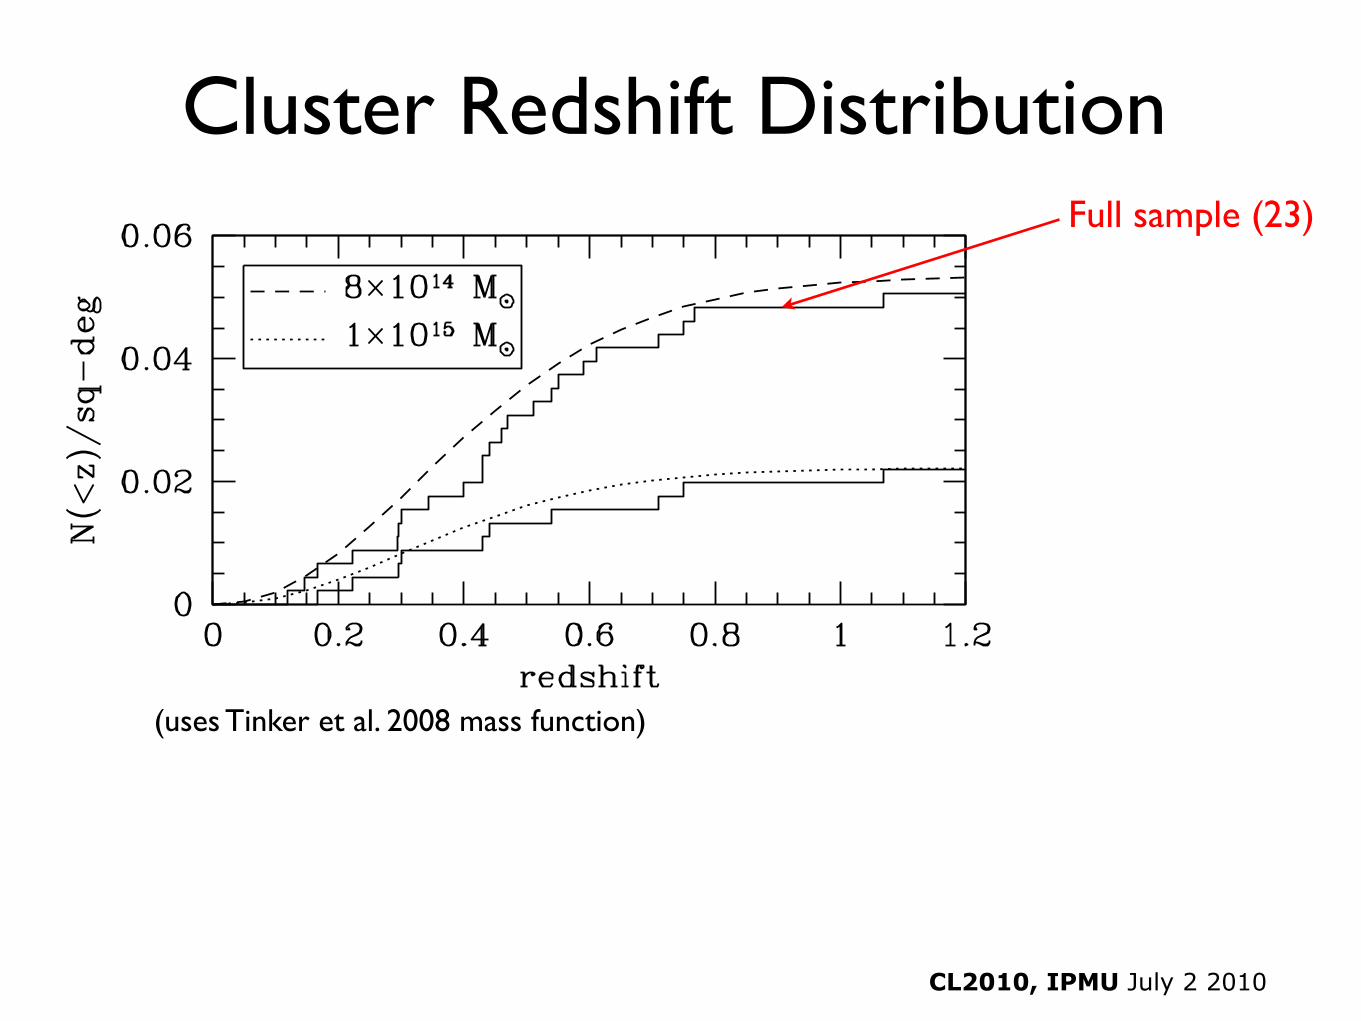
Cluster Redshift Distribution
(uses Tinker et al. 2008 mass function)
Full sample (23)
CL2010, IPMU July 2 2010
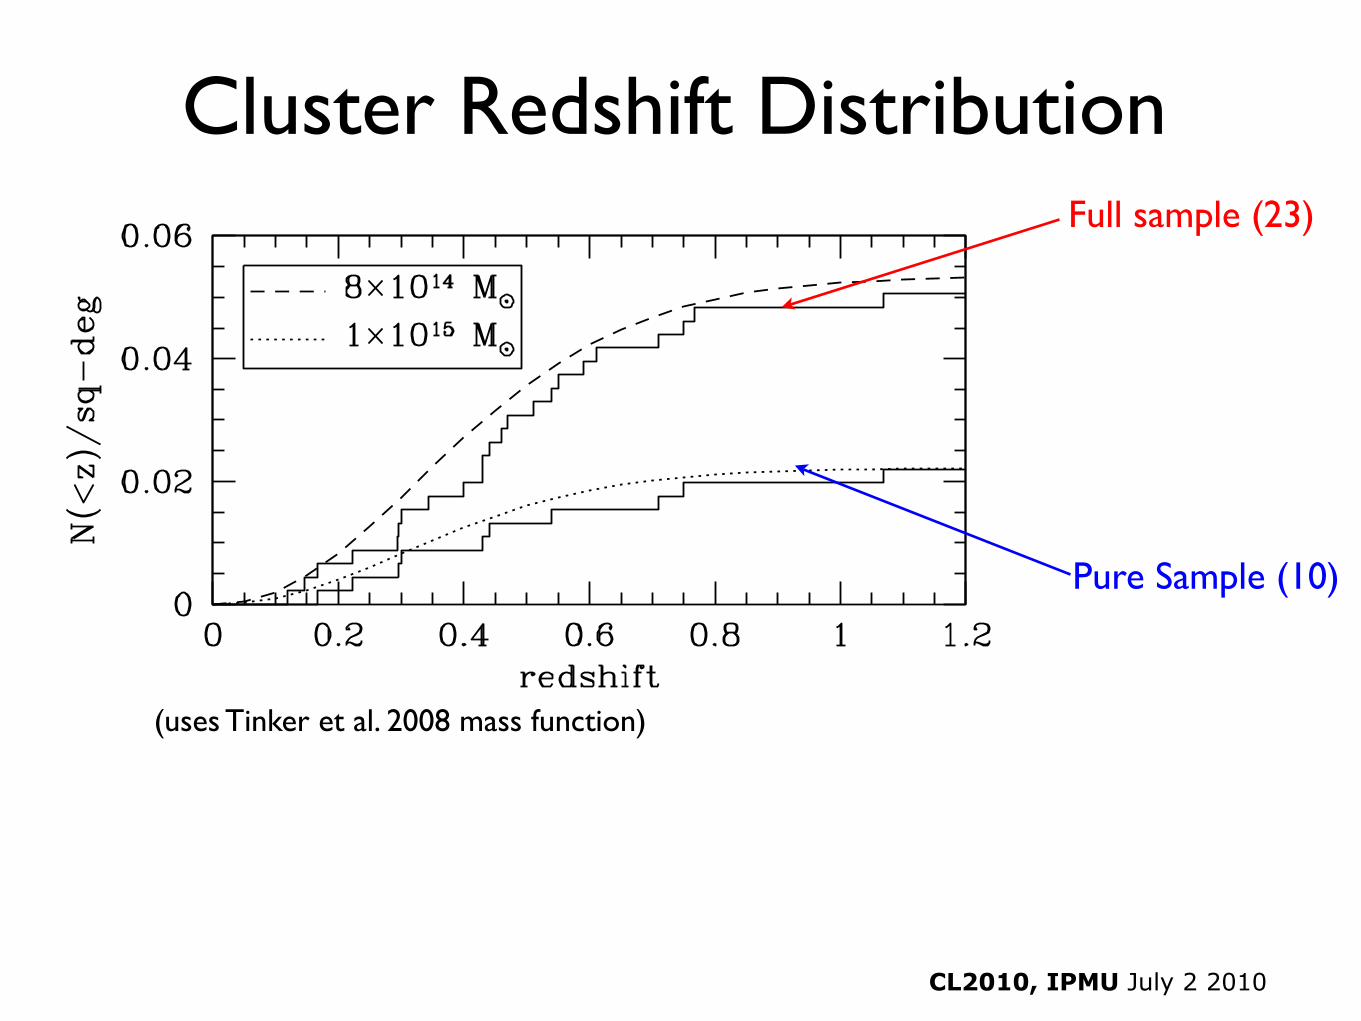
Cluster Redshift Distribution
(uses Tinker et al. 2008 mass function)
Full sample (23)
Pure Sample (10)
CL2010, IPMU July 2 2010
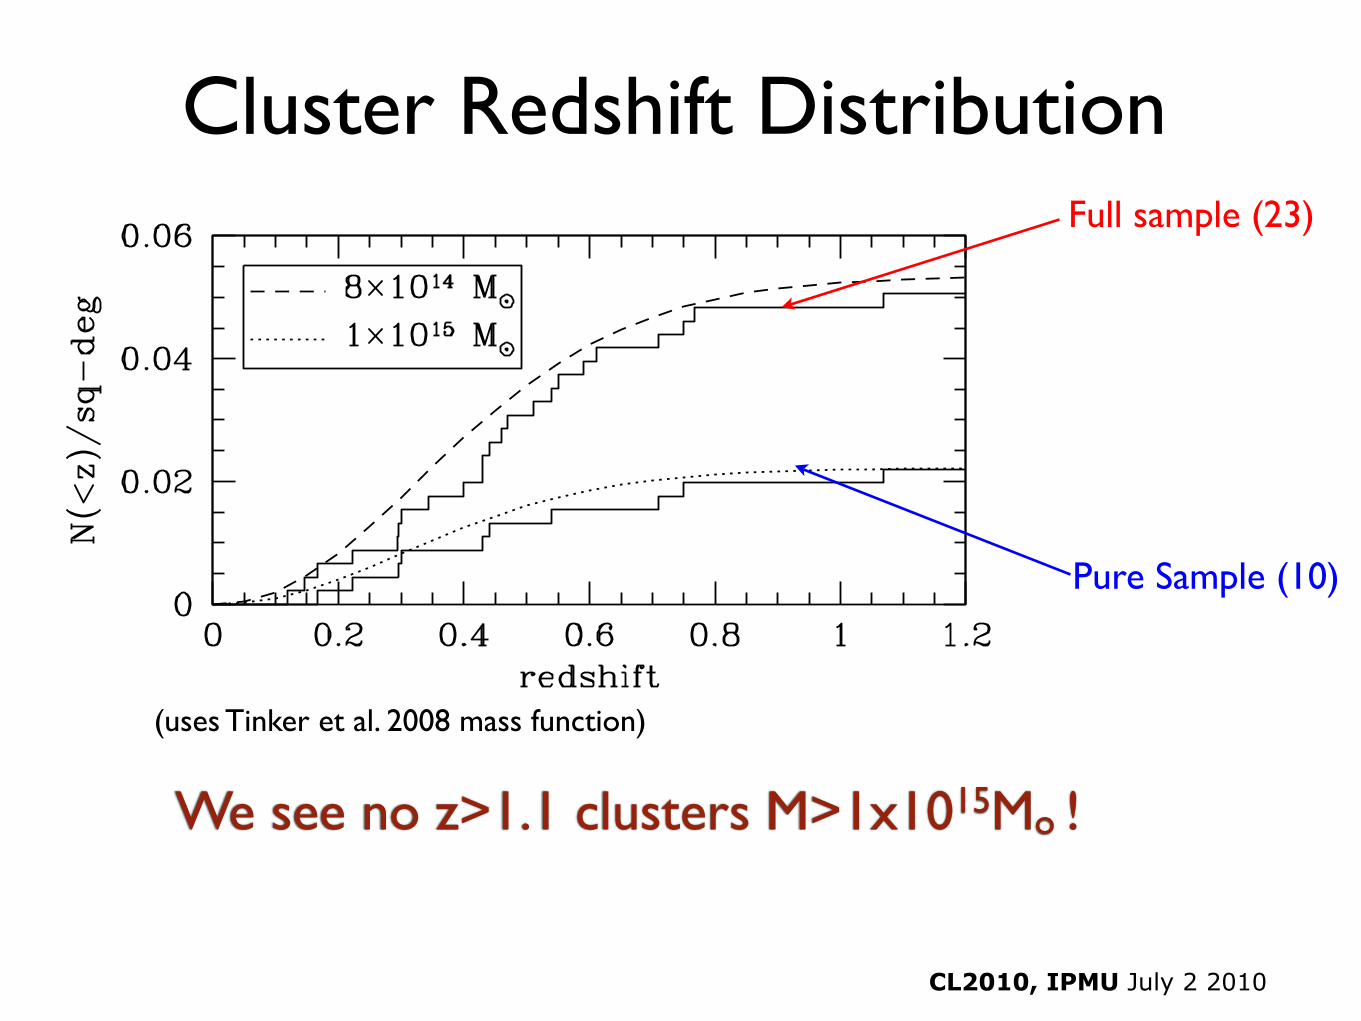
Cluster Redshift Distribution
(uses Tinker et al. 2008 mass function)
Full sample (23)
Pure Sample (10)
We see no z>1.1 clusters M>1x10¹⁵Mo !
CL2010, IPMU July 2 2010
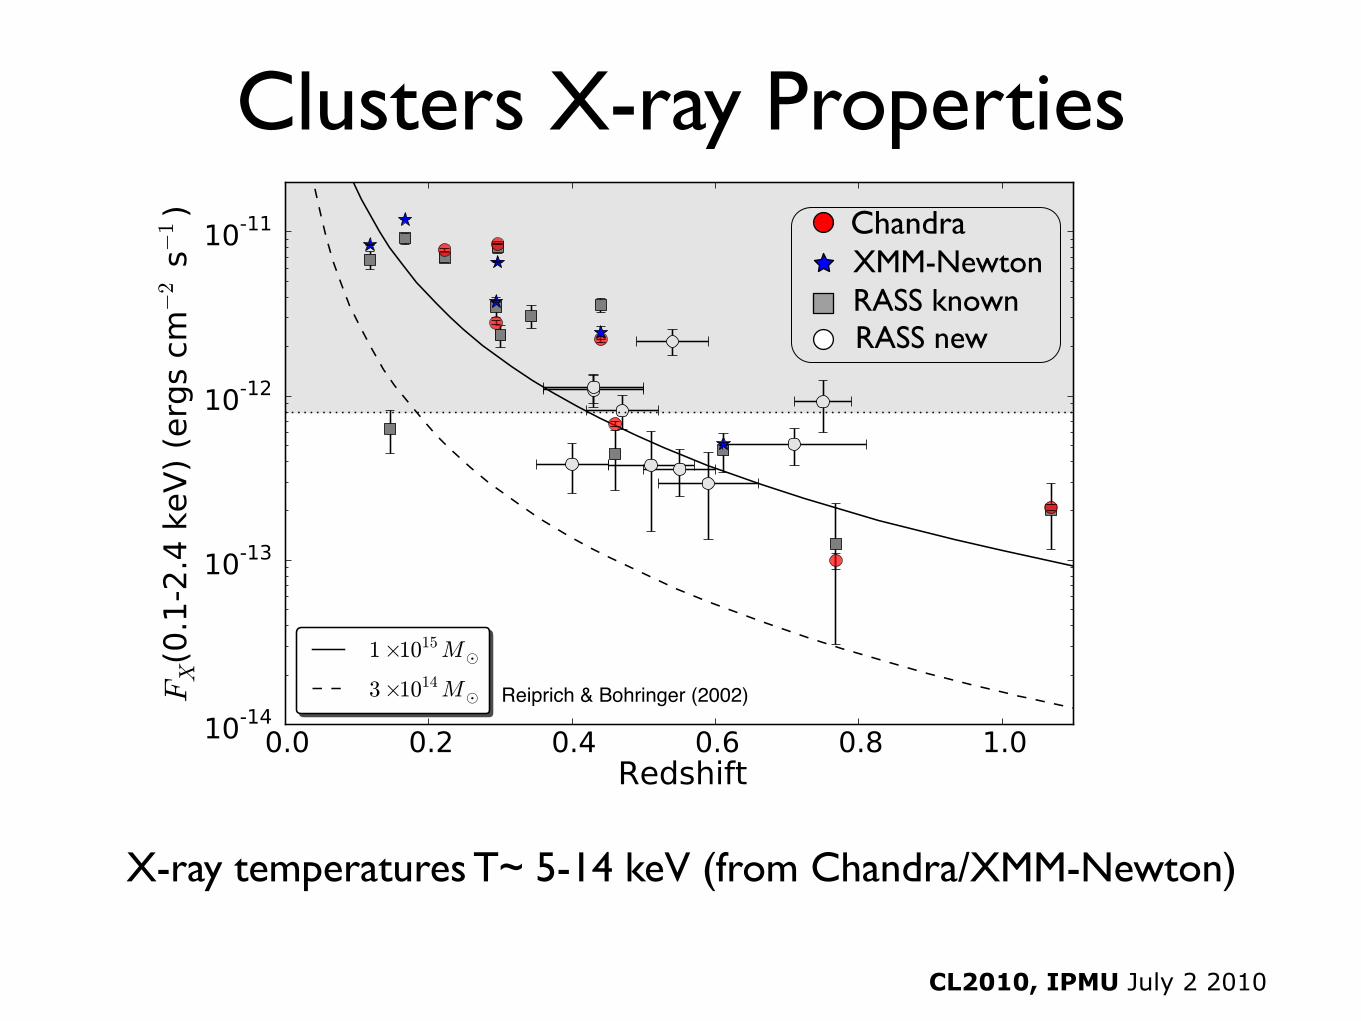
Clusters X-ray Properties ChandraXMM-NewtonRASS knownRASS new
Reiprich & Bohringer (2002)
X-ray temperatures T~ 5-14 keV (from Chandra/XMM-Newton)
CL2010, IPMU July 2 2010
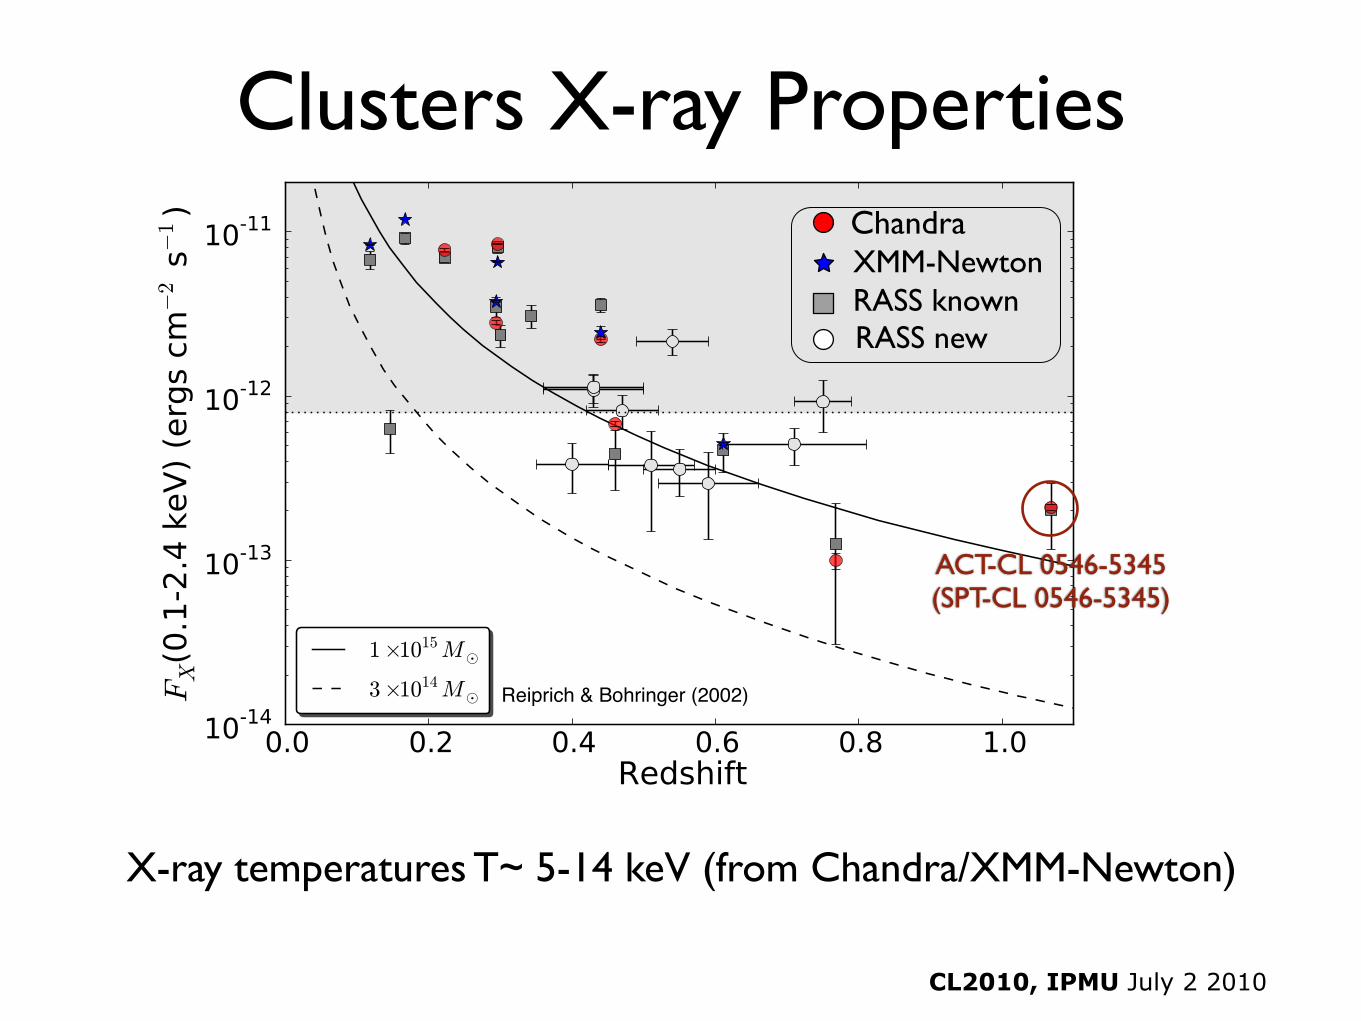
Clusters X-ray Properties ChandraXMM-NewtonRASS knownRASS new
Reiprich & Bohringer (2002)
X-ray temperatures T~ 5-14 keV (from Chandra/XMM-Newton)
ACT-CL 0546-5345(SPT-CL 0546-5345)
The most massive cluster z>1?
CL2010, IPMU July 2 2010
The most massive cluster z>1?
CL2010, IPMU July 2 2010

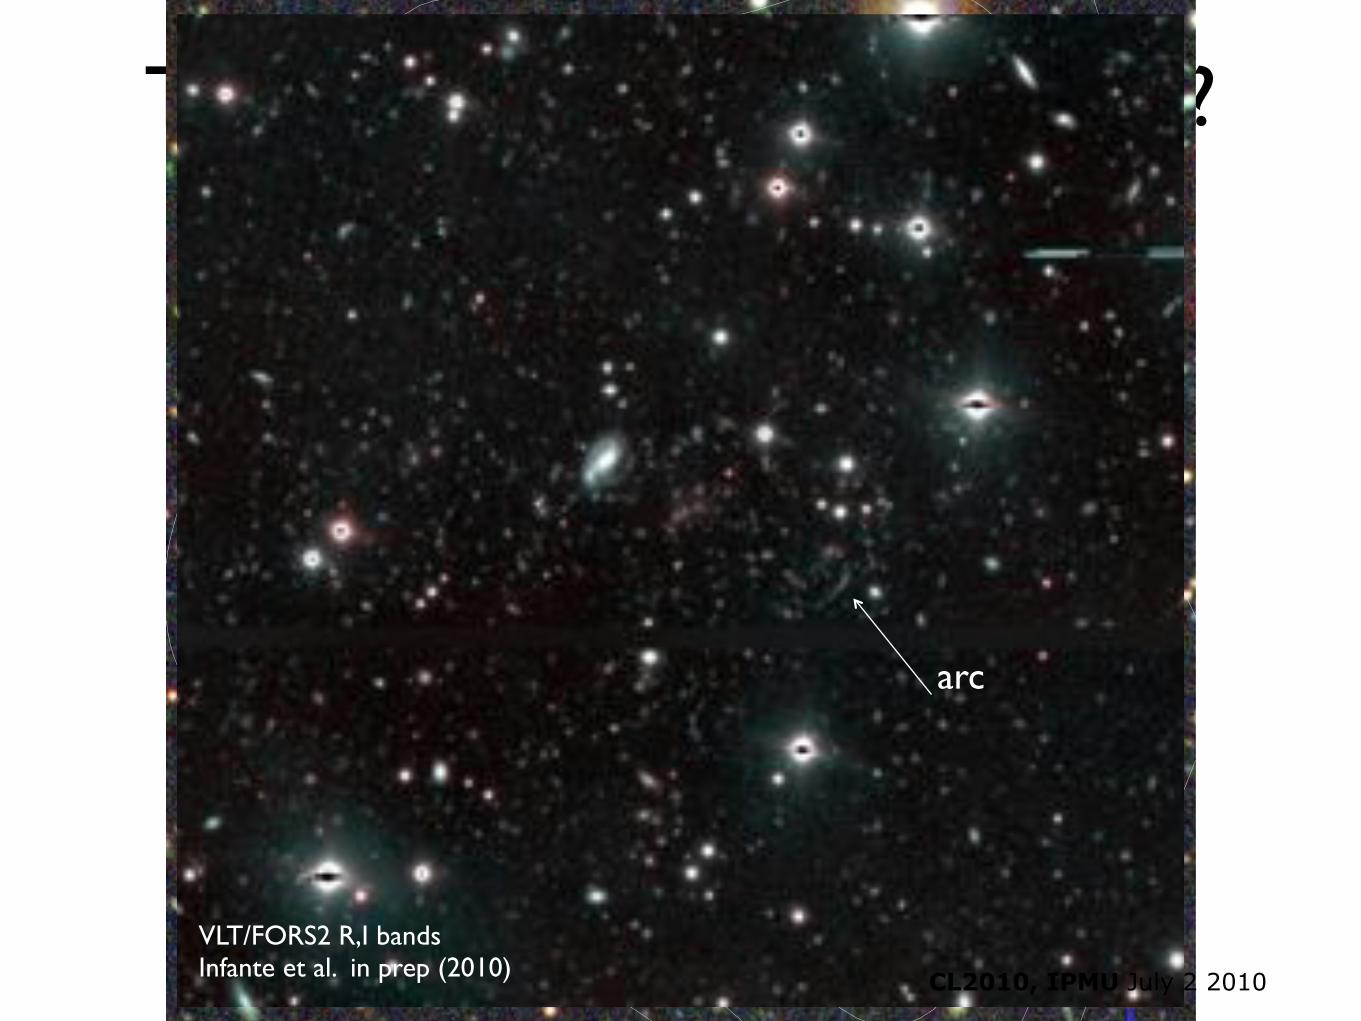
The most massive cluster z>1?
VLT/FORS2 R,I bandsInfante et al. in prep (2010)
CL2010, IPMU July 2 2010
The most massive cluster z>1?
VLT/FORS2 R,I bandsInfante et al. in prep (2010)
CL2010, IPMU July 2 2010
arc
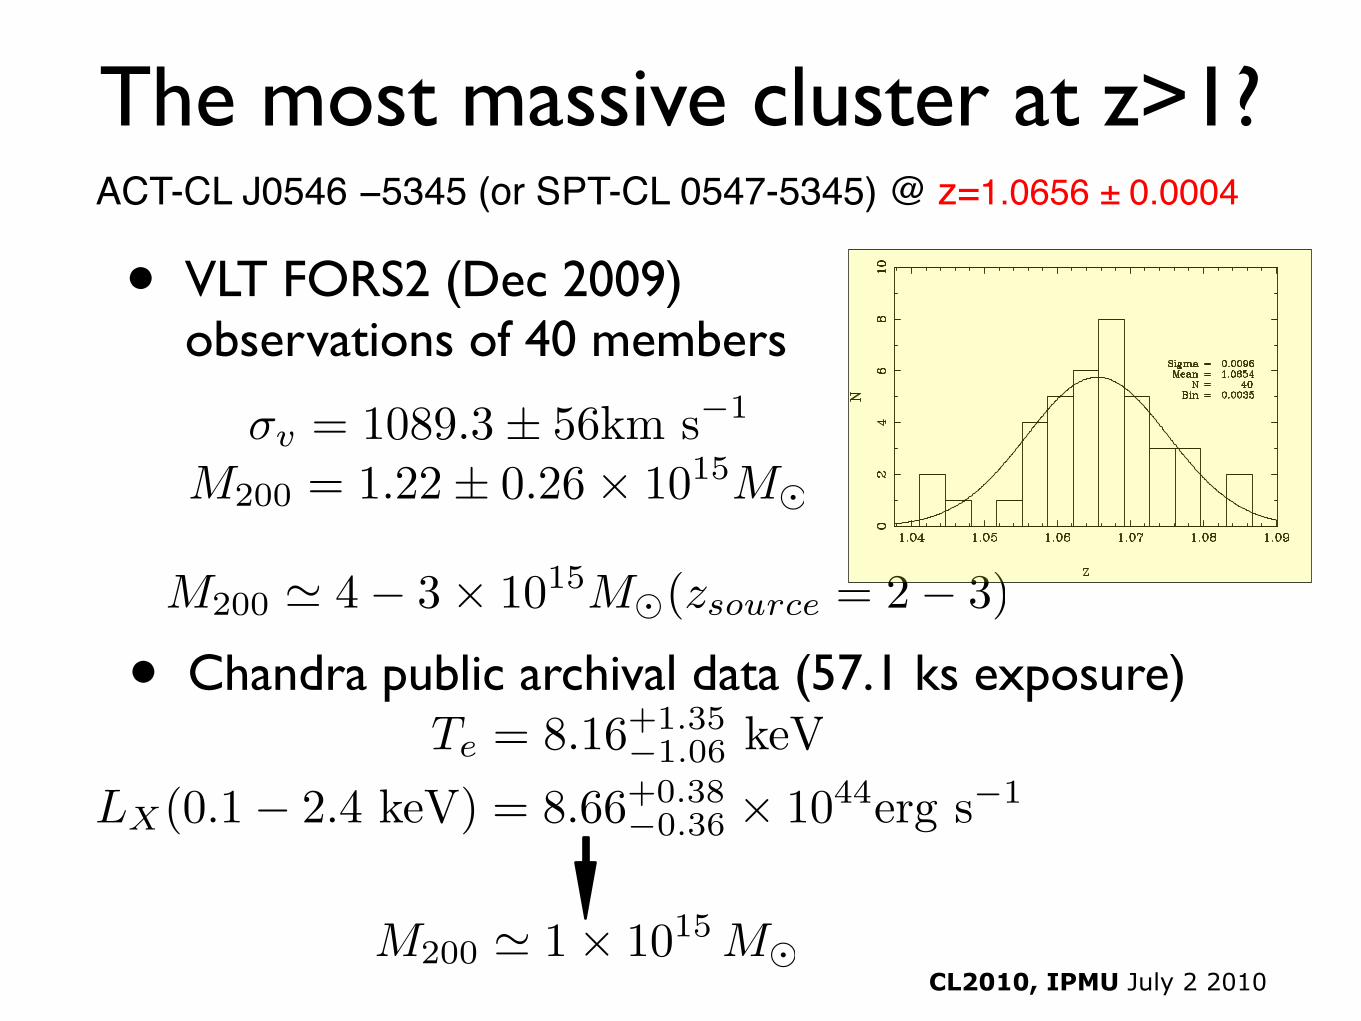
LX(0.1! 2.4 keV) = 8.66+0.38!0.36 " 1044erg s!1
M200 ! 1" 1015 M!
M200 ! 4" 3# 1015M!(zsource = 2" 3)
CL2010, IPMU July 2 2010
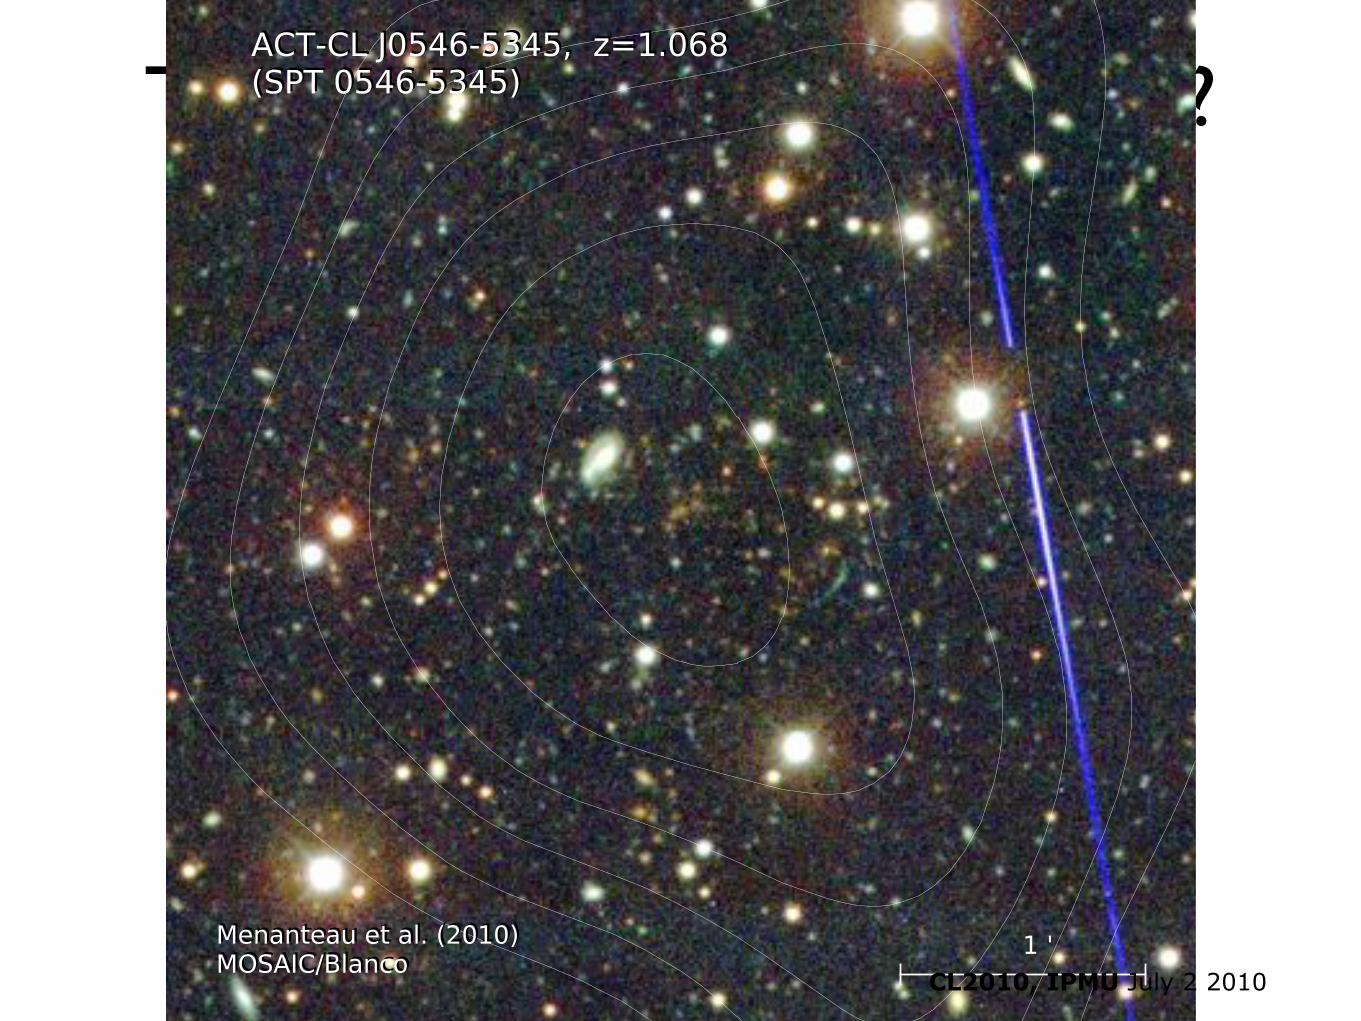
The most massive cluster at z>1?
• VLT FORS2 (Dec 2009) observations of 40 members
Te = 8.16+1.35!1.06 keV
M200 = 1.22± 0.26! 1015M!
!v = 1089.3± 56km s!1
ACT-CL J0546 !5345 (or SPT-CL 0547-5345) @ z=1.0656 ± 0.0004
• Chandra public archival data (57.1 ks exposure)
CL2010, IPMU July 2 2010
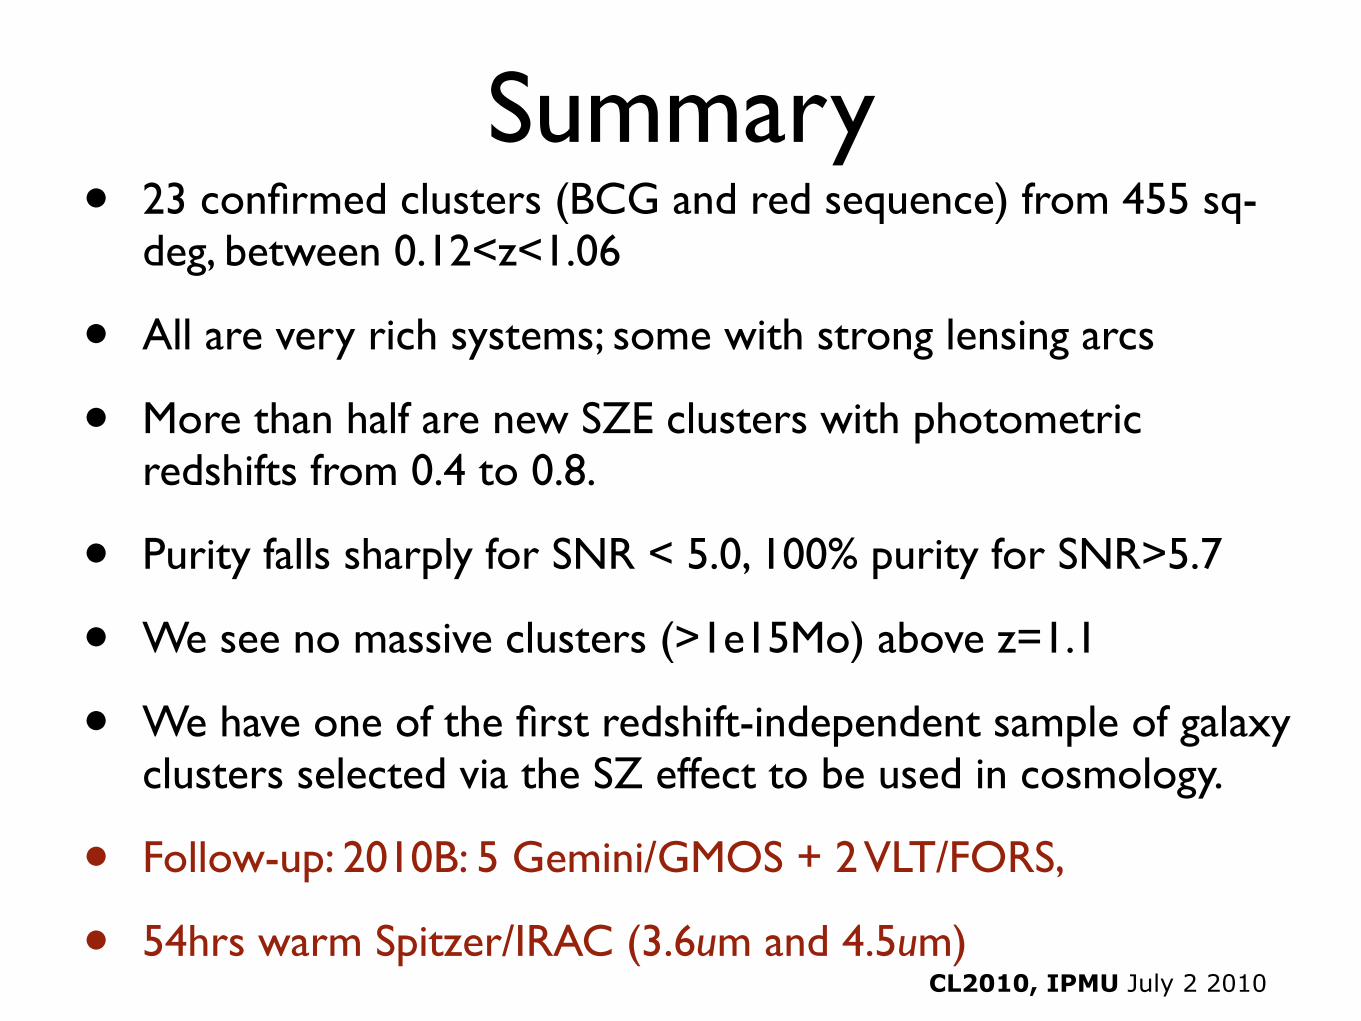
Summary• 23 confirmed clusters (BCG and red sequence) from 455 sq-
deg, between 0.12<z<1.06
• All are very rich systems; some with strong lensing arcs
• More than half are new SZE clusters with photometric redshifts from 0.4 to 0.8.
• Purity falls sharply for SNR < 5.0, 100% purity for SNR>5.7
• We see no massive clusters (>1e15Mo) above z=1.1
• We have one of the first redshift-independent sample of galaxy clusters selected via the SZ effect to be used in cosmology.
• Follow-up: 2010B: 5 Gemini/GMOS + 2 VLT/FORS,
• 54hrs warm Spitzer/IRAC (3.6um and 4.5um)