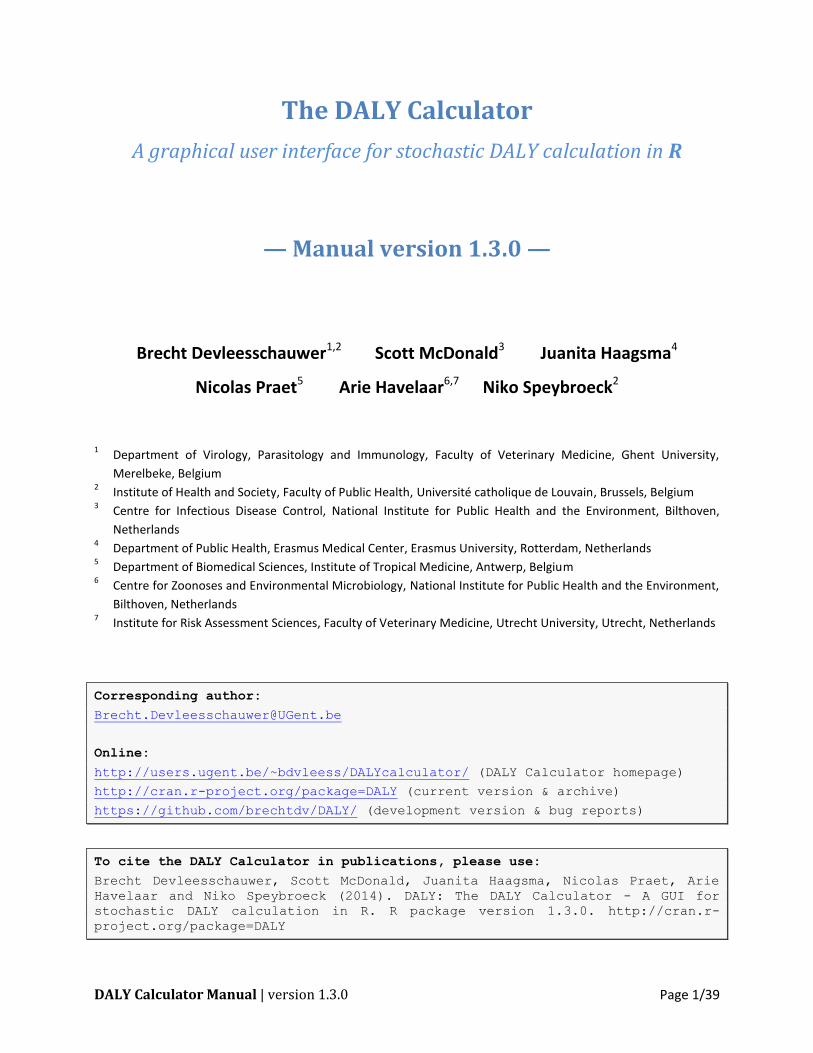
manual version 1.3.0 - daly calculator
TRANSCRIPT
DALY Calculator Manual | version 1.3.0 Page 1/39
The DALY Calculator
A graphical user interface for stochastic DALY calculation in R
— Manual version 1.3.0 —
Brecht Devleesschauwer1,2
Scott McDonald3 Juanita Haagsma
4
Nicolas Praet5 Arie Havelaar
6,7 Niko Speybroeck
2
1 Department of Virology, Parasitology and Immunology, Faculty of Veterinary Medicine, Ghent University,
Merelbeke, Belgium 2 Institute of Health and Society, Faculty of Public Health, Université catholique de Louvain, Brussels, Belgium
3 Centre for Infectious Disease Control, National Institute for Public Health and the Environment, Bilthoven,
Netherlands 4 Department of Public Health, Erasmus Medical Center, Erasmus University, Rotterdam, Netherlands
5 Department of Biomedical Sciences, Institute of Tropical Medicine, Antwerp, Belgium
6 Centre for Zoonoses and Environmental Microbiology, National Institute for Public Health and the Environment,
Bilthoven, Netherlands 7 Institute for Risk Assessment Sciences, Faculty of Veterinary Medicine, Utrecht University, Utrecht, Netherlands
Corresponding author:
Online:
http://users.ugent.be/~bdvleess/DALYcalculator/ (DALY Calculator homepage)
http://cran.r-project.org/package=DALY (current version & archive)
https://github.com/brechtdv/DALY/ (development version & bug reports)
To cite the DALY Calculator in publications, please use:
Brecht Devleesschauwer, Scott McDonald, Juanita Haagsma, Nicolas Praet, Arie Havelaar and Niko Speybroeck (2014). DALY: The DALY Calculator - A GUI for stochastic DALY calculation in R. R package version 1.3.0. http://cran.r-project.org/package=DALY
DALY Calculator Manual | version 1.3.0 Page 2/39
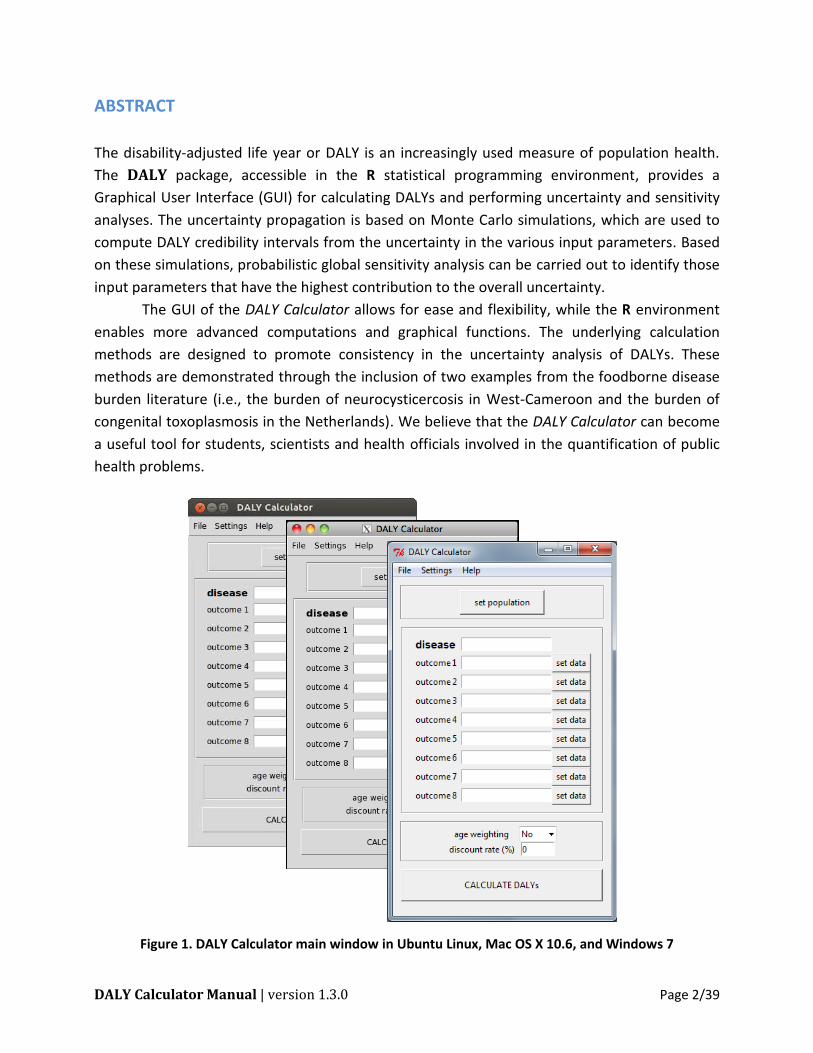
ABSTRACT
The disability-adjusted life year or DALY is an increasingly used measure of population health.
The DALY package, accessible in the R statistical programming environment, provides a
Graphical User Interface (GUI) for calculating DALYs and performing uncertainty and sensitivity
analyses. The uncertainty propagation is based on Monte Carlo simulations, which are used to
compute DALY credibility intervals from the uncertainty in the various input parameters. Based
on these simulations, probabilistic global sensitivity analysis can be carried out to identify those
input parameters that have the highest contribution to the overall uncertainty.
The GUI of the DALY Calculator allows for ease and flexibility, while the R environment
enables more advanced computations and graphical functions. The underlying calculation
methods are designed to promote consistency in the uncertainty analysis of DALYs. These
methods are demonstrated through the inclusion of two examples from the foodborne disease
burden literature (i.e., the burden of neurocysticercosis in West-Cameroon and the burden of
congenital toxoplasmosis in the Netherlands). We believe that the DALY Calculator can become
a useful tool for students, scientists and health officials involved in the quantification of public
health problems.
Figure 1. DALY Calculator main window in Ubuntu Linux, Mac OS X 10.6, and Windows 7
DALY Calculator Manual | version 1.3.0 Page 3/39
1. Introduction
The disability-adjusted life year or DALY is a summary measure of population health widely
used in disease burden assessment studies and cost-utility analyses (Murray and Lopez, 1996;
Lopez et al., 2006). DALYs represent the number of healthy life years lost due to a disease or
disability, and do so by incorporating non-fatal and fatal health outcomes, calculated as the
years of life lived with disability (YLD) and the years of life lost due to premature death (YLL),
respectively. In order to make a direct comparison of YLDs and YLLs possible, disability weights
are assigned to various degrees of disability, ranging from zero (full health) to one (worst
possible health state). In addition to these disability weights, the DALY calculation requires the
choice of two other social values, i.e., age weighting and time discounting. The former gives a
higher weight to the healthy life years lived between the age of 9 and 54, as this period of life is
considered to be socially more important than the younger and older life spans (Murray, 1994).
The latter discounts the years of healthy life lived in the future, at a rate of (usually) 3%. The
incorporation of a time discount rate reflects similar practices in economic assessments, and
would prevent policy makers from saving resources for a possible future eradication program,
instead of investing in currently available, but less effective, intervention measures (the so-
called "disease eradication and research paradox"; Murray, 1994).
The formulas for calculating the YLLs and YLDs are presented in Murray (1994) and Murray and
Acharya (1997), and can easily be incorporated in a spreadsheet, such as the "DALY calculation
template"1 prepared by the World Health Organization for its Global Burden of Disease (GBD)
project (Mathers et al., 2001). This template allows the computation of YLLs and YLDs for both
sexes and various age groups, which are then summarized into a single deterministic DALY
measure.
The reliability of the final DALY result depends heavily on the quality of the epidemiological
data, which are commonly derived from routine data collection systems, scientific literature,
and expert elicitation. The estimates provided by these data sources include an inherent level of
uncertainty, mainly due to sampling error, diagnostic uncertainty, and population
heterogeneity. To reflect this stochastic nature, epidemiological parameters are often
accompanied by a confidence or credibility interval, or represented as a probability distribution,
rather than being represented by a single point estimate. Monte Carlo simulations have been
suggested as the appropriate technique to incorporate this uncertainty in the final DALY result
(de Vocht et al., 2010), which can then be presented as a point estimate with a credibility
1 http://www.who.int/entity/healthinfo/bodreferencedalycalculationtemplate.xls
DALY Calculator Manual | version 1.3.0 Page 4/39
interval. This interval allows the assessment of the level of uncertainty in the total DALYs, and
facilitates a more reliable comparison of the health impact of different diseases.
To our knowledge, however, there are no standardized tools available for stochastic DALY
calculation. Therefore, we designed a Graphical User Interface (GUI) for calculating DALYs that
allows for the incorporation of input uncertainty and the computation of a DALY credibility
interval through Monte Carlo simulations. This program, the DALY Calculator, is designed to be
used by a variety of users, with different levels of statistical skills, to allow maximum flexibility,
and to promote consistency in the DALY uncertainty analysis.
The remainder of this manual is structured as follows. A description of how to obtain and install
the DALY Calculator is given in Chapter 2. The five basic steps to calculate DALYs with the DALY
Calculator are presented in Chapter 3. Using the table widgets of the DALY Calculator is
described in Chapter 4. Manipulating the DALY Calculator output in the R environment is
presented in Chapter 5. Sensitivity analysis features are presented in Chapter 6, scenario
analysis features in Chapter 7. The two built-in examples are introduced in Chapter 8. The
features to save and load input data are described in Chapter 9. Current limitations and
envisioned future improvements are listed in Chapter 10. Finally, an overview of the different
versions of the DALY Calculator is given in Chapter 11.
The computational details of the uncertainty analysis performed by the DALY Calculator are
outlined in Annex 1.
DALY Calculator Manual | version 1.3.0 Page 5/39
2. Installing and running the DALY Calculator
The DALY Calculator is developed in R, an open-source environment for statistical programming
and graphics (R Core Team, 2014). The use of the DALY Calculator requires the prior installation
of R, which can be freely downloaded from the Comprehensive R Archive Network (CRAN):
http://cran.r-project.org/
The installation procedure under Mac OS X is more complicated. Two additional tools need to
be installed:
The X Window System (X11): if this is properly installed, the file X11.app should appear
in the Utilities folder under Applications in the Finder. If not, you can install it from your
Mac OS X installation disc.
Tcl/Tk for X Windows: this can be installed by downloading and installing tcltk-8.5.5-
x11.dmg from http://cran.r-project.org/bin/macosx/tools/
Linux users may need to download and install the Tktable toolkit, which can be found through
http://packages.ubuntu.com/search?keywords=tk-table. Ubuntu/Debian users may download
and install the toolkit directly by issuing any of the following command from Terminal:
sudo apt-get install tk-table
sudo apt-get install libtktable2.10
The DALY package is available on the CRAN repository, and can be installed directly from the R
console, by calling:
install.packages("DALY")
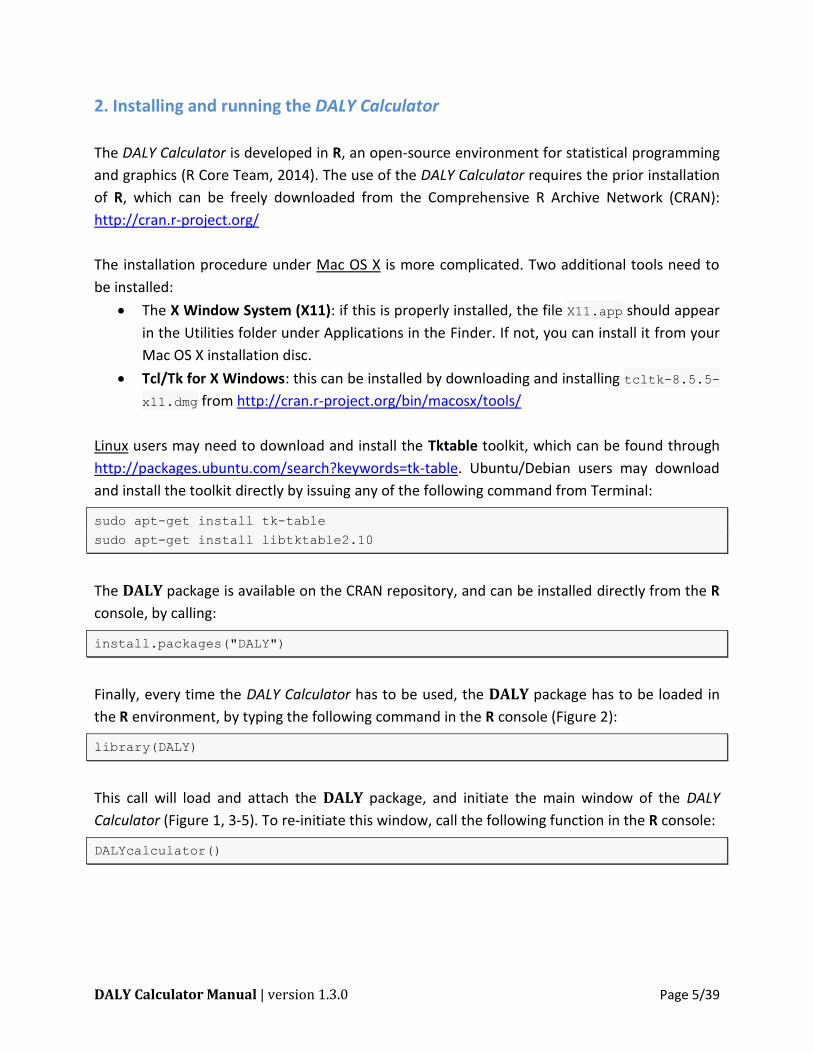
Finally, every time the DALY Calculator has to be used, the DALY package has to be loaded in
the R environment, by typing the following command in the R console (Figure 2):
library(DALY)
This call will load and attach the DALY package, and initiate the main window of the DALY
Calculator (Figure 1, 3-5). To re-initiate this window, call the following function in the R console:
DALYcalculator()
DALY Calculator Manual | version 1.3.0 Page 6/39
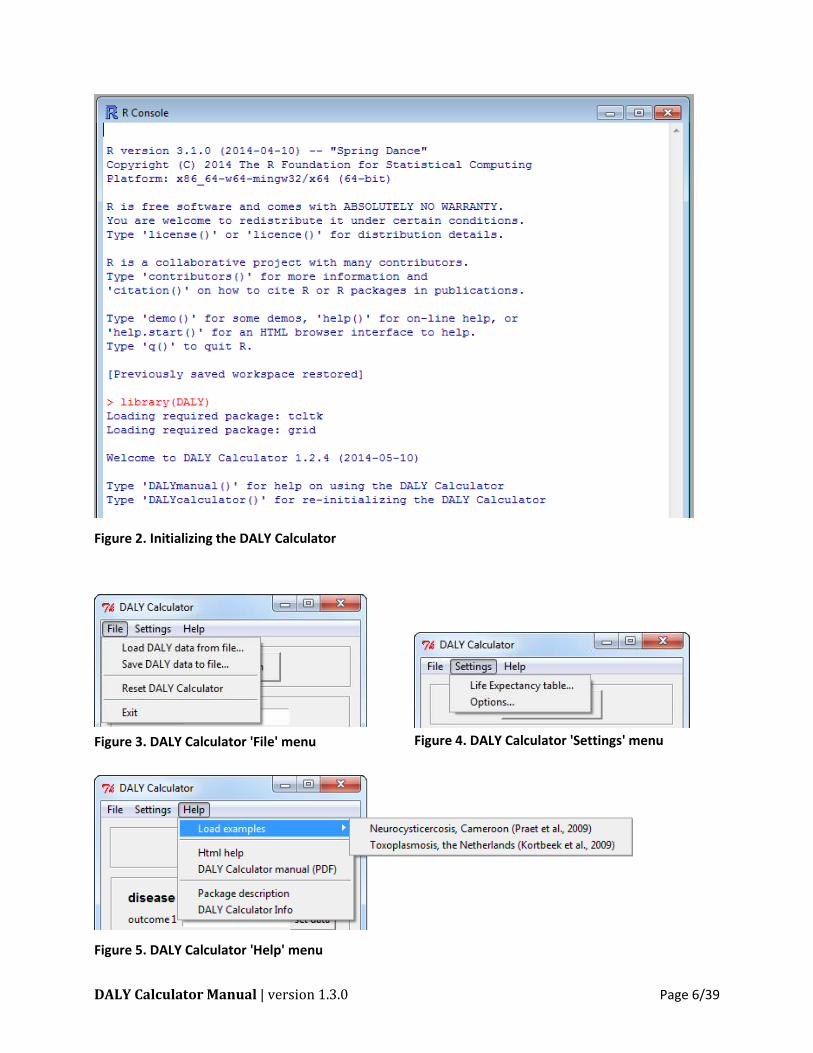
Figure 2. Initializing the DALY Calculator
Figure 3. DALY Calculator 'File' menu
Figure 4. DALY Calculator 'Settings' menu
Figure 5. DALY Calculator 'Help' menu
DALY Calculator Manual | version 1.3.0 Page 7/39
3. Getting started with the DALY Calculator
The DALY Calculator is designed to be used in an outcome-based as well as an agent-based
approach. Depending on the approach, YLDs, YLLs, DALYs and incident cases and deaths can be
computed for a combination of up to eight different disease categories of one outcome, or of up
to eight different outcomes of one agent.
According to the GBD studies, the incidence-based approach was favored over the prevalence-
based approach. The current version of the DALY Calculator is able to calculate DALYs for a basic
incidence-based disease model with well-defined incidence and/or mortality rates per disease
category or outcome.
The default age groups used by the DALY Calculator are the five age groups used by the GBD
1990 study: 0-4; 5-14; 15-44; 45-59; 60+ (Lopez and Murray, 1996). At least one combination of
sex and age group has to be set in order to proceed with the DALY calculation.
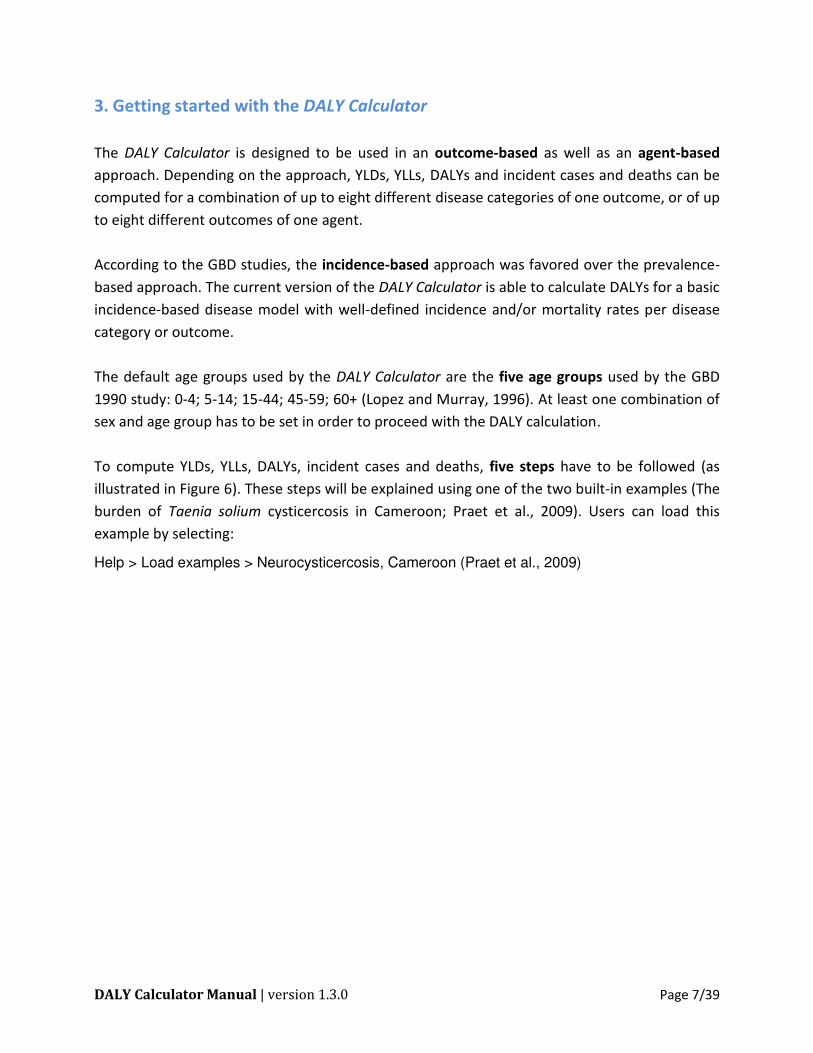
To compute YLDs, YLLs, DALYs, incident cases and deaths, five steps have to be followed (as
illustrated in Figure 6). These steps will be explained using one of the two built-in examples (The
burden of Taenia solium cysticercosis in Cameroon; Praet et al., 2009). Users can load this
example by selecting:
Help > Load examples > Neurocysticercosis, Cameroon (Praet et al., 2009)
DALY Calculator Manual | version 1.3.0 Page 8/39
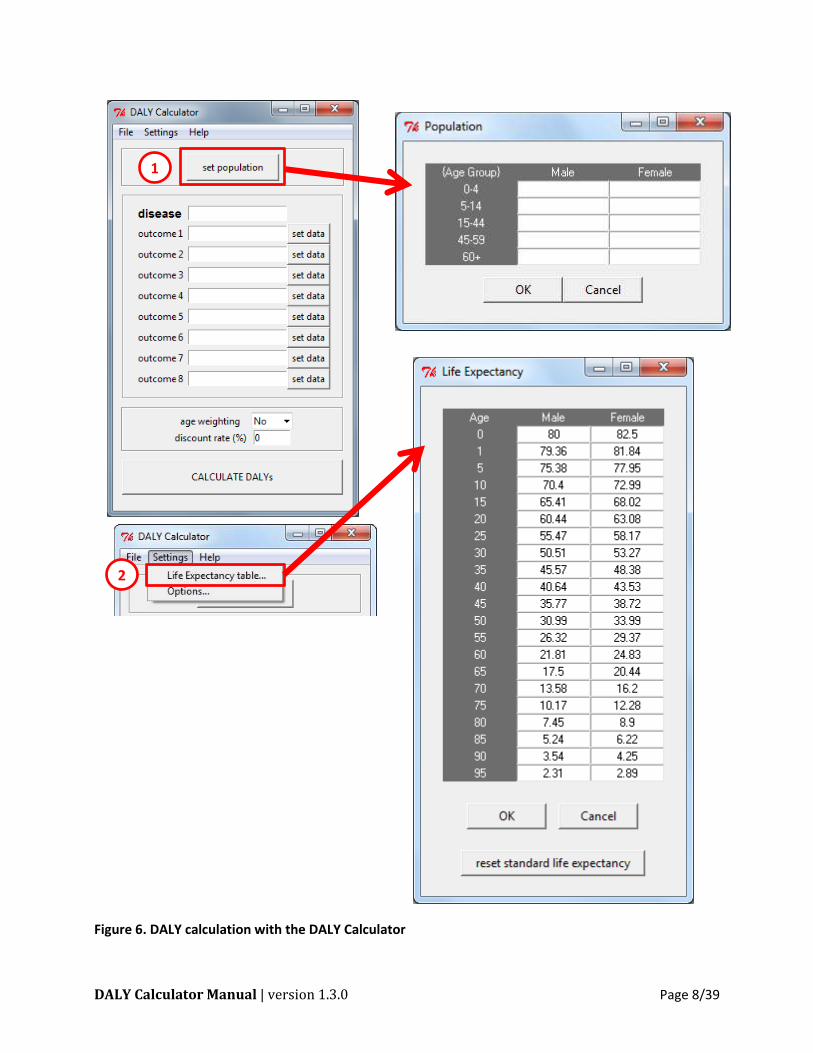
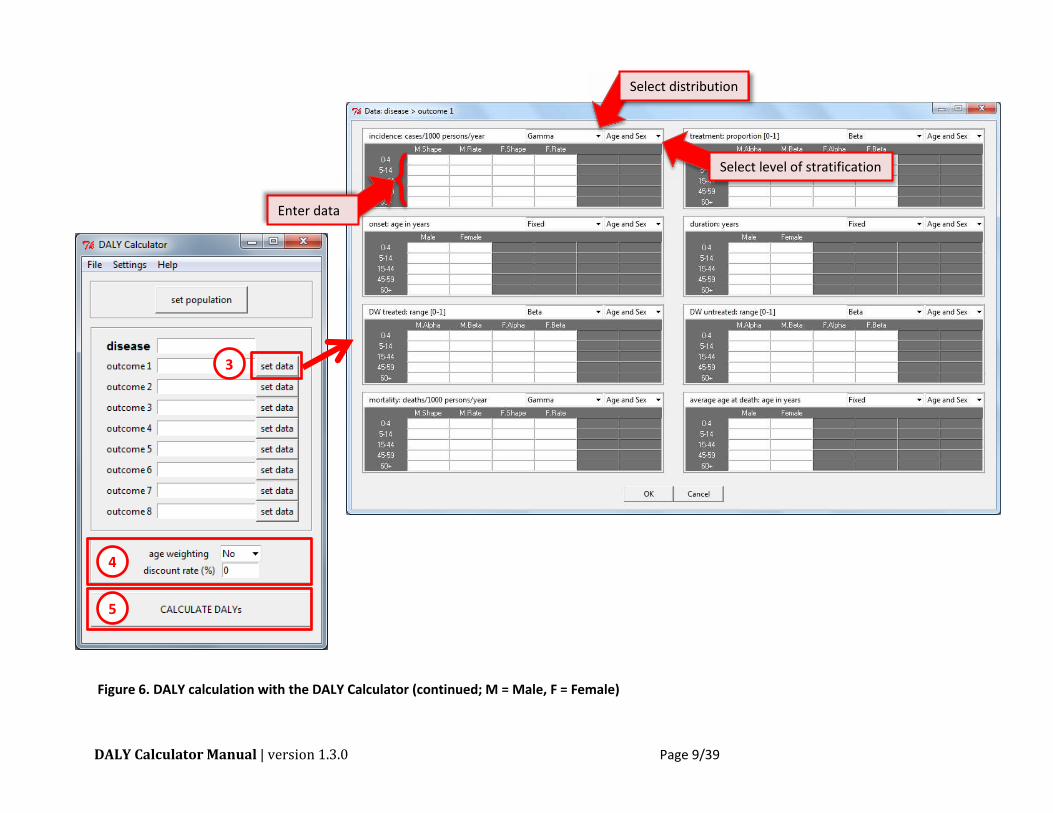
Figure 6. DALY calculation with the DALY Calculator
1
2
DALY Calculator Manual | version 1.3.0 Page 9/39
Figure 6. DALY calculation with the DALY Calculator (continued; M = Male, F = Female)
3
4
5
Enter data
Select distribution
Select level of stratification
DALY Calculator Manual | version 1.3.0 Page 10/39
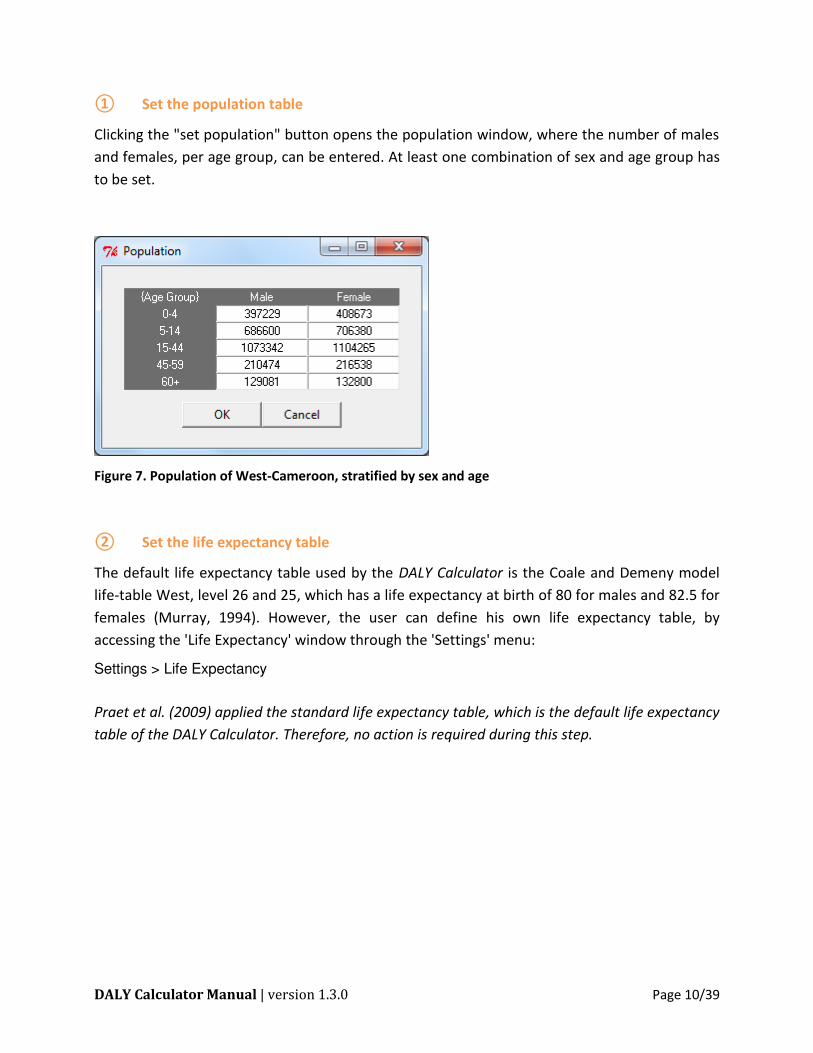
Set the population table
Clicking the "set population" button opens the population window, where the number of males
and females, per age group, can be entered. At least one combination of sex and age group has
to be set.
Figure 7. Population of West-Cameroon, stratified by sex and age
Set the life expectancy table
The default life expectancy table used by the DALY Calculator is the Coale and Demeny model
life-table West, level 26 and 25, which has a life expectancy at birth of 80 for males and 82.5 for
females (Murray, 1994). However, the user can define his own life expectancy table, by
accessing the 'Life Expectancy' window through the 'Settings' menu:
Settings > Life Expectancy
Praet et al. (2009) applied the standard life expectancy table, which is the default life expectancy
table of the DALY Calculator. Therefore, no action is required during this step.
DALY Calculator Manual | version 1.3.0 Page 11/39
Set the input parameters, per disease category or outcome
After entering the disease and outcome names, the epidemiological data and disability weights
can be entered by clicking the "set data" button. For every parameter, the user can specify the
distribution by selecting one of following:
Beta-Pert (mode; min; max)
Beta (alpha; beta)
Gamma (shape; rate)
Normal (mu; sigma)
Lognormal-geometric (logmean; logsigma)
Lognormal-arithmetic (mean; sigma)
Uniform (min; max)
Fixed
Next, the user has to select the specific level of stratification for every parameter. The following
four stratification levels are available:
Age and Sex (i.e., full stratification)
Age (i.e., data is stratified by age group, but not by sex)
Sex (i.e., data is stratified by sex, but not by age group)
None (i.e., no stratification, data applies to total population)
For calculating the YLDs and incident cases, the following tables have to be completed:
Incidence: number of new cases per 1,000 persons per year
Treatment: proportion of patients receiving proper treatment; range [0-1]
Onset of the disease: age of onset in years
Duration of the disease: duration in years
Disability Weight for treated cases: range [0-1]
Disability Weight for non-treated cases: range [0-1]
For calculating the YLLs and deaths, the following tables have to be completed:
Mortality: number of deaths per 1,000 persons per year
Average age at death: age at death in years; based on these values, the DALY Calculator
will compute the corresponding life expectancies according to the Life Expectancy table.
By default, the distributions of incidence and mortality will be set to "Gamma", those of the
proportion treated and the disability weights to "Beta", and those of onset, duration and
average age at death to "Fixed"; the level of stratification for all parameters is set to full
stratification (i.e., "Age and Sex").
DALY Calculator Manual | version 1.3.0 Page 12/39
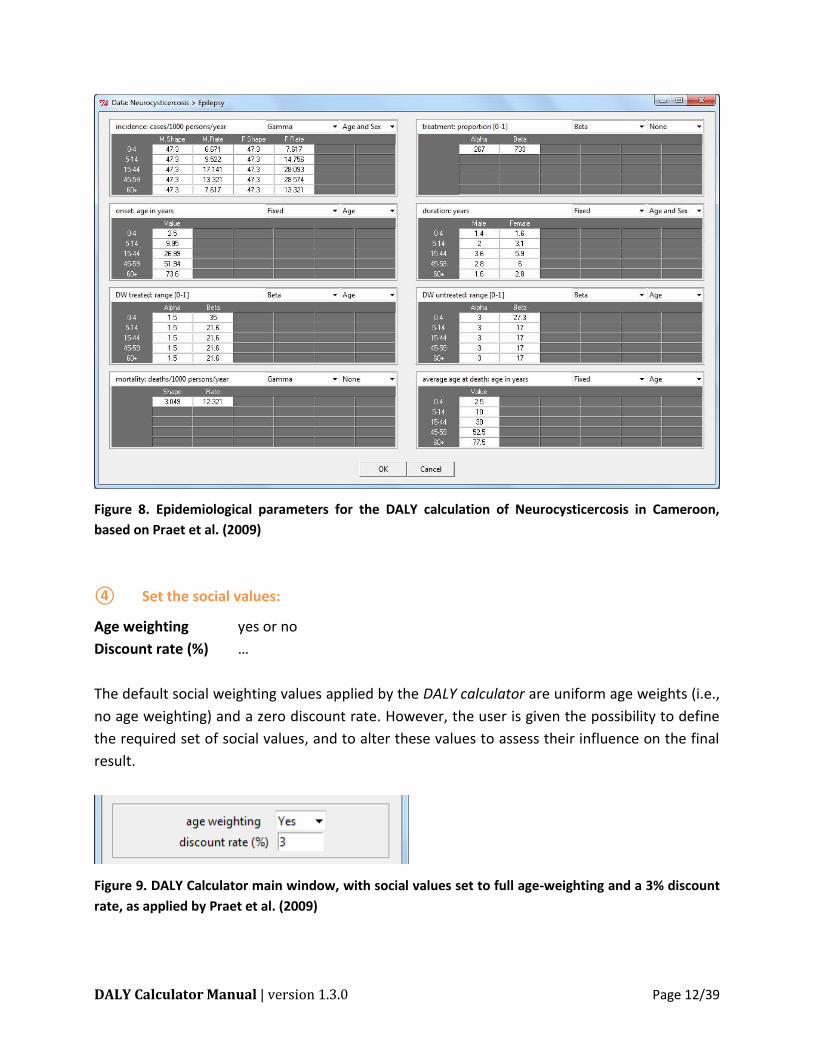
Figure 8. Epidemiological parameters for the DALY calculation of Neurocysticercosis in Cameroon,
based on Praet et al. (2009)
Set the social values:
Age weighting yes or no
Discount rate (%) …
The default social weighting values applied by the DALY calculator are uniform age weights (i.e.,
no age weighting) and a zero discount rate. However, the user is given the possibility to define
the required set of social values, and to alter these values to assess their influence on the final
result.
Figure 9. DALY Calculator main window, with social values set to full age-weighting and a 3% discount
rate, as applied by Praet et al. (2009)
DALY Calculator Manual | version 1.3.0 Page 13/39
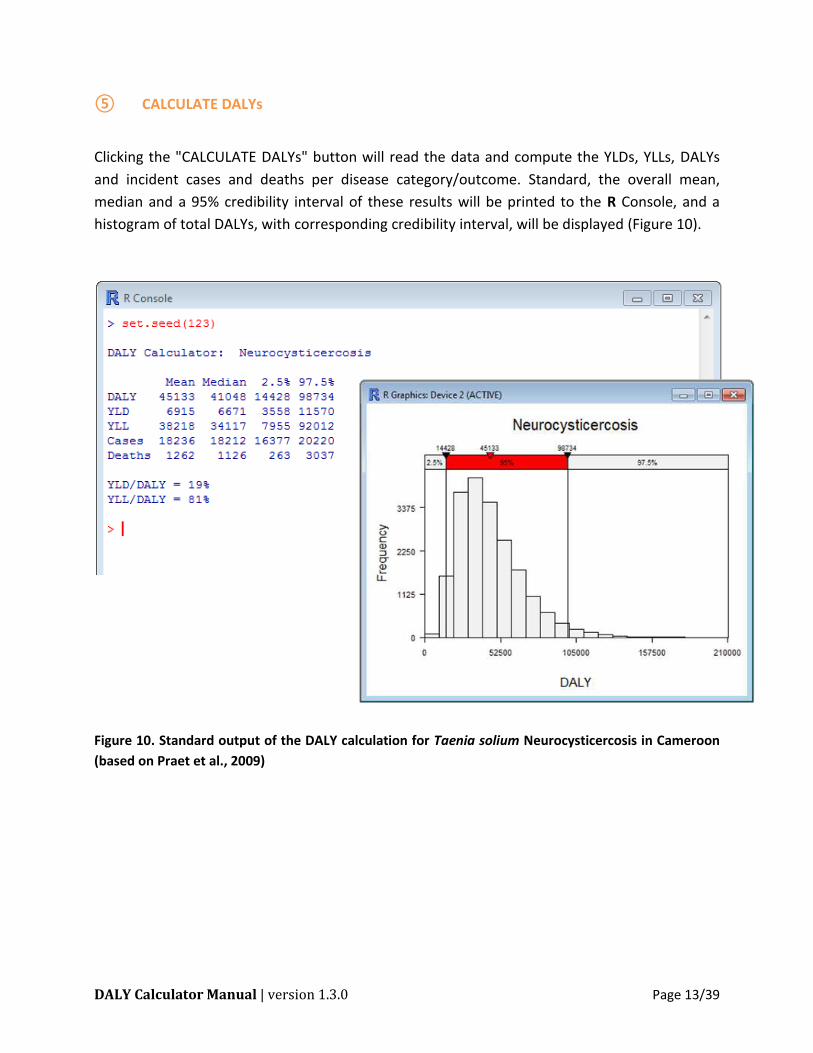
CALCULATE DALYs
Clicking the "CALCULATE DALYs" button will read the data and compute the YLDs, YLLs, DALYs
and incident cases and deaths per disease category/outcome. Standard, the overall mean,
median and a 95% credibility interval of these results will be printed to the R Console, and a
histogram of total DALYs, with corresponding credibility interval, will be displayed (Figure 10).
Figure 10. Standard output of the DALY calculation for Taenia solium Neurocysticercosis in Cameroon
(based on Praet et al., 2009)
DALY Calculator Manual | version 1.3.0 Page 14/39
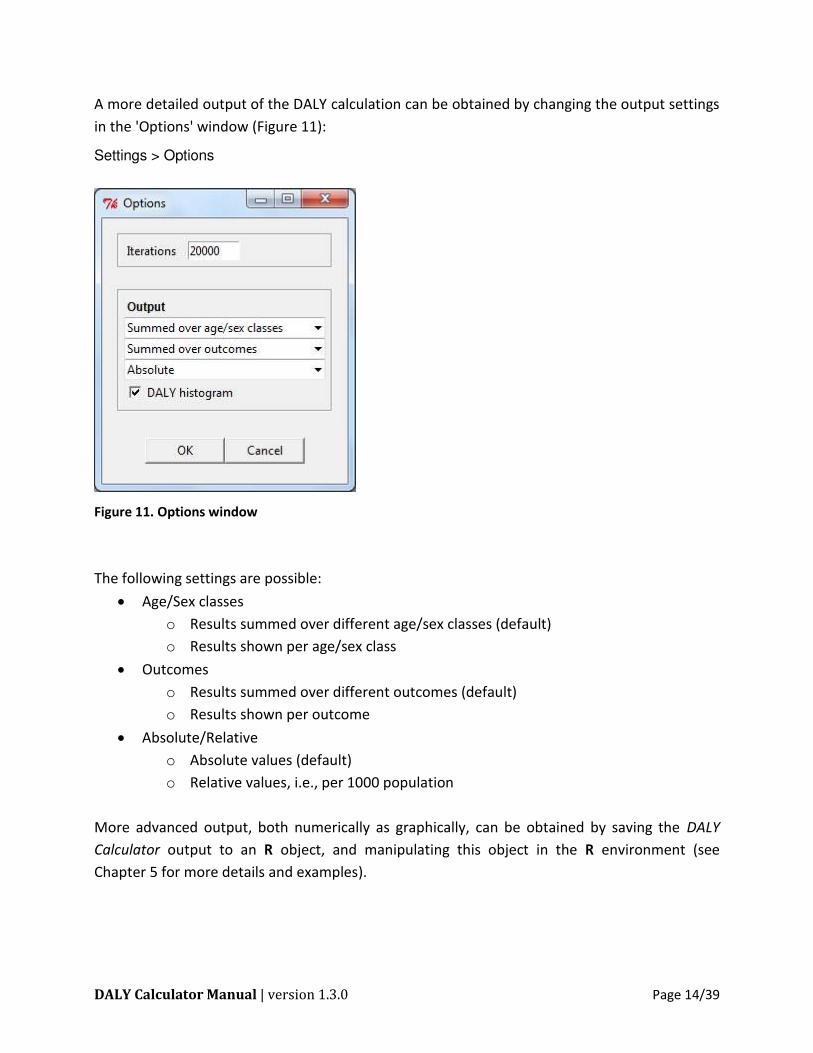
A more detailed output of the DALY calculation can be obtained by changing the output settings
in the 'Options' window (Figure 11):
Settings > Options
Figure 11. Options window
The following settings are possible:
Age/Sex classes
o Results summed over different age/sex classes (default)
o Results shown per age/sex class
Outcomes
o Results summed over different outcomes (default)
o Results shown per outcome
Absolute/Relative
o Absolute values (default)
o Relative values, i.e., per 1000 population
More advanced output, both numerically as graphically, can be obtained by saving the DALY
Calculator output to an R object, and manipulating this object in the R environment (see
Chapter 5 for more details and examples).
DALY Calculator Manual | version 1.3.0 Page 15/39
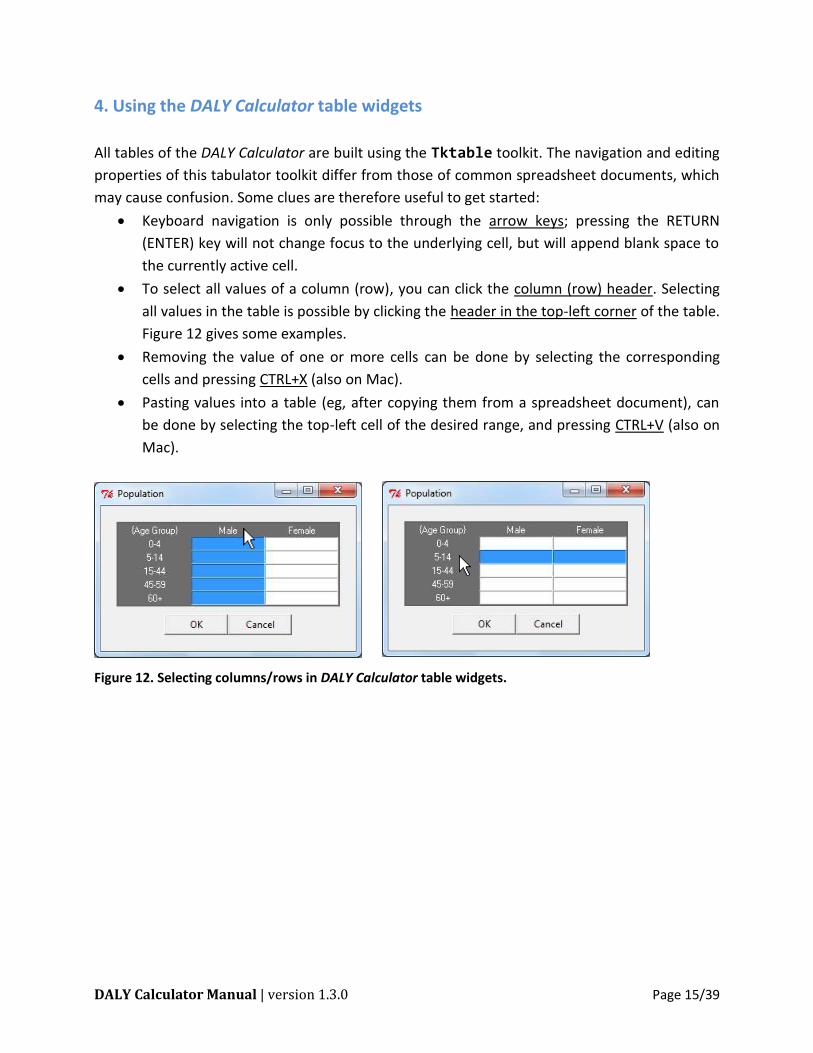
4. Using the DALY Calculator table widgets
All tables of the DALY Calculator are built using the Tktable toolkit. The navigation and editing
properties of this tabulator toolkit differ from those of common spreadsheet documents, which
may cause confusion. Some clues are therefore useful to get started:
Keyboard navigation is only possible through the arrow keys; pressing the RETURN
(ENTER) key will not change focus to the underlying cell, but will append blank space to
the currently active cell.
To select all values of a column (row), you can click the column (row) header. Selecting
all values in the table is possible by clicking the header in the top-left corner of the table.
Figure 12 gives some examples.
Removing the value of one or more cells can be done by selecting the corresponding
cells and pressing CTRL+X (also on Mac).
Pasting values into a table (eg, after copying them from a spreadsheet document), can
be done by selecting the top-left cell of the desired range, and pressing CTRL+V (also on
Mac).
Figure 12. Selecting columns/rows in DALY Calculator table widgets.
DALY Calculator Manual | version 1.3.0 Page 16/39
5. Handling DALY Calculator output in the R environment
Instead of clicking the "CALCULATE DALYs" button in the DALY Calculator main window, the
DALY calculation process may also be invoked by calling the getDALY() function from the R
console. This function initiates the Monte Carlo simulation process, and returns the simulated
DALYs, YLDs, YLLs and incident cases and deaths. Of course, this will only take place if the data
have been entered, as outlined before.
The getDALY() function takes two arguments, aw and dr , that specify the age weighting
constant and time discount rate, respectively. If these values are not specified, they will be
taken from the GUI (see Figure 9).
The results of the DALY calculation process can be stored in an object, say x , as follows:
x <- getDALY()
Since aw and dr were not specified, these values were taken from the GUI. If one wishes to
specify the social weighting values directly from the command-line, the values from the GUI will
be over-ruled. For instance, one could specify to use no age weighting and a 3% time discount
rate as follows:
x <- getDALY(aw = FALSE, dr = 0.03)
5.1. Structure of the object returned by getDALY()
The getDALY() function returns an object of class 'DALY' , which inherits from class 'list' .
The returned object is a list containing the following elements:
i For each outcome i, an unnamed list containing simulated DALYs, YLDs, YLLs and
incident cases and deaths, per age/sex class;
pop A matrix containing the population data;
name The name of the disease.
Each list of simulated results for a certain outcome i contains the following six elements:
DALY 3-dimensional array of simulated DALYs;
YLD 3-dimensional array of simulated YLDs;
DALY Calculator Manual | version 1.3.0 Page 17/39
YLL 3-dimensional array of simulated YLLs;
cases 3-dimensional array of simulated incident cases;
deaths 3-dimensional array of simulated deaths;
name The name of the outcome;
input A list containing the simulated samples (arranged in 3-dimensional arrays) from
all input distributions.
The three dimensions of DALY , YLD , YLL , cases , deaths and the input elements, are,
respectively, iteration, age group, and sex.
The input element is a list of eight arrays, named as follows:
inc incidence rate;
trt proportion treated;
ons age at disease onset;
dur disease duration;
DWt disability weight for treated cases;
DWn disability weight for non-treated cases;
mrt mortality rate;
dth age at death.
To view the structure of the returned object, one may call the following command:
str(x)
5.2. Methods for objects of class 'DALY'
Six methods have been made available for the objects of class 'DALY' :
print() print results, summed over age/sex classes;
summary() print results, per age/sex class;
aggregate() aggregate simulations by outcome, age/sex, or both;
hist() histogram of total DALYs, YLDs, YLLs, cases or deaths;
plot() plot a stacked barplot of YLLs/YLDs with a DALY error bar;
scatterplot() generate a scatterplot of population versus patient level burden.
DALY Calculator Manual | version 1.3.0 Page 18/39
In both the print() and summary() methods, the user can specify whether or not to print the
results per outcome (argument outcome ), and whether or not to print the results relative to
the population (i.e., per 1000 population; argument relative ). By default, outcome and
relative are set to FALSE .
The argument digits of both the print() and summary() methods controls the number of
decimal digits to be printed. By default, digits equals zero. The argument prob of the
print() method sets the range of the printed credibility interval. By default, prob equals
0.95.
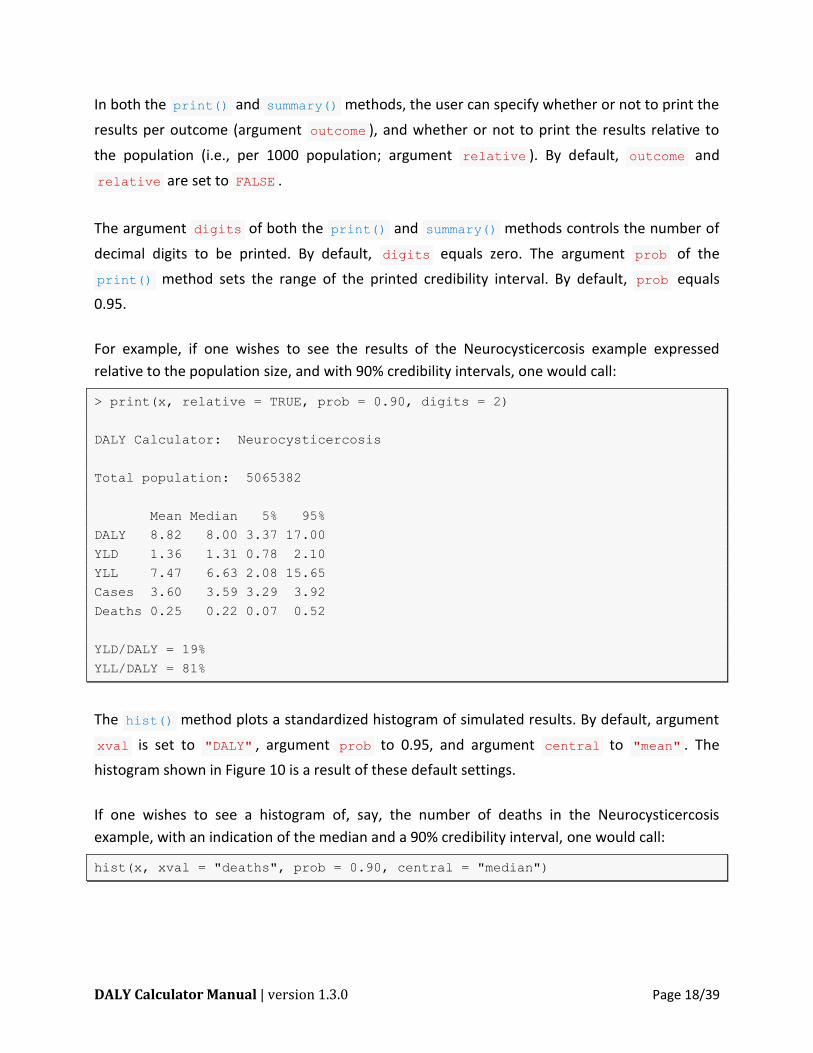
For example, if one wishes to see the results of the Neurocysticercosis example expressed
relative to the population size, and with 90% credibility intervals, one would call:
> print(x, relative = TRUE, prob = 0.90, digits = 2)
DALY Calculator: Neurocysticercosis
Total population: 5065382
Mean Median 5% 95%
DALY 8.82 8.00 3.37 17.00
YLD 1.36 1.31 0.78 2.10
YLL 7.47 6.63 2.08 15.65
Cases 3.60 3.59 3.29 3.92
Deaths 0.25 0.22 0.07 0.52
YLD/DALY = 19%
YLL/DALY = 81%
The hist() method plots a standardized histogram of simulated results. By default, argument
xval is set to "DALY" , argument prob to 0.95, and argument central to "mean" . The
histogram shown in Figure 10 is a result of these default settings.
If one wishes to see a histogram of, say, the number of deaths in the Neurocysticercosis
example, with an indication of the median and a 90% credibility interval, one would call:
hist(x, xval = "deaths", prob = 0.90, central = "median")
DALY Calculator Manual | version 1.3.0 Page 19/39
For more info on the available methods for class 'DALY' , please visit the R help pages for the
corresponding methods. To access the R help page for, say, print.DALY() , call ?print.DALY .
5.3. Handling objects of class 'DALY'
The strength of the implementation of the DALY Calculator is that its results can be directly
manipulated from within the R environment. This allows users to obtain virtually any possible
numerical or graphical output they desire. Of course, this also requires a more advanced
knowledge of the R programming language. Some examples might therefore be useful.
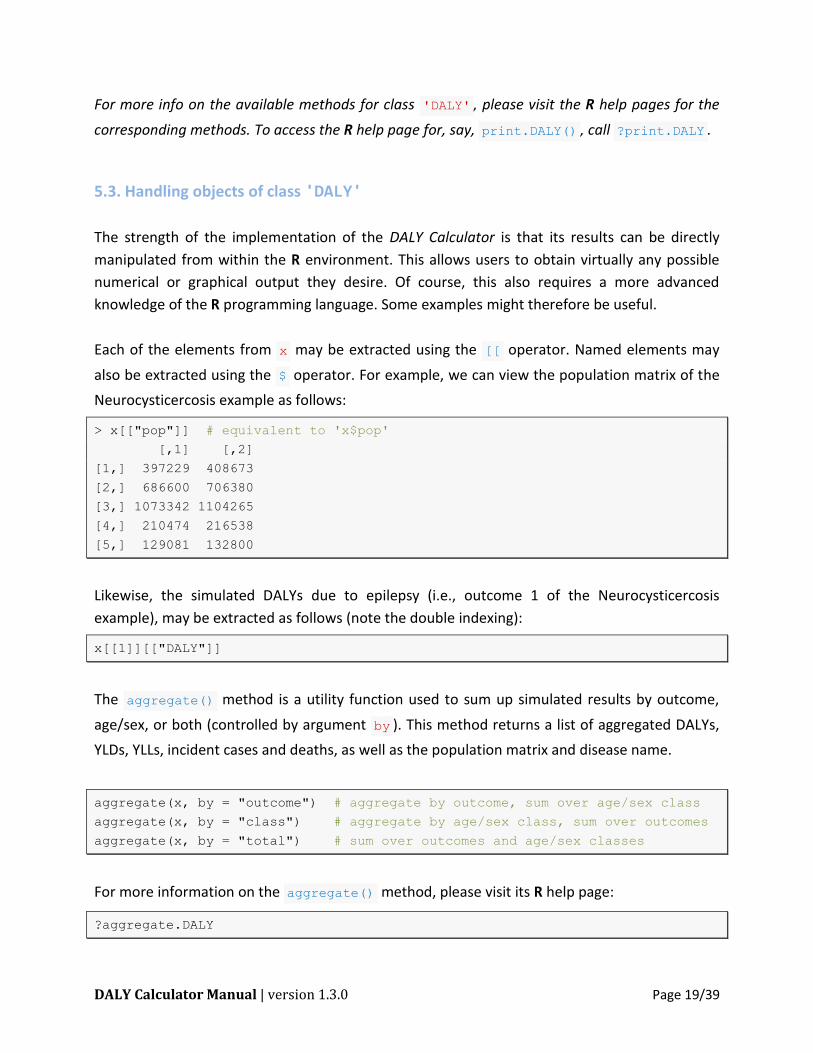
Each of the elements from x may be extracted using the [[ operator. Named elements may
also be extracted using the $ operator. For example, we can view the population matrix of the
Neurocysticercosis example as follows:
> x[["pop"]] # equivalent to 'x$pop'
[,1] [,2]
[1,] 397229 408673
[2,] 686600 706380
[3,] 1073342 1104265
[4,] 210474 216538
[5,] 129081 132800
Likewise, the simulated DALYs due to epilepsy (i.e., outcome 1 of the Neurocysticercosis
example), may be extracted as follows (note the double indexing):
x[[1]][["DALY"]]
The aggregate() method is a utility function used to sum up simulated results by outcome,
age/sex, or both (controlled by argument by ). This method returns a list of aggregated DALYs,
YLDs, YLLs, incident cases and deaths, as well as the population matrix and disease name.
aggregate(x, by = "outcome") # aggregate by outcome, sum over age/sex class
aggregate(x, by = "class") # aggregate by age/sex class, sum over outcomes
aggregate(x, by = "total") # sum over outcomes and age/sex classes
For more information on the aggregate() method, please visit its R help page:
?aggregate.DALY
DALY Calculator Manual | version 1.3.0 Page 20/39
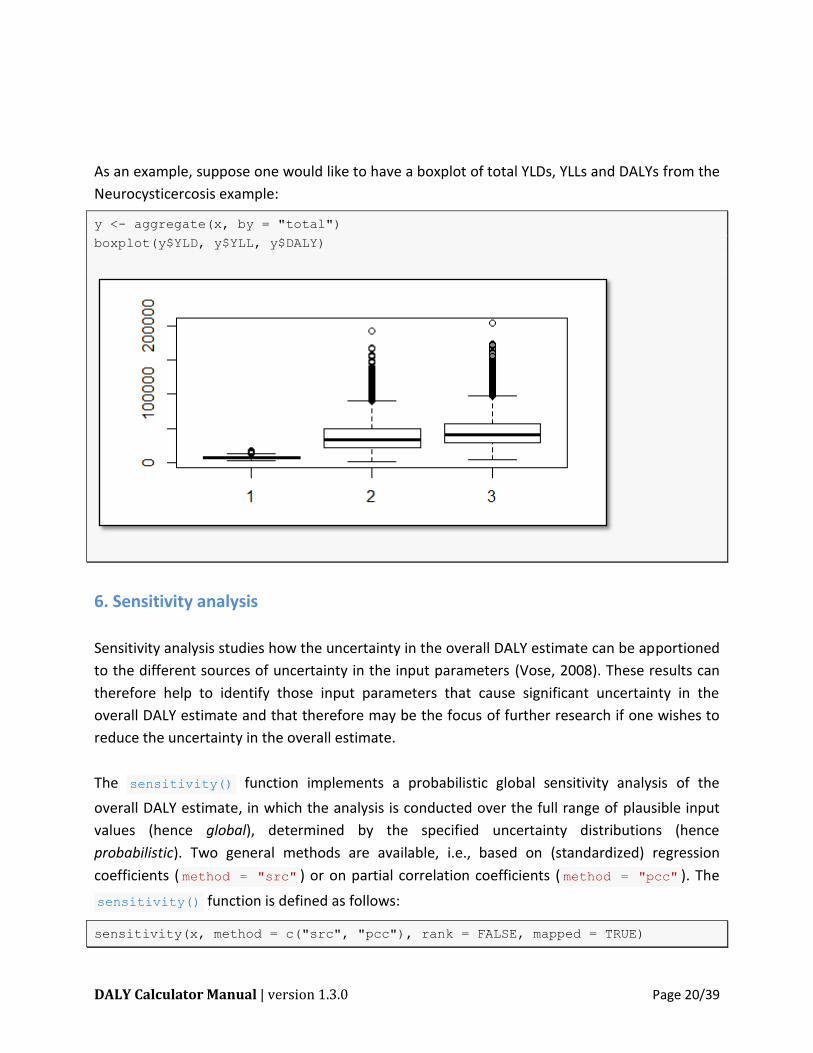
As an example, suppose one would like to have a boxplot of total YLDs, YLLs and DALYs from the
Neurocysticercosis example:
y <- aggregate(x, by = "total")
boxplot(y$YLD, y$YLL, y$DALY)
6. Sensitivity analysis
Sensitivity analysis studies how the uncertainty in the overall DALY estimate can be apportioned
to the different sources of uncertainty in the input parameters (Vose, 2008). These results can
therefore help to identify those input parameters that cause significant uncertainty in the
overall DALY estimate and that therefore may be the focus of further research if one wishes to
reduce the uncertainty in the overall estimate.
The sensitivity() function implements a probabilistic global sensitivity analysis of the
overall DALY estimate, in which the analysis is conducted over the full range of plausible input
values (hence global), determined by the specified uncertainty distributions (hence
probabilistic). Two general methods are available, i.e., based on (standardized) regression
coefficients ( method = "src" ) or on partial correlation coefficients ( method = "pcc" ). The
sensitivity() function is defined as follows:
sensitivity(x, method = c("src", "pcc"), rank = FALSE, mapped = TRUE)
DALY Calculator Manual | version 1.3.0 Page 21/39
Specifying method = "src" will perform a linear regression-based sensitivity analysis. Here,
the simulated overall DALY estimates will be regressed against the simulated values for the
stochastic input parameters (using lm() ). To facilitate comparison, the independent terms are
standardized such that they are normally distributed with mean zero and standard deviation
one (using scale() ). The resulting regression coefficients are therefore referred to as
standardized regression coefficients.
Argument rank specifies whether the regression should be performed on the actual
values ( rank = FALSE ; default) or on the ranked values ( rank = TRUE ). Rank-based
regression may be preferred when the relation between output and inputs is non-linear. R^2
values smaller than 0.60 may be indicative of a poor fit of the default linear regression model.
If mapped = TRUE , the dependent term is not standardized, such that the resulting
mapped regression coefficients correspond to the change in overall DALY given one standard
deviation change in the corresponding input parameter. If mapped = FALSE , the dependent
term is standardized, such that the resulting standardized regression coefficients correspond to
the number of standard deviations change in overall DALY given one standard deviation change
in the corresponding input parameter.
Specifying method = "pcc" will calculate partial correlation coefficients for each of the input
variables. Partial correlation coefficients represent the correlation between two variables when
adjusting for other variables. In the presence of important interactions between input variables,
partial correlation coefficients may be preferred over standardized regression coefficients.
Argument rank specifies whether the correlation should be calculated between the
actual values ( rank = FALSE ; default) or between the ranked values ( rank = TRUE ).
The sensitivity() function returns an object of class 'DALY_sensitivity' . Both a
print() and plot() method are available for this class, the latter generating a tornado plot
of the regression or partial correlation coefficients.
DALY Calculator Manual | version 1.3.0 Page 22/39
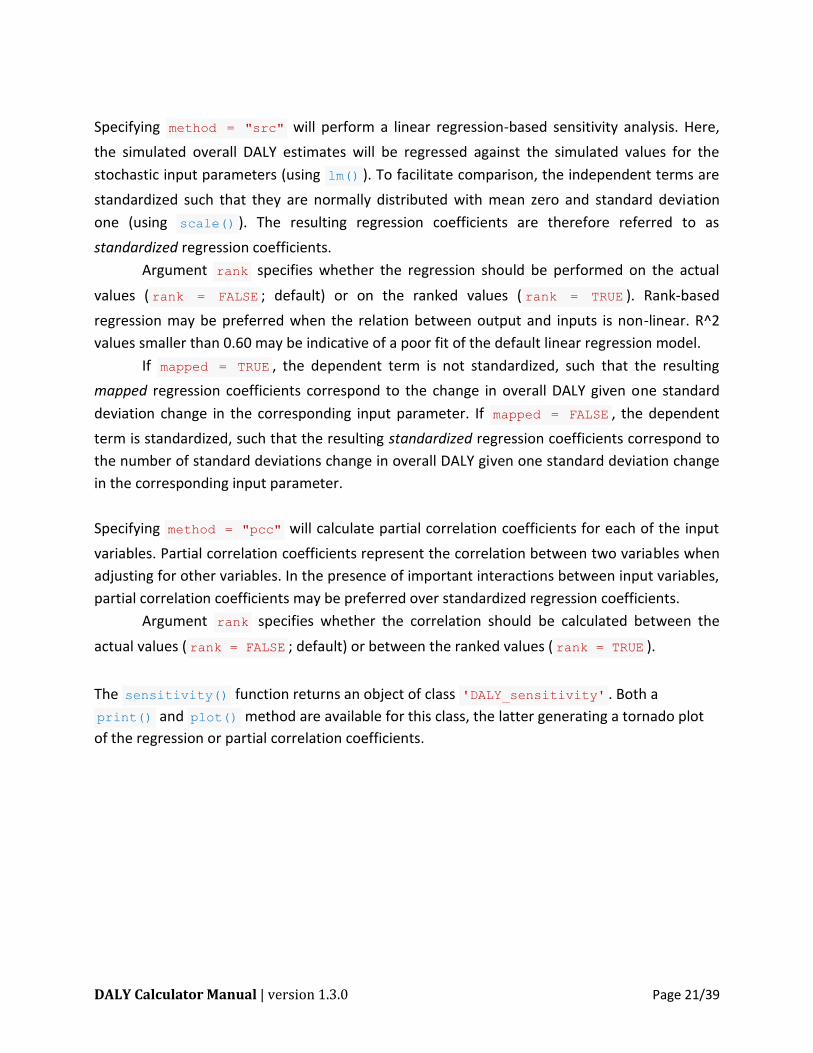
For example, a sensitivity analysis of the Neurocysticercosis model, based on mapped regression
coefficients, could be performed as follows:
set.seed(123)
x <- getDALY(aw = TRUE, dr = 0.03)
sa <- sensitivity(x, method = "src", mapped = TRUE)
## show results of sensitivity analysis
print(sa)
Mapped standardized regression coefficients:
Estimate Std. Error t value Pr(>|t|)
mrt1 21902.003 8.015 2732.596 0 ***
DWn1.3 1736.451 8.014 216.674 0 ***
DWn1.2 891.846 8.015 111.273 0 ***
DWt1.3 398.369 8.016 49.699 0 ***
inc1.F.3 288.485 8.015 35.995 5.76e-275 ***
inc1.M.3 275.811 8.016 34.409 4.09e-252 ***
DWn1.4 259.261 8.016 32.342 1.02e-223 ***
DWt1.2 201.790 8.015 25.177 9.97e-138 ***
DWn1.1 159.864 8.013 19.950 1.07e-87 ***
inc1.M.2 149.588 8.014 18.665 4.29e-77 ***
inc1.F.2 144.769 8.014 18.064 2.29e-72 ***
DWn1.5 100.915 8.014 12.593 3.17e-36 ***
trt1 -72.530 8.013 -9.051 1.54e-19 ***
DWt1.4 52.205 8.014 6.514 7.47e-11 ***
inc1.M.4 37.124 8.015 4.632 3.65e-06 ***
DWt1.1 35.729 8.014 4.458 8.31e-06 ***
inc1.F.4 33.616 8.015 4.194 2.75e-05 ***
inc1.F.1 21.062 8.014 2.628 0.00859 **
inc1.M.1 19.798 8.014 2.470 0.0135 *
inc1.M.5 14.351 8.015 1.790 0.0734 .
DWt1.5 5.076 8.016 0.633 0.527
inc1.F.5 4.559 8.014 0.569 0.569
---
Signif. codes: 0 ‘***’ 0.001 ‘**’ 0.01 ‘*’ 0.05 ‘.’ 0.1 ‘ ’ 1
Adjusted R-squared: 0.997
DALY Calculator Manual | version 1.3.0 Page 23/39
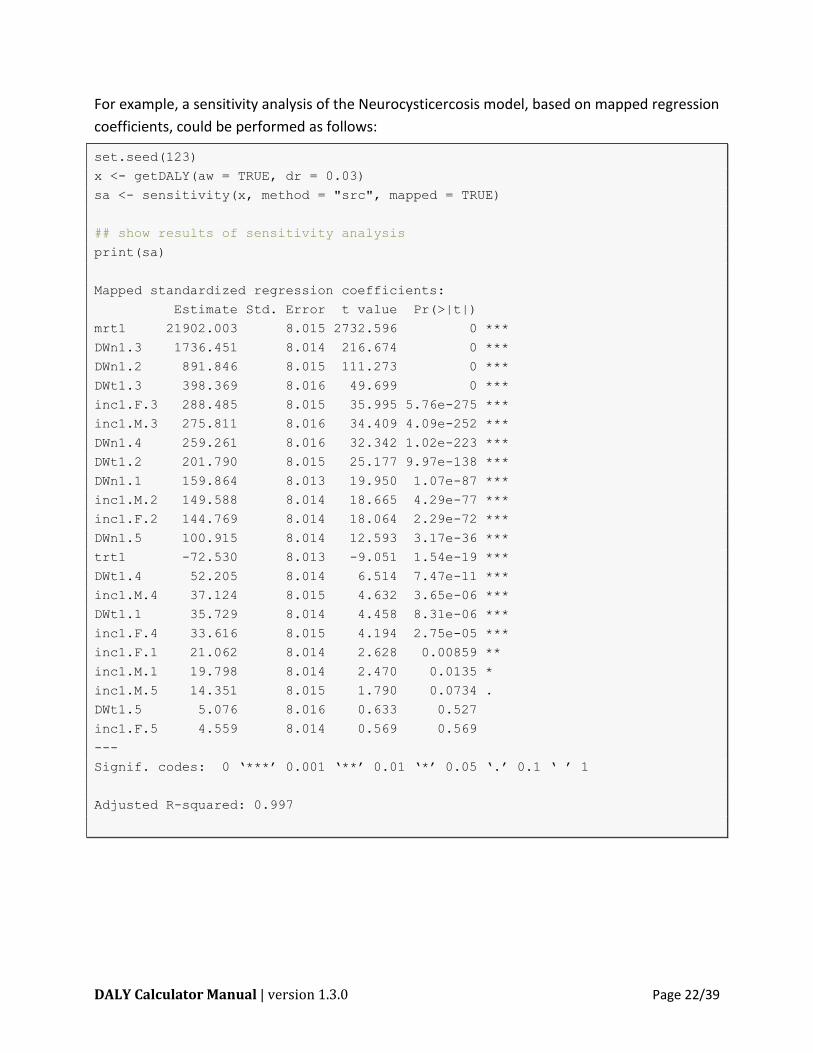
## plot tornado graph
plot(sa)
From the above results, we learn that the uncertainty in mortality rate has the highest influence
on the overall uncertainty. Indeed, one standard deviation change in mortality rate would lead
to a difference of more than 20,000 DALYs in the overall DALY estimate.
Further note that the names of the different input parameters are constructed as a combination
of the input element (see 5.1), the sex (in case of sex stratification), and the age group (in case
of age stratification).
DALY Calculator Manual | version 1.3.0 Page 24/39
7. Scenario analysis
To assess the impact of methodological choices, such as the application of age weighting or the
choice of the discount rate, different scenarios can be run and the results compared. Likewise,
scenario analyses can be performed to assess model uncertainty.
The DALY_list() function combines multiple 'DALY' objects into an object of class
'DALY_list' . Methods exist to print the different scenario results and for producing
comparative stacked barplots and scatterplots.
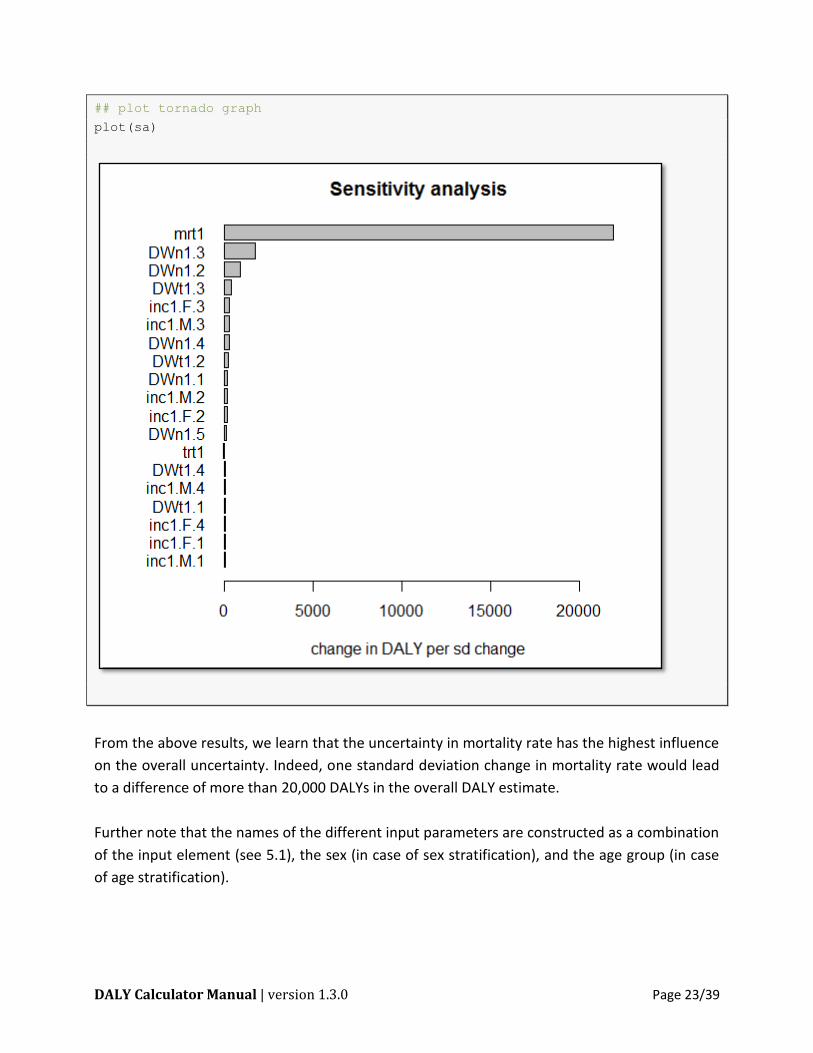
As an example, we will calculate DALYs for the neurocysticercosis example based on three
different social weighting scenarios, i.e., no age weighting or time discounting (DALY[0,0]), no
age weighting but 3% time discounting (DALY[0,0.03]), and age weighting and 3% time
discounting (DALY[1,0.03]).
## load NCC example
setDALYexample(1)
## calculate DALYs under different scenarios
ncc_00 <- getDALY(aw = FALSE, dr = 0)
ncc_03 <- getDALY(aw = FALSE, dr = 0.03)
ncc_13 <- getDALY(aw = TRUE, dr = 0.03)
## save results as 'DALY_list'
ncc <- DALY_list(ncc_00, ncc_03, ncc_13)
## barplot of different scenarios
plot(ncc, names = c("DALY[0,0]", "DALY[0,0.03]", "DALY[1,0.03]"))
DALY Calculator Manual | version 1.3.0 Page 25/39
8. Built-in examples
To demonstrate the calculation process of the DALY Calculator, two DALY calculation examples
are derived from the foodborne disease literature, and are built-in to the DALY Calculator:
"The burden of Taenia solium cysticercosis in Cameroon" (Praet et al., 2009); and
"Congenital toxoplasmosis and DALYs in the Netherlands" (Kortbeek et al., 2009).
These examples can be loaded by accessing the 'Help' menu, selecting 'Load examples', and
selecting the required examples (Figure 2.3):
Help > Load examples > Neurocysticercosis, Cameroon (Praet et al., 2009)
Help > Load examples > Toxoplasmosis, the Netherlands (Kortbeek et al., 2009)
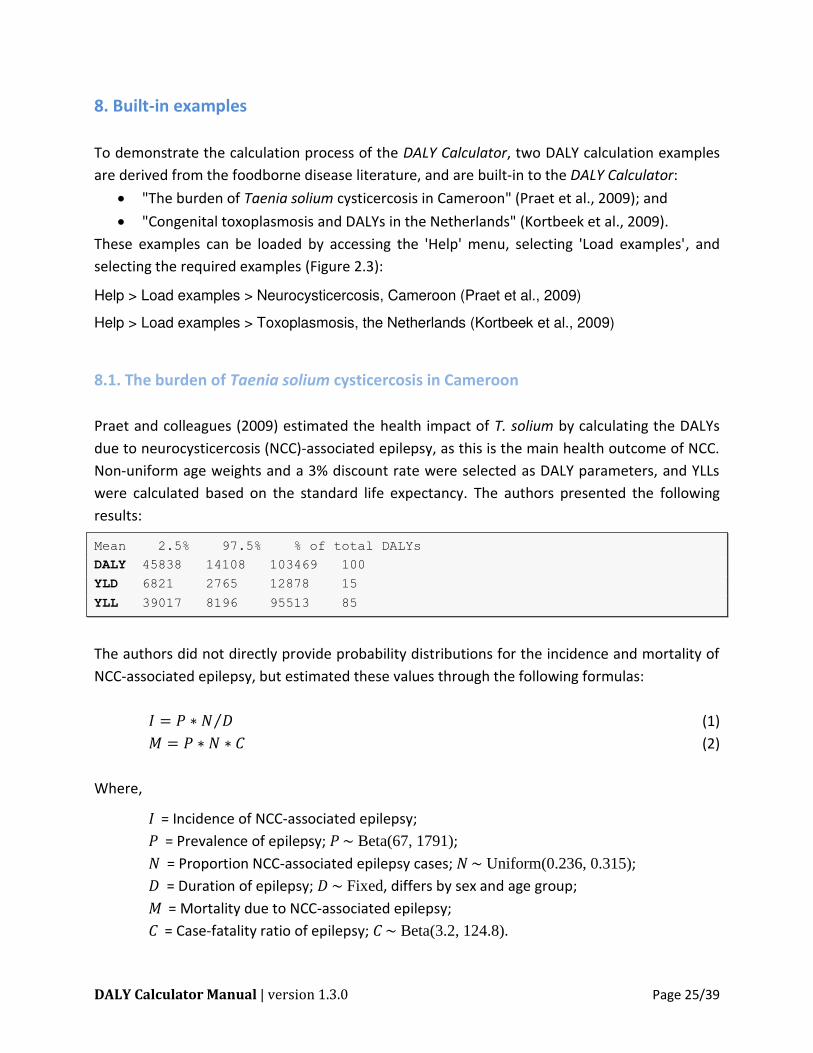
8.1. The burden of Taenia solium cysticercosis in Cameroon
Praet and colleagues (2009) estimated the health impact of T. solium by calculating the DALYs
due to neurocysticercosis (NCC)-associated epilepsy, as this is the main health outcome of NCC.
Non-uniform age weights and a 3% discount rate were selected as DALY parameters, and YLLs
were calculated based on the standard life expectancy. The authors presented the following
results:
Mean 2.5% 97.5% % of total DALYs
DALY 45838 14108 103469 100
YLD 6821 2765 12878 15
YLL 39017 8196 95513 85
The authors did not directly provide probability distributions for the incidence and mortality of
NCC-associated epilepsy, but estimated these values through the following formulas:
⁄ (1) (2)
Where,
I = Incidence of NCC-associated epilepsy;
P = Prevalence of epilepsy; P Beta(67, 1791);
N = Proportion NCC-associated epilepsy cases; N Uniform(0.236, 0.315);
D = Duration of epilepsy; D Fixed, differs by sex and age group;
M = Mortality due to NCC-associated epilepsy;
C = Case-fatality ratio of epilepsy; C Beta(3.2, 124.8).
DALY Calculator Manual | version 1.3.0 Page 26/39
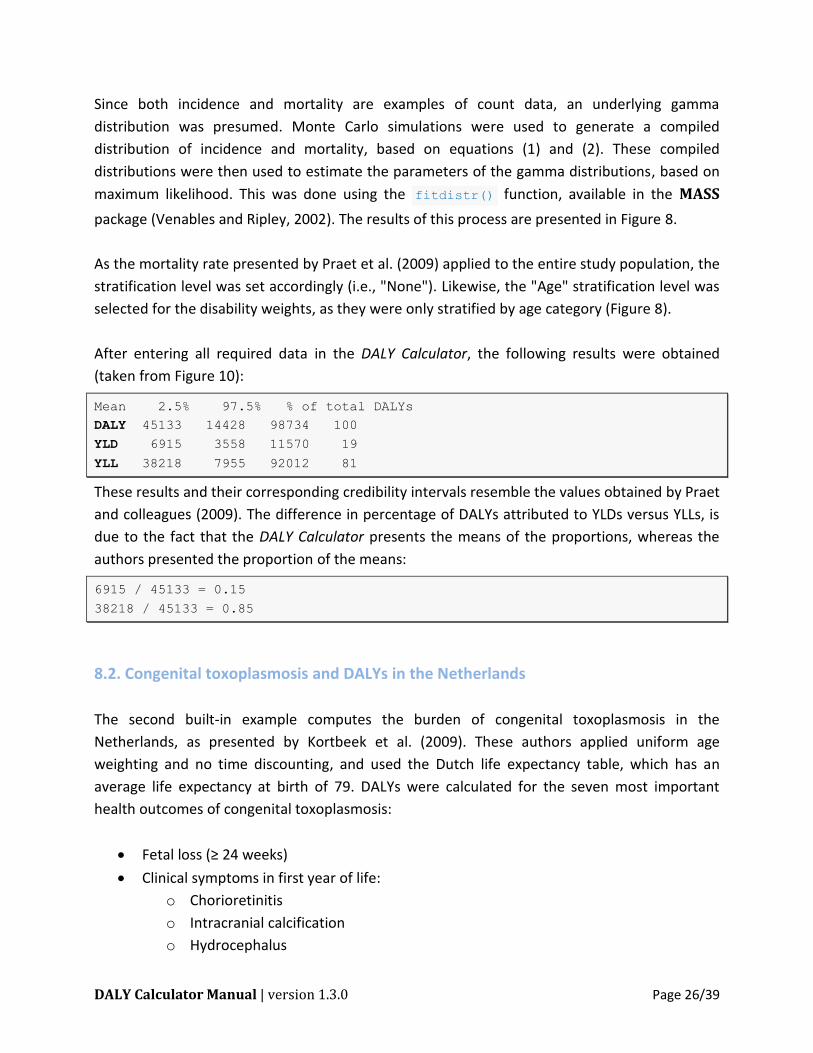
Since both incidence and mortality are examples of count data, an underlying gamma
distribution was presumed. Monte Carlo simulations were used to generate a compiled
distribution of incidence and mortality, based on equations (1) and (2). These compiled
distributions were then used to estimate the parameters of the gamma distributions, based on
maximum likelihood. This was done using the fitdistr() function, available in the MASS
package (Venables and Ripley, 2002). The results of this process are presented in Figure 8.
As the mortality rate presented by Praet et al. (2009) applied to the entire study population, the
stratification level was set accordingly (i.e., "None"). Likewise, the "Age" stratification level was
selected for the disability weights, as they were only stratified by age category (Figure 8).
After entering all required data in the DALY Calculator, the following results were obtained
(taken from Figure 10):
Mean 2.5% 97.5% % of total DALYs
DALY 45133 14428 98734 100
YLD 6915 3558 11570 19
YLL 38218 7955 92012 81
These results and their corresponding credibility intervals resemble the values obtained by Praet
and colleagues (2009). The difference in percentage of DALYs attributed to YLDs versus YLLs, is
due to the fact that the DALY Calculator presents the means of the proportions, whereas the
authors presented the proportion of the means:
6915 / 45133 = 0.15
38218 / 45133 = 0.85
8.2. Congenital toxoplasmosis and DALYs in the Netherlands
The second built-in example computes the burden of congenital toxoplasmosis in the
Netherlands, as presented by Kortbeek et al. (2009). These authors applied uniform age
weighting and no time discounting, and used the Dutch life expectancy table, which has an
average life expectancy at birth of 79. DALYs were calculated for the seven most important
health outcomes of congenital toxoplasmosis:
Fetal loss (≥ 24 weeks)
Clinical symptoms in first year of life:
o Chorioretinitis
o Intracranial calcification
o Hydrocephalus
DALY Calculator Manual | version 1.3.0 Page 27/39
o Central nerve system abnormalities
o Neonatal death
Asymptomatic at birth:
o Chorioretinitis later in life
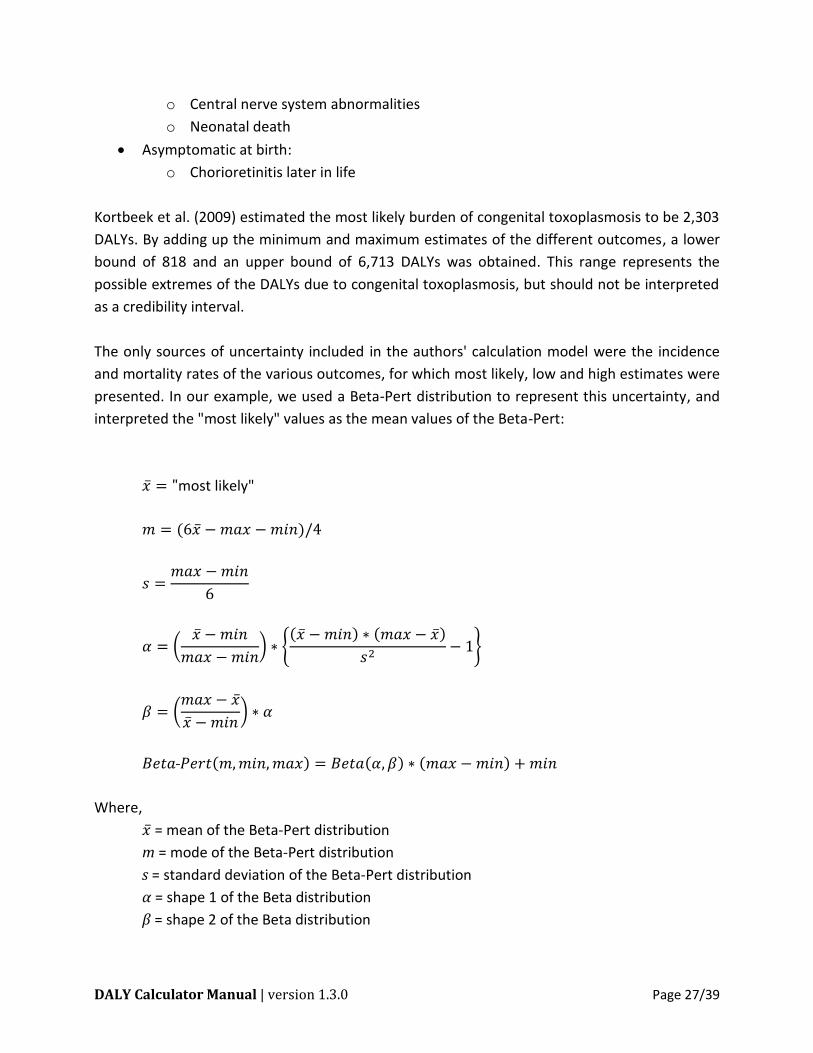
Kortbeek et al. (2009) estimated the most likely burden of congenital toxoplasmosis to be 2,303
DALYs. By adding up the minimum and maximum estimates of the different outcomes, a lower
bound of 818 and an upper bound of 6,713 DALYs was obtained. This range represents the
possible extremes of the DALYs due to congenital toxoplasmosis, but should not be interpreted
as a credibility interval.
The only sources of uncertainty included in the authors' calculation model were the incidence
and mortality rates of the various outcomes, for which most likely, low and high estimates were
presented. In our example, we used a Beta-Pert distribution to represent this uncertainty, and
interpreted the "most likely" values as the mean values of the Beta-Pert:
( ) { }
( )
Where,
= mean of the Beta-Pert distribution
m = mode of the Beta-Pert distribution
s = standard deviation of the Beta-Pert distribution
= shape 1 of the Beta distribution
= shape 2 of the Beta distribution
DALY Calculator Manual | version 1.3.0 Page 28/39
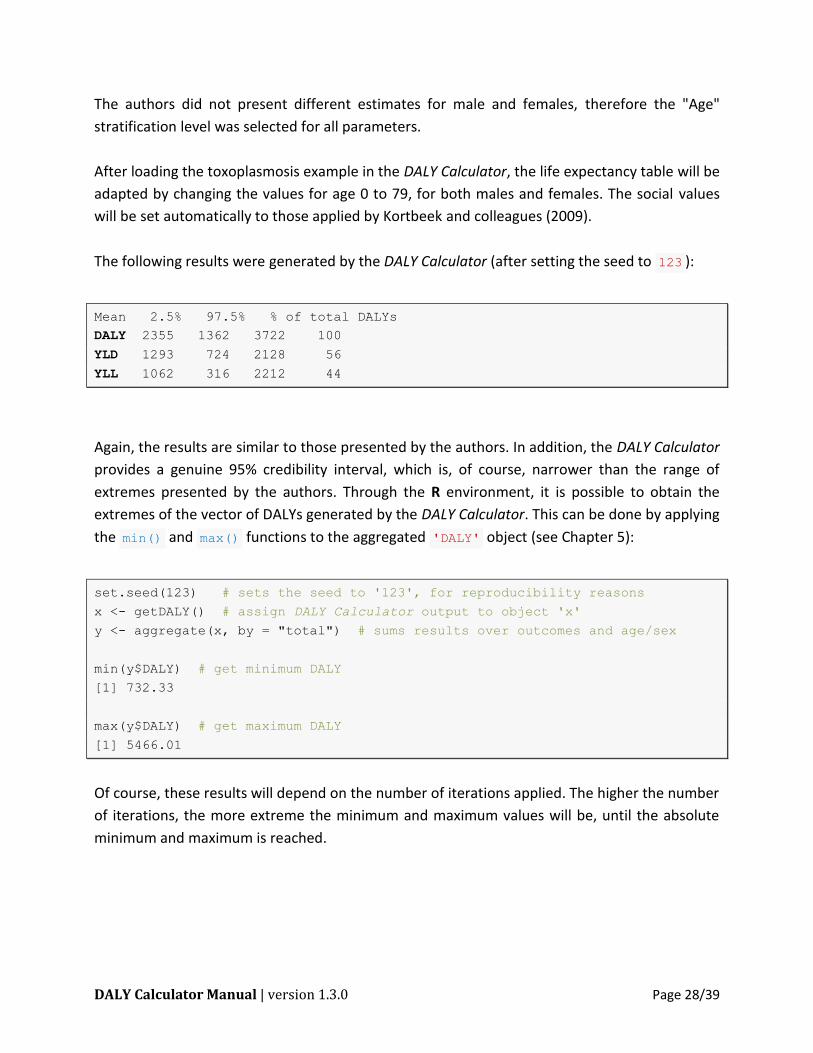
The authors did not present different estimates for male and females, therefore the "Age"
stratification level was selected for all parameters.
After loading the toxoplasmosis example in the DALY Calculator, the life expectancy table will be
adapted by changing the values for age 0 to 79, for both males and females. The social values
will be set automatically to those applied by Kortbeek and colleagues (2009).
The following results were generated by the DALY Calculator (after setting the seed to 123 ):
Mean 2.5% 97.5% % of total DALYs
DALY 2355 1362 3722 100
YLD 1293 724 2128 56
YLL 1062 316 2212 44
Again, the results are similar to those presented by the authors. In addition, the DALY Calculator
provides a genuine 95% credibility interval, which is, of course, narrower than the range of
extremes presented by the authors. Through the R environment, it is possible to obtain the
extremes of the vector of DALYs generated by the DALY Calculator. This can be done by applying
the min() and max() functions to the aggregated 'DALY' object (see Chapter 5):
set.seed(123) # sets the seed to '123', for reproducibility reasons
x <- getDALY() # assign DALY Calculator output to object 'x'
y <- aggregate(x, by = "total") # sums results over outcomes and age/sex
min(y$DALY) # get minimum DALY
[1] 732.33
max(y$DALY) # get maximum DALY
[1] 5466.01
Of course, these results will depend on the number of iterations applied. The higher the number
of iterations, the more extreme the minimum and maximum values will be, until the absolute
minimum and maximum is reached.
DALY Calculator Manual | version 1.3.0 Page 29/39
9. Saving and loading input data
An additional feature of the DALY Calculator is the possibility to save the entered values for the
epidemiological parameters to an RData image file. This function is available through:
File > Save DALY data to f …
Thus created (and edited) RData files can be loaded into the DALY Calculator by accessing:
File > L ad DALY da a fr f …
Alternatively, saving and loading RData files can be done directly from the R console:
saveDALYdata() # save data to .RData file
readDALYdata() # load data from .RData file
10. Current limitations and future work
The current version of the DALY Calculator allows basic DALY calculation and uncertainty
analysis, which could be useful for a variety of users. However, this first release has some
restrictions, which might limit a more advanced performance:
The current version of the DALY Calculator is designed to calculate a basic incidence-
based disease model, with well-defined incidence and mortality rates per disease
category or outcome. The incorporation of conditional probabilities or the calculation of
complex disease models is currently not possible;
The DALY Calculator only allows the simultaneous assessment of up to eight disease
categories or outcomes. This is sufficient for most diseases or agents, but could be
limiting for certain more complex models;
Until now, the DALY Calculator only allows the simultaneous use of a maximum of five
age groups;
Currently, only two DALY calculation examples are built-in.
Efforts are being made to clear these limitations, and solutions should be provided in the next
major releases of the DALY Calculator. User suggestions will be substantially taken into account
during the further development of the DALY Calculator.
DALY Calculator Manual | version 1.3.0 Page 30/39
11. Version history
DALY 1.3.0 – Release date 10/05/2014
New features
Introduction of a DALY_list() function to combine different 'DALY' objects;
Introduction of a plot() method for objects of class 'DALY' and 'DALY_list' ;
Introduction of a scatterplot() method for objects of class 'DALY' and
'DALY_list' ;
Introduction of a print() and plot() method for objects of class
'DALY_sensitivity' .
Performance improvements
Function sensitivity() has been updated to allow calculating (standardized)
regression coefficients and partial correlation coefficients, either on the original or the
ranked input values.
Bug fixes
Fixed mismatch between Authors@R and Author fields in DESCRIPTION file;
The use of extern "C" {} in the DALY.cpp file has been revised to fix issues with
clang.
DALY 1.2.0 – Release date 06/07/2013
New features
Introduction of a sensitivity() function;
Function getDALY() gains arguments aw and dr .
Performance improvements
The DALY Calculator now also includes the simulated values from the input distributions;
Several functions have been updated to make proper use of the match.arg()
functionality;
The 'DALY' database on the search path is replaced by a '.DALYenv' environment in
the DALY package.
DALY Calculator Manual | version 1.3.0 Page 31/39
Bug fixes
The readDALYdata() now correctly reads .RData files when specified through the
file argument;
All instances of INC and MRT have now consistently been renamed to cases and
deaths , respectively;
The DALY Calculator manual has been rebuilt to fix issues with pdffonts.
DALY 1.1.0 – Release date 27/08/2012
New features
Introduction of an aggregate() method for objects of class 'DALY' .
Performance improvements
Each window has a "save or cancel" policy;
The basic DALY Calculator output consists of simulated DALYs, YLLs, YLDs, incident cases
and deaths per outcome and per age/sex class;
print() , summary() and hist() methods have been updated;
Saving and loading data is implemented through .RData files instead of .txt files.
Deprecated and defunct
Text files with input data can no longer be read by the DALY Calculator;
As a result, the DALY Calculator Excel template is defunct.
Installation
DALY 1.1.0 can be installed and run under Mac OS X, Linux and Windows operating
systems. The DALY Calculator is only launched after attaching the package in an
interactive session, which means that the package can be installed without having the
required tools installed. Loading the package under Mac OS X and Linux requires the
prior installation of the X Window System (X11) and the Tcl/Tk toolkit.
Bug fixes
Global variables removed; all variables needed by the DALY Calculator are stored in a
separate 'DALY' database;
Welcome messages implemented through packageStartupMessage() ;
Problems with installation of BWidget resolved by replacing tkwidget(parent, type
= "ComboBox", ...) by ttkcombobox() ;
DALY Calculator Manual | version 1.3.0 Page 32/39
set.seed() can be used to select the seed used for the random number generation
processes within the DALY Calculator;
A same window can be opened only once; calling a window opening function while the
corresponding window is already opened will return focus to the existing window;
Evaluation of input data improved by using regular expressions;
Empty cells in the 'Life Expectancy' window produce an error message, while they are
still allowed in other windows;
'Iterations' can only be set to a strictly positive integer value;
On closing the DALY Calculator main window, all other DALY Calculator windows will
close as well;
Checkboxes may also be set by clicking the corresponding text.
DALY 1.0.0 – Release date 23/03/2011
Features
Calculate DALYs, YLDs, YLLs and Deaths for a simple incidence-based disease model;
Able to include up to eight outcomes;
Five age-groups included, i.e., 0-4; 5-14; 15-44; 45-59; 60+;
Life expectancy table can be defined by user; standard table is the Coale and Demeny
model life-table West, level 26 and 25;
Two examples included, i.e., Neurocysticercosis in Cameroon and Toxoplasmosis in the
Netherlands;
Saving/loading data through .txt file;
The basic DALY Calculator output consists of simulated DALYs, YLLs, YLDs and deaths per
outcome, aggregated over age/sex classes;
print() , summary() and hist() methods for objects returned by the DALY
Calculator.
DALY 0.0.0
A first version of the DALY Calculator was developed in November 2010, but was never released.
This version consisted of a single 'data' window, and was only able to reproduce the
Neurocysticercosis example.
DALY Calculator Manual | version 1.3.0 Page 33/39
ANNEX 1. DALY calculation and uncertainty analysis
Traditionally, three types of uncertainty are distinguished (Bilcke et al., 2011):
Methodological uncertainty: which normative modeling approach should be used?
Structural uncertainty: what structural aspects should be incorporated to capture the
relevant characteristics of the phenomenon being investigated?
Parameter uncertainty: what is the true value of each model parameter?
The DALY Calculator mainly deals with parameter uncertainty. Other types can be dealt with by
running multiple simulations (i.e., performing scenario analyses):
Methodological uncertainty: different normative views exist regarding the application of
age weighting and time discounting in DALY calculations. The DALY Calculator easily
allows to calculate results based on different scenarios of age weighting and time
discounting (see Chapter 3, Step 4).
Structural uncertainty: the definition of a disease model is one of the most important
steps preceding the actual DALY calculation. In case of uncertainty or controversy
regarding the disease model, different scenarios can be run and their results compared.
The DALY Calculator allows for the incorporation of parameter uncertainty at two different
levels, i.e., parameter uncertainty sensu stricto, and stratification uncertainty.
Evidence for parameters is often only available through population samples, leading to sampling
error in the reported parameters. The evidence of available parameter values may furthermore
be of questionable quality, due to imperfect test characteristics, or worse, low-quality study
designs. Sometimes, parameter values are even completely lacking. In these cases, parameter
values should be represented by appropriate probability distributions reflecting their
uncertainty, rather than by mere point estimates. The DALY Calculator allows the user to specify
for each parameter one of the following probability distributions:
Beta-Pert (mode; min; max)
Beta (alpha; beta)
Gamma (shape; rate)
Normal (mu; sigma)
Lognormal-geometric (logmean; logsigma)
Lognormal-arithmetic (mean; sigma)
Uniform (min; max)
Fixed
DALY Calculator Manual | version 1.3.0 Page 34/39
As the available parameter values are often not available per combination of age group and sex,
the total uncertainty would be underestimated if the exact level of data stratification would not
be taken in account. This can be demonstrated by a simple example:
Suppose parameter X is sampled from a distribution with variance σ². We need this parameter
for males and females, but the distribution we derived from literature makes no distinction
between sexes, and is thus not stratified by sex (for the sake of the example, we will forget
about age group stratification). If we do not take in account stratification uncertainty, we will
simulate two times from the same distribution, thereby obtaining a sequence of random values
for Xm and Xf. As for regular DALY calculations, our end result will be the sum of both
parameters (see Annex 1). The variance of our end result will then be:
Var(Xm + Xf) = Var(Xm) + Var(Xf) + 2 * Cov(Xm, Xf) = 2σ²
Since Xm and Xf were independent simulations from a same distribution, their covariance is zero.
The correct approach, however, would be to draw one sequence of simulations from the
distribution, and then multiply it by two. The variance of the end result will then be:
Var(2 * X) = 4σ²
Not accounting for stratification uncertainty would thus underestimate the overall uncertainty
by a factor of two. Likewise, not accounting for stratification uncertainty due to n strata, would
lead to an n-fold underestimation of overall uncertainty.
The DALY Calculator enables users to specify the level of stratification of the input parameters,
and incorporates this information in the DALY calculation process. Four possibilities are
provided:
Age and Sex (i.e., full stratification)
Age (i.e., data is stratified by age group, but not by sex)
Sex (i.e., data is stratified by sex, but not by age group)
None (i.e., no stratification, data applies to total population)
For the case where the data applies to the total population (i.e., no stratification), a single
random value is generated per iteration and applied to each age and sex class. If the data is only
stratified by age (sex), a random value is generated during each iteration per age (sex) class, and
applied to all sex (age) classes. Finally, in case of full stratification, during each iteration, a
random value will be generated for each combination of age group and sex, reflecting the
maximum level of detail of the respective input parameter.
DALY Calculator Manual | version 1.3.0 Page 35/39
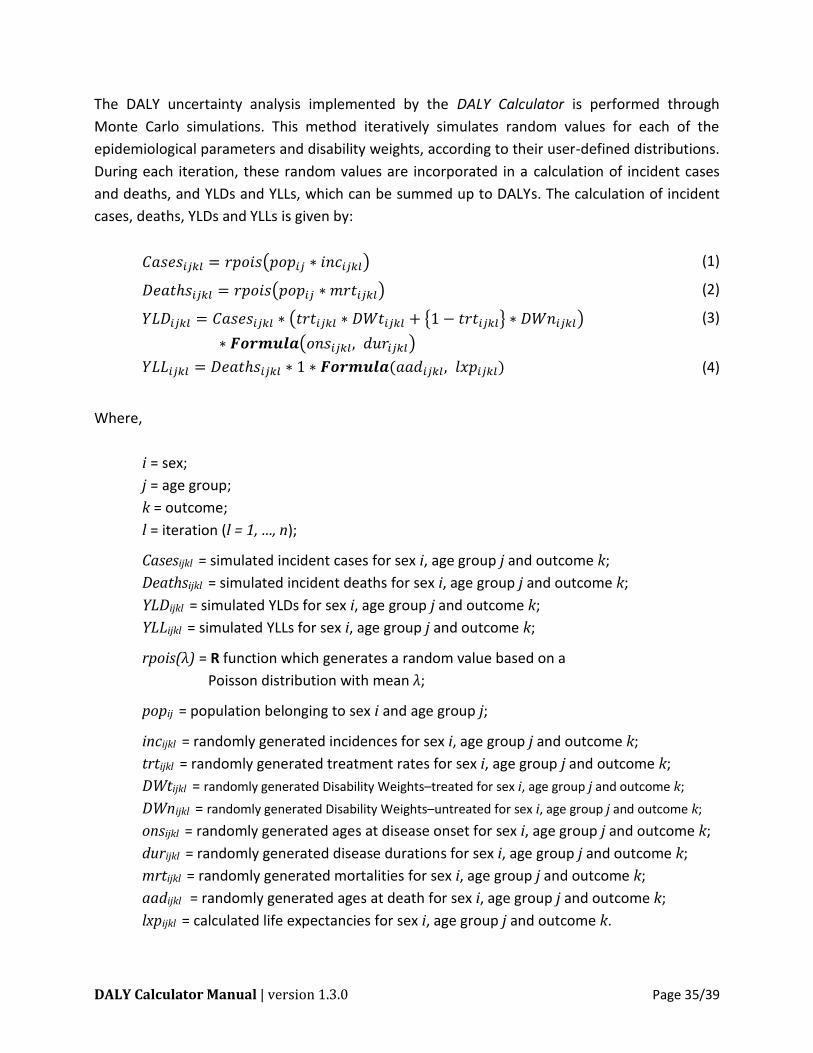
The DALY uncertainty analysis implemented by the DALY Calculator is performed through
Monte Carlo simulations. This method iteratively simulates random values for each of the
epidemiological parameters and disability weights, according to their user-defined distributions.
During each iteration, these random values are incorporated in a calculation of incident cases
and deaths, and YLDs and YLLs, which can be summed up to DALYs. The calculation of incident
cases, deaths, YLDs and YLLs is given by:
( ) (1)
( ) (2)
( { } )
( )
(3)
(4)
Where,
i = sex;
j = age group;
k = outcome;
l = iteration (l = 1, …, n);
Casesijkl = simulated incident cases for sex i, age group j and outcome k;
Deathsijkl = simulated incident deaths for sex i, age group j and outcome k;
YLDijkl = simulated YLDs for sex i, age group j and outcome k;
YLLijkl = simulated YLLs for sex i, age group j and outcome k;
rpois(λ) = R function which generates a random value based on a
Poisson distribution with mean λ;
popij = population belonging to sex i and age group j;
incijkl = randomly generated incidences for sex i, age group j and outcome k;
trtijkl = randomly generated treatment rates for sex i, age group j and outcome k;
DWtijkl = randomly generated Disability Weights–treated for sex i, age group j and outcome k;
DWnijkl = randomly generated Disability Weights–untreated for sex i, age group j and outcome k;
onsijkl = randomly generated ages at disease onset for sex i, age group j and outcome k;
durijkl = randomly generated disease durations for sex i, age group j and outcome k;
mrtijkl = randomly generated mortalities for sex i, age group j and outcome k;
aadijkl = randomly generated ages at death for sex i, age group j and outcome k;
lxpijkl = calculated life expectancies for sex i, age group j and outcome k.
DALY Calculator Manual | version 1.3.0 Page 36/39
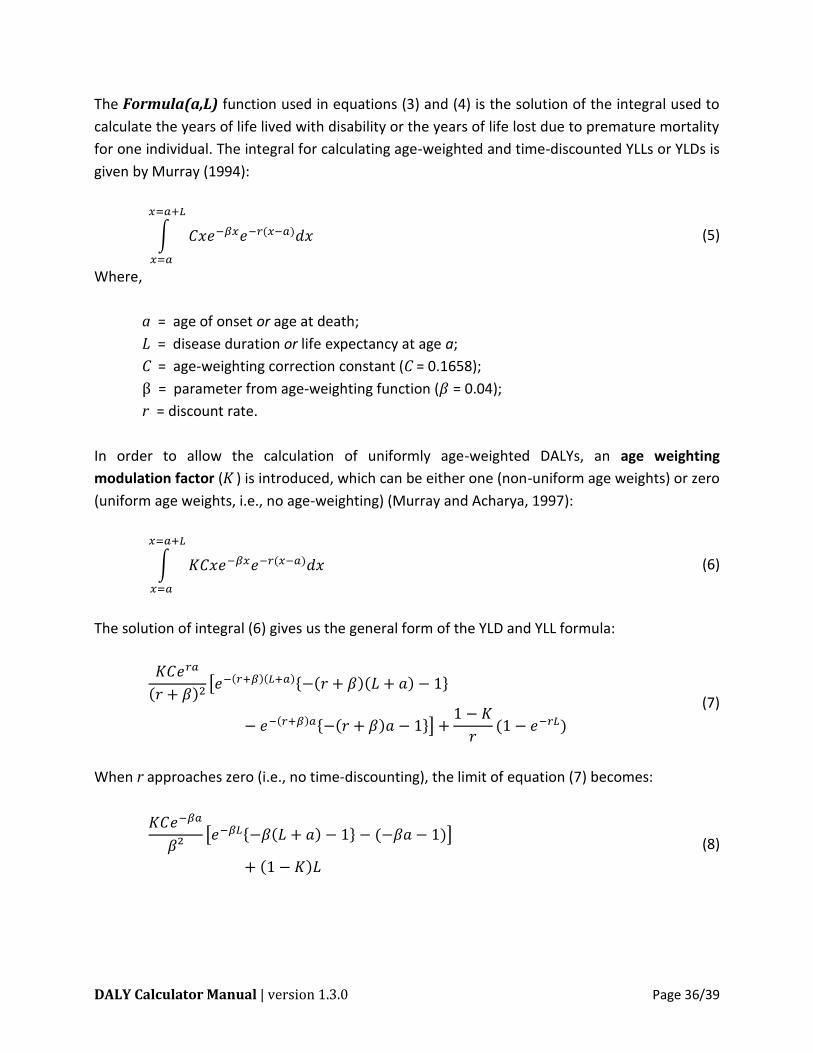
The Formula(a,L) function used in equations (3) and (4) is the solution of the integral used to
calculate the years of life lived with disability or the years of life lost due to premature mortality
for one individual. The integral for calculating age-weighted and time-discounted YLLs or YLDs is
given by Murray (1994):
∫ (5)
Where,
a = age of onset or age at death;
L = disease duration or life expectancy at age a;
C = age-weighting correction constant (C = 0.1658);
= parameter from age-weighting function ( = 0.04);
r = discount rate.
In order to allow the calculation of uniformly age-weighted DALYs, an age weighting
modulation factor (K ) is introduced, which can be either one (non-uniform age weights) or zero
(uniform age weights, i.e., no age-weighting) (Murray and Acharya, 1997):
∫ (6)
The solution of integral (6) gives us the general form of the YLD and YLL formula:
[ { } { }]
(7)
When r approaches zero (i.e., no time-discounting), the limit of equation (7) becomes:
[ { } ]
(8)

DALY Calculator Manual | version 1.3.0 Page 37/39
For the case where both r and K are zero (i.e., no time-discounting and no age-weighting),
equation (8) equals L, the disease duration (for the calculation of YLDs) or the life expectancy at
age a (for the calculation of YLLs).
This process of simulating YLD and YLL values is iteratively repeated for each combination of sex
and age group (i,j) within each outcome k. By summing these values, a DALY matrix is obtained
per age/sex class (i,j) and outcome k:
(9)
Based upon these vectors, posterior summary statistics can be calculated for incident cases and
deaths, and YLDs, YLLs and DALYs, per outcome and age/sex class. Summing these vectors over
age group i, sex j, and/or outcome k, will lead to aggregated results, as returned by the
aggregate() method. For example, summary statistics of total DALYs, such as those given by
the default print() method, can be obtained by summing up the simulated results over all
outcomes and age/sex classes:
∑ ∑ ∑ (10)
The implementation of the above-mentioned features is primarily written in the R programming
language, with additional support from Tcl/Tk (using the tcltk package; R Core Team, 2013),
to design the GUI. In order to speed up the computation process, the DALY Calculator interacts
with the C++ programming language, which is used to randomly generate the epidemiological
input values (through R random number generation functions), and to calculate the YLDs, YLLs
and incident cases and deaths, based on equations (1) to (4). These results are then sent back to
the R environment, where they are summed up to obtain DALYs and processed into their
corresponding list elements. Finally, the output of the results and their graphical representation
is handled by R, which is optimized towards these tasks.
DALY Calculator Manual | version 1.3.0 Page 38/39
REFERENCES
Bilcke J, Beutels P, Brisson M, Jit M (2011). Accounting for methodological, structural, and
parameter uncertainty in decision-analytic models: a practical guide. Medical Decision Making
31(4), 675-692.
de Vocht F, Higgerson J, Oliver K, Verma A (2010). Incorporating uncertainty in aggregate
burden of disease measures: an example of DALYs-averted by a smoking cessation campaign in
the UK. Journal of Epidemiology and Community Health 65(9), 751-756.
Kortbeek LM, Hofhuis A, Nijhuis CDM, Havelaar AH (2009). Congenital toxoplasmosis and DALYs
in the Netherlands. Memórias de Instituto Oswaldo Cruz 104(2), 370-373.
Lopez AD, Mathers CD, Ezzati M, Jamison DT, Murray CJL (2006). Global burden of disease and
risk factors. Oxford University Press, New York, USA, pp. 475.
Mathers CD, Vos T, Lopez AD, Salomon J, Ezzati M (2001). National Burden of Disease Studies: a
Practical Guide. Edition 2.0. Global Program on Evidence for Health Policy. World Health
Organization, Geneva, Switzerland.
Murray CJL (1994). Quantifying the burden of disease: the technical basis for disability-adjusted
life years. Bulletin of the World Health Organization 72(3), 429-445.
Murray CJL, Lopez AD (1996). The Global Burden of Disease: a comprehensive assessment of
mortality and disability from diseases, injuries and risk factors in 1990 and projected to 2020.
Harvard University Press, Cambridge, UK, pp. 990.
Murray CJL, Acharya AK (1997). Understanding DALYs. Journal of Health Economics 16(6), 703-
730.
Praet N, Speybroeck N, Manzanedo R, Berkvens D, Nforninwe DN, Zoli A, Quet F, Preux P-M,
Carabin H, Geerts S (2009). The disease burden of Taenia solium cysticercosis in Cameroon. PLoS
Neglected Tropical Diseases 3(3), e406.
R Core Team (2014). R: A language and environment for statistical computing. R Foundation for
Statistical Computing, Vienna, Austria. URL http://www.R-project.org/.

DALY Calculator Manual | version 1.3.0 Page 39/39
Venables WN, Ripley BD (2002). Modern Applied Statistics with S. Fourth Edition. Springer, New
York, USA. ISBN 0-387-95457-0.
Vose D (2008). Risk Analysis: a quantitative guide. Third Edition. John Wiley & Sons, Chichester,
UK. ISBN 978-0-470-51284-5.