a human platelet calcium calculator trained by pairwise agonist scanning
TRANSCRIPT
RESEARCH ARTICLE
A Human Platelet Calcium Calculator Trainedby Pairwise Agonist ScanningMei Yan Lee, Scott L. Diamond*
Institute for Medicine and Engineering, Department of Chemical and Biomolecular Engineering, University ofPennsylvania, Philadelphia, Pennsylvania, United States of America
AbstractSince platelet intracellular calcium mobilization [Ca(t)]i controls granule release, cyclooxy-
genase-1 and integrin activation, and phosphatidylserine exposure, blood clotting simula-
tions require prediction of platelet [Ca(t)]i in response to combinatorial agonists. Pairwise
Agonist Scanning (PAS) deployed all single and pairwise combinations of six agonists
(ADP, convulxin, thrombin, U46619, iloprost and GSNO used at 0.1, 1, and 10xEC50; 154
conditions including a null condition) to stimulate platelet P2Y1/P2Y12, GPVI, PAR1/PAR4,
TP, IP receptors, and guanylate cyclase, respectively, in Factor Xa-inhibited (250 nM apixa-
ban), diluted platelet rich plasma that had been loaded with the calcium dye Fluo-4 NW.
PAS of 10 healthy donors provided [Ca(t)]i data for training 10 neural networks (NN, 2-layer/
12-nodes) per donor. Trinary stimulations were then conducted at all 0.1x and 1xEC50
doses (160 conditions) as was a sampling of 45 higher ordered combinations (four to six ag-
onists). The NN-ensemble average was a calcium calculator that accurately predicted [Ca
(t)]i beyond the single and binary training set for trinary stimulations (R = 0.924). The 160
trinary synergy scores, a normalized metric of signaling crosstalk, were also well predicted
(R = 0.850) as were the calcium dynamics (R = 0.871) and high-dimensional synergy scores
(R = 0.695) for the 45 higher ordered conditions. The calculator even predicted sequential
addition experiments (n = 54 conditions, R = 0.921). NN-ensemble is a fast calcium calcula-
tor, ideal for multiscale clotting simulations that include spatiotemporal concentrations of
ADP, collagen, thrombin, thromboxane, prostacyclin, and nitric oxide.
Author Summary
Platelets regulate clotting during injury to prevent blood loss. Hyperactive platelets mayincrease risk of thrombosis, whereas hypoactive platelets may increase risk of bleeding.Platelets are activated during a clotting event by agonists, through different signaling path-ways, all of which converge on intracellular calcium mobilization. Calcium mobilization isa global metric of platelet activation. Predicting platelet response to different combinationsof agonists is essential to scoring bleeding or clotting risks or drug response. We collectedpairwise agonist scanning data, in which platelets are activated by all single and pairwisecombinations of six important agonists at low, medium and high doses, from 10 donors
PLOS Computational Biology | DOI:10.1371/journal.pcbi.1004118 February 27, 2015 1 / 24
OPEN ACCESS
Citation: Lee MY, Diamond SL (2015) A HumanPlatelet Calcium Calculator Trained by PairwiseAgonist Scanning. PLoS Comput Biol 11(2):e1004118. doi:10.1371/journal.pcbi.1004118
Editor: Jeffrey J. Saucerman, University of Virginia,United States of America
Received: October 31, 2014
Accepted: January 7, 2015
Published: February 27, 2015
Copyright: © 2015 Lee, Diamond. This is an openaccess article distributed under the terms of theCreative Commons Attribution License, which permitsunrestricted use, distribution, and reproduction in anymedium, provided the original author and source arecredited.
Data Availability Statement: All relevant data arewithin the paper and its Supporting Information files.
Funding: This work was funded by the grant NIHR01 HL103419 (SLD). The funders had no role instudy design, data collection and analysis, decision topublish, or preparation of the manuscript.
Competing Interests: The authors have declaredthat no competing interests exist.
and subsequently trained artificial neural networks. The combined trained model was ableto predict the dynamic calcium time traces of combinations of three, four, five and six ago-nists at various dose ranges, as well as conditions where agonists were added sequentially.The data-driven neural network model is computationally fast and is able to capture a sig-nificant level of signaling complexity within the human platelet.
IntroductionPlatelet activation during heart attack and stroke occurs through combined signaling pathwaysinvolving various receptors responding to collagen, thrombin, ADP, and thromboxane. Endo-thelial production of prostacyclin is highly protective against thrombotic platelet activation asrevealed by the known cardiovascular risks of COX-2 inhibitors. Similarly, endothelial produc-tion of NO has many cardiovascular effects via vasodilation and platelet inhibition. The clinicalimportance of these pathways is seen in the number of drugs in clinical trials or approved thattarget GPVI signaling, thromboxane, ADP, or thrombin. More than 50 million U.S. adults takeaspirin to inhibit platelet COX-1 production of thromboxane in order to reduce long-term riskof cardiovascular disease [1]. Clopidogrel antagonizes ADP activation of platelet P2Y12 recep-tors and is widely prescribed. Numerous anticoagulants are approved to target the generationor activity of thrombin.
Platelet activation occurs through multiple signaling pathways in which agonists bind spe-cific receptors on the platelet to trigger signaling in a dose-dependent manner. During a clot-ting episode, platelets respond to exposed surface collagen, released ADP, synthesizedthromboxane, and the serine protease thrombin, all while being simultaneously modulated byendothelial derived nitric oxide and prostacyclin. These receptor-mediated signaling pathwaysare not independent and significant crosstalk can occur (Fig. 1A).
The Pairwise Agonist Scanning (PAS) method was first developed by Chatterjee et al.(2010) using EDTA-treated platelet rich plasma (PRP) to quantify and predict the interactionsbetween multiple pathways (S1 Fig.) [2]. The PAS method measures platelet calcium responsesto all individual and pairwise combinations of agonists at low, medium and high concentra-tions (154 conditions total for six agonists at 0.1, 1, and 10xEC50, including a null condition).Because EDTA chelates extracellular calcium and prevents store operated calcium entry(SOCE), the measured calcium data obtained using EDTA-treated PRP is enriched in the regu-latory events surrounding IP3-mediated calcium release from the dense tubular system (DTS).With PAS data, Chatterjee et al. were able to train an artificial neural network (NN) to predictplatelet calcium response to combinations of agonists beyond the training data, such as trinarycombinations, sequential additions of agonists, and combinatorial responses of four to six ago-nists [2]. The NN model builds an estimate of higher order interactions (response to>2 ago-nists) by combination of the measured binary interactions. A metric called the pairwisesynergy score was defined to quantify the extent of cross-talk between pairs of agonists(Fig. 1B) [2]. The pairwise synergy score (Sij) was defined to be the difference between the inte-grated area (area under the curve) for the combined response to agonists i and j relative to theintegrated area for both the individual agonist responses added together, normalized to themaximum absolute Sij [2]. In other words, the synergy score is a measure of deviation of theplatelet response from the simple additive response of each agonist. A positive Sij value indi-cates synergistic behavior between agonists i and j whereas a negative Sij value indicates antago-nistic or saturating behavior and Sij = 0 represents a purely additive response.
Human Platelet Calcium Calculator
PLOS Computational Biology | DOI:10.1371/journal.pcbi.1004118 February 27, 2015 2 / 24
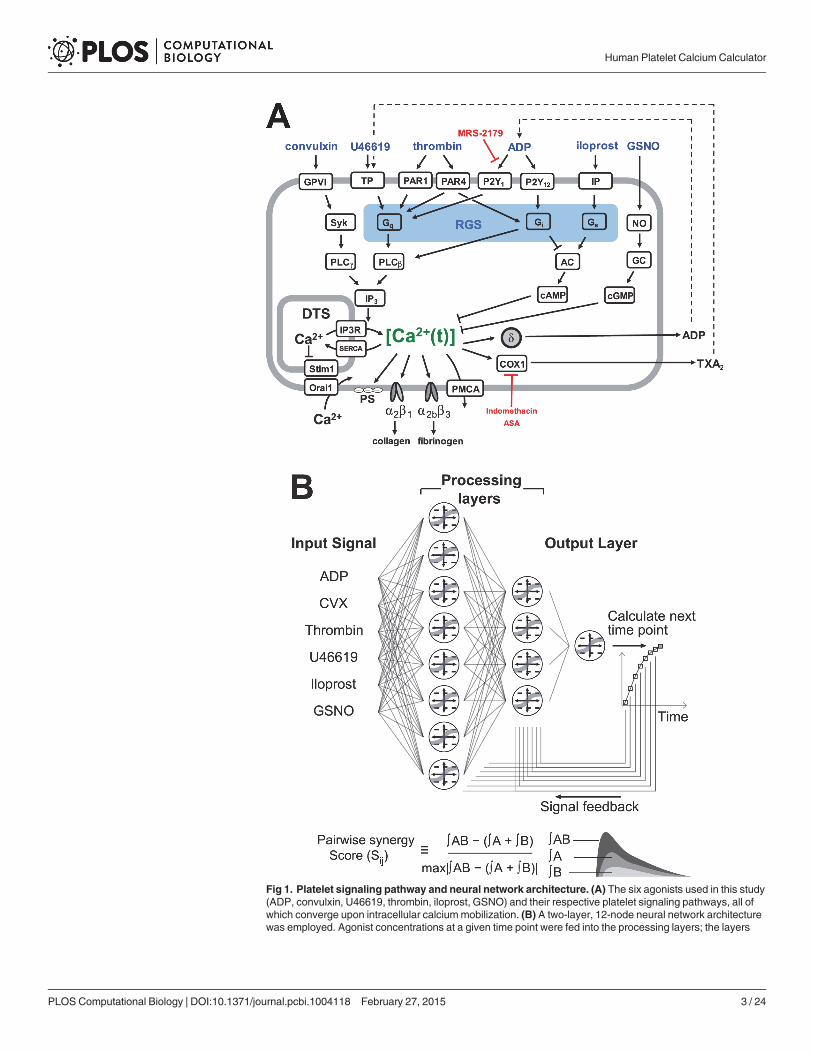
Fig 1. Platelet signaling pathway and neural network architecture. (A) The six agonists used in this study(ADP, convulxin, U46619, thrombin, iloprost, GSNO) and their respective platelet signaling pathways, all ofwhich converge upon intracellular calciummobilization. (B) A two-layer, 12-node neural network architecturewas employed. Agonist concentrations at a given time point were fed into the processing layers; the layers
Human Platelet Calcium Calculator
PLOS Computational Biology | DOI:10.1371/journal.pcbi.1004118 February 27, 2015 3 / 24
Since many platelet pathways are triggered distally of IP3-released calcium and SOCE, theintracellular calcium concentrations can be used as a global metric of platelet activation. Calci-um is the central “node” in platelet signaling, in that elevated calcium levels are central todownstream clotting events such as integrin activation, granule release, shape change, andphosphatidylserine exposure by platelets [3–5]. The ability to predict dynamic calcium tracesfor combinations of agonists enables the targeting of specific platelet pathways to increase ordecrease platelet activity so as to achieve desired clinical outcome. NN trained on PAS dataprovides accurate calcium responses to different dose combinations of important agonists andis essential for simulating platelet function under flow. As an in silico predictor of calcium reg-ulation, the NNs trained by PAS can be embedded in multi-scale simulations of platelet deposi-tion under flow conditions. In the work of Flamm et al. (2011) [6], NN were trained via PASusing calcium-containing PRP and then used to predict platelet deposition rates on collagen inthe absence of thrombin by accounting for platelet signaling in response to laboratory analogsof collagen, ADP, thromboxane, and prostacyclin.
A universal platelet calcium calculator provides a reference for platelet function of a healthyhuman. Platelet gain of function or loss of function in patients can therefore be measured in ahigh dimensional approach using the PAS method. Furthermore, since the specific pathways inthe platelet that contribute to platelet gain or loss of function can be identified by PAS as well,PAS can be used to predict the sensitivity and resistance of drugs that target those specific ago-nist pathways, even loss of function mutations have been discovered with PAS [6]. Additional-ly, the calcium calculator can be embedded into a multiscale simulation of clotting underdefined hemodynamic conditions.
In the current study, the PAS method was expanded for the use of exogenously addedthrombin in the presence of normal calcium and included the potent platelet inhibitors iloprostand nitric oxide (NO). Thrombin is an extremely potent platelet activator via cleavage of plate-let PAR1 and PAR4 receptors. Additionally, to estimate average healthy human platelet re-sponses, calcium data was obtained from 10 healthy donors as an ensemble-averaged predictorof platelet calcium. Distinct from the prior PAS in Chatterjee et. al (2010) where PAR1 andPAR4 agonist peptides were used with platelet rich plasma (PRP) treated with EDTA, the cur-rent study required a means to study exogeneously added thrombin without endogenous pro-duction of thrombin in PRP with normal calcium. In the current experimental design, bloodwas drawn into 250 nM apixaban (Ki = 0.08 nM) [7], a direct Factor Xa inhibitor, which doesnot alter extracellular calcium levels but prevents endogenous thrombin generation. This assaytherefore allows the contribution of SOCE and includes the signaling distal of thrombin pro-teolytic activity on PAR1 and PAR4. Furthermore, the NN-ensemble method was employed toincrease accuracy and robustness in NN predictions.
Materials and Methods
Ethics StatementWhole blood was drawn by venipuncture from healthy donors according to the University ofPennsylvania Institutional Review Board guidelines (protocol number: 805305), into a syringecontaining apixaban (SelleckChem) with a final concentration of 250 nM. Donors self-reported
then integrated the input signal with feedback at t = 1, 2, 4, 8, 16, 32, 64 and 128 seconds to calculate [Ca2+]iat the next time point. The pairwise synergy score (Sij) was also defined as the difference in integratedcalcium response to two agonists used together and integrated response to agonists used individually,normalized by the maximum synergy score in the experiment.
doi:10.1371/journal.pcbi.1004118.g001
Human Platelet Calcium Calculator
PLOS Computational Biology | DOI:10.1371/journal.pcbi.1004118 February 27, 2015 4 / 24
to be free of any medications or alcohol use for three days prior to the blood draw. Female do-nors self-reported to not using oral contraceptives.
Pairwise Agonist Scanning (PAS)Platelet rich plasma (PRP) was then obtained by subjecting the whole blood sample to centrifu-gation at 120g for 12 minutes. Then, 2 ml of PRP was incubated with a vial (single microplatesize) of Fluo-4 NW dye mixture (Invitrogen) reconstituted with 7.8 ml of HEPES buffer and200 μL of 77 mg/ml reconstituted probenecid (Invitrogen) for 30 minutes [2]. All single andpairwise combinations of six agonists (ADP, convulxin, thrombin, U46619, iloprost andGSNO) at low, medium and high concentrations (0.1, 1, and 10X EC50), as well as a buffercondition (154 conditions total x 2 replicates) were dispensed into a 384-well plate (called the‘agonist plate’) using a high throughput liquid handler (PerkinElmer Janus). The PAS agonistswere: ADP (P2Y1/P2Y12 activator, EC50 = 1 μM), convulxin (GPVI activator, EC50 = 2 nM),thrombin (PAR1/PAR4 activator, EC50 = 20 nM), U46619 (TP activator, EC50 = 1 μM), ilo-prost (IP activator, EC50 = 0.5 μM) and GSNO (NO donor, EC50 = 7 μM) (S2 Fig.). ADP andGSNO were obtained from Sigma-Aldrich, convulxin from Pentapharm, thrombin from Hae-matologic Technologies Inc., U46619 and iloprost from Tocris Bioscience. After incubationwith dye, the PRP was dispensed into a 384-well plate (called the ‘read plate’). Both the agonistand read plate were loaded into a Molecular Devices FlexStation 3, a fluorescence reader withauto-pipetting capabilities. Agonists were dispensed to a column of wells containing the PRP,where well fluorescence F(t) was read and normalized by the pre-dispense baseline. Specifically,20 μL of agonist was added to 30 μL of PRP in each well, giving a final volume of 50 μL. In eachwell, the final concentration of PRP after agonist addition was 12% PRP by vol., and the volumeof calcium dye was 15 μL (30% dye by vol.). Readings were taken in intervals of 2.5 seconds.The fluorescence was read for 20 seconds before dispense, and readings were taken for 210seconds after each dispense (EX/EM, 485 nm/525 nm). The entire plate was read, column-wise, in under 90 minutes. PAS was conducted on PRP from ten donors (50% male), each inreplicate on two different days (20 PAS experiments total). In separate tests using indometha-cin (Sigma-Aldrich) to block COX1 and apyrase (Sigma-Aldrich) to degrade released ADP,there was no evidence for autocrine signaling in the dilute PRP conditions of the experiment(S3 Fig.), as previously found with EDTA-treated PRP [2].
Trinary, Higher Order Combinations and Sequential AdditionExperimentsIn experiments with trinary mixtures of agonists, all single and trinary combinations of thesame six agonists at two different concentrations (0.1x and 1x EC50), as well as a null buffercondition (173 conditions total x 2 replicates) were prepared in the agonist plate. This experi-ment was done once for each of the 10 PAS donors. There are 3,402 possible conditions involv-ing four, five, or six agonists (higher order combinations of agonists) at low, medium and highconcentrations. The higher order combination space was sampled in equal proportions (ap-proximately 1.3% each of 4 to 6 agonist conditions). Thus, a total of n = 45 higher order combi-nations were sampled (16 four-agonist, 19 five-agonist, and 10 six-agonist conditions). Theseexperiments were done seven times spanning five donors (two repeat experiments for two ofthe donors), neither of which were present in the PAS training set. In the sequential additionexperiments, all conditions involving sequential addition of three agonists (ADP, convulxinand U46619) at three different concentrations and a null buffer condition (55 conditions totalx 2 replicates) were prepared in the agonist plate. The sequential addition experiment was doneonce on a single donor.
Human Platelet Calcium Calculator
PLOS Computational Biology | DOI:10.1371/journal.pcbi.1004118 February 27, 2015 5 / 24
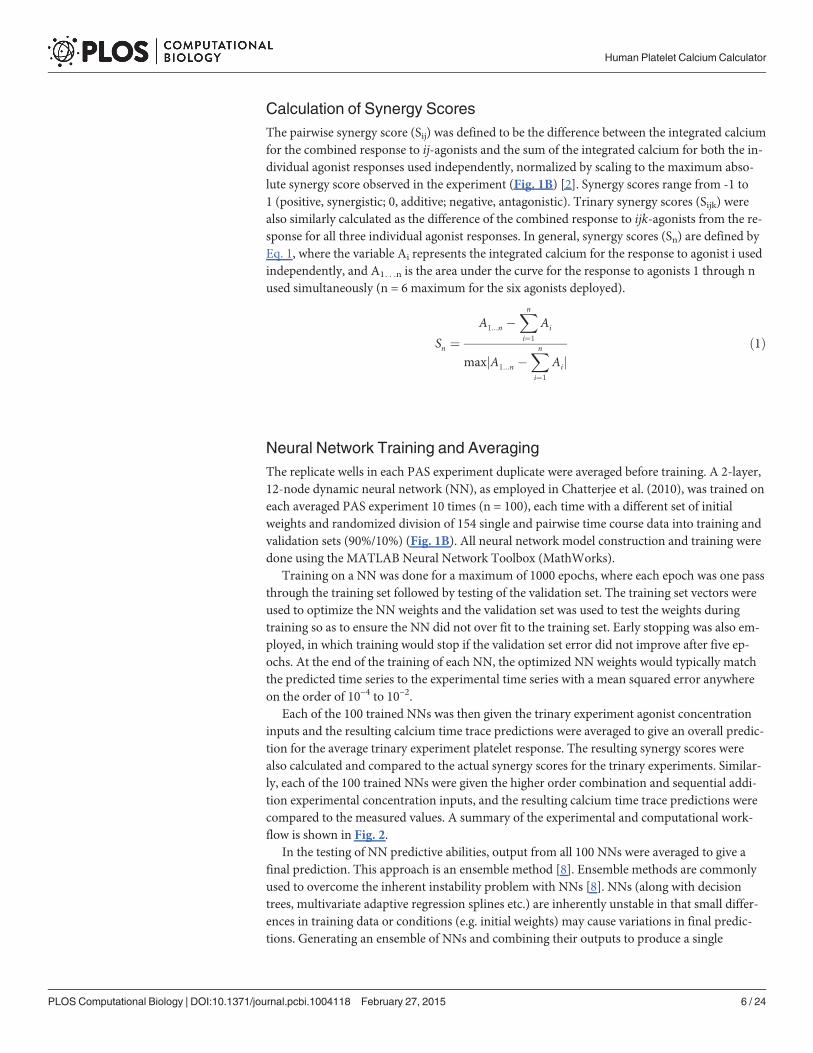
Calculation of Synergy ScoresThe pairwise synergy score (Sij) was defined to be the difference between the integrated calciumfor the combined response to ij-agonists and the sum of the integrated calcium for both the in-dividual agonist responses used independently, normalized by scaling to the maximum abso-lute synergy score observed in the experiment (Fig. 1B) [2]. Synergy scores range from -1 to1 (positive, synergistic; 0, additive; negative, antagonistic). Trinary synergy scores (Sijk) werealso similarly calculated as the difference of the combined response to ijk-agonists from the re-sponse for all three individual agonist responses. In general, synergy scores (Sn) are defined byEq. 1, where the variable Ai represents the integrated calcium for the response to agonist i usedindependently, and A1. . .n is the area under the curve for the response to agonists 1 through nused simultaneously (n = 6 maximum for the six agonists deployed).
Sn ¼A1...n �
Xn
i¼1
Ai
maxjA1...n �Xn
i¼1
Aijð1Þ
Neural Network Training and AveragingThe replicate wells in each PAS experiment duplicate were averaged before training. A 2-layer,12-node dynamic neural network (NN), as employed in Chatterjee et al. (2010), was trained oneach averaged PAS experiment 10 times (n = 100), each time with a different set of initialweights and randomized division of 154 single and pairwise time course data into training andvalidation sets (90%/10%) (Fig. 1B). All neural network model construction and training weredone using the MATLAB Neural Network Toolbox (MathWorks).
Training on a NN was done for a maximum of 1000 epochs, where each epoch was one passthrough the training set followed by testing of the validation set. The training set vectors wereused to optimize the NN weights and the validation set was used to test the weights duringtraining so as to ensure the NN did not over fit to the training set. Early stopping was also em-ployed, in which training would stop if the validation set error did not improve after five ep-ochs. At the end of the training of each NN, the optimized NN weights would typically matchthe predicted time series to the experimental time series with a mean squared error anywhereon the order of 10–4 to 10–2.
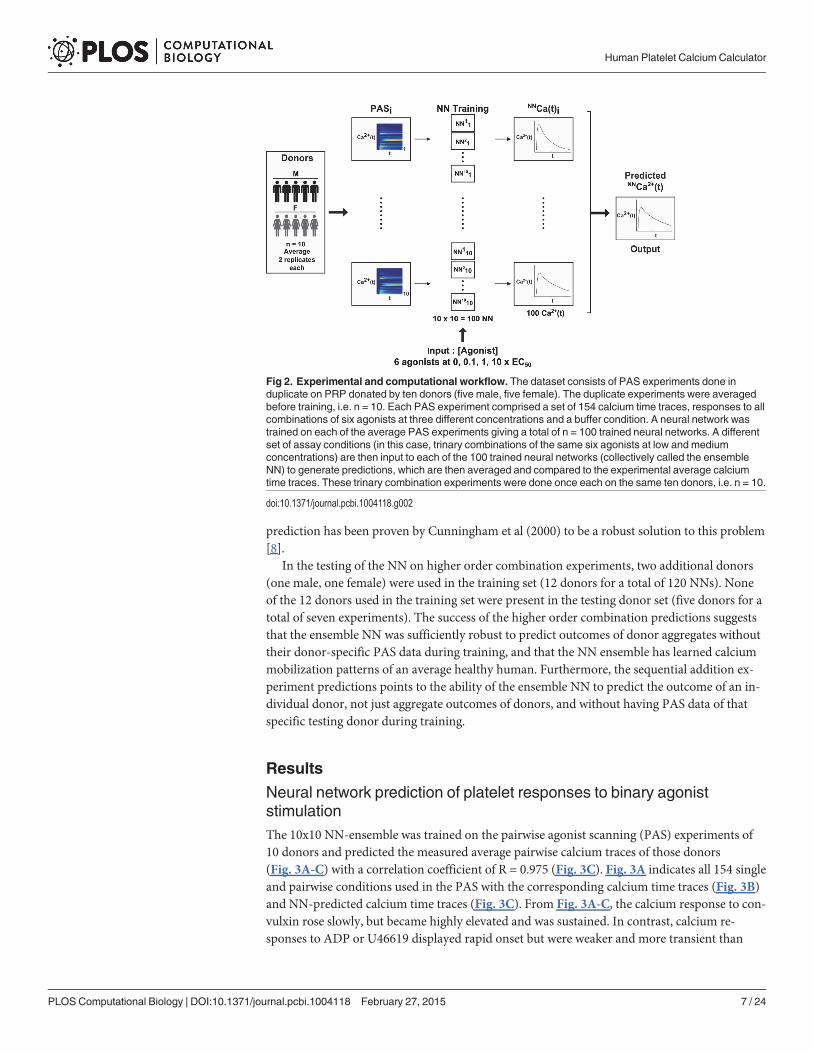
Each of the 100 trained NNs was then given the trinary experiment agonist concentrationinputs and the resulting calcium time trace predictions were averaged to give an overall predic-tion for the average trinary experiment platelet response. The resulting synergy scores werealso calculated and compared to the actual synergy scores for the trinary experiments. Similar-ly, each of the 100 trained NNs were given the higher order combination and sequential addi-tion experimental concentration inputs, and the resulting calcium time trace predictions werecompared to the measured values. A summary of the experimental and computational work-flow is shown in Fig. 2.
In the testing of NN predictive abilities, output from all 100 NNs were averaged to give afinal prediction. This approach is an ensemble method [8]. Ensemble methods are commonlyused to overcome the inherent instability problem with NNs [8]. NNs (along with decisiontrees, multivariate adaptive regression splines etc.) are inherently unstable in that small differ-ences in training data or conditions (e.g. initial weights) may cause variations in final predic-tions. Generating an ensemble of NNs and combining their outputs to produce a single
Human Platelet Calcium Calculator
PLOS Computational Biology | DOI:10.1371/journal.pcbi.1004118 February 27, 2015 6 / 24
prediction has been proven by Cunningham et al (2000) to be a robust solution to this problem[8].
In the testing of the NN on higher order combination experiments, two additional donors(one male, one female) were used in the training set (12 donors for a total of 120 NNs). Noneof the 12 donors used in the training set were present in the testing donor set (five donors for atotal of seven experiments). The success of the higher order combination predictions suggeststhat the ensemble NN was sufficiently robust to predict outcomes of donor aggregates withouttheir donor-specific PAS data during training, and that the NN ensemble has learned calciummobilization patterns of an average healthy human. Furthermore, the sequential addition ex-periment predictions points to the ability of the ensemble NN to predict the outcome of an in-dividual donor, not just aggregate outcomes of donors, and without having PAS data of thatspecific testing donor during training.
Results
Neural network prediction of platelet responses to binary agoniststimulationThe 10x10 NN-ensemble was trained on the pairwise agonist scanning (PAS) experiments of10 donors and predicted the measured average pairwise calcium traces of those donors(Fig. 3A-C) with a correlation coefficient of R = 0.975 (Fig. 3C). Fig. 3A indicates all 154 singleand pairwise conditions used in the PAS with the corresponding calcium time traces (Fig. 3B)and NN-predicted calcium time traces (Fig. 3C). From Fig. 3A-C, the calcium response to con-vulxin rose slowly, but became highly elevated and was sustained. In contrast, calcium re-sponses to ADP or U46619 displayed rapid onset but were weaker and more transient than
Fig 2. Experimental and computational workflow. The dataset consists of PAS experiments done induplicate on PRP donated by ten donors (five male, five female). The duplicate experiments were averagedbefore training, i.e. n = 10. Each PAS experiment comprised a set of 154 calcium time traces, responses to allcombinations of six agonists at three different concentrations and a buffer condition. A neural network wastrained on each of the average PAS experiments giving a total of n = 100 trained neural networks. A differentset of assay conditions (in this case, trinary combinations of the same six agonists at low and mediumconcentrations) are then input to each of the 100 trained neural networks (collectively called the ensembleNN) to generate predictions, which are then averaged and compared to the experimental average calciumtime traces. These trinary combination experiments were done once each on the same ten donors, i.e. n = 10.
doi:10.1371/journal.pcbi.1004118.g002
Human Platelet Calcium Calculator
PLOS Computational Biology | DOI:10.1371/journal.pcbi.1004118 February 27, 2015 7 / 24
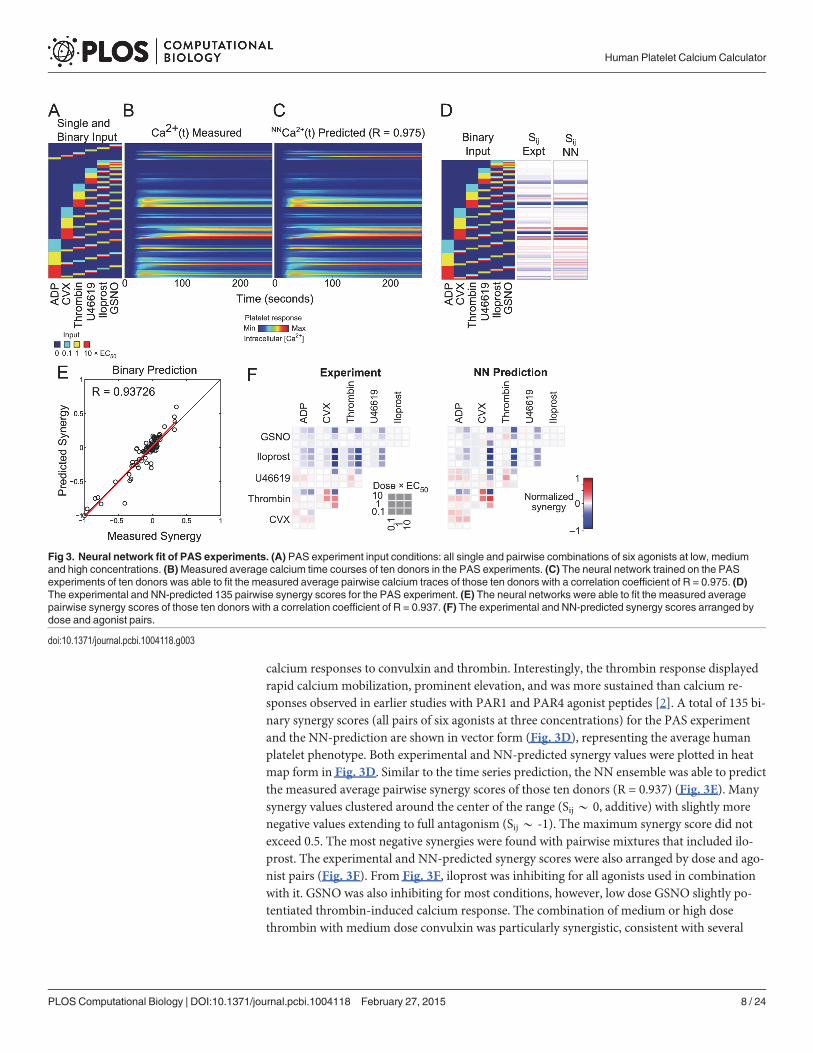
calcium responses to convulxin and thrombin. Interestingly, the thrombin response displayedrapid calcium mobilization, prominent elevation, and was more sustained than calcium re-sponses observed in earlier studies with PAR1 and PAR4 agonist peptides [2]. A total of 135 bi-nary synergy scores (all pairs of six agonists at three concentrations) for the PAS experimentand the NN-prediction are shown in vector form (Fig. 3D), representing the average humanplatelet phenotype. Both experimental and NN-predicted synergy values were plotted in heatmap form in Fig. 3D. Similar to the time series prediction, the NN ensemble was able to predictthe measured average pairwise synergy scores of those ten donors (R = 0.937) (Fig. 3E). Manysynergy values clustered around the center of the range (Sij* 0, additive) with slightly morenegative values extending to full antagonism (Sij * -1). The maximum synergy score did notexceed 0.5. The most negative synergies were found with pairwise mixtures that included ilo-prost. The experimental and NN-predicted synergy scores were also arranged by dose and ago-nist pairs (Fig. 3F). From Fig. 3F, iloprost was inhibiting for all agonists used in combinationwith it. GSNO was also inhibiting for most conditions, however, low dose GSNO slightly po-tentiated thrombin-induced calcium response. The combination of medium or high dosethrombin with medium dose convulxin was particularly synergistic, consistent with several
Fig 3. Neural network fit of PAS experiments. (A) PAS experiment input conditions: all single and pairwise combinations of six agonists at low, mediumand high concentrations. (B)Measured average calcium time courses of ten donors in the PAS experiments. (C) The neural network trained on the PASexperiments of ten donors was able to fit the measured average pairwise calcium traces of those ten donors with a correlation coefficient of R = 0.975. (D)The experimental and NN-predicted 135 pairwise synergy scores for the PAS experiment. (E) The neural networks were able to fit the measured averagepairwise synergy scores of those ten donors with a correlation coefficient of R = 0.937. (F) The experimental and NN-predicted synergy scores arranged bydose and agonist pairs.
doi:10.1371/journal.pcbi.1004118.g003
Human Platelet Calcium Calculator
PLOS Computational Biology | DOI:10.1371/journal.pcbi.1004118 February 27, 2015 8 / 24
findings [9,10]. Also, thrombin signaling was synergistic with thromboxane signaling which isa novel observation since both agonists signal through Gq.
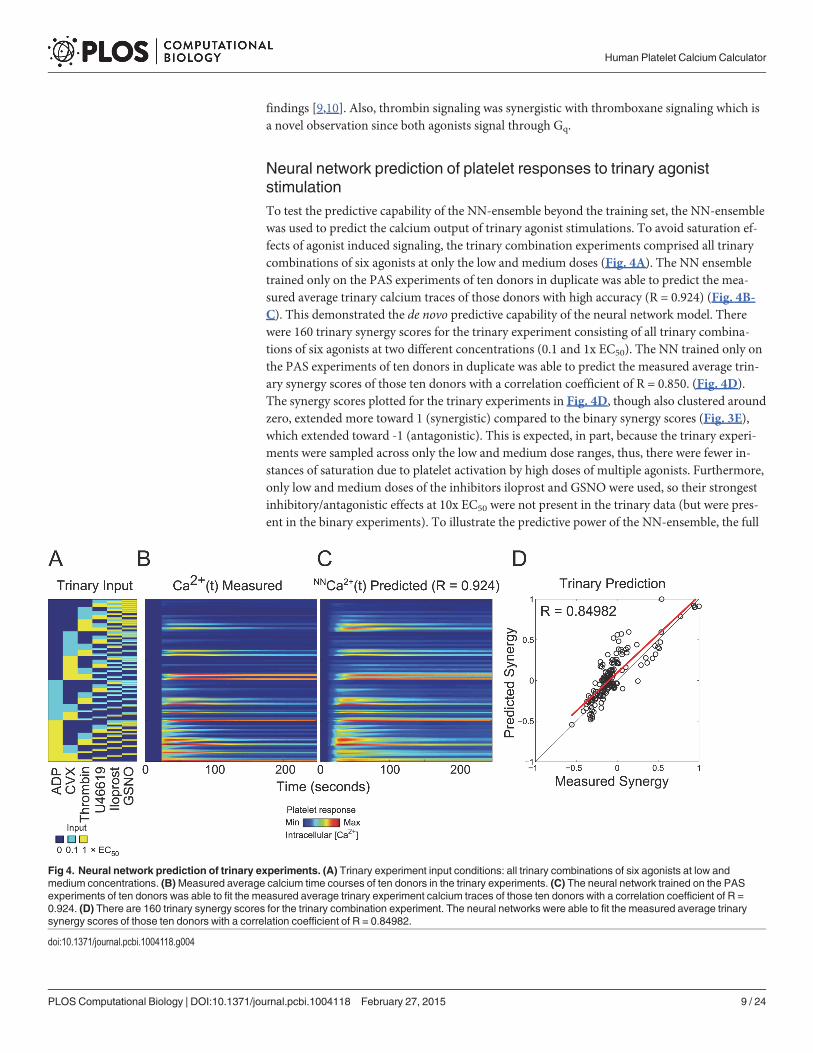
Neural network prediction of platelet responses to trinary agoniststimulationTo test the predictive capability of the NN-ensemble beyond the training set, the NN-ensemblewas used to predict the calcium output of trinary agonist stimulations. To avoid saturation ef-fects of agonist induced signaling, the trinary combination experiments comprised all trinarycombinations of six agonists at only the low and medium doses (Fig. 4A). The NN ensembletrained only on the PAS experiments of ten donors in duplicate was able to predict the mea-sured average trinary calcium traces of those donors with high accuracy (R = 0.924) (Fig. 4B-C). This demonstrated the de novo predictive capability of the neural network model. Therewere 160 trinary synergy scores for the trinary experiment consisting of all trinary combina-tions of six agonists at two different concentrations (0.1 and 1x EC50). The NN trained only onthe PAS experiments of ten donors in duplicate was able to predict the measured average trin-ary synergy scores of those ten donors with a correlation coefficient of R = 0.850. (Fig. 4D).The synergy scores plotted for the trinary experiments in Fig. 4D, though also clustered aroundzero, extended more toward 1 (synergistic) compared to the binary synergy scores (Fig. 3E),which extended toward -1 (antagonistic). This is expected, in part, because the trinary experi-ments were sampled across only the low and medium dose ranges, thus, there were fewer in-stances of saturation due to platelet activation by high doses of multiple agonists. Furthermore,only low and medium doses of the inhibitors iloprost and GSNO were used, so their strongestinhibitory/antagonistic effects at 10x EC50 were not present in the trinary data (but were pres-ent in the binary experiments). To illustrate the predictive power of the NN-ensemble, the full
Fig 4. Neural network prediction of trinary experiments. (A) Trinary experiment input conditions: all trinary combinations of six agonists at low andmedium concentrations. (B)Measured average calcium time courses of ten donors in the trinary experiments. (C) The neural network trained on the PASexperiments of ten donors was able to fit the measured average trinary experiment calcium traces of those ten donors with a correlation coefficient of R =0.924. (D) There are 160 trinary synergy scores for the trinary combination experiment. The neural networks were able to fit the measured average trinarysynergy scores of those ten donors with a correlation coefficient of R = 0.84982.
doi:10.1371/journal.pcbi.1004118.g004
Human Platelet Calcium Calculator
PLOS Computational Biology | DOI:10.1371/journal.pcbi.1004118 February 27, 2015 9 / 24
time series plots of a random sampling of the 160 trinary conditions are shown in Fig. 5. Fulltime series plots of all 160 trinary conditions rescaled to 0.5 are also shown in S6 Fig.. For thetrinary stimulations, the predicted calcium time traces fit the experimental data over the fulltime domain with remarkable accuracy.
The trinary agonist experiments embed information about platelet signaling during in vivohemostasis, thrombosis, or bleeding. For example, during the early stages of vessel wall injury,platelets are activated by collagen of the damaged vessel wall [11] which can also generatethrombin via the extrinsic pathway (distal of tissue factor). Concomitantly, endothelium-de-rived nitric oxide and prostacyclin modulate platelet functions. Therefore at this early stage theplatelet is mainly exposed to these three agonists: exposed collagen, prevailing nitric oxide andprostacyclin, while thrombin is dynamically generated. Soluble agonists such as ADP andthromboxane become critically important during platelet mass build-up (sometimes called sec-ondary aggregation) when activated platelets release ADP from dense granules and generatethromboxane via COX-1. Recent in vivo and in vitro studies reveal that the platelets in the“core” are exposed to high levels of thrombin, while the outer shell of platelets see little throm-bin but are especially sensitive to the presence of thromboxane [12–16].
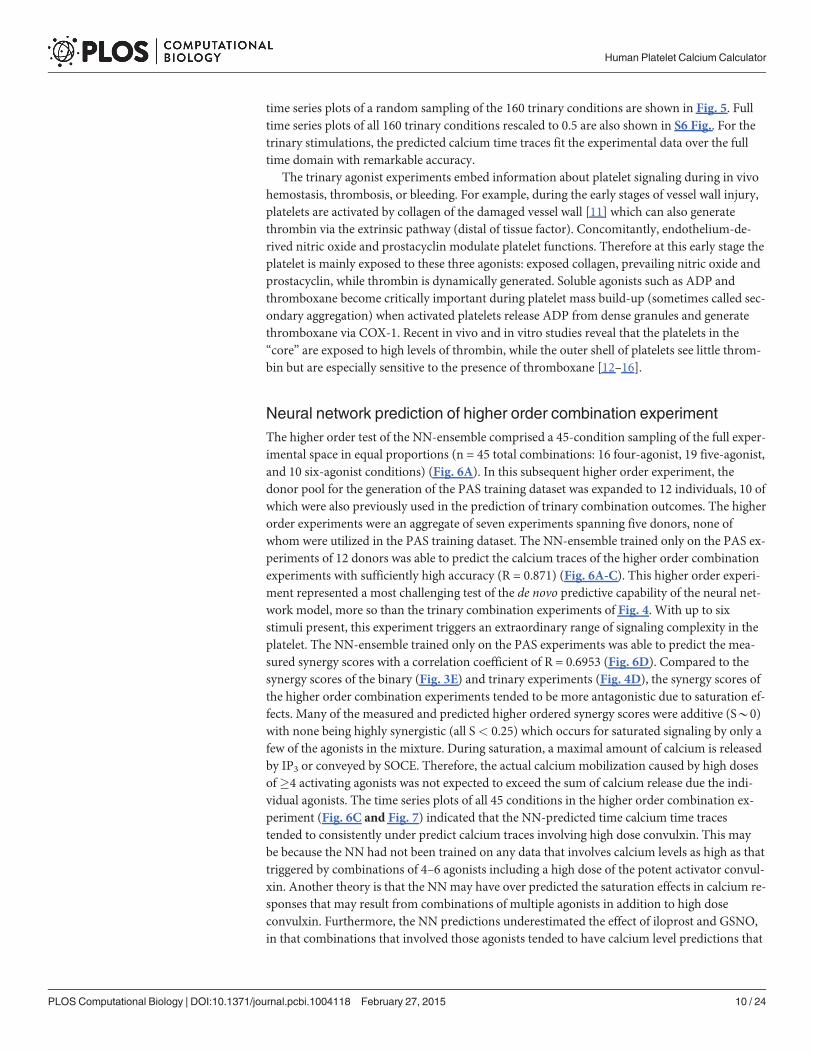
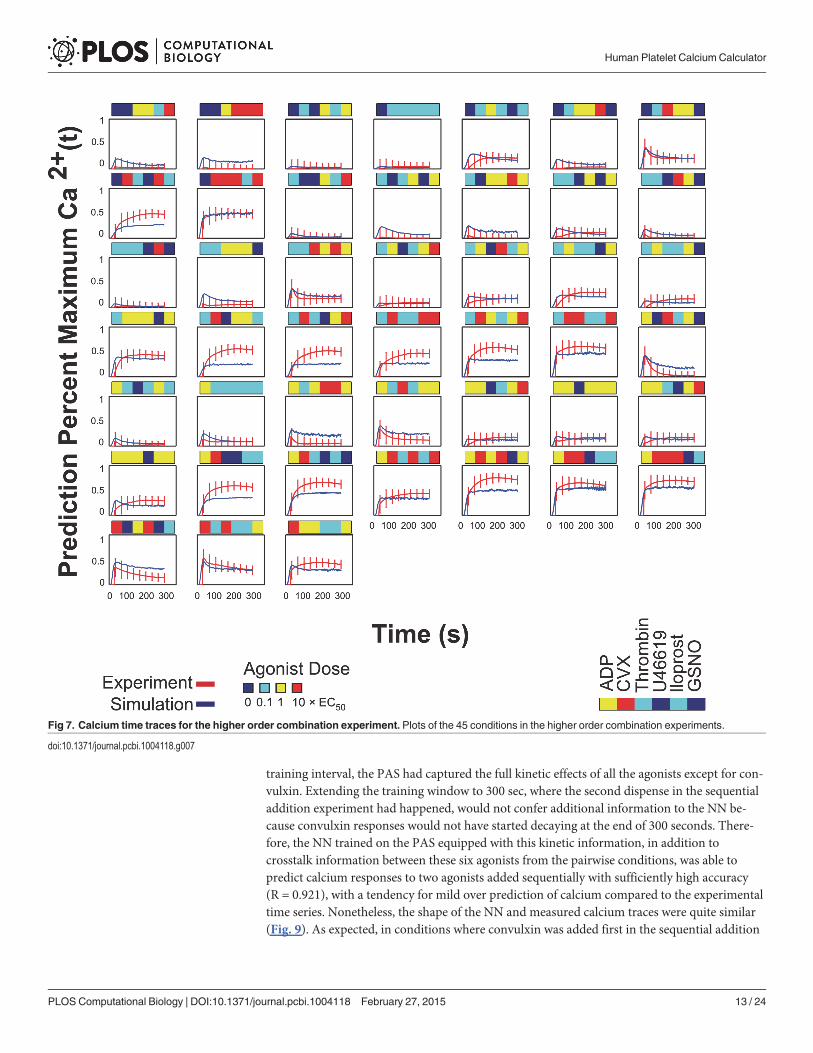
Neural network prediction of higher order combination experimentThe higher order test of the NN-ensemble comprised a 45-condition sampling of the full exper-imental space in equal proportions (n = 45 total combinations: 16 four-agonist, 19 five-agonist,and 10 six-agonist conditions) (Fig. 6A). In this subsequent higher order experiment, thedonor pool for the generation of the PAS training dataset was expanded to 12 individuals, 10 ofwhich were also previously used in the prediction of trinary combination outcomes. The higherorder experiments were an aggregate of seven experiments spanning five donors, none ofwhom were utilized in the PAS training dataset. The NN-ensemble trained only on the PAS ex-periments of 12 donors was able to predict the calcium traces of the higher order combinationexperiments with sufficiently high accuracy (R = 0.871) (Fig. 6A-C). This higher order experi-ment represented a most challenging test of the de novo predictive capability of the neural net-work model, more so than the trinary combination experiments of Fig. 4. With up to sixstimuli present, this experiment triggers an extraordinary range of signaling complexity in theplatelet. The NN-ensemble trained only on the PAS experiments was able to predict the mea-sured synergy scores with a correlation coefficient of R = 0.6953 (Fig. 6D). Compared to thesynergy scores of the binary (Fig. 3E) and trinary experiments (Fig. 4D), the synergy scores ofthe higher order combination experiments tended to be more antagonistic due to saturation ef-fects. Many of the measured and predicted higher ordered synergy scores were additive (S*0)with none being highly synergistic (all S< 0.25) which occurs for saturated signaling by only afew of the agonists in the mixture. During saturation, a maximal amount of calcium is releasedby IP3 or conveyed by SOCE. Therefore, the actual calcium mobilization caused by high dosesof�4 activating agonists was not expected to exceed the sum of calcium release due the indi-vidual agonists. The time series plots of all 45 conditions in the higher order combination ex-periment (Fig. 6C and Fig. 7) indicated that the NN-predicted time calcium time tracestended to consistently under predict calcium traces involving high dose convulxin. This maybe because the NN had not been trained on any data that involves calcium levels as high as thattriggered by combinations of 4–6 agonists including a high dose of the potent activator convul-xin. Another theory is that the NNmay have over predicted the saturation effects in calcium re-sponses that may result from combinations of multiple agonists in addition to high doseconvulxin. Furthermore, the NN predictions underestimated the effect of iloprost and GSNO,in that combinations that involved those agonists tended to have calcium level predictions that
Human Platelet Calcium Calculator
PLOS Computational Biology | DOI:10.1371/journal.pcbi.1004118 February 27, 2015 10 / 24
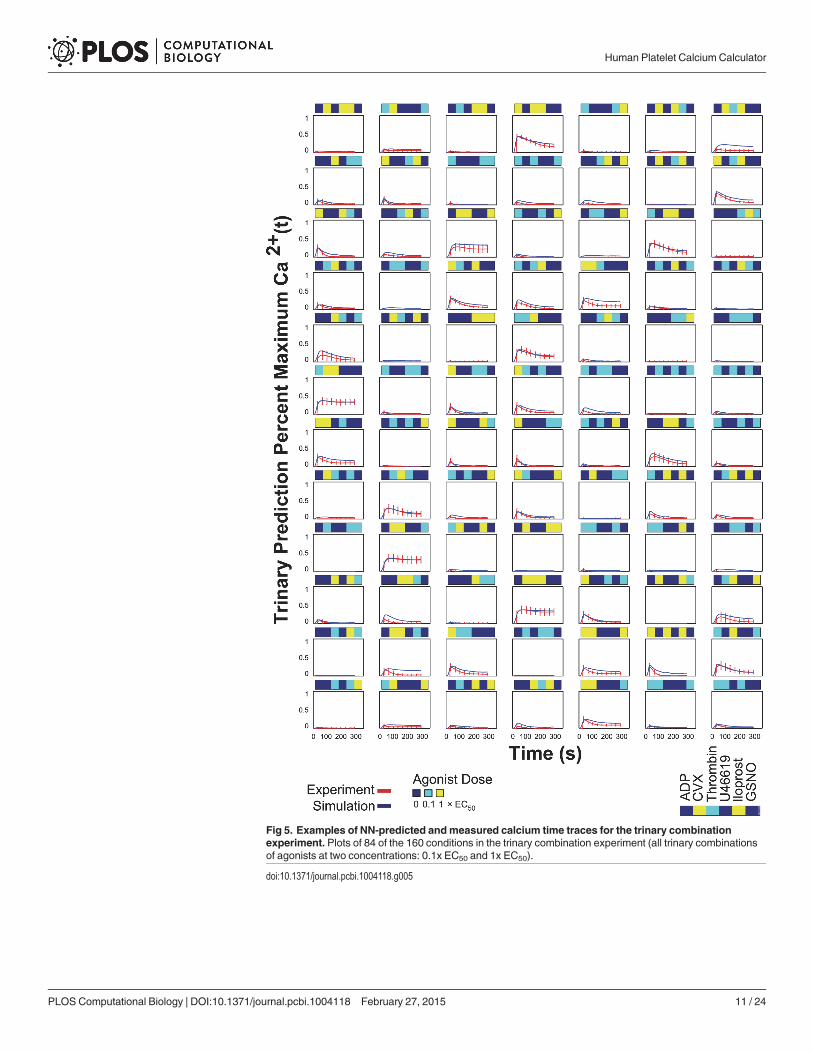
Fig 5. Examples of NN-predicted andmeasured calcium time traces for the trinary combinationexperiment. Plots of 84 of the 160 conditions in the trinary combination experiment (all trinary combinationsof agonists at two concentrations: 0.1x EC50 and 1x EC50).
doi:10.1371/journal.pcbi.1004118.g005
Human Platelet Calcium Calculator
PLOS Computational Biology | DOI:10.1371/journal.pcbi.1004118 February 27, 2015 11 / 24
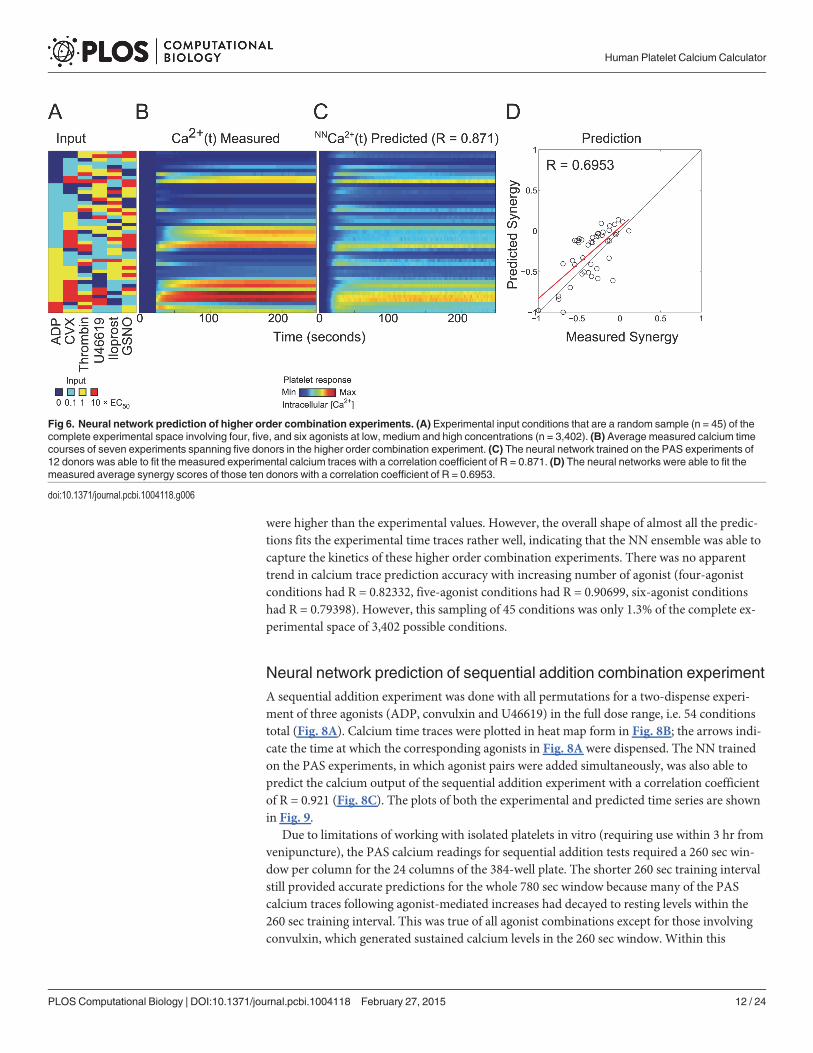
were higher than the experimental values. However, the overall shape of almost all the predic-tions fits the experimental time traces rather well, indicating that the NN ensemble was able tocapture the kinetics of these higher order combination experiments. There was no apparenttrend in calcium trace prediction accuracy with increasing number of agonist (four-agonistconditions had R = 0.82332, five-agonist conditions had R = 0.90699, six-agonist conditionshad R = 0.79398). However, this sampling of 45 conditions was only 1.3% of the complete ex-perimental space of 3,402 possible conditions.
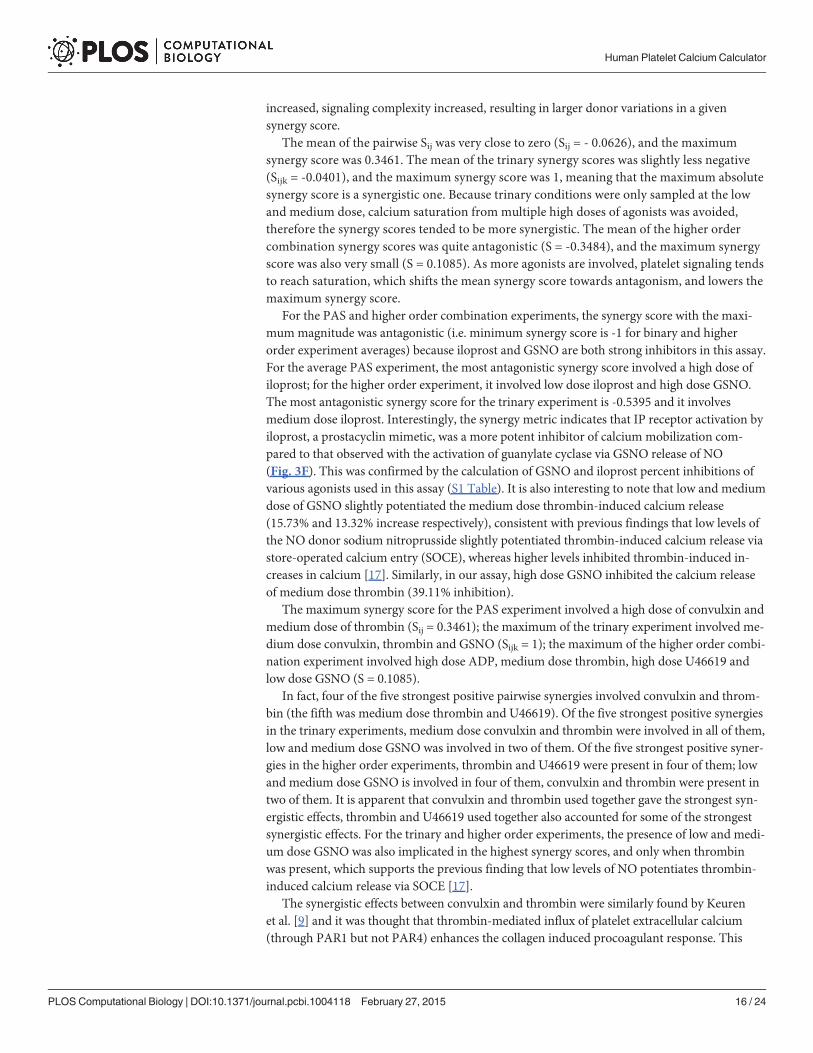
Neural network prediction of sequential addition combination experimentA sequential addition experiment was done with all permutations for a two-dispense experi-ment of three agonists (ADP, convulxin and U46619) in the full dose range, i.e. 54 conditionstotal (Fig. 8A). Calcium time traces were plotted in heat map form in Fig. 8B; the arrows indi-cate the time at which the corresponding agonists in Fig. 8A were dispensed. The NN trainedon the PAS experiments, in which agonist pairs were added simultaneously, was also able topredict the calcium output of the sequential addition experiment with a correlation coefficientof R = 0.921 (Fig. 8C). The plots of both the experimental and predicted time series are shownin Fig. 9.
Due to limitations of working with isolated platelets in vitro (requiring use within 3 hr fromvenipuncture), the PAS calcium readings for sequential addition tests required a 260 sec win-dow per column for the 24 columns of the 384-well plate. The shorter 260 sec training intervalstill provided accurate predictions for the whole 780 sec window because many of the PAScalcium traces following agonist-mediated increases had decayed to resting levels within the260 sec training interval. This was true of all agonist combinations except for those involvingconvulxin, which generated sustained calcium levels in the 260 sec window. Within this
Fig 6. Neural network prediction of higher order combination experiments. (A) Experimental input conditions that are a random sample (n = 45) of thecomplete experimental space involving four, five, and six agonists at low, medium and high concentrations (n = 3,402). (B) Average measured calcium timecourses of seven experiments spanning five donors in the higher order combination experiment. (C) The neural network trained on the PAS experiments of12 donors was able to fit the measured experimental calcium traces with a correlation coefficient of R = 0.871. (D) The neural networks were able to fit themeasured average synergy scores of those ten donors with a correlation coefficient of R = 0.6953.
doi:10.1371/journal.pcbi.1004118.g006
Human Platelet Calcium Calculator
PLOS Computational Biology | DOI:10.1371/journal.pcbi.1004118 February 27, 2015 12 / 24
training interval, the PAS had captured the full kinetic effects of all the agonists except for con-vulxin. Extending the training window to 300 sec, where the second dispense in the sequentialaddition experiment had happened, would not confer additional information to the NN be-cause convulxin responses would not have started decaying at the end of 300 seconds. There-fore, the NN trained on the PAS equipped with this kinetic information, in addition tocrosstalk information between these six agonists from the pairwise conditions, was able topredict calcium responses to two agonists added sequentially with sufficiently high accuracy(R = 0.921), with a tendency for mild over prediction of calcium compared to the experimentaltime series. Nonetheless, the shape of the NN and measured calcium traces were quite similar(Fig. 9). As expected, in conditions where convulxin was added first in the sequential addition
Fig 7. Calcium time traces for the higher order combination experiment. Plots of the 45 conditions in the higher order combination experiments.
doi:10.1371/journal.pcbi.1004118.g007
Human Platelet Calcium Calculator
PLOS Computational Biology | DOI:10.1371/journal.pcbi.1004118 February 27, 2015 13 / 24
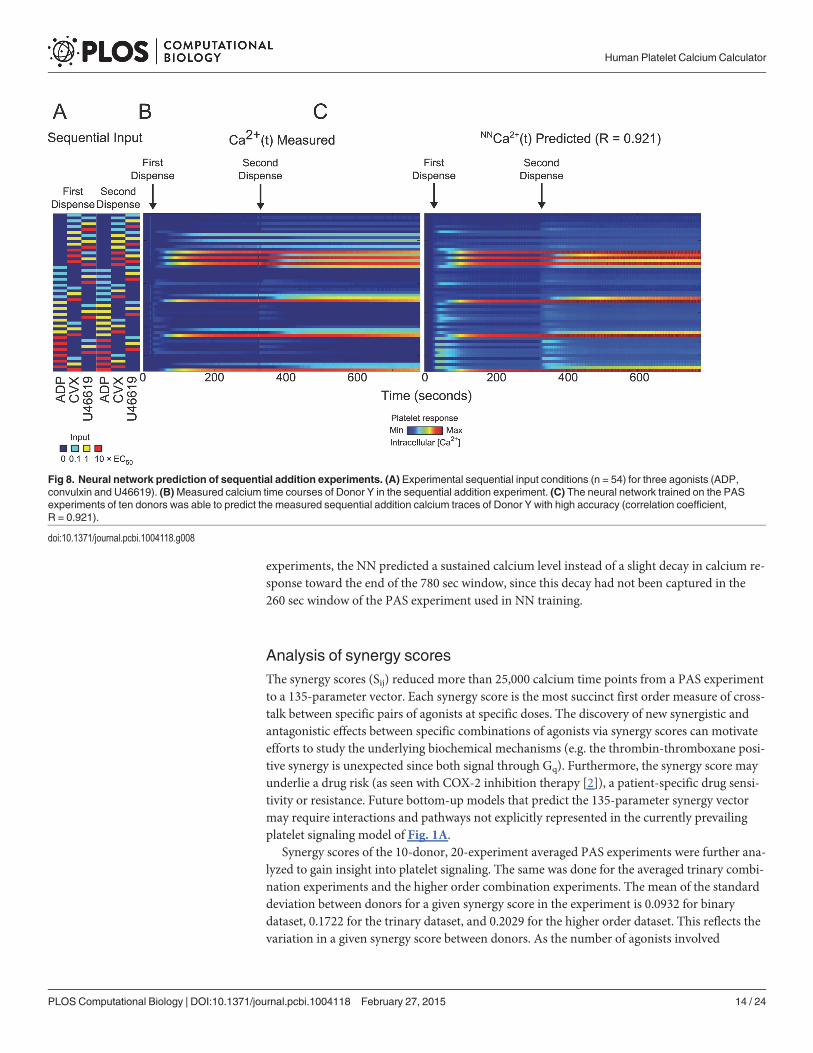
experiments, the NN predicted a sustained calcium level instead of a slight decay in calcium re-sponse toward the end of the 780 sec window, since this decay had not been captured in the260 sec window of the PAS experiment used in NN training.
Analysis of synergy scoresThe synergy scores (Sij) reduced more than 25,000 calcium time points from a PAS experimentto a 135-parameter vector. Each synergy score is the most succinct first order measure of cross-talk between specific pairs of agonists at specific doses. The discovery of new synergistic andantagonistic effects between specific combinations of agonists via synergy scores can motivateefforts to study the underlying biochemical mechanisms (e.g. the thrombin-thromboxane posi-tive synergy is unexpected since both signal through Gq). Furthermore, the synergy score mayunderlie a drug risk (as seen with COX-2 inhibition therapy [2]), a patient-specific drug sensi-tivity or resistance. Future bottom-up models that predict the 135-parameter synergy vectormay require interactions and pathways not explicitly represented in the currently prevailingplatelet signaling model of Fig. 1A.
Synergy scores of the 10-donor, 20-experiment averaged PAS experiments were further ana-lyzed to gain insight into platelet signaling. The same was done for the averaged trinary combi-nation experiments and the higher order combination experiments. The mean of the standarddeviation between donors for a given synergy score in the experiment is 0.0932 for binarydataset, 0.1722 for the trinary dataset, and 0.2029 for the higher order dataset. This reflects thevariation in a given synergy score between donors. As the number of agonists involved
Fig 8. Neural network prediction of sequential addition experiments. (A) Experimental sequential input conditions (n = 54) for three agonists (ADP,convulxin and U46619). (B)Measured calcium time courses of Donor Y in the sequential addition experiment. (C) The neural network trained on the PASexperiments of ten donors was able to predict the measured sequential addition calcium traces of Donor Y with high accuracy (correlation coefficient,R = 0.921).
doi:10.1371/journal.pcbi.1004118.g008
Human Platelet Calcium Calculator
PLOS Computational Biology | DOI:10.1371/journal.pcbi.1004118 February 27, 2015 14 / 24
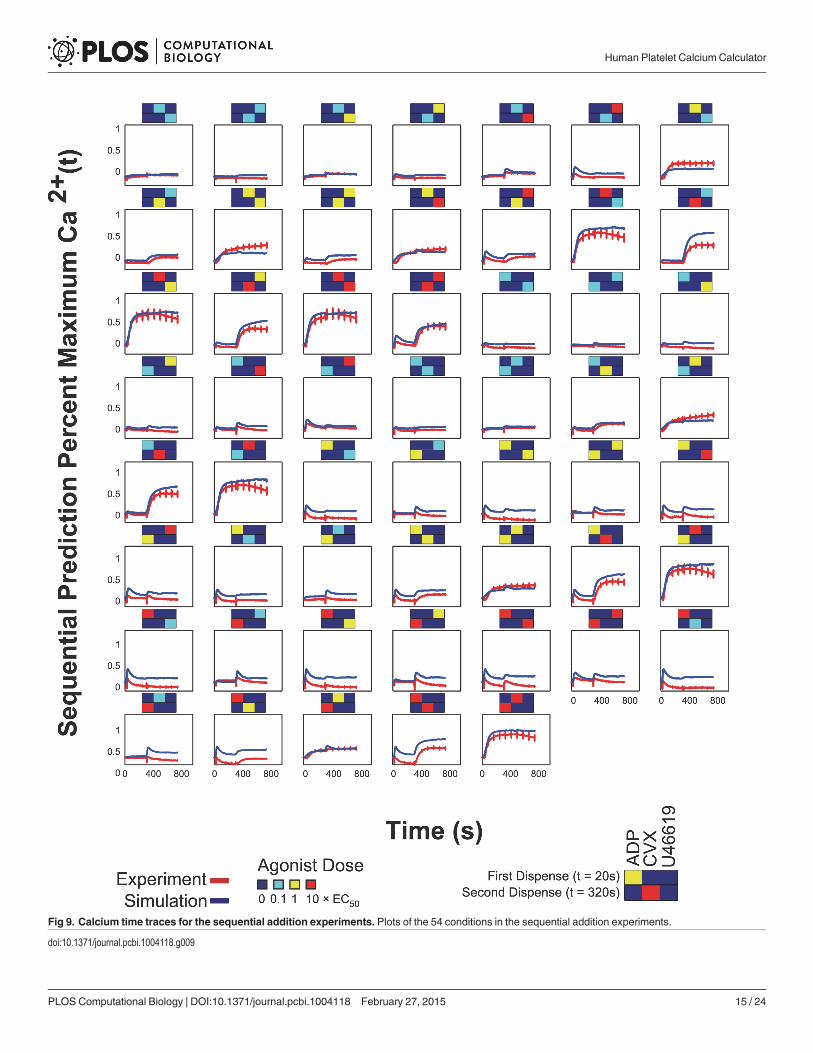
Fig 9. Calcium time traces for the sequential addition experiments. Plots of the 54 conditions in the sequential addition experiments.
doi:10.1371/journal.pcbi.1004118.g009
Human Platelet Calcium Calculator
PLOS Computational Biology | DOI:10.1371/journal.pcbi.1004118 February 27, 2015 15 / 24
increased, signaling complexity increased, resulting in larger donor variations in a givensynergy score.
The mean of the pairwise Sij was very close to zero (Sij = - 0.0626), and the maximumsynergy score was 0.3461. The mean of the trinary synergy scores was slightly less negative(Sijk = -0.0401), and the maximum synergy score was 1, meaning that the maximum absolutesynergy score is a synergistic one. Because trinary conditions were only sampled at the lowand medium dose, calcium saturation from multiple high doses of agonists was avoided,therefore the synergy scores tended to be more synergistic. The mean of the higher ordercombination synergy scores was quite antagonistic (S = -0.3484), and the maximum synergyscore was also very small (S = 0.1085). As more agonists are involved, platelet signaling tendsto reach saturation, which shifts the mean synergy score towards antagonism, and lowers themaximum synergy score.
For the PAS and higher order combination experiments, the synergy score with the maxi-mummagnitude was antagonistic (i.e. minimum synergy score is -1 for binary and higherorder experiment averages) because iloprost and GSNO are both strong inhibitors in this assay.For the average PAS experiment, the most antagonistic synergy score involved a high dose ofiloprost; for the higher order experiment, it involved low dose iloprost and high dose GSNO.The most antagonistic synergy score for the trinary experiment is -0.5395 and it involvesmedium dose iloprost. Interestingly, the synergy metric indicates that IP receptor activation byiloprost, a prostacyclin mimetic, was a more potent inhibitor of calcium mobilization com-pared to that observed with the activation of guanylate cyclase via GSNO release of NO(Fig. 3F). This was confirmed by the calculation of GSNO and iloprost percent inhibitions ofvarious agonists used in this assay (S1 Table). It is also interesting to note that low and mediumdose of GSNO slightly potentiated the medium dose thrombin-induced calcium release(15.73% and 13.32% increase respectively), consistent with previous findings that low levels ofthe NO donor sodium nitroprusside slightly potentiated thrombin-induced calcium release viastore-operated calcium entry (SOCE), whereas higher levels inhibited thrombin-induced in-creases in calcium [17]. Similarly, in our assay, high dose GSNO inhibited the calcium releaseof medium dose thrombin (39.11% inhibition).
The maximum synergy score for the PAS experiment involved a high dose of convulxin andmedium dose of thrombin (Sij = 0.3461); the maximum of the trinary experiment involved me-dium dose convulxin, thrombin and GSNO (Sijk = 1); the maximum of the higher order combi-nation experiment involved high dose ADP, medium dose thrombin, high dose U46619 andlow dose GSNO (S = 0.1085).
In fact, four of the five strongest positive pairwise synergies involved convulxin and throm-bin (the fifth was medium dose thrombin and U46619). Of the five strongest positive synergiesin the trinary experiments, medium dose convulxin and thrombin were involved in all of them,low and medium dose GSNO was involved in two of them. Of the five strongest positive syner-gies in the higher order experiments, thrombin and U46619 were present in four of them; lowand medium dose GSNO is involved in four of them, convulxin and thrombin were present intwo of them. It is apparent that convulxin and thrombin used together gave the strongest syn-ergistic effects, thrombin and U46619 used together also accounted for some of the strongestsynergistic effects. For the trinary and higher order experiments, the presence of low and medi-um dose GSNO was also implicated in the highest synergy scores, and only when thrombinwas present, which supports the previous finding that low levels of NO potentiates thrombin-induced calcium release via SOCE [17].
The synergistic effects between convulxin and thrombin were similarly found by Keurenet al. [9] and it was thought that thrombin-mediated influx of platelet extracellular calcium(through PAR1 but not PAR4) enhances the collagen induced procoagulant response. This
Human Platelet Calcium Calculator
PLOS Computational Biology | DOI:10.1371/journal.pcbi.1004118 February 27, 2015 16 / 24
may explain why the synergistic effects between convulxin and the PAR1 agonist were not asprominent in previous PAS work that was done in the absence of extracellular calcium [1]. An-other study that found similar synergistic effects between sub threshold concentrations ofthrombin and GPVI showed that the synergism was independent of Src kinases and Syk [10].As previously observed with EDTA-treated PRP activated by PAR1 agonist peptide andU46619 [2], thrombin activation of PAR1/PAR4 and the thromboxane mimetic U46619 weresynergistic (Sij = 0.1127 at medium dose of thrombin and low dose U46619), and especially atmedium doses of thrombin and U46619 (Sij = 0.1766).
Inhibition of calcium release by iloprostIloprost and GSNO when used alone or together with each other had no effect on platelet calci-um (top 9 binary conditions of Fig. 3A-C), as expected. However, these compounds elevatecAMP and cGMP to attenuate calcium mobilization [18–20] and this inhibition was clearlyseen in the calcium traces (Figs. 5, 7).
Iloprost was a potent, rapid, and sustained inhibitor of convulxin activity (99.6–99.7% inhi-bition overall) (S4B, S4H Fig.), indicating that IP signaling was more rapid than GPVI signal-ing. Furthermore, iloprost was more potent than GSNO in inhibiting activity of all agoniststhis assay, for example, medium dose GSNO caused only 18.6% inhibition of convulxin activity(S1 Table). Convulxin caused slow platelet activation since it must multimerize GPVI to inducesignaling [21]. During thrombin activation of PAR1/4, the inhibition by iloprost was also rapid(as seen by the offset in peak calcium levels), but was incomplete initially and became morepronounced after approximately 25 seconds post-stimulation (S4D, S4J Fig.). Low and medi-um levels of iloprost (0.1 and 1 x EC50) resulted in similar inhibition of thrombin calcium re-lease (*76.3 to 78.9% inhibition (S4D, S4J Fig.). In the experiments with thrombin, iloprostmay have a diffusive and kinetic advantage over thrombin which must cleave PAR1/4 whereasiloprost simply must the bind IP receptor. A similar pattern was observed for ADP (S4M, S4NFig.). However, there was no offset in peak calcium levels, potentially due to similar diffusiveand binding kinetics of these two small molecules for their respective receptors. The inhibitionby iloprost of ADP signaling only began after ADP-induced calcium level peaked around20 seconds post-stimulation (41.5% to 71.7% inhibition at 0.1 and 1 x EC50, respectively). Dur-ing U46619 stimulation of TP receptor, the inhibition by iloprost was apparent immediatelyafter dispense and increased after calcium levels peaked (* 20 sec post-stimulation). Iloprostwas slightly more potent against U46619 compared to ADP, causing 87.4% to 91.6% inhibitionat 0.1 and 1 x EC50, respectively (S4F, S4L Fig.). Overall, iloprost was more fast-acting and po-tent against the slower signaling agonists such as convulxin (99.6–99.7% inhibition) or throm-bin (*76–79% inhibition) that required receptor multimerization or enzymatic cleavage,compared to small molecules that rapidly equilibrated with their receptors such as U46619(87–92% inhibition) or ADP (41–72% inhibition). Iloprost may be less active against ADPcompared to U46619 since ADP also binds the P2Y12 receptor which antagonizes cAMP path-ways (Fig. 1A).
When ADP and convulxin were used simultaneously, ADP signaling dominated early calci-um mobilization while convulxin signaling maintained sustained calcium levels. (S4A, S4GFig.) With combined ADP/convulxin stimulation, medium dose iloprost resulted in only71.1% inhibition (S4G Fig.) since it was not a complete blocker of the early signaling (att< 30 sec) induced by ADP. A similar trend occurred with thrombin/convulxin co-stimulation(S4C, S4I Fig.), however, iloprost was more effective in this case (83.5% inhibition with medi-um dose iloprost, S4I Fig.) since thrombin/convulxin co-stimulation elevated calcium relative-ly slowly. When the weaker agonist U46619 (compared to ADP) was used with convulxin,
Human Platelet Calcium Calculator
PLOS Computational Biology | DOI:10.1371/journal.pcbi.1004118 February 27, 2015 17 / 24
iloprost remained a very potent inhibitor (98.9% inhibition with medium dose iloprost, S4E,S4K Fig.).
Range of individual neural network prediction and donor responsesThe range (i.e. intradonor variation) of individual NN predictions over 10 to 12 donors for sin-gle and pairwise agonist conditions (S5 Fig.) was comparable to the experimental observations,as expected for NNs trained exactly on those conditions (S5A, S5B Fig.). Similarly, the rangeof NN predictions for trinary agonist conditions matched the range for the experimental valuesas well (S5C Fig.). The range of the higher order NN predictions (� 4 agonists) was somewhatlarger than the range observed in the corresponding individual experiments (S5D–S5F Fig.).Clearly for� 4 agonists, the signaling pathways span a very complex platelet biology beyondthe dimensionality of the pairwise training data. Nonetheless, the range of the NN predictionsreflected to a large degree the range of the experiment itself. For example, the range of the NN-predictions in S5E Fig. was smaller than the range in S5D Fig.; the same trend was reflected inthe range of the actual experiments. Furthermore, for� 4 agonists, the experimental datacomprises seven experiments spanning five donors, whereas the NN used in training spanned12 donors, which in part explains why simulation ranges were larger than ranges of experimen-tal observations. The NN range over all 120 NNs in S5D Fig. was larger than the experimentalranges, potentially reflecting donor variation but more importantly reflecting the difficulty ofpredicting higher dimensional responses. Despite the substantial range of individual NN pre-dictions for the four-agonist condition depicted in S5D Fig., the mean of the NN predictionspredicted the mean response of the actual experiments, a benefit of the NN-ensemble approachfor predicting a pooled population dynamic.
DiscussionWhile the full complexity of receptor mediated signaling in platelets extends well beyond theknown pathways indicated in Fig. 1A, a top-down approach using pairwise agonist scanning(PAS) provides an efficient data-driven method to predict platelet function. By using data ob-tained from multiple donors and training multiple NNs for each donor, a NN-ensemble(Fig. 2) allowed accurate prediction of 135 binary stimulations and 135 synergy parameters(Fig. 3). The synergy vector composed of the 135 synergy parameters is an experimentallymeasured human platelet phenotype (healthy adult male and female) that is fully predicted bythe NN-ensemble. Furthermore, the NN-ensemble provided suitable prediction beyond the bi-nary training set to predict trinary responses (Figs. 4–5), higher ordered responses (Figs. 6–7),and response to sequential stimuli (Figs. 8–9).
The major components of hemostasis and thrombosis that regulate platelet activation stateare now quantitatively captured in the NN-ensemble. For large scale simulation of blood func-tion, a user may specify or calculate any combination of the six agonists at different concentra-tions to produce a dynamic platelet calcium response representative of a healthy human donor.The NN is able to do this mainly because individual and pairwise interactions dominate plateletcalcium signaling crosstalk in this assay, and because all single agonists are sampled across eachof their full dose ranges [2]. An ordinary differential equation (ODE) model describing the calci-ummobilization mediated by all six PAS agonists would likely require an estimated>500 kineticparameters, many of which are unavailable [2].
From the perspective of a data-driven and top-down approach, NNs have proven quite ro-bust and well matched to PAS data sets. Also NNs are ideal for multiscale simulations that in-volve crosstalk between receptors. However, NNs are not mechanistic models for identificationor quantification of basic biochemical mechanisms. To facilitate future mechanistic model
Human Platelet Calcium Calculator
PLOS Computational Biology | DOI:10.1371/journal.pcbi.1004118 February 27, 2015 18 / 24
building, the full calcium data set is provided (S1 Dataset). For example, future mechanisticmodels of receptor signaling and crosstalk should be testable against the 135-parameter syner-gy map we measured. Such mechanistic models should account for RGS proteins, PKC, cAMP/PKA, cGMP/PKG, and phosphodiesterase pathways, as well as receptor desensitization path-ways including ITIM/Shp2 phosphatase, receptor internalization, and receptor shedding path-ways, along with regulation of store operated calcium entry. Improved predictive capability isnot necessarily an outcome of constraining of NN nodes and linkages to a preconceived reac-tion topology (Fig. 1).
The calcium experiments that the NN was trained on included the contributions of SOCEbecause Apixaban was used in place of a calcium chelator as an anticoagulant. The effect ofautocrinic effects by ADP and thromboxane secretion, however, were not significant in thePAS assay due to the dilute conditions of the assay (S3 Fig.). Such autocrinic effects howeverare naturally captured in multiscale simulations that include convection-diffusion of solubleagonists [6]. Other important inside-out signaling downstream of calcium mobilization, suchas integrin engagement, granule release, shape change, and phosphatidylserine exposure can besimulated by incorporating the calcium model into a larger fine or coarse-grain model. For ex-ample, in Flamm et al. (2011), NN were trained via PAS using calcium-containing PRP andthen used to predict platelet deposition rates on collagen in the absence of thrombin by ac-counting for platelet signaling in response to laboratory analogs of collagen, ADP, thrombox-ane, and prostacyclin [6]. Alternatively, the PAS methodology has also been adapted by Jaegeret al. [22] for flow cytometry instead of calcium measurements, so as to quantify inside-out sig-naling events such as: integrin α(IIb)β(3) activation, P-selectin exposure, and PS exposureusing PAC-1, anti-P-selectin antibody, and annexin V, respectively.
The NN ensemble trained only on pairwise data was able to predict the calcium output ofhigher order agonist combination experiments with reasonably high accuracy. This was poten-tially due to a sparsity-of-effects principle: a system is largely dictated by main effects andlower order interaction [23]. Adding trinary conditions to the training data might theoreticallyimprove prediction accuracy when it comes to higher order combinations. The improvementin accuracy should be a measure of the information content of trinary data. In separate studies,we tested the utility of adding trinary stimulation data to the PAS training set in order to en-hance the predictive capability of the NN-ensemble. Trinary data were incorporated into theNN ensemble in 3 different ways, each time controlling for the number of NNs in the ensem-ble. The first set of trinary data collected comprised 160 trinary combinations of all six agonistsat only low and medium concentrations, repeated on 10 donors. Adding this trinary data re-duced the higher-order combination prediction accuracy from R = 0.824 to R = 0.784, and syn-ergy score accuracy decreased from 0.66936 to 0.66145. The second set of trinary data collectedcomprised 27 combinations of only three agonists (ADP, convulxin, U46619) in the full doserange, repeated on eight donors. Adding this trinary data did not substantially affect the predic-tion accuracy (calcium trace accuracy from R = 0.810 to R = 0.806, and synergy correlationfrom R = 0.66367 to R = 0.68387). The third set of trinary data collected was an unbiased, ran-dom sampling (n = 54) of the complete trinary space done on a single donor, who was not partof the original PAS dataset. Adding this trinary data increased prediction accuracy of the timecourses (from R = 0.871 to R = 0.906), but reduced the accuracy of synergy scores predictionfrom R = 0.6953 to R = 0.53925. We conclude that incorporating a randomly sampled trinarydataset can moderately increase prediction accuracy, whereas adding a biased sample of thetrinary space does not increase accuracy. In fact, adding a sample of the trinary space that doesnot span the full dose range may reduce accuracy. However, even in the best of the three sce-narios tested, adding trinary data to the PAS training dataset did not substantially improveaccuracy.
Human Platelet Calcium Calculator
PLOS Computational Biology | DOI:10.1371/journal.pcbi.1004118 February 27, 2015 19 / 24
The 120-NN ensemble (R = 0.87134, mean-squared error MSE = 0.0129) was more accuratethan the average individual NN within the ensemble (R average = 0.6566, MSE average = 0.0501)in predicting the calcium traces of higher order combination experiments. Even though the mostaccurate individual NN in the 120-NN ensemble (R = 0.91391, MSE = 0.0092) was more accuratethan the ensemble itself, its prediction output was significantly noisier, and its synergy score pre-diction accuracy was much lower (R = 0.6953 to R = 0.4609). The ensemble approach reducedvariances in prediction output, increased accuracy above the average NN in the 120-NN ensem-ble, consistent with previous findings [24], and is generally thought to be more robust [25–28].Ensemble pruning is often used to eliminate individual models from the ensemble based on cer-tain criteria so as to improve the new ensembles predictive ability [28]. Using the interquartilerange (IQR) outlier detection method, eight high outliers spanning seven different donors wereidentified in the mean-squared error (MSE) measurements of each of the 120 individual NNs.Removing the eight most inaccurate individual NNs from the ensemble did not improve theensemble accuracy (R-value improved slightly from 0.87134 to 0.87768, but MSE increasedslightly from 0.0129 to 0.0148, synergy score R decreased slightly from 0.6953 to 0.68632, andnoise in ensemble predictions increased). Diversity of the models (in this case originatingfrom the different random initial weights generated at the beginning of each NN training)comprising an ensemble is important for accuracy and robustness [29–31]. To increase di-versity, heterogeneous ensembles may be used instead; for example, changing the trainingparameters of select individual NNs or incorporating into the NN-ensemble regression mod-els other than NNs [28].
We found that the NN-ensemble was able to account for the dynamics and magnitude ofone pathway relative to that of another. Iloprost was a very potent antagonist in this assay. Invivo, prostacyclin activates IP to increase cAMP and cGMP-dependent protein kinases pKAand pKG. Both pKA and pKG phosphorylate RGS18 (a G-protein regulator), which eventuallyturns off Gq-signaling, the main activation pathway for U46619 and thrombin (via PAR-1)[32]. ADP signaling through P2Y1 also goes through Gq-signaling. However, ADP also signalsthrough the P2Y12 receptor, which involves the Gi protein (Fig. 1A).Thrombin signalingthrough PAR4 can go through either Gq or Gi. The existence of alternate signaling routes(through Gi) explain why iloprost inhibition is markedly less potent for ADP, and slightly lesseffective for thrombin as well. Furthermore, signaling through the Gi protein inhibits the risein adenylate cyclase (precursor of cAMP which decreases intracellular calcium levels). As ex-pected from studies of “coated” platelets [33] and studies with similar findings [9,10], convul-xin and thrombin were quite synergistic in the PAS assay. Additionally, thrombin and TPreceptor signaling were somewhat synergistic, consistent with previous findings [2,6]. In futurework, the NN-ensemble can be incorporated in multi-scale and hierarchical simulations ofbleeding or clotting with linkages to vascular pathophysiology. While exogenously addedthrombin was used in PAS, not all of this thrombin may reach the platelet due to antithrombin.This may right shift the thrombin potency [34]. Iloprost and GSNO were also included in thisassay to recapitulate endothelial-derived prostacyclin and nitric oxide effects on platelet func-tion. The development of a healthy human platelet calcium calculator can enable various appli-cations such as predicting thrombosis or hemostasis under flow condition or extractinginformation from in vitro diagnostics, potentially using platelets from patients with cardiovas-cular disease risks.
Supporting InformationS1 Fig. Pairwise Agonist Scanning experimental method. Platelet-rich-plasma was obtainedfrom a healthy donor and incubated with Fluo 4-NW calcium dye (Invitrogen) for 30 minutes,
Human Platelet Calcium Calculator
PLOS Computational Biology | DOI:10.1371/journal.pcbi.1004118 February 27, 2015 20 / 24
then dispensed into a 384-well plate called the “read plate”. At the same time, a high-through-put liquid handler (PerkinElmer Janus) assembled another 384-well plate containing all combi-nations of six agonists at three doses called the “agonist plate”. Molecular Devices FlexStation3 auto-dispenser and microplate reader measures calcium fluorescence in the read plate for260 seconds. The FlexStation 3 dispensed contents from the agonist plate into the read plate atthe 20 second mark. This experiment was done in duplicates with ten donors (five male andfive female).(EPS)
S2 Fig. Dose response curves of each agonist. This set of dose response curves were obtainedfor a single donor done in quadruplicate, and is representative of the dose response curves forthe total of six donors used to calculate the average EC50 values shown in the table inset. EC50
values were calculated by fitting a four-parameter hill function curve (dashed lines) to the areaunder curve of the baseline-normalized fluorescence intensity (F/F0) calcium time course. Forthe dose response of platelet antagonist iloprost, platelets were simultaneously stimulated withPAR1 agonist SFLLRN (40μM). For the dose response of platelet antagonist GSNO, plateletswere simultaneously stimulated with 1μMADP.(EPS)
S3 Fig. Investigation of autocrinic signaling effects. To determine whether or not significantsecondary autocrinic amplification effects by ADP and thromboxane secretion were present inthe PAS assays, apyrase (ADP hydrolyzing enzyme, 2 Units/ml) and indomethacin (COX-in-hibitor, 15μM) were used. GSNO, Iloprost, U46619, thrombin and convulxin at 0.1, 1, or 10 XEC50 were added to platelets in similar conditions as in the PAS experiments (12% PRP,250nM Apixaban). In the case of the inhibitors GSNO and Iloprost, platelets were co-stimulat-ed with 60mM SFLLRN, a PAR1 activator. Only one of the 60 conditions tested with added in-hibitors produced a detectable reduction in calcium signal (one-tailed T-test P< 0.05).(EPS)
S4 Fig. Analysis of iloprost inhibition effects. Data from PAS and trinary combinationexperiments also provided insight into the inhibitory effects of iloprost on other agonists. (B,H) Iloprost was a potent and sustained inhibitor of GPVI-induced calcium release (99.6% and99.7% inhibition by low and medium dose iloprost respectively). Iloprost was a moderatelypotent inhibitor of (D, J) thrombin activity (76–79% inhibition) and (F, L) U46619 activity(87–92% inhibition). (M, N) Iloprost was least effective on ADP (41–72% inhibition). (A, G)With combined ADP/convulxin stimulation, low and medium dose iloprost resulted in only61% and 71% inhibition respectively. (C, I)With thrombin/convulxin co-stimulation, however,iloprost was more effective (75%–84% inhibition). (E, K)When the weaker agonist U46619 (com-pared to ADP) was used with convulxin, iloprost remained a very potent inhibitor (95%–99%inhibition).(PDF)
S5 Fig. Range of individual neural network responses and donor responses. The range ofthe NN predictions reflected to a large degree the range of the experiment itself. (A-C) Therange of single (A), binary (B) and trinary (C) predictions matched almost exactly the range ofits corresponding experiments. (D-F) Although the range of the higher order NN predictions(� 4 agonists) was larger than the range observed in the corresponding individual experiments,the mean of the NN predictions was a good fit of the mean response of the actual experiments,a benefit of the NN-ensemble approach for predicting a pooled population dynamic.(EPS)
Human Platelet Calcium Calculator
PLOS Computational Biology | DOI:10.1371/journal.pcbi.1004118 February 27, 2015 21 / 24
S6 Fig. Neural network prediction of the trinary combination experiment. Experimentaland NN-predicted calcium traces are plotted for all 160 trinary conditions (all single and trin-ary combinations of agonists at two concentrations: 0.1x EC50 and 1x EC50). Rescaled to 0.5 foreasy visualization.(PDF)
S1 Table. Percent inhibition of medium dose iloprost and GSNO on medium doses of vari-ous agonists. Iloprost was a more potent inhibitor than GSNO on all the agonists in the PASassays. Interestingly, medium dose GSNO slightly potentiates thrombin-mediatedcalcium mobilization.(DOCX)
S1 Dataset. Calcium data used in all experiments. To facilitate future building of a mechanis-tic platelet calcium model, the full calcium data set is provided. This dataset comprisesMATLAB structures that contain dynamic calcium data in response to various combinationsand permutations of up to six agonists used in PAS, trinary, higher order and sequential experi-ments. There are 24 PAS experiments spanning 12 donors, 10 PAS experiments spanning10 donors, 7 higher order experiments spanning 5 donors, and 1 sequential addition experi-ment done for a single donor.(ZIP)
S2 Dataset. Trained neural networks (NNs). This dataset comprises all 120 NNs trained on12 donor-specific PAS experiments (10 NNs trained per donor, PAS experiments averagedover 2 repetitions) Trained NNs are in the form of MATLAB networks that contain the finaltrained weights for all 12 nodes in the 2-layer NN configuration. The trained NNs may be usedto make dynamic calcium predictions in response to all combinations and permutations of upto six agonists (ADP, CVX, thrombin, U46619, iloprost, GSNO).(ZIP)
S1 Code. Human Platelet Calcium Calculator. AMATLABM-File that allows users to specifya combination or permutation of up to six agonists (ADP, CVX, thrombin, U46619, iloprost,GSNO) in the full dose range, and obtain the corresponding predicted dynamic calcium timetrace based on the 120 NNs that were trained on PAS experiments. This code requires thetrained NNs in S2 Dataset to run.(ZIP)
Author ContributionsConceived and designed the experiments: MYL SLD. Performed the experiments: MYL. Ana-lyzed the data: MYL. Contributed reagents/materials/analysis tools: SLD. Wrote the paper:MYL SLD.
References1. Campbell CL, Smyth S, Montalescot G, Steinhubl SR (2007) Aspirin dose for the prevention of cardio-
vascular disease: a systematic review. Jama 297: 2018–2024. PMID: 17488967
2. Chatterjee MS, Purvis JE, Brass LF, Diamond SL (2010) Pairwise agonist scanning predicts cellularsignaling responses to combinatorial stimuli. Nat Biotechnol 28: 727–732. doi: 10.1038/nbt.1642PMID: 20562863
3. Shattil SJ, Brass LF (1987) Induction of the fibrinogen receptor on human platelets by intracellular medi-ators. J Biol Chem 262: 992–1000. PMID: 3100533
4. Stefanini L, Roden RC, Bergmeier W (2009) CalDAG-GEFI is at the nexus of calcium-dependent plate-let activation. Blood 114: 2506–2514. doi: 10.1182/blood-2009-04-218768 PMID: 19628710
Human Platelet Calcium Calculator
PLOS Computational Biology | DOI:10.1371/journal.pcbi.1004118 February 27, 2015 22 / 24
5. Crittenden JR, Bergmeier W, Zhang Y, Piffath CL, Liang Y, et al. (2004) CalDAG-GEFI integrates sig-naling for platelet aggregation and thrombus formation. Nat Med 10: 982–986. PMID: 15334074
6. FlammMH, Colace TV, Chatterjee MS, Jing H, Zhou S, et al. (2012) Multiscale prediction of patient-specific platelet function under flow. Blood 120: 190–198. doi: 10.1182/blood-2011-10-388140 PMID:22517902
7. Pinto DJ, Orwat MJ, Koch S, Rossi KA, Alexander RS, et al. (2007) Discovery of 1-(4-methoxyphenyl)-7-oxo-6-(4-(2-oxopiperidin-1-yl)phenyl)-4,5,6,7-tetrahydro-1H-pyrazolo[3,4-c]pyridine-3-carboxamide(apixaban, BMS-562247), a highly potent, selective, efficacious, and orally bioavailable inhibitor ofblood coagulation factor Xa. J Med Chem 50: 5339–5356. PMID: 17914785
8. Cunningham P, Carney J, Jacob S (2000) Stability problems with artificial neural networks and the en-semble solution. Artif Intell Med 20: 217–225. PMID: 10998588
9. Keuren JF, Wielders SJ, Ulrichts H, Hackeng T, Heemskerk JW, et al. (2005) Synergistic effect ofthrombin on collagen-induced platelet procoagulant activity is mediated through protease-activated re-ceptor-1. Arterioscler Thromb Vasc Biol 25: 1499–1505. PMID: 15845904
10. Hughan SC, Hughes CE, McCarty OJ, Schweighoffer E, Soultanova I, et al. (2007) GPVI potentiationof platelet activation by thrombin and adhesion molecules independent of Src kinases and Syk. Arter-ioscler Thromb Vasc Biol 27: 422–429. PMID: 17110603
11. Brass LF, Wannemacher KM, Ma P, Stalker TJ (2011) Regulating thrombus growth and stability toachieve an optimal response to injury. J Thromb Haemost 9 Suppl 1: 66–75. doi: 10.1111/j.1538-7836.2011.04364.x PMID: 21781243
12. Welsh JD, Colace TV, Muthard RW, Stalker TJ, Brass LF, et al. (2012) Platelet-targeting sensor revealsthrombin gradients within blood clots forming in microfluidic assays and in mouse. J Thromb Haemost10: 2344–2353. doi: 10.1111/j.1538-7836.2012.04928.x PMID: 22978514
13. Muthard RW, Diamond SL (2012) Blood clots are rapidly assembled hemodynamic sensors: flow arresttriggers intraluminal thrombus contraction. Arterioscler Thromb Vasc Biol 32: 2938–2945. doi: 10.1161/ATVBAHA.112.300312 PMID: 23087356
14. Welsh JD, Stalker TJ, Voronov R, Muthard RW, Tomaiuolo M, et al. (2014) A systems approach to he-mostasis: 1. The interdependence of thrombus architecture and agonist movements in the gaps be-tween platelets. Blood 124: 1808–1815. doi: 10.1182/blood-2014-01-550335 PMID: 24951424
15. Tomaiuolo M, Stalker TJ, Welsh JD, Diamond SL, Sinno T, et al. (2014) A systems approach to hemo-stasis: 2. Computational analysis of molecular transport in the thrombus microenvironment. Blood 124:1816–1823. doi: 10.1182/blood-2014-01-550343 PMID: 24951425
16. Stalker TJ, Welsh JD, Tomaiuolo M, Wu J, Colace TV, et al. (2014) A systems approach to hemostasis:3. Thrombus consolidation regulates intrathrombus solute transport and local thrombin activity. Blood124: 1824–1831. doi: 10.1182/blood-2014-01-550319 PMID: 24951426
17. Blackmore PF (2011) Biphasic effects of nitric oxide on calcium influx in human platelets. Thromb Res127: e8–14. doi: 10.1016/j.thromres.2010.10.002 PMID: 21056902
18. Radomski MW, Palmer RM, Moncada S (1987) Comparative pharmacology of endothelium-derived re-laxing factor, nitric oxide and prostacyclin in platelets. Br J Pharmacol 92: 181–187. PMID: 3311265
19. Radomski MW, Rees DD, Dutra A, Moncada S (1992) S-nitroso-glutathione inhibits platelet activationin vitro and in vivo. Br J Pharmacol 107: 745–749. PMID: 1335336
20. Moro MA, Russel RJ, Cellek S, Lizasoain I, Su Y, et al. (1996) cGMPmediates the vascular and plateletactions of nitric oxide: confirmation using an inhibitor of the soluble guanylyl cyclase. Proc Natl AcadSci U S A 93: 1480–1485. PMID: 8643658
21. Polgar J, Clemetson JM, Kehrel BE, Wiedemann M, Magnenat EM, et al. (1997) Platelet activation andsignal transduction by convulxin, a C-type lectin from Crotalus durissus terrificus (tropical rattlesnake)venom via the p62/GPVI collagen receptor. J Biol Chem 272: 13576–13583. PMID: 9153205
22. Jaeger DT, Diamond SL (2013) Pairwise agonist scanning-flow cytometry (PAS-FC) measures inside-out signaling and patient-specific response to combinatorial platelet agonists. Biotechniques 54: 271–277. doi: 10.2144/000114027 PMID: 23662898
23. Montgomery DC (1997) Design and Analysis of Experiments. New York: Wiley. PMID: 25165803
24. Garcia-Pedrajas N, Hervas-Martinez C, Ortiz-Boyer D (2005) Cooperative coevolution of artificial neu-ral network ensembles for pattern classification. Evolutionary Computation, IEEE Transactions on 9:271–302.
25. Liu Y, Yao X (1999) Ensemble learning via negative correlation. Neural Netw 12: 1399–1404. PMID:12662623
26. Breiman L (2001) Random Forests. Machine Learning 45: 5–32.
Human Platelet Calcium Calculator
PLOS Computational Biology | DOI:10.1371/journal.pcbi.1004118 February 27, 2015 23 / 24
27. Rodriguez JJ, Kuncheva LI, Alonso CJ (2006) Rotation forest: A new classifier ensemble method. IEEETrans Pattern Anal Mach Intell 28: 1619–1630. PMID: 16986543
28. Jo, Mendes-Moreira o, Soares C, Al M p, et al. (2012) Ensemble approaches for regression: A survey.ACM Comput Surv 45: 1–40.
29. Partridge D, YatesWB (1996) Engineering multiversion neural-net systems. Neural Comput 8: 869–893. PMID: 8624963
30. Kuncheva L, Whitaker C (2003) Measures of Diversity in Classifier Ensembles and Their Relationshipwith the Ensemble Accuracy. Machine Learning 51: 181–207.
31. Windeatt T, Roli F, Aksela M (2003) Comparison of Classifier Selection Methods for Improving Commit-tee Performance. Multiple Classifier Systems: Springer Berlin Heidelberg. pp. 84–93.
32. Louwette S, Van Geet C, Freson K (2012) Regulators of G protein signaling: role in hematopoiesis,megakaryopoiesis and platelet function. J Thromb Haemost 10: 2215–2222. doi: 10.1111/j.1538-7836.2012.04903.x PMID: 22908964
33. Dale GL (2005) Coated-platelets: an emerging component of the procoagulant response. J ThrombHaemost 3: 2185–2192. PMID: 16194197
34. Xu Z, Chen N, Shadden SC, Marsden JE, Kamocka MM, et al. (2009) Study of blood flow impact ongrowth of thrombi using a multiscale model. Soft Matter 5: 769–779.
Human Platelet Calcium Calculator
PLOS Computational Biology | DOI:10.1371/journal.pcbi.1004118 February 27, 2015 24 / 24