making! - pita - paper industry technical association
TRANSCRIPT
Volume 5 / Number 1 / 2019
making! PAPERThe e-magazine for the Fibrous Forest Products Sector
Produced by: The Paper Industry Technical Association
PAPERmaking!
FROM THE PUBLISHERS OF PAPER TECHNOLOGY
Volume 5, Number 1, 2019
Page 1 of 1 Contents
CONTENTS: FEATURE ARTICLES:
1. Wastewater: Modelling control of an anaerobic reactor 2. Biobleaching: Enzyme bleaching of wood pulp 3. Novel Coatings: Using solutions of cellulose for coating purposes 4. Warehouse Design: Optimising design by using Augmented Reality technology 5. Analysis: Flow cytometry for analysis of polyelectrolyte complexes 6. Wood Panel: Explosion severity caused by wood dust 7. Agriwaste: Soda-AQ pulping of agriwaste in Sudan 8. New Ideas: 5 tips to help nurture new ideas 9. Driving: Driving in wet weather - problems caused by Spring showers 10. Women and Leadership: Importance of mentoring and sponsoring to leaders 11. Networking: 8 networking skills required by professionals 12. Time Management: 101 tips to boost everyday productivity 13. Report Writing: An introduction to report writing skills
SUPPLIERS NEWS SECTION: Products & Services: Section 1 – PITA Corporate Members:
ABB / ARCHROMA / JARSHIRE / VALMET
Section 2 – Other Suppliers
Materials Handling / Safety / Testing & Analysis / Miscellaneous DATA COMPILATION: Installations: Overview of equipment orders and installations since November 2018
Research Articles: Recent peer-reviewed articles from the technical paper press
Technical Abstracts: Recent peer-reviewed articles from the general scientific press
Events: Information on forthcoming national and international events and courses
The Paper Industry Technical Association (PITA) is an independent organisation which operates for the general benefit of its members – both individual and corporate – dedicated to promoting and improving the technical and scientific knowledge of those working in the UK pulp and paper industry. Formed in 1960, it serves the Industry, both manufacturers and suppliers, by providing a forum for members to meet and network; it organises visits, conferences and training seminars that cover all aspects of papermaking science. It also publishes the prestigious journal Paper Technology International and the PITA Annual Review, both sent free to members, and a range of other technical publications which include conference proceedings and the acclaimed Essential
Guide to Aqueous Coating.
PAPERmaking!
FROM THE PUBLISHERS OF PAPER TECHNOLOGY
Volume 5, Number 1, 2019
Page 1 of 11 Article 1 – Wastewater
Dynamic soft sensing of organic pollutants in effluent from UMIC anaerobic reactor for industrial papermaking wastewater Yajuan Xing
1, Zhong Cheng
2,*, Shengdao Shan
3.
With the rapid development of paper industry, the pressure of environmental pollution is going more and more serious. Recently, resource utilization of wastewater by anaerobic digestion has become a feasible way to solve this problem. In order to maintain the safe and efficient production of the process, a novel adaptive soft sensor model was developed to infer the chemical oxygen demand (COD) of paper mill effluent in this paper. First, the principal component analysis technique was performed in this model so as to eliminate the col-linearity between the process variables and accordingly obtain the low-dimensional feature principal component. Then, the least square support vector machine method was used to construct a quantitative regression model between principal component and the effluent COD. Along with it, particle swarm optimization was implemented to search for the best value of the LSSVM model parameters, namely the kernel parameters and the regularization factor. Finally, an online calibration strategy was designed to adapt to the process dynamic changes in an adaptive iterative manner. When the constructed model tested for performances in a full-scale factory, the average relative deviation and maximum deviation are 1.80% and 6.26%, respectively. The experimental results show that this proposed soft sensor model is featured with high accuracy and strong dynamic stability, and it can provide good guidance for COD prediction and optimal control of paper mill wastewater treatment. Contact information: 1Key Laboratory of Recycling and Eco-treatment of Waste Biomass of Zhejiang Province, School of
Environment and Resources, Zhejiang University of Science and Technology, Hangzhou 310023 2School of Biological and Chemical Engineering, Zhejiang University of Science and Technology, Hangzhou
310023 3Key Laboratory of Recycling and Eco-treatment of Waste Biomass of Zhejiang Province, School of
Environment and Resources, Zhejiang University of Science and Technology, Hangzhou 310023 Yajuan Xing et al 2019 IOP Conf. Ser.: Mater. Sci. Eng. 490 062027. https://doi.org/10.1016/j.bcab.2019.01.019
The Paper Industry Technical Association (PITA) is an independent organisation which operates for the general benefit of its members – both individual and corporate – dedicated to promoting and improving the technical and scientific knowledge of those working in the UK pulp and paper industry. Formed in 1960, it serves the Industry, both manufacturers and suppliers, by providing a forum for members to meet and network; it organises visits, conferences and training seminars that cover all aspects of papermaking science. It also publishes the prestigious journal Paper Technology International and the PITA Annual Review, both sent free to members, and a range of other technical publications which include conference proceedings and the acclaimed Essential
Guide to Aqueous Coating.
Content from this work may be used under the terms of the Creative Commons Attribution 3.0 licence. Any further distributionof this work must maintain attribution to the author(s) and the title of the work, journal citation and DOI.
Published under licence by IOP Publishing Ltd
SAMSE 2018
IOP Conf. Series: Materials Science and Engineering 490 (2019) 062027
IOP Publishing
doi:10.1088/1757-899X/490/6/062027
1
Dynamic soft sensing of organic pollutants in effluent from UMIC anaerobic reactor for industrial papermaking wastewater
Yajuan Xing1, Zhong Cheng2,*, Shengdao Shan3 1Key Laboratory of Recycling and Eco-treatment of Waste Biomass of Zhejiang Province, School of Environment and Resources, Zhejiang University of Science and Technology, Hangzhou 310023 2School of Biological and Chemical Engineering, Zhejiang University of Science and Technology, Hangzhou 310023 3Key Laboratory of Recycling and Eco-treatment of Waste Biomass of Zhejiang Province, School of Environment and Resources, Zhejiang University of Science and Technology, Hangzhou 310023
*Corresponding author e-mail: [email protected]
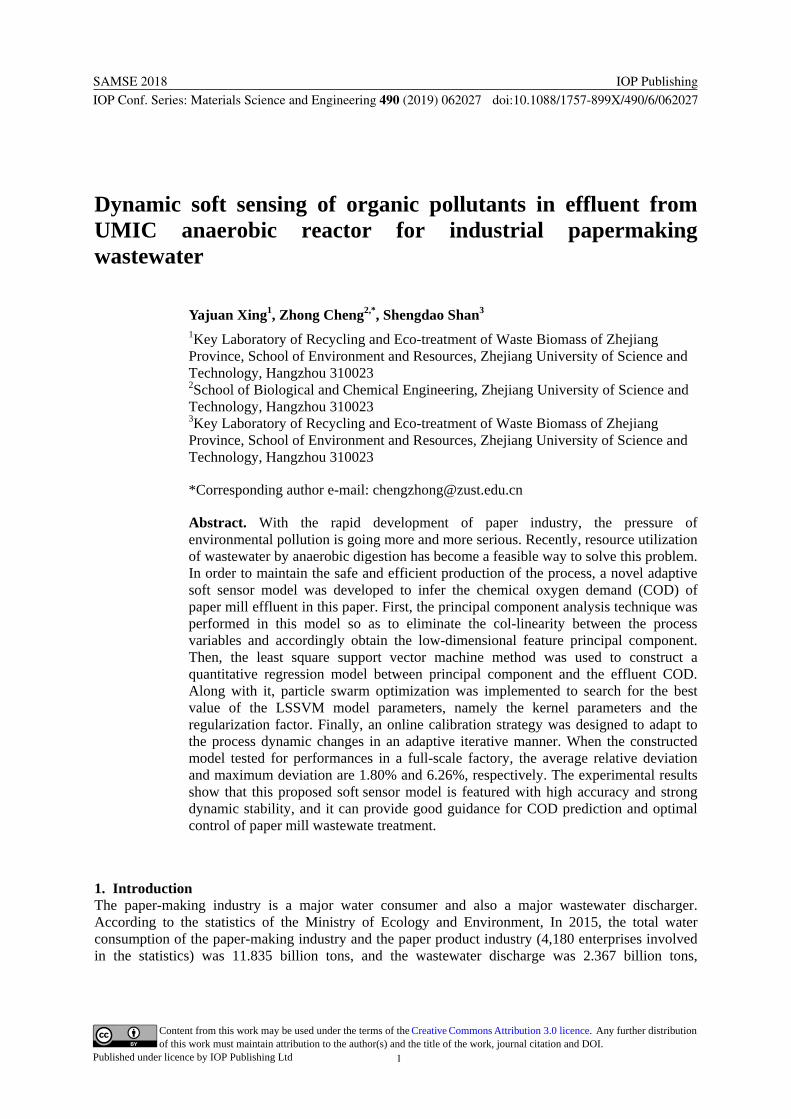
Abstract. With the rapid development of paper industry, the pressure of environmental pollution is going more and more serious. Recently, resource utilization of wastewater by anaerobic digestion has become a feasible way to solve this problem. In order to maintain the safe and efficient production of the process, a novel adaptive soft sensor model was developed to infer the chemical oxygen demand (COD) of paper mill effluent in this paper. First, the principal component analysis technique was performed in this model so as to eliminate the col-linearity between the process variables and accordingly obtain the low-dimensional feature principal component. Then, the least square support vector machine method was used to construct a quantitative regression model between principal component and the effluent COD. Along with it, particle swarm optimization was implemented to search for the best value of the LSSVM model parameters, namely the kernel parameters and the regularization factor. Finally, an online calibration strategy was designed to adapt to the process dynamic changes in an adaptive iterative manner. When the constructed model tested for performances in a full-scale factory, the average relative deviation and maximum deviation are 1.80% and 6.26%, respectively. The experimental results show that this proposed soft sensor model is featured with high accuracy and strong dynamic stability, and it can provide good guidance for COD prediction and optimal control of paper mill wastewate treatment.
1. Introduction The paper-making industry is a major water consumer and also a major wastewater discharger. According to the statistics of the Ministry of Ecology and Environment, In 2015, the total water consumption of the paper-making industry and the paper product industry (4,180 enterprises involved in the statistics) was 11.835 billion tons, and the wastewater discharge was 2.367 billion tons,
SAMSE 2018
IOP Conf. Series: Materials Science and Engineering 490 (2019) 062027
IOP Publishing
doi:10.1088/1757-899X/490/6/062027
2
accounting for 13.0% of the total industrial wastewater discharge. The chemical oxygen demand (COD) in the discharged wastewater is 335,000 tons, accounting for 13.1% of the total industrial COD emission. In recent years, with the increasing shortage of water resources, production water has become a problem that restricts the development of paper-making enterprises. At present, in order to solve the environmental pollution due to paper-making wastewater and realize resource utilization, biogas production through anaerobic digestion has become a main method. The anaerobic digestion process under the action of microorganisms is featured as multi-factor influence, dynamic variability, complex nonlinearity (Yang Hao et al., 2016), etc. and the mechanism model thereof is difficult to construct, so the real-time operation control and optimization and calibration that affect safe production and effluent water production conditions cannot be realized. The production effectiveness of the industrialization process of anaerobic digestion for paper-making wastewater is often measured by the effluent COD. However, the current COD testing of enterprises is mostly realized by timed manual sampling and laboratory analysis. The test results cannot be obtained till several hours later, so the real-time performance is poor (Xu Lisha et al., 2012). In case that a COD on-line analyzer is installed on site, failure often occurs, resulting in loss of data. And also, the maintenance is difficult and the instrument is expensive(Langergraber et al., 2004; Bourgeois et al., 2010). With the improvement of enterprise automation as well as the deep integration of informationization and industrialization, the methods like pivot element regression, partial least squares regression, neural network, support vector machine and fuzzy logic have been used for the data modeling and operational control of the performance indicators including COD concentration, volatile fatty acid (VFA), dissolved oxygen, suspended solids (SS) concentration and gas production in the process of paper-making wastewater treatment (Bourgeois et al., 2010; Haimi et al., 2013) Choi et al., 2001; Wan et al., 2011; Huang et al., 2015 Dürenmatt et al., 2012; Zhou Hongbiao et al., 2017; Liu Lin et al., 2017; Tang Wei et al., 2017). With respect of the method selection, Wan et al. (2011) designed an adaptive fuzzy inference system integrating fuzzy subtractive clustering and PCA technologies, of which the fuzzy subtractive clustering is used to identify the model structure, and PCA is used to reduce the complex collinearity between variables as well as the dimensionality. The model accuracy with this integrated method is higher than that with the BP neural network method in the performance test about the COD and SS concentration prediction of paper-making wastewater. Wang Yao et al. (2017) chose the LSSVM method to predict the COD and SS concentrations. The results show that the soft-sensor model created by optimizing the LSSVM method parameters via the PSO algorithm has a higher prediction accuracy. The LSSVM method based on minimum structural risk is widely used in soft-sensor modeling because of its features of low dependence on sample data, less parameters to be estimated, and strong generalization ability (Souza et al., 2016; Wang et al., 2015; Fortuna et al., 2007; Liu Bo et al., 2015; Zheng Rongjian et al., 2017). However, the prediction accuracy of the soft-sensor model based on the offline sample data architecture, will gradually decline in the face of dynamic changes in continuous production processes. In order to solve the above problem, this paper proposes an OCS-PCA-PSO-LSSVM soft-sensor method integrating data analysis technology and regression modeling, which can eliminate the complex collinearity between variables and achieve dimensionality reduction via PCA technology; then, implement the LSSVM method to establish the nonlinear relationship between input and output variables, and realize the optimization of LSSVM model parameters by means of PSO; and finally, initiate the online calibration strategy (OCS) in case the prediction deviation of the new sample individual exceeds the set error limit, iteratively updating the soft-sensor model in an adaptive manner.
2. Materials and Methods
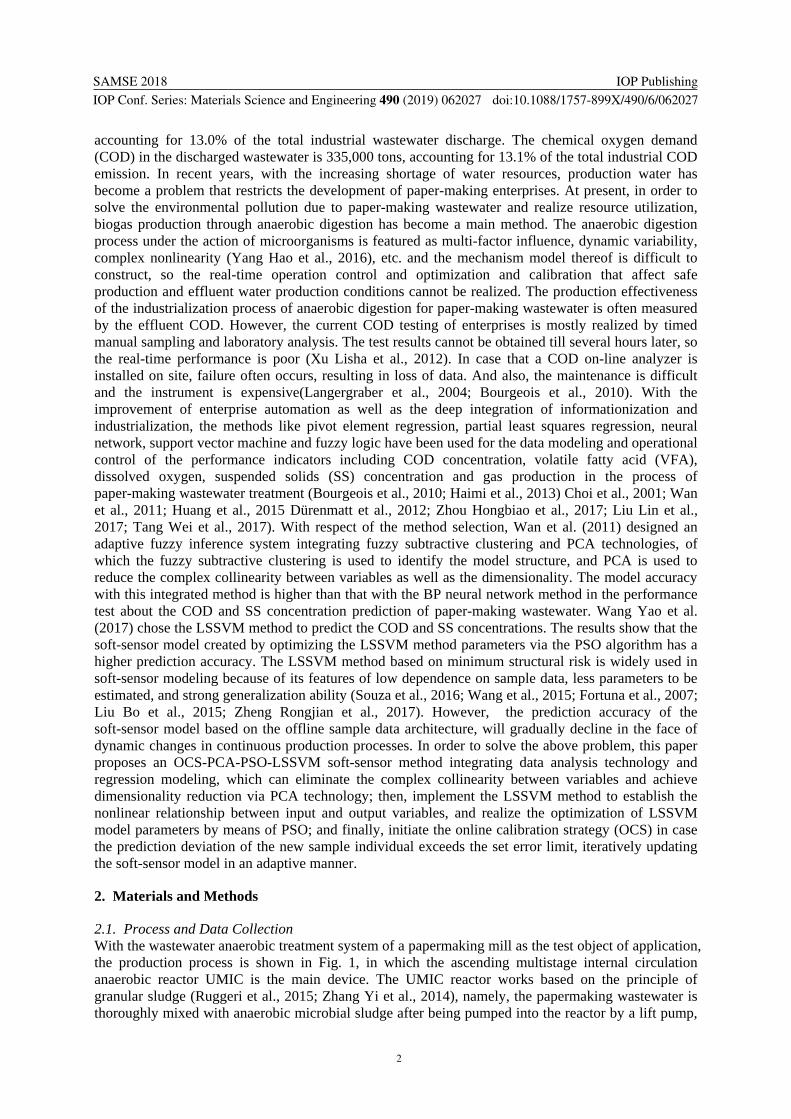
2.1. Process and Data Collection With the wastewater anaerobic treatment system of a papermaking mill as the test object of application, the production process is shown in Fig. 1, in which the ascending multistage internal circulation anaerobic reactor UMIC is the main device. The UMIC reactor works based on the principle of granular sludge (Ruggeri et al., 2015; Zhang Yi et al., 2014), namely, the papermaking wastewater is thoroughly mixed with anaerobic microbial sludge after being pumped into the reactor by a lift pump,
SAMSE 2018
IOP Conf. Series: Materials Science and Engineering 490 (2019) 062027
IOP Publishing
doi:10.1088/1757-899X/490/6/062027
3
and the organics in the mixture are chemically converted into the gases like methane and carbon dioxide, as well as microbial bacterial plastids under the action of the microorganisms.
Based on the analysis of production behavior and process mechanism of the UMIC device, with the combination of experts’ experience and knowledge as well as the sensitivity analysis of field data, 8 process variables that affect the COD of the treatment system were selected as the input variables of the model, and they are: influent COD/mg•L-1, influent SS/mg•L-1, influent pH, influent flow/m3, influent temperature/°C, circulating pool level/%, effluent pH and effluent temperature/°C, while the output variable of the model is effluent COD/mg•L-1. Two sample data collection methods were adopted, one of which was that the mill’s distributed control system DCS was used to collect 8 process variables, and the other was that the on-site sampling laboratory obtained effluent COD through offline test (Sun Jun et al., 2017). After the collection of the mill’s field operation data from July 2016 to February 2017 was completed, the missing data was directly removed, then the abnormal data was identified and deleted, and finally the initial sample matrix set containing 175 sample individuals was obtained.
1-Bar screener; 2-Blending pond; 3- Preliminary clarifier; 4-Pump; 5- Regulating container;
6-Anaerobic reactor; 7-Cycling wstandpipe; 8- Anoxic pool; 9- The secondary clarifier; 10-Biogas storage tank;
11-Nutrient auto-count pipette Fig 1. Flow chart of anaerobic degradation for paper mill wastewater
2.2. OCS-PCA-PSO-LSSVM Soft-sensor Method
2.2.1. PCA Technology The independent variable matrix n pX of the obtained initial sample data was recorded, where n is the
number of sample individuals, i.e. the sample size, and p is the number of process variables. PCA technology (Jolliffe et al., 2002) was namely to project X from the Euclidean space to the latent vector space of the pivot element.
T Td
k kk = 1
X = TQ + E = t q + E (1)
Where, kt is the k th extracted pivot element, kq is the load vector used to extract the pivot element, and E is the final residual matrix. In essence, the construction of the PCA latent vector space is to represent most of the dynamic information in the initial process variables in the sample data by extracting d pivot elements ( d p ) (Sun Jun et al., 2017), of which, the information contribution of
the k th pivot element can be calculated according to Formula (2).
1
/p
k k kk
(2)
2.2.2. Soft-sensor Optimization Model PSO-LSSVM The least square support vector machine (LSSVM) is an extension of the standard SVM method (Cristianini et al., 2000), and the main ideas of the algorithm are summarized as follows:
SAMSE 2018
IOP Conf. Series: Materials Science and Engineering 490 (2019) 062027
IOP Publishing
doi:10.1088/1757-899X/490/6/062027
4
Suppose the modeling sample data set is 1{( , )}ni i iy t , where, d
i Rt is the input vector of
the i th-dimension pivot element in the latent vector space expanded by the d th-dimension pivot element,
and iy R is the target output variable of effluent COD of the papermaking wastewater. In the
high-dimension feature space constructed by the nonlinear mapping function ( ) t , the model establishment between the output variable and the input variable is to find the best fitting function:
T( ) ( )y b t w t (3)
Where, w is the weight coefficient vector to be estimated in the high-dimension feature space, b is the constant deviation term. For the LSSVM method, the parameter estimate in the above formula can be transformed to satisfy the constraint of Formula (4):
T ( ) , 1,2, ,i i iy b i n w t (4) The minimization optimization problem was solved as below:
T 2
, ,1
1 1min ( , , )
2 2
n
ib
i
J b
w
ξw w w (5)
In the formula, is a penalty factor, used to balance the complexity and approximation accuracy
of the model, i is the training error of the i th sample point. The Lagrange multiplier i is now introduced to transform the above-mentioned constraint optimization problem of the formula into an unconstrained optimization problem:
1
( , , , )
( , , ) ( ( ) )n
Ti i i i
i
L b
J b w b y
w ξ
w ξ t
α
(6)
Using the KKT optimization condition to solve the above formula (Zhou Xinran, 2012), that is, to solve the partial derivatives of w ,b, i and i , we can obtain:
1
1
T
0 ( )
0 0
0 , 1,2, ,
0 ( ) 0, 1,2, ,
n
i ii
n
ii
i ii
i i ii
L
L
b
Li n
Lb y i n
w tw
w t
(7)
Eliminating the elements from the above equation set, we will obtain the following linear equation set:
T
1
00 1
1v
v
b
I α yK
(8)
Where, T1 [1,1, ,1 ]v n , T1 2[ , , , ]n α , T
1 2[ , , , ]ny y yy , T( , ) ( ) ( )ij i j i jK t t t t ,
1,2, ,i j n , ,and I is the unit matrix. After solving the parameters of i and b in Formula (8) and via the least square method, the LSSVM model will be obtained as below:
1
ˆ ( ) ( , )n
i ii
y f K b
t t t (9)
If the LSSVM model uses the RBF kernel function 2 2( , , ) exp( )i iK t t t t , the different
values of the kernel function width and the penalty factor in Formula (5) will affect the actual performance of the LSSVM model (Zhao et al., 2000). To this end, this paper completes the optimization of the two parameters by taking the minimum of the sum of squared error
SAMSE 2018
IOP Conf. Series: Materials Science and Engineering 490 (2019) 062027
IOP Publishing
doi:10.1088/1757-899X/490/6/062027
5
2
1
ˆ( )vn
l ll
y y
between the experimental value ly and the predicted value of the model of the effluent
COD as the objective function, through the particle swarm optimization (PSO) (Kennedy et al., 1995), based on the validation sample set.
2.2.3.Model Parameter Adaptive Correction
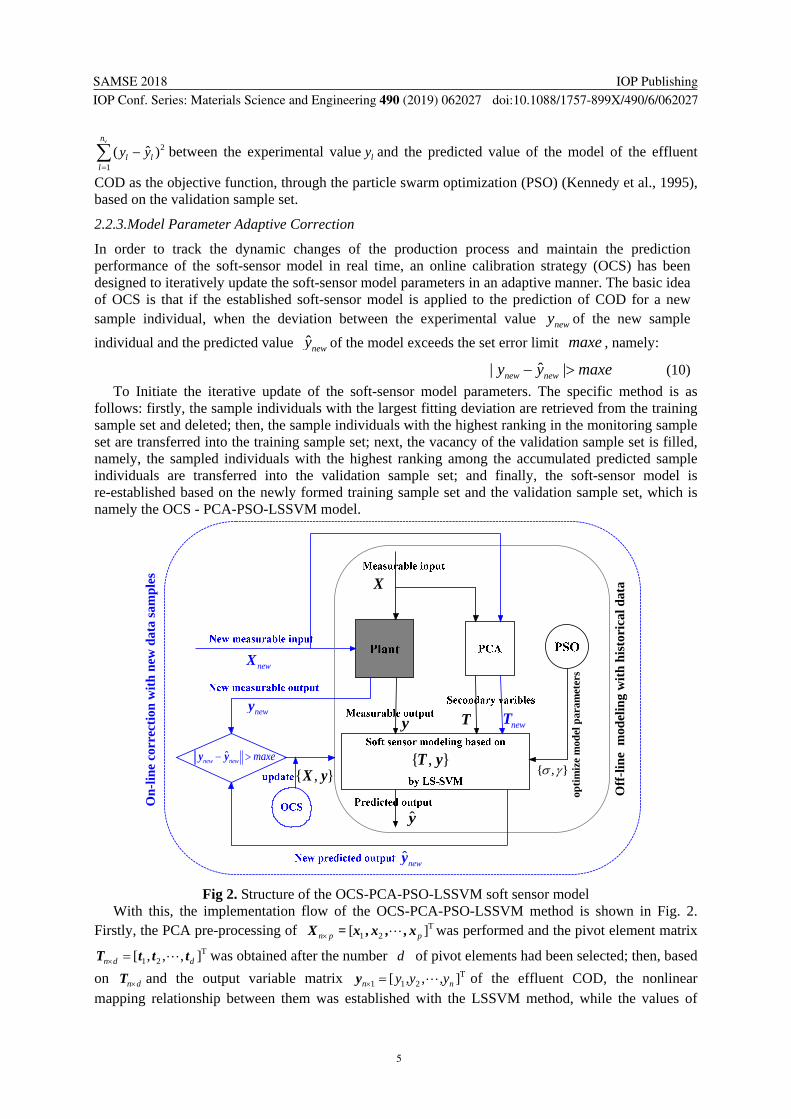
In order to track the dynamic changes of the production process and maintain the prediction performance of the soft-sensor model in real time, an online calibration strategy (OCS) has been designed to iteratively update the soft-sensor model parameters in an adaptive manner. The basic idea of OCS is that if the established soft-sensor model is applied to the prediction of COD for a new sample individual, when the deviation between the experimental value newy of the new sample
individual and the predicted value ˆnewy of the model exceeds the set error limit maxe , namely:
ˆ| |new newy y maxe (10)
To Initiate the iterative update of the soft-sensor model parameters. The specific method is as follows: firstly, the sample individuals with the largest fitting deviation are retrieved from the training sample set and deleted; then, the sample individuals with the highest ranking in the monitoring sample set are transferred into the training sample set; next, the vacancy of the validation sample set is filled, namely, the sampled individuals with the highest ranking among the accumulated predicted sample individuals are transferred into the validation sample set; and finally, the soft-sensor model is re-established based on the newly formed training sample set and the validation sample set, which is namely the OCS - PCA-PSO-LSSVM model.
newX
X
newyT
ˆnewy
y
ˆ new new maxey y
Off
-lin
e m
odel
ing
wit
h h
isto
rica
l dat
a
y
opti
miz
e m
odel
par
amet
ers
On
-lin
e co
rrec
tion
wit
h n
ew d
ata
sam
ple
s
newT
{ , }T y{ , }X y { , }
Fig 2. Structure of the OCS-PCA-PSO-LSSVM soft sensor model
With this, the implementation flow of the OCS-PCA-PSO-LSSVM method is shown in Fig. 2. Firstly, the PCA pre-processing of T
1 2[ ]n p pX = x , x , , x was performed and the pivot element matrix T
1 2[ , , , ]n d d T t t t was obtained after the number d of pivot elements had been selected; then, based
on n dT and the output variable matrix T1 1 2[ , , , ]n ny y y y of the effluent COD, the nonlinear
mapping relationship between them was established with the LSSVM method, while the values of
SAMSE 2018
IOP Conf. Series: Materials Science and Engineering 490 (2019) 062027
IOP Publishing
doi:10.1088/1757-899X/490/6/062027
6
model parameters and were determined by PSO optimization; and finally, the OCS would be initiated to iteratively update the model in case the prediction deviation of the new sample individual was beyond the set error limit.
3.Results and Discussion
3.1. Model Performance Evaluation Indicator To objectively and independently evaluate the performance of the OCS-PCA-PSO-LSSVM soft-sensor model, the initial sample data set was divided into a training sample set, a validation set, and a test set in time order, of which the training sample set contained 100 sample individuals, used for parameter estimation of the model; the validation sample set contained 50 sample individuals, used for parameter optimization of the model; and the test sample set contained the remaining 25 sample individuals, used for performance evaluation of the model. The performance evaluation indicators include: maximum deviation (MAXE)/mg•L-1, maximum relative deviation (MAXRE)/%, mean absolute deviation (MAE)/mg•L-1, mean relative deviation (MRE)/% ,root mean square error (RMSE) / mg • L-1, standard deviation (STD) / mg • L-1, etc., and their respective definition formula are as follows:
{1,2, , }ˆMAXE max { }i i
i ny y
(11)
{1,2, , }
ˆMAXRE max { } 100%i i
i ni
y y
y
(12)
1
1ˆMAE
n
i ii
y yn
(13)
1
ˆ| |1MRE 100%
ni i
i i
y y
n y
(14)
2
1
1ˆRMSE ( )
n
i ii
y yn
(15)
2
1
1STD ( )
1
n
ii
e en
(16)
Where, ˆi i ie y y ,1
1 n
ii
e en
, while iy and iy denote the experimental value and predicted
value of the model regarding COD of the i th sample individual, respectively. Among the above statistical performance indicators, MAXE, MRE, RMSE and STD are absolute accuracy indicators, of which, MAXE measures the limit boundary conditions of the model according to the maximum predicted deviation of the sample individuals, and MRE and RMSE measure the accuracy of the model according to the average prediction accuracy of the sample individuals. while STD measures the stability of the model according to the degree of dispersion of the prediction deviation of the sample individuals. Considering the objective difference between the magnitudes of different physical quantities, MAXRE and MRE are relative accuracy indicators. The former measures the deviation of the prediction results based on a single sample individual, and the latter does the same based on the average of sample individuals. The smaller the values of these statistics are, the better the performance of the model will be indicated.
3.2. Experimental Results and Analysis As described in Section 2.2.1 above, in order to satisfy that the pivot element under the OCS-PCA-PSO-LSSVM method contain enough initial variable information, and the cumulative information contribution rate of the dth extracted pivot element is now required to be above 85%. Based on the information of the eight latent roots of the correlation matrix for the training sample set
SAMSE 2018
IOP Conf. Series: Materials Science and Engineering 490 (2019) 062027
IOP Publishing
doi:10.1088/1757-899X/490/6/062027
7
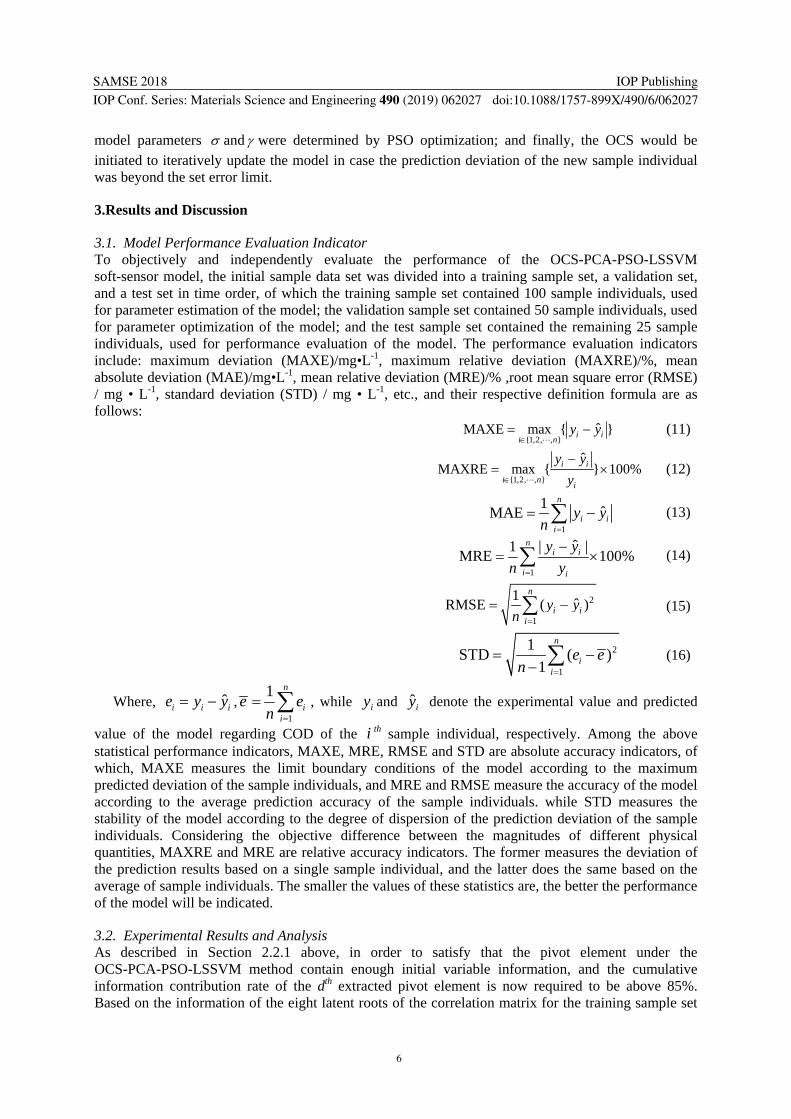
of papermaking wastewater, when the 6th pivot element is extracted during calculation, namely, 6d , the cumulative information contribution rate is 92.63%. Thus, the six pivot element are determined as the input vectors of the subsequent PSO-LSSVM model.
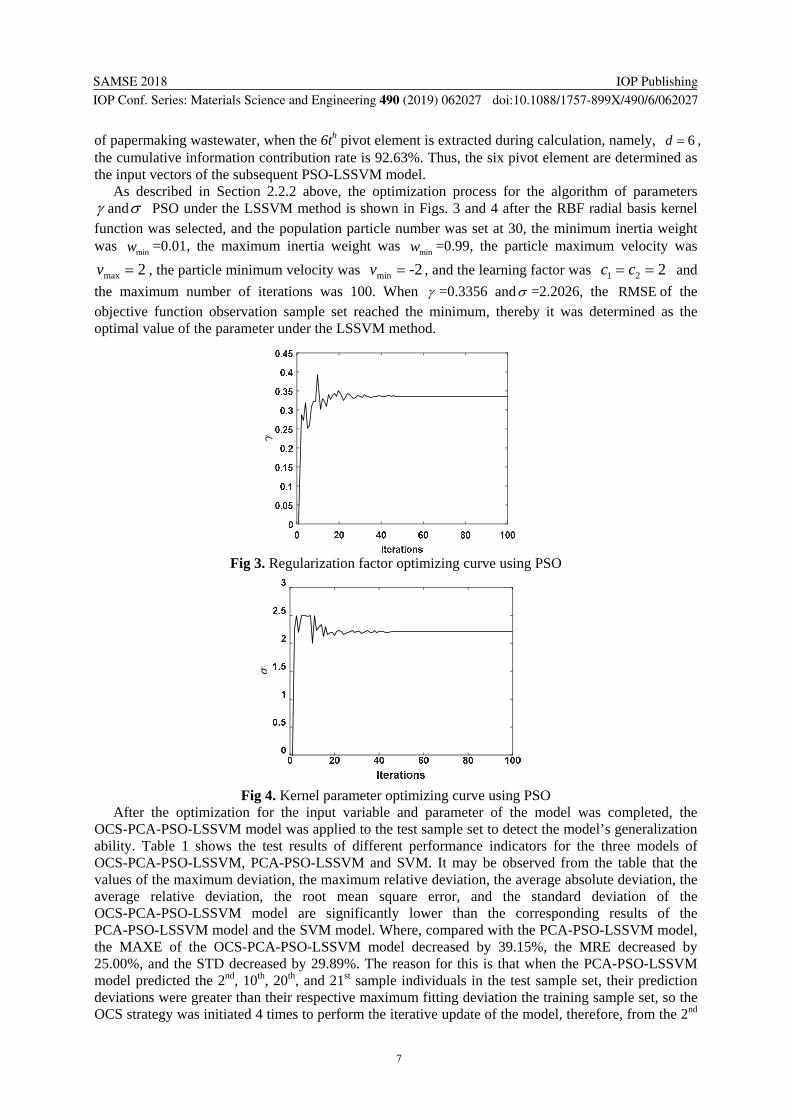
As described in Section 2.2.2 above, the optimization process for the algorithm of parameters and PSO under the LSSVM method is shown in Figs. 3 and 4 after the RBF radial basis kernel function was selected, and the population particle number was set at 30, the minimum inertia weight was minw =0.01, the maximum inertia weight was minw =0.99, the particle maximum velocity was
2max v , the particle minimum velocity was -2min v , and the learning factor was 221 cc and
the maximum number of iterations was 100. When =0.3356 and =2.2026, the RMSE of the objective function observation sample set reached the minimum, thereby it was determined as the optimal value of the parameter under the LSSVM method.
Fig 3. Regularization factor optimizing curve using PSO
Fig 4. Kernel parameter optimizing curve using PSO
After the optimization for the input variable and parameter of the model was completed, the OCS-PCA-PSO-LSSVM model was applied to the test sample set to detect the model’s generalization ability. Table 1 shows the test results of different performance indicators for the three models of OCS-PCA-PSO-LSSVM, PCA-PSO-LSSVM and SVM. It may be observed from the table that the values of the maximum deviation, the maximum relative deviation, the average absolute deviation, the average relative deviation, the root mean square error, and the standard deviation of the OCS-PCA-PSO-LSSVM model are significantly lower than the corresponding results of the PCA-PSO-LSSVM model and the SVM model. Where, compared with the PCA-PSO-LSSVM model, the MAXE of the OCS-PCA-PSO-LSSVM model decreased by 39.15%, the MRE decreased by 25.00%, and the STD decreased by 29.89%. The reason for this is that when the PCA-PSO-LSSVM model predicted the 2nd, 10th, 20th, and 21st sample individuals in the test sample set, their prediction deviations were greater than their respective maximum fitting deviation the training sample set, so the OCS strategy was initiated 4 times to perform the iterative update of the model, therefore, from the 2nd
SAMSE 2018
IOP Conf. Series: Materials Science and Engineering 490 (2019) 062027
IOP Publishing
doi:10.1088/1757-899X/490/6/062027
8
sample individual of the test sample set containing 25 sample individuals, and the predicted value of the model was different from the predicted value of the PCA-PSO-LSSVM model without the OCS strategy integrated, which was generally reflected as the deviation tends to be small, thus achieving dynamic adjustment and optimization of the model.
Tab. 1 Model performances comparison on the testing data set
Methods MAXE/mg·L-1
MAXRE/%
MAE /mg·L-1
MRE /%
RMSE /mg·L-1
STD /mg·L-1
SVM 54.39 7.82 18.62 2.58 22.96 13.71
PCA-PSO-LSSVM 51.09 7.53 17.37 2.40 21.57 13.05
OCS-PCA-PSO-LSSVM 31.09 6.26 12.31 1.80 15.23 9.15
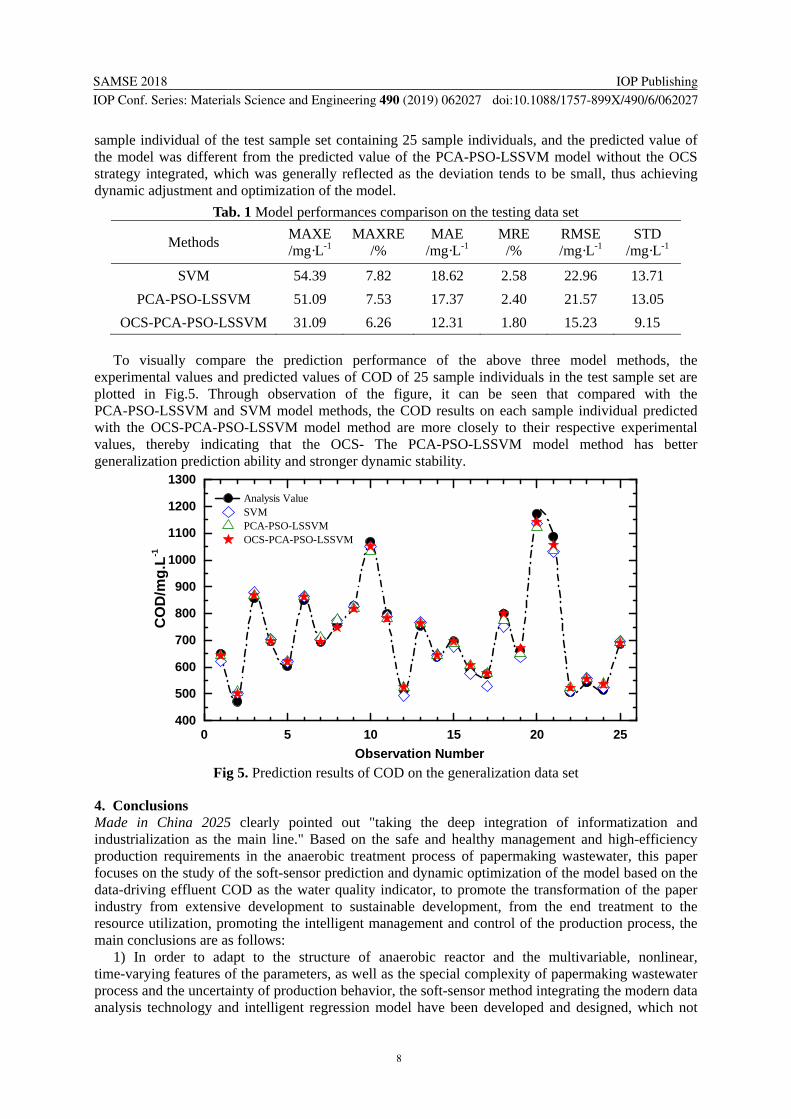
To visually compare the prediction performance of the above three model methods, the experimental values and predicted values of COD of 25 sample individuals in the test sample set are plotted in Fig.5. Through observation of the figure, it can be seen that compared with the PCA-PSO-LSSVM and SVM model methods, the COD results on each sample individual predicted with the OCS-PCA-PSO-LSSVM model method are more closely to their respective experimental values, thereby indicating that the OCS- The PCA-PSO-LSSVM model method has better generalization prediction ability and stronger dynamic stability.
0 5 10 15 20 25400
500
600
700
800
900
1000
1100
1200
1300
Observation Number
CO
D/m
g.L
-1
Analysis Value SVM PCA-PSO-LSSVM OCS-PCA-PSO-LSSVM
Fig 5. Prediction results of COD on the generalization data set
4. Conclusions Made in China 2025 clearly pointed out "taking the deep integration of informatization and industrialization as the main line." Based on the safe and healthy management and high-efficiency production requirements in the anaerobic treatment process of papermaking wastewater, this paper focuses on the study of the soft-sensor prediction and dynamic optimization of the model based on the data-driving effluent COD as the water quality indicator, to promote the transformation of the paper industry from extensive development to sustainable development, from the end treatment to the resource utilization, promoting the intelligent management and control of the production process, the main conclusions are as follows:
1) In order to adapt to the structure of anaerobic reactor and the multivariable, nonlinear, time-varying features of the parameters, as well as the special complexity of papermaking wastewater process and the uncertainty of production behavior, the soft-sensor method integrating the modern data analysis technology and intelligent regression model have been developed and designed, which not
SAMSE 2018
IOP Conf. Series: Materials Science and Engineering 490 (2019) 062027
IOP Publishing
doi:10.1088/1757-899X/490/6/062027
9
only effectively reduces the complex collinearity between variables, but also reduces the spatial dimension of the model, and the prediction accuracy and dynamic stability of the model are significantly improved, achieving the overall improvement and breakthrough of the model performance by virtue of the integration advantages.
2) Data-driving soft-sensor model method: As the time series data continues to increase, the prediction accuracy of the model based on long-term historical data will decrease. Taking the actual industrial process as the background, combined with the dynamic change characteristics of the process, the method can adaptively iteratively update the model parameters through deviation feedback, and maintain the generalization performance of the soft-sensor model in real time, thus ensuring the continuous efficient and stable operation of the equipment, and monitoring the energy conservation and emission reduction as well as sustainable development of the enterprise.
Acknowledgements Financial supports of this work by National Natural Science Foundation of China (U1609214), Major Projects for Science and Technology Development of Zhejiang Province, China (2015C02037), Zhejiang Science and Technology Program key projects, China (2017C03010), and Zhejiang Province Research Project of Public Welfare Technology Application (2016C33105).
References [1]Bourgeois W, Burgess J E, Stuetz R M. 2010. On‐line monitoring of wastewater quality: a
review[J]. Journal of Chemical Technology & Biotechnology, 76: 337-348 [2]Choi D J, Park H. 2001.A hybrid artificial neural network as a software sensor for optimal control
of a wastewater treatment process[J]. Water Research, 35: 3959-3967 [3]Cristianini N, Shawe T J. 2000. An Introduction to Support Vector Machines and Other
Kernel-based Learning Methods[M], Cambridge University Press, 112-120 [4]Dürenmatt D J, Gujer W. 2012. Data-driven modeling approaches to support wastewater treatment
plant operation. Environmental Modeling & Software. 30: 47-56 [5]Fortuna L, Graziani S, Rizzo A, et al.2007. Soft Sensors for Monitoring and Control of Industrial
Processes[M]. Springer-Verlag: London, 34-45 [6]Haimi H, Mulas M, Corona F, et al. 2013. Data-derived soft-sensors for biological wastewater
treatment plants: An overview[J]. Environmental Modelling & Software, 47: 88-107 [7]Huang Mingzhi, Ma Yongwen, Wan Jinquan, et al. 2015. A sensor-software based on a genetic
algorithm based neural fuzzy system for modeling and simulating a wastewater treatment process[J]. Applied Soft Computing, 27: 1-10
[8]Jolliffe I T. 2002. Principal Component Analysis (second edition)[M]. Springer-Verlag, 168-176 [9]Kennedy J, Eberhart R C. 1995. Particle swarm optimization[C]. Proceedings of IEEE International
Conference on Neural Networks. Perth, Australia, 1942-1948 [10]Langergraber G, Fleischmann N, Hofstaedter F, et al. 2004. Monitoring of a paper mill wastewater
treatment plant using UV/VIS spectroscopy[J], Water Science and Technology, 49: 9-14 [11]Liu Bo, Wan Jinquan, Huang Mingzhi, et al. 2015. Online Prediction Model for Effluent VFA
from Anaerobic Wastewater Treatment System Based on PCA-LSSVM[J]. Journal of Environmental Sciences, 35(6): 1768-1778
[12]Liu Lin, Ma Yiwen, Wan Jinquan, et al. 2017. Soft-sensor Model of Anaerobic Treatment Process of Wastewater Based on Pso-SVM[J], Journal of Environmental Science, 37(6): 2122-2129
[13]Ruggeri B, Tommasi T, Sanfilippo S. 2015.BioH2 & BioCH4 Through Anaerobic Digestion From Research To Full-Scale Applications[M]. Springer-Verlag, 1-24
[14]Souza F A A, Aráujo R, Mendes J. 2016. Review of soft sensor methods for regression applications. Chemometrics and Intelligent Laboratory Systems, 152: 69-79
[15]Sun Jun, Cheng Zhong, Yang Ruiqin, et al. 2017. PCA-PSO-LSSVM-based Soft-sensor of Effluent COD of the Anaerobic Treatment System for Papermaking Wastewater [J].Computer and Applied Chemistry, 34(9): 706-710
[16]Tang Wei, Bai Zhixiong, Gao Xiang. 2017. Dissolved Oxygen Concentration Control System Based on Adaptive Mutation Differential Evolution Algorithm[J]. Paper China, 36 (6): 49-54

SAMSE 2018
IOP Conf. Series: Materials Science and Engineering 490 (2019) 062027
IOP Publishing
doi:10.1088/1757-899X/490/6/062027
10
[17]Wan Jinquan, Huang Mingzhi, Ma Yongwen, et al. 2011. Prediction of effluent quality of a paper mill wastewater treatment using an adaptive network-based fuzzy inference system[J]. Applied Soft Computing, 11: 3238-3246
[18]Wang Wenchuan, Liu Xinggao.2015.Melt index prediction by least squares support vector machines with an adaptive mutation fruit fly optimization algorithm[J]. Chemometrics and Intelligent Laboratory Systems, 141: 79-87
[19]Wang Yao, Xu Liang, Yin Wenzhi, et al. 2017. Soft-sensor Modeling of Papermaking Wastewater Treatment Process Based on ANN and LSSVR[J]. Transactions of China Pulp and Paper, 32(1): 50-54
[20]Xu Lisha, Qian Xiaoshan. 2012. A Study on Soft-sensor of Effluent COD Based on MUTATION CPSO ALGORITHM[J]. Chinese Journal of Environmental Engineering, 6: 1455-1458
[21]Yang Hao, Mo Weilin, Xiong Zhixin, et al. 2016. Soft-sensor Modeling of Papermaking Wastewater Treatment Process Based on RPLS[J]. Paper China, 35(10): 31-35
[22]Zhang Wei, Liu Min, Chen Wei, et al. 2014. Influence of External Circulation on the Operation Effect of IC Reactors[J]. Journal of Chemical Industry and Engineering, 65: 2329-2334
[23]Zhao Huiru, Huang Guo, Yan Ning. 2018.Forecasting energy-related CO2 emissions employing a novel SSA-LSSVM model: considering structural factors in China[J]. Energies, 11: 781-802.
[24]Zheng Rongjian, Pan Feng. 2017. Modeling for Concentration Prediction of Glutamic Acid Fermentation Products based on PLS-LSSVM[J]. Journal of Chemical Industry and Engineering, 68: 976-983
[25]Zhou Hongbiao, Qiao Junfei. 2017. Application of Hybrid Multi-objective Particle Swarm Optimization Algorithm in Optimal Control of Wastewater Treatment Process[J]. Journal of Chemical Industry and Engineering, 68: 3511-3521
[26]Zhou Xinran. 2012. Research on online Modeling and Control Method Based on Least Squares Support Vector Machine[D]. Changsha: Hunan University, 19-21
PAPERmaking!
FROM THE PUBLISHERS OF PAPER TECHNOLOGY
Volume 5, Number 1, 2019
Page 1 of 9 Article 2 – Biobleaching
Biobleaching for pulp and paper industry in India: Emerging enzyme technology Gursharan Singh, Satinderpal Kaur, Madhu Khatri, Shailendra Kumar Arya. Indian pulp and paper industry is one of the fastest emerging business sector of the country which has shown tremendous growth in last few years. Governments policies are creating sustain pressure on paper industries to preserve the clean and pollution free environment at any price. As a result industries are pondering to replace the chemical bleaching processes with facile bio-based cost effective technologies. Eco-friendly bleaching enzymes like xylanases and laccases have the potential for biobleaching of wood and agro-based pulps at industrial scale. In India, enzymatic prebleaching of pulp is widely being investigated and has achieved favourable outcomes but at laboratory scales only and commercial application of enzymes for the delignification of pulp is still at budding stage. This article tends to draw the attention on significant efforts which have been continually attributed by indigenous research laboratories and industries to replace the chemical bleaching with enzymes. Contact information: Department of Biotechnology, University Institute of Engineering Technology, Panjab University, Chandigarh, India E-mail address: [email protected] Biocatalysis and Agricultural Biotechnology 17 (2019) 558–565. https://doi.org/10.1016/j.bcab.2019.01.019
The Paper Industry Technical Association (PITA) is an independent organisation which operates for the general benefit of its members – both individual and corporate – dedicated to promoting and improving the technical and scientific knowledge of those working in the UK pulp and paper industry. Formed in 1960, it serves the Industry, both manufacturers and suppliers, by providing a forum for members to meet and network; it organises visits, conferences and training seminars that cover all aspects of papermaking science. It also publishes the prestigious journal Paper Technology International and the PITA Annual Review, both sent free to members, and a range of other technical publications which include conference proceedings and the acclaimed Essential
Guide to Aqueous Coating.
Contents lists available at ScienceDirect
Biocatalysis and Agricultural Biotechnology
journal homepage: www.elsevier.com/locate/bab
Biobleaching for pulp and paper industry in India: Emerging enzymetechnology
Gursharan Singh, Satinderpal Kaur, Madhu Khatri, Shailendra Kumar Arya⁎
Department of Biotechnology, University Institute of Engineering Technology, Panjab University, Chandigarh, India
A R T I C L E I N F O
Keywords:BiobleachingEco-friendlyLaccasePulp and paperXylanase
A B S T R A C T
Indian pulp and paper industry is one of the fastest emerging business sector of the country which has showntremendous growth in last few years. Governments policies are creating sustain pressure on paper industries topreserve the clean and pollution free environment at any price. As a result industries are pondering to replace thechemical bleaching processes with facile bio-based cost effective technologies. Eco-friendly bleaching enzymeslike xylanases and laccases have the potential for biobleaching of wood and agro-based pulps at industrial scale.In India, enzymatic prebleaching of pulp is widely being investigated and has achieved favorable outcomes butat laboratory scales only and commercial application of enzymes for the delignification of pulp is still at buddingstage. This article tends to draw the attention on significant efforts which have been continually attributed byindigenous research laboratories and industries to replace the chemical bleaching with enzymes.
1. Introduction
Currently Indian pulp and paper industrial units account for ~ 3.0%of the world's production of paper. The estimated turnover of the in-dustry is US$ ~ 8.0 billion. The industry provides employment to morethan 0.5 million people directly and 1.5 million indirectly. During2015–16, domestic production of paper was estimated to be 12.2 mil-lion tons (http://ipma.co.in). Paper industry in country is becomingmore promising as the domestic demand of paper is increasing due tothe growing population and literacy rate, growth in gross domesticproduct (GDP) and lifestyle of the individuals (Sharma et al., 2015a;Sharma et al., 2015b; Sharma et al., 2015c). The focus of paper industryis now shifting towards eco-friendly production of paper. The paper isproduced from pulps generated from wood, agricultural residues likewheat straw or from waste paper. The use of wood based technology isconstantly on the decline because of capital and raw material avail-ability constraints. The production of pulp and paper involves threeimportant steps viz. pulping, bleaching, and final paper finishing. Theremoval of recalcitrant lignin from pulp is called bleaching which isnecessary for making the bright and white paper. Till the end of 20thcentury, bleaching of pulps, irrespective of their origin from soft or hardwood, employed large amounts of chlorine and chlorine based chemi-cals. But now most of the pulp and paper mills worldwide use chlorinedioxide (ClO2) as the elemental chlorine free (ECF) bleaching agent forthe production of high quality white paper (Dwivedi et al., 2010;
Bajpai, 2012). The high organic content (especially in the wood basedpulp), coupled with chlorine dioxide used in the bleaching process,results in the production of organo-chlorine compounds, which are fi-nally discharged as bleach effluents in water bodies. These organo-chlorine compounds (measured as Adsorbable Organic Halogens, AOX)have been reported to cause genetic and reproductive damages inaquatic as well as terrestrial animals including humans (Sharma et al.,2014). Although more eco-friendly options for bleaching are open topulp mills in the form of alternatives to ClO2 like extended cooking oroxygen, hydrogen peroxide or ozone based delignification, but im-plementation of these alternates needs process modifications and isconsidered as cost intensive proposition at large scale. Enzymes providea simpler and cost effective way to reduce the use of ClO2, chlorinecompounds and other bleaching chemicals. Enzymes also offer thesimple approach that allows for a higher brightness ceiling to bereached (Abhay et al., 2018). This can all be achieved without majorcapital investment. The applications of xylanase enzyme as pre-bleaching agent has been established in several laboratories and hasalso been commercially exploited in Europe, North America and in fewAsian countries (Bajpai, 2012).
2. Structure of the Indian paper industry
The Indian paper industry recognized as the aggregation of small,medium and large sized paper mills with different paper making
https://doi.org/10.1016/j.bcab.2019.01.019Received 8 November 2018; Received in revised form 9 January 2019; Accepted 10 January 2019
⁎ Corresponding author.E-mail address: [email protected] (S.K. Arya).
Biocatalysis and Agricultural Biotechnology 17 (2019) 558–565
Available online 11 January 20191878-8181/ © 2019 Elsevier Ltd. All rights reserved.
T
capacities, 10–1150 t per day. Paper production in the country is widelybased on wood and agricultural waste as the major raw materials. TheIndian paper industry prominently produces writing, newsprint andcommercial grade paper. Newsprint grade paper is produced by millsutilizing mainly of recycled waste paper as the raw material. In 2012,India recorded the paper consumption of 9.3 kg/capita besides globalaverage was 58 kg/capita. Presently there are 759 paper mills in thecountry and producing ~ 10.9Mt of paper annually (http://psa.gov.in;initiatives-pulp-and-paper-industry-2014). Indian paper manu-facturers association (IPMA) representing the platform to project paperindustry's views and articulate its strategies. IPMA promoted the in-terests of paper industry in the country and help it achieve globalcompetitiveness while striving to be an active participant in the policymaking process. The important activities of IPMA are following, workas the interface with government, non-governmental organizations(NGOs) and industrial associations so as to present the perspective andinterests of Indian paper mills. Promote the excellence in paper man-ufacturing through presentation of awards, networking with interna-tional bodies with a view to gain better visibility for Indian paper in-dustry. IPMA also synchronize the R&D projects in collaboration withacademic institutions of India.
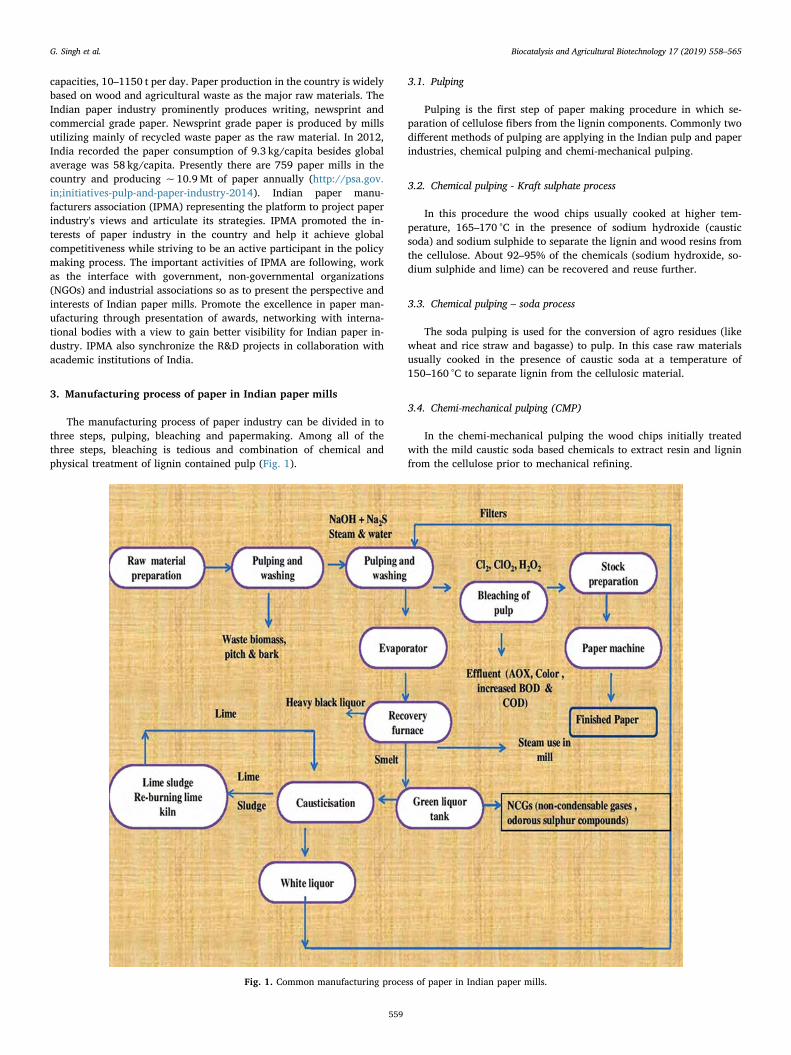
3. Manufacturing process of paper in Indian paper mills
The manufacturing process of paper industry can be divided in tothree steps, pulping, bleaching and papermaking. Among all of thethree steps, bleaching is tedious and combination of chemical andphysical treatment of lignin contained pulp (Fig. 1).
3.1. Pulping
Pulping is the first step of paper making procedure in which se-paration of cellulose fibers from the lignin components. Commonly twodifferent methods of pulping are applying in the Indian pulp and paperindustries, chemical pulping and chemi-mechanical pulping.
3.2. Chemical pulping - Kraft sulphate process
In this procedure the wood chips usually cooked at higher tem-perature, 165–170 °C in the presence of sodium hydroxide (causticsoda) and sodium sulphide to separate the lignin and wood resins fromthe cellulose. About 92–95% of the chemicals (sodium hydroxide, so-dium sulphide and lime) can be recovered and reuse further.
3.3. Chemical pulping – soda process
The soda pulping is used for the conversion of agro residues (likewheat and rice straw and bagasse) to pulp. In this case raw materialsusually cooked in the presence of caustic soda at a temperature of150–160 °C to separate lignin from the cellulosic material.
3.4. Chemi-mechanical pulping (CMP)
In the chemi-mechanical pulping the wood chips initially treatedwith the mild caustic soda based chemicals to extract resin and ligninfrom the cellulose prior to mechanical refining.
Fig. 1. Common manufacturing process of paper in Indian paper mills.
G. Singh et al. Biocatalysis and Agricultural Biotechnology 17 (2019) 558–565
559
3.5. De-inking of RCF
Recycled fibers (RCF) dispersion or floatation pulping process isapplied for the de-inking of the news papers/print papers. For de-inking, chemicals such as detergents, dispersants and foaming agentsadded and ink is separated from the pulp.
3.6. Pre-bleaching of pulp with enzymes
The term bleaching is generally referred to the removal of ligninfrom any kind of the pulp by use of chemicals/gases/steam etc. butprebleaching terminology is used for the enzymatic treatment of thepulp for removal of lignin. Prebleaching is an eco-friendly and cleanerprocess of lignin removal that can save the chlorine based and otherchemicals 10–15% (Bajpai, 2004; Camarero et al., 2007; Garg et al.,2011). Prebleaching of pulp with enzymes is still under trial or at pilotscale in paper mills of India.
3.7. Chlorine bleaching of pulp
The process is used to remove the residual lignin in the range5–10%. This process is followed by several stages of treatment of pulpwith chlorine dioxide or hypochlorite to whiten the pulp. Bleachingprocess employed in most of the medium and small mills is based onelemental chlorine. However, few of the large sized wood based/agrobased mills have introduced elemental chlorine free (ECF) bleachingprocess making use of chlorine dioxide ClO2.
3.8. Elemental chlorine free (ECF) bleaching
ECF bleaching technology is being practiced in few large mills of thecountry where it uses oxygen delignification (ODL), followed by ClO2 toenhance the brightness of the pulp.
4. Eco-friendly bleaching enzymes (xylanases and laccases)studied by the Indian research laboratories
There are numerous commercially available enzyme cocktails areavailable, but due to the differences in paper making process in thedeveloped countries and in India, it has been felt to characterize en-zymatic pre-bleaching process indigenously with enzymes producedfrom locally isolated cultures or with commercially available enzymesthat match with the interests of Indian pulp industries. One of the majordifferences is the use of different sort of raw materials for pulp makingin India (Sharma et al., 2015a; Sharma et al., 2015b; Sharma et al.,2015c; Dutt et al., 2009; Bajpai et al., 1994; Singh et al., 2008; Singhet al., 2010). Up to the 1980, there was no university or institute wasassociated in research and development (R&D) that can directly in-volved for giving the technical guidelines to Indian paper industry. R&Dprogress on enzymes for paper industry is still in its beginning and onlysingle institute works in a direction to undertake industry related issuesand emphasized on applied research, is Central Pulp and Paper Re-search Institute (CPPRI). There were only a few reports on xylanases forthe biobleaching of pulp in country before 2000, e.g. treatment of eu-calyptus pulp with commercial xylanases such as Novozyme 473, andCartazyme HS-10 reduced the chlorine consumption by 31% and in-creased the final brightness by 2.1–4.9 points (Bajpai et al., 1994).Thermostable cellulase-free xylanase from Streptomyces sp. QG-11-3was produced and applied for delignification of eucalyptus kraft pulp atpH 8.5 and 50 °C for 2 h. There was reduction in kappa number andincrease in brightness of pulp by 25% and 20% respectively (Beg et al.,2000). Bajpai, reported, properties of many commercial xylanases makethem unsuitable for the real process of pulp bleaching (Bajpai, 2004).So industries need xylanases which can function efficiently in theirexisting papermaking processes. Xylanase from Bacillus megateriumshowed 8.1% decrease in kappa number and 13% increase in brightness
of eucalyptus kraft pulp with 31% reduction in chlorine consumption(Sindhu et al., 2006). Extracellular cellulase free xylanase producedfrom Bacillus subtilis C01 increased the brightness by 19% of bananapulp Ayyachamy and Vatsala (Ayyachamy and Vatsala, 2007). Purifiedalkali stable xylanase from Aspergillus fischeri was immobilized onpolystyrene that reduced the kappa number of paper pulp by 87%(Senthilkumar et al., 2008). A synergistic action of xylano-pectinolyticenzymes from Bacillus pumilus was evaluated for the prebleaching ofkraft pulp; as a result 8.5% and 25% reduction was noticed in kappanumber and chlorine consumption respectively (Kaur et al., 2010).Alkali stable and thermo tolerant xylanase from B. pumilus SV-85Sshowed (at pH 9.0, 55 °C for 2.0 h) the reduction in kappa number by1.6 points and increased brightness by 1.9 points. The pretreatment ofpulp with xylanase resulted in 29% reduction in chlorine consumption(Nagar et al., 2013). First report on a bacterial system involving directgrowth of xylanase -producing B. halodurans FNP 135 on kraft (eu-calyptus) pulp under submerged fermentation conditions, showed 35%reduction in kappa number and 5.8% enhancement in brightness with20% reduction in chlorine consumption (Gupta et al., 2015). Kumaret al. (2016) emphasized that significant application of thermostablexylanases is biobleaching in pulp and paper industry, where these en-zymes acted as delignifying agents, showing clear economic and en-vironmental advantages over chemical alternatives. After xylanases,laccases are the next extensively explored enzymes for biobleaching ofpulp; these are oxidative biocatalysts that have influenced the re-searchers by their numerous merits over any other bleaching enzyme(Singh et al., 2008; Singh et al., 2010; Singh et al., 2009; Singh et al.,2015). Laccases, together with mediators are able to delignify the pulpby the oxidation chain reaction leading to lignin oxidation without thedegradation of cellulose. In India pioneering work on alkalophilic lac-cases was started by Bains et al. (Bains et al., 2003), through isolation ofa novel strain named as γ-proteobacterium JB. An alkalophilic cellu-lase-free laccase from γ-proteobacterium JB was applied to wheatstraw-rich soda pulp to evaluate its bleaching potential by optimizingthe conditions statistically using response surface methodology basedon central composite design in the presence of ABTS at pH 8.0 whichenhanced the brightness by 5.8 and reduced the kappa number by 21%within 4 h of incubation at 55 °C. It was noticed that pre-bleaching ofeucalyptus kraft pulp with xylanase or laccase individually avoided theClO2 by 15% and 25% respectively. When both enzymes were appliedtogether at pilot scale (50 kg pulp), there was reduced organo-chlorinecompounds consumption by 34% in bleach effluent (Sharma et al.,2014). Tables 1, 2 shows the year wise isolation of new laccase andxylanase producing organisms and enzyme characterization, but therewere very few enzymes either xylanase or laccase evaluated for bio-leaching of pulps. Recently, also many reports published on xylanasesand laccases from Indian laboratories but none of them studied ondelignification of biomass (Sharma et al., 2015a; Sharma et al., 2015b;Sharma et al., 2015c; Desai and Iyer, 2016; Nikam et al., 2017; Afreenet al., 2017; Dharmesh et al., 2017; Raj et al., 2018; Kumar et al., 2018;Ranimol et al., 2018).
5. Commercial use and availability of Indian patents on bleachingenzymes
R&D work on isolation and screening of microbial cultures, capableof producing low molecular weight xylanases was started initially atNational Chemical Laboratory Pune in early 1990s. Later, IIT Delhi,Birla Institute of Scientific and Industrial Research Jaipur and few otherresearch and academic institutions began working on culture develop-ment for the production of alkaline thermo-tolerant xylanase enzymes.A national research laboratory CPPRI and a premier educational in-stitution in the country, Institute of Paper Technology (IPT) also in-itiated R&D on xylanase enzyme based pre-bleaching of the pulp. Thefirst ever mill trial of xylanase pre-bleaching in India was conducted ina pulp and paper mill of Ballarpur Industries Ltd. (BILT) in 1992 using
G. Singh et al. Biocatalysis and Agricultural Biotechnology 17 (2019) 558–565
560
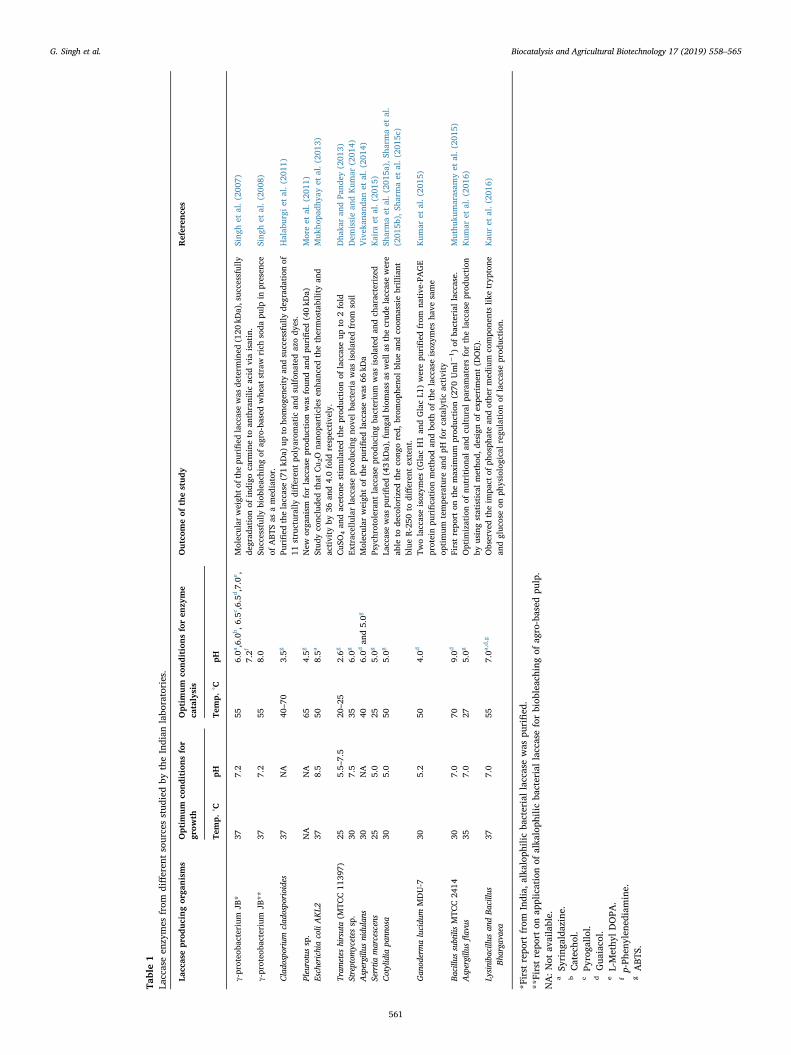
Table1
Laccaseen
zymes
from
differen
tsourcesstud
iedby
theIndian
labo
ratories.
Lacc
asepr
oduc
ingor
ganism
sOptim
umco
nditions
for
grow
thOptim
umco
nditions
foren
zyme
catalysis
Outco
meof
thestud
yReferen
ces
Temp.
°CpH
Temp.
°CpH
γ-proteo
bacterium
JB*
377.2
556.0a,6.0
b,6
.5c ,6.5d,7.0
e ,7.2f
Molecular
weigh
tofthe
purified
laccasewas
determ
ined
(120
kDa),suc
cessfully
degrad
ationof
indigo
carm
ineto
anthranilic
acid
viaisatin.
Sing
het
al.(20
07)
γ-proteo
bacterium
JB**
377.2
558.0
Successfully
biob
leaching
ofag
ro-based
whe
atstraw
rich
soda
pulp
inpresen
ceof
ABT
Sas
amed
iator.
Sing
het
al.(20
08)
Clado
sporium
clad
osporioides
37NA
40–7
03.5g
Purified
thelaccase(71kD
a)up
toho
mog
eneity
andsuccessfully
degrad
ationof
11structurally
differen
tpo
lyarom
atic
andsulfon
ated
azody
es.
Halab
urgi
etal.(20
11)
Pleurotussp.
NA
NA
654.5g
New
orga
nism
forlaccaseprod
uction
was
foun
dan
dpu
rified
(40kD
a)Moreet
al.(20
11)
EscherichiacoliAKL2
378.5
508.5a
Stud
yco
nclude
dthat
Cu 2O
nano
particlesen
hanc
edthethermostabilityan
dactivity
by36
and4.0fold
respective
ly.
Muk
hopa
dhya
yet
al.(20
13)
Tram
etes
hirsuta(M
TCC11
397)
255.5–
7.5
20–2
52.6g
CuS
O4an
daceton
estim
ulated
theprod
uction
oflaccaseup
to2fold
Dha
karan
dPa
ndey
(201
3)Streptom
ycetes
sp.
307.5
356.0g
Extracellularlaccaseprod
ucingno
velba
cteria
was
isolated
from
soil
Dem
issiean
dKum
ar(201
4)Aspergillu
snidu
lans
30NA
406.0d
and5.0g
Molecular
weigh
tof
thepu
rified
laccasewas
66kD
aVivek
anan
danet
al.(20
14)
Serrtia
marcescens
255.0
255.0g
Psychrotoleran
tlaccaseprod
ucingba
cterium
was
isolated
andch
aracterized
Kaira
etal.(20
15)
Cotylidia
pann
osa
305.0
505.0g
Laccasewas
purified
(43kD
a),fun
galb
iomassas
wella
sthecrud
elaccasewere
able
tode
colorizedtheco
ngored,
brom
ophe
nolblue
andco
omassiebrilliant
blue
R-250
todifferen
textent.
Sharmaet
al.(20
15a),S
harm
aet
al.
(201
5b),Sh
armaet
al.(20
15c)
Gan
odermalucidu
mMDU-7
305.2
504.0d
Twolaccaseisoz
ymes
(GlacH1an
dGlacL1
)werepu
rified
from
native
-PAGE
proteinpu
rification
metho
dan
dbo
thof
thelaccaseisoz
ymes
have
same
optimum
tempe
rature
andpH
forcatalyticactivity
Kum
aret
al.(20
15)
Bacillu
ssubtilisMTC
C24
1430
7.0
709.0d
Firstrepo
rton
themax
imum
prod
uction
(270
Uml−
1)of
bacteriallaccase.
Muthu
kumarasam
yet
al.(20
15)
Aspergillu
sflavus
357.0
275.0g
Optim
izationof
nutritiona
lan
dcu
ltural
paramatersforthelaccaseprod
uction
byusingstatisticalmetho
d,de
sign
ofexpe
rimen
t(D
OE).
Kum
aret
al.(20
16)
Lysiniba
cillu
san
dBa
cillu
sBh
argavaea
377.0
557.0a
,d,g
Observe
dtheim
pact
ofph
osph
atean
dothe
rmed
ium
compo
nentslik
etryp
tone
andgluc
oseon
physiologicalregu
lation
oflaccaseprod
uction
.Kau
ret
al.(20
16)
*First
repo
rtfrom
India,
alka
loph
ilicba
cteriallaccasewas
purified
.**
Firstrepo
rton
applicationof
alka
loph
ilicba
cteriallaccaseforbiob
leaching
ofag
ro-based
pulp.
NA:N
otav
ailable.
aSy
ring
alda
zine
.bCatecho
l.cPy
roga
llol.
dGua
iaco
l.eL-Methy
lDOPA
.fp-Ph
enylen
ediamine.
gABT
S.
G. Singh et al. Biocatalysis and Agricultural Biotechnology 17 (2019) 558–565
561
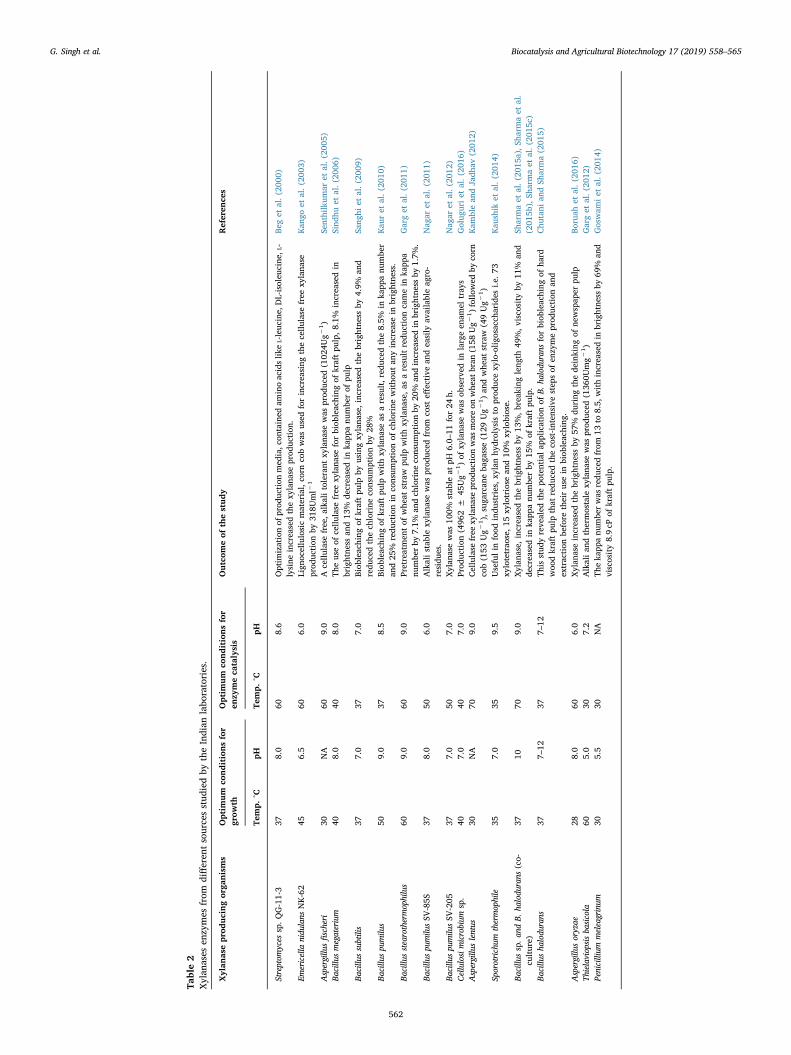
Table2
Xylan
ases
enzymes
from
differen
tsourcesstud
iedby
theIndian
labo
ratories.
Xylan
asepr
oduc
ingor
ganism
sOptim
umco
nditions
for
grow
thOptim
umco
nditions
for
enzy
meca
talysis
Outco
meof
thestud
yReferen
ces
Temp.
°CpH
Temp.
°CpH
Streptom
yces
sp.Q
G-11-3
378.0
608.6
Optim
izationof
prod
uction
med
ia,c
ontained
aminoacidslik
eL-leuc
ine,
DL-isoleu
cine
,L-
lysine
increasedthexy
lana
seprod
uction
.Be
get
al.(20
00)
Emericella
nidu
lans
NK-62
456.5
606.0
Lign
ocellulosicmaterial,co
rnco
bwas
used
forincreasing
thecellu
lase
free
xylana
seprod
uction
by31
8Uml−
1Kan
goet
al.(20
03)
Aspergillu
sfischeri
30NA
609.0
Acellu
lase
free,a
lkalitolerant
xylana
sewas
prod
uced
(102
4Ug−
1)
Senthilkum
aret
al.(20
05)
Bacillu
smegaterium
408.0
408.0
Theuseof
cellu
lase
free
xylana
seforbiob
leaching
ofkraftpu
lp,8
.1%
increasedin
brightne
ssan
d13
%de
creasedin
kapp
anu
mbe
rof
pulp
Sind
huet
al.(20
06)
Bacillu
ssubtilis
377.0
377.0
Biob
leaching
ofkraftpu
lpby
usingxy
lana
se,inc
reased
thebrightne
ssby
4.9%
and
redu
cedthech
lorine
consum
ptionby
28%
Sang
hiet
al.(20
09)
Bacillu
spu
milu
s50
9.0
378.5
Biob
leaching
ofkraftpu
lpwithxy
lana
seas
aresult,red
uced
the8.5%
inka
ppanu
mbe
ran
d25
%redu
ctionin
consum
ptionof
chlorine
witho
utan
yincrease
inbrightne
ss.
Kau
ret
al.(20
10)
Bacillu
sstearothermophilus
609.0
609.0
Pretreatmen
tof
whe
atstraw
pulp
withxy
lana
se,a
saresultredu
ctioncamein
kapp
anu
mbe
rby
7.1%
andch
lorine
consum
ptionby
20%
andincreasedin
brightne
ssby
1.7%
.Garget
al.(20
11)
Bacillu
spu
milu
sSV
-85S
378.0
506.0
Alkalistab
lexy
lana
sewas
prod
uced
from
cost
effective
andeasily
availableag
ro-
residu
es.
Nag
aret
al.(20
11)
Bacillu
spu
milu
sSV
-205
377.0
507.0
Xylan
asewas
100%
stab
leat
pH6.0–
11for24
h.Nag
aret
al.(20
12)
Cellulosimicrobium
sp.
407.0
407.0
Prod
uction
(496
2±
45Ug−
1)of
xylana
sewas
observed
inlargeen
amel
tray
sGolug
uriet
al.(20
16)
Aspergillu
slentus
30NA
709.0
Cellulase
free
xylana
seprod
uction
was
moreon
whe
atbran
(158
Ug−
1)follo
wed
byco
rnco
b(153
Ug−
1),suga
rcan
eba
gasse(129
Ug−
1)an
dwhe
atstraw
(49Ug−
1)
Kam
blean
dJadh
av(201
2)
Sporotrichum
thermophile
357.0
359.5
Usefulin
food
indu
stries,x
ylan
hydrolysis
toprod
ucexy
lo-olig
osacch
arides
i.e.7
3xy
lotetrao
se,1
5xy
lotriose
and10
%xy
lobiose.
Kau
shik
etal.(20
14)
Bacillu
ssp.a
ndB.
halodu
rans
(co-
culture)
3710
709.0
Xylan
ase,
increasedthebrightne
ssby
13%,b
reak
ingleng
th49
%,v
isco
sity
by11
%an
dde
creasedin
kapp
anu
mbe
rby
15%
ofkraftpu
lp.
Sharmaet
al.(20
15a),S
harm
aet
al.
(201
5b),Sh
armaet
al.(20
15c)
Bacillu
sha
lodu
rans
377–
1237
7–12
This
stud
yreve
aled
thepo
tentialap
plicationof
B.ha
lodu
rans
forbiob
leaching
ofha
rdwoo
dkraftpu
lpthat
redu
cedtheco
st-inten
sive
step
sof
enzymeprod
uction
and
extraction
before
theirusein
biob
leaching
.
Chu
tani
andSh
arma(201
5)
Aspergillu
soryzae
288.0
606.0
Xylan
aseincreasedthebrightne
ssby
57%
during
thede
inking
ofne
wspap
erpu
lpBo
ruah
etal.(20
16)
Thielaviopsisba
sicola
605.0
307.2
Alkalian
dthermostale
xylana
sewas
prod
uced
(136
0Umg−
1)
Garget
al.(20
12)
Penicillium
meleagrinum
305.5
30NA
Theka
ppanu
mbe
rwas
redu
cedfrom
13to
8.5,
withincreasedin
brightne
ssby
69%
and
viscosity8.9cP
ofkraftpu
lp.
Goswam
iet
al.(20
14)
G. Singh et al. Biocatalysis and Agricultural Biotechnology 17 (2019) 558–565
562
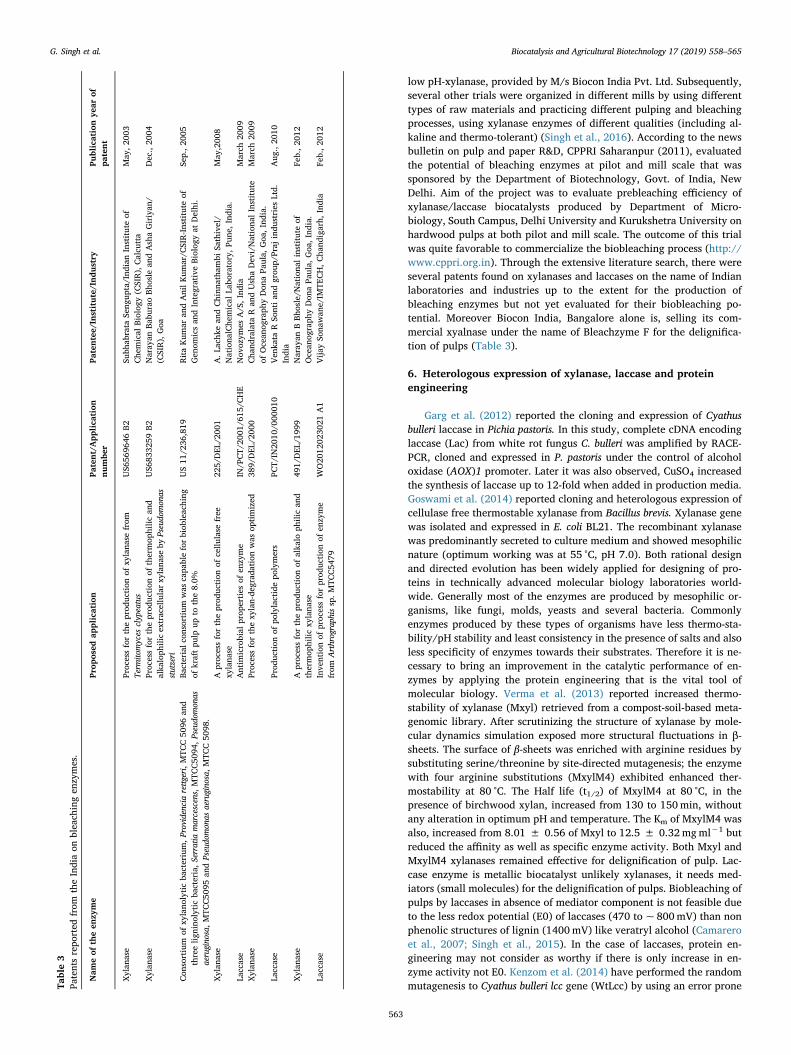
low pH-xylanase, provided by M/s Biocon India Pvt. Ltd. Subsequently,several other trials were organized in different mills by using differenttypes of raw materials and practicing different pulping and bleachingprocesses, using xylanase enzymes of different qualities (including al-kaline and thermo-tolerant) (Singh et al., 2016). According to the newsbulletin on pulp and paper R&D, CPPRI Saharanpur (2011), evaluatedthe potential of bleaching enzymes at pilot and mill scale that wassponsored by the Department of Biotechnology, Govt. of India, NewDelhi. Aim of the project was to evaluate prebleaching efficiency ofxylanase/laccase biocatalysts produced by Department of Micro-biology, South Campus, Delhi University and Kurukshetra University onhardwood pulps at both pilot and mill scale. The outcome of this trialwas quite favorable to commercialize the biobleaching process (http://www.cppri.org.in). Through the extensive literature search, there wereseveral patents found on xylanases and laccases on the name of Indianlaboratories and industries up to the extent for the production ofbleaching enzymes but not yet evaluated for their biobleaching po-tential. Moreover Biocon India, Bangalore alone is, selling its com-mercial xyalnase under the name of Bleachzyme F for the delignifica-tion of pulps (Table 3).
6. Heterologous expression of xylanase, laccase and proteinengineering
Garg et al. (2012) reported the cloning and expression of Cyathusbulleri laccase in Pichia pastoris. In this study, complete cDNA encodinglaccase (Lac) from white rot fungus C. bulleri was amplified by RACE-PCR, cloned and expressed in P. pastoris under the control of alcoholoxidase (AOX)1 promoter. Later it was also observed, CuSO4 increasedthe synthesis of laccase up to 12-fold when added in production media.Goswami et al. (2014) reported cloning and heterologous expression ofcellulase free thermostable xylanase from Bacillus brevis. Xylanase genewas isolated and expressed in E. coli BL21. The recombinant xylanasewas predominantly secreted to culture medium and showed mesophilicnature (optimum working was at 55 °C, pH 7.0). Both rational designand directed evolution has been widely applied for designing of pro-teins in technically advanced molecular biology laboratories world-wide. Generally most of the enzymes are produced by mesophilic or-ganisms, like fungi, molds, yeasts and several bacteria. Commonlyenzymes produced by these types of organisms have less thermo-sta-bility/pH stability and least consistency in the presence of salts and alsoless specificity of enzymes towards their substrates. Therefore it is ne-cessary to bring an improvement in the catalytic performance of en-zymes by applying the protein engineering that is the vital tool ofmolecular biology. Verma et al. (2013) reported increased thermo-stability of xylanase (Mxyl) retrieved from a compost-soil-based meta-genomic library. After scrutinizing the structure of xylanase by mole-cular dynamics simulation exposed more structural fluctuations in β-sheets. The surface of β-sheets was enriched with arginine residues bysubstituting serine/threonine by site-directed mutagenesis; the enzymewith four arginine substitutions (MxylM4) exhibited enhanced ther-mostability at 80 °C. The Half life (t1/2) of MxylM4 at 80 °C, in thepresence of birchwood xylan, increased from 130 to 150min, withoutany alteration in optimum pH and temperature. The Km of MxylM4 wasalso, increased from 8.01 ± 0.56 of Mxyl to 12.5 ± 0.32mgml−1 butreduced the affinity as well as specific enzyme activity. Both Mxyl andMxylM4 xylanases remained effective for delignification of pulp. Lac-case enzyme is metallic biocatalyst unlikely xylanases, it needs med-iators (small molecules) for the delignification of pulps. Biobleaching ofpulps by laccases in absence of mediator component is not feasible dueto the less redox potential (E0) of laccases (470 to ~ 800mV) than nonphenolic structures of lignin (1400mV) like veratryl alcohol (Camareroet al., 2007; Singh et al., 2015). In the case of laccases, protein en-gineering may not consider as worthy if there is only increase in en-zyme activity not E0. Kenzom et al. (2014) have performed the randommutagenesis to Cyathus bulleri lcc gene (WtLcc) by using an error proneTa
ble3
Patentsrepo
rted
from
theIndiaon
bleach
ingen
zymes.
Nam
eof
theen
zyme
Prop
osed
application
Patent/A
pplica
tion
numbe
rPa
tentee
/Ins
titute/Ind
ustry
Publicationye
arof
patent
Xylan
ase
Proc
essfortheprod
uction
ofxy
lana
sefrom
Term
itomyces
clypeatus
US6
5696
46B2
Subh
abrata
Seng
upta/Ind
ianInstituteof
Che
mical
Biolog
y(C
SIR),Calcu
tta
May
,200
3
Xylan
ase
Proc
essfortheprod
uction
ofthermop
hilic
and
alka
loph
ilicextracellularxy
lana
seby
Pseudo
mon
asstutzeri
US6
8332
59B2
Naray
anBa
buraoBh
osle
andAshaGiriyan
/(C
SIR),Goa
Dec.,20
04
Con
sortium
ofxy
lano
lyticba
cterium,P
rovidencia
rettg
eri,MTC
C50
96an
dthreelig
nino
lyticba
cteria,S
erratia
marcescens,MTC
C50
94,P
seud
omon
asaerugino
sa,M
TCC50
95an
dPseudo
mon
asaerugino
sa,M
TCC50
98.
Bacterialc
onsortium
was
capa
bleforbiob
leaching
ofkraftpu
lpup
tothe8.0%
US11
/236
,819
RitaKum
aran
dAnilKum
ar/C
SIR-Institute
ofGen
omicsan
dIntegrativeBiolog
yat
Delhi.
Sep.,2
005
Xylan
ase
Aproc
essfortheprod
uction
ofcellu
lase
free
xylana
se22
5/DEL
/200
1A.L
achk
ean
dChinn
atha
mbi
Sathivel/
Nationa
lChe
mical
Labo
ratory,P
une,
India.
May
,200
8
Laccase
Antim
icrobial
prop
erties
ofen
zyme
IN/P
CT/
2001
/615
/CHE
Nov
ozym
esA/S
,Ind
iaMarch
2009
Xylan
ase
Proc
essforthexy
lan-de
grad
ationwas
optimized
389/
DEL
/200
0Cha
ndralata
Ran
dUshaDev
i/Nationa
lInstitute
ofOcean
ograph
yDon
aPa
ula,
Goa
,Ind
ia.
March
2009
Laccase
Prod
uction
ofpo
lylactidepo
lymers
PCT/
IN20
10/0
0001
0Ven
kata
RSo
ntian
dgrou
p/Praj
indu
stries
Ltd.
India
Aug
.,20
10
Xylan
ase
Aproc
essfortheprod
uction
ofalka
loph
ilican
dthermop
hilic
xylana
se49
1/DEL
/199
9Naray
anBBh
osle/N
ationa
linstituteof
Ocean
ograph
yDon
aPa
ula,
Goa
,Ind
ia.
Feb.,2
012
Laccase
Inve
ntionof
proc
essforprod
uction
ofen
zyme
from
Arthrograph
issp.M
TCC54
79WO20
1202
3021
A1
Vija
ySo
nawan
e/IM
TECH,Cha
ndigarh,
India
Feb.,2
012
G. Singh et al. Biocatalysis and Agricultural Biotechnology 17 (2019) 558–565
563
PCR. The 816-bp fragment (toward the C terminus) of the WtLcc wasmanipulated and enzyme variants (Lcc35, Lcc61, and Lcc62) werechosen best on the criteria of enhanced enzyme activity against ABTS.In this study the mutant laccase variants have the same E0 like theparent WtLcc.
7. Environmental regulations for the paper industry and policymeasures
Pulp and paper industry presently consuming the large quantities offresh water, 80–150m3 t−1 of paper, depends on the type of raw ma-terial being used. Commonly agro based paper mills are expendingmore water than recycled fibre (RCF) mills for removing the chemicalsfrom processed pulp. Disposal of waste water contained severely en-vironmental toxic compounds (AOX), bleaching (hydrogen peroxide,chlorine dioxide and caustic soda) and whitening agents (kaolin, cal-cium carbonate and titanium dioxide). Consequences of growingawareness about healthy and clean environment, paper industries fa-cing stringent criticisms from Government as well as from generalpublic due to release of untreated or partially treated effluent (Bajpai,2012). In response to environmental concerns the paper industry hasreacted by making process modifications based on existing and newproven technologies. The Central Pollution Control Board (CPCB) hastaken several initiatives for reducing the pollution caused by papermills, up to 2020. CPCB will make sure that none of the paper industrycan discharge untreated industrial effluent to the water bodies likerivers and canals. Some of large paper industries recently upgradedtheir effluent treatment plant (ETP) with installation of tertiary treat-ment system for better effluent quality, particularly colour and sus-pended solids. Some of the medium sized agro-based paper mills haveinstalled the non-conventional chemical recovery system, to incineratethe black liquor, which is one of the major causes of pollution. Effluentfrom all the operational units is mixed together and collected in effluenttreatment plant for a common treatment, this is current practiceadopted by most of the small and medium paper industries. This mixingup of all types of wastes poses a problem of handling large volumes ofeffluents with a variety of effluent parameters. It is suggested that co-loured and non-coloured effluents should be segregated and treatedseparately thereby reducing the overall chemical load and possiblyimproving the treated wastewater quality. Therefore, mills may initiateactions to reengineer and modernize the existing ETP to phase outunlined lagoons by providing efficient coagulation and flocculationprocesses and converting the existing anaerobic lagoons into a linedlagoon for active aerobic process, thereby avoiding any groundwaterpollution problem, improving the quality of treated effluent as well asreducing the holding time (http://psa.gov.in).
8. Conclusion and future prospects
Irrespective of continuous progress of Indian paper industries, onlyfew of the large wood based paper mills have made progress by adop-tion of new green technologies but fully fledged, total chlorine free(TCF) bleaching of pulp with cocktail of enzymes is still under ob-servations. ECF and TCF paper production offers opportunities foremerging enzyme technology which provide a simple and cost-effectiveway to satisfy the consumers and environmental protection agencies’concerns. The day may not be far when paper products manufacturedwith chlorine compound-based technology will be prohibited forwrapping of food products and other consumer items. If industry willnot implement the international standards, as a result paper exportmarket may face the undesirable consequences in future. It is also im-perative to generate new technologies for economical xylanase andlaccase production. Realistic cost estimate and improvement in processeconomics shall be the key factors for commercial success of anytechnology and therefore it must be clearly understood that enzyme-based process for bleaching must be as inexpensive as using chlorine or
even organic chlorine compounds.
Acknowledgments
Authors are thankful to the SERB/DST, Delhi, India, for providingthe research funding under Fast Track Young Scientist Program (SB/FT/LS-315/2012).
References
Afreen, S., Bano, F., Ahmad, N., Fatma, T., 2017. Screening and optimization of laccasefrom Cyanobacteria with its potential in decolorization of anthraquinonic dye remazolbrilliant blue R. Biocatal. Agric. Biotechnol. 10, 403–410.
Ayyachamy, M., Vatsala, T.M., 2007. Production and partial characterization of cellulasefree xylanase by Bacillus subtilis C01 using agriresidues and its application in bio-bleaching of nonwoody plant pulps. Lett. Appl. Microbiol. 45, 467–472.
Bains, J., Capalash, N., Sharma, P., 2003. Laccase from a non-melanogenic, alkalotolerantγ-proteobacterium JB isolated from industrial wastewater drained soil. Biotechnol.Lett. 25, 1155–1159.
Bajpai, P., 2004. Biological bleaching of chemical pulps. Crit. Rev. Biotechnol. 24, 1–58.Bajpai, P., 2012. Environmentally Benign Approaches for Pulp Bleaching, 2nd edition.
Elsevier, USA.Bajpai, P., Bhardwaj, N.K., Bajpai, P.K., Jauhari, M.B., 1994. The impact of xylanases in
bleaching of eucalyptus kraft pulp. J. Biotechnol. 36, 1–6.Beg, Q.K., Bhushan, B., Kapoor, M., Hoondal, G.S., 2000. Effect of amino acids on pro-
duction of xylanase and pectinase from Streptomyces sp. QG-11-3. World J. Microbiol.Biotechnol. 16, 211–213.
Boruah, P., Dowarah, P., Hazarika, R., Yadav, A., Barkakati, P., Goswami, T., 2016.Xylanase from Penicillium meleagrinum var. virdification – a potential source forbamboo pulp bleaching. J. Clean. Prod. 116, 259–267.
Camarero, S., Ibarra, D., Martinez, A.T., Romero, J., Gutierrez, A., del Rio, J.C., 2007.Paper pulp delignification using laccase and natural mediators. Enzym. Microb.Technol. 40, 1264–1271.
Chutani, P., Sharma, K.K., 2015. Biochemical evaluation of xylanases from various fila-mentous fungi and their application for the deinking of ozone treated newspaperpulp. Carbohydr. Polym. 127, 54–63.
Demissie, A.G., Kumar, A., 2014. Isolation of novel bacteria isolate from soil for pro-duction of extra-cellular laccase enzyme. Int. J. Emerg. Technol. Adv. Eng. 11,404–407.
Desai, I.D., Iyer, B.D., 2016. Biodeinking of old newspaper pulp using a cellulase-freexylanase preparation of Aspergillus niger DX-23. Biocatal. Agric. Biotechnol. 5, 78–85.
Dhakar, K., Pandey, A., 2013. Laccase production from a temperature and pH tolerantfungal strain of Trametes hirsuta (MTCC 11397). Enzyme Res. 1–9 (Article ID869062).
Dharmesh, N., Adhyaru, N.S., Bhatt, H.A., Divecha, M.J., 2017. Cellulase-free-thermo-alkali-solvent-stable xylanase from Bacillus altitudinis DHN8: over-production throughstatistical approach, purification and bio-deinking/bio-bleaching potential. Biocatal.Agric. Biotechnol. 12, 220–227.
Dutt, D., Tyagi, C.H., Upadhyaya, J.S., Mittal, A., 2009. Oxygen delignification: an ef-fective back-end modification to reduce pollution load and improve mechanicalstrength properties prior to bleach. IPPTA 21, 151–153.
Dwivedi, P., Vivekanand, V., Pareek, N., Sharma, A., Singh, R.P., 2010. Bleach en-hancement of mixed wood pulp by xylanase–laccase concoction derived through co-culture strategy. Appl. Biochem. Biotechnol. 160, 255–268.
Garg, G., Dhiman, S.S., Mahajan, R., Kaur, A., Sharma, J., 2011. Bleach-boosting effect ofcrude xylanase from Bacillus stearothermophilus SDX on wheat straw pulp. New.Biotechnol. 28, 58–64.
Garg, N., Bieler, N., Kenzom, T., Chhabra, M., Ansorge-Schumacher, M., Mishra, S., 2012.Cloning, sequence analysis, expression of Cyathus bulleri laccase in Pichia pastoris andcharacterization of recombinant laccase. BMC Biotechnol. 12, 75.
Goluguri, B.R., Thulluri, C., Addepally, U., Shetty, P.R., 2016. Novel alkali-thermostablexylanase from Thielaviopsis basicola (MTCC 1467): Purification and kinetic char-acterization. Int. J. Biol. Macromolecules 82, 823–829.
Goswami, G.K., Krishnamohan, M., Nain, V., Aggarwal, C., Bandarupalli, R., 2014.Cloning and heterologous expression of cellulose free thermostable xylanase fromBacillus brevis. ⟨http://www.springerplus.com/content/3/1/20⟩.
Gupta, V., Garg, S., Capalash, N., Gupta, N., Sharma, P., 2015. Production of thermo-alkali-stable laccase and xylanase by co-culturing of Bacillus sp. and B. halodurans forbiobleaching of kraft pulp and deinking of waste paper. Bioproc. Biosyst. Eng. 38,947–956.
Halaburgi, V.M., Sharma, S., Sinha, M., Singh, T.P., Karegoudar, T.B., 2011. Purificationand characterization of a thermostable laccase from the ascomycetes Cladosporiumcladosporioides and its applications. Process. Biochem. 46, 1146–1152.
Kaira, G.S., Dhakar, K., Pandey, A., 2015. A psychrotolerant strain of Serratia marcescens(MTCC 4822) produces laccase at wide temperature and pH range. AMB Express 5, 1.https://doi.org/10.1186/s13568-014-0092-1.
Kamble, R.D., Jadhav, A.R., 2012. Optimization and scale up of cellulase-free xylanaseproduction in solid state fermentation on wheat bran by Cellulosi microbium sp. MTCC10645. Jordan. J. Biol. Sci. 5, 289–294.
Kango, N., Agrawal, S.C., Jain, P.C., 2003. Production of xylanase by Emericella nidulansNK-62 on low-value lignocellulosic substrates. World J. Microbiol. Biotechnol. 19,691–694.
Kaur, A., Mahajan, R., Singh, A., Garg, G., Sharma, J., 2010. Application of cellulase-free
G. Singh et al. Biocatalysis and Agricultural Biotechnology 17 (2019) 558–565
564
xylano-pectinolytic enzymes from the same bacterial isolate in biobleaching of kraftpulp. Bioresour. Technol. 101, 9150–9155.
Kaur, K., Singh, G., Gupta, V., Capalash, N., Sharma, P., 2016. Impact of phosphate andother medium components on physiological regulation of bacterial laccase produc-tion. Biotechnol. Prog. https://doi.org/10.1002/btpr.2408.
Kaushik, P., Mishra, A., Malik, A., 2014. Dual application of agricultural residues forxylanase production and dye removal through solid state fermentation. Int.Biodeteior. Biodegrad. 96, 1–8.
Kenzom, T., Srivastava, P., Mishra, S., 2014. Structural insights into 2,2-Azino-Bis(3-Ethylbenzothiazoline-6-Sulfonic Acid) (ABTS)-mediated degradation of reactive blue21 by engineered Cyathus bulleri laccase and characterization of degradation pro-ducts. Appl. Environ. Microbiol. 80, 7484–7495.
Kumar, A., Sharma, K.K., Kumar, P., Ramchiary, N., 2015. Laccase isozymes fromGanoderma lucidum MDU-7: isolation, characterization, catalytic properties and dif-ferential role during oxidative stress. J. Mol. Catal. B: Enzyme 113, 68–75.
Kumar, P.S., Yaashikaa, P.R., Saravanan, A., 2018. Isolation, characterization and pur-ification of xylanase producing bacteria from sea sediment. Biocatal. Agric.Biotechnol. 13, 299–303.
Kumar, R., Kaur, J., Jain, S., Kumar, A., 2016. Optimization of laccase production fromAspergillus flavus by design of experiment technique: partial purification and char-acterization. J. Genet. Eng. Biotechnol. 14, 125–131.
More, S.S., Renuka, P.S., Pruthvi, K., Swetha, M., Malini, S., Veena, S.M., 2011. Isolation,purification and characterizaion of fungal laccase from Pleurotus sp. Enzyme Res.2011 (Article ID248735, 7 Pg).
Mukhopadhyay, A., Dasgupta, A.K., Chakrabarti, K., 2013. Thermostability, pH stabilityand dye degrading activity of a bacterial laccase are enhanced in the presence of CuOnanoparticles. Bioresour. Technol. 127, 25–36.
Muthukumarasamy, N.P., Jackson, B., Joseph, A., Sevanan, M., 2015. Production of ex-tracellular laccase from Bacillus subtilis MTCC 2414 using agro residues as a potentialsubstrate. Biochem. Res. Int. https://doi.org/10.1155/2015/765190.765190.
Nagar, S., Mittal, A., Kumar, D., Gupta, V.K., 2012. Production of alkali tolerant cellulasefree xylanase in high levels by Bacillus pumilus SV-205. Int. J. Biol. Macromol. 50,414–420.
Nagar, S., Jain, R.K., Thakur, V.V., Gupta, V.K., 2013. Biobleaching application of cel-lulase poor and alkali stable xylanase from Bacillus pumilus SV-85S. 3 Biotech 3,277–285.
Nagar, S., Mittal, A., Kumar, D., Kumar, L., Kuhad, R.C., Gupta, V.K., 2011. Hyper pro-duction of alkali stable xylanase in lesser duration by Bacillus pumilus SV-85S usingwheat bran under solid state fermentation. New Biotechnol. 28, 581–587.
Nikam, M., Patil, S., Patil, U., Khandare, R., Chaudhari, A., 2017. Biodegradation anddetoxification of azo solvent dye by ethylene glycol tolerant ligninolytic ascomycetestrain of Pseudocochliobolus verruculosus NFCCI 3818. Biocatal. Agric. Biotechnol. 9,209–217.
Raj, A., Kumar, S., Singh, S.K., Prakash, J., 2018. Production and purification of xylanasefrom alkaliphilic Bacillus licheniformis and its pretreatment of eucalyptus kraft pulp.Biocatal. Agric. Biotechnol. 15, 199–209.
Ranimol, G., Venugopal, T., Gopalakrishnan, S., Sunkar, S., 2018. Production of laccasefrom Trichoderma harzianum and its application in dye decolourisation. Biocatal.Agric. Biotechnol. 16, 400–404.
Sanghi, A., Garg, N., Kuhar, K., Kuhad, R.C., Gupta, V.K., 2009. Enhanced production of
cellular-free xylanase by alkalophilic Bacillus subtilis and its application in bio-bleaching of kraft pulp. Bioresources 4, 1109–1129.
Senthilkumar, S.R., Ashokkumar, B., Raj, K.C., Gunasekaran, P., 2005. Optimization ofmedium composition for alkali-stable xylanase production by Aspergillus fischeri Fxn 1in solid-state fermentataion using central composite rotary design. Bioresour.Technol. 96, 1380–1386.
Senthilkumar, S.R., Dempsey, M., Krishnan, C., Gunasekaran, P., 2008. Optimization ofbiobleaching of paper pulp in an expanded bed bioreactor with immobilized alkalistable xylanase by using response surface methodology. Bioresour. Technol. 99,7781–7787.
Sharma, A., Thakur, V.V., Shrivastava, A., Jain, R.K., Mathur, R.M., Gupta, R., Kuhad,R.C., 2014. Xylanase and laccase based enzymatic kraft pulp bleaching reduces ad-sorbable organic halogen (AOX) in bleach effluents: a pilot scale study. Bioresour.Technol. 169, 96–102.
Sharma, D., Goel, G., Sud, A., Chauhan, R.S., 2015a. A novel laccase from newly isolatedCotylidia pannosa and its application in decolorization of synthetic dyes. Biocatal.Agric. Biotechnol. 4, 661–666.
Sharma, D., Goel, G., Sud, A., Chauhan, R.S., 2015cb. A novel laccase from newly isolatedCotylidia pannosa and its application in decolorization of synthetic dyes. Biocatal.Agric. Biotechnol. 4, 661–666.
Sharma, P., Sood, C., Singh, G., Capalash, N., 2015. An eco-friendly process for bio-bleaching of eucalyptus kraft pulp with xylanase producing Bacillus halodurans. J.Clean. Prod. 87, 966–970.
Sindhu, I., Chhibber, S., Caplash, N., Sharma, P., 2006. Production of cellulase-free xy-lanase from Bacillus megaterium by solid state fermentation for biobleaching of pulp.Curr. Microbiol. 53, 167–172.
Singh, G., Capalash, N., Sharma, P., 2010. Performance of an alkalophilic and haloto-lerant laccase from γ-proteobacterium JB in the presence of industrial pollutants. J.Gen. Appl. Microbiol. 55, 283–289.
Singh, G., Goel, R., Capalash, N., Sharma, P., 2007. A pH-stable laccase from alkali-tol-erant γ-proteobacterium JB: purification, characterization and indigo carmine de-gradation. Enzyme Microb. Technol. 41, 794–799.
Singh, G., Ahuja, N., Sharma, P., Capalash, N., 2009. Response surface methodology forthe optimized production of an alkalophilic laccase from γ-proteobacterium. JB BioResour. 4, 544–553.
Singh, G., Kaur, K., Puri, S., Sharma, P., 2015. Critical factors affecting laccase-mediatedbiobleaching of pulp in paper industry. Appl. Microbiol Biotechnol. 99, 155–164.
Singh, G., Capalash, N., Kaur, K., Sharma, P., 2016. Use of Enzymes in Pulp and PaperIndustry Agro-Industrial Wastes as Feedstock for Enzyme Production, 1st edition.Elsevier publishers.
Singh, G., Ahuja, N., Batish, M., Capalash, N., Sharma, P., 2008. Biobleaching of wheatstraw-rich soda pulp with alkalophilic laccase from γ-proteobacterium JB: optimi-zation of process parameters using response surface methodology. Bioresour.Technol. 99, 7472–7479.
Verma, D., Kawarabayasi, Y., Miyazaki, K., Satyanarayana, T., 2013. Cloning, expressionand characteristics of a novel alkalistable and thermostable xylanase encoding gene(mxyl) retrieved from compost-soil metagenome. PLoS One 8, 1–8.
Vivekanandan, K.E., Sivaraj, S., Kumaresan, S., 2014. Characterization and purification oflaccase enzyme from Aspergillus nidulans CASVK3 from velar estuary south east coastof India. Int. J. Curr. Microbiol. Appl. Sci. 3, 213–227.
G. Singh et al. Biocatalysis and Agricultural Biotechnology 17 (2019) 558–565
565
PAPERmaking!
FROM THE PUBLISHERS OF PAPER TECHNOLOGY
Volume 5, Number 1, 2019
Page 1 of 14 Article 3 – Novel Coatings
Regenerated cellulose from N-methylmorpholine N-oxide solutions as a coating agent for paper materials Marta Krysztof. Konrad Olejnik. Piotr Kulpinski. Anna Stanislawska. Svitlana Khadzhynova. The objective of the presented research was to determine the influence of cellulose coating, obtained from the cellulose solution in N-Methylmorpholine N-oxide (NMMO), on the structural and mechanical properties of paper. The effect of heating time of paper samples coated with cellulose dissolved in NMMO was also investigated. Depending on the heating time of the coating, a continuous or porous layer was obtained. Coating without any heating stage yielded a continuous cellulose layer of hydrophobic properties (higher contact angle in comparison to base paper), and paper of higher smoothness and increased tear resistance. Analysis of the paper samples showed that cellulose coating not only changed the surface properties of paper, but also significantly improved paper strength properties, such as the tensile index, elongation, bursting strength index and double folds number. Despite the process’ limitations (e.g. necessity of removing the NMMO), this method can be considered as a novel approach for paper property modification. Contact information: M. Krysztof, K. Olejnik, A. Stanislawska & S. Khadzhynova, Institute of Papermaking and Printing, Faculty of Management and Production Engineering, Lodz, University of Technology, Wolczanska 223, 90-924 Lodz, Poland e-mail: [email protected] P. Kulpinski, Department of Man-Made Fibers, Lodz University of Technology, Zeromskiego 116, 90-924 Lodz, Poland Cellulose (2018) 25:3595–3607. https://doi.org/10.1007/s10570-018-1799-y
The Paper Industry Technical Association (PITA) is an independent organisation which operates for the general benefit of its members – both individual and corporate – dedicated to promoting and improving the technical and scientific knowledge of those working in the UK pulp and paper industry. Formed in 1960, it serves the Industry, both manufacturers and suppliers, by providing a forum for members to meet and network; it organises visits, conferences and training seminars that cover all aspects of papermaking science. It also publishes the prestigious journal Paper Technology International and the PITA Annual Review, both sent free to members, and a range of other technical publications which include conference proceedings and the acclaimed Essential
Guide to Aqueous Coating.
ORIGINAL PAPER
Regenerated cellulose from N-methylmorpholine N-oxidesolutions as a coating agent for paper materials
Marta Krysztof . Konrad Olejnik . Piotr Kulpinski . Anna Stanislawska .
Svitlana Khadzhynova
Received: 11 November 2017 / Accepted: 17 April 2018 / Published online: 21 April 2018
� The Author(s) 2018
Abstract The objective of the presented research
was to determine the influence of cellulose coating,
obtained from the cellulose solution in N-Methylmor-
pholine N-oxide (NMMO), on the structural and
mechanical properties of paper. The effect of heating
time of paper samples coated with cellulose dissolved
in NMMO was also investigated. Depending on the
heating time of the coating, a continuous or porous
layer was obtained. Coating without any heating stage
yielded a continuous cellulose layer of hydrophobic
properties (higher contact angle in comparison to base
paper), and paper of higher smoothness and increased
tear resistance. Analysis of the paper samples showed
that cellulose coating not only changed the surface
properties of paper, but also significantly improved
paper strength properties, such as the tensile index,
elongation, bursting strength index and double folds
number. Despite the process’ limitations (e.g. neces-
sity of removing the NMMO), this method can be
considered as a novel approach for paper property
modification.
M. Krysztof � K. Olejnik (&) � A. Stanislawska �S. Khadzhynova
Institute of Papermaking and Printing, Faculty of
Management and Production Engineering, Lodz
University of Technology, Wolczanska 223, 90-924 Lodz,
Poland
e-mail: [email protected]
P. Kulpinski
Department of Man-Made Fibers, Lodz University of
Technology, Zeromskiego 116, 90-924 Lodz, Poland
123
Cellulose (2018) 25:3595–3607
https://doi.org/10.1007/s10570-018-1799-y
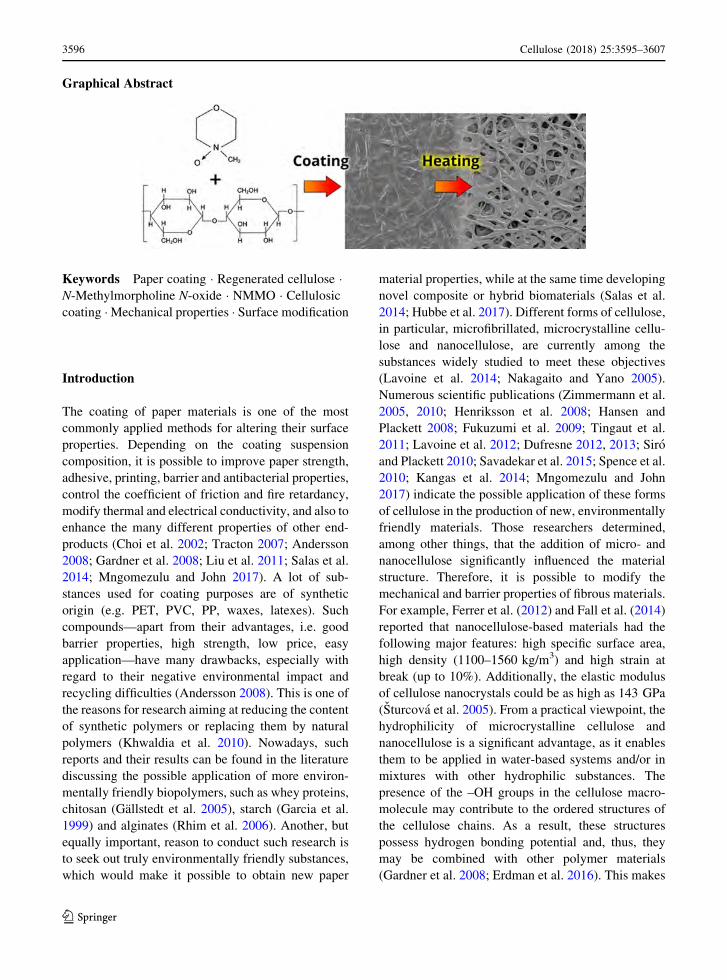
Graphical Abstract
Keywords Paper coating � Regenerated cellulose �N-Methylmorpholine N-oxide � NMMO � Cellulosiccoating �Mechanical properties � Surface modification
Introduction
The coating of paper materials is one of the most
commonly applied methods for altering their surface
properties. Depending on the coating suspension
composition, it is possible to improve paper strength,
adhesive, printing, barrier and antibacterial properties,
control the coefficient of friction and fire retardancy,
modify thermal and electrical conductivity, and also to
enhance the many different properties of other end-
products (Choi et al. 2002; Tracton 2007; Andersson
2008; Gardner et al. 2008; Liu et al. 2011; Salas et al.
2014; Mngomezulu and John 2017). A lot of sub-
stances used for coating purposes are of synthetic
origin (e.g. PET, PVC, PP, waxes, latexes). Such
compounds—apart from their advantages, i.e. good
barrier properties, high strength, low price, easy
application—have many drawbacks, especially with
regard to their negative environmental impact and
recycling difficulties (Andersson 2008). This is one of
the reasons for research aiming at reducing the content
of synthetic polymers or replacing them by natural
polymers (Khwaldia et al. 2010). Nowadays, such
reports and their results can be found in the literature
discussing the possible application of more environ-
mentally friendly biopolymers, such as whey proteins,
chitosan (Gallstedt et al. 2005), starch (Garcia et al.
1999) and alginates (Rhim et al. 2006). Another, but
equally important, reason to conduct such research is
to seek out truly environmentally friendly substances,
which would make it possible to obtain new paper
material properties, while at the same time developing
novel composite or hybrid biomaterials (Salas et al.
2014; Hubbe et al. 2017). Different forms of cellulose,
in particular, microfibrillated, microcrystalline cellu-
lose and nanocellulose, are currently among the
substances widely studied to meet these objectives
(Lavoine et al. 2014; Nakagaito and Yano 2005).
Numerous scientific publications (Zimmermann et al.
2005, 2010; Henriksson et al. 2008; Hansen and
Plackett 2008; Fukuzumi et al. 2009; Tingaut et al.
2011; Lavoine et al. 2012; Dufresne 2012, 2013; Siro
and Plackett 2010; Savadekar et al. 2015; Spence et al.
2010; Kangas et al. 2014; Mngomezulu and John
2017) indicate the possible application of these forms
of cellulose in the production of new, environmentally
friendly materials. Those researchers determined,
among other things, that the addition of micro- and
nanocellulose significantly influenced the material
structure. Therefore, it is possible to modify the
mechanical and barrier properties of fibrous materials.
For example, Ferrer et al. (2012) and Fall et al. (2014)
reported that nanocellulose-based materials had the
following major features: high specific surface area,
high density (1100–1560 kg/m3) and high strain at
break (up to 10%). Additionally, the elastic modulus
of cellulose nanocrystals could be as high as 143 GPa
(Sturcova et al. 2005). From a practical viewpoint, the
hydrophilicity of microcrystalline cellulose and
nanocellulose is a significant advantage, as it enables
them to be applied in water-based systems and/or in
mixtures with other hydrophilic substances. The
presence of the –OH groups in the cellulose macro-
molecule may contribute to the ordered structures of
the cellulose chains. As a result, these structures
possess hydrogen bonding potential and, thus, they
may be combined with other polymer materials
(Gardner et al. 2008; Erdman et al. 2016). This makes
3596 Cellulose (2018) 25:3595–3607
123
it possible to produce new, biodegradable composites
of exclusive characteristics, e.g. barrier properties
(Hubbe et al. 2017) or even substrates for printed
electronic products (Lee et al. 2009; Peresin and Rojas
2014). Moreover, using the same polymer for the
surface modification as that present in the natural
fibers may result in strong adhesion between the
coating layer and the base paper. Despite being a
hydrophilic and hydrogen-bonded substance, cellulose
neither dissolves in water nor in many popular volatile
polar and non-polar organic solvents (e.g. ethanol,
methanol). The lack of simple dissolving systems is a
direct outcome of the complex chemical structure of
cellulose. The cellulose macromolecule contains a
high number of hydroxyl groups prone to the forma-
tion of a strong and highly structured intra- and
intermolecular hydrogen-bonding network, which
resists water and most organic solvents. Therefore,
cellulose solubility depends on the ability of the
solvent to break these interactions (Yamane et al.
2006; Lindman et al. 2010; Medronho and Lindman
2014, 2015). Cellulose contains multiple hydroxyl
groups on the glucopyranose ring and, therefore, its
insolubility in water is rather unexpected. It might be
explained—according to recent investigations—by its
amphiphilic nature. This means that the glucopyranose
ring exhibits both a hydrophobic and hydrophilic
character. The axial direction of the ring is hydropho-
bic as a result of the location of C–H bonds along the
axial position. Hydrogen atoms connected directly to
the carbons do not contribute to the hydrogen bonding.
According to simulations carried out by Mazeau
(2011), the surface energy of the layer of C–H
moieties is the lowest and, as a consequence, the
attachment energy, which is mainly of van der Waals
type, is less favourable than that of other surfaces of
the cellulose. Hydrophobic interactions obviously
limit cellulose solubility in polar solvents. The equa-
torial direction of the ring is hydrophilic since the
hydroxyl groups—responsible for hydrogen bond-
ing—are located along this direction. Hence, cellulose
macromolecules exhibit differences in polarity (Ya-
mane et al. 2006; Medronho et al. 2012). The situation
is more complex due to the presence of various
crystalline phases in native cellulose. There are three
principal phases: type Ia (triclinic), Ib (monoclinic)
and type II (Biermann et al. 2001). Affinity of all these
phases to water and to many organic solvents has not
yet been fully investigated. Some authors also link
cellulose insolubility with its crystallinity (Cao et al.
1994; Medronho et al. 2012). The chemical structure
and properties of cellulose may suggest that amphi-
philic solvents would be the most suitable for cellulose
dissolution. Ionic liquids (Kosan et al. 2008) and some
organic solvents exhibit such properties (Kalash-
nikova et al. 2012; Lindman et al. 2010; Medronho
and Lindman 2014). It should be emphasised that,
even though many different systems that dissolve
cellulose are described in the scientific papers, not all
of them are amphiphilic (Alves et al. 2016). N-
MethylmorpholineN-oxide (NMMO) is an example of
such a system. The mechanism of cellulose dissolution
in NMMO systems has been described in the literature
(Medronho and Lindman 2014). The proposed mech-
anism, however, does not fully explain the occurring
changes. For instance, it does not include the impact of
water molecules, which are crucial for the NMMO
cellulose dissolving system. Experimental practice
indicates (Lindman et al. 2010) that lack of water
results in cellulose insolubility in NMMO. Con-
versely, at too high water content, cellulose would
not dissolve either. This emphasises the water-sensi-
tivity of the process. Nonetheless, among different
cellulose solvents, NMMO seems to be the most
interesting and promising from the viewpoint of paper
material modifications. This solvent has been the
subject matter of research for many years (Kulpinski
2007; Kulpinski et al. 2011; Erdman et al. 2016).
Nowadays, it is applied on an industrial scale for the
production of cellulose fibers, known under the brand
name of Lyocell or Tencel. Low toxicity is one of the
most important advantages of this solvent. The
possibility to obtain cellulose solutions in a wide
range of concentrations, from less than 1% to approx-
imately 28% by weight, is another advantage. No less
important is the fact that—in the case of NMMO—the
cellulose solidification process is carried out in water
baths. So far, methods for modifying paper with the
application of NMMO have been scarcely studied.
Johnson (1969) patented a method in which only
NMMO (without cellulose) was used for paper
mechanical property improvement. In another patent,
Melville et al. (2014) applied a mixture of NMMO,
water and fluorinated polymer particle suspension to
modify paper surface so that its abrasion resistance
would be increased and, simultaneously, its friction
coefficient decreased. Paper with an applied wet layer
was heated at a temperature of 100 �C to ensure good
Cellulose (2018) 25:3595–3607 3597
123
adhesion to paper fibers. Afterwards, NMMO was
washed out from the paper with water. The NMMO
cellulose solution, containing dispersed kaolinite, was
applied in research conducted by Se Young Yoon
(2007). Such a system was used to form paper-based
composite materials of improved strength properties.
In the literature, one may find information into the
properties of membranes, made of cellulose dissolved
in NMMO, which afterwards were used to filtrate, e.g.
gases (Jie et al. 2005). The above-mentioned patents
and scientific articles did not include the experiments
presented in this publication, i.e. in neither was the
cellulose solution in NMMO used to coat the surface
of paper. The method applied in this research is safe
because the solvent is both non-toxic and non-
flammable. Furthermore, NMMO is considered envi-
ronmentally friendly. It can be reused with a percent
recovery of 98% or even higher (Rosenau et al. 2001;
Chen et al. 2015). This technology also significantly
reduces problems related to post-consumer material
recycling.
The objective of the research was to determine the
interactions between the NMMO cellulose solution
and paper, whose surface had been coated by that
solution. In particular, the impact on the structural and
strength properties of paper was investigated. This
study is part of a larger research project on fibrous
material modification by means of a surface treatment
operation, namely by coating the substrate with the
solution containing cellulose dissolved in NMMO.
Materials and methods
Cellulose solution preparation
Bleached beech kraft pulp of Degree of Polymerisa-
tion (DP) of 655 and a-cellulose content of 92.3% was
used for the cellulose solution preparation. This type
of pulp was selected because of its relatively low
degree of polymerisation and short fibers that enabled
the dissolution of such cellulose under mild condi-
tions. According to the authors’ experience, it is very
difficult to run a coating operation using solutions of
higher than 5% cellulose concentration due to high
solution viscosity, resulting in runnability problems.
Conversely, the application of significantly lower
concentration solutions results in insufficient deposi-
tion of cellulose on the base paper. Therefore, for the
coating solutions used here, cellulose content of 3%
was selected as the most effective from a practical
point of view. The cellulose solutions were obtained in
a high efficiency laboratory-scale IKAVISC kneader
type MKD 0.6-H60. The mixture of 50/50 water and
NMMO with an addition of 3% of cellulosic material
(based on NMMOweight) was heated at a temperature
of 95 �C and under low pressure (of about 6.7 kPa),
and the excess of water was removed from the system.
The process was continued until a homogeneous and
transparent cellulose solution in NMMO was
obtained.
Base paper preparation
Commercial, bleached softwood pine kraft pulp
(BSK) was used to prepare laboratory handsheets.
Pulp parameters were as follows: initial moisture
content 93.78%; a-cellulose content 86.6%; DP 1081;
Schopper-Riegler value SR-12. Pulp samples were
prepared according to standard ISO 5263-1:2004.
Unbeaten pulp was examined and laboratory sheets of
70 g/m2 were formed in Rapid-Kothen apparatus
according to standard ISO 5259-2:2001. The obtained
laboratory sheets were used as base paper for a
subsequent coating.
Unbeaten pulp was used in order to eliminate the
influence of the beating process on the paper mechan-
ical properties. Consequently, it was possible to
evaluate the full development of strength properties,
resulting only from the applied modifications.
Coating
The application of cellulose-NMMO solution on the
paper surface was conducted using the standard
coating process. This operation was carried out with
the use of an automatic coater (‘Control Coater’) of
IPP/TUL, Poland, at the speed of 16 cm/s and with the
use of a standard Mayer rod No. 3 (K-bar), which gave
a wet film thickness of 24 lm and, hence, a dry coating
thickness of about 0.8 lm. Prior to the coating
process, the cellulose solutions were melted and kept
at a temperature of 80 ± 2 �C. Solidification of the
coating occurred as a result of washing out the solvent
(NMMO) and—afterwards—drying the coated
papers.
3598 Cellulose (2018) 25:3595–3607
123
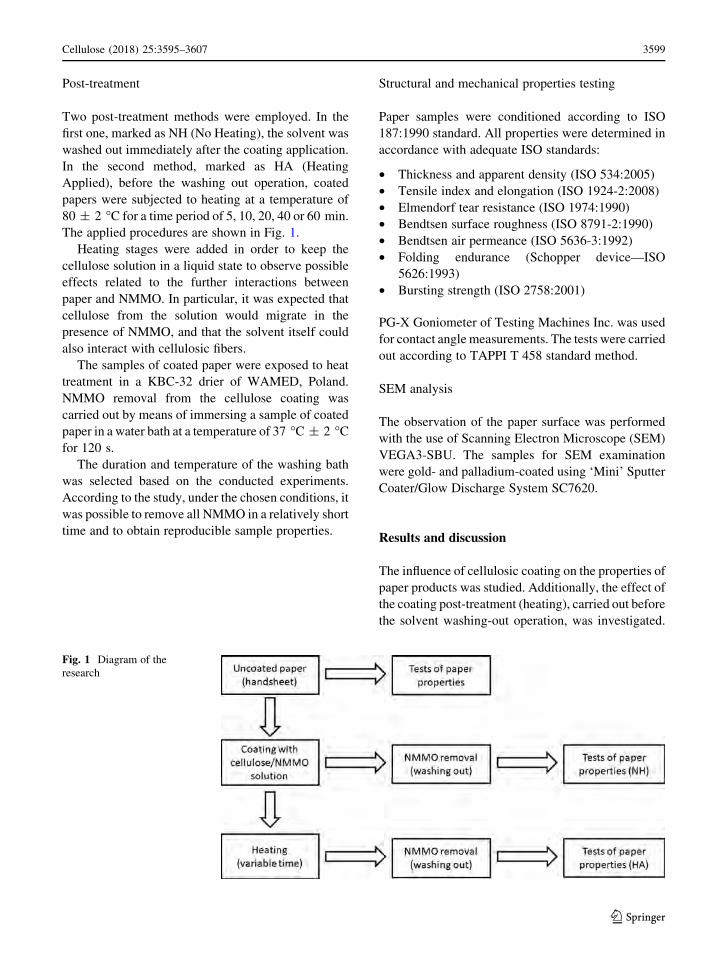
Post-treatment
Two post-treatment methods were employed. In the
first one, marked as NH (No Heating), the solvent was
washed out immediately after the coating application.
In the second method, marked as HA (Heating
Applied), before the washing out operation, coated
papers were subjected to heating at a temperature of
80 ± 2 �C for a time period of 5, 10, 20, 40 or 60 min.
The applied procedures are shown in Fig. 1.
Heating stages were added in order to keep the
cellulose solution in a liquid state to observe possible
effects related to the further interactions between
paper and NMMO. In particular, it was expected that
cellulose from the solution would migrate in the
presence of NMMO, and that the solvent itself could
also interact with cellulosic fibers.
The samples of coated paper were exposed to heat
treatment in a KBC-32 drier of WAMED, Poland.
NMMO removal from the cellulose coating was
carried out by means of immersing a sample of coated
paper in a water bath at a temperature of 37 �C ± 2 �Cfor 120 s.
The duration and temperature of the washing bath
was selected based on the conducted experiments.
According to the study, under the chosen conditions, it
was possible to remove all NMMO in a relatively short
time and to obtain reproducible sample properties.
Structural and mechanical properties testing
Paper samples were conditioned according to ISO
187:1990 standard. All properties were determined in
accordance with adequate ISO standards:
• Thickness and apparent density (ISO 534:2005)
• Tensile index and elongation (ISO 1924-2:2008)
• Elmendorf tear resistance (ISO 1974:1990)
• Bendtsen surface roughness (ISO 8791-2:1990)
• Bendtsen air permeance (ISO 5636-3:1992)
• Folding endurance (Schopper device—ISO
5626:1993)
• Bursting strength (ISO 2758:2001)
PG-X Goniometer of Testing Machines Inc. was used
for contact anglemeasurements. The tests were carried
out according to TAPPI T 458 standard method.
SEM analysis
The observation of the paper surface was performed
with the use of Scanning Electron Microscope (SEM)
VEGA3-SBU. The samples for SEM examination
were gold- and palladium-coated using ‘Mini’ Sputter
Coater/Glow Discharge System SC7620.
Results and discussion
The influence of cellulosic coating on the properties of
paper products was studied. Additionally, the effect of
the coating post-treatment (heating), carried out before
the solvent washing-out operation, was investigated.
Fig. 1 Diagram of the
research
Cellulose (2018) 25:3595–3607 3599
123
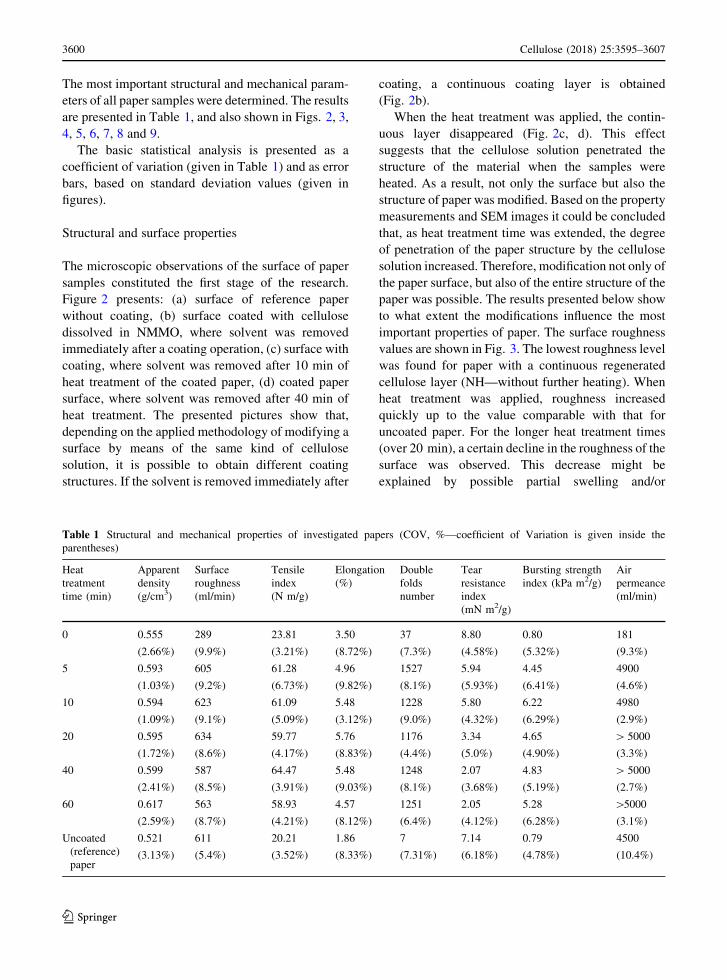
The most important structural and mechanical param-
eters of all paper samples were determined. The results
are presented in Table 1, and also shown in Figs. 2, 3,
4, 5, 6, 7, 8 and 9.
The basic statistical analysis is presented as a
coefficient of variation (given in Table 1) and as error
bars, based on standard deviation values (given in
figures).
Structural and surface properties
The microscopic observations of the surface of paper
samples constituted the first stage of the research.
Figure 2 presents: (a) surface of reference paper
without coating, (b) surface coated with cellulose
dissolved in NMMO, where solvent was removed
immediately after a coating operation, (c) surface with
coating, where solvent was removed after 10 min of
heat treatment of the coated paper, (d) coated paper
surface, where solvent was removed after 40 min of
heat treatment. The presented pictures show that,
depending on the applied methodology of modifying a
surface by means of the same kind of cellulose
solution, it is possible to obtain different coating
structures. If the solvent is removed immediately after
coating, a continuous coating layer is obtained
(Fig. 2b).
When the heat treatment was applied, the contin-
uous layer disappeared (Fig. 2c, d). This effect
suggests that the cellulose solution penetrated the
structure of the material when the samples were
heated. As a result, not only the surface but also the
structure of paper was modified. Based on the property
measurements and SEM images it could be concluded
that, as heat treatment time was extended, the degree
of penetration of the paper structure by the cellulose
solution increased. Therefore, modification not only of
the paper surface, but also of the entire structure of the
paper was possible. The results presented below show
to what extent the modifications influence the most
important properties of paper. The surface roughness
values are shown in Fig. 3. The lowest roughness level
was found for paper with a continuous regenerated
cellulose layer (NH—without further heating). When
heat treatment was applied, roughness increased
quickly up to the value comparable with that for
uncoated paper. For the longer heat treatment times
(over 20 min), a certain decline in the roughness of the
surface was observed. This decrease might be
explained by possible partial swelling and/or
Table 1 Structural and mechanical properties of investigated papers (COV, %—coefficient of Variation is given inside the
parentheses)
Heat
treatment
time (min)
Apparent
density
(g/cm3)
Surface
roughness
(ml/min)
Tensile
index
(N m/g)
Elongation
(%)
Double
folds
number
Tear
resistance
index
(mN m2/g)
Bursting strength
index (kPa m2/g)
Air
permeance
(ml/min)
0 0.555
(2.66%)
289
(9.9%)
23.81
(3.21%)
3.50
(8.72%)
37
(7.3%)
8.80
(4.58%)
0.80
(5.32%)
181
(9.3%)
5 0.593
(1.03%)
605
(9.2%)
61.28
(6.73%)
4.96
(9.82%)
1527
(8.1%)
5.94
(5.93%)
4.45
(6.41%)
4900
(4.6%)
10 0.594
(1.09%)
623
(9.1%)
61.09
(5.09%)
5.48
(3.12%)
1228
(9.0%)
5.80
(4.32%)
6.22
(6.29%)
4980
(2.9%)
20 0.595
(1.72%)
634
(8.6%)
59.77
(4.17%)
5.76
(8.83%)
1176
(4.4%)
3.34
(5.0%)
4.65
(4.90%)
[ 5000
(3.3%)
40 0.599
(2.41%)
587
(8.5%)
64.47
(3.91%)
5.48
(9.03%)
1248
(8.1%)
2.07
(3.68%)
4.83
(5.19%)
[ 5000
(2.7%)
60 0.617
(2.59%)
563
(8.7%)
58.93
(4.21%)
4.57
(8.12%)
1251
(6.4%)
2.05
(4.12%)
5.28
(6.28%)
[5000
(3.1%)
Uncoated
(reference)
paper
0.521
(3.13%)
611
(5.4%)
20.21
(3.52%)
1.86
(8.33%)
7
(7.31%)
7.14
(6.18%)
0.79
(4.78%)
4500
(10.4%)
3600 Cellulose (2018) 25:3595–3607
123
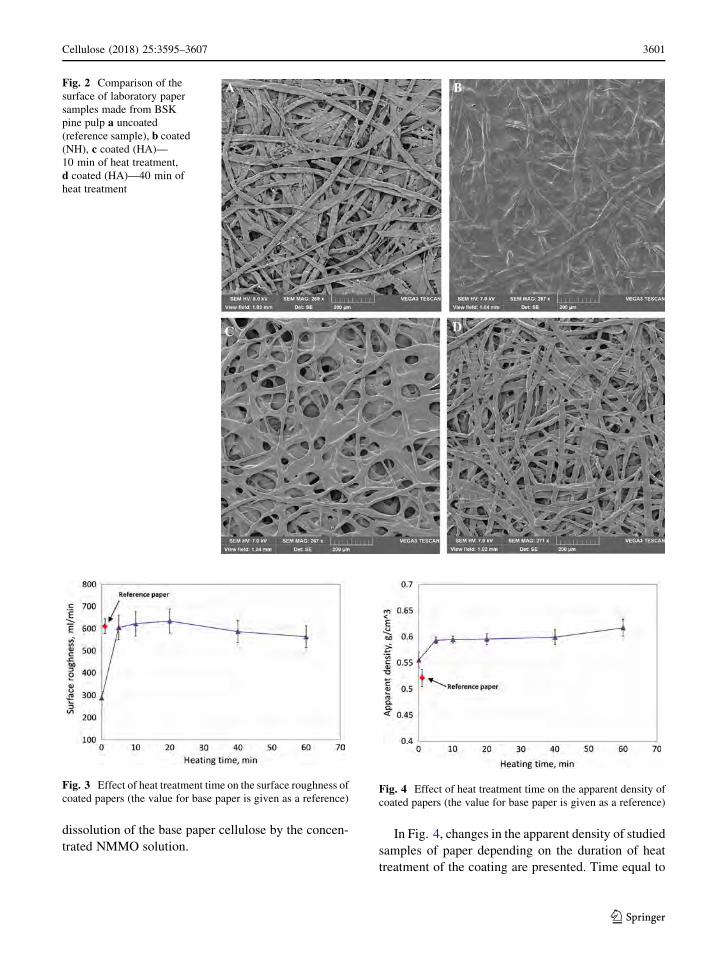
dissolution of the base paper cellulose by the concen-
trated NMMO solution.In Fig. 4, changes in the apparent density of studied
samples of paper depending on the duration of heat
treatment of the coating are presented. Time equal to
Fig. 2 Comparison of the
surface of laboratory paper
samples made from BSK
pine pulp a uncoated
(reference sample), b coated
(NH), c coated (HA)—
10 min of heat treatment,
d coated (HA)—40 min of
heat treatment
Fig. 3 Effect of heat treatment time on the surface roughness of
coated papers (the value for base paper is given as a reference)Fig. 4 Effect of heat treatment time on the apparent density of
coated papers (the value for base paper is given as a reference)
Cellulose (2018) 25:3595–3607 3601
123
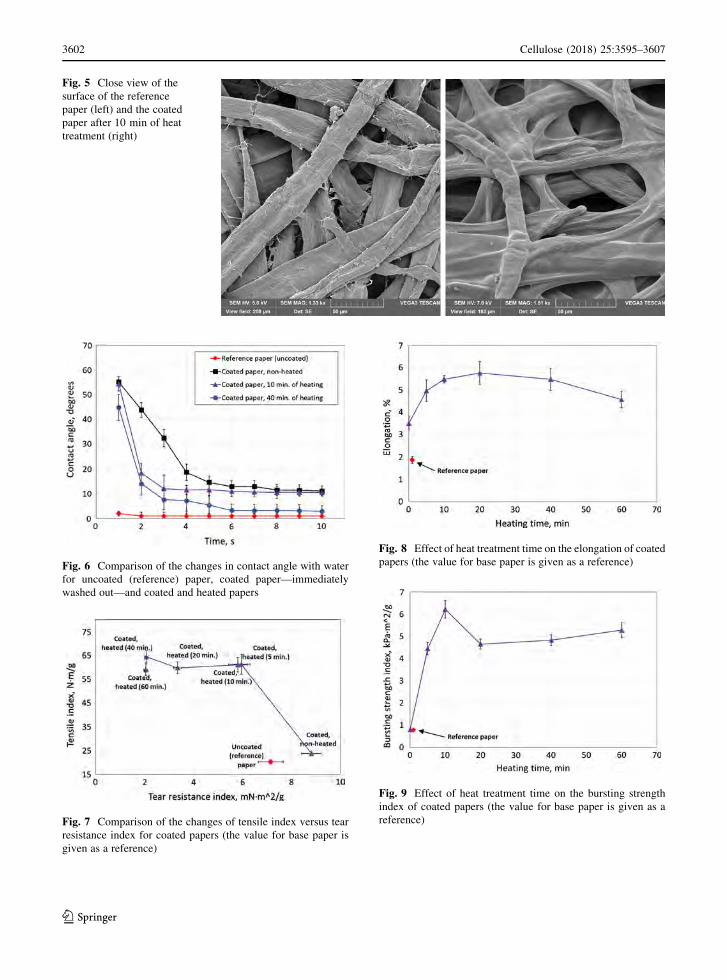
Fig. 5 Close view of the
surface of the reference
paper (left) and the coated
paper after 10 min of heat
treatment (right)
Fig. 6 Comparison of the changes in contact angle with water
for uncoated (reference) paper, coated paper—immediately
washed out—and coated and heated papers
Fig. 7 Comparison of the changes of tensile index versus tear
resistance index for coated papers (the value for base paper is
given as a reference)
Fig. 8 Effect of heat treatment time on the elongation of coated
papers (the value for base paper is given as a reference)
Fig. 9 Effect of heat treatment time on the bursting strength
index of coated papers (the value for base paper is given as a
reference)
3602 Cellulose (2018) 25:3595–3607
123
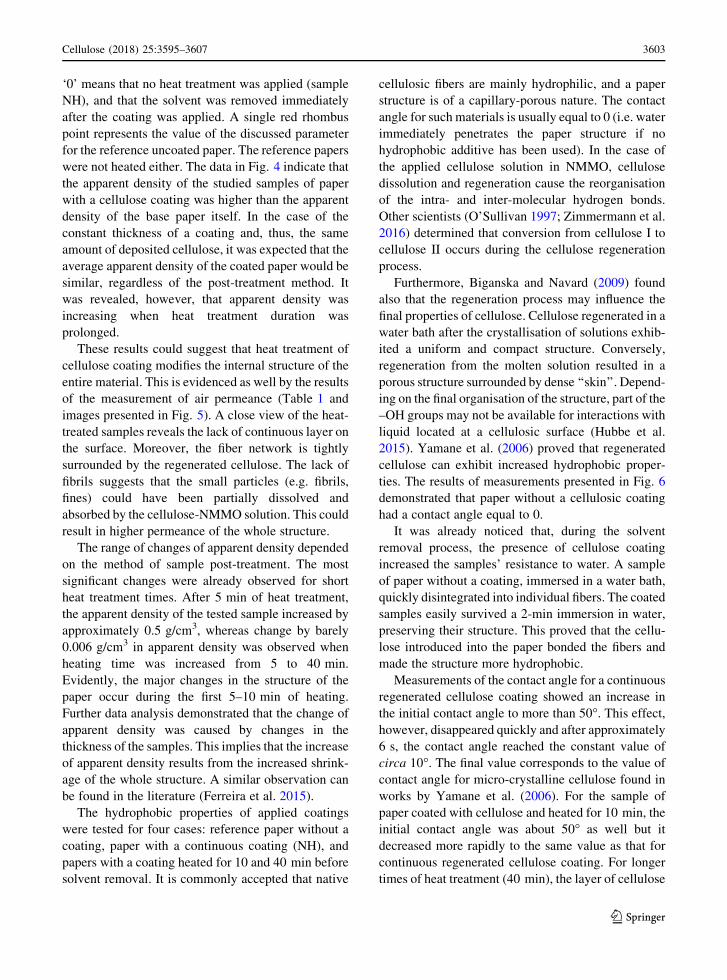
‘0’ means that no heat treatment was applied (sample
NH), and that the solvent was removed immediately
after the coating was applied. A single red rhombus
point represents the value of the discussed parameter
for the reference uncoated paper. The reference papers
were not heated either. The data in Fig. 4 indicate that
the apparent density of the studied samples of paper
with a cellulose coating was higher than the apparent
density of the base paper itself. In the case of the
constant thickness of a coating and, thus, the same
amount of deposited cellulose, it was expected that the
average apparent density of the coated paper would be
similar, regardless of the post-treatment method. It
was revealed, however, that apparent density was
increasing when heat treatment duration was
prolonged.
These results could suggest that heat treatment of
cellulose coating modifies the internal structure of the
entire material. This is evidenced as well by the results
of the measurement of air permeance (Table 1 and
images presented in Fig. 5). A close view of the heat-
treated samples reveals the lack of continuous layer on
the surface. Moreover, the fiber network is tightly
surrounded by the regenerated cellulose. The lack of
fibrils suggests that the small particles (e.g. fibrils,
fines) could have been partially dissolved and
absorbed by the cellulose-NMMO solution. This could
result in higher permeance of the whole structure.
The range of changes of apparent density depended
on the method of sample post-treatment. The most
significant changes were already observed for short
heat treatment times. After 5 min of heat treatment,
the apparent density of the tested sample increased by
approximately 0.5 g/cm3, whereas change by barely
0.006 g/cm3 in apparent density was observed when
heating time was increased from 5 to 40 min.
Evidently, the major changes in the structure of the
paper occur during the first 5–10 min of heating.
Further data analysis demonstrated that the change of
apparent density was caused by changes in the
thickness of the samples. This implies that the increase
of apparent density results from the increased shrink-
age of the whole structure. A similar observation can
be found in the literature (Ferreira et al. 2015).
The hydrophobic properties of applied coatings
were tested for four cases: reference paper without a
coating, paper with a continuous coating (NH), and
papers with a coating heated for 10 and 40 min before
solvent removal. It is commonly accepted that native
cellulosic fibers are mainly hydrophilic, and a paper
structure is of a capillary-porous nature. The contact
angle for such materials is usually equal to 0 (i.e. water
immediately penetrates the paper structure if no
hydrophobic additive has been used). In the case of
the applied cellulose solution in NMMO, cellulose
dissolution and regeneration cause the reorganisation
of the intra- and inter-molecular hydrogen bonds.
Other scientists (O’Sullivan 1997; Zimmermann et al.
2016) determined that conversion from cellulose I to
cellulose II occurs during the cellulose regeneration
process.
Furthermore, Biganska and Navard (2009) found
also that the regeneration process may influence the
final properties of cellulose. Cellulose regenerated in a
water bath after the crystallisation of solutions exhib-
ited a uniform and compact structure. Conversely,
regeneration from the molten solution resulted in a
porous structure surrounded by dense ‘‘skin’’. Depend-
ing on the final organisation of the structure, part of the
–OH groups may not be available for interactions with
liquid located at a cellulosic surface (Hubbe et al.
2015). Yamane et al. (2006) proved that regenerated
cellulose can exhibit increased hydrophobic proper-
ties. The results of measurements presented in Fig. 6
demonstrated that paper without a cellulosic coating
had a contact angle equal to 0.
It was already noticed that, during the solvent
removal process, the presence of cellulose coating
increased the samples’ resistance to water. A sample
of paper without a coating, immersed in a water bath,
quickly disintegrated into individual fibers. The coated
samples easily survived a 2-min immersion in water,
preserving their structure. This proved that the cellu-
lose introduced into the paper bonded the fibers and
made the structure more hydrophobic.
Measurements of the contact angle for a continuous
regenerated cellulose coating showed an increase in
the initial contact angle to more than 50�. This effect,however, disappeared quickly and after approximately
6 s, the contact angle reached the constant value of
circa 10�. The final value corresponds to the value of
contact angle for micro-crystalline cellulose found in
works by Yamane et al. (2006). For the sample of
paper coated with cellulose and heated for 10 min, the
initial contact angle was about 50� as well but it
decreased more rapidly to the same value as that for
continuous regenerated cellulose coating. For longer
times of heat treatment (40 min), the layer of cellulose
Cellulose (2018) 25:3595–3607 3603
123
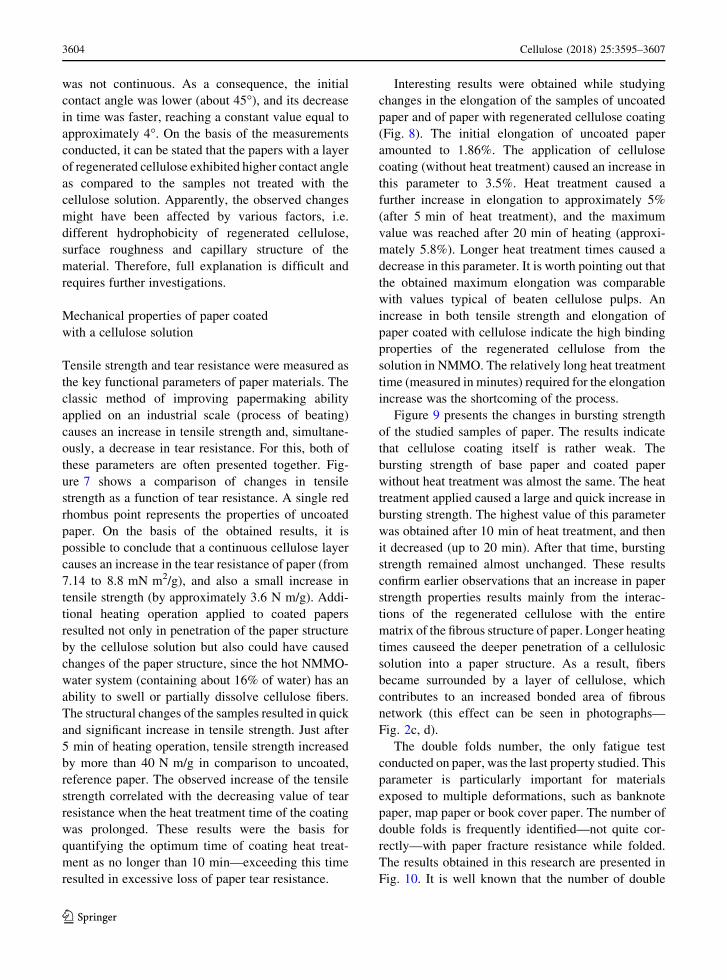
was not continuous. As a consequence, the initial
contact angle was lower (about 45�), and its decrease
in time was faster, reaching a constant value equal to
approximately 4�. On the basis of the measurements
conducted, it can be stated that the papers with a layer
of regenerated cellulose exhibited higher contact angle
as compared to the samples not treated with the
cellulose solution. Apparently, the observed changes
might have been affected by various factors, i.e.
different hydrophobicity of regenerated cellulose,
surface roughness and capillary structure of the
material. Therefore, full explanation is difficult and
requires further investigations.
Mechanical properties of paper coated
with a cellulose solution
Tensile strength and tear resistance were measured as
the key functional parameters of paper materials. The
classic method of improving papermaking ability
applied on an industrial scale (process of beating)
causes an increase in tensile strength and, simultane-
ously, a decrease in tear resistance. For this, both of
these parameters are often presented together. Fig-
ure 7 shows a comparison of changes in tensile
strength as a function of tear resistance. A single red
rhombus point represents the properties of uncoated
paper. On the basis of the obtained results, it is
possible to conclude that a continuous cellulose layer
causes an increase in the tear resistance of paper (from
7.14 to 8.8 mN m2/g), and also a small increase in
tensile strength (by approximately 3.6 N m/g). Addi-
tional heating operation applied to coated papers
resulted not only in penetration of the paper structure
by the cellulose solution but also could have caused
changes of the paper structure, since the hot NMMO-
water system (containing about 16% of water) has an
ability to swell or partially dissolve cellulose fibers.
The structural changes of the samples resulted in quick
and significant increase in tensile strength. Just after
5 min of heating operation, tensile strength increased
by more than 40 N m/g in comparison to uncoated,
reference paper. The observed increase of the tensile
strength correlated with the decreasing value of tear
resistance when the heat treatment time of the coating
was prolonged. These results were the basis for
quantifying the optimum time of coating heat treat-
ment as no longer than 10 min—exceeding this time
resulted in excessive loss of paper tear resistance.
Interesting results were obtained while studying
changes in the elongation of the samples of uncoated
paper and of paper with regenerated cellulose coating
(Fig. 8). The initial elongation of uncoated paper
amounted to 1.86%. The application of cellulose
coating (without heat treatment) caused an increase in
this parameter to 3.5%. Heat treatment caused a
further increase in elongation to approximately 5%
(after 5 min of heat treatment), and the maximum
value was reached after 20 min of heating (approxi-
mately 5.8%). Longer heat treatment times caused a
decrease in this parameter. It is worth pointing out that
the obtained maximum elongation was comparable
with values typical of beaten cellulose pulps. An
increase in both tensile strength and elongation of
paper coated with cellulose indicate the high binding
properties of the regenerated cellulose from the
solution in NMMO. The relatively long heat treatment
time (measured in minutes) required for the elongation
increase was the shortcoming of the process.
Figure 9 presents the changes in bursting strength
of the studied samples of paper. The results indicate
that cellulose coating itself is rather weak. The
bursting strength of base paper and coated paper
without heat treatment was almost the same. The heat
treatment applied caused a large and quick increase in
bursting strength. The highest value of this parameter
was obtained after 10 min of heat treatment, and then
it decreased (up to 20 min). After that time, bursting
strength remained almost unchanged. These results
confirm earlier observations that an increase in paper
strength properties results mainly from the interac-
tions of the regenerated cellulose with the entire
matrix of the fibrous structure of paper. Longer heating
times causeed the deeper penetration of a cellulosic
solution into a paper structure. As a result, fibers
became surrounded by a layer of cellulose, which
contributes to an increased bonded area of fibrous
network (this effect can be seen in photographs—
Fig. 2c, d).
The double folds number, the only fatigue test
conducted on paper, was the last property studied. This
parameter is particularly important for materials
exposed to multiple deformations, such as banknote
paper, map paper or book cover paper. The number of
double folds is frequently identified—not quite cor-
rectly—with paper fracture resistance while folded.
The results obtained in this research are presented in
Fig. 10. It is well known that the number of double
3604 Cellulose (2018) 25:3595–3607
123
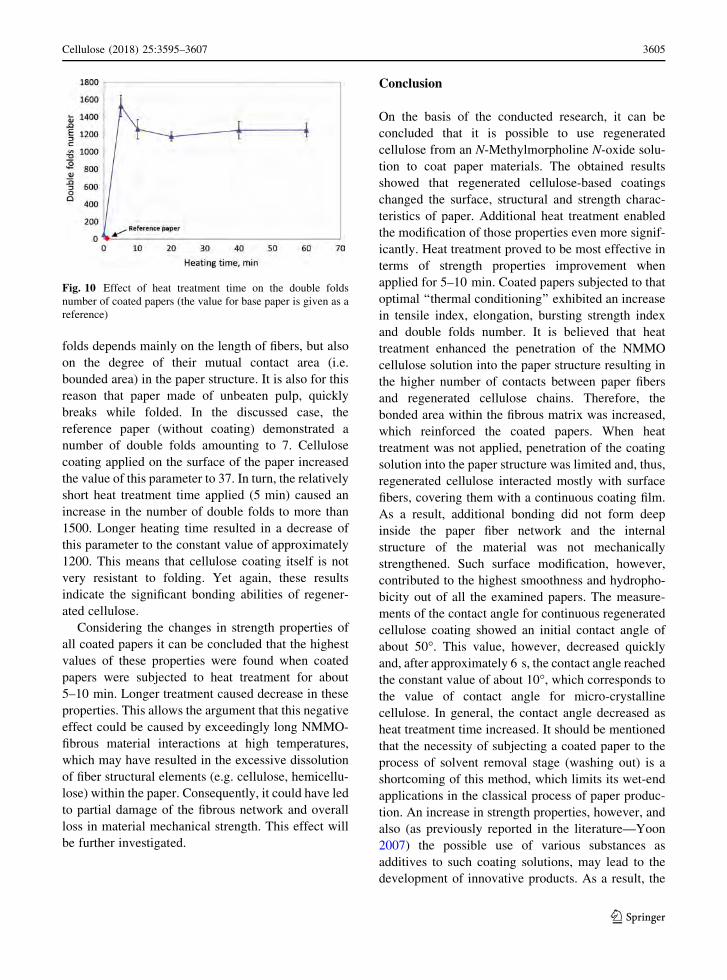
folds depends mainly on the length of fibers, but also
on the degree of their mutual contact area (i.e.
bounded area) in the paper structure. It is also for this
reason that paper made of unbeaten pulp, quickly
breaks while folded. In the discussed case, the
reference paper (without coating) demonstrated a
number of double folds amounting to 7. Cellulose
coating applied on the surface of the paper increased
the value of this parameter to 37. In turn, the relatively
short heat treatment time applied (5 min) caused an
increase in the number of double folds to more than
1500. Longer heating time resulted in a decrease of
this parameter to the constant value of approximately
1200. This means that cellulose coating itself is not
very resistant to folding. Yet again, these results
indicate the significant bonding abilities of regener-
ated cellulose.
Considering the changes in strength properties of
all coated papers it can be concluded that the highest
values of these properties were found when coated
papers were subjected to heat treatment for about
5–10 min. Longer treatment caused decrease in these
properties. This allows the argument that this negative
effect could be caused by exceedingly long NMMO-
fibrous material interactions at high temperatures,
which may have resulted in the excessive dissolution
of fiber structural elements (e.g. cellulose, hemicellu-
lose) within the paper. Consequently, it could have led
to partial damage of the fibrous network and overall
loss in material mechanical strength. This effect will
be further investigated.
Conclusion
On the basis of the conducted research, it can be
concluded that it is possible to use regenerated
cellulose from an N-Methylmorpholine N-oxide solu-
tion to coat paper materials. The obtained results
showed that regenerated cellulose-based coatings
changed the surface, structural and strength charac-
teristics of paper. Additional heat treatment enabled
the modification of those properties even more signif-
icantly. Heat treatment proved to be most effective in
terms of strength properties improvement when
applied for 5–10 min. Coated papers subjected to that
optimal ‘‘thermal conditioning’’ exhibited an increase
in tensile index, elongation, bursting strength index
and double folds number. It is believed that heat
treatment enhanced the penetration of the NMMO
cellulose solution into the paper structure resulting in
the higher number of contacts between paper fibers
and regenerated cellulose chains. Therefore, the
bonded area within the fibrous matrix was increased,
which reinforced the coated papers. When heat
treatment was not applied, penetration of the coating
solution into the paper structure was limited and, thus,
regenerated cellulose interacted mostly with surface
fibers, covering them with a continuous coating film.
As a result, additional bonding did not form deep
inside the paper fiber network and the internal
structure of the material was not mechanically
strengthened. Such surface modification, however,
contributed to the highest smoothness and hydropho-
bicity out of all the examined papers. The measure-
ments of the contact angle for continuous regenerated
cellulose coating showed an initial contact angle of
about 50�. This value, however, decreased quickly
and, after approximately 6 s, the contact angle reached
the constant value of about 10�, which corresponds to
the value of contact angle for micro-crystalline
cellulose. In general, the contact angle decreased as
heat treatment time increased. It should be mentioned
that the necessity of subjecting a coated paper to the
process of solvent removal stage (washing out) is a
shortcoming of this method, which limits its wet-end
applications in the classical process of paper produc-
tion. An increase in strength properties, however, and
also (as previously reported in the literature—Yoon
2007) the possible use of various substances as
additives to such coating solutions, may lead to the
development of innovative products. As a result, the
Fig. 10 Effect of heat treatment time on the double folds
number of coated papers (the value for base paper is given as a
reference)
Cellulose (2018) 25:3595–3607 3605
123
presented method may be beneficial for the production
of specialty materials for which quality and specific
properties play a decisive role in relation to the
efficiency of the production process and also to the
price of the final product.
Open Access This article is distributed under the terms of the
Creative Commons Attribution 4.0 International License (http://
creativecommons.org/licenses/by/4.0/), which permits unre-
stricted use, distribution, and reproduction in any medium,
provided you give appropriate credit to the original
author(s) and the source, provide a link to the Creative Com-
mons license, and indicate if changes were made.
References
Alves L, Medronho B, Antunes FE, Romano A, Miguel GM,
Lindman B (2015) On the role of hydrophobic interactions
in cellulose dissolution andregeneration: colloidal aggre-
gates and molecular solutions. Colloids Surf A Physic-
ochem Eng Asp 483:257–263
Alves L, Medronho B, Antunes FE, Topgaard D, Lindman B
(2016) Dissolution state of cellulose in aqueous systems. 1.
Alkaline solvents. Cellulose 23:247–258
Andersson C (2008) New ways to enhance the functionality of
paperboard by surface treatment—a review. Packag
Technol Sci 21:339–373
Biermann O, Hadicke E, Koltzenburg S, Muller-Plathe F (2001)
Hydrophilicity and lipophilicity of cellulose crystal sur-
faces. Angew Chem Int Ed 40(20):3822–3825
Biganska O, Navard P (2009) Morphology of cellulose objects
regenerated from cellulose-N-methylmorpholine N-oxide-
water solutions. Cellulose 6:179–188
Cao NJ, Xu Q, Chen CS, Gong CS, Chen LF (1994) Cellulose
hydrolysis using zinc-chloride as a solvent and catalyst.
Appl Biochem Biotechnol 45(6):521–530
Chen JH, Guan Y, Wang K, Xu F, Sun RC (2015) Regulating
effect of hemicelluloses on the preparation and properties
of composite Lyocell fibers. Cellulose 22(3):1505–1516
Choi JO, Jitsunari F, Asakawa F, Park HJ, Lee DS (2002)
Migration of surrogate contaminants in paper and paper-
board into water through polyethylene coating layer. Food
Addit Contam 19(12):1200–1206
Dufresne A (2012) Nanocellulose: from nature to high perfor-
mance tailoredmaterials.Walter De Gruyter Gmbh, Berlin.
ISBN 9783110254563
Dufresne A (2013) Nanocellulose: a new ageless bionanoma-
terial. Mater Today 16:220–227. https://doi.org/10.1016/j.
mattod.2013.06.004
Erdman A, Kulpinski P, Olejnik K (2016) Application of
nanocomposite cellulose fibers with luminescent properties
to paper functionalization. Cellulose 23(3):2087–2097
Fall AB, Burman A, Wagberg L (2014) Cellulosic nanofibrils
from eucalyptus, acacia and pine fibers. Nordic Pulp Pap
Res J 29(1):129–143
Ferreira SE, Lanzoni ME, Costa CAR, Deneke C, Bernardes JS,
Galembeck F (2015) Adhesive and reinforcing properties
od soluble cellulose: a repulpable adhesive for wet and dry
cellulosic substrates. ACS Appl Mater Interfaces
7:18750–18758
Ferrer A, Quintana E, Filpponen I, Solala I, Vidal T, Rodriuez A,
Laine J, Rojas O (2012) Effect of residual lignin and
heteropolysaccharides in nanofibrillar cellulose and
nanopaper from wood fibers. Cellulose 19(6):2179–2193
Fukuzumi H, Saito T, Iwata T, Kumamoto Y, Isogai A (2009)
Transparent and high gas barrier films of cellulose nano-
fibers prepared by TEMPO-mediated oxidation.
Biomacromol 10(1):162–170
Gallstedt M, Brottman A, Hedenqvist MS (2005) Packaging
related properties of protein- and chitosan-coated paper.
Packag Technol Sci 18(4):161–170
Garcia MA, Martino MN, Zartizky NE (1999) Edible starch
films and coating char-acterization: scanning electron
microscopy, water vapor transmission and gas permeabil-
ities. Scanning 21(5):358–420
Gardner DJ, Oporto GS,Mills R, SamirMASA (2008) Adhesion
and surface issues in cellulose and nanocellulose. J Adhes
Sci Technol 22:545–567
Hansen N, Plackett D (2008) Sustainable films and coatings
from hemicelluloses: a review. Biomacromol 9:1493–1505
Henriksson M, Berglund LA, Isaksson P, Lindstrom T, Nishino
T (2008) Cellulose nanopaper structures of high toughness.
Biomacromol 9(6):1579–1587
Hubbe MA, Gardner DJ, Shen W (2015) Contact angles and
wettability of cellulosic surfaces: a review of proposed
mechanisms and test strategies. BioResources
10(4):8657–8749
Hubbe MA, Ferrer A, Tyagi P, Yin Y, Salas C, Pal L, Rojas OJ
(2017) Nanocellulose in thin films. coatings and plies for
packaging applications: a review. BioResources
12(1):2143–2333
Hult E-L, Ropponen J, Poppius-Levlin K, Ohra-Aho T, Tam-
minen T (2013) Enhancing the barrier properties of paper
board by a novel lignin coating. Ind Crops Prod
50:694–700
Jie XM, Cao YM, Qin JJ, Liu JH, Yuan Q (2005) Influence of
drying method on morphology and properties of asym-
metric cellulose hollow fiber membrane. J Membr Sci
246(2):157–165
Johnson DL (1969) Process for strengthening swellable fibrous
material with an amine oxide and the resulting material. US
Patent 3447956
Kalashnikova I, Bizot H, Cathala B, Capron I (2012) Modula-
tion of cellulose nanocrystals amphiphilic properties to
stabilize oil/water interface. Biomacromol 13:267–275
Kangas H, Lahtinen P, Sneck A, Saariaho AM, Laitinen O,
Hellen E (2014) Characterization of fibrillated celluloses.
A short review and evaluation of characteristics with a
combination of methods. Nordic Pulp Pap Res J
29(1):129–143
Khwaldia K, Arab-Tehrany E, Desobry S (2010) Biopolymer
coatings on paper packaging materials. Compr Rev Food
Sci Food Saf 9(1):82–91
Kosan B, Michels Ch, Meister F (2008) Dissolution and forming
of cellulose with ionic liquids. Cellulose 15(1):59–66
Kulpinski P (2007) Cellulose fibers modified by hydrophobic
type polymer. J Appl Polym Sci 104:398–409
3606 Cellulose (2018) 25:3595–3607
123
Kulpinski P, Smiechowicz E, Niekraszewicz B, Baciarelli A
(2011) Cellulose fibers modified with silver nanoparticles.
Cellulose 18:975–985
Lavoine N, Desloges I, Dufresne A, Bras J (2012) Microfibril-
lated cellulose—its barrier properties and applications in
cellulosic materials: a review. Carbohydr Polym
90:735–746
Lavoine N, Desloges I, Khelifi B, Bras J (2014) Impact of dif-
ferent coating processes of microfibrillated cellulose on the
mechanical and barrier properties of paper. J Mater Sci
49:2879–2893
Lee SY, Mohan DJ, Kang IA, Doh GH, Lee S, Han SO (2009)
Nanocellulose reinforced PVA composite films: effects of
acid treatment and filler loading. Fibers Polym 10:77–82
Lindman B, Karlstrom G, Stigsson L (2010) On the mechanism
of dissolution of cellulose. J Mol Liq 156:76–81
Liu A,Walther A, Ikkala O, Belova L, Berglund LA (2011) Clay
nanopaper with tough cellulose nanofiber matrix for fire
retardancy and gas barrier functions. Biomacromol
12:633–641
Mazeau K (2011) On the external morphology of native cellu-
lose microfibrils. Carbohyd Polym 84:524–532
Medronho B, Lindman B (2014) Competing forces during cel-
lulose dissolution: from solvents to mechanisms. Curr Opin
Colloid Interface Sci 19:32–40
Medronho B, Lindman B (2015) Brief overview on cellulose
dissolution/regeneration interactions and mechanisms.
Adv Coll Interface Sci 222:502–508
Medronho B, Romano A, GracaMiguel M, Stigsson L, Lindman
B (2012) Rationalizing cellulose (in)solubility: reviewing
basic physicochemical aspects and role of hydrophobic
interactions. Cellulose 19:581–587. https://doi.org/10.
1007/s10570-011-9644-6
Melville AJ, Topping DJ,Willis DP (2014) Bearing components
and processes for depositing additives, especially fluo-
ropolymers, on cellulose. US 8703668 B2
Mngomezulu ME, John MJ (2017) Thermoset cellulose
nanocomposites: flammability characteristics. In: Kar-
garzadeh H, Ahmad I, Sabu T, Alain Dufresne A (eds)
Handbook of nanocellulose and cellulose nanocomposites.
p 263, ISBN: 978-3-527-68999-6
Nakagaito AN, Yano H (2005) Novel high-strength biocom-
posites based on microfibrillated cellulose having nano-
order-unit web-like network structure. Appl Phys A
80:155–159
O’Sullivan A (1997) Cellulose: the structure slowly unravels.
Cellulose 4:173–207
Peresin M, Rojas OJ (2014) Electrospinning of nanocellulose-
based materials. In: Oksman K, Bismarck A, Rojas OJ,
Sain M (eds) Handbook of green materials. Part 3: self- and
direct-assembling of bionanomaterials, Chapter 10. World
Scientific Publishing, Singapore, pp 163–183. ISBN
9789814566452
Rhim J-W, Lee J-H, Hong S-I (2006) Water resistance and
mechanical properties of biopolymer (alginate and soy
protein) coated paperboards. LWT Food Sci Technol
39(7):806–813
Rosenau T, Potthast A, Sixta H, Kosma P (2001) The chemistry
of side reactions and byproduct formation in the system
NMMO/cellulose (Lyocell process). Prog Polym Sci
26:1763–1837
Salas C, Nypelo T, Abreu CR, Carrillo C, Rojas OJ (2014)
Nanocellulose properties and applications in colloids and
interfaces. Curr Opin Colloid Interface Sci 19:383–396
Savadekar NR, Karande VS, Vigneshwaran N, Kadam PG,
Mhaske ST (2015) Preparation of cotton linter nano-
whiskers by high-pressure homogenization process and its
application in thermoplastic starch. Appl Nanosci
5:281–290. https://doi.org/10.1007/s13204-014-0316-3
Siro I, Plackett D (2010) Microfibrillated cellulose and new
nanocomposite materials: a review. Cellulose 17:459–467
Spence KL, Venditti RA, Rojas OJ, Habibi Y, Pavlak JJ (2010)
The effect of chemical composition on microfibrillar cel-
lulose films from wood pulps: water interactions and
physical properties for packaging applications. Cellulose
17:835–844
Sturcova A, Davies GR, Eichhorn SJ (2005) Elastic modulus
and stress-transfer properties of tunicate cellulose whis-
kers. Biomacromol 6:1055–1061
Tingaut P, Eyholzer C, Zimmermann T (2011) Functional
polymer nanocomposite materials from microfibrillated
cellulose. In: Hashim A (ed) Advances in nanocomposite
technology. InTech. https://doi.org/10.5772/20817
Tracton AA (ed) (2007) Coatings technology. Fundamentals,
testing and processing techniques. CRC Press, Taylor &
Francis Group, London, New York. ISBN 978-1-4200-
4406-5
Yamane C, Aoyagi T, Ago M, Sato K, Okajima K, Takahashi T
(2006) Two different surface properties of regenerated
cellulose due to structural anisotropy. Polym J
38(8):819–826
Yoon S-Y (2007). Bonding material coated clay for improving
paper properties. Doctoral dissertation. Georgia Institute of
Technology, USA
Zimmermann T, Pohler E, Schwaller P (2005) Mechanical and
morphological properties of cellulose fibril reinforced
nanocomposites. Adv Eng Mater 7:1156–1161
Zimmermann T, Bordeanu N, Strub E (2010) Properties of
nanofibrillated cellulose from different raw materials and
its reinforcement potential. Carbohydr Polym
79:1086–1093
Zimmermann R, Muller Y, Freudenberg U, Jehnichen D, Pot-
thast A, Rosenau T, Werner C (2016) Oxidation and
structural changes in NMMO-regenerated cellulose films.
Cellulose 23(6):3535–3541
Cellulose (2018) 25:3595–3607 3607
123
PAPERmaking!
FROM THE PUBLISHERS OF PAPER TECHNOLOGY
Volume 5, Number 1, 2019
Page 1 of 7 Article 4 – Warehouse Design
Warehouse Design and Operation using Augmented Reality technology: A Papermaking Industry Case Study Dimitris Mourtzis
a·*, Vasilios Samothrakis
a, Vasilios Zogopoulos
a, Ekaterini Vlachou
a
In modern, high competitive markets, efficient warehousing is critical as it accounts for a great part of logistics costs. Companies try to adopt highly adaptive and flexible warehouse design that may support the integration of novel technologies such as Augmented Reality (AR). This paper proposes a framework for warehouse design which minimizes inventory cost while keeping a high degree of service by supporting the integration of an AR warehousing system. The AR system will support the effective management of operations, by providing meaningful information. The proposed methodology is tested and validated in a real-life case study of a papermaking industry. Contact information: a Laboratory for Manufacturing Systems and Automation (LMS), Department of Mechanical Engineering and Aeronautics, University of Patras, Rio Patras, 26504, Greece. *Corresponding author. Tel: +30 2610 910160; fax: +30-2610-997744. E-mail address: [email protected] Procedia CIRP 79 (2019) 574-579. DOI: 10.1016/j.procir.2019.02.097
The Paper Industry Technical Association (PITA) is an independent organisation which operates for the general benefit of its members – both individual and corporate – dedicated to promoting and improving the technical and scientific knowledge of those working in the UK pulp and paper industry. Formed in 1960, it serves the Industry, both manufacturers and suppliers, by providing a forum for members to meet and network; it organises visits, conferences and training seminars that cover all aspects of papermaking science. It also publishes the prestigious journal Paper Technology International and the PITA Annual Review, both sent free to members, and a range of other technical publications which include conference proceedings and the acclaimed Essential
Guide to Aqueous Coating.
ScienceDirect
Available online at www.sciencedirect.comAvailable online at www.sciencedirect.com
ScienceDirectProcedia CIRP 00 (2017) 000–000
www.elsevier.com/locate/procedia
2212-8271 © 2017 The Authors. Published by Elsevier B.V. Peer-review under responsibility of the scientific committee of the 28th CIRP Design Conference 2018.
28th CIRP Design Conference, May 2018, Nantes, France
A new methodology to analyze the functional and physical architecture of existing products for an assembly oriented product family identification
Paul Stief *, Jean-Yves Dantan, Alain Etienne, Ali Siadat École Nationale Supérieure d’Arts et Métiers, Arts et Métiers ParisTech, LCFC EA 4495, 4 Rue Augustin Fresnel, Metz 57078, France
* Corresponding author. Tel.: +33 3 87 37 54 30; E-mail address: [email protected]
Abstract
In today’s business environment, the trend towards more product variety and customization is unbroken. Due to this development, the need of agile and reconfigurable production systems emerged to cope with various products and product families. To design and optimize productionsystems as well as to choose the optimal product matches, product analysis methods are needed. Indeed, most of the known methods aim to analyze a product or one product family on the physical level. Different product families, however, may differ largely in terms of the number and nature of components. This fact impedes an efficient comparison and choice of appropriate product family combinations for the productionsystem. A new methodology is proposed to analyze existing products in view of their functional and physical architecture. The aim is to clusterthese products in new assembly oriented product families for the optimization of existing assembly lines and the creation of future reconfigurable assembly systems. Based on Datum Flow Chain, the physical structure of the products is analyzed. Functional subassemblies are identified, and a functional analysis is performed. Moreover, a hybrid functional and physical architecture graph (HyFPAG) is the output which depicts the similarity between product families by providing design support to both, production system planners and product designers. An illustrativeexample of a nail-clipper is used to explain the proposed methodology. An industrial case study on two product families of steering columns of thyssenkrupp Presta France is then carried out to give a first industrial evaluation of the proposed approach. © 2017 The Authors. Published by Elsevier B.V. Peer-review under responsibility of the scientific committee of the 28th CIRP Design Conference 2018.
Keywords: Assembly; Design method; Family identification
1. Introduction
Due to the fast development in the domain of communication and an ongoing trend of digitization anddigitalization, manufacturing enterprises are facing importantchallenges in today’s market environments: a continuingtendency towards reduction of product development times andshortened product lifecycles. In addition, there is an increasingdemand of customization, being at the same time in a global competition with competitors all over the world. This trend, which is inducing the development from macro to micro markets, results in diminished lot sizes due to augmentingproduct varieties (high-volume to low-volume production) [1]. To cope with this augmenting variety as well as to be able toidentify possible optimization potentials in the existingproduction system, it is important to have a precise knowledge
of the product range and characteristics manufactured and/or assembled in this system. In this context, the main challenge inmodelling and analysis is now not only to cope with single products, a limited product range or existing product families,but also to be able to analyze and to compare products to definenew product families. It can be observed that classical existingproduct families are regrouped in function of clients or features.However, assembly oriented product families are hardly to find.
On the product family level, products differ mainly in twomain characteristics: (i) the number of components and (ii) thetype of components (e.g. mechanical, electrical, electronical).
Classical methodologies considering mainly single products or solitary, already existing product families analyze theproduct structure on a physical level (components level) which causes difficulties regarding an efficient definition andcomparison of different product families. Addressing this
Procedia CIRP 79 (2019) 574–579
2212-8271 © 2019 The Authors. Published by Elsevier B.V.Peer-review under responsibility of the scientific committee of the 12th CIRP Conference on Intelligent Computation in Manufacturing Engineering.10.1016/j.procir.2019.02.097
12th CIRP Conference on Intelligent Computation in Manufacturing Engineering, 18-20 July 2018, Gulf of Naples, Italy
© 2019 The Authors. Published by Elsevier B.V. Peer-review under responsibility of the scientific committee of the 12th CIRP Conference on Intelligent Computation in Manufacturing Engineering.
Available online at www.sciencedirect.com
ScienceDirect Procedia CIRP 00 (2018) 000–000
www.elsevier.com/locate/procedia
2212-8271 © 2018 The Authors. Published by Elsevier B.V. Peer-review under responsibility of the scientific committee of the 12th CIRP Conference on Intelligent Computation in Manufacturing Engineering.
12th CIRP Conference on Intelligent Computation in Manufacturing Engineering, CIRP ICME '18
Warehouse Design and Operation using Augmented Reality technology: A Papermaking Industry Case Study
Dimitris Mourtzisa,*, Vasilios Samothrakisa, Vasilios Zogopoulosa, Ekaterini Vlachoua aLaboratory for Manufacturing Systems and Automation(LMS), Department of Mechanical Engineering and Aeronautics, University of Patras, Rio Patras,
26504, Greece * Corresponding author. Tel: +30 2610 910160; fax: +30-2610-997744. E-mail address: [email protected]
Abstract
In modern, high competitive markets, efficient warehousing is critical as it accounts for a great part of logistics costs. Companies try to adopt highly adaptive and flexible warehouse design that may support the integration of novel technologies such as Augmented Reality (AR). This paper proposes a framework for warehouse design which minimizes inventory cost while keeping a high degree of service by supporting the integration of an AR warehousing system. The AR system will support the effective management of operations, by providing meaningful information. The proposed methodology is tested and validated in a real-life case study of a papermaking industry. © 2018 The Authors. Published by Elsevier B.V. Peer-review under responsibility of the scientific committee of the 12th CIRP Conference on Intelligent Computation in Manufacturing Engineering.
Keywords: Warehouse design; Augmented reality; Warehouse simulation; Manufacturing
1 Introduction
Warehouses are a key aspect of modern supply chains and play a vital role in the success, or failure, of businesses today, since they: a) provide storage for raw materials, components, work-in-process, and finished goods b) operate as distribution and order fulfilment centres and c) perform localized and value-added warehousing [1]. For these reasons, warehouses have to be highly adaptive to the production rate so as to reach optimal operation level. Inventory management and control is the key to warehouse design and optimization. The main goal of inventory management and control is to optimize three targets: customer service, inventory costs, and operating costs. Service level must be kept at high levels while inventory and operation costs must be minimized [2].
Warehouse design demands a very methodical and well-structured approach due to warehouse complexity. Warehouse design is highly complex as it is a multi-criteria problem, with interconnected functions and parameters. Warehouse simulation is a commonly used approach to improve its design [3]. Novel digital solutions have been proposed in the literature
and also the market that support effective warehouse design, considering different criteria [4] so as to support decision making while offering simulation features that may visualize the functionality of the designed warehouse.
Additionally, novel technologies that shape manufacturing have found fertile ground in different fields [5]. Starting from simpler combinations on laser scanners and barcodes, contemporary warehouses try to integrate new technologies to facilitate managing warehouse available stock and effective product localisation, especially in larger facilities [6]. Utilizing wearables, such as smart watches and head-mounted displays, the operators may easily report product input/ output in the warehouse, while also retrieve the position of a stored product [7]. Using advanced visualization techniques, such as Augmented Reality, the operators may intuitively be guided to find a stored product and easily report stock updates [8].
This paper proposes an adaptive methodology for warehouse design while integrating Augmented Reality. Logistics and statistical analysis has been used and the final is designed according to Economic Order Quantity (EOQ) model, aiming to minimize inventory cost. Additionally, an
Dimitris Mourtzis et al. / Procedia CIRP 79 (2019) 574–579 575 D. Mourtzis et al. / Procedia CIRP 00 (2018) 000–000
Augmented Reality based system to support warehouse management, connecting the operators with a central inventory management platform. To verify the proposed design, it is applied in papermaking industry.
2 State of the art
According to ELA (2004), the capital and operating costs of warehousing in Europe represent about 25% of logistics costs, whilst figures for the USA show that warehousing contributes to about 10% [9]. In spite of warehouse significance in supply chain, there is limited effort in the literature towards that direction [10]. Although, publications show that there is an abundance of information written on analyzing particular aspects of warehouse designing problem, it is the combination of all these aspects that has to be taken into consideration and classified in a strict order so as act as a basis for a successful approach to warehouse design [11].
Warehouse design problems have been early reported in the literature. Oxley [12] presents a comprehensible list of steps which are based on the key features of the previous authors, while also defining the overall system requirements of the supply chain. He emphasizes that the warehouse design should be focused on the storage and handling requirements and that the building should then be designed around these. This basic framework of steps is also enhanced by Rowley [13] with Oxley’s contribution.
Simulation models have been applied since the early 1980’s through basic simulation packages as presented by Ashayeri, et al. [14]. Most of the research done in simulation field is due to the need for optimal warehouse design and planning, where novel technologies could be early adopted. For example, Automated Guided Vehicle (AGV) transport systems where soon adopted in warehouse applications [15]. Gu et al. provided an extensive overview of warehouse performance analysis models, claiming that simulation models are typically used for evaluating one design alternative, but that they are less suited for design-space exploration [4]. Andriansyah et al. presented a layered warehouse simulation model built from reusable components that considers varying number of storage aisles and workstations in a miniload-workstation order-picking system [16].
A further step has been added to the former publication which has to do with the use of computer simulation. Rouwenhorst et al. stated that a design process runs through a hierarchical framework, identifying strategic, tactical and operational decisions [11]. Rushton et al. (2006) have made a refinement of steps in their earlier edition so as to recognize the importance of flexibility in warehouse design issue [17]. The iterative nature of design process is clarified by the equipment and staffing calculations now being presented after the layout design rather than before, as with most other frameworks. Baker and Canessa explored the current literature on the overall methodology design, validated and refined the general results from the literature with reference to warehouse companies [18]. Accorsi et al. applied an integrated decision-support system for the design and management of a storage system [19]. Mital and Krejci presented a modelling framework and an effective algorithm to design material handling systems and warehouses
by the identification of the possible system configurations [20]. Thomas and Meller presented a statistical-based methodology to develop guidelines, used to design a manual and case-picking warehouse [21]. The aforementioned publications make apparent warehouse design follows a structure sequence of interdependent steps.
Nevertheless, there are many differences among the various approaches described above, which steam from the various combinations of design process activities when they are grouped into steps [18]. The past few years, warehouse planning was considered to be a very complex issue due to the absence of the simulation and computing power [3]. In many cases, it was not feasible to experiment on real environment as production rate did not allow to make changes. Nowadays, there are many simulation tools that make warehouse design and planning easier and give to the industry the opportunity to test different scenarios, supporting decision making [22].
A technology that starts to gain ground in industrial applications is Augmented Reality. From knowledge distribution through technical instructions in assembly tasks [23] to remote maintenance support [24], AR is tested in different applications, until it becomes mature enough (both from hardware but also from technical knowledge side) to be fully integrated into manufacturing. Its applicability, as it may be used through various host device, and its mobility has proven to be a great advantage that allows it to be easily used in the production line [25]. Additionally, it has proven to be useful for providing positioning instructions, both in maps navigation but also in large warehouse facilities for inventory management and package retrieval, facilitating the operators to efficiently manage large facilities with changing stocks (such as the case of logistics warehouses) [8].
Based on the aforementioned literature review, it becomes apparent that simulation modelling, in terms of warehouse design, is a one-way selection [26]. This happens due to the fact that simulation models can be extremely valuable, timely and cost-effective means to study the performance characteristics of a proposed warehouse layout. Additionally, novel technologies that may improve inventory management and increase the efficiency of product retrieval in vast warehouses are welcome. Towards that end, this paper suggests a method for warehouse design, considering the integration of mobile devices and Augmented Reality to support product location retrieval by the warehouse operators and efficient inventory management. The developed approach is applied in a papermaking industry for validation.
3 Warehouse design to support Augmented Reality package retrieval
This paper presents an innovative and easy to adapt methodology which can give a reliable solution to the problem of warehouse design and simulation that seems to concern the majority of the industries in our days. This methodology aims to keep a high service level while minimizing the inventory costs.
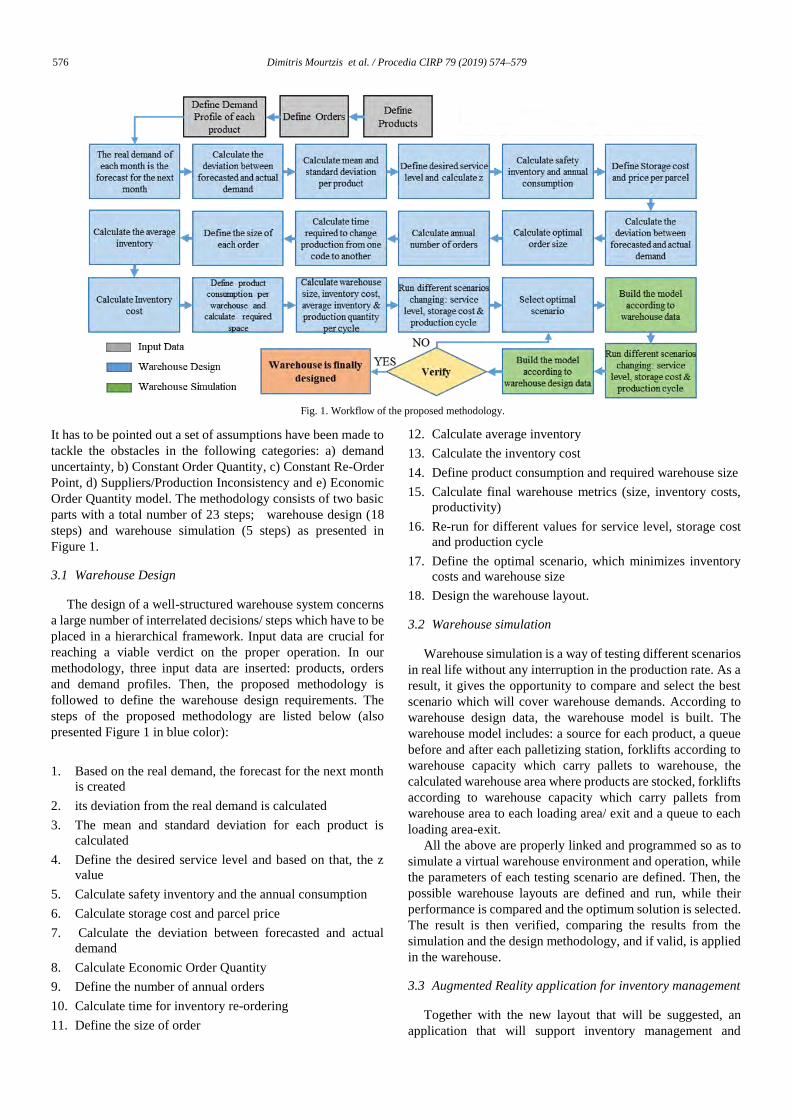
576 Dimitris Mourtzis et al. / Procedia CIRP 79 (2019) 574–579 D. Mourtzis et al. / Procedia CIRP 00 (2018) 000–000
It has to be pointed out a set of assumptions have been made to tackle the obstacles in the following categories: a) demand uncertainty, b) Constant Order Quantity, c) Constant Re-Order Point, d) Suppliers/Production Inconsistency and e) Economic Order Quantity model. The methodology consists of two basic parts with a total number of 23 steps; warehouse design (18 steps) and warehouse simulation (5 steps) as presented in Figure 1.
3.1 Warehouse Design
The design of a well-structured warehouse system concerns a large number of interrelated decisions/ steps which have to be placed in a hierarchical framework. Input data are crucial for reaching a viable verdict on the proper operation. In our methodology, three input data are inserted: products, orders and demand profiles. Then, the proposed methodology is followed to define the warehouse design requirements. The steps of the proposed methodology are listed below (also presented Figure 1 in blue color):
1. Based on the real demand, the forecast for the next month is created
2. its deviation from the real demand is calculated
3. The mean and standard deviation for each product is calculated
4. Define the desired service level and based on that, the z value
5. Calculate safety inventory and the annual consumption
6. Calculate storage cost and parcel price
7. Calculate the deviation between forecasted and actual demand
8. Calculate Economic Order Quantity
9. Define the number of annual orders
10. Calculate time for inventory re-ordering
11. Define the size of order
12. Calculate average inventory
13. Calculate the inventory cost
14. Define product consumption and required warehouse size
15. Calculate final warehouse metrics (size, inventory costs, productivity)
16. Re-run for different values for service level, storage cost and production cycle
17. Define the optimal scenario, which minimizes inventory costs and warehouse size
18. Design the warehouse layout.
3.2 Warehouse simulation
Warehouse simulation is a way of testing different scenarios in real life without any interruption in the production rate. As a result, it gives the opportunity to compare and select the best scenario which will cover warehouse demands. According to warehouse design data, the warehouse model is built. The warehouse model includes: a source for each product, a queue before and after each palletizing station, forklifts according to warehouse capacity which carry pallets to warehouse, the calculated warehouse area where products are stocked, forklifts according to warehouse capacity which carry pallets from warehouse area to each loading area/ exit and a queue to each loading area-exit.
All the above are properly linked and programmed so as to simulate a virtual warehouse environment and operation, while the parameters of each testing scenario are defined. Then, the possible warehouse layouts are defined and run, while their performance is compared and the optimum solution is selected. The result is then verified, comparing the results from the simulation and the design methodology, and if valid, is applied in the warehouse.
3.3 Augmented Reality application for inventory management
Together with the new layout that will be suggested, an application that will support inventory management and
Fig. 1. Workflow of the proposed methodology.
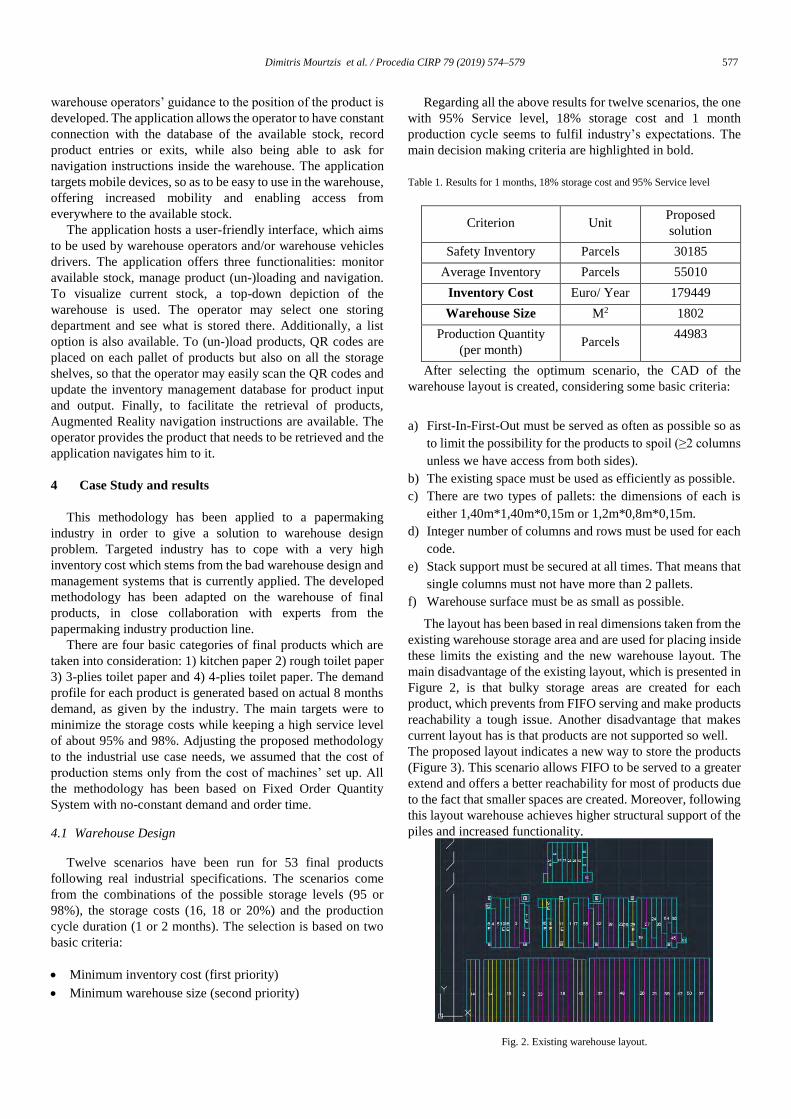
Dimitris Mourtzis et al. / Procedia CIRP 79 (2019) 574–579 577 D. Mourtzis et al. / Procedia CIRP 00 (2018) 000–000
warehouse operators’ guidance to the position of the product is developed. The application allows the operator to have constant connection with the database of the available stock, record product entries or exits, while also being able to ask for navigation instructions inside the warehouse. The application targets mobile devices, so as to be easy to use in the warehouse, offering increased mobility and enabling access from everywhere to the available stock.
The application hosts a user-friendly interface, which aims to be used by warehouse operators and/or warehouse vehicles drivers. The application offers three functionalities: monitor available stock, manage product (un-)loading and navigation. To visualize current stock, a top-down depiction of the warehouse is used. The operator may select one storing department and see what is stored there. Additionally, a list option is also available. To (un-)load products, QR codes are placed on each pallet of products but also on all the storage shelves, so that the operator may easily scan the QR codes and update the inventory management database for product input and output. Finally, to facilitate the retrieval of products, Augmented Reality navigation instructions are available. The operator provides the product that needs to be retrieved and the application navigates him to it.
4 Case Study and results
This methodology has been applied to a papermaking industry in order to give a solution to warehouse design problem. Targeted industry has to cope with a very high inventory cost which stems from the bad warehouse design and management systems that is currently applied. The developed methodology has been adapted on the warehouse of final products, in close collaboration with experts from the papermaking industry production line.
There are four basic categories of final products which are taken into consideration: 1) kitchen paper 2) rough toilet paper 3) 3-plies toilet paper and 4) 4-plies toilet paper. The demand profile for each product is generated based on actual 8 months demand, as given by the industry. The main targets were to minimize the storage costs while keeping a high service level of about 95% and 98%. Adjusting the proposed methodology to the industrial use case needs, we assumed that the cost of production stems only from the cost of machines’ set up. All the methodology has been based on Fixed Order Quantity System with no-constant demand and order time.
4.1 Warehouse Design
Twelve scenarios have been run for 53 final products following real industrial specifications. The scenarios come from the combinations of the possible storage levels (95 or 98%), the storage costs (16, 18 or 20%) and the production cycle duration (1 or 2 months). The selection is based on two basic criteria:
Minimum inventory cost (first priority)
Minimum warehouse size (second priority)
Regarding all the above results for twelve scenarios, the one with 95% Service level, 18% storage cost and 1 month production cycle seems to fulfil industry’s expectations. The main decision making criteria are highlighted in bold.
Table 1. Results for 1 months, 18% storage cost and 95% Service level
After selecting the optimum scenario, the CAD of the warehouse layout is created, considering some basic criteria:
a) First-In-First-Out must be served as often as possible so as to limit the possibility for the products to spoil (≥2 columns unless we have access from both sides).
b) The existing space must be used as efficiently as possible. c) There are two types of pallets: the dimensions of each is
either 1,40m*1,40m*0,15m or 1,2m*0,8m*0,15m. d) Integer number of columns and rows must be used for each
code. e) Stack support must be secured at all times. That means that
single columns must not have more than 2 pallets. f) Warehouse surface must be as small as possible.
The layout has been based in real dimensions taken from the existing warehouse storage area and are used for placing inside these limits the existing and the new warehouse layout. The main disadvantage of the existing layout, which is presented in Figure 2, is that bulky storage areas are created for each product, which prevents from FIFO serving and make products reachability a tough issue. Another disadvantage that makes current layout has is that products are not supported so well. The proposed layout indicates a new way to store the products (Figure 3). This scenario allows FIFO to be served to a greater extend and offers a better reachability for most of products due to the fact that smaller spaces are created. Moreover, following this layout warehouse achieves higher structural support of the piles and increased functionality.
Fig. 2. Existing warehouse layout.
Criterion Unit Proposed solution
Safety Inventory Parcels 30185
Average Inventory Parcels 55010
Inventory Cost Euro/ Year 179449
Warehouse Size M2 1802
Production Quantity (per month)
Parcels 44983
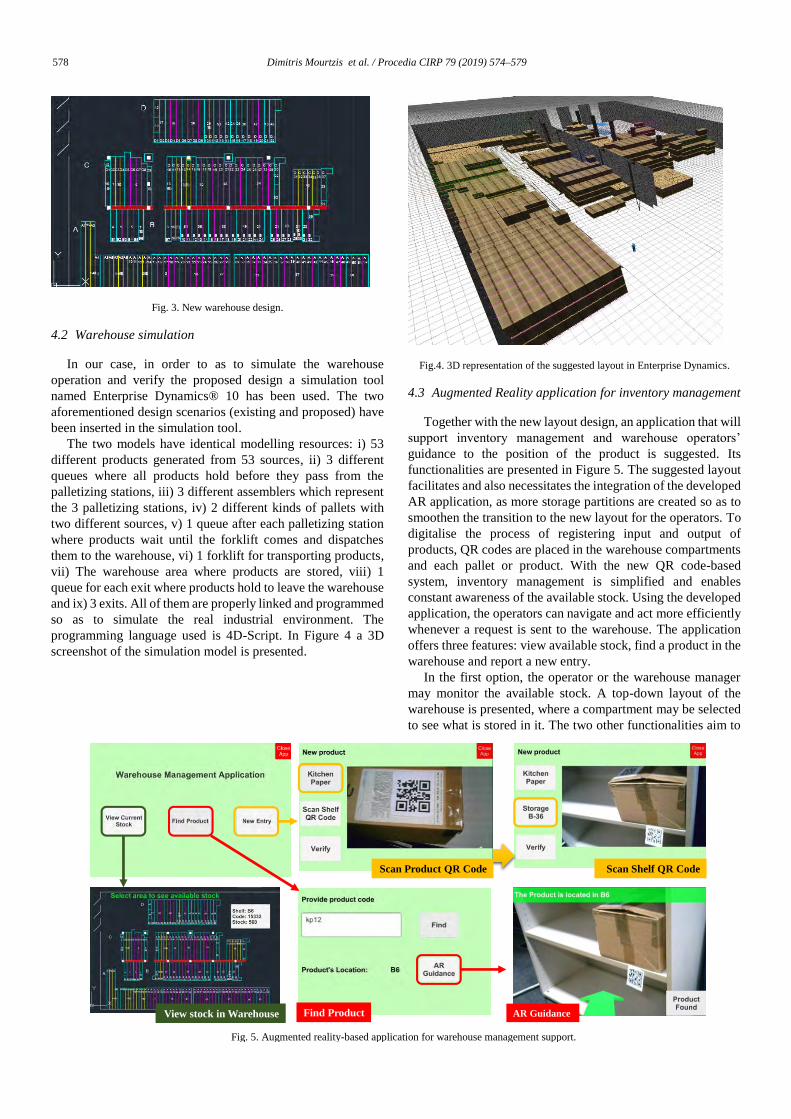
578 Dimitris Mourtzis et al. / Procedia CIRP 79 (2019) 574–579 D. Mourtzis et al. / Procedia CIRP 00 (2018) 000–000
Fig. 3. New warehouse design.
4.2 Warehouse simulation
In our case, in order to as to simulate the warehouse operation and verify the proposed design a simulation tool named Enterprise Dynamics® 10 has been used. The two aforementioned design scenarios (existing and proposed) have been inserted in the simulation tool.
The two models have identical modelling resources: i) 53 different products generated from 53 sources, ii) 3 different queues where all products hold before they pass from the palletizing stations, iii) 3 different assemblers which represent the 3 palletizing stations, iv) 2 different kinds of pallets with two different sources, v) 1 queue after each palletizing station where products wait until the forklift comes and dispatches them to the warehouse, vi) 1 forklift for transporting products, vii) The warehouse area where products are stored, viii) 1 queue for each exit where products hold to leave the warehouse and ix) 3 exits. All of them are properly linked and programmed so as to simulate the real industrial environment. The programming language used is 4D-Script. In Figure 4 a 3D screenshot of the simulation model is presented.
Fig.4. 3D representation of the suggested layout in Enterprise Dynamics.
4.3 Augmented Reality application for inventory management
Together with the new layout design, an application that will support inventory management and warehouse operators’ guidance to the position of the product is suggested. Its functionalities are presented in Figure 5. The suggested layout facilitates and also necessitates the integration of the developed AR application, as more storage partitions are created so as to smoothen the transition to the new layout for the operators. To digitalise the process of registering input and output of products, QR codes are placed in the warehouse compartments and each pallet or product. With the new QR code-based system, inventory management is simplified and enables constant awareness of the available stock. Using the developed application, the operators can navigate and act more efficiently whenever a request is sent to the warehouse. The application offers three features: view available stock, find a product in the warehouse and report a new entry.
In the first option, the operator or the warehouse manager may monitor the available stock. A top-down layout of the warehouse is presented, where a compartment may be selected to see what is stored in it. The two other functionalities aim to
Fig. 5. Augmented reality-based application for warehouse management support.
Find Product AR Guidance
Scan Product QR Code Scan Shelf QR Code
View stock in Warehouse
Dimitris Mourtzis et al. / Procedia CIRP 79 (2019) 574–579 579 D. Mourtzis et al. / Procedia CIRP 00 (2018) 000–000
support product input and output registration. In the case of new product entry to the warehouse, the operator may scan the QR code on the product and on the storage shelf/ compartment so as to quickly register a new product in the warehouse database.
The last functionality helps to retrieve a specific product in the warehouse. As a new warehouse layout is suggested, and also because the operators tend to change what product is stored in each compartment, an Augmented Reality based guidance is introduced. The operator may provide, through the mobile application, a request to retrieve a product’s position from the database and be guided to it. Using device’s GPS and the corresponding warehouse compartment’s position, as stored in the database, the operator is guided to find it. This application may be used by operators, using either handheld equipment or pallet transfer vehicles.
5 Conclusion
To sum up, warehouse design and planning is an ever- existing challenge in manufacturing that highly affects the efficiency of the warehouse. Many solutions have been proposed in the literature but it still seems to be an open issue for research. The developed methodology presents a step-by-step way to design and plan a warehouse which initiates from inventory control and management and is completed with a warehouse simulation so as to verify warehouse design. Additionally, an Augmented Reality based mobile application is introduced. The application aims to facilitate warehouse management, supporting efficient navigation and product retrieval, which could be extended to logistics warehouse, where there the product stock is constantly changing, thus finding it becomes more difficult for the operators.
For future work, a more throughout analysis of the fluctuating customer demand will be performed, in order to improve the design of the stock levels. Moreover, lost sales cost analysis due to low inventory level and the cost from the unpredictable changing of the production line in order to serve some large orders. Additionally, the developed Augmented Reality application will be extended to other warehouse management use cases.
Acknowledgements
The authors are grateful to the papermaking industry that provided the use case for this study.
References
[1] Frazelle E. Supply Chain Strategy: The Logistics of Supply Chain Management, 2002 McGraw-Hill, New York
[2] Wild T. Best Practice in Inventory Management, 2002, 2nd edition. [3] Mourtzis D, Doukas M, Bernidaki D. Simulation in manufacturing:
Review and challenges. Procedia CIRP. 2014 Jan 1;25:213-29. [4] Gu J, Goetschalckx M, McGinnis LF. Research on warehouse design and
performance evaluation: A comprehensive review. European Journal of Operational Research. 2010 Jun 16;203(3):539-49.
[5] Mourtzis D, Doukas M. The Evolution of Manufacturing Systems: From Craftsmanship to the. Handbook of Research on Design and Management of Lean Production Systems. 2014 Jan 31:1.
[6] Novák V, Krajčovič M. Warehouse Management System. TRANSCOM. 2011;23.
[7] Donnawitz, D. Industry 4.0 is transforming the warehouse sector, Perle, 2016. Available online: https://www.perle.com/articles/industry-4.0-is-transforming-the-warehouse-sector-40140747.shtml
[8] Fraga-Lamas P, Fernández-Caramés TM, Blanco-Novoa Ó, Vilar-Montesinos MA. A Review on Industrial Augmented Reality Systems for the Industry 4.0 Shipyard. IEEE Access. 2018;6:13358-75.
[9] Establish Inc./ Herbert W. Davis & Co. Logistic Cost and Service, CSCMP Global Conference; 2010.
[10] Kostrzewski M. Simulation method in research on material-flow in a warehouse. Logistics and Transport. 2014;21.
[11] Rouwenhorst B, Reuter B, Stockrahm V, van Houtum GJ, Mantel RJ, Zijm WH. Warehouse design and control: Framework and literature review. European Journal of Operational Research. 2000;122(3):515-33.
[12] Oxley B. Avoiding inferior design. Storage Handling and Distribution, 1994; 38(2): 28-30
[13] Rowley J. The principles of warehouse design. The Institute of Logistics & Transport, Corby. 2000.
[14] Gelders L, Ashayeri J, Van Looy P. A Simulation Package for Automated Warehouses. Material Flow. 1983;1(3).
[15] Hibino H, Fukuda Y, Fujii S, Kojima F, Mitsuyuki K, Yura Y. The development of an object-oriented simulation system based on the thought process of the manufacturing system design. International journal of production economics. 1999 Apr 20;60:343-51.
[16] Andriansyah R, De Koning WW, Jordan RM, Etman LF, Rooda JE. A process algebra based simulation model of a miniload-workstation order picking system. Computers in Industry. 2011 Apr 1;62(3):292-300.
[17] Rushton A, Croucher P, Baker P. The handbook of logistics and distribution management: Understanding the supply chain. Kogan Page Publishers; 2014 Jan 3.
[18] Baker P, Canessa M. Warehouse design: A structured approach. European Journal of Operational Research. 2009 Mar 1;193(2):425-36.
[19] Accorsi R, Manzini R, Maranesi F. A decision-support system for the design and management of warehousing systems. Computers in Industry. 2014;65(1):175-86.
[20] Mittal A, Krejci CC. A hybrid simulation model of inbound logistics operations in regional food supply systems. In Winter Simulation Conference (WSC), 2015:1549-1560
[21] Thomas LM, Meller RD. Developing design guidelines for a case-picking warehouse. International Journal of Production Economics. 2015 Dec 1;170:741-62.
[22] Mourtzis D, Papakostas N, Mavrikios D, Makris S, Alexopoulos K. The role of simulation in digital manufacturing: applications and outlook. International journal of computer integrated manufacturing. 2015 Jan 2;28(1):3-24.
[23] Rentzos L, Papanastasiou S, Papakostas N, Chryssolouris G. Augmented reality for human-based assembly: using product and process semantics. IFAC Proceedings Volumes. 2013 Jan 1;46(15):98-101
[24] Mourtzis D, Vlachou A, Zogopoulos V. Cloud-based augmented reality remote maintenance through shop-floor monitoring: a product-service system approach. Journal of Manufacturing Science and Engineering. 2017;139(6):061011.
[25] Mourtzis D, Vlachou E, Zogopoulos V, Fotini X. Integrated production and maintenance scheduling through machine monitoring and augmented reality: An Industry 4.0 approach. InIFIP International Conference on Advances in Production Management Systems 2017 Sep 3 (pp. 354-362). Springer, Cham.
[26] Efthymiou K, Sipsas K, Mourtzis D, Chryssolouris G. On knowledge reuse for manufacturing systems design and planning: A semantic technology approach. CIRP Journal of Manufacturing Science and Technology. 2015 Jan 1;8:1-1
PAPERmaking!
FROM THE PUBLISHERS OF PAPER TECHNOLOGY
Volume 5, Number 1, 2019
Page 1 of 16 Article 5 – Analysis
In-situ analysis of polyelectrolyte complexes by flow cytometry Anders Strand. Lari Vãhãsalo. Annika Ketola. Kristian Salminen. Elias Retulainen. Anna Sundberg. Polyelectrolyte complexes (PECs) from common papermaking additives were prepared at different cation/anion ratios, resulting in colloidal light scattering particles. The polycations were cationic starches and polyDADMACs, while the polyanions were different carboxymethyl celluloses. The PECs were studied by turbidity measurements, as well as by flow cytometry (FCM). Turbidity maxima were detected close to the theoretical neutralization point of the polycation and polyanion. The turbidity response of the PEC mixtures varied with polyelectrolyte charge density. The PECs were in most cases quite stable over 24 h, but certain combinations resulted in unstable particles over time. Flow cytometry of PECs revealed clear populations of hydrophilic particles. The light scattering properties of PECs in side direction (SSC) and forward direction (FSC) were recorded for the different PEC combinations. The determined FSC and SSC offered information about very different PEC properties, and a new term was suggested for better understanding the mechanisms behind PEC formation; FSC/SSC. It was suggested that the determined FSC/SSC values were connected to the structural density of different particles. The premise was tested by analyses of solid, dense particles as well as swollen, soft particles. In addition to this, the hydrophobicity of PECs was determined by FCM. It was seen that the PECs were quite hydrophilic overall and that the measured hydrophobicities were lowest around the theoretical point of neutralization. Finally, the behavior of a coagulating PEC mixture as a function of contact time was studied with FCM. Contact information: A. Strand & A. Sundberg, The Laboratory of Wood and Paper Chemistry, Åbo Akademi University, Porthaninkatu 3, 20500 Turku, Finland e-mail: [email protected] & [email protected] L. Vãhãsalo, CH Bioforce, Raisio, Finland e-mail: [email protected] A. Ketola, K. Salminen & E. Retulainen, VTT, Koivurannantie 1, 40400 Jyva¨skyla¨, Finland e-mail: [email protected] , [email protected] & [email protected] Cellulose (2018) 25:3781–3795. https://doi.org/10.1007/s10570-018-1832-1
The Paper Industry Technical Association (PITA) is an independent organisation which operates for the general benefit of its members – both individual and corporate – dedicated to promoting and improving the technical and scientific knowledge of those working in the UK pulp and paper industry. Formed in 1960, it serves the Industry, both manufacturers and suppliers, by providing a forum for members to meet and network; it organises visits, conferences and training seminars that cover all aspects of papermaking science. It also publishes the prestigious journal Paper Technology International and the PITA Annual Review, both sent free to members, and a range of other technical publications which include conference proceedings and the acclaimed Essential
Guide to Aqueous Coating.
ORIGINAL PAPER
In-situ analysis of polyelectrolyte complexes by flowcytometry
Anders Strand . Lari Vahasalo . Annika Ketola . Kristian Salminen .
Elias Retulainen . Anna Sundberg
Received: 22 December 2017 / Accepted: 5 May 2018 / Published online: 10 May 2018
� The Author(s) 2018
Abstract Polyelectrolyte complexes (PECs) from
common papermaking additives were prepared at
different cation/anion ratios, resulting in colloidal
light scattering particles. The polycations were
cationic starches and polyDADMACs, while the
polyanions were different carboxymethyl celluloses.
The PECs were studied by turbidity measurements, as
well as by flow cytometry (FCM). Turbidity maxima
were detected close to the theoretical neutralization
point of the polycation and polyanion. The turbidity
response of the PEC mixtures varied with polyelec-
trolyte charge density. The PECs were in most cases
quite stable over 24 h, but certain combinations
resulted in unstable particles over time. Flow cytom-
etry of PECs revealed clear populations of hydrophilic
particles. The light scattering properties of PECs in
side direction (SSC) and forward direction (FSC) were
recorded for the different PEC combinations. The
determined FSC and SSC offered information about
very different PEC properties, and a new term was
suggested for better understanding the mechanisms
behind PEC formation; FSC/SSC. It was suggested
that the determined FSC/SSC values were connected
to the structural density of different particles. The
premise was tested by analyses of solid, dense
particles as well as swollen, soft particles. In addition
to this, the hydrophobicity of PECs was determined by
FCM. It was seen that the PECs were quite hydrophilic
overall and that the measured hydrophobicities were
lowest around the theoretical point of neutralization.
Finally, the behavior of a coagulating PEC mixture as
a function of contact time was studied with FCM.
Keywords Polyelectrolyte complex � Cationicstarch � CMC � Flow cytometry � Light scattering �Hydrophobicity � Structural density
Introduction
Lately, materials research has focused more and more
on multi-composites. The potential of combining two
or more desirable properties by tailoring the material
A. Strand (&) � A. SundbergThe Laboratory of Wood and Paper Chemistry, Abo
Akademi University, Porthaninkatu 3, 20500 Turku,
Finland
e-mail: [email protected]
A. Sundberg
e-mail: [email protected]
L. Vahasalo
CH Bioforce, Raisio, Finland
e-mail: [email protected]
A. Ketola � K. Salminen � E. RetulainenVTT, Koivurannantie 1, 40400 Jyvaskyla, Finland
e-mail: [email protected]
K. Salminen
e-mail: [email protected]
E. Retulainen
e-mail: [email protected]
123
Cellulose (2018) 25:3781–3795
https://doi.org/10.1007/s10570-018-1832-1
opens up a vast array of new possibilities (Decher
1997; de Vasconcelos et al. 2006). The use of
polyelectrolyte complexes (PECs), or polyelectrolyte
multilayers (PEMs) have received quite a lot of
attention in the field of research (Philipp et al. 1989;
Dautzenberg 1997; Decher 1997; Dautzenberg and
Karibyants 1999). Multi-layered structures on surfaces
can be formed from a wide variety of components,
either from solutions or dispersions.
The most common approach for PEC or PEM
formation is the electrostatic attraction between
oppositely charged groups. The formation of PECs is
driven by the increase in entropy when counter ions
are liberated from the oppositely charged polyelec-
trolytes during associative phase separation into
colloidal particles (Piculell and Lindman 1992;
Kekkonen et al. 2001). Strong ionic binding between
the opposite charges of the polyelectrolytes results in
kinetically frozen structures (Dautzenberg and Kar-
ibyants 1999). It has been reported that the core of
PEC particles consists of a neutralized polyelectrolyte
core, while the outer shell consists mainly of excess
polyelectrolyte, which stabilizes the colloids against
aggregation (Dautzenberg and Karibyants 1999).
The use of PECs and PEMs have also found their
way into the field of pulping and papermaking
(Petzold and Lunkwitz 1995; Petzold et al. 1996;
Gernandt et al. 2003; Hubbe et al. 2003, 2005;
Gardlund et al. 2005; Lofton et al. 2005; Torgnysdot-
ter and Wagberg 2006; Myllytie et al. 2009; Ren-
neckar and Zhou 2009; Lin and Renneckar 2011;
Granberg et al. 2012; Ankerfors and Wagberg 2013;
Marais et al. 2014). The use of PECs and PEMs in
papermaking is somewhat expected, since the proper-
ties of paper and retention of fillers commonly have
been tailored by additions of polyelectrolytes, in single
or dual systems, for a long time (Hubbe 2006).
Additionally, surfaces of pulp fibers carry anionic
charges that are convenient anchor points for poly-
electrolytes and PECs. In papermaking applications,
the size of the PECs can be tailored to exceed the
average pore radius of pulp fibers, to ensure that the
PECs are retained mainly on fiber surfaces. In
papermaking, surface-specific strengthening agents
are especially interesting, since the additive should be
adsorbed within the cross-over region of two fibers in
order to enhance paper strength (Stratton 1989).
The properties and behavior of PECs in suspension
has previously been studied by measurements of
turbidity, static light scattering, dynamic light scatter-
ing, polyelectrolyte titration, viscosity, surface charge
analysis, FTIR spectroscopy, and electrophoretic
mobility (Buchhammer et al. 1995; Dautzenberg
1997; Dautzenberg and Karibyants 1999; Dragan
and Cristea 2001; Kekkonen et al. 2001; Hubbe et al.
2005; de Vasconcelos et al. 2006). It has been reported
that the formation of PECs is sensitive towards the
nature of the cationic polyelectrolyte (Hubbe et al.
2005). It is known that the formation of PECs is path
dependent, which means that all aspects of the PEC
formation will influence the result (Kotz 1993; Feng
et al. 2008). Due to the wide variety of available
polyelectrolytes, additional information about their
interactions and the complexes they form is still
needed.
Adsorption experiments and modeling have been
used to gain information about formed layers of
polyelectrolytes (Van de Steeg et al. 1992; Fleer et al.
1993). Adsorption studies using QCM-D and SPR
techniques have revealed that polyelectrolytes adsorb
differently depending on their chemical properties,
such as molar mass and charge density, onto model
cellulose or silica surfaces (Tammelin et al. 2004;
Kontturi et al. 2008; Strand et al. 2017). A polyelec-
trolyte with a high charge density will adsorb as a
stiffer and more rigid layer, compared to a polyelec-
trolyte with a low charge density (Kontturi et al. 2008).
The charge density of the surface itself in adsorption
studies is also of great importance, which was shown
by adsorption experiments onto cellulose and silica
surfaces. While the QCM-D and SPRmethods provide
information about adsorption of polyelectrolytes onto
surfaces, the behavior of unretained polycations and
polyanions is an open question. An analysis method
that could bridge the gap between the previously used
analyses for PECs and the techniques used in adsorp-
tion studies would be helpful for gaining additional
insight into the behavior of polyelectrolyte mixtures.
Flow cytometry (FCM) is a relatively new tech-
nique in the field of pulping and papermaking. The
technique was adapted from medical science, where it
is used mainly for the counting of cells (Shapiro 2003).
FCM also measures the light scattering properties of
particles in suspension in forward and side direction.
Further, FCM can be used to measure the fluorescence
of particles at different wavelengths, which is very
useful when combined with addition of selective dyes
to samples. In the field of pulping and papermaking,
123
3782 Cellulose (2018) 25:3781–3795
FCM has so far been used to analyze colloidal wood
pitch, bacteria, coated broke, precipitated oxalate, and
filler particles (Vahasalo et al. 2003; Lindberg et al.
2004; Vahasalo and Holmbom 2005; Strand et al.
2013; Haara et al. 2014). With FCM techniques, it is
possible to analyze particles in suspension directly
without complicated pre-treatments. The strengths of
the FCM technique are short analysis times, as well as
insight into the behavior and interactions of particle
populations in aqueous suspension.
The aim of this work was to gain additional
knowledge about PECs formed from commonly used
papermaking additives, by analysis with flow cytom-
etry. The light scattering properties of these particles
might reveal important information about their prop-
erties and structure. The additives chosen for the study
were different cationic starches, polyDADMAC and
carboxymethyl cellulose (CMC). Cationic starches are
the most commonly used additive in papermaking
(Fornue et al. 2011). Studies have shown that CMC
greatly increases both the strength and stiffness of
paper, which makes it a very interesting papermaking
additive (Beghello et al. 1997; Strand et al. 2017). An
additional aim of this work was to determine the
hydrophobicity of PECs, and to study the time
dependent stability of different PEC mixtures, since
contact times between polyelectrolytes in papermak-
ing can vary between fractions of a second to several
hours.
Materials and methods
Materials
Three different cationic starches were received from
Chemigate as pre-boiled slurries; Raifix 01015 SW,
Raifix 25035, and Raisabond 15. The cationic starch
slurries were diluted with distilled water to 0.1%
solutions under agitation. Sodium carboxymethyl
cellulose (CMC), Mw 700 kDa and DS 0.80–0.95,
was obtained from Aldrich as dry powder. Addition-
ally, three 250 kDa CMCs of varying DS were
obtained from Acros Organics as dry powders. The
different CMCs were dissolved in distilled water to a
concentration of 0.1% with the aid of agitation and
boiling, until clearly dissolved. Two different polydi-
allyldimethylammonium chloride (PolyDADMAC)
solutions were obtained from Aldrich. The
polyDADMACs were received as viscous solutions
with dry contents of about 26% and molar masses of
100–200 and 200–350 kDa, respectively. The poly-
DADMAC was diluted with distilled water to a
concentration of 0.1% under agitation. Poly(vinyl
sulfate) potassium salt (KPVS) was obtained from
Wako. The KPVS salt was dissolved in deionized
water under agitation. Hexadimethrine bromide (poly-
brene) was obtained from Sigma. The polybrene was
dissolved in deionized water under agitation. Nile red
was obtained in dry form from from Sigma-Aldrich,
USA. The Nile red was dissolved in methanol to a
concentration of 10 ppm.
A variety of commercially available mineral par-
ticles was obtained. Prismatic precipitated calcium
carbonate (PCC p) was obtained from Specialty
Minerals, New York, USA, as a slurry, which was
diluted with pH-adjusted distilled water (pH 8).
Scalenohedral precipitated calcium carbonate (PCC
s) was obtained from Specialty Minerals Nordic,
Anjalankoski, Finland as a slurry, which was diluted
with pH-adjusted distilled water (pH 8). Commer-
cially available ground calcium carbonate (GCC) was
obtained as a slurry, and was diluted with distilled
water. Kaolin was obtained from Imerys Minerals, Par
Cornwall, UK, in powder form and was dispersed in
distilled water. Three different grades of commercially
available bentonites were obtained from Clariant
Produkte, Germany, and dispersed in distilled water.
Cellulose nanocrystals (CNC) were prepared by
H2SO4 hydrolysis of birch kraft pulp, with subsequent
purification steps (Beck-Candanedo et al. 2005).
Cellulose nanofibrils (CNF) were produced by
TEMPO oxidation of birch kraft pulp followed by
mechanical defibration (Shibata and Isogai 2003).
Methods
Charge titration
The anionic or cationic charge of the different
polyelectrolytes was analyzed by polyelectrolyte
titration with a particle charge detector (Mutek PCD
03, Mutek Analytic GmbH, Germany; BTG, Switzer-
land) coupled to a titration device (736 GP Titrino,
Metrohm Ltd., Switzerland). The cationic polyelec-
trolytes were titrated with KPVS, and the anionic
polyelectrolytes were titrated with polybrene with an
Mw of approximately 8 kDa (Sundberg et al. 2000).
123
Cellulose (2018) 25:3781–3795 3783
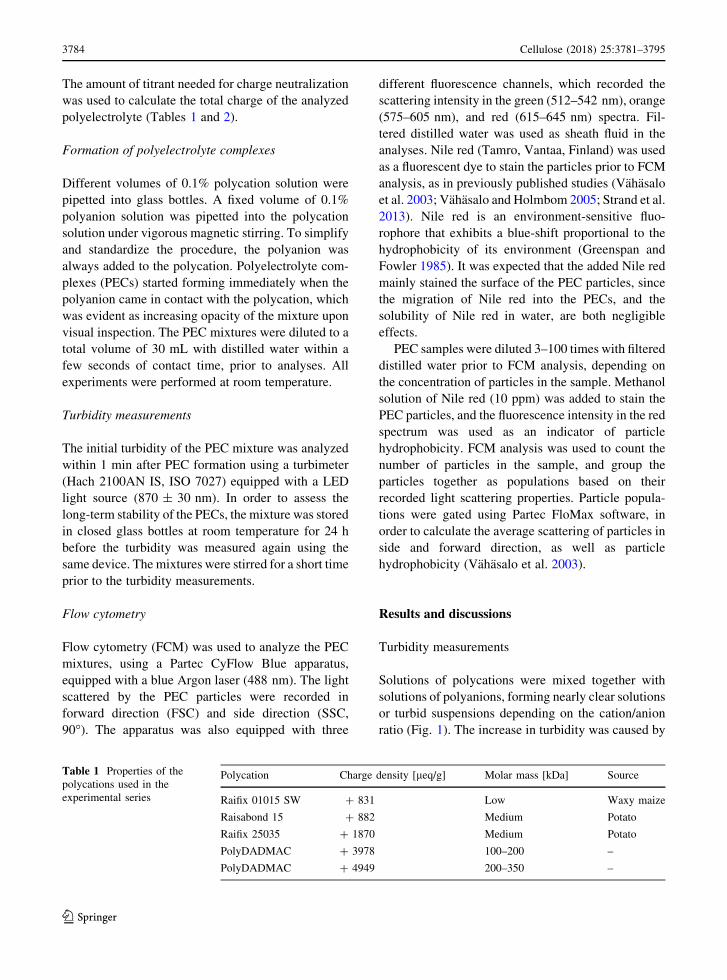
The amount of titrant needed for charge neutralization
was used to calculate the total charge of the analyzed
polyelectrolyte (Tables 1 and 2).
Formation of polyelectrolyte complexes
Different volumes of 0.1% polycation solution were
pipetted into glass bottles. A fixed volume of 0.1%
polyanion solution was pipetted into the polycation
solution under vigorous magnetic stirring. To simplify
and standardize the procedure, the polyanion was
always added to the polycation. Polyelectrolyte com-
plexes (PECs) started forming immediately when the
polyanion came in contact with the polycation, which
was evident as increasing opacity of the mixture upon
visual inspection. The PEC mixtures were diluted to a
total volume of 30 mL with distilled water within a
few seconds of contact time, prior to analyses. All
experiments were performed at room temperature.
Turbidity measurements
The initial turbidity of the PEC mixture was analyzed
within 1 min after PEC formation using a turbimeter
(Hach 2100AN IS, ISO 7027) equipped with a LED
light source (870 ± 30 nm). In order to assess the
long-term stability of the PECs, the mixture was stored
in closed glass bottles at room temperature for 24 h
before the turbidity was measured again using the
same device. The mixtures were stirred for a short time
prior to the turbidity measurements.
Flow cytometry
Flow cytometry (FCM) was used to analyze the PEC
mixtures, using a Partec CyFlow Blue apparatus,
equipped with a blue Argon laser (488 nm). The light
scattered by the PEC particles were recorded in
forward direction (FSC) and side direction (SSC,
90�). The apparatus was also equipped with three
different fluorescence channels, which recorded the
scattering intensity in the green (512–542 nm), orange
(575–605 nm), and red (615–645 nm) spectra. Fil-
tered distilled water was used as sheath fluid in the
analyses. Nile red (Tamro, Vantaa, Finland) was used
as a fluorescent dye to stain the particles prior to FCM
analysis, as in previously published studies (Vahasalo
et al. 2003; Vahasalo and Holmbom 2005; Strand et al.
2013). Nile red is an environment-sensitive fluo-
rophore that exhibits a blue-shift proportional to the
hydrophobicity of its environment (Greenspan and
Fowler 1985). It was expected that the added Nile red
mainly stained the surface of the PEC particles, since
the migration of Nile red into the PECs, and the
solubility of Nile red in water, are both negligible
effects.
PEC samples were diluted 3–100 times with filtered
distilled water prior to FCM analysis, depending on
the concentration of particles in the sample. Methanol
solution of Nile red (10 ppm) was added to stain the
PEC particles, and the fluorescence intensity in the red
spectrum was used as an indicator of particle
hydrophobicity. FCM analysis was used to count the
number of particles in the sample, and group the
particles together as populations based on their
recorded light scattering properties. Particle popula-
tions were gated using Partec FloMax software, in
order to calculate the average scattering of particles in
side and forward direction, as well as particle
hydrophobicity (Vahasalo et al. 2003).
Results and discussions
Turbidity measurements
Solutions of polycations were mixed together with
solutions of polyanions, forming nearly clear solutions
or turbid suspensions depending on the cation/anion
ratio (Fig. 1). The increase in turbidity was caused by
Table 1 Properties of the
polycations used in the
experimental series
Polycation Charge density [leq/g] Molar mass [kDa] Source
Raifix 01015 SW ? 831 Low Waxy maize
Raisabond 15 ? 882 Medium Potato
Raifix 25035 ? 1870 Medium Potato
PolyDADMAC ? 3978 100–200 –
PolyDADMAC ? 4949 200–350 –
123
3784 Cellulose (2018) 25:3781–3795
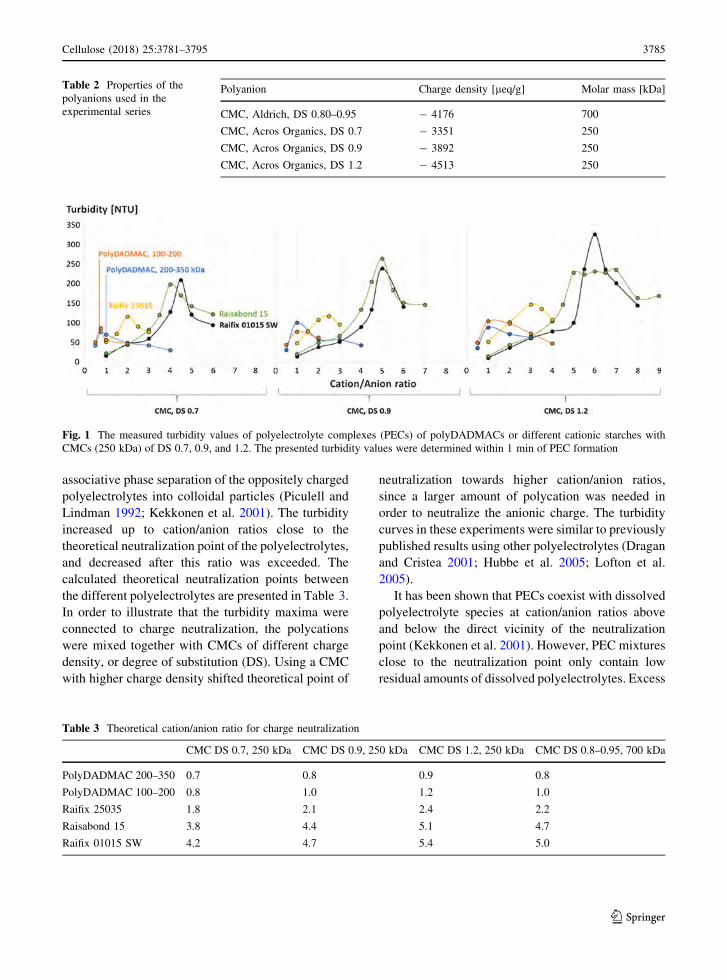
associative phase separation of the oppositely charged
polyelectrolytes into colloidal particles (Piculell and
Lindman 1992; Kekkonen et al. 2001). The turbidity
increased up to cation/anion ratios close to the
theoretical neutralization point of the polyelectrolytes,
and decreased after this ratio was exceeded. The
calculated theoretical neutralization points between
the different polyelectrolytes are presented in Table 3.
In order to illustrate that the turbidity maxima were
connected to charge neutralization, the polycations
were mixed together with CMCs of different charge
density, or degree of substitution (DS). Using a CMC
with higher charge density shifted theoretical point of
neutralization towards higher cation/anion ratios,
since a larger amount of polycation was needed in
order to neutralize the anionic charge. The turbidity
curves in these experiments were similar to previously
published results using other polyelectrolytes (Dragan
and Cristea 2001; Hubbe et al. 2005; Lofton et al.
2005).
It has been shown that PECs coexist with dissolved
polyelectrolyte species at cation/anion ratios above
and below the direct vicinity of the neutralization
point (Kekkonen et al. 2001). However, PEC mixtures
close to the neutralization point only contain low
residual amounts of dissolved polyelectrolytes. Excess
Table 2 Properties of the
polyanions used in the
experimental series
Polyanion Charge density [leq/g] Molar mass [kDa]
CMC, Aldrich, DS 0.80–0.95 - 4176 700
CMC, Acros Organics, DS 0.7 - 3351 250
CMC, Acros Organics, DS 0.9 - 3892 250
CMC, Acros Organics, DS 1.2 - 4513 250
Fig. 1 The measured turbidity values of polyelectrolyte complexes (PECs) of polyDADMACs or different cationic starches with
CMCs (250 kDa) of DS 0.7, 0.9, and 1.2. The presented turbidity values were determined within 1 min of PEC formation
Table 3 Theoretical cation/anion ratio for charge neutralization
CMC DS 0.7, 250 kDa CMC DS 0.9, 250 kDa CMC DS 1.2, 250 kDa CMC DS 0.8–0.95, 700 kDa
PolyDADMAC 200–350 0.7 0.8 0.9 0.8
PolyDADMAC 100–200 0.8 1.0 1.2 1.0
Raifix 25035 1.8 2.1 2.4 2.2
Raisabond 15 3.8 4.4 5.1 4.7
Raifix 01015 SW 4.2 4.7 5.4 5.0
123
Cellulose (2018) 25:3781–3795 3785
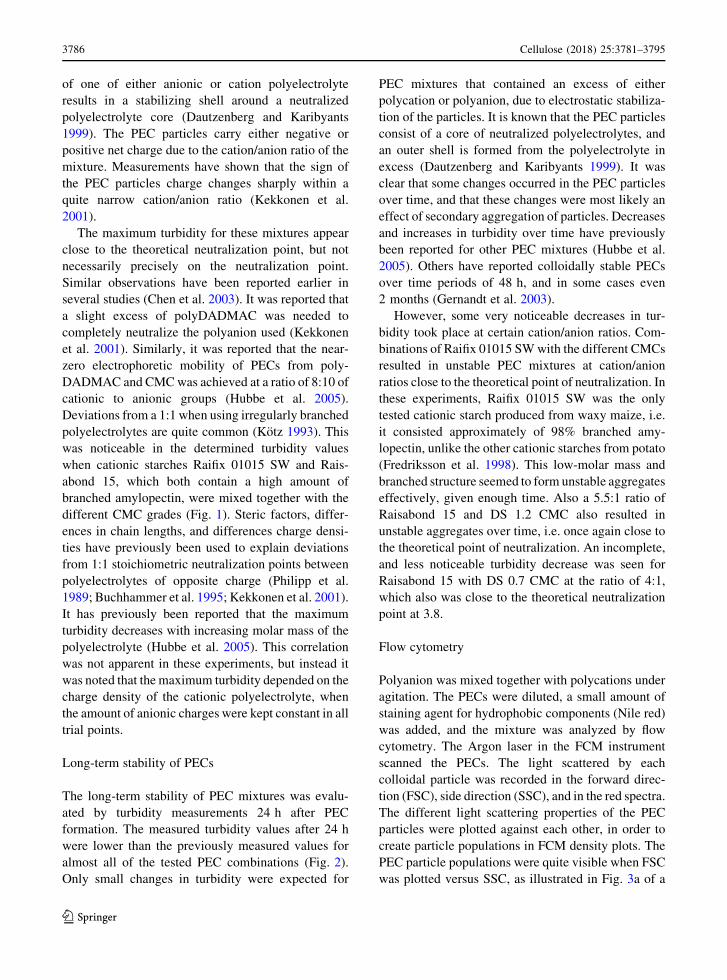
of one of either anionic or cation polyelectrolyte
results in a stabilizing shell around a neutralized
polyelectrolyte core (Dautzenberg and Karibyants
1999). The PEC particles carry either negative or
positive net charge due to the cation/anion ratio of the
mixture. Measurements have shown that the sign of
the PEC particles charge changes sharply within a
quite narrow cation/anion ratio (Kekkonen et al.
2001).
The maximum turbidity for these mixtures appear
close to the theoretical neutralization point, but not
necessarily precisely on the neutralization point.
Similar observations have been reported earlier in
several studies (Chen et al. 2003). It was reported that
a slight excess of polyDADMAC was needed to
completely neutralize the polyanion used (Kekkonen
et al. 2001). Similarly, it was reported that the near-
zero electrophoretic mobility of PECs from poly-
DADMAC and CMCwas achieved at a ratio of 8:10 of
cationic to anionic groups (Hubbe et al. 2005).
Deviations from a 1:1 when using irregularly branched
polyelectrolytes are quite common (Kotz 1993). This
was noticeable in the determined turbidity values
when cationic starches Raifix 01015 SW and Rais-
abond 15, which both contain a high amount of
branched amylopectin, were mixed together with the
different CMC grades (Fig. 1). Steric factors, differ-
ences in chain lengths, and differences charge densi-
ties have previously been used to explain deviations
from 1:1 stoichiometric neutralization points between
polyelectrolytes of opposite charge (Philipp et al.
1989; Buchhammer et al. 1995; Kekkonen et al. 2001).
It has previously been reported that the maximum
turbidity decreases with increasing molar mass of the
polyelectrolyte (Hubbe et al. 2005). This correlation
was not apparent in these experiments, but instead it
was noted that the maximum turbidity depended on the
charge density of the cationic polyelectrolyte, when
the amount of anionic charges were kept constant in all
trial points.
Long-term stability of PECs
The long-term stability of PEC mixtures was evalu-
ated by turbidity measurements 24 h after PEC
formation. The measured turbidity values after 24 h
were lower than the previously measured values for
almost all of the tested PEC combinations (Fig. 2).
Only small changes in turbidity were expected for
PEC mixtures that contained an excess of either
polycation or polyanion, due to electrostatic stabiliza-
tion of the particles. It is known that the PEC particles
consist of a core of neutralized polyelectrolytes, and
an outer shell is formed from the polyelectrolyte in
excess (Dautzenberg and Karibyants 1999). It was
clear that some changes occurred in the PEC particles
over time, and that these changes were most likely an
effect of secondary aggregation of particles. Decreases
and increases in turbidity over time have previously
been reported for other PEC mixtures (Hubbe et al.
2005). Others have reported colloidally stable PECs
over time periods of 48 h, and in some cases even
2 months (Gernandt et al. 2003).
However, some very noticeable decreases in tur-
bidity took place at certain cation/anion ratios. Com-
binations of Raifix 01015 SWwith the different CMCs
resulted in unstable PEC mixtures at cation/anion
ratios close to the theoretical point of neutralization. In
these experiments, Raifix 01015 SW was the only
tested cationic starch produced from waxy maize, i.e.
it consisted approximately of 98% branched amy-
lopectin, unlike the other cationic starches from potato
(Fredriksson et al. 1998). This low-molar mass and
branched structure seemed to form unstable aggregates
effectively, given enough time. Also a 5.5:1 ratio of
Raisabond 15 and DS 1.2 CMC also resulted in
unstable aggregates over time, i.e. once again close to
the theoretical point of neutralization. An incomplete,
and less noticeable turbidity decrease was seen for
Raisabond 15 with DS 0.7 CMC at the ratio of 4:1,
which also was close to the theoretical neutralization
point at 3.8.
Flow cytometry
Polyanion was mixed together with polycations under
agitation. The PECs were diluted, a small amount of
staining agent for hydrophobic components (Nile red)
was added, and the mixture was analyzed by flow
cytometry. The Argon laser in the FCM instrument
scanned the PECs. The light scattered by each
colloidal particle was recorded in the forward direc-
tion (FSC), side direction (SSC), and in the red spectra.
The different light scattering properties of the PEC
particles were plotted against each other, in order to
create particle populations in FCM density plots. The
PEC particle populations were quite visible when FSC
was plotted versus SSC, as illustrated in Fig. 3a of a
123
3786 Cellulose (2018) 25:3781–3795
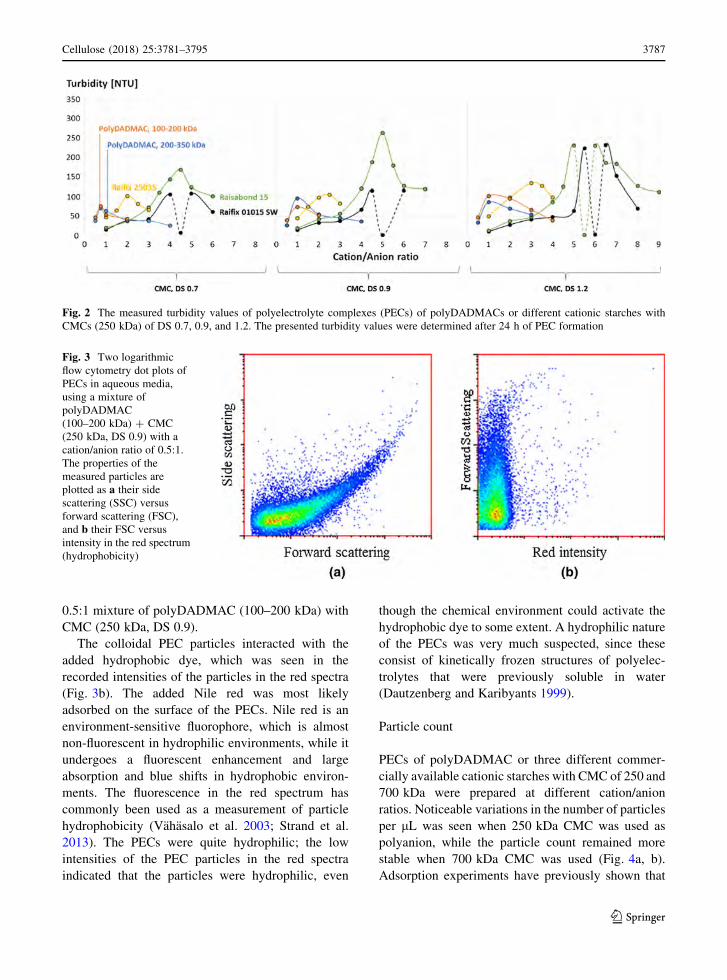
0.5:1 mixture of polyDADMAC (100–200 kDa) with
CMC (250 kDa, DS 0.9).
The colloidal PEC particles interacted with the
added hydrophobic dye, which was seen in the
recorded intensities of the particles in the red spectra
(Fig. 3b). The added Nile red was most likely
adsorbed on the surface of the PECs. Nile red is an
environment-sensitive fluorophore, which is almost
non-fluorescent in hydrophilic environments, while it
undergoes a fluorescent enhancement and large
absorption and blue shifts in hydrophobic environ-
ments. The fluorescence in the red spectrum has
commonly been used as a measurement of particle
hydrophobicity (Vahasalo et al. 2003; Strand et al.
2013). The PECs were quite hydrophilic; the low
intensities of the PEC particles in the red spectra
indicated that the particles were hydrophilic, even
though the chemical environment could activate the
hydrophobic dye to some extent. A hydrophilic nature
of the PECs was very much suspected, since these
consist of kinetically frozen structures of polyelec-
trolytes that were previously soluble in water
(Dautzenberg and Karibyants 1999).
Particle count
PECs of polyDADMAC or three different commer-
cially available cationic starches with CMC of 250 and
700 kDa were prepared at different cation/anion
ratios. Noticeable variations in the number of particles
per lL was seen when 250 kDa CMC was used as
polyanion, while the particle count remained more
stable when 700 kDa CMC was used (Fig. 4a, b).
Adsorption experiments have previously shown that
Fig. 2 The measured turbidity values of polyelectrolyte complexes (PECs) of polyDADMACs or different cationic starches with
CMCs (250 kDa) of DS 0.7, 0.9, and 1.2. The presented turbidity values were determined after 24 h of PEC formation
Fig. 3 Two logarithmic
flow cytometry dot plots of
PECs in aqueous media,
using a mixture of
polyDADMAC
(100–200 kDa) ? CMC
(250 kDa, DS 0.9) with a
cation/anion ratio of 0.5:1.
The properties of the
measured particles are
plotted as a their side
scattering (SSC) versus
forward scattering (FSC),
and b their FSC versus
intensity in the red spectrum
(hydrophobicity)
123
Cellulose (2018) 25:3781–3795 3787
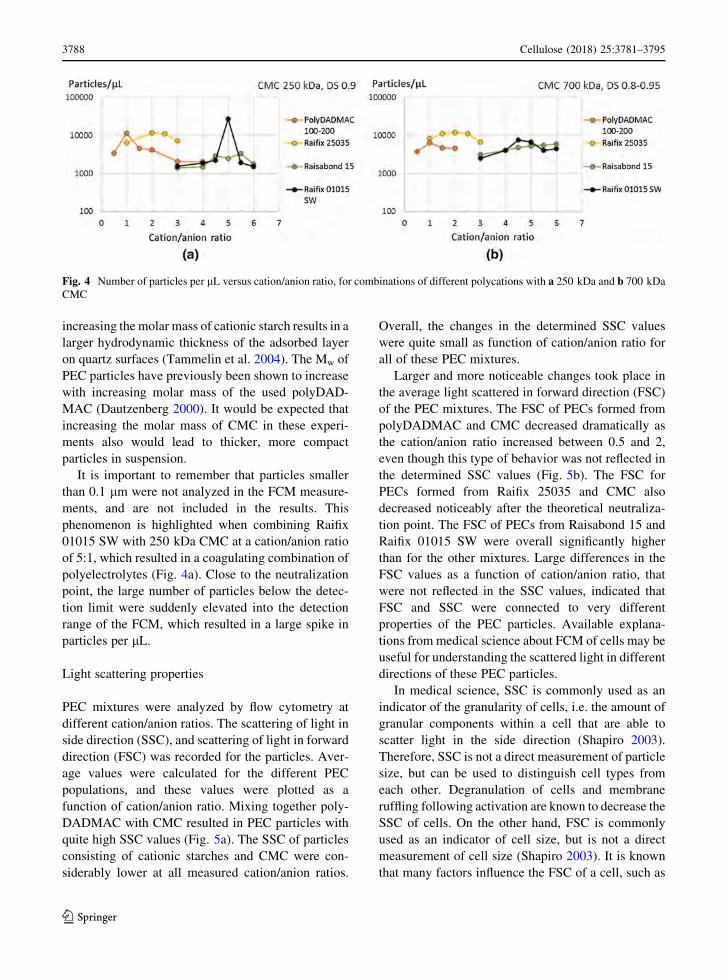
increasing themolar mass of cationic starch results in a
larger hydrodynamic thickness of the adsorbed layer
on quartz surfaces (Tammelin et al. 2004). The Mw of
PEC particles have previously been shown to increase
with increasing molar mass of the used polyDAD-
MAC (Dautzenberg 2000). It would be expected that
increasing the molar mass of CMC in these experi-
ments also would lead to thicker, more compact
particles in suspension.
It is important to remember that particles smaller
than 0.1 lm were not analyzed in the FCM measure-
ments, and are not included in the results. This
phenomenon is highlighted when combining Raifix
01015 SW with 250 kDa CMC at a cation/anion ratio
of 5:1, which resulted in a coagulating combination of
polyelectrolytes (Fig. 4a). Close to the neutralization
point, the large number of particles below the detec-
tion limit were suddenly elevated into the detection
range of the FCM, which resulted in a large spike in
particles per lL.
Light scattering properties
PEC mixtures were analyzed by flow cytometry at
different cation/anion ratios. The scattering of light in
side direction (SSC), and scattering of light in forward
direction (FSC) was recorded for the particles. Aver-
age values were calculated for the different PEC
populations, and these values were plotted as a
function of cation/anion ratio. Mixing together poly-
DADMAC with CMC resulted in PEC particles with
quite high SSC values (Fig. 5a). The SSC of particles
consisting of cationic starches and CMC were con-
siderably lower at all measured cation/anion ratios.
Overall, the changes in the determined SSC values
were quite small as function of cation/anion ratio for
all of these PEC mixtures.
Larger and more noticeable changes took place in
the average light scattered in forward direction (FSC)
of the PEC mixtures. The FSC of PECs formed from
polyDADMAC and CMC decreased dramatically as
the cation/anion ratio increased between 0.5 and 2,
even though this type of behavior was not reflected in
the determined SSC values (Fig. 5b). The FSC for
PECs formed from Raifix 25035 and CMC also
decreased noticeably after the theoretical neutraliza-
tion point. The FSC of PECs from Raisabond 15 and
Raifix 01015 SW were overall significantly higher
than for the other mixtures. Large differences in the
FSC values as a function of cation/anion ratio, that
were not reflected in the SSC values, indicated that
FSC and SSC were connected to very different
properties of the PEC particles. Available explana-
tions from medical science about FCM of cells may be
useful for understanding the scattered light in different
directions of these PEC particles.
In medical science, SSC is commonly used as an
indicator of the granularity of cells, i.e. the amount of
granular components within a cell that are able to
scatter light in the side direction (Shapiro 2003).
Therefore, SSC is not a direct measurement of particle
size, but can be used to distinguish cell types from
each other. Degranulation of cells and membrane
ruffling following activation are known to decrease the
SSC of cells. On the other hand, FSC is commonly
used as an indicator of cell size, but is not a direct
measurement of cell size (Shapiro 2003). It is known
that many factors influence the FSC of a cell, such as
Fig. 4 Number of particles per lL versus cation/anion ratio, for combinations of different polycations with a 250 kDa and b 700 kDa
CMC
123
3788 Cellulose (2018) 25:3781–3795
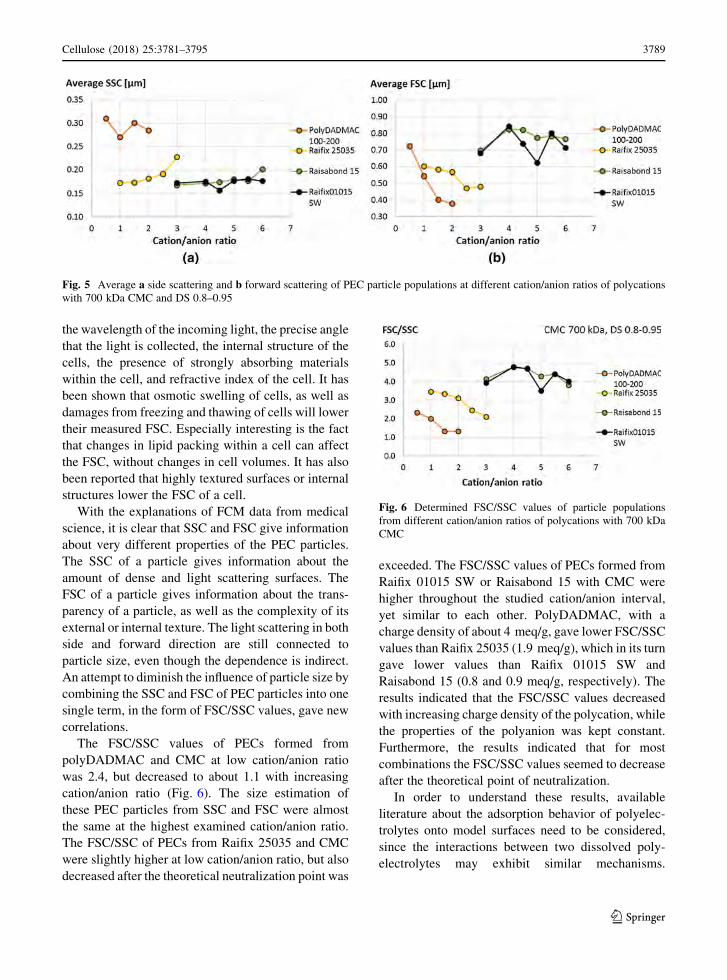
the wavelength of the incoming light, the precise angle
that the light is collected, the internal structure of the
cells, the presence of strongly absorbing materials
within the cell, and refractive index of the cell. It has
been shown that osmotic swelling of cells, as well as
damages from freezing and thawing of cells will lower
their measured FSC. Especially interesting is the fact
that changes in lipid packing within a cell can affect
the FSC, without changes in cell volumes. It has also
been reported that highly textured surfaces or internal
structures lower the FSC of a cell.
With the explanations of FCM data from medical
science, it is clear that SSC and FSC give information
about very different properties of the PEC particles.
The SSC of a particle gives information about the
amount of dense and light scattering surfaces. The
FSC of a particle gives information about the trans-
parency of a particle, as well as the complexity of its
external or internal texture. The light scattering in both
side and forward direction are still connected to
particle size, even though the dependence is indirect.
An attempt to diminish the influence of particle size by
combining the SSC and FSC of PEC particles into one
single term, in the form of FSC/SSC values, gave new
correlations.
The FSC/SSC values of PECs formed from
polyDADMAC and CMC at low cation/anion ratio
was 2.4, but decreased to about 1.1 with increasing
cation/anion ratio (Fig. 6). The size estimation of
these PEC particles from SSC and FSC were almost
the same at the highest examined cation/anion ratio.
The FSC/SSC of PECs from Raifix 25035 and CMC
were slightly higher at low cation/anion ratio, but also
decreased after the theoretical neutralization point was
exceeded. The FSC/SSC values of PECs formed from
Raifix 01015 SW or Raisabond 15 with CMC were
higher throughout the studied cation/anion interval,
yet similar to each other. PolyDADMAC, with a
charge density of about 4 meq/g, gave lower FSC/SSC
values than Raifix 25035 (1.9 meq/g), which in its turn
gave lower values than Raifix 01015 SW and
Raisabond 15 (0.8 and 0.9 meq/g, respectively). The
results indicated that the FSC/SSC values decreased
with increasing charge density of the polycation, while
the properties of the polyanion was kept constant.
Furthermore, the results indicated that for most
combinations the FSC/SSC values seemed to decrease
after the theoretical point of neutralization.
In order to understand these results, available
literature about the adsorption behavior of polyelec-
trolytes onto model surfaces need to be considered,
since the interactions between two dissolved poly-
electrolytes may exhibit similar mechanisms.
Fig. 5 Average a side scattering and b forward scattering of PEC particle populations at different cation/anion ratios of polycations
with 700 kDa CMC and DS 0.8–0.95
Fig. 6 Determined FSC/SSC values of particle populations
from different cation/anion ratios of polycations with 700 kDa
CMC
123
Cellulose (2018) 25:3781–3795 3789
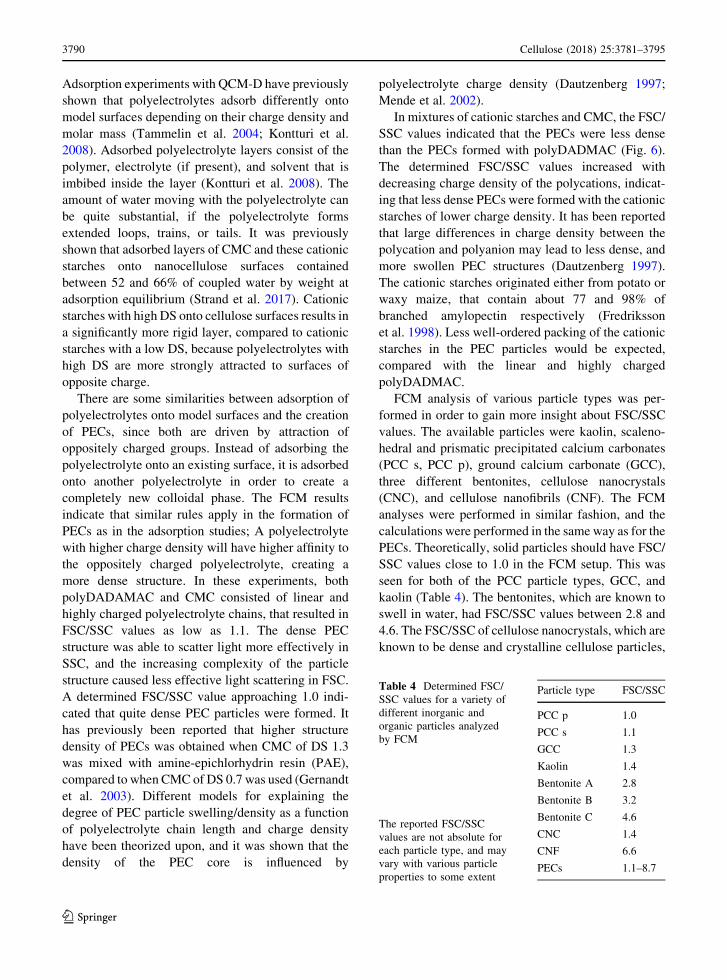
Adsorption experiments with QCM-D have previously
shown that polyelectrolytes adsorb differently onto
model surfaces depending on their charge density and
molar mass (Tammelin et al. 2004; Kontturi et al.
2008). Adsorbed polyelectrolyte layers consist of the
polymer, electrolyte (if present), and solvent that is
imbibed inside the layer (Kontturi et al. 2008). The
amount of water moving with the polyelectrolyte can
be quite substantial, if the polyelectrolyte forms
extended loops, trains, or tails. It was previously
shown that adsorbed layers of CMC and these cationic
starches onto nanocellulose surfaces contained
between 52 and 66% of coupled water by weight at
adsorption equilibrium (Strand et al. 2017). Cationic
starches with high DS onto cellulose surfaces results in
a significantly more rigid layer, compared to cationic
starches with a low DS, because polyelectrolytes with
high DS are more strongly attracted to surfaces of
opposite charge.
There are some similarities between adsorption of
polyelectrolytes onto model surfaces and the creation
of PECs, since both are driven by attraction of
oppositely charged groups. Instead of adsorbing the
polyelectrolyte onto an existing surface, it is adsorbed
onto another polyelectrolyte in order to create a
completely new colloidal phase. The FCM results
indicate that similar rules apply in the formation of
PECs as in the adsorption studies; A polyelectrolyte
with higher charge density will have higher affinity to
the oppositely charged polyelectrolyte, creating a
more dense structure. In these experiments, both
polyDADAMAC and CMC consisted of linear and
highly charged polyelectrolyte chains, that resulted in
FSC/SSC values as low as 1.1. The dense PEC
structure was able to scatter light more effectively in
SSC, and the increasing complexity of the particle
structure caused less effective light scattering in FSC.
A determined FSC/SSC value approaching 1.0 indi-
cated that quite dense PEC particles were formed. It
has previously been reported that higher structure
density of PECs was obtained when CMC of DS 1.3
was mixed with amine-epichlorhydrin resin (PAE),
compared to when CMC of DS 0.7 was used (Gernandt
et al. 2003). Different models for explaining the
degree of PEC particle swelling/density as a function
of polyelectrolyte chain length and charge density
have been theorized upon, and it was shown that the
density of the PEC core is influenced by
polyelectrolyte charge density (Dautzenberg 1997;
Mende et al. 2002).
In mixtures of cationic starches and CMC, the FSC/
SSC values indicated that the PECs were less dense
than the PECs formed with polyDADMAC (Fig. 6).
The determined FSC/SSC values increased with
decreasing charge density of the polycations, indicat-
ing that less dense PECs were formed with the cationic
starches of lower charge density. It has been reported
that large differences in charge density between the
polycation and polyanion may lead to less dense, and
more swollen PEC structures (Dautzenberg 1997).
The cationic starches originated either from potato or
waxy maize, that contain about 77 and 98% of
branched amylopectin respectively (Fredriksson
et al. 1998). Less well-ordered packing of the cationic
starches in the PEC particles would be expected,
compared with the linear and highly charged
polyDADMAC.
FCM analysis of various particle types was per-
formed in order to gain more insight about FSC/SSC
values. The available particles were kaolin, scaleno-
hedral and prismatic precipitated calcium carbonates
(PCC s, PCC p), ground calcium carbonate (GCC),
three different bentonites, cellulose nanocrystals
(CNC), and cellulose nanofibrils (CNF). The FCM
analyses were performed in similar fashion, and the
calculations were performed in the same way as for the
PECs. Theoretically, solid particles should have FSC/
SSC values close to 1.0 in the FCM setup. This was
seen for both of the PCC particle types, GCC, and
kaolin (Table 4). The bentonites, which are known to
swell in water, had FSC/SSC values between 2.8 and
4.6. The FSC/SSC of cellulose nanocrystals, which are
known to be dense and crystalline cellulose particles,
Table 4 Determined FSC/
SSC values for a variety of
different inorganic and
organic particles analyzed
by FCM
The reported FSC/SSC
values are not absolute for
each particle type, and may
vary with various particle
properties to some extent
Particle type FSC/SSC
PCC p 1.0
PCC s 1.1
GCC 1.3
Kaolin 1.4
Bentonite A 2.8
Bentonite B 3.2
Bentonite C 4.6
CNC 1.4
CNF 6.6
PECs 1.1–8.7
123
3790 Cellulose (2018) 25:3781–3795
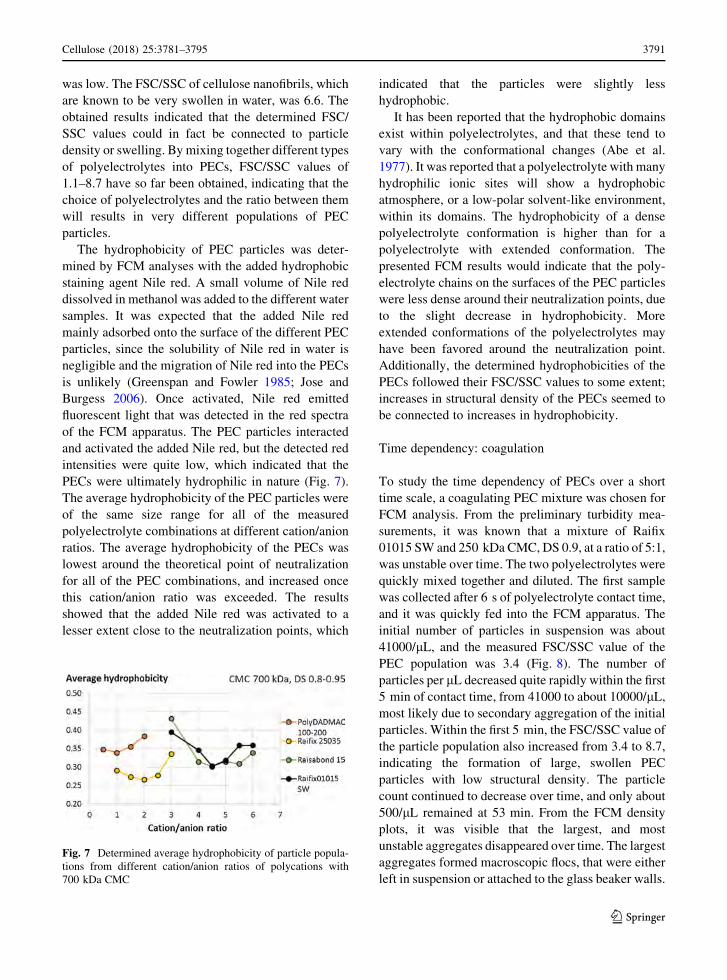
was low. The FSC/SSC of cellulose nanofibrils, which
are known to be very swollen in water, was 6.6. The
obtained results indicated that the determined FSC/
SSC values could in fact be connected to particle
density or swelling. By mixing together different types
of polyelectrolytes into PECs, FSC/SSC values of
1.1–8.7 have so far been obtained, indicating that the
choice of polyelectrolytes and the ratio between them
will results in very different populations of PEC
particles.
The hydrophobicity of PEC particles was deter-
mined by FCM analyses with the added hydrophobic
staining agent Nile red. A small volume of Nile red
dissolved in methanol was added to the different water
samples. It was expected that the added Nile red
mainly adsorbed onto the surface of the different PEC
particles, since the solubility of Nile red in water is
negligible and the migration of Nile red into the PECs
is unlikely (Greenspan and Fowler 1985; Jose and
Burgess 2006). Once activated, Nile red emitted
fluorescent light that was detected in the red spectra
of the FCM apparatus. The PEC particles interacted
and activated the added Nile red, but the detected red
intensities were quite low, which indicated that the
PECs were ultimately hydrophilic in nature (Fig. 7).
The average hydrophobicity of the PEC particles were
of the same size range for all of the measured
polyelectrolyte combinations at different cation/anion
ratios. The average hydrophobicity of the PECs was
lowest around the theoretical point of neutralization
for all of the PEC combinations, and increased once
this cation/anion ratio was exceeded. The results
showed that the added Nile red was activated to a
lesser extent close to the neutralization points, which
indicated that the particles were slightly less
hydrophobic.
It has been reported that the hydrophobic domains
exist within polyelectrolytes, and that these tend to
vary with the conformational changes (Abe et al.
1977). It was reported that a polyelectrolyte with many
hydrophilic ionic sites will show a hydrophobic
atmosphere, or a low-polar solvent-like environment,
within its domains. The hydrophobicity of a dense
polyelectrolyte conformation is higher than for a
polyelectrolyte with extended conformation. The
presented FCM results would indicate that the poly-
electrolyte chains on the surfaces of the PEC particles
were less dense around their neutralization points, due
to the slight decrease in hydrophobicity. More
extended conformations of the polyelectrolytes may
have been favored around the neutralization point.
Additionally, the determined hydrophobicities of the
PECs followed their FSC/SSC values to some extent;
increases in structural density of the PECs seemed to
be connected to increases in hydrophobicity.
Time dependency: coagulation
To study the time dependency of PECs over a short
time scale, a coagulating PEC mixture was chosen for
FCM analysis. From the preliminary turbidity mea-
surements, it was known that a mixture of Raifix
01015 SW and 250 kDa CMC, DS 0.9, at a ratio of 5:1,
was unstable over time. The two polyelectrolytes were
quickly mixed together and diluted. The first sample
was collected after 6 s of polyelectrolyte contact time,
and it was quickly fed into the FCM apparatus. The
initial number of particles in suspension was about
41000/lL, and the measured FSC/SSC value of the
PEC population was 3.4 (Fig. 8). The number of
particles per lL decreased quite rapidly within the first
5 min of contact time, from 41000 to about 10000/lL,most likely due to secondary aggregation of the initial
particles. Within the first 5 min, the FSC/SSC value of
the particle population also increased from 3.4 to 8.7,
indicating the formation of large, swollen PEC
particles with low structural density. The particle
count continued to decrease over time, and only about
500/lL remained at 53 min. From the FCM density
plots, it was visible that the largest, and most
unstable aggregates disappeared over time. The largest
aggregates formed macroscopic flocs, that were either
left in suspension or attached to the glass beaker walls.
Fig. 7 Determined average hydrophobicity of particle popula-
tions from different cation/anion ratios of polycations with
700 kDa CMC
123
Cellulose (2018) 25:3781–3795 3791
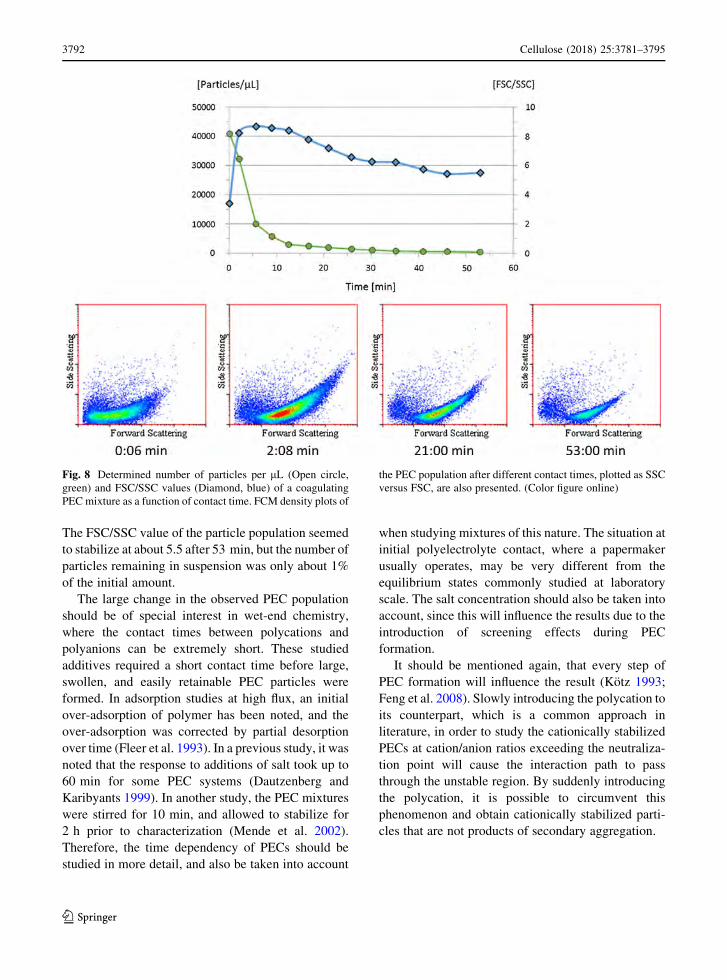
The FSC/SSC value of the particle population seemed
to stabilize at about 5.5 after 53 min, but the number of
particles remaining in suspension was only about 1%
of the initial amount.
The large change in the observed PEC population
should be of special interest in wet-end chemistry,
where the contact times between polycations and
polyanions can be extremely short. These studied
additives required a short contact time before large,
swollen, and easily retainable PEC particles were
formed. In adsorption studies at high flux, an initial
over-adsorption of polymer has been noted, and the
over-adsorption was corrected by partial desorption
over time (Fleer et al. 1993). In a previous study, it was
noted that the response to additions of salt took up to
60 min for some PEC systems (Dautzenberg and
Karibyants 1999). In another study, the PEC mixtures
were stirred for 10 min, and allowed to stabilize for
2 h prior to characterization (Mende et al. 2002).
Therefore, the time dependency of PECs should be
studied in more detail, and also be taken into account
when studying mixtures of this nature. The situation at
initial polyelectrolyte contact, where a papermaker
usually operates, may be very different from the
equilibrium states commonly studied at laboratory
scale. The salt concentration should also be taken into
account, since this will influence the results due to the
introduction of screening effects during PEC
formation.
It should be mentioned again, that every step of
PEC formation will influence the result (Kotz 1993;
Feng et al. 2008). Slowly introducing the polycation to
its counterpart, which is a common approach in
literature, in order to study the cationically stabilized
PECs at cation/anion ratios exceeding the neutraliza-
tion point will cause the interaction path to pass
through the unstable region. By suddenly introducing
the polycation, it is possible to circumvent this
phenomenon and obtain cationically stabilized parti-
cles that are not products of secondary aggregation.
Fig. 8 Determined number of particles per lL (Open circle,
green) and FSC/SSC values (Diamond, blue) of a coagulating
PEC mixture as a function of contact time. FCM density plots of
the PEC population after different contact times, plotted as SSC
versus FSC, are also presented. (Color figure online)
123
3792 Cellulose (2018) 25:3781–3795
Conclusions
Polyelectrolyte complexes (PECs) were prepared from
common papermaking additives at different cation/
anion ratios. The polycations were different cationic
starches and polyDADMACs, while the polyanions
were CMCs of various molar masses and charge
densities. The colloidal, light scattering PEC particles
were studied by turbidity measurements, as well as by
flow cytometry (FCM). Turbidity maxima of the
different PEC mixtures were located close to the
theoretical point of neutralization between the poly-
cation and polyanion. The turbidity response varied
with polyelectrolyte charge density. The formed PECs
were in most cases stable for 24 h, but certain
combinations close to the theoretical point of neutral-
ization resulted in unstable complexes.
The light scattering properties of PECs in side
direction (SSC) and in forward direction (FSC) were
recorded by FCM analyses. It was seen that the SSC
and FSC of the analyzed particles were influenced by
very different particle properties, and a new term was
suggested to better understand the properties of these
particles in suspension; FSC/SSC. It was shown that
the calculated FSC/SSC values were connected to the
structural density of particles. The hydrophobicity of
PECs was also analyzed by FCM. All of the measured
PEC combinations were very hydrophilic, and it was
seen that the hydrophobicity of the particles was
lowest close to the theoretical point of neutralization.
Finally, a coagulating PEC mixture was studied by
FCM analysis as a function of time. It was shown that
the initial particle count decreased by 75% over a short
period of time. The PECs were initially of medium
density, but quickly formed large, swollen particles
due to secondary aggregation amongst the initial
particles. After 53 min, only about 1% of the particles
remained in suspension.
It is suggested that FCM can be used to study
polyelectrolyte complexes in suspension. FCM pro-
vides relevant information about the structural density
and hydrophobicity of these particles. With FCM it
would be possible to simultaneous analyze PEC
properties and their interactions with other particles
in suspension. When dealing with research or produc-
tion of PECs, FCM techniques can be very useful for
categorizing the formed particles.
Acknowledgments This work is a part of the project
ExtBioNet, appointed by the Academy of Finland. The work
is part of the activities of the Process Chemistry Centre (PCC) at
Abo Akademi University. Special thanks to Frida Sjogren, MSc
worker at the laboratory of Wood and Paper Chemistry, Abo
Akademi University, for skillful laboratory work.
Open Access This article is distributed under the terms of the
Creative Commons Attribution 4.0 International License (http://
creativecommons.org/licenses/by/4.0/), which permits unre-
stricted use, distribution, and reproduction in any medium,
provided you give appropriate credit to the original
author(s) and the source, provide a link to the Creative Com-
mons license, and indicate if changes were made.
References
Abe K, Koide M, Tsuchida E (1977) Hydrophobicities in the
domains of polyelectrolytes. J Polym Sci, Part A: Polym
Chem 15:2469–2477. https://doi.org/10.1002/pol.1977.
170151016
Ankerfors C, Wagberg L (2013) Polyelectrolyte complexes for
tailoring of wood fibre surfaces. In: Muller M (ed) Poly-
electrolyte complexes in the dispersed and solid state II.
Springer, Berlin Heidelberg, pp 1–24. https://doi.org/10.
1007/12_2012_206
Beck-Candanedo S, RomanM, Gray D (2005) Effect of reaction
conditions on the properties and behavior of wood cellu-
lose nanocrystal suspensions. Biomacromol 6:1048–1054.
https://doi.org/10.1021/bm049300p
Beghello L, Long L, Eklund D (1997) Laboratory study on
carboxymethylcellulose as a wet-end additive in paper-
board making. Pap Puu 79:55–57
Buchhammer H-M, Kramer G, Lunkwitz K (1995) Interaction
of colloidal dispersions of non-stoichiometric polyelec-
trolyte complexes and silica particles. Colloids Surf A
95:299–304. https://doi.org/10.1016/0927-
7757(94)03036-Y
Chen J, Heitmann A, Hubbe M (2003) Dependency of poly-
electrolyte complex stoichiometry on the order of addition.
1. Effect of salt concentration during streaming current
titrations with strong poly-acid and poly-base. Colloids
Surf A 223:215–230. https://doi.org/10.1016/S0927-
7757(03)00222-X
Dautzenberg H (1997) Polyelectrolyte complex formation in
highly aggregating systems. 1. Effect of salt: polyelec-
trolyte complex formation in the presence of NaCl.
Macromolecules 30:7810–7815. https://doi.org/10.1021/
ma970803f
Dautzenberg H (2000) Polyelectrolyte complex formation: role
of a double hydrophilic polymer. Macromol Chem Phys
201:1765–1773. https://doi.org/10.1002/1521-
3935(20000901)201:14\1765:AID-MACP1765[3.0.
CO;2-W
Dautzenberg H, Karibyants N (1999) Polyelectrolyte complex
formation in highly aggregating systems. Effect of salt:
response to subsequent addition of NaCl. Macromol Chem
Phys 200:118–125. https://doi.org/10.1002/(SICI)1521-
123
Cellulose (2018) 25:3781–3795 3793
3935(19990101)200:1\118::AID-MACP118[3.0.CO;2-
K
De Vasconcelos C, Bezerril P, Dos Santos D, Dantas T, Pereira
M, Fonseca J (2006) Effect of molecular weight and ionic
strength on the formation of polyelectrolyte complexes
based on poly(methacrylic acid) and chitosan. Biomacro-
mol 7:1245–1252. https://doi.org/10.1021/bm050963w
Decher G (1997) Fuzzy nanoassemblies: toward layered poly-
meric multicomposites. Science 277:1232–1237. https://
doi.org/10.1126/science.277.5330.1232
Dragan S, Cristea M (2001) Influence of low-molecular-weight
salts on the formation of polyelectrolyte complexes based
on polycations with quaternary ammonium salt groups in
the main chain and poly(sodium acrylate). Eur Polym J
37:1571–1575. https://doi.org/10.1016/S0014-
3057(01)00025-8
Feng X, Leduc M, Pelton R (2008) Polyelectrolyte complex
characterization with isothermal titration calorimetry and
colloid titration. Colloids Surf A 317:535–542. https://doi.
org/10.1016/j.colsurfa.2007.11.053
Fleer G, Cohen Stuart M, Scheutjens J, Cosgrove T, Vincent B
(1993) Electrostatic effects: charged surfaces and poly-
electrolyte adsorption. In: Polymers at interfaces, 1st edn.
Chapman & Hall, London, pp 343–375
Fornue E, Allan G, Quinones H, Gonzalez G, Saucedo J (2011)
Fundamental aspects of adhesion between cellulosic sur-
faces in contact—a review. Papel 72:85–90
Fredriksson H, Silverio J, Andersson R, Eliasson A-C, Aman P
(1998) The influence of amylose and amylopectin charac-
teristics on gelatinization and retrogradation properties of
different starches. Carbohydr Polym 35:119–134
Gardlund L, Forsstrom J, Andreasson B, Wagberg L (2005)
Influence of polyelectrolyte complexes on the strength
properties of papers from unbleached kraft pulps with
different yields. Nord Pulp Pap Res J 20:36–42. https://doi.
org/10.3183/NPPRJ-2005-20-01-p036-042
Gernandt R, Wagberg L, Gardlund L, Dautzenberg H (2003)
Polyelectrolyte complexes for surface modification of
wood fibres: I. Preparation and characterisation of com-
plexes for dry and wet strength improvement of paper.
Colloids Surf A 213:15–25. https://doi.org/10.1016/
S0927-7757(02)00335-7
Granberg H, Coppel L, Eita M, de Mayolo A, Arwin H, Wag-
berg L (2012) Dynamics of moisture interaction with
polyelectrolyte multilayers containing nanofibrillated cel-
lulose. Nord Pulp Pap Res J 27:496–499. https://doi.org/10.
3183/NPPRJ-2012-27-02-p496-499
Greenspan P, Fowler S (1985) Spectrofluorometric studies of
the lipid probe, nile red. J Lipid Res 26:781–789
Haara M, Konn J, Vahasalo L, Sundberg A, Willfor S (2014)
Flow cytometry as a tool to assess inhibitor performance
for calcium oxalate scale control. Nord Pulp Pap Res J
29:663–672. https://doi.org/10.3183/NPPRJ-2014-29-04-
p663-672
Hubbe M (2006) Bonding between cellulosic fibers in the
absence and presence of dry-strength agents—a review.
BioResources 1:281–318. https://doi.org/10.15376/biores.
1.2.281-318
Hubbe M, Jackson T, Zhang M (2003) Fiber surface saturation
as a strategy to optimize dual-polymer dry strength treat-
ment. Tappi J 2:7–12
Hubbe M, Moore S, Lee SY (2005) Effects of charge ratios and
cationic polymer nature on polyelectrolyte complex
deposition onto cellulose. Ind Eng Chem Res
44:3068–3074. https://doi.org/10.1021/ie048902m
Jose J, Burgess K (2006) Syntheses and properties of water-
soluble nile red derivatives. J Org Chem 71:7835–7839.
https://doi.org/10.1021/jo061369v
Kekkonen J, Lattu H, Stenius P (2001) Adsorption kinetics of
complexes formed by oppositely charged polyelectrolytes.
J Colloid Interface Sci 234:384–392. https://doi.org/10.
1006/jcis.2000.7326
Kontturi K, Tammelin T, Johansson L-S, Stenius P (2008)
Adsorption of cationic starch on cellulose studied by
QCM-D. Langmuir 24:4743–4749. https://doi.org/10.
1021/la703604j
Kotz J (1993) Phase behavior of polyanion-polycation aggre-
gates and possibilities of utilization. Nord Pulp Pap Res J
8:11–14
Lin Z, Renneckar S (2011) Nanocomposite-based lignocellu-
losic fibers 3: polyelectrolyte adsorption onto heteroge-
neous fiber surfaces. Cellulose 18:563–574. https://doi.org/
10.1007/s10570-011-9502-6
Lindberg L, Vahasalo L, Holmbom B (2004) Flow cytometry of
bacteria and wood resin particles in paper production. Nord
Pulp Pap Res J 19:412–416. https://doi.org/10.3183/
NPPRJ-2004-19-04-p412-416
Lofton M, Moore S, Hubbe M, Lee SY (2005) Deposition of
polyelectrolyte complexes as a mechanism for developing
paper dry strength. Tappi J 4:3–8
Marais A, Utsel S, Gustafsson E, Wagberg L (2014) Towards a
super-strainable paper using the layer-by-layer technique.
Carbohydr Polym 100:218–224. https://doi.org/10.1016/j.
carbpol.2013.03.049
Mende M, Petzold G, Buchhammer H-M (2002) Polyelectrolyte
complex formation between poly(diallyldimethyl-ammo-
nium chloride) and copolymers of acrylamide and sodium-
acrylate. Colloid Polym Sci 280:342–351. https://doi.org/
10.1007/s00396-001-0614-7
Myllytie P, Yin J, Holappa S, Laine J (2009) The effect of
different polysaccharides on the development of paper
strength during drying. Nord Pulp Pap Res J 24:469–477.
https://doi.org/10.3183/NPPRJ-2009-24-04-p469-477
Petzold G, Lunkwitz K (1995) The interaction between poly-
electrolyte complexes made from poly(dimethyldially-
lammonium chloride) (PDMDAAC) and poly(maleic acid-
co-a-methylstyrene) (P(MS-a-MeSty)) and cellulosic
materials. Colloids Surf A 98:225–233. https://doi.org/10.
1016/0927-7757(95)03133-X
Petzold G, Buchhammer H-M, Lunkwitz K (1996) The use of
oppositely charged polyelectrolytes as flocculants and
retention aids. Colloids Surf A 119:87–92. https://doi.org/
10.1016/S0927-7757(96)03740-5
Philipp B, Dautzenberg H, Linow K-J, Kotz J, Dawydoff W
(1989) Polyelectrolyte complexes—recent developments
and open problems. Prog Polym Sci 14:91–172. https://doi.
org/10.1016/0079-6700(89)90018-X
Piculell L, Lindman B (1992) Association and segregation in
aqueous polymer/polymer, polymer/surfactant, and sur-
factant/surfactant mixtures: similarities and differences.
Adv Colloid Interface Sci 41:149–178. https://doi.org/10.
1016/0001-8686(92)80011-L
123
3794 Cellulose (2018) 25:3781–3795

Renneckar S, Zhou Y (2009) Nanoscale coatings on wood:
polyelectrolyte adsorption and layer-by-layer assembled
film formation. ACS Appl Mater Interfaces 1:559–566.
https://doi.org/10.1021/am800119q
Shapiro H (2003) Practical flow cytometry, 4th edn. Wiley,
Hoboken
Shibata I, Isogai A (2003) Depolymerization of cellouronic acid
during TEMPO-mediated oxidation. Cellulose 10:151–158
Strand A, Lindqvist H, Vahasalo L, Blomquist M, Sundberg A
(2013) Analysis of interactions between colloidal wood
pitch and various mineral particles by flow cytometry.
BioResources 8:3884–3900. https://doi.org/10.15376/
biores.8.3.3884-3900
Strand A, Khakalo A, Kouko J, Oksanen A, Ketola A, Salminen
K, Rojas O, Retulainen E, Sundberg A (2017) The effect of
chemical additives on the strength, stiffness and elongation
potential of paper. Nord Pulp Pap Res J 32:324–335.
https://doi.org/10.3183/NPPRJ-2017-32-03-p324-335
Stratton R (1989) Dependence of sheet properties on the loca-
tion of adsorbed polymer. Nord Pulp Pap Res J 4:104–112
Sundberg A, Pranovich A, Holmbom B (2000) Distribution of
anionic groups in TMP suspensions. J Wood Chem Tech-
nol 20:71–92. https://doi.org/10.1080/
02773810009349625
Tammelin T, Merta J, Johansson L-S, Stenius P (2004) Vis-
coelastic properties of cationic starch adsorbed on quartz
studied by QCM-D. Langmuir 20:10900–10909. https://
doi.org/10.1021/la0487693
Torgnysdotter A, Wagberg L (2006) Tailoring of fibre/fibre
joints in order to avoid the negative impacts of drying on
paper properties. Nord Pulp Pap Res J 21:411–418. https://
doi.org/10.3183/NPPRJ-2006-21-03-p411-418
Vahasalo L, Holmbom B (2005) Factors affecting white pitch
deposition. Nord Pulp Pap Res J 20:164–168. https://doi.
org/10.3183/NPPRJ-2005-20-02-p164-168
Vahasalo L, Degerth R, Holmbom B (2003) The use of flow
cytometry in wet end research. Pap Technol 44:45–49
Van de Steeg H, Cohen Stuart M, De Keizer A, Bijsterbosch B
(1992) Polyelectrolyte adsorption: a subtle balance of
forces. Langmuir 8:2538–2546. https://doi.org/10.1021/
la00046a030
123
Cellulose (2018) 25:3781–3795 3795
PAPERmaking!
FROM THE PUBLISHERS OF PAPER TECHNOLOGY
Volume 5, Number 1, 2019
Page 1 of 19 Article 6 – Wood Panel
Comparative Studies on the Explosion Severity of Different Wood Dusts from Fiberboard Production
Lu Guo,
a Qiuping Xiao,
b Nanfeng Zhu,
a Yao Wang,
b Xiulan Chen,
c and Changyan Xu
a,*
Wood dust samples with different particle sizes were used to investigate the explosion characteristics of wood dust. The dust samples came from Populus alba L., Pinus massoniana Lamb., and Cinnamonum camphora (L.) Pres., species that are commonly utilized in medium density fiberboard production in China. The thermogravimetric characteristics, element composition, and morphology of dust samples were analyzed to help explain the explosion phenomena in a 20 L sphere. The analysis showed that both the maximum explosion pressure and explosion index of wood dust presented a decreasing trend with increasing particle size, and the maximum explosion pressure values were in the range of 7 to 9 bar, regardless of species. For both explosion pressure and explosion index values, the wood dust with similar particle sizes were different, which are ranked as Populus alba > Cinnamonum camphora > Pinus massoniana. In addition, for the explosion pressure of wood dust with similar particle size, the dust concentration had threshold values. Additionally, the particle size and dust concentration had a synergistic effect on the explosion pressure and explosion index. Wood dust with a smaller particle size is more likely to explode at the threshold of concentration. Contact information: a: College of Materials Science and Engineering, Nanjing Forestry University, 159 Longpan Road, Nanjing 210037, P.R. China; b: Shanghai Research Institute of Chemical Industry Co., Ltd., 345 Yunling West Road, P.R. China; c: Dare Wood-Based Panels Group Co., Ltd., 2021 Haixiu Road, P.R. China; *Corresponding author: [email protected] Guo et al. (2019). “Explosion of wood dusts,” BioResources 14(2), 3182-3199. DOI: 10.15376/biores.14.2.3182-3199
The Paper Industry Technical Association (PITA) is an independent organisation which operates for the general benefit of its members – both individual and corporate – dedicated to promoting and improving the technical and scientific knowledge of those working in the UK pulp and paper industry. Formed in 1960, it serves the Industry, both manufacturers and suppliers, by providing a forum for members to meet and network; it organises visits, conferences and training seminars that cover all aspects of papermaking science. It also publishes the prestigious journal Paper Technology International and the PITA Annual Review, both sent free to members, and a range of other technical publications which include conference proceedings and the acclaimed Essential
Guide to Aqueous Coating.
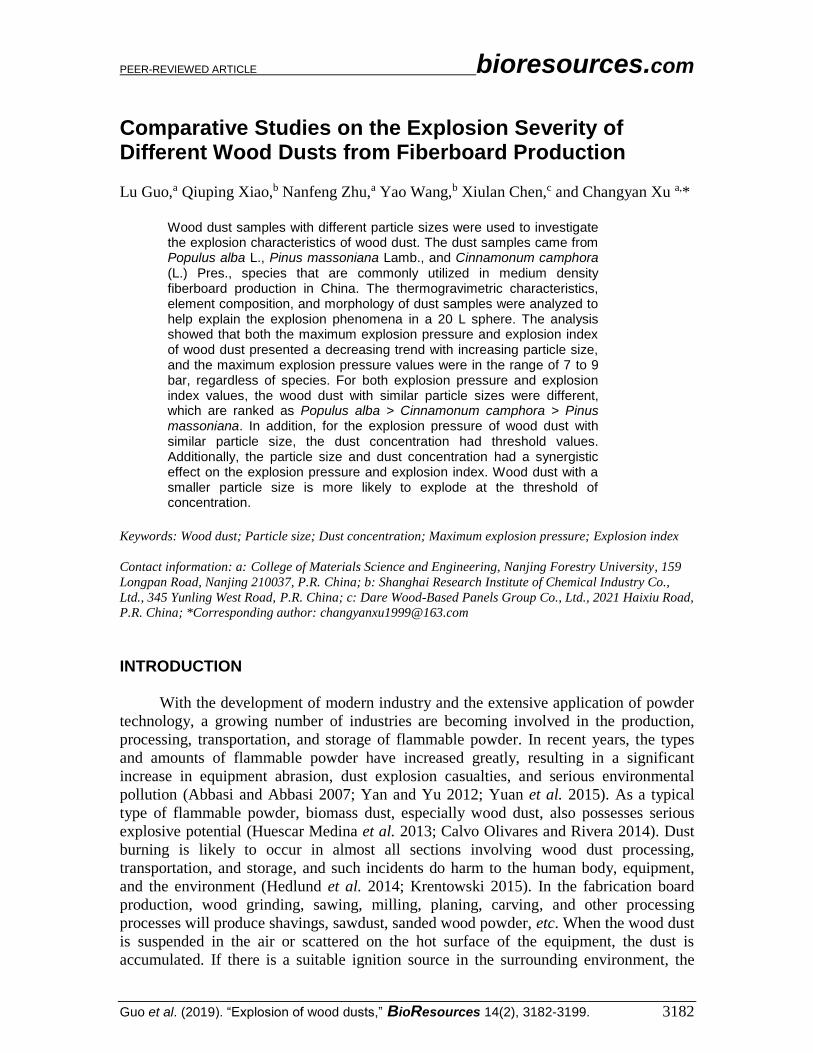
PEER-REVIEWED ARTICLE bioresources.com
Guo et al. (2019). “Explosion of wood dusts,” BioResources 14(2), 3182-3199. 3182
Comparative Studies on the Explosion Severity of Different Wood Dusts from Fiberboard Production
Lu Guo,a Qiuping Xiao,b Nanfeng Zhu,a Yao Wang,b Xiulan Chen,c and Changyan Xu a,*
Wood dust samples with different particle sizes were used to investigate the explosion characteristics of wood dust. The dust samples came from Populus alba L., Pinus massoniana Lamb., and Cinnamonum camphora (L.) Pres., species that are commonly utilized in medium density fiberboard production in China. The thermogravimetric characteristics, element composition, and morphology of dust samples were analyzed to help explain the explosion phenomena in a 20 L sphere. The analysis showed that both the maximum explosion pressure and explosion index of wood dust presented a decreasing trend with increasing particle size, and the maximum explosion pressure values were in the range of 7 to 9 bar, regardless of species. For both explosion pressure and explosion index values, the wood dust with similar particle sizes were different, which are ranked as Populus alba > Cinnamonum camphora > Pinus massoniana. In addition, for the explosion pressure of wood dust with similar particle size, the dust concentration had threshold values. Additionally, the particle size and dust concentration had a synergistic effect on the explosion pressure and explosion index. Wood dust with a smaller particle size is more likely to explode at the threshold of concentration.
Keywords: Wood dust; Particle size; Dust concentration; Maximum explosion pressure; Explosion index
Contact information: a: College of Materials Science and Engineering, Nanjing Forestry University, 159
Longpan Road, Nanjing 210037, P.R. China; b: Shanghai Research Institute of Chemical Industry Co.,
Ltd., 345 Yunling West Road, P.R. China; c: Dare Wood-Based Panels Group Co., Ltd., 2021 Haixiu Road, P.R. China; *Corresponding author: [email protected]
INTRODUCTION
With the development of modern industry and the extensive application of powder
technology, a growing number of industries are becoming involved in the production,
processing, transportation, and storage of flammable powder. In recent years, the types
and amounts of flammable powder have increased greatly, resulting in a significant
increase in equipment abrasion, dust explosion casualties, and serious environmental
pollution (Abbasi and Abbasi 2007; Yan and Yu 2012; Yuan et al. 2015). As a typical
type of flammable powder, biomass dust, especially wood dust, also possesses serious
explosive potential (Huescar Medina et al. 2013; Calvo Olivares and Rivera 2014). Dust
burning is likely to occur in almost all sections involving wood dust processing,
transportation, and storage, and such incidents do harm to the human body, equipment,
and the environment (Hedlund et al. 2014; Krentowski 2015). In the fabrication board
production, wood grinding, sawing, milling, planing, carving, and other processing
processes will produce shavings, sawdust, sanded wood powder, etc. When the wood dust
is suspended in the air or scattered on the hot surface of the equipment, the dust is
accumulated. If there is a suitable ignition source in the surrounding environment, the
PEER-REVIEWED ARTICLE bioresources.com
Guo et al. (2019). “Explosion of wood dusts,” BioResources 14(2), 3182-3199. 3183
wood dust will be ignited, releasing heat and causing an explosion accident. Yuan et al.
(2015) examined and analyzed more than 2000 dust explosion accidents that occurred
worldwide between 1785 and 2012, and found that 17% of the incidents were caused by
wood dust. Wood dust is an important type of combustible dust that accounts for 46%
and 27% of all explosion accidents in the US and China, respectively. On January 31,
2015, a wood dust explosion occurred in Jinhe Xingan Wood-based Panel Co. Ltd.,
Genhe, Inner Mongolia in China killing six, injuring three, and badly damaging the
factory building (State Administration of Work Safety of China 2015). According to a
preliminary investigation, the accident was caused by an initial wood dust bin explosion
in the sanding and dust collecting system, which led to a secondary wood dust explosion
in the workshop, triggering a fire in the workshop and storehouse.
Increasing attention has been paid to research on combustible dust explosions in
the United States, Britain, France, Germany, Japan, Norway, and other developed
countries (Nagy and Verakis 1983; Eckhoff 2005, 2009; Amyotte and Eckhoff 2010).
They studied the causes and consequences of dust explosions, mechanisms of dust
explosions, physical and chemical experimental methods related to dust cloud generation
and combustion, explosion test parameters, and safety improvement procedures to reduce
the probability and damage of dust explosions in industry.
The maximum explosion pressure (Pmax), the maximum rate of explosion pressure
rise (dp/dt)max, and the explosion index (Kst) derived from (dp/dt)max are safety
characteristic factors usually used for hazard identification in various industries,
suggesting safety improvement procedures, and designing safety measures for the
mitigation of destructive effects of dust explosions (BSEN 14034-1(2004) and BS EN
14034-2 (2006)).
Cashdollar (2000) believed that the particle size, shape, and specific surface area
of dust were closely related to its explosion characteristics. Amyotte et al. (2012)
conducted a comparative study on the effects of dust particle size and shape on the
maximum explosion pressure as well as the rise in the maximum rate of explosion
pressure of wood fibers and polyethylene dust. They deemed that fibrillar particles such
as wood dust were more likely to explode because they would remain suspended in air
for a long time, increasing their ignition probability. Calle et al. (2005) also studied the
explosion characteristics of wood dust with different particle size in a 20 L sphere, and
confirmed that explosion violence decreases with increasing particle size. The researchers
then developed a model based on balances of chemical reactions, kinetics, and
thermodynamics during the explosion.
Most studies on dust explosions have focused on coal, metal, and food dust. To
date, the reports about wood dust explosion characteristics are still in a fragmentary
stage, including the description of the individual explosion characteristics of wood dust,
describing common physical laws of various dust types such as explosion incentives,
explosive conditions, as well as explosion and explosion factors (Hedlund et al. 2014;
Krentowski 2015). Minimal attention has been paid to the combustion and explosion
dynamics in wood explosions (Calle et al. 2005; Huescar Medina et al. 2015), mainly
because of the considerable variation in wood particle size and morphology, as well as
the low density and large specific surface area of wood dust.
The 1990s saw a rapid development of fiber board production as an effective way
to comprehensively utilize wood resources in China. However, it is unavoidably
accompanied by a lot of dangerous wood dust explosions. In fiberboard production, the
equipment that is prone to dust explosion includes the wood fiber drying system, dry
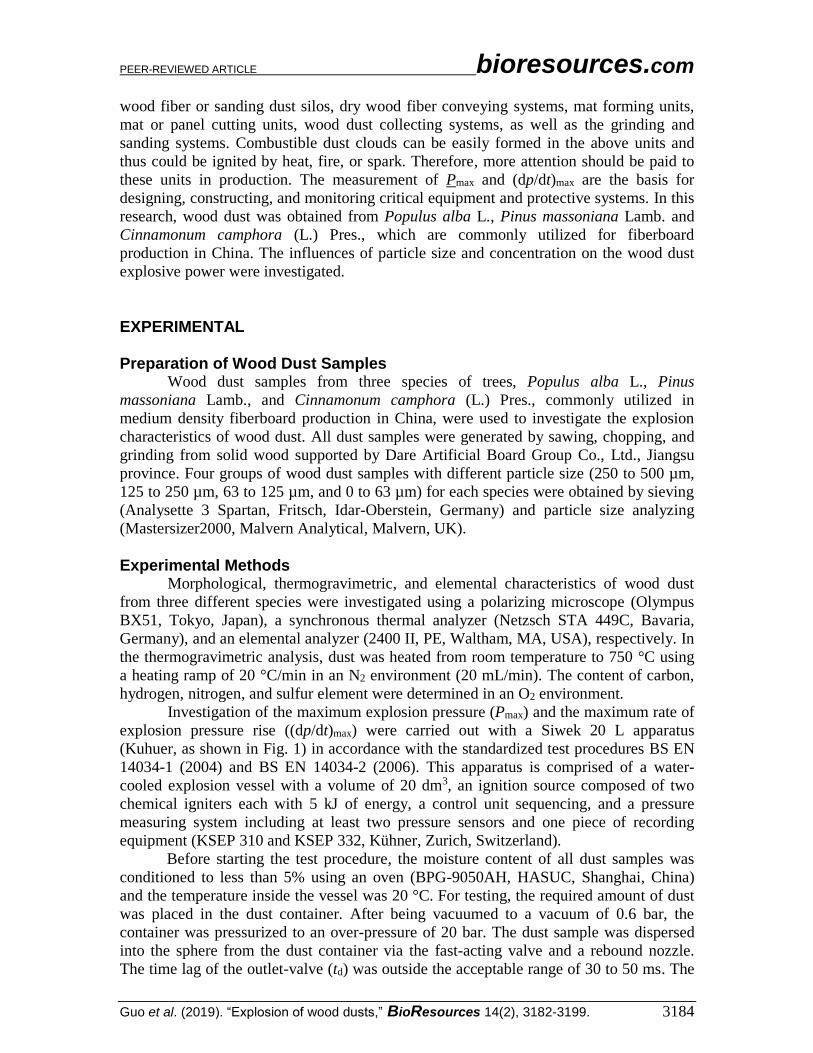
PEER-REVIEWED ARTICLE bioresources.com
Guo et al. (2019). “Explosion of wood dusts,” BioResources 14(2), 3182-3199. 3184
wood fiber or sanding dust silos, dry wood fiber conveying systems, mat forming units,
mat or panel cutting units, wood dust collecting systems, as well as the grinding and
sanding systems. Combustible dust clouds can be easily formed in the above units and
thus could be ignited by heat, fire, or spark. Therefore, more attention should be paid to
these units in production. The measurement of Pmax and (dp/dt)max are the basis for
designing, constructing, and monitoring critical equipment and protective systems. In this
research, wood dust was obtained from Populus alba L., Pinus massoniana Lamb. and
Cinnamonum camphora (L.) Pres., which are commonly utilized for fiberboard
production in China. The influences of particle size and concentration on the wood dust
explosive power were investigated.
EXPERIMENTAL
Preparation of Wood Dust Samples Wood dust samples from three species of trees, Populus alba L., Pinus
massoniana Lamb., and Cinnamonum camphora (L.) Pres., commonly utilized in
medium density fiberboard production in China, were used to investigate the explosion
characteristics of wood dust. All dust samples were generated by sawing, chopping, and
grinding from solid wood supported by Dare Artificial Board Group Co., Ltd., Jiangsu
province. Four groups of wood dust samples with different particle size (250 to 500 µm,
125 to 250 µm, 63 to 125 µm, and 0 to 63 µm) for each species were obtained by sieving
(Analysette 3 Spartan, Fritsch, Idar-Oberstein, Germany) and particle size analyzing
(Mastersizer2000, Malvern Analytical, Malvern, UK).
Experimental Methods Morphological, thermogravimetric, and elemental characteristics of wood dust
from three different species were investigated using a polarizing microscope (Olympus
BX51, Tokyo, Japan), a synchronous thermal analyzer (Netzsch STA 449C, Bavaria,
Germany), and an elemental analyzer (2400 II, PE, Waltham, MA, USA), respectively. In
the thermogravimetric analysis, dust was heated from room temperature to 750 °C using
a heating ramp of 20 °C/min in an N2 environment (20 mL/min). The content of carbon,
hydrogen, nitrogen, and sulfur element were determined in an O2 environment.
Investigation of the maximum explosion pressure (Pmax) and the maximum rate of
explosion pressure rise ((dp/dt)max) were carried out with a Siwek 20 L apparatus
(Kuhuer, as shown in Fig. 1) in accordance with the standardized test procedures BS EN
14034-1 (2004) and BS EN 14034-2 (2006). This apparatus is comprised of a water-
cooled explosion vessel with a volume of 20 dm3, an ignition source composed of two
chemical igniters each with 5 kJ of energy, a control unit sequencing, and a pressure
measuring system including at least two pressure sensors and one piece of recording
equipment (KSEP 310 and KSEP 332, Kühner, Zurich, Switzerland).
Before starting the test procedure, the moisture content of all dust samples was
conditioned to less than 5% using an oven (BPG-9050AH, HASUC, Shanghai, China)
and the temperature inside the vessel was 20 °C. For testing, the required amount of dust
was placed in the dust container. After being vacuumed to a vacuum of 0.6 bar, the
container was pressurized to an over-pressure of 20 bar. The dust sample was dispersed
into the sphere from the dust container via the fast-acting valve and a rebound nozzle.
The time lag of the outlet-valve (td) was outside the acceptable range of 30 to 50 ms. The
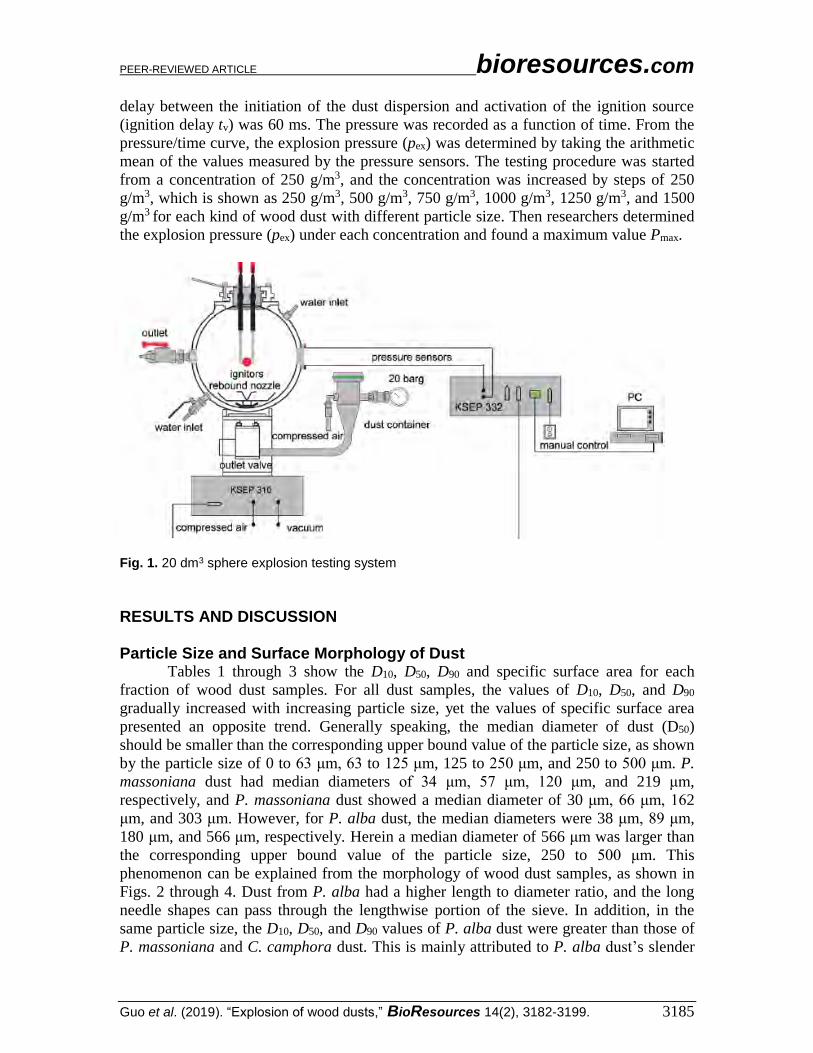
PEER-REVIEWED ARTICLE bioresources.com
Guo et al. (2019). “Explosion of wood dusts,” BioResources 14(2), 3182-3199. 3185
delay between the initiation of the dust dispersion and activation of the ignition source
(ignition delay tv) was 60 ms. The pressure was recorded as a function of time. From the
pressure/time curve, the explosion pressure (pex) was determined by taking the arithmetic
mean of the values measured by the pressure sensors. The testing procedure was started
from a concentration of 250 g/m3, and the concentration was increased by steps of 250
g/m3, which is shown as 250 g/m3, 500 g/m3, 750 g/m3, 1000 g/m3, 1250 g/m3, and 1500
g/m3 for each kind of wood dust with different particle size. Then researchers determined
the explosion pressure (pex) under each concentration and found a maximum value Pmax.
Fig. 1. 20 dm3 sphere explosion testing system
RESULTS AND DISCUSSION
Particle Size and Surface Morphology of Dust Tables 1 through 3 show the D10, D50, D90 and specific surface area for each
fraction of wood dust samples. For all dust samples, the values of D10, D50, and D90
gradually increased with increasing particle size, yet the values of specific surface area
presented an opposite trend. Generally speaking, the median diameter of dust (D50)
should be smaller than the corresponding upper bound value of the particle size, as shown
by the particle size of 0 to 63 μm, 63 to 125 μm, 125 to 250 μm, and 250 to 500 μm. P.
massoniana dust had median diameters of 34 μm, 57 μm, 120 μm, and 219 μm,
respectively, and P. massoniana dust showed a median diameter of 30 μm, 66 μm, 162
μm, and 303 μm. However, for P. alba dust, the median diameters were 38 μm, 89 μm,
180 μm, and 566 μm, respectively. Herein a median diameter of 566 μm was larger than
the corresponding upper bound value of the particle size, 250 to 500 μm. This
phenomenon can be explained from the morphology of wood dust samples, as shown in
Figs. 2 through 4. Dust from P. alba had a higher length to diameter ratio, and the long
needle shapes can pass through the lengthwise portion of the sieve. In addition, in the
same particle size, the D10, D50, and D90 values of P. alba dust were greater than those of
P. massoniana and C. camphora dust. This is mainly attributed to P. alba dust’s slender
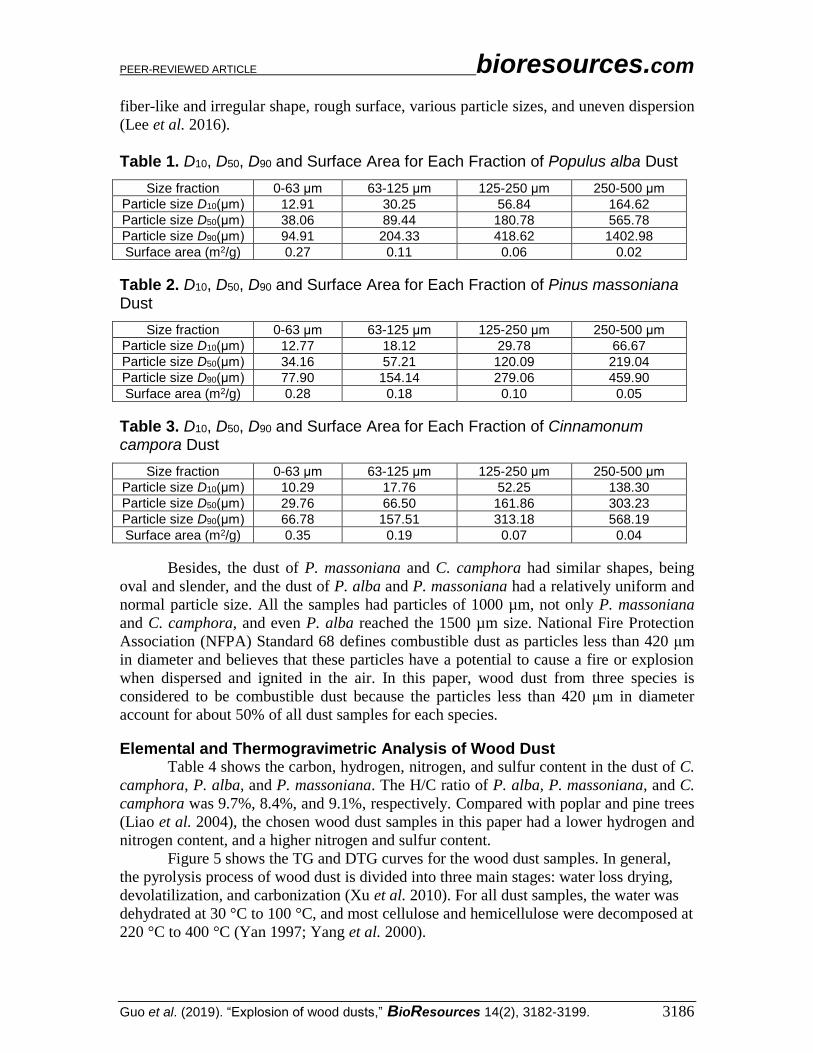
PEER-REVIEWED ARTICLE bioresources.com
Guo et al. (2019). “Explosion of wood dusts,” BioResources 14(2), 3182-3199. 3186
fiber-like and irregular shape, rough surface, various particle sizes, and uneven dispersion
(Lee et al. 2016).
Table 1. D10, D50, D90 and Surface Area for Each Fraction of Populus alba Dust
Size fraction 0-63 μm 63-125 μm 125-250 μm 250-500 μm Particle size D10(μm) 12.91 30.25 56.84 164.62 Particle size D50(μm) 38.06 89.44 180.78 565.78 Particle size D90(μm) 94.91 204.33 418.62 1402.98 Surface area (m2/g) 0.27 0.11 0.06 0.02
Table 2. D10, D50, D90 and Surface Area for Each Fraction of Pinus massoniana Dust
Size fraction 0-63 μm 63-125 μm 125-250 μm 250-500 μm Particle size D10(μm) 12.77 18.12 29.78 66.67 Particle size D50(μm) 34.16 57.21 120.09 219.04 Particle size D90(μm) 77.90 154.14 279.06 459.90 Surface area (m2/g) 0.28 0.18 0.10 0.05
Table 3. D10, D50, D90 and Surface Area for Each Fraction of Cinnamonum campora Dust
Size fraction 0-63 μm 63-125 μm 125-250 μm 250-500 μm Particle size D10(μm) 10.29 17.76 52.25 138.30 Particle size D50(μm) 29.76 66.50 161.86 303.23 Particle size D90(μm) 66.78 157.51 313.18 568.19 Surface area (m2/g) 0.35 0.19 0.07 0.04
Besides, the dust of P. massoniana and C. camphora had similar shapes, being
oval and slender, and the dust of P. alba and P. massoniana had a relatively uniform and
normal particle size. All the samples had particles of 1000 µm, not only P. massoniana
and C. camphora, and even P. alba reached the 1500 µm size. National Fire Protection
Association (NFPA) Standard 68 defines combustible dust as particles less than 420 μm
in diameter and believes that these particles have a potential to cause a fire or explosion
when dispersed and ignited in the air. In this paper, wood dust from three species is
considered to be combustible dust because the particles less than 420 μm in diameter
account for about 50% of all dust samples for each species. Elemental and Thermogravimetric Analysis of Wood Dust
Table 4 shows the carbon, hydrogen, nitrogen, and sulfur content in the dust of C.
camphora, P. alba, and P. massoniana. The H/C ratio of P. alba, P. massoniana, and C.
camphora was 9.7%, 8.4%, and 9.1%, respectively. Compared with poplar and pine trees
(Liao et al. 2004), the chosen wood dust samples in this paper had a lower hydrogen and
nitrogen content, and a higher nitrogen and sulfur content.
Figure 5 shows the TG and DTG curves for the wood dust samples. In general,
the pyrolysis process of wood dust is divided into three main stages: water loss drying,
devolatilization, and carbonization (Xu et al. 2010). For all dust samples, the water was
dehydrated at 30 °C to 100 °C, and most cellulose and hemicellulose were decomposed at
220 °C to 400 °C (Yan 1997; Yang et al. 2000).
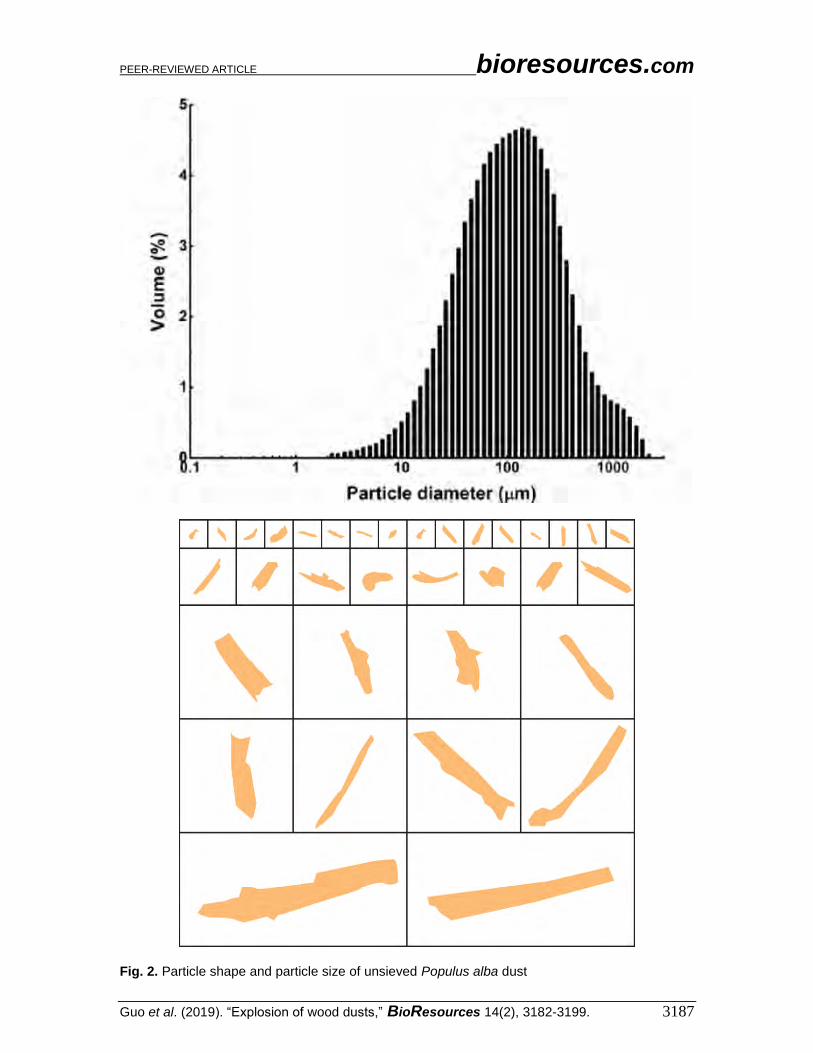
PEER-REVIEWED ARTICLE bioresources.com
Guo et al. (2019). “Explosion of wood dusts,” BioResources 14(2), 3182-3199. 3187
Fig. 2. Particle shape and particle size of unsieved Populus alba dust
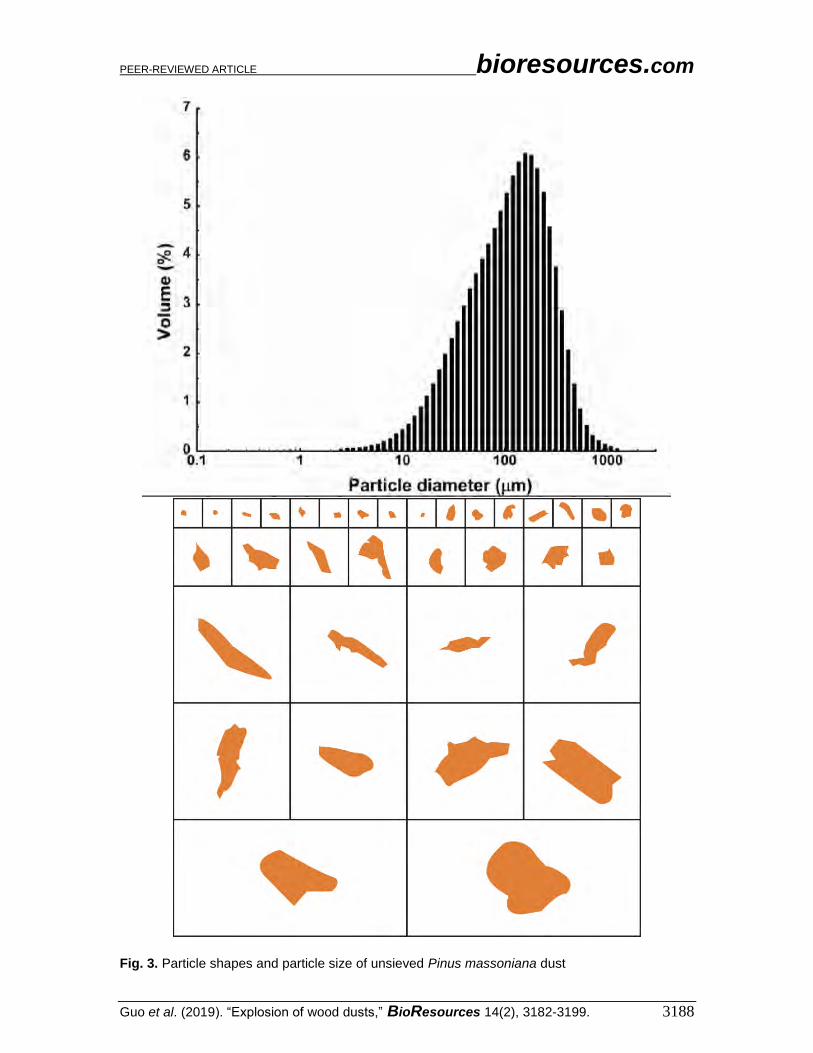
PEER-REVIEWED ARTICLE bioresources.com
Guo et al. (2019). “Explosion of wood dusts,” BioResources 14(2), 3182-3199. 3188
Fig. 3. Particle shapes and particle size of unsieved Pinus massoniana dust
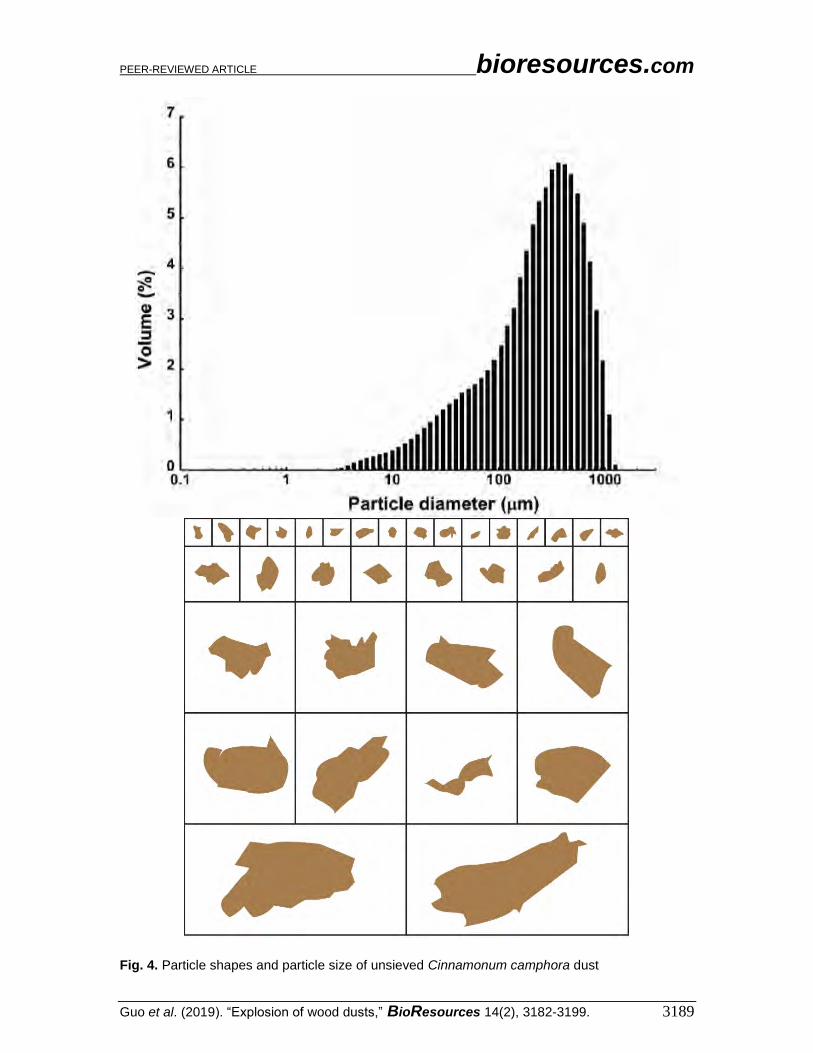
PEER-REVIEWED ARTICLE bioresources.com
Guo et al. (2019). “Explosion of wood dusts,” BioResources 14(2), 3182-3199. 3189
Fig. 4. Particle shapes and particle size of unsieved Cinnamonum camphora dust
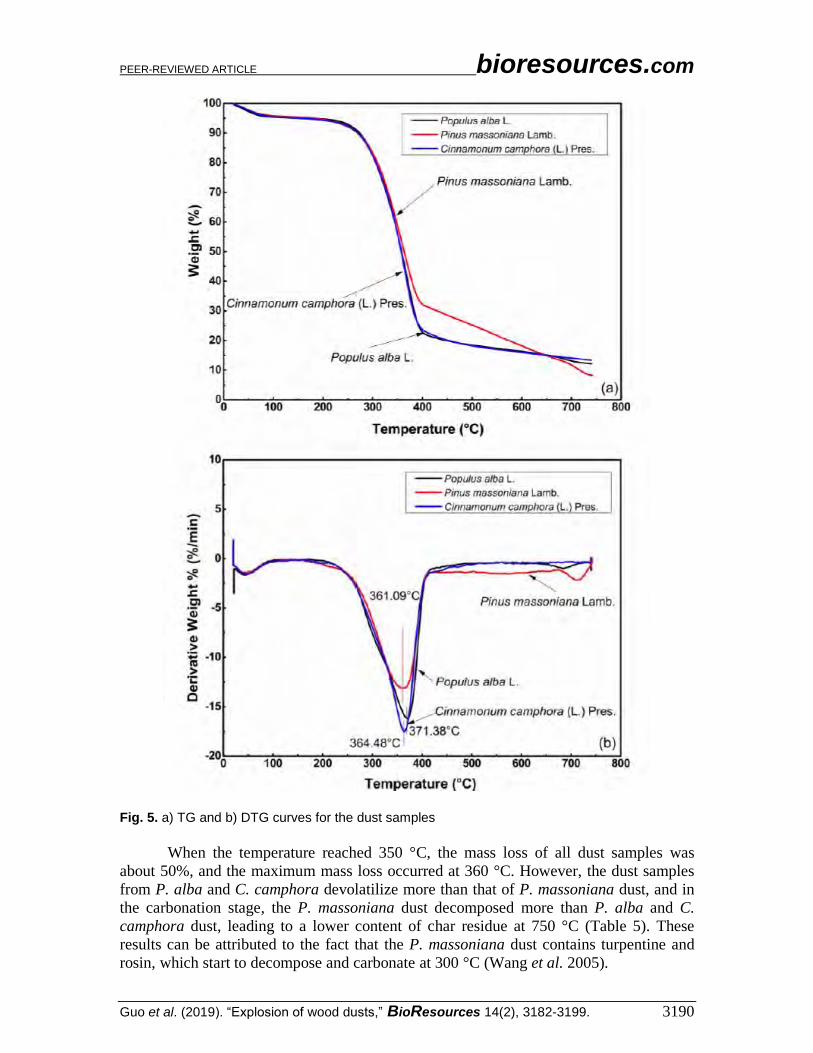
PEER-REVIEWED ARTICLE bioresources.com
Guo et al. (2019). “Explosion of wood dusts,” BioResources 14(2), 3182-3199. 3190
Fig. 5. a) TG and b) DTG curves for the dust samples
When the temperature reached 350 °C, the mass loss of all dust samples was
about 50%, and the maximum mass loss occurred at 360 °C. However, the dust samples
from P. alba and C. camphora devolatilize more than that of P. massoniana dust, and in
the carbonation stage, the P. massoniana dust decomposed more than P. alba and C.
camphora dust, leading to a lower content of char residue at 750 °C (Table 5). These
results can be attributed to the fact that the P. massoniana dust contains turpentine and
rosin, which start to decompose and carbonate at 300 °C (Wang et al. 2005).
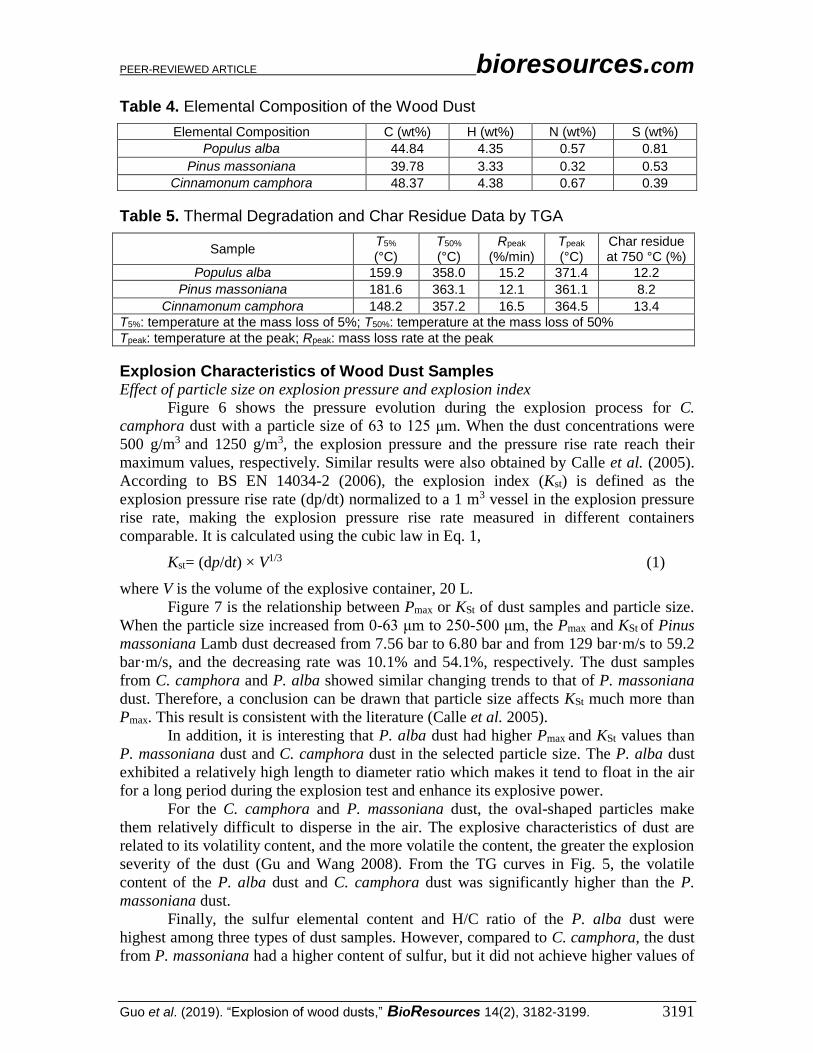
PEER-REVIEWED ARTICLE bioresources.com
Guo et al. (2019). “Explosion of wood dusts,” BioResources 14(2), 3182-3199. 3191
Table 4. Elemental Composition of the Wood Dust Elemental Composition C (wt%) H (wt%) N (wt%) S (wt%)
Populus alba 44.84 4.35 0.57 0.81 Pinus massoniana 39.78 3.33 0.32 0.53
Cinnamonum camphora 48.37 4.38 0.67 0.39 Table 5. Thermal Degradation and Char Residue Data by TGA
Sample T5% (°C)
T50% (°C)
Rpeak (%/min)
Tpeak (°C)
Char residue at 750 °C (%)
Populus alba 159.9 358.0 15.2 371.4 12.2 Pinus massoniana 181.6 363.1 12.1 361.1 8.2
Cinnamonum camphora 148.2 357.2 16.5 364.5 13.4 T5%: temperature at the mass loss of 5%; T50%: temperature at the mass loss of 50% Tpeak: temperature at the peak; Rpeak: mass loss rate at the peak Explosion Characteristics of Wood Dust Samples Effect of particle size on explosion pressure and explosion index
Figure 6 shows the pressure evolution during the explosion process for C.
camphora dust with a particle size of 63 to 125 μm. When the dust concentrations were
500 g/m3 and 1250 g/m3, the explosion pressure and the pressure rise rate reach their
maximum values, respectively. Similar results were also obtained by Calle et al. (2005).
According to BS EN 14034-2 (2006), the explosion index (Kst) is defined as the
explosion pressure rise rate (dp/dt) normalized to a 1 m3 vessel in the explosion pressure
rise rate, making the explosion pressure rise rate measured in different containers
comparable. It is calculated using the cubic law in Eq. 1,
Kst= (dp/dt) × V1/3 (1)
where V is the volume of the explosive container, 20 L.
Figure 7 is the relationship between Pmax or KSt of dust samples and particle size.
When the particle size increased from 0-63 μm to 250-500 μm, the Pmax and KSt of Pinus
massoniana Lamb dust decreased from 7.56 bar to 6.80 bar and from 129 bar·m/s to 59.2
bar·m/s, and the decreasing rate was 10.1% and 54.1%, respectively. The dust samples
from C. camphora and P. alba showed similar changing trends to that of P. massoniana
dust. Therefore, a conclusion can be drawn that particle size affects KSt much more than
Pmax. This result is consistent with the literature (Calle et al. 2005).
In addition, it is interesting that P. alba dust had higher Pmax and KSt values than
P. massoniana dust and C. camphora dust in the selected particle size. The P. alba dust
exhibited a relatively high length to diameter ratio which makes it tend to float in the air
for a long period during the explosion test and enhance its explosive power.
For the C. camphora and P. massoniana dust, the oval-shaped particles make
them relatively difficult to disperse in the air. The explosive characteristics of dust are
related to its volatility content, and the more volatile the content, the greater the explosion
severity of the dust (Gu and Wang 2008). From the TG curves in Fig. 5, the volatile
content of the P. alba dust and C. camphora dust was significantly higher than the P.
massoniana dust.
Finally, the sulfur elemental content and H/C ratio of the P. alba dust were
highest among three types of dust samples. However, compared to C. camphora, the dust
from P. massoniana had a higher content of sulfur, but it did not achieve higher values of
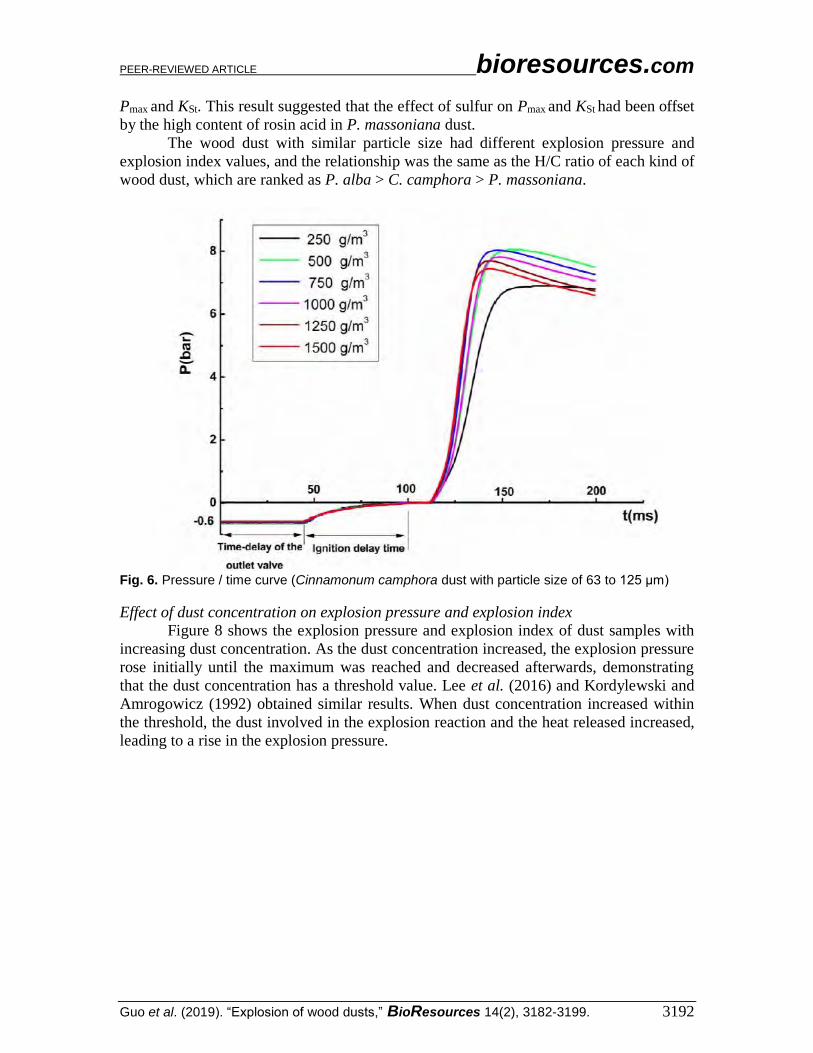
PEER-REVIEWED ARTICLE bioresources.com
Guo et al. (2019). “Explosion of wood dusts,” BioResources 14(2), 3182-3199. 3192
Pmax and KSt. This result suggested that the effect of sulfur on Pmax and KSt had been offset
by the high content of rosin acid in P. massoniana dust.
The wood dust with similar particle size had different explosion pressure and
explosion index values, and the relationship was the same as the H/C ratio of each kind of
wood dust, which are ranked as P. alba > C. camphora > P. massoniana.
Fig. 6. Pressure / time curve (Cinnamonum camphora dust with particle size of 63 to 125 μm) Effect of dust concentration on explosion pressure and explosion index
Figure 8 shows the explosion pressure and explosion index of dust samples with
increasing dust concentration. As the dust concentration increased, the explosion pressure
rose initially until the maximum was reached and decreased afterwards, demonstrating
that the dust concentration has a threshold value. Lee et al. (2016) and Kordylewski and
Amrogowicz (1992) obtained similar results. When dust concentration increased within
the threshold, the dust involved in the explosion reaction and the heat released increased,
leading to a rise in the explosion pressure.
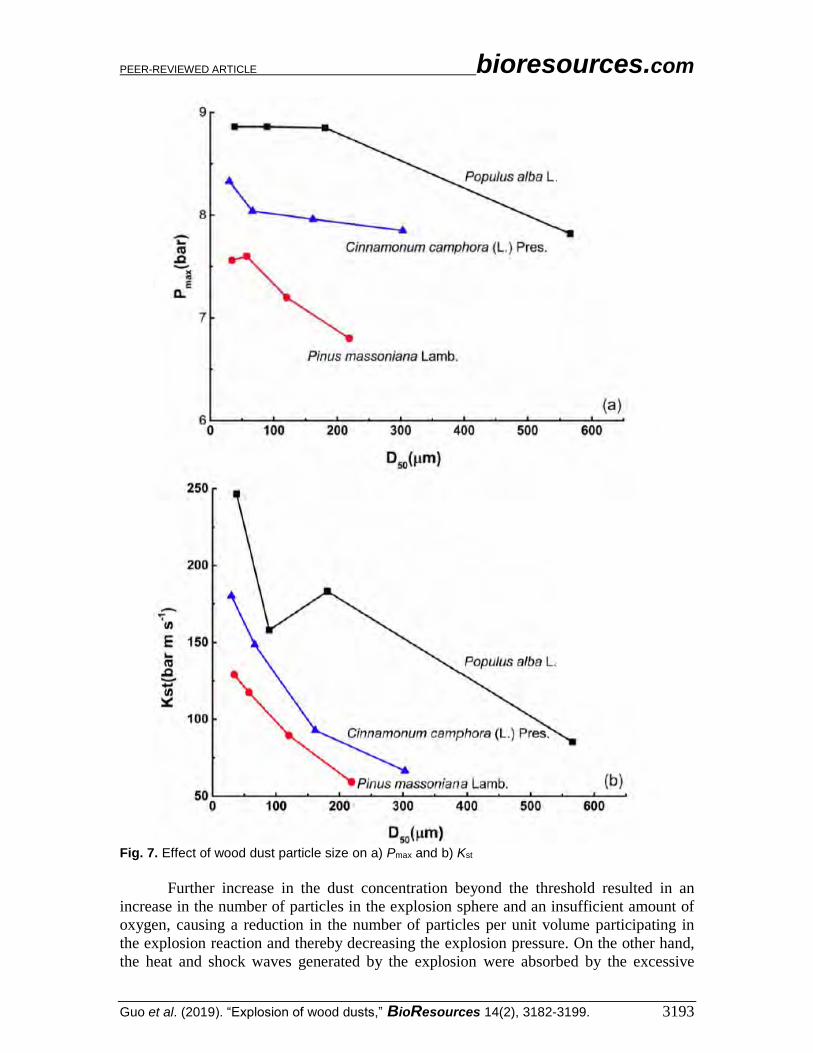
PEER-REVIEWED ARTICLE bioresources.com
Guo et al. (2019). “Explosion of wood dusts,” BioResources 14(2), 3182-3199. 3193
Fig. 7. Effect of wood dust particle size on a) Pmax and b) Kst
Further increase in the dust concentration beyond the threshold resulted in an
increase in the number of particles in the explosion sphere and an insufficient amount of
oxygen, causing a reduction in the number of particles per unit volume participating in
the explosion reaction and thereby decreasing the explosion pressure. On the other hand,
the heat and shock waves generated by the explosion were absorbed by the excessive

PEER-REVIEWED ARTICLE bioresources.com
Guo et al. (2019). “Explosion of wood dusts,” BioResources 14(2), 3182-3199. 3194
dust, which caused the heat released by the reaction to be less than the heat lost by the
absorption. This hindered the spread of the flame and eventually lead to the downward
trend of the dust explosion. Finally, the excessive dust in the explosion sphere can also
reduce the explosive level and efficiency of the gunpowder.
Fig. 8. Effect of dust concentration on a) Pmax and b) Kst (particle size, 0 to 63 μm)
PEER-REVIEWED ARTICLE bioresources.com
Guo et al. (2019). “Explosion of wood dusts,” BioResources 14(2), 3182-3199. 3195
For different species, the threshold of dust concentration was not identical. For
example, for the dust of P. alba and P. massoniana, the threshold, 750 g/m3, was higher
than that of C. camphora, 500 g/m3. The thermal degradation data in Table 5 shows that
the mass loss rate of C. camphora dust first reached 5% at 148 °C. The higher the
concentration of C. camphora dust, the smaller the number of particles involved in the
subsequent explosion reaction, resulting in a lower dust concentration threshold.
The dust concentration values corresponding to the maximum explosion pressure
and the maximum pressure rise rate are different, as shown in Fig. 6. Obviously, the
maximum speed and the maximum acceleration of the explosion reaction do not
necessarily occur at the same time. Accordingly, in the testing procedure of the
explosion, a series of experiments were repeated for a range of dust concentrations. This
conclusion is consistent with the literature reports (Amyotte et al. 2012; Tascón et al.
2016; Cao et al. 2017).
Similarly, among the three types of wood dust with a particle size of 0 to 63 μm,
Populus alba dust exhibited the highest values of Pmax and KSt, and the Pinus massoniana
Lamb dust had the lowest.
Synergistic effects of particle size and dust concentration on the explosion severity of the
wood dust
Figure 8 shows that for the explosion pressure of the three types of wood dust, the
threshold of dust concentration is 500 g/m3 or 750 g/m3. The dust concentration of 500
g/m3 or 750 g/m3 were used as examples to discuss the synergistic effects of particle size
and dust concentration on explosion severity.
In Fig. 9, for the dust samples of P. alba and C. camphora with the same dust
concentration, the explosion pressure increased with decreasing particle size. The smaller
the particle size, the larger the specific surface area and the larger the contact area
between dust particles and the oxygen, resulting in faster heat release during burning.
Besides, the convective heat rate of the dust and the gas in the explosion sphere is
accelerated with decreasing particle size, thus shorting the ignition time of the dust.
However, for the P. massoniana dust with a dust concentration of 500 g/m3, the
explosion pressure did not reach above the changing trend, and its Pmax corresponded to
the particle size range of 63 to 125 m instead of 0 to 63 m. This result may be caused
by the fact that the P. massoniana dust contains a large amount of turpentine that makes
small dust reunion and thus reduces its explosion severity.
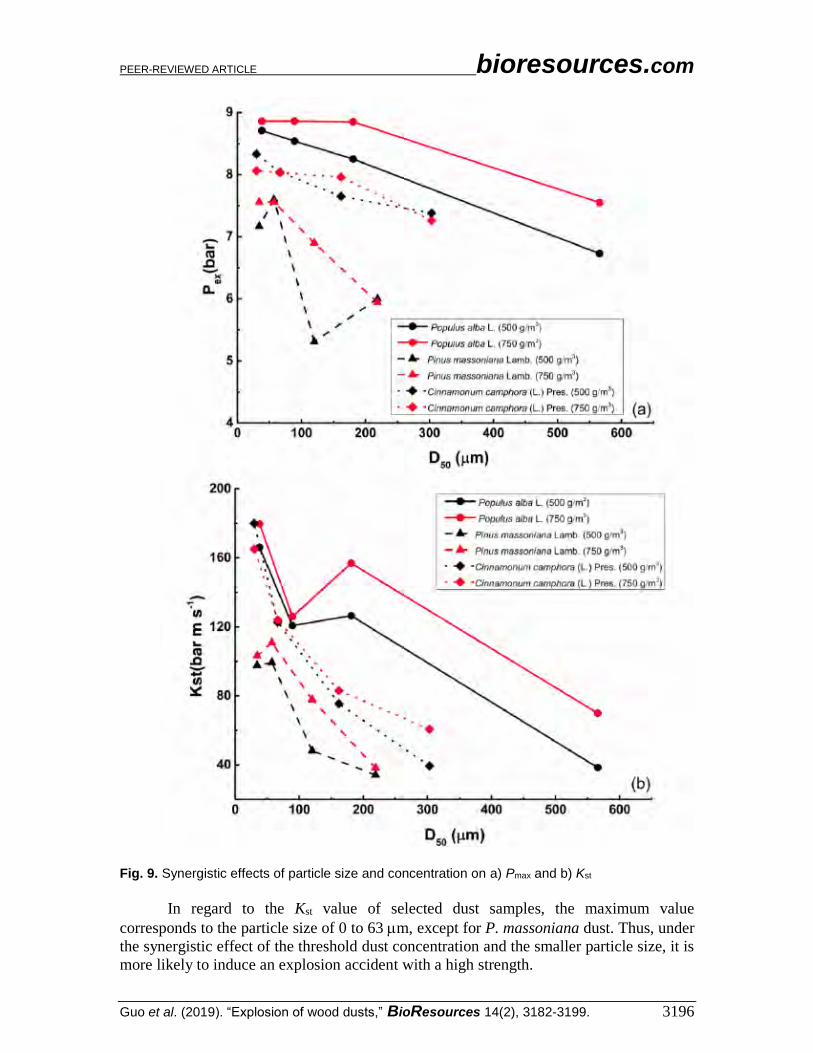
PEER-REVIEWED ARTICLE bioresources.com
Guo et al. (2019). “Explosion of wood dusts,” BioResources 14(2), 3182-3199. 3196
Fig. 9. Synergistic effects of particle size and concentration on a) Pmax and b) Kst
In regard to the Kst value of selected dust samples, the maximum value
corresponds to the particle size of 0 to 63 m, except for P. massoniana dust. Thus, under
the synergistic effect of the threshold dust concentration and the smaller particle size, it is
more likely to induce an explosion accident with a high strength.
PEER-REVIEWED ARTICLE bioresources.com
Guo et al. (2019). “Explosion of wood dusts,” BioResources 14(2), 3182-3199. 3197
CONCLUSIONS
1. The particle size affects the explosion index (KSt) much more than the maximum
explosion pressure (Pmax). Both KSt and Pmax present a decreasing trend with
increasing particle size, and the Pmax values are in the range of 7 to 9 bar, regardless
of species.
2. For different species, wood dust with similar particle size have different explosion
pressure and explosion index values, which are ranked as Populus alba L. >
Cinnamonum camphora (L.) Pres. > Pinus massoniana Lamb.
3. For the explosion pressure of wood dust samples with same particle size, the dust
concentration exhibited a threshold value that produced Pmax values of 750 g/m3, 750
g/m3, and 500 g/m3 for Populus alba dust, Pinus massoniana dust, and Cinnamonum
camphora dust, respectively.
4. Particle size and dust concentration have a synergistic effect on the explosion
pressure and explosion index. Wood dust with a smaller particle size is more likely to
explode at the threshold of dust concentration.
ACKNOWLEDGMENTS
This work was financially supported by “The National Key Research and
Development Program of China (Project No. 2016YFD0600703)”, and the “Postgraduate
Education Reform Project of Jiangsu Province.”
REFERENCES CITED
Abbasi, T., and Abbasi, S. A. (2007). “Dust explosions – Cases, causes, consequences,
and control,” Journal of Hazardous Materials 140, 7-44. DOI:
10.1016/j.jhazmat.2006.11.007
Amyotte, P. R., and Eckhoff, R. K. (2010). “Dust explosion causation, prevention and
mitigation: An overview,” Journal of Chemical Health and Safety 17, 15-28. DOI: 10.1016/j.jchas.2009.05.002
Amyotte, P. R., Cloney, C. T., Khan, F. I., and Ripley, R. C. (2012). “Dust explosion risk
moderation for flocculent dusts,” Journal of Loss Prevention in the Process Industries
25, 862-869. DOI: 10.1016/j.jlp.2012.05.007
BS EN 14034–1 (2004). “Determination of explosion characteristics of dust clouds–Part
1: Determination of the maximum explosion pressure Pmax of dust clouds,” European
Standard, London, England.
BS EN 14034-2 (2006). “Determination of explosion characteristics of dust clouds–Part
2: Determination of the maximum rate of explosion pressure rise (dt/dp) max of dust
clouds,” European Standard, London, UK.
Calle, S., Klaba, L., Thomas, D., Perrin, L., and Dufaud, O. (2005). “Influence of the size
distribution and concentration on wood dust explosion: Experiments and reaction
modelling,” Powder Technology 157, 144-148. DOI: 10.1016/j.powtec.2005.05.021
PEER-REVIEWED ARTICLE bioresources.com
Guo et al. (2019). “Explosion of wood dusts,” BioResources 14(2), 3182-3199. 3198
Calvo Olivares, R. D., and Rivera, S. S. (2014). “Database for accidents and incidents in
the biodiesel industry,” Journal of Loss Prevention in the Process Industries 29, 245-
261. DOI: 10.1016/j.jlp.2014.03.010
Cao, W., Qin, Q., Cao, W., Lan, Y., Chen, T., and Xu, S. (2017). “Experimental and
numerical studies on the explosion severities of coal dust/air mixtures in a 20-L
spherical vessel,” Powder Technology 310, 17-23. DOI: 10.1016/j.powtec.2017.01.019
Cashdollar, K. L. (2000). “Overview of dust explosibility characteristics,” Journal of
Loss Prevention in the Process Industries 13, 183-199. DOI: 10.1016/s0950-
4230(99)00039-x
Eckhoff, R. K. (2005). “Current status and expected future trends in dust explosion
research,” Journal of Loss Prevention in the Process Industries 18, 225-237. DOI: 10.1016/j.jlp.2005.06.012
Eckhoff, R. K. (2009). “Dust explosion prevention and mitigation, status and
developments in basic knowledge and in practical application,” International Journal
of Chemical Engineering, 1-12. DOI: 10.1155/2009/569825
Gu, J. L., and Wang, P. (2008). “Discuss of powder explode through a wood chip explode
accident,” Fire Science and Technology, 378-381. DOI: 10.3969/j.issn.1009-
0029.2008.05.018
Hedlund, F. H., Astad, J., and Nichols, J. (2014). “Inherent hazards, poor reporting and
limited learning in the solid biomass energy sector: A case study of a wheel loader
igniting wood dust, leading to fatal explosion at wood pellet manufacturer,” Biomass
and Bioenergy 66, 450-459. DOI: 10.1016/j.biombioe.2014.03.039
Huescar Medina, C., Phylaktou, H. N., Sattar, H., Andrews, G. E., and Gibbs, B. M.
(2013). “The development of an experimental method for the determination of the
minimum explosible concentration of biomass powders,” Biomass Bioenergy 53, 9-
104. DOI: 10.1016/j.biombioe.2013.03.008
Huescar Medina, C., Phylaktou, H. N., Andrews, G. E., and Gibbs, B. M. (2015).
“Explosion characteristics of pulverised torrefied and raw Norway spruce (Picea
abies) and Southern pine (Pinus palustris) in comparison to bituminous coal,”
Biomass and Bioenergy 79, 116-127. DOI: 10.1016/j.biombioe.2015.04.001
Kordylewski, W., and Amrogowicz, J. (1992). “Comparison of NaHCO3, and NH4H2PO4,
effectiveness as dust explosion suppressants,” Combustion & Flame 90, 344-345.
DOI: 10.1016/0010-2180(92)90093-5
Krentowski, J. (2015). “Disaster of an industrial hall caused by an explosion of wood
dust and fire,” Engineering Failure Analysis 56, 403-411.
DOI: 10.1016/j.engfailanal.2014.12.015
Lee, M. C., Kim, Y. S., and Rie, D. H. (2016). “Analysis of explosion characteristics of
combustible wood dust in confined system using the thermal decomposition rate and
mass loss rate,” Applied Thermal Engineering 109, 432-439. DOI: 10.1016/j.applthermaleng.2016.08.010
Liao, C. P., Wu, C. Z., Yan, Y. J., and Huang, H. T. (2004). “Chemical elemental
characteristics of biomass fuels in China,” Biomass & Bioenergy 27, 119-130. DOI: 10.1016/j.biombioe.2004.01.002
Nagy, J., and Verakis, H. C. (1983). Development and Control of Dust Explosions,
Marcel Dekker, New York.
PEER-REVIEWED ARTICLE bioresources.com
Guo et al. (2019). “Explosion of wood dusts,” BioResources 14(2), 3182-3199. 3199
NFPA 68 (2002). “Guide for venting of deflagrations,” National Fire Protection
Association, Quincy, MA, US.
State Administration of Work Safety of China. (2015). “Wood dust explosion in Inner
Mongolia,” (http://www.safehoo.com/ Laws/Notice/201502/382212.shtml), Accessed
2 February 2015.
Tascón, A., Ramírez-Gómez, Á., and Aguado, P. J. (2016). “Dust explosions in an
experimental test silo: Influence of length/diameter ratio on vent area sizes,”
Biosystems Engineering 148, 18-33. DOI: 10.1016/j.biosystemseng.2016.04.014
Wang, Q. F., Yang, X. N., and Zeng, Z. J. (2005). “Thermogravimetric study of the
pyrolysis of pine wood,” Guangdong Chemical Industry 12, 008. DOI:
10.3969/j.issn.1007-1865.2005.12.009
Xu, D. L., Sun, J., Chen, X. J., and Zhao, P. (2010). “Study on combustion and pyrolysis
characteristic of poplar bark,” Renewable Energy Resources, 38-40. DOI:
10.3969/j.issn.1671-5292.2010.02.010
Yan, H. (1997). “Study on chemical kinetics of wood pyrolysis by thermogravimetric
analysis,” China Wood Industry 11, 14-18.
Yan, X. Q., and Yu, J. L. (2012). “Dust explosion incidents in China,” Process Safety
Progress 31, 187-189. DOI: 10.1002/prs.11482
Yang, W. B., Ma, S. C., and Gu, L. B. (2000). “Thermodynamic analysis of fire retardant
treated masson's Pine,” China Wood Industry 14, 10-12. DOI: 10.19455/j.mcgy.2000.05.003
Yuan, Z., Khakzad, N., Khan, F., and Amyotte, P. (2015). “Dust explosions: A threat to
the process industries,” Process Safety and Environmental Protection 98, 57-71. DOI: 10.1016/j.psep.2015.06.008
Article submitted: November 20, 2018; Peer review completed: January 26, 2019;
Revised version received: February 13, 2019; Accepted: February 14, 2019; Published:
February 27, 2019.
DOI: 10.15376/biores.14.2.3182-3199
PAPERmaking!
FROM THE PUBLISHERS OF PAPER TECHNOLOGY
Volume 5, Number 1, 2019
Page 1 of 7 Article 7 – Agriwaste
Application of soda-AQ pulping to agricultural waste (okra stalks) from Sudan Safaa Hassan Omer
1, Tarig Osman Khider
2* , Osman Taha Elzaki
3, Salaheldin Dafalla Mohieldin
3 and
Suhair Kamal Shomeina3.
Abelmoschus esculentus okra as whole stalks was examined for its suitability for pulp and paper production. It’s, fiber dimensions, morphological and chemical characteristics were reported. The pulping trials with soda- Anthraquinone (AQ,) at different chemical charges. Application of 21% as NaOH with 0.1% AQ gave good results in degree of delignification, mechanical properties. Utilization of okra pulps and blender is recommended due to good pulp properties. Evaluation of general characteristics of okra stalks in terms of fiber dimensions morphological indices, chemical components, Soda-AQ cooking and to study their suitability for paper production. Okra Fiber dimension evaluation done after maceration with a mixture of 30% hydrogen peroxide and acetic acid (1:1) for core and bark parts separately and was carried out under microscope staining with aqueous safranin. The Soda-AQ cooks at different active alkali levels were calculated as NaOH on oven dry raw material. The fibers from okra stalks studied (core and bark) were in the range of hardwood fibers, with short fiber length, especially the core with more or less moderate walls, narrow lumen and fiber width. The fiber width of bark was medium –narrow with medium wall thickness. The ash content was rather high whereas the silica content was comparatively high The hot water extractives from okra stalks was (4.1%), cold water (0.4) ethanol/ cyclohexane (1.1), ethanol extractives (1.2%) and 1% NaOH (27.6%) were rather high. The cellulose (Kurschner-Hoffer) was (48.5%) The lignin content was (15.3%) which was relatively moderate. The use of 0.1% AQ enhanced the delignification in the three trials applied. The screened yield increase with increase of chemical dose applied while the rejects decrease. When 21% NaOH was applied, the screened yield was 32.2% with negligible amount of rejects, however with lower alkali charge 18% the screened yield was decreased to 28% with very low rejects 1.5%. on the other hand rejects were increased to 7% when 15% NaOH was applied with very low screened yield 19%.The pulps produced from okra soda-AQ are suitable for production of printing and writing papers and it is advisable to use them in blending due to good papermaking properties. Contact information: 1University of Bahri, College of Natural Resources and Environmental Studies, Khartoum, Sudan.
2Industries Department, College of Applied and Industrial Sciences, University of Bahri Sudan, P.O. Box
1606, Khartoum, Sudan. 3Cellulose Chemistry and Technology Research Unit, National Centre of Research, Khartoum, Sudan.
Omer et al. BMC Chemical Engineering (2019) 1:6 https://doi.org/10.1186/s42480-019-0005-9
The Paper Industry Technical Association (PITA) is an independent organisation which operates for the general benefit of its members – both individual and corporate – dedicated to promoting and improving the technical and scientific knowledge of those working in the UK pulp and paper industry. Formed in 1960, it serves the Industry, both manufacturers and suppliers, by providing a forum for members to meet and network; it organises visits, conferences and training seminars that cover all aspects of papermaking science. It also publishes the prestigious journal Paper Technology International and the PITA Annual Review, both sent free to members, and a range of other technical publications which include conference proceedings and the acclaimed Essential
Guide to Aqueous Coating.
RESEARCH ARTICLE Open Access
Application of soda-AQ pulping toagricultural waste (okra stalks) from SudanSafaa Hassan Omer1, Tarig Osman Khider2* , Osman Taha Elzaki3, Salaheldin Dafalla Mohieldin3 andSuhair Kamal Shomeina3
Abstract
Abelmoschus esculentus okra as whole stalks was examined for its suitability for pulp and paper production. It’s, fiberdimensions, morphological and chemical characteristics were reported. The pulping trials with soda- Anthraquinone(AQ,) at different chemical charges. Application of 21% as NaOH with 0.1% AQ gave good results in degree ofdelignification, mechanical properties. Utilization of okra pulps and blender is recommended due to good pulpproperties. Evaluation of general characteristics of okra stalks in terms of fiber dimensions morphological indices,chemical components, Soda-AQ cooking and to study their suitability for paper production. Okra Fiber dimensionevaluation done after maceration with a mixture of 30% hydrogen peroxide and acetic acid (1:1) for core and barkparts separately and was carried out under microscope staining with aqueous safranin. The Soda-AQ cooks atdifferent active alkali levels were calculated as NaOH on oven dry raw material. The fibers from okra stalks studied(core and bark) were in the range of hardwood fibers, with short fiber length, especially the core with more or lessmoderate walls, narrow lumen and fiber width. The fiber width of bark was medium –narrow with medium wallthickness. The ash content was rather high whereas the silica content was comparatively high The hot waterextractives from okra stalks was (4.1%), cold water (0.4) ethanol/ cyclohexane (1.1), ethanol extractives (1.2%) and 1%NaOH (27.6%) were rather high. The cellulose (Kurschner-Hoffer) was (48.5%) The lignin content was (15.3%) which wasrelatively moderate. The use of 0.1% AQ enhanced the delignification in the three trials applied. The screened yieldincrease with increase of chemical dose applied while the rejects decrease. When 21% NaOH was applied, thescreened yield was 32.2% with negligible amount of rejects, however with lower alkali charge 18% the screened yieldwas decreased to 28% with very low rejects 1.5%. on the other hand rejects were increased to 7% when 15% NaOHwas applied with very low screened yield 19%.The pulps produced from okra soda-AQ are suitable for production ofprinting and writing papers and it is advisable to use them in blending due to good papermaking properties.
Keywords: Abelmoschus esculentus stalks, Fiber dimensions, Chemical composition, Soda-AQ cooking, Pulp properties
High lights
� Okra fruits is important vegetable but its stalks isburned in tropical and suptropical areas
� Soda-AQ cooking is suitable methods for pulpingthe agricultural residues.
� There is seldom literature on pulping of okra stalksand rational utilization is highly needed.
� In large areas in Asia and Africa, these stalks areburned and treated as waste.
� Production of paper pulps in good paper propertieswith low lignin content (kappa number) andimproved viscosity could be expected.
BackgroundNon woody plants and agricultural residues as flax, cot-ton, bamboo and cereal straw were used extensively inpulp and paper production. However okra Abelmoschusesculentus stalks could be one of promising non woodyplants in paper production [1, 2]. The family of okra(Abelmoschus esculentus) and cotton (Gossypium hirsu-tum) is Malvaceae, okra is one of the oldest cultivatedcrops, it was recorded by the Egyptians in 1216 A.D.,however there was strong evidence, okra was cultivated
* Correspondence: [email protected] Department, College of Applied and Industrial Sciences, Universityof Bahri Sudan, P.O. Box 1606, Khartoum, SudanFull list of author information is available at the end of the article
BMC Chemical Engineering
© The Author(s). 2019 Open Access This article is distributed under the terms of the Creative Commons Attribution 4.0International License (http://creativecommons.org/licenses/by/4.0/), which permits unrestricted use, distribution, andreproduction in any medium, provided you give appropriate credit to the original author(s) and the source, provide a link tothe Creative Commons license, and indicate if changes were made. The Creative Commons Public Domain Dedication waiver(http://creativecommons.org/publicdomain/zero/1.0/) applies to the data made available in this article, unless otherwise stated.
Omer et al. BMC Chemical Engineering (2019) 1:6 https://doi.org/10.1186/s42480-019-0005-9
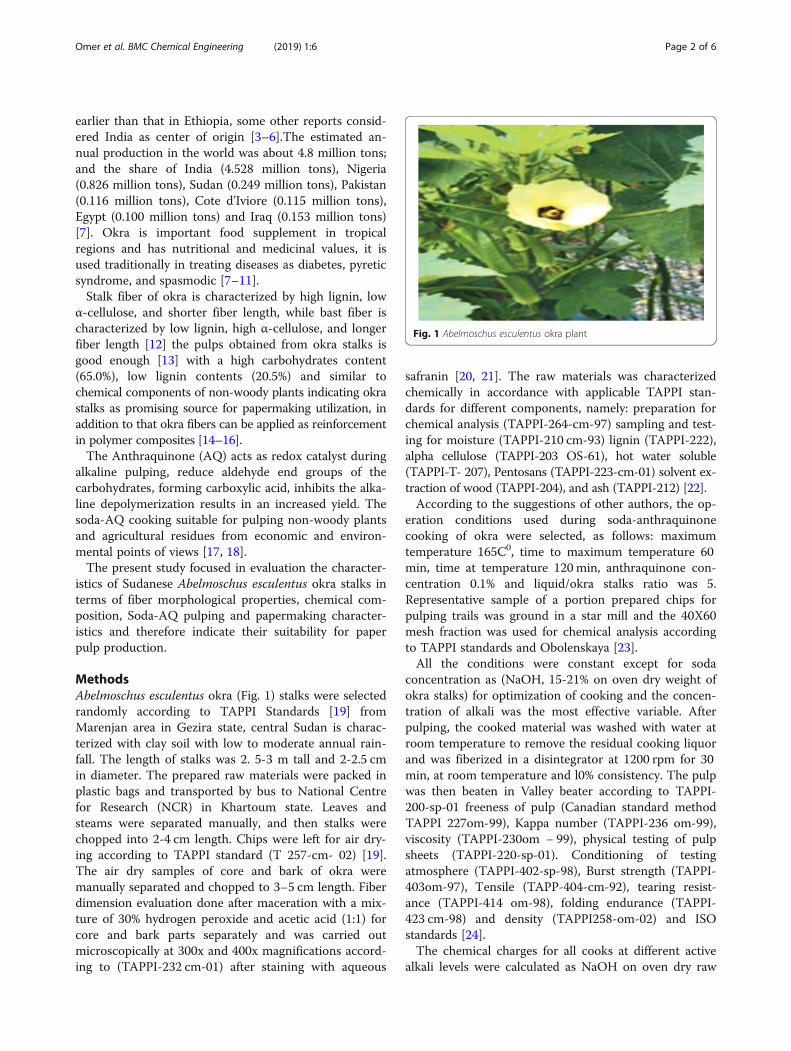
earlier than that in Ethiopia, some other reports consid-ered India as center of origin [3–6].The estimated an-nual production in the world was about 4.8 million tons;and the share of India (4.528 million tons), Nigeria(0.826 million tons), Sudan (0.249 million tons), Pakistan(0.116 million tons), Cote d’Iviore (0.115 million tons),Egypt (0.100 million tons) and Iraq (0.153 million tons)[7]. Okra is important food supplement in tropicalregions and has nutritional and medicinal values, it isused traditionally in treating diseases as diabetes, pyreticsyndrome, and spasmodic [7–11].Stalk fiber of okra is characterized by high lignin, low
α-cellulose, and shorter fiber length, while bast fiber ischaracterized by low lignin, high α-cellulose, and longerfiber length [12] the pulps obtained from okra stalks isgood enough [13] with a high carbohydrates content(65.0%), low lignin contents (20.5%) and similar tochemical components of non-woody plants indicating okrastalks as promising source for papermaking utilization, inaddition to that okra fibers can be applied as reinforcementin polymer composites [14–16].The Anthraquinone (AQ) acts as redox catalyst during
alkaline pulping, reduce aldehyde end groups of thecarbohydrates, forming carboxylic acid, inhibits the alka-line depolymerization results in an increased yield. Thesoda-AQ cooking suitable for pulping non-woody plantsand agricultural residues from economic and environ-mental points of views [17, 18].The present study focused in evaluation the character-
istics of Sudanese Abelmoschus esculentus okra stalks interms of fiber morphological properties, chemical com-position, Soda-AQ pulping and papermaking character-istics and therefore indicate their suitability for paperpulp production.
MethodsAbelmoschus esculentus okra (Fig. 1) stalks were selectedrandomly according to TAPPI Standards [19] fromMarenjan area in Gezira state, central Sudan is charac-terized with clay soil with low to moderate annual rain-fall. The length of stalks was 2. 5-3 m tall and 2-2.5 cmin diameter. The prepared raw materials were packed inplastic bags and transported by bus to National Centrefor Research (NCR) in Khartoum state. Leaves andsteams were separated manually, and then stalks werechopped into 2-4 cm length. Chips were left for air dry-ing according to TAPPI standard (T 257-cm- 02) [19].The air dry samples of core and bark of okra weremanually separated and chopped to 3–5 cm length. Fiberdimension evaluation done after maceration with a mix-ture of 30% hydrogen peroxide and acetic acid (1:1) forcore and bark parts separately and was carried outmicroscopically at 300x and 400x magnifications accord-ing to (TAPPI-232 cm-01) after staining with aqueous
safranin [20, 21]. The raw materials was characterizedchemically in accordance with applicable TAPPI stan-dards for different components, namely: preparation forchemical analysis (TAPPI-264-cm-97) sampling and test-ing for moisture (TAPPI-210 cm-93) lignin (TAPPI-222),alpha cellulose (TAPPI-203 OS-61), hot water soluble(TAPPI-T- 207), Pentosans (TAPPI-223-cm-01) solvent ex-traction of wood (TAPPI-204), and ash (TAPPI-212) [22].According to the suggestions of other authors, the op-
eration conditions used during soda-anthraquinonecooking of okra were selected, as follows: maximumtemperature 165C0, time to maximum temperature 60min, time at temperature 120 min, anthraquinone con-centration 0.1% and liquid/okra stalks ratio was 5.Representative sample of a portion prepared chips forpulping trails was ground in a star mill and the 40X60mesh fraction was used for chemical analysis accordingto TAPPI standards and Obolenskaya [23].All the conditions were constant except for soda
concentration as (NaOH, 15-21% on oven dry weight ofokra stalks) for optimization of cooking and the concen-tration of alkali was the most effective variable. Afterpulping, the cooked material was washed with water atroom temperature to remove the residual cooking liquorand was fiberized in a disintegrator at 1200 rpm for 30min, at room temperature and l0% consistency. The pulpwas then beaten in Valley beater according to TAPPI-200-sp-01 freeness of pulp (Canadian standard methodTAPPI 227om-99), Kappa number (TAPPI-236 om-99),viscosity (TAPPI-230om − 99), physical testing of pulpsheets (TAPPI-220-sp-01). Conditioning of testingatmosphere (TAPPI-402-sp-98), Burst strength (TAPPI-403om-97), Tensile (TAPP-404-cm-92), tearing resist-ance (TAPPI-414 om-98), folding endurance (TAPPI-423 cm-98) and density (TAPPI258-om-02) and ISOstandards [24].The chemical charges for all cooks at different active
alkali levels were calculated as NaOH on oven dry raw
Fig. 1 Abelmoschus esculentus okra plant
Omer et al. BMC Chemical Engineering (2019) 1:6 Page 2 of 6
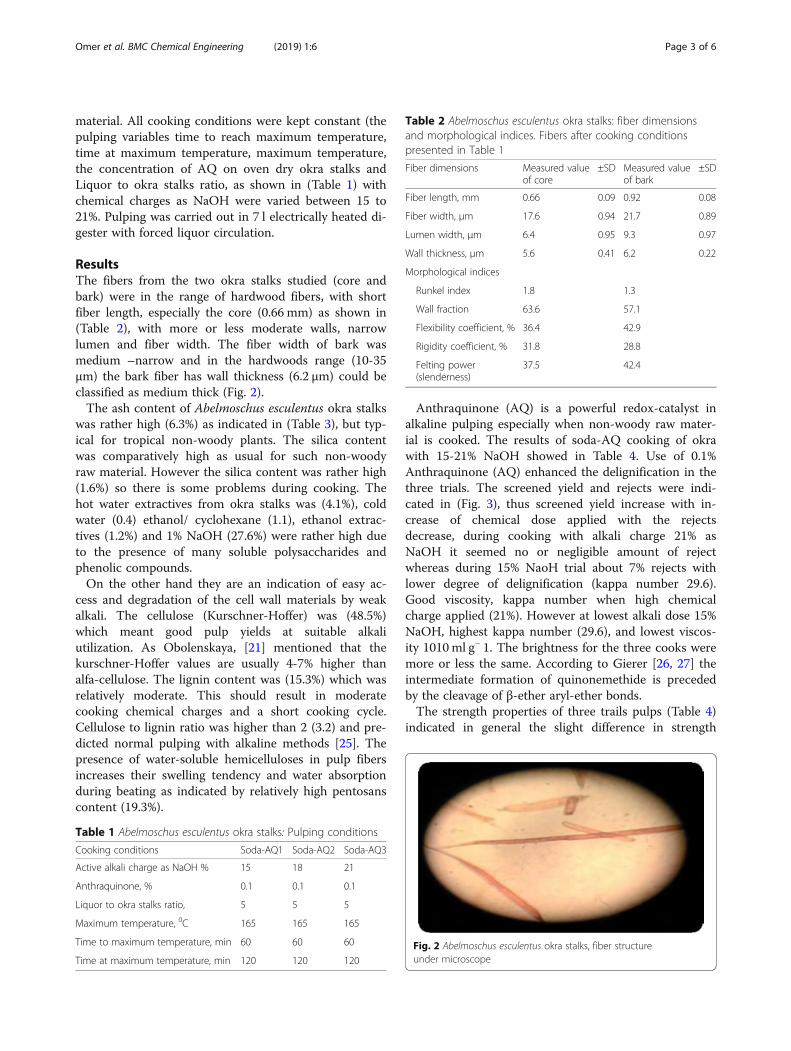
material. All cooking conditions were kept constant (thepulping variables time to reach maximum temperature,time at maximum temperature, maximum temperature,the concentration of AQ on oven dry okra stalks andLiquor to okra stalks ratio, as shown in (Table 1) withchemical charges as NaOH were varied between 15 to21%. Pulping was carried out in 7 l electrically heated di-gester with forced liquor circulation.
ResultsThe fibers from the two okra stalks studied (core andbark) were in the range of hardwood fibers, with shortfiber length, especially the core (0.66 mm) as shown in(Table 2), with more or less moderate walls, narrowlumen and fiber width. The fiber width of bark wasmedium –narrow and in the hardwoods range (10-35μm) the bark fiber has wall thickness (6.2 μm) could beclassified as medium thick (Fig. 2).The ash content of Abelmoschus esculentus okra stalks
was rather high (6.3%) as indicated in (Table 3), but typ-ical for tropical non-woody plants. The silica contentwas comparatively high as usual for such non-woodyraw material. However the silica content was rather high(1.6%) so there is some problems during cooking. Thehot water extractives from okra stalks was (4.1%), coldwater (0.4) ethanol/ cyclohexane (1.1), ethanol extrac-tives (1.2%) and 1% NaOH (27.6%) were rather high dueto the presence of many soluble polysaccharides andphenolic compounds.On the other hand they are an indication of easy ac-
cess and degradation of the cell wall materials by weakalkali. The cellulose (Kurschner-Hoffer) was (48.5%)which meant good pulp yields at suitable alkaliutilization. As Obolenskaya, [21] mentioned that thekurschner-Hoffer values are usually 4-7% higher thanalfa-cellulose. The lignin content was (15.3%) which wasrelatively moderate. This should result in moderatecooking chemical charges and a short cooking cycle.Cellulose to lignin ratio was higher than 2 (3.2) and pre-dicted normal pulping with alkaline methods [25]. Thepresence of water-soluble hemicelluloses in pulp fibersincreases their swelling tendency and water absorptionduring beating as indicated by relatively high pentosanscontent (19.3%).
Anthraquinone (AQ) is a powerful redox-catalyst inalkaline pulping especially when non-woody raw mater-ial is cooked. The results of soda-AQ cooking of okrawith 15-21% NaOH showed in Table 4. Use of 0.1%Anthraquinone (AQ) enhanced the delignification in thethree trials. The screened yield and rejects were indi-cated in (Fig. 3), thus screened yield increase with in-crease of chemical dose applied with the rejectsdecrease, during cooking with alkali charge 21% asNaOH it seemed no or negligible amount of rejectwhereas during 15% NaoH trial about 7% rejects withlower degree of delignification (kappa number 29.6).Good viscosity, kappa number when high chemicalcharge applied (21%). However at lowest alkali dose 15%NaOH, highest kappa number (29.6), and lowest viscos-ity 1010ml g− 1. The brightness for the three cooks weremore or less the same. According to Gierer [26, 27] theintermediate formation of quinonemethide is precededby the cleavage of β-ether aryl-ether bonds.The strength properties of three trails pulps (Table 4)
indicated in general the slight difference in strength
Table 1 Abelmoschus esculentus okra stalks: Pulping conditions
Cooking conditions Soda-AQ1 Soda-AQ2 Soda-AQ3
Active alkali charge as NaOH % 15 18 21
Anthraquinone, % 0.1 0.1 0.1
Liquor to okra stalks ratio, 5 5 5
Maximum temperature, 0C 165 165 165
Time to maximum temperature, min 60 60 60
Time at maximum temperature, min 120 120 120
Table 2 Abelmoschus esculentus okra stalks: fiber dimensionsand morphological indices. Fibers after cooking conditionspresented in Table 1
Fiber dimensions Measured valueof core
±SD Measured valueof bark
±SD
Fiber length, mm 0.66 0.09 0.92 0.08
Fiber width, μm 17.6 0.94 21.7 0.89
Lumen width, μm 6.4 0.95 9.3 0.97
Wall thickness, μm 5.6 0.41 6.2 0.22
Morphological indices
Runkel index 1.8 1.3
Wall fraction 63.6 57.1
Flexibility coefficient, % 36.4 42.9
Rigidity coefficient, % 31.8 28.8
Felting power(slenderness)
37.5 42.4
Fig. 2 Abelmoschus esculentus okra stalks, fiber structureunder microscope
Omer et al. BMC Chemical Engineering (2019) 1:6 Page 3 of 6
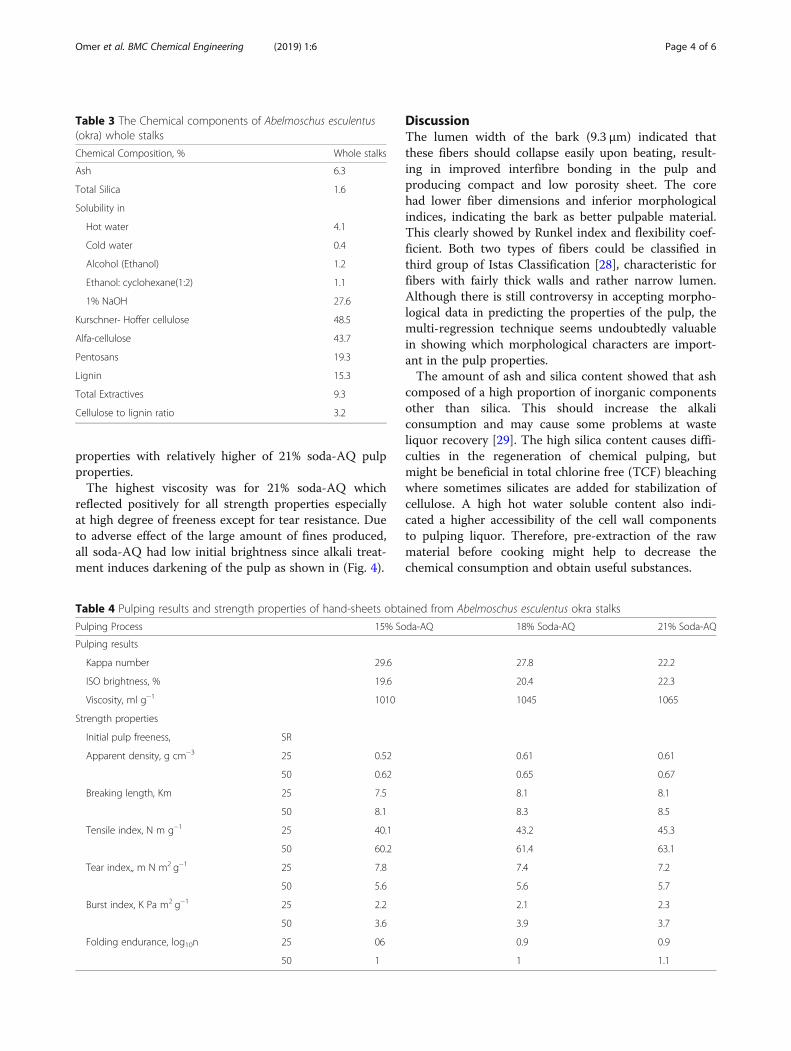
properties with relatively higher of 21% soda-AQ pulpproperties.The highest viscosity was for 21% soda-AQ which
reflected positively for all strength properties especiallyat high degree of freeness except for tear resistance. Dueto adverse effect of the large amount of fines produced,all soda-AQ had low initial brightness since alkali treat-ment induces darkening of the pulp as shown in (Fig. 4).
DiscussionThe lumen width of the bark (9.3 μm) indicated thatthese fibers should collapse easily upon beating, result-ing in improved interfibre bonding in the pulp andproducing compact and low porosity sheet. The corehad lower fiber dimensions and inferior morphologicalindices, indicating the bark as better pulpable material.This clearly showed by Runkel index and flexibility coef-ficient. Both two types of fibers could be classified inthird group of Istas Classification [28], characteristic forfibers with fairly thick walls and rather narrow lumen.Although there is still controversy in accepting morpho-logical data in predicting the properties of the pulp, themulti-regression technique seems undoubtedly valuablein showing which morphological characters are import-ant in the pulp properties.The amount of ash and silica content showed that ash
composed of a high proportion of inorganic componentsother than silica. This should increase the alkaliconsumption and may cause some problems at wasteliquor recovery [29]. The high silica content causes diffi-culties in the regeneration of chemical pulping, butmight be beneficial in total chlorine free (TCF) bleachingwhere sometimes silicates are added for stabilization ofcellulose. A high hot water soluble content also indi-cated a higher accessibility of the cell wall componentsto pulping liquor. Therefore, pre-extraction of the rawmaterial before cooking might help to decrease thechemical consumption and obtain useful substances.
Table 3 The Chemical components of Abelmoschus esculentus(okra) whole stalks
Chemical Composition, % Whole stalks
Ash 6.3
Total Silica 1.6
Solubility in
Hot water 4.1
Cold water 0.4
Alcohol (Ethanol) 1.2
Ethanol: cyclohexane(1:2) 1.1
1% NaOH 27.6
Kurschner- Hoffer cellulose 48.5
Alfa-cellulose 43.7
Pentosans 19.3
Lignin 15.3
Total Extractives 9.3
Cellulose to lignin ratio 3.2
Table 4 Pulping results and strength properties of hand-sheets obtained from Abelmoschus esculentus okra stalks
Pulping Process 15% Soda-AQ 18% Soda-AQ 21% Soda-AQ
Pulping results
Kappa number 29.6 27.8 22.2
ISO brightness, % 19.6 20.4 22.3
Viscosity, ml g−1 1010 1045 1065
Strength properties
Initial pulp freeness, SR
Apparent density, g cm−3 25 0.52 0.61 0.61
50 0.62 0.65 0.67
Breaking length, Km 25 7.5 8.1 8.1
50 8.1 8.3 8.5
Tensile index, N m g−1 25 40.1 43.2 45.3
50 60.2 61.4 63.1
Tear index,, m N m2 g−1 25 7.8 7.4 7.2
50 5.6 5.6 5.7
Burst index, K Pa m2 g−1 25 2.2 2.1 2.3
50 3.6 3.9 3.7
Folding endurance, log10n 25 06 0.9 0.9
50 1 1 1.1
Omer et al. BMC Chemical Engineering (2019) 1:6 Page 4 of 6
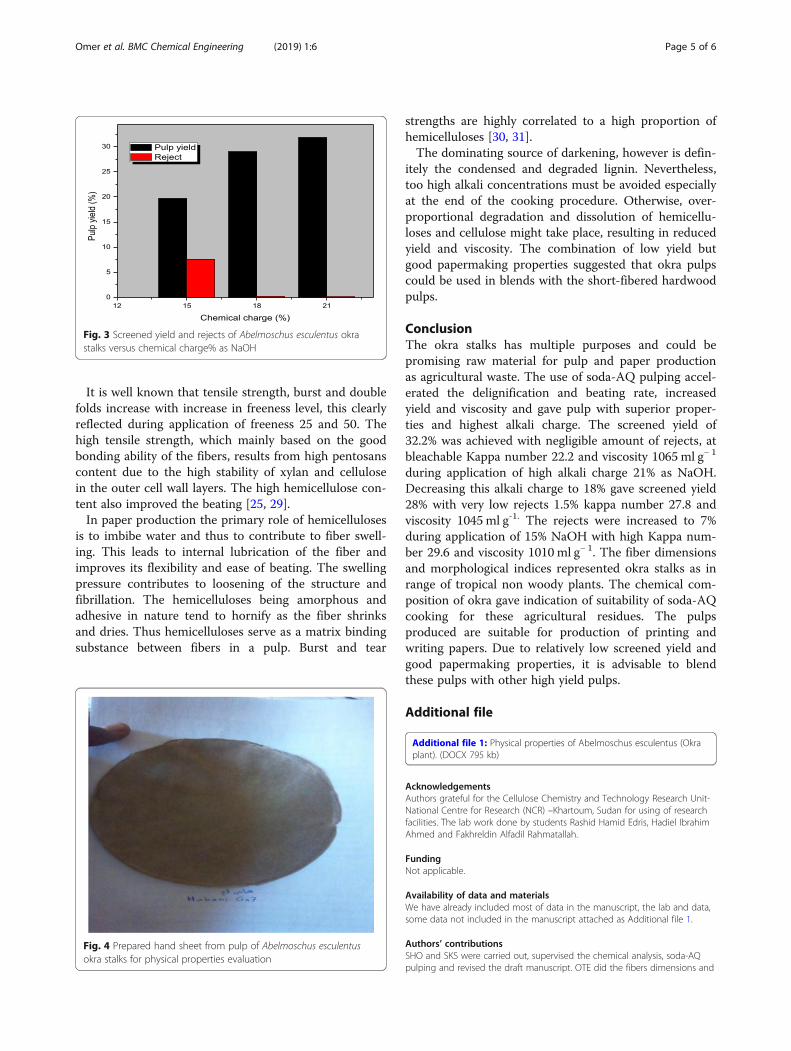
It is well known that tensile strength, burst and doublefolds increase with increase in freeness level, this clearlyreflected during application of freeness 25 and 50. Thehigh tensile strength, which mainly based on the goodbonding ability of the fibers, results from high pentosanscontent due to the high stability of xylan and cellulosein the outer cell wall layers. The high hemicellulose con-tent also improved the beating [25, 29].In paper production the primary role of hemicelluloses
is to imbibe water and thus to contribute to fiber swell-ing. This leads to internal lubrication of the fiber andimproves its flexibility and ease of beating. The swellingpressure contributes to loosening of the structure andfibrillation. The hemicelluloses being amorphous andadhesive in nature tend to hornify as the fiber shrinksand dries. Thus hemicelluloses serve as a matrix bindingsubstance between fibers in a pulp. Burst and tear
strengths are highly correlated to a high proportion ofhemicelluloses [30, 31].The dominating source of darkening, however is defin-
itely the condensed and degraded lignin. Nevertheless,too high alkali concentrations must be avoided especiallyat the end of the cooking procedure. Otherwise, over-proportional degradation and dissolution of hemicellu-loses and cellulose might take place, resulting in reducedyield and viscosity. The combination of low yield butgood papermaking properties suggested that okra pulpscould be used in blends with the short-fibered hardwoodpulps.
ConclusionThe okra stalks has multiple purposes and could bepromising raw material for pulp and paper productionas agricultural waste. The use of soda-AQ pulping accel-erated the delignification and beating rate, increasedyield and viscosity and gave pulp with superior proper-ties and highest alkali charge. The screened yield of32.2% was achieved with negligible amount of rejects, atbleachable Kappa number 22.2 and viscosity 1065 ml g− 1
during application of high alkali charge 21% as NaOH.Decreasing this alkali charge to 18% gave screened yield28% with very low rejects 1.5% kappa number 27.8 andviscosity 1045ml g-1. The rejects were increased to 7%during application of 15% NaOH with high Kappa num-ber 29.6 and viscosity 1010 ml g− 1. The fiber dimensionsand morphological indices represented okra stalks as inrange of tropical non woody plants. The chemical com-position of okra gave indication of suitability of soda-AQcooking for these agricultural residues. The pulpsproduced are suitable for production of printing andwriting papers. Due to relatively low screened yield andgood papermaking properties, it is advisable to blendthese pulps with other high yield pulps.
Additional file
Additional file 1: Physical properties of Abelmoschus esculentus (Okraplant). (DOCX 795 kb)
AcknowledgementsAuthors grateful for the Cellulose Chemistry and Technology Research Unit-National Centre for Research (NCR) –Khartoum, Sudan for using of researchfacilities. The lab work done by students Rashid Hamid Edris, Hadiel IbrahimAhmed and Fakhreldin Alfadil Rahmatallah.
FundingNot applicable.
Availability of data and materialsWe have already included most of data in the manuscript, the lab and data,some data not included in the manuscript attached as Additional file 1.
Authors’ contributionsSHO and SKS were carried out, supervised the chemical analysis, soda-AQpulping and revised the draft manuscript. OTE did the fibers dimensions and
Fig. 3 Screened yield and rejects of Abelmoschus esculentus okrastalks versus chemical charge% as NaOH
Fig. 4 Prepared hand sheet from pulp of Abelmoschus esculentusokra stalks for physical properties evaluation
Omer et al. BMC Chemical Engineering (2019) 1:6 Page 5 of 6

their analysis, review the draft manuscript, SDM supervised and carried outthe evaluation of paper properties and revised the draft manuscript. TOKwrote the draft manuscript, designed the study and supervised the work. Allauthors read and approved the final manuscript.
Ethics approvalNot applicable.
Consent for publicationNot applicable.
Competing interestsThe authors declare that they have no competing interests.
Publisher’s NoteSpringer Nature remains neutral with regard to jurisdictional claims inpublished maps and institutional affiliations.
Author details1University of Bahri, College of Natural Resources and Environmental Studies,Khartoum, Sudan. 2Industries Department, College of Applied and IndustrialSciences, University of Bahri Sudan, P.O. Box 1606, Khartoum, Sudan.3Cellulose Chemistry and Technology Research Unit, National Centre ofResearch, Khartoum, Sudan.
Received: 2 August 2018 Accepted: 21 January 2019
References1. Rodriguez A, Sanchez R, Eugenio M, Jimenez L. Soda- Anthraquinone
pulping of residues from oil palm industry. Cellul Chem Technol.2010;44(7–8):239–48.
2. Jimenez L, Rodriguez A, Perez A, Sarrano L. Alternative raw material andpulping process using clean technologies. Ind Crop Prod. 2008;28(1):11–6.
3. Lamont WJ. Okra—A Versatile Vegetable Crop. HortTechnology. 1999;9:2,179–84.
4. Singha P, Chauhana V, Tiwaria BK, Chauhan SS, Simonb S, Bilalc S, Abidia AB.An Overview on Okara (Abelmoschus esculentus) and its importance asNutritive Vegetable in the World. Int J Pharm Biol Sci. 2014;4(2):227–33.
5. Franklin AM, Suzuki, A and Hongu, N. (2015). Okra. The University of Arizonacooperative Extension1–4. http://cals.arizona.edu/yavapai/anr/hort/byg/.
6. Tong PS. Okra (Abelmoschus esculentus) – a popular crop and vegetable.Utar. Agriculture Sci J. 2016;2(3):39–41.
7. Shahid MR, Amjad M, Ziaf K, Jahangir MM, Ahmad S, Iqbal Q, Nawaz A.Growth, yield and seed production of okra as influenced by differentgrowth regulators. Pakistan J Agric Sci. 2013;50(3):387–92.
8. Moniruzzaman M, Maniruzzaman M, Gafur MA, Santu C. Lady’s finger Fibresfor possible use as a reinforcement in composite materials. J BiobasedMater Bioenergy. 2009;3:1–5.
9. Roy A, Shrivastava SL, Mandal SM. Functional properties of Okra Abelmoschusesculentus L (Moench): traditional claims and scientific evidences. Plant ScienceToday. 2014;1(3):121–30 https://doi.org/10.14719/pst.2014.1.3.63.
10. Gemed, H.F.Ratta , N.Desse, G.Ashagrie, H.Woldegiorgis, Z.andBeyene, F.Nutritional Quality and Health Benefits of Okra (Abelmoschus esculentus): AReview. J Food Process Technol. 2015;6:458. https://doi.org/10.4172/2157-7110.1000458.
11. Duman MN, Kocak E, Merdan DN, Mistik I. Nonwoven production fromagricultural okra wastes and investigation of their thermal conductivities.17th world textile conference AUTEX 2017- textiles - shaping the future.Mater Sci Eng. 2017;254.
12. Rahman M, Jahan MS, Rahman MM. Characterization and evaluation of okrafibre (abelmoschus esculentus) as a pulping raw material. J Sci TechnolForest Prod Process. 2012;2(5):1–17.
13. Atik C. Soda-AQ pulping of Okra stalks. Cellul Chem Technol. 2002;36(3–4):353–6.14. Okoro IA, Amadi OK. The use of okra derived cellulose biomass for the
removal and recovery of cd and Pb ions from the aqueous environment.Chem Sci Trans. 2012;1(3):683–7. https://doi.org/10.7598/cst2012.185.
15. Ullah, S. Kilpelainen, P. Ilvesniem, H. Pakkanen, H. and Alen, R. ChemicalCharacterization of Okra stalk (Abelmoschus esculentus) as Potential RawMaterial for Bio -refinery Utilization. Cellul Chem Technol. 2018;52(3–4).
16. Ullah S, Pakkanen H, Lehto J. A comparable study on the hot-watertreatment of wheat straw and okra stalk prior to delignification biomassconv. Bioref. 2018;8:413 https://doi.org/10.1007/s13399-018-0306-x.
17. Shakhes J, Zeinaly F, Marandi M, Saghafi T. The effect of processing variableson the soda and soda-AQ pulping of kenaf bast fibers. BioResources. 2011;6(4):4626–39.
18. Azizi M, Ainun Z, Rushdan I. Chemical, morphological, and technologicalproperties of cultivated Kenaf (Hibiscus cannabinus) fibers. BioRessources.2010;5(4):2112–22.
19. TAPPI 2002. TAPPI test methods TAPPI press, Atlanta.20. Horn, R. (1978) .Morphology of Pulp Fiber from Hardwoods and Influence
on Paper Strength. Forest Prods. Lab. Report, Madison. 312.21. Kirci H. Pulping industry. Trabzon: KTU Faculty of Forest Press, No: 86; 2006.22. Rodriguiz A, Sanchez R, Requejo A, Ferrer. Feasibility of Rice straw as a raw
material for the production of soda cellulose pulp. J Clean Prod. 2010;18:1084–91.
23. Obolenskaya AV, V P, Tshegolov GI, Akim NC, Kossoviz NL, Emelyannova IZ.Practitcheshie Raboti po Himii Drevesinii Tzellulozi. Moscow, Lesporm; 1965.(In Russian)
24. ISO standards 2003. International Organization for Standardization.25. Simionescu, C. Grigorash, M. and Cerantescu-Asandei, A. (1964). Chimia
Lemnului din R.P.R. Acad, Bucuresti.26. Gierer J. The chemistry of delignification, general concept part 1.
Holzforschung. 1982;36:43–51.27. Gierer J. The chemistry of delignification, general concept part II.
Holzforschung. 1982;36:55–64.28. Istas JR. Pulp from Congolese fibrous raw materials. Conference on Pulp
and Paper Development in Africa and Near East, vol. Vol. II. Rome: Cario,FAO; 1965. p. 347–81.
29. Rydholm SA. Pulping Processes. New York: Interscience; 1965. p. 1289.30. Khristova P, Bentcheva S, Khider T. Soda-AQ pulping of four acacias from
Sudan. Cellul Chem Technol. 1998;68:209–13.31. Khristova P, Bentcheva S, Karar I. Soda-AQ pulp blends from kenaf and
sunflower stalks. Bioresour Technol. 1998;66:99–103.
Omer et al. BMC Chemical Engineering (2019) 1:6 Page 6 of 6

PAPERmaking!
FROM THE PUBLISHERS OF PAPER TECHNOLOGY
Volume 5, Number 1, 2019
Page 1 of 3 Article 8 – New Ideas
5 Tips to Help You Protect & Grow New Ideas Lion cubs are born tiny, blind, and helpless. Weighing just 3 pounds and with their eyes shut tight for a week or longer after birth, the baby lions only get a chance to become apex predators because their mothers protect and nurture them until they’re old enough to hunt and survive on their own. New ideas may be even more vulnerable than lion cubs, as most organizations don’t have fearsome mothers guarding them. From the humble sticky note — now available in a near-infinite variety of colours and sizes — to the camera in your phone, ideas that are now ubiquitous were once small and vulnerable, their potential unknown. Even leaders who value creativity often quash new ideas before they’ve been given a fair hearing. When we surveyed global executives, 94% said innovation was important or very important to their organizations. But only 14% said their organizations were good at innovation. Doing a better job of nurturing new ideas is a good place to begin addressing that innovation gap. How to Protect a New Idea https://www.ccl.org
The Paper Industry Technical Association (PITA) is an independent organisation which operates for the general benefit of its members – both individual and corporate – dedicated to promoting and improving the technical and scientific knowledge of those working in the UK pulp and paper industry. Formed in 1960, it serves the Industry, both manufacturers and suppliers, by providing a forum for members to meet and network; it organises visits, conferences and training seminars that cover all aspects of papermaking science. It also publishes the prestigious journal Paper Technology International and the PITA Annual Review, both sent free to members, and a range of other technical publications which include conference proceedings and the acclaimed Essential
Guide to Aqueous Coating.

PAPERmaking!
FROM THE PUBLISHERS OF PAPER TECHNOLOGY
Volume 5, Number 1, 2019
Page 2 of 3 Article 8 – New Ideas
In How to Treat New Ideas, authors David Magellan Horth and Michael T. Mitchell draw on decades of personal experience, data, and lessons from scores of organizations around the world. They identify 5 tips that can help companies nurture new ideas:
1. Resist the instinct to kill a new idea. Leaders need to understand that their first reaction to a new idea is typically “fight or flight.” When an idea that is new, foreign, or maybe even odd emerges, we’re programmed to fight it or resist it, perhaps maybe even ignore it in hopes that it will go away. Steve Wozniak, cofounder of Apple, worked at blue chip firm Hewlett-Packard before he joined forces with Steve Jobs. He reportedly went to his HP bosses 5 times with the idea of building a personal computer; 5 times they said no. This instinct comes from a finely tuned and powerful part of our brains—the limbic system. The limbic system is one of the larger and most ancient part of our brains. It’s the part of our brains that helped insure that we survived as a species. Where would we be without our limbic brains and the deeply embedded “fight or flight” response? Likely, our ancestors would have been extinguished as they chose to try to hug some prehistoric beast rather than fight it off with a club or run for their lives. The drive to fear or run away from a particularly novel idea is a natural reaction, and one that’s so powerful it overwhelms us. But leaders who want to encourage innovation should take a deep breath and allow themselves and their teams to think through the idea before rejecting it. They must watch out for signs they are subconsciously sabotaging innovation. 2. Practice innovation thinking. Innovation, by definition, means doing things differently. That creates risks and uncertainty—often considered enemies of a successful business. The logical, analytical thought processes we rely on usually are not very helpful in the early stages of innovation. The key is to practice innovation thinking. That means listening to your intuition and asking “What if?,” believing there’s always a better way.

PAPERmaking!
FROM THE PUBLISHERS OF PAPER TECHNOLOGY
Volume 5, Number 1, 2019
Page 3 of 3 Article 8 – New Ideas
There’s nothing wrong with traditional business thinking—it’s required to manage a modern organization. But when a new idea comes along, it’s time to switch into innovation thinking mode. Innovation thinking gives new ideas the oxygen they need to continue developing. 3. Frame and clarify the idea’s purpose. Now that you’re starting to dig into the possibilities of a new idea, how do you give that new idea some concrete direction? One important technique is to frame and clarify the idea’s purpose. In other words, what might this be good for? Successful innovators will often ask themselves what problem a new idea can help solve or what opportunity it might address. Sometimes this takes a little patience. When 3M scientist Spencer Silver created a “low-tack,” pressure-sensitive adhesive instead of the super-strong glue he’d been trying for, he couldn’t imagine what it would be good for. When a colleague mentioned a problem with the slips of paper he used to mark songs falling out of his Sunday hymnal, Silver had a solution. The result was 3M’s Post-it notes, now a staple item in every office supply closet. 4. Use the POINt technique. At this point, the promise of at least some new ideas might be starting to clarify. But to sharpen that promise and test it a bit more rigorously, you can use the POINt technique developed by Pfizer executive Bob Moore. POINt stands for: Pluses: Praise the idea and consider what’s good about it as presented. Opportunities: Picture the opportunities and benefits that might be realized if you implemented the idea. Issues: While you don’t want to kill new ideas, it’s OK to consider some of their challenges and limitations. New thinking: Use new thinking to develop solutions for the issues you’ve raised about the new idea. Nurturing new ideas doesn’t mean being naive about them. Rather, it means considering, with clear eyes, both the opportunities and challenges a new idea presents, and thinking through potential solutions to those challenges. 5. Connect ideas to ideas. Not every new idea will become a fully realized product or business solution on its own. But that doesn’t mean those ideas don’t have value. One useful exercise to get more value out of new ideas is to combine previously unconnected ideas. Consider the Sony Walkman, which combined two concepts: pre-recorded cassette tapes and a device small enough to carry around. For the first time, people could take their music wherever they went. Brainstorming, mind-mapping, and forced connections are techniques that can be used to connect one idea to another. Learn more about our guidebook, How to Treat New Ideas.

PAPERmaking!
FROM THE PUBLISHERS OF PAPER TECHNOLOGY
Volume 5, Number 1, 2019
Page 1 of 2 Article 9 – Driving
Slowdown in Spring showers Drivers are being urged to take care on the roads if they get caught in a sudden Spring shower. The motoring experts at LeaseVan.co.uk have put together their top tips for driving in wet conditions during Spring. Tim Alcock from LeaseVan.co.uk said: “Drivers always need to be cautious of changing weather conditions throughout the year but during Spring, heavy showers can pose a big risk. If drivers get caught out, top priority is to slow down, leave plenty of stopping room and make sure the car windscreen is kept mist free to help with visibility. Visibility can be quickly reduced during a sudden downpour and if there’s somewhere safe to pullover and wait out the shower, then it’s often worth doing. Wipers can struggle to keep up with heavy rain. Drivers also need to be mindful of other road users, the risks caused by flooded routes and excess surface water.” https://www.leasevan.co.uk/
The Paper Industry Technical Association (PITA) is an independent organisation which operates for the general benefit of its members – both individual and corporate – dedicated to promoting and improving the technical and scientific knowledge of those working in the UK pulp and paper industry. Formed in 1960, it serves the Industry, both manufacturers and suppliers, by providing a forum for members to meet and network; it organises visits, conferences and training seminars that cover all aspects of papermaking science. It also publishes the prestigious journal Paper Technology International and the PITA Annual Review, both sent free to members, and a range of other technical publications which include conference proceedings and the acclaimed Essential
Guide to Aqueous Coating.

PAPERmaking!
FROM THE PUBLISHERS OF PAPER TECHNOLOGY
Volume 5, Number 1, 2019
Page 2 of 2 Article 9 – Driving
Here are LeaseVan.co.uk ’s tips for driving in Spring showers. 1. Vehicle maintenance Check your tyres and make sure they’re properly inflated and have good tread to grip on slippery road surfaces. 2. Stopping distance It takes longer to stop when the roads are wet and slippery. Allow at least double the usual separation distance between you and the car in front. 3. Slow down Keep your speed down when driving in showers. Wipers struggle to keep up in a heavy downpour so your visibility will be reduced. Drive slower and you’ll have more time to react to hazards. 4. Put your lights on Use dipped headlights so other road users can see you. 5. Stop If the shower is really heavy and visibility is poor, pull over somewhere safe and wait out the rain. 6. Flooded roads If the Spring showers are heavy, you may find yourself on flooded roads. If it looks too deep stop, turn round in a safe place and find an alternative route. 7. Aquaplaning This happens when your tyres lose traction from the road. Roads with lots of surface water pose the biggest risk. Reducing your speed will help. 8. Pedestrians and cyclists Be mindful of other people on the road, particularly cyclists and pedestrians. If you splash a pedestrian, you could face a fine of anything from £100 to £5,000. 9. Steamed up car Make sure any heat is going straight on to your windscreen to stop it getting misted up and to keep visibility good.
PAPERmaking!
FROM THE PUBLISHERS OF PAPER TECHNOLOGY
Volume 5, Number 1, 2019
Page 1 of 5 Article 10 – Women and Leadership
Why Mentoring & Sponsoring Are Important—Particularly for Women Women must advocate for themselves if they want to move their careers forward. But to succeed, they can’t go it alone. All successful leaders need a network of champions—including mentors and sponsors. “The people around us have the ability to either support or hinder our growth toward the leaders we can be,” says CCL’s Jennifer Martineau, co-author of Kick Some Glass: 10 Ways Women Succeed at Work on Their Own Terms. “If people don’t have access to the relationships important to leadership success, they’re missing out.” And in fact, women are missing out. https://www.ccl.org
The Paper Industry Technical Association (PITA) is an independent organisation which operates for the general benefit of its members – both individual and corporate – dedicated to promoting and improving the technical and scientific knowledge of those working in the UK pulp and paper industry. Formed in 1960, it serves the Industry, both manufacturers and suppliers, by providing a forum for members to meet and network; it organises visits, conferences and training seminars that cover all aspects of papermaking science. It also publishes the prestigious journal Paper Technology International and the PITA Annual Review, both sent free to members, and a range of other technical publications which include conference proceedings and the acclaimed Essential
Guide to Aqueous Coating.

PAPERmaking!
FROM THE PUBLISHERS OF PAPER TECHNOLOGY
Volume 5, Number 1, 2019
Page 2 of 5 Article 10 – Women and Leadership
Women outnumber men at almost every educational level and are about half the workforce in most countries, but:
Women hold just 24% of senior management roles.
Women make up a mere 3% of Fortune 500 CEOs.
Only 1 in 18 women earns a 6-figure salary in the US—versus 1 in 7 men.
For women of colour, this wage and leadership gap is even wider.
Progress has been slow or stagnant in the percentages of women reaching senior, top, and director-level positions in all countries in which benchmarking studies have been conducted.
Yet the business case for advancing women leaders is compelling. In addition to doubling a company’s talent pool, recruiting women increases financial performance:
Fortune 500 companies with the highest representation of women on boards financially outperform those with the fewest female board members.
A recent Gallup study found that gender-diverse business units have higher average revenue than less diverse business units.
Having larger percentages of women in an organization also predicts greater job satisfaction, higher levels of employee engagement, and decreased rates of burnout—for all workers, regardless of gender, age, ethnicity, or leadership level.
In short, having more women in the workplace is associated with positive outcomes for both women and men. So, how can women advance their careers, and how can organizations ensure they’re making the most of all their talent? A key strategy is to prioritize the mentoring and sponsorship of women—particularly by influential (often male) leaders. Both mentors and sponsors are critical to helping aspiring women leaders gain the perspective and connections they need to take on larger roles and advance their careers. What’s the Difference Between a Mentor and a Sponsor? By the time they reach mid-career, most leaders can name a handful of advisors—bosses, coaches, colleagues, and friends—who’ve helped them build confidence and develop needed skills. These advisors may be mentors and/or sponsors. While both guide professional development, there are important differences between mentors and sponsors:
MENTOR SPONSOR Role Experienced person at any level Senior leader in the organization
Goal Provide guidance for career choices and decisions
Use influence to help employee obtain high-visibility assignments
Who drives the relationship?
Both mentee and mentor; requires mentor to be responsive to the needs of the “mentee”
The sponsor, who chooses to advocate for “sponsoree,” including behind closed doors with other leaders
Actions Helps mentee determine paths to meet specific career goals
Advocates for sponsoree’s advancement; champions her potential
Mentors vs. Sponsors Mentors provide guidance and support, whether around a specific need or for ongoing development. They listen to their mentees’ experiences and give constructive, direct, and honest feedback.

PAPERmaking!
FROM THE PUBLISHERS OF PAPER TECHNOLOGY
Volume 5, Number 1, 2019
Page 3 of 5 Article 10 – Women and Leadership
Our research with the Leaders’ Counsel found that people who are mentored:
Are better prepared for promotions and have higher success rates;
Stay with their organizations longer;
Feel more satisfied with their jobs and careers; and
Rate higher on performance measures. We also found that “mentees” have greater impact in their organizations, are perceived as being more innovative and creative, show higher resilience to setbacks, and have stronger networks. A mentor may also be a sponsor—but not necessarily. A sponsor is a specific type of mentor who goes above and beyond giving advice. Sponsors are advocates who actively work to advance the career of their “sponsoree,” touting their accomplishments and potential, connecting them to others in their network, and recommending them for bigger roles. A sponsor pushes their “sponsoree” to take on challenging assignments and actively advances their career progression—including in off-the-record or closed-door meetings with other leaders. Since the people who can advocate and create opportunities for others have some level of authority in an organization, they are likely upper-level leaders—people in power. And as the statistics above noted, in most organizations, that pool of influencers is still primarily male. So “while sponsors are important for men, they are critical for women,” says Martineau. “Yet men are more likely than women to have sponsors.” Mentoring at all career stages is important, but without sponsors who take that next step to advocate on their behalf, women—especially women of color—are at a disadvantage. Why Is There an Imbalance in Sponsorship Between Men & Women? There are several reasons why more men are sponsors and more men are sponsored. Like attracts like. Since people naturally tend to gravitate to other people who are like them, male leaders may unconsciously be inclined to mentor and champion other men. Similarly, women may not feel comfortable asking somebody several levels up—especially someone who doesn’t look like them—for advice or sponsorship. So even with no other factors at play, more men than women are sponsored, and leadership power structures remain largely unchanged. Unconscious bias also plays a role. “Historically, images and ideals of leadership have been associated with stereotypically ‘male’ qualities, and so because of that, women are less likely to be perceived as ‘leadership material,’ as compared to men,” notes senior CCL researcher Cathleen Clerkin. Research shows that women face a double bind of being seen as competent or likable—but not both. Research has also found that women receive fewer stretch assignments and more vague, personal, and unhelpful feedback than men—preventing them from getting clear information about their performance that would push them to learn, grow, and improve. Assumptions are problematic. “Often, women have the right qualifications and the personal readiness but are not considered for a promotion or critical assignment,” says Laura Santana, who works closely with female leaders in CCL’s Women’s Leadership Experience and other leadership development programs.

PAPERmaking!
FROM THE PUBLISHERS OF PAPER TECHNOLOGY
Volume 5, Number 1, 2019
Page 4 of 5 Article 10 – Women and Leadership
“People make assumptions about women’s capabilities and interests and then make decisions for them:
She’s too nice; she wouldn’t want this job…
She has young children; the travel schedule will be too demanding…
She won’t want this promotion; she’d have to relocate her family…
She hasn’t done this before; she won’t feel up for the challenge… “These assumptions may not be conscious or spoken, but they cause women to be overlooked for roles they would be great at.” “Queen Bee Syndrome” contributes, too. The few women who have broken through the glass ceiling often still find themselves feeling stuck because of gender bias. While many women do sponsor, promote, or support the career advancement of other women, those who don’t are sometimes called “queen bees” and are considered unsupportive of other women. But our research has found that when women executives do advocate for diversity and promote other women, they receive lower competency and performance ratings. So it’s understandable that senior women may hesitate to advance the careers of more junior women—it may feel as if it comes at too great a personal cost. Men who sponsor or promote women are not similarly penalized—and may even be rewarded for supporting diversity. To mitigate power and bias, both men and women in positions of power should mentor and sponsor talent—regardless of gender. With awareness of the reality of power and bias in everyday actions, leaders should check their thinking, adjust as needed, and call out bias whenever they see it. Aspiring Women Leaders: Don’t Go It Alone Think you might need a mentor or sponsor? If you don’t already have one, the answer is yes. “You absolutely need mentors and sponsors! You just need them for different things at different times,” says Kelly Simmons, who developed CCL’s Advancing Technical Women program. “In new roles, you need to learn new skills, find out what you don’t know, and learn. If you’re not moving ahead or are feeling stuck or confused about your situation, get help—it’s not all on you. Don’t put all the responsibility on yourself to advance in your career or succeed in a new role.” You might be thinking:
“If I do a good job, people will notice. If I do just a little more, work a little harder, it will happen. I don’t need a mentor or sponsor.”
Or, “I want to earn that promotion myself; it feels like cheating or pulling rank if I have a senior decision-maker on my side.”
Or, “The timing isn’t right, right now; I’ll go for the next opportunity.” Many women wrestle with these same concerns. But without access to the people who can set you up for the experiences you need—and support you through the inevitable challenges—your career progress is likely to stall, leading to short-term frustration and long-term consequences. Wherever you are in your career, you need a network of champions—colleagues but also mentors and sponsors—to help you shift the way you think and act.

PAPERmaking!
FROM THE PUBLISHERS OF PAPER TECHNOLOGY
Volume 5, Number 1, 2019
Page 5 of 5 Article 10 – Women and Leadership
Can Men Really Be Good Mentors to Women? Yes! Men in leadership roles are ideally positioned to strengthen the leadership pipeline in their organizations by helping to retain and advance talented women. Plus, mentoring and sponsoring others offers benefits to both parties. Research from our work with the Leaders’ Counsel found that leaders who mentor and advocate for others have:
A stronger commitment to their organization;
An enhanced perception of their leadership by others; and
A greater sense of well-being, including increased job and personal satisfaction. Through mentoring and sponsoring, our research also found you can and build and enhance your own networks, more quickly access job-related and organizational news, and become a better leader yourself. You also gain a chance to reflect upon and articulate your own expertise and experience—something you may not take time to do otherwise. Some men think they wouldn’t be good at mentoring someone who is different from them. Others have said they’re wary of perceptions or misinterpretation of their work relationships with women. But if you’re a man who is hesitant to seriously mentor or sponsor a woman, don’t say no yet. Check out Athena Rising: How and Why Men Should Mentor Women, a book by two men and take advantage of our free resources to help you get started mentoring or sponsoring. Take some time to learn how you can make a difference to the talented women around you—and help your organization thrive. What Are You Waiting For? Ideally, women would have the mentors they need to help them navigate their careers, and senior leaders would see their skills and potential and enthusiastically sponsor them. But, since this isn’t happening by default in most organizations, there’s a leaky pipeline of talent. What can be done? Establishing a mentoring or sponsoring relationship may not be easy to do. It can feel a bit awkward and confusing to get started, but it doesn’t have to be. We offer our free mentoring resources for aspiring women leaders, potential mentors and sponsors, and HR executives, including:

PAPERmaking!
FROM THE PUBLISHERS OF PAPER TECHNOLOGY
Volume 5, Number 1, 2019
Page 1 of 5 Article 11 – Networking
8 Networking Skills that Every Professional Needs to Have Gregory Ciotti When it comes to most advice on networking, many business publications place too much emphasis on “what’s easy” rather than “what works”. This has only been amplified by the recent dominant presence of social media. With useless “tips” like: ‘Set up a LinkedIn profile!’ ‘Get active on Twitter!’ ‘And… um, email people I guess!’ …it’s no wonder people get frustrated when they look for information on how to properly network with others. Networking also has a somewhat ‘sleazy’ association to it: people picture the grease-ball haircut on the really loud guy with 800 business cards who’s all talk and no action. The thing is, good networking does not have to be this way, not at all. So set aside your bias against networking, and step into ‘natural networking’ for building real relationships with people who can help you get where you want to be. https://www.bidsketch.com 1.) Make Networking a Regular Activity This is my solution to one of the most common questions about networking: how do I get started? If you’re worried about jumping in to networking or how you can keep it as a habit, just follow this one simple strategy — every other day (or every day, or twice a week, etc.), reach out to one person who’s work you find interesting. That’s it!
The Paper Industry Technical Association (PITA) is an independent organisation which operates for the general benefit of its members – both individual and corporate – dedicated to promoting and improving the technical and scientific knowledge of those working in the UK pulp and paper industry. Formed in 1960, it serves the Industry, both manufacturers and suppliers, by providing a forum for members to meet and network; it organises visits, conferences and training seminars that cover all aspects of papermaking science. It also publishes the prestigious journal Paper Technology International and the PITA Annual Review, both sent free to members, and a range of other technical publications which include conference proceedings and the acclaimed Essential
Guide to Aqueous Coating.

PAPERmaking!
FROM THE PUBLISHERS OF PAPER TECHNOLOGY
Volume 5, Number 1, 2019
Page 2 of 5 Article 11 – Networking
Networking Skills that Work If you’ve struggled with sincere networking in the past (as I have), definitely give this list a run-through and take notes when you notice an area where you can improve your own networking habits. As a last bit of advice before we get into the list, be sure to network outside of your industry from time to time! We often get so focused with business related networking that we never reach out to people who may be doing cool stuff in other fields of work… and you never know what may come of it. 1.) Make Networking a Regular Activity This is my solution to one of the most common questions about networking: how do I get started? If you’re worried about jumping in to networking or how you can keep it as a habit, just follow this one simple strategy — every other day (or every day, or twice a week, etc.), reach out to one person who’s work you find interesting. That’s it! Don’t ask for anything (more on that in a minute), just reach out with an email that shows your mutual respect/interest in what they do, and that you just wanted to say “Hey” to a person doing cool things. That way, you have no fear of coming off as sleazy/begging, will consistently reach out to new people (not just for a week before you quit), and you’ll likely come across a lot of interesting folks in your industry, which is always a plus. No more excuses! 2.) Stop Being an Internet Panhandler As a guy who loves studying behavioral psychology, one of the most interesting topics to me is what exactly changes in people’s personalities when they interact with others online. Not much has been published on the subject, but the online disinhibition effect is one that we all probably recognize in one way or another. The point is this: People on the internet tend to lack diplomacy & tact, and one of the ways that this rears its ugly head is that people will ask for things on the internet that they’d never expect someone to give them in “real life.” While most people on the street would be hesitant to ask a stranger for $10, on the internet people will ask for THE WORLD and then get upset when you don’t deliver! As an example… when I recently wrote a huge article on productivity, I got a lot of good emails after it was published from people who enjoyed it (more on that in a bit). On the other hand, I got a lot of TERRIBLE intro emails from people essentially demanding that I help them with their productivity problems. One guy even told me that he wanted a “quick” analysis of his productivity problems over an hour long Skype call! “Sure thing, my time is apparently worth nothing to you so let me drop everything I’m doing and call you up!” As freelancers, many of us know this feeling all too well, yet a lot of us still suffer from “internet pandhandler syndrome” when trying to network with people. I wrote in my previous post on freelance marketing about how I was able to land features on big publications through email, and I included a single tip that can help you avoid this annoying habit… Don’t ask for anything in the first email! Genuine networking doesn’t start with your hands out during the first contact.

PAPERmaking!
FROM THE PUBLISHERS OF PAPER TECHNOLOGY
Volume 5, Number 1, 2019
Page 3 of 5 Article 11 – Networking
3.) Know Who You’re Reaching Out To This should be a no-brainer, but if you’ve ever gotten an unsolicited email that felt like a spam message but actually wasn’t, you know what I mean here. The most important thing to remember here is that if you are trying to connect with an influential person, this becomes even more important — not because they are inherently more important, but because they probably have people trying to reach out all the time. You can stand out by doing your homework and actually getting to know some facts about the person you’re about to reach out to, beyond the “surface level” stuff that everybody already knows. People reach out to me a lot of discuss content strategy, and I’m flattered when they bring up some work of mine that they saw on Help Scout, Bidsketch, or any other place I regularly appear. As basic as that may seem, remember point #2… on the internet, everyone comes across as: “Blah blah blah enough about you, let’s get back to me!“ Separate yourself from the pack and actually come prepared knowing about the person’s passion projects, and I guarantee you’ll get remembered. 4.) Use Positive Language I actually talked about this in my list of customer service skills, and this is true for building proposals (as described in this example eBook about software development proposals), but it goes far beyond dealing with customers — it’s great for networking too. This is especially true when you consider that so much communication today is done via text, and it’s hard to display emotions and other subtle cues without the other person’s face being in sight. For instance, compare these two similar requests… “Hey. I want to do an interview with you on your new project by this Friday, we have very similar audiences.” vs. “Hey, I’d love it if we could do a quick interview sometime soon on your new project, my audience loves your work.” While “saying” the same thing, you likely immediately realized that #2 was far more inviting and using positive language to get the same message across, but without the bluntness (which can be misinterpreted for rudeness via text) of the first example. When in doubt about the tone of your message, it is best to keep this rule in mind and evaluate whether or not you are using positive language, there is essentially no downside (just don’t be overly chipper or “Whoo hoo!” for every single message) and it is a great way to avoid communication problems that stem from using harsher language. 5.) Cultivate Your “Power” Contacts As much as many people may not like to hear it, “All contacts are equal, but some are more equal than others.” You’re going to come across people who become power contacts as you become more connected with those in your industry. These people will be the ones who are constantly introducing you to new/interesting contacts, referring you to others for more work, and just generally pushing your business forward. I can name one supernetworker of mine in Leo Widrich, co-founder of the BufferApp. Although we’re both busy, I try to stay in regular contact with Leo, make contributing to the Buffer blog a monthly priority, and constantly make mentions of Leo wherever I post (hint hint).

PAPERmaking!
FROM THE PUBLISHERS OF PAPER TECHNOLOGY
Volume 5, Number 1, 2019
Page 4 of 5 Article 11 – Networking
These are simply the contacts you’ll form where the “give and take” has reached a fairly high level, and you’re both willing to support the other where possible. Be sure to keep an eye on these people, networking isn’t always Pareto principle in practice, but in many instances your most frequent contacts will be the ones that really matter. You don’t need to know the most people, just the right people. 6.) Learn How to Email Real business gets done over email. A tweet may get someone’s attention, but when it comes to establishing real relationships, the conversation truly begins when you start the reciprocity via email. That said, you should know how to write a good email, both during the “outreach” stages of networking and when you’ve already established a connection. Let’s break some advice down for each stage… #1 — Outreach When you’re looking to initially get someone’s attention, you need to tread carefully. Here are 3 good pieces of advice for outreach emails:
KISS: Keep it short, stupid. I wrote about this in my guide on How to Email Busy People, but the #1 killer in outreach emails is sending people a book when all they want is a paragraph. You’re the one reaching out, so don’t waste their time with a wall-o-text, 3 short paragraphs ought to do it.
Make it about them: You can give a quick spiel as to why you’re an interesting guy/gal to connect with, but since you’re hitting their inbox first, make the first email mostly about them.
Find a mutual connection: This could either be a mutual friend or a mutual interest, but one of the best ways to personalize an outreach email is to find a legitimate thing in common that you and receiving party have.
#2 — Established connections Once you’ve established contact, the conversation begins to shift quite a bit (obviously). It’s similar to when you make a new friend vs. talking to a friend you’ve had for 2 years, you’re familiarity changes what you talk about. That said, don’t let your good connections go to waste over a bad email. Here’s how you can improve the next stage…
1. NO CONSTANT PANHANDLING!: That’s right, this is making another appearance. If the only time you contact this person is to get something out of them, you’re doing it wrong.
2. Send them interesting emails: What should you be emailing them then? Interesting content that they may enjoy, mentions that you’ve given them, insightful questions or thoughts that appeal to both of your businesses/interests, etc.
Pretty simple right? Use email to stay in touch with those important people in your networks, staying connected is often much more important than getting connected. 7.) Don’t Expect Anything This “skill” is actually one of the most important of all, because with the right mindset you can usually avoid many of the big networking mistakes out there. When you are always out to get something, you are not truly networking with people, you’re just running a long-term manipulation game.

PAPERmaking!
FROM THE PUBLISHERS OF PAPER TECHNOLOGY
Volume 5, Number 1, 2019
Page 5 of 5 Article 11 – Networking
The RIGHT mindset is to know that creating a big network is the smart thing to do, but also understanding that whatever comes should just come, you don’t need to actively be pestering your connections for everything. It’s great when a new connection works out from a professional standpoint, but it’s hard to measure some other things that having a large network can bring, like…
1. More information & great conversation with smart people 2. Introductions to others 3. Creating a presence of being “that guy that everybody knows and likes”
Just because a connection doesn’t result in more direct dollars in your bank account doesn’t mean it was fruitless, and you shouldn’t be pursuing connections with people just to wring something out of them. Speaking of which… 8.) Burn Useless Bridges Yikes, somewhat of a controversial point to place on a post about networking, no? The thing is, this skill is an absolute must to learn. Eventually, you’re going to come across “leeches,” people who you’ve connected with but don’t see the relationship as give-and-take, more like, “How much can I get out of you?” Networking is supposed to help you grow your business by meeting genuinely awesome people, not create a network of vultures who only reach out to you when they need something. Cut these people off, and fast, you don’t need anyone holding you back. Note that this isn’t the same as people who want to help you, but can’t and don’t ask much from you. This advice is for the greedy, those hitting your inbox with favour after favour that never gets returned.

PAPERmaking!
FROM THE PUBLISHERS OF PAPER TECHNOLOGY
Volume 5, Number 1, 2019
Page 1 of 10 Article 12 – Time Management
101 Time Management Tips to Boost Productivity Every Day John Rampton For most of us, time management and staying productive is a daily struggle. Sometimes that’s not the end of the world. But, if you don’t address this sooner then later, the things you were supposed to do today get pushed to tomorrow, then the next day. Eventually, you could end-up several weeks behind. That’s not good for business or your stress-level. Thankfully, you can prevent that from happening by using these 101 time management and productivity tips. Let's start to gain yourself more time. https://www.entrepreneur.com
The Paper Industry Technical Association (PITA) is an independent organisation which operates for the general benefit of its members – both individual and corporate – dedicated to promoting and improving the technical and scientific knowledge of those working in the UK pulp and paper industry. Formed in 1960, it serves the Industry, both manufacturers and suppliers, by providing a forum for members to meet and network; it organises visits, conferences and training seminars that cover all aspects of papermaking science. It also publishes the prestigious journal Paper Technology International and the PITA Annual Review, both sent free to members, and a range of other technical publications which include conference proceedings and the acclaimed Essential
Guide to Aqueous Coating.

PAPERmaking!
FROM THE PUBLISHERS OF PAPER TECHNOLOGY
Volume 5, Number 1, 2019
Page 2 of 10 Article 12 – Time Management
1. Just breathe. Here’s an interesting fact from Tom Evans, host of the Zone Show podcast. A tortoise’s life expectancy is around 120 to 140 years, while an elephant lives for around 80 to 90 years. Even though our own life expectancy is increasing, it used to be just between 50 and 60 years. While there are a number of factors that influence the life expectancy of these animals, Evans notes that, "a tortoise breathes around four times every minute. An elephant breathes around eight times every minute and we breathe around 12 to 15 times every minute.” As such, Evans, suggests that if you want to change your relationship with time then you should start breathing more slowly. “To begin we need to use our diaphragm and to do belly breaths. This of course is how a baby breathes. We’ve just got out of the habit.” “Now you don’t have to do it all the time but just doing seven to nine deep and slow breaths at the start of the day is enough to slow things down. You can also do it before any creative task or if you have been stressed. It works especially well if you are running late for a meeting. By breathing more slowly, we ‘expand’ time.” 2. Measure twice, cut once. My dad used to tell me, “Measure twice, cut once.” This is actually a famous proverb for anyone involved in carpentry or building since it advices to do things right the first time around. Double-check your work so that you don’t spend the time going back and correcting your mistakes. 3. Turn off the TV. It’s been found that we spend eight years and ten months of our lives watching TV - plus an additional eight months discussing plot holes and characters. Instead of watching so much television, spend that time on higher-leverage tasks. 4. Eat the frog first. “Mark Twain once said that if the first thing you do each morning is to eat a live frog, you can go through the day with the satisfaction of knowing that that is probably the worse things that is going to happen to you all day long,” writes Brian Tracy. “Your ‘frog’ is your biggest, most important task, the one you are most likely to procrastinate on if you don’t do something about it.” 5. Schedule according to energy. Speaking of eating that frog, do that when you have the most amount of energy and focus - aka your “magic hours.” This is typically 2.5 hours after you wake-up. By creating a schedule based around your energy you can create a routine that ensures your as productive as possible. Make sure to schedule out time on your Calendar. 6. Wake-up earlier. Want more time? Then start waking-up earlier. This way you have the time to read, exercise, respond to emails, and plan out your day properly. 7. Keep a time diary. A time diary a simple way to find out how you spend your time. By recording how you spend your time for a month or two, you’ll see where you’re wasting time and what influences productivity. 8. Make use of waiting time. Let’s say you have a doctor’s appointment. Have something with you to do. This could be reading a book, catching up on correspondence, or writing your upcoming eBook. 9. Make a list and get it out of your head. Don’t let everything you have to do swirl around in your head. Jot them done so that it clears your brain and prevents you from getting overwhelmed. 10. Think “half-time.” For example, if you’re cooking dinner, make the twice the amount and freeze half of it. This way you’re not spending that time again preparing and cleaning your meal on another night.

PAPERmaking!
FROM THE PUBLISHERS OF PAPER TECHNOLOGY
Volume 5, Number 1, 2019
Page 3 of 10 Article 12 – Time Management
11. Ditch commitments that waste your time, energy and attention. One of the most effective ways to gain more time is to eliminate those commitments that are, well, a waste of your time. Identify these commitments that are unproductive and don’t schedule them into your calendar growing forward. 12. Be decisive. That time you spend flip-flopping on a decision could be spent on something that’s actually productive. Make a decision, live with it, and move on. 13. Cross something off. We’re familiar with crossing items off to-do-lists. But, you should also start crossing off items that you’re not going to do. This keeps your to-do lists from getting out of control. It also prevents you from overcommitting. 14. Lighten your cleaning standards. Obviously you want your home and office to be clean and organized. But, settling on “dirt removal” instead of “spotless” will definitely save you a ton of time and energy in the end. For example, as opposed to scrubbing your shower stall every week, wipe it down everytime you use it. 15. Establish “maintenance days.” Group your cleaning, laundry, and errands on specific days. This way they’re not lingering over your head when working on more pressing matters. 16. Schedule your work in batches. Speaking of grouping, start batching similar tasks together. For example, spend one day solely dedicated to writing, another to meetings. 17. Combine efforts. If you’re volunteering or meeting a client for lunch, then run errands that are nearby This way you’re cutting down on the time spend going back and forth all day. 18. Learn keyboard shortcuts. Online users between the ages of 18 to 24 years old spend an average of 1,979 minutes online per month. With that in mind, it makes sense to learn keyboard shortcuts and touch type so that you can save some time when browsing online. Here are some Office 365 Calendar hacks, Yahoo Calendar tips and Google Calendar hacks to help along the way. 19. Shorten your emails. Keep your emails short and to the point. I try to keep all of my emails under five sentences. 20. Delegate or outsource. Instead of doing tasks yourself, delegate or outsource them to someone else so that you can focus on more important tasks. 21. Automate repetitive tasks. There’s also certain tasks, like scheduling meetings and recurring billing, that you can automate via software. 22. Schedule less. I know what you’re thinking. This is pretty obvious. But, you’re probably spreading yourself too thin without even knowing it. Review all of your activities and see which ones aren’t helping your reach your goals. You should also look at the activities that no longer fit into your schedule. 23. Work four hours a day. Science has found that you should only work four hours a day. This doesn’t mean you can goof off the rest of the day. It’s all about focusing on your most important tasks when you’re most productive. Spend the rest of your days resting, practicing your skills, and completing less challenging tasks.

PAPERmaking!
FROM THE PUBLISHERS OF PAPER TECHNOLOGY
Volume 5, Number 1, 2019
Page 4 of 10 Article 12 – Time Management
24. Stop multitasking. Multitasking doesn’t work. In fact, it takes longer to complete a task when we multitasks because our minds are shifting back-and-forth. Instead, focus on one task at a time. Train your brain to slow down a little. It's like running, the more train your body, the faster you'll become. 25. Don’t beat yourself up. What happens if you spend a Saturday morning binge-watching Stranger Things? Stop wasting your time feeling guilty about it. Sometimes that happens. Do your best not to make that a habit and move-on instead of living in the past. To make the most of your time, here are tips for implementing a productivity system. 26. The “Pomodoro Technique.” The “Pomodoro Technique” is where you use a timer and schedule short breaks, usually five minutes, after 25 minutes of focused work. 27. Seinfeld’s “Don’t break the chain” method. Jerry Seinfeld would use a wall calendar and red marker to stay focused. He would cross out the days on the calendar when he wrote. “After a few days you’ll have a chain. Just keep at it and the chain will grow longer every day. You’ll like seeing that chain, especially when you get a few weeks under your belt. Your only job next is to not break the chain.” 28. David Allen’s “two-minute rule.” According to David Allen, author of the best-selling Getting Things Done, if a task takes under two-minutes to complete -- do it now -- so that it’s out of the way. 29. Break your day into five-minute slots like Elon Musk. How does Elon Musk run both Tesla and SpaceX? He breaks his entire day into five-minute slots - even his lunch. Doing so keeps him productive since it ensues that he stays on-track and doesn’t waste his time. 30. Jay Shirley’s “Must, Should Want Method.” Here’s a simple exercise from Jay Shirley. Every morning start your day by answering three questions: What must your do to create the most impact today? What should your do to build a better future? What do you want to do so that you can enjoy today and life more completely? This gets your day started on the right foot, while increasing your productivity and happiness. 31. The Eisenhower Matrix. This strategy was developed by Dwight Eisenhower. As explained by James Clear, “Eisenhower’s strategy for taking action and organizing your tasks is simple. Using the decision matrix below, you will separate your actions based on four possibilities.
1. Urgent and important (tasks you will do immediately). 2. Important, but not urgent (tasks you will schedule to do later). 3. Urgent, but not important (tasks you will delegate to someone else). 4. Neither urgent nor important (tasks that you will eliminate).”
This matrix “can be used for broad productivity plans (‘How should I spend my time each week?’) and for smaller, daily plans (‘What should I do today?).” 32. Airplane days. “Some years ago, Hughes AirWest, a regional airline that once served the western U.S., hired a consulting firm to compare the efficiency of flying first-class with flying economy-class, and with working in a normal office,” writes Brian Tracy. “What they found was that one hour of uninterrupted work time in an airplane yielded the equivalent of three hours of work in a normal work environment. The keyword was ‘’uninterrupted.’’ If you plan ahead and organize your work before you leave for the airport, you can increase productivity by accomplishing an enormous amount while you are in the air.”

PAPERmaking!
FROM THE PUBLISHERS OF PAPER TECHNOLOGY
Volume 5, Number 1, 2019
Page 5 of 10 Article 12 – Time Management
Of course, you can apply this to your daily life as well since it highlights the importance of planning and organization. 33. Follow your ultradian rhythms. Coined by psycho-physiologist Peretz Lavie, ultradian rhythms are simply the natural rhythms that the body cycles through every 90-120 minutes. It can get pretty complex, but the idea is that you should concentrate when your energy levels are highest, but to rest when you feel drained. 34. The “big rocks system.” Based on the principles outlined by Stephen R. Covey, author The Seven Habits of Highly Effective People, this is where you schedule time for your most important priorities first by imagining them as “big rocks” filling a bucket or jar. If you start with “big rocks,” and then put in sand or smaller rocks, all the gaps and cracks will get filled. 35. “No Meetings Wednesdays.” Companies like Facebook and Asana have a rule where there are no meetings on Wednesdays. Other companies have this rule for other days of the week, but the idea is the same. As opposed to wasting your time in a meeting, you can focus on important individual tasks. I've implemented this two days a week at my company Calendar. It works like a charm. We've seen an increase in code deployed and bugs by 14% since implementing this eight months ago. 36. The “anti to-do-list.” Instead of composing just a to-do list, create a to-done list where you write down everything you've already accomplished. It’s a powerful way to keep you motivated when you need a boost. 37. Sunday check-ins. There are some entrepreneurs and CEO’s who briefly check-in with their teams on Sunday's. This way everything is ready to go on Monday morning. If you’re a flying solo, you can schedule a Sunday check-in with yourself to make sure you have everything in-order for Monday and the rest of the week. We got this via Slack to make it easier for everyone and not be too formal. What brings this altogether is focus and attention. The following tips can be a big help. 38. Get you environment right. Work in an environment that has your auditory sweet spot (some prefer silence, others like background), organized, comfortable, free of distractions, and comfortable. Also make sure you have all the tools and resources readily available. And, paint your workplace a color that improves your productivity. 39. Turn off notifications. Turn off all notifications for email, Facebook, Twitter, and other social media channels when eating that frog. 40. Plan for interruptions. Try all you might, there will occasionally be interruptions. Plan for these in advance by having some flexibility in your schedule so that you don’t get log jammed. 41. Shrink your mental deadlines. If you believe it’s going to take you an hour to do something, give yourself 40 minutes instead. By shrinking your mental deadline you’ll work faster, as well as improve your focus. 42. Make a procrastination list. This is a list of high-leverage activities that you can chip away at whenever you’re procrastinating or have down time. Examples include reading industry magazines, organizing folders, or reviewing your contact lists. 43. Create a stop doing list. This is a list of those bad habits that waste your time or hinder your productivity. Write these habits down so that you can develop a realistic plan to replace these bad habits with good habits.

PAPERmaking!
FROM THE PUBLISHERS OF PAPER TECHNOLOGY
Volume 5, Number 1, 2019
Page 6 of 10 Article 12 – Time Management
44. Use Brainwave Entrainment. Brainwave entrainment isn’t a new development. In fact, it’s a 100+ year old science that uses special tones and sounds to influence an individual’s brainwave patterns. This has scientifically been proven to help change a person’s state of mind. 45. Focus@Will. Focus@Will is an app that not only removes distractions, it also increases productivity. How? It discovers the type of music to put your brain into a “flow state.” 46. Use a password manager. The average person has 27 discrete online logins. That takes-up a lot of real estate in our brains. And, trying to recover lost logins is time-consuming. Invest in a password manager, like LastPass or 1Password to rectify this problem. 47. Hack your vision. Blue wavelengths from fluorescent lights and electronic devices can fatigue your eyes and accelerate eye aging. To combat this start by taking a couple of small steps like blinking more and reducing your exposure before bed. You may also want to consider getting protective lenses. 48. Actively listen. Active listening is when you all of your attention and focus is at the conversation at-hand. As a result, you’ll free-up and boost productivity since you’re avoiding misunderstandings and not having the other party stop and repeat themselves. 49. Have a cut-off time. Set a specific time to completely check-out from work so that you can avoid further exposure to blue light and recharge your batteries. Doing so ensures you’ll be fully energized the following day. The foundation of our productivity is our health, so here are physical productivity tips to simplify getting and staying in shape. 50. Exercise. "I definitely can achieve twice as much by keeping fit," Richard Branson tells FourHourBodyPress. "It keeps the brain functioning well." When does someone like Richard Branson find the time to exercise? By waking up at 5:00 am everyday. 51. Fuel-up wisely. “Keep your energy high by eating the right foods that fuel your body instead of dragging it down,” recommends Rieva Lesonsky on the OPEN Forum. “Avoid sugar, simple carbohydrates like pasta and bread, and junk food -- they can give you a temporary energy high, but then you may crash.” 52. Drink caffeine intelligently and stay hydrated. “Use caffeine strategically: It can take about 20 minutes for a cup of coffee to kick in, so drink it 20 minutes before you need to power up, and you should be good to go,” adds Lesonsky. “Above all, try to stay hydrated. Often, when you feel tired or hungry, all you really need may be a big glass of water to get back in the game.” 53. Get 7-to-9 hours of sleep. You might be able to get by with a couple of hours of sleep when you’re younger, but that won’t fly as you get older. Remember, getting seven-to-nine hours of quality sleep every night improves your attention, concentration, creativity, decision-making, and health. It also reduces stress and impulsiveness. 54. Skip the nightcap. Drinking alcohol before bed prevents your from getting a quality night’s rest. If you do have an alcoholic beverage, have one several hours before your hit the hay. 55. Stop and smell...the lemons. Via Rodale’s Organic Life;

PAPERmaking!
FROM THE PUBLISHERS OF PAPER TECHNOLOGY
Volume 5, Number 1, 2019
Page 7 of 10 Article 12 – Time Management
“Research from Ohio State University found that sniffing lemon improved people’s moods and raised levels of norepinephrine, a brain chemical linked to executive decision-making and motivation. Another study found that students exposed to a citrus-scented cleaner were more likely to clean up after themselves, while in a Japanese study the scent of lemon improved typing accuracy, with workers making 54 percent fewer errors.” 56. Meditate As mentioned in a previous Calendar post, “Meditation at its simplest form is the ability to focus on a single point typically your breath. In order to truly meditate you need to remove everything else from thought.” 57. Strike a power pose. “Strike Power Pose for More Productive Day: A 'Power Pose' is a method of telling your body to start moving,” states Murray Newlands. “Productivity is all about telling the brain: 'I am in charge, I feel good to go.' A 'power pose' actually can cause a burst of testosterone, that's responsible for feelings of dominance. Having a power pose in place for around 2 minutes may assist with confidence, decrease stress, and encourage a greater tolerance for risk.” If you want to learn some awesome power poses, then check out Murray’s 7 body positions and gestures that can improve productivity. 58. Take a nap. When you feel like you’re dragging, go ahead a take a short nap - preferably in the afternoon. This doesn’t just recharge your batteries, napping can improve your memory, alertness, and creativity. 59. Set the right temperature. Productivity decreases when you’re either too hot or too cold. That makes sense since you’re focused on how much you’re sweating or shivering. While there are several factors to consider, keeping the temperature between 70º–72ºF (21–22ºC) is usually ideal. 60. Soak up the sun. Natural light increases your energy levels, helps you focus, reduces stress, and assists in better sleep. 61. Smile! According to A Life of Productivity, smiling makes you more productive because it boosts your immunity, makes your happier, handle stress better, and helps you focus on the big picture. 62. Bring your dog to work. Studies have found that we “become more trusting, relaxed and nicer towards each after interacting with a canine.” Furthermore, playing with your best friend reduces stress. This isn’t a problem if you work from home, but what if you can’t bring your dog to work? Looking at pictures of animals can have similar effects. 63. Standing and walking meetings. Some meetings are essential. But instead of sitting - like you’ve been doing all day - start having standing or walking meetings. It’s not just better for your health, these types of meetings reduce distractions, promote collaboration, and saves time. Success requires being equally fit physically and mentally. Try these mental productivity tips: 64. Have a plan. Let’s say you’re building your dream home. Obviously you would have an architect design your home. This ensures that it’s built correctly and that you have all the materials needed to get the job done on time. Start by identifying a daily mantra, your short-term goal, and your long-term goal. 65. Take five. This isn’t taking a five-minute break. It’s actually taking five minutes before any call or task to determine what you want to attain. As noted in Entrepreneur, "This will help you know what success looks like before you start. And it will also slow time down." After the call or task, decide on whether or not the desired result was achieved. If not, figure out what’s missing for the next time around.

PAPERmaking!
FROM THE PUBLISHERS OF PAPER TECHNOLOGY
Volume 5, Number 1, 2019
Page 8 of 10 Article 12 – Time Management
66. Develop a growth mindset. Discovered by Stanford psychologist Carol Dweck, those with a growth mindset “believe that their most basic abilities can be developed through dedication and hard work—brains and talent are just the starting point. This view creates a love of learning and a resilience that is essential for great accomplishment.” 67. Regularly review the past week. This is a time management habit championed by David Allen by taking the following steps;
1. Get clear by emptying your inbox, wrapping up any loose end, and tidying up. 2. Now you want to get current by reviewing your upcoming calendar, projects, actions lists, and
checklists and ditching the inessentials. 3. Finally, get creative. Find unique ways to slip projects you’ve been putting off into your schedule.
68. Write in your happiness journal. Every night write down the three things you’re grateful for that occurred within the last 24 hours. As explained in Daring to Live Fully, “This brings your brain into better balance. It also retrains your brain so that it will start seeing more possibilities.” You can also write about one positive experience you had in the last 24 hours and jot down at least four details about this experience. “This is helpful because when you take a moment to remember a positive experience, your brain labels it as meaningful, which deepens the imprint.” 69. Get an easy win. While you should usually focus on tackling the hardest tasks first, sometimes you need an instant victory, like making your bed when you wake-up. It’s a simple way to feel accomplished and build momentum for the rest of the day. 70. Learn to say 'no' effectively. When starting out in your career, it’s not uncommon to say “yes” to new responsibilities. There comes a point, however, that you can’t keep this pace-up. The Power of No: Because One Little Word Can Bring Health, Abundance, and Happiness by James Altucher and Claudia Azula Altucher is an excellent book to help you learn how to say “no” more effectively. 71. Find your groove. A flow state is where you’re completely absorbed in what you’re doing at the moment. To get into this flow state, you should work on activities that are challenging, but also equal to the skills you possess. 72. Schedule breaks throughout the day. “There’s a lot to be said about the power of rest throughout the workday,” writes Renzo Costarella. “If you power through the day without taking the time to decompress you’ll do yourself more harm than good.” “The best way to take breaks is to schedule them throughout your day. That way you can truly control the flow of work.” 73. Disconnect Sometimes you need to completely unplug and disconnect in order to recharge and avoid burnout. For instance, on Saturday afternoons shut off you phone for a couple of hours so that you aren’t answering phone calls, texts, or emails. 74. Rehearse situations. Rehearse your commute home, for example. What can you grab for dinner? Is there a Salad Works along the way? If so you can stop there than McDonald's. This way you can resist temptations. 75. Bargain with yourself. “If you don't want to do something, make a deal with yourself to do at least five minutes of it,” says Instagram founder Kevin Systrom. “After five minutes, you'll end up doing the whole thing.” 76. Identify your keystone habits. Charles Duhigg, author of "The Power of Habit," defines “keystone habits” as those that can transform your life. Examples include planning out your days, exercising, and having strong willpower.

PAPERmaking!
FROM THE PUBLISHERS OF PAPER TECHNOLOGY
Volume 5, Number 1, 2019
Page 9 of 10 Article 12 – Time Management
77. Establish S.M.A.R.T. goals. Make sure your goals are specific, measurable, attainable, realistic, and time based. This makes it easier to define and achieve them. 78. Stop tracking your progress on goals. According to psychologist Kelly McGonigal, “although it runs counter to everything we believe about achieving our goals, focusing on progress can hold us back from success.” Instead, McGonigal suggests that you, “View your actions as evidence that you are committed to your goal” and remind yourself why you want to reach your goal. 79. Set “process goals.” A process goal is what you actually need to achieve in order to achieve a larger goal. For example, if you want to increase sales by 25%, then your process goal would be to call 5 potential clients daily. 80. Anticipate obstacles. While you can’t expect for every unexpected occurrence, you should anticipate certain obstacles. This way you can have a contingency plan so that you can keep going forward no matter what. 81. Own your mistakes, then move on. We all mistakes. Learn from them so that you won’t repeat these same mistakes in the future. 82. End your day on a high-note. Did you get that blog post written ahead of schedule? Did you then call your best friend since you now have the spare time? That feels awesome, right? Ending your day on a high note encourages you to do the same the next day. Success always is a team sport, so here are organization and prioritization tips: 83. Schedule your entire day. Benjamin Franklin said, "If you fail to plan, you are planning to fail!" With that in mind, kick-off every morning by planning your entire day. This includes everything from your most important tasks to meetings to commute times. 84. Keep your desk clear. When you have a cluttered desk that sends a visual cue to your brain that causes stress. Spend the last couple minutes of your day cleaning and organizing your desk so it’s clear for the next day. 85. Use an online calendar and calendar tool. With an online calendar you can access it from multiple devices, schedule meetings/appointments, set up reminders, block time, and set up recurring events. On top of an online calendar, a calendar tool creates a daily routine, puts time limits on tasks, keeps your time in-check, and helps you plan for breaks. 86. Declutter your calendar. Calendars are paramount to time management and productivity. But, they’re not effective when they’re so full that they’re bursting at the seams. Clear the clutter from your calendar by only adding priorities that are date-specific. Don’t fill it with minute activities or events that no longer fit into your lifestyle. 87. Consolidate your tools and apps. Even though there thousands of tools and apps that can assist you with time management and productivity, don’t go hog wild. Having too many of these tools and apps are counter-productive. Limit yourself to the essentials. 88. Share your calendar. Share your calendar with clients and colleagues so that you can schedule productive meetings and be aware of deadlines without the back-and-forth emails. You can also share your calendar with your family so that they know where you are and that you can delegate household chores.

PAPERmaking!
FROM THE PUBLISHERS OF PAPER TECHNOLOGY
Volume 5, Number 1, 2019
Page 10 of 10 Article 12 – Time Management
89. Set a maximum of three priority tasks per day. Lengthy to-do lists aren’t effective. That’s because you simply don’t have the time or energy to cross everything off your list. Instead, keep your to-do lists lean and mean by choosing your three most important tasks for the day. 90. Define three daily outcomes every morning. This isn’t your to-do list. These are three outcomes that you want to accomplish by the end of the day. 91. Jot down “forgettables.” What happens when something pops in your mind while you’re working on an important task? Have a pen and paper nearby so that you can jot it down. This gets the thought out of your head, without doing much damage to your flow. 92. Schedule buffer and travel time. Don’t jump directly from task-to-task or meeting-to-meeting. You need time to recharge, refocus, and/or commute. It also prevents you from running late, which eats into the time you’ve set aside for another task or appointment. 93. Break larger projects into bite-sized pieces. It’s almost impossible to set the light at the end of the tunnel when working on a large project. That’s why breaking these projects into smaller, more manageable tasks. The University of Georgia has published a handy article to get your started. 94. Set deadlines. Setting deadlines on everything is a useful trick to keep you on track and avoid procrastination. Personally, if I need to have a blog post submitted by Friday, I set the deadline for Thursday. It alleviates stress while giving me time to review it. 95. Tap into the power of visualization. “Mental practice can get you closer to where you want to be in life, and it can prepare you for success!,” writes AJ Adams, MAPP in Psychology Today. For example, in a study of weight trainers, those “who carried out virtual workouts in their heads” increased muscle strength by almost half as much when compared to those who didn’t. 96. Set-out visual reminders. These could be inspiring quotes that you print and display around your home or office to keep you motivated. 97. Find a mentor. A mentor will share with you the tips and tricks that have worked for them, as well as the mistakes to avoid. 98. Enhance or develop skills. Learning or strengthening skills can help you complete tasks faster. This is because you not only have the knowledge, you also have new approaches to solve problems. It also boosts your confidence. 99. Take one step at a time. Baby steps. It’s probably one of the easiest and most powerful time management and productivity tips. Instead of focusing on the task, focus on what you’re doing now. For example, when I was writing this massive article, I focused on one point at a time and then moved-on, as opposed to worrying about all 101 tips at once. 100. Don’t worry about perfection. Stop worrying about something being “perfect.” It doesn’t exist. It’s only a figment of your imagination that can never become a reality. Do your best and keep on moving forward. 101. Reward yourself. It’s no secret that rewarding yourself when you’ve reached a goal or milestone is an effective way to keep you motivated and productive. The trick is being smart with your rewards. Skip the sugary treats for something like a massage. This avoids sugar crashes, but reduces anxiety and stress.

PAPERmaking!
FROM THE PUBLISHERS OF PAPER TECHNOLOGY
Volume 5, Number 1, 2019
Page 1 of 8 Article 13 – Report Writing
Report Writing: An introductory guide Reports are documents used to convey information in a relevant format. This guide will provide some hints and tips about what reports are, how they differ from essays and how best to structure them to create professional looking documents. https://my.cumbria.ac.uk
The Paper Industry Technical Association (PITA) is an independent organisation which operates for the general benefit of its members – both individual and corporate – dedicated to promoting and improving the technical and scientific knowledge of those working in the UK pulp and paper industry. Formed in 1960, it serves the Industry, both manufacturers and suppliers, by providing a forum for members to meet and network; it organises visits, conferences and training seminars that cover all aspects of papermaking science. It also publishes the prestigious journal Paper Technology International and the PITA Annual Review, both sent free to members, and a range of other technical publications which include conference proceedings and the acclaimed Essential
Guide to Aqueous Coating.

[email protected] UNIVERSITY OF CUMBRIA
Report Writing An introductory guide
The Skills Team, University of Cumbria
August 2018

1 | P a g e
Skills@Cumbria
Summary
Reports are documents used to convey information in a relevant format. This guide
will provide some hints and tips about what reports are, how they differ from essays and how best to structure them to create professional looking documents.
Disclaimer
Please Note: This guide has been written in the
style of a report. However, there are many ways
to layout a report. Check your module guide for
individual tutor requirements.

2 | P a g e
Skills@Cumbria
Contents
Summary Page 2 Disclaimer Page 2 Introduction Page 3
1. Differences and purpose Page 3
2. Importance of the brief Page 3
3. Format or layout Page 3
4. Writing skills Page 4
5. Visual media Page 5
6. Examples of reports Page 5
7. References Page 5
8. Further reading Page 6
Figures and Tables
Fig.1 Suggested sections for a scientific report Page 4 Fig.2 Suggested sections for a business report Page 4

3 | P a g e
Skills@Cumbria
Introduction
Reports are used in many professions including health, medical, science,
government, business, and the police. As they are used to provide key information, they are considered to be a highly effective communication tool. But
they need careful planning to create maximum impact. This guide will outline some of the formatting and style issues to consider.
1. Differences and Purpose
1.1 The main difference from essays is that reports can make use of the following to enhance their look and feel:
labelled sections headings and subheadings
bullet points or short paragraphs images, tables and diagrams
1.2 Good report writing is a key employability skill. Reports are used to provide
information, make recommendations, feedback on surveys or outline strategy. Therefore, a good report should be accessible, readable and attractive.
2. Importance of the Brief
2.1 Reports are usually the result of a specific brief or assignment. The format of the report therefore needs to reflect what your tutor is asking for.
2.2 Read the brief carefully and if need be ask your tutor which layout they wish
to see. They may leave that decision up to you as it can depend on your findings.
Here are some basics to get you started:
3. Format or Layout
3.1 Below are some suggested sections for a scientific or laboratory report and a business or policing report. The key is to be flexible so only include those
sections relevant to the brief. Therefore, use these suggestions as guidelines and add to, change or omit sections as needed.
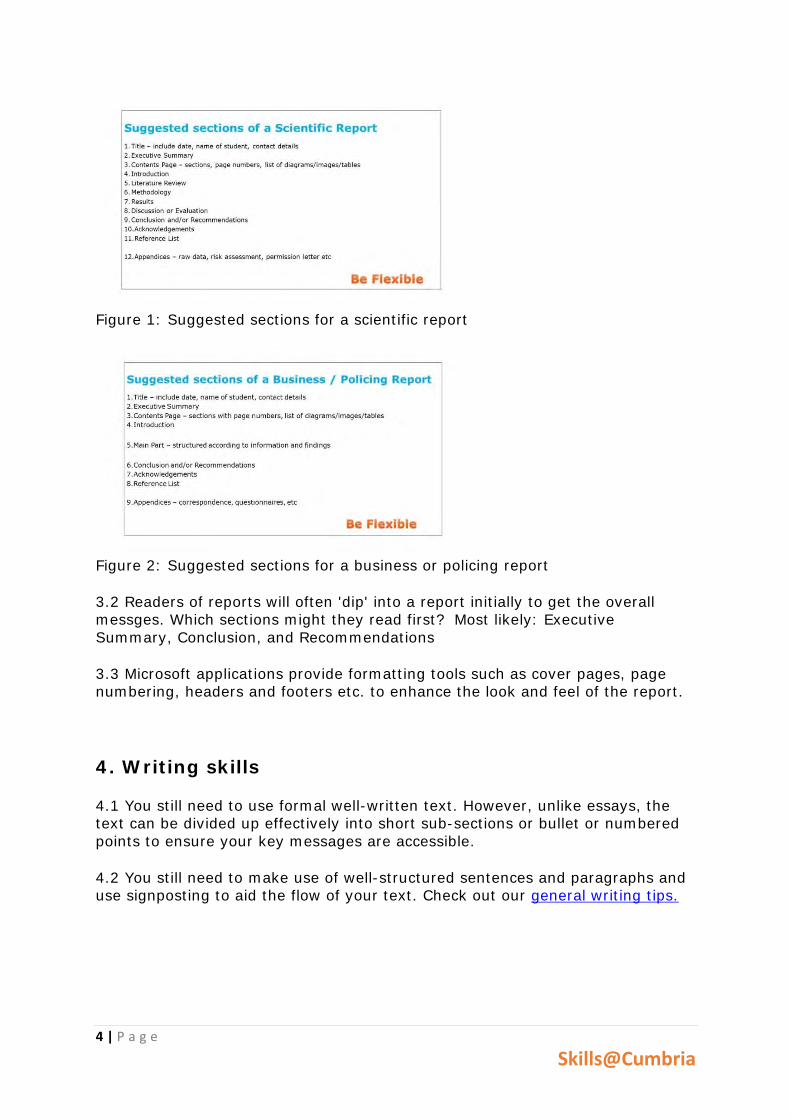
4 | P a g e
Skills@Cumbria
Figure 1: Suggested sections for a scientific report
Figure 2: Suggested sections for a business or policing report
3.2 Readers of reports will often 'dip' into a report initially to get the overall messges. Which sections might they read first? Most likely: Executive
Summary, Conclusion, and Recommendations
3.3 Microsoft applications provide formatting tools such as cover pages, page numbering, headers and footers etc. to enhance the look and feel of the report.
4. Writing skills
4.1 You still need to use formal well-written text. However, unlike essays, the text can be divided up effectively into short sub-sections or bullet or numbered
points to ensure your key messages are accessible.
4.2 You still need to make use of well-structured sentences and paragraphs and use signposting to aid the flow of your text. Check out our general writing tips.

5 | P a g e
Skills@Cumbria
5. Visual media to illustrate your reports
5.1 Enhance the impact of your report by including images, figures or
illustrations, diagrams, tables, infographics etc. A few golden rules though:
1. They must all be relevant and have a purpose 2. This purpose must be explained
3. They must be referenced if not your own - Check Cite them Right for styles
4. They must be labelled 5. They can be listed in the contents page so they are easy to find
5.2 If appropriate add an image or colour to the title page or front cover of your report. You can also use colour within the main body of your report.
6. Example of Reports
6.1 Scientific
Invertebrate Survey (Telfer, 2013)
The Clean Growth Strategy (HM Government, 2017)
6.2 Business / Policing
Smart Cities (McKinsey & Co, 2018) Report of the Stephen Lawrence Enquiry (Macpherson, 1999)
7. References
HM Government (2017) The clean growth strategy: leading the way to a low barbon
future. Available at:
https://assets.publishing.service.gov.uk/government/uploads/system/uploads/attachme
nt_data/file/700496/clean-growth-strategy-correction-april-2018.pdf (Accessed: 9
August 2018).
Macpherson, W. (1999) Report of the Stephen Lawrence Enquiry. Available at:
https://www.gov.uk/government/publications/the-stephen-lawrence-inquiry (Accessed:
9 August 2018).
McKinsey (2018) Smart cities: digital solutions for a more livable future. Available at:
https://www.mckinsey.com/~/media/McKinsey/Industries/Capital%20Projects%20and%
20Infrastructure/Our%20Insights/Smart%20cities%20Digital%20solutions%20for%20a
%20more%20livable%20future/MGI-Smart-Cities-Full-Report.ashx (Accessed: 9 August
2018).
Telfer, M.G. (2013) Invertebrate survey of Northstowe, Cambridgeshire. Available at:
https://www.scambs.gov.uk/sites/default/files/documents/ES%20Appendix%20F_Part_8
_0.pdf (Accessed: 9 August 2018).

6 | P a g e
Skills@Cumbria
8. Further reading
Check Onesearch for the full range of titles available. Some will be aimed at
general audiences, others at specific subject areas.
Bogg, D. (2016) Report writing for social workers. 2nd edn. London: Open
University Press.
Bowden, J. (2011) Writing a report: how to prepare, write and present really
effective reports. 9th edn. Oxford: How to Books.
Forsyth, P. (2016) How to write reports and proposals. 4th edn. London: Kogan
Page.
Price, M. (2013) Lab reports and projects in sport and exercise science: a guide
for students. Harlow: Pearson.
Reid, M. (2012) Report writing. Basingstoke: Palgrave Macmillan.
PAPERmaking!
FROM THE PUBLISHERS OF PAPER TECHNOLOGY
Volume 5, Number 1, 2019
Page 1 of 27 Products & Services
Products & Services PITA CORPORATE SUPPLIER MEMBERS
Page 2 ABB
Page 11 Archroma
Page 12 Jarshire
Page 15 Valmet
OTHER SUPPLIERS Page 16 Materials Handling Page 19 Safety Page 21 Testing / Analysis Page 25 Miscellaneous
The Paper Industry Technical Association (PITA) is an independent organisation which operates for the general benefit of its members – both individual and corporate – dedicated to promoting and improving the technical and scientific knowledge of those working in the UK pulp and paper industry. Formed in 1960, it serves the Industry, both manufacturers and suppliers, by providing a forum for members to meet and network; it organises visits, conferences and training seminars that cover all aspects of papermaking science. It also publishes the prestigious journal Paper Technology International and the PITA Annual Review, both sent free to members, and a range of other technical publications which include conference proceedings and the acclaimed Essential
Guide to Aqueous Coating.
PAPERmaking!
FROM THE PUBLISHERS OF PAPER TECHNOLOGY
Volume 5, Number 1, 2019
Page 2 of 27 Products & Services
ABB OFFERS A NEW APPLICATION TO HELP CUSTOMERS WORK SMARTER NOT HARDER Pioneering digital technology company ABB has a new application that will help customers achieve higher levels of productivity and improve economic return to meet their performance and quality objectives. The Asset Management Application is a digital solution that enables process industries to manage and protect their assets through predictive and preventative maintenance to avoid costly failures. Cost effective management becomes a reality through the optimisation of workflows and in-depth analysis of results, offering efficient asset management strategies that enable smarter, more informed decisions. The application offers industrial plants real-time condition monitoring of equipment, connected devices and field devices to reduce unscheduled downtime, prevents equipment failures and optimises operation and maintenance of the installed base. ABB enables predictive and preventative maintenance by diagnosing asset conditions and predicting looming equipment problems on premise and, for the first time, at an enterprise’s global level. Moreover, the application enables the usage of advanced analytical methods such as machine learning and artificial intelligence to analyse equipment problems and optimise the performance. As geographically dispersed production sites constantly grow, global connectivity, helped by advanced cloud technologies, is an important feature. It brings added benefits of wider collaboration across teams, management and operations. ABB Ability™ Edge ensures a secure connection between assets and the cloud, efficiently separating IT and OT. Edge technology can also act as a platform for applications to give customers the option to operate solely on premise rather than in the cloud. In the case of a problem, users can make informed and quick decisions, based on clear recommendations. Actions range from immediate attention to scheduling maintenance in the near future and the identification of issues that can be resolved during its routine maintenance of equipment. The application is available for basic instrumentation equipment across all processing and manufacturing industries, for detailed assets such as motor transformers or circuit breakers and complex electrical or rotating equipment, and mechanical handling equipment such as conveyor belts. By providing a precise cause of any equipment problems, the application also enables speedy identification and recovery, further reducing costs. “One of our priorities when developing the Asset Management App was to provide customers with complete control over knowledge of the process. In doing so we will, for the first time, give them the flexibility to quickly create their own asset models from the intelligence they gather.” says Neil Shah, Global Product Manager for Device Management & Asset Optimization at ABB. “Asset analysis, including root-cause analysis, is another key factor in helping customers to remain competitive in today’s industrial markets.”

PAPERmaking!
FROM THE PUBLISHERS OF PAPER TECHNOLOGY
Volume 5, Number 1, 2019
Page 3 of 27 Products & Services
The Asset Management Application will be launched in the second half of 2019. It sits within ABB Ability™, ABB’s digital offering, which includes more than 210 Industrial Internet solutions and an Industrial Internet technology platform and cloud infrastructure. Drawing on insights across 20 plus industries and more than 40 years of experience in digital technology, ABB Ability™ helps customers to develop new processes and advance existing processes by providing insights and by optimising planning and controlling for real-time operations. The results can flow into control systems such as ABB Ability™ System 800xA and ABB Ability™ Symphony Plus to improve key performance metrics of plants and assets. With over 70 million connected devices, more than 70,000 digital control systems and 6,000 enterprise software solutions, ABB is a trusted leader in creating digital solutions for customers in the industrial space.

PAPERmaking!
FROM THE PUBLISHERS OF PAPER TECHNOLOGY
Volume 5, Number 1, 2019
Page 4 of 27 Products & Services
ABB UNVEILS LATEST UPGRADE TO DCS FREELANCE Security is a top priority in the age of Industry 4.0 and enhanced security is one of a range of new features and benefits included in Freelance 2019. Originally launched in 1994, Freelance is ABB’s cost-effective distributed control system (DCS) solution for process industries. It combines the advantages of a DCS with Programmable Logic Controllers (PLC) and is characterised by ease of use, scalability, flexibility and reliability. Freelance 2019 is the latest version of the DCS. The Freelance suite of solutions comprises Freelance Operations for use at operator level, a scalable process level option, and Freelance Engineering which is used to configure and commission the system including the operator interface. The new version provides significant improvements throughout the complete system. New features and benefits of Freelance 2019 Improved usability: Freelance 2019 provides a significant increase in efficiency and usability for its Operations and Engineering solution by adding advanced navigation, filter and sort functionality. The user experience has been improved with a new, very modern UI. Scalable: A new controller, PM 904F, expands the Freelance AC 900F controller family in the upper range, supporting four communication interfaces. It also provides more application memory and enables the reservation of specific memory. As for all Freelance controllers user applications are 100% runtime-compatible which also enables smooth upgrade opportunities. More connectivity: Up to four monitors can now be connected to a single operator workplace. The available display types per monitor, as well as the arrangements of the monitors, are easily configured and fulfil the typical requirements for occupational safety and operator effectiveness. Enhanced security: Freelance provides an additional alternative to its user management capabilities known as “Security Lock” by a solution called “Extended User Management”. This new option makes use of Windows user accounts, supporting both local and domain accounts. As a result typical requests for options such as central password management, rules for password complexity, or password aging can be fulfilled.

PAPERmaking!
FROM THE PUBLISHERS OF PAPER TECHNOLOGY
Volume 5, Number 1, 2019
Page 5 of 27 Products & Services
Compatibility: Freelance 2019 can run on Windows 10 and Windows 7 in the same system architecture. This allows customers to do a step-wise upgrade to modern IT infrastructure which helps in reducing maintenance costs. “Being user-friendly, cost-effective and robust has already made Freelance a popular choice for businesses of process industries in more than 100 countries worldwide. Its flexibility and extensive reach are demonstrated by the 1000s of installations of the solution in industries,” said Ingo Mauritz, Global Product Line Manager for Freelance at ABB. “Wacker Chemie in Germany uses Freelance with Freelance Operations as the tool to efficiently operate and monitor their ketene plant. In China, Freelance provided uniform configuration of field devices online at YunNan HongTa DianXI Cement obtaining the maximum automation with minimum engineering. Freelance was also integral to the modernisation of Glinojeck, a leading European sugar producer and was at the centre of one of the most sophisticated reverse osmosis desalination projects in the Middle East,” added Mauritz. As in earlier versions of Freelance customers have the option of staying automatically up-to-date by subscribing to the Automation Sentinel life cycle program by, for example, providing automatic cyber security patches. Available in a wide range of languages, Freelance takes five minutes to install on any standard computer and can easily be self-learned. The intuitive operator interface enables easy operation and diagnosis of the entire system and being just one file it is easy to back up as the entire application fits on a small memory stick.

PAPERmaking!
FROM THE PUBLISHERS OF PAPER TECHNOLOGY
Volume 5, Number 1, 2019
Page 6 of 27 Products & Services
ABB ACS6080 DRIVE FOR HIGH PERFORMANCE MOTOR CONTROL ABB has expanded its all-compatible drives offering to include the ACS6080 medium voltage (MV) drive for critical applications. The new drive introduces a breakthrough control technology, developed by ABB, that brings high performance motor control to demanding processes used in industries such as mining, metals and marine. The drive also enables plants to operate more efficiently and produce higher quality output. Traditionally, achieving high dynamic performance and excellent power quality required hardware with multiple devices. However, this increase in components could decrease reliability of the operation. The ACS6080 drive maintains the same highly reliable hardware as its predecessor, the ACS6000, and includes the new advanced control capability, known as Model Predictive Pulse Pattern Control (MP3C). ABB’s MP3C technology combines model predictive control with optimised pulse pattern to modulate the semiconductors. This means that at every point in time this control can anticipate the best motor operation point by finding the perfect compromise between dynamics, efficiency and harmonic distortion. The new control enables system integrators and plant operators to maintain stability, while reducing investment and operational costs by using a smaller drive or a smaller motor. The increased power capability of the ACS6080’s single power module reduces the footprint of the drive by up to 20 percent. The new control helps to reduce operational cost in two ways: it is more energy efficient than other control solutions, and maintenance costs are reduced as there is less mechanical and thermal stress on the equipment leading to longer lifetime of the components.
The ACS6080 provides extensive input/output connectivity and supports all major fieldbus protocols, making it easy to integrate into existing systems and processes. It is compatible with ABB Ability™ condition monitoring services, allowing customers to obtain real-time data about the status and performance of the monitored equipment from any location. “The ACS6080 MV drive provides benefits which help deliver exceptional value to industrial processes in terms of product quality, uptime, safety and energy efficiency,” says Mark Land, Manager – MV Drives, ABB Limited.

PAPERmaking!
FROM THE PUBLISHERS OF PAPER TECHNOLOGY
Volume 5, Number 1, 2019
Page 7 of 27 Products & Services
The new drive delivers a high level of safety for people and equipment via an arc-resistant design and certified functional safety features. The ACS6080 is built on ABB’s common drive architecture, enabling a faster and harmonised start-up, commissioning and monitoring. Once a user has learned how to use one all-compatible drive, they can then operate any other drive in ABB’s all-compatible offering. The modular design of the ACS6080 enables it to be configured for single or multi-motor applications. It controls all types of AC motors including induction, synchronous and permanent magnet, without the need for different software. The ACS6080 can be tailored to any heavy industrial application, and has a power range from five megawatt (MW) to 36 MW. ABB Ltd., Daresbury Park, Daresbury, Warrington, WA4 4BT
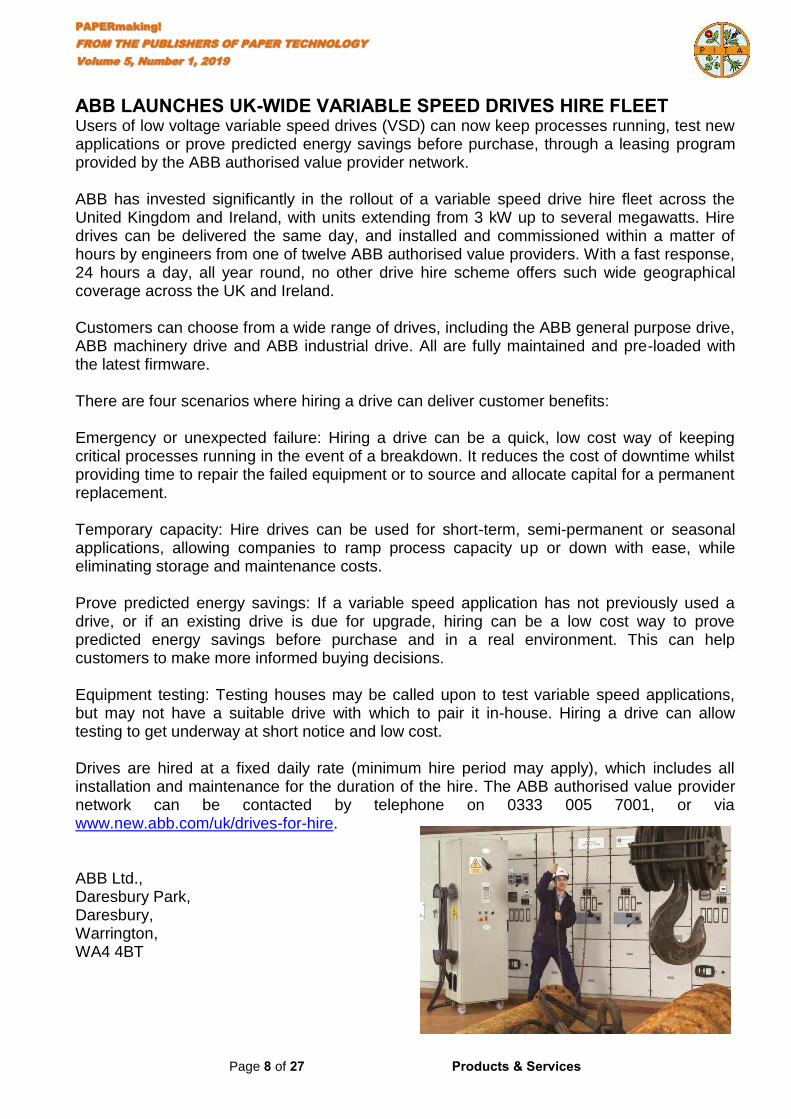
PAPERmaking!
FROM THE PUBLISHERS OF PAPER TECHNOLOGY
Volume 5, Number 1, 2019
Page 8 of 27 Products & Services
ABB LAUNCHES UK-WIDE VARIABLE SPEED DRIVES HIRE FLEET Users of low voltage variable speed drives (VSD) can now keep processes running, test new applications or prove predicted energy savings before purchase, through a leasing program provided by the ABB authorised value provider network. ABB has invested significantly in the rollout of a variable speed drive hire fleet across the United Kingdom and Ireland, with units extending from 3 kW up to several megawatts. Hire drives can be delivered the same day, and installed and commissioned within a matter of hours by engineers from one of twelve ABB authorised value providers. With a fast response, 24 hours a day, all year round, no other drive hire scheme offers such wide geographical coverage across the UK and Ireland. Customers can choose from a wide range of drives, including the ABB general purpose drive, ABB machinery drive and ABB industrial drive. All are fully maintained and pre-loaded with the latest firmware. There are four scenarios where hiring a drive can deliver customer benefits: Emergency or unexpected failure: Hiring a drive can be a quick, low cost way of keeping critical processes running in the event of a breakdown. It reduces the cost of downtime whilst providing time to repair the failed equipment or to source and allocate capital for a permanent replacement. Temporary capacity: Hire drives can be used for short-term, semi-permanent or seasonal applications, allowing companies to ramp process capacity up or down with ease, while eliminating storage and maintenance costs. Prove predicted energy savings: If a variable speed application has not previously used a drive, or if an existing drive is due for upgrade, hiring can be a low cost way to prove predicted energy savings before purchase and in a real environment. This can help customers to make more informed buying decisions. Equipment testing: Testing houses may be called upon to test variable speed applications, but may not have a suitable drive with which to pair it in-house. Hiring a drive can allow testing to get underway at short notice and low cost. Drives are hired at a fixed daily rate (minimum hire period may apply), which includes all installation and maintenance for the duration of the hire. The ABB authorised value provider network can be contacted by telephone on 0333 005 7001, or via www.new.abb.com/uk/drives-for-hire. ABB Ltd., Daresbury Park, Daresbury, Warrington, WA4 4BT
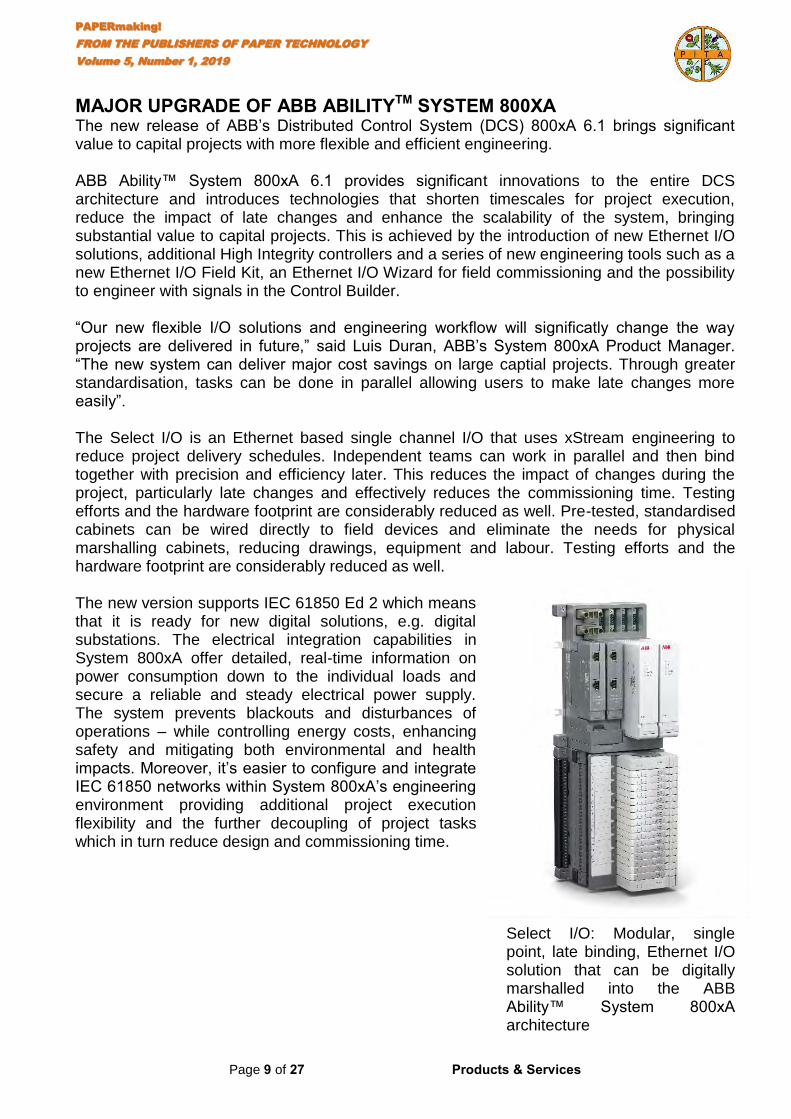
PAPERmaking!
FROM THE PUBLISHERS OF PAPER TECHNOLOGY
Volume 5, Number 1, 2019
Page 9 of 27 Products & Services
MAJOR UPGRADE OF ABB ABILITYTM SYSTEM 800XA The new release of ABB’s Distributed Control System (DCS) 800xA 6.1 brings significant value to capital projects with more flexible and efficient engineering. ABB Ability™ System 800xA 6.1 provides significant innovations to the entire DCS architecture and introduces technologies that shorten timescales for project execution, reduce the impact of late changes and enhance the scalability of the system, bringing substantial value to capital projects. This is achieved by the introduction of new Ethernet I/O solutions, additional High Integrity controllers and a series of new engineering tools such as a new Ethernet I/O Field Kit, an Ethernet I/O Wizard for field commissioning and the possibility to engineer with signals in the Control Builder. “Our new flexible I/O solutions and engineering workflow will significatly change the way projects are delivered in future,” said Luis Duran, ABB’s System 800xA Product Manager. “The new system can deliver major cost savings on large captial projects. Through greater standardisation, tasks can be done in parallel allowing users to make late changes more easily”. The Select I/O is an Ethernet based single channel I/O that uses xStream engineering to reduce project delivery schedules. Independent teams can work in parallel and then bind together with precision and efficiency later. This reduces the impact of changes during the project, particularly late changes and effectively reduces the commissioning time. Testing efforts and the hardware footprint are considerably reduced as well. Pre-tested, standardised cabinets can be wired directly to field devices and eliminate the needs for physical marshalling cabinets, reducing drawings, equipment and labour. Testing efforts and the hardware footprint are considerably reduced as well. The new version supports IEC 61850 Ed 2 which means that it is ready for new digital solutions, e.g. digital substations. The electrical integration capabilities in System 800xA offer detailed, real-time information on power consumption down to the individual loads and secure a reliable and steady electrical power supply. The system prevents blackouts and disturbances of operations – while controlling energy costs, enhancing safety and mitigating both environmental and health impacts. Moreover, it’s easier to configure and integrate IEC 61850 networks within System 800xA’s engineering environment providing additional project execution flexibility and the further decoupling of project tasks which in turn reduce design and commissioning time.
Select I/O: Modular, single point, late binding, Ethernet I/O solution that can be digitally marshalled into the ABB Ability™ System 800xA architecture
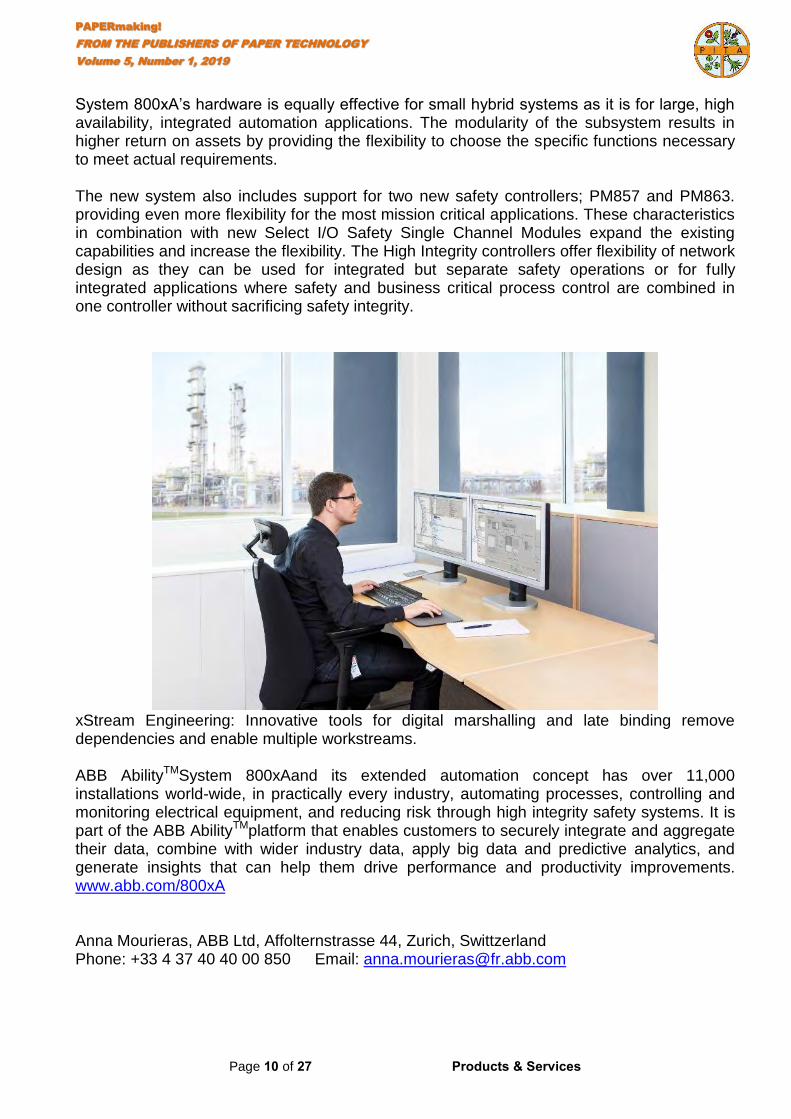
PAPERmaking!
FROM THE PUBLISHERS OF PAPER TECHNOLOGY
Volume 5, Number 1, 2019
Page 10 of 27 Products & Services
System 800xA’s hardware is equally effective for small hybrid systems as it is for large, high availability, integrated automation applications. The modularity of the subsystem results in higher return on assets by providing the flexibility to choose the specific functions necessary to meet actual requirements. The new system also includes support for two new safety controllers; PM857 and PM863. providing even more flexibility for the most mission critical applications. These characteristics in combination with new Select I/O Safety Single Channel Modules expand the existing capabilities and increase the flexibility. The High Integrity controllers offer flexibility of network design as they can be used for integrated but separate safety operations or for fully integrated applications where safety and business critical process control are combined in one controller without sacrificing safety integrity.
xStream Engineering: Innovative tools for digital marshalling and late binding remove dependencies and enable multiple workstreams. ABB AbilityTMSystem 800xAand its extended automation concept has over 11,000 installations world-wide, in practically every industry, automating processes, controlling and monitoring electrical equipment, and reducing risk through high integrity safety systems. It is part of the ABB AbilityTMplatform that enables customers to securely integrate and aggregate their data, combine with wider industry data, apply big data and predictive analytics, and generate insights that can help them drive performance and productivity improvements. www.abb.com/800xA Anna Mourieras, ABB Ltd, Affolternstrasse 44, Zurich, Swittzerland Phone: +33 4 37 40 40 00 850 Email: [email protected]
PAPERmaking!
FROM THE PUBLISHERS OF PAPER TECHNOLOGY
Volume 5, Number 1, 2019
Page 11 of 27 Products & Services
ARCHROMA LAUNCHES LEUCOPHOR® AFCN FOR FOOD CONTACT Archroma announced the introduction of a new optical brightening agent (OBA) specially designed for food packaging and paper, Leucophor® AFCN liq. The newly launched OBA has been approved for food contact by the US Food and Drug Administration. Urbanisation and digitalisation are rapidly changing our lifestyle. People around the globe are increasingly purchasing and consuming on the go. A growing part of food containers are made from renewable sources, such as paper and board. It is necessary to ensure that these paper containers are free from substances that would be harmful for the consumer. Archroma is committed to continuously challenge the status quo in the deep belief that we can make our industry sustainable. We strive to introduce innovations that allow safe, efficient and enhanced manufacturing processes - and end products. Leucophor® AFCN liq was designed with these guiding principles in mind:
• Leucophor® AFCN liquid has approval for use in food-contact paper and paperboard under FDA Food Contact Notification 1921, which became effective on 9 November 2018.
• Leucophor® AFCN liq is ideally suited for stock application and for use in coating
formulations that contain polyvinyl alcohol (PVOH), carboxymethyl cellulose (CMC) or casein as a secondary binder.
• Leucophor® AFCN liq is a disulphonated OBA, with a characteristically high
substantivity in the wet-end delivering the papermaker cost savings through the ability to make more rapid grade changes.
"There is a fast-growing demand for food packaging made with paper and board, and our Leucophor® AFCN liquid OBA has been developed to help manufacturers to respond to that demand”, comments Andrew Jackson, Global Product Manager Optical Brightening Agents, Paper Solutions Business, Archroma. “Complementing our FDA-compliant tetrasulphonated OBAs and shading colorants, Leucophor® AFCN liquid provides our customers with greater flexibility to produce attractive, white, paper-based packaging and containers for food applications. Because it’s our nature!” Contact Details: Muriel Werlé Archroma +65 68667422 [email protected]
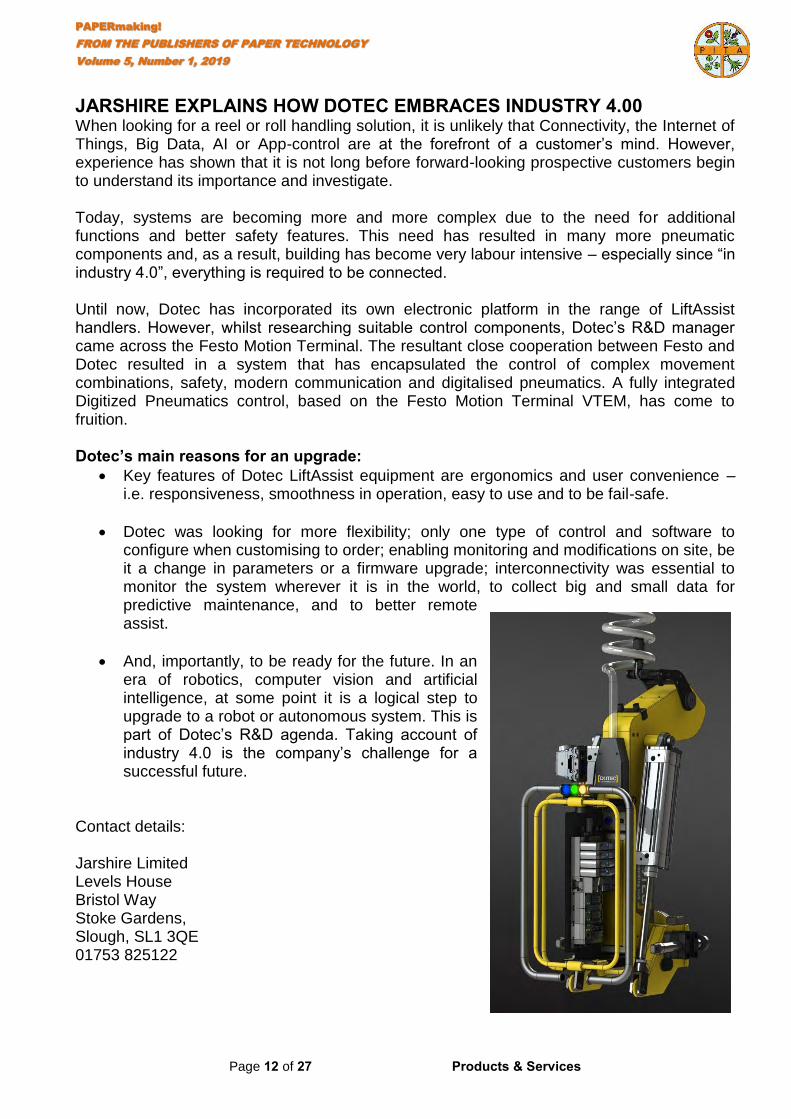
PAPERmaking!
FROM THE PUBLISHERS OF PAPER TECHNOLOGY
Volume 5, Number 1, 2019
Page 12 of 27 Products & Services
JARSHIRE EXPLAINS HOW DOTEC EMBRACES INDUSTRY 4.00 When looking for a reel or roll handling solution, it is unlikely that Connectivity, the Internet of Things, Big Data, AI or App-control are at the forefront of a customer’s mind. However, experience has shown that it is not long before forward-looking prospective customers begin to understand its importance and investigate. Today, systems are becoming more and more complex due to the need for additional functions and better safety features. This need has resulted in many more pneumatic components and, as a result, building has become very labour intensive – especially since “in industry 4.0”, everything is required to be connected. Until now, Dotec has incorporated its own electronic platform in the range of LiftAssist handlers. However, whilst researching suitable control components, Dotec’s R&D manager came across the Festo Motion Terminal. The resultant close cooperation between Festo and Dotec resulted in a system that has encapsulated the control of complex movement combinations, safety, modern communication and digitalised pneumatics. A fully integrated Digitized Pneumatics control, based on the Festo Motion Terminal VTEM, has come to fruition. Dotec’s main reasons for an upgrade:
Key features of Dotec LiftAssist equipment are ergonomics and user convenience – i.e. responsiveness, smoothness in operation, easy to use and to be fail-safe.
Dotec was looking for more flexibility; only one type of control and software to configure when customising to order; enabling monitoring and modifications on site, be it a change in parameters or a firmware upgrade; interconnectivity was essential to monitor the system wherever it is in the world, to collect big and small data for predictive maintenance, and to better remote assist.
And, importantly, to be ready for the future. In an era of robotics, computer vision and artificial intelligence, at some point it is a logical step to upgrade to a robot or autonomous system. This is part of Dotec’s R&D agenda. Taking account of industry 4.0 is the company’s challenge for a successful future.
Contact details: Jarshire Limited Levels House Bristol Way Stoke Gardens, Slough, SL1 3QE 01753 825122
PAPERmaking!
FROM THE PUBLISHERS OF PAPER TECHNOLOGY
Volume 5, Number 1, 2019
Page 13 of 27 Products & Services
JARSHIRE ON HIGH PRESSURE WATER JET TAIL CUTTING The Italian equipment specialist Weingrill has announced a new development within its range of tail cutters claiming that its HP-Waterjet is the best alternative to dry-end tail cutters with rotating blades, and that this new device offers major advantages over traditional cutting systems. Dry-end tail cutting Modern paper machines demand high reliability and performance. Today most have dry-ends equipped with fixed or rotating blade tail cutters, any of which provide an acceptable cut quality under ideal operating conditions – i.e. limited base weight range, high paper dryness and assuming a well sharpened blade. High-pressure water-jet cutting With the purpose of meeting evolving market demands, Weingrill has developed the HP-Waterjet Tail Cutter, whose working principle is based on the use of high-pressure water. In simple terms, the equipment is composed of one pumping station providing the water and one nozzle turning the applied pressure into a high velocity water jet. Paper can then be “cold cut” without any alteration of its chemical and physical properties. Fully automatic, the tail cutter has been specifically designed to provide an alternative tail cutting system to traditional blade tail cutters. The high-pressure water medium ensures no mechanical contact with the paper leading to a dust- and drag-free cut, and reduced threading downtimes. In addition, non-contact cutting eliminates the inconvenience of inevitable wear and tear and replacement relating to rotating (or fixed) blades, and the associated time losses. It should also be noted that high-pressure water cutting exerts lower cutting forces on the paper compared with traditional blade devices, which results in stronger sheet edges and reduced web breaks. With applications in all kinds of paper and board production, including coated grades, the HP-Waterjet provides for very reliable and successful tail threading that quickly reacts to paper breaks, so minimising associated production losses. In comparison with blade tail cutters the HP-Waterjet ensures the following benefits:
• It is not subject to wear therefore not requiring continuous service (blade sharpening).
• Airborne dust is eliminated significantly reducing paper breaks in addition to
improving air quality and the overall working environment.
• Due to its compact construction the water jet guarantees efficient paper cutting at high speed without disturbing or breaking the sheet.
• The water jet exerts a lower cutting force on the paper. Consequently, the cutting
operation is faster and smoother with reduced cross-machine cutting time, improving the efficiency of tail transfer from section to section.
• The water jet does not require physical adjustments and it is not influenced by
profile variations or sheet fluttering.
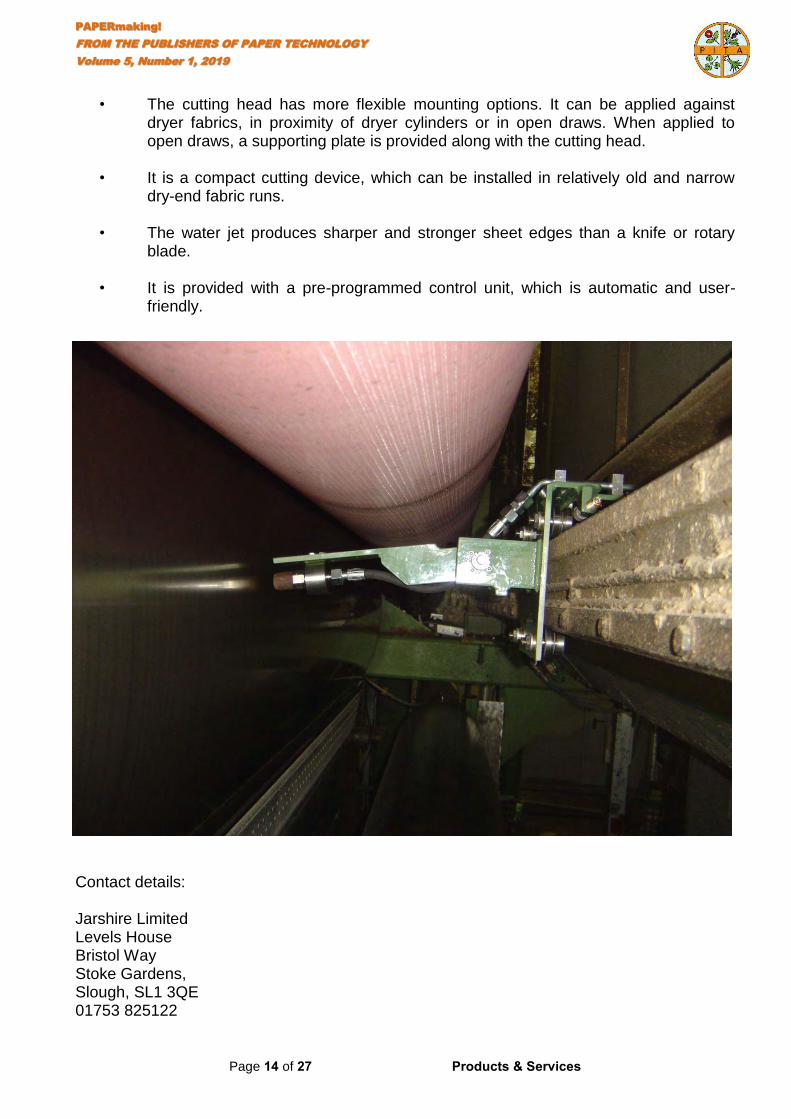
PAPERmaking!
FROM THE PUBLISHERS OF PAPER TECHNOLOGY
Volume 5, Number 1, 2019
Page 14 of 27 Products & Services
• The cutting head has more flexible mounting options. It can be applied against dryer fabrics, in proximity of dryer cylinders or in open draws. When applied to open draws, a supporting plate is provided along with the cutting head.
• It is a compact cutting device, which can be installed in relatively old and narrow
dry-end fabric runs.
• The water jet produces sharper and stronger sheet edges than a knife or rotary blade.
• It is provided with a pre-programmed control unit, which is automatic and user-
friendly.
Contact details: Jarshire Limited Levels House Bristol Way Stoke Gardens, Slough, SL1 3QE 01753 825122
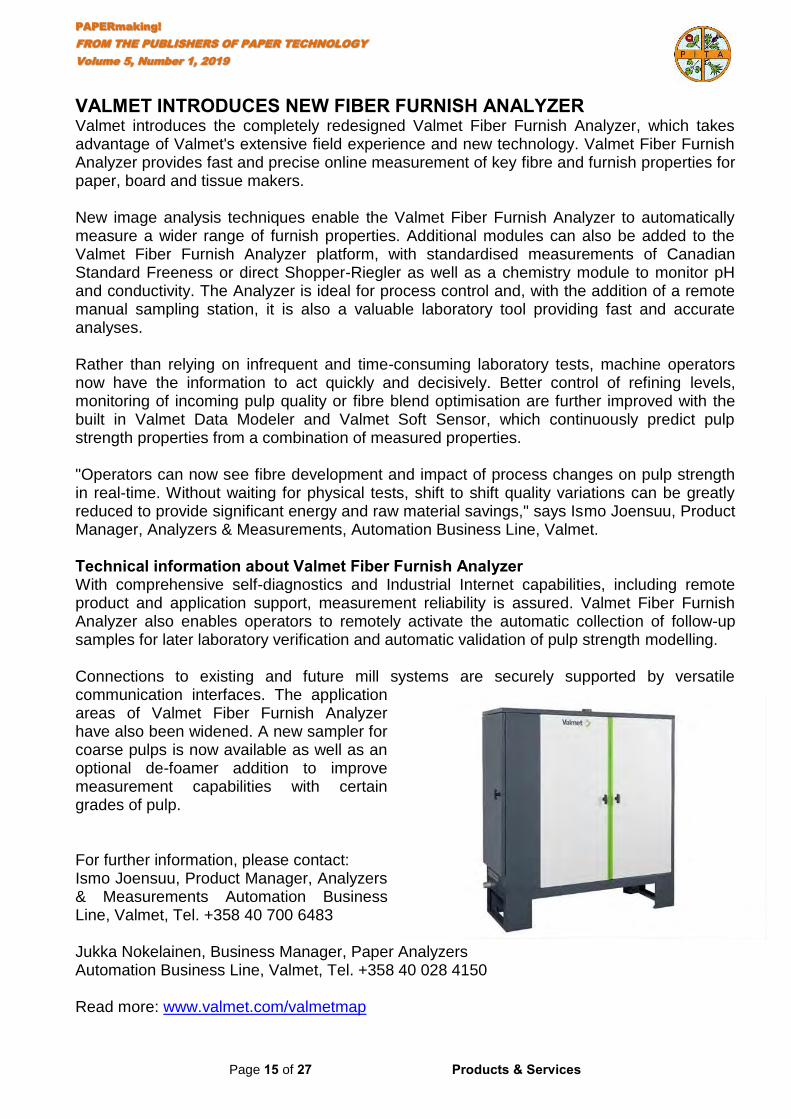
PAPERmaking!
FROM THE PUBLISHERS OF PAPER TECHNOLOGY
Volume 5, Number 1, 2019
Page 15 of 27 Products & Services
VALMET INTRODUCES NEW FIBER FURNISH ANALYZER Valmet introduces the completely redesigned Valmet Fiber Furnish Analyzer, which takes advantage of Valmet's extensive field experience and new technology. Valmet Fiber Furnish Analyzer provides fast and precise online measurement of key fibre and furnish properties for paper, board and tissue makers. New image analysis techniques enable the Valmet Fiber Furnish Analyzer to automatically measure a wider range of furnish properties. Additional modules can also be added to the Valmet Fiber Furnish Analyzer platform, with standardised measurements of Canadian Standard Freeness or direct Shopper-Riegler as well as a chemistry module to monitor pH and conductivity. The Analyzer is ideal for process control and, with the addition of a remote manual sampling station, it is also a valuable laboratory tool providing fast and accurate analyses. Rather than relying on infrequent and time-consuming laboratory tests, machine operators now have the information to act quickly and decisively. Better control of refining levels, monitoring of incoming pulp quality or fibre blend optimisation are further improved with the built in Valmet Data Modeler and Valmet Soft Sensor, which continuously predict pulp strength properties from a combination of measured properties. "Operators can now see fibre development and impact of process changes on pulp strength in real-time. Without waiting for physical tests, shift to shift quality variations can be greatly reduced to provide significant energy and raw material savings," says Ismo Joensuu, Product Manager, Analyzers & Measurements, Automation Business Line, Valmet. Technical information about Valmet Fiber Furnish Analyzer With comprehensive self-diagnostics and Industrial Internet capabilities, including remote product and application support, measurement reliability is assured. Valmet Fiber Furnish Analyzer also enables operators to remotely activate the automatic collection of follow-up samples for later laboratory verification and automatic validation of pulp strength modelling. Connections to existing and future mill systems are securely supported by versatile communication interfaces. The application areas of Valmet Fiber Furnish Analyzer have also been widened. A new sampler for coarse pulps is now available as well as an optional de-foamer addition to improve measurement capabilities with certain grades of pulp. For further information, please contact: Ismo Joensuu, Product Manager, Analyzers & Measurements Automation Business Line, Valmet, Tel. +358 40 700 6483 Jukka Nokelainen, Business Manager, Paper Analyzers Automation Business Line, Valmet, Tel. +358 40 028 4150 Read more: www.valmet.com/valmetmap

PAPERmaking!
FROM THE PUBLISHERS OF PAPER TECHNOLOGY
Volume 5, Number 1, 2019
Page 16 of 27 Products & Services
MATERIALS HANDLING
PAPERmaking!
FROM THE PUBLISHERS OF PAPER TECHNOLOGY
Volume 5, Number 1, 2019
Page 17 of 27 Products & Services
MIDLAND PALLET TRUCKS ANNOUNCES EXPANSION TO EXISTING RANGE OF MOVING SKATES Midland Pallet Trucks, nationwide leaders in the provision of high quality hand pallet trucks and other materials handling equipment, has announced the introduction of a new range of moving skates, also known as machinery skates, shifting skates, and load moving skates. The five new models in the Midland Pallet Trucks collection are designed to work alongside the firm’s selection of hydraulic lifting jacks to offer a simple, all-in-one solution for safe, secure, and efficient moving of heavy machinery. The new moving skate models include the X4-Y4 8000kg set, the X8-Y8 16000kg set, the X12-Y12 24000kg set, the X16-Y16 32000kg set, and the X18-Y18 36000kg set. These products have been added to Midland Pallet Trucks’ existing range of moving skates to enhance and expand the collection and provide customers with greater choice. All models are available now directly through the Midland Pallet Trucks website. The five new introductions to the Midland Pallet Trucks moving skate collection can be used within a variety of industrial environments, and are both steerable and adjustable for complete ease of use and added safety within the workplace. Featuring flexible swivel action due to the inclusion of a thrust bearing, and a powder-coated, durable finish, all of the latest models are designed and manufactured to the highest quality, ensuring top performance in warehouses. “We’ve specialised in moving skates for many years now, but have previously focused primarily on 6-18 ton weight capacities as these were what our customers were coming to us for,” says Midland Pallet Trucks Managing Director Phil Chesworth. “At a time when the needs of our customers are changing rapidly, we’ve taken measures to meet these new demands by introducing a wider capacity range, all the way from an 8 ton machinery skate set to a much more heavy duty 36 ton capability. “Our ultimate aim is to continue expanding our range to give our customers greater choice.” All skates within the new Midland Pallet Trucks range feature quality polyurethane skate wheels; an alternative to the standard nylon wheels included on many forms of machinery skate. The greater resistance of polyurethane compared to nylon ensures that this new skate collection performs optimally and to a continually high standard even on rough, uneven warehouse floor surfaces. Polyurethane is considered to be an effective material for skate wheels, offering a high level of crack resistance, unrivalled durability for longevity, and a minimal need for ongoing maintenance.
PAPERmaking!
FROM THE PUBLISHERS OF PAPER TECHNOLOGY
Volume 5, Number 1, 2019
Page 18 of 27 Products & Services
DRIVER ENVIRONMENT FOCUS FOR HYSTER® LIFT TRUCKS As the driving experience is an essential element of success in high intensity applications, Hyster Europe is focussing on enhancing the operator environment according to the application, including in the wood, metal, construction, ports and paper industries.
“When handling expensive, awkward and heavy loads, the driver environment matters more than ever,” says Chris van de Werdt from Hyster Europe. “Every lift truck brand claims its products are ergonomic, but you have to ask, ‘under what conditions?’ Intelligent Hyster® lift truck design focuses on the driver environment in all applications, but this proves particularly important for efficiency and driver comfort in extreme and demanding operating conditions.” Wood handling Throughout the wood supply chain, lift truck drivers may have to drive in reverse due to tall loads obscuring forward visibility. These operations can be very uncomfortable if the design of the driver environment doesn’t account for it. The shape of the rear of the truck, including the position of the exhaust stack, can affect visibility, while the seat needs to minimise body rotation to accommodate reversing. The Hyster® H13XM-6 is a typical lift truck used in the wood industry and addresses these challenges. With a clever rear design and the option of a swivel seat that turns 15/30 degrees, it aims to provide maximum comfort for the driver when driving in reverse. Depending on the application needs, Hyster Europe can also fit lift trucks with full rotating seats and drivers can be further assisted by camera systems. In addition, TouchPoint™ mini-lever controls help reduce awkward shoulder and arm postures by locating the hydraulic functions directly at the driver’s finger tips. This maintains driver comfort and helps the driver to focus on reversing. Paper Industry In the paper supply chain, it is common to handle large, expensive and fragile paper reels using giant clamps. “It’s important for drivers in paper applications to use trucks and attachments that not only minimise the risk of damage, but also optimise speed and performance,” says Chris. “However, this should not be at the expense of driver comfort.” A popular truck is the Hyster® S9.0FT which gives a 9-tonne lift on a 7-tonne chassis footprint, providing the instant advantages of added space and manoeuvrability during handling. The truck also offers a spacious driver environment, thanks to the design of the overhead guard and optimised floorspace in the operator cabin. The truck’s isolated drivetrain minimises the effects of powertrain vibration on the driver, while features such as ergonomically designed hydraulic controls, a contoured arm rest and a multi-function joystick also help to ensure comfort as well as lifting and handling accuracy. “Lift truck driver comfort is about far more than having some general ‘ergonomic’ features within the cab,” says Chris. “The best way to optimise the driver environment, even in the toughest operating conditions, is to select an intelligently designed heavy-duty lift truck with standard and additional features that meet both the demands of the application, and the needs of the driver.”

PAPERmaking!
FROM THE PUBLISHERS OF PAPER TECHNOLOGY
Volume 5, Number 1, 2019
Page 19 of 27 Products & Services
SAFETY

PAPERmaking!
FROM THE PUBLISHERS OF PAPER TECHNOLOGY
Volume 5, Number 1, 2019
Page 20 of 27 Products & Services
WHAT IS ISO/TS 19837:2018 - TRAPPED KEY INTERLOCKING DEVICES? ISO/TS 19837:2018 - Safety of Machinery – Trapped Key Interlocking Devices – Principles for design, selection and configuration is the first international ISO document devoted specifically to trapped key interlocking and answers many of the questions that have arisen relating to performance levels, key coding, and power interlocking. It is a significant step forward which will provide more choice for users of interlock devices and systems. Trapped Key Interlocking has its roots in the rail and power distribution industries where sequential control was, and still is, critical to safe, continuous operation. In the 1960’s trapped key interlocking was gradually utilised by the manufacturing sector, where isolating machinery before gaining access, was the requirement. Machinery with multiple energy sources and access points can be easily safeguarded using trapped key interlocks. Fortress Interlocks has developed specialised products over the years which can isolate air and hydraulic supplies as well as electrical power in sequence before allowing access points to be opened. When ISO14119:2013 Safety of Machinery – Interlocking device associated with guards, Principles for design and selection, was published trapped key interlocking had become no more than an annex, even the scope was clear that it did not provide all the specific requirements for trapped key systems. In many respects ISO14119:2013 served to confuse users and potential users familiar with decades of trapped key interlocks installations. ISO/TS 19837:2018, three years in the making, is a welcome addition to the existing suite of machinery safety standards. Perhaps the most critical question addressed is where mechanical or hybrid mechanical/electrical systems sit in relation to performance levels introduced in ISO 13849. Power Interlocking is now more properly referred to as “Isolation control through direct mechanical action” and falls within the Safety Related Part of The Control System. This coupled with the section “Validating performance level” makes evaluating performance levels for trapped key systems much clearer. The difference between actuators and keys is cleared up, following the confusion created in ISO14119:2013, and both are addressed in the “Terms and definitions” and “Symbols and abbreviated terms” sections. The need for a schematic detailing the trapped key system operation and establishing key coding appears under “Key Transfer Plan” and will provide users with an excellent tool in the system design phase as well as a documented system layout after installation. Key coding and management is also addressed extensively. A much-needed standardisation of symbols to represent trapped key interlocks will make it easier for customers to understand schematics, and the excellent pictorial examples throughout the document are useful for those building a trapped key interlock system. www.fortressinterlocks.com

PAPERmaking!
FROM THE PUBLISHERS OF PAPER TECHNOLOGY
Volume 5, Number 1, 2019
Page 21 of 27 Products & Services
TESTING / ANALYSIS
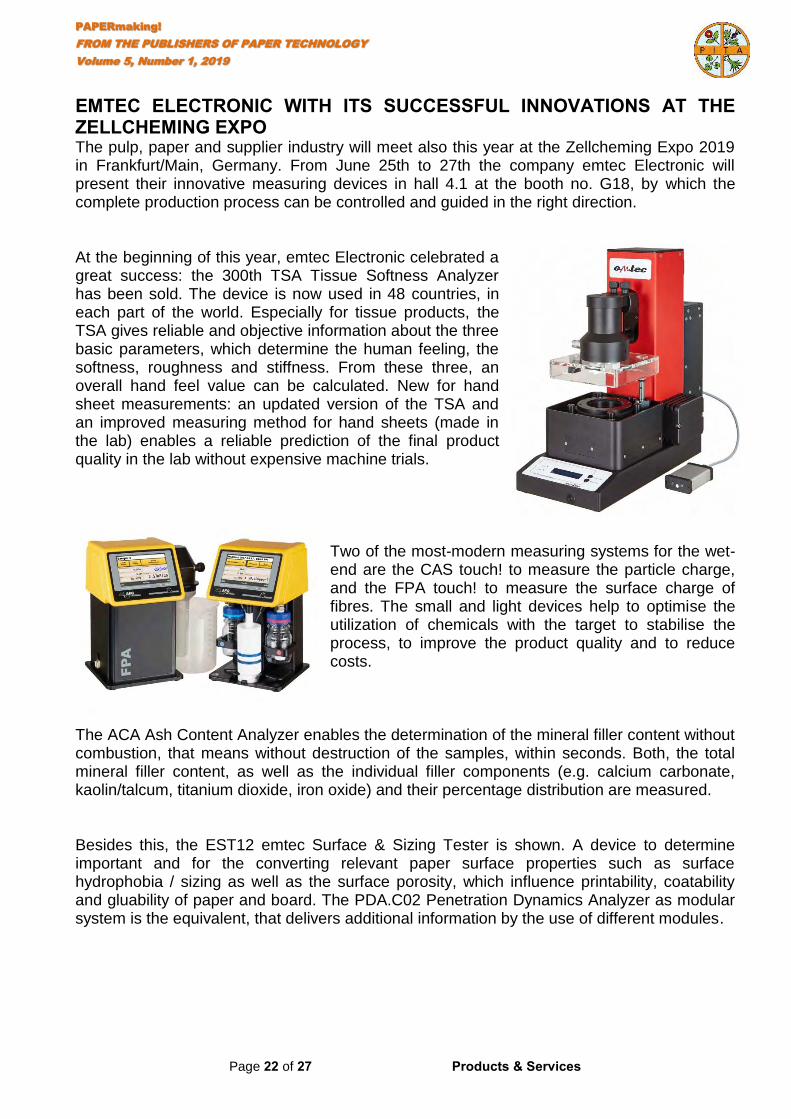
PAPERmaking!
FROM THE PUBLISHERS OF PAPER TECHNOLOGY
Volume 5, Number 1, 2019
Page 22 of 27 Products & Services
EMTEC ELECTRONIC WITH ITS SUCCESSFUL INNOVATIONS AT THE ZELLCHEMING EXPO The pulp, paper and supplier industry will meet also this year at the Zellcheming Expo 2019 in Frankfurt/Main, Germany. From June 25th to 27th the company emtec Electronic will present their innovative measuring devices in hall 4.1 at the booth no. G18, by which the complete production process can be controlled and guided in the right direction. At the beginning of this year, emtec Electronic celebrated a great success: the 300th TSA Tissue Softness Analyzer has been sold. The device is now used in 48 countries, in each part of the world. Especially for tissue products, the TSA gives reliable and objective information about the three basic parameters, which determine the human feeling, the softness, roughness and stiffness. From these three, an overall hand feel value can be calculated. New for hand sheet measurements: an updated version of the TSA and an improved measuring method for hand sheets (made in the lab) enables a reliable prediction of the final product quality in the lab without expensive machine trials.
Two of the most-modern measuring systems for the wet-end are the CAS touch! to measure the particle charge, and the FPA touch! to measure the surface charge of fibres. The small and light devices help to optimise the utilization of chemicals with the target to stabilise the process, to improve the product quality and to reduce costs.
The ACA Ash Content Analyzer enables the determination of the mineral filler content without combustion, that means without destruction of the samples, within seconds. Both, the total mineral filler content, as well as the individual filler components (e.g. calcium carbonate, kaolin/talcum, titanium dioxide, iron oxide) and their percentage distribution are measured. Besides this, the EST12 emtec Surface & Sizing Tester is shown. A device to determine important and for the converting relevant paper surface properties such as surface hydrophobia / sizing as well as the surface porosity, which influence printability, coatability and gluability of paper and board. The PDA.C02 Penetration Dynamics Analyzer as modular system is the equivalent, that delivers additional information by the use of different modules.
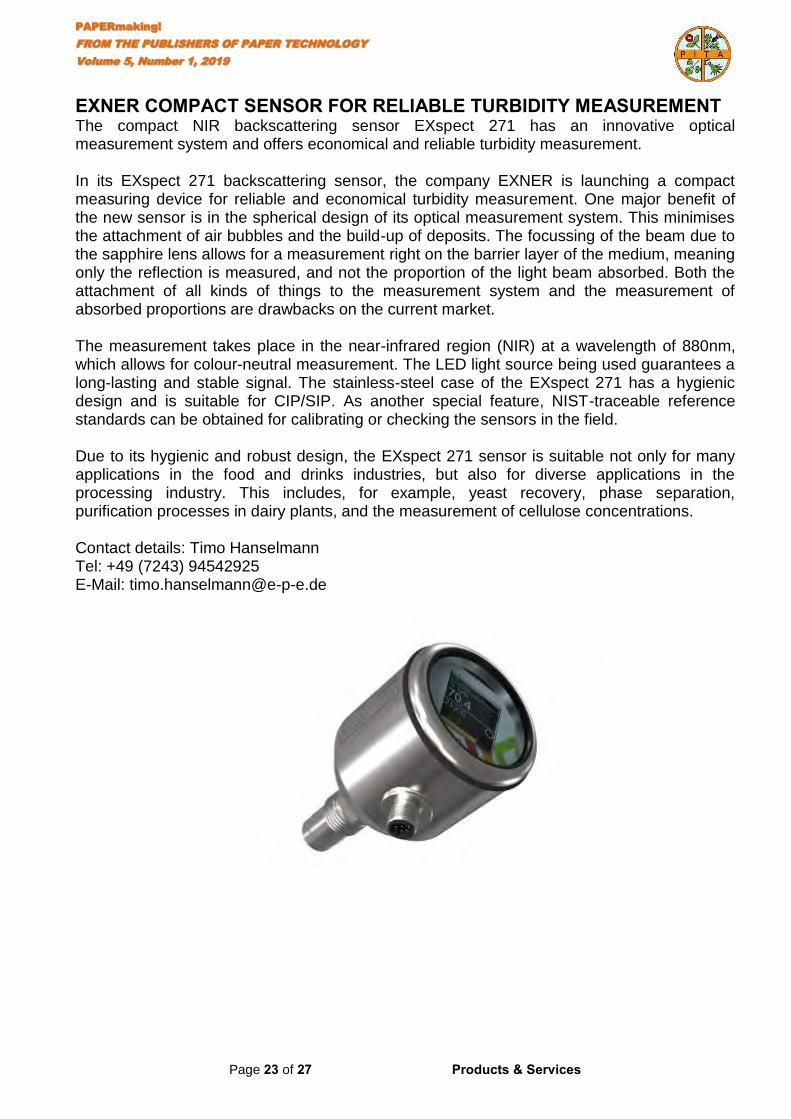
PAPERmaking!
FROM THE PUBLISHERS OF PAPER TECHNOLOGY
Volume 5, Number 1, 2019
Page 23 of 27 Products & Services
EXNER COMPACT SENSOR FOR RELIABLE TURBIDITY MEASUREMENT The compact NIR backscattering sensor EXspect 271 has an innovative optical measurement system and offers economical and reliable turbidity measurement. In its EXspect 271 backscattering sensor, the company EXNER is launching a compact measuring device for reliable and economical turbidity measurement. One major benefit of the new sensor is in the spherical design of its optical measurement system. This minimises the attachment of air bubbles and the build-up of deposits. The focussing of the beam due to the sapphire lens allows for a measurement right on the barrier layer of the medium, meaning only the reflection is measured, and not the proportion of the light beam absorbed. Both the attachment of all kinds of things to the measurement system and the measurement of absorbed proportions are drawbacks on the current market. The measurement takes place in the near-infrared region (NIR) at a wavelength of 880nm, which allows for colour-neutral measurement. The LED light source being used guarantees a long-lasting and stable signal. The stainless-steel case of the EXspect 271 has a hygienic design and is suitable for CIP/SIP. As another special feature, NIST-traceable reference standards can be obtained for calibrating or checking the sensors in the field. Due to its hygienic and robust design, the EXspect 271 sensor is suitable not only for many applications in the food and drinks industries, but also for diverse applications in the processing industry. This includes, for example, yeast recovery, phase separation, purification processes in dairy plants, and the measurement of cellulose concentrations. Contact details: Timo Hanselmann Tel: +49 (7243) 94542925 E-Mail: [email protected]
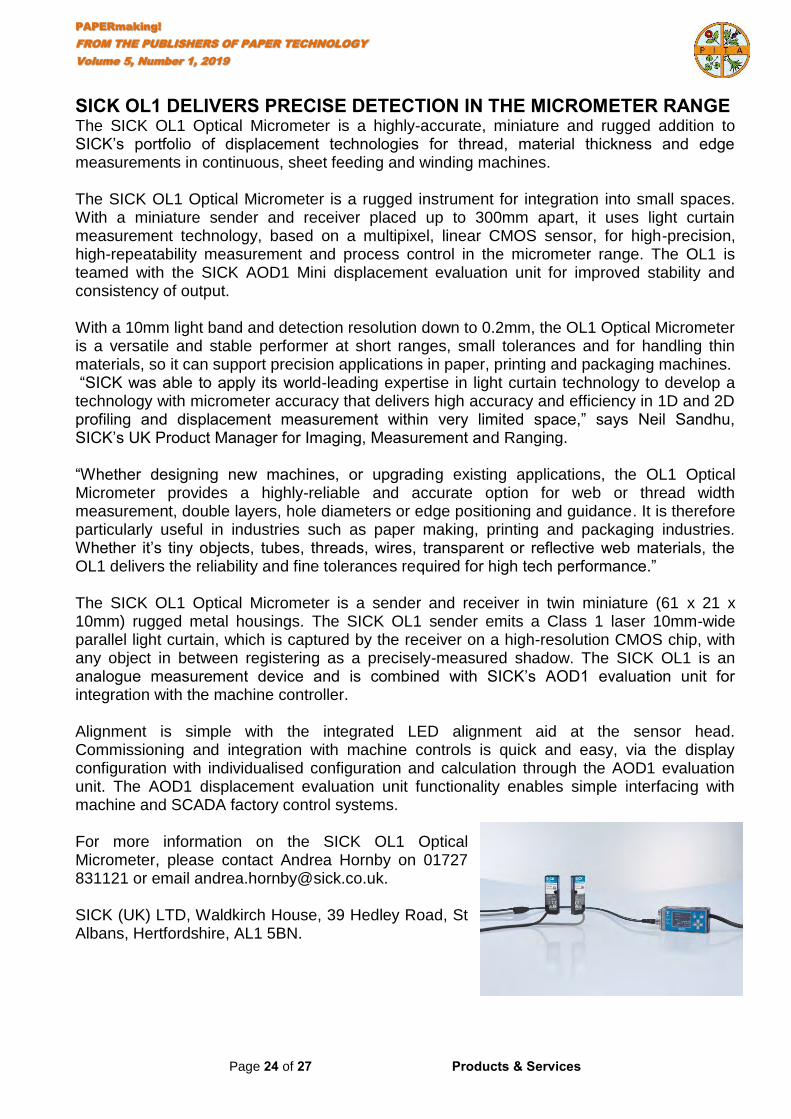
PAPERmaking!
FROM THE PUBLISHERS OF PAPER TECHNOLOGY
Volume 5, Number 1, 2019
Page 24 of 27 Products & Services
SICK OL1 DELIVERS PRECISE DETECTION IN THE MICROMETER RANGE The SICK OL1 Optical Micrometer is a highly-accurate, miniature and rugged addition to SICK’s portfolio of displacement technologies for thread, material thickness and edge measurements in continuous, sheet feeding and winding machines. The SICK OL1 Optical Micrometer is a rugged instrument for integration into small spaces. With a miniature sender and receiver placed up to 300mm apart, it uses light curtain measurement technology, based on a multipixel, linear CMOS sensor, for high-precision, high-repeatability measurement and process control in the micrometer range. The OL1 is teamed with the SICK AOD1 Mini displacement evaluation unit for improved stability and consistency of output. With a 10mm light band and detection resolution down to 0.2mm, the OL1 Optical Micrometer is a versatile and stable performer at short ranges, small tolerances and for handling thin materials, so it can support precision applications in paper, printing and packaging machines. “SICK was able to apply its world-leading expertise in light curtain technology to develop a technology with micrometer accuracy that delivers high accuracy and efficiency in 1D and 2D profiling and displacement measurement within very limited space,” says Neil Sandhu, SICK’s UK Product Manager for Imaging, Measurement and Ranging. “Whether designing new machines, or upgrading existing applications, the OL1 Optical Micrometer provides a highly-reliable and accurate option for web or thread width measurement, double layers, hole diameters or edge positioning and guidance. It is therefore particularly useful in industries such as paper making, printing and packaging industries. Whether it’s tiny objects, tubes, threads, wires, transparent or reflective web materials, the OL1 delivers the reliability and fine tolerances required for high tech performance.” The SICK OL1 Optical Micrometer is a sender and receiver in twin miniature (61 x 21 x 10mm) rugged metal housings. The SICK OL1 sender emits a Class 1 laser 10mm-wide parallel light curtain, which is captured by the receiver on a high-resolution CMOS chip, with any object in between registering as a precisely-measured shadow. The SICK OL1 is an analogue measurement device and is combined with SICK’s AOD1 evaluation unit for integration with the machine controller. Alignment is simple with the integrated LED alignment aid at the sensor head. Commissioning and integration with machine controls is quick and easy, via the display configuration with individualised configuration and calculation through the AOD1 evaluation unit. The AOD1 displacement evaluation unit functionality enables simple interfacing with machine and SCADA factory control systems. For more information on the SICK OL1 Optical Micrometer, please contact Andrea Hornby on 01727 831121 or email [email protected]. SICK (UK) LTD, Waldkirch House, 39 Hedley Road, St Albans, Hertfordshire, AL1 5BN.

PAPERmaking!
FROM THE PUBLISHERS OF PAPER TECHNOLOGY
Volume 5, Number 1, 2019
Page 25 of 27 Products & Services
MISCELLANEOUS
PAPERmaking!
FROM THE PUBLISHERS OF PAPER TECHNOLOGY
Volume 5, Number 1, 2019
Page 26 of 27 Products & Services
HI-LINE HLI62 VERTICAL AIR RECEIVERS As a company that listens carefully to changes in market demands and industry trends, Hi-line Industries now holds a range of class-leading Vertical Air Receivers in stock. The top-quality vessels are available immediately at highly competitive prices. Currently, four sizes of Vertical Air Receivers are being stocked at Hi-line: 300, 500, 1000 and 2000 litre variants. The vessels are manufactured at Hi-line’s new factory, centrally located in Burton-upon-Trent where the company has a storage facility populated with the vessels ready for immediate shipping or collection. Receivers provide valuable temporary storage for compressed air, particularly at facilities with high air consumption. The vessels also serve to stabilise pressure peaks and provide steady air flow. Not having one as part of a compressed air system can increase the load/unload cycles on the compressor, making it work harder. All of the Vertical Air Receivers stocked by Hi-line are powder-coat finished in compressed air blue (RAL 5015) and are PED compliant to 2014/68/EU. Indeed, quality is the primary attribute of the vessels, which are built by robots to ensure perfect and consistent welding quality. In addition, high-quality 5mm plate and fittings are used throughout. As a result of this build quality, the Vertical Air Receivers are twice the weight (pro rata) of standard catalogue vessels. All four models of Vertical Air Receiver being stocked by Hi-line Industries offer 11 bar working pressure and come with a 10-year warranty. The vessels can be supplied with or without fitting kits to suit individual preferences. Safety valves, gauges and drains are also available as options. As a member of the British Compressed Air Society, Hi-line is proud to be part of the ‘Made in Britain’ campaign that promotes the best of British manufacturing. Further information is available from: Hi-line Industries Ltd, Green Street, Burton on Trent, Staffordshire DE14 3RT Telephone: 01283 533377 www.hilineindustries.com

PAPERmaking!
FROM THE PUBLISHERS OF PAPER TECHNOLOGY
Volume 5, Number 1, 2019
Page 27 of 27 Products & Services
SELECTRONIC’S SUNLIGHT SPECTRUM LEDS CLOSE TO SUNLIGHT IMAGINE artificial lighting in a business or home setting with LEDs producing close to actual sunlight all day long. Well now you can get just that with the Sunlight Spectrum 2835 SMD packages from UK LED specialists Selectronic and their Chinese partners HongliTronic. The Witney, Oxfordshire, based Selectronic, celebrating their 40th anniversary this year, are experts in opto-electronic technologies. “We are pleased to introduce Hongli’s Sunlight Spectrum 2835, which is the perfect solution to those wanting very close to natural light from an artificial source,” said Selectronic MD Kevin Dry. "The option to create lighting products that replicate daylight opens a new era of what can be achieved in previously closed-off rooms or underground environments, not to forget the health benefits in dark winter periods from creating artificial daylight particularly when linked with a time clock to accurately reflect the various times of a bright sunny day." “The Sunlight Spectrum 2835, which produces perfect colour, measuring more than 95 in the range R1 to R15 and continuous saturation, is very close to the actual sunlight spectrum. There is much less blue light and it is a first choice for protecting our eyes.” The technology produces a spectrum of light that best matches sunlight’s natural spectrum, giving the ideal solution whether it is for various industrial/retail applications as well as in business, office or home lighting products.
PAPERmaking!
FROM THE PUBLISHERS OF PAPER TECHNOLOGY
Volume 5, Number 1, 2019
Page 1 of 6 Installations
Installations The following pages contain a summary of the various installations and orders from around the world of papermaking, wood panel and saw mills, and bio-power generation, received between November 2018 and the end of April 2019. Also included are new announcements about plans to build new mills or install new machinery (in which case the supplier will be noted as ‘TBA’).
The Paper Industry Technical Association (PITA) is an independent organisation which operates for the general benefit of its members – both individual and corporate – dedicated to promoting and improving the technical and scientific knowledge of those working in the UK pulp and paper industry. Formed in 1960, it serves the Industry, both manufacturers and suppliers, by providing a forum for members to meet and network; it organises visits, conferences and training seminars that cover all aspects of papermaking science. It also publishes the prestigious journal Paper Technology International and the PITA Annual Review, both sent free to members, and a range of other technical publications which include conference proceedings and the acclaimed Essential
Guide to Aqueous Coating.
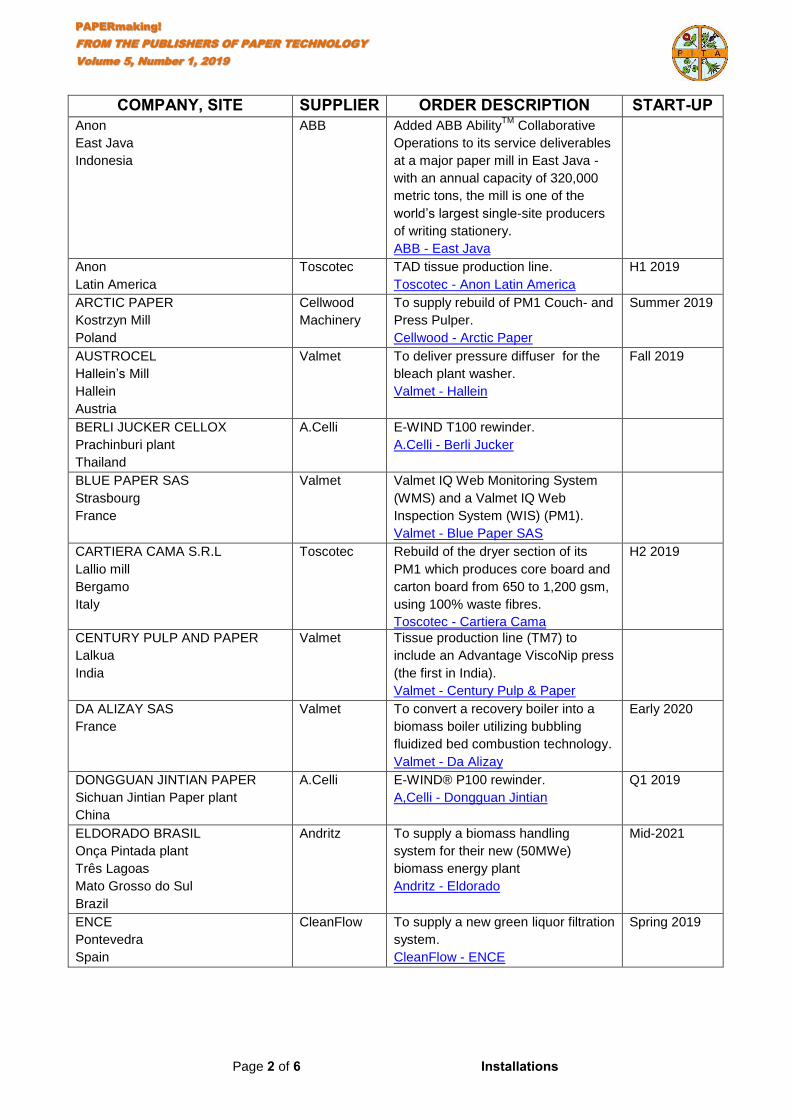
PAPERmaking!
FROM THE PUBLISHERS OF PAPER TECHNOLOGY
Volume 5, Number 1, 2019
Page 2 of 6 Installations
COMPANY, SITE SUPPLIER ORDER DESCRIPTION START-UP Anon
East Java
Indonesia
ABB Added ABB AbilityTM
Collaborative
Operations to its service deliverables
at a major paper mill in East Java -
with an annual capacity of 320,000
metric tons, the mill is one of the
world’s largest single-site producers
of writing stationery.
ABB - East Java
Anon
Latin America
Toscotec TAD tissue production line.
Toscotec - Anon Latin America
H1 2019
ARCTIC PAPER
Kostrzyn Mill
Poland
Cellwood
Machinery
To supply rebuild of PM1 Couch- and
Press Pulper.
Cellwood - Arctic Paper
Summer 2019
AUSTROCEL
Hallein’s Mill
Hallein
Austria
Valmet
To deliver pressure diffuser for the
bleach plant washer.
Valmet - Hallein
Fall 2019
BERLI JUCKER CELLOX
Prachinburi plant
Thailand
A.Celli
E-WIND T100 rewinder.
A.Celli - Berli Jucker
BLUE PAPER SAS
Strasbourg
France
Valmet
Valmet IQ Web Monitoring System
(WMS) and a Valmet IQ Web
Inspection System (WIS) (PM1).
Valmet - Blue Paper SAS
CARTIERA CAMA S.R.L
Lallio mill
Bergamo
Italy
Toscotec Rebuild of the dryer section of its
PM1 which produces core board and
carton board from 650 to 1,200 gsm,
using 100% waste fibres.
Toscotec - Cartiera Cama
H2 2019
CENTURY PULP AND PAPER
Lalkua
India
Valmet
Tissue production line (TM7) to
include an Advantage ViscoNip press
(the first in India).
Valmet - Century Pulp & Paper
DA ALIZAY SAS
France
Valmet To convert a recovery boiler into a
biomass boiler utilizing bubbling
fluidized bed combustion technology.
Valmet - Da Alizay
Early 2020
DONGGUAN JINTIAN PAPER
Sichuan Jintian Paper plant
China
A.Celli
E-WIND® P100 rewinder.
A,Celli - Dongguan Jintian
Q1 2019
ELDORADO BRASIL
Onça Pintada plant
Três Lagoas
Mato Grosso do Sul
Brazil
Andritz
To supply a biomass handling
system for their new (50MWe)
biomass energy plant
Andritz - Eldorado
Mid-2021
ENCE
Pontevedra
Spain
CleanFlow
To supply a new green liquor filtration
system.
CleanFlow - ENCE
Spring 2019

PAPERmaking!
FROM THE PUBLISHERS OF PAPER TECHNOLOGY
Volume 5, Number 1, 2019
Page 3 of 6 Installations
COMPANY, SITE SUPPLIER ORDER DESCRIPTION START-UP GLOBAL HYGIÈNE
Charavines
France
A.Celli
Tissue production line.
A.Celli - Global Hygiene
Q4 2019
GS EPS CO., LTD.
Dangjin 4 Biomass Power Plant
South Korea
Valmet To supply automation technology to
Phase 2 of this project.
Valmet - Dangiin
Q1 2020
GS PAPERBOARD &
PACKAGING SDN., BHD.
Selangor
Malaysia
Valmet
To supply a containerboard line with
automation solutions (PM3).
Valmet - GS Paperboard Packaging
2021
HAMBURGER RIEGER
Spremberg
Germany
Voith
Three separate stock preparation
lines with a total capacity of 2,450
metric tons per day (PM2).
Voith - Hamburger
Q2 2020
IGGESUND PAPERBOARD
Iggesund Mill
Sweden
Andritz
Modernise fibreline including: brown
stock washing; oxygen delignification
stage; relocation of screening; and
bleach plant modernisation.
Andritz - Iggesund
Q4 2019
ILIM GROUP
Koryazhma mill
Arkhangelsk region
Russia
Andritz
To supply wood processing plant with
two debarking and chipping lines,
chip and bark handling equipment,
and a Smart Woodyard advanced
control system.
Andritz - Ilim Group
Mid-2021
ILIM GROUP
Koryazhma mill
Arkhangelsk region
Russia
Econet
Group
Wastewater treatment machinery -
clarifiers and sludge thickeners with
sluice systems.
Econet - Ilim Group
Summer
periods of
2019-2021.
JSC VOLGA
Balakhna
Russia
Andritz
To rebuild the existing groundwood
reject line into a TMP (thermo-
mechanical pulping) line.
Andritz - JSC Volga
Q3 2019
KABEL PREMIUM PULP & PAPER
Hagen
Germany
Andritz
A new ATMP (Advanced Thermo
Mechanical Pulp) line.
Andritz - Kabel
Q1 2019
LAAKIRCHEN PAPIER
Laakirchen
Austria
Voith
Stabiliser boxes / Reel changing
system.
Voith - Laakirchen Papier
LONDONENERGY LTD.
North London
UK
Valmet
Modernise the automation systems
as well as the electrical and
instrumentation infrastructure of a
waste water treatment plant.
Valmet - London Energy
2019
LUZHOU YONGFENG PULP AND
PAPER
China
Valmet
A Valmet IQ Steam Profiler.
Valmet - Luzhou Yongfeng
Q4 2018
MAYR-MELNHOF KARTON
Frohnleiten
Austria
Valmet
A Valmet IQ Web Monitoring System
(WMS) with 51 cameras throughout
the whole production process (KM3).
Valmet - Mayr-Melnhof

PAPERmaking!
FROM THE PUBLISHERS OF PAPER TECHNOLOGY
Volume 5, Number 1, 2019
Page 4 of 6 Installations
COMPANY, SITE SUPPLIER ORDER DESCRIPTION START-UP MERCER GROUP
Stendal Pulp Mill
Germany
Valmet
On-line performance monitoring for
nine Valmet TwinRoll wash presses.
Valmet - Mercer Group
METSÄ GROUP
Joutseno pulp mill
Finland
Valmet
To supply a new wood handling line
(capacity 470 m3/hour).
Valmet - Metsa Group
Spring 2020
METSÄ TISSUE
Mänttä Mill
Finland
Valmet
An automation system update and
expansion for Gasum's project, in
which the mill will replace liquefied
petroleum gas (LPG) with Gasum's
low-emission liquefied natural gas
(LNG) in the burners of the drying
processes on the tissue machines.
Valmet - Metsa Tissue
Q2 2019
MONDI SCP
Ružomberok
Slovakia
Valmet
Old Corrugated Container (OCC) and
OptiConcept M containerboard
making lines with a winder (PM19).
Valmet - Mondi SCP
End 2020
PAPEL ARALAR
Amézqueta
Spain
Valmet
Rewinder (nonwovens) for PM4.
Valmet - Papel Aralar
Q2 2019
PAPELERA DEL PRINCIPADO
Paprinsa
Spain
Valmet
A Valmet IQ Quality Control System,
a related reporting system and a
recently launched Valmet DNA IQ
Dashboard.
Valmet - Papelere del Principado
PAPIERFABRIK PALM
Aalen-Neukochen Mill
Germany
Valmet To supply a containerboard making
line (PM 5) with extensive packages
of mill-wide automation and services.
(At 11.7m it will be the largest
containerboard machine in the
world.)
Valmet - Palm
2021
PORI ENERGIA OY
Aittaluoto biomass power plant
Finland
Valmet
Automation technology.
Valmet - Pro Energia
Summer 2020
MOHAWK
various sites
USA
Greycon
To roll out opt-Studio to the envelope
and substrate converting business.
Greycon - Mohawk
NAINI PAPERS
India
Valmet
To supply cooking, fibreline and
recausticising technology, as well as
a new lime kiln.
Valmet - Naini Papers
Q1 2020
NORSKE SKOG
Skogn Mil
Norway
Statkraft
Long term power supply contract.
Statkraft - Norsk Skog
NORSKE SKOG
Saugbrugs Mill
Norway
Statkraft
Long term power supply contract.
Statkraft - Norsk Skog
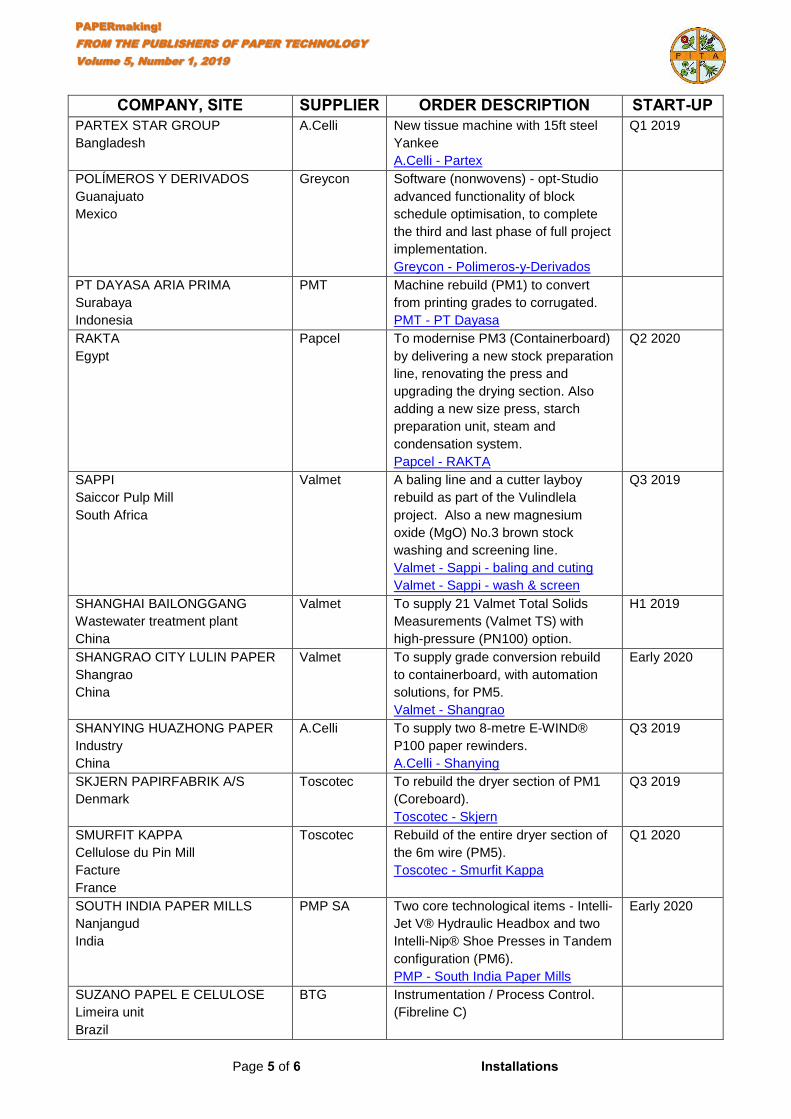
PAPERmaking!
FROM THE PUBLISHERS OF PAPER TECHNOLOGY
Volume 5, Number 1, 2019
Page 5 of 6 Installations
COMPANY, SITE SUPPLIER ORDER DESCRIPTION START-UP PARTEX STAR GROUP
Bangladesh
A.Celli
New tissue machine with 15ft steel
Yankee
A.Celli - Partex
Q1 2019
POLÍMEROS Y DERIVADOS
Guanajuato
Mexico
Greycon
Software (nonwovens) - opt-Studio
advanced functionality of block
schedule optimisation, to complete
the third and last phase of full project
implementation.
Greycon - Polimeros-y-Derivados
PT DAYASA ARIA PRIMA
Surabaya
Indonesia
PMT
Machine rebuild (PM1) to convert
from printing grades to corrugated.
PMT - PT Dayasa
RAKTA
Egypt
Papcel To modernise PM3 (Containerboard)
by delivering a new stock preparation
line, renovating the press and
upgrading the drying section. Also
adding a new size press, starch
preparation unit, steam and
condensation system.
Papcel - RAKTA
Q2 2020
SAPPI
Saiccor Pulp Mill
South Africa
Valmet
A baling line and a cutter layboy
rebuild as part of the Vulindlela
project. Also a new magnesium
oxide (MgO) No.3 brown stock
washing and screening line.
Valmet - Sappi - baling and cuting
Valmet - Sappi - wash & screen
Q3 2019
SHANGHAI BAILONGGANG
Wastewater treatment plant
China
Valmet To supply 21 Valmet Total Solids
Measurements (Valmet TS) with
high-pressure (PN100) option.
H1 2019
SHANGRAO CITY LULIN PAPER
Shangrao
China
Valmet To supply grade conversion rebuild
to containerboard, with automation
solutions, for PM5.
Valmet - Shangrao
Early 2020
SHANYING HUAZHONG PAPER
Industry
China
A.Celli
To supply two 8-metre E-WIND®
P100 paper rewinders.
A.Celli - Shanying
Q3 2019
SKJERN PAPIRFABRIK A/S
Denmark
Toscotec To rebuild the dryer section of PM1
(Coreboard).
Toscotec - Skjern
Q3 2019
SMURFIT KAPPA
Cellulose du Pin Mill
Facture
France
Toscotec
Rebuild of the entire dryer section of
the 6m wire (PM5).
Toscotec - Smurfit Kappa
Q1 2020
SOUTH INDIA PAPER MILLS
Nanjangud
India
PMP SA
Two core technological items - Intelli-
Jet V® Hydraulic Headbox and two
Intelli-Nip® Shoe Presses in Tandem
configuration (PM6).
PMP - South India Paper Mills
Early 2020
SUZANO PAPEL E CELULOSE
Limeira unit
Brazil
BTG Instrumentation / Process Control.
(Fibreline C)

PAPERmaking!
FROM THE PUBLISHERS OF PAPER TECHNOLOGY
Volume 5, Number 1, 2019
Page 6 of 6 Installations
COMPANY, SITE SUPPLIER ORDER DESCRIPTION START-UP SVEZA GROUP
Vologda region
Russia
Pesmel
MoU regarding an automated pulp
storage of the planned greenfield
pulp mill project.
Pesmel - Sveza Group
TEXHONG TEXTILE GROUP
Vietnam
A.Celli Automated warehouses.
A.Celli - Texhong Textile
TURUN SEUDUN
ENERGIANTUOTANTO
Naantali
Finland
Valmet
Flue gas condensing and asphaltene
combustion systems.
Valmet - Turun Seudun
End 2019
URUMCHI JINGHUAN
ENVIRONMENTAL & ENERGY
Urumchi
China
Valmet
Two boiler plants fired with refuse-
derived fuel (RDF) for a greenfield
waste-to-energy plant.
Valmet - Urumchi
End 2019
VATTENFALL AB
Uppsala
Sweden
Andritz
Biomass receiving, handling and
storage silos, a biomass-fired boiler
with flue gas cleaning, and a flue gas
condenser.
Andritz - Vattenfall
End 2021
VOITH (on behalf of)
Gondi Group
Monterrey
Mexico
Pöyry To provide detailed engineering
services agreement for a new
containerboard machine.
Poyry - Gondi Group
Mid-2019
ZHEJIANG KINGSAFE
NONWOVENS FABRIC
Huzhou
China
A.Celli
Nonwovens complete line comprising
a STREAM® winder, a RAPID®
rewinder, a Slittomatic, an extractor,
and an automated roll handling and
packaging system.
A.Celli - Zhejiang
H1 2019
PAPERmaking!
FROM THE PUBLISHERS OF PAPER TECHNOLOGY
Volume 5, Number 1, 2019
Page 1 of 5 Research Articles
Research Articles Most journals and magazines devoted to the paper industry contain a mixture of news, features and some technical articles. However, very few contain research items, and even fewer of these are peer-reviewed. This listing contains the most recent articles from the five main journals that publish original research:
APPITA JOURNAL
IPPTA JOURNAL
J-FOR
NORDIC PULP & PAPER RESEARCH JOURNAL
TAPPI JOURNAL
The Paper Industry Technical Association (PITA) is an independent organisation which operates for the general benefit of its members – both individual and corporate – dedicated to promoting and improving the technical and scientific knowledge of those working in the UK pulp and paper industry. Formed in 1960, it serves the Industry, both manufacturers and suppliers, by providing a forum for members to meet and network; it organises visits, conferences and training seminars that cover all aspects of papermaking science. It also publishes the prestigious journal Paper Technology International and the PITA Annual Review, both sent free to members, and a range of other technical publications which include conference proceedings and the acclaimed Essential
Guide to Aqueous Coating.
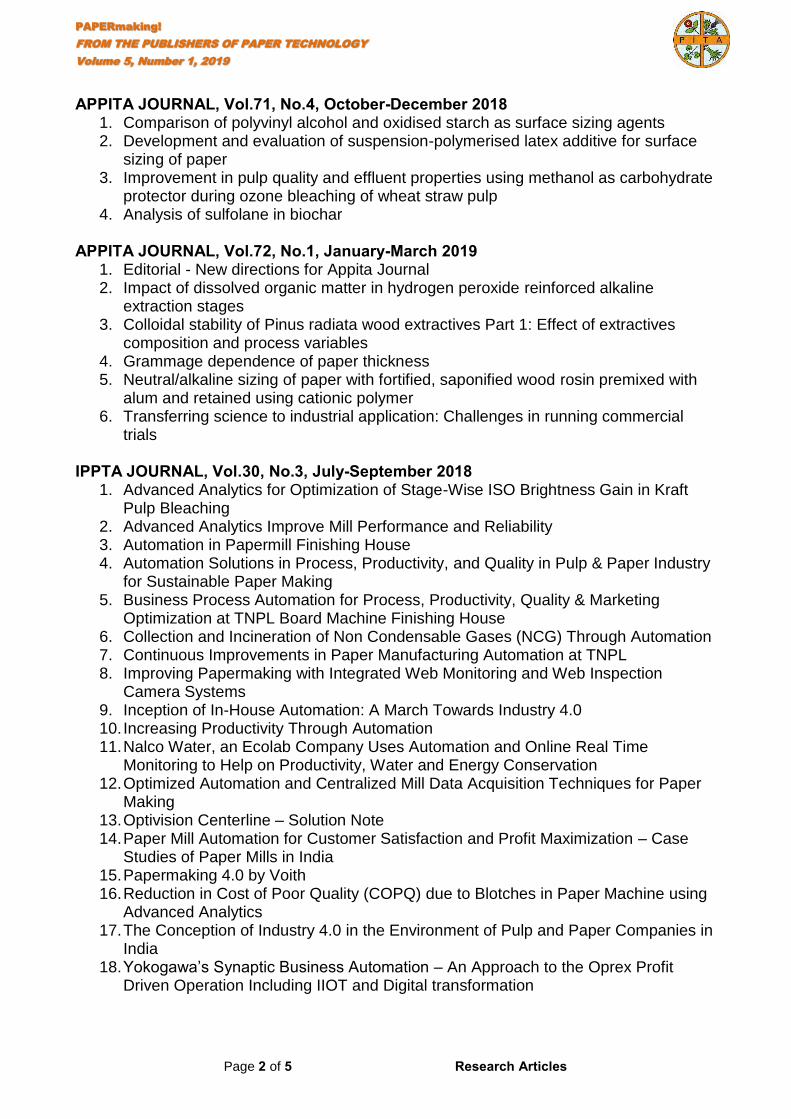
PAPERmaking!
FROM THE PUBLISHERS OF PAPER TECHNOLOGY
Volume 5, Number 1, 2019
Page 2 of 5 Research Articles
APPITA JOURNAL, Vol.71, No.4, October-December 2018 1. Comparison of polyvinyl alcohol and oxidised starch as surface sizing agents 2. Development and evaluation of suspension-polymerised latex additive for surface
sizing of paper 3. Improvement in pulp quality and effluent properties using methanol as carbohydrate
protector during ozone bleaching of wheat straw pulp 4. Analysis of sulfolane in biochar
APPITA JOURNAL, Vol.72, No.1, January-March 2019
1. Editorial - New directions for Appita Journal 2. Impact of dissolved organic matter in hydrogen peroxide reinforced alkaline
extraction stages 3. Colloidal stability of Pinus radiata wood extractives Part 1: Effect of extractives
composition and process variables 4. Grammage dependence of paper thickness 5. Neutral/alkaline sizing of paper with fortified, saponified wood rosin premixed with
alum and retained using cationic polymer 6. Transferring science to industrial application: Challenges in running commercial
trials IPPTA JOURNAL, Vol.30, No.3, July-September 2018
1. Advanced Analytics for Optimization of Stage-Wise ISO Brightness Gain in Kraft Pulp Bleaching
2. Advanced Analytics Improve Mill Performance and Reliability 3. Automation in Papermill Finishing House 4. Automation Solutions in Process, Productivity, and Quality in Pulp & Paper Industry
for Sustainable Paper Making 5. Business Process Automation for Process, Productivity, Quality & Marketing
Optimization at TNPL Board Machine Finishing House 6. Collection and Incineration of Non Condensable Gases (NCG) Through Automation 7. Continuous Improvements in Paper Manufacturing Automation at TNPL 8. Improving Papermaking with Integrated Web Monitoring and Web Inspection
Camera Systems 9. Inception of In-House Automation: A March Towards Industry 4.0 10. Increasing Productivity Through Automation 11. Nalco Water, an Ecolab Company Uses Automation and Online Real Time
Monitoring to Help on Productivity, Water and Energy Conservation 12. Optimized Automation and Centralized Mill Data Acquisition Techniques for Paper
Making 13. Optivision Centerline – Solution Note 14. Paper Mill Automation for Customer Satisfaction and Profit Maximization – Case
Studies of Paper Mills in India 15. Papermaking 4.0 by Voith 16. Reduction in Cost of Poor Quality (COPQ) due to Blotches in Paper Machine using
Advanced Analytics 17. The Conception of Industry 4.0 in the Environment of Pulp and Paper Companies in
India 18. Yokogawa’s Synaptic Business Automation – An Approach to the Oprex Profit
Driven Operation Including IIOT and Digital transformation
PAPERmaking!
FROM THE PUBLISHERS OF PAPER TECHNOLOGY
Volume 5, Number 1, 2019
Page 3 of 5 Research Articles
J-FOR, Vol.7, No.4, 2018 1. Non-covalent Surface Modification of Cellulose Nanocrystals by Polyethyleneimine 2. Apparent Structural Hydrophobicity of Cellulose Nanocrystals 3. Partnering for Lignin Biorefinery: Partner Evaluation and Selection Criteria 4. Production of Hydrocarbons from Fast Pyrolysis of Kraft Black Liquor: Integration
with a Kraft Mill 5. Biomimetic Adhesion of Phages on Cellulosic Fibres: A Feasibility Study 6. Exploring New Forms of Intermediation in the Forest Value Chain
NORDIC PULP & PAPER RESEARCH JOURNAL, Vol.33 No.4, December 2018
1. Paper technology: Through air drying assisted by infrared radiation: the influence of radiator power on drying rates and temperature
2. Paper technology: New strength metrics for containerboards: influences of basic papermaking factors
3. Paper technology: Selection of filler particle size for maximizing the critical properties of cellulosic paper by filler pre-flocculation
4. Nanotechnology: Detection of iron and iron-cobalt labeled cellulose nanofibrils using ICP-OES and XµCT
5. Paper physics: Variations of fiber structure and performance of ONP delinked pulp after modified-laccase/glutamate treatment
6. Paper chemistry: On-line monitoring of cationic starch gelatinization and retrogradation by 1H NMR-relaxometry
7. Paper chemistry: Wet-peel: a tool for comparing wet-strength resins 8. Paper chemistry: Improved dispersibility of once-dried cellulose nanofibers in the
presence of glycerol 9. Recycling: Recycled fiber treated with NaOH/urea aqueous solution: effects on
physical properties of paper sheets and on hornification NORDIC PULP & PAPER RESEARCH JOURNAL, Vol.34 No.1, March 2019
1. Lignin: Method for predicting lignocellulose components in jute by transformed FT-NIR spectroscopic data and chemometrics
2. Biorefinery: Short-term steam treatment of MFC gel with and without water-soluble cellulose derivative
3. Chemical pulping: Method for analysis of ClO2 and Cl2 air emissions from pulp mill 4. Chemical pulping: Consequences in a softwood kraft pulp mill of initial high alkali
concentration in the impregnation stage 5. Mechanical pulping: Power–gap relationships in low consistency refining 6. Mechanical pulping: Theoretical analysis of LC-refining – pressure screening
systems in TMP 7. Paper technology: Calcination-carbonization two-step process to improve the
brightness of fly ash and its application in paper filling 8. Paper technology: Energy efficiency in low consistency refining: a study using a
Valley beater 9. Paper physics: Principles of developing physical test methods for disposable
consumer products 10. Paper chemistry: Switching off PAE wet strength 11. Coating: Improving fire retardancy of cellulosic thermal insulating materials by
coating with bio-based fire retardants 12. Printing: Time-dependent mechanical response of paper during web-fed high-speed
inkjet printing
PAPERmaking!
FROM THE PUBLISHERS OF PAPER TECHNOLOGY
Volume 5, Number 1, 2019
Page 4 of 5 Research Articles
13. Packaging: Model to predict the top-to-bottom compressive strength of folding cartons
14. Environmental impact: A solution for a treatment of bottom sludge from a log-soaking pond for separation of sand
15. Environmental impact: Effects of temperature on white water treatment by the dominant bacteria
16. Environmental impact: Performance of microaerobic granular sludge system for pentachlorophenol (PCP) degradation responding to PCP loading shock
17. Miscellaneous: Potential of kraft lignin as an additive in briquette production 18. Miscellaneous: Effect of wood flour and naphthenic oil on morphology, rheological
and mechanical properties of EPDM/PP/AL composite TAPPI JOURNAL, November 2018
1. Editorial: 2018 TAPPI Journal features diverse content 2. Understanding the risks and rewards of using 50% vs. 10% strength peroxide in
pulp bleach plants, 3. Does the kappa number method accurately reflect lignin content in nonwood pulps? 4. Using multistage models to evaluate how pulp washing after the first extraction
stage impacts elemental chlorine-free bleach demand 5. Understanding the pulping and bleaching performances of eucalyptus woods
affected by physiological disturbance TAPPI JOURNAL, January 2019
1. Editorial: Lignin: Nature’s versatile polymer as a potent chemical platform for 21st century challenges
2. Adsorption performance of magnetic aminated lignin for the removal of Cu(II) and Cd(II)
3. Magnetization of aminated lignin and characterization 4. Structural analysis of poplar and Masson pine lignocresols and comparison of their
bovine serum albumin adsorption characteristics 5. Synthesis and characterization of novel foams by pyrolysis of lignin 6. Characterization and evaluation of antioxidation of lignin from bamboo powder
using a formic acid-catalyzed ethanol organosolv process 7. Nano-magnesium oxide as hard template synthesis of lignin carbon-based solid
acids and its application for cellulose hyrdrolysis 8. Graft copolymerization of acrylic acid of kraft lignin to enhance aniline adsoprtion
from aqueous solution TAPPI JOURNAL, February 2019
1. Editorial: Historical and evolving challenges in the coated paper industry 2. Discrete element method to model cracking for two layer systems 3. Optimazation of coating with water-based barriers 4. Operational limits of blade coating associated with high aspect ratio pigments: Part I
– bench top blade coater 5. Operational limits of blade coating assocciated with high aspect ratio pigments:
PartII – cylindrical laboratory coater 6. Improving the inkjet codability of folding boxboard 7. Cracking at the fold in double layer coated paper: the influence of latex and starch
composition

PAPERmaking!
FROM THE PUBLISHERS OF PAPER TECHNOLOGY
Volume 5, Number 1, 2019
Page 5 of 5 Research Articles
TAPPI JOURNAL, March 2019 1. Editorial: TAPPI Journal 2018 Best Research Paper delves deeper into press
section rewet to address drying efficiency 2. Evaluating hardness and the S-test 3. Controllable anisotropic properties of wet-laid hydroentangled nonwovens 4. Size distribution analysis of microstickies treated by enzyme mixtures in
papermaking whitewater 5. A study of the softness of household tissues using a tissue softness analyzer and
hand-felt panels
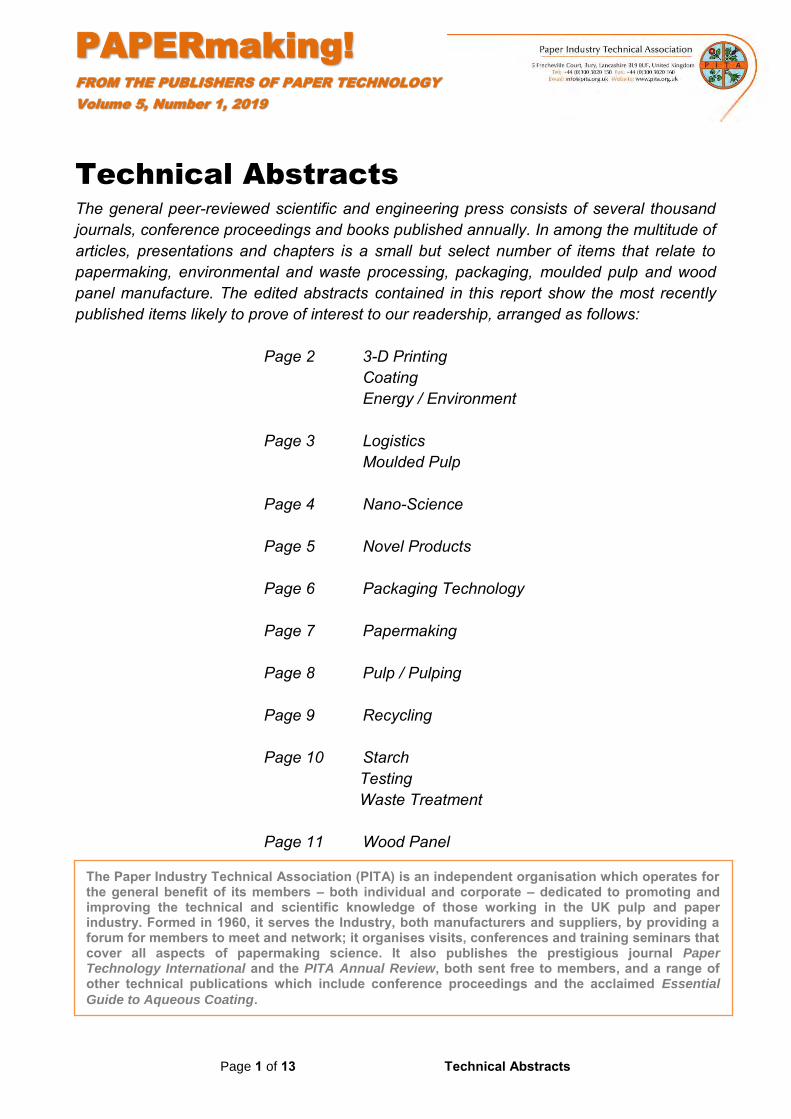
PAPERmaking!
FROM THE PUBLISHERS OF PAPER TECHNOLOGY
Volume 5, Number 1, 2019
Page 1 of 13 Technical Abstracts
Technical Abstracts The general peer-reviewed scientific and engineering press consists of several thousand journals, conference proceedings and books published annually. In among the multitude of articles, presentations and chapters is a small but select number of items that relate to papermaking, environmental and waste processing, packaging, moulded pulp and wood panel manufacture. The edited abstracts contained in this report show the most recently published items likely to prove of interest to our readership, arranged as follows:
Page 2 3-D Printing Coating Energy / Environment Page 3 Logistics
Moulded Pulp
Page 4 Nano-Science
Page 5 Novel Products Page 6 Packaging Technology Page 7 Papermaking Page 8 Pulp / Pulping
Page 9 Recycling Page 10 Starch
Testing Waste Treatment
Page 11 Wood Panel
The Paper Industry Technical Association (PITA) is an independent organisation which operates for
the general benefit of its members – both individual and corporate – dedicated to promoting and improving the technical and scientific knowledge of those working in the UK pulp and paper industry. Formed in 1960, it serves the Industry, both manufacturers and suppliers, by providing a forum for members to meet and network; it organises visits, conferences and training seminars that cover all aspects of papermaking science. It also publishes the prestigious journal Paper Technology International and the PITA Annual Review, both sent free to members, and a range of other technical publications which include conference proceedings and the acclaimed Essential
Guide to Aqueous Coating.
PAPERmaking!
FROM THE PUBLISHERS OF PAPER TECHNOLOGY
Volume 5, Number 1, 2019
Page 2 of 13 Technical Abstracts
3-D PRINTING Composites of waterborne polyurethane and cellulose nanofibers for 3D printing and bioapplications, Ren-De Chen et al, Carbohydrate Polymers, Vol.212. Waterborne polyurethane (PU) is a green, high performance elastomer but the viscosity of the dispersion is generally too low for direct three-dimensional (3D) printing. Composite brings additional properties while reinforcing the substrate. In the study, printable PU composites were successfully prepared by introducing cellulose nanofibrils (CNFs) and the viscosity was effectively regulated by the amount of neutralising agent during in-situ synthesis. COATING Study of chitosan with different degrees of acetylation as cardboard paper coating, Mariane Gatto et al, Carbohydrate Polymers, Vol.210. The biodegradability of chitosan is significant for packaging systems. Another relevant property of chitosan is its degree of acetylation (DA), which affects other properties, such as crystallinity and hydrophobicity. The DA can be modulated by chitin deacetylation or even chitosan reacetylation. The novelty of this paper is the application of reacetylated chitosan as a coating for cardboard paper surfaces to improve the barrier and mechanical properties of the paper. Chitosan with 2% DA was reacetylated to yield chitosan with 48% DA. Both samples were applied as cardboard paper coating, and the coated materials were characterised. The paper-film system of chitosan with 2% DA had better water barrier and mechanical resistance. ENERGY / ENVIRONMENT Life cycle energy consumption analysis and green manufacture evolution for the papermaking industry in China, Yi Man et al, Green Chemistry, Issue 5. Papermaking is a highly energy-consuming industry. The growth in paper demand will further intensify the need for energy and the stress of GHG emissions. Papermaking involves complex processing routes, and energy is required for collecting raw materials, producing chemicals, and pulp and papermaking. Previous investigations of energy consumption in the papermaking industry have focused primarily on the analysis of one single product or one single pathway, lacking a comprehensive and systematic comparison of various products and pathways. Herein, the results of a life cycle energy consumption analysis of major paper products in China using an extensive system boundary are presented. When 1 tonne of paper was produced in China in 2015, the maximum energy consumption was 38.17 GJ for tissue paper, with a minimum energy consumption of 15.90 GJ for corrugated medium. This study also predicts energy-related GHG emissions and a mitigation target in the papermaking industry in China by 2050. Short term electric load forecasting model and its verification for process industrial enterprises based on hybrid GA-PSO-BPNN algorithm—A case study of papermaking process, Y Hu et al, Energy, Vol.170. Process industry consumes tremendous amounts of electricity for production. Electric load forecasting could be conducive to managing the electricity consumption, determining the optimal production scheduling, and planning the maintenance schedule, which could improve the energy efficiency and reduce the production cost. This paper proposed a short term electric load forecasting model based on the hybrid GA-PSO-BPNN algorithm. Besides the proposed GA-PSO-BPNN model, the GA-BPNN and PSO-BPNN based electric load forecasting models are also studied as the contrasting cases. The verification results reveal that the GA-PSO-BPNN model is superior to the other two hybrid forecasting models for future application in the papermaking process since its MAPE is only 0.77%.
PAPERmaking!
FROM THE PUBLISHERS OF PAPER TECHNOLOGY
Volume 5, Number 1, 2019
Page 3 of 13 Technical Abstracts
Resource value flow analysis of paper-making enterprises: A Chinese case study, Z Li et al, Journal of Cleaner Production, Vol.213. Papermaking enterprises are currently under both environmental pressure and economic pressure for sustainable development in China. Thus, the efficiency, effectiveness, and benefits of resource utilisation need to be improved. High-consumption and high-pollution companies should manufacture paper using sustainable methods. This study highlights a resource value flow analysis from the circular economy perspective, developing an extension of material flow cost accounting and modifying it by accounting for environmental damage as well as economic benefits. In general, applying a resource value flow analysis can both reduce resource consumption and minimise environmental damage, enhancing the sustainable development of a process industry with limited resources. LOGISTICS A Description of Supply Chain Planning Problems in the Paper Industry with Literature Review, Florian Jaehn & Raisa Juopperi, Asia-Pacific Journal of Operational Research, Vol.36 (1). The paper industry supply chain is highly complex and consists of many processes and planning tasks. It starts with the collection of raw wood and ends up in different paper products from paperboard to high class art papers. Managing the supply chain is difficult and the permanently changing business environment constantly brings new challenges. This paper starts with outlining the challenges in the supply chain management of today’s paper industry. After that we evaluate the state of research to determine planning problems covered by the literature. The purpose is to catch up time-wise on the previous overview from 2009 and also to update the planning problems. This overview paper summarises comprehensively the paper industry as of today. It provides a reference work for researchers and other interested parties, and uncovers areas for future research. Warehouse Design and Operation using Augmented Reality technology: A Papermaking Industry Case Study, D Mourtzis et al, Procedia CIRP, Vol.79. In modern, high competitive markets, efficient warehousing is critical as it accounts for a great part of logistics costs. Companies try to adopt highly adaptive and flexible warehouse design that may support the integration of novel technologies such as Augmented Reality (AR). This paper proposes a framework for warehouse design which minimises inventory cost while keeping a high degree of service by supporting the integration of an AR warehousing system. The AR system will support the effective management of operations, by providing meaningful information. The proposed methodology is tested and validated in a real-life case study of a papermaking industry. MOULDED PULP Research on the Preparation and Properties of Water Resistant and Oil Resistant Paper Tableware Made by Bagasse Brown Pulp, Li Liu et al, Applied Sciences in Graphic Communication and Packaging, pp.609-615. Part of the Lecture Notes in Electrical Engineering book series (LNEE, Vol.477). Water-resistant and oil-resistant paper tableware has broad application prospects. The mechanism of water resistance and oil resistance properties of paper and the determination of oil resistance properties were introduced. The water/oil resisted paper was made of bagasse brown pulp by beating and adding oil-resistant agent, water-resistant agent and retention aid. The effects of water repellent, oil repellent and other factors on the oil and water repellency of paper tableware were studied.
PAPERmaking!
FROM THE PUBLISHERS OF PAPER TECHNOLOGY
Volume 5, Number 1, 2019
Page 4 of 13 Technical Abstracts
Molded Pulp Products Manufacturing: Process Development, Characterization and Modeling, Mattia Didone, PhD Thesis, Manufacturing Engineering, Department of Mechanical Engineering, Technical University of Denmark, Produktionstorvet, 2800, Kgs. Lyngby, Denmark. The matter of this thesis is the development, characterisation and ultimately modelling of the manufacturing process of moulded pulp products. In particular, focus was placed on studying and optimising the drying step, as the cost of energy required may be from eight to twenty times that needed for pre-forming. NANO-SCIENCE A bio-mechanical process for cellulose nanofiber production – Towards a greener and energy conservation solution, Xiuyu Liu et al, Carbohydrate Polymers, Vol.208. Enzyme pretreatment prior to mechanical grinding in cellulose nanofiberes production was fully explored in order to save mechanical energy and to find an alternative to chemical treatment, thus reducing the environmental impact of the process. Grinding energy was determined in terms of total energy, effective energy, and was related to nanofibre yield. Fibre morphology, crystalline and chemical structures were analysed to reveal the mechanisms behind enzyme actions. The results showed that with enzyme pretreatment, the effective energy was reduced by 60%, and yield of nanofibres was increased by 76%. Comparative study of aramid nanofiber (ANF) and cellulose nanofiber (CNF), Bin Yang et al, Carbohydrate Polymers, Vol.208. Cellulose nanofibre (CNF) has faced challenges toward advanced applications due to the poor water resistance, wet strength, and poor thermal stability. The fabrication methods, morphologies and dispersibility between CNF and aramid nanofibre (ANF) were compared. Then the mechanical strength, especially the retention of wet strength (RWS), optical property, UV shielding, wettability and thermal stability of CNF and ANF nanopapers were further investigated. The results show that ANF and ANF nanopaper have significant advantages in dispersibility, water resistance, wet strength, thermal stability and UV-blocking ability over the CNF and CNF nanopaper. This work demonstrates that the ANF could be an ideal alternative to CNF for advanced nanocomposites. A novel method for preparing microcrystalline cellulose from bleached chemical pulp using transition metal ions enhanced high temperature liquid water process, Xiaopeng Yue et al, Carbohydrate Polymers, Vol.208. A novel method for preparing microcrystalline cellulose (MCC) from bleached chemical pulp based on the transition metal ion-enhanced high temperature liquid water (HTLW) process was established in this study. Transition metal ions (Fe3+, Cu2+ or Cr3+) were used to enhance the depolymerization effect of HTLW treatment on fibres. The transition metal ion-enhanced HTLW treatment provides an acid free method for preparing MCC. Preparation and characterization of cellulose nanofibrils from coconut coir fibers and their reinforcements in biodegradable composite films, Jun Wu et al, Carbohydrate Polymers, Vol.211. Coconut waste husks were effectively utilised in this study as a promising cellulose source for production of purified coir cellulose (PCC) after multiple treatments, e.g., ultrasonic-assisted solvent immersion, alkaline treatment, bleaching, etc. The cellulose nanofibrils were comprehensively characterised in terms of their functional groups, crystallinity, morphology, and thermal stability. The potential reinforcement of CCNFs as a filler for biodegradable PVA based films was investigated.
PAPERmaking!
FROM THE PUBLISHERS OF PAPER TECHNOLOGY
Volume 5, Number 1, 2019
Page 5 of 13 Technical Abstracts
Mango Kernel Starch Films as Affected by Starch Nanocrystals and Cellulose Nanocrystals, Ana Priscila M. Silva et al, Carbohydrate Polymers, Vol.211. Mango seeds have been used to obtain components for nanocomposite films, namely, starch and starch nanocrystals (SNC) from seed kernels, and cellulose nanocrystals (CNC) from seed shells. Starch-based films were prepared with different contents and combinations of SNC and CNC. The optimised conditions (1.5 wt% CNC and 8.5 wt% SNC on a starch basis) resulted in a film with enhanced strength, modulus, and barrier to water vapour when compared to the unfilled film, although the elongation has been impaired. Preparation of cellulose nanomaterials via cellulose oxalates, Jonatan Henschen et al, Carbohydrate Polymers, Vol.213. The current work describes the use of a bulk reaction between pulp and oxalic acid dihydrate to prepare cellulose oxalate followed by homogenisation to produce nanocellulose. The presented results illustrate that cellulose oxalates may be a low-cost method to prepare nanocellulose with properties reminiscent of those of both cellulose nanofibrils and cellulose nanocrystals, which may open up new application areas for cellulose nanomaterials. Nanocellulose production from recycled paper mill sludge using ozonation pretreatment followed by recyclable maleic acid hydrolysis, Roi Peretz et al, Carbohydrate Polymers, online. Nanocellulose (NC) has garnered much interest worldwide due to its physical and chemical properties. Nanocellulose is produced from biomass materials by bleaching pretreatment, followed by acid hydrolysis. This work demonstrated the production of NC from recycled paper sludge (RPS), a crystalline cellulose rich waste, by ozonation pretreatment, followed by maleic acid hydrolysis. These results demonstrate that ozonation can be used as an effective pretreatment for NC production. NOVEL PRODUCTS Development of microporous cellulose-based smart xerogel reversible sensor via freeze drying for naked-eye detection of ammonia gas, Tawfik A. Khattab et al, Carbohydrate Polymers, Vol.210. Microporous cellulose xerogel can be defined as low density biomaterial that can be employed for a variety of promising applications of different fields. The characteristics of xerogel are a consequence of their microstructure. An easy-to-use and reversible solid-state colorimetric sensor for ammonia gas was developed by embedding a bromocresol purple (BCP) pH-sensory chromophore into the environmental friendly carboxymethyl cellulose as bio-based polymer (CMC) matrix. The vapochromic xerogel provided an instant colour alteration signal from yellow to purple when exposed to ammonia gas or an ammonium hydroxide aqueous environment as monitored by the absorption maxima, colour coordinates and colour strength. Stimuli-responsive cellulose paper materials, Zhijian Li et al, Carbohydrate Polymers, Vol.210. Cellulose paper can be functionalised, such as modified with stimuli-responsive polymers, small molecules or inorganic particles, papers may be sensitive to external stimuli from environments and consequently find applications in wide ranges including protein separation, controlled drug release, switchable surfaces, sensoring devices and smart substrates with various colours, etc. However, there are no reviews summarising the progress of such exciting research field. Here in this mini review, we discuss the advantages of cellulose paper as stimuli-responsive substrate and summarise the fabrication techniques, properties and applications of various stimuli-responsive papers reported to date which are triggered by temperature, pH, humidity, ions, light, magnetic field, solvent gas and biomolecules.
PAPERmaking!
FROM THE PUBLISHERS OF PAPER TECHNOLOGY
Volume 5, Number 1, 2019
Page 6 of 13 Technical Abstracts
Using cellulose fibers to fabricate transparent paper by microfibrillation, Zhenzhen Li et al, Carbohydrate Polymers, Vol.214. Fabricating transparent paper from cellulose nanofibres (CNFs) normally involves high energy or the use of expensive chemicals for the extraction of CNFs from cellulose fibres and time-consuming paper formation processes because of the slow filtration rate of CNFs. In this study, we reported a strategy for the fabrication of transparent paper using microfibrillated cellulose fibres (MFCFs), which were prepared by extracting nanosized fibrils from the cellulose fibre surfaces by a two-step refining process. The transparent paper made from MFCFs shows higher thermal stability, higher tensile strength, higher resistance to deformation, and more flexibility than the nanopaper made from commercial CNFs. This work provides a promising method for the manufacture of transparent paper from cellulose fibres. Poly (lactic acid) composites reinforced with kraft pulp fibres: Production by a papermaking process and characterisation, S Sousa et al, Composites Part A: Applied Science and Manufacturing, Vol.121. Four different pulp fibres, representing short and long cellulose fibres and chemically modified fibres, were tested as reinforcements for poly(lactic acid) composites. A simple papermaking method was used to form the composite sheets, which were further compression moulded. The effects of morphological, chemical, and mechanical characteristics of kraft pulp fibres and their contents on the PLA composite characteristics were investigated. PACKAGING TECHNOLOGY Fabrication and characterization of starch-based nanocomposites reinforced with montmorillonite and cellulose nanofibers, Jiali Li et al, Carbohydrate Polymers, Vol.210. In this study, one-dimensional (1D) cellulose nanofibres (CNFs) were used to stabilise the dispersion of two-dimensional (2D) montmorillonite (MMT) plates in aqueous system. Then the prepared MMT/CNF solution was simultaneously merged into water soluble corn starch (CS) to obtain CS/MMT/CNF composite freestanding films through a casting method. The reinforcing effect from building blocks of MMT and CNF, interfacial interactions of hydrogen and covalent bonding together led to enhanced tensile strength and Young’s modulus, reduced moisture susceptibility and increased transparency of the ternary CS nanocomposites. These extraordinary properties of the ternary nanocomposites clearly point towards a new strategy for designing and fabricating high-performance starch-based nanocomposites by using binary fillers with different geometric shapes and aspect ratio. This kind of ternary nanocomposite can be widely used in food packing and preservation as a biodegradable and green film. Effect of electrolyte on regenerated cellulose film as gold nanoparticle carrier, Lijuan Liu et al, Carbohydrate Polymers, Vol.210. The catalytic performances of gold nanoparticles immobilised on regenerated cellulose films were influenced by cellulose structure. Cellulose was regenerated in aqueous coagulants containing different electrolytes, to fabricate regenerated films with different coagulated network structure and property. Hofmeister sequence can be used to describe regeneration, namely more kosmotropic ions in the coagulants led to cellulose films with more homogeneous coagulated network structure, possibly due to the dehydration of cellulose caused by the ions. Gold nanoparticles were then immobilised on the films to prepare portable catalysts. This work provided not only the fundamental information about the intermolecular interactions between ions and macromolecules, but also an effective approach to construct powerful catalysts.
PAPERmaking!
FROM THE PUBLISHERS OF PAPER TECHNOLOGY
Volume 5, Number 1, 2019
Page 7 of 13 Technical Abstracts
Fabrication of food-safe superhydrophobic cellulose paper with improved moisture and air barrier properties, Hui Li et al, Carbohydrate Polymers, Vol.211. We presented a facile method for preparing a food-safe superhydrophobic packaging paper with improved moisture and air barrier properties in this study, which is combining construction of polymer-nanoclay hybrid multilayers with subsequent carnauba wax treatment. The obtained paper was used for strawberry packaging at ambient temperature, and it was very effective at reducing the weight loss and maintaining titratable acidity compared with the unpackaged strawberries, which might has a great potential as food packaging materials. Highly transparent and thermally stable cellulose nanofibril films functionalized with colored metal ions for ultraviolet blocking activities, Weisheng Yang et al, Carbohydrate Polymers, Vol.213. Although many preparation methods have been reported so far, it is still a great challenge for Ultraviolet (UV) protection films that simultaneously have extremely high transparency and excellent UV shielding properties. Herein, we reported a simple, eco-friendly process for preparing high transparency TOCN-COOM (M: metal ions) films with diverse UV-shielding performances via adsorption of coloured metal ions (Fe3+, Co2+, Ni2+, Cu2+). The introduction of Fe3+ led to an excellent UV blocking, especially almost 89% absorption of Ultraviolet A (UVA) and full absorption of Ultraviolet B (UVB). The formation of metal-carboxylate complexes is also advantageous for improving thermal stability. Hence, the obtained TOCN-COOM films have wide application prospect in the field of UV shielding. Role of the Relaxation State of Polymer Components in Wood When Making Composite Packaging Materials (Corrugated Cardboard), E. L. Akim et al, Fibre Chemistry, Vol.50 (4). We consider targeted variation of the relaxation state for polymer components of wood in stages of the life cycle of corrugated cardboard. From the standpoint of the structural physicochemistry of wood, we present a mechanism for the processes occurring in traditional corrugated cardboard production technology. Our thesis is that cellulose and hemicellulose can go from the glassy state to the rubbery (highly elastic) state at 220°C, but under real conditions this transition occurs at room temperature and even at negative temperatures in the case of plasticization by a sufficient amount of water. Transition of lignin from the glassy state to the rubbery state occurs at a temperature above 130°C, and at 70°C-120°C under conditions of sufficient hydration. Formation of strong interfibre bonds is possible only when the polymers forming the contact are in the rubbery or viscous-flow state. PAPERMAKING Study on the wet-web strength and pressability of paper sheet during the press process with the addition of nano-fibrillated cellulose (NFC), Zonghong Lu et al, Carbohydrate Polymers, Vol.210. The properties of wet-web strength and pressability of base paper affect the frequency of sheet breaks and machine runnability during the paper-making process. In this paper, the effect of nano-fibrillated cellulose (NFC) on the wet-web strength and pressability of paper sheet during the press process of paper-making was explored. It was found that the tensile energy absorption (TEA) of the sample was increased from 6.32 to 10.93 J/m2 at 50% wet web solid content when 5% NFC was added. The web solid content was decreased from 50.51% to 42.85% when 0%-5% NFC was added under the same drainage and press conditions, indicating that the addition of NFC during the paper-making process can retard the pressability of paper sheet. The study put forwards a new view to discuss/study the effect of added NFC on the wet-web strength and pressability of paper sheet.
PAPERmaking!
FROM THE PUBLISHERS OF PAPER TECHNOLOGY
Volume 5, Number 1, 2019
Page 8 of 13 Technical Abstracts
Carboxymethylated cellulose nanofibrils in papermaking: influence on filler retention and paper properties, AF Lourenço et al, Cellulose, Vol.26 (5). The present paper deals with the production of cellulose nanofibrils (CNF) from bleached Eucalyptus kraft pulp by carboxymethylation and TEMPO-mediated oxidation, followed by high pressure homogenisation. The main purpose of the work was to increase the filler retention and mechanical strength of printing and writing paper grades. Mineral fillers are of utmost importance in papermaking and therefore a thorough study of the CNF influence in filler-containing handsheets is mandatory. In this sense, flocculation studies revealed the extraordinary ability of CNF to flocculate calcium carbonate, which was translated into high filler retentions in the paper matrix. Moreover, the interactions between bleached pulp, CNF, mineral fillers and common paper additives, such as cationic starch, alkenyl succinic anhydride and cationic polyacrylamide, were investigated. The results show that, depending on the materials applied, CNF are able to promote an adequate bonding between fibres and filler aggregates, reducing the requirements for the additives. The addition of carboxymethylated or TEMPO-oxidised CNF to the fibrous matrix led to handsheets with better structural, mechanical and optical properties than those of reference handsheets (without CNF and with additives). Mechanisms of strength and stiffness improvement of paper after PFI refining with a focus on the effect of fines, Hamid Reza Motamedian et al, Cellulose, Vol.26 (6). Refining (i.e., mechanical beating of pulp) is a common procedure that is used in paper-making to improve the mechanical properties of the final product. The improvements caused by refining are mainly attributed to increased density and to a better bonding between fibres. In this work, we study how various mechanisms that can be triggered by refining affect the tensile behaviour of the sheets. A paper sizing agent based on leather collagen hydrolysates modified by glycol diglycidyl ether and its compound performance, X Wang et al, International Journal of Biological Macromolecules, Vol.124. In this research, collagen hydrolysates with different average molecular weights from leather collagen were chosen as raw materials. Five environmental-friendly sizing agents (SA) were prepared by cross-linking collagen hydrolysates with glycol diglycidyl ether (GDE) and further grafting them with butyl acrylate (BA) and styrene (St). Then the compound sizing agents (SGDESA-x, x = 1, 2, 3 and 4) were obtained by simple physical mixing of GDESA and starch. The surface sizing performance of GDESA and compound sizing agents were studied. The coated corrugated paper exhibited strong water resistance, good physical and mechanical properties even after refolded for 20 times. PULP / PULPING Determining the repair and maintenance cost of wood chippers, Raffaele Spinelli et al, Biomass and Bioenergy, Vol. 122. Chipping weighs heavily on the total delivered cost of wood fuel, which calls for accurate chipping cost estimates. Chipper repair and maintenance cost is perhaps the most obscure among the figures required for a reliable estimate of chipping cost. To clarify this issue, the authors examined the long-term repair and maintenance records for 51 wood chippers operated by 48 chipping service contractors. The study also provides reference figures for the contribution of labour cost to total maintenance cost. Farm tractors incur more repairs than preventive maintenance, contrary to the other dedicated components of the chipping operation, where preventive maintenance represents most of maintenance cost. Forestry users should make allowance for the lower structural strength of tractors and select large models.
PAPERmaking!
FROM THE PUBLISHERS OF PAPER TECHNOLOGY
Volume 5, Number 1, 2019
Page 9 of 13 Technical Abstracts
Deep eutectic solvents (DESs) for cellulose dissolution: a mini-review, Yang-Lei Chen et al, Cellulose, Vol.26 (1). Deep eutectic solvents (DESs), which are a novel class of sustainable designer solvents, have attracted considerable attention in the field of cellulose chemistry. Due to their low cost and analogous physico-chemical properties to ionic liquids, DESs are expected to be alternative solvents for dissolving cellulose. However, at present, the solubility of cellulose in DESs is much lower than in most ionic liquids. In this mini-review, we briefly summarise the current state of knowledge about cellulose dissolution in DESs.
Non‐Wood Plant Fibers: Applications in Pulp and Papermaking, JE Atchison - Encyclopedia of Plant and Crop Science (Print), 2019. Originally paper was being made from non-wood materials such as papyrus, hemp and textile rags. With the development of technologies for isolating pulp from wood, it resulted in abandoning paper making from many non-wood materials. In this paper we have reviewed the trend in pulp and paper production from different non-wood materials since the perception of the paper making technology up to date through literature review and consultations with experts in the area of pulp and paper production. Cleaner approach for improving the papermaking from agro and hardwood blended pulps using biopolymers, S Bhardwaj et al, Journal of Cleaner Production, Vol.213. Due to rapid deforestation, the paper industry is facing problems like shortage of forest based raw materials, cost increment and negative effects on the environment including increasing air, water and soil pollution. In India, agro residues utilised in stubble burning could be used as a sustainable fibre resource for papermaking, but the paper made from these possesses poor strength properties. Considering the multiple advantages of using agro residues and weak strength properties of the paper made from these, this study was conducted. The effect of blending hardwood pulp and agro pulp with cationic starch or chitosan at wet-end of papermaking with and without subsequent surface sizing using oxidized starch was explored. Approaches for converting sugarcane trash, a promising agro residue, into pulp and paper using soda pulping and elemental chlorine-free bleaching, NK Bhardwaj et al, Journal of Cleaner Production, Vol.217. Industrialisation and urbanisation are the key drivers to threaten the environmental quality and natural resources. Traditionally, pulp and paper industry has been highly reliant on forest based resources for its escalation. Shortage of forest based raw materials, strict environmental regulations and policies have compelled the industry to seek for alternate raw materials for its production. Mills are now focusing on exploring the potential of different agro wastes such as cereal straws and bagasse etc. In present research, sugarcane trash, one of the most abundant agro residues in India, was investigated for its capability in pulping and bleaching. RECYCLING Optimal scheduling ratio of recycling waste paper with NSGAII based on deinked-pulp properties prediction, Wenhao Shen et al, Computers & Industrial Engineering, Vol.132. The recycling of waste paper has been an effective way to achieve the environmental-friendly growth of papermaking industry. Focusing on the mixed-pulping process which has been generally employed, to ensure the required properties of the deinking pulp (DIP) and minimise the purchase cost of waste paper, an intelligent model scheduling the mixing ratio of waste paper was developed in the study.
PAPERmaking!
FROM THE PUBLISHERS OF PAPER TECHNOLOGY
Volume 5, Number 1, 2019
Page 10 of 13 Technical Abstracts
STARCH Modification of retrogradation property of rice starch by improved extrusion cooking technology, Yunfei Liu et al, Carbohydrate Polymers, Vol.213. Modifications of molecular structure, and of short- and long-term retrogradation properties, in rice starch by an “improved extrusion cooking technology” (IECT) were studied. These results show that, under appropriate conditions, IECT is a type of extrusion which can be used to change retrogradation properties of rice starch that have not been previously available. Effect of Octenylsuccinylation of Oxidized Cassava Starch on Grease Resistance and Waterproofing of Food Wrapping Paper, Li Zhong et al, Starch - Stärke, No.1-2, 2019. The surface of food wrapping paper is coated with octenylsuccinic anhydride (OSA)‐modified cassava starch to develop food packaging with high waterproofing and low grease permeability. Oxidised cassava starch is modified using various concentrations of OSA. The effects of OSA concentration, starch content, incubation time, and coating rate on oil resistance and hydrophobicity, grease and water barrier properties are quantified. The influence of octenylsuccinylation of oxidised cassava starch on the optical and physical properties of paper is also investigated. TESTING Maximum Vibration Transmissibility of Paper Honeycomb Sandwich Structures, Rui Yang et al, International Journal of Structural Stability and Dynamics, Online. The maximum vibration transmissibility of paper honeycomb sandwich structures with different sizes of honeycomb core under various static stresses was investigated using the sine frequency sweep test. The effects of the cell length of the honeycomb, the thickness of the sandwich structure, and the static stress on the maximum vibration transmissibility were evaluated. Test method for enhanced mechanical shock fragility statistics accuracy, Shogo Horiguchi & Katsuhiko Saito, Packaging Technology and Science, Vol.30 (4). An optimum cushioning package, which is neither excessive nor inadequate, must be designed to ensure cushioning performance that maintains an acceptable failure rate during transportation while also minimising packaging costs. For this purpose, statistics pertaining to transport hazards and product shock strength must be engaged. The proposed study presents a test method to enhance the statistical accuracy of mechanical
shock fragility of products. An example of the application of experimental results to stress‐strength models has also been described. WASTE TREATMENT Preparation of geopolymer inorganic membrane and purification of pulp-papermaking green liquor, M Xu et al, Applied Clay Science, Vol.168. This paper describes a low-cost and highly efficient metakaolin-based geopolymer composite membrane (support + dense layer) at normal pressure and <70 °C. The support was fabricated using geopolymer foam materials and shows a large water flux and good mechanical properties. The dense layer was prepared using a dip-coating process with geopolymer paste on the porous geopolymer support surface. The preliminary ultra-filtration test (0.2 MPa operation pressure) demonstrates that the geopolymer-based composite membrane can effectively treat suspended particles in wastewater and is expected to be applied in the field of wastewater treatment. We then used the composite membrane in the pulp-papermaking green liquor at different temperatures, and it was found that the SS (suspended solids) of the filtrate can be decreased to far below the industrial requirements of green liquor recycling (SS < 20 mg·L−1).
PAPERmaking!
FROM THE PUBLISHERS OF PAPER TECHNOLOGY
Volume 5, Number 1, 2019
Page 11 of 13 Technical Abstracts
Statistical analysis of sustainable production of algal biomass from wastewater treatment process, Indu Ambat et al, Biomass and Bioenergy, Vol.120. Algal biodiesel is one of the most promising renewable and eco-friendly source of energy for transportation, when algae is produced from wastewater. During the process, both goals of biodiesel production and wastewater treatment could be achieved simultaneously. However, the optimal condition for algae production remained unanswered. Algal biodiesel could be produced from various wastewater treatments. In this study the relationship between biomass production versus lipid productivity in various wastewater sources is statistically analysed. A green composite hydrogel based on cellulose and clay as efficient absorbent of colored organic effluent, Qiyang Wang et al, Carbohydrate Polymers, Vol.210. This work has developed a convenient way of constructing wood cellulose and clay green composite hydrogel as efficient adsorbent of coloured organic effluent. The simple procedure and cost effective wood cellulose as raw material for the composite absorbent construction presented in this research are favourable for industrial applications. Phosphonium-Enhanced Chitosan for Cr(VI) Adsorption in Wastewater Treatment, Sebastian Sessarego et al, Carbohydrate Polymers, Vol.211. Adsorption is a commonly used method for industrial wastewater treatment because of its low-cost, easy operation and high efficiency. In this work, chitosan was crosslinked and functionalised with a low-cost phosphonium salt, tetrakis(hydroxymethyl)phosphonium sulfate (THPS), to enhance its adsorption capacity for Cr(VI). WOOD PANEL Application of surface chemical functionalized cellulose nanocrystals to improve the performance of UF adhesives used in wood based composites - MDF type, Hossein Khanjanzadeh et al, Carbohydrate Polymers, Vol.206. The aim of this research was to investigate the effect of functionalised cellulose nanocrystals (CNC) on the performance of urea-formaldehyde (UF) adhesive for the production of medium density fiberboard (MDF). Surface modification of CNC was performed using 3-Aminopropyltriethoxysilane (APTES). Some physical and thermal properties of reinforced and neat UF as well as formaldehyde emission and some mechanical (modulus of rupture (MOR), modulus of elasticity (MOE) and internal bond strength (IB)) and physical properties (thickness swelling (TS) and water absorption (WA)) of the resulting MDF panels were determined. Quasi-static and dynamic response of oriented strand boards based on balsa wood waste, G.Barbirato et al, Composite Structures, Vol.219. This work presents an evaluation of the performance of Oriented Strand Boards (OSB) panels based on balsa wood (Ochroma Pyramidale) waste agglomerated with castor oil polyurethane resin. In this study, were evaluated OSB panels with different densities (300 kg/m3, 400 kg/m3 and 650 kg/m3), with 10 mm thickness and castor oil polyurethane resin in different contents (11% and 15%). The OSB panels were preliminary characterised by physical and quasi-static mechanical tests to identify the class of application of this material according to the recommendations of standard EN 300: 2002. Subsequently, the OSB panels were characterised by low velocity impact tests.
PAPERmaking!
FROM THE PUBLISHERS OF PAPER TECHNOLOGY
Volume 5, Number 1, 2019
Page 12 of 13 Technical Abstracts
Solid Wood and Wood Based Composites: The Challenge of Sustainability Looking for a Short and Smart Supply Chain, M. Romagnoli et al, Digital Wood Design, Chapter, pp.783-807. (Part of the Lecture Notes in Civil Engineering book series (LNCE, volume 24).) The paper takes into account the most important wood based products used in architecture, structural engineering and design. The amount of roundwood, sawnwood and wood panel production is analysed and forest certification is reported as possible tool to ensure a sustainable forest management, fighting illegal logging and deforestation. A smart review of the most used wood-based products is performed together with the chance to activate a modern short supply chain. The state of art of the wood species actually used is considered together with most important actual challenges addressed to obtain sustainable wood-based products referring to eco-friendly process of gluing and increasing durability. Preparation, characterization and properties of starch-based adhesive for wood-based panels, YongGu et al, International Journal of Biological Macromolecules, online. A new biodegradable, renewable, and environmentally friendly starch-based adhesive for wood-based panels was synthesised. The synthesis was conducted by grafting polymerisation of vinyl acetate (VAC) monomer onto corn starch and crosslinking polymerisation with N-methylol acrylamide (NMA). Compared with the traditional starch-based wood adhesive, the water resistance of starch-based adhesive with NMA (SWA-N) was greatly improved to more than 1 MPa; this exceeds the Chinese standard by 40%. The complex network structure was found to inhibit excessive expansion of the adhesive during high temperature pressing and water absorption. As a result, the adhesive remained intact when subjected to hot pressing and placed in wet conditions. Latex and rosin films as alternative waterproofing coatings for 3-layer sugarcane-bamboo-based particleboards, Erika Yukari Nakanishi et al, Polymer Testing, Vol.75. This paper studied two alternative polymeric films based on natural latex and rosin as a waterproofing coating for 3-layer sugarcane-bamboo-based particleboards (3LP). To study the roughness as well as evaluate the coating surfaces on the 3LP, scanning confocal electron microscopy (SCEM) was used. The wettability performance of the coatings was evaluated by the surface energy through the contact angle method. The 3LP coated thermal, physical and mechanical properties were evaluated following ASTM-E1530: 2011 and ABNT NBR 14810 standards, respectively. Latex successfully formed a smooth and continuous film which covered the surface pores of the 3LP, whereas rosin did not form a smooth and continuous, forming only a thin film on the 3LP. Dynamic accounting of greenhouse gas emissions from cascading utilisation of wood waste, Giorgia Faraca et al, Science of The Total Environment, Vol.651 (2). Cascading utilisation of post-consumer wood waste has recently gained increasing attention in the European Union, aiming for a society in which the resource's properties are optimised through sequential uses. To date, material utilisation of wood waste has been limited to particleboard production, with additional niche alternatives being restricted by quality requirements for wood waste. In this consequential life cycle assessment focusing on post-consumer wood collected at Danish recycling centres, Global Warming Potential (GWP) impacts from quality-driven choices for cascading management of wood waste were compared with those from handling mixed wood waste qualities. The results demonstrated that valuing quality over quantity in wood waste management can ensure larger GWP savings, especially if recycling applications have a long lifetime and/or substitute energy-intensive products; such results were confirmed under all scenario analyses. More cascade steps of the wood waste resource ensured larger savings.
PAPERmaking!
FROM THE PUBLISHERS OF PAPER TECHNOLOGY
Volume 5, Number 1, 2019
Page 13 of 13 Technical Abstracts
Nanocellulose-Reinforced Adhesives for Wood-Based Panels, Elaine Cristina Lengowski et al, Sustainable Polymer Composites and Nanocomposites, pp.1001-1025. Considering that the solid wood, being a heterogeneous and anisotropic product, presents several disadvantages such as unsatisfactory mechanical properties for certain uses and limitations of wood due to dimensions of wood pieces, reconstituted wood products have been developed by gluing of veneer, boards, lignocellulosic fibres, etc., which are joined using adhesives. It should be noted that changes in adhesion to wood are desirable in terms of performance improvement and adhesive economy. Within the constant search for better performance of adhesives, the use of nanocelluloses appears as a viable option. Further, identification of reinforcement of adhesives with nanocellulose is being considered as an opportunity among the several opportunities offered by nanotechnology for the forest products industry. Use of nanocelluloses as reinforcements in adhesives for the production of reconstituted wood panels has several benefits such as possibility of altering the properties of adhesives, gain in mechanical and physical properties of panels and reduction in formaldehyde emissions by panels using synthetic adhesives. Despite all the advantages mentioned above, the Chapter ends with the conclusion that there are still some problems to be looked into suggesting need for more research either in the application of nanocellulose and its modification in different types of resin, as well as application technologies appropriate to the new conditions of the adhesives. Resource quality of wood waste: The importance of physical and chemical impurities in wood waste for recycling, Giorgia Faraca et al, Waste Management, Vol.87. Recycling of post-consumer wood waste into particleboard may be hindered by the presence of physical and chemical impurities in the waste stream, therefore calling for increased attention on the quality of wood waste. However, wood waste comprises several uses/types of wood, along with different levels of contamination. This study provides the detailed sampling and characterisation of wood waste according to its source, type and resource quality grade. The results showed that chemical contamination was significantly higher for low-quality wood waste, thus clearly indicating that improvements in separate collection, sorting and handling of wood waste may improve the resource quality of wood waste and potentially achieve cleaner recycling practices.
PAPERmaking!
FROM THE PUBLISHERS OF PAPER TECHNOLOGY
Volume 5 Number 1, 2019
Events
Forthcoming Events PITA ‘FOOD CONTACT’ COURSE (Bury) – Papers in this PDF 21 May 2019
PAPER & BIOREFINERY (Graz) – Papers in this PDF 5-6 June 2019
https://paper-biorefinery.com/
PITA ‘WASTEWATER TREATMENT’ COURSE (Bury) – Papers in this PDF 11-12 June 2019
TECHNOLOGIE KRING (Apeldoorn) – Papers in this PDF 19-20 June 2019
www.technologiekring.nl
ZELLCHEMING (Frankfurt am Main) 25-27 June 2019
https://zex.mesago.com/events/en.html
PITA ‘WEST END CHEMISTRY’ COURSE (Bury) – Papers in this PDF 2-3 July 2019
CPI BIENNIAL HEALTH, SAFETY & INDUSTRY CONFERENCE (Kenilworth) – Papers in this PDF 9 July 2019
www.paper.org.uk/biennial PITA ‘FUNDAMENTALS OF PAPERMAKING’ COURSE (Kappa SSK) – Papers in this PDF 16-18 July 2019
PITA MILL TOUR & VISIT (Two Rivers Paper Mill, Watchet) 18 July 2019
PAPERmaking!
FROM THE PUBLISHERS OF PAPER TECHNOLOGY
Volume 5, Number 1, 2019
Events
PRIMA 2019 (Prague) 17-18 September 2019
www.prima-paper.com – PITA Members get 10% discount on Conference PITA ‘MODERN PAPERMAKING’ COURSE (Bury) 17-18 September 2019
MIAC (Lucca) 9-11 October 2019
www.miac.info/en/
PITA ‘PUMP EFFICIENCY’ COURSE (Bury) – Papers in this PDF 15 October 2019
PITA ‘ENERGY OPTIMISATION’ COURSE (Bury) – Papers in this PDF 5-6 November 2019
DITP (Slovenia) – Papers in this PDF (call for papers) 20-21 November 2019
PAPER ONE SHOW (Dubai) 13-15 January 2020
https://paperoneshow.net/ – PITA Members get 20% discount on Stands
The full PITA Calendar of World Events can be found at:
https://www.pita.org.uk/what-we-do/events-activities/calendar-of-world-events

PAPERmaking!
FROM THE PUBLISHERS OF PAPER TECHNOLOGY
Volume 5, Number 1, 2019
Events
PITA COURSES

Cristina is a Key Account Manager & Consultant for the paper and board sector at Ecol
Studio, in particular for the European and International market. She is in charge of the
Technical and legislative Support. She has 20 years experience in the paper industry,
and she's involved in National and European Working Groups on paper and board, as
(CEN) TC 172 / WG3 -Analytical methods for the assessment of Poper ond
Board in contact with foodstuffs, Ecolabel (paper products), the Food
Contact Materials Working Group of Federchimica (Italian Federation
of the chemical industry).
Eugenio is a Senior Consultant for Ecol Studio in the field of Food Contact Materials & Articles.
He graduated in Chemistry and has been working in the Paper Industry for 35 years. Eugenio
is also a member of staff at CEPI, acting as the Technical Manager for food contact and safety
of paper products.
Cristina Lugli/Eugenio Cavallinio Ecol Studio presents. . . . “An Introduction to Food Contact for the Paper & Packaging Industry”
What you need to know about Paper & Board Materials for Food Contact 21st May 2019 in the PITA Office (Bury)
PITA Training & Conferences
Tel: 0300 3020 150
Fax: 0300 3020 160
E-mail: [email protected]
5 Frecheville Court
Bury
Lancashire
BL9 0UF
Paper
Industry
Technical
Association
This course will focus on the scenario of paper and board materials and articles for Food Contact (P&B FCMs),
and it is intended specifically for all operators along the paper and board supply chain: producers, converters
and retailers; providing essential training for operators who wish to develop a better understanding of
technical and legislative requirements in the Food Contact materials market.
PART 1 – LEGISLATIVE FRAMEWORK ON FOOD CONTACT MATERIALS AND ARTICLES
An introduction to the EU framework legislation: Reg.(EC) No 1935/04
Reg.(EC) No 2023/06 on Good Manufacturing Practices (GMP)
EU Non-harmonized FCMs: regulatory situation and implications
The role of national legislations
Future perspectives
PART 2 – TECHNICAL ASPECTS OF PAPER AND BOARD MATERIALS AND ARTICLES’ COMPLIANCE
Compliance for the Paper and Board sector in being compliant: Relevant documents for the Paper and Board Materials and Articles for Food Contact
GMP for the Manufacture of Paper and Board for Food Contact (CEPI Guidance)
How to comply with Food Contact regulations in the EU: Overview, positive list, labelling & declaration of compliance for Food Contact materials
Technical requirements on raw materials
Testing on the finished products
How to track the regulatory developments to ensure continued regulatory compliance
Only £499 (plus VAT) per person for the one day course, including full course
notes, refreshments & six months complimentary membership of PITA
For further details or to book your place on this course, contact Helen in the
PITA Office - (0300 3020 150 / [email protected])

This Two Day course will focus on optimising biological treatment plants to meet BAT, reduce operating costs and generate revenue.
The course will be of relevance to any paper industry site operating or considering investment in an activated sludge plant, a biological filter or anaerobic digestion plant.
BAT8 covers the monitoring of ‘key process parameters and of emissions to water and air’. Make sure you are ready for it with this course!
PITA & Graeme Finlayson present . . . . “Fundamentals of Wastewater Treatment”
11th& 12th June 2019 / PITA Office / Bury
PITA Training & Conferences
Tel: 0300 3020 150
If calling from outside
the UK: +44 161 764 5858
Fax: 0300 3020 160
E-mail: [email protected]
5 Frecheville Court
Bury
Lancashire
BL9 0UF
Paper
Industry
Technical
Association
Wastewater Characteristics: What is COD, BOD, ammonia, phosphate?
Nutrient Addition: Balancing nitrogen and phosphorus to achieve consent
Aerobic or Anaerobic: Costs, income, reactor types
Troubleshooting: Scaling, overloading, septicity
Activated Sludge Processes: The importance of sludge age and how this affects settlement rates
Optimising Final Sedimentation Tanks: Getting the most out of the final tank when settlement is poor
Microscopic Analysis of Activated Sludge: What to look for and what it means
Filamentous Bulking Control Strategies: Selectors and chemical addition
For further details &
to book your place on this course,
contact Helen in the PITA Office (0300 3020 150 / [email protected])
I liked the interactive nature and going through calculations and worked examples to apply the infor-mation we had just learnt.
The best aspect of the training was that it helped me to think about treatment in a more holistic way
Many thanks for what was a very well re-ceived couple of days. The way you adapted to the audience was excellent, Matt clearly has expertise that we would like to call on at some point

Mark Smith presents. . . . “PITA’s Introduction to Modern Wet End Chemistry”
Everything you need to know about Colloid Chemistry on a Paper Machine 2nd & 3rd July in the PITA Office (Bury)
Mark gained a PhD in Colloid Science from the University of Bristol and then spent a few years in the oil industry before joining and working (for over 30 years) in Paper Industry. Having gained experience at McMillan Bloedel Research, Mead Central Research, UK Paper and Omya, he has been involved in problem-solving around Wet End Chemistry on Paper Machines around the world. By measuring colloidal properties and using these measurements, it is possible to solve a wide range of papermaking issues.
PITA Training & Conferences
Tel: 0300 3020 150 Fax: 0300 3020 160
E-mail: [email protected]
5 Frecheville Court Bury
Lancashire BL9 0UF
Paper
Industry
Technical
Association
Day 1—Morning: Understanding & measuring colloidal properties What are colloidal materials
How colloidal systems are stabilised & de-stabilised Measurements of colloidal properties & other related chemical properties Use of these measurements to improve paper machine operations
Day 1—Afternoon: Use of inorganic colloidal solids - Fillers Type of fillers used in paper making
Effect of fillers on paper properties & paper making Recent developments to maximise filler use
Day 2—Morning: Use of colloidal material to give desired paper properties Strength additives
Nanocellulose, starch, wet strength & dry strength additives
Shade control, Dyes & OBAs Surface modifications additives
Wet end size, size press & coatings Day 2—Afternoon Control of colloidal material to improve paper machine efficiency Control of undesirable colloidal materials
Pitch, scaling & anionic trash Improve retention of desired colloidal
material Retention & drainage aids
Control of microbiological contaminants Yankee dryer chemistry
For further details or to book your place on this course, contact Helen in the PITA Office - (0300 3020 150 /
Course Objective: Gain an understanding of how colloidal materials can be used and controlled to give you desired paper properties and improved paper machine efficiency.

‘The Fundamentals of Papermaking’ An Introduction to the Operator Development Program
OVERVIEW Date / Venue:
16th – 18th July 2019 / Venue – Smurfit Kappa SSK, Birmingham
Outline:
This 2 ½ day course provides a fast track introduction to papermaking (limited to operations between
‘Mixing Chest’ & ‘Reel Up’). The intention is to raise the knowledge of process, technician & support staff
to an intermediate level of shared understanding regarding modern Paper Machine operations.
In addition to being valid as a standalone course, the course content also provides an introduction to the
‘Operator Development Program’ (ODP).
Papierzentrum in Gernsbach also provides a bridge between the UK & German Training & Education
systems.
Target Audience: Machine operators, wet end operators, shift supervisors & trainees. Running a paper production facility efficiently today, requires excellent know how from people involved in the process. This course will give participants up to date knowledge concerning all relevant processes involved. The course contents include:
Machinery,
Paper Chemistry
The interaction of other production areas, including their impact on product, quality & Machine
runability.
Course Fees1:
Course Fees, including full course documentation & refreshments
£ 750.00 (plus Tax)
Travel & Accommodation to be organised by the participant
1 Note:
Cancellation Policy
Substitutions of Attendee may be made at any time.
Cancellations made less than 14 days prior to the course date, or failure to appear, will result in forfeiture of the Course Fee.
All Courses are subject to a ‘Minimum Attendance Level’ & delegates should avoid making non-refundable travel arrangements until their place on the Course has been confirmed.

Outline Program & Prospectus
Proposed Course Schedule Tuesday, 16th July 2019 (Course Commences at 09:00 hrs): Introduction to the Industry
Overview to the pulp, paper & packaging industry
Main figures of the national & international productions
Raw material & resource development
Changes in the raw materials, energy & production in the past
Paper technology in the future, main barriers & challenges
Stock Approach Flow
o Feed flow into the Stock Approach System
Stock approach system as a black box: which components are added & removed in the stock
approach system & what is their influence on the paper making process.
Which parameters can be used for controlling the feed flows into the stock approach system
Effects of changes in the feed flows into the stock approach flow processing, overview
o Stock & water loops
Stock flows & main parameters in the stock approach system
Water circulation & its effect on the runability & quality, overview
o Machinery & build-up
Machineries used in the stock approach system & goals of them
Water circulation & its effect on the runability, wet end chemistry & quality
o Impact on quality & runability
The influence on the stock & paper quality in the stock approach system.
Typical runability & quality problems related to wet end
Head box
o Distribution systems
Cross flow header/tapered header & central distributor differences & functions
Pulsation elimination tank
o Design & types
Head box types limited to open, pressurised & hydraulic head boxes
Distribution channels, stock dilution system, mixing chamber, turbulence generator & lamellas
o Efflux ratio
Control & adjustment of efflux ratio
Effect of the efflux ratio on the paper quality (fibre orientation & formation)
o Turbulence generation
Different techniques for turbulence generation e.g. rectifier rolls & tube banks
Influence of the turbulence generation on the formation, paper quality & dewatering
Differences between macro & micro turbulences
o The ‘Slice’
Functions of the slice
Adjustment of the slice & its influence on the stock flow, paper quality & dewatering.
Velocity forming vs. pressure forming
o Impact on paper machine runability & product quality
Adjustments of the head box & their effect on the paper machine runability & the paper quality
Chemical additives in the wet end
o Chemicals to enhance product quality

Outline Program & Prospectus
Proposed Course Schedule Use of chemicals for improvement of e.g. strength or colour
Dosage of chemicals: influences on the production
o Chemicals for runability improvement
Addition of retention aids, defoaming/de-aerators or bentonite & their influence on runability
o Introduction into fibre & wet end chemistry
Fundamentals of fibre chemistry: hydrogen bondages & reactive groups
Chemical fundamentals of wet end chemicals, which requirements exist for the use of wet end
chemicals

Outline Program & Prospectus
Proposed Course Schedule Wednesday, 17th July 2019:
Forming section
o Single & multi-layer designs
Principles of different forming sections for different paper grades
o Sheet forming fundamentals
Dewatering & concentration of particles through the forming section
Two-sidedness & its influence on the quality
o Dewatering elements & vacuum system
Design of the dewatering elements e.g. foils, forming roll, forming table, suction boxes... & their
influence on the dewatering & paper quality
Pressure impulses & their adjustment to improve the paper quality & runability
o Retention
First pass & total retention, ash retention & influence on the productivity & quality
o Impact on product quality & runability
Wire section impacts on the paper machine runability & the stock & water loops
o Fabric considerations
Forming fabric fundamentals
The Press Section
o Press section designs
Different press section designs e.g. 3 nip system, 3+1 nip or shoe press system & their influence
on the runability & quality
o Fundamentals of pressing
Physics of pressing & dewatering in pressing section
Parameters effecting the pressing result
o Press nips: grooved, blind drilled, shoe press
Press cylinder designs & dewatering principles of them
o Press section impact on product quality & runability
Press section adjustments & their impact on the paper quality & runability of the paper machine
o Press felts & conditioning
Fundamentals of press felts
The Dryer Section
o Fundamental of paper & board drying
Dewatering of bound water & fundamentals of paper drying
Paper grades & their impact on the drying result & steam consumption
o Build-up of dryer groups single/double tier
Most typical cylinder drying systems & their differences
Water removal from the paper & hood in drying section for different systems
o The Drying Cylinder
Construction of a drying cylinder & principle of heat transfer
o Steam & condensate systems
Fundamentals of a steam-condensate system
Units & their principles in a steam-condensate system
o Pocket Ventilation
Importance of pocket ventilation

Outline Program & Prospectus
Proposed Course Schedule o Dew point & 0-level
Fundamentals of dew point & 0-level in a drying section
Influence on the steam consumption & paper quality
o Dryer Section Operations
Drying section adjustments
o The Dryer Fabric & cleaning
Fundamentals of dryer fabrics
Cleaning systems for dryer fabrics
Finishing
o Online-Calendering fundamentals
Calendering effects on the paper quality
Parameters for adjusting calendering results
Reel Up Systems
Reeling up systems & their function
Thursday, 18th July 2019: Introduction to Process Control
o Computer Aided Process Simulation
o “From mixing chest to reel-up”
o Start-up the paper machine
o Working with closed control loops
o Adjust various machine parameters to improve product quality
12:30 hrs – Lunch
13:30 hrs – Course Review & Feedback
14:30 hrs – Departure

Outline Program & Prospectus
Proposed Course Schedule Registration & Booking Form Course: Fundamentals of Papermaking (UK) - 2½ Days Course Date / Venue: 16th to 18th July 2019 / Venue TBC Details of Attendees:
Name Position Years in Paper Industry E-mail Address
Do you have any Special Dietary requirements, if so please specify: Specific Interests (please feel free to list topics on a separate sheet): What are you looking to gain from this Course? (please feel free to continue on a separate sheet): Invoicing Details: Invoice Address: Purchase Order / Reference: Invoice Contact: Telephone:
E-mail Address:
Note
All Courses are subject to a ‘Minimum Attendance Level’ & delegates should avoid making non-refundable travel arrangements until their place on the Course has been confirmed.
Substitutions of Attendee may be made at any time. Cancellations made less than 14 days prior to the course date, or failure to appear, will
result in forfeiture of the Course Fee.

Energy efficiency of pumping systems is important in that energy
efficiency is one of the most important factors in determining pump
reliability and maintenance costs. Consequently, energy inefficiency in
pump systems increases operating costs due to:
Higher energy use and cost
Increased maintenance costs
Failure (reduced reliability affecting production
schedules)
There are many reasons for low energy efficiency of pump systems.
Several of these can be identified by simple measurements such as
flow, power consumption and total pump head. Other reasons for low
efficiency may require a detailed analysis of the pump system to
identify specific issues and what steps to take to resolve these issues.
This course is designed to show how to measure pump efficiency so that pump systems are operated at high
efficiency following remedial action when the data shows that there is a cost benefit from this action.
“Pumping Systems Energy Efficiency Workshop” Essential Knowledge for Everyone Working with Pumps
15th October 2019 / PITA Office, Bury
PITA Training & Conferences
Tel: 0300 3020 150
Fax: 0300 3020160
E-mail: [email protected]
5 Frecheville Court
Bury
Lancashire
BL9 0UF
Paper
Industry
Technical
Association
Who should attend:
Energy Managers & Coordinators Operations Supervisors & Managers
Plant & Process Engineers Maintenance Personnel
C o n t e n t s
The relationship between Energy Efficiency and Reliability
How to assess Pump System Efficiency; what measurements need to be taken and the possible
problems in taking these
How to use the data generated
What surveys show in terms of Pump System Efficiency - typical efficiency in pump systems
Options to improve efficiency after finding that a system is inefficient
The pros and cons of Variable Speed Drives
How to measure pump failure rates, so that
improvements can be tracked
For further details or to book your
place on this course,
contact Helen in the PITA Office (0300 3020 150 / [email protected])

This Intensive Two Day Course focuses on Modern Energy Optimisation Techniques specifically relevant to the production of Paper, Fibre-based Packaging Products and Converting. Starting from an up to date overview of the Energy Market, the course provides essential background knowledge for anyone (manufacturer or supplier) who is involved in the implementation of Energy Saving / Carbon Emissions Reduction strategies throughout the Fibrous Forest Products Sector. The content of this course is highly interactive, allowing the discussion to focus on the key areas of interest relevant to the attendees.
A great primer/motivator for those looking to increase Energy Efficiency.
Kate Leach presents . . . . “Energy Optimisation”
Essential Cost Saving Knowledge for All involved in the Paper Industry
5th& 6th November 2019 / PITA Office / Bury
PITA Training & Conferences
Tel: 0300 3020 150
If calling from outside
the UK: +44 161 764 5858
Fax: 0300 3020 160
E-mail: [email protected]
5 Frecheville Court
Bury
Lancashire
BL9 0UF
Paper
Industry
Technical
Association
Energy & Trends: A look at energy trends locally and globally.
Motors: Understanding how motors work, to make them work more efficiently in our mills.
Context & Scale: Looking at energy use in the Home, Office and Industry.
Processing & Pumping Efficiency: Learning how to spot process inefficiencies in pumps.
Dewatering: Relative costs of water removal throughout the papermaking process, how small changes can bring about big savings.
Employee Engagement: The importance of involving the whole workforce in energy optimisation and some tools to do this.
Compressed Air: How to ensure one of the largest single energy users in the mill is working optimally.
Refining: A background to refining leading on to an understanding of how to optimise refining results whilst minimising energy requirements.
Energy Generation: Generation options for the paper industry (including: heat exchangers and steam systems).
For further details & to book your place on this course, contact Helen in the PITA Office
(0300 3020 150 / [email protected])
Kate is an effective and entertaining trainer with a thor-ough and grounded knowledge of pa-permaking processes with good insight into the world of soft tissue manufacture.
I can honestly say that after 38 years in the paper industry and having attended a large number of courses this was truly one of the best both in terms of content and supporting mate-rial.

PAPERmaking!
FROM THE PUBLISHERS OF PAPER TECHNOLOGY
Volume 5, Number 1, 2019
Events
PAPER & BIOREFINERY
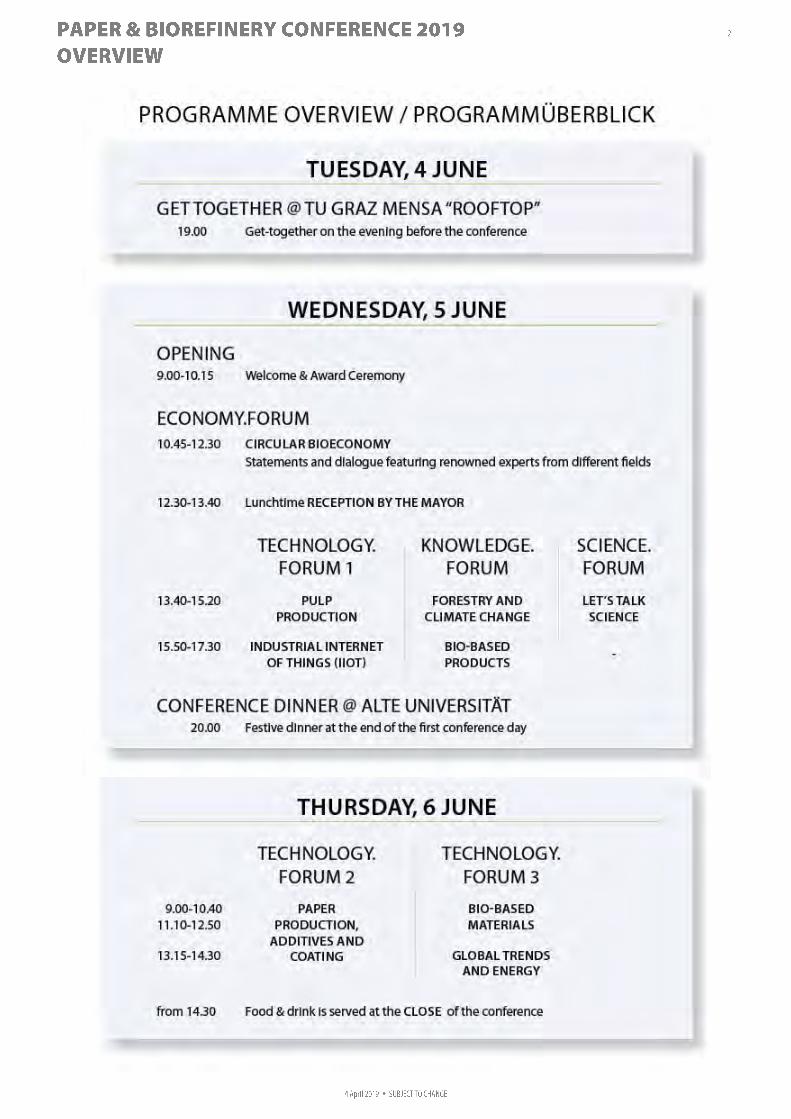
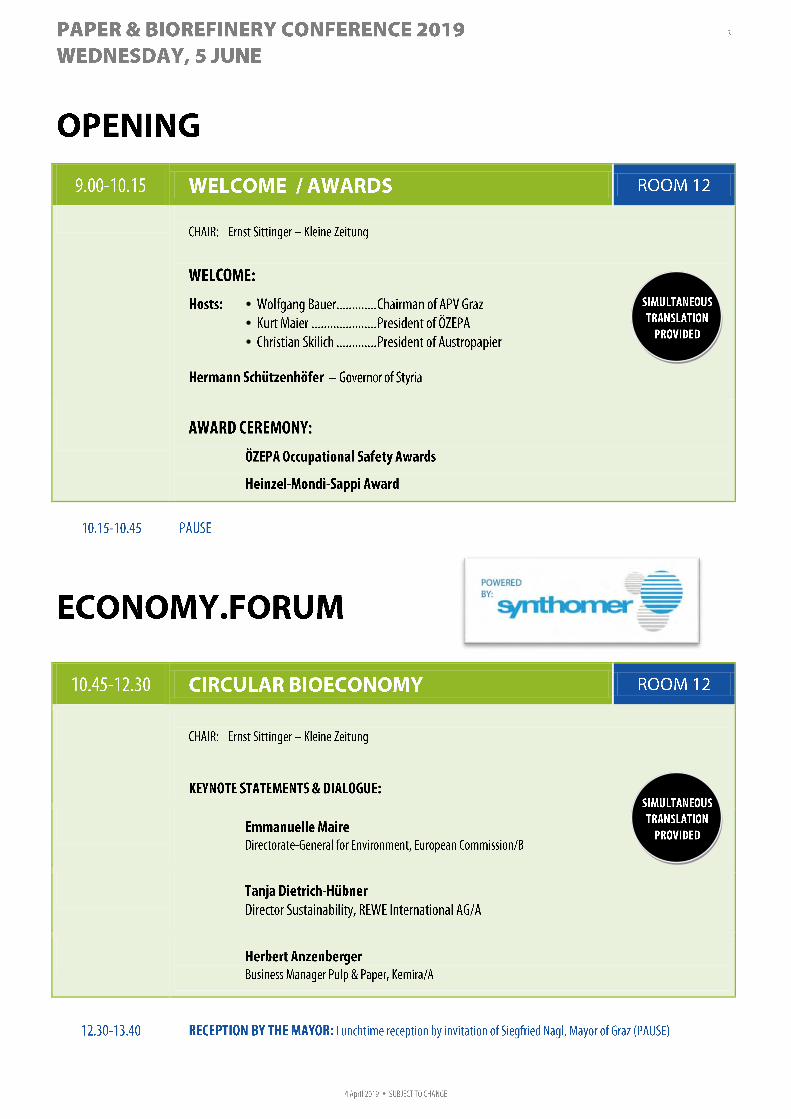


PAPERmaking!
FROM THE PUBLISHERS OF PAPER TECHNOLOGY
Volume 5, Number 1, 2019
Events
TECHNOLOGIE KRING
INTERNATIONAL SEMINAR 2019
TECHNOLOGIEKRING Paper & Board Industry
‘Raw materials and stock preparation’
Location: Van der Valk Hotel Apeldoorn-De Cantharel, Van Golsteinlaan 20 7339 GT
Apeldoorn
June 19th (Wednesday afternoon) | June 20th (Thursday morning)
Preliminary program
June 19th (Afternoon, Day 1)
13:00 Welcome and opening by Jan Pille, Royal VNP
Introduction new website Technologie Kring
13:10
Setting the theme ‘Raw materials and stock preparation’ by the chairman
of the day, Walter Hulshof, managing director Industriewater Eerbeek
Masterclass Young Talent & General issues
13:30 Brexit – The Effect of the Big Blue Monster on Papermaking in the UK by
Andrew Large (Director General of the CPI)
13:50 3D printing of lignocellulosic materials: from nanofibre hydrogels to
structured biocarbons by Dr. Davide Beneventi, CNRS, Laboratoire de
Génie des Procédés Papetiers
14:10 Plant properties of the various wood fibers by Andries van Eckeveld, Van
Hall Larenstein/Innovita-Advies
Masterclass Water as raw material
14:30 Polishing bio-effluent to liner processwater by Walter Hulshof,
Industriewater Eerbeek
Making polished bio-effluent and paper machine production fit for liner
production purpose by Alfons Koelen, DS Smith
Discussion afterwards
15:15 Break & telsell
Masterclass Pulpers as raw material
15:45 Up-date pulpers by Oliver Lüdtke, Voith
16:05 Small investment with a big impact by Harald Bauer, ANDRITZ Pulping
Rebuilds
16:25 Repulping Aids – New opportunities for the Recovered Paper Industry by
Bernhard Nellessen, Solenis Technology Germany GmbH
16:45 Junk Trap or Trashwell? Reducing maintenance costs in pulper detrashing
by using fewer but better valves by Francois Rui, Kadant lamort

16:55 Break & Snack
17:15 Workshop Pulping
* DS Smith De Hoop, Ben Kortekaas
* Neenah Coldenhove, Gert van Beek
* ESKA, Bert Uil
* Stora Enso Langerbrugge, Patrick de Wilde
* VPK, Ann Deschildre
* PF Doetinchem, Frank Uittenbogaard
18:15 Networking at the technology market
19:00 Informal BBQ in first class networking atmosphere
and official ceremony Technologie Kring Award June 2019
INTERNATIONAL SEMINAR 2019
TECHNOLOGIEKRING Paper & Board Industry
‘Raw materials and stock preparation’
Location: Van der Valk Hotel Apeldoorn-De Cantharel, Van Golsteinlaan 20 7339 GT
Apeldoorn
June 19th (Wednesday afternoon) | June 20th (Thursday morning)
Preliminary program
June 20th (Morning, Day 2)
8:45 Opening by the chairman of the morning session by Leon Joore, Natural fiber
Application Center
Masterclass Starch
9:00 Effect of water quality on starch performance by Koen Homburg, ADM
9:30 Cationic starch booster by Franco Faleschini, Kemira
Masterclass Sorting, screaning & cleaning
9:50
Reconsidering screening technologies & fractionation with BoosTEK
desruptive innovation by Francois Rui, Kadant Lamort
10:20 Break & telsell
10:40 Profile control in relation to customer problems by Hugo Geerdinck, Neenah
Coldenhove
Masterclass
Refining
11:00 Pulping and refining in combination with our new Mill Process Solution (since
the acquisition of GL&V) by Valmet
11:20 Robotization in paper industry by Improvia
11:40 End of seminar and take away lunch
Program updates: www.technologiekring.nl - Program is subject to changes

VNP Millvision seminar 19th en 20th of June 2019
Registrationform
Name: Invoice adress (in case different)
e- mail:
Company: Company:
Adress: Adress:
PC&City: PC&City:
Tel.no. Tel.no.
VAT no. VAT no.
I register for the seminar of the 19th and 20th of June 2019 and pay € 490,- I will attend the dinner on day 1 (inclusive)
I register for the takeaway lunch on day 2 (inclusive)
Please make a hotelreservation for me (exclusive)
Dinner 19th of June and lunch 20th of June are included, excl. VAT. Please note: hotel rooms can be reserved through us until Wednesday, May 22nd 2019, after this day your room is not guaranteed! Overnight stay hotel NOT included. Cancelling costs: hotelroom charges, if booked. Signature: E-mail to: [email protected]

PAPERmaking!
FROM THE PUBLISHERS OF PAPER TECHNOLOGY
Volume 5, Number 1, 2019
Events
CPI HEALTH, SAFETY & INDUSTRY
CONFERENCE

CPI Biennial Health, Safety and Industry Conference
‘Keeping our people safe, motivated and informed’
Tuesday 9 July 2019
Chesford Grange Hotel, Kenilworth
P R O G R A M M E
Main Event Sponsors:
Opening Key Note Address
Miles Roberts, Group Chief Executive, DS Smith plc
PABIAC Strategy 2019 – 2023 Official Launch
Martin Temple CBE, HSE Chair
Key Speakers
Plenary Session
Richard Stanton MBE Richard (Rick) is a British civilian cave diver who specialises in rescues through the Cave Rescue Organisation and the British Cave Rescue Council. In 2018 he played a leading role in the Tham Luang youth soccer team cave rescue. Rick and diving partner John Volanthen were the first to make contact with the team and played a leading role in the successful rescue thereafter. Rick will give an unforgettable presentation, drawing on his experiences as a diver over many years. He will use the cave rescue last year to illustrate how he managed the risks, planning, emergency planning, teamwork, leadership, and the importance of the support needed to carry out this delicate rescue.
Programme Sponsors:
Marquarie Investment Bank

HEA
LTH
AND
SAF
ETY
PRO
GRA
MM
E
SESSION 1 11:15 Leadership, engagement and collaboration
It is recognised that health, safety and well-being management systems are most successful if they’re embedded in an organisation’s culture – if everyone, from the shop floor to the boardroom is engaged and committed to making it work. Top management leadership ensures that an organisation has in place a sound, functional management system that incorporates commitment, responsibility and accountability. In this session you will hear how you can develop, lead and promote a positive health and safety culture within your company, and how one company gained ISO 45001 accreditation, and is applying the new standard within the organisation.
Speakers: Paul Freeman Director Paul Freeman Enterprises Terry Stears Risk Director Portals Overton George Craig EHS Manager Portals Overton
IND
UST
RY P
ROG
RAM
ME
SESSION 4 11:15 Labour | Skills | Diversity
Changes in manufacturing technology, together with the impact of Brexit on cross-European labour movement and the challenges of attracting new recruits into manufacturing are all impacting on the future prospects of the UK’s Paper-based Industries. This session will look at how the industry will meet its future needs for labour and skills, with particular reference to improving diversity and enabling the industry to recruit from all sections of society.
Speakers: Phillipa Foster Back CBE Director, Institute of Business Ethics David Nicholson Group HR Director, James Cropper PLC Professor Bill Sampson Head of School of Materials, University of Manchester Janet Marshall HR Manager Arjowiggins
HEA
LTH
AND
SAF
ETY
PRO
GRA
MM
E
SESSION 7 13:35 Leadership, engagement and collaboration
Leadership, engagement and collaboration extends to more than just safety, and if we are to embrace ill-health, stress and mental well-being as part of our agenda, we need to ensure we have the right attitude and necessary skills. The speakers in this session will discuss leadership, engagement and collaboration in its broadest terms, and how a different approach to measuring a company’s health and safety performance goes beyond measuring accident/incident rates.
Speakers: Dr Carolyn Yeoman Highley Yeoman Limited Bud Hudspith National H&S Advisor Unite the Union
IND
UST
RY P
ROG
RAM
ME
SESSION 10 13:35 Recyclability & Extended Producer Responsibility
Since the last CPI Conference, a swathe of environmental legislation has been passed or is being considered, which will impact our industry. Driven by public and political sentiment, the EU Circular Economy Package, which the UK Government has indicated it will transpose come what may with Brexit, demands increasing paper and board recycling rates and a significant additional contribution to the funding of collections by producers. In addition, the Resources and Waste Strategy, Deposit Return Schemes, the Single Use Plastics directive, Consistent Collections and proposed changes to the current EPR system are all likely to have impact and bring change.
Speakers: Dr Adam Read External Affairs Director, SUEZ Phil Conran Chair, Defra Advisory Panel on Packaging (ACP) Kevin Vyse Director, OPRL Ltd
CPI Biennial Health, Safety and Industry Conference ‘Keeping our people safe, motivated and informed’
Programme of Events
Monday 8 July 2019 Garden and Terrace 18:30 – 19:30 Drinks Reception 19:30 – 21:30 BBQ
Tuesday 9 July 2019 Kenilworth Foyer | The Grange 08:00 – 09:00 Registration and Exhibition Events Centre Foyer 08:00 – 09:00 Sponsors Breakfast Sessions Kenilworth Suite 09:15 – 09:20 Conference Introduction Andrew Braund, Director of Health & Safety, CPI 09:20 – 09:50 Opening Key Note Address Miles Roberts, Group Chief Executive, DS Smith plc 09:50 – 10:15 PABIAC Strategy 2019 – 2023 Official Launch Martin Temple CBE, HSE Chair 10:15 – 10:40 The Future of UK Manufacturing Niall Mackenzie, Director, Infrastructure & Materials, BEIS
Seamus Nevin, Chief Economist, Make UK The Grange 10:40 – 11:10 Coffee Break and Exhibition Syndicate Rooms 11:15 – 12:30 Pre-booked sessions (see sessions opposite) The Grange 12:30 – 13:30 Lunch and Exhibition Syndicate Rooms 13:35 – 14:45 Pre-booked sessions (see sessions opposite) The Grange 14:45 – 15:10 Coffee Break and Exhibition Kenilworth Suite 15:15 – 16:00 Plenary Session Richard Stanton MBE 16:00 – 16:15 Challenges Ahead Andrew Large, Director General, CPI 16:15 – 16:30 Closing Address Richard Coward, CPI President

SESSION 2 11:15 Work-related stress, health and well-being
SESSION 3 11:15 Vehicle, material movement and storage stability We shouldn’t see health and well-being as
something different than safety. With a safety issue we look at protecting the person from a physical hazard, but organisations should look closely at what they are doing to protect the person from a psychological hazard.
Dr Sarah Hattam is a practicing GP with a special interest in workplace health, well-being and especially mental health and work (and non-work) related stress. In this interactive session, Sarah will talk about the common issues she deals with on a daily basis, while Cristina will highlight the impact of fatigue and shift work on performance, and the countermeasures that organisations can introduce.
Speakers: Dr Sarah Hattam Concilio Health Dr Cristina Ruscitto Senior Researcher Clockwork Research
Over recent years there has been a steady increase in the number of transport and material related incidents, some of which have resulted in serious injury. Vehicle and material movement doesn’t stop when loads leave the site, and companies still have a responsibility for the material they transport when on the road. This session will start with a case study and how, following an incident, one company reviewed its whole internal transport procedures and the measures it has since implemented. This will be followed by Andy Binns who will give an insight into the role of Highways England and dealing with the aftermath of a load shift incident.
Speakers: Mark Ryan Group Health, Safety and Environment Manager Logson Group Andy Binns Traffic Officer Highways England
SESSION 5 11:15 Environmental Permitting
SESSION 6 11:15 Paper & Board in Food Contact With high impact changes to environmental
permitting on the horizon, this session will discuss the way forward for sector permits with the integration of Abstraction Licencing into mill permits, defining UK BAT & BAT AELs, requirements for hitherto exempt activities such as waste paper depots, to apply for permits. Changes to sector permits brings in a requirement for sites to produce Fire Prevention Plans. The session will hear from the Wood Recyclers Association who have produced a Sector Guide on writing Fire Prevention Plans in collaboration with the EA.
Speakers: Julie Dracup Senior Advisor; Abstraction, EA Spence Seaman Senior Advisor; Paper, Pulp & Textiles, EA Julia Turner Executive Director, Wood Recyclers Association Peter Buckley Senior Fire Advisor - FPPs, EA
Producers of food contact materials have always had a responsibility to manufacture their materials in accordance with the ‘Framework’ Regulation. But in the absence of specific (EU) legislation for paper & board, how does industry demonstrate the suitability of paper & board for food contact? In this session you will hear how the industry has revised the longstanding voluntary Guideline and Good Manufacturing Practice (GMP) as well as the other steps that are being taken to demonstrate compliance and prepare for potential legislation. And, importantly, where do we stand in terms of UK legislation as we leave the EU? Hear the position from experts as it develops post-Brexit.
Speakers: Adam Hardgrave Head of Food Contact Materials, FSA Tim Chandler, Senior Scientific Officer – Food Contact Materials, FSA
Jori Ringman Deputy Director General, CEPI Krassi Kazashka Technical Director FEFCO
SESSION 8 13:35 Work-related stress, health and well-being
SESSION 9 13:35 Machine procurement, safe interventions and control standards Every year the Chartered Institute of
Personnel and Development (CIPD) publish an annual survey that examines trends in work-related absence in UK workplaces. Drawing on the survey results, Rachel will discuss the main reasons for absenteeism, including the effect of ‘presenteeism’ and ‘leaveism’, while Dan will address the big issues around mental health and well-being.
Speakers: Rachel Suff Senior Policy Advisor CIPD Dan Shears Safety & Environment Director, GMB National Health
Each year the industry invests heavily on purchasing machinery. Unfortunately, some equipment when it arrives in the UK does not meet the required level of safety standards. New PABIAC guidance for the Procurement and Installation of Machinery is designed to assist all sites in the planning and implementation of purchasing new machinery. In this session, delegates will have an opportunity to ask questions to a panel of experts on machinery procurement issues relative to the guidance.
Speakers: Paul Grady Specialist Mechanical Inspector, HSE Matt Androsiuk Principal Safety Consultant, PILZ Andy Godbold Head of Health, Safety and Environment DS Smith Packaging North Europe
SESSION 11 13:35 Supply Chain
SESSION 12 13:35 Energy efficiency in a bio-based economy A consequence of the ubiquity of paper is
the high degree of complexity and wide range of both suppliers and customers that must be engaged. The session will hear from stakeholders as diverse as finance directors and food industry customers and will examine how the UK’s Paper-based Industries can improve their interaction across the totality of their supply chains.
Speakers: Angela Coleshill Competitiveness Director, Food and Drink Federation Jane Bevis Chair, OPRL Ltd Isabelle Maddock Group Finance Director James Cropper PLC Julian Freeman Group Sales and Marketing Director, Rigid Containers Ltd
With a mandatory 2050 target for the UK to reduce emissions by 80%, pressure to decarbonise production continues to grow. Added to rapidly increasing energy cost, and a Roadmap charting potential opportunities, there’s a refocused attention on energy efficiency. The speakers in this session will discuss the current energy efficency options and what industry is doing. From a policy perspective, we will find out about Government support, and what additional support is available through the Industrial Energy Efficiency Accelerator and other funds.
Speakers: Paul Nobel Principal Consultant, Sustainable Energy Use Europe, DNV GL Arjan Geveke Assistant Director of Energy Policy, BEIS Ulrika Wising Head of Solar & Battery Storage Macquarie Investment Bank William Hudson Manager, Policy & Innovation The Carbon Trust


PAPERmaking!
FROM THE PUBLISHERS OF PAPER TECHNOLOGY
Volume 5, Number 1, 2019
Events
DITP
PRVA
NAJ
AVA
IN V
ABIL
O ZA
AKT
IVNO
UDE
LEŽB
O
na 4
6. M
edna
rodn
em s
reča
nju
slov
ensk
ega
papi
rniš
tva,
ki b
o le
tos
pote
kalo
pod
nas
lovo
m
“MED
KRO
ŽNIM
, BIO
IN D
IGIT
ALNI
M”
20. –
21.
nov
embe
r 201
9 I
Slo
veni
ja
Tem
e na
leto
šnje
m s
impo
ziju
bod
o z
nasl
ednj
ih p
odro
čij:
> m
oder
na p
ripra
va in
čiš
čenj
e re
cikl
irani
h vla
ken
> te
hnol
oške
nov
osti
pri p
apirn
ih in
kar
tons
kih
stro
jih>
novi
konc
epti
pri p
rem
azov
anju
pap
irja
in k
arto
na>
novi
trend
i v ti
skar
skih
in d
odel
avni
h te
hnik
ah>
mož
nost
i zni
žanj
a po
rabe
ene
rgije
v p
apirn
ištv
u>
upor
abno
st p
apirn
iški
h m
ulje
v in
pep
elov
> šo
lanj
e za
prih
odno
st>
poti
do n
ovih
zna
nj>
pogl
ed tr
žnik
ov n
a sv
etov
ni tr
g pa
pirja
> fin
anci
ranj
e pa
pirn
e in
dust
rije
Pred
stav
niki
indu
strij
e, in
štitu
tov
in u
nive
rz iz
koris
tite
prilo
žnos
t in
se a
ktiv
no u
dele
žite
Si
mpo
zija
•
s pr
edav
anje
m a
li •
s po
ster
jem
Pros
imo
vas,
da
pošl
jete
izvl
eček
pre
dava
nja/
post
ra v
slo
vens
kem
in a
ngle
škem
jezi
ku
(naj
več
25 ti
pkan
ih v
rstic
) naj
kasn
eje
do 1
5. ju
nija
201
9 na
nas
lov:
ditp
@ic
p-lj.
si.
Urad
na je
zika
bost
a sl
oven
ski i
n an
gleš
ki s
sim
ulta
nim
pre
vaja
njem
.
Za o
rgan
izaci
jski
odb
or:
Mar
ko J
agod
ič, u
niv.d
ipl.i
ng.
Vabl
jeni
na
Bled
!
FIRS
T AN
NOUN
CEM
ENT
AND
INVI
TATI
ON F
OR A
N AC
TIVE
PAR
TICI
PATI
ON
at th
e 46
th In
tern
atio
nal M
eetin
g of
Slo
vene
Pap
er In
dust
ry u
nder
the
head
ing
“BET
WEE
N CI
RCUL
AR, B
IO A
ND D
IGIT
AL”
21 –
21
Nove
mbe
r 201
9 I
Slo
veni
a
Topi
cs fr
om th
e fo
llow
ing
area
s:>
mod
ern
prep
arat
ion
and
clean
ing
of re
cycle
d fib
ers,
> te
chno
logi
cal n
ovel
ties
on p
aper
and
pap
erbo
ard
mac
hine
s,>
new
coat
ing
conc
epts
,>
trend
s in
prin
ting
and
finish
ing
tech
nics
,>
poss
ibilit
ies
of re
ducin
g th
e en
ergy
con
sum
ptio
n at
pap
erm
akin
g pr
oces
ses,
> us
abilit
y of
slu
dges
and
ash
es,
> ed
ucat
ion
for t
he fu
ture
,>
ways
to n
ew k
nowl
edge
s,>
com
mer
cial v
iews
on
the
glob
al p
aper
mar
ket,
> fin
ancin
g in
pap
er in
dust
ry.
Repr
esen
tativ
es fr
om th
e in
dust
ry, i
nstit
utes
and
uni
vers
ities
are
invi
ted
to p
artic
ipat
e w
ith
• a
pape
r or
• a
post
er
To p
rese
nt y
our p
aper
/pos
ter y
ou n
eed
to s
end
a sh
ort a
bstr
act i
n En
glis
h (2
5 ty
ped
lines
max
) to
ditp
@ic
p-lj.
si, b
y 15
Jun
e 20
19 a
t the
late
st.
The
offic
ial l
angu
ages
are
Slo
vene
and
Eng
lish
with
sim
ulta
neou
s tra
nsla
tion.
For t
he O
rgan
izing
Com
mitt
ee:
Mar
ko J
agod
ič, B
.Sc.
Wel
com
e to
Ble
d!
Zdru
ženj
e sl
oven
ske
papi
rne
indu
strij
eSl
oven
ian
Cham
ber o
f Com
mer
ce a
nd In
dust
ry -
Pape
r Ass
ocia
tion
Pulp
and
Pap
er E
ngin
eers
and
Tec
hnic
ians
Asso
ciat
ion
of S
love
nia