magnetic resonance imaging (mri) biomarkers of placental
TRANSCRIPT
Magnetic Resonance Imaging (MRI) Biomarkers of Placental
Structure and Function in Normal and Growth Restricted Pregnancy
A thesis submitted to The University of Manchester for the degree of
PhD in the Faculty of Medical and Human Sciences
2012
Dr. Caroline Wright MBBS
School of Medicine

2
List of Contents
Abstract 3 Declaration 4 Copyright 5 Acknowledgements 6 A note about Alternative Format Theses 7 Chapter 1. An introduction to FGR, the Placenta and MRI 8 1.1 Fetal Growth Restriction 9 1.2 The Placenta in FGR 28 1.3 Magnetic Resonance Imaging 44 1.4 Summary and Purpose of Proposed Investigations 70 1.5 Further notes on methodology 72 Chapter 2. MRI Relaxation Time Measurements of the Placenta at 1.5 T 93 2.1 Abstract 98 2.2 Introduction 99 2.3 Methods 102 2.4 Results 108 2.5 Discussion 112 Chapter 3. Potential MRI Biomarkers of the Placenta in FGR 120 3.1 Abstract 121 3.2 Introduction 127 3.3 Methods 119 3.4 Results 135 3.5 Discussion 150 Chapter 4. Arterial Spin Labelling in the Assessment of Placental Perfusion at 1.5 T 158 4.1 Abstract 160 4.2 Introduction 161 4.3 Methods 165 4.4 Results 168 4.5 Discussion 175 Chapter 5. Overall Conclusions and Future Work 179 References 187 Appendix I 199 Appendix II 217
Abstract
Fetal growth restriction (FGR) is a serious complication of human pregnancy where the
fetus fails to reach its genetically pre-determined growth potential. It is a common
condition, affecting 5 -15 % of all pregnancies (Gardosi 2009) and is linked to a third of
all antepartum deaths (CEMACH 2008). An ongoing problem for obstetricians is the
difficulty in diagnosing and predicting FGR and those at highest risk of poor outcomes.
Placental insufficiency is a major cause of FGR and specific abnormalities in placental
morphology and function occur in this condition; constituting an abnormal FGR placental
phenotype (Sibley, Turner et al. 2005). Magnetic Resonance Imaging (MRI) is a powerful
tool that allows quantitative analysis of several indices relating to tissue structure and
function and, therefore, is of potential use in identifying this phenotype. We hypothesised
that a range of MR indices would be feasible in the placenta at 1.5 T, that these indices
would be altered in FGR and that there would be correlations with relevant parameters of
placental morphology. Ultimately, we aimed to assess whether these indices could be used
in the assessment of FGR in utero.
Using MRI we estimated placental volume, widths, length and depths in groups of women
with normal and FGR pregnancies. We also measured placental relaxation times, T1 and
T2, which relate to tissue composition and assessed parameters relating to blood flow using
Intra-Voxel Incoherent Motion (IVIM) and Arterial Spin Labelling (ASL). We
demonstrated an FGR placental phenotype that was reduced in volume but increased in
depth, by around 10mm, with a shorter T2 relaxation time and lower values of D (the
diffusion coefficient) measured by IVIM. A trend for reduced perfusion measured by ASL
was observed in pregnancies with birthweights less than 10th centile (Gardosi, Chang et al.
1992). T2 and D also correlated with stereological indices of placental morphology.
In conclusion, the studies in this thesis illustrate these MRI indices show great potential as
biomarkers for identifying the FGR placenta

Declaration
No portion of the work referred to in the thesis has been submitted in support of an
application for another degree or qualification of this or any other university or other
institute of learning.

5
Copyright
The author of this thesis (including any appendices and/or schedules to this thesis) owns
certain copyright or related rights in it (the “Copyright”) and she has given The University
of Manchester certain rights to use such Copyright, including for administrative purposes.
Copies of this thesis, either in full or in extracts and whether in hard or electronic copy,
may be made only in accordance with the Copyright, Designs and Patents Act 1988 (as
amended) and regulations issued under it or, where appropriate, in accordance with
licensing agreements which the University has from time to time. This page must form
part of any such copies made.
The ownership of certain Copyright, patents, designs, trade marks and other intellectual
property (the “Intellectual Property”) and any reproductions of copyright works in the
thesis, for example graphs and tables (“Reproductions”), which may be described in this
thesis, may not be owned by the author and may be owned by third parties. Such
Intellectual Property and Reproductions cannot and must not be made available for use
without the prior written permission of the owner(s) of the relevant Intellectual Property
and/or Reproductions.
Further information on the conditions under which disclosure, publication and
commercialisation of this thesis, the Copyright and any Intellectual Property and/or
Reproductions described in it may take place is available in the University IP Policy (see
http://www.campus.manchester.ac.uk/medialibrary/policies/intellectual-property.pdf), in
any relevant Thesis restriction declarations deposited in the University Library, The
University Library’s regulations (see
http://www.manchester.ac.uk/library/aboutus/regulations) and in The University’s policy
on presentation of Theses.

6
Acknowledgements
This work was funded by the Medical Research Council, UK and by the Wellcome Trust
(Clinical Research Training Fellowship to Caroline Wright). The work was also supported
by the Manchester NIHR Biomedical Research Centre. All MRI Scans were performed at
the Wellcome Trust Clinical Research Facility, University of Manchester and particular
thanks go to the research radiographers there for all their advice and support. Many thanks
also to the women who participated in the study and, for their assistance in recruiting and
retaining participants, the staff at St. Mary’s Hospital, Central Manchester University
Hospitals NHS Foundation Trust, Manchester. Very special thanks go to Dr David Morris
who has been the much needed other half in this project, offering MR physics expertise
and being responsible for the development of the MR scan protocols.
I would like to thank individually my supervisors for their ongoing patience and support
with this project. Prof. Philip Baker who has always offered great advice and guided me in
my academic career. Dr Ian Crocker for his support with scientific writing and placental
analysis (with Prof. Terry Mayhew, who kindly took the time to teach us both the
stereological techniques needed for this project when we visited him in Nottingham). Prof.
Penny Gowland for her advice with in the early stages of this project and Prof. Geoff JM
Parker for the ongoing MR physics expertise. In particular I wish to thank Prof. Colin
Sibley who has been a superb example to me as has enabled me to develop personally and
professionally under his guidance.

7
A note on Alternative Format Theses
The Alternative Format thesis allows a postgraduate doctoral to incorporate sections that
are in a format suitable for submission for publication in a peer-reviewed journal. Apart
from the inclusion of such materials, the alternative format thesis must conform to the
same standards expected for a standard thesis. Materials included in the alternative format
thesis may include those which are solely and/or partly authored by the student and may
be already published, accepted for publication, or submitted for publication in externally
refereed contexts such as journals and conference proceedings. The work must constitute a
body of publication tending towards a coherent and continuous thesis, rather than a series
of disconnected publications. As such, any publications should be adapted and integrated
within the structure of the thesis. Any sections of the thesis which are published or in
publishable format should be clearly identified. The incorporation of publication-style
chapters in the thesis will inevitably lead to some duplication since each publication-style
chapter will have self-contained components that will overlap with parts of the other
sections of the thesis.
My reasons for wishing to submit in this format were that the body of work naturally falls
into chapters that are also transferable to original research papers. Therefore, the thesis
will be written in a very similar way in an alternative format as it would have been in a
classical format and the readability is maintained. I also felt that aiming to have each
chapter written as a research paper would improve my writing skills and those chapters
submitted as papers prior to thesis submission would benefit from the feedback of peer
review, particularly as much as the work is novel and exploratory in nature. Completing
article submission to peer reviewed journals has been a great learning experience and
helped me focus on which aspects of the work are of greatest interest to the reader and
researcher.

8
Chapter 1
Introduction to Fetal Growth Restriction (FGR), the Placenta and
Magnetic Resonance Imaging (MRI)
9
1.1 Fetal Growth Restriction
Fetal growth restriction (FGR) is a serious complication of human pregnancy where the
fetus fails to reach its genetically pre-determined growth potential. It is a common
condition, affecting 5 -15 % of all pregnancies (depending on definition used) (Gardosi
2009) and is linked to a third of all antepartum deaths (CEMACH 2008). Growth
restricted infants are at increased risk of a number of neonatal morbidities (Gilbert and
Danielsen 2003), often worsened by iatrogenic prematurity. In addition, serious
neurological sequelae, such as cerebral palsy, are more common (Jarvis, Glinianaia et al.
2003) along with behavioral and emotional problems in childhood (Zubrick, Kurinczuk et
al. 2000). Small size at birth also predisposes the infant to major diseases in adult life,
such as diabetes, hypertension and cardiovascular disease (Hales, Barker et al. 1991;
Leon, Lithell et al. 1998).
An ongoing problem for obstetricians is the difficulty in predicting, detecting and
diagnosing FGR, as well as predicting fetal outcome. Ultrasound biometry of fetal size
may not always be able to distinguish the fetus that is growth restricted, from one that is
constitutionally small and may also miss those whose growth is failing but fetal size
remains within normal limits. Although the use of ultrasound Doppler in the uterine and
umbilical circulations has been described in over 200 investigations of uteroplacental
disease, no sufficiently predictive test for FGR has been established.
1.1.1 Consequences of FGR
The association of FGR with stillbirth and neonatal death is well established. A fetus with
growth restriction is at risk for sudden unexplained intrauterine death [odds ratio 7.0]
(Froen, Gardosi et al. 2004). The severity of growth restriction is directly related to an
10
increased risk of fetal death (Kramer, Olivier et al. 1990), a relationship that holds true
regardless of gestational age (Piper, Xenakis et al. 1996).
The perinatal mortality rate is higher among both term and preterm FGR infants, Lackman
et al. (Lackman, Capewell et al. 2001) reported a 5 to 6-fold increased rate of death among
both term and preterm infants with FGR, McIntire et al. (McIntire, Bloom et al. 1999)
reported up to a 10-fold increase rate of death in growth-restricted infants at term. SGA
infants are also at increased risk of morbidity, including low Apgar scores, seizures,
hypoxic ischaemic encephalopathy, hypothermia, hypoglycaemia, hypocalcaemia,
polycythaemia, sepsis, coagulopathy and hepatocellular dysfunction (Pallotto and Kilbride
2006). These are often secondary to prematurity (Lackman, Capewell et al. 2001), as early
delivery may be required for maternal or fetal health reasons. Premature infants that are
small, as opposed to average for gestational age, appear to be most at risk, with higher
rates of serious complications such as respiratory distress syndrome and chronic lung
disease (Tyson, Kennedy et al. 1995; Regev, Lusky et al. 2003).
Long term follow up of SGA infants suggests there are health implications lasting into
childhood, with poor growth (Karlberg and Albertsson-Wikland 1995) and academic
under-achievement (Strauss 2000), although this does not outweigh the more important
influence of socioeconomic status (Goldenberg, Hoffman et al. 1998). Serious
neurological sequelae, such as cerebral palsy are seen more commonly in SGA infants
(Jarvis, Glinianaia et al. 2003) and there are less conclusive associations with behavioral
and emotional problems in childhood (Zubrick, Kurinczuk et al. 2000).
A growing body of evidence has indicated that many major diseases of adulthood e.g.
coronary heart disease, hypertension and type 2 diabetes - are associated with low
birthweight (Barker, Osmond et al. 1989; Hales, Barker et al. 1991; Leon, Lithell et al.
11
1998). These associations extend across into the normal range of birthweights and depend
on low birth weight in relation to gestation rather than prematurity (Barker, Gluckman et
al. 1993). Such findings have led to the ‘developmental origins of adult disease’
hypothesis, which states that our susceptibility to such diseases is programmed in utero as
a response to the fetal environment (Barker 1995), thought to occur through processes of
developmental plasticity and epigenetic modification. A concept of predictive adaptation
has also been developed to explain the relationship between early life events and the risk
of later disease. The model suggests that a mismatch between fetal expectation of its
postnatal environment and actual postnatal environment contribute to later adult disease
risk (Gluckman, Hanson et al. 2005). Both concepts are important in our understanding of
how FGR impacts upon health well beyond the perinatal period.
1.1.2 Definitions
Normal fetal growth is determined by a genetically predetermined growth potential and
modulated by maternal, fetal, placental, and external factors. Fetal Growth Restriction
(FGR) is defined as a condition in which the fetus fails to achieve its own genetically
determined growth potential and may be secondary to a number of causes. However, as
the genetic growth potential is often not known, FGR can in practice be difficult to
diagnose, which has led to a variety of alternative terms and definitions being used in the
literature. Small for gestational age or SGA (usually defined as a birthweight less than the
10th percentile for gestational age) is often used as a proxy, but it is important to stress
that the terms are not synonymous. Although FGR and SGA are often diagnosed
antenatally, indirect assessments of fetal size, usually made using ultrasound, are subject
to a range of errors and confirmation after delivery is required. Antenatal definitions are,

12
nevertheless, necessary for clinicians, to guide management decisions that must be made
prior to delivery. Correct assessment of fetal growth is also reliant upon accurate
pregnancy dating, where first trimester ultrasound is a better predictor of gestational age
than using the last menstrual period dates alone (Campbell and Thoms 1977).
Common terms and definitions used in the literature to define FGR include;
Determined antenatally;
1) Estimated fetal weight (EFW) generated by ultrasound biometric measurements of less
than the 3rd, 5th, 10th or 15th percentile for gestational age or 2 standard deviations below
the mean for gestational age.
2) Fetal abdominal circumference less than two standard deviations below the mean for
gestational age determined by ultrasound.
Determined after birth;
1) Small for gestational age (SGA) - a newborn with a birthweight below the 3rd, 5th,
15th but generally 10th percentile for gestational age.
2) Low birthweight infants – a birthweight regardless of gestation of less than 2500g (very
low birthweight less than 1500g or extremely low birthweight less that 1000g).
3) Individualised birthweight ratio (IBR) or centile of less than the 5th or 10th percentile.
This is relative to predicted birthweight (calculated using gestational age to delivery,
parity, ethnic origin, height, booking weight and fetal sex).
4) Ponderal index (weight divided by cube of length) of below the 10th percentile for
gestational age.
13
The situation is further complicated as the percentile given may be based upon a
birthweight reference, representative of an entire population, or a birthweight standard,
which limits the population to those births that have optimal outcomes. More recently, it
has been recognised that additional factors such as maternal height, weight, ethnicity,
parity and fetal gender should perhaps also be accounted for, rather than gestational age
alone (whole population based). This has led to the introduction of ‘customised growth
charts’ in clinical practice and the increased use of the IBR in research practice. Both have
an improved correlation with fetuses at risk of poor perinatal outcomes (Wilcox, Johnson
et al. 1993; Clausson, Gardosi et al. 2001). Compared to whole population based charts,
customised growth charts have better sensitivities for identifying SGA fetuses (Gardosi,
Chang et al. 1992), identifying morphometric evidence of FGR (Sanderson, Wilcox et al.
1994) and have lower false-positive rates (Mongelli and Gardosi 1996). The use of
customised growth charts has raised some controversies regarding improvement of
outcome, however, they are now recommended in the UK by the Royal College of
Obstetricians and Gynaecologists (Gynaecologists 2002). Post-delivery, definitions
involving the IBR probably relate most closely to true FGR. In a study of 616 infants, an
IBR less than the 10th percentile reclassified 25% of those less than the 10th percentile of
birthweight for gestation as normal (Sanderson, Wilcox et al. 1994). In the infants that
remained classified as small, significantly more infants had abnormal ponderal indices and
reduced skin fold thicknesses, suffered abnormal fetal heart rate patterns, underwent
operative delivery for fetal distress and required neonatal resuscitation than those who
were reclassified as normally grown.
Doppler flow studies, most commonly of umbilical blood flow, are also often included in
research definitions of FGR. FGR may, however, occur in the absence of abnormal
umbilical artery Dopplers. SGA infants without abnormal umbilical artery Dopplers
remain at risk of poor perinatal and neurodevelopmental outcomes (Figueras, Eixarch et
14
al. 2007) although numerous studies confirm that groups with abnormal Dopplers are at
highest risk of adverse perinatal outcomes, particularly perinatal death (Thornton and
Lilford 1993). A significant association also exists between abnormal Doppler indices and
fetal acid-base compromise in FGR. One study reported that 67% to 80% of the fetuses
were hypoxic and 45% were acidotic when absent end-diastolic flow was present
(Nicolaides, Bilardo et al. 1988). The absence or reversal of end-diastolic flow is known to
be associated with very poor perinatal outcomes and a high perinatal mortality rate
(Nicolaides, Bilardo et al. 1988) (Karsdorp, van Vugt et al. 1994). Doppler studies of
umbilical flow therefore provide an indication of the severity of FGR, but are not a
compulsory component of the definition.
An appreciation of the difficulties in defining and diagnosing FGR is important when
considering the literature surrounding this condition, as study groups often comprise of
relatively heterogenous populations. More rigorous definitions of FGR, perhaps based on
the abnormalities of placental structure and function seen, would offer advantages from
both clinical and research viewpoints.
1.1.3 Causes of FGR
When discussing causes of FGR, the definition used is relevant. An infant that is small for
gestational age may be constitutionally small or have failed to reach its genetic growth
potential i.e. true FGR. By using any of the definitions given in the previous section, it is
virtually impossible to completely separate the two, leading to heterogeneous groups that
include small but healthy infants.
15
For truly growth restricted infants, who have failed to reach their genetically determined
growth potential, placental insufficiency is the major cause. Specific placental
abnormalities, such as a single (rather than double) uterine artery, are found in the
minority (Catanzarite, Hendricks et al. 1995). Generally, the diagnosis is made on the
basis of exclusion of other causes or antenatal tests suggesting poor placental function e.g.
abnormal uterine artery Dopplers or oligohydramnios. Causes often regarded as ‘non-
placental’ may also indirectly affect placental function, for example trisomy 18 babies
frequently exhibit asymmetrical growth restriction with abnormal uteroplacental Dopplers
(Kennerknecht and Terinde 1990).
Causes and associations can be broadly categorised into three groups (adapted from
(Sabogal 2007):
Fetal:
• Genetic diseases (5% to 20%) (e.g., aneuploidy, uniparental disomy, growth factor
mutations, etc.)
• Infection (5% to 10%) (e.g., CMV, toxoplasmosis, malaria, rubella)
• Malformations (1% to 2%)
• Multiple gestation (3%)
Uteroplacental:
• Placental insufficiency
• Placental /cord abnormalities (3%) (abruption, mosaicism, chorioangiomas, 2 vessel
cord, velamentous insertion, etc.)
• Uterine abnormalities
Maternal:

16
• Hypertensive disorders (20% to 30%)
• Pre-gestational diabetes
• Autoimmune disease (e.g., APS, SLE)
• Cardiac disease (e.g., complex cyanotic congenital heart diseases)
• Other maternal diseases (especially if poorly controlled)
• Toxic exposure (smoking, alcohol, cocaine, drugs)
• Malnutrition
• Living at high altitudes
• Living in developing country
• Low socio-economic status
• Race (e.g., Afro-American)
• Family or prior history of FGR
• Extremes of maternal age
• Short inter-pregnancy interval
1.1.4 Predicting FGR
FGR is a serious condition with poor outcomes. Currently, a sufficiently predictive test for
the condition is not available. Although many epidemiological associations are described,
few are particularly strong. In a study of 8030 deliveries, 2788 women with risk factors
17
and 292 representative women from the group with no risk factors were analysed in detail
(Galbraith, Karchmar et al. 1979). One third of FGR infants came from a population with
no risk factors and only 9.8% of women with risk factors delivered an SGA infant, leaving
the vast majority with an average sized infant. Pre-eclampsia and smoking remain major
risk factors for SGA; pre-eclampsia is associated with a 4-fold increase in the risk of
having a small for gestational age infant (Odegard, Vatten et al. 2000), whilst maternal
cigarette smoking leads to an average birth weight reduction of 6% when continued
throughout gestation (Cliver, Goldenberg et al. 1995).
It is of course important that clinicians are aware of the risk factors, so that they may
advise women on risk reduction and look for warning signs of disease. However, given
that so many cases of FGR occur in groups with no risk factors and most women with risk
factors will have a normal outcome, such factors cannot be used as a predictive test in
practice.
There are over 150 publications examining the role of Doppler assessment of blood flow
in the uteroplacental vessels, primarily the uterine arteries, in the prediction of FGR and
pre-eclampsia. A recent meta-analysis of 61 studies (in which Doppler assessment of the
uterine arteries was used to predict FGR), evaluated the accuracy of 15 Doppler indices,
using well-described and robust statistical methods (Cnossen, Morris et al. 2008). FGR in
low-risk patients was best predicted in the second trimester by an increased pulsatility
index with notching (positive likelihood ratio 9.1, 95% CI 5.0–16.7; negative likelihood
ratio 0.89, 95% CI 0.85–0.93). Severe FGR in low-risk patients was best predicted in the
second trimester by an increased pulsatility index (positive likelihood ratio 13.7, 95% CI
10.3–16.9; negative likelihood ratio 0.34, 95% CI 0.23–0.48) or an increased pulsatility
index with notching (positive likelihood ratio 14.6, 95% CI 7.8–26.3; negative likelihood
ratio 0.78, 95% CI 0.68–0.87). An increased resistance index (> 0.58 or > 90th percentile)
18
in the second trimester best predicted severe fetal growth restriction in high-risk patients
(positive likelihood ratio 10.9, 95% CI 10.4–11.4; negative likelihood ratio 0.20, 95% CI
0.14–0.26). One of the challenges of conducting a review in this area is the variability in
definitions of FGR, aetiologies included and varying approaches to management. In
addition, the studies are heterogeneous in their timing of Doppler assessment and
inclusion of other screening methods. This said, although the positive likelihood ratios of
these data are reasonable, the negative likelihood ratios are poor, therefore we cannot be
reassured that women with negative results are less likely to develop FGR. Although
improvements are seen in higher risk populations, this negates the use of uterine artery
Doppler as a screening test for FGR in a low-risk population.
In addition to uterine artery Doppler ultrasonography, a variety of proteins and hormones
have been studied as potential early biomarkers of FGR. Low first trimester PAPP-A
levels are associated with low birth weight, but studies of first and second trimester AFP,
hCG and inhibin-A have shown a less consistent picture (Yaron, Cherry et al. 1999;
Spencer, Yu et al. 2005). Second-trimester maternal serum screening markers for
aneuploidy (the presence of an abnormal number of chromosomes), human chorionic
gonadotropin (-hCG) and -fetoprotein have been shown to be associated with increased
risk (Raty, Koskinen et al. 1999; Yaron, Cherry et al. 1999). Multiple combinations of
these biochemical tests and uterine artery Dopplers have been attempted, but as yet no
sufficiently predictive test for use in low-risk pregnancy has been established. A profile of
placental function may, however, be of value to screen pregnancies that are clinically
judged to be at increased risk of preeclampsia, fetal death, and FGR (Whittle, Chaddha et
al. 2006). Kingdom et al. have adopted this approach, finding that in 212 high-risk
pregnancies assessed using a placental profile (combining a)16- to 18-week maternal
serum screening, b)18- to 23-week uterine artery Doppler imaging and c) ultrasound
assessment of placental morphologic condition), the development of adverse outcomes,
19
such as SGA, severe early onset FGR and intrauterine fetal death, were significantly less
in women with all normal test results. Combining groups of women with two or 3
abnormal test results together predicted 14 of 19 severe FGR and 15 of 22 IUFD cases
(Toal, Chan et al. 2007). These results combining tests of placental function, rather than
relying on ultrasound alone is useful in stratifying risk in FGR. The investigation of other
tools, such as placental MRI, in important in this concept. The SCOPE (Screening of
Pregnancy Endpoints) Consortium has fully adapted the approach that using a
combination of various clinical, imaging and chemical markers is likely to provide the
most effective screening for conditions such as FGR. In 2009 they published on patterns
of uterine artery Doppler and pregnancy outcome (Groom, North et al. 2009) and in 2010
again published on risk factors relating to FGR including a number of lifestyle factors and
the previously reported associations with abnormal uterine artery Dopplers at 20 weeks
gestation (McCowan, Roberts et al.). Both studies concluded that a range of markers,
including biochemical parameters not included in these studies, were most likely to
provide effective predictive testing for FGR. The SCOPE consortium as a whole takes a
novel approach, recruiting large numbers of women from a group of centres across the
globe. Using this approach, they aim to build on current knowledge by investigating more
novel markers identified by use of proteomic, metabolomic and genomic techniques.
Although the full outcomes of this research in relation to FGR are yet to be reported, a
number of important associations have already been identified in other related diseases,
such as pre-eclampsia (Atkinson, Blumenstein et al. 2009; Blumenstein, McMaster et al.
2009).
1.1.5 Diagnosis of FGR
Clinical examination is most commonly by symphysis-fundal height (SFH) measurement,
although the technique is associated poor intra and inter-observer reproducibility and a
20
lack of account for physical build and abnormalities such as fibroids or abnormal fetal lie.
Studies conducted in the 1980s suggested that reduced SFH measurements correctly
identified only 25-50% of fetuses whose birthweight was <10th percentile; a frightening
statistic when considering that for most women, this is their route of entry to ultrasound
surveillance (Pearce and Campbell 1987).
Again, it is important to stress that accurate pregnancy dating is a pre-requisite for
accurate growth assessment and can lead to difficulties in ‘late-bookers’ who miss the
window (late first or early second trimester) for sonographic assessment of gestation.
Growth parameters, primarily biparietal diameter (BPD), head circumference (HC), femur
length (FL) and abdominal circumference (AC) are plotted on charts which delineate the
normal range of growth within a population. These values can also be combined to plot an
estimated fetal weight (EFW), where the predicted weight will fall within 15 -18% of the
actual weight in 95% of cases (Hadlock, Harrist et al. 1985). As discussed earlier, attempts
to improve identification of true FGR has led to the introduction of customised growth
charts of EFW.
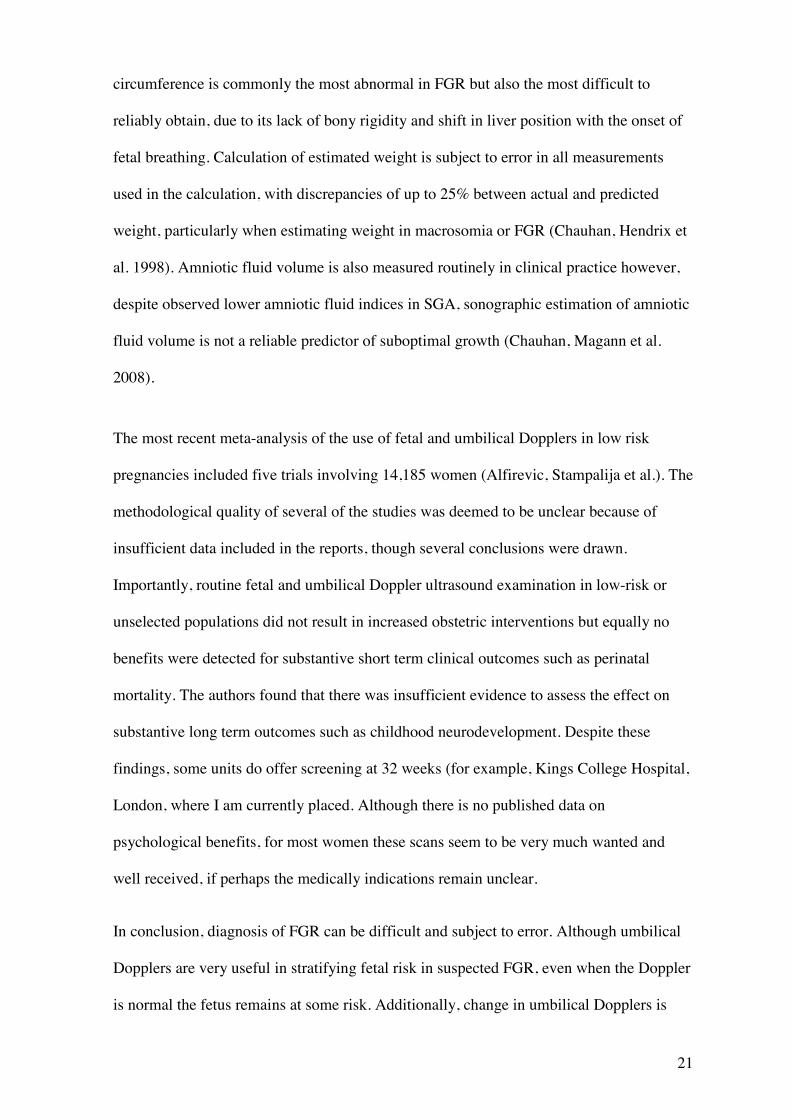
Even using the best available charts, there are other difficulties in sonographic
surveillance of growth. Fetal growth is a dynamic process, whereas ultrasound examines
the fetus at isolated time points. While a single ultrasound measurement may be an
indication of a problem, this does not itself diagnose a growth abnormality. Successive
measurements are required, however depending upon the start and end-points used and
frequency of assessment, FGR could still be missed. False reassurance may also be gained
from isolated measurements where the parameters plot within the normal range, but in fact
growth is failing. This is illustrated in Chapter 1 Figure 1.
Furthermore, a degree of error lies within the measurements themselves. Abdominal
21
circumference is commonly the most abnormal in FGR but also the most difficult to
reliably obtain, due to its lack of bony rigidity and shift in liver position with the onset of
fetal breathing. Calculation of estimated weight is subject to error in all measurements
used in the calculation, with discrepancies of up to 25% between actual and predicted
weight, particularly when estimating weight in macrosomia or FGR (Chauhan, Hendrix et
al. 1998). Amniotic fluid volume is also measured routinely in clinical practice however,
despite observed lower amniotic fluid indices in SGA, sonographic estimation of amniotic
fluid volume is not a reliable predictor of suboptimal growth (Chauhan, Magann et al.
2008).
The most recent meta-analysis of the use of fetal and umbilical Dopplers in low risk
pregnancies included five trials involving 14,185 women (Alfirevic, Stampalija et al.). The
methodological quality of several of the studies was deemed to be unclear because of
insufficient data included in the reports, though several conclusions were drawn.
Importantly, routine fetal and umbilical Doppler ultrasound examination in low-risk or
unselected populations did not result in increased obstetric interventions but equally no
benefits were detected for substantive short term clinical outcomes such as perinatal
mortality. The authors found that there was insufficient evidence to assess the effect on
substantive long term outcomes such as childhood neurodevelopment. Despite these
findings, some units do offer screening at 32 weeks (for example, Kings College Hospital,
London, where I am currently placed. Although there is no published data on
psychological benefits, for most women these scans seem to be very much wanted and
well received, if perhaps the medically indications remain unclear.
In conclusion, diagnosis of FGR can be difficult and subject to error. Although umbilical
Dopplers are very useful in stratifying fetal risk in suspected FGR, even when the Doppler
is normal the fetus remains at some risk. Additionally, change in umbilical Dopplers is

22
often late in the disease, so that ongoing fetal surveillance is required through the
pregnancy. Ideally, a more predictive test of FGR and fetal outcome would be available.
Until this is established, it is important that research continues into other potential
candidates, including biochemical tests and other imaging modalities, such as MRI.
23
Chapter 1 Figure 1. Graph showing theoretical pitfalls of ultrasonographic biometry
and estimation of fetal weight. Gestation is plotted in weeks on the x axis against
estimated fetal weight in grams. AGA is average for gestational age in size, SGA is
small for gestational age in size. AGP is average for gestational age in phenotype
FGRP is FGR phenotype. Average sized infants whose growth is failing may not be
picked up, whereas small but normal infants may face unnecessary intervention.
24
1.1.6 Management of FGR
Our methods identifying the growth restricted fetus antenatally are not ideal. Using
standard care, only 26% of SGA babies were suspected to be small before birth in an
unselected hospital population (Hepburn and Rosenberg 1986). In a low-risk population in
Nottingham, only 16% of SGA infants were detected with standard methods of antenatal
assessment (Hepburn and Rosenberg 1986; Kean, Liu et al. 1996). Identifying FGR is
crucial to the management of disease. As no intervention has yet been demonstrated to
alter the growth pattern of the fetus, management is reliant upon surveillance and
appropriate delivery in terms of time, mode and location. Timing of delivery is
individualized, as yet no randomized controlled trial has fully elucidated the optimal time
frame and no national or international guidelines are in place, however, from the literature
available a system of best care can be derived.
The Growth Restriction Intervention Trial (2003) was a prospective randomized
multicenter study of over 500 women with pregnancies (24 to 36 weeks gestation)
complicated by FGR. Patients were randomly assigned to immediate versus delayed
delivery based on physician discomfort. The median time-to-delivery intervals were 0.9
days in the immediate groups and only 4.9 days in the delay group. Total deaths before
discharge were 10% in the immediate group and 9% in the the delay group. Essentiall, no
differences in short-term outcomes were observed but immediate delivery was associated
with higher neonatal mortality while delayed delivery carried the price of a higher
stillbirth rate. However, follow up studies demonstrated there may be further impact on
long term neurodevelopment outcomes, assessed at 2 years of age or beyond (Thornton,
Hornbuckle et al. 2004). The greatest difference in disability was seen in babies
randomised before 31 weeks gestation; 14% in the immediate group versus 5% in the
delayed group. Based on these studies it was concluded that safe prolongation of
25
pregnancy offers the best combination of decreased perinatal mortality, morbidity, and
improved neurodevelopment. In terms of mode of delivery, one third of FGR pregnancies
requires caesarean delivery (Group 2003), but again choice is individualized. Elective
caesarean did not show statistically significant differences in poor outcomes such as
respiratory distress syndrome and seizures although trends were towards this (Grant
2003). Delivery in a tertiary level neonatal unit is often indicated, so that staff and
facilities for appropriate resuscitation and stabilisation are available.
The DIGITAT trial (Disproportionate Intrauterine Growth Intervention Trial at Term) was
designed to compare the effect of induction of labour with expectant monitoring on
neonatal outcome and operative delivery rates in suspected growth restriction at term
(beyond 36 weeks) (Boers, Vijgen et al.). FGR was defined as abdominal circumference
<10th centile, estimated fetal weight <10th centile or a tailing off across the centiles. 321
were randomized to induction and 329 to expectant monitoring, which led to delivery
around 10 days later. Birthweights were lower in the induced group, however, the number
of babies born with birthweights less than the 3rd centile was significantly higher in the
expectant group (30% vs 12%). A composite neonatal outcome combining death before
discharge, Apgar Score, umbilical artery pH and admission to neonatal intensive care was
used to assess fetal outcome. There was no significant difference in poor outcomes
between the expectant group as compared to the induction group (6% vs 5%) and no
difference in caesarean rates (45% both groups). The study concluded that expectant
management for women is a equivocal options as long as fetal monitoringis used (here
daily movement counts, twice weekly CTG and ultrasound were employed). A caution
however is that the maternal age of this group was 27 and there was a tendency for older,
more educated women not to participate. Customised growth charts were not used and
therefore perhaps many of these particiapants would have been reclassified as normal,
which may affect the generalisability of the results, particularly in the UK where these
26
have been widely adopted. Nevertheless, the high proportion of infant less than the 3rd
centile in the expectant group does support that this remains a viable option for presumed
FGR at term.
Further guidance is awaited from the results of the TRUFFLE study (Trial of umbilical
and fetal flow in Europe) (Lees). This multicentre study is aimed at defining optimal
timing of delivery between 26 and 32 weeks with women randomised to delivery based on
cardiotocograph changes (primarily reduced short term variability) or on early of late
changes in blood flow in the ductus venosus (the vessel carries oxygenated blood in the
fetus before birth) i.e increased pulsatility index or loss of ‘a-wave’. This study will look
at both short term and long term outcomes at 2 years and hopefully guide clinicians
towards best practice.
The most recent meta-analysis on the use of fetal and umbilical Dopplers in high risk
pregnancies has continued to support their use, however, high quality evidence is lacking
and particularly in relation to FGR/SGA pregnancies (Alfirevic, Stampalija et al.).
Eighteen completed studies involving just over 10,000 women were included. The use of
Doppler ultrasound in high-risk pregnancy was associated a reduction in perinatal deaths
(risk ratio (RR) 0.71, 95% confidence interval (CI) 0.52 to 0.98, numbers needed to treat =
203; 95%CI 103 to 4352). There were also fewer inductions of labour (average RR 0.89,
95% CI 0.80 to 0.99) and fewer caesarean sections (RR 0.90, 95% CI 0.84 to 0.97). No
difference was found in operative vaginal births (RR 0.95, 95% CI 0.80 to 1.14 nor in
Apgar scores less than seven at five minutes (RR 0.92, 95% CI 0.69). Only 7 studies
focused on FGR specifically and the authors concluded that there was insufficient data in
this sub group to say whether Doppler ultrasound has differential effect depending on the
indication e.g. IUGR, hypertension or previous pregnancy loss.
27
1.1.7 Conclusion
Currently our methods for detecting the fetus at risk of FGR are not sufficient and may
miss those at risk or lead to intervention in the small but normal fetus. An objective and
more sensitive assessment of distinguishing the fetus with normal or abnormal growth
would have enormous utility in guiding antenatal care, improving neonatal outcomes and
focusing research. The placenta is of key importance in the pathophysiology of FGR,
however in current practice, few tests relating to placental structure or function have been
developed. New approaches such as 3D power ultrasound and angiography as well as MRI
may allow non-invasive testing of these parameters. Three-dimensional power Doppler
angiography (3-DPDA) facilitates the demonstration of blood vessels within an organ and
provides a noninvasive method for the assessment of placental vasculature in humans in
vivo (Campbell 2007). The power Doppler data within any three-dimensional (3-D)
dataset can be processed to provide indices that represent the power Doppler signal,
although the exact relationship to true blood flow is not clear, as for several MRI
parameters in development. 3D Doppler indices such as the vascular index and vascular
flow index have been shown to be altered in FGR (Pomorski, Zimmer et al.)and may
correlate more closely than traditional 2D parameters (Luria, Barnea et al.). MRI however
has some advantages over ultrasound; primarily the field of view is not limited by the size
of the probe allowing whole placental imaging with ease. It is also not limited by reduced
liquor volume, shadowing from ossification or obesity, which can prevent adequate
assessment using ultrasound. However, MRI is costly and it’s use in pregnancy is much
more limited which may hinder it’s development for use in FGR. Advanced ultrasound
and MRI techniques are at a similar stage of development in relation to FGR; it seems
likely that both may have a role to play but the exact nature of those roles is yet to be fully
determined.
28
1.2 The Placenta in FGR
1.2.1 Placental phenotypes
Placental insufficiency is a major cause of FGR and understanding how the placenta
differs in this condition is crucial in realising how tools such as MRI might be useful in
identifying the disease.
The placenta represents the key interface between the mother and fetus and is the organ by
which nutrient transfer and gaseous exchange occurs. Placental insufficiency is a major
cause of FGR and increasing evidence supports that several aspects of placental structure
and function are altered in the condition, including gross morphology, morphometric
assessments of tissue structure at a microscopic level, blood flow in the uteroplacental
circulations and molecular transport mechanisms for ions and nutrients. This constellation
of specific abnormalities has been proposed as a representation of a placental phenotype of
FGR (Sibley, Turner et al. 2005). In the mouse, a placental specific knockout of a single
imprinted gene, encoding Insulin-like Growth Factor-2 (IGF-2), leads to a combination of
placental alterations similar to those seen in human FGR (Constancia, Hemberger et al.
2002; Sibley, Coan et al. 2004). In this mutant mouse, placental weight is reduced prior to
the onset of fetal growth restriction, supporting a causal relationship (Constancia,
Hemberger et al. 2002). Although a single gene or even the IGF pathway alone is unlikely
to be responsible for FGR as we see it in humans, a rigorously defined placental
phenotype might help both in defining FGR and distinguishing it from other growth
patterns, such as the constitutionally small baby.
29
1.2.2 Pathophysiology of placental insufficiency
Although FGR is rarely detected in the first half of pregnancy, abnormal placentation
during this period is relevant to the pathophysiology of FGR. Understanding the
pathophysiology of placental insufficiency is important in our appreciation of how we are
most likely to detect FGR and at what gestation.
Placentation begins with implantation of the blastocyst beneath the uterine epithelium and
subsequent differentiation into embryonic and extra-embryonic components. The placenta
begins as cytotrophoblast, separated initially from maternal tissue by a shell of
syncytiotrophoblast. Following implantation, cytotrophoblast begins to penetrate outside
this shell in columns with cells breaking off to invade the uterine stroma, forming an
extra-villous cytotrophoblast cell linage (Benirschke 2000). (The remaining columns
differentiate into villous cytotrophoblast, where proliferating cells fuse to form an
overlying syncytiotrophoblast (Huppertz, Tews et al. 2001)). Extra-villous cytotrophoblast
is thought to play a key role in forming plugs in the maternal spiral arteries preventing
blood flow into the intervillous space, therefore providing a hypoxic drive for ongoing
fetal angiogenesis within the developing placenta (Kaufmann, Black et al. 2003). This
process is important in determining eventual placental size and shape; inadequate
endovascular occlusion below the area destined to form the placenta could lead to
excessive placental regression in the early second trimester, such that a previously central
cord insertion becomes eccentric or even velamentous, often seen in FGR (discussed in
next section).
At the end of the first trimester, the endovascular plugs disappear, maternal blood reaches
the placental villi, and oxygenation of the whole placenta occurs. Extravillous trophoblast
cells also surround the spiral arteries where they replace the muscularised vascular walls
30
with a deposition, creating dilated channels conducting blood to the intervillous space
(Lyall, Bulmer et al. 2001). The extra-villous trophoblast invades arteries in the inner
myometrium to a depth of 3 to 5 mm. This is reduced to about 2 mm in pregnancies
complicated by pre-eclampsia (Kadyrov, Schmitz et al. 2003) , possibly due to the
persistence of maternal leukocytes in the decidua secreting pro-apoptotic cytokines
(Reister, Frank et al. 2001). Pregnancy therefore normally results in a low pressure high
flow system into the placenta, however pregnancies complicated by FGR often have
persistent high resistance, as evidenced by abnormal uterine artery Doppler waveforms
(Cnossen, Morris et al. 2008). Although for some time this was largely thought to be
secondary to the deficient invasion of the maternal vasculature, more recent evidence
(from Power Doppler studies and post partum uterine vascular casts) has suggested that
during the second trimester, blood flow to the intervillous space remains limited (Schaaps,
Tsatsaris et al. 2005). The currently favoured explanation is that the interstitial
extravillous trophoblast cells also secrete angiogenic and vasodilator signals to not only
promote local blood flow to the uterus, but to mediate the increase in maternal cardiac
output and blood volume and the decrease in blood pressure due to systemic vasodilatation
(Hemberger, Nozaki et al. 2003). These changes in the microcirculations of the placenta,
highlight its importance as a potential focus for detecting FGR. Currently ultrasound
Dopplers only investigate the uterine and umbilical blood flows, related to ‘intra-placental
flow’, but not a study of it directly. It is also apparent that placentation, at least in some
cases, is abnormal from very early gestations, it therefore follows that prediction of FGR
should be possible, if an appropriate test was available.
The placenta extracts a fixed proportion of the nutrient stream (70% glucose and 40%
oxygen supplied to the uterus), therefore fetal supply is restricted to the surplus after
placental needs have been met (Baschat 2004). Even mild dysfunction may restrict
transfer to the fetus whilst placental nutrition is maintained. The fetus is able to respond to
31
such changes by adjustments in metabolism, endocrine axes and hematologic parameters
as well as cardiovascular and behavioural responses. These adaptations and the restriction
of fetal growth are the outcome of placental insufficiency and ultimately define the
consequences of the disorder.
1.2.3 Gross placental morphology in FGR
Alterations in very basic morphological placental parameters are seen in association with
FGR. When considering placental tests for this condition, these should not be disregarded.
Although, due to a large amount of biological variation, the size or shape of the placenta
alone is unlikely to be predictive of FGR, if considered as part of the placental FGR
phenotype, they can be useful in conjunction with other parameters.
The relationship between placental weight and birthweight is complex. Teasdale reported
that the weight of placentas from SGA infants was reduced when compared with controls,
but changes in the placental weight to birthweight ratio were unclear (Teasdale 1984). The
study concluded that the placenta is usually small because the infant is small, and its small
size does not act as a contributory factor to fetal growth restriction. A further study found
that placental weight to birthweight ratio was significantly associated with gestational age,
female sex, Asian parentage, increasing maternal body mass index, increased maternal
weight at booking, and lower socioeconomic status and concluded that the ratio was not an
accurate marker of fetal growth, but a surrogate for other factors already known to
influence health (Williams, Evans et al. 1997). Interestingly, the weight of the placenta in
relation to birthweight was revisited in 15,047 appropriate for gestational age (AGA) and
1569 SGA infants (Heinonen, Taipale et al. 2001). The placental weight to birthweight
ratio was significantly lower in SGA infants than in AGA infants with same birthweight.
32
SGA infants had smaller placentas than the controls, suggesting that placental weight is an
influencing factor on fetal growth.
Placental weight is the most common way to characterize placental growth, but of note,
weight is a summary of many dimensions of growth, measured by disc shape, the distance
from the cord insertion site to the nearest disc margin and extent of branching of the
villous and vascular nutrient exchange surface, reflected in the thickness of the chorionic
disc. The normal placental disc shape is round oval. Abnormal lobation (bipartite or
tripartite) of the placenta is associated with maternal smoking, maternal age over 35 and
maternal diabetes mellitus (based on data from the National Collaborative Perinatal
Project and analysis of placental morphology in placentas from 24,047 women (Salafia,
Charles et al. 2006)). The umbilical cord insertion site marks the early confluence of
principal chorionic vessels. Uniform placental growth about the cord insertion site will
result in a centrally inserted cord, but if the placenta grows more in one direction than in
others the cord insertion site may be eccentric, marginal, or (at the extreme) velamentous.
Marginal and velamentous cord insertions are associated with fetal malformations
(potentially implicating a primary fetal origin), but also with maternal diabetes mellitus
and FGR (Naeye 1992).
Most of the placental growth in the third trimester is in increasing thickness, with
progressive branching of the villous tree (Boyd 1970). Placental disc thickness is therefore
an indirect measure of the development of the exchange surface of the placenta, essential
to its successful support of fetal growth. However, there may be an optimal placental
thickness; in normal placentas of normal thickness, subchorionic villi are already showing
changes related to poor perfusion (Popek 1999). In thicker placentas, the increased depth
of villous arborisation may therefore be less efficient. Abnormally thick placentas have
been correlated with adverse pregnancy outcome (Raio, Ghezzi et al. 2004; Fisteag-
33
Kiprono, Neiger et al. 2006; Toal, Keating et al. 2008). Placentas from 60 women with
abnormal uterine artery Doppler were examined at 19 – 23 weeks of gestation for
placental shape abnormalities, described as a placental thickness >4cm or >50% of length.
Those with abnormally thick placentas had higher odds of intrauterine fetal death (odds
ratio, 4.5 95% CI, 1.3-15.6) and FGR (odds ratio 4.7, 95% CI 1.4 -15.1) (Toal, Keating et
al. 2008). This highlights the importance of further research into the use of placental
parameters as a tool for identifying the at risk fetus.
1.2.4 Placental blood flow in FGR
Uteroplacental vascular resistance has been extensively investigated as a predictor of FGR
(see above). Prefumo et al. (Prefumo, Guven et al. 2004) investigated the relationship
between the timing of disappearance of high-resistance uterine artery waveforms between
the first and second trimester of pregnancy and birth weight in 662 pregnancies. A clear
correlation between the longitudinal variation in uterine artery blood flow pattern and
birth weight was observed, suggesting that the timing and extent of trophoblastic
conversion of the maternal uteroplacental vessels is an important determinant of
birthweight.
Vascularisation of the developing placental villi is seen in the second trimester. Fetal
angiogenesis is crucial for successful placental development, although all the mechanisms
are not completely understood. The pathology underlying the abnormal umbilical artery
high resistance waveforms seen in FGR are complex and debates exist regarding the
relative importance of the cord, stem artery and terminal villus pathology (Kingdom,
Burrell et al. 1997). Umbilical arteries appear hypoplastic using morphometric analysis in
FGR (Bruch, Sibony et al. 1997) . Branching from these, stem artery density was initially
34
thought to be reduced in FGR (Giles, Trudinger et al. 1985), but since (using more
rigorous stereological methods and immunohistochemistry) no major differences have
been demonstrated (Jackson, Walsh et al. 1995; Macara, Kingdom et al. 1995). More
distally, electron microscopy of placental villi and their vascular casts suggests a failure of
formation of the terminal villi and an arrest of non-branching angiogenesis in FGR (Krebs,
Macara et al. 1996). Thrombo-occlusive damage to the placenta, including central
infarction, intervillous thrombosis and massive perivillous fibrin deposistion are all seen
in association with FGR, usually in the absence of maternal thrombophillia (Chaddha,
Viero et al. 2004).
There is a growing body of evidence that the abnormal angiogenesis patterns seen in FGR,
are influenced by angiogenic proteins such as vascular endothelial growth factors (VEGF)
and angiogenic inhibitors (sFlt-1, soluble Fms-like tyrosine kinase) (Ahmed, Li et al.
1995; Wallner, Sengenberger et al. 2007). The exact roles of such factors is still
undergoing research, however there are definite associations between maternal raised sFlt
levels,abnormal uterine artery Doppler patterns and FGR (Schlembach, Wallner et al.
2007; Nevo, Many et al. 2008). If angiogenesis is abnormal in FGR, blood flow,
particularly the microvasculature of the placenta, is also likely to be abnormal with effects
on placental transfer.
It is likely that reduced blood flow contributes to fetal hypoxia in FGR (Itskovitz,
LaGamma et al. 1983; Edelstone, Peticca et al. 1985), as oxygen is small and highly
lipophillic, enabling it to diffuse readily across the placental barrier and causing its
transfer to be flow–limited (Sibley and Boyd 1988). However, it is unlikely that blood
flow reduction can sufficiently explain the reduced concentrations of various nutrients in
the condition, such as glucose and amino acids, as the properties of the placental exchange
35
barrier primarily limits transfer of these hydrophilic molecules, rather than blood flow
(Sideri M 1983; Sibley and Boyd 1988).
Currently, ultrasound imaging is not used to evaluate blood flow in the microcirculations
of the placenta itself, only up- or downstream in the uterine or umbilical vessels. The
development of techniques to study these microcirculations, such as MRI, are of key
importance, given that, as discussed above, many of the changes seen in FGR are within
the smaller vessels of the placenta itself.
1.2.5 Placental tissue morphology in FGR
Several aspects of placental tissue morphology are known to be altered in FGR. MRI
offers a range of indices that relate to tissue structure, particularly relaxation times,
discussed in the next section. Here, we discuss the alterations in tissue structure that may
be foci for identifying this condition.
Substances passing from the maternal to fetal circulation, or vice versa, are faced with the
placental barriers. The first, from a maternal start point, is the syncytiotrophoblast layer,
which consists of the maternal facing microvillous plasma membrane (MVM), the
trophoblast cytosol and the fetal facing basal plasma membrane (BM). The villous stroma
is then reached, before crossing the fetal capillary endothelium to enter the fetal
circulation. Human placental capillaries closely resemble other non-brain continuous
capillaries, having wide paracellular clefts (Leach and Firth 1992), which allow relatively
unrestricted transfer of molecules like glucose and amino acids across the capillary wall.
Therefore it is the two polarized membranes of the syncytiotrophoblast that represent the
main barrier for transplacental transfer (Sideri M 1983; Sibley and Boyd 1988).
36
Mayhew (Mayhew, Ohadike et al. 2003) quantified placental morphology using
stereological techniques in pregnancies complicated by preeclampsia with and without
FGR. FGR was associated with a placenta that had reduced volumes of all types of villi
(stem, intermediate, terminal). The reduced elaboration of distal villi affected all
compartments (trophoblast, stroma, capillaries) and was accompanied by smaller
exchange surface areas and a thicker trophoblastic epithelium. It was concluded that FGR,
but not preeclampsia, was associated with substantial changes in placental morphology of
the placenta, including impoverished growth of villi and fetal vasculature. These results
were reiterated in a study using visual image analysis to observe changes in the
morphology (Daayana, Baker et al. 2004). Placental biopsies from nine normal
pregnancies, five cases of pre-eclampsia, five cases of FGR, and five cases of pre-
eclampsia with FGR were randomly sampled and the placental areas occupied by villi,
syncytiotrophoblast, and syncytial cytoplasm were quantified. Only the FGR group
showed a consistent reduction in villous area. Birth weight was positively correlated to
total villous area occupied. Furthermore, increasingly positive relationships were recorded
between both syncytiotrophoblast area and syncytiotrophoblast cytoplasm and birth
weight, pointing to impoverished villus development in FGR. The changes seen in pre-
eclampsia with FGR were more similar to those in the isolated pre-eclampsia group than
those with isolated FGR, supporting that FGR and FGR seen in combination with pre-
eclampsia have separate aetiologies. These FGR specific abnormalities are key targets to
try to identify in utero, using techniques such as MRI.
37
1.2.6 Note on Stereological Placental Analysis
The nomenclature morphometry and stereology do not describe the same method.
Morphometry is a two-dimensional quantitative method that uses a calliper or guage, that
may be part of a computer based image analysis system. Stereology is a test-system
comprised of test points or lines orientated over a known frame area, which again may be
computerised. Morphometry determines lengths, perimeters, areas whereas stereology
estimates densities, such as volume density and surface area density by the application of
specific formulae. The calculations are based on statistical principles (sample size,
randomisation, tissue isotropy) and the aim of the sampling design is to obtain the
maximum amount of quantitative structural information (for full details of sterological
protocols for the placenta see Mayhew, 2006) (Mayhew 2006) and can require a
significant amount of time and effort. Where very large data sets are analysed, the
precision of individual measurement may be less important and a morphometeric
technique may be better suited in terms of cost and time. Very few studies have compared
morphometry and stereology (Parsons, Marko et al. 1990; Rahman and Itakura 1996),
none have compared techniques in the placenta (although Mayhew and Burton put
forward a strong case for the latter(Mayhew and Burton 1988)). In studies contained
within this thesis, a stereological technique was adopted after experimenting with the
different methods. This was due to the small sample sizes achievable, the perhaps more
robust methodology was preferred.
1.2.7 Placental transfer in FGR
38
During pregnancy, the placenta provides the major route by which all nutrients, ions,
gases, water and other compounds are transferred to the fetus and by which waste products
are removed. The placenta, therefore, is of fundamental importance to fetal health and
growth. Although, for many years, the placenta was seen as a passive conduit to the fetus,
its importance in regulation of placental transfer is increasingly acknowledged and several
aspects of placental structure and function are altered in disease conditions. These are
particularly relevant to disorders of fetal growth such as FGR.
Absolute fetal growth rate changes with gestation; it is very slow in the first trimester and
from then on accelerates towards term. As material required for growth is supplied
predominantly via the placenta, it follows that the transfer capacity of the placenta must
also grow. Changes in transfer capacity cannot be explained by placental growth alone (at
least on a macroscopic scale, as this is known to be highest in the first trimester and
relatively slow towards term) and therefore other mechanisms must come into play. These
increased demands could theoretically be met by one, alone or combined, of three
changes; 1) alterations in blood flow to or within the placenta, 2) altered capacity of the
placenta itself to facilitate transfer (determined by dimensions of the exchange barrier and
availability/activity of specific transporter proteins in the plasma membrane) or 3)
alterations in the driving forces across the placenta (the hydrostatic, osmotic and electrical
gradients and supply of energy for active transport e.g. ATP).
As well as the well documented alterations in maternal and fetal blood flow in FGR (as
evidenced by uterine and umbilical Doppler ultrasound measurements), there are changes
in the structural variables of the exchange barrier and an ever growing wealth of literature
describing a variety of changes in transporter expression and activity. In FGR, the surface
area of the villi and fetal capillaries are significantly reduced (Mayhew, Manwani et al.
2007). Despite the degree of cross over between FGR and pre-eclampsia, these changes
39
are attributable to the former condition when seen in isolation, further evidence in support
of differential disease processes for the conditions.(Daayana, Baker et al. 2004). The
affect of FGR on the thickness of the placental exchange barrier is not clear cut.
Stereological studies suggest a thickening of the trophoblastic component of the barrier
although the overall thickness (comprising of trophoblast + stroma + capillaries) remains
constant, suggesting a thinning of another component such as the stroma, with a possible
compensatory shift of the capillaries to be in closer proximity with the trophoblast.
Whether the alterations in placental structure and function seen in FGR are cause or effect
is a difficult issue to answer, but evidence from studies on a knockout mouse model, in
which the placental-specific transcript of the insulin-like growth factor 2 gene (igf-2) was
deleted, suggest the former. The altered placental phenotype in mutant mice pregnancies,
similar to that seen in human FGR, was found to precede a decline in fetal growth.
Undernutrition in the rat also leads to an altered placental phenotype prior to fetal growth
decline. Knockout of the placental specific transcript of igf-2 in the mouse leads to a
decrease in placental weight with reduced exchange surface area, an increase in the
estimated harmonic mean thicknesses of the barrier and a strongly correlated decrease in
permeability to diffusional markers, as well as fetuses which are 30% smaller than wild
type (Sibley, Coan et al. 2004). Furthermore, placental growth restriction occurs at day 14
onwards (term is day 20), but fetal growth restriction does not occur until around day 18
or 19 (Constancia, Angiolini et al. 2005) .
The reasons for this delay between placental growth restriction and that of the fetus may
be due to a delayed reduction in the diffusional permeability of the mutant placentas to
hydrophilic molecules, apparently arising from the altered placental morphology and
changes in placental transporter activity or expression in the mutants. Various alterations
in specific transporter mechanisms occur in association with human FGR. Impaired
40
amino acid transport generally is associated with impaired fetal growth and reduced fetal
plasma levels of amino acids are seen in FGR. In FGR, the activity of the System A
amino acid transporter in the placenta is markedly reduced and in the most severe cases of
FGR, as determined by abnormal umbilical artery Doppler and fetal heart tracings, the
most profound reductions in System A activity are seen(Glazier, Cetin et al. 1997).
The fact that some placental transporter activities (e.g. System A) go down in FGR
whereas at least one, the Ca2+ATPase increases is very interesting. The decreased in
System A may be causative to FGR. The increase in Ca2+ATPase may be adaptive to the
FGR: placental supply adapting to specific demand signals from the fetus. In the igf-2
knockout mouse model, maternofetal transfer of [14C]methylaminoisobutyric acid
(MeAIB,a specific non-metabolisable substrate of System A), measured in vivo, was
increased by 50% per unit weight of placenta, in the knockout mice at day 16, but by day
19, [14C]MeAIB transfer was similar in knockout and wild-type pups. These data suggest
that System A activity in the placenta can be upregulated to increase placental efficiency.
However, this upregulation may not be sustainable, so that fetal growth restriction does
finally ensue (Constancia, Hemberger et al. 2002). Furthermore, in the same model fetal
calcium accumulation in the fetus of the knockout is reduced but transfer is then
upregulated (with increased expression of calbindin-d9k) so that fetal calcium content is
normal by term (Dilworth, Kusinski et al.). There is therefore good evidence of placental
adaptation to fetal growth requirements in this model.
Further evidence for compensatory mechanisms comes from a study of System A
transport in the MVM of human placentas from babies across the range of normal
birthweights where activity was found to be highest in the smallest babies(Godfrey 1998).
This is in contrast with the situation in frank FGR, where, as discussed, a downregulation
of System A is seen.
41
Low birthweight infants are often found to be hypoglycaemic at birth and may have
ongoing problems normalising glucose levels in the neonatal period. The reasons for this
are not entirely clear. Fetal hypoglycaemia in FGR is unlikely to be due to altered
placental GLUT 1 function, as protein expression and transport activity are unaltered. The
impact of other members of the GLUT family has not been fully established, but it is
important to note that not all transporter activities are altered in FGR.
Lipoprotein lipase is crucial in the process of fatty acid release to the fetus from
lipoproteins and interestingly, its activity is found to be reduced in FGR, in keeping with
the altered maternal/fetal lipid ratios also found in the condition.
Na+/K+ATPase activity and expression is decreased in the MVM in FGR, which may
result in a reduced driving force for a range of Na+ dependent transport mechanisms. The
activity and expression of the Na+/H+ exchanger (NHE), the primary pH regulating
transporter in the syncytiotrophoblast, is reduced in association with FGR, which could,
speculatively, contribute towards acidosis in these fetuses. Note that the activity of a
lactate transporter on the BM is also reduced perhaps contributing further to the fetal
acidosis
1.2.7.1 The placenta as a sensor
Our understanding of the control of placental transfer mechanisms remains incomplete but
several lines of evidence support the view that the placenta is able to adapt to changes in
its environment e.g. substrate levels in the maternal or fetal microcirculations, and adjust
transfer accordingly, so that transport functions will be coordinated with maternal nutrient
or ion availability and fetal demand. Therefore factors such as malnutrition, reduced blood
42
flow or hypoxemia may impact upon these regulatory mechanisms and as a consequence
be up or down regulated. Examples of this include the reduction in the expression of
System A amino acid transporter and increase glucose transporters in cultured term
trophoblasts during hypoxia (Esterman, Greco et al. 1997; Nelson, Smith et al. 2003)and
the effect of metabolic hormones such as insulin, IGF-1 and leptin, on nutrient transporters
(Karl, Alpy et al. 1992; Ericsson, Hamark et al. 2005; Ericsson, Hamark et al. 2005).
Disease states such as FGR and fetal overgrowth may in fact be due to a loss of placental
‘sensing’ and appropriate up or down regulation – as evidenced by the patterns seen in
placental specific Igf2 knockout mice (Sibley, Coan et al. 2004).
Excitingly, another candidate ‘regulator’ of transport mechanisms has recently been
postulated. mTOR (mammalian target of rampamycin) is a serine threonine kinase and
represents an important nutrient sensing pathway in mammalian cells, controlling growth
through regulation of translation and transcription in response to nutrient availability, in
particular of branched chain amino acids, hypoxia and cellular energy status (Dennis,
Jaeschke et al. 2001; Arsham, Howell et al. 2003; Jacinto and Hall 2003). mTOR is highly
expressed in the cytosol of the syncytiotrophoblast and appears to have down regulated
activity in FGR (Jansson and Powell 2006). Although much further research is required,
such findings could eventually provide therapeutic targets for use in fetal conditions.
1.2.8 Conclusions
These accumulated observations enable us to describe a series of structural and functional
alterations in the placenta that are specific to fetal conditions, even when accepting that
groups included in studies may be heterogeneous. Further exploration of these
abnormalities together could provide better information on the placental phenotype,

43
allowing more rigorous definitions of conditions such as FGR and fetal overgrowth and
providing better biomarkers for use in clinical practise to identify and diagnose these
conditions. Placental MRI is a potential candidate for this role.

44
1.3 Magnetic Resonance Imaging (MRI)
1.3.1 Basic Physics of MRI
An understanding of basic MRI physics is important when considering what MRI can tell
us about tissue structure and function. As with all tests, it is subject to variation and error
and is, to some extent, an approximation of the actual in vivo situation. MRI physics is a
complex subject, sufiice to say during MR the patient lies within a large,
powerful magnet where the magnetic field is used to align the magnetization of the
protons within the atomic nuclei in the body (most commonly hydrogen nuclei which are
abundant in body tissues) and radio frequency fields are used to systematically alter the
alignment of this magnetization. This causes the protons to produce a rotating magnetic
field detectable by the scanner—and this information is recorded to construct an image of
the scanned area of the body. A more in depth discussion of MRI physics is covered in the
title Magnetic resonance imaging: Physical principles and sequence design (Haacke
1999).Bloch and Purcell were responsible for the original demonstration of nuclear
magnetic resonance in 1945. They made their observations on either side of the United
States within days of each other and subsequently shared the 1952 Nobel Prize for Physics
(Bloch 1946; Purcell 1946).
45
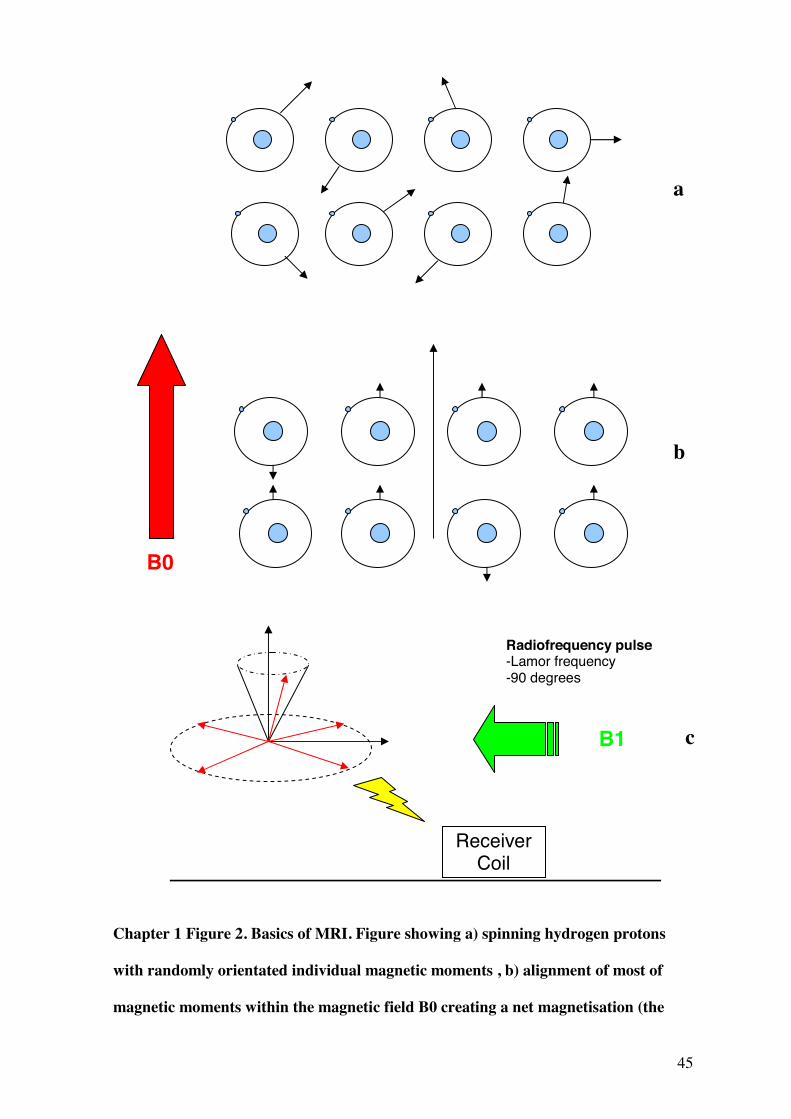
Chapter 1 Figure 2. Basics of MRI. Figure showing a) spinning hydrogen protons
with randomly orientated individual magnetic moments , b) alignment of most of
magnetic moments within the magnetic field B0 creating a net magnetisation (the
Receiver Coil
Radiofrequency pulse -Lamor frequency -90 degrees
B1
B0
a
b
c

46
higher the field strength the greater the number of moments aligning), the magnetic
moments also begin to precess in phase. In c) the precessing magnetic moments (and
net magnetisation) are flipped into the transverse plane by the presence of a
radiofrequency coil generating a magnetic field (B1) at 90 degrees at the Lamor
frequency/resonant frequency of precession. If the radiofrequency pulse is then
switched off the signal can be detected by a receiver coil. The signal then begins to
decay by T1 and T2 relaxation as the protons return to their steady state.

47
1.3.2 Quantitative MRI indices
A major advantage of MRI is its ability to provide quantitative indices which relate to
differences in tissue structure and function. These include indirect measurements in the
form of physical properties such as MR relaxation times and magnetisation transfer, which
are related to the bulk macromolecular and water content of the tissue of interest. MRI can
also provide more direct measurements, without using injectable contrast, of blood flow
and perfusion.
1.3.2.1 Relaxation time measurements
Most of the protons in tissues are found in water molecules with lesser amounts in organic
molecules. In order to manipulate net magnetisation, a Radio Frequency (RF) pulse with a
frequency that matches the Larmor frequency is applied. Protons spinning with the same
frequency as the RF pulse will respond or resonate to that RF pulse. By sending an RF
pulse with a certain strength (amplitude) and for a certain period of time it is possible to
rotate the net magnetization into a perpendicular plane i.e. the net magnetization is
‘flipped’ by 90º (this angle is referred to as the flip angle and can vary between 0º and
180º in MR sequences). They protons also become ‘in phase’, so that the precession for all
hydrogen protons becomes uniform. This process is called excitation and can be equated
with the protons absorbing energy from the MR pulse. After the pulse is switched off, the
relaxation process begins and can be divided into two parts: T1 and T2 relaxation. This is
illustrated in Chapter 1 Figure 2.
T1 Relaxation: After the RF excitation pulse stops, the net magnetization will re-grow
along the longitudinal direction, while emitting radio-frequency waves. T1 relaxation is

48
also known as Spin-Lattice relaxation, because the energy is released to the surrounding
tissue (lattice). T1 relaxation relates to the protons flipped by 90º by the excitation pulse.
Not all protons are bound in the same way depending on the molecule they are in.
Hydrogen in complex molecules such as fat are bound tightly, while those in water have a
much looser bond. Therefore, the rate at which they release their energy is therefore
different. T1 is a time constant defined as the time it takes for the longitudinal
magnetization to reach 63 % of the original magnetization.
T2 Relaxation: T2 relaxation occurs simultaneously, but is independent of T1. It relates to
the protons relaxing from an in-phase situation to a total out-of-phase situation. Again,
how the hydrogen proton is bound in its molecule is important. T2 is defined as the time it
takes for the spins to de-phase to 37% of the original value. The rate of de-phasing is
different for each tissue. Fat tissue will de-phase quickly, while water will de-phase much
more slowly.
The rate of T2 relaxation is quicker than T1 relaxation. T2 relaxation happens in tens of
milliseconds, while T1 can take up to seconds. T2 relaxation is also called spin–spin
relaxation because it describes interactions between protons in their immediate
surroundings (molecules).
Thus, the contrast in the MR image largely relates to differences in the longitudinal (T1)
or the transverse (T2) relaxation times of water protons present in the tissue. Cameron et
al. studied the histology of 16 different tissue types in rats and correlated these with T1
and T2 relaxation times (Cameron, Ord et al. 1984). From the results they made the
following generalizations;

49
1. Each normal tissue has characteristic and reasonably consistent T1 and T2 relaxation
times.
2. Tissues with higher water content have longer T1 relaxation times.
3. Tissue T2 values are not as well correlated with water content as T1 values.
4. Tissues with shorter T1 values have higher calculated hydration fractions, greater
amounts of rough endoplasmic reticulum, and a greater rate of protein synthetic
activity.
5. Tissues with higher lipid content, associated with non membrane bound liquid
droplets, tend to have longer T2 values.
6. Tissues with greater all over surface area, whether in the form of cellular membranes
or intracellular or extracellular fibrillar macromolecules, tend to have shorter T2
values.
7. The differences in T1 and T2 values between tumour and normal tissues correlates with
differences in the volume fraction of extracellular fluid and in the amounts of
membrane and fibrillar surface area in the cells.
These last two points are of particular interest when studying the placenta, as a fall in T2
and to a lesser extent T1 were observed with advancing gestation, when increases in
overall exchange barrier surface area would be expected (Gowland, Freeman et al. 1998).
The clinical application of such indices has been studied in many human tissues and
shown to be of use in the liver where it may help identify certain tumor histotypes, such as
hepatocellular carcinoma and with careful analysis, may also help predict the degree of
tumor differentiation (Bartolozzi, Cioni et al. 2001). Intracellular content of certain
50
substances such as glycogen, fat, melanin, iron and copper will also have a role in
determining MR signal behavior and relaxation times have been investigated as a tool for
studying iron load in the liver and brain (Thomsen 1996; Vymazal, Brooks et al. 1996).
Relaxation times can act as tissue biomarkers are are potentially of use in identifying the
alterations in placental tissue seen in association with FGR.
1.3.2.2 Blood flow and perfusion measurements
In considering perfusion measurements, it is important to recall that there are a number of
well established techniques for imaging blood flow including positron emission
tomography, computed tomography and MRI contrast techniques. Particularly relevant to
pregnancy however, are techniques which require no injected or inhaled contrast.
Intravoxel Incoherent Motion was inititally developed by Le Bihan, in assessment of
microscopic motions causing signal attenuation in diffusion MR imaging (Le Bihan,
Breton et al. 1986; Le Bihan 1988). Attenuation of signal occurs when protons move fast
enough within a magnetic field to become dephased (i.e. desynchronised in their inherent
spins from other protons, giving a corresponding reduction in signal. IVIM measures a
property of a tissue slightly different from classical perfusion as it is sensitive to molecular
motion, however, in biological tissue this is predominantly constituted of the diffusion of
water and movement of blood (Henkelman 1990).). Blood (or other fluids such as lymph),
flowing in any direction will also contribute, rather than capillary flow in isolation. This is
particularly of relevance when considering IVIM in the placenta, in which flow is slow
and multi-directional. The concept introduced by Le Bihan is that water flowing in
randomly oriented capillaries mimics a random pathed walk “pseudo-diffusion”. Diffusion
itself relates to the random Brownian motion of water molecules, propelled by thermal
energy, and is also in a random path. Both measurements are dependant on the b value
51
(the b value is a factor of diffusion weighted sequences which summarises the influence of
the gradients on the diffusion weighted images. The higher the value b, the stronger
the diffusion weighting); pseudo-diffusion is also dependant on the velocity of the blood
and the vascular architecture. However, the rate of signal attenuation resulting from
pseudo-diffusion is greater than molecular diffusion in tissues, so its relative contribution
to the MR signal becomes significant only at very low b values, allowing diffusion and
perfusion effects to be separated (Le Bihan, Breton et al. 1988).
Arterial Spin Labeling (ASL) is a method of assessing blood flow, most extensively
investigated in the brain (Detre, Leigh et al. 1992; Williams, Detre et al. 1992). ASL uses
selective inversion as a method of tagging inflowing arterial blood. When the tagged
blood reaches the tissue being imaged, it attenuates the signal as it has already undergone
some relaxation. Subtraction of the tagged image from a control image gives a measure of
the amount of tagged blood which flowed into the tissue. The quantity is closely related to
the tissue perfusion. The sensitivity of the technique is improved at higher field strengths
due to both intrinsically higher signal to noise ratio and the lengthening of blood T1.
However, it is particularly challenging to use ASL to study slow blood flow, as T1 decay
in the tagged blood may occur before reaching the tissue of interest, therefore preventing
its detection (Chalela, Alsop et al. 2000). ASL has been investigated in a number of
disease states including stroke (Chalela, Alsop et al. 2000), dementia (Johnson, Jahng et
al. 2005), brain tumours (Weber, Thilmann et al. 2004) and epilepsy (Wolf, Alsop et al.
2001) although its role outside the CNS remains relatively unexplored. As ASL is able to
tag blood in supplying vessels, differentiation of blood flowing into the placenta from
either maternal or fetal directions may be possible and their relative contributions
assessed.
52
1.3.4 Placental MRI
Fetal MRI is reviewed as a published article in Appendix I.
The placenta is of fundamental importance in the normal growth and development of the
fetus and pregnancy. Specific alterations are seen in the placenta in association with FGR.
Doppler assessments of uterine and umbilical blood flow are used in clinical practice and
are indirect markers of placental function, examining blood flow up or downstream from
the circulations within the placenta itself. MRI offers non invasive methods of examining
blood flow and perfusion within the placenta and also provides quantitative indices, which
relate to tissue structure.
1.3.4.1 Imaging the Placenta
The placenta is suited to MRI as it is relatively immobile and hence the problems created
by fetal movement are not encountered to such an extent (Gowland 2005). It also lacks the
air tissue interfaces found in other parts of the body which may cause image artefact and
has a high moving blood volume, allowing the application of perfusion assessment
techniques. Placental anatomy is well defined on MRI, with clear boundaries against the
amniotic fluid and to a slightly lesser extent with the uterine wall. The volume of the
placenta can be measured from a multi-slice set of images and has been investigated as a
predictor of FGR (Baker, Johnson et al. 1995); generally lower placental volumes were
seen on MRI in pregnancies complicated by this condition, but not falling outside the
confidence limits set for the normal population (Baker, Johnson et al. 1995; Duncan,
Sahota et al. 2001).
53
1.3.4.2 Placental structure
Histology has shown that the placenta matures and alters in structure with increasing
gestation and quantitative MRI reflects these changes. T1 and T2 relaxation times, related
to the structural and content of the placenta, are seen to fall with increasing gestation
(Gowland, Freeman et al. 1998). The values are less than those seen for blood alone,
suggesting changes in the villous tissues rather than just an increase in the vascular
component are responsible for the drop. This could be due to either a change in volume or
surface area, although studies looking at magnetisation transfer data suggest the latter.
Magnetisation transfer can be used to quantify the ratio of bound protons to the total
number of protons within a given sample. No change was seen in magnetization transfer
ratios in the placenta at different gestations (Ong, Tyler et al. 2004), in particular no
change in the bound fraction, which would be expected if macromolecular content had
increased. This might suggests that the ratio of the villous tissue (non-vascular
component) to total placental volume remains constant throughout gestation, but surface
area changes (affecting relaxation times). Further correlation with placental morphometric
assessments is, however, required.
Increased heterogeneities are often observed on MR images at later gestations and in
complicated pregnancies (Gowland 2005). T1 and to a lesser extent, T2, fall in pregnancies
complicated by FGR or pre-eclampsia (Gowland, Freeman et al. 1998). This may be due
to the cumulative effects of small regions of infarction and fibrosis. Differences in
magnetization transfer ratios were not seen in complicated pregnancies (Ong, Tyler et al.
2004) suggesting that even within the FGR placenta, where the total volume may be
reduced, the ratio of non vascular: total volume (presuming a correspondence to bound
protons : total protons) remains constant. The significance of these findings is not fully
54
clear, but may reflect an adaptive placental response, although the small numbers in these
studies warrants further investigations.
1.3.4.3 Placental Function
As discussed, blood flow and perfusion can be depicted in several ways using MRI and
with the exception of contrast agents, these methods can be applied to the placenta. The
safety of contrast agents such as gadolinium remains controversial in pregnancy, as it is
passed into the amniotic fluid and re-swallowed, the total fetal exposure is unknown
(discussed in (Garcia-Bournissen, Shrim et al. 2006)). In the few women receiving
contrast for medical indications (Marcos, Semelka et al. 1997), rapid enhancement of the
placenta was demonstrated, initially following the lobular structure and becoming
homogeneous with the uterus after around 45 seconds. Contrast imaging has been used to
image placental blood flow in mice (Yeh 2006) and establishment of a safe contrast
material would no doubt be advantageous for in utero assessment of perfusion. Using
ultrasound , contrast micro-bubbles have been trialled as a means of qualitatively,
although not yet quantitatively, assessing intervillous blood flow (Orden, Gudmundsson et
al. 1999). Potentially these bubbles could also be detected on MRI images, an area which
is yet to be explored.
In the placenta, ASL is challenging due to the slow and multi-directional blood flow,
despite a high blood volume. FAIR (flow-sensitive alternating inversion recovery) ASL is
a technique which can be used as an alternative, with an initial non selective inversion
pulse acting on blood within the whole coil area which will in time, flow into the capillary
network (Gowland, Francis et al. 1998). Using this technique, the average perfusion rate
of the placenta was found to be around 176ml/100mg/min, more than would be predicted
55
based on knowledge of placental blood flow and weight (Francis, Duncan et al. 1998).
This is most likely due to the multidirectional flow in the placenta and hence the measure
is of moving blood within a tissue rather than classical perfusion through a tissue.
Mapping of these ‘perfusion’ values across the pixels in the placental image demonstrated
that a significantly higher fraction of pixels had low perfusion values (<100ml/min/100g)
in pregnancies complicated by FGR (as defined by IBR < 10th percentile) (Francis,
Duncan et al. 1998). This study was performed at 0.5 T in 6 healthy pregnant volunteers
and 9 women with pregnancies complicated by FGR. The numbers are small and it would
be interesting to further investigate this method at increased field strengths where, as
mentioned, inherent improvements would be expected.
The alternative technique is intra-voxel incoherent motion (IVIM). Initial studies in 11
women from 20 weeks gestation found the technique to be both sensitive and informative
(Moore, Issa et al. 2000). The moving blood fraction (f%) within the placenta averaged at
26%, with a trend towards decreasing at later gestations. Interestingly, in a further study of
nine women with normal pregnancies and six women with pre-eclampsia scanned within
ten days of delivery, showed a reduction in f% using this technique at the basal plate
(maternal fetal interface and region of the maternal spiral artery supply to the placenta)
(Moore, Ong et al. 2008). The values at the basal plate appeared relatively constant for
various gestations, although a complete dataset (at four different gestations) was only
acquired in one individual due to exclusions. A similar pattern in FGR has not been
observed, and changes in IVIM in this condition would be interesting to study, as well
assessments at early gestations, to establish whether such findings predictive for pre-
eclampsia or FGR.
56
1.3.4.4 Placental Magnetic Resonance Spectroscopy
Placental MR spectroscopy has been used as a research tool for over 20 years with the aim
of investigating placental metabolism. Again, technical challenges have restricted the
development of the technique and compared to other organs, very little data has been
published with limited in vivo analysis. Problems due to movement in fetal MR
spectroscopy are not as great in the placenta, however, the availability of expensive
hardware and appropriate staff to maintain equipment remains a limitation. Additionally,
different methodologies have prevented a cumulative analysis of the available data
(McKelvey and Kay 2007). Despite this, differences have been observed between normal
and FGR placentas. One such study of phosphorus spectroscopy examined placental tissue
after delivery (by caesarean) from third trimester pregnancies complicated by FGR (Kay,
Hawkins et al. 1992). Compared to normal pregnancies (in both groups delivered by
caesarean and vaginally), mean concentrations of ATP (adenosine tri-phosphate), a
molecule fundamental to energy metabolism and exchange, were raised. This is somewhat
contradictory to other experiments performed by perfusing placentas in vitro, which
suggested that periods of ischaemia would cause ATP to fall (Malek, Miller et al. 1995). It
is possible that in FGR there is a compensatory mechanism underlying these effects,
however, there are no in vitro studies of FGR placentas to evaluate this more conclusively.
1.3.4.5 Conclusions
The potential for MRI in imaging the fetus and placenta is yet to be fully realised. It is
unlikely to supersede ultrasound entirely in the antenatal setting, partly due to its expense
and probable lower patient acceptability, but it has a role in the assessment of several fetal
anomalies. In the UK, referrals for MRI are increasing and have trebled at some centres

57
over the last 5 years (Reeves 2008). The increased diagnosis of CNS and other
abnormalities will no doubt lead to increased terminations, but this should be balanced
against positive outcome of allowing parents to make a more informed decision.
58
1.3.5 Safety issues relating to Magnetic Resonance Imaging (in detail)
Maternal and fetal concerns regarding the safety of Magnetic Resonance Imaging (MRI)
must be addressed when consenting a woman for an MRI scan in pregnancy. In non-
pregnant subjects, MRI has been utilized in the clinical setting in more than 150 million
persons, with very few serious injuries and no harmful effects demonstrated (Shellock and
Crues 2004).
1.3.5.1 General safety concerns of MRI
There are a number of potential safety concerns during MR imaging including
1. Biological effects of the magnetic field.
The direct effect of magnetic fields on human DNA, genes, cells and tissues has been
extensively investigated. No potential adverse effects have been clearly verified (WHO
2006). Additionally, there is no evidence for a cumulative effect of MR exposures on
health, as demonstrated in health care workers and patients requiring repeat examinations
(Kanal, Gillen et al. 1993).
2.Ferromagnetic attractive or ‘projectile’ effects.
Both internal implanted objects (e.g. aneurysm clip) and external (e.g. oxygen cylinder)
can move within the magnetic field causing injury and fatalities have occurred (Chen
2001). Many of the injuries sustained during MRI have been secondary to this effect and
demonstrate the importance of adhering to screening procedures and safety policies.
59
3. Potential effects of time varying magnetic field gradients.
During MRI, time varying magnetic field gradients may stimulate nerves or muscles by
inducing electric fields in the patient (Shellock 2000). In MR, three orthogonal magnetic
field gradients are switched on and off to select the region of diagnostic interest and to
spatially encode the MR signals. As a general guide, the faster the imaging, the greater the
rate of change of the gradient fields used and the resultant current density induced in the
tissue. At extremely high exposure levels, beyond those in routine clinical use, cardiac
stimulation may be a concern.
4. Effects of rapidly varying radiofrequency (RF) magnetic fields.
The majority of RF power transmitted for MRI is transformed into heat within the
patients’ tissues. This effect is altered by many variables relating both to the MR
procedure and individuals physiological response. Overall no excessive temperature
elevations or damaging physiologic responses have been demonstrated at field strengths in
clinical practice, although injuries have been sustained by excessive heating of conductive
materials (e.g. electrodes, guidewires) (Kanal, Shellock et al. 1990).
5. Auditory Considerations.
Various forms of acoustic noise are produced in association with the operation of an MR
system. The primary source is the gradient magnetic field activated during the MR
procedure. In general, acoustic noise levels recorded for conventional MR procedures are
below maximum permissible limits but has the potential to reach dangerous levels (Price,
De Wilde et al. 2001).
6. Safety issues from superconductive systems involving large amounts of helium or nitrogen.
60
7. Psychological effects, such as claustrophobia and anxiety.
Additionally, there are safety considerations relating to the use of MR contrast agents.
1.3.5.2 Safety Concerns Specific to Pregnancy
MRI does not involve exposure to ionizing radiation and therefore does not carry the
potential risks associated with X-Rays or Computerized Tomography (CT) imaging. The
main imaging modality in pregnancy is ultrasound, which is generally considered safe,
although previously concerns have been raised regarding heating effects in the fetus these
have not been demonstrated to be harmful (Miller, Nyborg et al. 2002) .
Thousands of women have now undergone MRI scanning in pregnancy, with no
demonstration of adverse effects. However, the potential for harm in pregnancy may be
greater and therefore all possible safety hazards should be considered again individually
with respect to the fetus and the pregnant woman.
Biological effects of Magnetic and Radiofrequency fields
It is well known that rapidly dividing cells, as in the case of the developing embryo, are
susceptible to the affects of a wide range of insults. Although no clear adverse effect have
been demonstrated in human tissues (Rodegerdts, Gronewaller et al. 2000), data in the
first trimester is limited and therefore MRI at this gestation is generally avoided. The
potential effects of the magnetic field on cardiac function at later gestations have also been
studied with no change in cardiotocograph parameters (Poutamo, Partanen et al. 1998).
61
In animal studies, there have been some conflicting results of the effects of in-utero
exposure to MRI. A number of studies have shown no adverse effects including studies in
mice with prolonged exposure to static fields (up to 624 days over 3 months) (Osbakken,
Griffith et al. 1986), high strengths (6.7T) (Murakami, Torii et al. 1992) and pulsed
magnetic fields (MRI associated) (McRobbie and Foster 1985). However, a few small
studies in mice have suggested a link with intra-uterine growth restriction. Most of these
studies are regarding MRI exposures much longer or at much higher strengths than those
relating to clinical practice. Those most minimal regimes (still beyond those used in
clinical practice) included exposure to 4.7 T for 8 hours (Carnes and Magin 1996) in
which fetal weights were between 11 and 17% less than controls, and crown rump lengths
were similarly reduced in animals exposed at 9 (time of spinal cord formation) days; no
effect was found after exposure at 9 plus 12 days or 12 days (time of reproductive organ
development) alone. In a follow up study by the same group at 4.0T (Magin, Lee et al.
2000), differences in CRL and birthweight were only observed in mice exposed to both
MRI and ultrasound (ultrasound at day 9, MRI day 12). The sham (outside the magnet)
MRI/ultrasound group also showed a downward trend, suggesting that environmental and
handling conditions are a factor. (Interestingly, both sham and non-sham groups also
showed post exposure weight loss in the mothers.) Another small study showed a reduced
CRL compared to controls following exposure to MRI at 1.5T on day 7, although the raw
data was not reported (Tyndall 1993). Another study demonstrated an effect on
birthweight at 0.35 T after 16 hours of exposure (Heinrichs, Fong et al. 1988). The
conflicting results are typical given the different imaging parameters, strains of mice and
outcome measures used by the different groups. At high exposure times and field strengths
caution is still required, although even within studies performed by the same group
inconsistencies are found in the results.
62
This effect on growth has never been demonstrated in humans. A prospective study of 74
pregnancies exposed to MRI (EPI 0.5T) in utero showed no difference in individualized
birth ratios when compared to matched controls (Myers, Duncan et al. 1998). Although
infant birthweights were lower in the MRI group, this corresponded with a difference in
gestational age at delivery (although no difference in premature delivery), which may have
been a reflection of increased opportunity for medical intervention in this group.
Heat
Heat generated relating to the radiofrequency pulses is not thought to cause significant
tissue heating outside the gravid uterus. Several studies have demonstrated only marginal
increases in body temperature with MRI (i.e. <0.6C) and even at very high levels of radio
frequency energy exposure, a normal individual is well able to tolerate any changes
(Shellock and Shields 2000). The fetus however is surrounded by fluid which is known to
be poor at dissipating heat, demonstrated in other organs such as the lens of the eye
(Shellock and Crues 1988). Additionally, the gravid uterus may fill the magnet bore,
limiting the airflow around the patient and its cooling effect.
Direct in utero measurements of temperature increases would be difficult to measure in
humans for ethical reasons, but have been measured in pregnant pigs undergoing half
Fourier single-shot turbo spin-echo (HASTE). This technique is has the potential to
deposit more heat than traditional imaging techniques, however no significant changes in
temperature were observed in the fetal brain, abdomen, or amniotic fluid (Levine, Zuo et
al. 2001). Additionally, the safety standards relating to radiofrequency fields include limits
on the specific absorbtion rate (SAR). Researchers have used an electromagnetic solver to
predict the SAR within the fetus in an anatomically realistic model of a pregnant patient
63
and found that at 1.5T (at 64MHz) peak SARs were around 40-60% of those generated in
the mother (Hand, Li et al. 2006).
.In both clinical and research practice, both 0.5 Tesla and 1.5 Tesla magnets have been
extensively used on thousands of women in pregnancy, though safety at 3 Tesla and
beyond is much less established. As in adults and neonates, no harmful effects have been
demonstrated from the associated magnetic and radiofrequency fields.
Auditory Considerations
The gradient magnetic field is the main source of acoustic noise associated with MRI
procedures. Rapid alterations of currents within the gradient coils in the presence of a
strong magnetic field give rise to significant forces (Lorentz) which act upon the coils,
causing them to vibrate and impact against their mountings which in turn vibrate. This
causes loud tapping, banging or chirping noises which will vary with the MRI imaging
parameters. The noise can increase with the strength of the magnet and is at its highest
with modalities such as echoplanar imaging (EPI), due to the extremely fast gradient
gradient switching times and high gradient amplitude.
The problems associated with acoustic noise for adult patients vary from annoyance and
difficulty communicating to temporary or potentially permanent hearing loss. Noise is
defined in terms of frequency (Hz), intensity (dB) and duration and damage to hearing is
dependant on these variables. The sound is affected by the source but also by the
environment i.e. the proximity of surfaces that may reflect the sound, quantified by the
sound pressure level (SPL). The ear is also not equally sensitive at all frequencies, peaking
at around 4Hz, where the most damage can be done. Noise intensity can be weighted to
reflect this in the dB (A) weighted, as opposed to linear, scale.
64
A temporary shift in hearing threshold was reported in 43% undergoing MRI (Brummett,
Talbot et al. 1988) without hearing protection, however if the noise is sufficiently
injurious, the result could be permanent hearing loss at specific frequencies. Permissible
limits in the UK for occupational exposures are peak levels of 135dB and daily/weekly
exposure limits of 85dB (HSE 2005). Safety standards for MRI recommend hearing
protection is worn when noise levels exceed 85dB, offering a reduction when worn
correctly of 10-30dB. Generally noise generated in MRI falls within recognized safety
guidelines however EPI has been recorded as generating noise levels of up to 115 dBA
(Shellock, Ziarati et al. 1998), a level which would be permissible for 15mins per day by
US federal guidelines.
In neonates, numerous studies have suggested a link with prolonged noise exposure (e.g.
in neonatal intensive care environments) and resulting cochlear damage (American
Academy of Pediatrics 1997), however the effects of short term high noise levels has not
been investigated. Preterm infants were also noted to have alterations in monitored vital
signs during MRI procedures (Battin, Maalouf et al. 1998) however a detrimental effect on
hearing nor any other adverse effect has never been confirmed.
In utero, development of fetal hearing organs is complete by 24 weeks and responses to
vibroacoustic stimulation are elicited from this gestation onwards. The threshold for
hearing appears to be around 40 dB at 28 weeks but falls near to adult levels by term (13.5
dB). Animal studies have suggested an increased sensitivity of the developing cochlea to
noise induced damage (Lenoir and Pujol 1980; Pierson 1996), but this effect has not been
demonstrated in humans. Noise exposure has been linked to congenital malformations,
pre-term birth and decreased birth weight. In all studies the insult was prolonged noise
exposure such as air craft or occupational noise, rather than the short exposures
65
experienced during MRI, although even here the evidence remains inconclusive
(American Academy of Pediatrics 1997).
Attempts have been made to assess the sound levels reaching the fetus in utero. Studies in
non-biological and sheep models have demonstrated a complex pattern of transmission of
external noise. As expected, the sound is always significantly attenuated to some degree
by air and by fluid. Sheep are a good model of human pregnancy as like in humans, the
fetus begins to hear in pregnancy and the dimensions of the abdomen of human females
and sheep are similar. At very low frequencies, less than 500Hz sound easily reaches the
sheep fetal head, but above this sounds are attenuated by around 15-20dB (Gerhardt and
Abrams 1996). At very high frequencies the sound pressure within some models would
peak and trough, so that attenuation of sound was reduced (Lecanuet, Gautheron et al.
1998). In MRI however, a peak noise levels are found to be at the low to medium
frequency region of the spectra, (a characteristic which is similar for different MR systems
(Counter, Olofsson et al. 1997)) and are therefore likely to have the most significant
attenuation.
In humans, sound transmission has been recorded in utero, after the rupture of
membranes, which may lead to an underestimation of noise attenuation, as much of the
amniotic fluid impeding the sound may have already been lost. One such study looked at
sound transmitted from a vibroacoustic stimulator across frequencies of 55 – 220Hz to a
hydrophone attached to the fetal ear under ultrasound guidance following artificial rupture
of the membranes (Arulkumaran, Talbert et al. 1992). At a level of 107dB reaching the
maternal abdomen, sounds recorded ranged between 65 to 96dB, an attenuation of
approximately10 – 40dB. Again, the frequencies tested here are generally lower than those
mostly generated by MRI noise, and therefore in MRI the noise is likely to be attenuated
to a greater degree. Therefore a value of 10 – 40dB may be an underestimate both by the
66
presence of more amniotic fluid and by the low to medium sound frequencies generated.
Interestingly background noise with no stimulation was up to 68dB, levels that might
relate to normal conversation or a vacuum cleaner for adults.
Importantly, these levels however do not account for the impedance of fluid in the outer
and middle ears. In sheep, an attempt was made to estimate this effect by measuring the
electrical voltage generated (called the cochlear microphonic) in the inner ear in fetal
sheep in utero and newborn lambs (Gerhardt, Otto et al. 1992). A much greater attenuation
of sound was observed in utero; above 500Hz this was 35 – 45dB, significantly less sound
than that reaching the fetal skull. This data would fit with a scientific model; in water, the
vibration for a given sound pressure is about 1/4000 of that in air, equating to a difference
in sound intensity of around 36dB. If the middle ear is also flooded, a situation which may
be analogous to otitis media, a further reduction of around 20dB may occur. Therefore,
although not directly measurable, there could be a reduction of a further 56dB on top of
the 10 – 40dB predicted from the human experimental model (which may in itself be an
underestimate of the situation in MRI with membranes intact).
Although it is difficult to quantify the exact sounds reaching the fetal cochlea, it is equally
difficult to analyse what levels cause damage. In sheep the effects of steady state long
duration exposures (120dB 16 hour broadband noise) (Gerhardt, Pierson et al. 1999) and
impulse noises (20 rounds of 170dB peak -artillery level) (Pierson, Gerhardt et al. 1994)
were studied. Changes were seen on histology suggestive that intense, long duration, low
frequency sound exposure caused damage rather than high frequency impulse noise.
Children with high frequency hearing loss tested aged 4 to 10 years of age were more
likely to have been exposed consistently to 85-95dB noise, although one of the several
weaknesses in this study was retrospective noise evaluation (Lalande, Hetu et al. 1986).
Similar studies with impulse noise insults have not been performed.
67
Follow up studies of infants exposed to MRI in utero from 20 weeks have demonstrated
no adverse effects on hearing. A series of 20 children from ‘high risk’ pregnancies
exposed to EPI in utero had no abnormality by 3 years of age (Baker, Johnson et al. 1994).
Although no clinical assessment was made as part of the study, the children were all
deemed to have normal hearing by standard pathways of care for hearing assessment. A
second series compared the results of a routine 8-month distraction test compared to
matched controls. These infants had been exposed to MRI at four points during the
pregnancy. Again normal results were found (Clements, Duncan et al. 2000). Of note, no
other differences in neurological/developmental assessments were demonstrated. Both
these studies used EPI, which as mentioned, produces some of the highest noise levels,
although in neither study was this data recorded. Additionally both these studies were
performed using 0.5 Tesla magnets. An increased risk might be predicted from a 1.5 Tesla
magnet due to the increased field strength.
One study in the Netherlands followed up hearing in 35 children aged between 1 and 3
and 9 children between 8 and 9 who underwent MRI in a 1.5T system in the third
trimester (Kok, de Vries et al. 2004). Data included health centre assessments at 3, 6, 9,
14, 24 and 36 months as well as a questionnaire regarding current health. Again, the noise
levels were not measured but MR sequences included half-Fourier acquisition single shot
turbo spin-echo (HASTE), which would be expected to generate high noise levels. The
total examination times were between 40 and 70 minutes. No abnormalities in hearing
function as a result of MR exposure were observed; 2 children failed the hearing screening
at the health centre, one child was diagnosed as having cholesteatoma secondary to
recurrent ear infections and the hearing of the second child was found to be normal on
further assessment at the ear, nose and throat department.
68
Although numbers in these follow up studies are small, thousands of in utero MRI scans
have now been performed and no effect on hearing has been seen. Difficulties arise in
assessing the possibility for damage in that direct in utero measurements of sound
reaching the cochlea cannot be measured ethically in humans and the threshold at which
hearing may be affected in the fetus is not clear cut. All the evidence in non-biological,
animal and human studies suggest there is a significant attenuation of noise reaching the
fetus and that the size of this is probably larger than would be provided by ear protection
worn by the adult. In industrial situations caution is advised; the American Conference of
Governmental Industrial Hygienists recommended a threshold limit value that called for
women to avoid steady state noise levels of >115dB and impulses >155dB peak (levels
which are not exceeded in MRI, even in worst case scenarios). No such pregnancy specific
recommendation exists in the UK, but sound levels are likely to be much below 135dB the
recommended peak exposure level and for short durations. Efforts should be made to
reduce noise where possible and researchers should continue to follow up those exposed to
in utero MRI. However, women should feel confident that all the evidence suggests that
the noise levels reaching the fetus are not of sufficient intensity or for long enough
duration to cause damage and indeed an effect in humans has never been demonstrated.
Maternal Considerations
In the heavily pregnant woman, comfort within the MRI scanner may be an issue. Women
may be scanned on their side or in a left lateral tilt position, with the aid of a support, to
reduce vena cavil compression. There is an increased potential for anxiety or
claustrophobia, as the abdomen may fill the magnet bore and some women may prefer to
enter the scanner feet first. Very few groups have looked at the psychological impact of
MRI in pregnancy. One small questionnaire in volunteers suggested it was generally well
tolerated and that claustrophobia was uncommon.
69
Contrast agents
Gadolinium is not recommended for use in pregnancy. It is able to cross the placenta but
it’s half life with the fetal circulation is not known, as it is excreted into the amniotic fluid
and re-ingested and has demonstrated adverse effects in high doses in animal
studies(Magnevist 2000). In 2006, a potential link with nephrogenic systemic fibrosis (a
disorder with causes fibrosis of the skin and connective tissues in association with renal
failure) has further prohibited it’s use in pregnancy, as the fetus may be more susceptible
to developing this condition. Gadolinium has been used shortly prior to delivery for the
assessment of placenta accreta (Tanaka, Sohda et al. 2001), when due to timing the effect
of reabsorption is minimized.
1.4.5.3 Conclusions on Safety of MRI in Pregnancy
There is no evidence to suggest that MRI is unsafe in pregnancy provided the standard
safety limits and protocols applicable to adults are adhered to. Importantly, no adverse
affects have been demonstrated from MRI in pregnancy, including no association with
FGR (a concern raised inconsistently in mice studies) and no effect on child hearing (it is
likely that the amniotic fluid and flooding of the ear provides more than adequate
protection). As technology advances and higher field strengths become available, it is
right that both researchers and clinicians to continue to assess fetal outcomes. However, at
low field strengths, safety of MRI in pregnancy is well established and women they should
be reassured of this, as part of the counselling process.
70
1.4 Summary and Purpose of the Proposed Investigation
The review of the literature in the previous chapters highlights the importance of FGR as a
serious complication of pregnancy with associated poor fetal outcomes. It also discusses
the difficulties in diagnosing and predicting the condition. In clinical obstetrics, ultrasound
biometry and Dopplers of the uterine and umbilical vessels are the main investigations
available to diagnose and predict FGR. Despite rapid progress in the use of antenatal
ultrasound, a sufficiently predictive test for the condition has yet to be developed.
Additionally, it may not be always be possible to differentiate the small, but healthy fetus
from one affected by FGR and ultrasound may miss the diagnosis, when the fetal growth
is failing, but biometric measurements remain within normal limits. These difficulties in
practice lead to large heterogenous group of women (some with suspected FGR on the
basis of biometric fetal measurements or amniotic fluid volumes and some with risk
factors for FGR), all undergoing fetal surveillance and even facing unnecessary
intervention, as the precise risks to the fetus are difficult to define and may only become
clear at a late stage in the disease. Ultrasound Dopplers are an investigation of one aspect
of placental function, that is blood flow in the uteroplacental circulations and they have
been extremely successful in enabling us to stratify risk to the fetus in suspected FGR.
However, as discussed in the review, other aspects of placental structure and function are
altered in FGR, including morphology at the gross and microscopic level and blood flow
within the placental microcirculations. Although it is not yet known how all such variables
relate to fetal risk, development of tools to identify these altered placental features and the
‘placental FGR phenotype’ in utero, may allow more rigorous definitions of the condition,
improve our ability to stratify disease and potentially even provide predictive tests for
condition.
71
Specific aims of this project are;
1. To develop and use MRI techniques for examining placental structure and function in
normal human pregnancies; including placental volumetry, placental MR relaxation times
T1 and T2, and parameters relating to blood flow measured by Intra-Voxel Incoherent
Motion (IVIM) and Arterial Spin Labelling (ASL) methods.
2. To carry out MRI examinations and perform measurements of the above placental
indices in pregnancies complicated by Fetal Growth Restriction (FGR).
3. To correlate these data with stereological assessments of the placental morphology.
4. To compare data between groups affected by FGR and normal pregnancy, drawing
conclusions as to whether MRI could be used as a clinical tool to distinguish these
phenotypes.
72
1.5 Further notes on methodology
MRI Relaxation times
Relaxation times are MRI measurements that reflect the recovery of magnetisation
following perturbation using a radiofrequency pulse in the scanner. The relaxation times
are determined by the molecular environment of the hydrogen nuclei (the hydrogen
nucleus is a single positively charged proton) within the tissue. In biological systems,
water may be free in blood (or CSF) but is usually associated with large polysaccharides
and proteins, which restrict proton movement. Relaxation occurs by two independent
processes, referred to as longitudinal (spin-lattice) (T1) and transverse (spin-spin) (T2)
relaxation, the rate of which depends upon the interaction between protons and their
surrounding environment. The relaxation times T1 and T2 characterise these processes and
may be measured non-invasively in vivo. Different body tissues have specific
characteristic relaxation times, which reflect the number of protons that are ‘free’ i.e. in
solution, ‘bound’ i.e. closely associated with macromolecules and those in an intermediate
situation, often termed ‘structured’. T1 and T2 measurements were acquired with whole
placental coverage, co-localised with the structural scans. The aim of achieving whole
placental coverage was to try to allow cross-reference to the placenta when delivered i.e.
a placenta lobule of interest on scan be matched to a lobule of interest following placental
delivery. T1 measurements were achieved using a 3D multiple flip angle fast field echo
(FFE; spoiled gradient echo) technique with angles 2, 10 & 20 degrees with an acquisition
time of 10 seconds for each volume (Fram, Herfkens et al. 1987). T2 measurements, with
the same geometry, were acquired with a double echo spin echo sequence using echo
times of 6.3 ms and 200 ms on a slice by slice basis, repetition times 400ms each echo,
taking 4 seconds per slice.
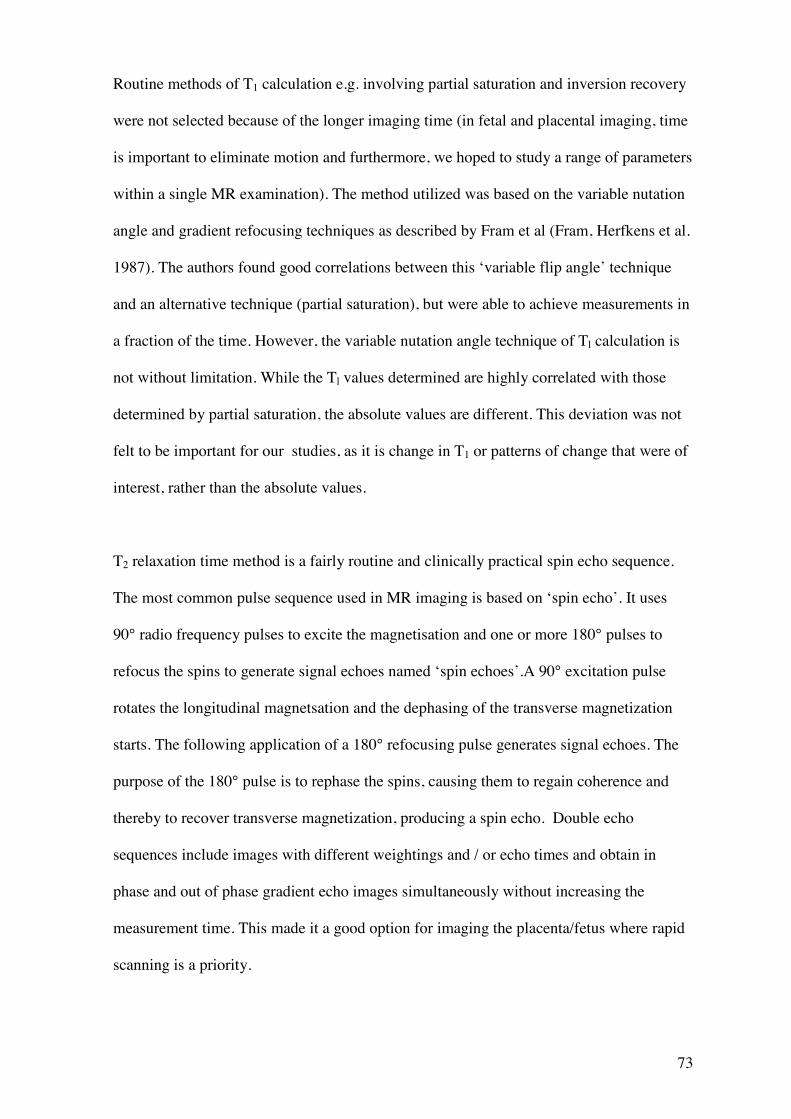
73
Routine methods of T1 calculation e.g. involving partial saturation and inversion recovery
were not selected because of the longer imaging time (in fetal and placental imaging, time
is important to eliminate motion and furthermore, we hoped to study a range of parameters
within a single MR examination). The method utilized was based on the variable nutation
angle and gradient refocusing techniques as described by Fram et al (Fram, Herfkens et al.
1987). The authors found good correlations between this ‘variable flip angle’ technique
and an alternative technique (partial saturation), but were able to achieve measurements in
a fraction of the time. However, the variable nutation angle technique of Tl calculation is
not without limitation. While the Tl values determined are highly correlated with those
determined by partial saturation, the absolute values are different. This deviation was not
felt to be important for our studies, as it is change in T1 or patterns of change that were of
interest, rather than the absolute values.
T2 relaxation time method is a fairly routine and clinically practical spin echo sequence.
The most common pulse sequence used in MR imaging is based on ‘spin echo’. It uses
90° radio frequency pulses to excite the magnetisation and one or more 180° pulses to
refocus the spins to generate signal echoes named ‘spin echoes’.A 90° excitation pulse
rotates the longitudinal magnetsation and the dephasing of the transverse magnetization
starts. The following application of a 180° refocusing pulse generates signal echoes. The
purpose of the 180° pulse is to rephase the spins, causing them to regain coherence and
thereby to recover transverse magnetization, producing a spin echo. Double echo
sequences include images with different weightings and / or echo times and obtain in
phase and out of phase gradient echo images simultaneously without increasing the
measurement time. This made it a good option for imaging the placenta/fetus where rapid
scanning is a priority.
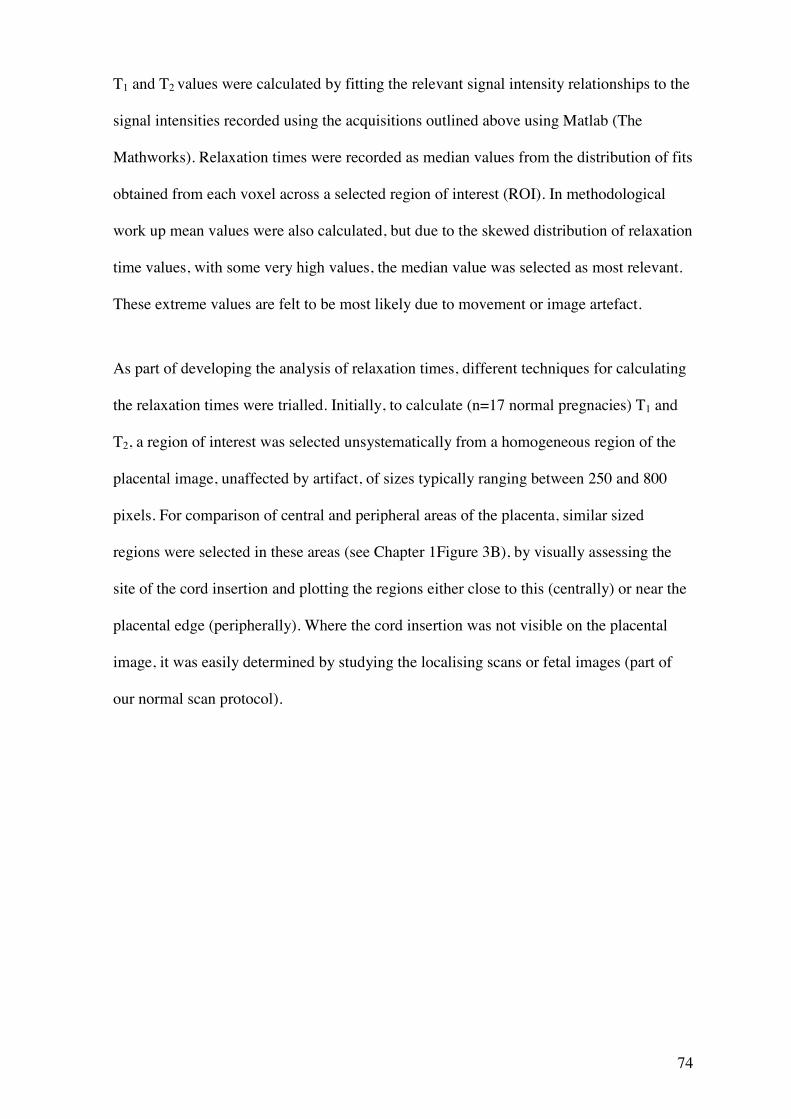
74
T1 and T2 values were calculated by fitting the relevant signal intensity relationships to the
signal intensities recorded using the acquisitions outlined above using Matlab (The
Mathworks). Relaxation times were recorded as median values from the distribution of fits
obtained from each voxel across a selected region of interest (ROI). In methodological
work up mean values were also calculated, but due to the skewed distribution of relaxation
time values, with some very high values, the median value was selected as most relevant.
These extreme values are felt to be most likely due to movement or image artefact.
As part of developing the analysis of relaxation times, different techniques for calculating
the relaxation times were trialled. Initially, to calculate (n=17 normal pregnacies) T1 and
T2, a region of interest was selected unsystematically from a homogeneous region of the
placental image, unaffected by artifact, of sizes typically ranging between 250 and 800
pixels. For comparison of central and peripheral areas of the placenta, similar sized
regions were selected in these areas (see Chapter 1Figure 3B), by visually assessing the
site of the cord insertion and plotting the regions either close to this (centrally) or near the
placental edge (peripherally). Where the cord insertion was not visible on the placental
image, it was easily determined by studying the localising scans or fetal images (part of
our normal scan protocol).
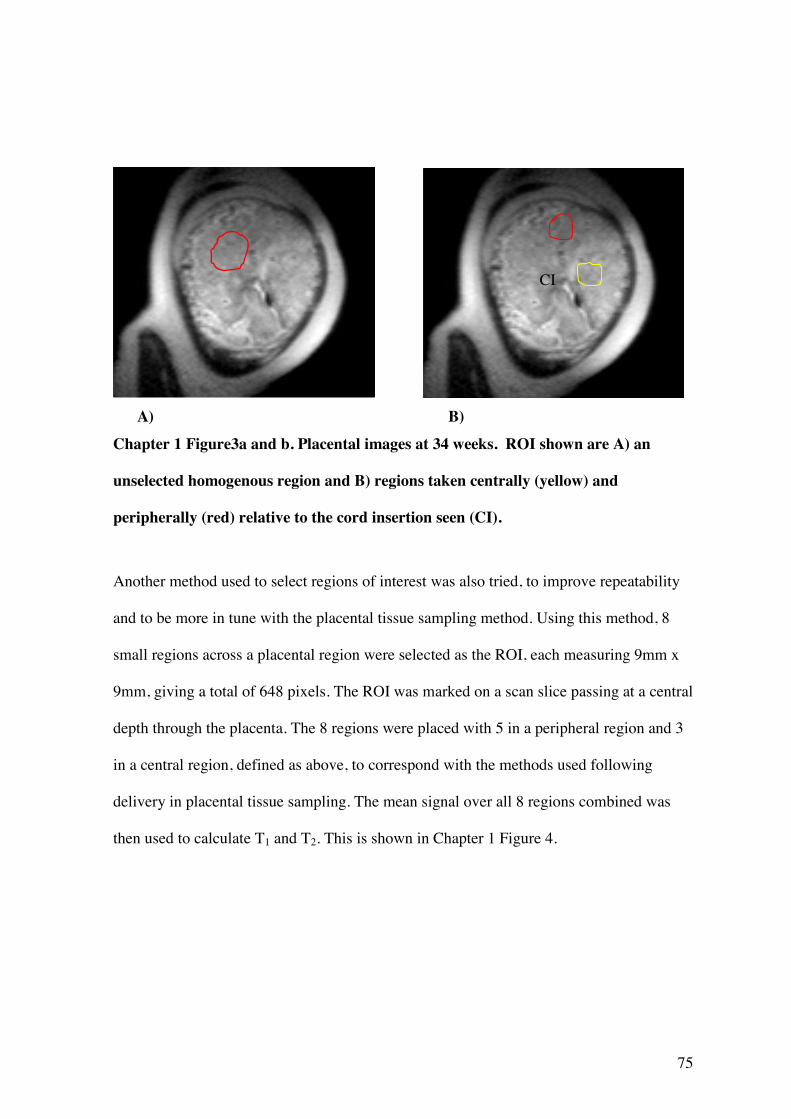
75
A) B) Chapter 1 Figure3a and b. Placental images at 34 weeks. ROI shown are A) an
unselected homogenous region and B) regions taken centrally (yellow) and
peripherally (red) relative to the cord insertion seen (CI).
Another method used to select regions of interest was also tried, to improve repeatability
and to be more in tune with the placental tissue sampling method. Using this method, 8
small regions across a placental region were selected as the ROI, each measuring 9mm x
9mm, giving a total of 648 pixels. The ROI was marked on a scan slice passing at a central
depth through the placenta. The 8 regions were placed with 5 in a peripheral region and 3
in a central region, defined as above, to correspond with the methods used following
delivery in placental tissue sampling. The mean signal over all 8 regions combined was
then used to calculate T1 and T2. This is shown in Chapter 1 Figure 4.
CI
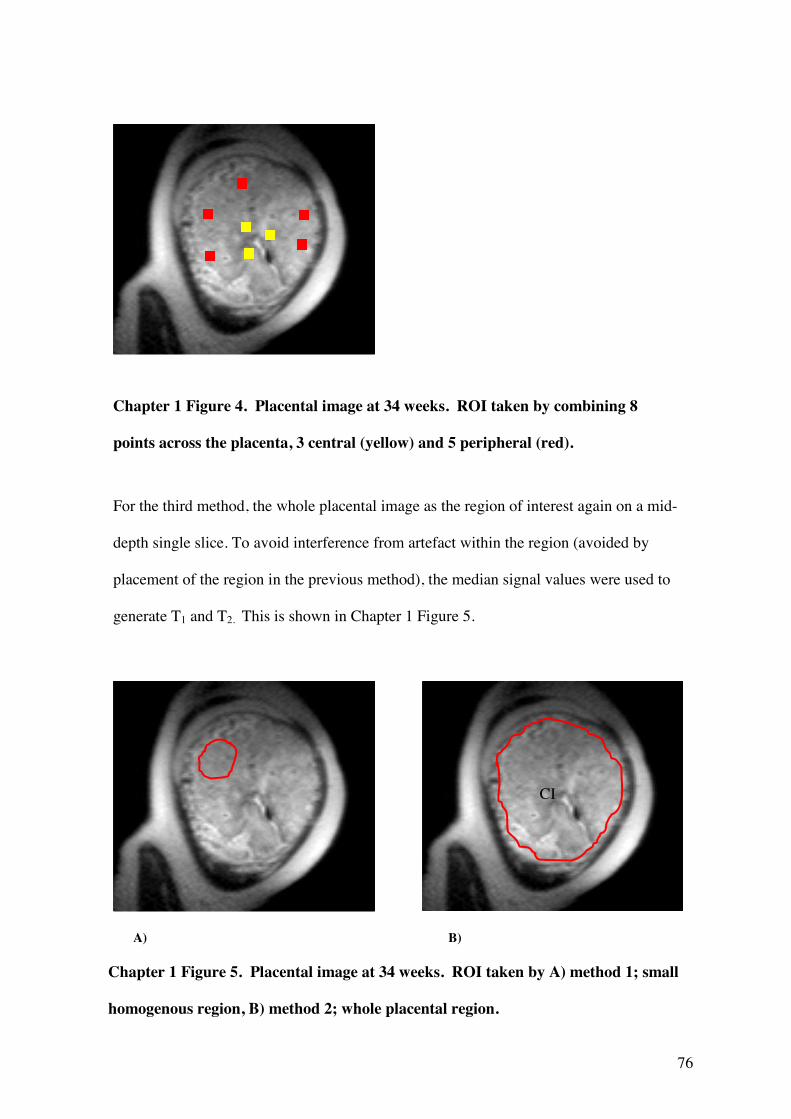
76
Statistical Analysis
For the third method, the whole placental image as the region of interest again on a mid-
depth single slice. To avoid interference from artefact within the region (avoided by
placement of the region in the previous method), the median signal values were used to
generate T1 and T2. This is shown in Chapter 1 Figure 5.
A) B)
CI
Chapter 1 Figure 4. Placental image at 34 weeks. ROI taken by combining 8
points across the placenta, 3 central (yellow) and 5 peripheral (red).
Chapter 1 Figure 5. Placental image at 34 weeks. ROI taken by A) method 1; small
homogenous region, B) method 2; whole placental region.
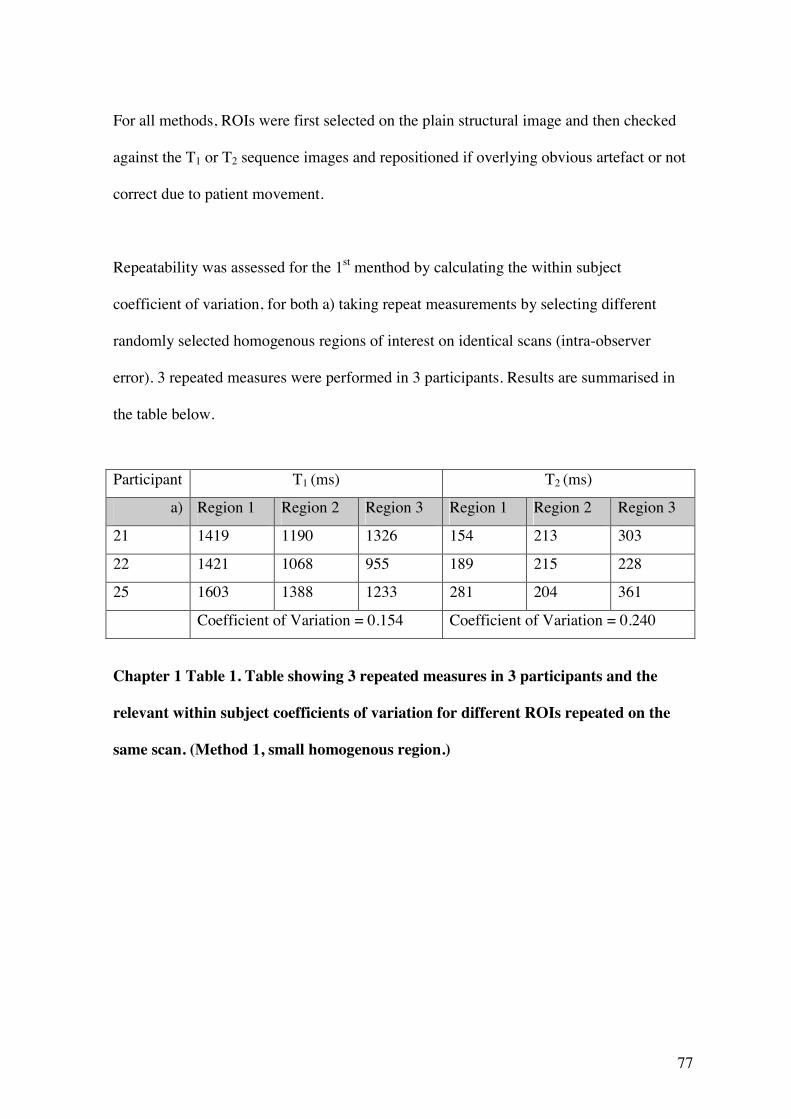
77
For all methods, ROIs were first selected on the plain structural image and then checked
against the T1 or T2 sequence images and repositioned if overlying obvious artefact or not
correct due to patient movement.
Repeatability was assessed for the 1st menthod by calculating the within subject
coefficient of variation, for both a) taking repeat measurements by selecting different
randomly selected homogenous regions of interest on identical scans (intra-observer
error). 3 repeated measures were performed in 3 participants. Results are summarised in
the table below.
Participant T1 (ms) T2 (ms)
a) Region 1 Region 2 Region 3 Region 1 Region 2 Region 3
21 1419 1190 1326 154 213 303
22 1421 1068 955 189 215 228
25 1603 1388 1233 281 204 361
Coefficient of Variation = 0.154 Coefficient of Variation = 0.240
Chapter 1 Table 1. Table showing 3 repeated measures in 3 participants and the
relevant within subject coefficients of variation for different ROIs repeated on the
same scan. (Method 1, small homogenous region.)
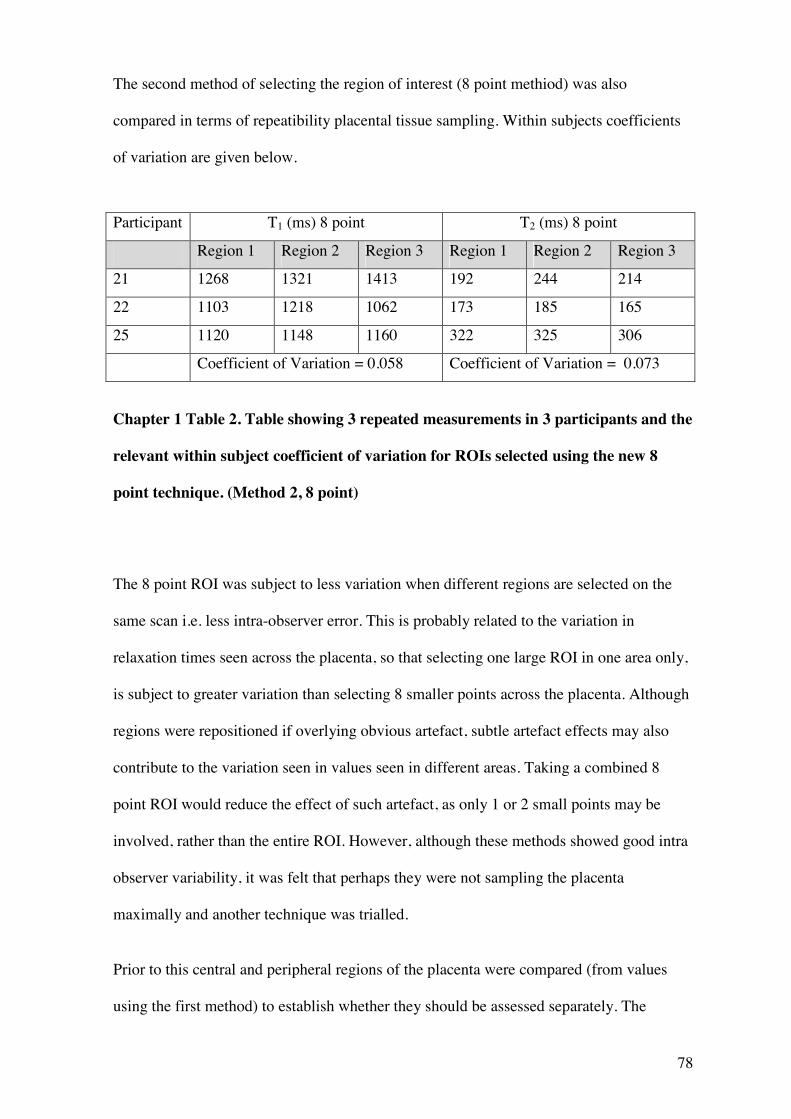
78
The second method of selecting the region of interest (8 point methiod) was also
compared in terms of repeatibility placental tissue sampling. Within subjects coefficients
of variation are given below.
Participant T1 (ms) 8 point T2 (ms) 8 point
Region 1 Region 2 Region 3 Region 1 Region 2 Region 3
21 1268 1321 1413 192 244 214
22 1103 1218 1062 173 185 165
25 1120 1148 1160 322 325 306
Coefficient of Variation = 0.058 Coefficient of Variation = 0.073
Chapter 1 Table 2. Table showing 3 repeated measurements in 3 participants and the
relevant within subject coefficient of variation for ROIs selected using the new 8
point technique. (Method 2, 8 point)
The 8 point ROI was subject to less variation when different regions are selected on the
same scan i.e. less intra-observer error. This is probably related to the variation in
relaxation times seen across the placenta, so that selecting one large ROI in one area only,
is subject to greater variation than selecting 8 smaller points across the placenta. Although
regions were repositioned if overlying obvious artefact, subtle artefact effects may also
contribute to the variation seen in values seen in different areas. Taking a combined 8
point ROI would reduce the effect of such artefact, as only 1 or 2 small points may be
involved, rather than the entire ROI. However, although these methods showed good intra
observer variability, it was felt that perhaps they were not sampling the placenta
maximally and another technique was trialled.
Prior to this central and peripheral regions of the placenta were compared (from values
using the first method) to establish whether they should be assessed separately. The

79
Wilcoxon’s matched pairs test for non-parametric data was used. There were no
significant differences between central and peripheral placental regions in terms of either
T1 (p=0.727) or T2 (p=0.3379). There was also no clear pattern between paired (same
placenta) central and peripheral values, see Chapter 1 Figure 6 and 7. On the basis of this
it was decided the most appropriate method was the third method encorporating the whole
placental region, as differences between central and peripheral areas were not felt to be
significant and this sampled the placenta maximally.
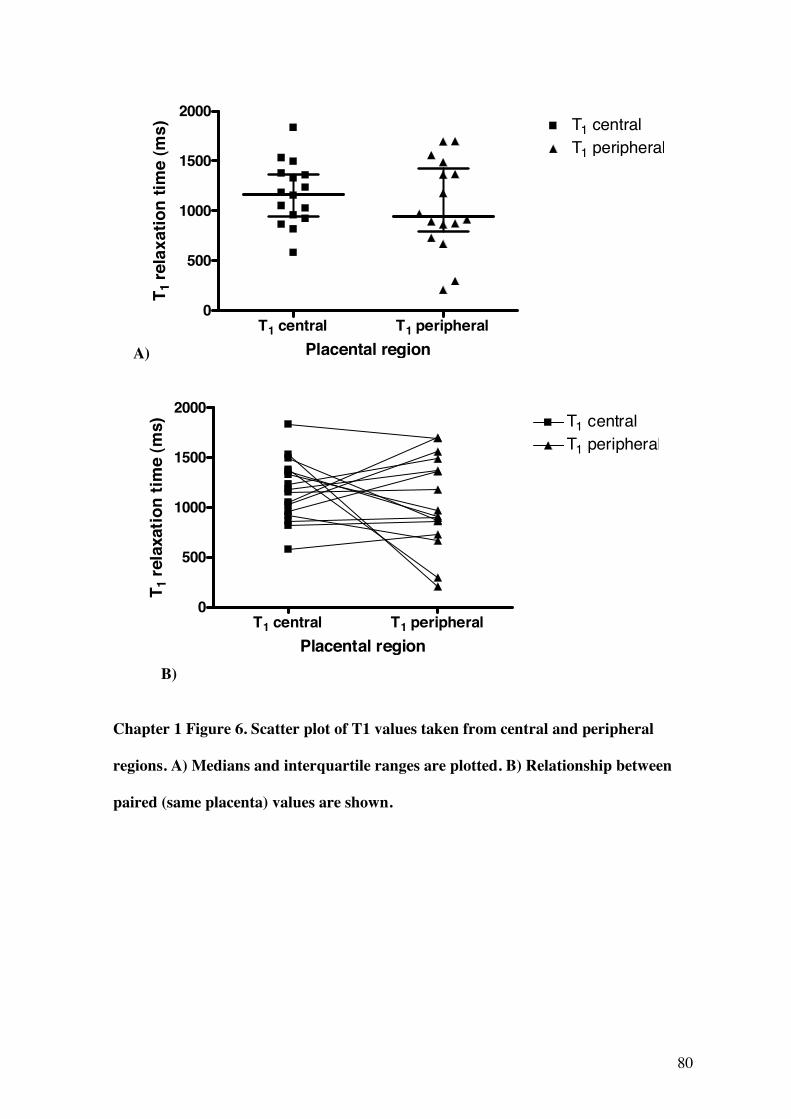
80
A)
T1 central T1 peripheral0
500
1000
1500
2000T1 centralT1 peripheral
Placental region
T 1re
laxa
tion
time
(ms)
T1 central T1 peripheral0
500
1000
1500
2000T1 centralT1 peripheral
Placental region
T 1re
laxa
tion
time
(ms)
B)
Chapter 1 Figure 6. Scatter plot of T1 values taken from central and peripheral
regions. A) Medians and interquartile ranges are plotted. B) Relationship between
paired (same placenta) values are shown.
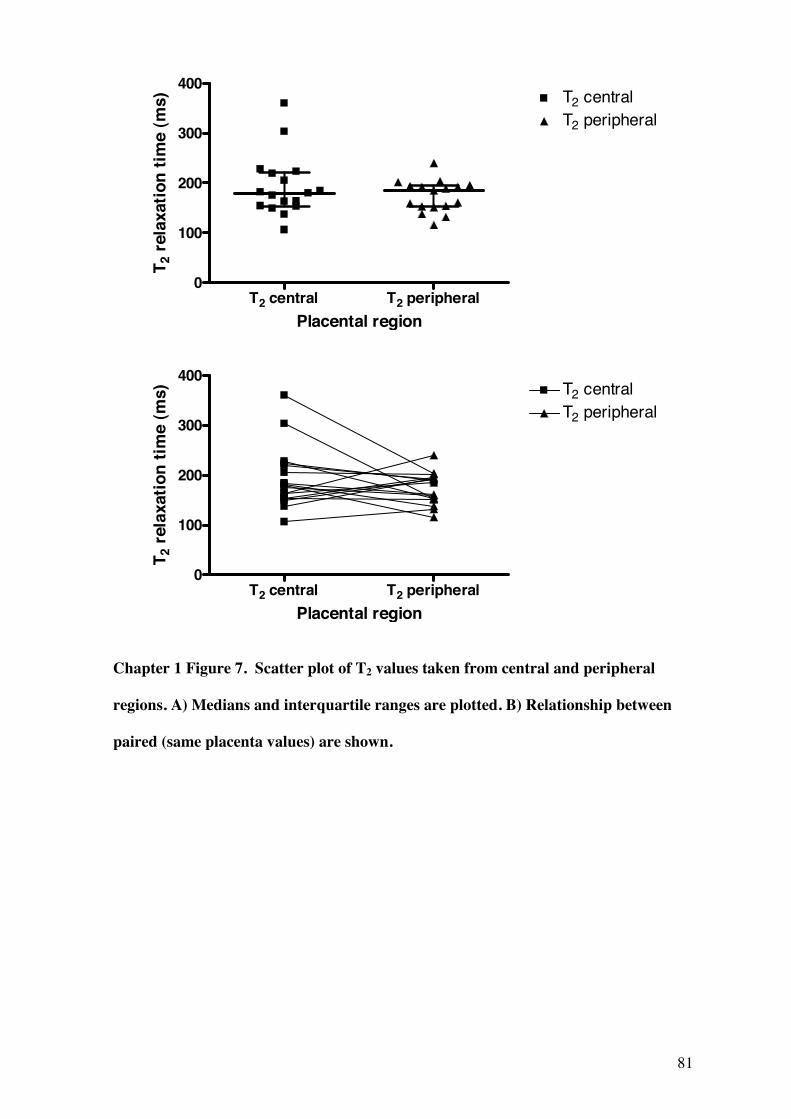
81
T2 central T2 peripheral0
100
200
300
400T2 centralT2 peripheral
Placental region
T 2 r
elax
atio
n tim
e (m
s)
T2 central T2 peripheral0
100
200
300
400T2 centralT2 peripheral
Placental region
T 2 r
elax
atio
n tim
e (m
s)
Chapter 1 Figure 7. Scatter plot of T2 values taken from central and peripheral
regions. A) Medians and interquartile ranges are plotted. B) Relationship between
paired (same placenta values) are shown.
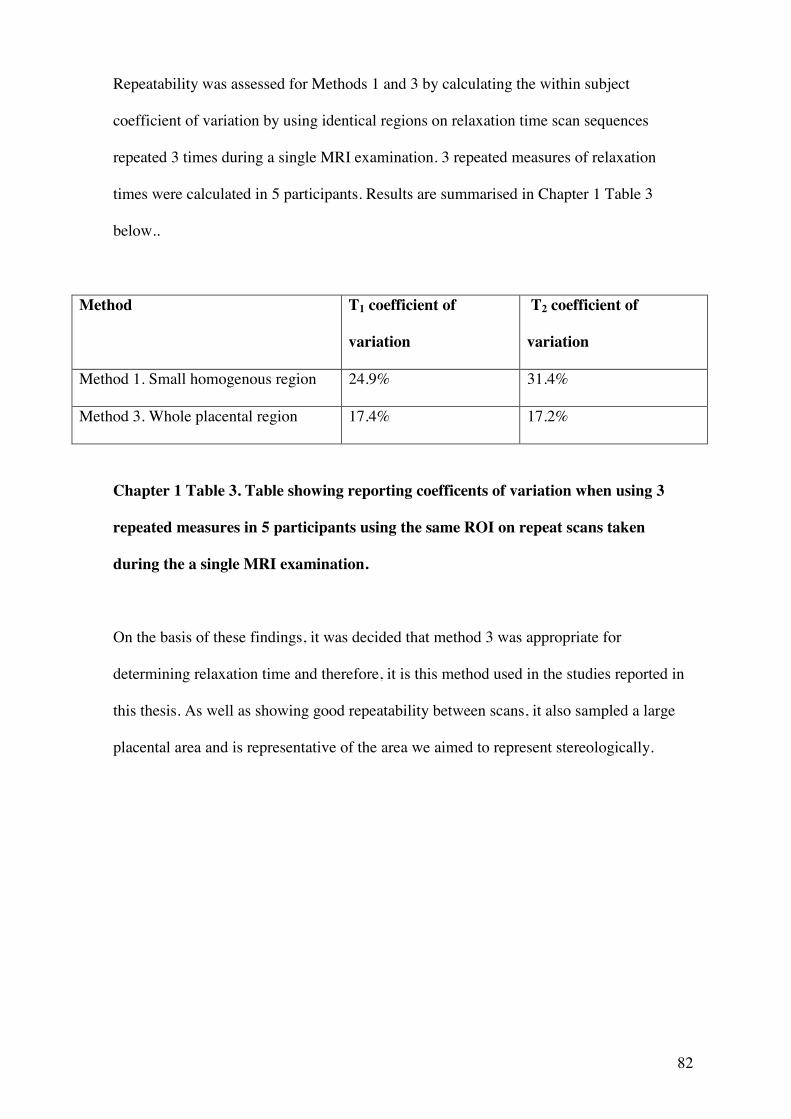
82
Repeatability was assessed for Methods 1 and 3 by calculating the within subject
coefficient of variation by using identical regions on relaxation time scan sequences
repeated 3 times during a single MRI examination. 3 repeated measures of relaxation
times were calculated in 5 participants. Results are summarised in Chapter 1 Table 3
below..
Method T1 coefficient of
variation
T2 coefficient of
variation
Method 1. Small homogenous region 24.9% 31.4%
Method 3. Whole placental region 17.4% 17.2%
Chapter 1 Table 3. Table showing reporting coefficents of variation when using 3
repeated measures in 5 participants using the same ROI on repeat scans taken
during the a single MRI examination.
On the basis of these findings, it was decided that method 3 was appropriate for
determining relaxation time and therefore, it is this method used in the studies reported in
this thesis. As well as showing good repeatability between scans, it also sampled a large
placental area and is representative of the area we aimed to represent stereologically.
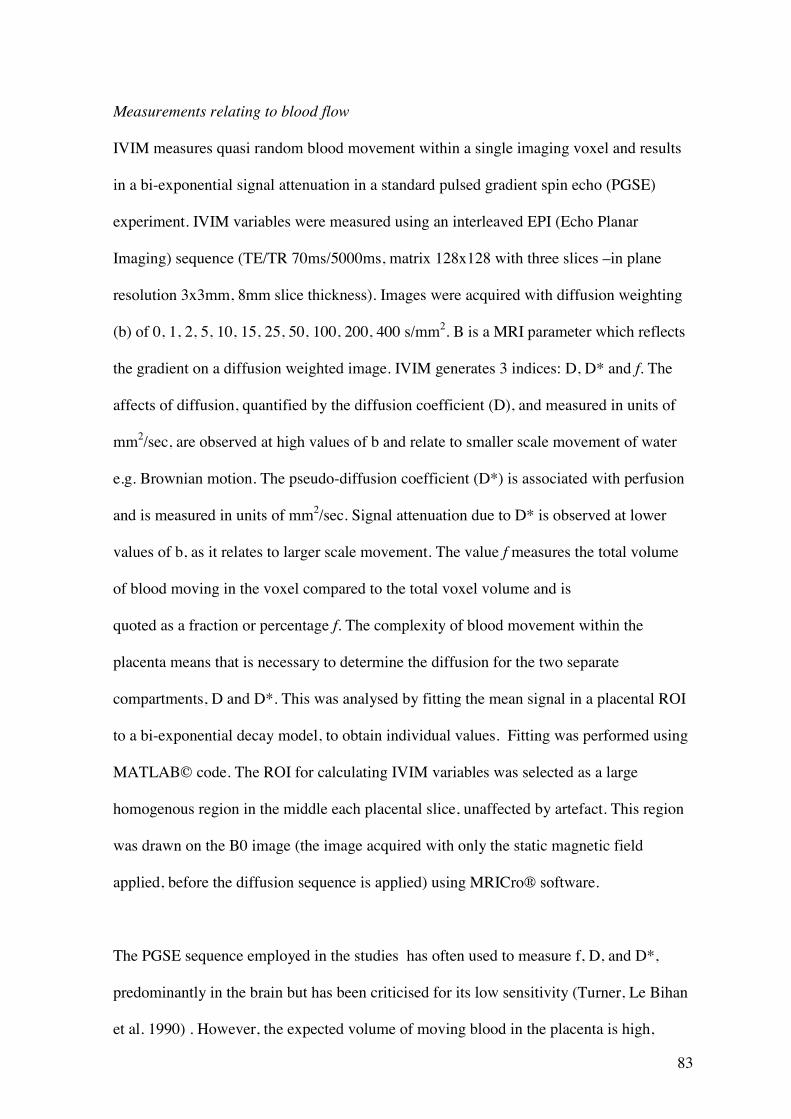
83
Measurements relating to blood flow
IVIM measures quasi random blood movement within a single imaging voxel and results
in a bi-exponential signal attenuation in a standard pulsed gradient spin echo (PGSE)
experiment. IVIM variables were measured using an interleaved EPI (Echo Planar
Imaging) sequence (TE/TR 70ms/5000ms, matrix 128x128 with three slices –in plane
resolution 3x3mm, 8mm slice thickness). Images were acquired with diffusion weighting
(b) of 0, 1, 2, 5, 10, 15, 25, 50, 100, 200, 400 s/mm2. B is a MRI parameter which reflects
the gradient on a diffusion weighted image. IVIM generates 3 indices: D, D* and f. The
affects of diffusion, quantified by the diffusion coefficient (D), and measured in units of
mm2/sec, are observed at high values of b and relate to smaller scale movement of water
e.g. Brownian motion. The pseudo-diffusion coefficient (D*) is associated with perfusion
and is measured in units of mm2/sec. Signal attenuation due to D* is observed at lower
values of b, as it relates to larger scale movement. The value f measures the total volume
of blood moving in the voxel compared to the total voxel volume and is
quoted as a fraction or percentage f. The complexity of blood movement within the
placenta means that is necessary to determine the diffusion for the two separate
compartments, D and D*. This was analysed by fitting the mean signal in a placental ROI
to a bi-exponential decay model, to obtain individual values. Fitting was performed using
MATLAB© code. The ROI for calculating IVIM variables was selected as a large
homogenous region in the middle each placental slice, unaffected by artefact. This region
was drawn on the B0 image (the image acquired with only the static magnetic field
applied, before the diffusion sequence is applied) using MRICro® software.
The PGSE sequence employed in the studies has often used to measure f, D, and D*,
predominantly in the brain but has been criticised for its low sensitivity (Turner, Le Bihan
et al. 1990) . However, the expected volume of moving blood in the placenta is high,
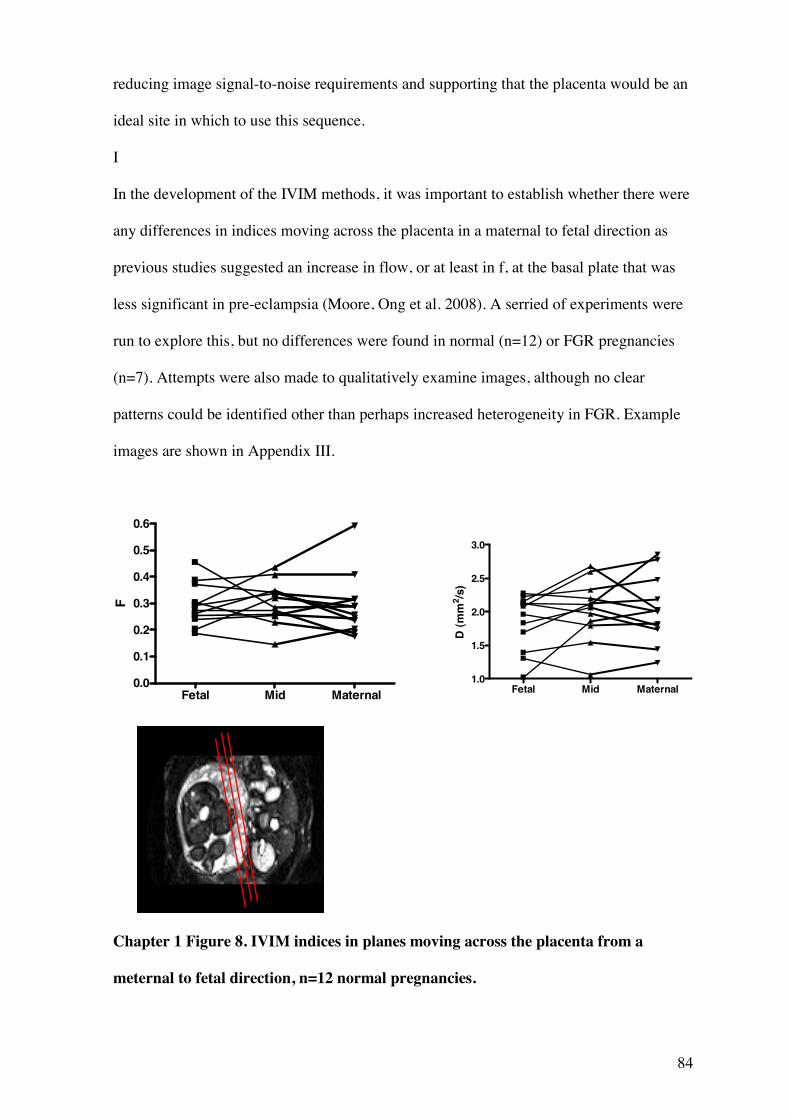
84
reducing image signal-to-noise requirements and supporting that the placenta would be an
ideal site in which to use this sequence.
I
In the development of the IVIM methods, it was important to establish whether there were
any differences in indices moving across the placenta in a maternal to fetal direction as
previous studies suggested an increase in flow, or at least in f, at the basal plate that was
less significant in pre-eclampsia (Moore, Ong et al. 2008). A serried of experiments were
run to explore this, but no differences were found in normal (n=12) or FGR pregnancies
(n=7). Attempts were also made to qualitatively examine images, although no clear
patterns could be identified other than perhaps increased heterogeneity in FGR. Example
images are shown in Appendix III.
Chapter 1 Figure 8. IVIM indices in planes moving across the placenta from a
meternal to fetal direction, n=12 normal pregnancies.
Fetal Mid Maternal0.0
0.1
0.2
0.3
0.4
0.5
0.6
F
Fetal Mid Maternal1.0
1.5
2.0
2.5
3.0
D (m
m2 /s
)
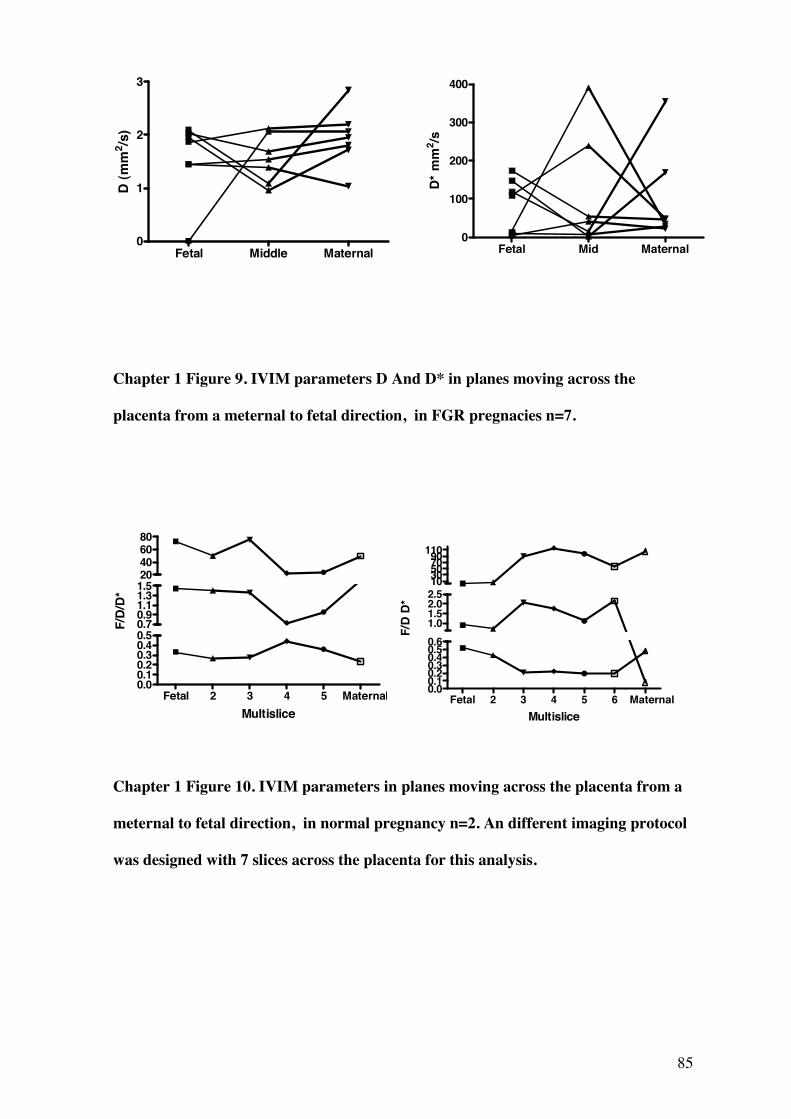
85
Chapter 1 Figure 9. IVIM parameters D And D* in planes moving across the
placenta from a meternal to fetal direction, in FGR pregnacies n=7.
Chapter 1 Figure 10. IVIM parameters in planes moving across the placenta from a
meternal to fetal direction, in normal pregnancy n=2. An different imaging protocol
was designed with 7 slices across the placenta for this analysis.
Fetal 2 3 4 5 Maternal0.00.10.20.30.40.50.70.91.11.31.520406080
Multislice
F/D
/D*
Fetal 2 3 4 5 6 Maternal0.00.10.20.30.40.50.61.01.52.02.51030507090110
Multislice
F/D
D*
Fetal Middle Maternal0
1
2
3
D (m
m2 /s
)
Fetal Mid Maternal0
100
200
300
400
D* m
m2 /s
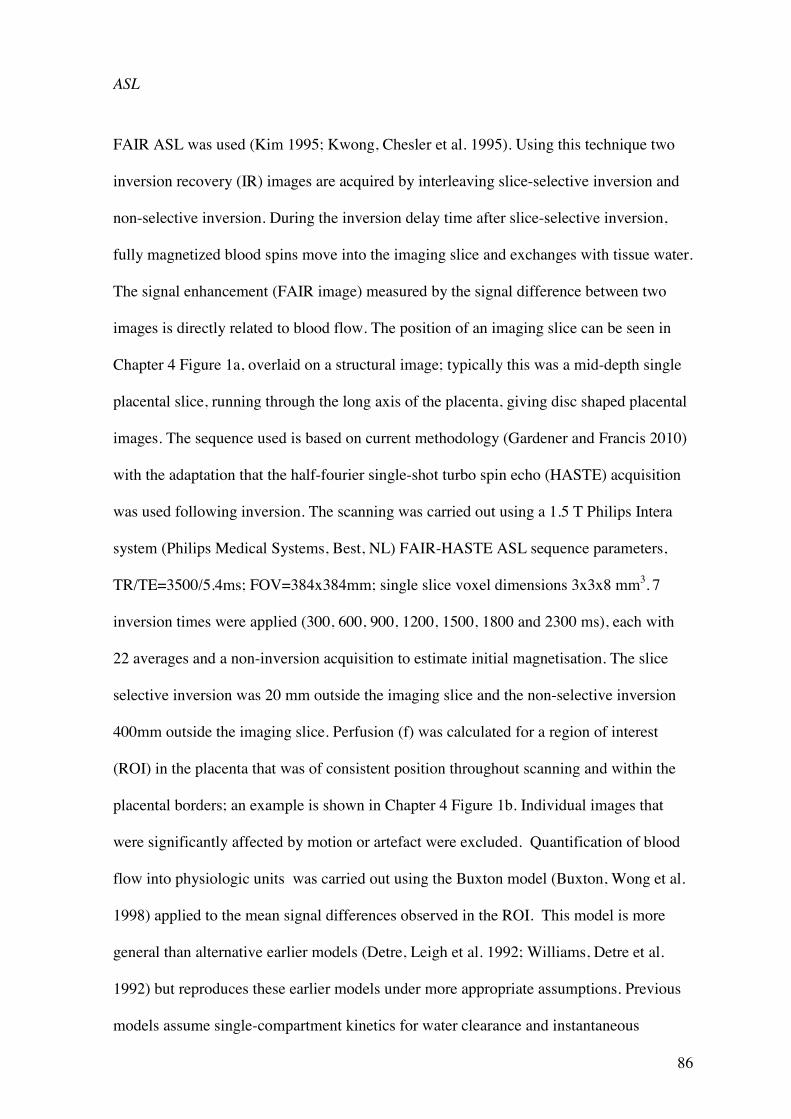
86
ASL
FAIR ASL was used (Kim 1995; Kwong, Chesler et al. 1995). Using this technique two
inversion recovery (IR) images are acquired by interleaving slice-selective inversion and
non-selective inversion. During the inversion delay time after slice-selective inversion,
fully magnetized blood spins move into the imaging slice and exchanges with tissue water.
The signal enhancement (FAIR image) measured by the signal difference between two
images is directly related to blood flow. The position of an imaging slice can be seen in
Chapter 4 Figure 1a, overlaid on a structural image; typically this was a mid-depth single
placental slice, running through the long axis of the placenta, giving disc shaped placental
images. The sequence used is based on current methodology (Gardener and Francis 2010)
with the adaptation that the half-fourier single-shot turbo spin echo (HASTE) acquisition
was used following inversion. The scanning was carried out using a 1.5 T Philips Intera
system (Philips Medical Systems, Best, NL) FAIR-HASTE ASL sequence parameters,
TR/TE=3500/5.4ms; FOV=384x384mm; single slice voxel dimensions 3x3x8 mm3. 7
inversion times were applied (300, 600, 900, 1200, 1500, 1800 and 2300 ms), each with
22 averages and a non-inversion acquisition to estimate initial magnetisation. The slice
selective inversion was 20 mm outside the imaging slice and the non-selective inversion
400mm outside the imaging slice. Perfusion (f) was calculated for a region of interest
(ROI) in the placenta that was of consistent position throughout scanning and within the
placental borders; an example is shown in Chapter 4 Figure 1b. Individual images that
were significantly affected by motion or artefact were excluded. Quantification of blood
flow into physiologic units was carried out using the Buxton model (Buxton, Wong et al.
1998) applied to the mean signal differences observed in the ROI. This model is more
general than alternative earlier models (Detre, Leigh et al. 1992; Williams, Detre et al.
1992) but reproduces these earlier models under more appropriate assumptions. Previous
models assume single-compartment kinetics for water clearance and instantaneous
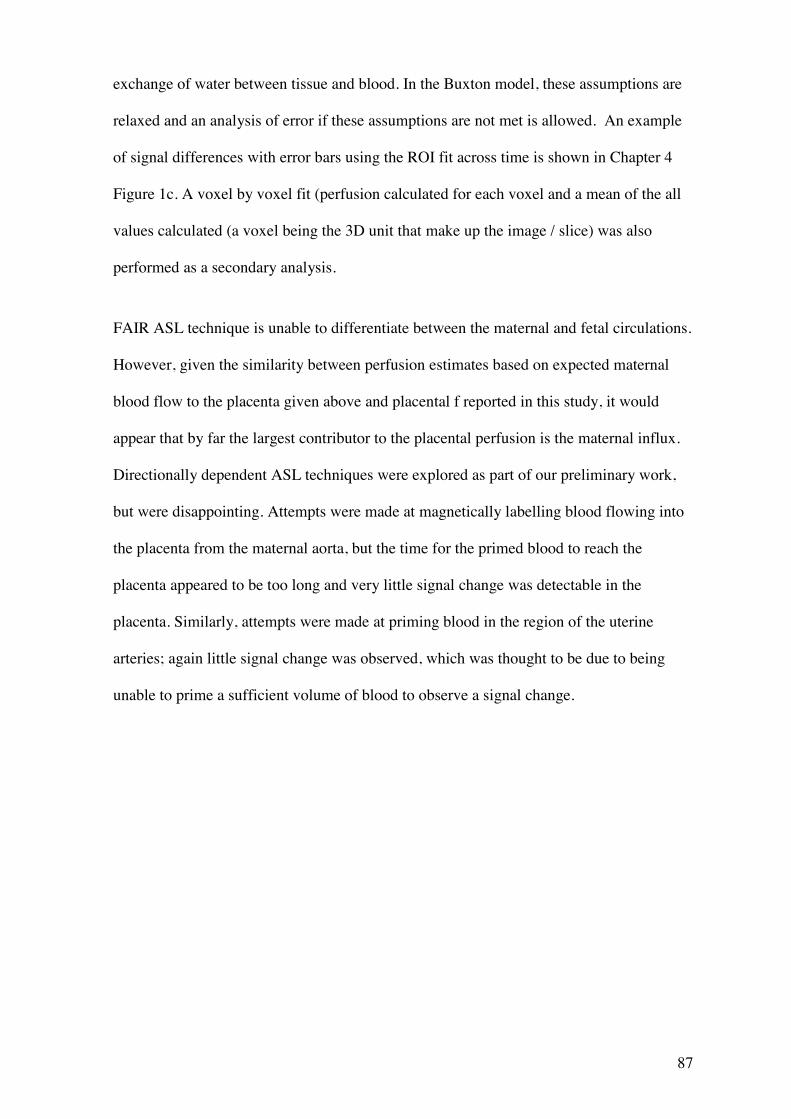
87
exchange of water between tissue and blood. In the Buxton model, these assumptions are
relaxed and an analysis of error if these assumptions are not met is allowed. An example
of signal differences with error bars using the ROI fit across time is shown in Chapter 4
Figure 1c. A voxel by voxel fit (perfusion calculated for each voxel and a mean of the all
values calculated (a voxel being the 3D unit that make up the image / slice) was also
performed as a secondary analysis.
FAIR ASL technique is unable to differentiate between the maternal and fetal circulations.
However, given the similarity between perfusion estimates based on expected maternal
blood flow to the placenta given above and placental f reported in this study, it would
appear that by far the largest contributor to the placental perfusion is the maternal influx.
Directionally dependent ASL techniques were explored as part of our preliminary work,
but were disappointing. Attempts were made at magnetically labelling blood flowing into
the placenta from the maternal aorta, but the time for the primed blood to reach the
placenta appeared to be too long and very little signal change was detectable in the
placenta. Similarly, attempts were made at priming blood in the region of the uterine
arteries; again little signal change was observed, which was thought to be due to being
unable to prime a sufficient volume of blood to observe a signal change.
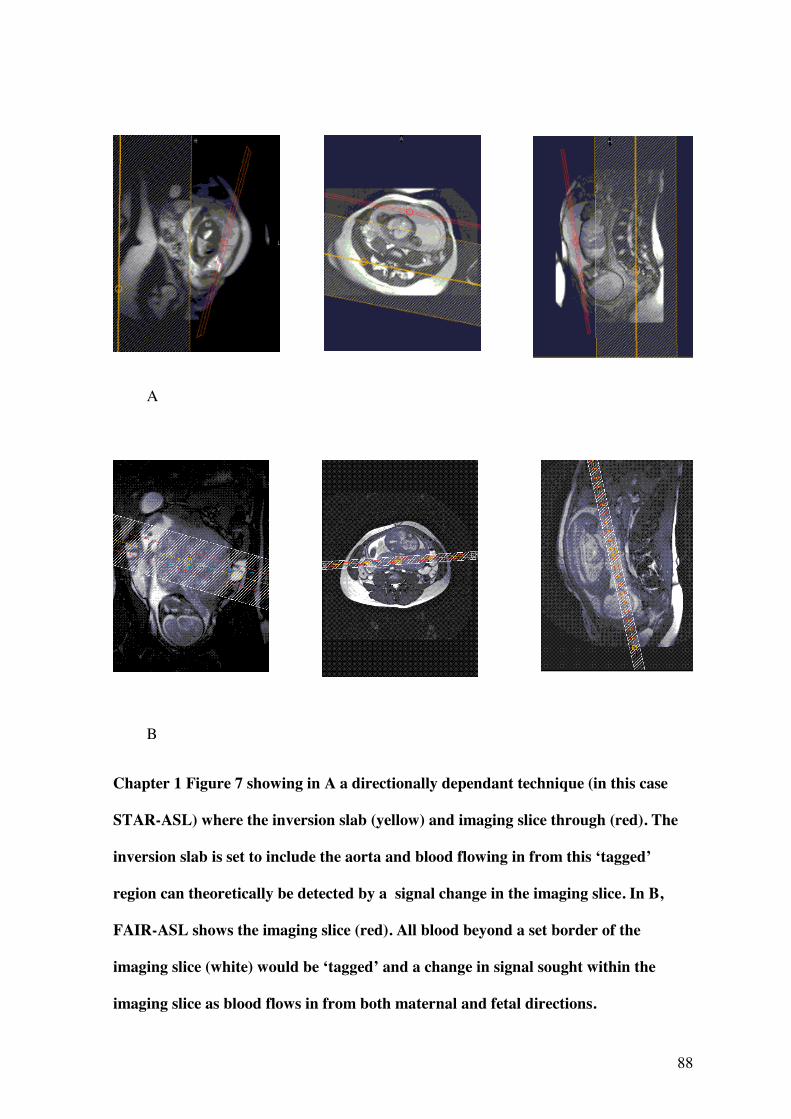
88
Chapter 1 Figure 7 showing in A a directionally dependant technique (in this case
STAR-ASL) where the inversion slab (yellow) and imaging slice through (red). The
inversion slab is set to include the aorta and blood flowing in from this ‘tagged’
region can theoretically be detected by a signal change in the imaging slice. In B,
FAIR-ASL shows the imaging slice (red). All blood beyond a set border of the
imaging slice (white) would be ‘tagged’ and a change in signal sought within the
imaging slice as blood flows in from both maternal and fetal directions.
B
A
89
Stereology
Morphometry and stereology are two techniques used commonly in the analysis of tissue
morphology and have been used in the placenta (Daayana, Baker et al. 2004; Mayhew
2006). They differ in several aspects; morphometry typically uses random selection
method of tissue biopsies whereas stereology uses a systematic random sampling method
to ensure unbiased selection of tissue. Both randomly orientate tissue biopsies for slide
preparation. Microscopic image analysis is then different; morphometry uses image
analysis systems to manipulate field images (usually by pseudocolouration of the screen
image) to generate whole areas per field (e.g. to give an indication of villous to non villous
tissue) or drawing around surface manually to calculate surface area per field (e.g. to give
an indication of capillary surface area). Stereology uses a grid lattice placed over the
image to allow point or intersect counting to generate the same values.
Stereology is concerned with extrapolating threedimensional (3D) structural quantities
from simple counts or measurements made on 2D sectional images. Stereology is
dependent upon random sampling, which is applied at all levels. Its virtue (and strength)
resides in the fact that random sampling gives each part of the specimen, and every
direction within it, an equal chance of being selected. Random sampling is, by definition,
unbiased sampling. Stereology aims to be an unbiased numerical estimation of parameters,
such as length, area, volume, that characterize the tissue. On the other hand, computer
morphometry was developed to quantify the 3D morphology of structures seen in light
microscopy, ranging in size from individual cells to larger anatomical entities. The
researcher uses a set of criteria, e.g colour when stained, to select the parts of the tissue
that are to be analyzed. The goal is to obtain accurate representations of the anatomical
structures. Computer microscopy's aim is accurate 3D mapping and quantification of
biological tissue whether it be of individual cells, groups of cells, or entire histological
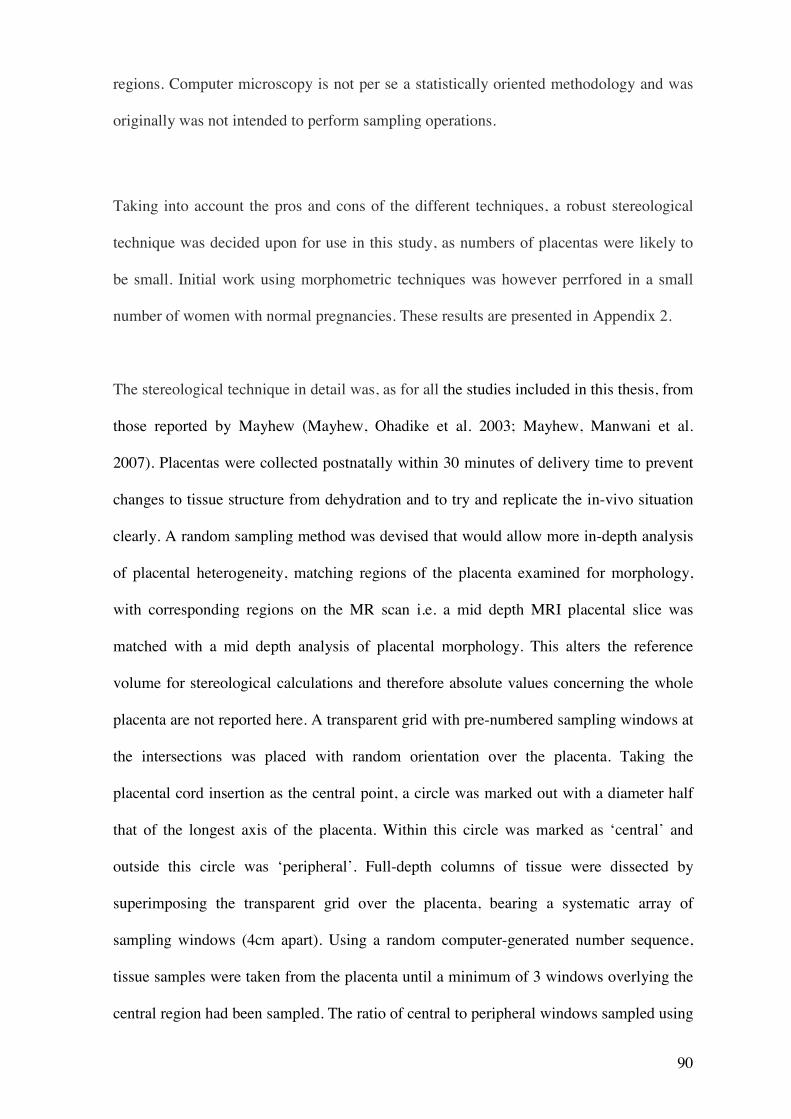
90
regions. Computer microscopy is not per se a statistically oriented methodology and was
originally was not intended to perform sampling operations.
Taking into account the pros and cons of the different techniques, a robust stereological
technique was decided upon for use in this study, as numbers of placentas were likely to
be small. Initial work using morphometric techniques was however perrfored in a small
number of women with normal pregnancies. These results are presented in Appendix 2.
The stereological technique in detail was, as for all the studies included in this thesis, from
those reported by Mayhew (Mayhew, Ohadike et al. 2003; Mayhew, Manwani et al.
2007). Placentas were collected postnatally within 30 minutes of delivery time to prevent
changes to tissue structure from dehydration and to try and replicate the in-vivo situation
clearly. A random sampling method was devised that would allow more in-depth analysis
of placental heterogeneity, matching regions of the placenta examined for morphology,
with corresponding regions on the MR scan i.e. a mid depth MRI placental slice was
matched with a mid depth analysis of placental morphology. This alters the reference
volume for stereological calculations and therefore absolute values concerning the whole
placenta are not reported here. A transparent grid with pre-numbered sampling windows at
the intersections was placed with random orientation over the placenta. Taking the
placental cord insertion as the central point, a circle was marked out with a diameter half
that of the longest axis of the placenta. Within this circle was marked as ‘central’ and
outside this circle was ‘peripheral’. Full-depth columns of tissue were dissected by
superimposing the transparent grid over the placenta, bearing a systematic array of
sampling windows (4cm apart). Using a random computer-generated number sequence,
tissue samples were taken from the placenta until a minimum of 3 windows overlying the
central region had been sampled. The ratio of central to peripheral windows sampled using
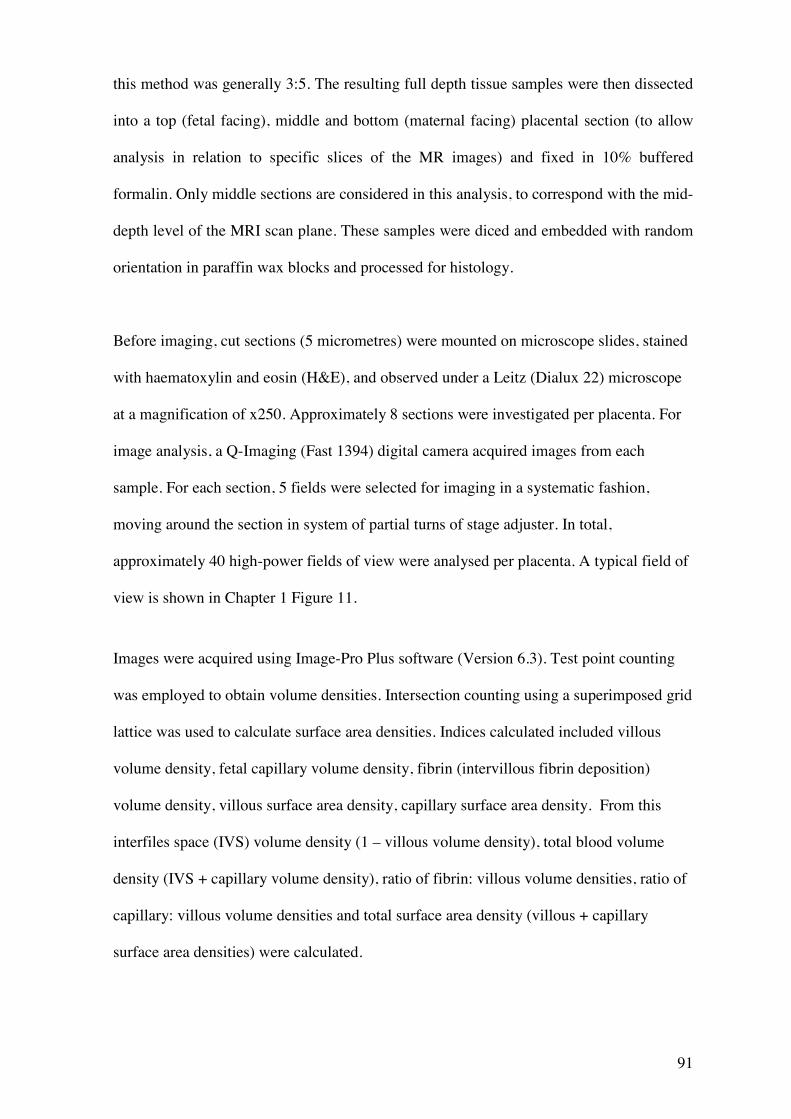
91
this method was generally 3:5. The resulting full depth tissue samples were then dissected
into a top (fetal facing), middle and bottom (maternal facing) placental section (to allow
analysis in relation to specific slices of the MR images) and fixed in 10% buffered
formalin. Only middle sections are considered in this analysis, to correspond with the mid-
depth level of the MRI scan plane. These samples were diced and embedded with random
orientation in paraffin wax blocks and processed for histology.
Before imaging, cut sections (5 micrometres) were mounted on microscope slides, stained
with haematoxylin and eosin (H&E), and observed under a Leitz (Dialux 22) microscope
at a magnification of x250. Approximately 8 sections were investigated per placenta. For
image analysis, a Q-Imaging (Fast 1394) digital camera acquired images from each
sample. For each section, 5 fields were selected for imaging in a systematic fashion,
moving around the section in system of partial turns of stage adjuster. In total,
approximately 40 high-power fields of view were analysed per placenta. A typical field of
view is shown in Chapter 1 Figure 11.
Images were acquired using Image-Pro Plus software (Version 6.3). Test point counting
was employed to obtain volume densities. Intersection counting using a superimposed grid
lattice was used to calculate surface area densities. Indices calculated included villous
volume density, fetal capillary volume density, fibrin (intervillous fibrin deposition)
volume density, villous surface area density, capillary surface area density. From this
interfiles space (IVS) volume density (1 – villous volume density), total blood volume
density (IVS + capillary volume density), ratio of fibrin: villous volume densities, ratio of
capillary: villous volume densities and total surface area density (villous + capillary
surface area densities) were calculated.
92
A)
B) Chapter 1 Figure 11. Microscope images showing A) normal villous appearance with
H&E stain and B) villous containing large amounts of fibrin staining bright pink.
FIBRIN

93
Chapter 2
Magnetic Resonance Imaging Relaxation Time Measurements of the
Placenta at 1.5 T
94
This chapter is the published article:
Wright, C., Morris, D.M., Baker P.N., Crocker, I.P., Gowland, P.A., G.J. Parker, Sibley,
C.P., 2011. Magnetic resonance imaging relaxation time measurements of the
placenta at 1.5 T. Placenta, 32(12), pp1010.
Acknowledgements
This paper was written by Dr Caroline Wright, author of this PhD thesis. Recruitment of
women, supervising scanning of participants and ensuring patient safety, comfort and
correct positioning during scanning, placenta collection, tissue processing and stereology,
all data analysis and write up was carried out by Dr Caroline Wright. David Morris was
responsible for the methodological work up of the MRI methods and assisted with
carrying out the scans and fine tuning scan protocols. Other authors were involved with
general development and direction of the project, supervision and review of write up.
Co-authors
Dr. David M Morris, PhD
Imaging Science & Biomedical Engineering, University of Manchester Biomedical
Imaging Institute, University of Manchester, Manchester, M13 9PT, UK and Manchester
Academic Health Sciences Centre, University of Manchester, Manchester, M13 9PL, UK.
Prof. Philip N Baker, FRCOG, FRCSC, FMedSci

95
Faculty of Medicine & Dentistry, University of Alberta, Edmonton, T6G 2RZ, Canada and
Maternal and Fetal Health Research Centre, School of Biomedicine, University of
Manchester, Manchester Academic Health Sciences Centre, St Mary’s Hospital,
Manchester, M13 9WL,UK.
Dr. Ian P Crocker, PhD
Maternal and Fetal Health Research Centre, School of Biomedicine, University of
Manchester, Manchester Academic Health Sciences Centre, St Mary’s Hospital,
Manchester, M13 9WL,UK.
Prof. Penny A Gowland, PhD
Sir Peter Mansfield Magnetic Resonance Centre, University of Nottingham, Nottingham,
NG7 2RD, UK.
Prof. Geoff JM Parker, PhD
Imaging Science & Biomedical Engineering, University of Manchester Biomedical
Imaging Institute, University of Manchester, Manchester, M13 9PT, UK and Manchester
Academic Health Sciences Centre, University of Manchester, Manchester, M13 9PL, UK.
Prof. Colin P Sibley, BSc, PhD
Maternal and Fetal Health Research Centre, School of Biomedicine, University of
Manchester, Manchester Academic Health Sciences Centre, St Mary’s Hospital,
Manchester, M13 9WL,UK.

96
97
2.1 Abstract
Placental insufficiency is a major cause of fetal growth restriction (FGR) and
accumulating evidence indicates several aspects of placental morphology are altered in
this condition. MRI provides quantitative indices that may be used in non-invasive
assessment of the human placenta, such as relaxation time measurements, T1 and T2. We
hypothesised that placental relaxation times relate to alterations in placental tissue
morphology and hence may be useful in identifying the changes associated with FGR. We
report on the first phase of testing this hypothesis, in a study of women in normal
pregnancy.
Aims: To assess relaxation time measurements in the placenta in normal pregnancy and
correlate these with gestational age and stereological analyses of placental morphology
following delivery.
Methods: 30 women underwent MRI examination (1.5 T) between 20 and 41 weeks
gestation. Placental T1 and T2 measurements were acquired from a mid-depth placental
region, co-localised to a structural scan. Fixed, wax-embedded sections of these placentas
collected at delivery were stained with haematoxylin/ eosin and subjected to stereological
analysis.
Results: Placental T1 and T2 show a significant negative correlation with gestation,
(Pearson correlation p=0.01, 0.03 respectively). 17 placentas were analysed
stereologically. In the group as a whole there was no significant correlation between T1
and T2 and morphological features. However, in a subset of 7 pregnancies scanned within
a week of delivery, a significant positive correlation was observed between the fibrin

98
volume density and the ratio of fibrin: villous volume densities and T2 (Spearman
correlation p=0.02, 0.03 respectively).
Discussion: The correlations between placental T1 and T2 and gestation show that these
variables are clearly influenced by changes in placental structure. Fibrin might be a key
component but further work is needed to fully elucidate the major structural influences on
placental T1 and T2.
99
2.2 Introduction
Fetal growth restriction (FGR) is a serious complication of pregnancy in which the fetus
fails to reach its own genetically determined growth potential. It is common, affecting 3-
10% of all first time births(Chiswick 1985) and is linked to a third of all antepartum
deaths(CEMACH 2008). Placental insufficiency is a major cause of FGR and
accumulating evidence indicates that several aspects of placental structure and function
are specifically altered in this condition, including gross morphology(Toal, Keating et al.
2008), villous morphology at a microscopic level(Daayana, Baker et al. 2004), blood flow
in the uteroplacental circulations and placental transport mechanisms for nutrients and
ions(Sibley, Turner et al. 2005).
In clinical obstetrics, ultrasound biometry and Doppler ultrasound of the uterine and
umbilical vessels are the main investigations available to diagnose and predict FGR.
However, it may not always be possible to differentiate the small but healthy fetus from
one affected by FGR. These difficulties particularly affect the large heterogeneous groups
of women with suspected FGR (on the basis of biometric measurements, reduced amniotic
fluid volumes, abnormal uterine artery Dopplers or risk factors for FGR), all undergoing
intensive fetal surveillance or facing unnecessary intervention, as prognosis for the fetus is
difficult to predict and a deterioration may only occur late in disease, if at all.
Doppler ultrasound of umbilical blood flow is an assessment of only one aspect of
placental function (and does not directly measure blood flow in the placental
microcirculations, the site of increased resistance(Mitra, Seshan et al. 2000; Baykal,
Sargon et al. 2004; Mayhew, Wijesekara et al. 2004)), whilst several other aspects of
placental structure and function are altered in FGR(Sibley, Turner et al. 2005). Various
morphological changes occur in placental tissue in association with FGR. Gross placental
100
lesions are detected occasionally and are associated with poorer fetal outcomes and
abnormal Doppler waveforms (Madazli, Somunkiran et al. 2003; Sebire and Sepulveda
2008). However, there are often more subtle alterations, such as impoverished
development of the villi(Daayana, Baker et al. 2004) and changes in placental exchange
barrier surface area and thickness(Mayhew, Ohadike et al. 2003; Daayana, Baker et al.
2004; Pallotto and Kilbride 2006; Mayhew, Manwani et al. 2007). Such subtle changes are
not directly detectable using routine ultrasound, although altered vessel morphometry may
in turn influence umbilical Doppler waveforms (Mitra, Seshan et al. 2000). The
constellation of specific morphological and physiological abnormalities in the placenta has
been proposed to represent a placental phenotype(s) of FGR(Sibley, Turner et al.
2005).The development of tools to identify a placental FGR phenotype in utero, may
allow more rigorous definitions of the condition, improve our ability to stratify disease
and potentially provide specific predictive tests.
Magnetic Resonance Imaging (MRI) provides a range of quantitative indices that may be
used in non-invasive assessment of the human placenta; these remain relatively
unexplored in this tissue and there is a need for further evaluation of their use as
biomarkers of pregnancy disease. At the gross morphology level, MRI has been shown to
detect changes in placental thickness and volume in FGR as compared to normal
pregnancy(Damodaram, Story et al. 2010). However, other MRI markers may relate to
fine tissue structure and function and therefore be good candidates for more detailed in
utero placental assessment, with greater discrimination between placental phenotypes. The
major source of image contrast in MRI comes from the variation in relaxation times
between tissues. Relaxation times are MRI measurements that reflect the rate of hydrogen
nucleus recovery following perturbation using a radiofrequency pulse in the scanner. The
relaxation times are determined by the molecular environment of the hydrogen nuclei (the
hydrogen nucleus is a single positively charged proton) within the tissue. In biological
101
systems, water may be free in blood (or CSF) but is usually associated with large
polysaccharides and proteins, which restrict proton movement. Relaxation occurs by two
independent processes, referred to as longitudinal (spin-lattice) (T1) and transverse (spin-
spin) (T2) relaxation, the rate of which depends upon the interaction between protons and
their surrounding environment. The relaxation times T1 and T2 characterise these processes
and may be measured non-invasively in vivo. Different body tissues have specific
characteristic relaxation times, which reflect the number of protons that are ‘free’ i.e. in
solution, ‘bound’ i.e. closely associated with macromolecules and those in an intermediate
situation, often termed ‘structured’. Theoretically, T1 will be shortest in tissues with
mainly ‘structured’ protons, longer when ‘free’ and longest when ‘bound’. T2 will be
longest where protons are ‘free’ in solution and shortest where bound to
macromolecules(Bottomley, Foster et al. 1984). These parameters have been studied in
many clinical disorders but, although generalisations can be made regarding their
histopathological correlates, it is not known specifically what changes in the placenta
influence relaxation. In studies examining other tissue types, water content (related to
vascular and intervillous volumes in the placenta) and membrane surface areas were found
to be important influences on relaxation times(Cameron, Ord et al. 1984). As yet, no study
investigating possible correlations between postnatal placental villous morphology and
quantitative relaxation times has been conducted.
In this study we have examined relaxation time measurements in the placenta in normal
pregnancy and evaluated evidence for correlations between these measurements and
postnatal morphology of the placenta using stereological techniques. Based on the work
described above in other tissues, indices relating to blood and non-blood volumes of the
placenta were examined as potential structural correlates, as well as consideration of
villous and vascular surface areas. The fibrin content of the placenta was also assessed; as
a macromolecule, this may have an important influence on relaxation times in the placenta
102
and is related to relaxation time values in other disease processes such as atherosclerosis
and liver cirrhosis (Yu, Song et al. 2000; Bartolozzi, Cioni et al. 2001). In previous MRI
studies at lower field strengths (0.5 T), a trend for shorter relaxation time measurements,
T1 and T2, was observed in pregnancies complicated by pre-eclampsia and FGR (Gowland,
Freeman et al. 1998). We hypothesised that the differences observed at 0.5 T in FGR
placentas were related to altered placental morphology and therefore that T1 and T2 may
be prognostic biomarkers of the abnormal placental structure associated with this
condition, where there is high risk for adverse pregnancy outcome. To begin testing of this
hypothesis, we investigated placental relaxation times in normal pregnancies at the
increased field strength of 1.5 T, allowing improvements over the 0.5T measurements in
signal-to-noise ratio and spatial resolution.
2.3 Methods
2.3.1 Subjects
Ethical approval was obtained from the local NHS Research Ethics Committee and all
women gave written informed consent. Women with normal pregnancies between 20 and
42 weeks gestation were recruited. Participants included had apparently uncomplicated
pregnancies and subsequently delivered normal infants at term without adverse outcomes.
Exclusion criteria were co-existing maternal systemic disease such as diabetes, renal
disease or microvascular disease, multiple pregnancies, fetal anomalies and antenatal
complications including pre-eclampsia, fetal growth restriction and pre-term delivery.
Neonates with an individualised birthweight ratio (IBR) less than the 5th centile, a
surrogate for FGR (Wilcox, Johnson et al. 1993; Sanderson, Wilcox et al. 1994), were
excluded.
103
2.3.2 MRI
Women underwent a single MRI examination including acquisition protocols for placental
structure and relaxation time measurements (T1 and T2). All scans were carried out on a
1.5 T Philips Achieva scanner using a 5 channel phased array cardiac coil positioned to
optimise the signal from the placenta. The pregnant women were positioned supine, using
a foam wedge to support a left-lateral tilt (preventing vena cava compression) and
introduced feet first into the scanner, with their heads outside the bore to reduce potential
for claustrophobia. Although no evidence has demonstrated any detrimental effects to the
fetus as a result of MRI, in the interests of adopting a cautious approach, “SofTone”
imaging magnetic field gradients were used, keeping gradient ramp speeds to below 50%
of maximum to reduce noise exposure. Furthermore, the specific absorption rate (SAR)
was restricted to 2 W/kg to minimise thermal effects. These restrictions represent hard
limits on acquisition protocol optimisation, which aimed to achieve measurements within
reasonable time limits, reducing issues of fetal motion and maximising patient comfort.
All scanning sessions were limited to a maximum of 40 minutes, which was well tolerated
by the women.
Women first underwent a series of 3 localising images, for orientation, followed by
structural and relaxation time acquisitions, taking slices along the long axis of the placenta
and through the shortest axis, giving disc shape placental images. This allowed whole
placental coverage with the minimum number of slices. Structural scans were carried out
using an implementation of the single shot fast spin echo sequence used routinely in fetal
scanning; with a field of view of 384 x 384cm2, matrix size 128 x 128, 30 slices
(interleaved), resolution 3x3x3 mm3 and half scan (55%) to obtain the image in a single
acquisition lasting 36 seconds. T1 and T2 measurements were acquired with whole
placental coverage, co-localised with the structural scans. T1 measurements were achieved
104
using a 3D multiple flip angle fast field echo (FFE; spoiled gradient echo) technique with
angles 2, 10 & 20 degrees with an acquisition time of 10 seconds for each volume (Fram,
Herfkens et al. 1987). T2 measurements, with the same geometry, were acquired with a
double echo spin echo sequence using echo times of 6.3 ms and 200 ms on a slice by slice
basis, repetition times 400ms each echo, taking 4 seconds per slice.
T1 and T2 values were calculated by fitting the relevant signal intensity relationships to the
signal intensities recorded using the acquisitions outlined above using Matlab (The
Mathworks). Relaxation times were recorded as median values from the distribution of fits
obtained from each voxel across a selected region of interest (ROI).
The ROI was drawn as the largest placental region possible ensuring that the outer borders
were not crossed and typically encompassed between 500 – 1500 voxels. The ROI was
marked on a scan slice passing at a mid-depth through the placenta and was always first
selected on the structural image, (where the placental outline and cord insertion are most
clearly seen) and then checked against the co-localised relaxation time scans and
repositioned if affected by obvious artefact or patient movement. Chapter 2 Figure 1
shows a typical structural image through the placenta with the ROI selected.
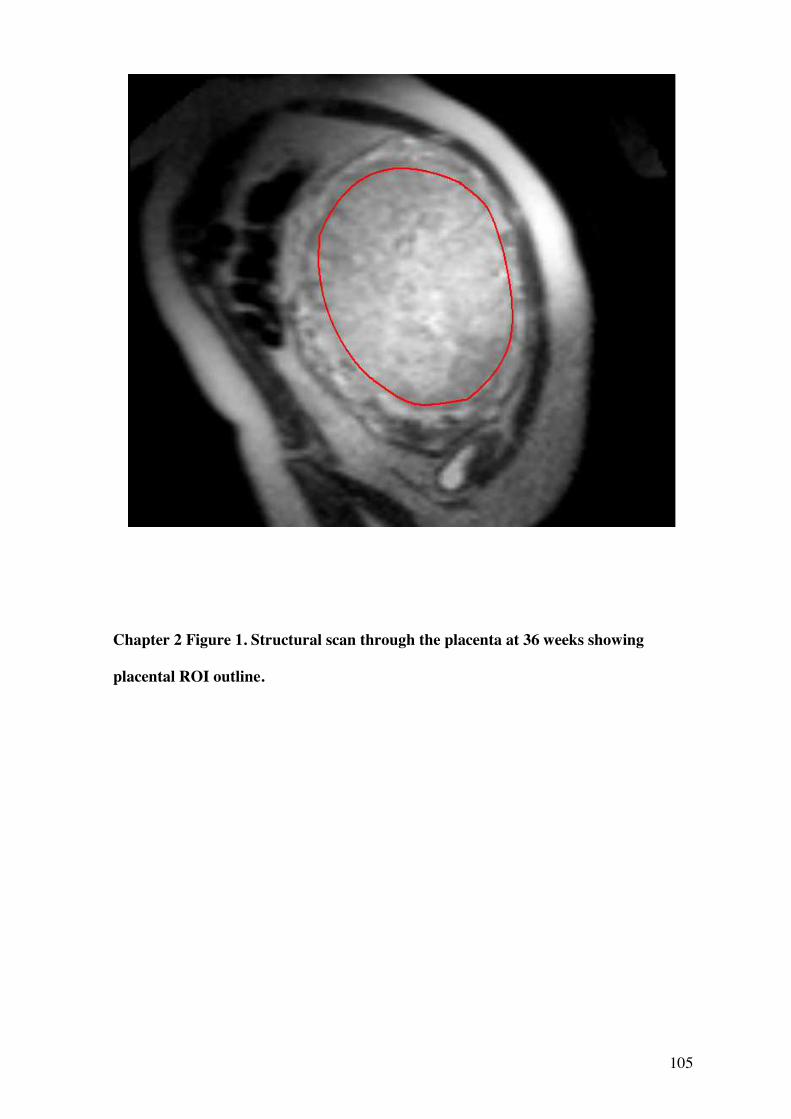
105
Chapter 2 Figure 1. Structural scan through the placenta at 36 weeks showing
placental ROI outline.
106
2.3.3 Stereology
All stereological analyses were made in placentas collected from women undergoing MRI
using methods adopted from those reported by Mayhew (Mayhew, Ohadike et al. 2003;
Mayhew, Manwani et al. 2007). Placental tissue samples were collected in 17 subjects
delivered at term. Placentas were collected postnatally within 30 minutes of delivery time.
A random sampling method was devised that would allow more in-depth analysis of
placental heterogeneity, matching regions of the placenta examined for morphology, with
corresponding regions on the MR scan i.e. a mid depth MRI placental slice was matched
with a mid depth analysis of placental morphology. This alters the reference volume for
stereological calculations and therefore absolute values concerning the whole placenta are
not reported here. A transparent grid with pre-numbered sampling windows at the
intersections was placed with random orientation over the placenta. Taking the placental
cord insertion as the central point, a circle was marked out with a diameter half that of the
longest axis of the placenta. Within this circle was marked as ‘central’ and outside this
circle was ‘peripheral’. Full-depth columns of tissue were dissected by superimposing the
transparent grid over the placenta, bearing a systematic array of sampling windows (4cm
apart). Using a random computer-generated number sequence, tissue samples were taken
from the placenta until a minimum of 3 windows overlying the central region had been
sampled. The ratio of central to peripheral windows sampled using this method was
generally 3:5. The resulting full depth tissue samples were then dissected into a top (fetal
facing), middle and bottom (maternal facing) placental section (to allow analysis in
relation to specific slices of the MR images) and fixed in 10% buffered formalin. Only
middle sections are considered in this analysis, to correspond with the mid-depth level of
the MRI scan plane. These samples were diced and embedded with random orientation in
paraffin wax blocks and processed for histology.
107
Before imaging, cut sections (5 micrometres) were mounted on microscope slides, stained
with haematoxylin and eosin (H&E), and observed under a Leitz (Dialux 22) microscope
at a magnification of x250. Approximately 8 sections were investigated per placenta. For
image analysis, a Q-Imaging (Fast 1394) digital camera acquired images from each
sample. For each section, 5 fields were selected for imaging in a systematic fashion,
moving around the section in system of partial turns of stage adjuster. In total,
approximately 40 high-power fields of view were analysed per placenta.
Images were acquired using Image-Pro Plus software (Version 6.3). Test point counting
was employed to obtain volume densities. Intersection counting using a superimposed grid
lattice was used to calculate surface area densities. Indices calculated included villous
volume density, fetal capillary volume density, fibrin (intervillous fibrin deposition)
volume density, villous surface area density, capillary surface area density. From this
interfiles space (IVS) volume density (1 – villous volume density), total blood volume
density (IVS + capillary volume density), ratio of fibrin: villous volume densities, ratio of
capillary: villous volume densities and total surface area density (villous + capillary
surface area densities) were calculated.
2.3.4 Statistics
The normality of the distribution of the median relaxation time and stereological values
across the subject group was tested using D’Agostino and Pearson omnibus normality test:
T1 and T2 results were normally distributed and therefore analyses of their relationships
with gestation were performed using parametric tests. Not all stereological variables were
normally distributed, therefore non-parametric tests were used for all analyses involving
stereological variables. Test of correlations were consistently two-tailed. Linear regression
108
analysis was performed to define linear trends in the data. Graphpad Prism (Version 4.01)
was used for statistical analysis. No corrections were made for multiple statistical
comparisons.
2.4 Results
2.4.1 Relationship between placental relaxation times and gestation
30 women underwent a single MRI examination at a range of gestations between 21.9 and
41.7 weeks (mean 32.9). Of the 30 women scanned, one scan was terminated before
completing the entire T1 sequence due to maternal claustrophobia, thus there were 29
remaining T1 results.
Chapter 2 Figure 2 shows the relationship between relaxation times and gestational age at
the time of scan. A significant negative correlation was seen between both T1 and
gestational age (Pearson’s p= 0.01) and T2 and gestational age (Pearson’s p= 0.03). When
expressed as a linear regression, this showed a fall in T1 across gestation of 20.2 ms/week
(95% confidence interval -35.1 to -5.2 ms/week, intercept = 1684ms, r2=0.22, p=0.01) and
in T2 of 2.4 ms/week (95% confidence interval -5.6 to -0.3 ms/week, interval intercept =
280 ms, r2=0.16, p=0.03). (Distribution of data across gestation; weeks 20-23+6, n=1,
mean T1 1407ms, mean T2 217ms; weeks 24-27+6, n=7, mean T1 1170ms, mean T2
225ms; weeks 28-31+6, n=8, mean T1 1000ms, mean T2 195ms; weeks 32-35+6, n=2,
mean T1 935ms, mean T2 198ms; weeks 36-39+6, n=10, mean T1 904ms, mean T2 194ms;
weeks 40-41+6, n=2, mean T1 1017ms, T2=163ms.)
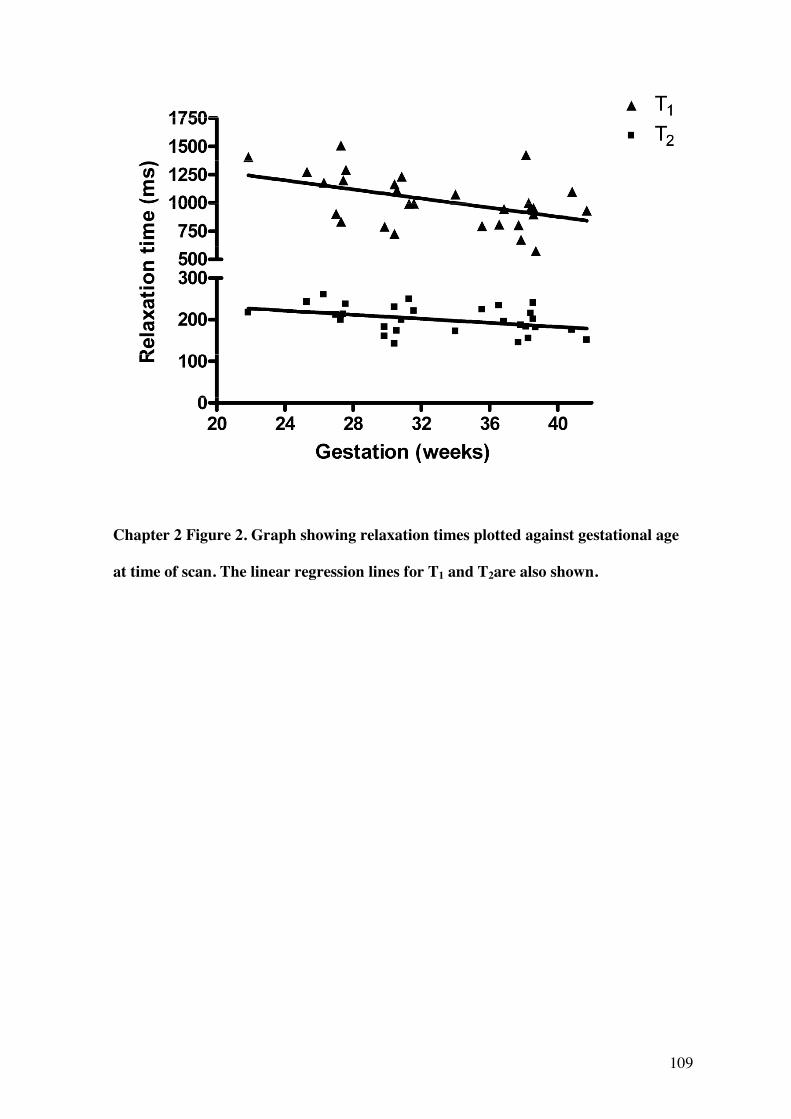
109
Chapter 2 Figure 2. Graph showing relaxation times plotted against gestational age
at time of scan. The linear regression lines for T1 and T2are also shown.
110
2.4.2 Correlations between placental stereological analyses and relaxation times
From the 30 patients who were scanned, 17 placentas were analysed stereologically
following delivery. Failure to analyse placentas was due to non-collection e.g. if the
researcher was not informed of delivery, the woman delivered elsewhere or the researcher
was not available. No significant correlations were observed between relaxation times
measured at time of scan and placental stereological variables.
As placentas were collected following term deliveries (between 37 and 42 weeks, mean
age of delivery 39.8 weeks), often some time after the MRI scan, and bearing in mind the
change in T1 and T2 over gestation, three further analyses were performed. In the first, a
subgroup population who all had scans within a week of delivery were analysed. In this
subgroup (n=7, mean gestational age at scan 38.9 weeks, at delivery 39.1weeks),
significant correlations were observed between T2 relaxation time and the fibrin volume
density and fibrin: villous densities ratio (Spearman’s p= 0.02 and 0.03 respectively)
(Chapter 2 Figure 3). In the second analysis, a subgroup of women who were scanned
within 2 weeks of delivery (n=10, mean gestational age at scan 38.9 weeks, at delivery
39.5weeks), were analysed: no significant correlations between relaxation times and
stereological variables were observed. In the third analysis, the linear regression model for
the relationship between gestational age and relaxation times (Chapter 2 Figure 2) was
used to predict T1 and T2 values for each of the seventeen women (whose placentas had
been analysed stereologically) for the exact day of their delivery. Using this method no
significant correlations were found between T1 and T2 values and placental stereological
variables.
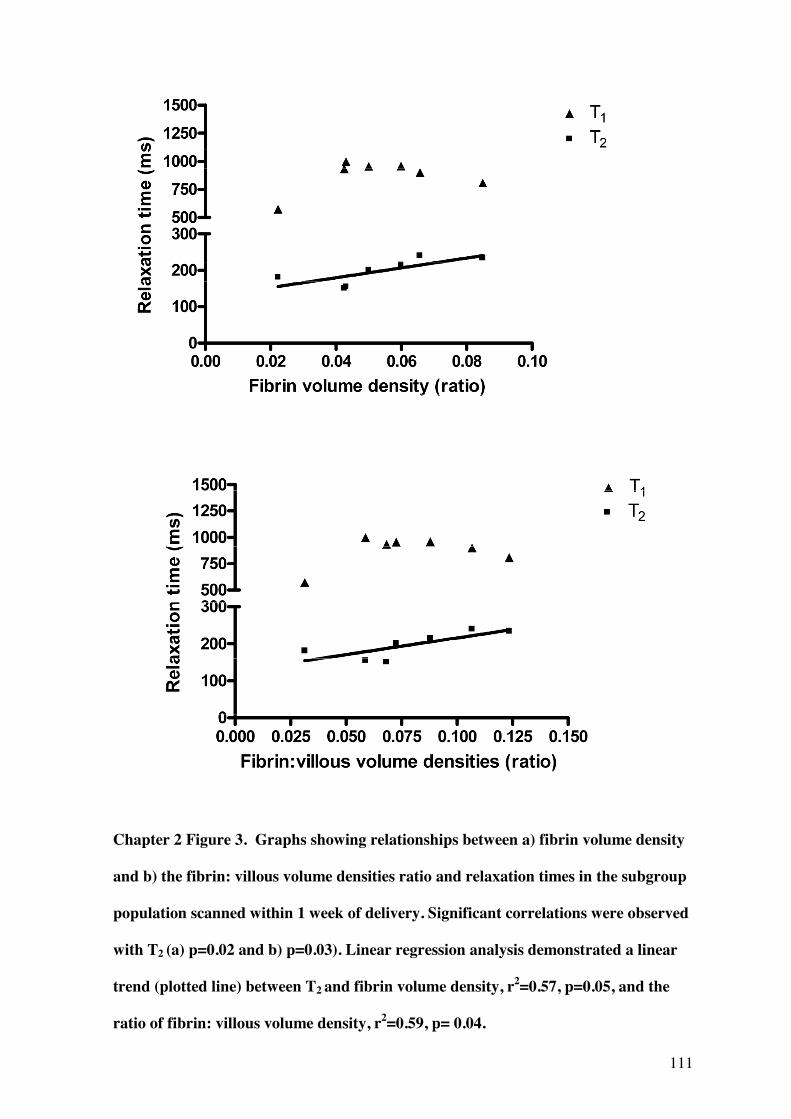
111
Chapter 2 Figure 3. Graphs showing relationships between a) fibrin volume density
and b) the fibrin: villous volume densities ratio and relaxation times in the subgroup
population scanned within 1 week of delivery. Significant correlations were observed
with T2 (a) p=0.02 and b) p=0.03). Linear regression analysis demonstrated a linear
trend (plotted line) between T2 and fibrin volume density, r2=0.57, p=0.05, and the
ratio of fibrin: villous volume density, r2=0.59, p= 0.04.
112
2.5 Discussion
The most important finding in this study is a clear correlation and linear relationship
between placental T1 and T2 measurements at 1.5 T and gestational age. This relationship
was previously demonstrated at 0.5 T (Gowland, Freeman et al. 1998), but given the
differences in imaging and analysis methodologies, software and the effect of increased
field strength on relaxation and particularly on T1, the fact that this relationship persists in
our study adds considerably to its validity. T1 and T2 relaxation times are shown to
decrease by 20.2 ms and 2.4 ms per week of gestational 1.5 T respectively, giving a total
fall of in T1 of 400 ms and in T2 of 50 ms between 20 and 40 weeks. The relationship
supports the proposition that changes in placental tissue structure or composition that
occur with advancing gestation significantly influence relaxation times. Of note, the
gradient of decline in T1 across gestation is twice that seen at 0.5 T (Gowland, Freeman et
al. 1998), which may be attributable to the increase in field strength and might also
support that the previously demonstrated differences in relaxation times in pregnancies
complicated by FGR and pre-eclampsia (Gowland, Freeman et al. 1998), may be more
readily observed at this field strength.
Our observations on gestational changes in placental T1 and T2 are similar to those seen at
0.5 T (Gowland, Freeman et al. 1998). However, our study at 1.5T shows a sharper
decline in T1 across gestation than was reported at 0.5 T. It is known that field strength
strongly influences T1(Bottomley, Foster et al. 1984)and the trend for a steeper decline
across gestation at 1.5 T than at 0.5 T (gradient 20.2 ms/week at 1.5 T and gradient
9.1ms/week at 0.5 T) suggests an enhanced ability to differentiate placentas with longer or
shorter relaxation times at the higher field strength. This additional differentiability may
be important, as shorter relaxation times have previously been associated with
complicated pregnancies (Gowland, Freeman et al. 1998).
113
The origin of the observed change in relaxation times with advancing gestational age
remains a matter for conjecture. In this study, relaxation time values did not correlate with
villous volume densities or total blood volume densities, indicating that other changes in
morphology or function, rather than just increases in solid or blood volumes, lead to the
fall in T1 and T2 towards term. Previous studies of placental morphology support that
villous densities do not change with gestational age, rather the total volume of the villi
increase, owing to hyperplastic growth of the placenta (Mayhew, Wadrop et al. 1994). The
total volume of the maternal vascular bed increases with gestational age (Mayhew,
Jackson et al. 1993), but if this was the major influence on relaxation times then a rise
rather than fall would be seen, as the T1 and T2 of oxygenated maternal blood in vivo is
around the upper end of the placental values (Barth and Moser 1997). That other changes
in placental morphology may influence relaxation times, rather than the balance of
vascular and non-vascular volumes, is supported by studies looking at MRI magnetisation
transfer (an in-vivo measure of bound protons to total protons) in the placenta which
demonstrated no changes in these values or in non-vascular: total placental volume ratios
assessed stereologically across gestation (Ong, Tyler et al. 2004). Other studies have also
supported the view that the ratios of total volumes of blood and non-blood placental
compartments remain fairly static across gestation (Boyd 1984) and if so, the fall in T1 and
T2 observed across gestation must be due to other changes within placental tissue, rather
than blood volume alone.
All placentas included in the analysis were delivered at term when large amounts of
placental fibrin were likely to be present. Fibrinoid volume has previously been shown to
114
correlate positively with intervillous volume and villous surface area, but relative to
intervillous volumes, increases significantly towards term(Mayhew and Barker 2001). Our
data show a correlation between T2 and placental fibrin deposition, but only when scan
and delivery were within one week of each other (Chapter 2 Figure 3). As all analysis
groups has similar mean gestational age at delivery, the correlations observed cannot be
explained by the presence of more or less fibrin in placentas of any group and are more
likely to reflect the importance of close timing of MRI and stereology. These data suggest
that fibrin content might be one of the contributors to the fall in T2 over gestation,
although it is unlikely to be the sole determinant. Intuitively, a negative rather than
positive correlation between fibrin and relaxation times would be expected as we might
assume that the complex macromolecular structure of fibrin deposits would result in
shorter relaxation times. Fibrin may, however, be a surrogate marker for a wider change in
tissue quality that is influencing T1 and T2. Villous surface area may be a factor
influencing relaxation times, (surface area of the villi expands with advancing gestation
(Teasdale 1980; Boyd 1984; Teasdale and Jean-Jacques 1985)) but we did not find a
significant correlation between these variables. It is likely that other factors not
investigated here may also influence relaxation times. Potential candidates include
reduced blood oxygenation (for example, deoxygenated blood generally has lower T1
values(Silvennoinen, Kettunen et al. 2003)), variations in the fluid content of stromal
channels in the villi(Castellucci and Kaufmann 1982) or changes in the tissue hydration
fraction; found to be important in other tissues in animal studies(Cameron, Ord et al.
1984).
In this study, women were scanned deliberately at a range of gestations in order to assess
the effect of gestational age on relaxation times. This caused difficulties in the analysis
when relating MRI findings to stereology, as the stereological variables were always
measured at delivery. There was a correlation between T2 and fibrin content when only
115
those placentas delivered within one week of scan were considered, but not when all
delivered within two weeks of scan were included, emphasising the importance of taking
gestational changes into account. We attempted to do this by modelling the gestational
changes in T1 and T2 and using the predicted values for day of delivery in correlations
with stereological values. For several indices, a tighter relationship was seen using this
approach but none reached significance at the 5% level. Although a significant linear
relationship was observed between relaxation times and gestation, the broad confidence
interval surrounding this slope may have hindered the linear regression model as an
accurate predictor of T1 and T2 at delivery. In future studies we hope to scan more women
closer to term in order to closely assess the links between MRI biomarkers and
morphology, removing the influence of gestation. In practical terms this can be
problematic, as delivery may be unpredictable, MR scanning may be prevented due to size
of the gravid uterus or discomfort lying flat/still and women may also be less amenable to
participation in research in the last few days before delivery.
Histological studies have demonstrated a range of differences in placentas from FGR
pregnancies including evidence of tissue damage and repair, increased inter-villous fibrin
deposition and reduced villous volume, surface area and capillary surface area(Mayhew,
Ohadike et al. 2003; Daayana, Baker et al. 2004; Pallotto and Kilbride 2006; Mayhew,
Manwani et al. 2007). Previous studies at 0.5 T demonstrated that in pregnancies
complicated by pre-eclampsia and FGR, relaxation times were generally lower and
frequently below the 90% confidence interval for the healthy population. From the
stereological data presented in this current study it is unclear which morphological
variables, if any, directly influence placental relaxation times and therefore whether a
difference in relaxation times in FGR could be expected. However, the clear correlation
with both T1 and T2 and gestation at scan supports the view that relaxation times may be
important biomarkers of placental tissue change and therefore may be useful in detecting

116
pathological conditions such as FGR. Further work to test this hypothesis requires
stereological measurements of the placenta together with measurement of relaxation times
and other MRI variables closer to term. These structural measurements might also be
combined with MRI assessment of placental blood flow such as those measured by Intra-
Voxel Incoherent Motion and/or Arterial Spin Labelling.
117
Chapter 3
Potential Magnetic Resonance Imaging Biomarkers of the Placenta in
Fetal Growth Restriction
118
This section is the article planned for submission for publication in the journal
Obstetrics & Gynaecology:
Wright, C., Morris, D.M., Mullins, K., Baker P.N., Crocker, I.P., G.J. Parker, Sibley, C.P.,
Potential Magnetic Resonance Imaging Biomarkers of the Placenta in Fetal Growth
Restriction
Acknowledgements
This paper was written by Dr Caroline Wright, author of this PhD thesis. Recruitment of
women, supervising scanning of participants and ensuring patient safety, comfort and
correct positioning during scanning, placenta collection, tissue processing and stereology,
all data analysis and write up was carried out by Dr Caroline Wright. David Morris was
responsible for the methodological work up of the MRI methods and assisted with
carrying out the scans and fine tuning scan protocols. Katherine Mullins was supervised
by myself in a medical student undergraduate research project and was involved in the
placental volumetric analysis. Other authors were involved with general development and
direction of the project, supervision and review of write up.
Co-authors
Dr. David M Morris, PhD
Imaging Science & Biomedical Engineering, University of Manchester Biomedical
Imaging Institute, University of Manchester, Manchester, M13 9PT, UK and Manchester
Academic Health Sciences Centre, University of Manchester, Manchester, M13 9PL, UK.
119
Prof. Philip N Baker, FRCOG, FRCSC, FMedSci
Faculty of Medicine & Dentistry, University of Alberta, Edmonton, T6G 2RZ, Canada and
Maternal and Fetal Health Research Centre, School of Biomedicine, University of
Manchester, Manchester Academic Health Sciences Centre, St Mary’s Hospital,
Manchester, M13 9WL,UK.
Katherine Mullins
Medical Undergraduate, University of Manchester, Manchester, UK
Dr. Ian P Crocker, PhD
Maternal and Fetal Health Research Centre, School of Biomedicine, University of
Manchester, Manchester Academic Health Sciences Centre, St Mary’s Hospital,
Manchester, M13 9WL,UK.
Prof. Geoff JM Parker, PhD
Imaging Science & Biomedical Engineering, University of Manchester Biomedical
Imaging Institute, University of Manchester, Manchester, M13 9PT, UK and Manchester
Academic Health Sciences Centre, University of Manchester, Manchester, M13 9PL, UK.

120
Prof. Colin P Sibley, BSc, PhD
Maternal and Fetal Health Research Centre, School of Biomedicine, University of
Manchester, Manchester Academic Health Sciences Centre, St Mary’s Hospital,
Manchester, M13 9WL,UK.
121
3.1 Abstract
MRI provides quantitative indices for use in the non-invasive assessment of the human
placenta, such as measurements of placental shape and size, relaxation time
measurements, T1 and T2, which relate to placental composition, D, D* (coefficients of
diffusion and pseudo-diffusion) and f% (the fraction of moving blood per voxel) which
relate to perfusion, measured using Intra-Voxel Incoherent Motion (IVIM). We
hypothesised these indices could be assessed using MRI in utero and would be altered
with advancing gestation and in FGR pregnancies, relating to changes in placental tissue
morphology which occur in these states.
Methods: 53 (39 normal, 14 FGR) women underwent MRI examination between 20 and
41 weeks. Parameters of placental shape and size, placental relaxation times T1 and T2 and
IVIM measurements D, D* and f were acquired from a mid-depth placental region.
Sections of these placentas collected at delivery were stained and subjected to
stereological analysis of morphology.
Results: There was a significant positive correlation between placental volume, depth,
the depth: volume ratio and gestation in normal pregnancy (p=>0.0001, p=0.001 and 0.02
respectively) Placental volume was significantly lower in the FGR group (ANCOVA
p=0.0003) and depth was significantly greater in FGR (ANCOVA p=0.004), by around
10mm. There was a highly significant difference in log10 depth: volume between normal
and FGR groups (ANCOVA p=<0.000001). In this analysis the correlation previously
reported between T2 and gestation in normal pregnancy was again significant (p=0.002)
but not T1. A significant difference was observed in T2 between normal and FGR groups
(ANCOVA p=0.01) but not T1. Analysis of the IVIM variables f, D and D* was possible
in 26 participants; 16 normal and 10 FGR pregnancies. There was a significant negative
122
correlation between D and gestation in normal pregnancy (p=0.039) which was reduced in
FGR pregnancies (ANCOVA p= 0.02). T2 and D also correlated with stereological indices
of placental morphology.
Discussion: These finding show that MRI placental biomarkers are altered with advancing
gestation and in FGR. Further investigation is required to determine whether their use in
FGR could be beneficial.
123
3.2 Introduction
Fetal growth restriction (FGR) is a serious complication of human pregnancy where the
fetus fails to reach its genetically pre-determined growth potential. It is a common
condition, affecting 5 -15 % of all pregnancies (depending on definition used) (Gardosi
2009) and is linked to a third of all antepartum deaths (CEMACH 2008). Growth
restricted infants are at increased risk of neonatal morbidities, including intraventricular
haemorrhage, respiratory distress syndrome and necrotizing enterocolitis (Gilbert and
Danielsen 2003), often worsened by iatrogenic prematurity. In addition, serious
neurological sequelae, such as cerebral palsy, are more common (Jarvis, Glinianaia et al.
2003) along with behavioral and emotional problems in childhood (Zubrick, Kurinczuk et
al. 2000). Small size at birth also predisposes the infant to major diseases in adult life,
such as diabetes, hypertension and cardiovascular disease (Hales, Barker et al. 1991;
Leon, Lithell et al. 1998).
In clinical obstetrics, ultrasound biometry and Doppler assessment of the uterine,
umbilical and fetal vessels is the mainstay of investigation. Nevertheless, these methods
may still fail to differentiate a small but healthy fetus from one affected by FGR. Indeed,
abnormal umbilical Dopplers may predict those at risk of adverse outcomes, particularly
perinatal death (Madazli, Somunkiran et al. 2003; Sebire and Sepulveda 2008), but small
for gestational age infants, with normal umbilical artery Dopplers, may still be at risk of
adverse perinatal outcomes and subsequent neurodevelopmental complications (Figueras,
Eixarch et al. 2007).
Placental insufficiency is a major cause of FGR and accumulating evidence supports that
placental structure, function and blood flow are invariably altered in this condition. These
potential pathologic features range from gross changes in placental size and structure
124
(Toal, Keating et al. 2008; (Damodaram, Story et al. 2010), changes in morphology at the
microscopic level (Mayhew, Ohadike et al. 2003; Daayana, Baker et al. 2004), and
attenuations in placental nutrient transport (Sibley, Turner et al. 2005). This constellation
of abnormalities provides a placental phenotype for FGR (Sibley, Turner et al. 2005) and
implies a more global assessment of placental characteristics would allow more rigorous
definition of the condition, its clinical scarification and potentially its early prediction.
Magnetic resonance imaging (MRI) provides a range of quantitative indices that relate to
tissue structure and function. It is therefore a realistic but relatively unexplored candidate
for non-invasive in utero placental assessment. In this study we consider MR indices in 3
areas; those relating to marcromolecular structure e.g. placental volume and depth, MR
relaxation times, which relate to placental tissue composition, and indices measured by
intravoxel incoherent motion (IVIM), which relate to blood movement. Recent studies
have re-highlighted the importance of considering aspects of gross placental structure;
both Toal et al.(Toal, Keating et al. 2008) using ultrasound and Damodaram et al. using
MRI (Damodaram, Story et al. 2010) demonstrated a link between placental thickness and
FGR. We hypothesised similarly, that placental dimensions would be altered in FGR and
aimed to determine which parameters showed the greatest differences between groups and
how these were placed in the context of alternative indices of structure and function.
Relaxation times T1 and T2 are MRI measurements that reflect the rate of recovery of
magnetisation following perturbation using a radiofrequency pulse in the scanner.
Relaxation times T1 and T2 characterise the processes by which this recovery occurs and
may be measured non-invasively in vivo. Different body tissues have specific
characteristic relaxation times, which broadly reflect the number of protons that are ‘free’
i.e. in solution, ‘bound’ i.e. closely associated with macromolecules. In previous work we
demonstrated that T1 and T2 measurements of the placenta were significantly affected by
gestation and that macromolecules such as fibrin may influence relaxation times (Wright,
125
Morris et al. 2011). Following on from this, we hypothesised that T1 and T2 are altered in
FGR, due to the abnormal placental morphology associated with this condition. IVIM
techniques assess diffusion within a tissue by measuring the attenuation of signal when
water protons in motion are travelling far enough within a magnetic field to become
dephased (i.e. desynchronised in their inherent spins from other protons, giving a
corresponding reduction in signal). These techniques are therefore sensitive to blood
motion (Moore, Strachan et al. 2000; Moore, Ong et al. 2008). Blood (or other fluids such
as lymph, flowing in any direction will contribute towards the attenuation, rather than
capillary flow in isolation. Signal attenuation due to D*, measured in units of mm2/sec, is
observed at lower values of b as itrelates to larger scale movement and is the parameter
most closely linked to perfusion. Diffusion, quantified by the diffusion coefficient (D) and
also measured in units of mm2/sec, is observed at higher values of b and are related to
smaller scale movement of water. By performing this diffusion weighted MRI with at least
two diffusion weightings, or b values, the differential signal attenuation at different b
values can be used to calculate the diffusion coefficient (known as D or the apparent
diffusion coefficient, ADC). In its simplest form, the slope of the line that describes the
relationship between the logarithm of the signal intensity and the b value is D. If the
calculation is repeated for each voxel of the DW-MRI, then D for every image voxel can
be derived.. Thus, voxels that show a steeper slope of signal attenuation with increasing b
values will have higher D values (indicating higher water diffusivity) compared with
voxels that show a gradual slope of signal attenuation. Cellular tissues (e.g., tumor tissues)
in the body often return lower D values compared with native tissues, which facilitates
their detection and characterization. The value of f measures the total volume of blood
moving in the voxel compared to the total voxel volume and is quoted as a
percentage.This is particularly of relevance when considering IVIM in the placenta, in
which flow is slow and multi-directional. IVIM has been used to assess placental blood
126
flow at 0.5 T (Moore, Strachan et al. 2000) and is of interest in FGR pregnancies as a
means of assessing blood flow in the placental microcirculations.
Studies to date have touched on MRI as a potentially useful tool for in utero placental
assessment, but there is a need for greater knowledge of what information can be provided
and a better understanding of how these altered MRI indices relate to real differences in
placental tissue structure and fetal outcomes. In the study reported here, we tested the
overall hypothesis that analysis of indices of gross placental structure, placental relaxation
times (relating to tissue composition) and placental IVIM (relating to blood flow) would
be altered in FGR and relate to placental morphological characteristics assessed
stereologically following delivery. Furthermore, we hypothesized that at field strengths of
1.5 T, improvements in signal-to-noise ratio and spatial resolution would improve
placental visualisation and allow more accurate analysis compared to the majority of
previous studies in this field which were conducted at 0.5 T.
127
3.3 Methods
3.3.1 Subjects
Ethical approval was obtained from the local NHS Research Ethics Committee and all
women gave informed written consent. Women were recruited at a range of gestations
between 20 and 42 weeks. Two groups of women were studied: those of normal
pregnancy and those complicated by FGR. The FGR group were recruited on the basis of
an ultrasound-estimated fetal weight <5th centile; this was confirmed after delivery with a
customised birthweight centile <5 – a surrogate for FGR (Gardosi, Chang et al. 1992),
calculated by Growth Centile Calculator (UK v5.15) (Gardosi J and Gestation Network).
Neonates with birthweights between 5th and 10th customised centiles were excluded.
Exclusion criteria for both groups included co-existing maternal systemic disease
(diabetes, renal or microvascular disease), multiple pregnancies, the presence of fetal
anomalies (antenatally or postnatally diagnosed), or the onset of pregnancy complications,
e.g. pre-eclampsia, gestational diabetes or obstetric cholestasis. Women were classified as
normal if they delivered at term (37-42 weeks gestation) without adverse maternal or
neonatal outcomes. Some of the women in the normal pregnancy group were also included
in our previous study investigation of placental relaxation times (Wright, Morris et al.
2011). In interpreting the FGR data, severity of disease was considered by birthweight.
Umbilical Doppler assessments were not considered as they had not been performed as
part of the study and timing in relation to scan was variable.
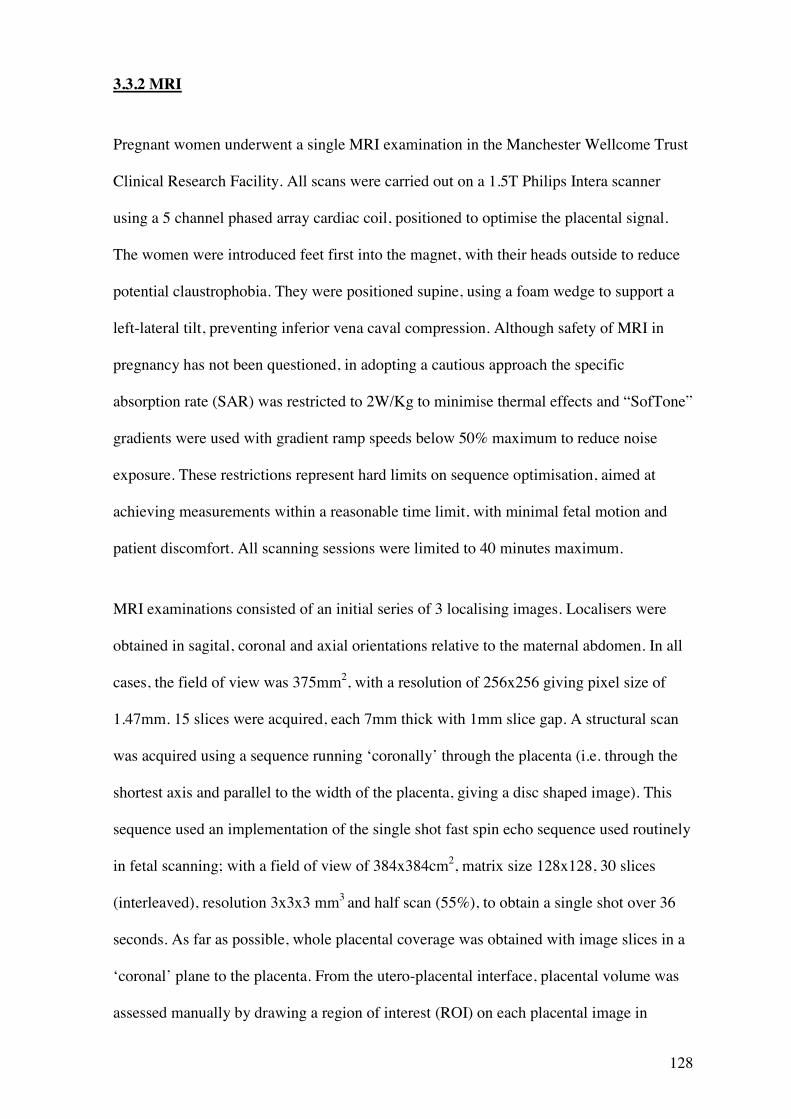
128
3.3.2 MRI
Pregnant women underwent a single MRI examination in the Manchester Wellcome Trust
Clinical Research Facility. All scans were carried out on a 1.5T Philips Intera scanner
using a 5 channel phased array cardiac coil, positioned to optimise the placental signal.
The women were introduced feet first into the magnet, with their heads outside to reduce
potential claustrophobia. They were positioned supine, using a foam wedge to support a
left-lateral tilt, preventing inferior vena caval compression. Although safety of MRI in
pregnancy has not been questioned, in adopting a cautious approach the specific
absorption rate (SAR) was restricted to 2W/Kg to minimise thermal effects and “SofTone”
gradients were used with gradient ramp speeds below 50% maximum to reduce noise
exposure. These restrictions represent hard limits on sequence optimisation, aimed at
achieving measurements within a reasonable time limit, with minimal fetal motion and
patient discomfort. All scanning sessions were limited to 40 minutes maximum.
MRI examinations consisted of an initial series of 3 localising images. Localisers were
obtained in sagital, coronal and axial orientations relative to the maternal abdomen. In all
cases, the field of view was 375mm2, with a resolution of 256x256 giving pixel size of
1.47mm. 15 slices were acquired, each 7mm thick with 1mm slice gap. A structural scan
was acquired using a sequence running ‘coronally’ through the placenta (i.e. through the
shortest axis and parallel to the width of the placenta, giving a disc shaped image). This
sequence used an implementation of the single shot fast spin echo sequence used routinely
in fetal scanning; with a field of view of 384x384cm2, matrix size 128x128, 30 slices
(interleaved), resolution 3x3x3 mm3 and half scan (55%), to obtain a single shot over 36
seconds. As far as possible, whole placental coverage was obtained with image slices in a
‘coronal’ plane to the placenta. From the utero-placental interface, placental volume was
assessed manually by drawing a region of interest (ROI) on each placental image in
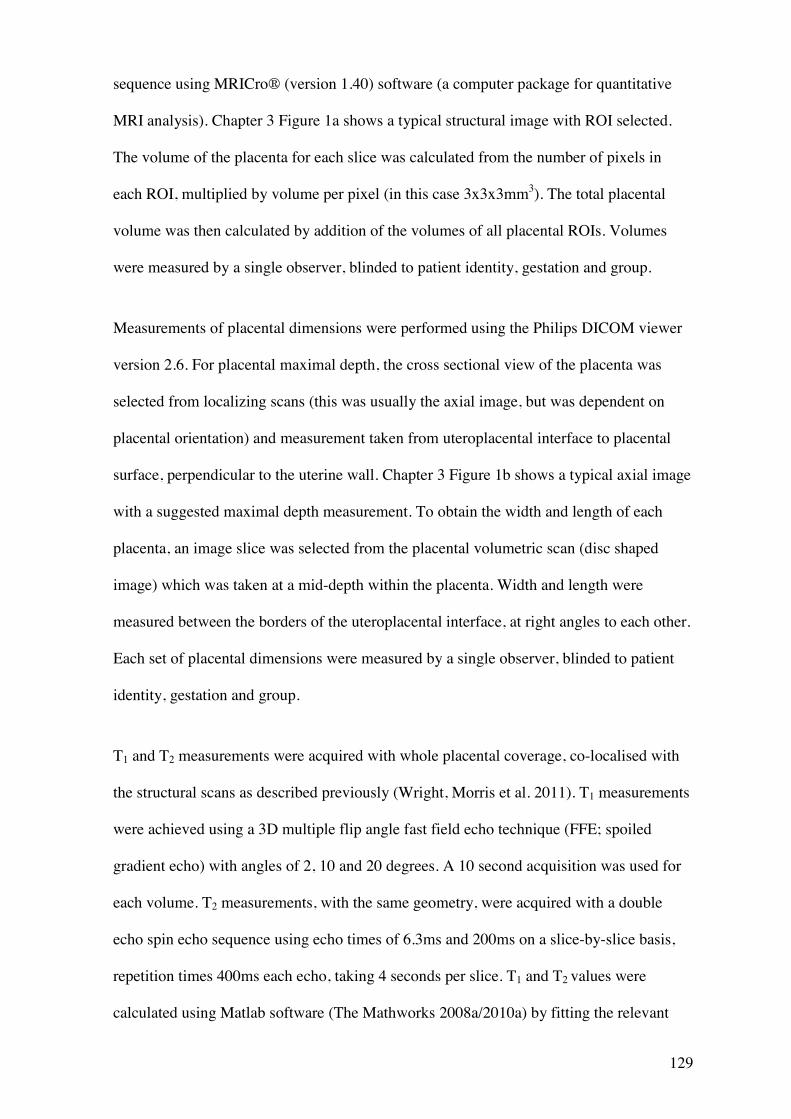
129
sequence using MRICro® (version 1.40) software (a computer package for quantitative
MRI analysis). Chapter 3 Figure 1a shows a typical structural image with ROI selected.
The volume of the placenta for each slice was calculated from the number of pixels in
each ROI, multiplied by volume per pixel (in this case 3x3x3mm3). The total placental
volume was then calculated by addition of the volumes of all placental ROIs. Volumes
were measured by a single observer, blinded to patient identity, gestation and group.
Measurements of placental dimensions were performed using the Philips DICOM viewer
version 2.6. For placental maximal depth, the cross sectional view of the placenta was
selected from localizing scans (this was usually the axial image, but was dependent on
placental orientation) and measurement taken from uteroplacental interface to placental
surface, perpendicular to the uterine wall. Chapter 3 Figure 1b shows a typical axial image
with a suggested maximal depth measurement. To obtain the width and length of each
placenta, an image slice was selected from the placental volumetric scan (disc shaped
image) which was taken at a mid-depth within the placenta. Width and length were
measured between the borders of the uteroplacental interface, at right angles to each other.
Each set of placental dimensions were measured by a single observer, blinded to patient
identity, gestation and group.
T1 and T2 measurements were acquired with whole placental coverage, co-localised with
the structural scans as described previously (Wright, Morris et al. 2011). T1 measurements
were achieved using a 3D multiple flip angle fast field echo technique (FFE; spoiled
gradient echo) with angles of 2, 10 and 20 degrees. A 10 second acquisition was used for
each volume. T2 measurements, with the same geometry, were acquired with a double
echo spin echo sequence using echo times of 6.3ms and 200ms on a slice-by-slice basis,
repetition times 400ms each echo, taking 4 seconds per slice. T1 and T2 values were
calculated using Matlab software (The Mathworks 2008a/2010a) by fitting the relevant
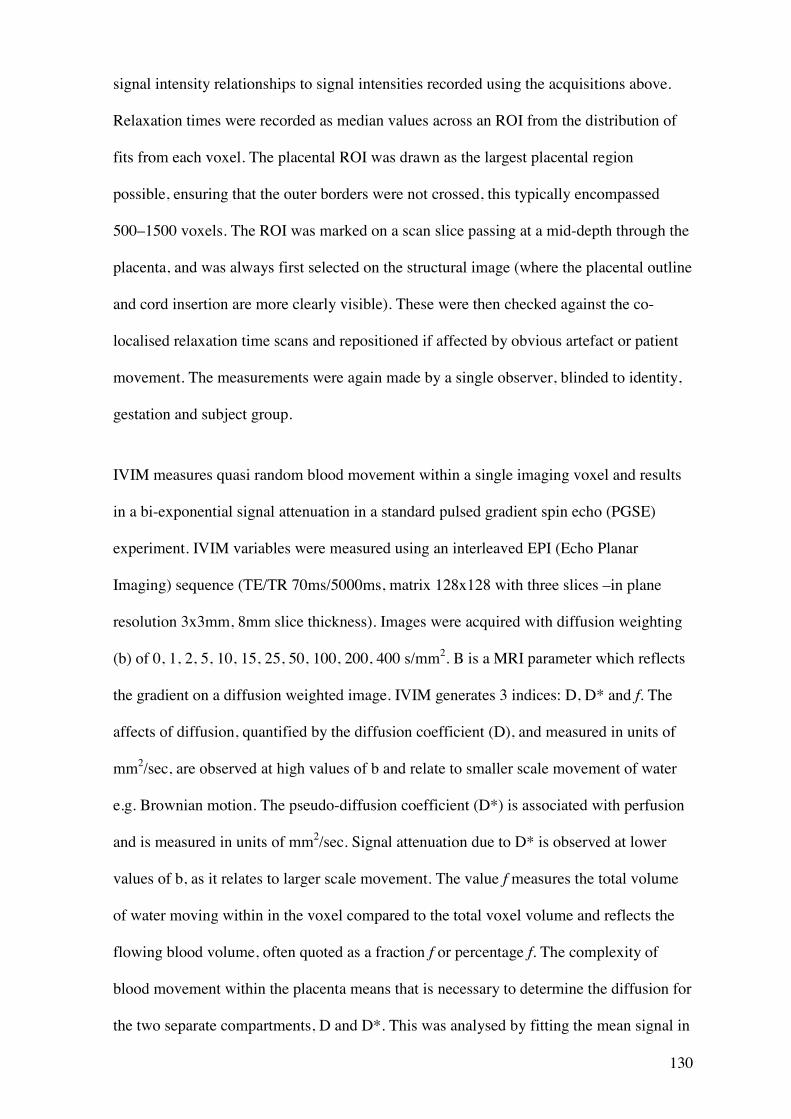
130
signal intensity relationships to signal intensities recorded using the acquisitions above.
Relaxation times were recorded as median values across an ROI from the distribution of
fits from each voxel. The placental ROI was drawn as the largest placental region
possible, ensuring that the outer borders were not crossed, this typically encompassed
500–1500 voxels. The ROI was marked on a scan slice passing at a mid-depth through the
placenta, and was always first selected on the structural image (where the placental outline
and cord insertion are more clearly visible). These were then checked against the co-
localised relaxation time scans and repositioned if affected by obvious artefact or patient
movement. The measurements were again made by a single observer, blinded to identity,
gestation and subject group.
IVIM measures quasi random blood movement within a single imaging voxel and results
in a bi-exponential signal attenuation in a standard pulsed gradient spin echo (PGSE)
experiment. IVIM variables were measured using an interleaved EPI (Echo Planar
Imaging) sequence (TE/TR 70ms/5000ms, matrix 128x128 with three slices –in plane
resolution 3x3mm, 8mm slice thickness). Images were acquired with diffusion weighting
(b) of 0, 1, 2, 5, 10, 15, 25, 50, 100, 200, 400 s/mm2. B is a MRI parameter which reflects
the gradient on a diffusion weighted image. IVIM generates 3 indices: D, D* and f. The
affects of diffusion, quantified by the diffusion coefficient (D), and measured in units of
mm2/sec, are observed at high values of b and relate to smaller scale movement of water
e.g. Brownian motion. The pseudo-diffusion coefficient (D*) is associated with perfusion
and is measured in units of mm2/sec. Signal attenuation due to D* is observed at lower
values of b, as it relates to larger scale movement. The value f measures the total volume
of water moving within in the voxel compared to the total voxel volume and reflects the
flowing blood volume, often quoted as a fraction f or percentage f. The complexity of
blood movement within the placenta means that is necessary to determine the diffusion for
the two separate compartments, D and D*. This was analysed by fitting the mean signal in

131
a placental ROI to a bi-exponential decay model, to obtain individual values. Fitting was
performed using MATLAB© code. The ROI for calculating IVIM variables was selected
as a large homogenous region in the middle each placental slice, unaffected by artefact.
This region was drawn on the B0 image (the image acquired with only the static magnetic
field applied, before the diffusion sequence is applied) using MRICro® software. All
measurements were made by a single observer, blinded to identity, gestation and group.
An example and typical ROI for a B0 image is shown in Chapter 3 Figure 2.
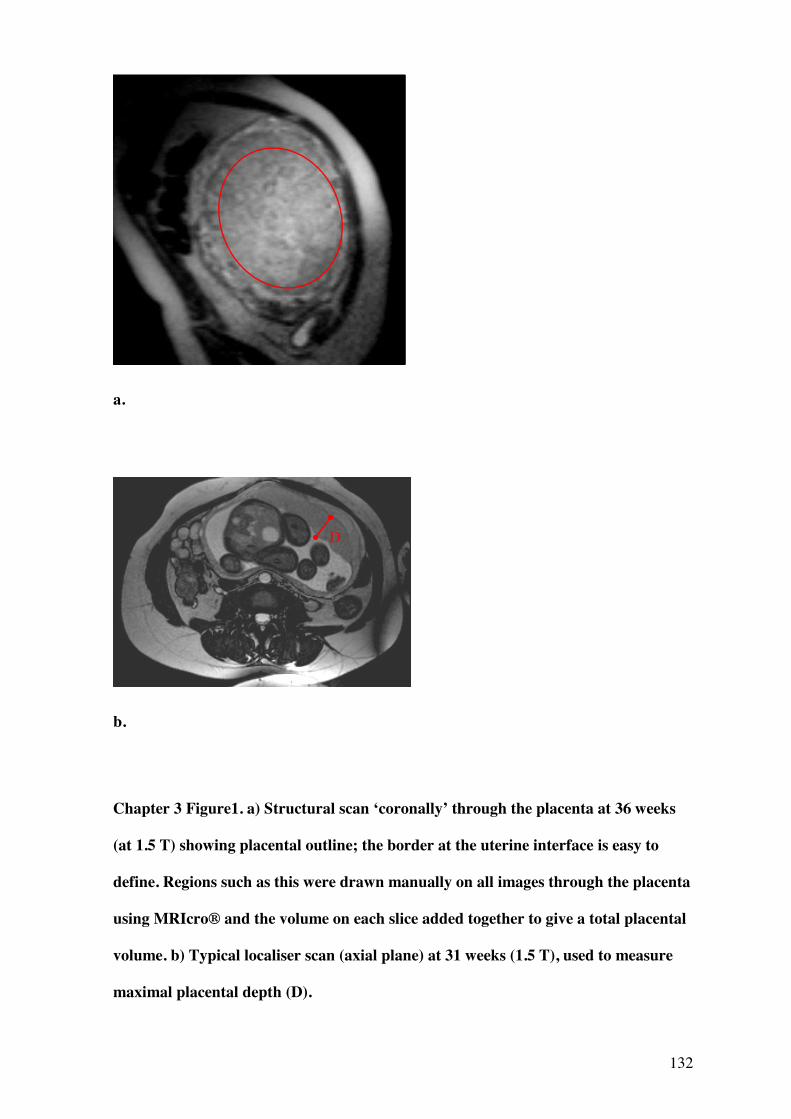
132
a.
b.
Chapter 3 Figure1. a) Structural scan ‘coronally’ through the placenta at 36 weeks
(at 1.5 T) showing placental outline; the border at the uterine interface is easy to
define. Regions such as this were drawn manually on all images through the placenta
using MRIcro® and the volume on each slice added together to give a total placental
volume. b) Typical localiser scan (axial plane) at 31 weeks (1.5 T), used to measure
maximal placental depth (D).
D
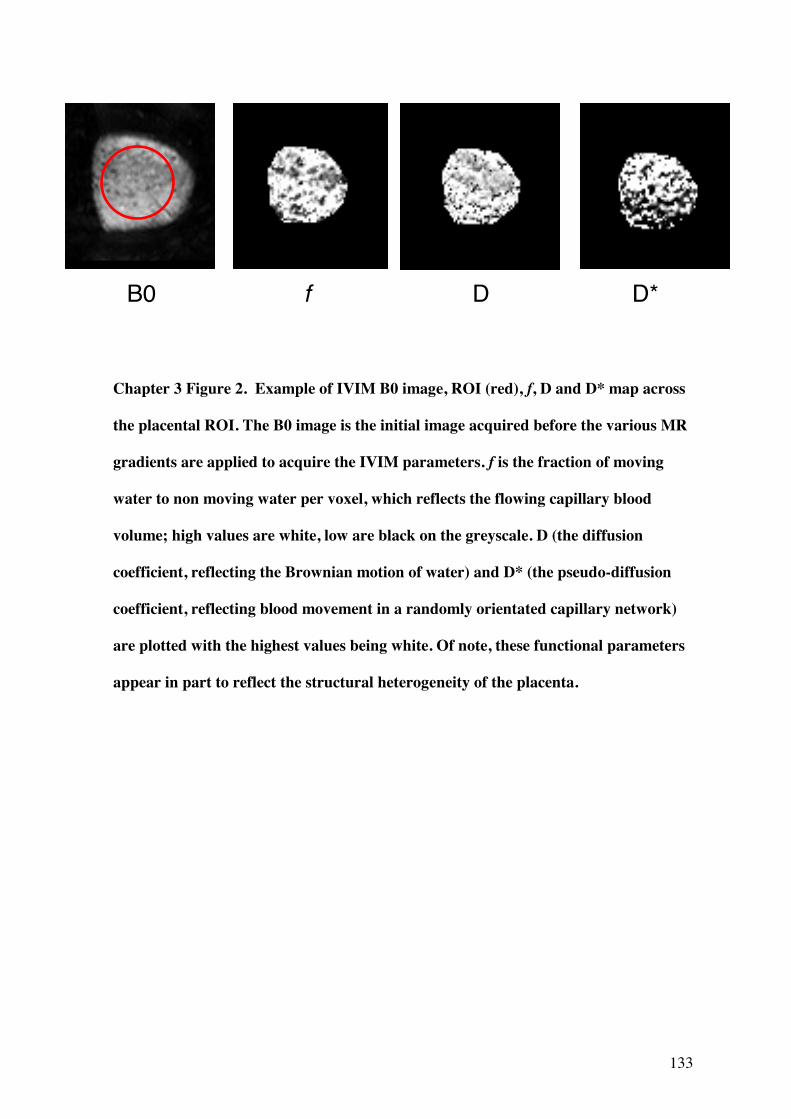
133
Chapter 3 Figure 2. Example of IVIM B0 image, ROI (red), f, D and D* map across
the placental ROI. The B0 image is the initial image acquired before the various MR
gradients are applied to acquire the IVIM parameters. f is the fraction of moving
water to non moving water per voxel, which reflects the flowing capillary blood
volume; high values are white, low are black on the greyscale. D (the diffusion
coefficient, reflecting the Brownian motion of water) and D* (the pseudo-diffusion
coefficient, reflecting blood movement in a randomly orientated capillary network)
are plotted with the highest values being white. Of note, these functional parameters
appear in part to reflect the structural heterogeneity of the placenta.
B0 f D D*
134
3.3.3 Placental morphology
Stereology was performed on delivered placentas from women who had undergone an
MRI scan. The methods used were adopted from Mayhew et al. (Mayhew, Ohadike et al.
2003; Mayhew, Manwani et al. 2007) as described by Wright, Morris et al.(Wright,
Morris et al. 2011). Placentas were collected postnatally within 30 minutes of delivery.
Systematic random sampling was performed by superimposing a transparent grid
haphazardly over the placenta, bearing a systematic array of sampling windows (4cm
apart). Using a random computer-generated number sequence, full-depth columns of
tissue were dissected until 8 windows had been sampled. The resulting tissue was further
subdivided equally into top (fetal facing), middle and bottom (maternal facing) placental
sections, and fixed in 10% buffered formalin. These divisions reflected specific slices of
MR images previously taken. On this occasion, only middle sections were considered,
along with their associated mid-depth MR images. These samples were diced and
embedded with random orientation in paraffin wax blocks, before being processed for
histology. As this protocol alters the reference volume for stereological calculations,
absolute values concerning the whole placenta could not be reported.
Before imaging, cut sections (5 micrometres) were mounted on microscope slides, stained
with hematoxylin and eosin (H&E), and observed under a Leitz (Dialux 22) microscope at
a magnification of x250. Approximately 8 sections were investigated per placenta. For
image analysis, a Q-Imaging (Fast 1394) digital camera was used with Image-Pro Plus
software (Version 6.3). For each section, 5 fields were selected in a systematic way,
moving around the section in sequence of partial turns of the stage adjuster. In total,
approximately 40 high-power fields of view were analysed per placenta. Test point
counting was employed to obtain volume densities. Intersection counting, using a
superimposed grid lattice, was also used to calculate surface area densities. Indices
135
calculated included: (i) villous volume ratio, (ii) intervillous volume ratio, (iii) fetal
capillary volume ratio, (iv) fibrinoid volume ratio (intervillous fibrin-like deposition), (v)
villous surface and (vi) capillary surface area densities. From these, total blood volume
(intervillous + capillary volume ratios), ratio of fibrinoid: villous volume ratios, ratio of
capillary: villous volume ratios, and total surface area densities (villous + capillary surface
area densities) were calculated.
All placentas were assessed stereologically at delivery, but subset analysis was performed
for placentas scanned within a week of delivery, in an attempt to negate the lag between
MR and stereological variables (see Wright, Morris et al., 2011). Where this was not
achieved (due to limited numbers), multivariate regression analyses was performed to
account for gestational effects.
3.3.4 Statistics
The distribution of variables was assessed and data transformed where appropriate for
parametric analysis. Two-tailed testing was employed for all correlations. Graphpad Prism
(version 4.01) was for used statistical analysis and Graphpad InStat (version 3.10) for
multiple regression analysis. IBM SPSS (version 20.0.0) was used for analysis of co-
variance (ANCOVA) with homoscedasticity confirmed by Levene’s test. ROC
curves were generated using Graphpad Prism (version 4.01).
136
3.4 Results
A total of 39 women with normal pregnancies and 14 with FGR were scanned. The
characteristics of both groups are summarised in Chapter 3 Table 1. Of the 11 FGR
pregnancies, 14 had birthweights below the 1st centile of the customised chart.
All 53 pregnancies were analysed when considering placental volumes and dimensions
and relaxation times, bar one T1 measurement in the normal group, in which the scan was
incomplete. Due to the IVIM MR protocols being developed and introduced later in the
study period, 26 pregnancies (16 of the normal group and 10 of the FGR group), were
available for this analysis.
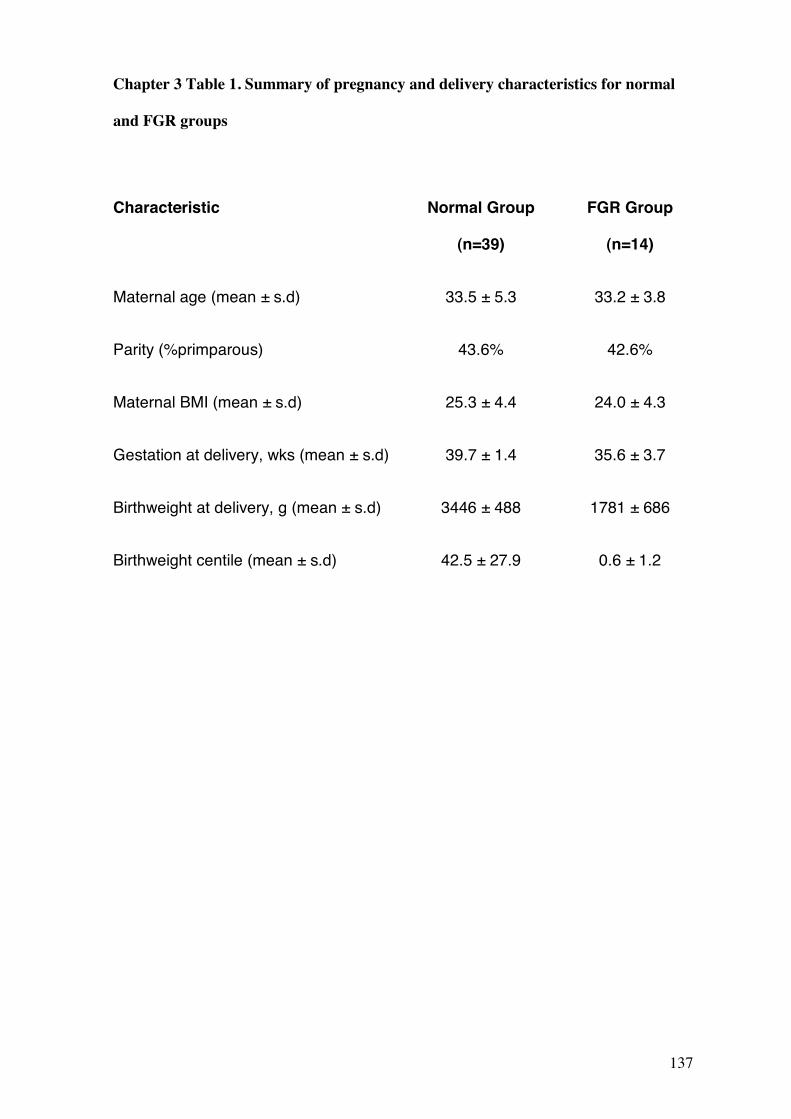
137
Chapter 3 Table 1. Summary of pregnancy and delivery characteristics for normal
and FGR groups
Characteristic Normal Group
(n=39)
FGR Group
(n=14)
Maternal age (mean ± s.d) 33.5 ± 5.3 33.2 ± 3.8
Parity (%primparous) 43.6% 42.6%
Maternal BMI (mean ± s.d) 25.3 ± 4.4 24.0 ± 4.3
Gestation at delivery, wks (mean ± s.d) 39.7 ± 1.4 35.6 ± 3.7
Birthweight at delivery, g (mean ± s.d) 3446 ± 488 1781 ± 686
Birthweight centile (mean ± s.d) 42.5 ± 27.9 0.6 ± 1.2
138
3.4.1 Measurement of Placental Volume and Dimensions
There was no significant difference between the gestation at time of scan between normal
and FGR groups for this comparison: mean±SE 33.5 ± 0.9 weeks and 33.2 ± 1.0 weeks
respectively, unpaired t-test, although correction for gestation was made in the analysis
when comparing groups by the use of ANCOVA.
Unsurprisingly, there was a significant positive correlation between placental volume in
normal pregnancy and gestation (Pearson’s r2=0.67, p=>0.0001), although this was not
replicated in the smaller sized FGR group (Pearson’s r2=0.50, p=0.07); the correlations
appeared similar, albeit with greater variability in the FGR group. Placental volume was
significantly lower in the FGR group when gestation was not considered (unpaired t-test
p=0.003) and when gestation was corrected for (ANCOVA F=14.879, p=0.0003, partial
2=0.23). The corrected means for volume were (mean±SE) 814.3± 35.7cm3 and 545.7±
59.7cm3 for the normal and FGR groups respectively. There was no significant interaction
between group and gestation for this analysis.
There was a significant positive correlation between placental depth in normal pregnancy
and gestation (Pearson’s r2=0.51, p=0.001), this again was not replicated in the smaller
FGR group (Pearson’s r2=0.27, p=0.34), although the correlations appeared similar with
greater variability in the FGR group. Placental depth was significantly greater in the FGR
group (unpaired t-test p=0.01) and more so when gestation is corrected for (ANCOVA
F=8.874, p=0.004, partial 2=0.15). The corrected means for volume were (mean±SE)
39.6 ± 1.7mm and 49.4 ± 1.7mm for the normal and FGR groups respectively. There was
no significant interaction between group and gestation for this analysis.
139
Depth: volume ratio was also considered as this had been highlighted as of interest in the
study by Damodaram et al. (Damodaram, Story et al. 2010). There was a significant
positive correlation between placental depth: volume ratio in normal pregnancy and
gestation (Pearson’s r2=-0.37, p=0.02), although this was not replicated in the FGR group
(Pearson’s r2=-0.35, p=0.21), again with similar correlations but greater variability seen in
the smaller FGR group. Placental depth: volume was significantly greater in the FGR
group when gestational effects are not considered (unpaired t-test p<0.0001). For
ANCOVA analysis, log10 transformation of the depth: volume ratio was used, as this
demonstrated better homoscedasticity between normal and FGR groups (Levene’s test
p=0.185) whilst maintaining a normal distribution. When gestation was considered as a
co-variate, there was a highly significant difference in log10 depth: volume between
normal and FGR groups (F=39.683, p=<0.000001, partial 2=0.442). The corrected means
for the log10 depth: volume ratio was (mean±SE) -1.299 ± 0.23 and -1.017± 0.38 for the
normal and FGR groups respectively. There was no significant interaction between group
and gestation for this analysis. The results for log10 depth: volume is illustrated in Chapter
3 Figure 3. A further analysis of placental depth (width x length) was performed; there
was no correlation between this parameter and gestation in either normal or FGR groups
(p=0.52 and 0.52 respectively). As this variable was not normally distributed the log10
transformation was used to compare groups which were significantly different (ANCOVA
F=0.132, p=0.0002, partial 2=0.314). (Corrected mean±SE = -2.47 ± 0.05 and -2.76
±0.03 for normal and FGR groups respectively.) There was no interaction between group
and gestation in this analysis (p=0.50) and variance was uniformly distributed (Levene’s
test p= 0.132).
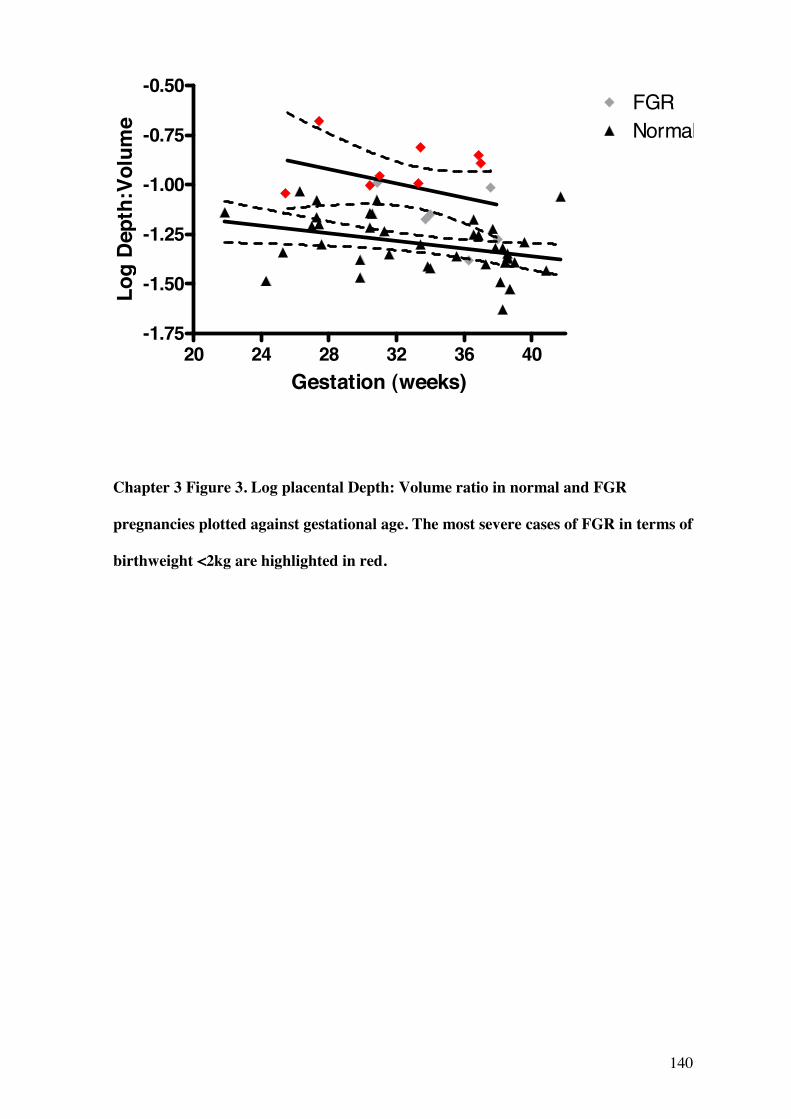
140
20 24 28 32 36 40-1.75
-1.50
-1.25
-1.00
-0.75
-0.50FGRNormal
Gestation (weeks)
Log
Dep
th:V
olum
e
Chapter 3 Figure 3. Log placental Depth: Volume ratio in normal and FGR
pregnancies plotted against gestational age. The most severe cases of FGR in terms of
birthweight <2kg are highlighted in red.
141
3.4.2 Placental Relaxation Times
As noted measurement of placental relaxation times was possible for all 53 pregnancies
examined excluding one participant in the normal group in whom the T1 sequence was
incomplete, therefore, as above, the groups were well matched in terms of gestation at
scan. Relaxation time values are presented in Chapter 4 Figure 4. We previously reported
a significant negative correlation between placental relaxation times and gestation in
normal pregnancy (Wright, Morris et al. 2011). In this analysis the correlation between T2
and gestation in normal pregnancy was again highly significant (Pearson’s r2=-0.47,
p=0.002). For T1, a trend to decrease with advancing gestation was observed, although
this was not significant in this dataset (Pearson’s r2=-0.05, p=0.17). There was no
correlation with either T1 or T2 and gestation in the smaller FGR group (Spearman’s
p=0.15 and p=0.14 respectively); these data were analyzed using non-parametric tests due
to the almost bimodal distribution of the data in the FGR groups. There was a significant
difference in T2 values between the normal and FGR pregnancy groups when compared
directly (Mann-Whitney p=0.02) but no significant difference in T1 (Mann-Whitney
p=0.37). When gestation was corrected for using ANCOVA a significant difference was
observed in T2 between groups (ANCOVA F=7.045, p=0.01, partial 2=0.123, corrected
mean±SE normal group 199.274±5.018, and FGR group 173.351± 8.378). However,
should be interpreted with caution, given an interaction seen between group and gestation
in this analysis (p=0.03) and variance of T2 may not be homogenous across groups
(Levene’s test p=0.05). No significant difference was observed in T1 between normal and
FGR groups when considering gestation as a co-variate (ANCOVA F=1.626, p=0.208,
partial 2=0.032, Levene’s test p=0.996, Interaction between group and gestation
p=0.696). The difficulty in analysis of T2 lies in the bimodal distribution seen in the FGR
group, which cannot be normalized by standard transformations. One further analysis was
142
performed in an attempt to make sense of the two possible populations seen in the FGR
group by splitting this group according to birth weights, either greater or less than 2kg.
Although numbers are small (>2kg n=6, <2kg n=8), this split produced curves of 2
populations that appeared more normally distributed. Accounting for any gestational
effect, the bigger >2kg babies were similar to the normal group in terms of the mean T2
(ANCOVA F 0.244, p=0.624, partial 2=0.006, >2kg mean ±SE 195.134±12.149)
whereas the smaller <2kg babies, had significantly lower T2 values as compared to the
normal group (ANCOVA F12.620, p=0.001, partial 2=0.223, <2kg mean±SE
159.310±10.368).
We previously reported a correlation between placental T2 and the placental fibrin content
in normal pregnancy (Wright, Morris et al. 2011). This relationship persisted in this
analysis; placentas delivered within a week of the scan (thereby reducing the lag between
scan and assessment of placental morphology), showed a significant positive correlation
between T2 and the placental fibrin volume ratio assessed stereologically in normal
pregnancy (n=10, Spearman’s r2=0.709, p=0.027). No further correlations were observed
between relaxation times and morphological variables in either normal (n=23) or FGR
groups (n=5). Fewer FGR placentas were collected, as decision to delivery time was often
short and the research team had not been made aware of the plan to deliver.
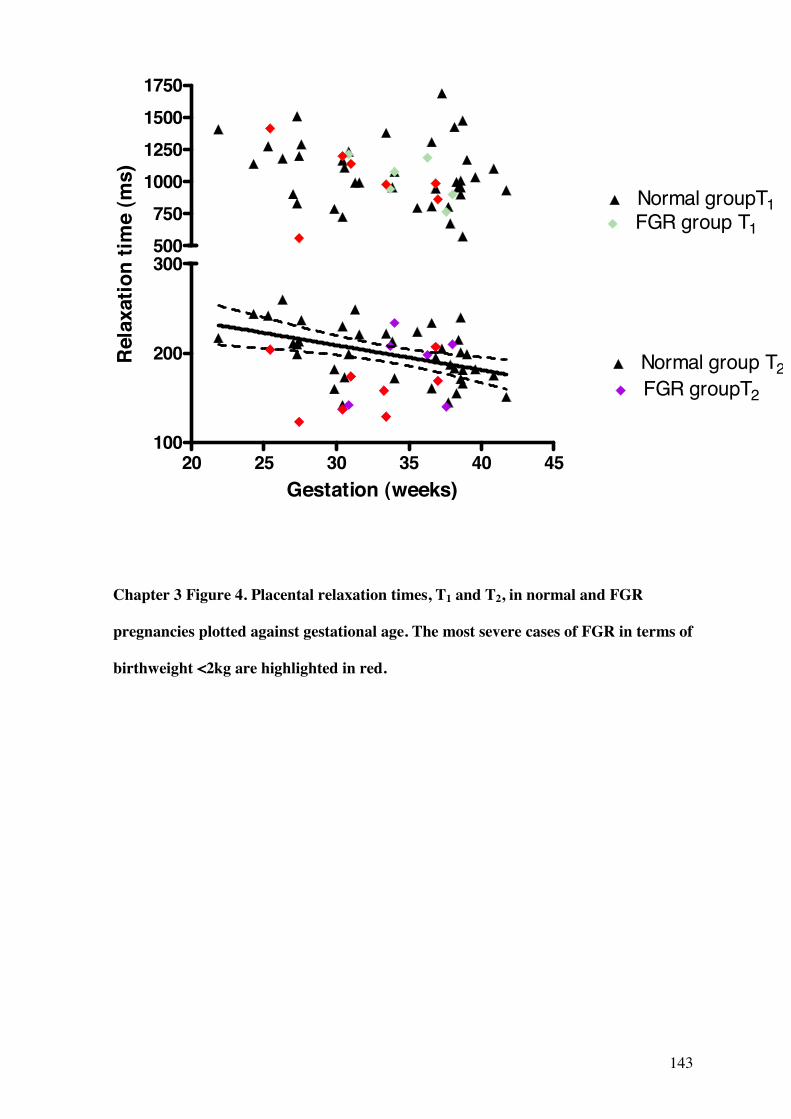
143
20 25 30 35 40 45100
200
300
Normal group T2
Normal groupT1
FGR groupT2
FGR group T1500750
1000125015001750
Gestation (weeks)
Rel
axat
ion
time
(ms)
Chapter 3 Figure 4. Placental relaxation times, T1 and T2, in normal and FGR
pregnancies plotted against gestational age. The most severe cases of FGR in terms of
birthweight <2kg are highlighted in red.
144
3.4.3 IVIM Indices
As noted, analysis of the IVIM variables f, D and D* was possible in 26 participants; 16
normal and 10 FGR pregnancies. The normal and FGR groups appeared well matched in
terms of gestation at scan (mean±SE normal group 35.0 ±1.3, mean FGR group 32.3 ±1.3,
unpaired t-test p=0.193), but analyses to account for gestational effects were also
performed when comparing groups.
The relationship between D and gestation in normal and FGR groups is shown in Chapter
3 Figure 5. There was a significant negative correlation between D (the diffusion
coefficient) and gestation in normal pregnancy (Pearson’s r2=-0.519, p=0.039), which was
not observed in FGR (r2=-0.307, p=0.389), although there remained a trend for the values
to fall towards term. There was also a significant difference between D in FGR and
normal pregnancy groups when compared directly (unpaired t-test p=0.013) and when
gestation was considered as a co-variate (ANCOVA F=12.502, p= 0.02, partial 2=0.343).
The adjusted mean±SE for D were 2.00mm2/mm3 ±0.117 and 1.302mm2/mm3±0.154 for
normal and FGR groups respectively. Of note, there was no interaction between gestation
and group for this analysis (p=0.99) and variance in D was uniform across groups
(Levene’s test p=0.41).
There was no significant correlation between f and D* and gestation in either group and no
significant differences in these values between normal and FGR groups (ANCOVA f
p=0.915 and p=0.984 respectively).
IVIM indices were also correlated with placental morphological variables. In normal
pregnancy D was shown to correlate with placental villous volume ratio positively and
intervillous space volume (and total blood volume ratio) negatively (n=11, Spearman’s
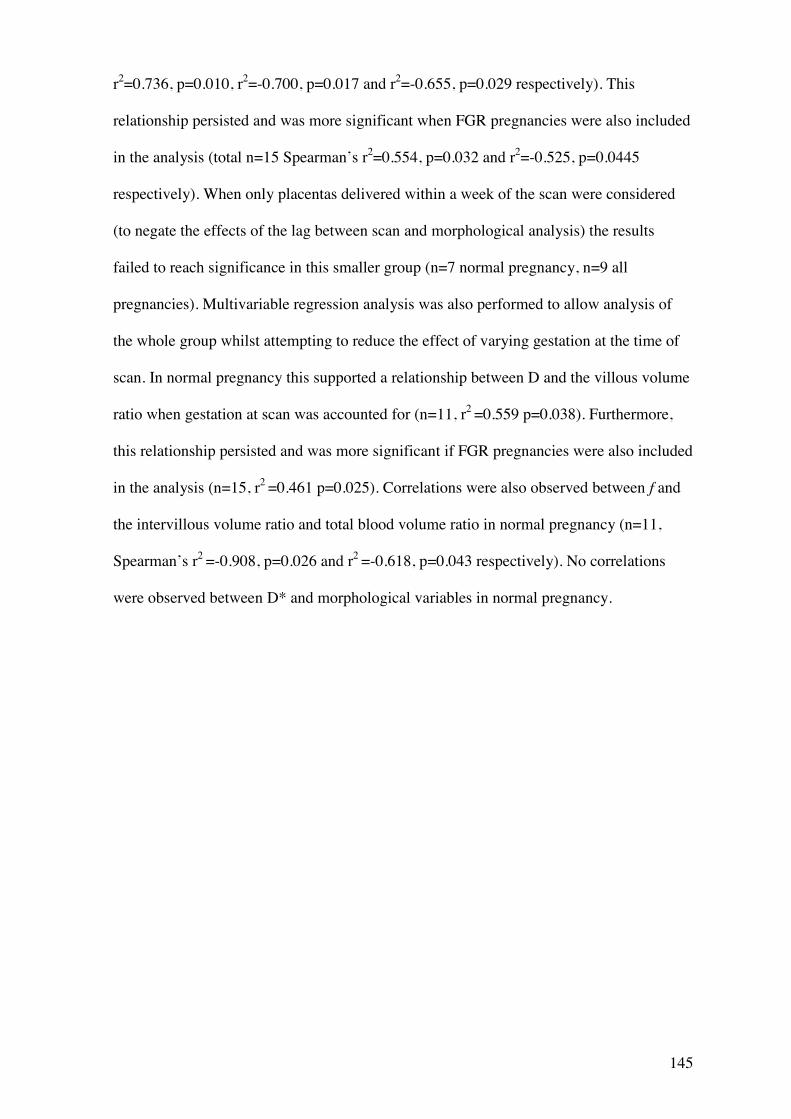
145
r2=0.736, p=0.010, r2=-0.700, p=0.017 and r2=-0.655, p=0.029 respectively). This
relationship persisted and was more significant when FGR pregnancies were also included
in the analysis (total n=15 Spearman’s r2=0.554, p=0.032 and r2=-0.525, p=0.0445
respectively). When only placentas delivered within a week of the scan were considered
(to negate the effects of the lag between scan and morphological analysis) the results
failed to reach significance in this smaller group (n=7 normal pregnancy, n=9 all
pregnancies). Multivariable regression analysis was also performed to allow analysis of
the whole group whilst attempting to reduce the effect of varying gestation at the time of
scan. In normal pregnancy this supported a relationship between D and the villous volume
ratio when gestation at scan was accounted for (n=11, r2 =0.559 p=0.038). Furthermore,
this relationship persisted and was more significant if FGR pregnancies were also included
in the analysis (n=15, r2 =0.461 p=0.025). Correlations were also observed between f and
the intervillous volume ratio and total blood volume ratio in normal pregnancy (n=11,
Spearman’s r2 =-0.908, p=0.026 and r2 =-0.618, p=0.043 respectively). No correlations
were observed between D* and morphological variables in normal pregnancy.
146
20 24 28 32 36 400.0
0.5
1.0
1.5
2.0
2.5
3.0
3.5NormalFGR
Gestation (weeks)
D (m
m2 /m
m3 )
Chapter 3 Figure 5. Placental D (the diffusion coefficient) in normal and FGR
pregnancies plotted against gestational age. The most severe cases of FGR in terms of
birthweight <2kg are highlighted in red.
147
3.4.4 Stereological Variables
Comparison of stereological variables between normal and FGR groups demonstrated a
significantly reduced villous surface area density in FGR placentas (n=5) in comparison to
the normal group (n=23) (unpaired t-test p=0.037), consistent with previous studies
(Mayhew, Ohadike et al. 2003; Daayana, Baker et al. 2004). (Mean±SE Villous surface
area normal 229.0±7.2 cm2/cm3and FGR 192.9±11.2cm2/cm3).
3.4.5 Predictive Testing
The results for the above parameters are summarized in Chapter 3 Table 2. Although
numbers were small, where differences between FGR and normal pregnancies were most
statistically significant (see Chapter 3 Table 2), ROC (Receiver Operator Characteristic)
curves were constructed, in an exploratory fashion, as a means of investigating and
comparing the potential of these biomarkers in the assessment of FGR. As each parameter
had been measured at a range of gestations, where gestation had a significant effect on the
variable, results were expressed as a percentage of the predicted normal value for that
gestational time point; the predicted normal values were estimated using the linear
regression model for each parameter across gestation. The actual results were then
expressed as a percentage of normal in relation to the predicted value for the same
gestation and ROC curves constructed from these values. ROC curves for placental depth:
volume ratio (and adjusted as a percentage of normal), T2 relaxation time (and adjusted as
a percentage of normal) and D (and adjusted as a percentage of normal) can be seen in
Chapter 3 Figure 6.
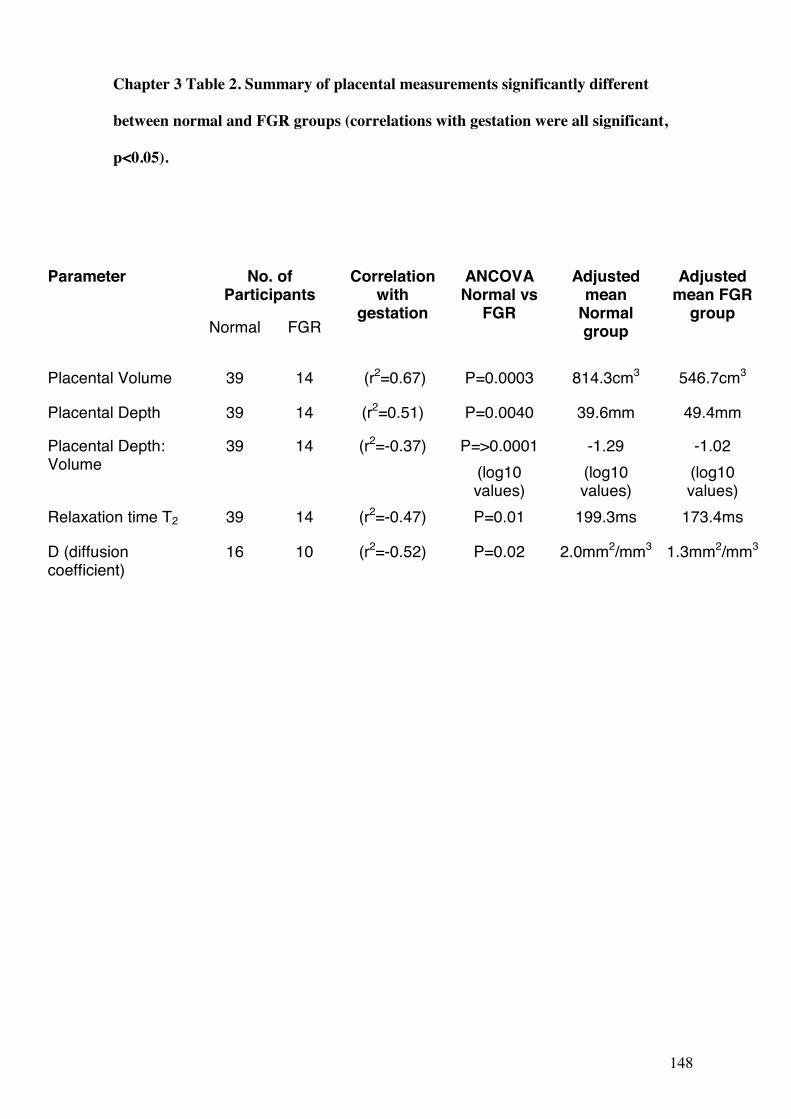
148
Chapter 3 Table 2. Summary of placental measurements significantly different
between normal and FGR groups (correlations with gestation were all significant,
p<0.05).
No. of Participants
Parameter
Normal FGR
Correlation with
gestation
ANCOVA Normal vs
FGR
Adjusted mean
Normal group
Adjusted mean FGR
group
Placental Volume 39 14 (r2=0.67) P=0.0003 814.3cm3 546.7cm3
Placental Depth 39 14 (r2=0.51) P=0.0040 39.6mm 49.4mm
Placental Depth: Volume
39 14 (r2=-0.37) P=>0.0001 (log10 values)
-1.29 (log10 values)
-1.02 (log10 values)
Relaxation time T2 39 14 (r2=-0.47) P=0.01 199.3ms 173.4ms
D (diffusion coefficient)
16 10 (r2=-0.52) P=0.02 2.0mm2/mm3 1.3mm2/mm3
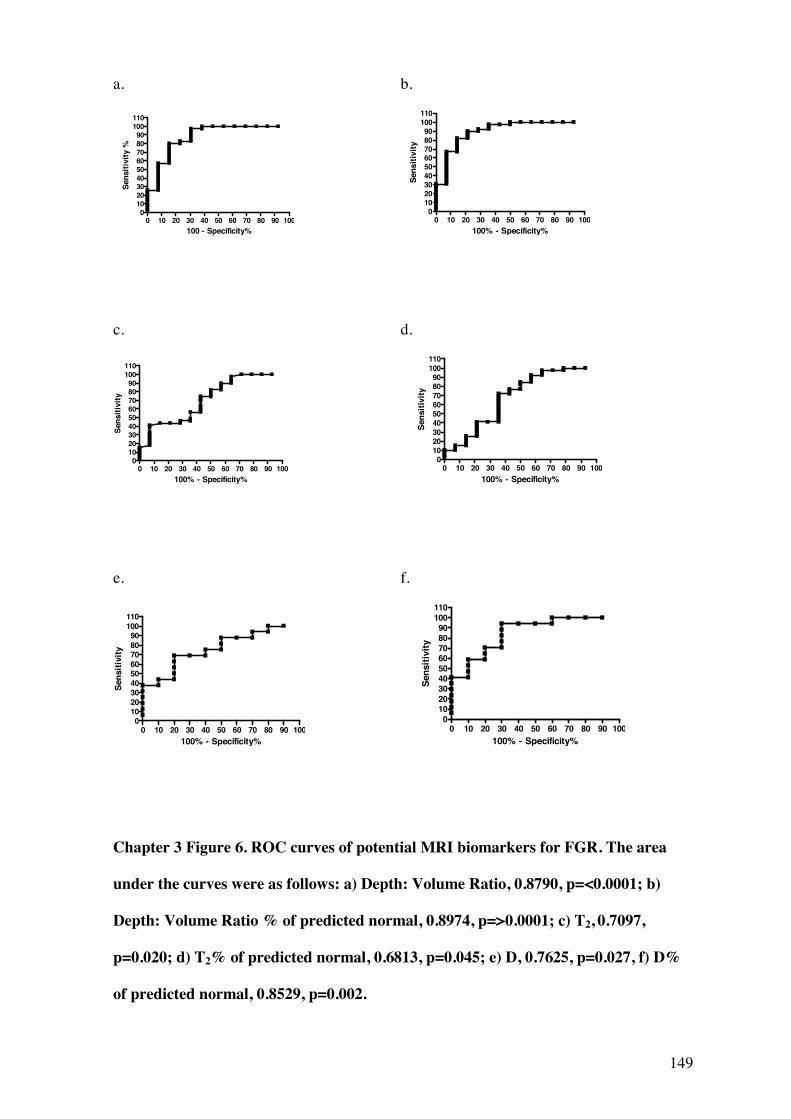
149
a. b.
0 10 20 30 40 50 60 70 80 90 100
0102030405060708090
100110
100 - Specificity%
Sens
itivi
ty %
0 10 20 30 40 50 60 70 80 90 100
0102030405060708090
100110
100% - Specificity%
Sens
itivi
ty
c. d.
0 10 20 30 40 50 60 70 80 90 1000
102030405060708090
100110
100% - Specificity%
Sens
itivi
ty
0 10 20 30 40 50 60 70 80 90 100
0102030405060708090
100110
100% - Specificity%
Sens
itivi
ty
e. f.
0 10 20 30 40 50 60 70 80 90 1000
102030405060708090
100110
100% - Specificity%
Sens
itivi
ty
0 10 20 30 40 50 60 70 80 90 100
0102030405060708090
100110
100% - Specificity%
Sens
itivi
ty
Chapter 3 Figure 6. ROC curves of potential MRI biomarkers for FGR. The area
under the curves were as follows: a) Depth: Volume Ratio, 0.8790, p=<0.0001; b)
Depth: Volume Ratio % of predicted normal, 0.8974, p=>0.0001; c) T2, 0.7097,
p=0.020; d) T2% of predicted normal, 0.6813, p=0.045; e) D, 0.7625, p=0.027, f) D%
of predicted normal, 0.8529, p=0.002.
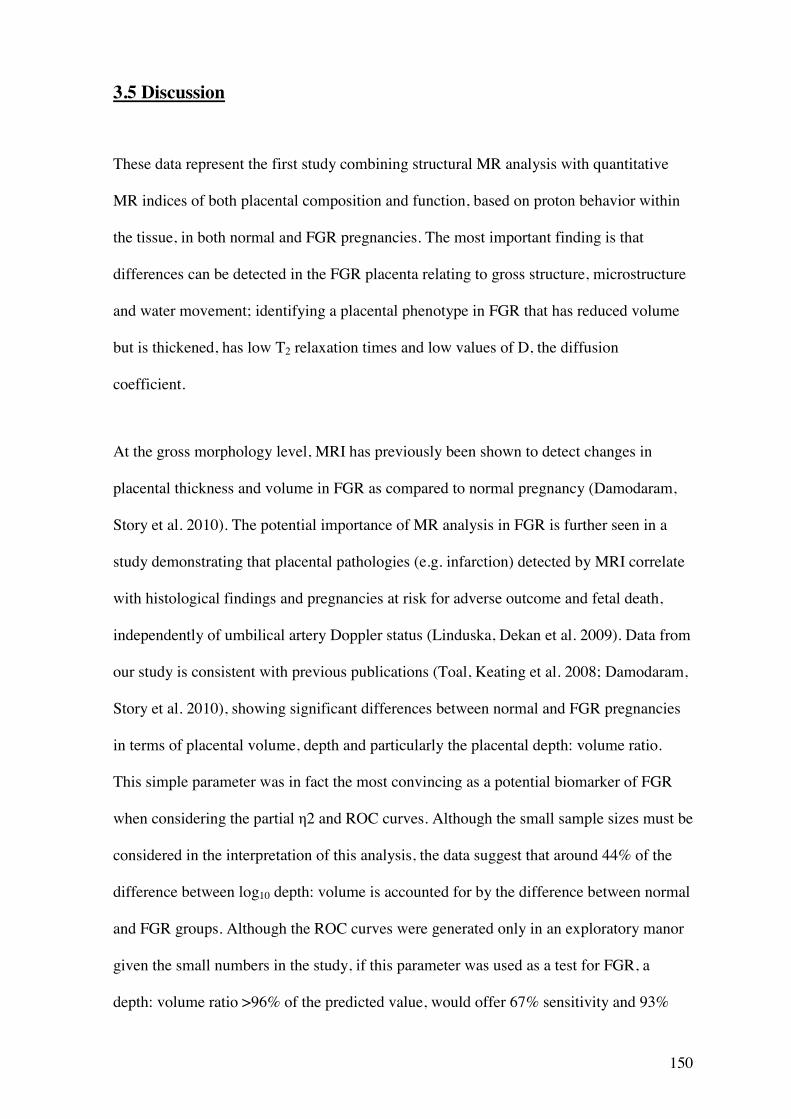
150
3.5 Discussion
These data represent the first study combining structural MR analysis with quantitative
MR indices of both placental composition and function, based on proton behavior within
the tissue, in both normal and FGR pregnancies. The most important finding is that
differences can be detected in the FGR placenta relating to gross structure, microstructure
and water movement; identifying a placental phenotype in FGR that has reduced volume
but is thickened, has low T2 relaxation times and low values of D, the diffusion
coefficient.
At the gross morphology level, MRI has previously been shown to detect changes in
placental thickness and volume in FGR as compared to normal pregnancy (Damodaram,
Story et al. 2010). The potential importance of MR analysis in FGR is further seen in a
study demonstrating that placental pathologies (e.g. infarction) detected by MRI correlate
with histological findings and pregnancies at risk for adverse outcome and fetal death,
independently of umbilical artery Doppler status (Linduska, Dekan et al. 2009). Data from
our study is consistent with previous publications (Toal, Keating et al. 2008; Damodaram,
Story et al. 2010), showing significant differences between normal and FGR pregnancies
in terms of placental volume, depth and particularly the placental depth: volume ratio.
This simple parameter was in fact the most convincing as a potential biomarker of FGR
when considering the partial 2 and ROC curves. Although the small sample sizes must be
considered in the interpretation of this analysis, the data suggest that around 44% of the
difference between log10 depth: volume is accounted for by the difference between normal
and FGR groups. Although the ROC curves were generated only in an exploratory manor
given the small numbers in the study, if this parameter was used as a test for FGR, a
depth: volume ratio >96% of the predicted value, would offer 67% sensitivity and 93%

151
specificity for the condition. A novel marker, placental depth: (width x length) ratio was
also considered in this analysis. Although the results were not as convincing as the depth:
volume ratio, this parameter may be more applicable in real case analysis, as measurement
of placental volume performed manually slice-by-slice is relatively laborious, whereas
width x length is measured easily. In these data, where women were scanned at a whole
range of gestations, this parameter was not as predictive of FGR as the depth: volume
ratio.
The relaxation times are determined by the molecular environment of the hydrogen nuclei
(the hydrogen nucleus is a single positively charged proton) within the tissue. In biological
systems, water may be free in blood (or CSF) but is usually associated with large
polysaccharides and proteins, which restrict proton movement. Relaxation occurs by two
independent processes, referred to as longitudinal (spin-lattice) (T1) and transverse (spin-
spin) (T2) relaxation, the rate of which depends upon the interaction between protons and
their surrounding environment and those in an intermediate situation, often termed
‘structured’. Theoretically, T1 will be shortest in tissues with mainly ‘structured’ protons,
longer when ‘free’ and longest when ‘bound’. T2 will be longest where protons are ‘free’
in solution and shortest where bound to macromolecules (Bottomley, Foster et al. 1984).
In previous MRI studies at lower field strengths (0.5 T), a trend for shorter relaxation time
measurements, T1 and T2, was observed in pregnancies complicated by pre-eclampsia and
FGR (Gowland, Freeman et al. 1998) although the numbers were small. In our previous
study (Wright, Morris et al. 2011), we also demonstrated a significant fall in both T1 and
T2 with gestation and a correlation between T2 and placental fibrin content. The current
study is consistent with those data, although the relationship between T1 and gestation was
not seen, the relationship with T2 and gestation was observed and it is also in T2 values
that a significant reduction was seen in FGR. This would support the view that it is T2
rather than T1 that is reflecting the morphological changes occurring in the placenta with
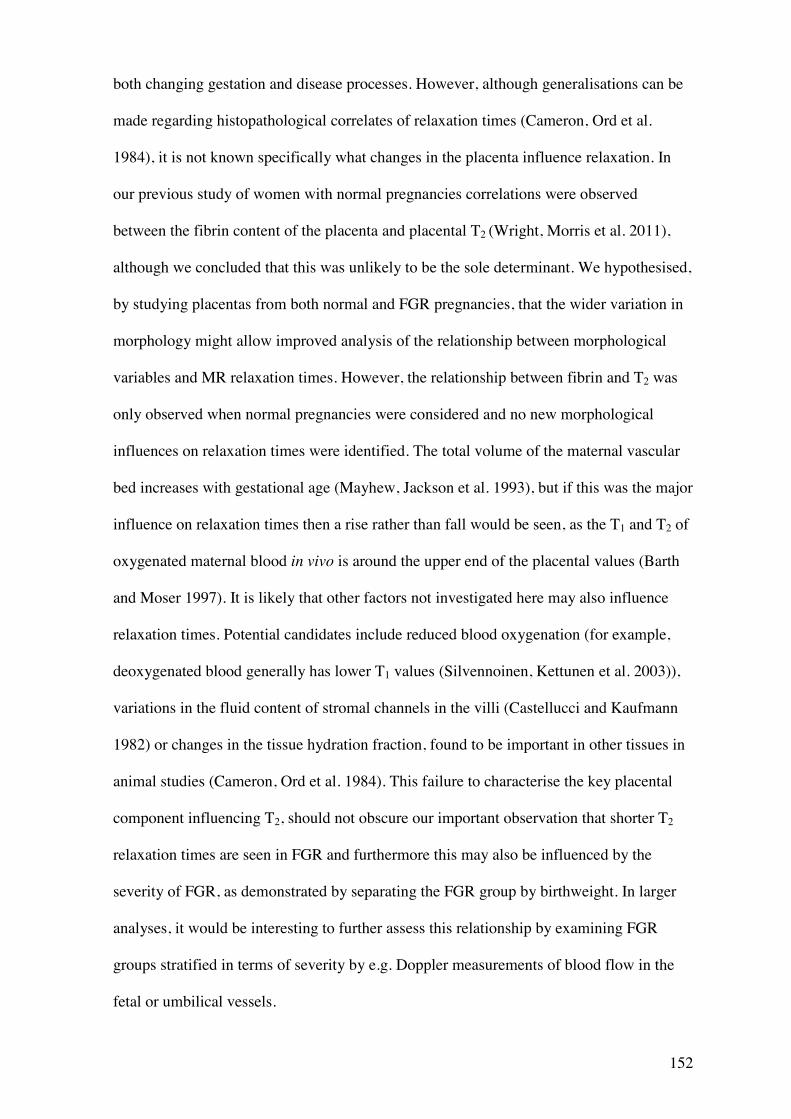
152
both changing gestation and disease processes. However, although generalisations can be
made regarding histopathological correlates of relaxation times (Cameron, Ord et al.
1984), it is not known specifically what changes in the placenta influence relaxation. In
our previous study of women with normal pregnancies correlations were observed
between the fibrin content of the placenta and placental T2 (Wright, Morris et al. 2011),
although we concluded that this was unlikely to be the sole determinant. We hypothesised,
by studying placentas from both normal and FGR pregnancies, that the wider variation in
morphology might allow improved analysis of the relationship between morphological
variables and MR relaxation times. However, the relationship between fibrin and T2 was
only observed when normal pregnancies were considered and no new morphological
influences on relaxation times were identified. The total volume of the maternal vascular
bed increases with gestational age (Mayhew, Jackson et al. 1993), but if this was the major
influence on relaxation times then a rise rather than fall would be seen, as the T1 and T2 of
oxygenated maternal blood in vivo is around the upper end of the placental values (Barth
and Moser 1997). It is likely that other factors not investigated here may also influence
relaxation times. Potential candidates include reduced blood oxygenation (for example,
deoxygenated blood generally has lower T1 values (Silvennoinen, Kettunen et al. 2003)),
variations in the fluid content of stromal channels in the villi (Castellucci and Kaufmann
1982) or changes in the tissue hydration fraction, found to be important in other tissues in
animal studies (Cameron, Ord et al. 1984). This failure to characterise the key placental
component influencing T2, should not obscure our important observation that shorter T2
relaxation times are seen in FGR and furthermore this may also be influenced by the
severity of FGR, as demonstrated by separating the FGR group by birthweight. In larger
analyses, it would be interesting to further assess this relationship by examining FGR
groups stratified in terms of severity by e.g. Doppler measurements of blood flow in the
fetal or umbilical vessels.
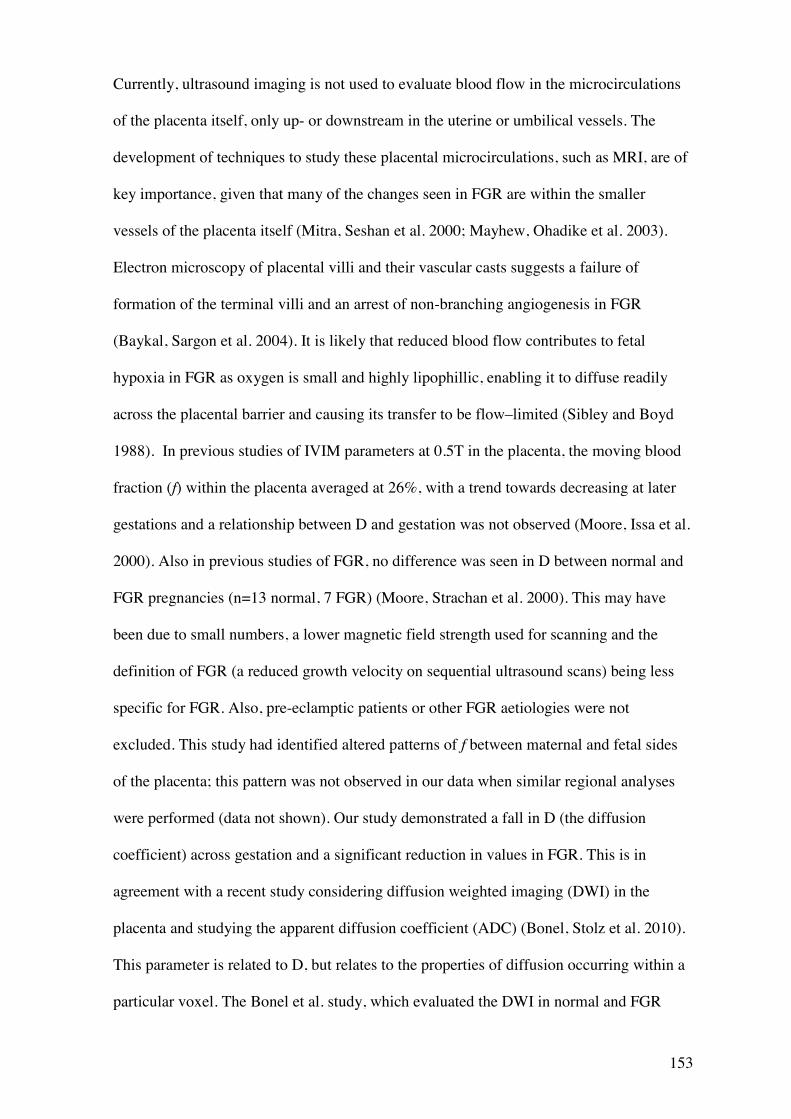
153
Currently, ultrasound imaging is not used to evaluate blood flow in the microcirculations
of the placenta itself, only up- or downstream in the uterine or umbilical vessels. The
development of techniques to study these placental microcirculations, such as MRI, are of
key importance, given that many of the changes seen in FGR are within the smaller
vessels of the placenta itself (Mitra, Seshan et al. 2000; Mayhew, Ohadike et al. 2003).
Electron microscopy of placental villi and their vascular casts suggests a failure of
formation of the terminal villi and an arrest of non-branching angiogenesis in FGR
(Baykal, Sargon et al. 2004). It is likely that reduced blood flow contributes to fetal
hypoxia in FGR as oxygen is small and highly lipophillic, enabling it to diffuse readily
across the placental barrier and causing its transfer to be flow–limited (Sibley and Boyd
1988). In previous studies of IVIM parameters at 0.5T in the placenta, the moving blood
fraction (f) within the placenta averaged at 26%, with a trend towards decreasing at later
gestations and a relationship between D and gestation was not observed (Moore, Issa et al.
2000). Also in previous studies of FGR, no difference was seen in D between normal and
FGR pregnancies (n=13 normal, 7 FGR) (Moore, Strachan et al. 2000). This may have
been due to small numbers, a lower magnetic field strength used for scanning and the
definition of FGR (a reduced growth velocity on sequential ultrasound scans) being less
specific for FGR. Also, pre-eclamptic patients or other FGR aetiologies were not
excluded. This study had identified altered patterns of f between maternal and fetal sides
of the placenta; this pattern was not observed in our data when similar regional analyses
were performed (data not shown). Our study demonstrated a fall in D (the diffusion
coefficient) across gestation and a significant reduction in values in FGR. This is in
agreement with a recent study considering diffusion weighted imaging (DWI) in the
placenta and studying the apparent diffusion coefficient (ADC) (Bonel, Stolz et al. 2010).
This parameter is related to D, but relates to the properties of diffusion occurring within a
particular voxel. The Bonel et al. study, which evaluated the DWI in normal and FGR
154
(<10th centile birthweight) pregnancies, concluded that placental dysfunction was
associated with restricted diffusion and reduced ADC. Our data support this conclusion.
Various morphological changes occur in placental tissue in association with FGR. Gross
placental lesions are detected occasionally and are associated with poorer fetal outcomes
and abnormal Doppler waveforms (Sebire and Sepulveda 2008). However, there are often
more subtle alterations, such as impoverished development of the villi (Mayhew, Ohadike
et al. 2003; Daayana, Baker et al. 2004; Pallotto and Kilbride 2006; Mayhew, Manwani et
al. 2007) and changes in placental exchange barrier surface area and thickness (Mitra,
Seshan et al. 2000; Baykal, Sargon et al. 2004; Mayhew, Wijesekara et al. 2004). The
correlations between D and villous tissue volume are perhaps consistent with
morphological studies; if more tissue is present, this may represent the placenta that is
undergoing rapid growth and expected levels of small scale movement of water molecules
would be high (giving high D values), as is the case in tumour tissues (Sakuma,
Tamagawa et al. 1989). Therefore if villous volume is reduced in FGR and there is little
growth and development of the villi (as illustrated in previous morphological studies
(Mayhew, Ohadike et al. 2003; Daayana, Baker et al. 2004)), D would also be reduced.
Another explanation would be that if the villous tissue is more restrictive to diffusion,
even in the absence of reduced villous volume (as found in this study, alongside reduced
villous surface area which might also influence diffusion), D would be reduced in FGR.
Further examination of the characteristics of diffusion parameters within the placenta is
warranted; potentially these biomarkers might provide information on the functioning on
the placental microcirculations, which have remained difficult to assess in vivo. Although
exploratory, the ROC curve for D adjusted as a percentage of the predicted normal was
promising with an area under the curve of greater than 0.8.
155
In conclusion, this study illustrates that MRI biomarkers show potential in identifying the
FGR placenta. Given the small numbers of studies in the literature, optimisation of scan
protocols and scan interpretation still requires much work, as well as analysis of what
information can be gained from MRI, in addition to that provided by ultrasound, by both
qualitative and quantitative analysis. Although our study focused on an initial exploration
of differences between normal and FGR groups as a whole, there are hints that the severity
of FGR may be detected by MRI techniques and these may be useful in stratifying disease
and rigorously defining phenotypes. Although at present ultrasound remains the optimal
tool for the evaluation of the placenta in FGR, there is accumulating evidence to support
the role of MR in assessment of this disease. Abnormalities in fetal brain development in
growth restriction have also been demonstrated using MR techniques such as diffusion
tensor analysis and proton Magnetic Resonance Spectroscopy (Charles-Edwards, Jan et al.
2010). We suggest that as units continue to increase their volume of MR imaging for a
variety of fetal conditions, placental assessment should be included, as it may provide
additional information on disease severity. Animal studies have recently studied the use of
treatments including melatonin and growth hormone in animal models of FGR (de Boo,
Eremia et al. 2008; Richter, Hansell et al. 2009), with evidence of potential improvement
in outcome following treatment. As the origins of FGR lie in placental dysfunction, MRI
could potentially also provide a means of analysis of interventions designed to improve
placental function.

156

157
Chapter 4
Arterial Spin Labelling in the Assessment of Placental Perfusion at 1.5 T
158
This chapter is the article planned for submission for publication in the journal
‘Placenta’ and adapted for thesis format:
Wright, C., Morris, D.M., Baker P.N., Crocker, I.P., G.J. Parker, Sibley, C.P.
Arterial Spin Labelling in the Assessment of Placental Perfusion at 1.5 T.
Acknowledgements
This paper was written by Dr Caroline Wright, author of this PhD thesis. Recruitment of
women, supervising scanning of participants and ensuring patient safety, comfort and
correct positioning during scanning, placenta collection, tissue processing and stereology,
all data analysis and write up was carried out by Dr Caroline Wright. David Morris was
responsible for the methodological work up of the MRI methods and assisted with
carrying out the scans and fine tuning scan protocols. Other authors were involved with
general development and direction of the project, supervision and review of write up.
.
Co-authors
Dr. David M Morris, PhD
Imaging Science & Biomedical Engineering, University of Manchester Biomedical
Imaging Institute, University of Manchester, Manchester, M13 9PT, UK and Manchester
Academic Health Sciences Centre, University of Manchester, Manchester, M13 9PL, UK.

159
Prof. Philip N Baker, FRCOG, FRCSC, FMedSci
Faculty of Medicine & Dentistry, University of Alberta, Edmonton, T6G 2RZ, Canada and
Maternal and Fetal Health Research Centre, School of Biomedicine, University of
Manchester, Manchester Academic Health Sciences Centre, St Mary’s Hospital,
Manchester, M13 9WL,UK.
Dr. Ian P Crocker, PhD
Maternal and Fetal Health Research Centre, School of Biomedicine, University of
Manchester, Manchester Academic Health Sciences Centre, St Mary’s Hospital,
Manchester, M13 9WL,UK.
Prof. Geoff JM Parker, PhD
Imaging Science & Biomedical Engineering, University of Manchester Biomedical
Imaging Institute, University of Manchester, Manchester, M13 9PT, UK and Manchester
Academic Health Sciences Centre, University of Manchester, Manchester, M13 9PL, UK.
Prof. Colin P Sibley, BSc, PhD
Maternal and Fetal Health Research Centre, School of Biomedicine, University of
Manchester, Manchester Academic Health Sciences Centre, St Mary’s Hospital,
Manchester, M13 9WL,UK.
160
4.1 Abstract
Blood flow to the placenta can be assessed by Doppler ultrasound in the uterine and
umbilical arteries. However, there is currently no technique available to measure perfusion
within the placenta itself. Here we present in vivo measurements of perfusion in the human
placenta using a Magnetic Resonance Imaging (MRI) perfusion imaging technique; Flow
Sensitive Alternating Inversion Recovery (FAIR) Arterial Spin Labelling (ASL). ASL is a
technique which uses endogenous water excited by the MR pulse as a tracer and offers a
means of measuring placental perfusion without the use of contrast agents. We carried out
ASL placental perfusion measurements in 9 women during the third trimester using a
FAIR-HASTE ASL technique at 1.5 T and correlated these findings with measures of
placental morphology assessed stereologically at term. Mean perfusion ± S.D. was 111±
28 ml/min/100g. A significant negative correlation was seen between perfusion and
gestation (p=0.026) with perfusion falling by 6.3ml/min/100g per week. No significant
correlations with placental morphology were observed. A trend for reduced perfusion in
small for gestational age pregnancies was observed (n=4); a reduction of 10ml/min/100g
was seen compared to average sized infants when gestational differences were corrected
for. Good inter- and intra-observer variability was demonstrated. We conclude that this
FAIR ASL technique is suitable for measurement of perfusion in the placenta at 1.5 T and
offers potential as a technique for use in complicated pregnancies.
161
4.2 Introduction
Fetal growth restriction (FGR) is a serious complication of pregnancy in which the fetus
fails to reach its own genetically determined growth potential. Placental insufficiency is a
major cause of FGR and accumulating evidence indicates that several aspects of placental
structure and function are specifically altered in this condition, including blood flow in the
uteroplacental and fetoplacental circulations, as evidenced by over 200 studies into the use
of Doppler ultrasound in this condition. In clinical obstetrics, measurement of blood
velocity by Doppler ultrasound in the uterine and umbilical vessels is the main imaging
technique used to assess blood flow in predicting or diagnosing FGR, but does not directly
measure blood flow in the placental microcirculations; the maternal intervillous space and
fetal placental vessels and capillaries.
It is well established that the spiral arteries of the uteroplacental circulations are
transformed during early pregnancy, by invasion of extravillous trophoblast, into wide
bore, low resistance vessels (Brosens, Robertson et al. 1967; De Wolf, De Wolf-Peeters et
al. 1980). Failure of this invasion and consequent vessel transformation is associated with
FGR, and probably underlies the abnormal uterine artery Doppler measurements seen in
this condition (Brosens, Pijnenborg et al.). The pathology underlying the abnormal
umbilical artery high resistance waveforms seen in FGR is complex and debate exists
regarding the relative importance of cord, stem artery and terminal villous pathology
(Krebs, Macara et al. 1996) and indeed of humoral regulation of vessel resistance (Mills,
Wareing et al. 2005). However, electron microscopy of placental villi and their vascular
casts suggests a failure of formation of the terminal villi and an arrest of non-branching
angiogenesis in FGR, supporting the importance of the placental microcirculations in this
condition (Lee and Yeh 1986; Krebs, Macara et al. 1996; Baykal, Sargon et al. 2004).
162
Better understanding of blood flow in the microcirculations of the placenta, maternal
intervillous space and fetal villous vessels, either side of the exchange barrier, is important
as this will ultimately determine transfer rates of both oxygen, in the maternofetal
direction, and of carbon dioxide in the fetomaternal direction (Sibley and Boyd 1988).
Abnormalities in flow and therefore transfer of these highly diffusible gases will directly
contribute to FGR. Therefore, the development of tools to identify abnormal blood flow in
these microcirculations may allow more rigorous definition of the condition, improve our
ability to stratify disease and potentially provide specific predictive tests.
An increasing body of work suggests that Magnetic Resonance Imaging (MRI) may be a
very useful way of assessing placental structure and function in vivo (Damodaram, Story
et al. 2010; Wright, Morris et al. 2011). The purpose of the study reported here was to
determine the usefulness of one MRI technique, Arterial Spin Labelling (ASL), to
measure placental perfusion in normal pregnancy. ASL perfusion imaging has gained
wide acceptance for its value in clinical applications during recent years (Chen, Chiu et
al.). Its capability for non-invasive (without the use of radio-isotopes) and absolute
perfusion quantification makes it attractive for many clinical applications, including
placental analysis. Magnetically labelled endogenous blood water can be used as a tracer
for perfusion MRI. Clasically, an inversion pulse is used to tag inflowing spins at a level
proximal to the imaging slab, and, following a transit delay to allow these tagged spins to
enter the imaging plane and exchange with tissue, control and label images are obtained.
The pair-wise subtraction of many of these 2 images yields maps of brain tissue perfusion,
expressed in units of ml/100 g/min. ASL essentially measures the a signal difference
within the tissue of interest caused by the inflow of equilibrium magnetization from MR
‘labelled’ areas outside the tissue of interest and is therefore directly related to blood flow
into the tissue (Detre, Leigh et al. 1992; Williams, Detre et al. 1992). This may be
achieved in the placenta using a technique called FAIR ASL (Flow-sensitive Alternating
163
Inversion Recovery) Two previous studies, using MRI Echo-Planar Imaging (EPI) at 0.5 T
(Tesla), explored FAIR ASL in the placenta in small numbers of women (Duncan,
Gowland et al. 1998; Gowland, Francis et al. 1998). Both studies included pregnancies at
a wide range of gestations between 20 and 40 weeks and huge variability in the data was
observed (perfusion varying between around 50 and 350 ml/100g/min), which bore no
relation to gestation. EPI was one of the first MRI sequences used in applications
like diffusion, perfusion, and functional MRI, but is extremely sensitive to image artefacts
and distortions, which may have in part been responsible for the high variability seen in
these earlier studies. In the current study, the perfusion measurements were performed
using a FAIR ASL with the adaptation that the half-fourier single-shot turbo spin echo
(HASTE) used in image acquisition was used following inversion (EPI not used) (Kim
1995; Kwong, Chesler et al. 1995). In this particular scheme, an inversion recovery
sequence is performed twice: one with and one without slice selective gradient to label the
arterial spins. The perfusion-weighted signal then comes from the difference in signal
intensity due to the absence of inverted arterial spins in the slice-selective inversion
recovery sequence. For placental imaging, all regions outside the placenta are selected and
labelled so inflow of blood (from any direction) from these labelled regions into the non-
labelled placental slice is detectable by the altered signal. Directionally dependant ASL
techniques (which would enable flow from the maternal and fetal circulations into the
placenta to be determined separately) were explored in preliminary work but found to be
ineffective in the placenta (see Discussion). Incorporated into this study, the FAIR ASL
sequence has been optimized for future measurements to give maximum signal to noise
ratio in the fitted value of the perfusion rate. The higher Tesla used in this study (1.5 T as
opposed to 0.5 T in previous studies), gives intrinsically higher Signal to Noise Ratio
(SNR) and also lengthens blood T1 which should enhance the ASL technique and allow
more robust measurements of perfusion than seen in earlier studies(Wang, Alsop et al.

164
2002). Furthermore, the use of background noise suppression by the application of
multiple inversion pulses (Dixon, Sardashti et al. 1991; Garcia, Duhamel et al. 2005) has
become more attractive to improve ASL robustness and SNR; here 22 averages were used
as opposed to 2 in previous studies. We hypothesized that these techniques would enable
enhanced measurement of placental blood flow at 1.5 T in normal pregnancy and that
measured perfusion would correlate with differences in placental vasculature assessed
stereologically following delivery.
165
4.3 Methods
4.3.1. Subjects
Ethical approval was obtained from the local NHS Research Ethics Committee and all
women gave written informed consent. Women with normal pregnancies in the third
trimester (between 28 and 42 weeks gestation) were recruited from antenatal attendances
at St Mary’s Hospital, Manchester. Perfusion measurements were performed on 9 women
with normal healthy pregnancies, i.e. women with no significant past medical history, who
had no known complications of pregnancy and who subsequently delivered an infant at
term (37-42 weeks) with no adverse immediate adverse outcomes. Birth weight centiles
were calculated using the Growth Centile Calculator for the UK v 5.16 (Gardosi J and
Gestation Network; Gardosi, Chang et al. 1992).
4.3.2 MRI
FAIR ASL was used (Kim 1995; Kwong, Chesler et al. 1995). Using this technique two
inversion recovery (IR) images are acquired by interleaving slice-selective inversion and
non-selective inversion. During the inversion delay time after slice-selective inversion,
fully magnetized blood spins move into the imaging slice and exchanges with tissue water.
The signal enhancement (FAIR image) measured by the signal difference between two
images is directly related to blood flow. The position of an imaging slice can be seen in
Chapter 4 Figure 1a, overlaid on a structural image; typically this was a mid-depth single
placental slice, running through the long axis of the placenta, giving disc shaped placental
images. The sequence used is based on current methodology (Gardener and Francis 2010)
with the adaptation that the half-fourier single-shot turbo spin echo (HASTE) acquisition
was used following inversion. The scanning was carried out using a 1.5 T Philips Intera
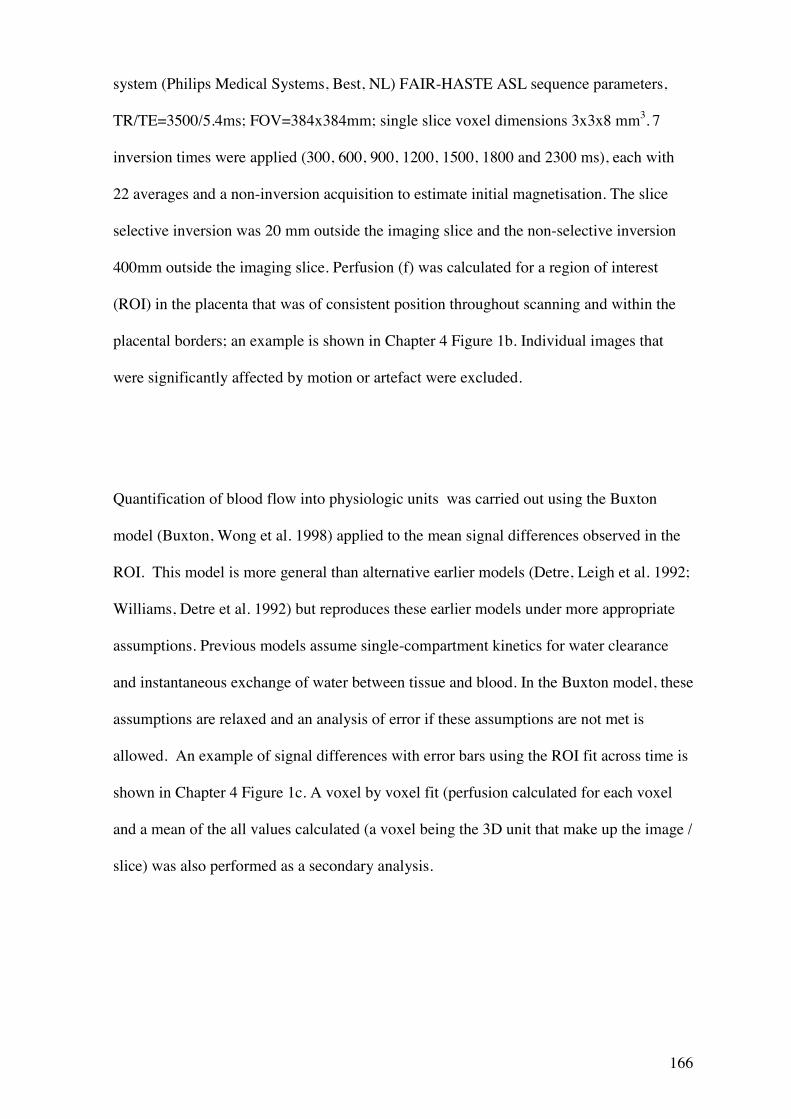
166
system (Philips Medical Systems, Best, NL) FAIR-HASTE ASL sequence parameters,
TR/TE=3500/5.4ms; FOV=384x384mm; single slice voxel dimensions 3x3x8 mm3. 7
inversion times were applied (300, 600, 900, 1200, 1500, 1800 and 2300 ms), each with
22 averages and a non-inversion acquisition to estimate initial magnetisation. The slice
selective inversion was 20 mm outside the imaging slice and the non-selective inversion
400mm outside the imaging slice. Perfusion (f) was calculated for a region of interest
(ROI) in the placenta that was of consistent position throughout scanning and within the
placental borders; an example is shown in Chapter 4 Figure 1b. Individual images that
were significantly affected by motion or artefact were excluded.
Quantification of blood flow into physiologic units was carried out using the Buxton
model (Buxton, Wong et al. 1998) applied to the mean signal differences observed in the
ROI. This model is more general than alternative earlier models (Detre, Leigh et al. 1992;
Williams, Detre et al. 1992) but reproduces these earlier models under more appropriate
assumptions. Previous models assume single-compartment kinetics for water clearance
and instantaneous exchange of water between tissue and blood. In the Buxton model, these
assumptions are relaxed and an analysis of error if these assumptions are not met is
allowed. An example of signal differences with error bars using the ROI fit across time is
shown in Chapter 4 Figure 1c. A voxel by voxel fit (perfusion calculated for each voxel
and a mean of the all values calculated (a voxel being the 3D unit that make up the image /
slice) was also performed as a secondary analysis.
167
Chapter 4 Figure 1a) Imaging slice position on sagital localizing scan, 1b) Sample
ROI on placental image, 1c) Graph showing measured signal difference within the
ROI across time (ms) (ROI fit); error
1a 1c 1b
168
4.3.3 Placental analysis
All stereological analyses were made in placentas collected from women undergoing MRI
using methods previously reported by Wright et al. (Wright, Morris et al. 2011), adapted
from those reported by Mayhew (Mayhew, Ohadike et al. 2003; Mayhew, Manwani et al.
2007). Placental tissue samples were collected in 5 subjects delivered at term. Placentas
were collected postnatally within 30 minutes of delivery time. A random sampling method
was devised (Wright, Morris et al 2011) that would allow more in-depth analysis of
placental heterogeneity, matching regions of the placenta examined with MR with
morphology, so that a mid-depth MRI placental slice was matched with a mid depth
analysis of placental morphology. This alters the reference volume for stereological
calculations and therefore absolute values concerning the whole placenta are not reported
here. A transparent grid with pre-numbered sampling windows at the intersections was
placed with random orientation over the placenta and a random-number generated
sequence used to select samples. The tissue was fixed in 10% buffered formalin. Only
middle sections are considered in this analysis, to correspond with the mid-depth level of
the MRI scan plane. These samples were diced and embedded with random orientation in
paraffin wax blocks and processed for histology. Before imaging, cut sections (5
micrometres) were mounted on microscope slides, stained with haematoxylin and eosin
(H&E), and observed under a Leitz (Dialux 22) microscope at a magnification of x250.
Approximately 8 sections were investigated per placenta. For image analysis, a Q-Imaging
(Fast 1394) digital camera acquired images from each sample. For each section, 5 fields
were selected for imaging in a systematic fashion, moving around the section in system of
partial turns of stage adjuster. In total, approximately 40 high-power fields of view were
analysed per placenta.
169
Images were acquired using Image-Pro Plus software (Version 6.3). Test point counting
was employed to obtain volume densities. Intersection counting using a superimposed grid
lattice was used to calculate surface area densities. Indices calculated included villous
volume density, fetal capillary volume density, fibrin (intervillous fibrin deposition)
volume density, villous surface area density, capillary surface area density. From this
interfiles space (IVS) volume density (1 – villous volume density) and total blood volume
density (IVS + capillary volume density) were calculated.
4.4 Results
The perfusion values are shown in Chapter 4 Table 1 for each of the 9 subjects. The mean
gestational age at time of scan was 33.4 weeks (range 29.3 – 36.9 weeks). Mean gestation
at delivery (and time of placental analysis) was 40.2 weeks. In this study group the mean
perfusion rates were found to be 111 - 127 ml/min/100g depending on the method of
analysis used and the observer. Columns A to C refer to the ROI analysis method; the
observer selects a placental region of interest (see Methods) and the mean signal from that
region is used to calculate perfusion. Column A refers to the initial analysis using this
technique, Column B to a second analysis performed by the same observer i.e. redrawing
the placental region on the same images, whereas in Column C, the regions of interest
were drawn by a second observer, thereby allowing analysis of inter-observer error using
this technique. Column D refers to an alternative method to calculate perfusion in which
the signal from each voxel in the MR image is used to calculate a perfusion value and the
mean of all voxel values taken as the final perfusion value.
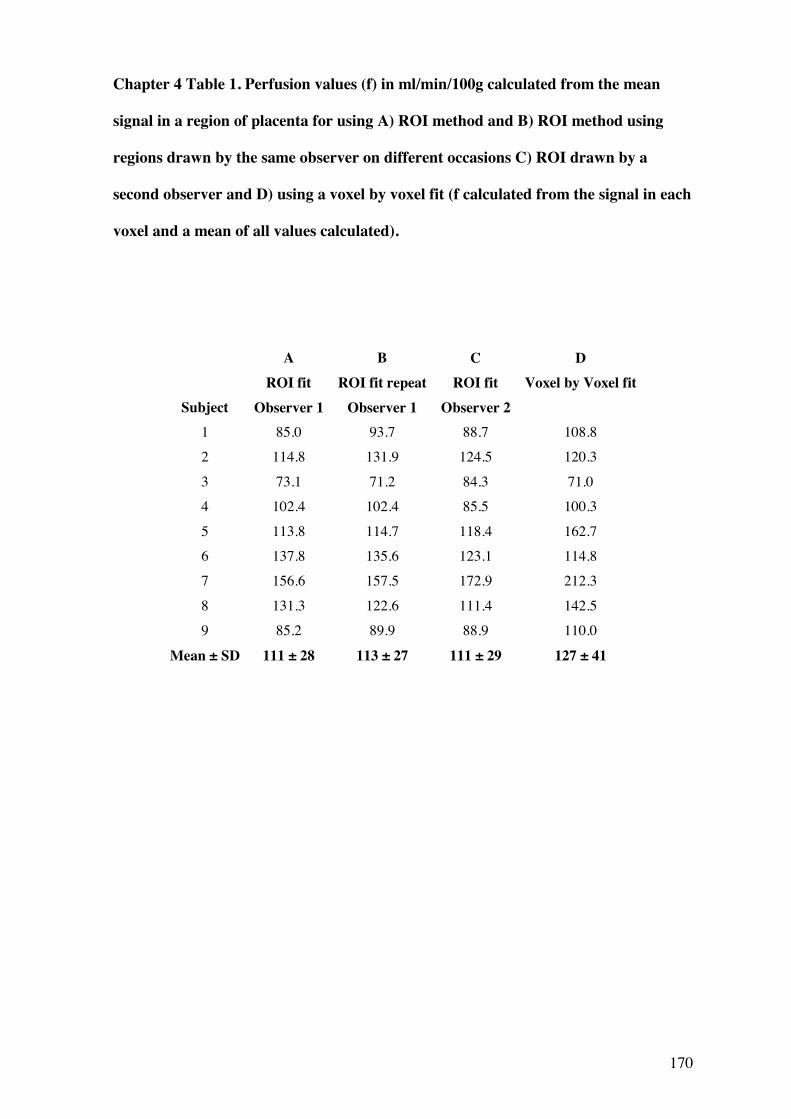
170
Chapter 4 Table 1. Perfusion values (f) in ml/min/100g calculated from the mean
signal in a region of placenta for using A) ROI method and B) ROI method using
regions drawn by the same observer on different occasions C) ROI drawn by a
second observer and D) using a voxel by voxel fit (f calculated from the signal in each
voxel and a mean of all values calculated).
A B
C
D
Subject ROI fit
Observer 1 ROI fit repeat
Observer 1 ROI fit
Observer 2 Voxel by Voxel fit
1 85.0 93.7 88.7 108.8 2 114.8 131.9 124.5 120.3
3 73.1 71.2 84.3 71.0 4 102.4 102.4 85.5 100.3
5 113.8 114.7 118.4 162.7 6 137.8 135.6 123.1 114.8 7 156.6 157.5 172.9 212.3
8 131.3 122.6 111.4 142.5 9 85.2 89.9 88.9 110.0
Mean ± SD 111 ± 28 113 ± 27 111 ± 29 127 ± 41

171
Chapter 4 Figure 2 shows the variation in placental perfusion rate as pregnancy advances;
there was a significant negative correlation with gestational age when using the ROI
technique (Pearson’s r=-0.73, p=0.03, r=-0.69, p=0.04) respectively). Linear regression
modelling showed that f decreased by 6.3ml/min/100g each week so that at 28 weeks the
expected perfusion would be 145ml/min/100g and at term (40 weeks) this would have
fallen to 70ml/min/100g. There was no significant correlation with gestation when the
voxel to voxel fit analysis (Column D in Table 1) was used (Chapter 4 Figure 2).
4.4.1 Variability
The intra-observer and inter-observer correlation coefficients for the ROI fit were r=0.96,
p=<0.001 and r=0.87, p=0.0012 respectively, based on 2 readings for each subject taken
by a single observer (Columns A and B of Table 1) and a second independent observer
(Columns A and C of Table 1). The correlation coefficient between ROI fit values and
voxel by voxel fit values (Column A and D of Table 1) was 0.80, p=0.005; there was no
significant difference between any group (Compared group to group by Paired t-test).
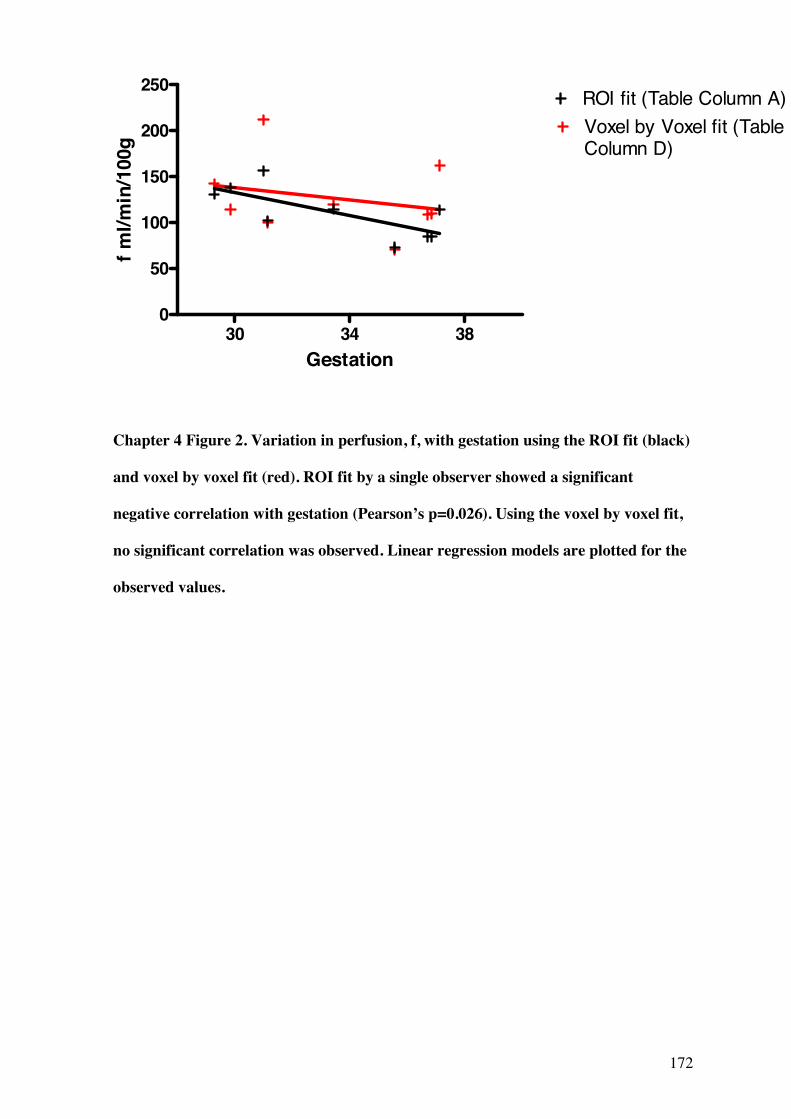
172
30 34 380
50
100
150
200
250
Voxel by Voxel fit (TableColumn D)
ROI fit (Table Column A)
Gestation
f ml/m
in/1
00g
Chapter 4 Figure 2. Variation in perfusion, f, with gestation using the ROI fit (black)
and voxel by voxel fit (red). ROI fit by a single observer showed a significant
negative correlation with gestation (Pearson’s p=0.026). Using the voxel by voxel fit,
no significant correlation was observed. Linear regression models are plotted for the
observed values.
173
4.4.2 Comparison of data from pregnancies with Appropriate for Gestational Age
and Small for Gestational Age babies
Although women at recruitment were not known to have any antenatal problems, 4 of the
9 women subsequently delivered infants that were less than the 10th customized
birthweight centile, often used as a surrogate definition of small for gestational age
(SGA); 2 of these were below the 5th centile, often used as a surrogate definition of fetal
growth restriction (FGR) and 5 had normal birthweight centiles between the 10th and 90th
centiles, often referred to appropriate for gestational age (AGA) (Gardosi J and Gestation
Network). Direct comparison of f between AGA (10th centile and above) and SGA (less
than the 10th centile) groups showed no significant difference between groups (unpaired t-
test), although there was a trend for lower values in the SGA group; mean ± S.D. 115 ± 29
ml/min/100g versus 103 ± 30 ml/min/100g, AGA versus SGA respectively. When
gestation is considered as a covariate, there was again no significant difference between
groups (ANCOVA F=0.478, p=0.515, partial 2=0.074). However, the corrected means ±
S.E for f were 116 ± 9 ml/min/100g and 106 ± 11 ml/min/100g for the normal and SGA
groups respectively. There was no significant interaction between group and gestation for
this analysis. There was no significant correlation between f or f predicted for the day of
delivery (using the linear regression model in Chapter 4 Figure 2) and the individualised
birthweight centiles.
4.4.3 Correlations with placental stereology
5 placentas were analysed stereologically. The remaining placentas were not collected due
to difficulties with placental collection at time of delivery e.g. the researcher was not
informed of delivery or was not available to perform placental analysis. There were no

174
correlations between f and placental villous volume, capillary volume, fibrin volume,
intervillous (blood filled) space volume or total blood volume (capillary volume +
intervillous space volume). There was also no correlation with villous surface area or
capillary surface area in this sample. As there was some lag between time of MRI and
time of placental analysis (which occurred following delivery), the linear regression model
for the ROI method (shown in Chapter 4 Figure 2) was used to estimate f for the day of
delivery as a means of minimizing the effect of the change in gestation. There remained
no significant correlations with stereological variables and f predicted for the date of
delivery, when this step was taken.
175
4.5 Discussion
This study has shown it is possible to apply FAIR ASL to the measurement of perfusion
rates in the placenta at 1.5 T. The observed perfusion value of 111ml/100g/min are in
keeping with estimates of placental blood flow; at term the maternal blood supply to the
placenta is estimated to be 600 ml/min (Browne and Veall 1953) and taking the mass of
the placenta to be 550g (Boyd 1970), this would give an approximate expected classical
placental perfusion rate of about 110 m1/100 g/min. Our data also show reasonable
agreement with the previous studies at 0.5 T. Duncan et al. measured perfusion in 20
normal pregnancies (Duncan, Gowland et al. 1998), reporting mean placental perfusion (f)
to be 209ml/100g/min (S.D. not given) between 20 and 40 weeks (the mean gestational
age at time of scan is not given but from plotted graphical data it was around 31 weeks).
The same group using the same technique also report on f in 15 normal pregnancies
(Gowland, Francis et al. 1998), finding mean perfusion (f) ± S.D. to be 176 ± 24
ml/min/100g (at a mean gestational age of 31 weeks), slightly higher than our observed
value; mean perfusion (f) ± S.D. 111 ± 28 (at a mean gestation of 33.4 weeks). This may
in part be due to the range of gestations studied; we observed a significant negative
correlation between f and gestation which supports that perfusion falls towards term;
although this linear relationship was not demonstrated in previous studies, it would
explain the lower mean value of f as in this study all women were scanned in the third
trimester. The difference in observed values, may have also have been secondary to noise
in the sample which was minimised in this study with the removal of scans affected by
movement, increased field strengths and high number of averages acquired at each time
point (22 compared to 2 in the previous studies). There is also much less variability in the
data at 1.5 T; using the ROI technique the range of values is over 100ml/min/100g as
opposed to 300ml/min/100g range at 0.5 T (Gowland, Francis et al. 1998).
176
The fall in f towards late gestation is supported by evidence from ultrasound Doppler
studies, which demonstrated that in the umbilical vein (which carries blood from the
placenta to the fetus), blood flow decreased linearly from 139 ml/min/100g to
65ml/min/100g between 27 and 40 weeks (Lingman and Marsal 1986). This shows
remarkable similarity with our data, which demonstrated a fall in perfusion equating to
152ml/min/100g to 70ml/min/100g over the same time period. The higher values we
observed are likely to reflect that using FAIR ASL is a measure of both maternal and fetal
blood flow in combination, as opposed to that of the umbilical vein which is downstream
in the maternal to fetal circulation. Furthermore, in a normal capillary network, where the
blood flow is unidirectional, ASL will measure classical perfusion. However, in the
placenta, where blood is flowing in vasculature latticed in a variety of directions (Boyd
and Hamilton 1967), ASL might overestimate perfusion, and might be more reasonably
said to be measuring blood movement. Nonetheless, blood movement may be the relevant
measure in the placenta, as it is this movement that ensures that the maternal blood
circulates adequately, so values of f may be functionally more useful in this regard.
It is reassuring that our data show good intra- and inter- variability between observations
and, furthermore, that the voxel-by-voxel technique demonstrated similar results to the
ROI mean signal method. The similarity of these two methods supports the view that the
majority of voxels are not severely affected by noise, although the slightly higher values
are likely to reflect the presence of some noise (the FAIR ASL technique is sensitive to in-
plane motion), hence the ROI method was chosen in preference for analysis.
This study was designed to test the feasibility of ASL measurements on the placenta and
was not powered to consider differences between AGA and SGA or FGR groups.
However, as the birthweight centiles in the sample by chance included a number of SGA
and FGR infants, this relationship between perfusion and birthweight was considered. It is
177
therefore of interest that a trend for reduced perfusion in the SGA group was observed and
this certainly requires further investigation using the developed ASL techniques. Previous
studies have shown similar trends; Francis et al. showed a reduction in the proportion of
the placenta image with f < 100ml/min/100g using FAIR ASL (with EPI) in 9 SGA versus
6 normal pregnancies (Francis, Duncan et al. 1998). The results were confounded by a
difference in mean gestational age at time of scan between groups; 36.5 weeks in the
normal group and 33.9 in the SGA group. However, our finding, that f decreases as
pregnancy advances, would suggest that the difference between SGA and normal
pregnancies studied by Francis et al. might be underestimated. Duncan et al. (Duncan,
Gowland et al. 1998) who also found a trend for reduced overall mean placental f in SGA
pregnancies. Clearly the scene is now set for a larger study of the utility of placental ASL
measurements in complicated pregnancies.
Our study did not demonstrate any correlations between placental stereological variables
and perfusion. This analysis was limited by both the small sample size and delay between
scan and delivery, although attempts to correct for the latter were made using the linear
regression model. This relationship would be worth continuing in a larger study, including
stereological analysis in a true FGR group who have undergone ASL.
Another limitation of the study reported here is that the FAIR ASL technique is unable to
differentiate between the maternal and fetal circulations. However, given the similarity
between perfusion estimates based on expected maternal blood flow to the placenta given
above and placental f reported in this study, it would appear that by far the largest
contributor to the placental perfusion is the maternal influx. Directionally dependent ASL
techniques were explored as part of our preliminary work, but were disappointing.
Attempts were made at magnetically labelling blood flowing into the placenta from the
maternal aorta, but the time for the primed blood to reach the placenta appeared to be too
178
long and very little signal change was detectable in the placenta. Similarly, attempts were
made at priming blood in the region of the uterine arteries; again little signal change was
observed, which was thought to be due to being unable to prime a sufficient volume of
blood to give a detectable change in T1.
There is a growing body of evidence that supports the view that investigation of a range of
potential pathologic features of the placenta may be important in understanding FGR;
ranging from gross changes in placental size and structure (Toal, Keating et al. 2008,
(Damodaram, Story et al. 2010), changes in morphology at the microscopic level
(Mayhew, Ohadike et al. 2003; Daayana, Baker et al. 2004), and attenuations in placental
nutrient transport (Sibley, Turner et al. 2005). This constellation of abnormalities provides
a placental phenotype for FGR (Sibley, Turner et al. 2005). Previous research in this field
by our group has demonstrated a range of alterations in placental structure and function
detectable by advanced MRI techniques across gestation (Wright, Morris et al. 2011). In
FGR, we have demonstrated an increased placental depth: volume ratio, shorter placental
relaxation times and a reduction in D, the diffusion coefficient (Wright et al, unpublished
data). These findings support that a more global assessment of placental characteristics
using MRI may be worthwhile and potentially allow more rigorous definition of FGR, its
clinical scarification and possibly its early prediction.
In summary this paper presents in vivo measurements of perfusion in the human placenta
using ASL. Our work details an optimised sequence for ASL placental perfusion
scanning. The data suggest that the implementation of the FAIR-HASTE ASL technique
can be used successfully in the placenta and may, in the future, be applied to the
investigation of microcirculatory flows in normal and FGR pregnancy.

179
Chapter 5
Overall Conclusions and Future Work
180
The studies reported in this thesis demonstrate that quantitative MRI techniques are
feasible in the placenta at 1.5 T and provide important new information on the structure
and function of the placenta in vivo. We focused on the relationships between potential
MRI biomarkers and gestation and the differences observed between normal and FGR
pregnancies. We have identified a placental phenotype in FGR pregnancy that is
characterised by (i) a reduction in placental volume and increased depth, (ii) altered
structural composition (as evidenced by alterations in MR relaxation times), (iii) altered
diffusion characteristics and (iv) preliminary ASL data suggest that perfusion measured by
this technique is reduced. Furthermore, there are hints in the data that those with more
severe FGR also have a more marked deviation from the normal AGA phenotype.
Data from our study is consistent with previous publications showing an increase in
placental volume with advancing gestation (Duncan 2001; Damodaram, Story et al. 2010).
MRI is the only tool available to accurately study placental volume in vivo as, beyond the
first trimester, 3D ultrasound is limited by the size of the field of view (Metzenbauer,
Hafner et al. 2001). We also observed a reduction in placental volume in FGR, consistent
with several histopathological studies (Boyd and Scott 1985; Biswas and Ghosh 2008).
The change in volume with gestation is likely to be a reflection of fetal growth, whereas in
growth restricted pregnancies, the aetiology is less clear and may be secondary to
increased placental apoptosis rather than a reflection of smaller fetal size per se
(Kaufmann, Black et al. 2003). In addition to a reduced size, FGR placentas also had an
increased depth, giving a thickened, globular placental appearance. This appearance has
been previously demonstrated in association with FGR using ultrasound (Fisteag-Kiprono,
Neiger et al. 2006; Toal, Keating et al. 2008) and MRI (Damodaram, Story et al. 2010)
and it appears that these simple gross morphological assessments may be more relevant in
the assessment of FGR than previously realised. Particularly when combined with
accurate volumetry as a depth: volume ratio, they may also be indicative of poor fetal
181
outcomes (Damodaram, Story et al. 2010). Although the ROC curves generated for this
simple parameter in our studies were merely exploratory, as a test for FGR, a depth:
volume ratio >96% of the predicted value, would offer 67% sensitivity and 93%
specificity for the condition; a biomarker that perhaps might be useful, in combination
with other factors. Other macroscopic morphology (e.g. infarction) detected by MRI have
also been previously demonstrated to correlate with histological findings and pregnancies
at risk for adverse outcome and fetal death, independently of umbilical artery Doppler
status (Linduska, Dekan et al. 2009). Our data support a growing body of evidence for the
use of structural MRI in evaluating the placenta in FGR pregnancies, not currently routine
practice, as it may provide additional evidence on disease severity and outcome.
The studies reported in Chapter 2 demonstrated a correlation and linear relationship
between placental T1 and, more convincingly, T2 measurements at 1.5 T and gestational
age, consistent with previous work at 0.5 T (Gowland, Freeman et al. 1998). At 1.5 T T1
and T2 relaxation times were shown to decrease by 20.2 ms and 2.4 ms per week of
advancing gestational age respectively, giving a total fall of in T1 of 400 ms and in T2 of
50 ms between 20 and 40 weeks. The relationship supports the proposition that changes in
placental tissue structure or composition that occur with advancing gestation significantly
influence relaxation times. The exact nature of this change, however, remains a matter for
conjecture. In this study, relaxation time values did not correlate with villous volume
densities or total blood volume densities, indicating that other changes in morphology or
function, rather than just increases in solid or blood volumes, lead to the fall in T1 and T2
towards term. The total volume of the maternal vascular bed increases with gestational age
(Mayhew, Jackson et al. 1993), but if this was the major influence on relaxation times then
a rise rather than fall would be seen, as the T1 and T2 of oxygenated maternal blood in vivo
is around the upper end of the placental values (Barth and Moser 1997). That other
changes in placental morphology may influence relaxation times, rather than the balance
182
of vascular and non-vascular volumes, is supported by MRI magnetisation transfer (an in-
vivo measure of bound protons to total protons) in the placenta which demonstrated no
changes in these values across gestation (Ong, Tyler et al. 2004) and other studies of
placental morphology demonstrating that ratios of total volumes of blood and non-blood
placental compartments also remain fairly static (Boyd 1984). Our data showed a
correlation between T2 and placental fibrin deposition, suggesting that fibrin content might
be one of the contributors to the fall in T2 over gestation, although it is unlikely to be the
sole determinant. Fibrin may, however, be a surrogate marker for a wider change in tissue
quality that is influencing T1 and T2. No other individual stereological variable analysed
correlated with relaxation times, although several trends were seen, supporting a
hypothesis that a combination of factors or more generalised change in tissue quality is
key in determining relaxation times, fitting with data from initial studies correlating tissue
types and relaxation times (Cameron, Ord et al. 1984). Other potential influences include
reduced blood oxygenation (for example, deoxygenated blood generally has lower T1
values (Silvennoinen, Kettunen et al. 2003)) and variations in the fluid content of stromal
channels in the villi (Castellucci and Kaufmann 1982).
In previous MRI studies at lower field strengths (0.5 T), a trend for shorter relaxation time
measurements, T1 and T2, was observed in pregnancies complicated by pre-eclampsia and
FGR (Gowland, Freeman et al. 1998) although the numbers were small. In the study here,
significantly shorter T2 relaxation times were seen in FGR and furthermore this may also
be influenced by the severity of FGR, as demonstrated by separating the FGR group by
birthweight (Chapter 2). In larger analyses, it would be interesting to further assess this
relationship by examining FGR groups stratified in terms of severity e.g. by Doppler
measurements of blood flow in the fetal or umbilical vessels. Our data support the view
that it is T2 rather than T1 that is reflecting the morphological changes occurring in the
183
placenta with both advancing gestation and disease processes, as it is in this parameter that
the differences across gestation and in FGR are most clearly observed.
Currently, ultrasound imaging is not used to evaluate blood flow in the microcirculations
of the placenta itself, only to or from the placenta in the uterine or umbilical vessels. The
development of techniques to study these placental microcirculations, such as MRI, are of
key importance, given that many of the changes seen in FGR are within the smaller
vessels of the placenta (Mitra, Seshan et al. 2000; Mayhew, Ohadike et al. 2003; Mills,
Wareing et al. 2005). Electron microscopy of placental villi and their vascular casts
suggests a failure of formation of the terminal villi and an arrest of non-branching
angiogenesis in FGR, damaging the development of these microcirculations (Baykal,
Sargon et al. 2004). It is likely that reduced blood flow within these microcirculations
contributes to fetal hypoxia in FGR as oxygen is small and highly lipophillic, enabling it
to diffuse readily across the placental barrier and causing its transfer to be flow–limited
(Sibley and Boyd 1988). We studied blood flow by two techniques; IVIM and ASL.
In previous studies of IVIM parameters at 0.5T in the placenta, the moving blood fraction
(f) within the placenta averaged 26%. There was a trend for f to fall in later gestations, but
a relationship between the diffusion coefficient (D) and gestation was not observed
(Moore, Issa et al. 2000). We observed a fall in D across gestation and more importantly, a
significant reduction in D in FGR pregnancies. In previous studies of FGR, no difference
was seen in D between normal and FGR pregnancies (n=13 normal, 7 FGR) (Moore,
Strachan et al. 2000), however, a reduction in D in FGR was seen in our data at 1.5 T,
which may be due to methodological changes or more specific inclusion criteria for FGR.
This would be in agreement with evidence from diffusion weighted imaging (DWI)
(Bonel, Stolz et al. 2010). We also observed a correlation between D and villous volume,
consistent with the morphological changes that occur in FGR. If less villous tissue is
184
present as seen in FGR (Mayhew, Ohadike et al. 2003; Daayana, Baker et al. 2004), less
Brownian motion or small scale movement of water molecules would be expected and D
would also be reduced. Another explanation would be that if the villous tissue is more
restrictive to diffusion, by changes in the exchange barrier, tissue macromolecules or
hydration fraction, even in the absence of reduced villous volume (as in this study), D
would be reduced in FGR. Further examination of the characteristics of diffusion
parameters within the placenta is warranted; potentially these biomarkers might provide
important information on the functioning of the placental microcirculations, not previously
possible in vivo.
We demonstrated that FAIR ASL can be applied to the placenta in the measurement of
perfusion at 1.5 T. Our data showed reasonable agreement with the previous studies at 0.5
T; (Duncan, Gowland et al. 1998; Gowland, Francis et al. 1998), finding mean perfusion
(f) ± S.D. to be 111 ± 28 ml/min/100g (at a mean gestation of 33.4 weeks). We observed a
significant negative correlation between f and gestation which supports that perfusion falls
towards term. This relationship was not demonstrated in previous MRI studies, but is in
keeping with evidence from Doppler ultrasound (Lingman and Marsal 1986). Certainly
variability in the data was reduced at 1.5 T compared to 0.5 T, likely due to both inherent
improvements from increased field strength and advances in scan protocols. Using our
ROI technique all values lay within approx 100ml/min/100g of each at 1.5T, as opposed to
around 300ml/min/100g for 0.5 T.
As the ASL study group by chance included a number of SGA and FGR infants, a
relationship between perfusion and birthweight was considered. It is of interest that a trend
for reduced perfusion in the SGA group and more so in the FGR group was observed and
this certainly requires further investigation, using this now developed ASL technique.
Previous studies have shown similar trends; Francis et al. showed a reduction in the
185
proportion of the placenta image with f < 100ml/min/100g using FAIR ASL (with EPI) in
6 normal and 9 SGA pregnancies (Francis, Duncan et al. 1998). This difference was also
reported by Duncan et al. (Duncan, Gowland et al. 1998) who also found a trend for
reduced overall mean placental f in SGA pregnancies. The observed finding in our study
supports a growing body of small studies demonstrating that ASL can be used to assess
placental perfusion and that reduced perfusion, so measured, is associated with FGR.
Importantly, we were able to correct for any gestational effect in our study and this trend
remained present. It would certainly be worthwhile continuing this analysis in a larger
more rigorously defined group of women.
In conclusion, the studies in this thesis illustrate that MRI biomarkers show great potential
in identifying the FGR placenta. Given the small numbers of studies in the literature,
optimisation of scan protocols and scan interpretation still requires much work, as well as
analysis of what information can be gained from MRI, in addition to that provided by
ultrasound. Although our study focused on an initial exploration of differences between
normal and FGR groups as a whole, there are hints that the severity of FGR may be
detected by MRI techniques and these may be useful in stratifying disease and rigorously
defining phenotypes. Although at present ultrasound remains the optimal tool for the
evaluation of the placenta in FGR, there is accumulating evidence to support the role of
MR in assessment of this disease. Abnormalities in fetal brain development in growth
restriction have also been demonstrated using MR techniques such as diffusion tensor
analysis (Tolsa, Zimine et al. 2004; Lodygensky, Seghier et al. 2008) and proton Magnetic
Resonance Spectroscopy (Charles-Edwards, Jan et al. 2010). We would advocate that MR
imaging is used more frequently in FGR, as it may provide additional information on
disease severity. Most studies in this field are limited by the fairly small numbers involved
and there is a case that, given the evidence that MR is safe in pregnancy, more widespread
use might allow us to realise its potential. 3D ultrasound of the fetus has been widely
186
adopted in developed countries as it is acceptable to women, who often value the images
provided, which has enabled its development. Similarly, it may be appropriate in some
women to offer MRI, ideally in a setting which combines clinical and research elements,
such as the ‘Placenta Clinics’, initially commenced by Kingdom’s group in Toronto and
adopted in several centres including Manchester. These manage the clinical needs of
pregnancies with FGR, or at high risk of FGR, but also collate data from ultrasound and
biochemical blood tests. This approach allows large numbers of women to be accessed for
recruitment and is likely to be important in the development of investigations and
management of FGR, in which poor outcomes measures, such as intrauterine death of the
fetus (stillbirth), are rare (Toal, Chan et al. 2007).
The main limitations of the study are in the small numbers studied. MRI is an expensive
test and funding was limited, however the main constraint on particpants scanned was
time not money. At the outset of the body of the work no scan protocols were fully
developed and therefore development of the protocols ran alongside recruitment and data
collection. This was a huge hinderance in terms of time as many scans did not yield the
data expected and there was substantial fine tuning along the way which could affect
validity of the results. A study of this design ideally needs all scan protocols to be in their
final form before recruitment begins, however, in reality, it is difficult to secure funding
for development work without a clear clinical link in todays climate. If running a similar
study in the future, it would be ideal to run all indices in every woman, allowing
comparison between parameters within the same placenta e.g due to subadequate
development of the scans many women who had relaxation time measurements did not
have IVIM measurements. Again, numbers of placentas collected were low, this was due
to collection problems when working independently on a project without assistance,
requiring essentially to be on call 24 hours given the unpredictable nature of delivery.
187
In terms of validation of these techniques there is still much to be done. Various tests were
run by me in the course of my PhD such as inter and intraobserver agreement and
experimenting with different ways of analysing the data, however, a full and robust
assessment of the physics of the scan protocols felt beyond my realm.
Another big weakness in the study is not being able to compare to other parameters such
as uterine artery Dopplers. This would have greatly assisted in assessment of whether the
MRI findings bore relation to measures of placental function in clinical practice. If doing
the study again, all women would have an ultrasound placental assessment and MR
assessment on the same day. It may be faesible in the future to run such a study from the
base of the ‘Placenta Clinic’, incorporating several imaging and biochemical markers of
placental function.
Currently, there are no treatments available for FGR specifically and management
revolves around timing of delivery, hence the importance of imaging techniques that can
predict fetal outcome. Recently animal studies have assessed the use of potential hormonal
agents including melatonin and growth hormone in animal models of FGR (de Boo,
Eremia et al. 2008; Richter, Hansell et al. 2009), with evidence of potential improvements
in outcome. Similarly, Sildenafil (which regulates blood vessel diameter in some vascular
beds) (Stanley, Andersson et al. 2012)and Tempol (an antioxidant) (Stanley, Andersson et
al. 2012) have been demonstrated to improve pup growth in mouse models of FGR, also
improving blood flow in the uteroplacental circulations assessed by Doppler ultrasound.
As the origins of FGR lie in placental dysfunction, MRI could potentially assist in the
assessment of such interventions.

188
References
(2003). "A randomised trial of timed delivery for the compromised preterm fetus: short term outcomes and Bayesian interpretation." Bjog 110(1): 27-32.
Ahmed, A., X. F. Li, et al. (1995). "Colocalisation of vascular endothelial growth factor and its Flt-1 receptor in human placenta." Growth Factors 12(3): 235-43.
Alfirevic, Z., T. Stampalija, et al. "Fetal and umbilical Doppler ultrasound in high-risk pregnancies." Cochrane Database Syst Rev(1): CD007529.
Alfirevic, Z., T. Stampalija, et al. "Fetal and umbilical Doppler ultrasound in normal pregnancy." Cochrane Database Syst Rev(8): CD001450.
American Academy of Pediatrics, C. o. E. H. (1997). "Noise: a hazard for the fetus and newborn. American Academy of Pediatrics. Committee on Environmental Health." Pediatrics 100(4): 724-7.
Arsham, A. M., J. J. Howell, et al. (2003). "A novel hypoxia-inducible factor-independent hypoxic response regulating mammalian target of rapamycin and its targets." J Biol Chem 278(32): 29655-60.
Arulkumaran, S., D. Talbert, et al. (1992). "In-utero sound levels when vibroacoustic stimulation is applied to the maternal abdomen: an assessment of the possibility of cochlea damage in the fetus." Br J Obstet Gynaecol 99(1): 43-5.
Atkinson, K. R., M. Blumenstein, et al. (2009). "An altered pattern of circulating apolipoprotein E3 isoforms is implicated in preeclampsia." J Lipid Res 50(1): 71-80.
Baker, P. N., I. R. Johnson, et al. (1995). "Measurement of fetal liver, brain and placental volumes with echo-planar magnetic resonance imaging." Br J Obstet Gynaecol 102(1): 35-9.
Baker, P. N., I. R. Johnson, et al. (1994). "A three-year follow-up of children imaged in utero with echo-planar magnetic resonance." Am J Obstet Gynecol 170(1 Pt 1): 32-3.
Barker, D. J. (1995). "The fetal and infant origins of disease." Eur J Clin Invest 25(7): 457-63.
Barker, D. J., P. D. Gluckman, et al. (1993). "Fetal nutrition and cardiovascular disease in adult life." Lancet 341(8850): 938-41.
Barker, D. J., C. Osmond, et al. (1989). "Growth in utero, blood pressure in childhood and adult life, and mortality from cardiovascular disease." Bmj 298(6673): 564-7.
Barth, M. and E. Moser (1997). "Proton NMR relaxation times of human blood samples at 1.5 T and implications for functional MRI." Cell Mol Biol (Noisy-le-grand) 43(5): 783-91.
Bartolozzi, C., D. Cioni, et al. (2001). "Focal liver lesions: MR imaging-pathologic correlation." Eur Radiol 11(8): 1374-88.
Baschat, A. A. (2004). "Fetal responses to placental insufficiency: an update." Bjog 111(10): 1031-41.
Battin, M., E. F. Maalouf, et al. (1998). "Physiological stability of preterm infants during magnetic resonance imaging." Early Hum Dev 52(2): 101-10.
Benacerraf, B. R., T. D. Shipp, et al. (2007). "What does magnetic resonance imaging add to the prenatal sonographic diagnosis of ventriculomegaly?" J Ultrasound Med 26(11): 1513-22.
Benirschke, K., Kaufmann, P. (2000). Pathology of the human placenta. New York, Springer-Verlag.
Bloch, F., Hansen. W.W., Packard, M.E. (1946). "The nuclear induction experiment." Physiol Rev 70: 474-85.

189
Blumenstein, M., M. T. McMaster, et al. (2009). "A proteomic approach identifies early pregnancy biomarkers for preeclampsia: novel linkages between a predisposition to preeclampsia and cardiovascular disease." Proteomics 9(11): 2929-45.
Boers, K. E., S. M. Vijgen, et al. "Induction versus expectant monitoring for intrauterine growth restriction at term: randomised equivalence trial (DIGITAT)." Bmj 341: c7087.
Bottomley, P. A., T. H. Foster, et al. (1984). "A review of normal tissue hydrogen NMR relaxation times and relaxation mechanisms from 1-100 MHz: dependence on tissue type, NMR frequency, temperature, species, excision, and age." Med Phys 11(4): 425-48.
Boyd, J. D. and W. J. Hamilton (1967). "Development and structure of the human placenta from the end of the 3rd month of gestation." J Obstet Gynaecol Br Commonw 74(2): 161-226.
Boyd, J. D., Hamilton, W. J (1970). The Human Placenta. Cambridge, Heffer. Boyd, P. A. (1984). "Quantitative structure of the normal human placenta from 10 weeks
of gestation to term." Early Hum Dev 9(4): 297-307. Brosens, I., R. Pijnenborg, et al. "The "Great Obstetrical Syndromes" are associated with
disorders of deep placentation." Am J Obstet Gynecol 204(3): 193-201. Browne, J. C. and N. Veall (1953). "The maternal placental blood flow in normotensive
and hypertensive women." J Obstet Gynaecol Br Emp 60(2): 141-7. Bruch, J. F., O. Sibony, et al. (1997). "Computerized microscope morphometry of
umbilical vessels from pregnancies with intrauterine growth retardation and abnormal umbilical artery Doppler." Hum Pathol 28(10): 1139-45.
Brummett, R. E., J. M. Talbot, et al. (1988). "Potential hearing loss resulting from MR imaging." Radiology 169(2): 539-40.
Buxton, R. B., E. C. Wong, et al. (1998). "Dynamics of blood flow and oxygenation changes during brain activation: the balloon model." Magn Reson Med 39(6): 855-64.
Cameron, I. L., V. A. Ord, et al. (1984). "Characterization of proton NMR relaxation times in normal and pathological tissues by correlation with other tissue parameters." Magn Reson Imaging 2(2): 97-106.
Campbell, S. (2007). "Placental vasculature as visualized by 3D power Doppler angiography and 3D color Doppler imaging." Ultrasound Obstet Gynecol 30(6): 917-20.
Campbell, S. and A. Thoms (1977). "Ultrasound measurement of the fetal head to abdomen circumference ratio in the assessment of growth retardation." Br J Obstet Gynaecol 84(3): 165-74.
Carnes, K. I. and R. L. Magin (1996). "Effects of in utero exposure to 4.7 T MR imaging conditions on fetal growth and testicular development in the mouse." Magn Reson Imaging 14(3): 263-74.
Castellucci, M. and P. Kaufmann (1982). "A three-dimensional study of the normal human placental villous core: II. Stromal architecture." Placenta 3(3): 269-85.
Catanzarite, V. A., S. K. Hendricks, et al. (1995). "Prenatal diagnosis of the two-vessel cord: implications for patient counselling and obstetric management." Ultrasound Obstet Gynecol 5(2): 98-105.
CEMACH (2008). Perinatal Mortality 2006. London, CEMACH Publications. Chaddha, V., S. Viero, et al. (2004). "Developmental biology of the placenta and the
origins of placental insufficiency." Semin Fetal Neonatal Med 9(5): 357-69. Chalela, J. A., D. C. Alsop, et al. (2000). "Magnetic resonance perfusion imaging in acute
ischemic stroke using continuous arterial spin labeling." Stroke 31(3): 680-7.
190
Chauhan, S. P., N. W. Hendrix, et al. (1998). "Limitations of clinical and sonographic estimates of birth weight: experience with 1034 parturients." Obstet Gynecol 91(1): 72-7.
Chauhan, S. P., E. F. Magann, et al. (2008). "Prediction of small for gestational age newborns using ultrasound estimated and actual amniotic fluid volume: published data revisited." Aust N Z J Obstet Gynaecol 48(2): 160-4.
Chen, D. W. (2001). Boy, 6, dies of skull injury during M.R.I. . NY Times. New York. B1.
Chen, T. Y., L. Chiu, et al. "Arterial spin-labeling in routine clinical practice: a preliminary experience of 200 cases and correlation with MRI and clinical findings." Clin Imaging 36(4): 345-52.
Chiswick, M. L. (1985). "Intrauterine growth retardation." Br Med J (Clin Res Ed) 291(6499): 845-8.
Clausson, B., J. Gardosi, et al. (2001). "Perinatal outcome in SGA births defined by customised versus population-based birthweight standards." Bjog 108(8): 830-4.
Clements, H., K. R. Duncan, et al. (2000). "Infants exposed to MRI in utero have a normal paediatric assessment at 9 months of age." Br J Radiol 73(866): 190-4.
Cliver, S. P., R. L. Goldenberg, et al. (1995). "The effect of cigarette smoking on neonatal anthropometric measurements." Obstet Gynecol 85(4): 625-30.
Cnossen, J. S., R. K. Morris, et al. (2008). "Use of uterine artery Doppler ultrasonography to predict pre-eclampsia and intrauterine growth restriction: a systematic review and bivariable meta-analysis." Cmaj 178(6): 701-11.
Constancia, M., E. Angiolini, et al. (2005). "Adaptation of nutrient supply to fetal demand in the mouse involves interaction between the Igf2 gene and placental transporter systems." Proc Natl Acad Sci U S A 102(52): 19219-24.
Constancia, M., M. Hemberger, et al. (2002). "Placental-specific IGF-II is a major modulator of placental and fetal growth." Nature 417(6892): 945-8.
Counter, S. A., A. Olofsson, et al. (1997). "MRI acoustic noise: sound pressure and frequency analysis." J Magn Reson Imaging 7(3): 606-11.
Daayana, S., P. Baker, et al. (2004). "An image analysis technique for the investigation of variations in placental morphology in pregnancies complicated by preeclampsia with and without intrauterine growth restriction." J Soc Gynecol Investig 11(8): 545-52.
Damodaram, M., L. Story, et al. (2010). "Placental MRI in intrauterine fetal growth restriction." Placenta 31(6): 491-8.
de Boo, H. A., S. C. Eremia, et al. (2008). "Treatment of intrauterine growth restriction with maternal growth hormone supplementation in sheep." Am J Obstet Gynecol 199(5): 559 e1-9.
Dennis, P. B., A. Jaeschke, et al. (2001). "Mammalian TOR: a homeostatic ATP sensor." Science 294(5544): 1102-5.
Detre, J. A., J. S. Leigh, et al. (1992). "Perfusion imaging." Magn Reson Med 23(1): 37-45.
Dilworth, M. R., L. C. Kusinski, et al. "Placental-specific Igf2 knockout mice exhibit hypocalcemia and adaptive changes in placental calcium transport." Proc Natl Acad Sci U S A 107(8): 3894-9.
Duncan, K. R., P. N. Baker, et al. (1997). "Demonstration of changes in fetal liver erythropoiesis using echo-planar magnetic resonance imaging." Am J Physiol 273(4 Pt 1): G965-7.
Duncan, K. R., P. Gowland, et al. (1998). "The investigation of placental relaxation and estimation of placental perfusion using echo-planar magnetic resonance imaging." Placenta 19(7): 539-43.

191
Duncan, K. R., B. Issa, et al. (2005). "A comparison of fetal organ measurements by echo-planar magnetic resonance imaging and ultrasound." Bjog 112(1): 43-9.
Duncan, K. R., D. S. Sahota, et al. (2001). "Multilevel modeling of fetal and placental growth using echo-planar magnetic resonance imaging." J Soc Gynecol Investig 8(5): 285-90.
Ericsson, A., B. Hamark, et al. (2005). "Hormonal regulation of glucose and system A amino acid transport in first trimester placental villous fragments." Am J Physiol Regul Integr Comp Physiol 288(3): R656-62.
Ericsson, A., B. Hamark, et al. (2005). "Glucose transporter isoform 4 is expressed in the syncytiotrophoblast of first trimester human placenta." Hum Reprod 20(2): 521-30.
Esterman, A., M. A. Greco, et al. (1997). "The effect of hypoxia on human trophoblast in culture: morphology, glucose transport and metabolism." Placenta 18(2-3): 129-36.
Fisteag-Kiprono, L., R. Neiger, et al. (2006). "Perinatal outcome associated with sonographically detected globular placenta." J Reprod Med 51(7): 563-6.
Fram, E. K., R. J. Herfkens, et al. (1987). "Rapid calculation of T1 using variable flip angle gradient refocused imaging." Magn Reson Imaging 5(3): 201-8.
Francis, S. T., K. R. Duncan, et al. (1998). "Non-invasive mapping of placental perfusion." Lancet 351(9113): 1397-9.
Froen, J. F., J. O. Gardosi, et al. (2004). "Restricted fetal growth in sudden intrauterine unexplained death." Acta Obstet Gynecol Scand 83(9): 801-7.
Galbraith, R. S., E. J. Karchmar, et al. (1979). "The clinical prediction of intrauterine growth retardation." Am J Obstet Gynecol 133(3): 281-6.
Garcia-Bournissen, F., A. Shrim, et al. (2006). "Safety of gadolinium during pregnancy." Can Fam Physician 52: 309-10.
Gardener, A. G. and S. T. Francis (2010). "Multislice perfusion of the kidneys using parallel imaging: image acquisition and analysis strategies." Magn Reson Med 63(6): 1627-36.
Gardosi, J. (2009). "Intrauterine growth restriction: new standards for assessing adverse outcome." Best Pract Res Clin Obstet Gynaecol 23(6): 741-9.
Gardosi, J., A. Chang, et al. (1992). "Customised antenatal growth charts." Lancet 339(8788): 283-7.
Gardosi J, F. A. C. W. C. C. G.-C. v. and w. g. n. v. i. v. b. c. Gestation Network. Gerhardt, K. J. and R. M. Abrams (1996). "Fetal hearing: characterization of the stimulus
and response." Semin Perinatol 20(1): 11-20. Gerhardt, K. J., R. Otto, et al. (1992). "Cochlear microphonics recorded from fetal and
newborn sheep." Am J Otolaryngol 13(4): 226-33. Gerhardt, K. J., L. L. Pierson, et al. (1999). "Effects of intense noise exposure on fetal
sheep auditory brain stem response and inner ear histology." Ear Hear 20(1): 21-32.
Ghi, T., G. Tani, et al. (2003). "Prenatal imaging of facial clefts by magnetic resonance imaging with emphasis on the posterior palate." Prenat Diagn 23(12): 970-5.
Gilbert, W. M. and B. Danielsen (2003). "Pregnancy outcomes associated with intrauterine growth restriction." Am J Obstet Gynecol 188(6): 1596-9; discussion 1599-601.
Giles, W. B., B. J. Trudinger, et al. (1985). "Fetal umbilical artery flow velocity waveforms and placental resistance: pathological correlation." Br J Obstet Gynaecol 92(1): 31-8.
Glazier, J. D., I. Cetin, et al. (1997). "Association between the activity of the system A amino acid transporter in the microvillous plasma membrane of the human placenta and severity of fetal compromise in intrauterine growth restriction." Pediatr Res 42(4): 514-9.

192
Gluckman, P. D., M. A. Hanson, et al. (2005). "The developmental origins of adult disease." Matern Child Nutr 1(3): 130-41.
Godfrey, K. M. (1998). "Maternal regulation of fetal development and health in adult life." Eur J Obstet Gynecol Reprod Biol 78(2): 141-50.
Goldenberg, R. L., H. J. Hoffman, et al. (1998). "Neurodevelopmental outcome of small-for-gestational-age infants." Eur J Clin Nutr 52 Suppl 1: S54-8.
Gowland, P. (2005). "Placental MRI." Semin Fetal Neonatal Med 10(5): 485-90. Gowland, P. A., S. T. Francis, et al. (1998). "In vivo perfusion measurements in the
human placenta using echo planar imaging at 0.5 T." Magn Reson Med 40(3): 467-73.
Gowland, P. A., A. Freeman, et al. (1998). "In vivo relaxation time measurements in the human placenta using echo planar imaging at 0.5 T." Magn Reson Imaging 16(3): 241-7.
Grant, A., Glazener, C.M.A (2003). Elective caesarean section versus expectant management for delivery of the small baby. Oxford, Cochrane Library.
Griffiths, P. D., E. Widjaja, et al. (2006). "Imaging the fetal spine using in utero MR: diagnostic accuracy and impact on management." Pediatr Radiol 36(9): 927-33.
Groom, K. M., R. A. North, et al. (2009). "Patterns of change in uterine artery Doppler studies between 20 and 24 weeks of gestation and pregnancy outcomes." Obstet Gynecol 113(2 Pt 1): 332-8.
Group, T. G. S. (2003). "A randomised trial of timed delivery for the compromised preterm fetus: short term outcomes and Bayesian interpretation." Bjog 110(1): 27-32.
Guimiot, F., C. Garel, et al. (2008). "Contribution of diffusion-weighted imaging in the evaluation of diffuse white matter ischemic lesions in fetuses: correlations with fetopathologic findings." AJNR Am J Neuroradiol 29(1): 110-5.
Gynaecologists, R. C. O. a. (2002). The Investigation and Management of the Small-for-Gestational-Age Fetus. Guideline No.31. London, RCOG.
Haacke, E. M., Brown, R.F., Thompson, M., Venkatesan, R. (1999). Magnetic resonance imaging: Physical principles and sequence design. New York, J. Wiley & Sons.
Hadlock, F. P., R. B. Harrist, et al. (1985). "Estimation of fetal weight with the use of head, body, and femur measurements--a prospective study." Am J Obstet Gynecol 151(3): 333-7.
Hales, C. N., D. J. Barker, et al. (1991). "Fetal and infant growth and impaired glucose tolerance at age 64." Bmj 303(6809): 1019-22.
Hand, J. W., Y. Li, et al. (2006). "Prediction of specific absorption rate in mother and fetus associated with MRI examinations during pregnancy." Magn Reson Med 55(4): 883-93.
Heinonen, S., P. Taipale, et al. (2001). "Weights of placentae from small-for-gestational age infants revisited." Placenta 22(5): 399-404.
Heinrichs, W. L., P. Fong, et al. (1988). "Midgestational exposure of pregnant BALB/c mice to magnetic resonance imaging conditions." Magn Reson Imaging 6(3): 305-13.
Hemberger, M., T. Nozaki, et al. (2003). "Differential expression of angiogenic and vasodilatory factors by invasive trophoblast giant cells depending on depth of invasion." Dev Dyn 227(2): 185-91.
Henkelman, R. M. (1990). "Does IVIM measure classical perfusion?" Magn Reson Med 16(3): 470-5.
Hepburn, M. and K. Rosenberg (1986). "An audit of the detection and management of small-for-gestational age babies." Br J Obstet Gynaecol 93(3): 212-6.
Hormann, M., P. C. Brugger, et al. (2006). "Fetal MRI of the urinary system." Eur J Radiol 57(2): 303-11.
193
HSE, H. a. S. E. (2005). The Control of Noise at Work Regulations. Statutory Instrument 2005 No.
1643., The Stationery Office Limited. Huppertz, B., D. S. Tews, et al. (2001). "Apoptosis and syncytial fusion in human
placental trophoblast and skeletal muscle." Int Rev Cytol 205: 215-53. International Electrotechnical Comission (IEC), G. (2002). IEC 60601-2-33. Medical
Electrical Equipment - particular requirements for the safety of magnetic resonance equipment for medical diagnosis. .
Jacinto, E. and M. N. Hall (2003). "Tor signalling in bugs, brain and brawn." Nat Rev Mol Cell Biol 4(2): 117-26.
Jackson, M. R., A. J. Walsh, et al. (1995). "Reduced placental villous tree elaboration in small-for-gestational-age pregnancies: relationship with umbilical artery Doppler waveforms." Am J Obstet Gynecol 172(2 Pt 1): 518-25.
Jansson, T. and T. L. Powell (2006). "IFPA 2005 Award in Placentology Lecture. Human placental transport in altered fetal growth: does the placenta function as a nutrient sensor? -- a review." Placenta 27 Suppl A: S91-7.
Jarvis, S., S. V. Glinianaia, et al. (2003). "Cerebral palsy and intrauterine growth in single births: European collaborative study." Lancet 362(9390): 1106-11.
Johnson, N. A., G. H. Jahng, et al. (2005). "Pattern of cerebral hypoperfusion in Alzheimer disease and mild cognitive impairment measured with arterial spin-labeling MR imaging: initial experience." Radiology 234(3): 851-9.
Kadyrov, M., C. Schmitz, et al. (2003). "Pre-eclampsia and maternal anaemia display reduced apoptosis and opposite invasive phenotypes of extravillous trophoblast." Placenta 24(5): 540-8.
Kanal, E., J. Gillen, et al. (1993). "Survey of reproductive health among female MR workers." Radiology 187(2): 395-9.
Kanal, E., F. G. Shellock, et al. (1990). "Safety considerations in MR imaging." Radiology 176(3): 593-606.
Karl, P. I., K. L. Alpy, et al. (1992). "Amino acid transport by the cultured human placental trophoblast: effect of insulin on AIB transport." Am J Physiol 262(4 Pt 1): C834-9.
Karlberg, J. and K. Albertsson-Wikland (1995). "Growth in full-term small-for-gestational-age infants: from birth to final height." Pediatr Res 38(5): 733-9.
Karsdorp, V. H., J. M. van Vugt, et al. (1994). "Clinical significance of absent or reversed end diastolic velocity waveforms in umbilical artery." Lancet 344(8938): 1664-8.
Kaufmann, P., S. Black, et al. (2003). "Endovascular trophoblast invasion: implications for the pathogenesis of intrauterine growth retardation and preeclampsia." Biol Reprod 69(1): 1-7.
Kay, H. H., S. R. Hawkins, et al. (1992). "Comparative analysis of normal and growth-retarded placentas with phosphorus nuclear magnetic resonance spectroscopy." Am J Obstet Gynecol 167(2): 548-53.
Kean, L. H., D. T. Liu, et al. (1996). "Pregnancy care of the low risk woman: the community-hospital interface." Int J Health Care Qual Assur 9(5): 39-44.
Kennerknecht, I. and R. Terinde (1990). "Intrauterine growth retardation associated with chromosomal aneuploidy confined to the placenta. Three observations: triple trisomy 6,21,22; trisomy 16; and trisomy 18." Prenat Diagn 10(8): 539-44.
Kingdom, J. C., S. J. Burrell, et al. (1997). "Pathology and clinical implications of abnormal umbilical artery Doppler waveforms." Ultrasound Obstet Gynecol 9(4): 271-86.
Kok, R. D., M. M. de Vries, et al. (2004). "Absence of harmful effects of magnetic resonance exposure at 1.5 T in utero during the third trimester of pregnancy: a follow-up study." Magn Reson Imaging 22(6): 851-4.

194
Kramer, M. S., M. Olivier, et al. (1990). "Impact of intrauterine growth retardation and body proportionality on fetal and neonatal outcome." Pediatrics 86(5): 707-13.
Krebs, C., L. M. Macara, et al. (1996). "Intrauterine growth restriction with absent end-diastolic flow velocity in the umbilical artery is associated with maldevelopment of the placental terminal villous tree." Am J Obstet Gynecol 175(6): 1534-42.
Lackman, F., V. Capewell, et al. (2001). "The risks of spontaneous preterm delivery and perinatal mortality in relation to size at birth according to fetal versus neonatal growth standards." Am J Obstet Gynecol 184(5): 946-53.
Lalande, N. M., R. Hetu, et al. (1986). "Is occupational noise exposure during pregnancy a risk factor of damage to the auditory system of the fetus?" Am J Ind Med 10(4): 427-35.
Le Bihan, D. (1988). "Intravoxel incoherent motion imaging using steady-state free precession." Magn Reson Med 7(3): 346-51.
Le Bihan, D., E. Breton, et al. (1988). "Separation of diffusion and perfusion in intravoxel incoherent motion MR imaging." Radiology 168(2): 497-505.
Le Bihan, D., E. Breton, et al. (1986). "MR imaging of intravoxel incoherent motions: application to diffusion and perfusion in neurologic disorders." Radiology 161(2): 401-7.
Leach, L. and J. A. Firth (1992). "Fine structure of the paracellular junctions of terminal villous capillaries in the perfused human placenta." Cell Tissue Res 268(3): 447-52.
Lees, C. "TRUFFLE Multicentre Group." from https://trufflestudy.org/truffle/index.htm. Leon, D. A., H. O. Lithell, et al. (1998). "Reduced fetal growth rate and increased risk of
death from ischaemic heart disease: cohort study of 15 000 Swedish men and women born 1915-29." Bmj 317(7153): 241-5.
Levine, D. (2006). "Obstetric MRI." J Magn Reson Imaging 24(1): 1-15. Levine, D., P. D. Barnes, et al. (2003). "Fast MR imaging of fetal central nervous system
abnormalities." Radiology 229(1): 51-61. Levine, D., C. E. Barnewolt, et al. (2003). "Fetal thoracic abnormalities: MR imaging."
Radiology 228(2): 379-88. Levine, D., C. Zuo, et al. (2001). "Potential heating effect in the gravid uterus during MR
HASTE imaging." J Magn Reson Imaging 13(6): 856-61. Linduska, N., S. Dekan, et al. (2009). "Placental pathologies in fetal MRI with
pathohistological correlation." Placenta 30(6): 555-9. Lingman, G. and K. Marsal (1986). "Fetal central blood circulation in the third trimester
of normal pregnancy--a longitudinal study. II. Aortic blood velocity waveform." Early Hum Dev 13(2): 151-9.
Luria, O., O. Barnea, et al. "Two-dimensional and three-dimensional Doppler assessment of fetal growth restriction with different severity and onset." Prenat Diagn 32(12): 1174-80.
Lyall, F., J. N. Bulmer, et al. (2001). "Human trophoblast invasion and spiral artery transformation: the role of PECAM-1 in normal pregnancy, preeclampsia, and fetal growth restriction." Am J Pathol 158(5): 1713-21.
Macara, L., J. C. Kingdom, et al. (1995). "Elaboration of stem villous vessels in growth restricted pregnancies with abnormal umbilical artery Doppler waveforms." Br J Obstet Gynaecol 102(10): 807-12.
Magin, R. L., J. K. Lee, et al. (2000). "Biological effects of long-duration, high-field (4 T) MRI on growth and development in the mouse." J Magn Reson Imaging 12(1): 140-9.
Magnevist, B. L. (2000). "Product information."

195
Malek, A., R. K. Miller, et al. (1995). "Continuous measurement of ATP by 31P-NMR in term human dually perfused placenta in vitro: response to ischemia." J Appl Physiol 78(5): 1778-86.
Marcos, H. B., R. C. Semelka, et al. (1997). "Normal placenta: gadolinium-enhanced dynamic MR imaging." Radiology 205(2): 493-6.
Mayhew, T. M. (2006). "Stereology and the placenta: where's the point? -- a review." Placenta 27 Suppl A: S17-25.
Mayhew, T. M. and B. L. Barker (2001). "Villous trophoblast: morphometric perspectives on growth, differentiation, turnover and deposition of fibrin-type fibrinoid during gestation." Placenta 22(7): 628-38.
Mayhew, T. M. and G. J. Burton (1988). "Methodological problems in placental morphometry: apologia for the use of stereology based on sound sampling practice." Placenta 9(6): 565-81.
Mayhew, T. M., M. R. Jackson, et al. (1993). "Changes in oxygen diffusive conductances of human placentae during gestation (10-41 weeks) are commensurate with the gain in fetal weight." Placenta 14(1): 51-61.
Mayhew, T. M., R. Manwani, et al. (2007). "The placenta in pre-eclampsia and intrauterine growth restriction: studies on exchange surface areas, diffusion distances and villous membrane diffusive conductances." Placenta 28(2-3): 233-8.
Mayhew, T. M., C. Ohadike, et al. (2003). "Stereological investigation of placental morphology in pregnancies complicated by pre-eclampsia with and without intrauterine growth restriction." Placenta 24(2-3): 219-26.
Mayhew, T. M., E. Wadrop, et al. (1994). "Proliferative versus hypertrophic growth in tissue subcompartments of human placental villi during gestation." J Anat 184 ( Pt 3): 535-43.
McCowan, L. M., C. T. Roberts, et al. "Risk factors for small-for-gestational-age infants by customised birthweight centiles: data from an international prospective cohort study." Bjog 117(13): 1599-607.
McIntire, D. D., S. L. Bloom, et al. (1999). "Birth weight in relation to morbidity and mortality among newborn infants." N Engl J Med 340(16): 1234-8.
McKelvey, S. S. and H. H. Kay (2007). "Magnetic resonance spectroscopy of the placenta." Placenta 28(5-6): 369-77.
McRobbie, D. and M. A. Foster (1985). "Pulsed magnetic field exposure during pregnancy and implications for NMR foetal imaging: a study with mice." Magn Reson Imaging 3(3): 231-4.
Medical Devices Agency, L. (2002). Guidelines for Magnetic Resonance Equipment in Clinical Use.
Metzenbauer, M., E. Hafner, et al. (2001). "Three-dimensional ultrasound measurement of the placental volume in early pregnancy: method and correlation with biochemical placenta parameters." Placenta 22(6): 602-5.
Miller, M. W., W. L. Nyborg, et al. (2002). "Hyperthermic teratogenicity, thermal dose and diagnostic ultrasound during pregnancy: implications of new standards on tissue heating." Int J Hyperthermia 18(5): 361-84.
Mills, T. A., M. Wareing, et al. (2005). "Chorionic plate artery function and Doppler indices in normal pregnancy and intrauterine growth restriction." Eur J Clin Invest 35(12): 758-64.
Mongelli, M. and J. Gardosi (1996). "Reduction of false-positive diagnosis of fetal growth restriction by application of customized fetal growth standards." Obstet Gynecol 88(5): 844-8.
Moore, R. J., B. Issa, et al. (2000). "In vivo intravoxel incoherent motion measurements in the human placenta using echo-planar imaging at 0.5 T." Magn Reson Med 43(2): 295-302.
196
Moore, R. J., S. S. Ong, et al. (2008). "Spiral artery blood volume in normal pregnancies and those compromised by pre-eclampsia." NMR Biomed 21(4): 376-80.
Moore, R. J., B. Strachan, et al. (2001). "In vivo diffusion measurements as an indication of fetal lung maturation using echo planar imaging at 0.5T." Magn Reson Med 45(2): 247-53.
Moore, R. J., B. K. Strachan, et al. (2000). "In utero perfusing fraction maps in normal and growth restricted pregnancy measured using IVIM echo-planar MRI." Placenta 21(7): 726-32.
Murakami, J., Y. Torii, et al. (1992). "Fetal development of mice following intrauterine exposure to a static magnetic field of 6.3 T." Magn Reson Imaging 10(3): 433-7.
Myers, C., K. R. Duncan, et al. (1998). "Failure to detect intrauterine growth restriction following in utero exposure to MRI." Br J Radiol 71(845): 549-51.
Naeye, R. L. (1992). Disorders of the Placenta, Fetus and Neonate: Diagnosis and Clinical Significance. St. Louis, Mosby Year Book.
Nelson, D. M., S. D. Smith, et al. (2003). "Hypoxia reduces expression and function of system A amino acid transporters in cultured term human trophoblasts." Am J Physiol Cell Physiol 284(2): C310-5.
Nevo, O., A. Many, et al. (2008). "Placental expression of soluble fms-like tyrosine kinase 1 is increased in singletons and twin pregnancies with intrauterine growth restriction." J Clin Endocrinol Metab 93(1): 285-92.
Nicolaides, K. H., C. M. Bilardo, et al. (1988). "Absence of end diastolic frequencies in umbilical artery: a sign of fetal hypoxia and acidosis." Bmj 297(6655): 1026-7.
Odegard, R. A., L. J. Vatten, et al. (2000). "Preeclampsia and fetal growth." Obstet Gynecol 96(6): 950-5.
Ong, S. S., D. J. Tyler, et al. (2004). "Functional magnetic resonance imaging (magnetization transfer) and stereological analysis of human placentae in normal pregnancy and in pre-eclampsia and intrauterine growth restriction." Placenta 25(5): 408-12.
Orden, M. R., S. Gudmundsson, et al. (1999). "Intravascular ultrasound contrast agent: an aid in imaging intervillous blood flow?" Placenta 20(2-3): 235-40.
Osbakken, M., J. Griffith, et al. (1986). "A gross morphologic, histologic, hematologic, and blood chemistry study of adult and neonatal mice chronically exposed to high magnetic fields." Magn Reson Med 3(4): 502-17.
Pallotto, E. K. and H. W. Kilbride (2006). "Perinatal outcome and later implications of intrauterine growth restriction." Clin Obstet Gynecol 49(2): 257-69.
Pearce, J. M. and S. Campbell (1987). "A comparison of symphysis-fundal height and ultrasound as screening tests for light-for-gestational age infants." Br J Obstet Gynaecol 94(2): 100-4.
Pierson, L. L., K. J. Gerhardt, et al. (1994). "Effect of impulse noise on the auditory brainstem response of the fetal sheep and the adult ewe: case study." Mil Med 159(11): 676-80.
Piper, J. M., E. M. Xenakis, et al. (1996). "Do growth-retarded premature infants have different rates of perinatal morbidity and mortality than appropriately grown premature infants?" Obstet Gynecol 87(2): 169-74.
Pomorski, M., M. Zimmer, et al. "Comparative analysis of placental vasculature and placental volume in normal and IUGR pregnancies with the use of three-dimensional Power Doppler." Arch Gynecol Obstet 285(2): 331-7.
Popek, E. J. (1999). Normal anatomy and histology of the placenta. Pathology of the Placenta. S. H. Lewis, Perrin, E.V.D.K. New York, Churchill Livingstone: 66-67.
Poutamo, J., K. Partanen, et al. (1998). "MRI does not change fetal cardiotocographic parameters." Prenat Diagn 18(11): 1149-54.

197
Poutamo, J., R. Vanninen, et al. (1999). "Magnetic resonance imaging supplements ultrasonographic imaging of the posterior fossa, pharynx and neck in malformed fetuses." Ultrasound Obstet Gynecol 13(5): 327-34.
Prefumo, F., M. Guven, et al. (2004). "The longitudinal variation in uterine artery blood flow pattern in relation to birth weight." Obstet Gynecol 103(4): 764-8.
Price, D. L., J. P. De Wilde, et al. (2001). "Investigation of acoustic noise on 15 MRI scanners from 0.2 T to 3 T." J Magn Reson Imaging 13(2): 288-93.
Purcell, E. M., Torrey, H.C., Pound, R.V. (1946). "Resonance absorption by nuclear magnetic moments in a solid." Physiol Rev 69: 37-8.
Raio, L., F. Ghezzi, et al. (2004). "The thick heterogeneous (jellylike) placenta: a strong predictor of adverse pregnancy outcome." Prenat Diagn 24(3): 182-8.
Raty, R., P. Koskinen, et al. (1999). "Prediction of pre-eclampsia with maternal mid-trimester total renin, inhibin A, AFP and free beta-hCG levels." Prenat Diagn 19(2): 122-7.
Reeves, M. J., Whitby, E.H., Paley, N.M.J., Griffiths, P.D. (2008). "The current role of magnetic resonance imaging." Maternal & Fetal Medicine Review 19(1): 33-60.
Regev, R. H., A. Lusky, et al. (2003). "Excess mortality and morbidity among small-for-gestational-age premature infants: a population-based study." J Pediatr 143(2): 186-91.
Reister, F., H. G. Frank, et al. (2001). "Macrophage-induced apoptosis limits endovascular trophoblast invasion in the uterine wall of preeclamptic women." Lab Invest 81(8): 1143-52.
Richter, H. G., J. A. Hansell, et al. (2009). "Melatonin improves placental efficiency and birth weight and increases the placental expression of antioxidant enzymes in undernourished pregnancy." J Pineal Res 46(4): 357-64.
Righini, A., E. Bianchini, et al. (2003). "Apparent diffusion coefficient determination in normal fetal brain: a prenatal MR imaging study." AJNR Am J Neuroradiol 24(5): 799-804.
Rodegerdts, E. A., E. F. Gronewaller, et al. (2000). "In vitro evaluation of teratogenic effects by time-varying MR gradient fields on fetal human fibroblasts." J Magn Reson Imaging 12(1): 150-6.
Sabogal, J. C. (2007). Fetal growth restriction. London, Informa Healthcare. Sakuma, H., Y. Tamagawa, et al. (1989). "[Intravoxel incoherent motion (IVIM) imaging
using an experimental MR unit with small bore]." Nihon Igaku Hoshasen Gakkai Zasshi 49(7): 941-3.
Salafia, C. M., A. K. Charles, et al. (2006). "Placenta and fetal growth restriction." Clin Obstet Gynecol 49(2): 236-56.
Sanderson, D. A., M. A. Wilcox, et al. (1994). "The individualised birthweight ratio: a new method of identifying intrauterine growth retardation." Br J Obstet Gynaecol 101(4): 310-4.
Schaaps, J. P., V. Tsatsaris, et al. (2005). "Shunting the intervillous space: new concepts in human uteroplacental vascularization." Am J Obstet Gynecol 192(1): 323-32.
Schlembach, D., W. Wallner, et al. (2007). "Angiogenic growth factor levels in maternal and fetal blood: correlation with Doppler ultrasound parameters in pregnancies complicated by pre-eclampsia and intrauterine growth restriction." Ultrasound Obstet Gynecol 29(4): 407-13.
Sebire, N. J. and W. Sepulveda (2008). "Correlation of placental pathology with prenatal ultrasound findings." J Clin Pathol 61(12): 1276-84.
Shellock, F. G. (2000). "Radiofrequency energy-induced heating during MR procedures: a review." J Magn Reson Imaging 12(1): 30-6.
Shellock, F. G. and J. V. Crues (1988). "Corneal temperature changes induced by high-field-strength MR imaging with a head coil." Radiology 167(3): 809-11.
198
Shellock, F. G. and J. V. Crues (2004). "MR procedures: biologic effects, safety, and patient care." Radiology 232(3): 635-52.
Shellock, F. G. and C. L. Shields, Jr. (2000). "Radiofrequency energy-induced heating of bovine articular cartilage using a bipolar radiofrequency electrode." Am J Sports Med 28(5): 720-4.
Shellock, F. G., M. Ziarati, et al. (1998). "Determination of gradient magnetic field-induced acoustic noise associated with the use of echo planar and three-dimensional, fast spin echo techniques." J Magn Reson Imaging 8(5): 1154-7.
Shen, S. H., W. Y. Guo, et al. (2007). "Two-dimensional fast imaging employing steady-state acquisition (FIESTA) cine acquisition of fetal non-central nervous system abnormalities." J Magn Reson Imaging 26(3): 672-7.
Sibley, C. P. and R. D. Boyd (1988). "Control of transfer across the mature placenta." Oxf Rev Reprod Biol 10: 382-435.
Sibley, C. P., P. M. Coan, et al. (2004). "Placental-specific insulin-like growth factor 2 (Igf2) regulates the diffusional exchange characteristics of the mouse placenta." Proc Natl Acad Sci U S A 101(21): 8204-8.
Sibley, C. P., M. A. Turner, et al. (2005). "Placental phenotypes of intrauterine growth." Pediatr Res 58(5): 827-32.
Sideri M, D. V. G., rainoldi R, Rainotti G (1983). "The ultra-structural basis of nutritional transfer: evidence of different patterns in the placenta membranes of the multilayered placental barrier." Trophoblast Research 1: 15 - 26.
Silvennoinen, M. J., M. I. Kettunen, et al. (2003). "Effects of hematocrit and oxygen saturation level on blood spin-lattice relaxation." Magnetic Resonance in Medicine 49(3): 568-71.
Spencer, K., C. K. Yu, et al. (2005). "Prediction of pregnancy complications by first-trimester maternal serum PAPP-A and free beta-hCG and with second-trimester uterine artery Doppler." Prenat Diagn 25(10): 949-53.
Stanley, J. L., I. J. Andersson, et al. (2012). "Effect of the Anti-Oxidant Tempol on Fetal Growth in a Mouse Model of Fetal Growth Restriction." Biol Reprod.
Strauss, R. S. (2000). "Adult functional outcome of those born small for gestational age: twenty-six-year follow-up of the 1970 British Birth Cohort." Jama 283(5): 625-32.
Tanaka, Y. O., S. Sohda, et al. (2001). "High temporal resolution dynamic contrast MRI in a high risk group for placenta accreta." Magn Reson Imaging 19(5): 635-42.
Teasdale, F. (1984). "Idiopathic intrauterine growth retardation: histomorphometry of the human placenta." Placenta 5(1): 83-92.
Thomsen, C. (1996). "Quantitative magnetic resonance methods for in vivo investigation of the human liver and spleen. Technical aspects and preliminary clinical results." Acta Radiol Suppl 401: 1-34.
Thornton, J. G. and R. J. Lilford (1993). "Do we need randomised trials of antenatal tests of fetal wellbeing?" Br J Obstet Gynaecol 100(3): 197-200.
Toal, M., C. Chan, et al. (2007). "Usefulness of a placental profile in high-risk pregnancies." Am J Obstet Gynecol 196(4): 363 e1-7.
Toal, M., S. Keating, et al. (2008). "Determinants of adverse perinatal outcome in high-risk women with abnormal uterine artery Doppler images." Am J Obstet Gynecol 198(3): 330 e1-7.
Turner, R., D. Le Bihan, et al. (1990). "Echo-planar imaging of intravoxel incoherent motion." Radiology 177(2): 407-14.
Tyson, J. E., K. Kennedy, et al. (1995). "The small for gestational age infant: accelerated or delayed pulmonary maturation? Increased or decreased survival?" Pediatrics 95(4): 534-8.
199
von Koch, C. S., O. A. Glenn, et al. (2005). "Fetal magnetic resonance imaging enhances detection of spinal cord anomalies in patients with sonographically detected bony anomalies of the spine." J Ultrasound Med 24(6): 781-9.
Vymazal, J., R. A. Brooks, et al. (1996). "The relation between brain iron and NMR relaxation times: an in vitro study." Magn Reson Med 35(1): 56-61.
Wallner, W., R. Sengenberger, et al. (2007). "Angiogenic growth factors in maternal and fetal serum in pregnancies complicated by intrauterine growth restriction." Clin Sci (Lond) 112(1): 51-7.
Wang, J., D. C. Alsop, et al. (2002). "Comparison of quantitative perfusion imaging using arterial spin labeling at 1.5 and 4.0 Tesla." Magn Reson Med 48(2): 242-54.
Weber, M. A., C. Thilmann, et al. (2004). "Assessment of irradiated brain metastases by means of arterial spin-labeling and dynamic susceptibility-weighted contrast-enhanced perfusion MRI: initial results." Invest Radiol 39(5): 277-87.
Whittle, W., V. Chaddha, et al. (2006). "Ultrasound detection of placental insufficiency in women with 'unexplained' abnormal maternal serum screening results." Clin Genet 69(2): 97-104.
WHO, W. H. O. (2006) "Environmental Health Criteria 232 Static Fields." Volume, DOI:
Wilcox, M. A., I. R. Johnson, et al. (1993). "The individualised birthweight ratio: a more logical outcome measure of pregnancy than birthweight alone." Br J Obstet Gynaecol 100(4): 342-7.
Williams, D. S., J. A. Detre, et al. (1992). "Magnetic resonance imaging of perfusion using spin inversion of arterial water." Proc Natl Acad Sci U S A 89(1): 212-6.
Williams, L. A., S. F. Evans, et al. (1997). "Prospective cohort study of factors influencing the relative weights of the placenta and the newborn infant." Bmj 314(7098): 1864-8.
Wolf, R. L., D. C. Alsop, et al. (2001). "Detection of mesial temporal lobe hypoperfusion in patients with temporal lobe epilepsy by use of arterial spin labeled perfusion MR imaging." AJNR Am J Neuroradiol 22(7): 1334-41.
Wright, C., D. M. Morris, et al. (2011). "Magnetic resonance imaging relaxation time measurements of the placenta at 1.5 T." Placenta 32(12): 1010-5.
Yaron, Y., M. Cherry, et al. (1999). "Second-trimester maternal serum marker screening: maternal serum alpha-fetoprotein, beta-human chorionic gonadotropin, estriol, and their various combinations as predictors of pregnancy outcome." Am J Obstet Gynecol 181(4): 968-74.
Yeh, B. M. (2006). "Has the time arrived to image placental perfusion?" Radiology 241(3): 633-4.
Zizka, J., P. Elias, et al. (2006). "Liver, meconium, haemorrhage: the value of T1-weighted images in fetal MRI." Pediatr Radiol 36(8): 792-801.
Zubrick, S. R., J. J. Kurinczuk, et al. (2000). "Fetal growth and subsequent mental health problems in children aged 4 to 13 years." Dev Med Child Neurol 42(1): 14-20.

200
Appendix 1
MRI of the fetus
This section is the published review article (adapted to thesis format):
Wright, C., Sibley, C.P., Baker P.N., 2010. The role of fetal magnetic resonance
imaging. Archives of Diseases of Childhood, 95(2), p137.
Acknowledgements
This paper was written by Dr Caroline Wright, author of this PhD thesis. This work was
edited prior to submission for publication by co-authors Professor Colin P Sibley and Prof.
Philip N Baker as supervisors the PhD project.
Co-authors
Prof. Colin P Sibley, BSc, PhD
Maternal and Fetal Health Research Centre, School of Biomedicine, University of
Manchester, Manchester Academic Health Sciences Centre, St Mary’s Hospital,
Manchester, M13 9WL,UK.
Prof. Philip N Baker, FRCOG, FRCSC, FMedSci
Faculty of Medicine & Dentistry, University of Alberta, Edmonton, T6G 2RZ, Canada and
Maternal and Fetal Health Research Centre, School of Biomedicine, University of

201
Manchester, Manchester Academic Health Sciences Centre, St Mary’s Hospital,
Manchester, M13 9WL,UK.
202
Abstract
The role of MRI in fetal imaging is expanding. The depth of structural information
provided by MRI places it as more than just a useful adjunct to ultrasound, as several
structures are more clearly visualised and many of the limitations of ultrasound are
avoided. Currently, MRI is most frequently utilised in the fetal central nervous system
and is valuable in ventriculomegaly, agenesis of the corpus callosum and posterior fossa
abnormalities. Outside this, MRI remains primarily a research tool, with increasing
interest in thoracic abnormalities and scope for development in other niche areas. MRI is
able to accurately determine fetal organ volumes and weight, although whether such
measurements could play a role in conditions such has fetal growth restriction, has yet to
be fully established. Techniques such as diffusion weighted imaging, magnetic resonance
spectroscopy and functional imaging are also being remodelled for use in the fetus,
improving our knowledge of in utero metabolism and development.
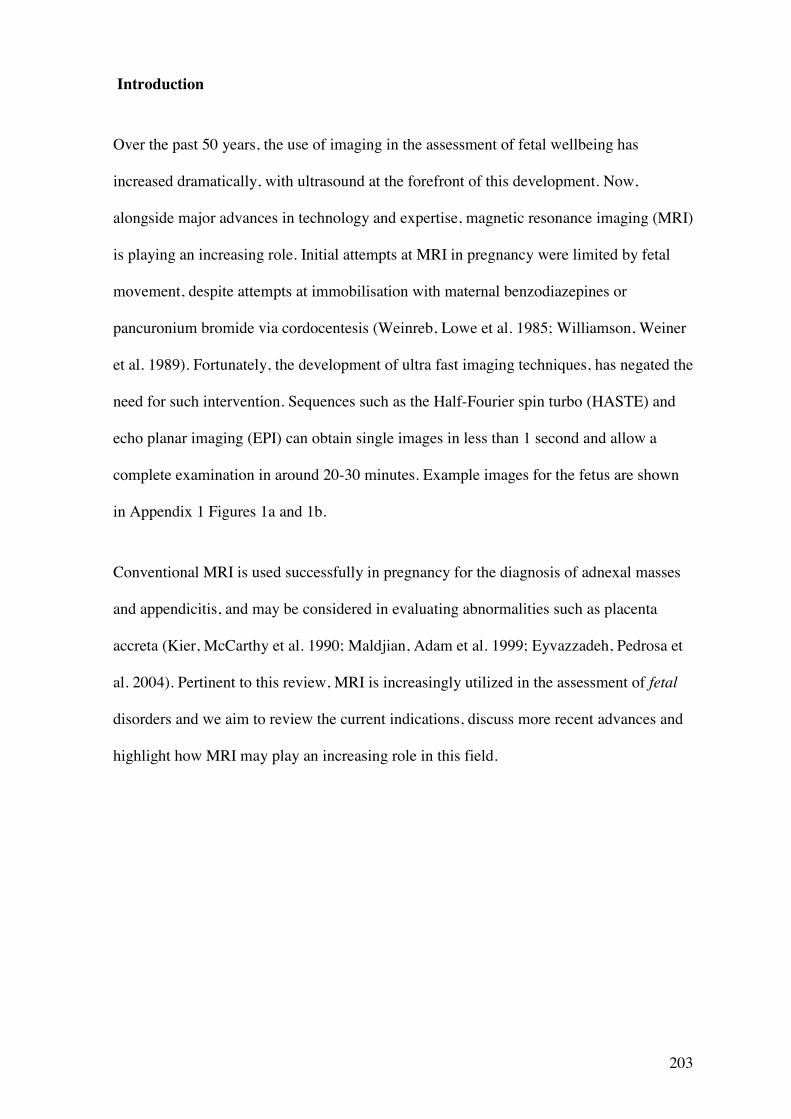
203
Introduction
Over the past 50 years, the use of imaging in the assessment of fetal wellbeing has
increased dramatically, with ultrasound at the forefront of this development. Now,
alongside major advances in technology and expertise, magnetic resonance imaging (MRI)
is playing an increasing role. Initial attempts at MRI in pregnancy were limited by fetal
movement, despite attempts at immobilisation with maternal benzodiazepines or
pancuronium bromide via cordocentesis (Weinreb, Lowe et al. 1985; Williamson, Weiner
et al. 1989). Fortunately, the development of ultra fast imaging techniques, has negated the
need for such intervention. Sequences such as the Half-Fourier spin turbo (HASTE) and
echo planar imaging (EPI) can obtain single images in less than 1 second and allow a
complete examination in around 20-30 minutes. Example images for the fetus are shown
in Appendix 1 Figures 1a and 1b.
Conventional MRI is used successfully in pregnancy for the diagnosis of adnexal masses
and appendicitis, and may be considered in evaluating abnormalities such as placenta
accreta (Kier, McCarthy et al. 1990; Maldjian, Adam et al. 1999; Eyvazzadeh, Pedrosa et
al. 2004). Pertinent to this review, MRI is increasingly utilized in the assessment of fetal
disorders and we aim to review the current indications, discuss more recent advances and
highlight how MRI may play an increasing role in this field.
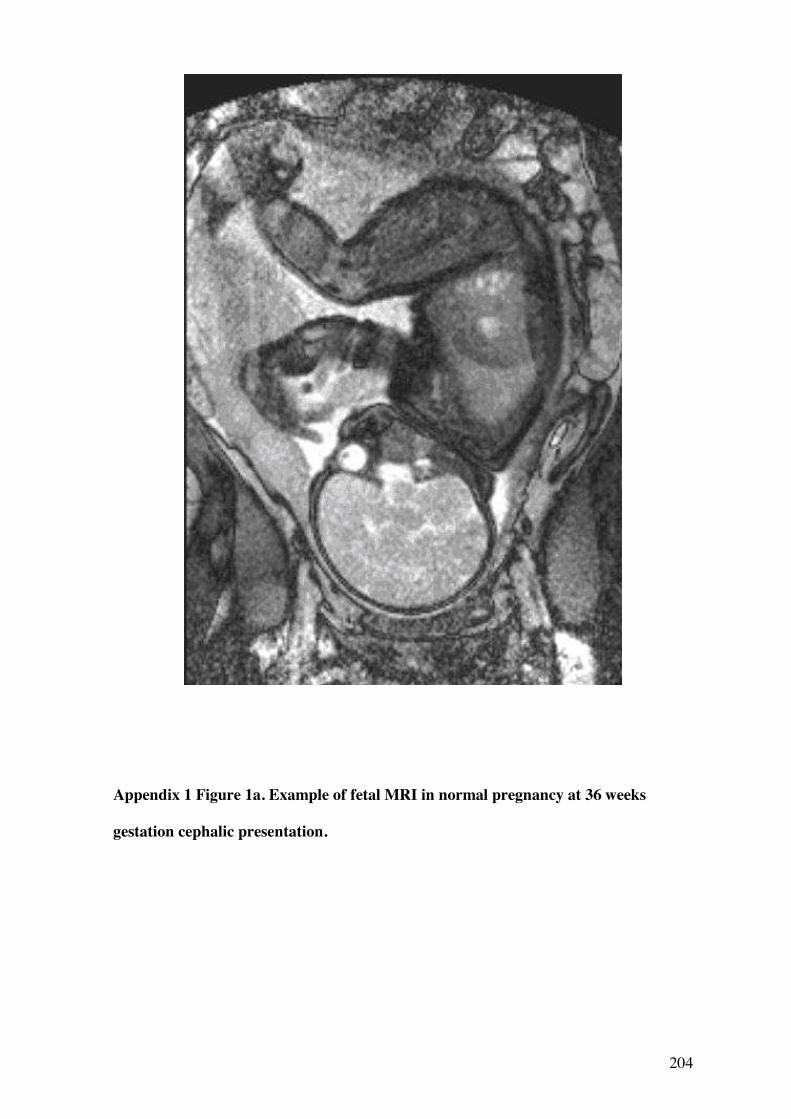
204
Appendix 1 Figure 1a. Example of fetal MRI in normal pregnancy at 36 weeks
gestation cephalic presentation.
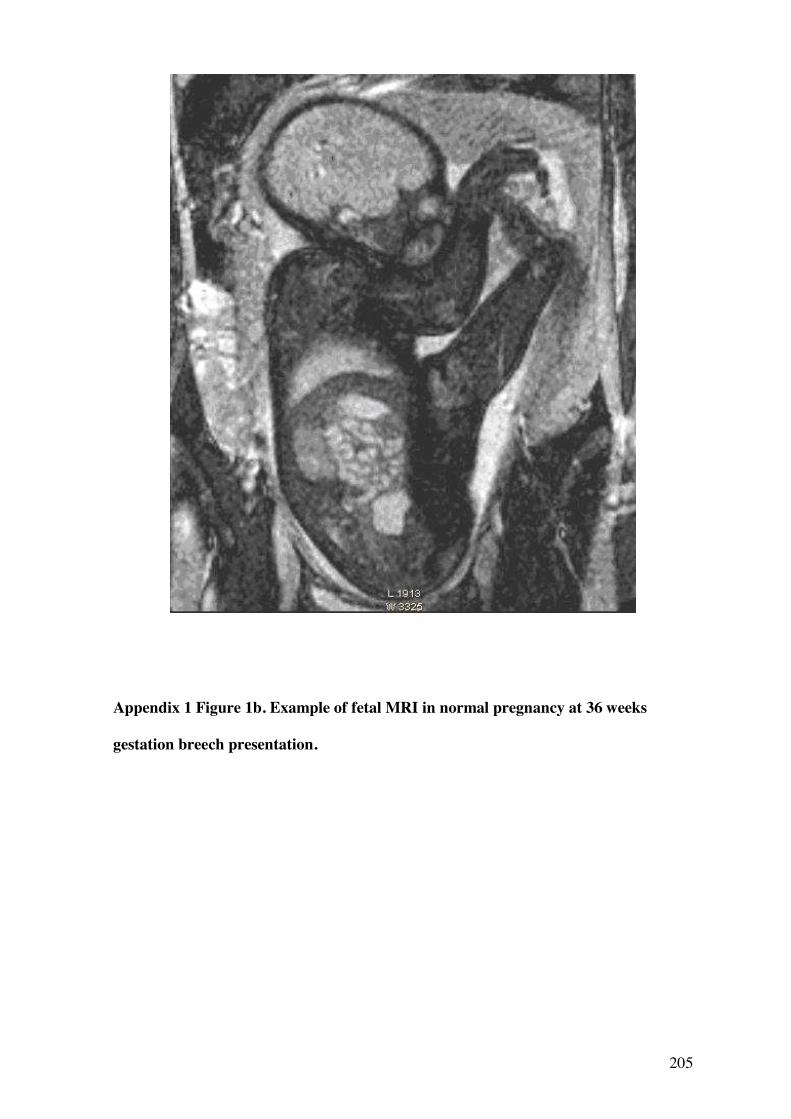
205
Appendix 1 Figure 1b. Example of fetal MRI in normal pregnancy at 36 weeks
gestation breech presentation.
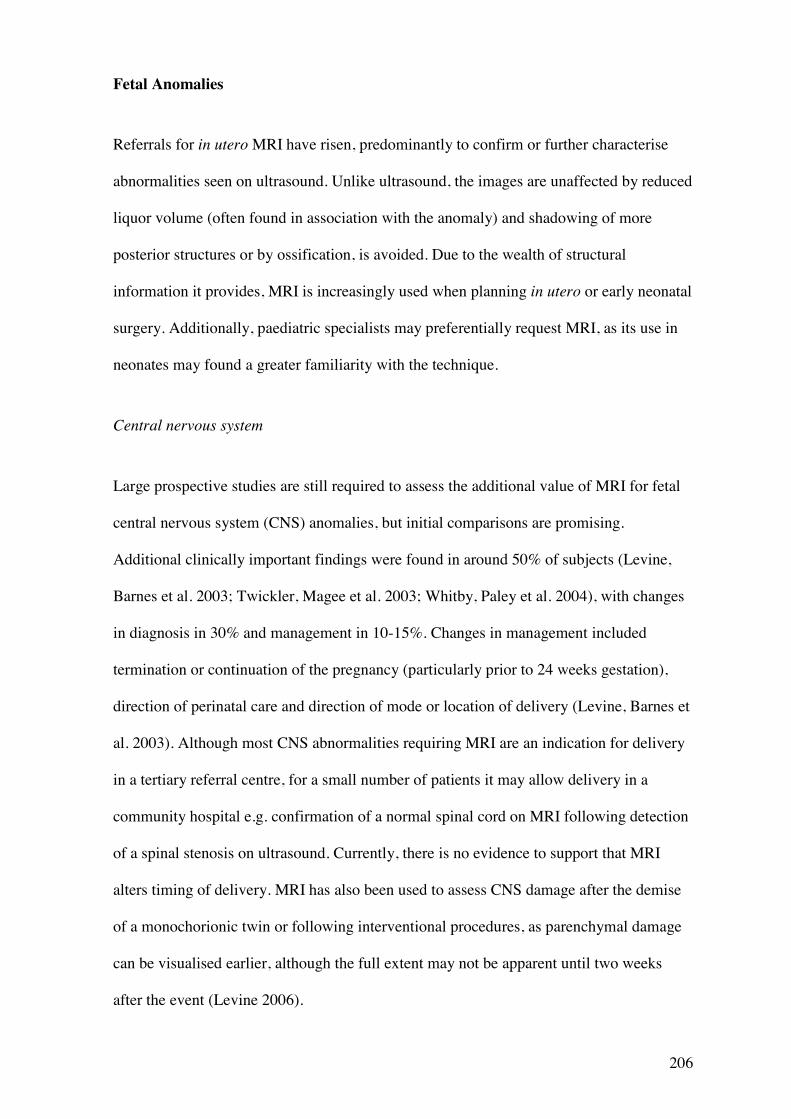
206
Fetal Anomalies
Referrals for in utero MRI have risen, predominantly to confirm or further characterise
abnormalities seen on ultrasound. Unlike ultrasound, the images are unaffected by reduced
liquor volume (often found in association with the anomaly) and shadowing of more
posterior structures or by ossification, is avoided. Due to the wealth of structural
information it provides, MRI is increasingly used when planning in utero or early neonatal
surgery. Additionally, paediatric specialists may preferentially request MRI, as its use in
neonates may found a greater familiarity with the technique.
Central nervous system
Large prospective studies are still required to assess the additional value of MRI for fetal
central nervous system (CNS) anomalies, but initial comparisons are promising.
Additional clinically important findings were found in around 50% of subjects (Levine,
Barnes et al. 2003; Twickler, Magee et al. 2003; Whitby, Paley et al. 2004), with changes
in diagnosis in 30% and management in 10-15%. Changes in management included
termination or continuation of the pregnancy (particularly prior to 24 weeks gestation),
direction of perinatal care and direction of mode or location of delivery (Levine, Barnes et
al. 2003). Although most CNS abnormalities requiring MRI are an indication for delivery
in a tertiary referral centre, for a small number of patients it may allow delivery in a
community hospital e.g. confirmation of a normal spinal cord on MRI following detection
of a spinal stenosis on ultrasound. Currently, there is no evidence to support that MRI
alters timing of delivery. MRI has also been used to assess CNS damage after the demise
of a monochorionic twin or following interventional procedures, as parenchymal damage
can be visualised earlier, although the full extent may not be apparent until two weeks
after the event (Levine 2006).
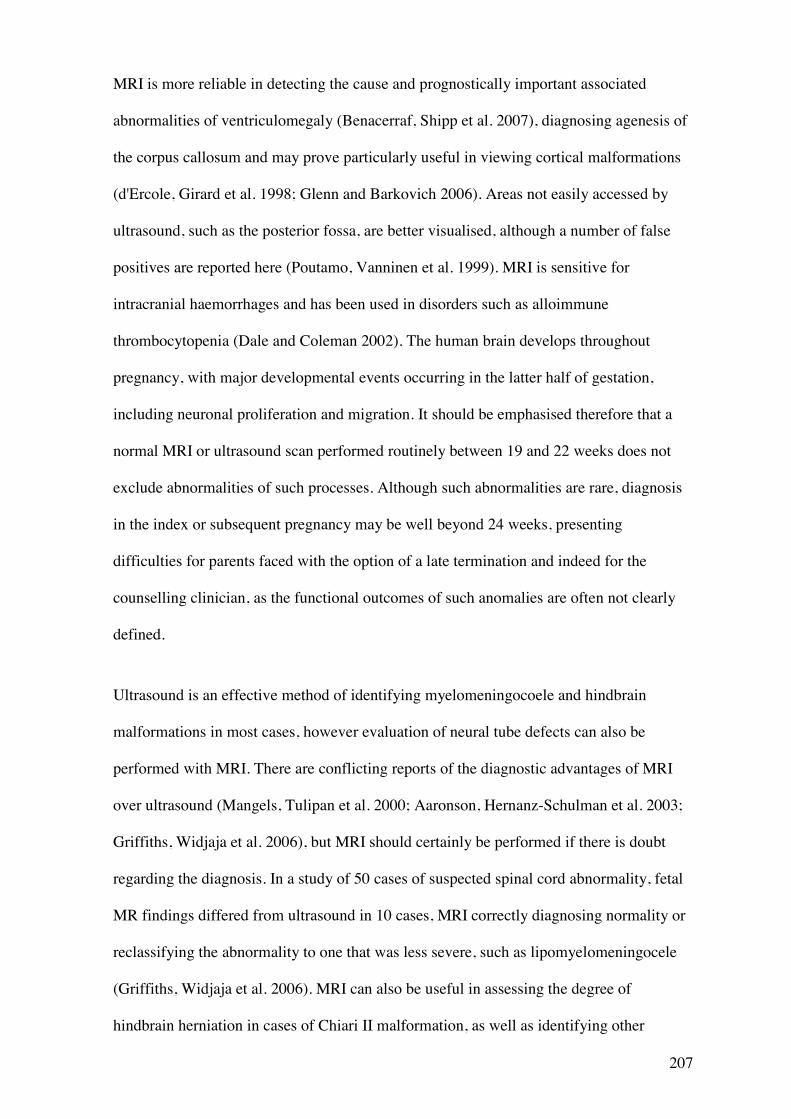
207
MRI is more reliable in detecting the cause and prognostically important associated
abnormalities of ventriculomegaly (Benacerraf, Shipp et al. 2007), diagnosing agenesis of
the corpus callosum and may prove particularly useful in viewing cortical malformations
(d'Ercole, Girard et al. 1998; Glenn and Barkovich 2006). Areas not easily accessed by
ultrasound, such as the posterior fossa, are better visualised, although a number of false
positives are reported here (Poutamo, Vanninen et al. 1999). MRI is sensitive for
intracranial haemorrhages and has been used in disorders such as alloimmune
thrombocytopenia (Dale and Coleman 2002). The human brain develops throughout
pregnancy, with major developmental events occurring in the latter half of gestation,
including neuronal proliferation and migration. It should be emphasised therefore that a
normal MRI or ultrasound scan performed routinely between 19 and 22 weeks does not
exclude abnormalities of such processes. Although such abnormalities are rare, diagnosis
in the index or subsequent pregnancy may be well beyond 24 weeks, presenting
difficulties for parents faced with the option of a late termination and indeed for the
counselling clinician, as the functional outcomes of such anomalies are often not clearly
defined.
Ultrasound is an effective method of identifying myelomeningocoele and hindbrain
malformations in most cases, however evaluation of neural tube defects can also be
performed with MRI. There are conflicting reports of the diagnostic advantages of MRI
over ultrasound (Mangels, Tulipan et al. 2000; Aaronson, Hernanz-Schulman et al. 2003;
Griffiths, Widjaja et al. 2006), but MRI should certainly be performed if there is doubt
regarding the diagnosis. In a study of 50 cases of suspected spinal cord abnormality, fetal
MR findings differed from ultrasound in 10 cases, MRI correctly diagnosing normality or
reclassifying the abnormality to one that was less severe, such as lipomyelomeningocele
(Griffiths, Widjaja et al. 2006). MRI can also be useful in assessing the degree of
hindbrain herniation in cases of Chiari II malformation, as well as identifying other
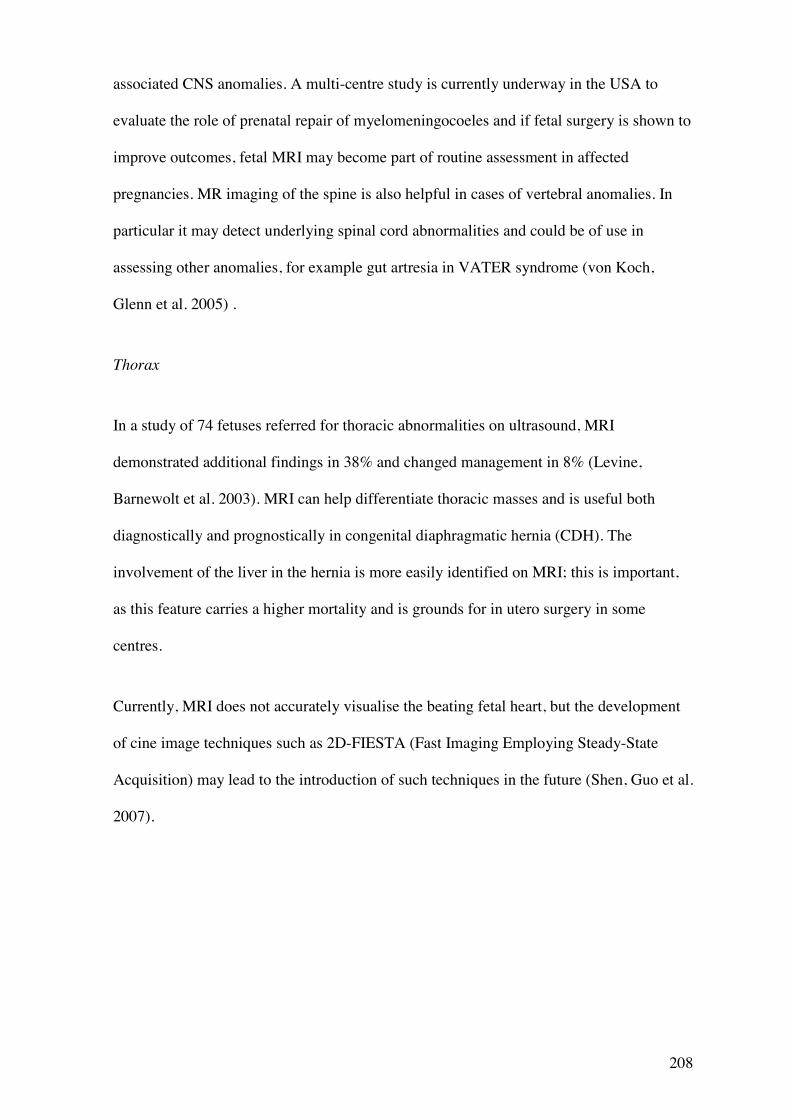
208
associated CNS anomalies. A multi-centre study is currently underway in the USA to
evaluate the role of prenatal repair of myelomeningocoeles and if fetal surgery is shown to
improve outcomes, fetal MRI may become part of routine assessment in affected
pregnancies. MR imaging of the spine is also helpful in cases of vertebral anomalies. In
particular it may detect underlying spinal cord abnormalities and could be of use in
assessing other anomalies, for example gut artresia in VATER syndrome (von Koch,
Glenn et al. 2005) .
Thorax
In a study of 74 fetuses referred for thoracic abnormalities on ultrasound, MRI
demonstrated additional findings in 38% and changed management in 8% (Levine,
Barnewolt et al. 2003). MRI can help differentiate thoracic masses and is useful both
diagnostically and prognostically in congenital diaphragmatic hernia (CDH). The
involvement of the liver in the hernia is more easily identified on MRI; this is important,
as this feature carries a higher mortality and is grounds for in utero surgery in some
centres.
Currently, MRI does not accurately visualise the beating fetal heart, but the development
of cine image techniques such as 2D-FIESTA (Fast Imaging Employing Steady-State
Acquisition) may lead to the introduction of such techniques in the future (Shen, Guo et al.
2007).
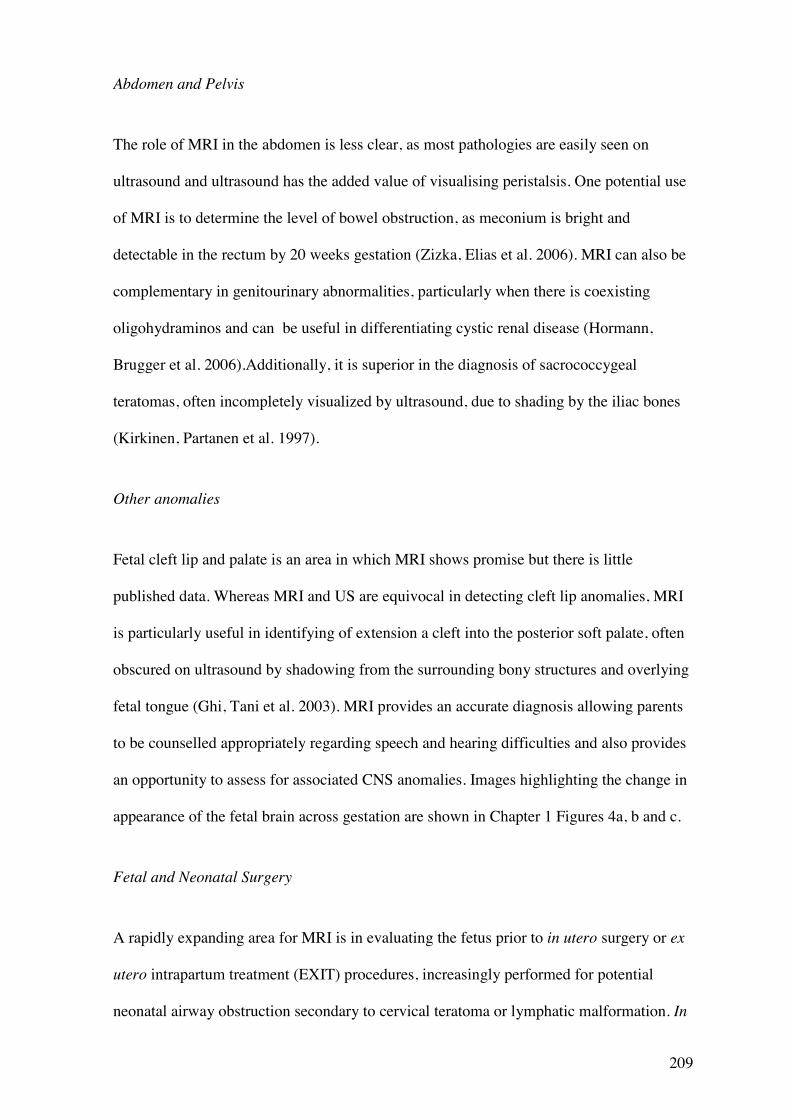
209
Abdomen and Pelvis
The role of MRI in the abdomen is less clear, as most pathologies are easily seen on
ultrasound and ultrasound has the added value of visualising peristalsis. One potential use
of MRI is to determine the level of bowel obstruction, as meconium is bright and
detectable in the rectum by 20 weeks gestation (Zizka, Elias et al. 2006). MRI can also be
complementary in genitourinary abnormalities, particularly when there is coexisting
oligohydraminos and can be useful in differentiating cystic renal disease (Hormann,
Brugger et al. 2006).Additionally, it is superior in the diagnosis of sacrococcygeal
teratomas, often incompletely visualized by ultrasound, due to shading by the iliac bones
(Kirkinen, Partanen et al. 1997).
Other anomalies
Fetal cleft lip and palate is an area in which MRI shows promise but there is little
published data. Whereas MRI and US are equivocal in detecting cleft lip anomalies, MRI
is particularly useful in identifying of extension a cleft into the posterior soft palate, often
obscured on ultrasound by shadowing from the surrounding bony structures and overlying
fetal tongue (Ghi, Tani et al. 2003). MRI provides an accurate diagnosis allowing parents
to be counselled appropriately regarding speech and hearing difficulties and also provides
an opportunity to assess for associated CNS anomalies. Images highlighting the change in
appearance of the fetal brain across gestation are shown in Chapter 1 Figures 4a, b and c.
Fetal and Neonatal Surgery
A rapidly expanding area for MRI is in evaluating the fetus prior to in utero surgery or ex
utero intrapartum treatment (EXIT) procedures, increasingly performed for potential
neonatal airway obstruction secondary to cervical teratoma or lymphatic malformation. In

210
utero MRI may also be useful if complex surgery is likely to be required in the early
neonatal period for example in cases of conjoined twin
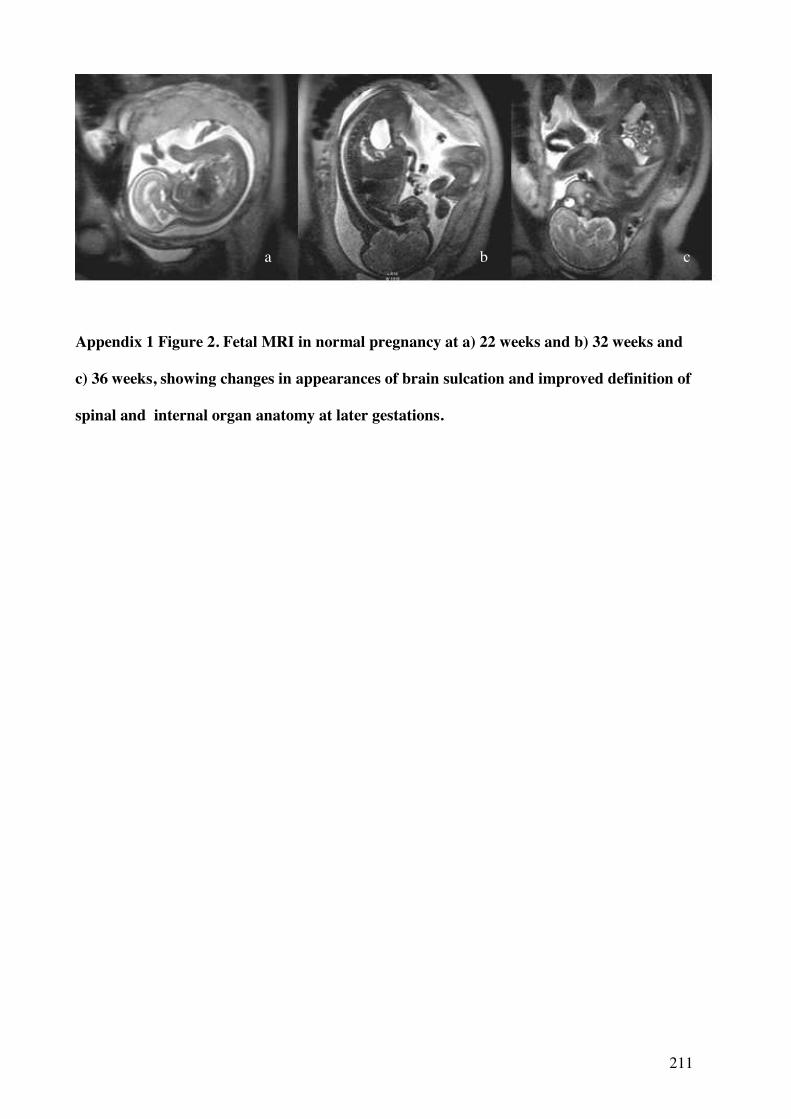
211
Appendix 1 Figure 2. Fetal MRI in normal pregnancy at a) 22 weeks and b) 32 weeks and
c) 36 weeks, showing changes in appearances of brain sulcation and improved definition of
spinal and internal organ anatomy at later gestations.
a b c
The Role of Fetal MRI – Organ Volumetry
Knowledge about fetal growth and organ development has greatly improved over the past
50 years, largely contributed to by imaging techniques. MRI is able to accurately predict
both organ volumes and fetal weight (Baker, Johnson et al. 1995; Duncan, Issa et al.
2005), of interest in various fetal disorders. In fetal growth restriction (FGR - often
defined for research purposes as an individualized birthweight ratio of less that the 5th or
10th percentile for gestational age), ultrasound remains the best predictor of fetal weight
(Duncan, Issa et al. 2005), but whether this is the case in macrosomia, has yet to be
established. Many such pregnancies are in obese women, where ultrasonic image quality
is affected, although the diameter of the magnet bore would prohibit examinations in the
very obese.
MRI volumetry has confirmed liver volume to be decreased in FGR, although this was not
highly predictive of outcome (Duncan, Issa et al. 2005). Interestingly, MRI may also
assess physiological processes; changes in fetal liver signal intensity are seen alongside
changes in erythropoiesis activity (Duncan, Baker et al. 1997).
Inadequate maturation of the lungs limits the chance of surviving a premature delivery.
MRI can accurately determine lung volume, even when small and in CDH can assess the
ipsilateral lung, often not seen on ultrasound (Busing, Kilian et al. 2008). There is much
speculation about the use of MR lung volumetry in classifying the prognosis of CDH and
several ratios have been explored including lung: head volume and actual: expected lung
volume. As yet, no sufficiently predictive test based on these measurements has been
established, suggesting that pulmonary hypoplasia is not the only factor determining
survival in CDH (Betremieux, Gaillot et al. 2004; Gorincour, Bouvenot et al. 2005;
Bonfils, Emeriaud et al. 2006). Interestingly, a rise in MR signal intensity is seen as
213
alveolar fluid is deposited and the lungs mature, but so far it is unclear whether such
observations could be used prognostically. MR spectroscopy and diffusion weighted
imaging present alternative strategies for assessing lung maturity (see below).
The phenomenon of ‘head sparing’ is classically reported in FGR, where head
circumference is preserved despite failing growth, presumably due to redirected blood
flow to the brain. Interestingly, MR images show a reduction in brain volume in FGR,
although the head circumference remains spared (Duncan, Issa et al. 2005), which may be
important in our understanding of this condition.
The Role of Fetal MRI – Advanced Imaging Techniques
Beyond an anatomical survey, MRI can provide a wealth of information on more
functional aspects. Several techniques used in children and adults are being developed for
the fetus, under the constraints of ethical considerations and minimising scan time.
Diffusion weighted imaging
Diffusion weighted imaging (DWI) assesses the Brownian motion of water molecules and
can be evaluated by measuring the apparent diffusion coefficient (ADC). It has been used
after birth in detecting hypoxic-ischaemic damage and white matter disorders. DWI
patterns have been characterised in the normal fetal brain (Righini, Bianchini et al. 2003),
but unlike in neonates, a chronic rather than acute pattern of ischaemic change is seen,
with a likely increase in the ADC. As yet, the prognosis of white matter abnormalities
with a raised ADC is unknown, although they correlate strongly with fetopathologic
findings of cerebral oedema with astrogliosis (Guimiot, Garel et al. 2008). If earlier
lesions are found to have improved outcomes, the technique could play an important role
in the prevention of disorders such as cerebral palsy.
214
Other uses include assessing fetal renal function, with abnormalities demonstrated in the
presence of huge dilatations and nephropathies (Savelli, Di Maurizio et al. 2007).
Furthermore, the bright signal can be useful in locating the kidney, in cases of suspected
agenesis or ectopic kidney. DWI may also have a role in assessing lung maturation, as
changes are seen with increasing gestational age (Moore, Strachan et al. 2001), mainly
reflecting an increase in pulmonary vascularisation.
MR Spectroscopy
MR spectroscopy can be used to estimate the concentration of various molecules within a
tissue of interest and continues to be developed. In the fetal brain, several markers of
development and ischaemia have been targeted, whilst in the lung, phospholipid
components of surfactant were the focus. Unfortunately, the long scan times required
(allowing fetal movement) have hindered the development of this technique and although
some findings are of interest, the clinical applications are yet to be fully realised.
Functional MRI
Functional MRI (fMRI) gives information on pre- and post-stimulus blood flow to various
parts of the brain. When an external stimulus causes increased neuronal activity, blood
flows to that site, which fMRI detects by estimating the amount of oxyhaemoglobin
present. Using this technique in the fetus, both temporal (auditory) and frontal lobe
(visual) activation has been demonstrated (Hykin, Moore et al. 1999; Fulford, Vadeyar et
al. 2003). Although still requiring development, it may be possible to use such methods
diagnostically or as markers of fetal health.
215
Placental MRI
The placenta is of fundamental importance to the normal growth and development of the
fetus and is suited to MRI as it is relatively immobile. The volume of the placenta can be
easily measured and is generally low in pregnancies complicated by FGR, although not
falling outside the confidence limits for the normal population (Baker, Johnson et al.
1995). The placenta matures with increasing gestation and MRI reflects this, with T1 and
T2 relaxation times falling with increasing gestation , suggesting a change in the structural
make-up (Gowland, Freeman et al. 1998) . Relaxation times may also be altered in
pregnancies complicated by FGR or pre-eclampsia, perhaps due to multiple areas of
infarction and fibrosis.
Placental perfusion can be depicted in several ways using MRI, with the exception of
contrast agents, such as gadolinium, which remain controversial in pregnancy. Arterial
Spin Labelling (ASL) tags arterial blood upstream with a radiofrequency pulse and detects
it as it flows into the main field. Mapping ASL values across the placental image
demonstrates a higher number of pixels with low perfusion values in pregnancies
complicated by FGR (Francis, Duncan et al. 1998). Intravoxel incoherent motion (IVIM)
measures the reduction in signal when protons flow fast enough within the field to be
dephased. Using this technique, the moving blood fraction in the placenta is around 26%
(Moore, Issa et al. 2000), with a reduction at the maternal-fetal interface in pregnancies
complicated by pre-eclampsia (Moore, Ong et al. 2008).
MR spectroscopy is less affected by fetal movement and has been attempted by several
groups, with various methodologies employed. In vivo data is limited, but some
interesting results have been obtained in post delivery placentas, such as higher
216
concentrations of adenosine triphosphate (ATP) in FGR pregnancies (Kay, Hawkins et al.
1992).
Safety of MRI in Pregnancy
A full review of MRI safety is beyond the scope of this article, but importantly, no adverse
affects have been demonstrated from MRI in pregnancy, including no association with
FGR (a concern raised inconsistently in mice studies) and no effect on child hearing (it is
likely that the amniotic fluid and flooding of the ear provides more than adequate
protection) (Arulkumaran, Talbert et al. 1992; Baker, Johnson et al. 1994; Carnes and
Magin 1996; Clements, Duncan et al. 2000; Magin, Lee et al. 2000; Kok, de Vries et al.
2004). The contraindications to MRI (such as cardiac pacemakers or other ferromagnetic
objects) remain the same as in the adult and guidelines have been set by the International
Electrotechnical Commission (IEC) on the amount of heat (termed specific absorption
rate) that can be generated (International Electrotechnical Comission (IEC) 2002). Also, as
data is limited, MRI should be avoided in the first trimester. The magnetic field strength
used in obstetric imaging is restricted in the UK to below 2.5 Tesla by the Medical
Devices Agency (Medical Devices Agency 2002). As technology advances and higher
field strengths become available, it is right that both researchers and clinicians to continue
to assess fetal outcomes. However, at low field strengths, safety of MRI in pregnancy is
well established and women they should be reassured of this, as part of the counselling
process.

217
The Role of Fetal MRI - Conclusions
As our understanding of MRI improves, limitations become apparent, as fetal MRI and its
interpretation are not yet available in many centres. The inevitable effect of improved
diagnostic capabilities, is an increase in terminations, balanced against the positive
outcome of more informed decision making for parents. In the long-term it is unlikely that
MRI will replace ultrasound in the antenatal setting and outside the CNS it remains
primarily a research tool. However, it has already adopted several niche roles and the
potential for development is vast. This, alongside advances in other imaging techniques
such as 3D ultrasound, makes for an exciting time ahead in fetal assessment.
END OF PUBLICATION
218
Appendix II
Morphometric Placental Analysis and correlations with MRI indices
In FGR, it is known that aspects of placental structure are altered, primarily a reduction in
villous volume and exchange barrier surface area are observed. It is also known that
relaxation times are a reflection of the molecular complexity to which the hydrogen
protons are bound and hence differ dependant upon the components of the tissue and on
other factors, such as the presence of membrane structures. In previous studies at 0.5 T
(Gowland et al, 1998), a fall was seen in relaxation times with advancing gestation and in
complicated pregnancies. The origin of these changes is, however, unknown and
comparisons with placental tissue morphology and relaxation times have not been
reported. We hypothesized that placental relaxation times are correlated with parameters
of placental tissue morphology and in this first phase tested the correlation with
morphometric analysis of the villous volume and the presence of fibrin.
Morphometric analysis
Similarly to stereologic investigations, good morphometric measurements require the
unbiased selection of tissue, i.e., all parts and orientations of each placenta must be given
equal opportunity for selection. To achieve this, I adopted a multistage random sampling
method in which tissue selection was randomized for location and orientation, adopted
from Mayhew (Mayhew et al, 2003). As we wished to compare central and peripheral
regions of the placenta, adaptations to Mathews’ techniques were made, detailed below.
7.2 Aims
219
1. To carry out initial morphometric placental analyses of villous and fibrin content.
2. To correlate these morphometric analyses with placental relaxation times.
3. To compare central and peripheral placental regions in terms of morphometry
Methods
Placentas were collected postnatally within 30 minutes of delivery time. Taking the
placental cord insertion as the central point, as circle was marked out on a transparent
sampling grid with a diameter half that of the longest axis of the placenta. Within this
circle was marked as ‘central’ and outside this circle was ‘peripheral’. Full-depth columns
of tissue were dissected by superimposing the transparent grid over the placenta, bearing a
systematic array of sampling windows (4cm apart). Using a random computer generated
number sequence, 3 tissue samples were taken from windows overlying the central region
and 5 from the peripheral region. The resulting full depth tissue samples were then
dissected into a top(fetal facing), middle and bottom (maternal facing) placental section
and fixed in 10% buffered formalin. Only middle sections are considered in this analysis
to date. These samples were diced and each sample was embedded haphazardly in paraffin
wax blocks and processed for histology. Before imaging, cut sections (5 micrometres)
were mounted on microscope slides, stained with hematoxylin and eosin (H&E), and
observed under a Litz (Dialux 22) microscope at a magnification of x250. 8 sections were
investigated per placenta. For image analysis, a Q-Imaging (Fast 1394) digital camera
acquired images from each sample. In total, 40 high-power fields of view were analysed
per placenta. Images were acquired using Image-Pro Plus software (Version 6.3). Once
acquired, images were pseudocolored and a threshold applied. This manipulation provided
a boundary between the objects measured, i.e. those with pixel intensities falling within
the thresholding range, and those to be excluded: those falling outside the desired color
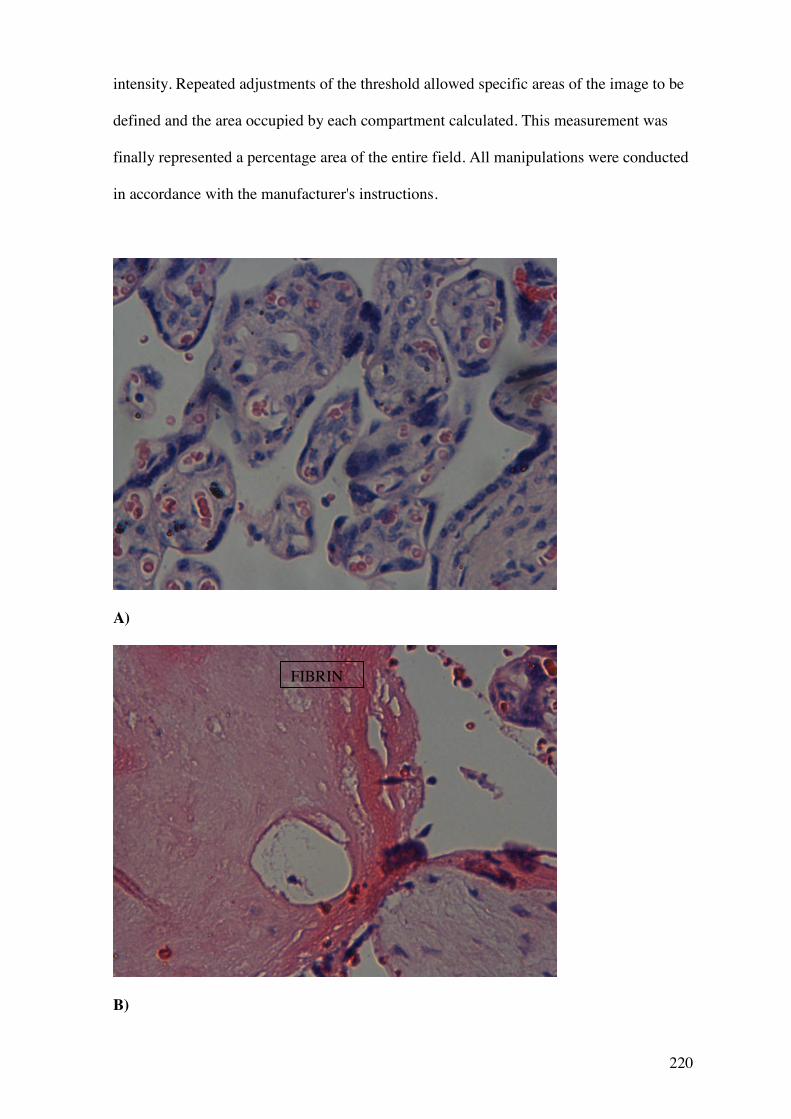
220
intensity. Repeated adjustments of the threshold allowed specific areas of the image to be
defined and the area occupied by each compartment calculated. This measurement was
finally represented a percentage area of the entire field. All manipulations were conducted
in accordance with the manufacturer's instructions.
A)
B)
FIBRIN

221
Appendix II Figure 1. Microscope images showing A) normal villous appearance
with H&E stain and B) villous containing large amounts of fibrin staining bright
pink.
222
Statistical Analysis
To generate T1 and T2 values, the 8 point ROI method was selected as this corresponded
best with the 8 point placental tissue sampling techniques. Relaxation times were
calculated from the mean signal over the entire 8 point region of interest. Similarly, the
morphometric values were taken as the means from all 8 placental samples i.e. from 40
microscope fields.
Initial correlations were made using Spearman’s rank correlation. Wilcoxon’s matched
pairs test (non parametric) was used to assess whether differences were present between
central and peripheral placental regions in terms of morphometry.
Results
At the time of write-up, 7 placentas were delivered and had been processed for analysis.
Correlations between placental morphometric analyses and relaxation times
Villous area is reported as villous area per field; this is the mean value for all 40 fields
investigated across one placenta. Similarly fibrin area per field is the mean value for all 40
fields.
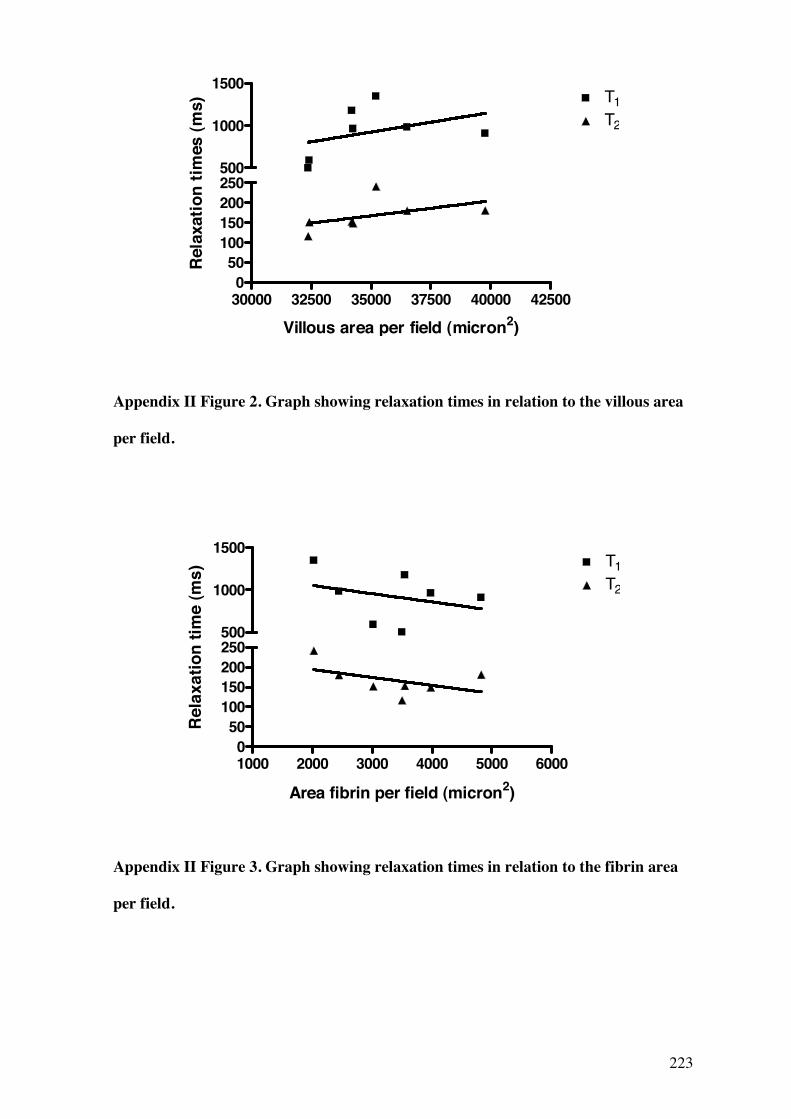
223
30000 32500 35000 37500 40000 425000
50100150200250
T1T2
500
1000
1500
Villous area per field (micron2)
Rela
xatio
n tim
es (m
s)
Appendix II Figure 2. Graph showing relaxation times in relation to the villous area
per field.
1000 2000 3000 4000 5000 60000
50100150200250
T1T2
500
1000
1500
Area fibrin per field (micron2)
Rel
axat
ion
time
(ms)
Appendix II Figure 3. Graph showing relaxation times in relation to the fibrin area
per field.
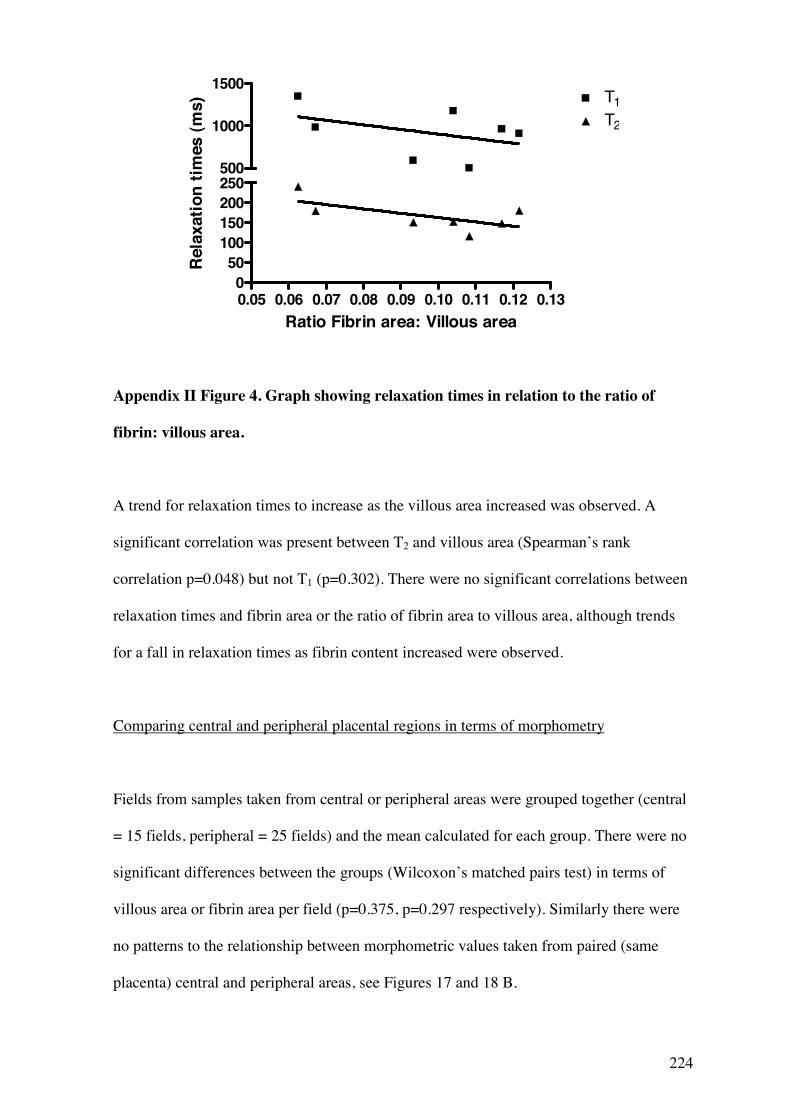
224
0.05 0.06 0.07 0.08 0.09 0.10 0.11 0.12 0.130
50100150200250
T1T2
500
1000
1500
Ratio Fibrin area: Villous area
Rel
axat
ion
times
(ms)
Appendix II Figure 4. Graph showing relaxation times in relation to the ratio of
fibrin: villous area.
A trend for relaxation times to increase as the villous area increased was observed. A
significant correlation was present between T2 and villous area (Spearman’s rank
correlation p=0.048) but not T1 (p=0.302). There were no significant correlations between
relaxation times and fibrin area or the ratio of fibrin area to villous area, although trends
for a fall in relaxation times as fibrin content increased were observed.
Comparing central and peripheral placental regions in terms of morphometry
Fields from samples taken from central or peripheral areas were grouped together (central
= 15 fields, peripheral = 25 fields) and the mean calculated for each group. There were no
significant differences between the groups (Wilcoxon’s matched pairs test) in terms of
villous area or fibrin area per field (p=0.375, p=0.297 respectively). Similarly there were
no patterns to the relationship between morphometric values taken from paired (same
placenta) central and peripheral areas, see Figures 17 and 18 B.

225
Areas are expressed here as percentage area per field, to highlight that the differences
between the groups are small, 3-5%. The median villous area per field is 65-70% and
fibrin 3-7% - these values are similar to morphometric values obtained in previous studies
(Boyd et al, 1977, Daayana et al. 2004).
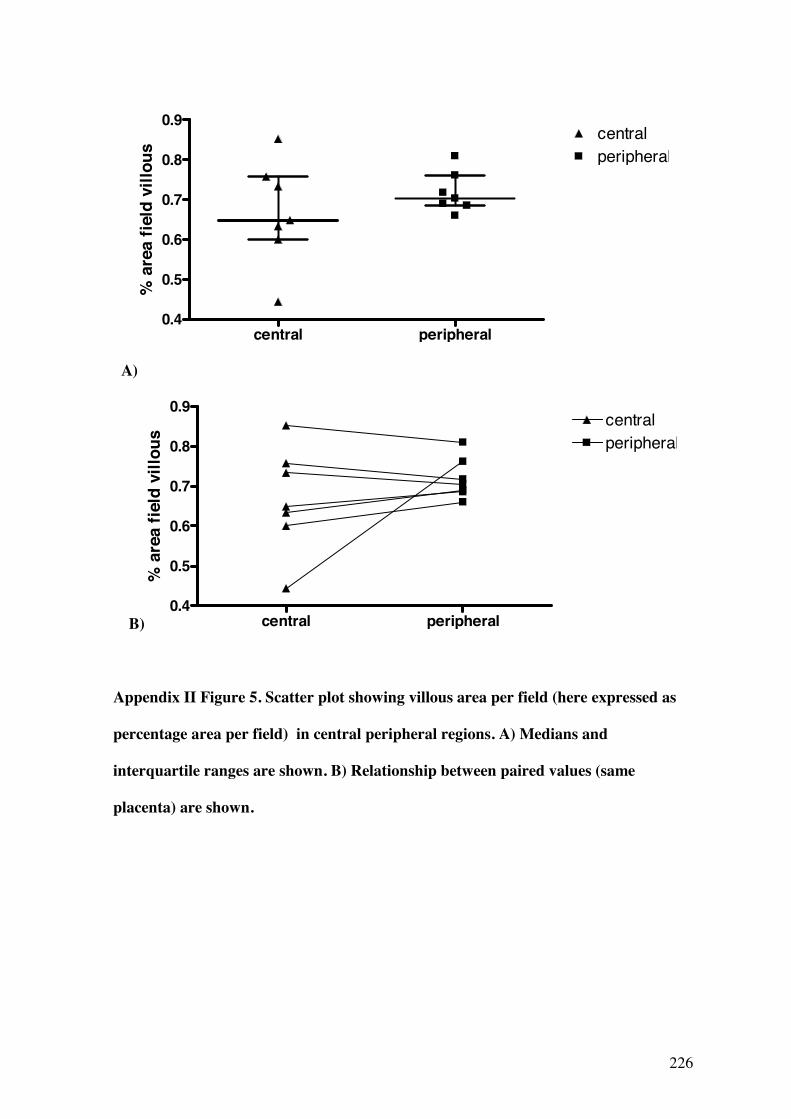
226
central peripheral0.4
0.5
0.6
0.7
0.8
0.9
peripheralcentral
% a
rea
field
vill
ous
A)
B) central peripheral0.4
0.5
0.6
0.7
0.8
0.9
peripheralcentral
% a
rea
field
vill
ous
Appendix II Figure 5. Scatter plot showing villous area per field (here expressed as
percentage area per field) in central peripheral regions. A) Medians and
interquartile ranges are shown. B) Relationship between paired values (same
placenta) are shown.
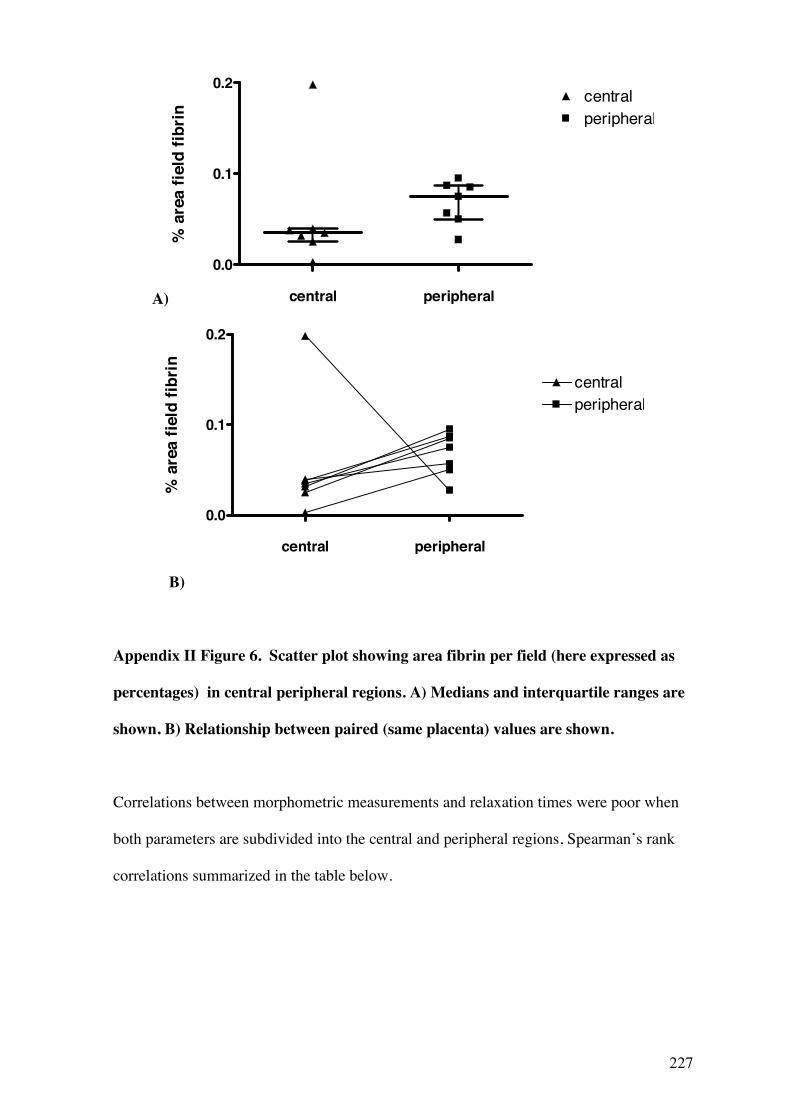
227
A) central peripheral
0.0
0.1
0.2centralperipheral
% a
rea
field
fibr
in
central peripheral
0.0
0.1
0.2
centralperipheral
% a
rea
field
fibr
in
B)
Appendix II Figure 6. Scatter plot showing area fibrin per field (here expressed as
percentages) in central peripheral regions. A) Medians and interquartile ranges are
shown. B) Relationship between paired (same placenta) values are shown.
Correlations between morphometric measurements and relaxation times were poor when
both parameters are subdivided into the central and peripheral regions, Spearman’s rank
correlations summarized in the table below.
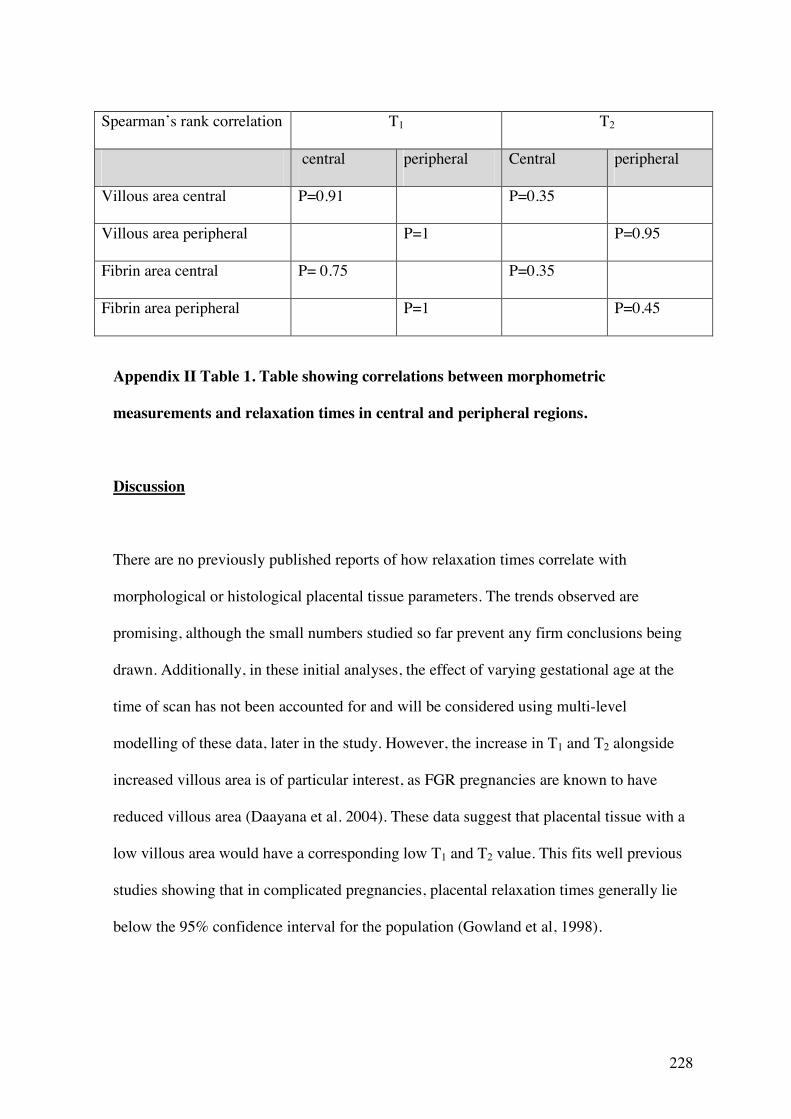
228
Spearman’s rank correlation T1 T2
central peripheral Central peripheral
Villous area central P=0.91 P=0.35
Villous area peripheral P=1 P=0.95
Fibrin area central P= 0.75 P=0.35
Fibrin area peripheral P=1 P=0.45
Appendix II Table 1. Table showing correlations between morphometric
measurements and relaxation times in central and peripheral regions.
Discussion
There are no previously published reports of how relaxation times correlate with
morphological or histological placental tissue parameters. The trends observed are
promising, although the small numbers studied so far prevent any firm conclusions being
drawn. Additionally, in these initial analyses, the effect of varying gestational age at the
time of scan has not been accounted for and will be considered using multi-level
modelling of these data, later in the study. However, the increase in T1 and T2 alongside
increased villous area is of particular interest, as FGR pregnancies are known to have
reduced villous area (Daayana et al. 2004). These data suggest that placental tissue with a
low villous area would have a corresponding low T1 and T2 value. This fits well previous
studies showing that in complicated pregnancies, placental relaxation times generally lie
below the 95% confidence interval for the population (Gowland et al, 1998).
229
No differences were observed between central and peripheral regions of the placenta in
either of the morphometric parameters, suggesting that the placenta is relatively
homogenous from region to region in normal pregnancy. This finding may be linked to the
mixed/early gestations at which women were scanned, as although central and peripheral
regions have not been compared morphometrically in the past, at term placentas often
have multiple area of infarction, necrosis and repair which can be seen macroscopically. It
would be expected that the greatest variation in morphometric parameters would therefore
be seen at later gestations (Boyd et al. 1977) and to draw out these differences, women at
gestations of 36 weeks and above will be targeted for the remainder of the study.
The origin of the rise in relaxation times with increasing villous area remains a matter for
conjecture. Again these data suggest that the observed changes are not due to an increase
in blood volume; as the villous area increases, the intervillous space filled with maternal
blood will decrease and less maternal blood will be present. As previously mentioned, the
relaxation times for maternal blood are at the high end of the values seen here, so if less
blood is present a corresponding fall not rise in T1 and T2 would be expected. Of course,
the effect of the volume of blood in the fetal capillaries has not been considered in the
morphometric analysis so far and will be investigated later in the study. The fall in
relaxation times with increased villous area may relate to surface area of the villi. If the
motion of the protons on the surface area of the villi is restricted, producing a fast relaxing
compartment in fast exchange with the bulk water protons, then a relative increase in
surface area could explain the observed changes in relaxation times. At low villous
volumes, the relative surface area may be still be high (due to branching of stem villi out
into small terminal villi) and this could explain the short relaxation times. Further
morphometric analysis of such parameters is, however, required. The trend for a fall in
relaxation times as the fibrin content increases is more easily explained, as complex

230
molecular structures such as fibrin restrict the movement of hydrogen protons and,
similarly to adipose tissue, have long T1 and T2 relaxation times. The small increases in
fibrin seen may not entirely explain the corresponding increases in relaxation times, but
may infact be a surrogate marker for a wider change in tissue structure or repair.
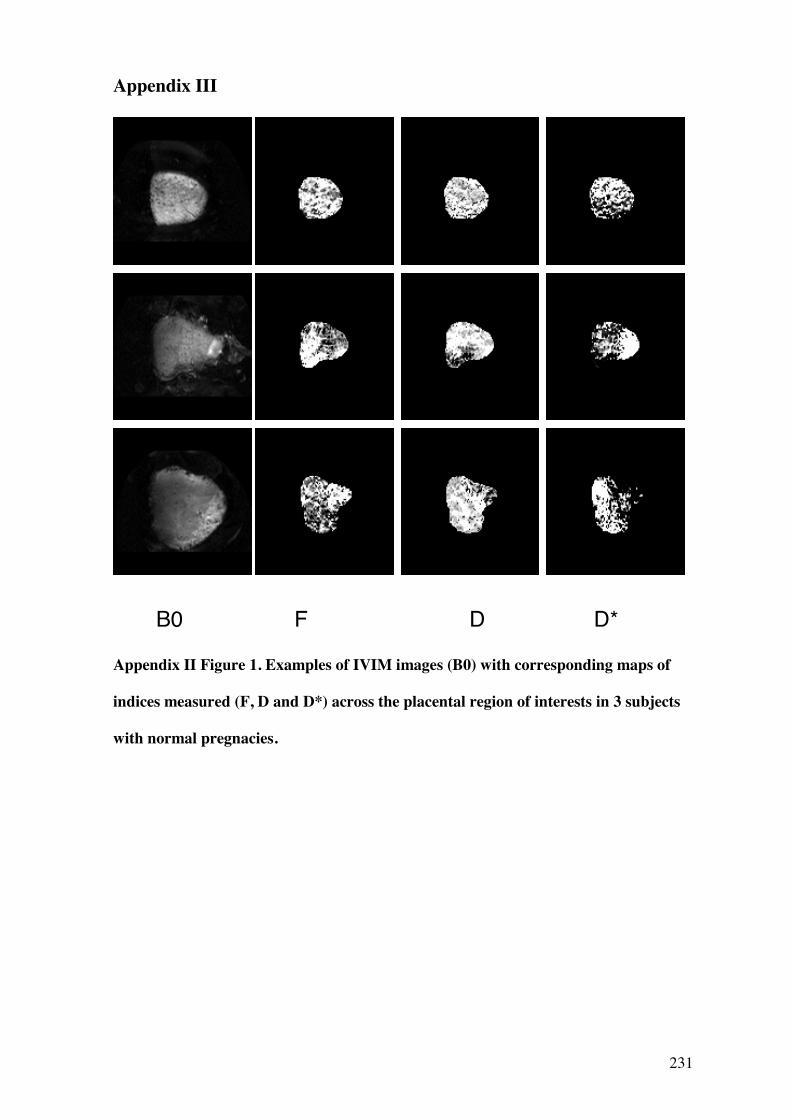
231
Appendix III
Appendix II Figure 1. Examples of IVIM images (B0) with corresponding maps of
indices measured (F, D and D*) across the placental region of interests in 3 subjects
with normal pregnacies.
B0 F D D*
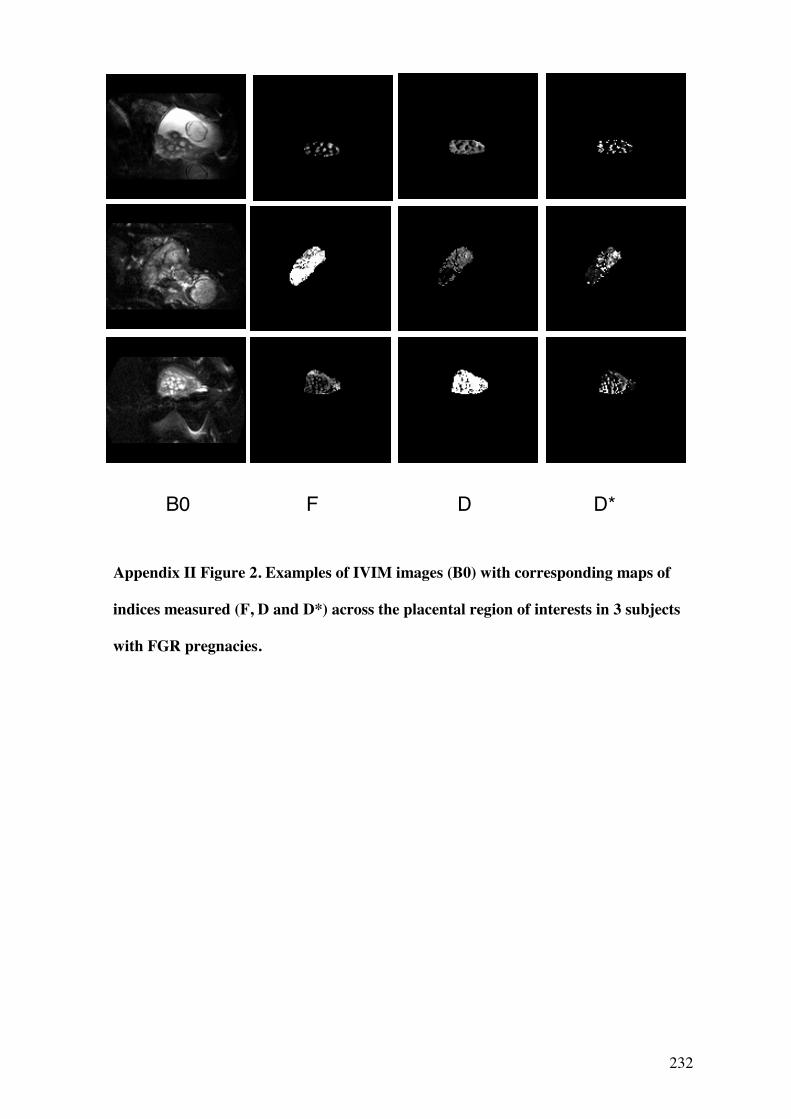
232
Appendix II Figure 2. Examples of IVIM images (B0) with corresponding maps of
indices measured (F, D and D*) across the placental region of interests in 3 subjects
with FGR pregnacies.
B0 F D D*