large scale simulation of industrial, engineering and geophysical flows using particle methods
TRANSCRIPT
Large Scale Simulation of Industrial,Engineering and Geophysical Flows UsingParticle Methods
Paul W. Cleary, Mahesh Prakash, Matt D. Sinnott, Murray Rudman and Raj Das
Abstract Particle based computational methods, such as DEM and SPH, are shownto be widely applicable as tools to understand complex large scale particulate andfluid flows in industrial processing, civil, marine and coastal engineering and geo-hazards.
1 Introduction
DEM has been developed and used over the past 30 years for modelling flows ofparticulate solids in many applications, starting with small systems in simple geo-metries in two dimensions [1–4]. It is now possible to model systems of tens ofmillions of particles on desktop computers [5, 6] enabling many complex partic-ulate flows to be explored in depth. It is the most effective method for any flowcontrolled by collision of particulates.
SPH is a powerful particle method that is suitable for solving complex multi-physics flow and deformation problems. It is particularly well suited to splashingfree surface flows, interaction with dynamic moving bodies and discrete particles.It is also very well suited to situations where flow or material history is important.
examples of SPH applications are given in [8].The inherent flexibility of these two Lagrangian techniques allows them to be
easily and effectively applied to a wide range of different modelling problems withthe only adjustments required being modifications to the detailed physics. In thischapter we describe a sub-set of the applications where such methods have beenapplied and highlight the diversity of physics and modelling scenarios that can bereadily handled by DEM and SPH.
Paul W. Cleary ·Mahesh Prakash ·Matt D. Sinnott ·Murray Rudman · Raj DasCSIRO Mathematics, Informatics and Statistics, Private Bag 33, Clayton South, Victoria, 3168,Australia; e-mail: [email protected]
89
© Springer Science+Business Media B.V. 2011in Applied Sciences 25, DOI 10.1007/978-94-007-0735-1_3,
The method was first developed for incompressible flows by Monaghan [7]. Many
E. Oñate and R. Owen (eds.), Particle-Based Methods, Computational Methods
90 P.W. Cleary et al.
2 Industrial Flows
Industrial applications can be broadly classified according to their key physical pro-cesses, such as:
• Mixing (fluid, particulate and fluid-particulate)• Separation• Comminution• Agglomeration• Storage/unloading/transport• Material forming (casting, forging, extrusion, forming, etc.)• Sampling• Excavation• Fracture and material failure• Bio-medical and biomechanical• Fluid-particulate flow• Fluid-bubble flow
In this section we will explore the use of particle based modelling in predicting thebehaviour of these flow based processes.
2.1 Mixing
Mixing of granular materials occurs in applications as broad as minerals processing,chemical manufacture and pharmceutical preparation A variety of techniques havebeen developed to mix granular materials, often based on empiricism and intuition.This diversity is suggestive of a fundamental lack of rigorous understanding of gran-ular mixing. DEM is an ideal technique for developoing such understanding.
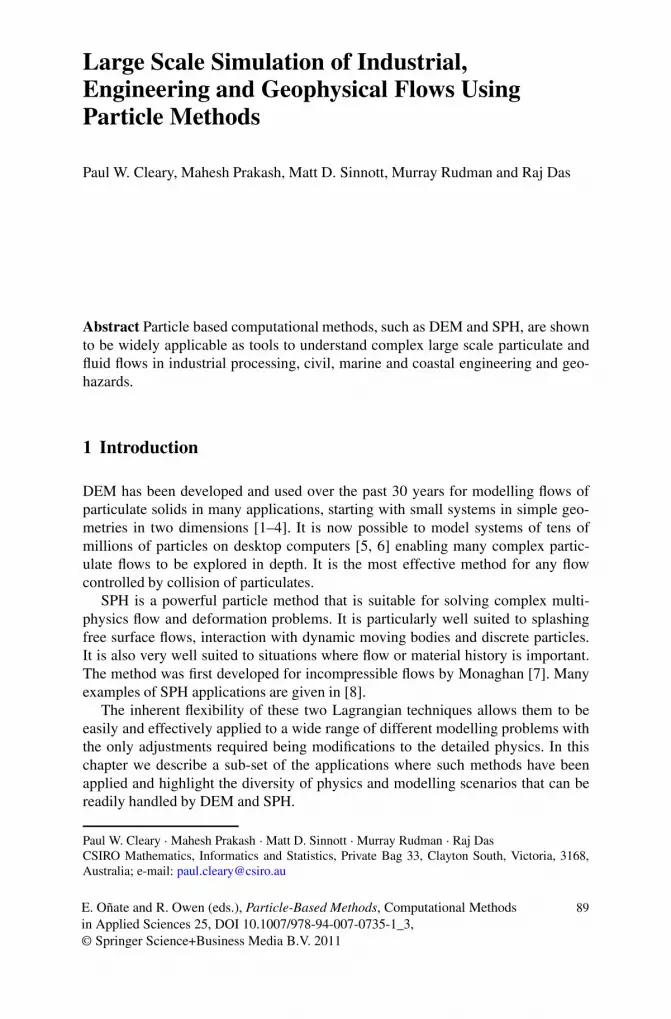
A peg mixer is one example of a device that uses an agitator to mix a bed ofparticles. It is commonly used to reduce residence times and thus equipment dimen-sions compared to tumbling blenders and bins. In Figure 1 we study a laboratory-scale version. This peg mixer has a 300 mm diameter, 600 mm long cylindricalshell. Agitation is achieved using an axially mounted peg-agitator consisting of 18pins attached to a 50 mm shaft and arranged at equal intervals along a helical path.Each pin is 15 mm in diameter and 125 mm in length with ends that move just insidethe surrounding shell. The mixer rotates anti-clockwise at 60 rpm for a period of 30seconds. Feed material enters the mixer through a 60 mm inclined port at the leftend. The feed rate is chosen to match the discharge rate at the other end so as toensure that the bed mass remains constant at 22 kg. The particles are spherical withdensity 2000 kg/m3 and have a size range of 2.–8.8 mm. This is a collision domin-ated particulate system and consequently, DEM is the ideal technique to predict theflow behaviour. The particles have a coefficient of restitution of 0.3 and a frictioncoefficient of 0.75. A spring stiffness of 5000 N/m is used.
Large Scale Simulation of Flows Using Particle Methods 91
Fig. 1 Mixing in a continuously fed peg mixer predicted using DEM
Figure 1 shows the progress of feed material (red) through the original bed ofparticles (blue). The feed material falls onto the rotating shaft and is distributed overthe bed near the feed opening. Particles are moved around by the axially migratingrecirculation zones set up by the peg movement. Direct interaction with the pegsgives the particles high velocities leading to strong local mixing, particularly close tothe surface of the bed where the impacts with the pegs can move individual particlesa significant distance. In Figure 1 the feed material dominates the first quarter of themixer with some particles having already passed the mid-point. The flow behaviouris quite different to the plug flow observed in a conventional drum mixer and theinterface between the blue and red particles is much less sharp in the mixer here. Theeffect of design choices for the agitator on axial transport and agglomerate break-upcan be assessed using DEM simulation. For more details on how to quantify mixingand for assessment of particulate mixing in many types of mixers using DEM [9].
Figure 2 shows the progress of the mixing and submergence of buoyant partic-ulates into a fluid in a 1 m diameter cylindrical tank. Here the modelling is per-formed using SPH with the particulates modelled as clusters of SPH particles hav-ing a pellet-like shape.The impeller is downward pumping and its motion sets upa swirl in the tank with a downward axial flow at the impeller shaft that leads to abulk recirculation within the tank. At 1.0 s, this downdraft begins to pull down thehighly buoyant pellets. By 1.5 s, the pellets have started to cluster near the centre ofthe tank. By 2 s (Figure 2a) the pellets are starting to be dragged down into the fluidwith the leading pellets reaching half way down the shaft. The recirculating flowpattern is fully established around 2.5 s and a significant proportion of the pelletshave been drawn down towards the impeller. By 3.0 s, (Figure 2b) pellets are flungoutwards by the impeller and are re-circulated within the fluid. Very good agree-ment is obtained with experiment for the distribution of solids, the critical speed for

92 P.W. Cleary et al.
Fig. 2 Mixing and submergence of buoyant particulates in a tank of water driven by a centralimpeller rotating at 200 rpm, after (a) 2 s and (b) 3 s
submergence and the rate of submergence. This demonstrates that SPH is a viablemethod for predicting mixing of particulate-fluid systems. For the detailed compar-ison to experiment [10].

Large Scale Simulation of Flows Using Particle Methods 93
Fig. 3 Separation by a double deck banana screen with 5 g peak acceleration. The particles arecoloured by size with red being coarse, green are the intermediate sizes and blue are the fines
2.2 Separation
Screens are often used for separation of particulates into different size fractions.They consist of one or more decks that are fitted with screen panels with arraysof square or rectangular holes. The screen is vibrated at high frequency to gener-ate peak accelerations of 3–10 g which separates particles flowing over the screenaccording to size.
Material passing through the first and second panels of the top deck leads to theformation of a dense bed on the bottom deck. The blue (fine) material falls fairlyquickly through the top deck bed so the visible particles are increasingly red toyellow in colour reflecting the ongoing removal of the fine material. The bed depthon the bottom deck increases along the screen as material falls from above and buildsup. The colour of the lower deck bed changes from blue to green/yellow over thethird and fourth panels again reflecting the removal of fines that fall through to thelower collection chute as an underflow stream. The contribution to the separationefficiency of each panel of each deck can be understood allowing the screen designand/or operating conditions to be optimized. For detailed analysis of the productsize distributions, evaluation of the contribution of each panel to the separation ofeach deck and wear and power consumption [11, 12].
94 P.W. Cleary et al.
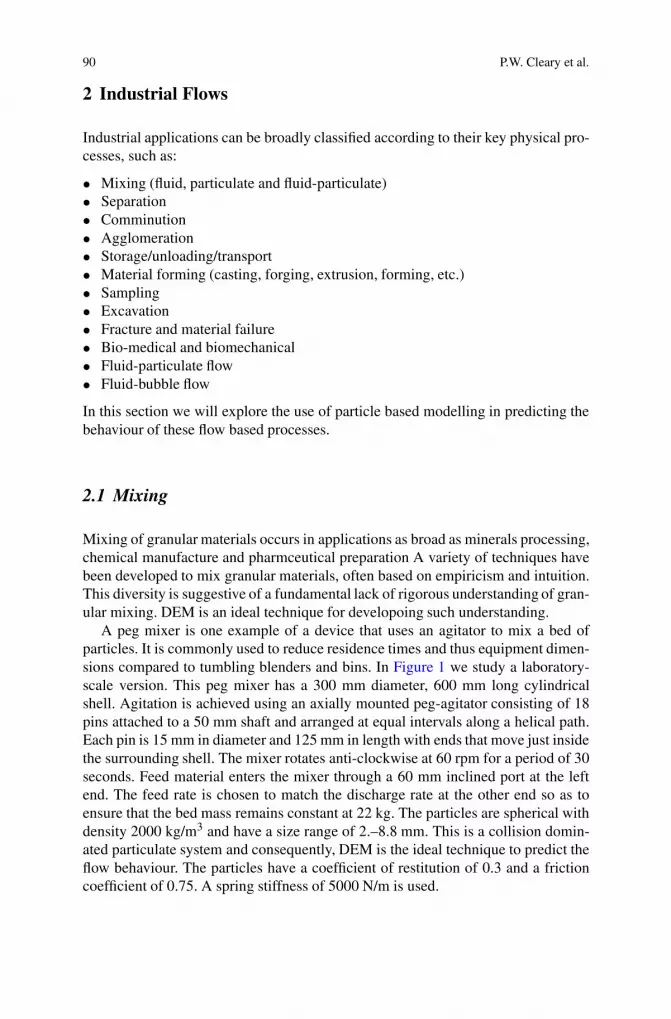
Fig. 4 Particle distribution in the cone crusher with particles coloured by size. The material isappreciably finer (blue) after passing the choke point of maximum constriction. The concave is thesectioned outer object and the mantle is the nutating conical object over which particles flow
2.3 Comminution
Comminution is the process of reducing the size of particles by breakage. It startswith large particles which are typically broken by one or more stages of crushing.The intermediate size particles produced are then fed to grinding mills that grind theparticles down to mm or micron size. DEM simulations of a crusher and a mill arepresented.
Figure 4 shows a DEM model of a cone crusher (around 0.6 m wide and 0.4 mhigh). The cone crusher is choke fed from above with medium size material (10–
Large Scale Simulation of Flows Using Particle Methods 95
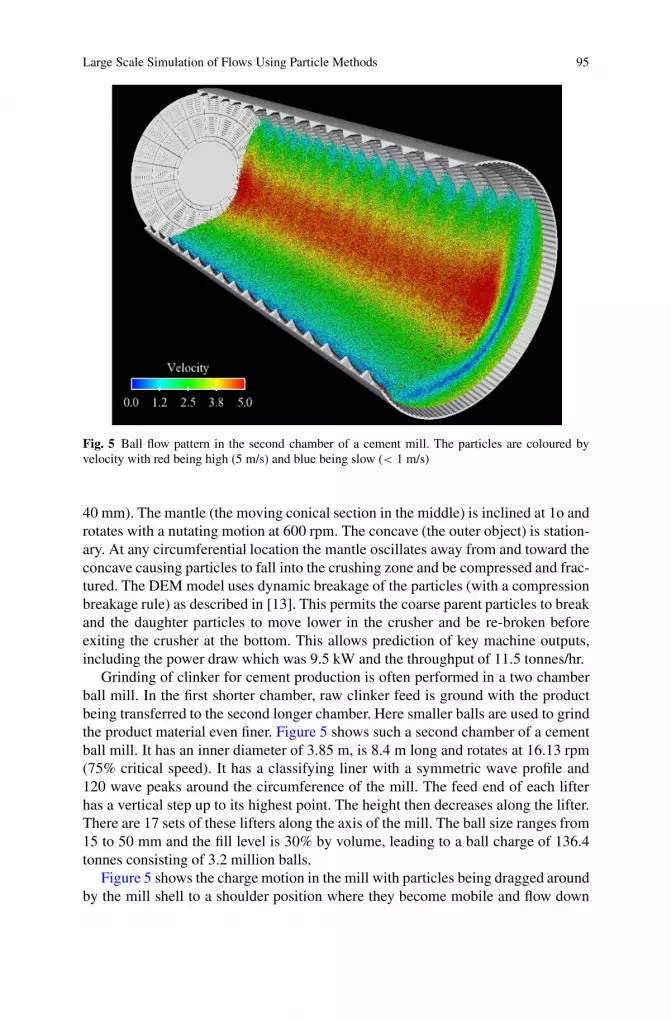
Fig. 5 Ball flow pattern in the second chamber of a cement mill. The particles are coloured byvelocity with red being high (5 m/s) and blue being slow (< 1 m/s)
40 mm). The mantle (the moving conical section in the middle) is inclined at 1o androtates with a nutating motion at 600 rpm. The concave (the outer object) is station-ary. At any circumferential location the mantle oscillates away from and toward theconcave causing particles to fall into the crushing zone and be compressed and frac-tured. The DEM model uses dynamic breakage of the particles (with a compressionbreakage rule) as described in [13]. This permits the coarse parent particles to breakand the daughter particles to move lower in the crusher and be re-broken beforeexiting the crusher at the bottom. This allows prediction of key machine outputs,including the power draw which was 9.5 kW and the throughput of 11.5 tonnes/hr.
Grinding of clinker for cement production is often performed in a two chamberball mill. In the first shorter chamber, raw clinker feed is ground with the productbeing transferred to the second longer chamber. Here smaller balls are used to grindthe product material even finer. Figure 5 shows such a second chamber of a cementball mill. It has an inner diameter of 3.85 m, is 8.4 m long and rotates at 16.13 rpm(75% critical speed). It has a classifying liner with a symmetric wave profile and120 wave peaks around the circumference of the mill. The feed end of each lifterhas a vertical step up to its highest point. The height then decreases along the lifter.There are 17 sets of these lifters along the axis of the mill. The ball size ranges from15 to 50 mm and the fill level is 30% by volume, leading to a ball charge of 136.4tonnes consisting of 3.2 million balls.
Figure 5 shows the charge motion in the mill with particles being dragged aroundby the mill shell to a shoulder position where they become mobile and flow down
96 P.W. Cleary et al.
as a cascading stream to the toe position. They are then re-captured by the linerand begin to circulate again. The free surface has the characteristic S shape. Theparticles move slowly near the shoulder and toe. As they flow down the surface theyaccelerate reaching peak speeds of 5 m/s in the steep central section. The particlesnear the mill shell are transported around with the mill rotation at speeds of closeto 3 m/s. There is a narrow band of dark blue connecting the shoulder and toe. Thismaterial is very slow moving. Between the slow moving semi-circular blue band andthe mill shell is a region of strong shear. Similarly, there is high shear between theslow moving layer and the high speed cascading flow above. Fine clinker particlesare systematically trapped and crushed between the balls as they pass each other inthese separate sliding layers.
2.4 Material Forming
SPH has been demonstrated to be a very effective method for predicting complexfluid flow in the High Pressure Die Casting (HPDC) process [14, 15]. Here we showthe casting of an automatic differential cover. This component has a very complexthree dimensional shape. The base plate is about 250 mm × 250 mm square inarea. A thin-walled dome-like structure rises from the base plate and has an averagesection thickness of about 6.5 mm. Two cylindrical bosses blend into the domeand several bolt plates are raised from the surface to allow structural attachment tothe car. Liquid aluminium is injected into the die cavity through the curved gatesattached to one side of the base plate. The gates are are fed from a runner systemattached to the shot sleeve. The liquid metal in the shot sleeve is pressurised bya plunger that forces the metal out into the runner system, through the gate andinto the part. In this simulation an SPH particle size of 0.75 mm is used. When thecavity is completely filled, the total number of particles is about 900,000. The liquidaluminium viscosity used is 0.01 Pa s and the density is 2700 kg/m3.
Figure 6 shows the filling pattern at 40 ms. Fluid initially enters the die at 10 ms,forming two broad jets at diverging 45◦ angles, partially fragmenting to spray acrossthe cavity. In regions of die curvature, the wall drag causes the fluid to slow and thefollowing fluid catches up leading to the formation of moderately coherent streamswith fragmented boundaries. By 40 ms (Figure 6), almost the entire half of thedie on the far side of the gate is filled and the detailed topographic structures arebecoming clear. There is a strong back flow along the sides and along the base platetowards the gates. The dominant void regions are now just the areas on either sideof the incoming streams from the gate, with some residual voids present on the top,behind the horizontal boss, and on the sides of the vertical boss. All the exit ventsthat are attached to the base plate are now blocked and all the remaining air in thedie (represented here as the void regions) is trapped, leading to porosity formation.By 50 ms, there has been significant back filling as fluid flows back from the farside of the die to fill upcavities in the leading half of the die. Filling is completeafter 60 ms with the last areas to fill being adjacent to the gates.

Large Scale Simulation of Flows Using Particle Methods 97
Fig. 6 Filling of a differential cover with the molten aluminium. The fluid is coloured by speedwith blue being slow and red being fast
SPH is also well suited to simulating mechanical forming processes such as for-ging and extrusion due to its ability to model complex free surface behaviour, itsability to tolerate high levels of deformation and its history tracking capability. Herewe show an SPH prediction of cold extrusion of aluminium alloy A6061 through asimple orifice. The initial billet dimension is 50 × 50 mm and the ratio of the ex-truded product width to the billet width is 1:2. A punch speed of 25 m/min is usedfor the simulation. An SPH particle separation of 1 mm is used giving a total ofaround 2,700 particles.
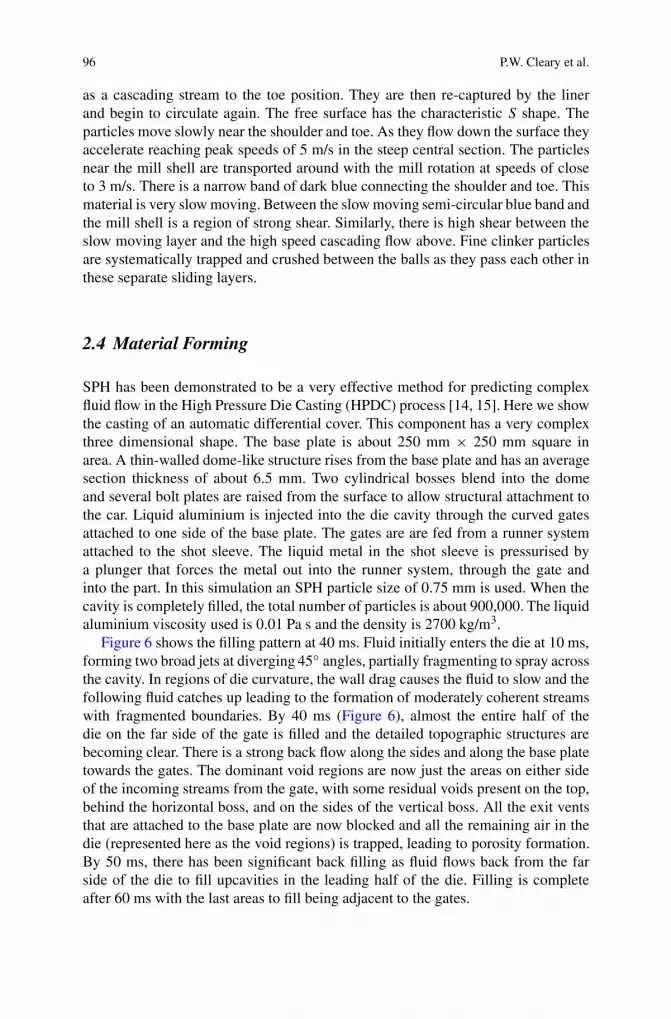
Figure 7 shows the progress of the billet being extruded. On the left material iscoloured in vertical strata according to the initial material position so we can trackinternal deformation. On the right, the particles are coloured by their plastic strain.Once the billet corners contact the converging walls of the die, the metal quicklybecomes elastically loaded and begins to undergo plastic deformation. By 20 ms,the leading edge of the billet has reached the end of the convergent section and mildplastic strains of up to 50% are found in these regions. By 60 ms, the leading edgeemerges from the die. High strains of around 200% are observed in the regions justadjacent to the die walls. The distribution of plastic strain is fairly uniform along thelength of the extruded rod but has significant variation across the width. The strongpredisposition of the metal in the middle of the billet to flow preferentially along thecentreline of the die is easily observed due to the frictional resistance of the walls.For more details about the application of SPH to solids forming processes [16].
98 P.W. Cleary et al.
Fig. 7 Cold extrusion of aluminium using an elastoplastic SPH model. The particles are coloured(left) in four bands based on their initial position to show the deformation pattern and (right) byplastic strain with red being 1.8 and dark blue corresponding to 0.0
2.5 Bubbly and Reacting Multiphase Flows
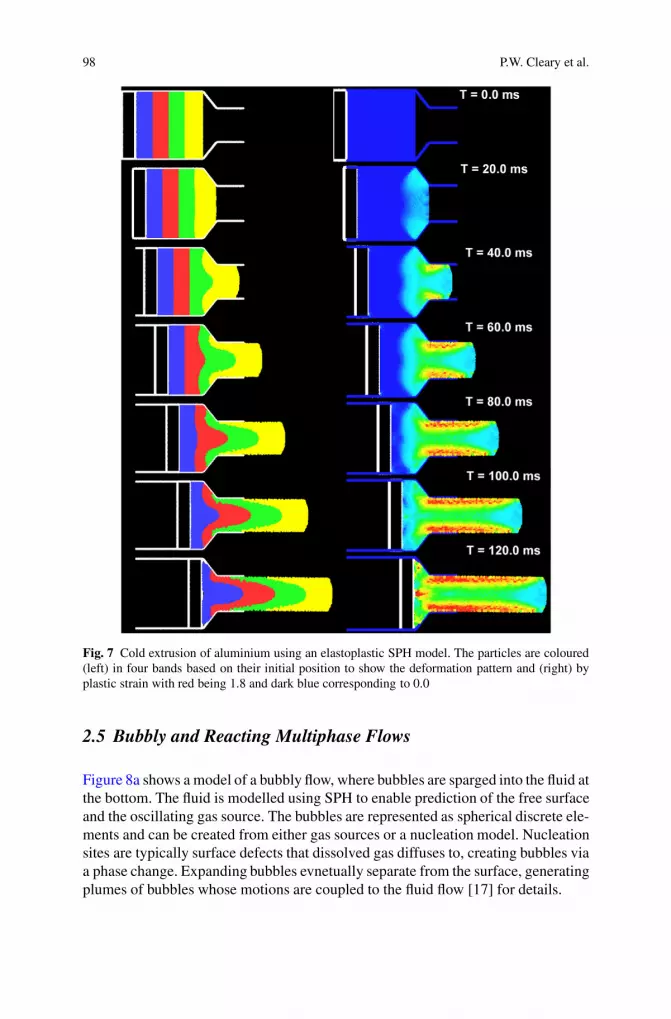
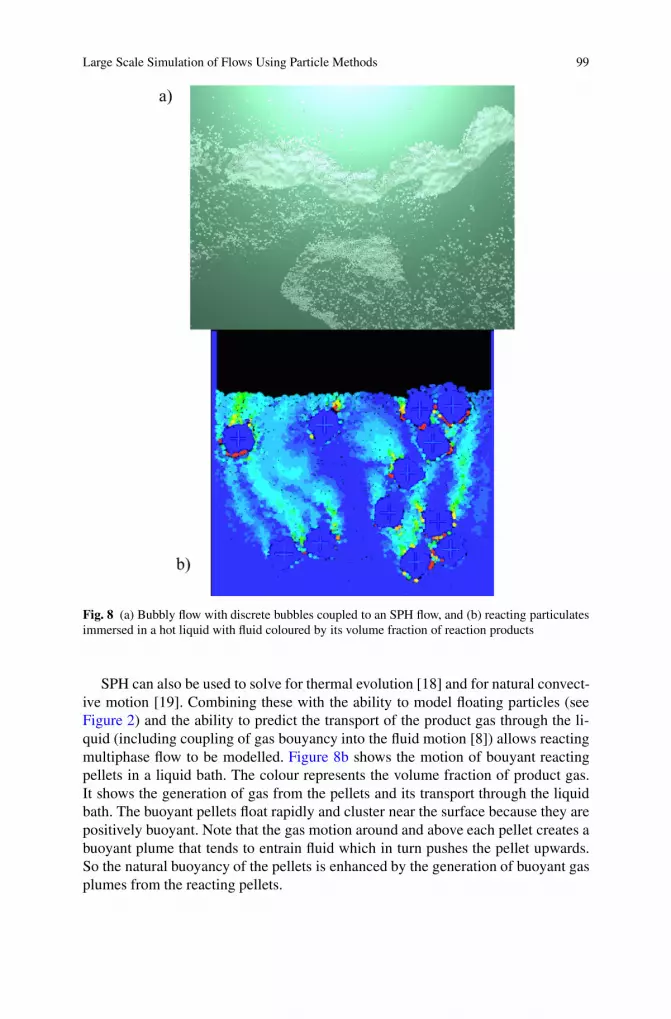
Figure 8a shows a model of a bubbly flow, where bubbles are sparged into the fluid atthe bottom. The fluid is modelled using SPH to enable prediction of the free surfaceand the oscillating gas source. The bubbles are represented as spherical discrete ele-ments and can be created from either gas sources or a nucleation model. Nucleationsites are typically surface defects that dissolved gas diffuses to, creating bubbles viaa phase change. Expanding bubbles evnetually separate from the surface, generatingplumes of bubbles whose motions are coupled to the fluid flow [17] for details.
Large Scale Simulation of Flows Using Particle Methods 99
Fig. 8 (a) Bubbly flow with discrete bubbles coupled to an SPH flow, and (b) reacting particulatesimmersed in a hot liquid with fluid coloured by its volume fraction of reaction products
SPH can also be used to solve for thermal evolution [18] and for natural convect-ive motion [19]. Combining these with the ability to model floating particles (seeFigure 2) and the ability to predict the transport of the product gas through the li-quid (including coupling of gas bouyancy into the fluid motion [8]) allows reactingmultiphase flow to be modelled. Figure 8b shows the motion of bouyant reactingpellets in a liquid bath. The colour represents the volume fraction of product gas.It shows the generation of gas from the pellets and its transport through the liquidbath. The buoyant pellets float rapidly and cluster near the surface because they arepositively buoyant. Note that the gas motion around and above each pellet creates abuoyant plume that tends to entrain fluid which in turn pushes the pellet upwards.So the natural buoyancy of the pellets is enhanced by the generation of buoyant gasplumes from the reacting pellets.
100 P.W. Cleary et al.
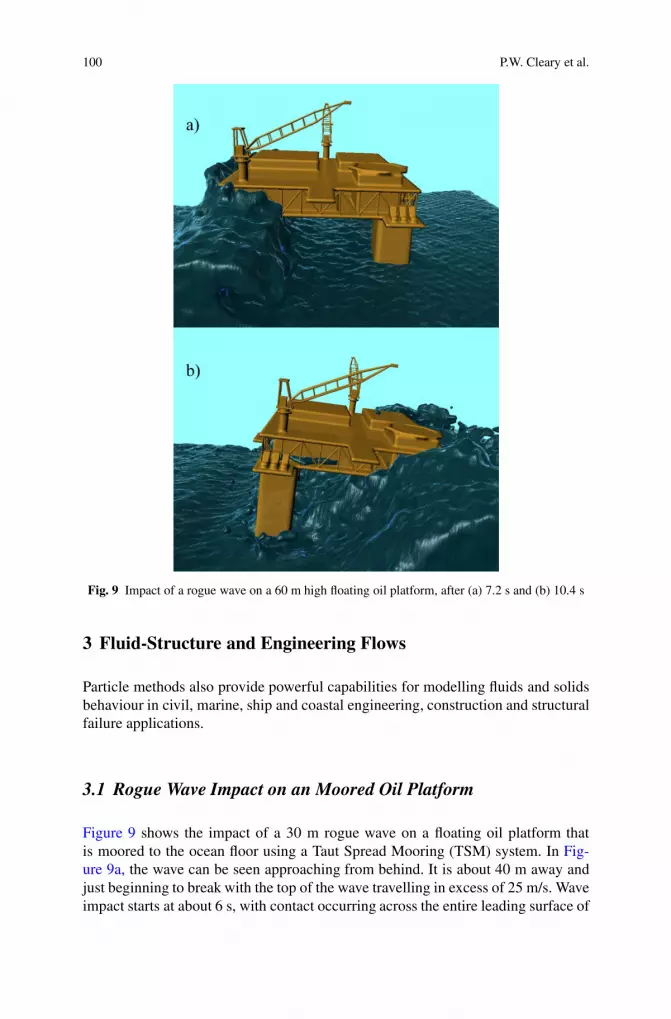
Fig. 9 Impact of a rogue wave on a 60 m high floating oil platform, after (a) 7.2 s and (b) 10.4 s
3 Fluid-Structure and Engineering Flows
Particle methods also provide powerful capabilities for modelling fluids and solidsbehaviour in civil, marine, ship and coastal engineering, construction and structuralfailure applications.
3.1 Rogue Wave Impact on an Moored Oil Platform
Figure 9 shows the impact of a 30 m rogue wave on a floating oil platform thatis moored to the ocean floor using a Taut Spread Mooring (TSM) system. In Fig-ure 9a, the wave can be seen approaching from behind. It is about 40 m away andjust beginning to break with the top of the wave travelling in excess of 25 m/s. Waveimpact starts at about 6 s, with contact occurring across the entire leading surface of

Large Scale Simulation of Flows Using Particle Methods 101
the platform. The top of the wave is just below the top deck. The extreme pressureof the water pushes the platform to the right (termed surge) and tilts it sharply clock-wise (termed pitch). Figure 9b shows the platform at 10.4 s when the rogue wavehas just passed the back of the platform. The surge at 15 m and the pitch of 8o arenow substantial. Water splashing over the super-structure inundates much of the topof the platform. Over the next few seconds the platform starts to straighten with thepitch halving. The maximum surge has passed and the platform starts to move backto the left. The rogue wave has passed then beyond the platform, but the equallydangerous following trough is now directly under the platform. For more details ofthe recovery process and the comparative performance to other rigging systems andthe effect of large conventional waves [20].
3.2 Ship Slamming and Green Water–Ship Interaction
The ability to easily couple free surface fluid motion to the dynamic response ofobjects subject to fluid forces is an attractive feature of the SPH technique. One im-portant application is in the area of marine hydrodynamics where a range of differentphysical phenomena need to be captured. Two of these are known as “slamming”and “green water on deck” (see Figure 10).
Slamming occurs when the combination of swell position and pitch of the vesselcauses the bow (or stern) to rise completely above the sea surface. As the pitch andswell change, the bow (or stern) can slam down onto the sea surface, giving rise tohigh pressures and structural loads that can damage the vessel structure. Green wa-ter on deck occurs in similar conditions to slamming and is caused when the pitch ofthe vessel causes the next wave to wash over its bow. This water is not in the formof spray or foam, instead being a large coherent volume of water, hence the term“green water”. The volume and speed of the water mean that significant danger tocrew arises and damage can be done to the deck, the superstructure and infrastruc-ture such as lifeboats. Green water can also take a long time to drain from the deck,temporarily increasing the weight and behaviour of the vessel and decreasing man-oeuvrability.
3.3 Spillway Flow and Dam Discharge
Spillways are structures used for the controlled release of water from a dam or leveeinto a downstream area, typically the river that was dammed. Spillways release floodwaters so that the water does not overtop and damage, or even destroy, the dam. Asflow through a spillway involves complex free surface behaviour SPH is a veryattractive method for such modelling. Figure 11 shows flow into a spillway fromfour open gates using approximately 500,000 fluid particles with a resolution of25 mm. Figure 11a shows the initial release as the front just leaves the spillway

102 P.W. Cleary et al.
Fig. 10 SPH simulation of a Ticonderoga-class cruiser travelling at 20 knots in a 6 m swell. In(a) the bow of the ship is completely above the sea surface and is about to “slam” down onto it. In(b) the bow has dipped significantly after the slamming event and has dug into the next wave in theswell, leading to green water washing over the deck
structure. The steady state flow is reached after 2.5 min of the opening of the gatesand is shown in Figure 11b.
3.4 Dam Wall Collapse under Earthquake Loading
Dam failures are catastrophic and create significant economic loss and loss of hu-man life. A common cause of failure is the cracking that results from seismic load,uneven settling of foundations, and thermal and residual stresses. Fracture of theKoyna dam subjected to earthquake-type motion is modelled using an elastic brittleSPH formulation [21], and the fracture pattern is shown in Figure 12.

Large Scale Simulation of Flows Using Particle Methods 103
Fig. 11 Discharge of water from a dam and flow down the spillway
Fig. 12 Fracture pattern of the dam subjected to base motion in the horizontal and vertical direc-tions (coloured by damage with blue being no damage and red being fully fractured)
104 P.W. Cleary et al.
The base of the dam is subjected to fluctuating loads in the horizontal and ver-tical directions to simulate the ground motion during an earthquake. The cracksoriginate normal to the wall surface, because the tangential stress is approximatelyequal to the maximum principal stress near the free surface. As the cracks propag-ate towards the interior, they branch one or more times to produce pairs of cracks ineach branch. These new cracks propagate towards the surfaces of the dam structurebecause this provides the path of least resistance to fracture. During the periodicdynamic loads, the interaction of the impinging stress waves with the rarefactioncompression waves reflected from the free surfaces slows the normal propagation ofcracks. So as the crack front approaches the free surface it decelerates causing bend-ing of the advancing crack front. This is observed for the uppermost crack on theleft face and the lowermost crack on the right face in Figure 12b. This phenomenonis known as ‘crack arrest’. The patterns are qualitatively similar to those observedin practice [22].
3.5 Fracture of a Structural Column during Projectile Impact
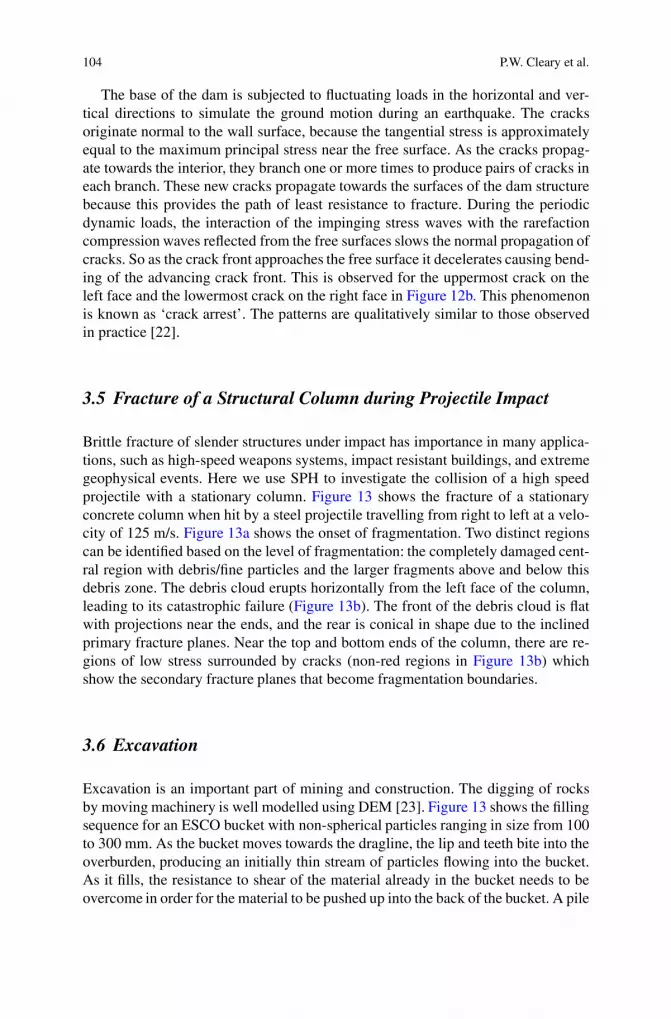
Brittle fracture of slender structures under impact has importance in many applica-tions, such as high-speed weapons systems, impact resistant buildings, and extremegeophysical events. Here we use SPH to investigate the collision of a high speedprojectile with a stationary column. Figure 13 shows the fracture of a stationaryconcrete column when hit by a steel projectile travelling from right to left at a velo-city of 125 m/s. Figure 13a shows the onset of fragmentation. Two distinct regionscan be identified based on the level of fragmentation: the completely damaged cent-ral region with debris/fine particles and the larger fragments above and below thisdebris zone. The debris cloud erupts horizontally from the left face of the column,leading to its catastrophic failure (Figure 13b). The front of the debris cloud is flatwith projections near the ends, and the rear is conical in shape due to the inclinedprimary fracture planes. Near the top and bottom ends of the column, there are re-gions of low stress surrounded by cracks (non-red regions in Figure 13b) whichshow the secondary fracture planes that become fragmentation boundaries.
3.6 Excavation
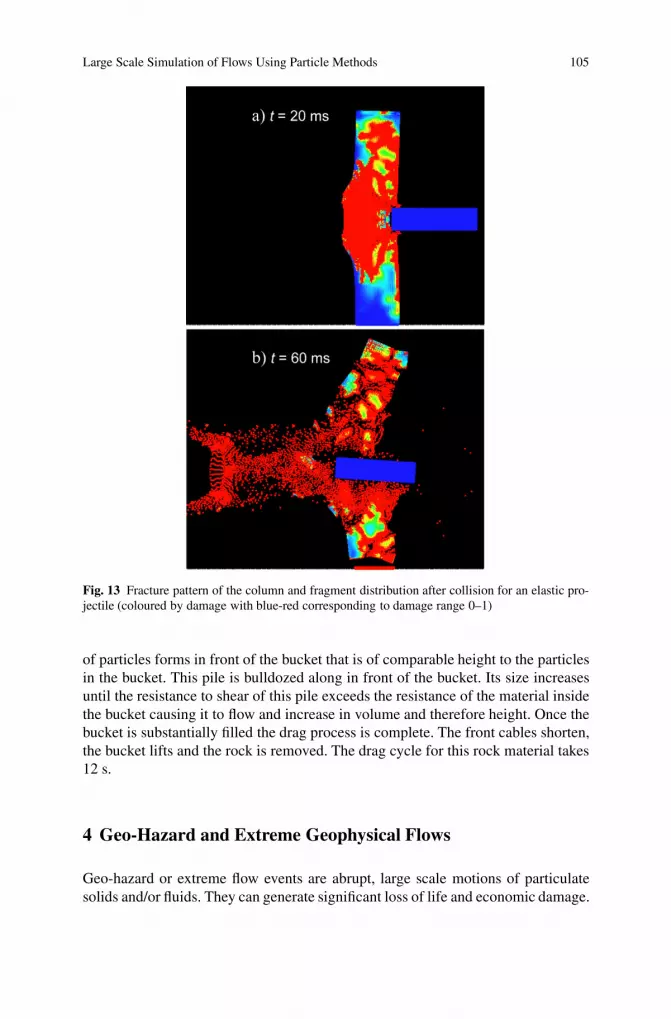
Excavation is an important part of mining and construction. The digging of rocksby moving machinery is well modelled using DEM [23]. Figure 13 shows the fillingsequence for an ESCO bucket with non-spherical particles ranging in size from 100to 300 mm. As the bucket moves towards the dragline, the lip and teeth bite into theoverburden, producing an initially thin stream of particles flowing into the bucket.As it fills, the resistance to shear of the material already in the bucket needs to beovercome in order for the material to be pushed up into the back of the bucket. A pile
Large Scale Simulation of Flows Using Particle Methods 105
Fig. 13 Fracture pattern of the column and fragment distribution after collision for an elastic pro-jectile (coloured by damage with blue-red corresponding to damage range 0–1)
of particles forms in front of the bucket that is of comparable height to the particlesin the bucket. This pile is bulldozed along in front of the bucket. Its size increasesuntil the resistance to shear of this pile exceeds the resistance of the material insidethe bucket causing it to flow and increase in volume and therefore height. Once thebucket is substantially filled the drag process is complete. The front cables shorten,the bucket lifts and the rock is removed. The drag cycle for this rock material takes12 s.
4 Geo-Hazard and Extreme Geophysical Flows
Geo-hazard or extreme flow events are abrupt, large scale motions of particulatesolids and/or fluids. They can generate significant loss of life and economic damage.
106 P.W. Cleary et al.
Fig. 14 Progress in the filling and lifting of an ESCO dragline bucket for a non-spherical rockoverburden with a 100 mm bottom particle size
They include landslides, debris flows, flooding induced by extreme rain and damcollapse, storm surge, tsunamis, pyroclastic flows and volcanic lava flows. Compu-tational modelling of extreme rock and fluid flow events, such as landslides and damcollapses, can provide increased understanding of their post-initiation course. Thiscan provide valuable insight into opportunities for designing mitigation strategiesand to enable more informed management of such disaster scenarios. For the pre-diction of fluid based geo-hazards such as dam breaks SPH is ideally suited to pre-dicting the resulting complex, highly three dimensional, free surface flows. Theseflows involve splashing, fragmentation, and interaction with complex topographyand engineering structures [24]. For landslides, which are collision dominated flowsof rocks, DEM provides an ideal method for prediction [5, 6, 24–26].
Large Scale Simulation of Flows Using Particle Methods 107
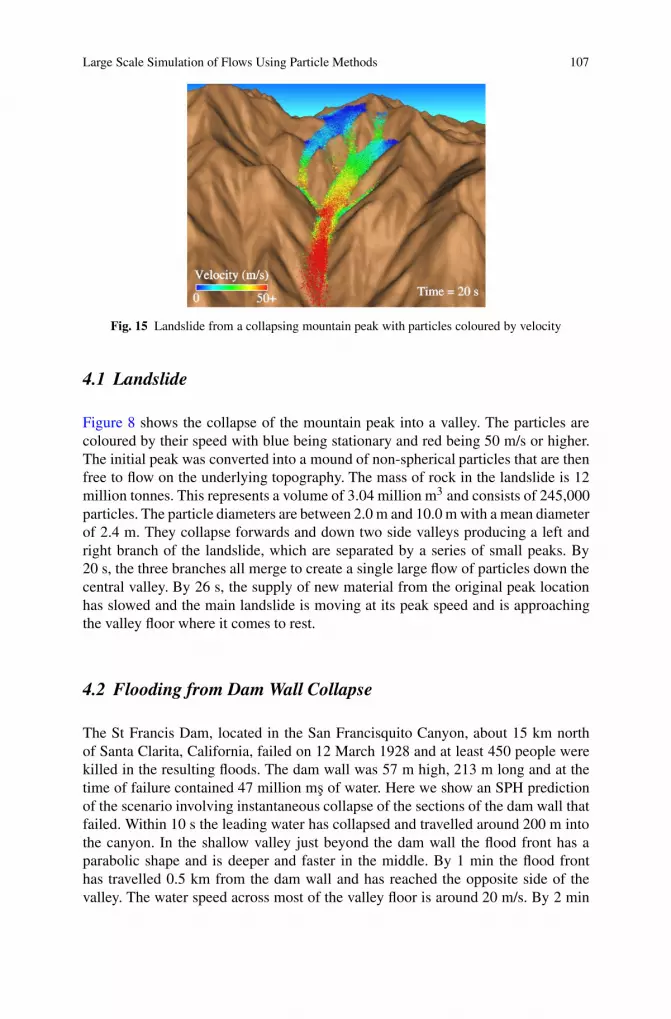
Fig. 15 Landslide from a collapsing mountain peak with particles coloured by velocity
4.1 Landslide
Figure 8 shows the collapse of the mountain peak into a valley. The particles arecoloured by their speed with blue being stationary and red being 50 m/s or higher.The initial peak was converted into a mound of non-spherical particles that are thenfree to flow on the underlying topography. The mass of rock in the landslide is 12million tonnes. This represents a volume of 3.04 million m3 and consists of 245,000particles. The particle diameters are between 2.0 m and 10.0 m with a mean diameterof 2.4 m. They collapse forwards and down two side valleys producing a left andright branch of the landslide, which are separated by a series of small peaks. By20 s, the three branches all merge to create a single large flow of particles down thecentral valley. By 26 s, the supply of new material from the original peak locationhas slowed and the main landslide is moving at its peak speed and is approachingthe valley floor where it comes to rest.
4.2 Flooding from Dam Wall Collapse
The St Francis Dam, located in the San Francisquito Canyon, about 15 km northof Santa Clarita, California, failed on 12 March 1928 and at least 450 people werekilled in the resulting floods. The dam wall was 57 m high, 213 m long and at thetime of failure contained 47 million ms of water. Here we show an SPH predictionof the scenario involving instantaneous collapse of the sections of the dam wall thatfailed. Within 10 s the leading water has collapsed and travelled around 200 m intothe canyon. In the shallow valley just beyond the dam wall the flood front has aparabolic shape and is deeper and faster in the middle. By 1 min the flood fronthas travelled 0.5 km from the dam wall and has reached the opposite side of thevalley. The water speed across most of the valley floor is around 20 m/s. By 2 min
108 P.W. Cleary et al.
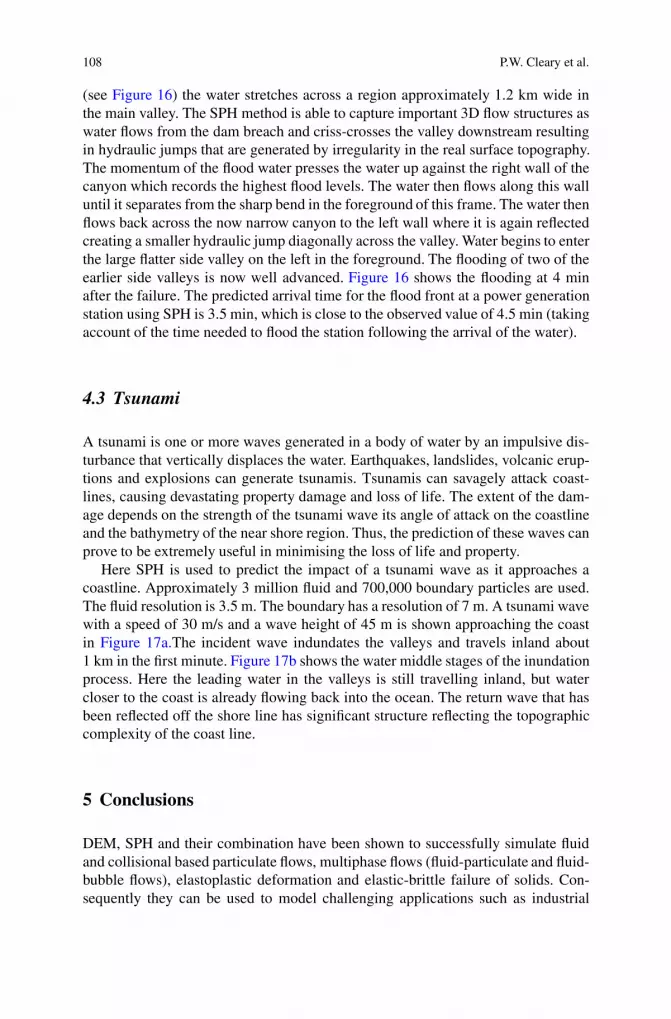
(see Figure 16) the water stretches across a region approximately 1.2 km wide inthe main valley. The SPH method is able to capture important 3D flow structures aswater flows from the dam breach and criss-crosses the valley downstream resultingin hydraulic jumps that are generated by irregularity in the real surface topography.The momentum of the flood water presses the water up against the right wall of thecanyon which records the highest flood levels. The water then flows along this walluntil it separates from the sharp bend in the foreground of this frame. The water thenflows back across the now narrow canyon to the left wall where it is again reflectedcreating a smaller hydraulic jump diagonally across the valley. Water begins to enterthe large flatter side valley on the left in the foreground. The flooding of two of theearlier side valleys is now well advanced. Figure 16 shows the flooding at 4 minafter the failure. The predicted arrival time for the flood front at a power generationstation using SPH is 3.5 min, which is close to the observed value of 4.5 min (takingaccount of the time needed to flood the station following the arrival of the water).
4.3 Tsunami
A tsunami is one or more waves generated in a body of water by an impulsive dis-turbance that vertically displaces the water. Earthquakes, landslides, volcanic erup-tions and explosions can generate tsunamis. Tsunamis can savagely attack coast-lines, causing devastating property damage and loss of life. The extent of the dam-age depends on the strength of the tsunami wave its angle of attack on the coastlineand the bathymetry of the near shore region. Thus, the prediction of these waves canprove to be extremely useful in minimising the loss of life and property.
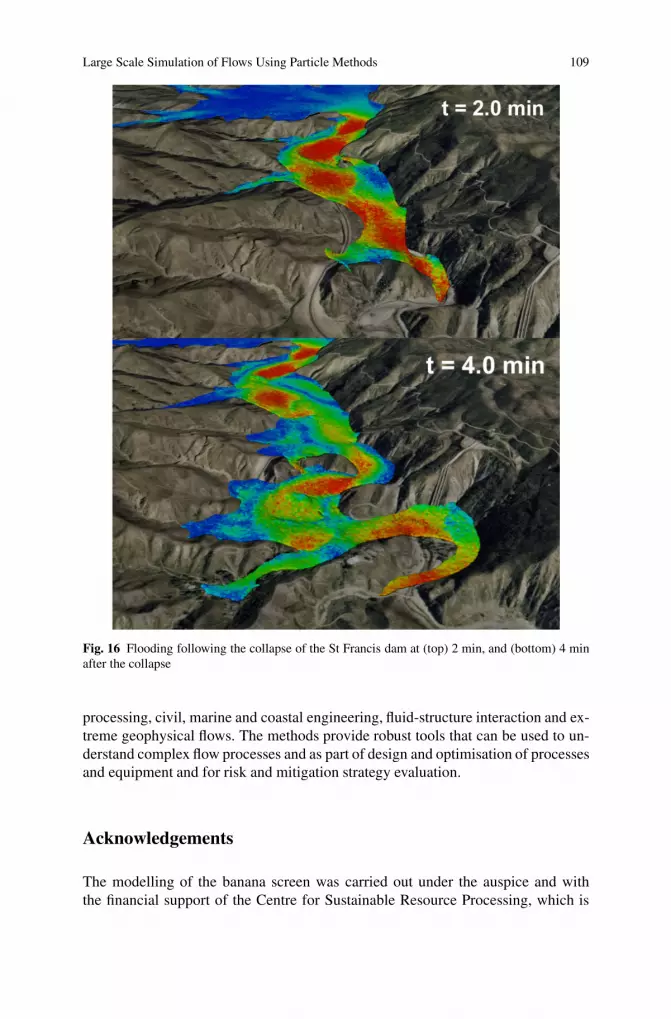
Here SPH is used to predict the impact of a tsunami wave as it approaches acoastline. Approximately 3 million fluid and 700,000 boundary particles are used.The fluid resolution is 3.5 m. The boundary has a resolution of 7 m. A tsunami wavewith a speed of 30 m/s and a wave height of 45 m is shown approaching the coastin Figure 17a.The incident wave indundates the valleys and travels inland about1 km in the first minute. Figure 17b shows the water middle stages of the inundationprocess. Here the leading water in the valleys is still travelling inland, but watercloser to the coast is already flowing back into the ocean. The return wave that hasbeen reflected off the shore line has significant structure reflecting the topographiccomplexity of the coast line.
5 Conclusions
DEM, SPH and their combination have been shown to successfully simulate fluidand collisional based particulate flows, multiphase flows (fluid-particulate and fluid-bubble flows), elastoplastic deformation and elastic-brittle failure of solids. Con-sequently they can be used to model challenging applications such as industrial
Large Scale Simulation of Flows Using Particle Methods 109
Fig. 16 Flooding following the collapse of the St Francis dam at (top) 2 min, and (bottom) 4 minafter the collapse
processing, civil, marine and coastal engineering, fluid-structure interaction and ex-treme geophysical flows. The methods provide robust tools that can be used to un-derstand complex flow processes and as part of design and optimisation of processesand equipment and for risk and mitigation strategy evaluation.
Acknowledgements
The modelling of the banana screen was carried out under the auspice and withthe financial support of the Centre for Sustainable Resource Processing, which is
110 P.W. Cleary et al.
Fig. 17 Incoming linear tsunami wave (top) and aftermath one minute later (bottom) with retreat-ing waves and inundation of valleys and low lying areas. Fluid is coloured by speed with red beinghigh (30 m/s) and dark blue being stationary
established and supported under the Australian Government’s Cooperative ResearchCentres Program.
The authors wish to thank their collaborators at ETRI (South Korea) for theircontribution to the SPH-DEM bubble modelling.
References
1. Cundall, P.A., Strack, O.D.L., A discrete numerical model for granular assemblies. Geotech-nique, 29:47–65, 1979.
2. Walton, O.R., Numerical simulation of inelastic frictional particle-particle interaction(Chapter 25). In: Particulate Two-phase Flow, M.C. Roco (ed.), pp. 884–911, 1994.
3. Campbell, C.S., Rapid granular flows. Annual Review of Fluid Mechanics 22:57–92, 1990.4. Haff, P.K., Werner, B.T., Powder Technology 48:239, 1986.5. Cleary, P.W., Large scale industrial DEM modelling. Engineering Computations 21:169–204,
2004.6. Cleary, P.W., Industrial particle flow modelling using DEM. Engineering Computations
26:698–743, 2009.

Large Scale Simulation of Flows Using Particle Methods 111
7. Monaghan, J.J., Simulating free surface flows with SPH. Journal of Computational Physics110:399–406, 1994.
8. Cleary, P.W., Prakash, M., Ha, J., Stokes, N., Scott, C., Smooth particle hydrodynamics: Statusand future potential. Progress in Computational Fluid Dynamics 7:70–90, 2007.
9. Cleary, P.W., Sinnott, M.D., Assessing mixing characteristics of particle mixing and granula-tion devices. Particuology 6:419–444, 2008.
10. Prakash, M., Cleary, P.W., Noui-Mehidi, M.N., Blackburn, H., Brooks, G., Simulation of sus-pension of solids in a liquid in a mixing tank using SPH and comparison with physical mod-eling experiments. Progress in Computational Fluid Dynamics 7:91–100, 2007.
11. Cleary, P.W., Sinnott, M.D., Morrison, R.D., Separation performance of double deck ba-nana screens – Part 1: Flow and separation for different accelerations. Minerals Engineering22:1218–1229, 2009.
12. Cleary, P.W., Sinnott, M.D., Morrison, R.D., Separation performance of double deck bananascreens – Part 2: Quantitative predictions. Minerals Engineering 22:1230–1244, 2009.
13. Cleary, P.W., Recent advances in DEM modelling of tumbling mills. Minerals Engineering14:1295–1319, 2001.
14. Cleary, P.W., Ha, J., Ahuja, V., High pressure die casting simulation using smoothed particlehydrodynamics. International Journal on Cast Metals Research 12:335–355, 2000.
15. Cleary, P.W., Ha, J., Prakash, M., Nguyen, T., 3D SPH flow predictions and validation for highpressure die casting of automotive components. Applied Mathematical Modelling 30:1406–1427, 2004.
16. Cleary, P.W., Prakash, M., Ha, J., Novel applications of SPH in metal forming. Journal ofMaterials Processing Technology 177:41–48, 2006.
17. Cleary, P.W., Pyo, S.H., Prakash, M., Koo, B.K., Bubbling and frothing liquids. ACM Trans-action on Graphics 26, Article No. 97, 2007.
18. Cleary, P.W., Monaghan, J.J., Conduction modelling using smoothed particle hydrodynamics.Journal of Computational Physics 148:227–264, 1999.
19. Cleary, P.W., Modelling confined multi-material heat and mass flows using SPH. AppliedMathematical Modelling, 22:981–993, 1998.
20. Cleary, P.W., Rudman, M., Extreme wave interaction with a floating oil rig: Prediction usingSPH. Proc. CFD 9:332–344, 2009.
21. Das, R., Cleary, P.W., Effect of rock shapes on brittle fracture using smoothed particle hydro-dynamics. Theoretical and Applied Fracture Mechanics 53:47–60, 2010.
22. Lee, O.S., Kim, D.Y., Crack-arrest phenomenon of an aluminum alloy. Mechanics ResearchCommunications 26:575–581, 1999.
23. Cleary, P.W., The filling of dragline buckets. Mathematical Engineering in Industry 7:1–24,1998.
24. Cleary, P.W., Prakash, M., Smooth particle hydrodynamics and discrete element modelling:Potential in the environmental sciences. Philosophical Transactions of the Royal Society ofLondon A 362:2003–2030, 2004.
25. Cleary, P.W., Campbell, C.S., Self-lubrication for long run-out landslides: Examination bycomputer simulation. Journal of Geophysical Research 98(B12):21911–21924, 1993.
26. Campbell, C.S., Cleary, P.W., Hopkins, M.A., Large scale landslide simulations: Global de-formation, velocities and basal friction. Journal of Geophysical Research 100(B5):8267–8283,1995.