land use optimization for - citeseerx
TRANSCRIPT
i
LAND USE OPTIMIZATION FOR IMPROVED TRANSPORTATION SYSTEM PERFORMANCE
CASE STUDY: ANKARA
A THESIS SUBMITTED TO THE GRADUATE SCHOOL OF NATURAL AND APPLIED SCIENCES
OF MIDDLE EAST TECHNICAL UNIVERSITY
BY
BERNA ALAYLI
IN PARTIAL FULFILLMENT OF THE REQUIREMENTS FOR
THE DEGREE OF MASTER OF SCIENCE IN
CIVIL ENGINEERING
DECEMBER 2006
ii
Approval of the Graduate School of Natural and Applied Sciences
Prof. Dr. Canan Özgen
Director I certify that this thesis satisfies all the requirements as a thesis for the degree of Master of Science.
Prof. Dr. Erdal Çokca Head of Department
This is to certify that we have read this thesis and that in our opinion it is fully adequate, in scope and quality, as a thesis for the degree of Master of Science.
Prof. Dr. Ayhan İnal
Supervisor
Examining Committee Members
Prof. Dr. Özdemir Akyılmaz (METU, CE)
Prof. Dr. Ayhan İnal (METU, CE)
Asst. Dr. Murat Güler (METU, CE)
Asst. Dr. Hikmet Bayırtepe (Gazi University, CE)
Inst. Dr. Osman Acar (METU,CE)
iii
I hereby declare that all information in this document has been obtained and presented in accordance with academic rules and ethical conduct. I also declare that, as required by these rules and conduct, I have fully cited and referenced all material and results that are not original to this work.
Name, Last Name: Berna ALAYLI
Signature :
iv
ABSTRACT
LAND USE OPTIMIZATION FOR
IMPROVED TRANSPORTATION SYSTEM PERFORMANCE
CASE STUDY: ANKARA
ALAYLI, Berna
M.S., Department of Civil Engineering
Supervisor: Prof. Dr. Ayhan İNAL
December 2006, 212 pages
This thesis investigates the effects of urban land use on transportation system
performance in terms of various land use factors such as density, mixed or single
land use, jobs-housing balance, street patterns, transit accessibility. Reviewed
studies show that urban land use has considerable effects on transportation system
performance measures which are average travel distances per person, level of
service, air quality, gasoline consumption etc. Based on the obtained results, it is
concluded that one of the basic reasons behind increasing auto dependency and
outcoming problems in recent years is lack of coordination between land use and
transportation system.
The obtained results are used to analyze land use impacts on transportation system
of Ankara. Urban transportation planning decisions, deficiencies in implementation
and resulted problems are discussed in terms of land use and transportation
interaction. Possible land use regulations which can contribute to relieve
transportation problems of Ankara are proposed.
Keywords: Urban transportation, land use, automobile dependency, transit, Ankara.
v
ÖZ
İYİLEŞTİRİLMİŞ ULAŞTIRMA SİSTEMİ PERFORMANSI İÇİN
ARAZİ KULLANIMI OPTİMİZASYONU
ANKARA ÖRNEĞİ
ALAYLI, Berna
Yüksek Lisans, İnşaat Mühendisliği Bölümü
Tez Yöneticisi: Prof. Dr. Ayhan İNAL
Aralık 2006, 212 sayfa
Bu tez kentsel arazi kullanımının, ulaştırma sistemi performansı üzerindeki etkilerini;
nüfus yoğunluğu, heterojen yada tek yönlü arazi kullanımı, konut-iş dengesi, sokak
desenleri, toplu taşıma uygunluk gibi çeşitli arazi kullanımı faktörleri açısından
incelemektedir. İncelenen çalışmalar, kentsel arazi kullanımının; kişi başına
ortalama yolculuk mesafeleri, servis seviyesi, hava kalitesi ve enerji tüketimi gibi
ulaştırma sistemi performans faktörleri üzerine önemli etkileri olduğunu ortaya
koymuştur. Bu sonuçlara dayanarak, son yıllarda artan özel otomobile bağımlı
kentsel gelişmeler ve beraberinde getirdiği sorunların altında yatan temel
nedenlerden birinin, arazi kullanımı ve ulaşım sistemi arasındaki koordinasyon
eksikliği olduğu sonucuna varılmıştır.
Elde edilen çıkarımlar ışığında; Ankara kentinde arazi kullanımının ulaşım sistemi
üzerine etkileri değerlendirilmiştir. Ulaşım planlama kararları, uygulamadaki
aksaklıklar ve beraberinde getirdiği sorunlar, arazi kullanımı ve ulaşım etkileşmi
açısından tartışılmıştır. Ankara’nın ulaşım sorunlarının aşılabilmesini sağlayabilecek
olası arazi kullanım düzenlemeleri önerilmiştir.
Anahtar Kelimeler: Kentiçi ulaşım, arazi kullanımı, otomobil bağımlılığı, toplutaşım,
Ankara.

vi
To My Family
vii
ACKNOWLEDGMENTS
I would like to express my sincere appreciation to my supervisor,
Prof. Dr. Ayhan İnal, for his guidance, support, encouragement and insight
throughout the study.
I would also like to thank to Prof. Dr. Ali Türel, Asst. Prof. Dr. Ela Babalık and
Research Assistant Olgu Çalışkan from Department of City and Regional Planning
in METU for their help and support.
I am grateful to Fuat Vural and Buğra Gökçe from Greater Municipality of Ankara for
making the data available to support this study.
My friends Taner Özerkan, Esra Balkan, Tülay Ocak, Tutku Kömürcüoğlu, Hülya
Yıldırım and Barış Barışeri are gratefully acknowledged in my thesis for their
continuous encouragements and supports.
Lastly, I would like to express my gratefulness to my family. I would not have
completed this thesis without their endless love, support and patience.
viii
TABLE OF CONTENTS
PLAGIARISM............................................................................................................III ABSTRACT...............................................................................................................IV ÖZ ..............................................................................................................................V DEDICATION............................................................................................................VI ACKNOWLEDGEMENTS........................................................................................VII TABLE OF CONTENTS..........................................................................................VIII LIST OF TABLES.....................................................................................................XI LIST OF FIGURES..................................................................................................XIII LIST OF MAPS.......................................................................................................XIX LIST OF ABBREVIATIONS.....................................................................................XX CHAPTER 1.INTRODUCTION……………………………….......……........………………...........…1
1.1 Objectives of the study……………………………………………..........……2 1.2 Scope of the Study………………………………………………...........……..3
2. LITERATURE REVIEW ……………………………....…………………...........……..4
2.1 What is Transportation? …………………………………..........…………….4 2.2 The Link between Land Use and Transportation System Performance…...……………............……………………………..…..4 2.3 Performance Measures…………………..........……………………………….6 2.4 Land Use Impacts on Transportation System Performance……...........…...9
2.4.1 From Accessibility Point of View..................................................10
2.4.2 From Density and Clustering Points of View................................13
ix
2.4.3 From Land Use Mix Point of View................................................22 2.4.3.1 Land use mix at suburban area.......................................30 2.4.3.2 Jobs-housing balance......................................................34
2.4.4 From Roadway Design Point of View...........................................35
2.4.4.1 Roadway Connectivity.....................................................39 2.4.4.2 Access Management ......................................................49
2.4.5 From Transit Accessibility Point of View: Transit
Oriented Development (Transit villages).....................................68
2.4.5.1 Description.......................................................................68 2.4.5.2 Reasons behind supporting public transportation...........75 2.4.5.3 The built environment and the demand for
Transit..............................................................................72 2.4.5.4 Transit supportive design................................................89 2.4.5.5 Comparison of auto oriented and transit
oriented communities in terms of transit accessibility .....................................................................99
3. CASE STUDY: ANKARA ...............................................................................111
3.1 History of Urban Planning in Ankara........................................................111
3.1.1 Period before Jansen Plan (1923-1932)......................................111 3.1.2 Period of Jansen Plan (1932-1957).............................................112 3.1.3 Period of Uybadın-Yücel Plan (1957-1969).................................112 3.1.4 Period of Ankara Master Plan Bureau (AMANBP)
(1969-1984)..................................................................................116 3.1.5 2015 Structural Plan.....................................................................118 3.1.6 Period of 1984-1993.....................................................................121
3.1.7 2025 Master Plan.........................................................................122
3.2 History of Urban Transportation Planning in Ankara................................131
x
3.2.1 Urban Transportation Survey (Municipality of Ankara
SOFRETU: 1972).........................................................................131 3.2.2 Studies done between 1978 and 1980.........................................132 3.2.3 Project and Feasibility Studies done between 1980 and
1984.............................................................................................132 3.2.4 Ankara Urban Transportation Study, 1985-1987
(EGO-Canada Consortium-Kutlutaş)............................................133
3.3 Urban Transportation Plan of Ankara.......................................................134
3.3.1 Basic Principles of Urban Transportation.....................................134 3.3.2 Objectives....................................................................................137 3.3.3 Analysis of land use – transportation interaction of Ankara with planning context.......................................................145
3.3.3.1 Historical development of density of Ankara..............145
3.3.3.2 Compactess...…………………………..……........….. 147
3.3.3.3 Modal Split of Ankara...............................................150 3.3.3.4 Factors that enhanced transit and
nonmotorized travel in Ankara..................................156 3.3.3.5 Reasons behind the increasing auto travel..............158 3.3.3.6 Land use mix in Ankara..............................................171
4. SUMMARY AND CONCLUSIONS.............................................................190 REFERENCES……………………………………………………………...........……..198 APPENDICES.........................................................................................................205
xi
LIST OF TABLES
Table 2.1: Land Use Categories……………………………………………...........……14 Table 2.2: Improvement in peak hour traffic service levels.......................................51 Table 2.3: Transit modes related to residential density............................................92 Table 2.4: Transit modes suited to downtown size ..................................................93 Table 2.5: Comparison of Bay Area Neighborhoods: Control Factors, 1990-1992 ..............................................................................................101 Table 2.6: Characteristics of Bay Area Neighborhoods: Differentiation Criteria, 1990-1992.........................................................102 Table 2.7: Comparison of Rockridge and Lafayette communities, 1990.................................................................................108 Table 3.1: Historical transformation of the density measure of Ankara urban form in relation with area coverage and population increases ............................................................................................ 145 Table 3.2: Intensity of land use in global cities. …………………………….............148 Table 3.3: Annual travel by private and public transportation in world cities, 1990……………………………………………………………...........149 Table 3.4: Growth journey-to-work trip lengths in World cities, 1980- 1990........................................................................................................150 Table 3.5: Relative performance and provision for transportation modes in world cities, 1990...............................................................................151 Table 3.6: Modal split in Ankara including nonmotorized trips, 1990......................152 Table 3.7: Modal split in Ankara including nonmotorized trips, 1992......................153 Table 3.8: Modal split in Ankara for motorized trips, 2003......................................154 Table 3.9: Modal split in Ankara for motorized trips, 2005.....................................155 Table 3.10: Modal split of motorized trip during 1990-2005...............................156
xii
Table 3.11: Change in ridership of public and private transportation during 1990-2005............................................................................................156 Table 3.12: Share of motorized and nonmotorized trips in transportation from 1930 to 1985...........................................................................158 Table 3.13: GNP* in world cities 1990...................................................................159 Table 3.14: Employment, workforce and jobs/housing ratios, 1995.......................174 Table 3.15: Eskişehir Highway Cordon Counts (to CBD).......................................182 Table 3.16: Eskişehir Highway Cordon Counts (From CBD)..................................183 Table 3.17: Kızılay-Çayyolu Metro System Expected Peak Period Passenger Volume, 2015.....................................................................184 Table 3.18: Keçiören Cordon Counts......................................................................187 Table 3.19: Keçiören Cordon Counts......................................................................187 Table 3.20: Tandoğan-Keçiören Metro System Expected Peak Period Passenger Volume, 2015.....................................................................188
xiii
LIST OF FIGURES
Figure 2.1: Land use and transportation cycle………………………………...........…..6 Figure 2.2: Accessibility From A Location At One End Of A Roadway……..............10 Figure 2.3: Accessibility From A Location In The Center Of A Roadway…..............11 Figure 2.4: Accessibility From A Location On A Loop Road.....................................11 Figure 2.5: Accessibility From A Crossroads............................................................12 Figure 2.6: Accessibility From A Crossroads With Connections...............................12 Figure 2.7: Daily vehicle miles of travel versus population density
in the 65 largest U.S. urbanized areas – 1998.....................................15 Figure 2.8: Distance travelled per person per week in the UK by mode and population density: 1985/86...........................................................16 Figure 2.9: Number of journeys per person per week in the UK by mode and population density: 1985/86..........................................................17 Figure 2.10: Distance travelled per person per week in The Netherlands
by mode and population density: 1995...............................................18 Figure 2.11: Number of journeys per person per week in The Netherlands by mode and population density: 1995.................................................18 Figure 2.12: Accessibility with clustering of destinations..........................................19 Figure 2.13: Accessibility with vertical clustering......................................................20 Figure 2.14: Clustering At the Building or Block Scale.............................................21 Figure 2.15: Typical mixing of uses in urban and suburban Neighborhood......................................................................................24 Figure 2.16: Vertical mix of uses in a building or parcel...........................................25 Figure 2.17: Residential uses over retail...................................................................25 Figure 2.18: Residential uses over retail...................................................................26 Figure 2.19: Residential uses over retail and office..................................................26
xiv
Figure 2.20: Office over retail....................................................................................27 Figure 2.21: Ground floor retail in compact residential area.....................................27 Figure 2.22: Horizontal mix of uses in a parcel.........................................................28 Figure 2.23: Residential over ground floor retail.......................................................28 Figure 2.24: Orenco Station live/work units..............................................................28 Figure 2.25: Vertical mixed use at Orenco Station...................................................29 Figure 2.26: Horizontal mixed uses..........................................................................29 Figure 2.27: Percent of floorspace in land use categories for 57 large
suburban employment centers in the United States............................32 Figure 2.28: Schematic relationship between access and movement function of streets..................................................................................36 Figure 2.29: Hierarchical and Connected Road Systems.........................................37 Figure 2.30: Evolution of the street design ...............................................................37 Figure 2.31: Connected street pattern, in Eugene, Oregon...............................................40 Figure 2.32: Networks of streets, blocks, and sidewalks..........................................42 Figure 2.33: Development is broken into series of short blocks...............................42 Figure 2.34: Comparison of street patterns...............................................................43 Figure 2.35: Intersections in a Conventional Street Design.................................44 Figure 2.36: Intersections in a Neotraditional Street Design.....................................45 Figure 2.37: Pedestrian routes provide direct links to destinations...........................47 Figure 2.38: Bicycle routes as a part of continuous network....................................48 Figure 2.39: Typical patterns of TND and conventional design................................49 Figure 2.40: Crash reduction by city along access controlled corridors.....................51 Figure 2.41: Crash reduction by crash type along access controlled Corridors................................................................................................52 Figure 2.42: Retail sales activity along access controlled corridors...........................52
xv
Figure 2.43: Conflict points of a intersection of four-lane road with a two-lane road…………………………………………….…............54 Figure 2.44: A four-lane undivided roadway intersects with driveway....................54 Figure 2.45: Constraction of median with or without
opening.......................................................................................55 Figure 2.46: Reduction of conflict points from driveway consolidation
of two closely spaced driveways on a four-lane undivided highway.....................................................................................55
Figure 2.47: Lot frontage requirements.....................................................................56 Figure 2.48: Driveway spacing standards.................................................................56 Figure 2.49: Driveway distance...................................................................................57 Figure 2.50: Adequate throat length............................................................................58 Figure 2.51: Inadequate throat length.........................................................................58 Figure 2.52: Shared commercial driveways................................................................59 Figure 2.53: Shared commercial driveway recommendations...................................60 Figure 2.54: Cross access..........................................................................................60 Figure 2.55: Reverse frontage ...................................................................................61 Figure 2.56: Shared access.........................................................................................62 Figure 2.57: Flag Lots.................................................................................................62 Figure 2.58: Inadequate corner clearance..............................................................63 Figure 2.59: Right turn lanes.....................................................................................64 Figure 2.60: Right turn lane and taper......................................................................64 Figure 2.61: Left turn lane with raised median at intersection..................................65 Figure 2.62: Left turn lanes with continuous raised median at intersection ..........................................................................................65 Figure 2.63: Continuous two-way left turn lane.........................................................66 Figure 2.64: Road Hierarchy..................................................................67
xvi
Figure 2.65: Urban density by city groupings, 1990 .................................................73 Figure 2.66: Private transportation energy consumption per capita by city groupings, 1990.........................................................................73 Figure 2.67: Trends in auto use per capita by city groupings, 1980-1990.............................................................................................74 Figure 2.68: Proportion of work trips undertaken by transit and
non-motorised modes by city groupings.............................................74 Figure 2.69: Transit trips per capita and vehicle kilometers of service
per capita by city groupings................................................................75 Figure 2.70: Auto use per capita and urban density in global cities.......................................................................................75 Figure 2.71: Public transportation modal split and urban density
in global cities....................................................................................76 Figure 2.72: Proportion of jobs in the central business district and
the inner area by city groupings, 1990..............................................78 Figure 2.73: Job centralization in the inner city and mode split to transit
for the journey to work, 1990.............................................................79 Figure 2.74: Light Rail Station Boardings by Distance to the CBD
and CBD Employment Density..........................................................80 Figure 2.75: Light Rail Station Boardings by Distance to the CBD
and Residential Density ....................................................................81 Figure 2.76: Light Rail Station Boardings by Distance to the CBD
and Access modes ...........................................................................81 Figure 2.77: Commuter Rail Station Boardings by Distance
to the CBD and CBD Employment density........................................82 Figure 2.78: Commuter Rail Station Boardings by Distance
to the CBD and Residential density ..................................................83 Figure 2.79: Commuter Rail Station Boardings by Distance
to the CBD and access modes..........................................................84 Figure 2.80: Bay Area Rapid Transit System (BART), 1995......................................85 Figure 2.81: BART Weekday Rail Trips Per Square Mile of Catchment Zone by Employment Density and Fare to San Francisco’s CBD.......................................................................................................86
xvii
Figure 2.82: BART Weekday Rail Trips Per Square Mile of Catchment Zone by Population Density and Fare to San Francisco’s CBD.......................................................................................................86 Figure 2.83: Changing transit accessibility with varying development patterns ................................................................................................89 Figure 2.84: Building detachment versus building integration..................................95 Figure 2.85: CBD parking spaces per 1000 jobs by city grouping, 1990..................96 Figure 2.86: Auto-oriented commercial district unfriendly to pedestrians
and transit users................................................................................97 Figure 2.87: Initial improvements friendly to pedestrians and transit Users.....................................................................................................98 Figure 2.88: Transformation into a transit oriented neighborhood............................99 Figure 2.89: Location of Paired Neighborhoods in the San Francisco Bay Area...........................................................................................100 Figure 2.90: Neighborhood comparison of transit work trip generation rates, 1990..........................................................................................103 Figure 2.91: Neighborhood comparison of walk-bicycle work trip generation rates, 1990.......................................................................103 Figure 2.92: Neighborhood comparison of transit modal splits, 1990 work trips.............................................................................................104 Figure 2.93: Neighborhood comparison of walk-bicycle modal splits, 1990 work trips....................................................................................104 Figure 2.94: Comparison of Street and block patterns, Rockridge and Lafayette...................................................................................107 Figure 2.95: Nonwork trip modal split percentages, four distance categories ........................................................................................109 Figure 2.96: Nonwork trips by nondriving modes as a function of
neighborhood origin and vehicle availability ..................................110 Figure 3.1: Commuter rail between Sincan and Kayaş...........................................160 Figure 3.2: Existing situation of Kuğulu Intersection...............................................161 Figure 3.3: Planned project for Kuğulu intersection and other intersection between Akay and Kuğulu...............................................162
xviii
Figure 3.4: Pedestrian crossing at Sıhhiye............................................................165 Figure 3.5: Pedestrian crossing at Sıhhiye............................................................166 Figure 3.6: Pedestrian crossing at Meşrutiyet Street.............................................166 Figure 3.7: Pedestrian Bridge occupying sidewalk, in Meşrutiyet Street...........................................................................167 Figure 3.8: Pedestrian Bridge occupying sidewalk, in Meşrutiyet Street...........................................................................167 Figure 3.9: Pedestrian Bridge occupying sidewalk, in Meşrutiyet Street...........................................................................168 Figure 3.10: Vehicle occupying sidewalk.............................................................168 Figure 3.11: Road widths in Ankara....................................................................169 Figure 3.12: Turning radius at Kızılay.....................................................................170 Figure 3.13: Turning radius at Kuğulu.....................................................................170 Figure 3.14: Graph of jobs to housing ratio versus district number.......................176 Figure 3.15: Work place of residents of survey area............................................178 Figure 3.16: Mode choice in survey area..............................................................178 Figure 3.17: Planned rail system lines of Ankara, 2005………………..............…181 Figure 3.18: Traffic cordon count stations of Eskişehir Highway..........................182 Figure 3.19: Passenger volumes of Kızılay-Çayyolu Metro System
at peak period for 2015....................................................................184 Figure 3.20: Keçiören Metro Corridor cordon count stations…....………...............186 Figure 3.21: Passenger volumes of Tandoğan-Keçiören Metro System
at peak period for 2015.....................................................................188 Figure B.1.: Transit and urban relationship in adaptive cities .............................. 208 Figure B.2: Transit and the spread-out metropolis..................................................210 Figure B.3: Transit and the polycentric city.............................................................211
xix
LIST OF MAPS
Map 3.1: Jansen Plan, 1932...................................................................................114 Map 3.2: Uybadın-Yücel Plan, 1957.......................................................................115 Map 3.3: Ankara Master Plan, 1990.......................................................................117 Map 3.4: 2015 Structural Plan................................................................................120 Map 3.5: Ankara Master Plan, 2025.......................................................................128 Map 3.6: Development Corridors, 2025..................................................................129 Map 3.7: Ankara Urban Road Network...................................................................130 Map 3.8: Integration between Rail system line and transfer points........................139 Map 3.9: The core circular Arterials....................................................................164 Map 3.10: District boundaries.................................................................................173 Map 3.11: Location of survey area in Ankara.........................................................177 Map 3.12: Curvilinear and cul de sac street pattern of Çayyolu Area.........................................................................................179
xx
LIST OF ABBREVIATIONS
ABB Ankara Büyükşehir Belediyesi AMANBP Ankara Master Plan Bureau AŞTİ Intercity Bus Terminal of Ankara BART Bay Area Rapid Transit CBD Central Business District CDOT California Department of Transportation CPOT City of Portland Office of Transportation CPW Community Planning Workshop CUTR Center for Urban Transportation Research FHWA Federal Highway Administration IDOT Iowa Department of Transportation LOS Level of Service LRT Light Rail Transit MDOT Michigan Department of Transportation METU Middle East Technical University SOV Single Occupancy Vehicle TCDD Turkish State Railways TCRP Transit Cooperative Research Program TDM Transportation Demand Management TND Traditional Neighborhood Development TOD Transit Oriented Development TRB Transportation Research Board
xxi
TS-M Transit Station-Mixed UK United Kingdom US United States of America UCTC University of California Transportation Center UTP Urban Transportation Planning VTPI Victoria Transport Policy Institute VMT Vehicle Miles of Travel
1
CHAPTER 1
INTRODUCTION
The idea that urban can be formed to effect travel behavior still remains valid.
(Boarnet & Crane, 2001) The reason behind that is the strong link between land use
and transportation in such a way that “a city can be considered as a locational
arrangement of activities or a land use pattern.” This pattern affects human behavior
which in turn shapes the land use pattern. Interaction between activities comes out
as movement of people and goods which is the definition of transportation. (Khisty &
Lall, 1990, p. 9)
Up to now, engineers and planners rarely try to change urban form to affect travel
behavior. Instead they prefer studying on existing urban form and design
transportation system to satisfy the current demand and the future demand.
(Boarnet & Crane, 2001)
Increasing mobility with added capacity gives people more freedom to spread over a
wide area, however sprawl development brings lots of problems. After it was
understood that sprawl causes inevitable automobile dependency and consequently
air pollution, excess energy usage, inequity between people etc. planners have
started to share the goal of limiting automobile useage and also realized that the
best way to achieve this goal is reshaping land use.
One of the most important planning strategies of the last decade is the idea of New
Urbanism. In spite of different suggestion and projects, the planners share common
ideas about importance of mixed use, grid like, more compact, clustered and
pedestrian friendly land developments to save people from automobile dependency
and to encourage people to walk more.
2
Jobs-housing balance is another subject of debate, according to the defender of
jobs-housing balancing; locating people and work opportunities in separate
areas makes automobile a requirement for commuters. However if designers plan
cities in mixed use form and put jobs near where people live commonly, people can
walk or use other facilities such as transit (Boarnet & Crane, 2001)
In this context the main goal for engineers and planners is to devise land use and
transportation system that makes the maximum contribution to the welfare of
community. So, aim for designer should be to minimize time spent, energy and cost
by making transportation system more efficient or planning the land use so as to
minimize the amount of travel which contributes to achieve an efficient
transportation system. (Blunden, 1973)
In this thesis, particularly the best possible or optimal land use patterns are
investigated to make transportation system more efficient. In the first chapter,
objectives and scope of the study are explained. In the second chapter, studies
about land use impact on transportation system are investigated considering various
land use factors. In the third chapter, interaction between urban transportation
system and land use of Ankara is evaluated based on inferences of literature
survey. Finally, in chapter 4, literature survey is summarized briefly and proposals
for Ankara are put forwarded.
1.1 Objectives of the Study
The aim of this thesis is five-fold. Firstly, it aims to determine the effects of land use
patterns on transportation system performance, and to determine land use and
transportation relationship. The second aim is to determine problems related with
land use – transportation interaction and the best possible solutions or land use
patterns for them. In short the thesis seeks to answer to the question of which land
use pattern causes which result. Next two objectives of the study are to analyze land
use and transportation interaction in Ankara and to propose solutions for problems
considering the points realized in the literature review. As a final purpose, the study
aims to become basis for future studies which are related to land use optimization
for improved transportation system.
3
1.2 Scope of the Study The scope of the thesis includes definitions of basic concepts included in the thesis,
the review of literature about effect of urban form on transportation system in
metropolitan area and emphasizing basic points observed from the literature review.
Other important part of the thesis is the case study: Ankara. This part covers
analysis of land use and transportation system of Ankara, problems of Ankara
related with land use-transportation system and solutions to observed problems in
the light of the literature review.
4
CHAPTER 2
LITERATURE REVIEW
2.1 What is Transportation?
Transportation is one of the basic requirements of people such as food, shelter,
clothing, and security. So it has an important portion in human culture. Also
transportation has various effects in the progress in the world. For instance, it
provide link between where people live and where people work, manufacturers and
consumers. Transportation facilities give opportunities for different activities such as
work, shopping, recreation and allow people to reach hospitals, schools, etc. (Khisty
& Lall, 1990)
Transportation can be defined as “the services provided for the movement of
persons and goods (freights) between different locations.” (Çetinel, n.d, p. 1) The
reason for people and goods to move from an origin to a destination is explained by
Khisty and Lall (1990) with three conditions:
(1) complementarity, the relative attractiveness between two or more destinations; (2) the desire to overcome distance, referred to as transferability, measured in terms of time and money needed to overcome this distance and the best technology available to achieve this; (3) intervening opportunities to competition among several locations to satisfy demand and supply. (p. 9)
The decisions between alternative travel ways for movements of people and goods
shape mode choices depending on some factors such as time, speed, efficiency,
costs, safety and convenience.
2.2 The Link between Land Use and Transportation System Performance
The link between land use and transportation is one of the important subjects in
transportation studies. (Meyer & Miller, 1984) This subject often becomes a matter
of discussion between town planner, the sociologist and economist. They argue
5
which comes first, transport or land use. This is a futile discussion like chicken and
egg argument.
The truth is that traffic is the joint consequence of land use potential and transport capability. It is intuitively obvious that neither land use nor transport on its own can cause or generate traffic and traffic is, in fact, the medium in which both find expression.(Blunden, 1973, p.1)
As activities spread according to land use pattern, people travel to access them.
Considering this, how people decide where to live and how firms decide where to
perform their economic activity are important questions. Households and firms are
two main parts of the agents in the urban market. They select their location to reach
maximum benefit. The consequent interaction between land use and transportation
occurs in two ways via agents. First location pattern of activity cause a trip pattern
and second location of each activity is affected by transportation system.
It can be said that the land use and transport interaction is the result of human
behavior. Land use sets the location of opportunities and transport needs come to
exist by the need to access these opportunities. (Martinez, 2000)
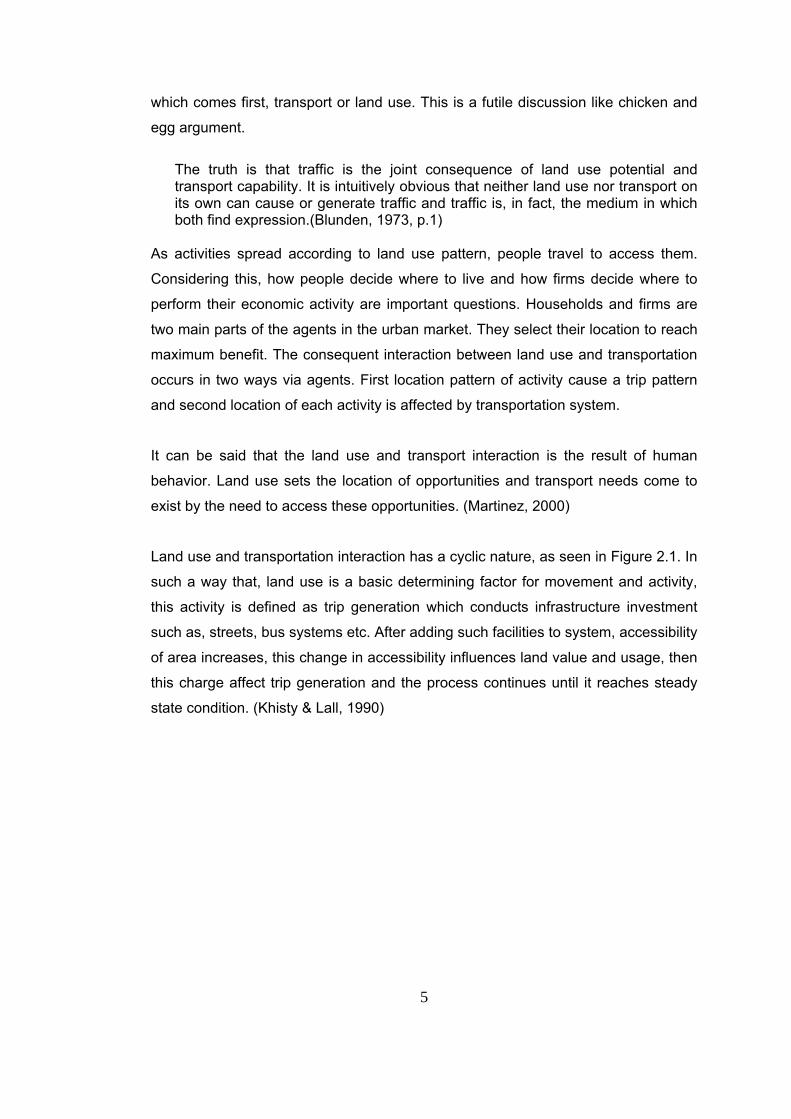
Land use and transportation interaction has a cyclic nature, as seen in Figure 2.1. In
such a way that, land use is a basic determining factor for movement and activity,
this activity is defined as trip generation which conducts infrastructure investment
such as, streets, bus systems etc. After adding such facilities to system, accessibility
of area increases, this change in accessibility influences land value and usage, then
this charge affect trip generation and the process continues until it reaches steady
state condition. (Khisty & Lall, 1990)
6
Figure 2.1: Land use and transportation cycle (Khisty & Lall, 1990)
2.3 Performance Measures
A transportation system may be defined as consisting of the fixed facilities, the flow entities, and the control system that permits people and goods to overcome the friction of geographical space efficiently in order to participate in a timely manner in some desired activity.(Ce 451, nd, para. 3)
The performance measure is a specific activity or physical change that can measure
transportation system performance. (City of Portland Office of Transportation, n.d).
Different performance measures are needed to analyze and to improve
transportation system. Measuring performance depends on the aim it serves. In this
study, the performance measures which are affected mainly by land use changes
are considered.
Performance measures can be listed as follows (Transportation Research Board,
2001);
• Accessibility: “Accessibility is an ability to obtain desired goods, services and activities”
(Victoria Transport Policy Institute(a), 2005).
7
• Mobility: “The ability to move people and goods from place to place, or the potential for
movement” (City of Portland Office of Transportation, n.d).
• Traffic level of service :
Level of service (LOS) is a qualitative measure describing operational conditions within a traffic stream and their perception by motorists and or passengers. Factors such as speed and travel time, freedom to maneuver, traffic interruptions, comfort and convenience are generally included as conditions affecting LOS (Khisty & Lall, 1990, p. 221).
• Congestion:
A condition characterized by unstable traffic flows that prohibits movement on a transportation facility at optimal legal speeds. Recurrent congestion is caused by constant excess volume compared with capacity. Nonrecurring congestion is caused by actions such as special events and/or traffic accidents (Puget Sound Regional Council, 2001).
• Delay: “Difference between actual travel time and free-flow travel time” (California
Department of Transportation, 2000, p. 140).
• Travel time: The time it takes to travel from origin to destination.
• Mode split:
The percentage of trips taken by each of the possible modes of travel (motor vehicle, transit, bicycle, walk). Mode split does not refer to the number of trips. For example, the number of trips by a particular mode may increase, but the percentage of trips by that mode may stay the same or be reduced if there is also growth in the overall number of trips for other modes (CPOT, n.d).
• Vehicle kilometers of travel:
“The number of kilometers traveled within a specific geographic location” (State
of North Carolina Department of Transportation, n.d).
8
• Transit accessibility: “Ability to do work trips by transit with walk access” (TRB, 2001).
• Environmental quality
“Helping to maintain and enhance the quality of the natural and human
environment” (CDOT, 2000, p. 140).
• Air Quality: “The levels of pollution and lengths of exposure” (State of North Carolina
Department of Transportation, n.d).
• Safety: “Minimizing the risk of death, injury, or property loss” (CDOT 2000, p. 141).
• Equity: “Equity refers to the distribution of resources and opportunities” (VTPI(b), 2005).
“In transportation, a normative measure of fairness among transportation users”
(Puget Sound Regional Council, 2001).
• Transportation Cost: Transportation cost is a cost which includes vehicle costs, travel time costs,
road and parking facility cost, congestion costs, cost of traffic crashes,
environmental costs, fuel externalities and etc (VTPI, 2005j).
• Reliability: “Providing reasonable and dependable levels of service by mode” (CDOT, 2000,
p. 141).
• Affordability:
Transportation affordability means that user financial costs of transport are not excessive particularly for basic access (that is, travel with high social value, such as access to medical services, essential shopping, work, school) for lower-income people. This is a critical equity objective, since it affects the cost burdens and opportunities available to disadvantaged people (VTPI, 2005c).
9
2.4 Land Use Impacts on Transportation System Performance
Land use (also called Land Development or Spatial Development) means treatment
of the landscape, including the location and design of buildings, transportation
infrastructure, parks and farms, greenspaces, etc. Basic land use categories for built
environment are given below.
• Residential (single- and multi-family housing)
• Commercial (stores and offices)
• Industrial
• Institutional (schools, public offices, etc.)
• Transportation facilities (roads, parking, etc.)
(Litman, 2005b)
In this part of the study, effect of different land use pattern (also called community
design, urban form, the built environment, spatial planning, and urban geography
(Litman, 2005a)) on transportation system performance is examined in terms of land
use factors defined below. Performance measures which are defined in part “2.3
Performance Measures” are used as an indicator when investigating effects on
performance of transportation system.
Land Use Factors:
• Accessibility
• Density and clustering
• Land use mix
• Connectivity
• Roadway design and management
• Parking supply and management
• Walking and cycling conditions
• Transit quality and transit accessibility
(Litman, 2005a, Litman, 2005b)
10
2.4.1 From Accessibility Point of View
Accessibility means the ability to reach opportunities such as desired goods,
services and activities. Access is the ultimate goal of most transportation activity,
with the exception of some cultural and sportive activities that aim the movement on
its own (e.g., cruising, historic train rides, horseback riding, jogging, and tracking)
(VTPI, 2005d).
Various factors affect accessibility. If accessibility is thought as an activity to reach
something necessary, then a land use pattern followed, a transportation mode used
and the speed reached become important factors.
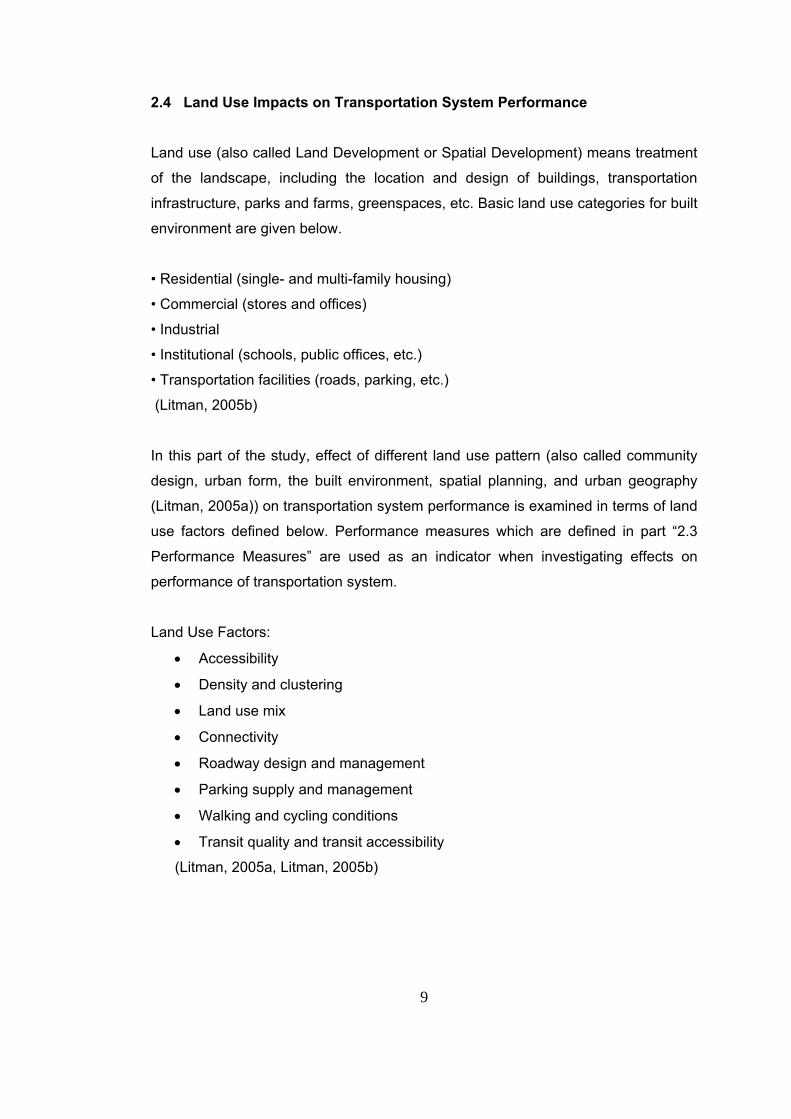
VTPI (2005d) gives an example to explain the effects of spatial distributions of
destinations to accessibility. According to the example, there are 12 destinations
which serve different needs. These destinations are placed along a road and the
home which is origin at the same time located at one end of the road as shown in
Figure 2.2.
Figure 2.2: Accessibility from a location at one end of a roadway VTPI (2005d)
If destinations spread over wide area as in Figure 4, travel distances and
consequent travel needs increase. Conversely, close destinations cause for walking,
cycling, and transit to become convenient transportation options.
In the light of above findings it can be said that shorter travel distances allow using
different transport choice and if other factors are fixed, then increased density
causes increase in accessibility.
11
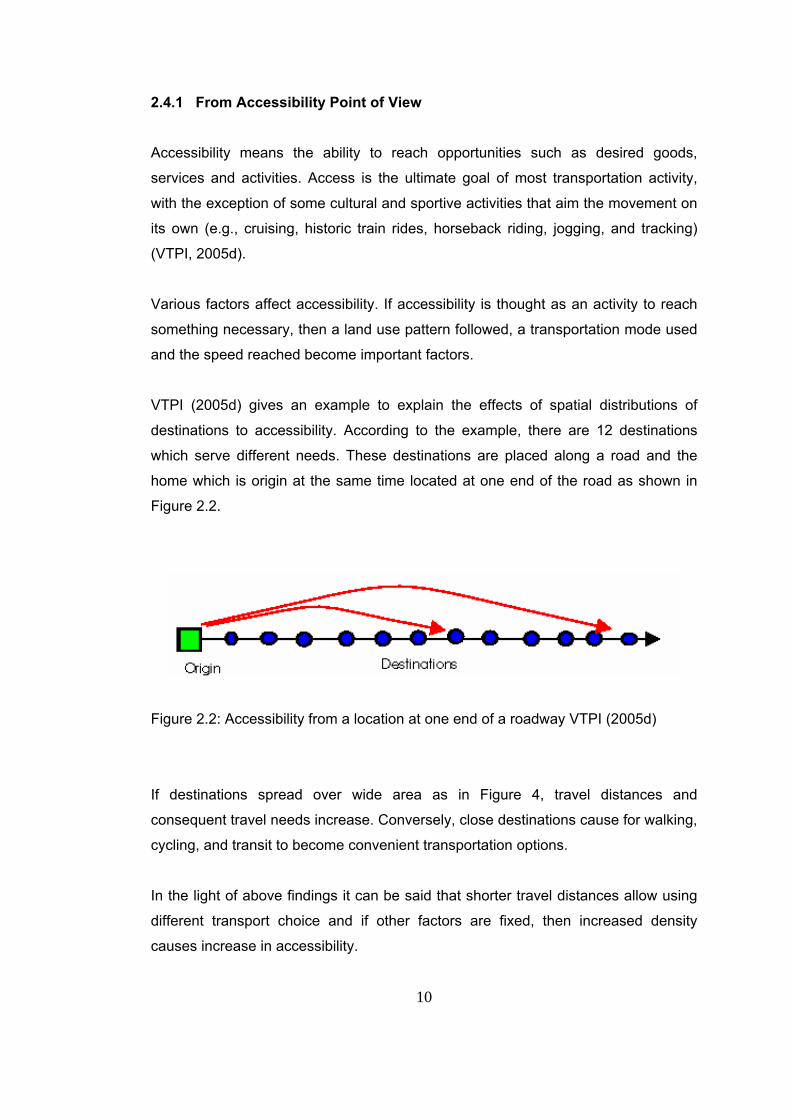
Another configuration is shown in Figure 2.3. In this figure the origin is located at
center of the road, which is better than the previous one, because this reduces
average travel distance to reach destinations.
Figure 2.3: Accessibility from a location in the center of a roadway (VTPI, 2005d)
One another configuration is a loop road, as shown in Figure 2.4.
Figure 2.4: Accessibility from a location on a loop road (VTPI, 2005d)
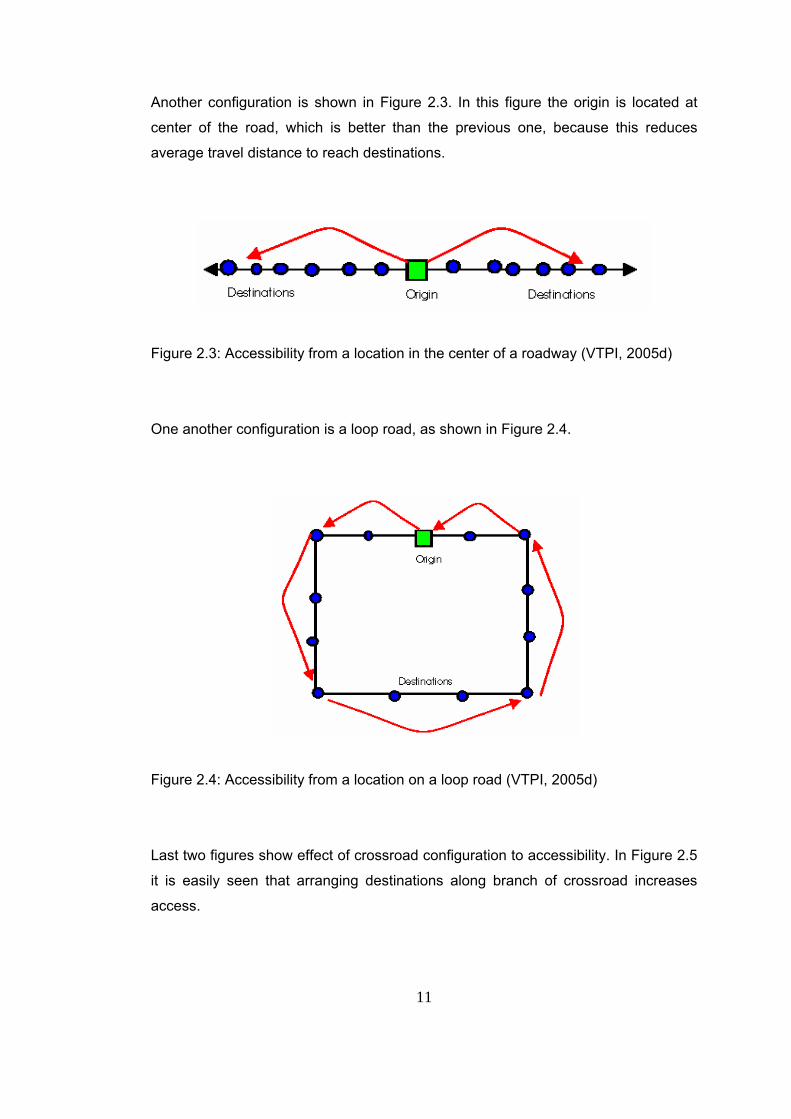
Last two figures show effect of crossroad configuration to accessibility. In Figure 2.5
it is easily seen that arranging destinations along branch of crossroad increases
access.
12
Figure 2.5: Accessibility from a crossroads (VTPI, 2005d)
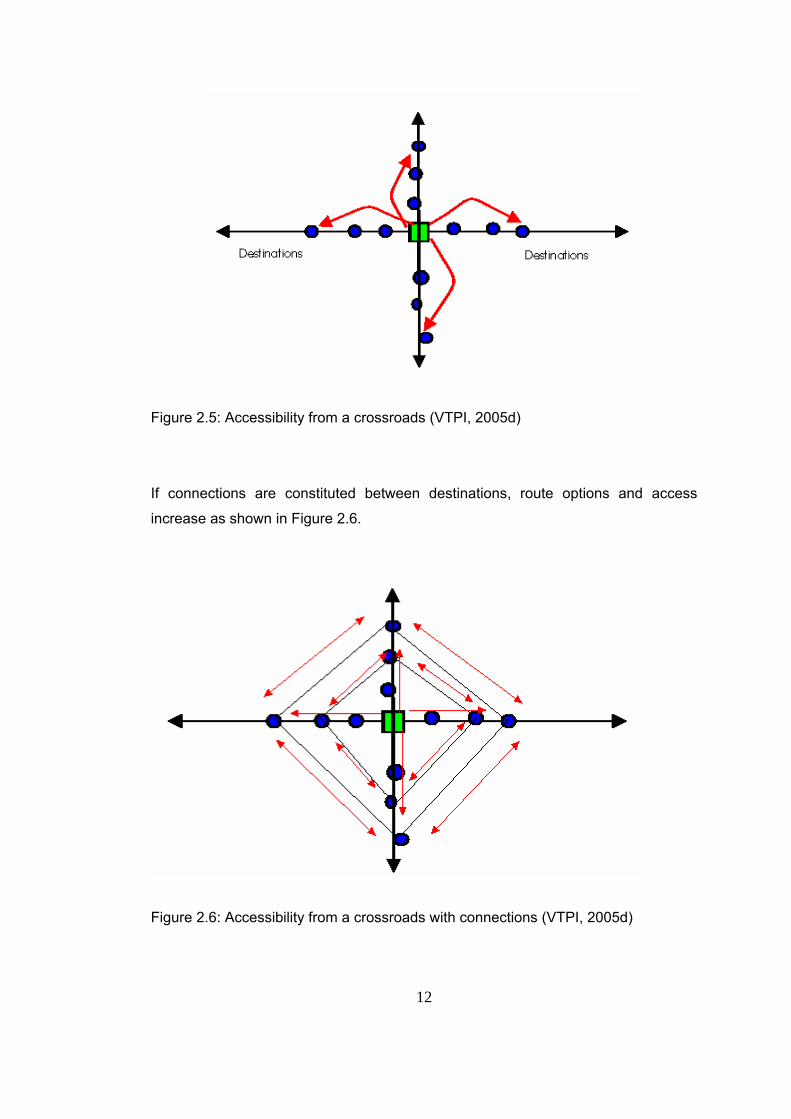
If connections are constituted between destinations, route options and access
increase as shown in Figure 2.6.
Figure 2.6: Accessibility from a crossroads with connections (VTPI, 2005d)
13
It can be concluded that central locations and connected road networks increase
accessibility and route options also reduce average travel distance.
2.4.2 From Density and Clustering Points of View Density
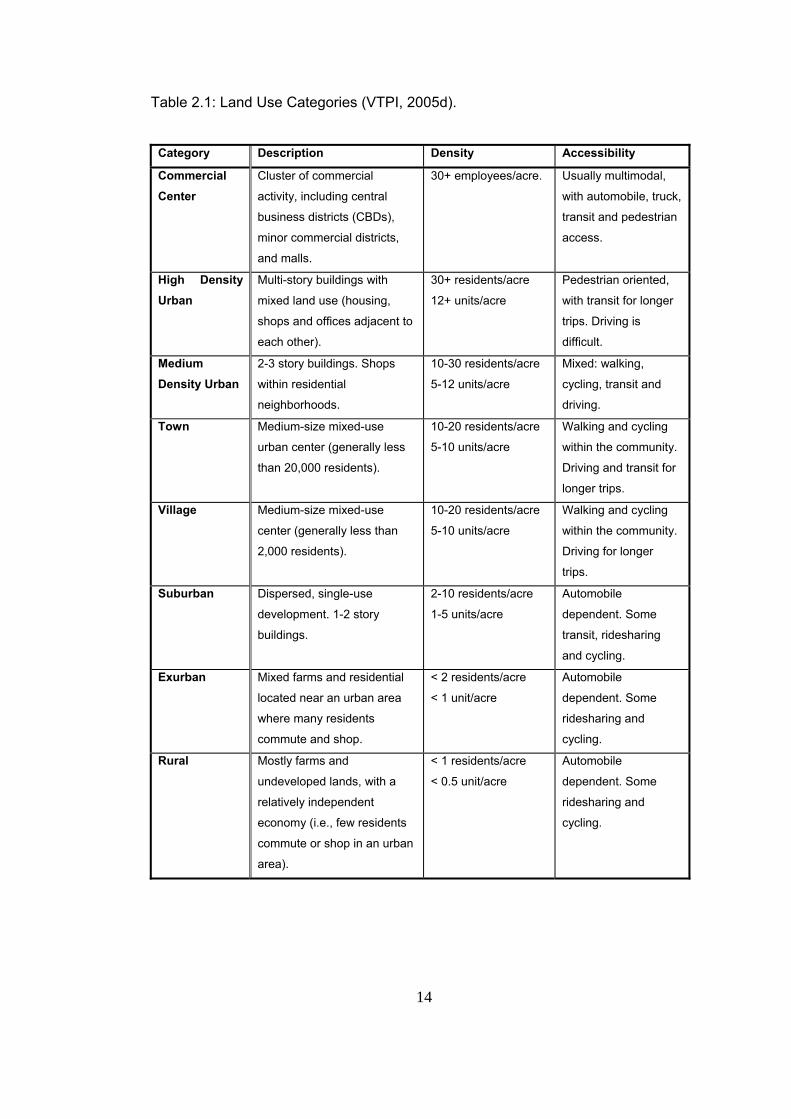
Density means the number of people or employment in an area. It can be measured
by the number of residents, housing units or employees per acre1 as in the Table
2.1 below (VTPI, 2005d).
According to a research performed by Newman, Kenworthy, Laube, Barter, Raad,
Paboon, and Gulia (1999) covering 46 major cities around the world, it is conluded
that “the more centralized is the city in terms of both population and jobs, the less
auto dependent it will be and the less transportation energy it will use.” (p. 580)
In this context Fouchier (1996b) carried out a research about auto ownership and
mobility which confirm findings of Newman & Kenworthy et al. (1999). He reported
that as density increases auto ownership decreases (as cited in Fouchier, 2000).
Additionally, Fouchier (2000) determined that in low density outer region of Paris
people prefer using automobile because of longer distance between residence and
employment, lack of public transport and convenient parking place. In high density
inner part the situation is totally inverted. Automobiles do not attract people because
of cost and scarcity of parking place and congestion. Easiness of public transport is
another factor for people not to choose private autos.
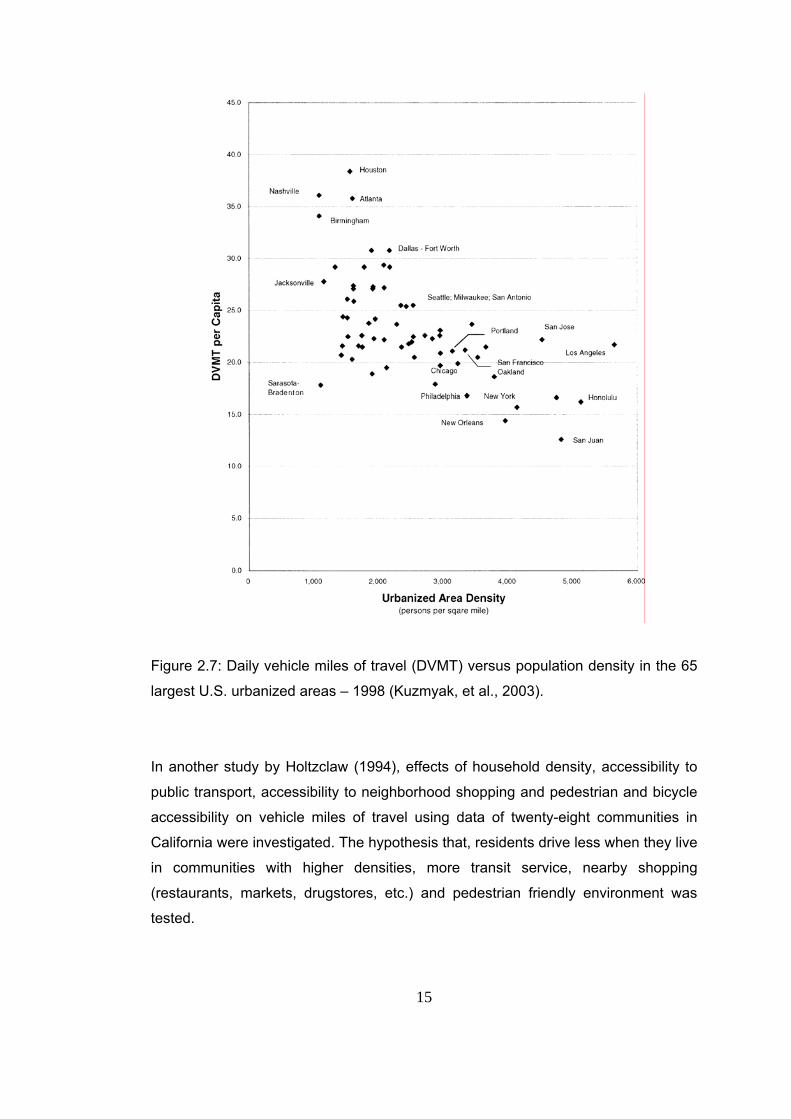
Transportation Research Board also investigates the relation between vehicle miles2
of travel (VMT) and urban density by a graph using statistical data of 65 largest U.S.
urbanized areas. According to Figure 2.7 which is obtained using these data, higher
densities tend to have less reliance on auto travel. And also there is a general
behavior that as density decreases vehicle miles of travel increases. (Kuzmyak,
Pratt, Douglas, Spielberg, 2003)
1 1acre = 4046.86 m2 2 1mile= 1609.34 m
14
Table 2.1: Land Use Categories (VTPI, 2005d).
Category Description Density Accessibility
Commercial Center
Cluster of commercial
activity, including central
business districts (CBDs),
minor commercial districts,
and malls.
30+ employees/acre. Usually multimodal,
with automobile, truck,
transit and pedestrian
access.
High Density Urban
Multi-story buildings with
mixed land use (housing,
shops and offices adjacent to
each other).
30+ residents/acre
12+ units/acre
Pedestrian oriented,
with transit for longer
trips. Driving is
difficult.
Medium Density Urban
2-3 story buildings. Shops
within residential
neighborhoods.
10-30 residents/acre
5-12 units/acre
Mixed: walking,
cycling, transit and
driving.
Town Medium-size mixed-use
urban center (generally less
than 20,000 residents).
10-20 residents/acre
5-10 units/acre
Walking and cycling
within the community.
Driving and transit for
longer trips.
Village Medium-size mixed-use
center (generally less than
2,000 residents).
10-20 residents/acre
5-10 units/acre
Walking and cycling
within the community.
Driving for longer
trips.
Suburban Dispersed, single-use
development. 1-2 story
buildings.
2-10 residents/acre
1-5 units/acre
Automobile
dependent. Some
transit, ridesharing
and cycling.
Exurban Mixed farms and residential
located near an urban area
where many residents
commute and shop.
< 2 residents/acre
< 1 unit/acre
Automobile
dependent. Some
ridesharing and
cycling.
Rural Mostly farms and
undeveloped lands, with a
relatively independent
economy (i.e., few residents
commute or shop in an urban
area).
< 1 residents/acre
< 0.5 unit/acre
Automobile
dependent. Some
ridesharing and
cycling.
15
Figure 2.7: Daily vehicle miles of travel (DVMT) versus population density in the 65
largest U.S. urbanized areas – 1998 (Kuzmyak, et al., 2003).
In another study by Holtzclaw (1994), effects of household density, accessibility to
public transport, accessibility to neighborhood shopping and pedestrian and bicycle
accessibility on vehicle miles of travel using data of twenty-eight communities in
California were investigated. The hypothesis that, residents drive less when they live
in communities with higher densities, more transit service, nearby shopping
(restaurants, markets, drugstores, etc.) and pedestrian friendly environment was
tested.
16
As a result of the analysis, it was obtained that auto ownership decreases as density
increases, vehicle miles traveled per household (VMT/HH) increases as household
density, the transit accessibility, nearby shopping and pedestrian friendlessness
decrease and the data are fairly well fit by decreases in VMT of 25 to 30 percent
every time density doubles between densities of 1.8 and 101 households per
residential acre (Holtzclaw, 1994).
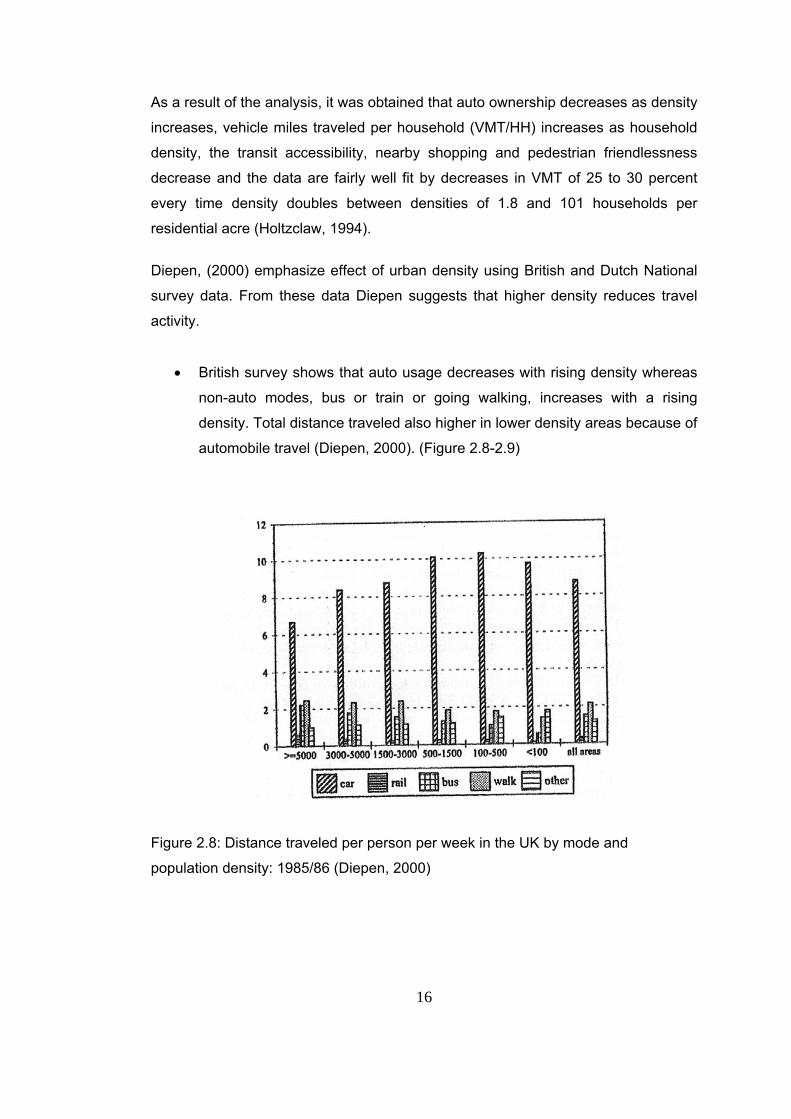
Diepen, (2000) emphasize effect of urban density using British and Dutch National
survey data. From these data Diepen suggests that higher density reduces travel
activity.
• British survey shows that auto usage decreases with rising density whereas
non-auto modes, bus or train or going walking, increases with a rising
density. Total distance traveled also higher in lower density areas because of
automobile travel (Diepen, 2000). (Figure 2.8-2.9)
Figure 2.8: Distance traveled per person per week in the UK by mode and
population density: 1985/86 (Diepen, 2000)
17
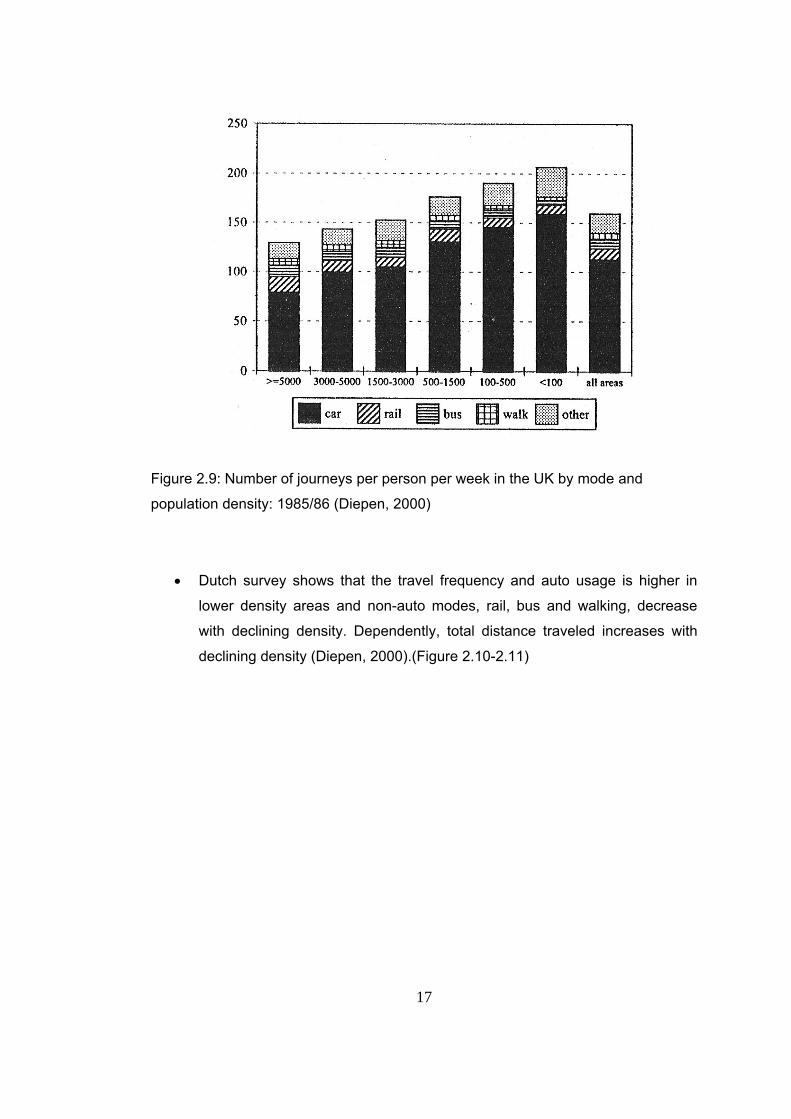
Figure 2.9: Number of journeys per person per week in the UK by mode and
population density: 1985/86 (Diepen, 2000)
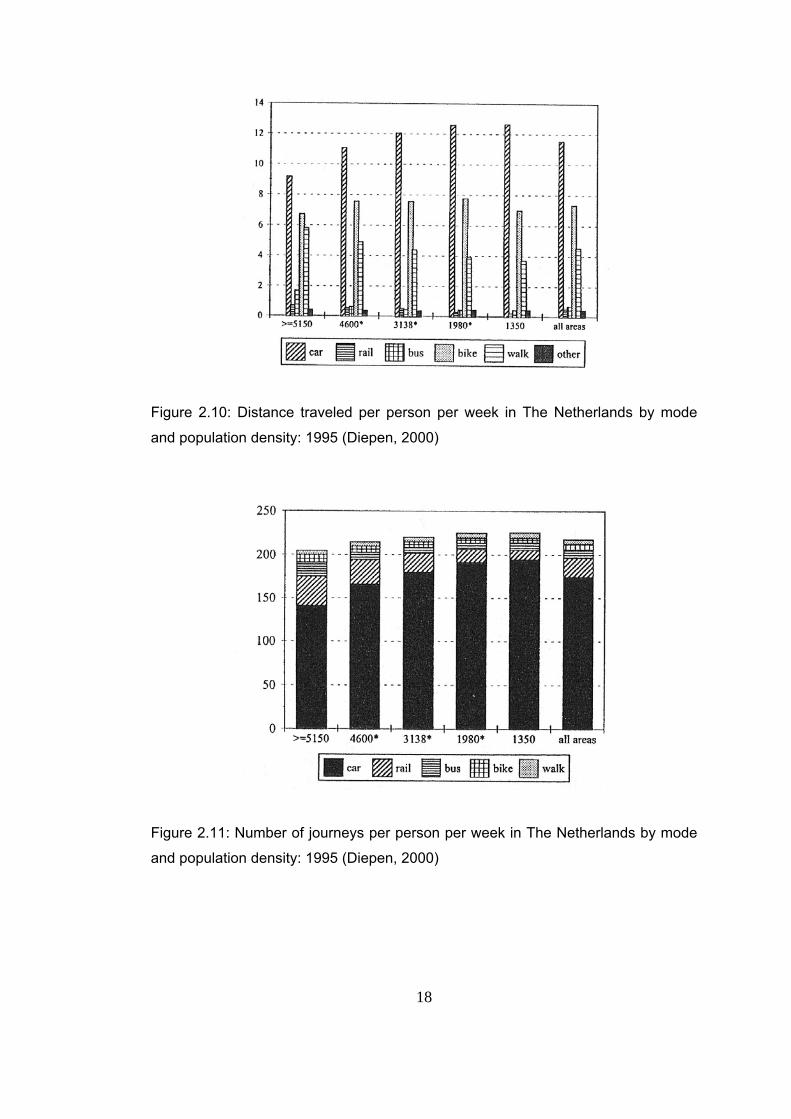
• Dutch survey shows that the travel frequency and auto usage is higher in
lower density areas and non-auto modes, rail, bus and walking, decrease
with declining density. Dependently, total distance traveled increases with
declining density (Diepen, 2000).(Figure 2.10-2.11)
18
Figure 2.10: Distance traveled per person per week in The Netherlands by mode
and population density: 1995 (Diepen, 2000)
Figure 2.11: Number of journeys per person per week in The Netherlands by mode
and population density: 1995 (Diepen, 2000)
19
Clustering
Clustering (also called compact development) means locating and organizing people
or destinations together, usually within convenient walking distances. Clustering
improves accessibility by shortening travel distances and improving transportation
options. If clustering is implemented in a pedestrian area, it is possible to perform
several daily activities with one vehicle trip, which is beneficial to trip makers. This is
impossible in dispersed area in where destinations are located along commercial
strip or spread throughout a suburban area. It is an important part of land use
management strategies. Considerable travel reductions can be achieved, if
clustering is implemented with other TDM (Transportation Demand Management)
strategies, such as pedestrian improvements, parking management, ridesharing,
transit improvements and traffic calming (VTPI, 2005f,2005d).
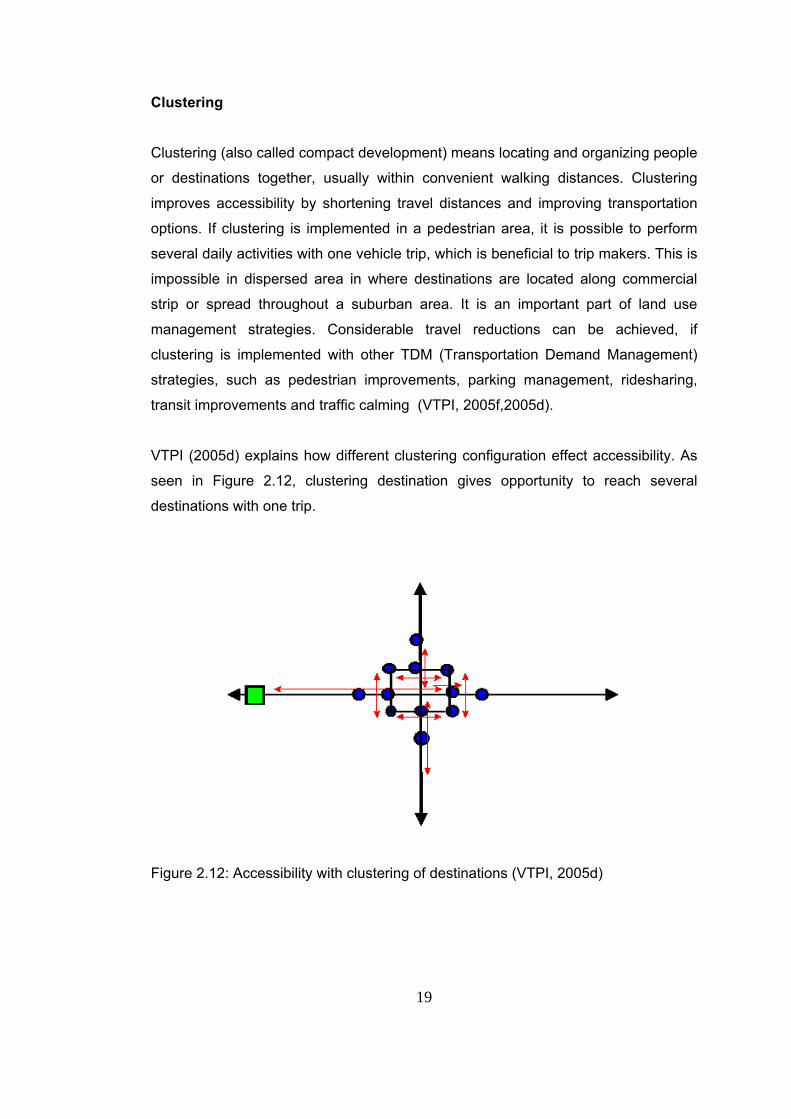
VTPI (2005d) explains how different clustering configuration effect accessibility. As
seen in Figure 2.12, clustering destination gives opportunity to reach several
destinations with one trip.
Figure 2.12: Accessibility with clustering of destinations (VTPI, 2005d)
20
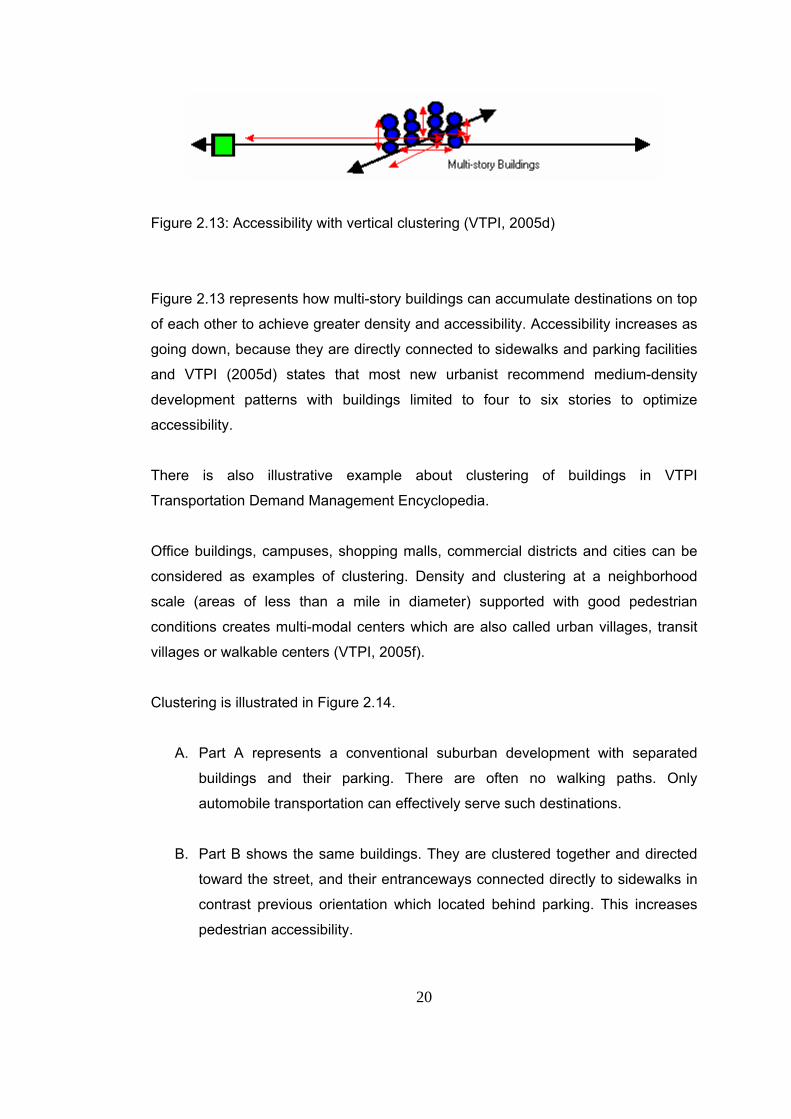
Figure 2.13: Accessibility with vertical clustering (VTPI, 2005d)
Figure 2.13 represents how multi-story buildings can accumulate destinations on top
of each other to achieve greater density and accessibility. Accessibility increases as
going down, because they are directly connected to sidewalks and parking facilities
and VTPI (2005d) states that most new urbanist recommend medium-density
development patterns with buildings limited to four to six stories to optimize
accessibility.
There is also illustrative example about clustering of buildings in VTPI
Transportation Demand Management Encyclopedia.
Office buildings, campuses, shopping malls, commercial districts and cities can be
considered as examples of clustering. Density and clustering at a neighborhood
scale (areas of less than a mile in diameter) supported with good pedestrian
conditions creates multi-modal centers which are also called urban villages, transit
villages or walkable centers (VTPI, 2005f).
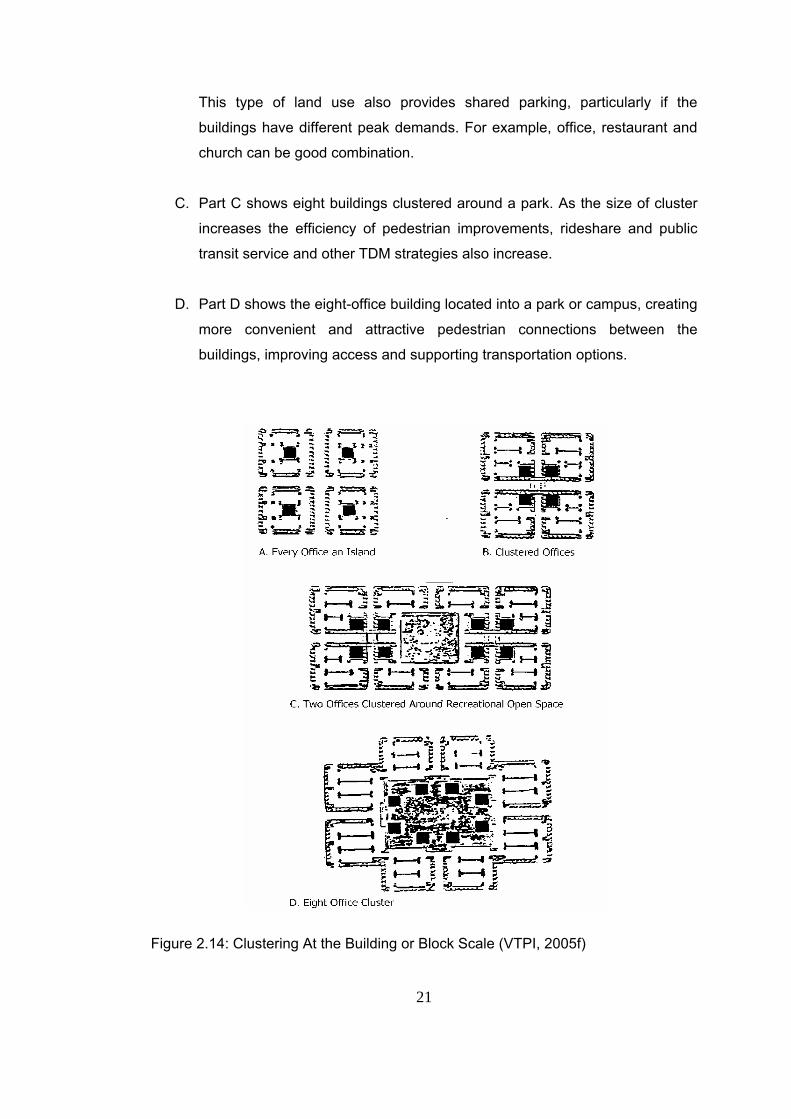
Clustering is illustrated in Figure 2.14.
A. Part A represents a conventional suburban development with separated
buildings and their parking. There are often no walking paths. Only
automobile transportation can effectively serve such destinations.
B. Part B shows the same buildings. They are clustered together and directed
toward the street, and their entranceways connected directly to sidewalks in
contrast previous orientation which located behind parking. This increases
pedestrian accessibility.
21
This type of land use also provides shared parking, particularly if the
buildings have different peak demands. For example, office, restaurant and
church can be good combination.
C. Part C shows eight buildings clustered around a park. As the size of cluster
increases the efficiency of pedestrian improvements, rideshare and public
transit service and other TDM strategies also increase.
D. Part D shows the eight-office building located into a park or campus, creating
more convenient and attractive pedestrian connections between the
buildings, improving access and supporting transportation options.
Figure 2.14: Clustering At the Building or Block Scale (VTPI, 2005f)
22
According to Figure 2.14; locating parking near destinations improves vehicle
access, although it may reduce accessibility by other modes. Increased building
height or reducing the amount of land around buildings devoted to parking can
increase density and accessibility.
Land use density and clustering increase accessibility reducing distance between
destinations and improving transportation options. So in higher density areas,
people rely more on walking, cycling and transit, and less on driving. In these
conditions, clustering and the quality of pedestrian conditions are important
supportive factors. Land use density and clustering also reduce per capita
impervious surface and the costs of providing public infrastructure and services
(VTPI, 2005f, VTPI, 2005d).
2.4.3 From Land Use Mix Point of View
Land use mix can be defined as the relative proximity of different land uses within an
area. A mixed-use neighborhood includes not just homes but also stores, offices,
parks, and perhaps other land uses. (Handy, Boarnet, Ewing, Killingsworth, 2002)
Mixing residential, commercial, recreational, educational, and other land uses in
districts and neighborhoods creates lively and diverse communities. Mixed land
uses are critical to achieving places in which people can live, work, and play without
being dependent on automobile travel (Vernez-Moudon et al., 2003).
In the past, many planners preferred single land uses to prevent location of improper
land uses together such as residential units and factories. This segregation concept
was incorporated into zoning codes and development practices. Such single land
use patterns reduce accessibility, and cause people to travel more distance to reach
desired activity and services, whereas mixed land use increase accessibility
reducing travel distance. Increasingly, planners now recognize the value of land use
mix. Although some types of land uses are unsuitable for clustering, such as
residential and industrial, many common destinations can be clustered together, and
can increase performance of transportation system (VTPI, 2005d).
23
Land use mix can occur at the different level such as neighborhood, or parcel level.
Traditional urban neighborhoods mix commercial and residential uses at a smaller
scale than modern suburban neighborhoods.
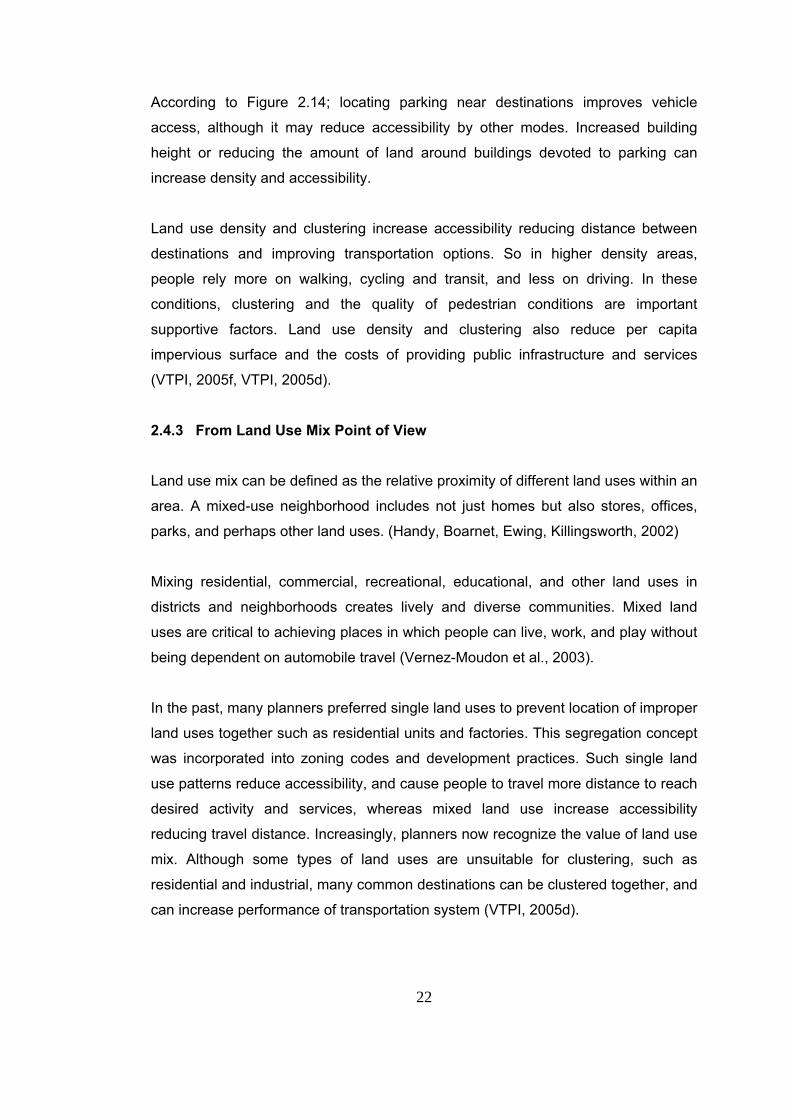
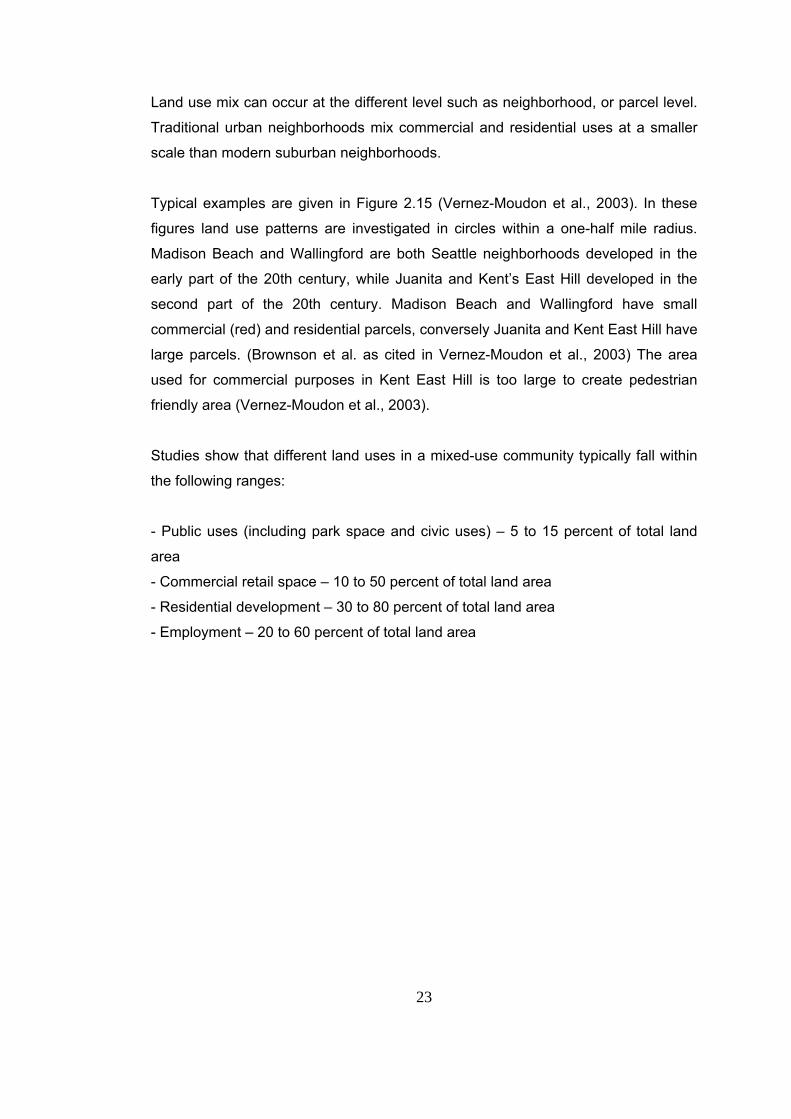
Typical examples are given in Figure 2.15 (Vernez-Moudon et al., 2003). In these
figures land use patterns are investigated in circles within a one-half mile radius.
Madison Beach and Wallingford are both Seattle neighborhoods developed in the
early part of the 20th century, while Juanita and Kent’s East Hill developed in the
second part of the 20th century. Madison Beach and Wallingford have small
commercial (red) and residential parcels, conversely Juanita and Kent East Hill have
large parcels. (Brownson et al. as cited in Vernez-Moudon et al., 2003) The area
used for commercial purposes in Kent East Hill is too large to create pedestrian
friendly area (Vernez-Moudon et al., 2003).
Studies show that different land uses in a mixed-use community typically fall within
the following ranges:
- Public uses (including park space and civic uses) – 5 to 15 percent of total land
area
- Commercial retail space – 10 to 50 percent of total land area
- Residential development – 30 to 80 percent of total land area
- Employment – 20 to 60 percent of total land area
24
Figure 2.15: Typical mixing of uses in urban and suburban neighborhood (Vernez-
Moudon et al., 2003)
Land use mix can occur vertically or horizontally at the parcel level. A vertical mix of
use is possible when two or more land uses exist in a single building (Figure 2.16). It
is convenient and successful in dense commercial areas with high pedestrian
activity (Vernez-Moudon et al., 2003).
25
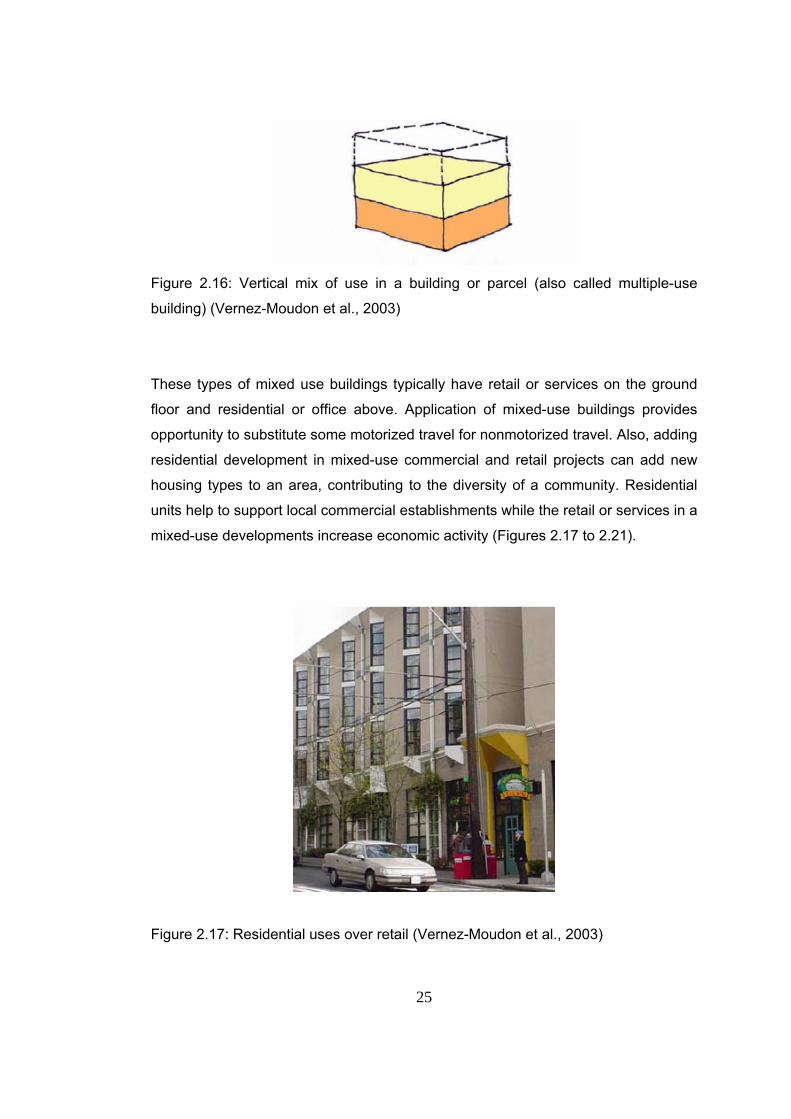
Figure 2.16: Vertical mix of use in a building or parcel (also called multiple-use
building) (Vernez-Moudon et al., 2003)
These types of mixed use buildings typically have retail or services on the ground
floor and residential or office above. Application of mixed-use buildings provides
opportunity to substitute some motorized travel for nonmotorized travel. Also, adding
residential development in mixed-use commercial and retail projects can add new
housing types to an area, contributing to the diversity of a community. Residential
units help to support local commercial establishments while the retail or services in a
mixed-use developments increase economic activity (Figures 2.17 to 2.21).
Figure 2.17: Residential uses over retail (Vernez-Moudon et al., 2003)
26
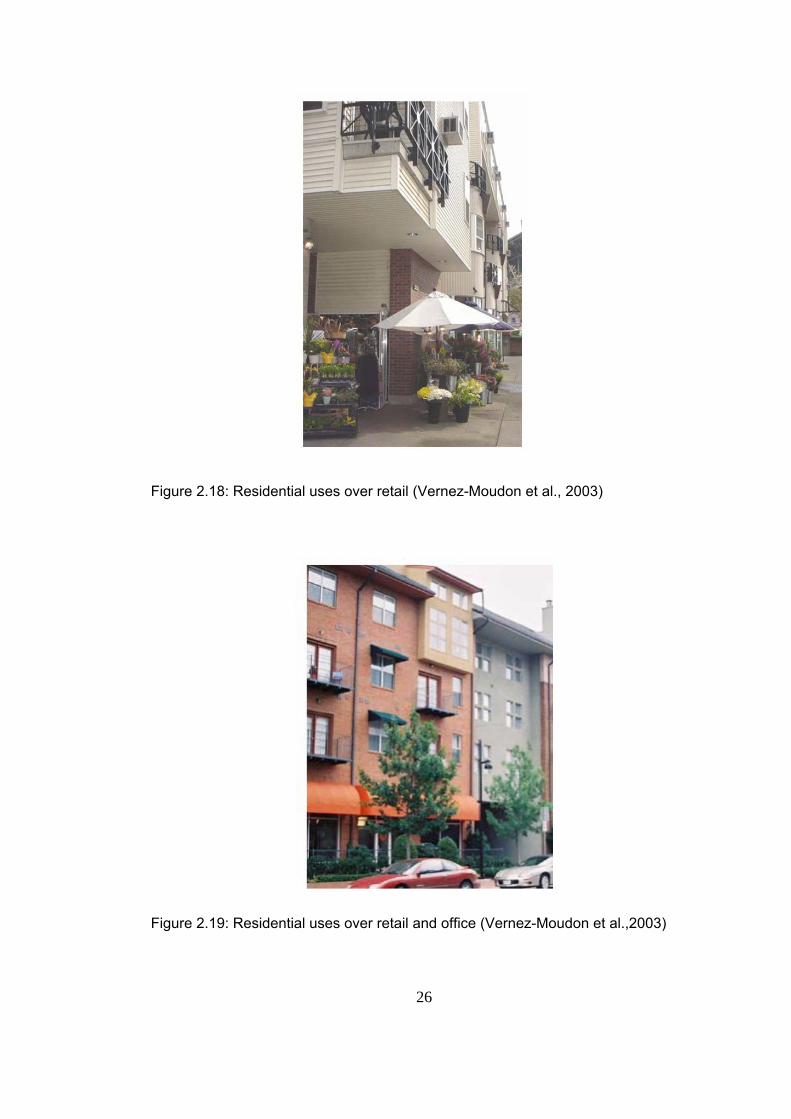
Figure 2.18: Residential uses over retail (Vernez-Moudon et al., 2003)
Figure 2.19: Residential uses over retail and office (Vernez-Moudon et al.,2003)
27
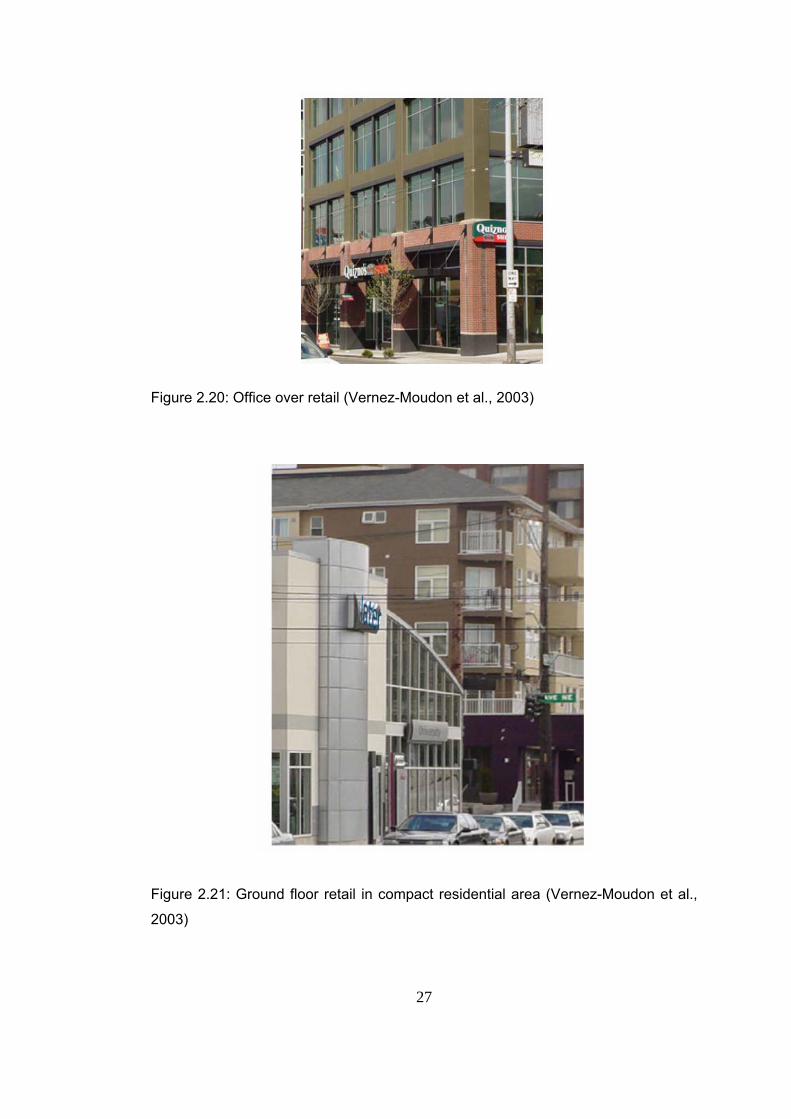
Figure 2.20: Office over retail (Vernez-Moudon et al., 2003)
Figure 2.21: Ground floor retail in compact residential area (Vernez-Moudon et al.,
2003)
28
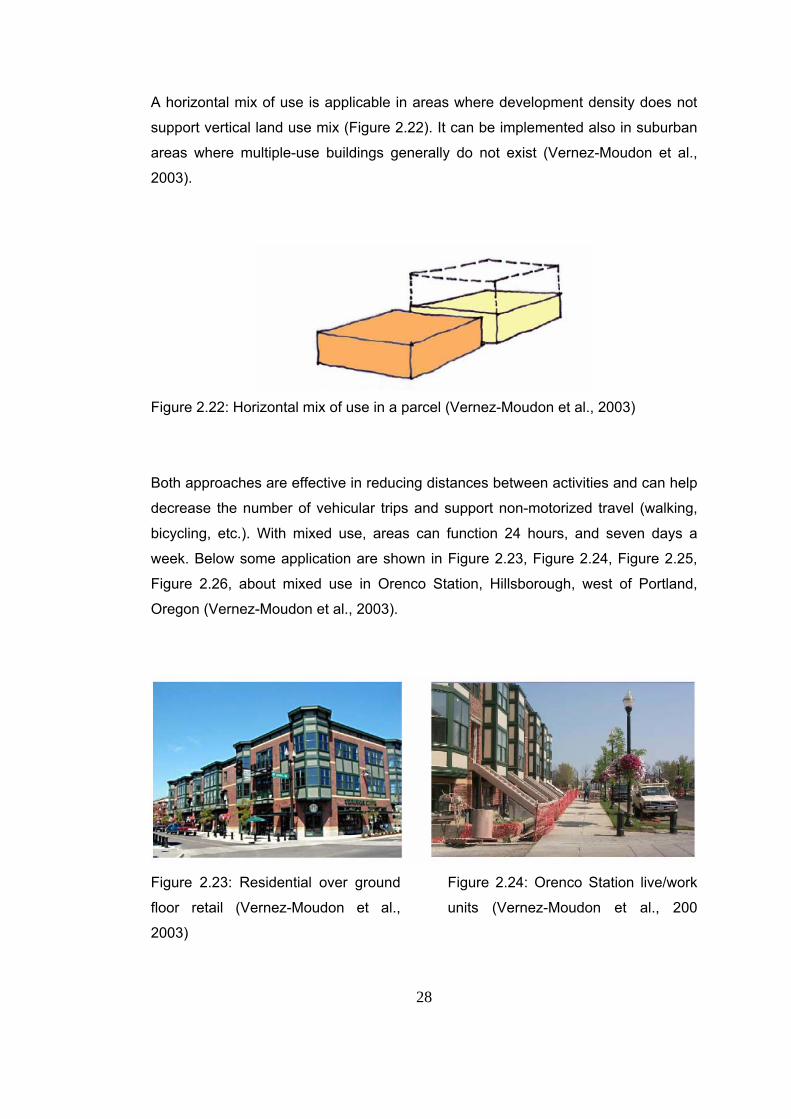
A horizontal mix of use is applicable in areas where development density does not
support vertical land use mix (Figure 2.22). It can be implemented also in suburban
areas where multiple-use buildings generally do not exist (Vernez-Moudon et al.,
2003).
Figure 2.22: Horizontal mix of use in a parcel (Vernez-Moudon et al., 2003)
Both approaches are effective in reducing distances between activities and can help
decrease the number of vehicular trips and support non-motorized travel (walking,
bicycling, etc.). With mixed use, areas can function 24 hours, and seven days a
week. Below some application are shown in Figure 2.23, Figure 2.24, Figure 2.25,
Figure 2.26, about mixed use in Orenco Station, Hillsborough, west of Portland,
Oregon (Vernez-Moudon et al., 2003).
Figure 2.23: Residential over ground
floor retail (Vernez-Moudon et al.,
2003)
Figure 2.24: Orenco Station live/work
units (Vernez-Moudon et al., 200
29
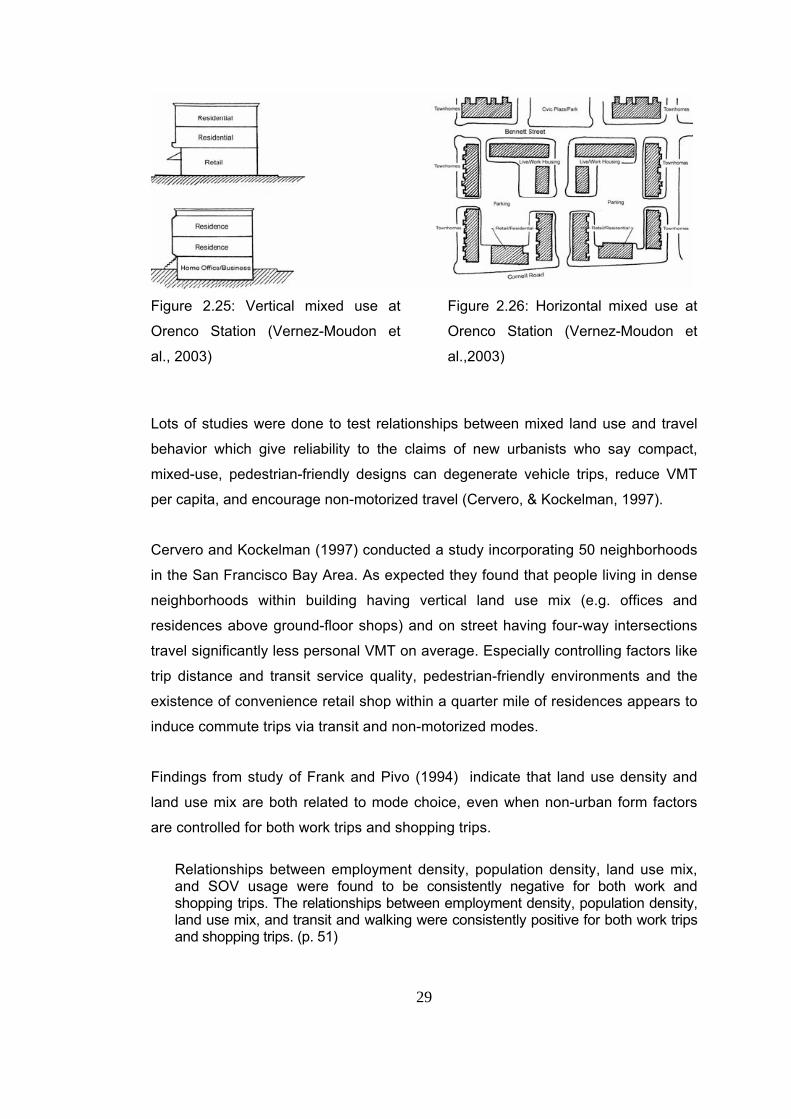
Figure 2.25: Vertical mixed use at
Orenco Station (Vernez-Moudon et
al., 2003)
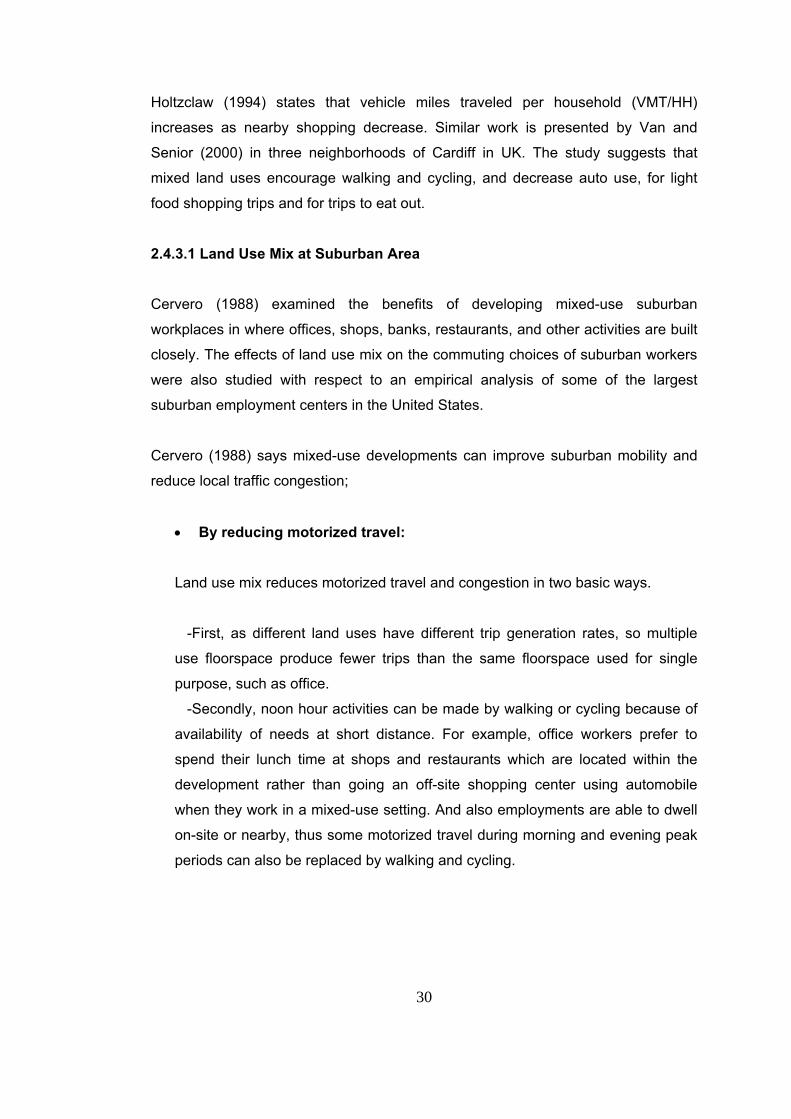
Figure 2.26: Horizontal mixed use at
Orenco Station (Vernez-Moudon et
al.,2003)
Lots of studies were done to test relationships between mixed land use and travel
behavior which give reliability to the claims of new urbanists who say compact,
mixed-use, pedestrian-friendly designs can degenerate vehicle trips, reduce VMT
per capita, and encourage non-motorized travel (Cervero, & Kockelman, 1997).
Cervero and Kockelman (1997) conducted a study incorporating 50 neighborhoods
in the San Francisco Bay Area. As expected they found that people living in dense
neighborhoods within building having vertical land use mix (e.g. offices and
residences above ground-floor shops) and on street having four-way intersections
travel significantly less personal VMT on average. Especially controlling factors like
trip distance and transit service quality, pedestrian-friendly environments and the
existence of convenience retail shop within a quarter mile of residences appears to
induce commute trips via transit and non-motorized modes.
Findings from study of Frank and Pivo (1994) indicate that land use density and
land use mix are both related to mode choice, even when non-urban form factors
are controlled for both work trips and shopping trips.
Relationships between employment density, population density, land use mix, and SOV usage were found to be consistently negative for both work and shopping trips. The relationships between employment density, population density, land use mix, and transit and walking were consistently positive for both work trips and shopping trips. (p. 51)
30
Holtzclaw (1994) states that vehicle miles traveled per household (VMT/HH)
increases as nearby shopping decrease. Similar work is presented by Van and
Senior (2000) in three neighborhoods of Cardiff in UK. The study suggests that
mixed land uses encourage walking and cycling, and decrease auto use, for light
food shopping trips and for trips to eat out.
2.4.3.1 Land Use Mix at Suburban Area
Cervero (1988) examined the benefits of developing mixed-use suburban
workplaces in where offices, shops, banks, restaurants, and other activities are built
closely. The effects of land use mix on the commuting choices of suburban workers
were also studied with respect to an empirical analysis of some of the largest
suburban employment centers in the United States.
Cervero (1988) says mixed-use developments can improve suburban mobility and
reduce local traffic congestion;
• By reducing motorized travel:
Land use mix reduces motorized travel and congestion in two basic ways.
-First, as different land uses have different trip generation rates, so multiple
use floorspace produce fewer trips than the same floorspace used for single
purpose, such as office.
-Secondly, noon hour activities can be made by walking or cycling because of
availability of needs at short distance. For example, office workers prefer to
spend their lunch time at shops and restaurants which are located within the
development rather than going an off-site shopping center using automobile
when they work in a mixed-use setting. And also employments are able to dwell
on-site or nearby, thus some motorized travel during morning and evening peak
periods can also be replaced by walking and cycling.
31
• By spreading trips out more evenly throughout the day:
With a combination of office, retail, recreational, and other land uses on a site,
distribution of trips becomes more equally during the day and week. In contrast,
with a single land use, many trips intensify in the morning and evening peak
hours. Mixed use development also enable efficient use of infrastructure thus
reduces the need to expand roads serving suburban job centers.
• By encouraging more workers to carpool and vanpool:
Mixed use development can also be a boon to ridesharing. Unless restaurants, shops, and banks are located nearby, most workers will find it necessary to drive their own cars in order to reach lunch-time destinations and run midday and after-work errands. From a mobility standpoint, the addition of noon-hour traffic usually poses few problems. Rather, problems are encountered during the peak hours because of the surfeit of automobiles with a single occupant who drives in order to have a car available during the day and after work (p. 432)
• By allowing shared-use parking arrangements:
Mixed land use can allow shared parking arrangements which can reduce the
project size and help creation of pedestrian friendly environment. Different land
uses need parking space at different time periods. For example the same
parking facility used by office workers from 8-5 on weekdays can serve
restaurant and cinema during the evening and on weekends provided that
offices, stores, and cinema lie in reasonable proximity to one another. This
shared use can reduce the space needed for parking 20 to 30 percent, so
overall size of a project might be scaled down which helps to control sprawl and
encourage more walk trips.
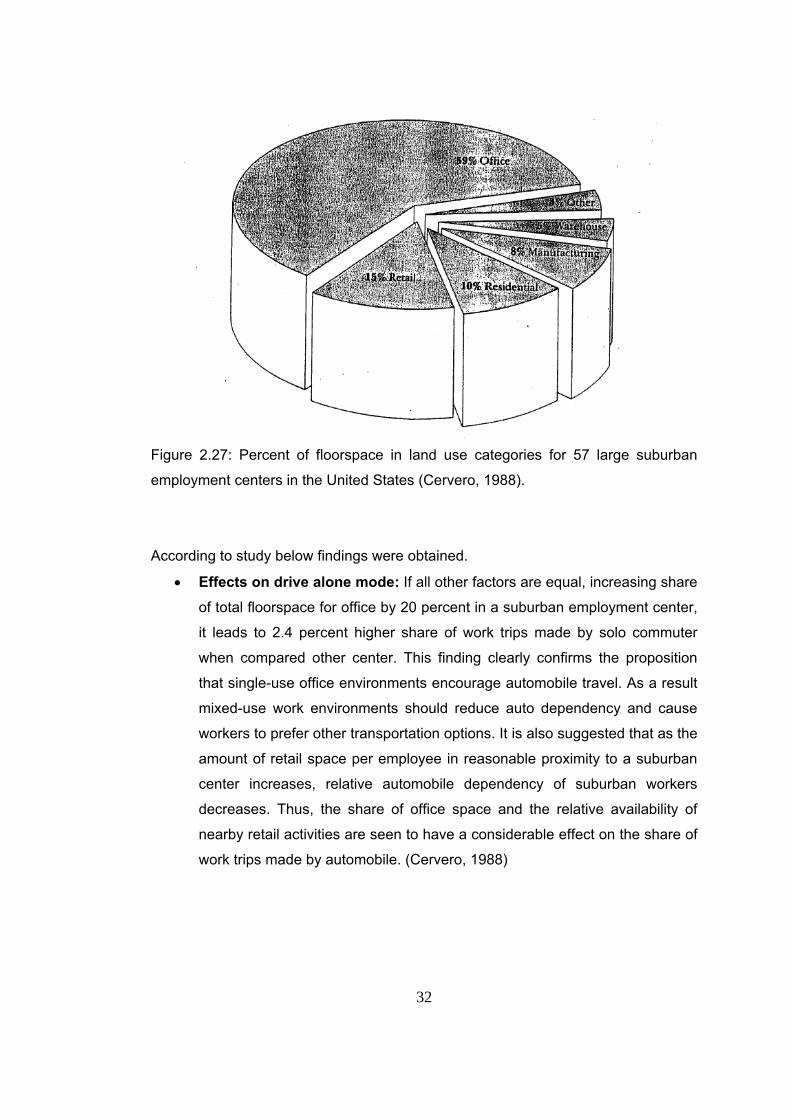
Cervero (1988) developed a series of stepwise regression models in order to find
out how the degree of land use variation influences the modes that suburban
workers choose. Percent of floorspace in land use categories for 57 large suburban
employment centers which are examined in study is given in Figure 2.27 below.
32
Figure 2.27: Percent of floorspace in land use categories for 57 large suburban
employment centers in the United States (Cervero, 1988).
According to study below findings were obtained.
• Effects on drive alone mode: If all other factors are equal, increasing share
of total floorspace for office by 20 percent in a suburban employment center,
it leads to 2.4 percent higher share of work trips made by solo commuter
when compared other center. This finding clearly confirms the proposition
that single-use office environments encourage automobile travel. As a result
mixed-use work environments should reduce auto dependency and cause
workers to prefer other transportation options. It is also suggested that as the
amount of retail space per employee in reasonable proximity to a suburban
center increases, relative automobile dependency of suburban workers
decreases. Thus, the share of office space and the relative availability of
nearby retail activities are seen to have a considerable effect on the share of
work trips made by automobile. (Cervero, 1988)
33
• Effects on rideshare: When jobs and housing units are imbalance that is to
say that there is relative shortages of nearby housing, employees are more
likely to live farther away, so vehicle-pool is needed. When housing is
available nearby, relatively less commutes will be made in carpools or
vanpools. So, jobs-housing balances can make converse effect on
carpooling and vanpooling. For short distances, ridesharing is unattractive
because picking up passengers is viewed as time consuming activity.
Because of this, balancing jobs and housing growth may not necessarily
reduce solo commuting. It might even induce some people to drive to work.
In a balanced environment, even more commuters can prefer driving
because of short distance, because of the fact that they use local streets it
would not affect through traffic on freeways. Other primary benefit of jobs
housing balances, of course, is that it encourages some employees to walk
or cycle to work. (Cervero, 1988)
• Effects on walking-cycling: Walking and cycling trips are more likely to
occur as floorspace used for retail activities increases in suburban
employment center. The availability of retail activities, provide some workers
to do personal business on foot, without being dependent on automobile.
(Cervero, 1988)
Cervero (1991) conducted another study which investigates effects of single /mixed
use buildings to travel behavior in suburban employment centers including six U.S.
metropolitan areas. Required data was compiled for 83 randomly sampled individual
buildings in the following suburban activity centers: Bellevue, Washington (near
Seattle), 10 buildings; South Coast Metro (Orange County, California), buildings;
Parkway Center (in northern Dallas), 12 buildings; Perimeter Center (north of
Atlanta), 15 buildings; Tysons Corner (outside of Washington, D.C.), 16 buildings;
and Southdale (near Minneapolis), 19 buildings. The 83 examined buildings were
devoted only to office functions or to mixture of office, retail, and other functions. So,
cases could be easily assigned as single-use office or mixed-office/retail sites. The
study try to find the influence of project size, density, land use mix, and parking
facilities on three measures of transportation demand: trip generation rates, work-
trip mode splits, and automobile occupancy levels.
34
Findings from the study about land use mix can be summarized as follow:
• Mixed-use buildings are associated with low vehicle-trip generation rates
since encourage employees to vanpool and carpool to work and reduce
need of automobile providing on site retail shops etc.
• Existence of a retail component within a suburban office building can
decrease vehicle-trip rates per employee by about 8 percent.
• Average vehicle occupancy is higher in mixed use buildings.
• Mixed-use activities have a relatively important positive influence on walking
to work in suburbia.
• Transit share is greater in mixed-use and multi-story buildings. (Cervero,
1991)
2.4.3.2 Jobs-housing balance Cervero (1989) says that it is easier to define what jobs-housing imbalance is than to
define what jobs-housing balance is. If workers commute over an hour each day
because of unaffordable or insufficient housing within reasonable proximity of their
workplaces, this means jobs - housing balance could not be achieved. The jobs-
housing balancing is breaking down the barriers that are forcing people to
accommodate farther from their workplaces than they would choose. (Cervero, 1989).
Cervero (1989) expresses benefits of jobs-housing balance as follows:
• The existence of affordable housing closer to suburban job centers increases
the residential opportunities. So commute distances can be shortened,
consequently vehicle miles traveled decrease.
• The share of walking and cycling increase by means of shortened commute
distance.
• Jobs-housing balance segregate neighborhood traffic from regional through
traffic, in such a way that bringing people and jobs closer together reduces the
number of autos entering regional traffic flows since motorists do not have to
leave the local street network.
35
• Congestion, energy consumption and the emission of vehicle pollutants
decrease because of reasons given in the above items.
Cervero (1989) explains reasons behind jobs-housing imbalance based on Suburban
Chicago. He claims that region's imbalance can be attributed to the shortage of
affordable housing suited to the income level of local employment, and restrictive
zoning and the congestion problems comes out sharing the same limited freeways to
commute long distances by thousands of workers.
He gives proposals to set jobs-housing balance as follows.
• To prevent segregation, zoning should be “turned on its head”, this means
integration of different land uses.
• A new office project may be allowed provided that it is located within a specified
radius of an existing high-density residential area.
• Multifamily and moderate-income housing can be encouraged by allowing de-
velopers to increase densities, giving tax credits to mixed-use projects etc
(Cervero, 1989).
2.4.4 From Roadway Design Point of View
Streets are public areas for many activities and functions. They provide paths for
walking, places for talking, rights of way for utilities, and facility for the movement,
stopping and storage of motor vehicles (Deakin, Homburger, Bosselman, Smith and
Beukers, 1989).
Streets evolved over many centuries to perform two transportation functions: provision of access to individual parcels of land, and provision of an infrastructure for movement between various origins and destinations. However these functions make competing demands on the street; in most situations a trade of must be made as to the relative importance of access and movement. • Access can be interpreted to include the existence of driveways connecting the street with private property and the availability of part of the street for parking and loading. • Movement comprises both the capacity to move quantities of vehicles or people and the ability to do so at a reasonably high speed (Deakin et al., 1989, p. 21).
The relationship between access and movement function of streets is shown in
Figure 2.28.
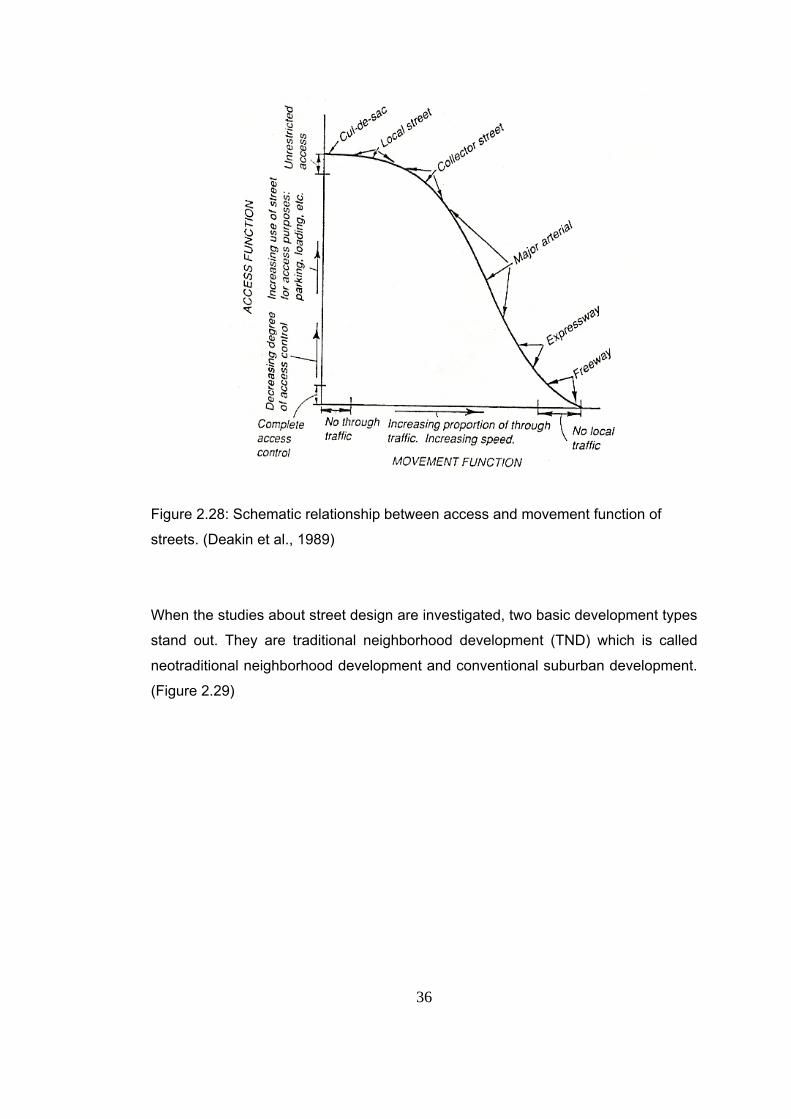
36
Figure 2.28: Schematic relationship between access and movement function of
streets. (Deakin et al., 1989)
When the studies about street design are investigated, two basic development types
stand out. They are traditional neighborhood development (TND) which is called
neotraditional neighborhood development and conventional suburban development.
(Figure 2.29)
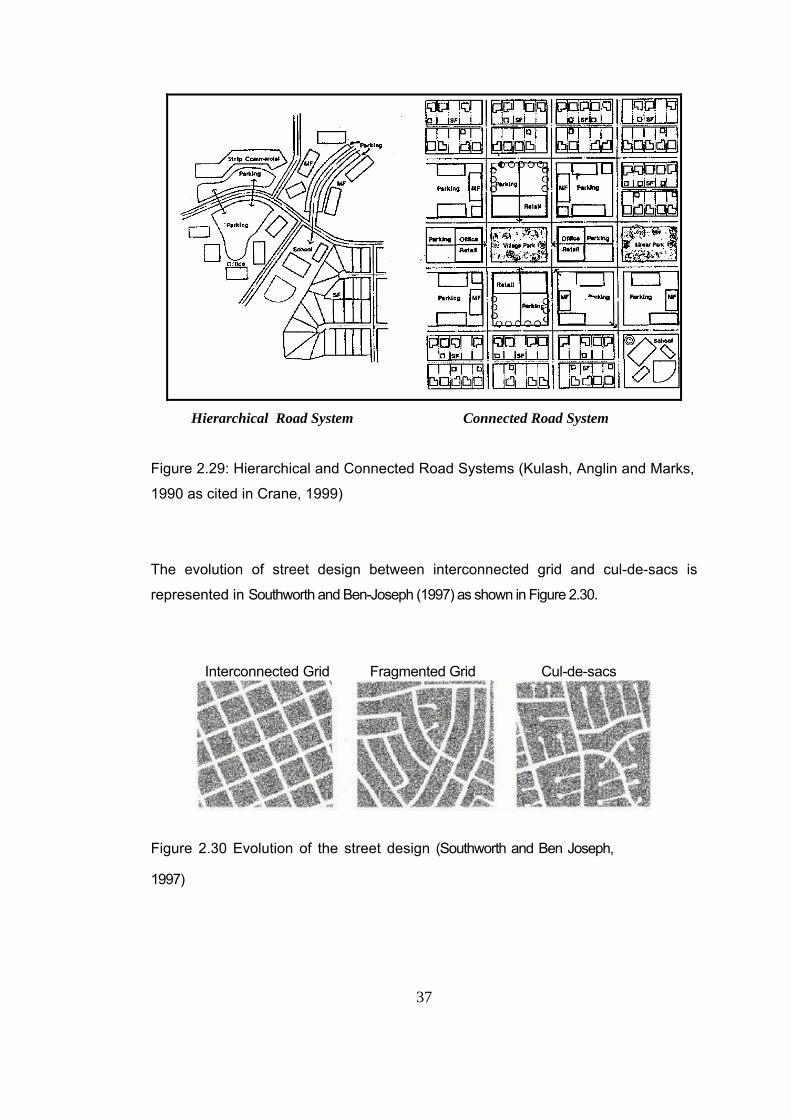
37
Hierarchical Road System Connected Road System
Figure 2.29: Hierarchical and Connected Road Systems (Kulash, Anglin and Marks,
1990 as cited in Crane, 1999)
The evolution of street design between interconnected grid and cul-de-sacs is
represented in Southworth and Ben-Joseph (1997) as shown in Figure 2.30.
Interconnected Grid Fragmented Grid Cul-de-sacs
Figure 2.30 Evolution of the street design (Southworth and Ben Joseph,
1997)
38
Conventional suburban development, favored during the 1960s through the 1990s,
has a roadway design which is composed of a poorly-connected, hierarchical
network, with many cul-de-sacs. (Figure 2.29) This increases the amount of travel
required to reach destinations, channels traffic onto arterials, and creates barriers to
walking and cycling. A hierarchical road network emphasizes mobility by supporting
higher traffic volumes and speeds on fewer roads (VTPI, 2005g). In such a way that,
in the conventional system, the first level of the hierarchy is local streets, intended
for direct property access. The second level is the collector, intended to gather traffic
from local streets and transfer it to the final level. The final level is the arterial street
which serves longer distance mobility and does not aim to serve as direct access to
properties. As for left turn, the conventional suburban development design permits
left-turn movements at a few major intersections which need multiphase signals. So
long traffic signal delays at intersections are inseperable parts of this design
(Kulash, 1990).
Traditional or neotraditional neighborhood development which has evolved since the
1970’s features many of the properties of urban designs of 50 to 100 years ago
(Kulash, 1990). A small, connected, dense road network which is a part of
neotraditional design emphasizes accessibility by providing more direct travel with
traffic distributed over more roads, offering more routes and making nonmotorized
modes more feasible. (VTPI, 2005g) In other words the TND trips, which use minor
arterial, collector and local streets, are characterized by low maximum speed, more
frequent short delays at intersections and a greater number of turning movements
(Kulash, 1990) (Figure 2.29). So, having improved connectivity, neotraditional
neighborhood is a part of new urbanism and smart growth land use policies (VTPI,
2005g).
Features of TND are denoted in Kulash (1990) as follows:
Network of streets: The TND has a highly connected dense street network which
means many available routes for a certain trip. If the primary route for a trip is
unavailable because of traffic conditions, alternates can be used. The dense
network is in contrast with the hierarchical pattern of most suburban development.
39
Street cross-section: Street cross-sections in the TND that are not greater than
two travel lanes plus on-street parking place, which means a maximum pavement
width of 40 feet1.
Reduced or non-existent hierarchy of streets: The TND either reduces or
eliminates the hierarchy of conventional functional classifications related with
streets.
Lateral clearance: TND allows and even encourages the reduction in lateral
clearance between street and the fixed objects (trees, street furniture) on the side of
the street.
On-street parking: On-street parallel parking is one of the main principles of TND.
This parking is designed to provide buffer area to pedestrians on the sidewalk, to
provide street activity and also for the supply of parking although this parking source
can serve only a small part of the overall parking demand in a business district, and
finally to enclose the sidewalk space.
Short traffic signal cycles: Traffic signal periods are less than 60 seconds in
accordance with TND. Short traffic signals are convenient for pedestrian activity
creating more frequent gaps in traffic for pedestrian crossings.
Two-phase signals: These signals simply turn green for the entire traffic, with no
turn arrows. These are convenient for dense street network, because of availability
of more locations for left-turn movements. Two-phase operation facilitates a reduced
cycle time.
Curb radius: TND uses reduced curb radius, at intersections to decrease the speed
of turning automobiles and to decrease the walking distance for pedestrians
crossing the street. (Kulash, 1990)
2.4.4.1 Roadway Connectivity Connectivity means the directness of links and the density of connections in path or
1 1 feet=0.3048 m
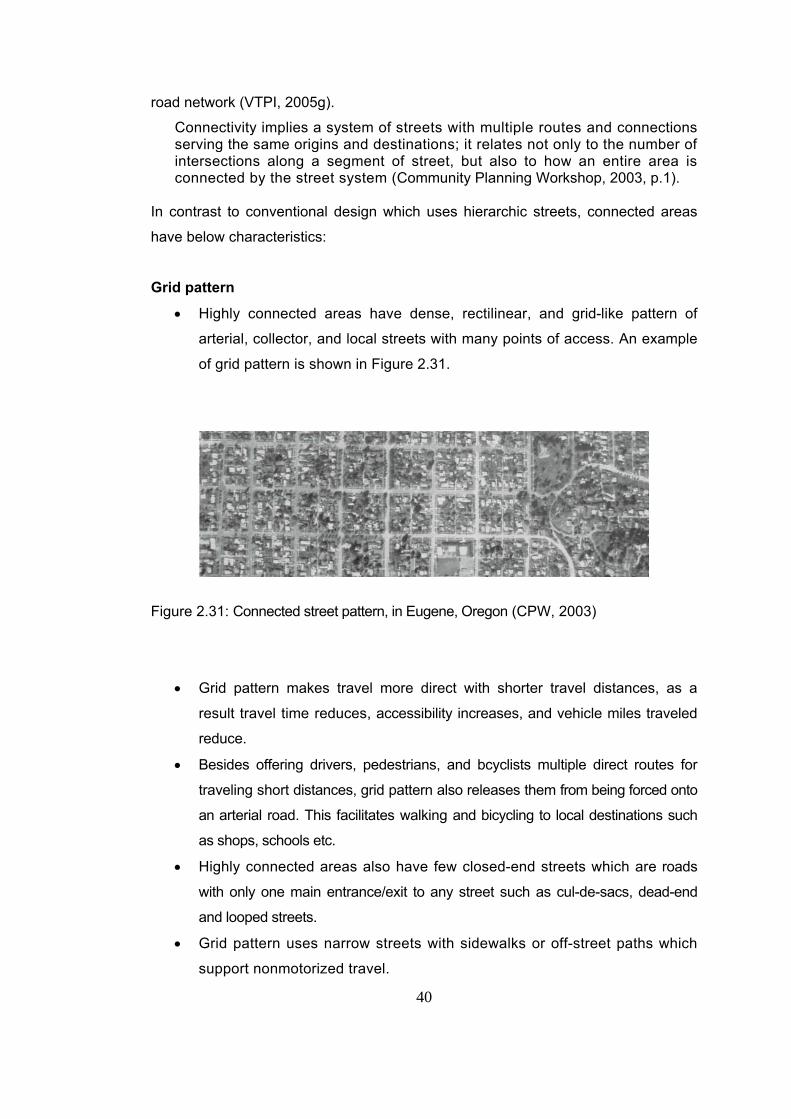
40
road network (VTPI, 2005g).
Connectivity implies a system of streets with multiple routes and connections serving the same origins and destinations; it relates not only to the number of intersections along a segment of street, but also to how an entire area is connected by the street system (Community Planning Workshop, 2003, p.1).
In contrast to conventional design which uses hierarchic streets, connected areas
have below characteristics:
Grid pattern
• Highly connected areas have dense, rectilinear, and grid-like pattern of
arterial, collector, and local streets with many points of access. An example
of grid pattern is shown in Figure 2.31.
Figure 2.31: Connected street pattern, in Eugene, Oregon (CPW, 2003)
• Grid pattern makes travel more direct with shorter travel distances, as a
result travel time reduces, accessibility increases, and vehicle miles traveled
reduce.
• Besides offering drivers, pedestrians, and bcyclists multiple direct routes for
traveling short distances, grid pattern also releases them from being forced onto
an arterial road. This facilitates walking and bicycling to local destinations such
as shops, schools etc.
• Highly connected areas also have few closed-end streets which are roads
with only one main entrance/exit to any street such as cul-de-sacs, dead-end
and looped streets.
• Grid pattern uses narrow streets with sidewalks or off-street paths which
support nonmotorized travel.
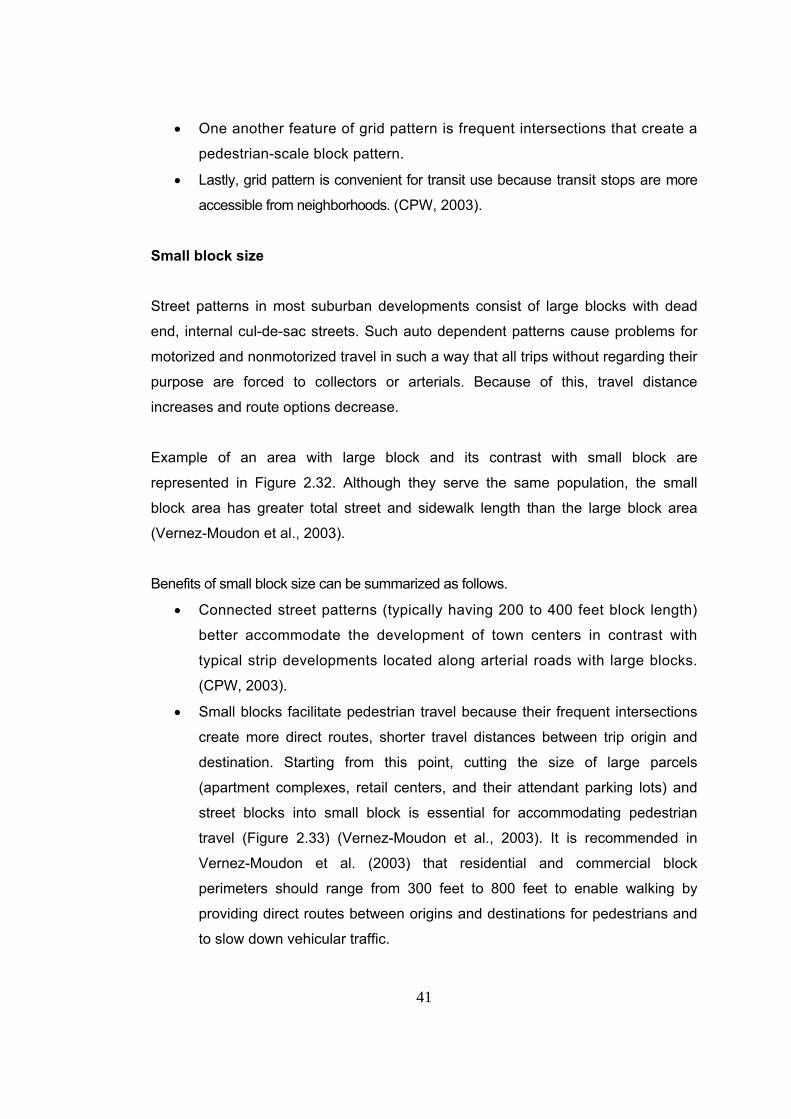
41
• One another feature of grid pattern is frequent intersections that create a
pedestrian-scale block pattern.
• Lastly, grid pattern is convenient for transit use because transit stops are more
accessible from neighborhoods. (CPW, 2003).
Small block size Street patterns in most suburban developments consist of large blocks with dead
end, internal cul-de-sac streets. Such auto dependent patterns cause problems for
motorized and nonmotorized travel in such a way that all trips without regarding their
purpose are forced to collectors or arterials. Because of this, travel distance
increases and route options decrease.
Example of an area with large block and its contrast with small block are
represented in Figure 2.32. Although they serve the same population, the small
block area has greater total street and sidewalk length than the large block area
(Vernez-Moudon et al., 2003).
Benefits of small block size can be summarized as follows.
• Connected street patterns (typically having 200 to 400 feet block length)
better accommodate the development of town centers in contrast with
typical strip developments located along arterial roads with large blocks.
(CPW, 2003).
• Small blocks facilitate pedestrian travel because their frequent intersections
create more direct routes, shorter travel distances between trip origin and
destination. Starting from this point, cutting the size of large parcels
(apartment complexes, retail centers, and their attendant parking lots) and
street blocks into small block is essential for accommodating pedestrian
travel (Figure 2.33) (Vernez-Moudon et al., 2003). It is recommended in
Vernez-Moudon et al. (2003) that residential and commercial block
perimeters should range from 300 feet to 800 feet to enable walking by
providing direct routes between origins and destinations for pedestrians and
to slow down vehicular traffic.
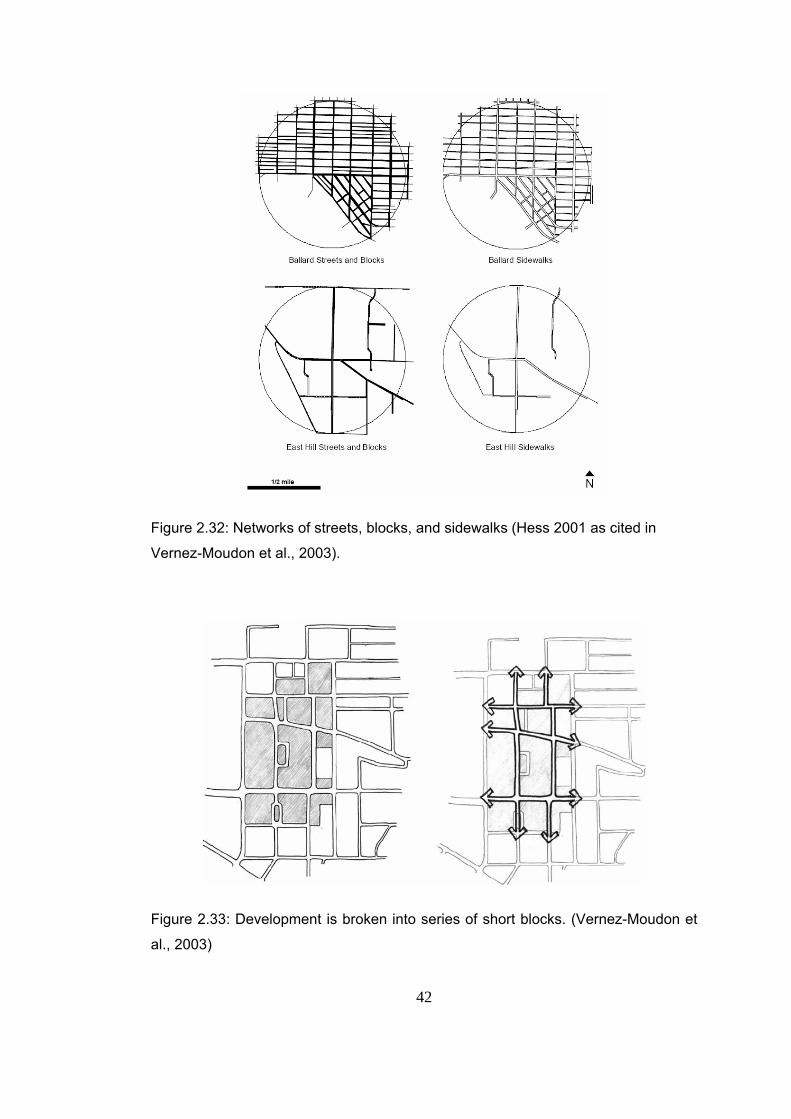
42
Figure 2.32: Networks of streets, blocks, and sidewalks (Hess 2001 as cited in
Vernez-Moudon et al., 2003).
Figure 2.33: Development is broken into series of short blocks. (Vernez-Moudon et
al., 2003)
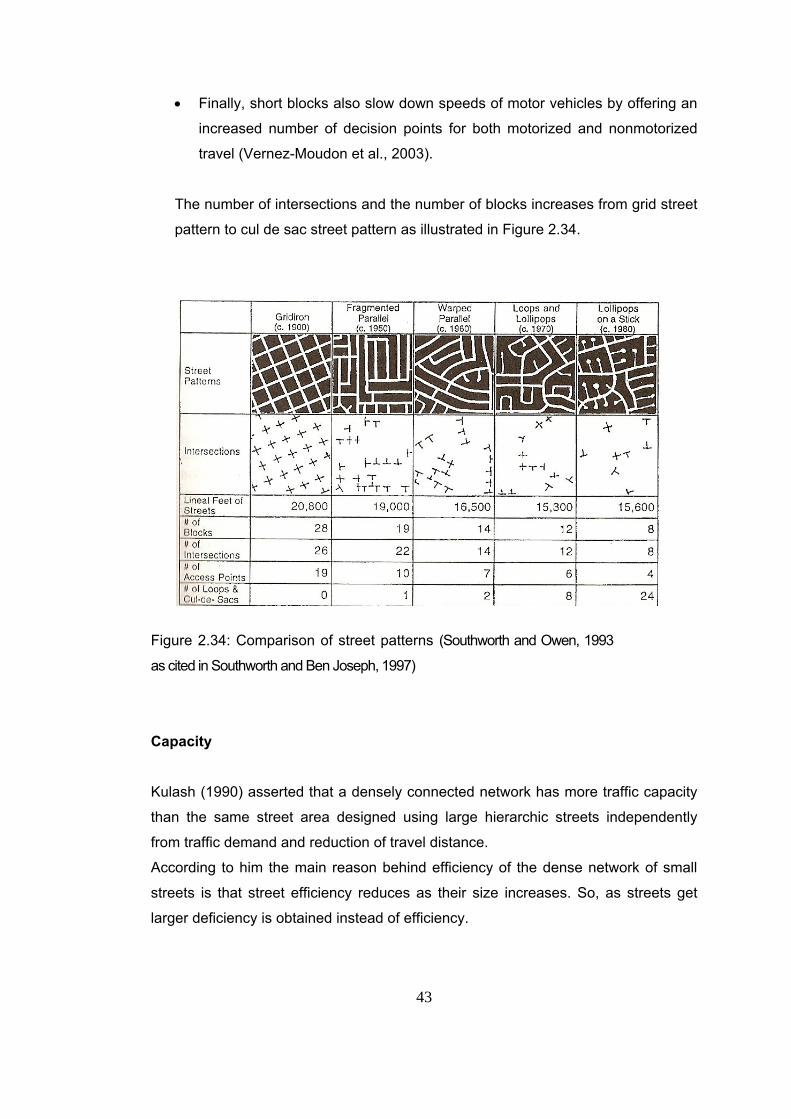
43
• Finally, short blocks also slow down speeds of motor vehicles by offering an
increased number of decision points for both motorized and nonmotorized
travel (Vernez-Moudon et al., 2003).
The number of intersections and the number of blocks increases from grid street
pattern to cul de sac street pattern as illustrated in Figure 2.34.
Figure 2.34: Comparison of street patterns (Southworth and Owen, 1993
as cited in Southworth and Ben Joseph, 1997)
Capacity Kulash (1990) asserted that a densely connected network has more traffic capacity
than the same street area designed using large hierarchic streets independently
from traffic demand and reduction of travel distance. According to him the main reason behind efficiency of the dense network of small
streets is that street efficiency reduces as their size increases. So, as streets get
larger deficiency is obtained instead of efficiency.
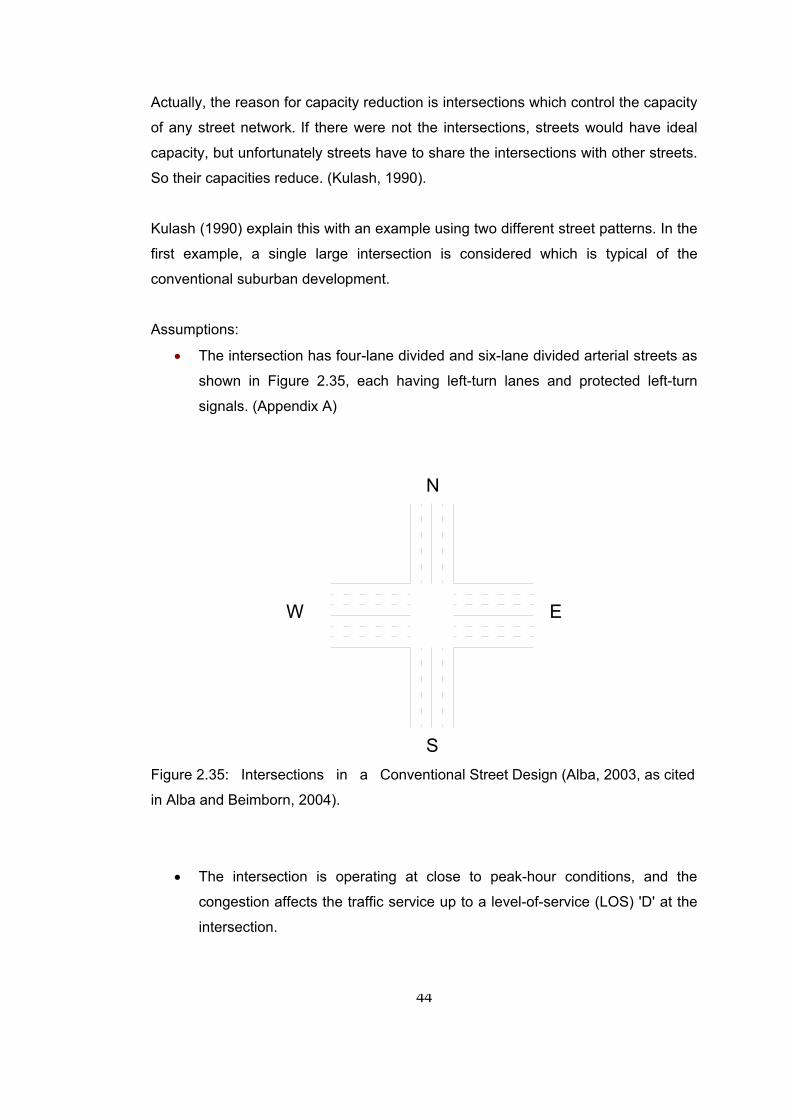
44
Actually, the reason for capacity reduction is intersections which control the capacity
of any street network. If there were not the intersections, streets would have ideal
capacity, but unfortunately streets have to share the intersections with other streets.
So their capacities reduce. (Kulash, 1990).
Kulash (1990) explain this with an example using two different street patterns. In the
first example, a single large intersection is considered which is typical of the
conventional suburban development.
Assumptions:
• The intersection has four-lane divided and six-lane divided arterial streets as
shown in Figure 2.35, each having left-turn lanes and protected left-turn
signals. (Appendix A)
N
S
EW
Figure 2.35: Intersections in a Conventional Street Design (Alba, 2003, as cited
in Alba and Beimborn, 2004).
• The intersection is operating at close to peak-hour conditions, and the
congestion affects the traffic service up to a level-of-service (LOS) 'D' at the
intersection.
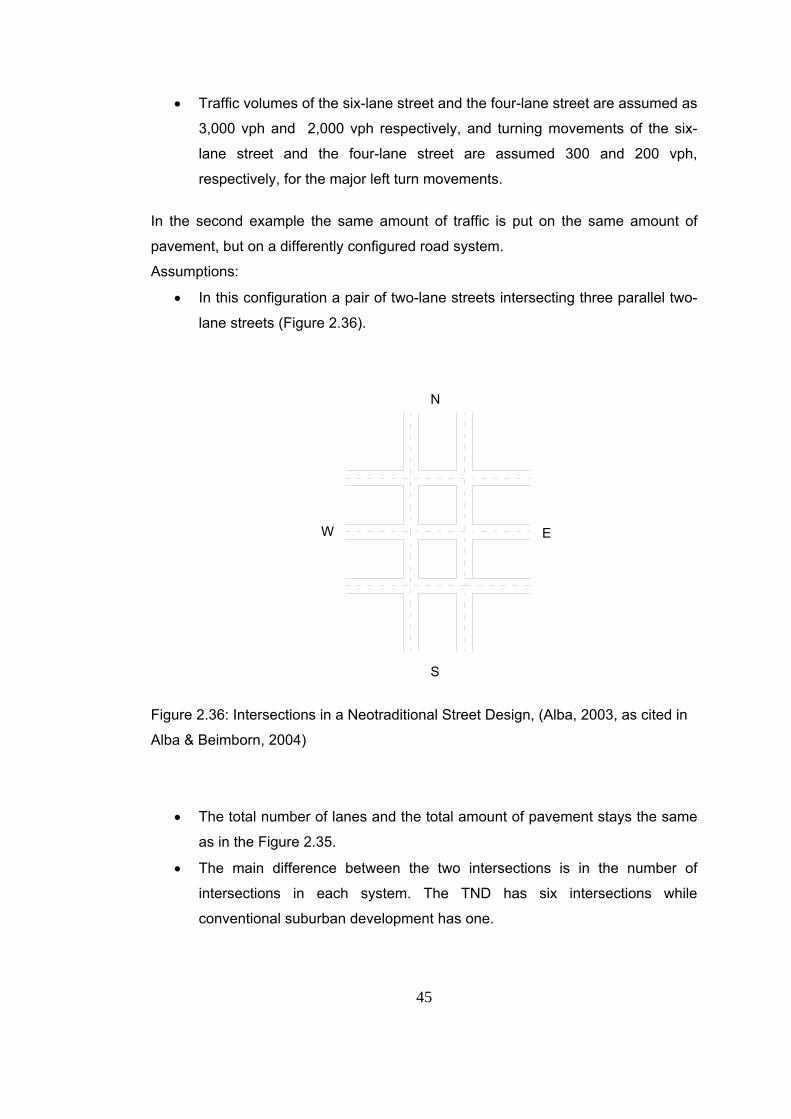
45
• Traffic volumes of the six-lane street and the four-lane street are assumed as
3,000 vph and 2,000 vph respectively, and turning movements of the six-
lane street and the four-lane street are assumed 300 and 200 vph,
respectively, for the major left turn movements.
In the second example the same amount of traffic is put on the same amount of
pavement, but on a differently configured road system.
Assumptions:
• In this configuration a pair of two-lane streets intersecting three parallel two-
lane streets (Figure 2.36).
E
N
S
W
Figure 2.36: Intersections in a Neotraditional Street Design, (Alba, 2003, as cited in
Alba & Beimborn, 2004)
• The total number of lanes and the total amount of pavement stays the same
as in the Figure 2.35.
• The main difference between the two intersections is in the number of
intersections in each system. The TND has six intersections while
conventional suburban development has one.
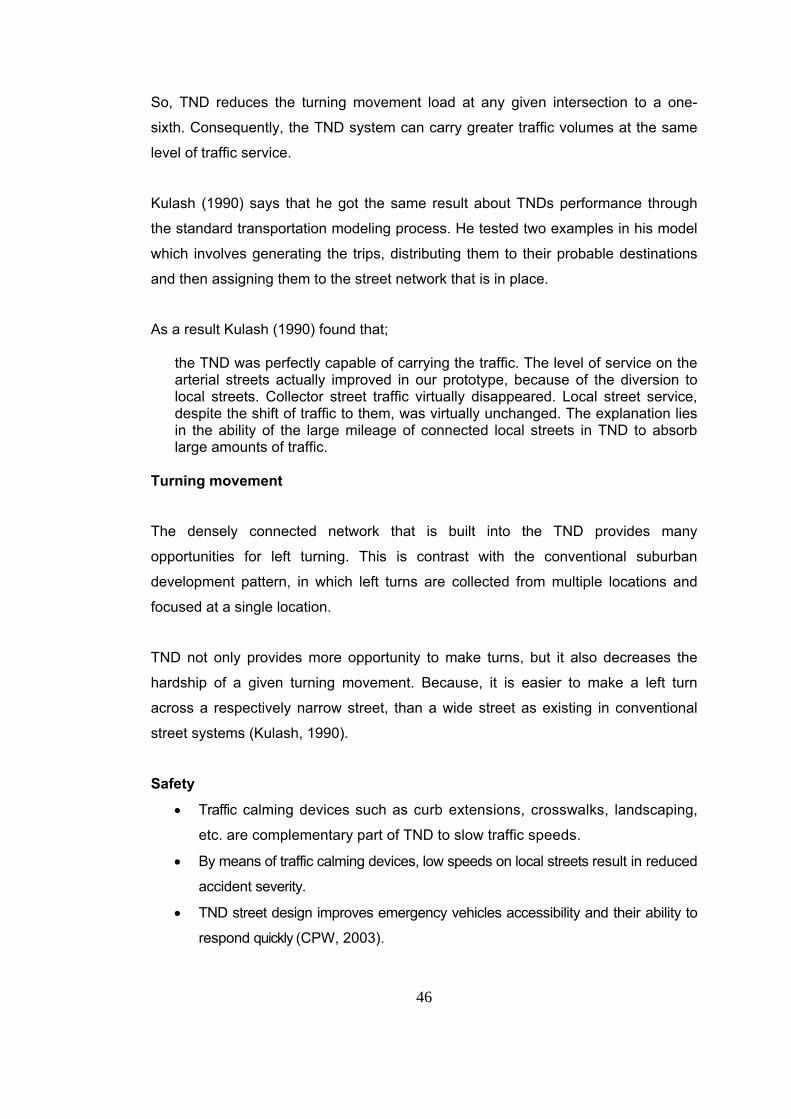
46
So, TND reduces the turning movement load at any given intersection to a one-
sixth. Consequently, the TND system can carry greater traffic volumes at the same
level of traffic service.
Kulash (1990) says that he got the same result about TNDs performance through
the standard transportation modeling process. He tested two examples in his model
which involves generating the trips, distributing them to their probable destinations
and then assigning them to the street network that is in place.
As a result Kulash (1990) found that;
the TND was perfectly capable of carrying the traffic. The level of service on the arterial streets actually improved in our prototype, because of the diversion to local streets. Collector street traffic virtually disappeared. Local street service, despite the shift of traffic to them, was virtually unchanged. The explanation lies in the ability of the large mileage of connected local streets in TND to absorb large amounts of traffic.
Turning movement The densely connected network that is built into the TND provides many
opportunities for left turning. This is contrast with the conventional suburban
development pattern, in which left turns are collected from multiple locations and
focused at a single location.
TND not only provides more opportunity to make turns, but it also decreases the
hardship of a given turning movement. Because, it is easier to make a left turn
across a respectively narrow street, than a wide street as existing in conventional
street systems (Kulash, 1990).
Safety
• Traffic calming devices such as curb extensions, crosswalks, landscaping,
etc. are complementary part of TND to slow traffic speeds.
• By means of traffic calming devices, low speeds on local streets result in reduced
accident severity.
• TND street design improves emergency vehicles accessibility and their ability to
respond quickly (CPW, 2003).
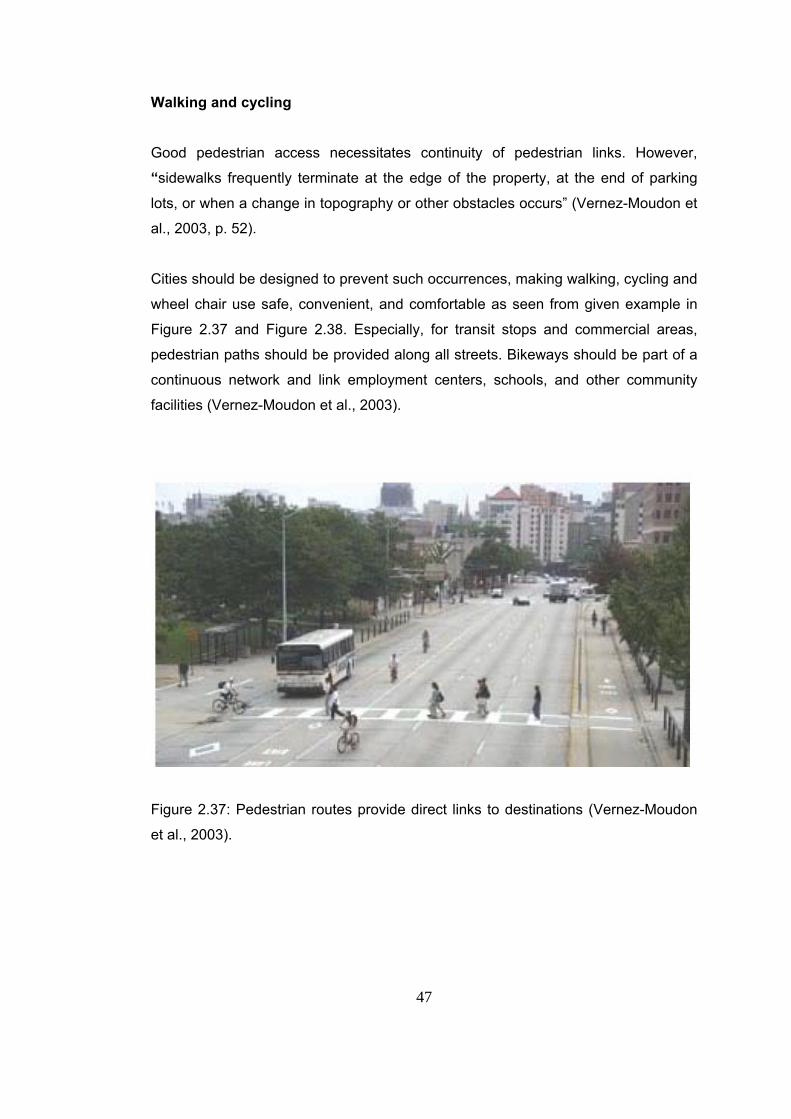
47
Walking and cycling
Good pedestrian access necessitates continuity of pedestrian links. However,
“sidewalks frequently terminate at the edge of the property, at the end of parking
lots, or when a change in topography or other obstacles occurs” (Vernez-Moudon et
al., 2003, p. 52).
Cities should be designed to prevent such occurrences, making walking, cycling and
wheel chair use safe, convenient, and comfortable as seen from given example in
Figure 2.37 and Figure 2.38. Especially, for transit stops and commercial areas,
pedestrian paths should be provided along all streets. Bikeways should be part of a
continuous network and link employment centers, schools, and other community
facilities (Vernez-Moudon et al., 2003).
Figure 2.37: Pedestrian routes provide direct links to destinations (Vernez-Moudon
et al., 2003).
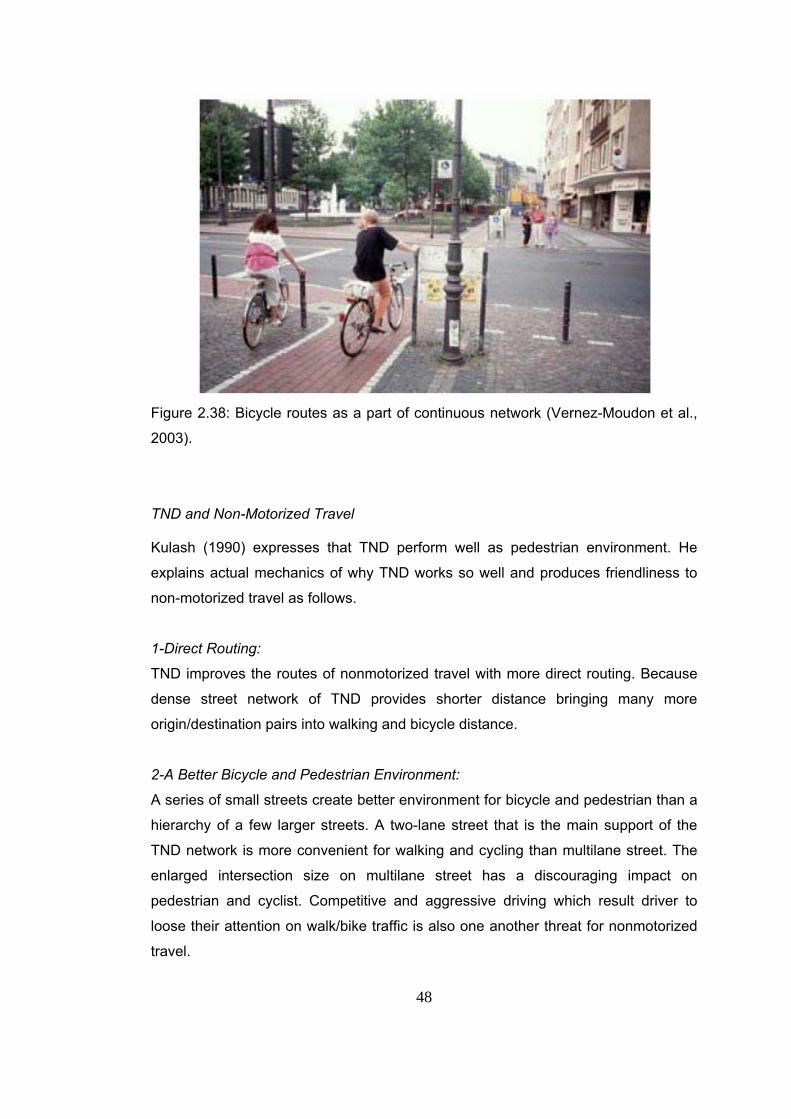
48
Figure 2.38: Bicycle routes as a part of continuous network (Vernez-Moudon et al.,
2003).
TND and Non-Motorized Travel Kulash (1990) expresses that TND perform well as pedestrian environment. He
explains actual mechanics of why TND works so well and produces friendliness to
non-motorized travel as follows.
1-Direct Routing:
TND improves the routes of nonmotorized travel with more direct routing. Because
dense street network of TND provides shorter distance bringing many more
origin/destination pairs into walking and bicycle distance.
2-A Better Bicycle and Pedestrian Environment:
A series of small streets create better environment for bicycle and pedestrian than a
hierarchy of a few larger streets. A two-lane street that is the main support of the
TND network is more convenient for walking and cycling than multilane street. The
enlarged intersection size on multilane street has a discouraging impact on
pedestrian and cyclist. Competitive and aggressive driving which result driver to
loose their attention on walk/bike traffic is also one another threat for nonmotorized
travel.
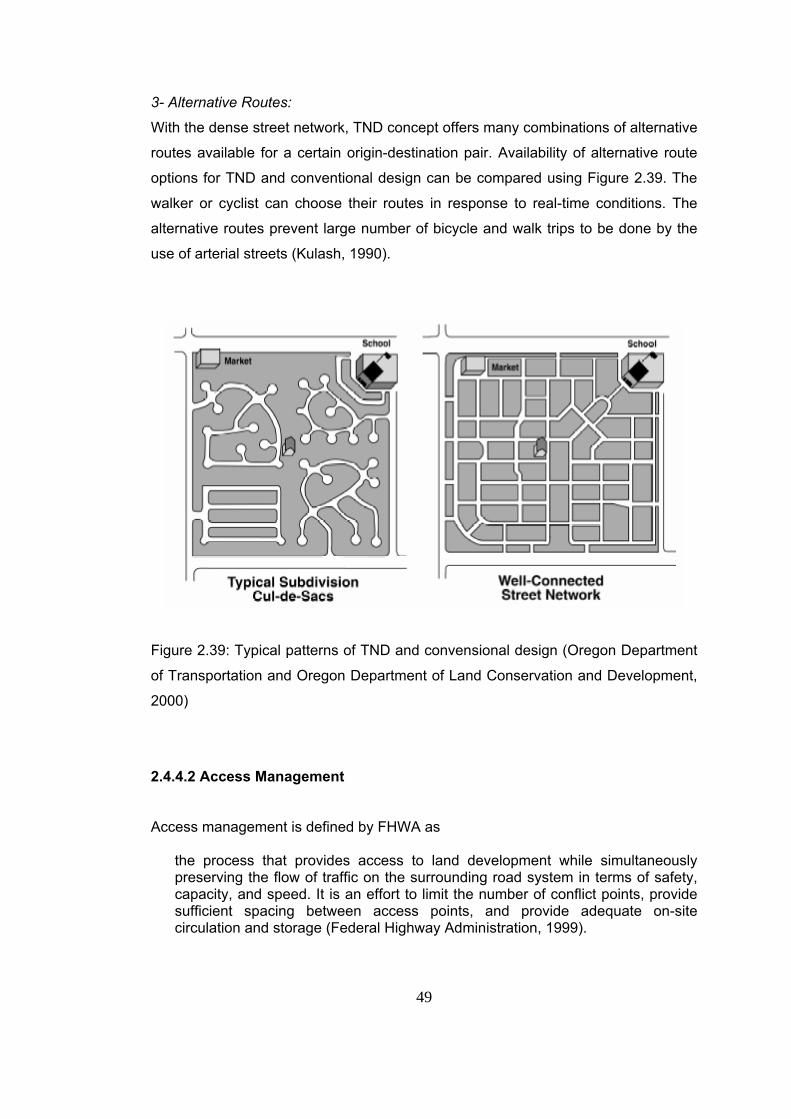
49
3- Alternative Routes:
With the dense street network, TND concept offers many combinations of alternative
routes available for a certain origin-destination pair. Availability of alternative route
options for TND and conventional design can be compared using Figure 2.39. The
walker or cyclist can choose their routes in response to real-time conditions. The
alternative routes prevent large number of bicycle and walk trips to be done by the
use of arterial streets (Kulash, 1990).
Figure 2.39: Typical patterns of TND and convensional design (Oregon Department
of Transportation and Oregon Department of Land Conservation and Development,
2000)
2.4.4.2 Access Management
Access management is defined by FHWA as
the process that provides access to land development while simultaneously preserving the flow of traffic on the surrounding road system in terms of safety, capacity, and speed. It is an effort to limit the number of conflict points, provide sufficient spacing between access points, and provide adequate on-site circulation and storage (Federal Highway Administration, 1999).
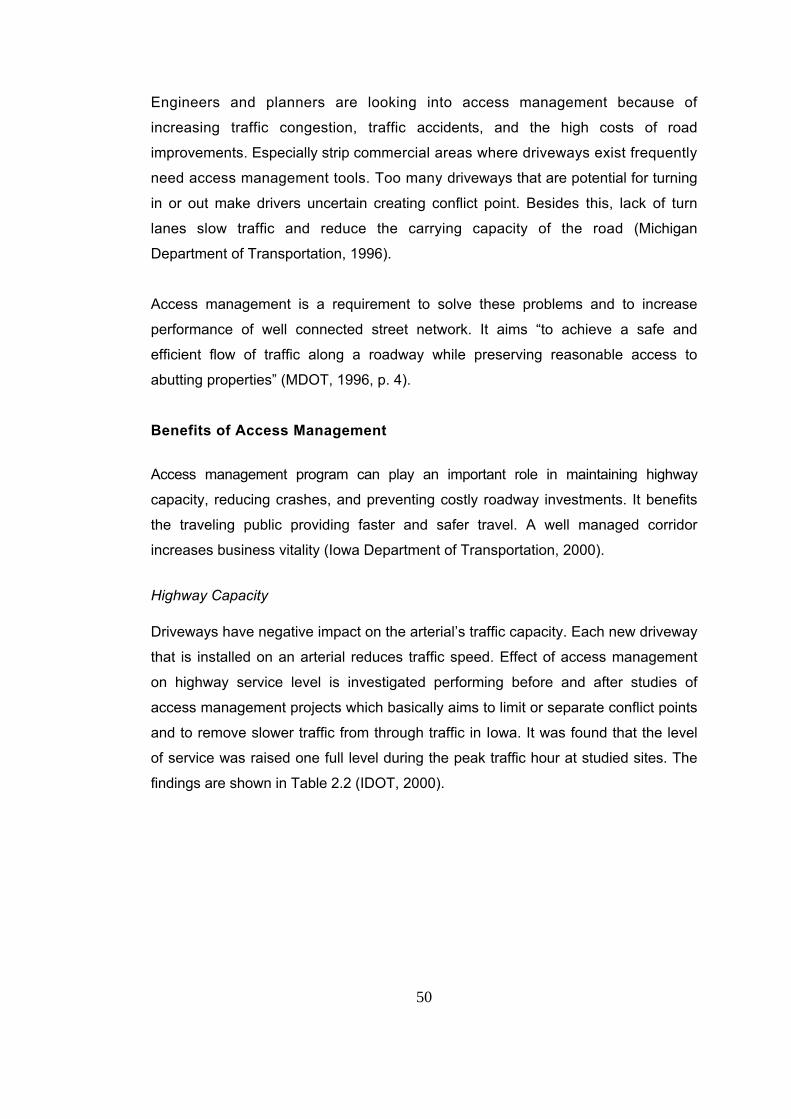
50
Engineers and planners are looking into access management because of
increasing traffic congestion, traffic accidents, and the high costs of road
improvements. Especially strip commercial areas where driveways exist frequently
need access management tools. Too many driveways that are potential for turning
in or out make drivers uncertain creating conflict point. Besides this, lack of turn
lanes slow traffic and reduce the carrying capacity of the road (Michigan
Department of Transportation, 1996).
Access management is a requirement to solve these problems and to increase
performance of well connected street network. It aims “to achieve a safe and
efficient flow of traffic along a roadway while preserving reasonable access to
abutting properties” (MDOT, 1996, p. 4).
Benefits of Access Management
Access management program can play an important role in maintaining highway
capacity, reducing crashes, and preventing costly roadway investments. It benefits
the traveling public providing faster and safer travel. A well managed corridor
increases business vitality (Iowa Department of Transportation, 2000).
Highway Capacity Driveways have negative impact on the arterial’s traffic capacity. Each new driveway
that is installed on an arterial reduces traffic speed. Effect of access management
on highway service level is investigated performing before and after studies of
access management projects which basically aims to limit or separate conflict points
and to remove slower traffic from through traffic in Iowa. It was found that the level
of service was raised one full level during the peak traffic hour at studied sites. The
findings are shown in Table 2.2 (IDOT, 2000).
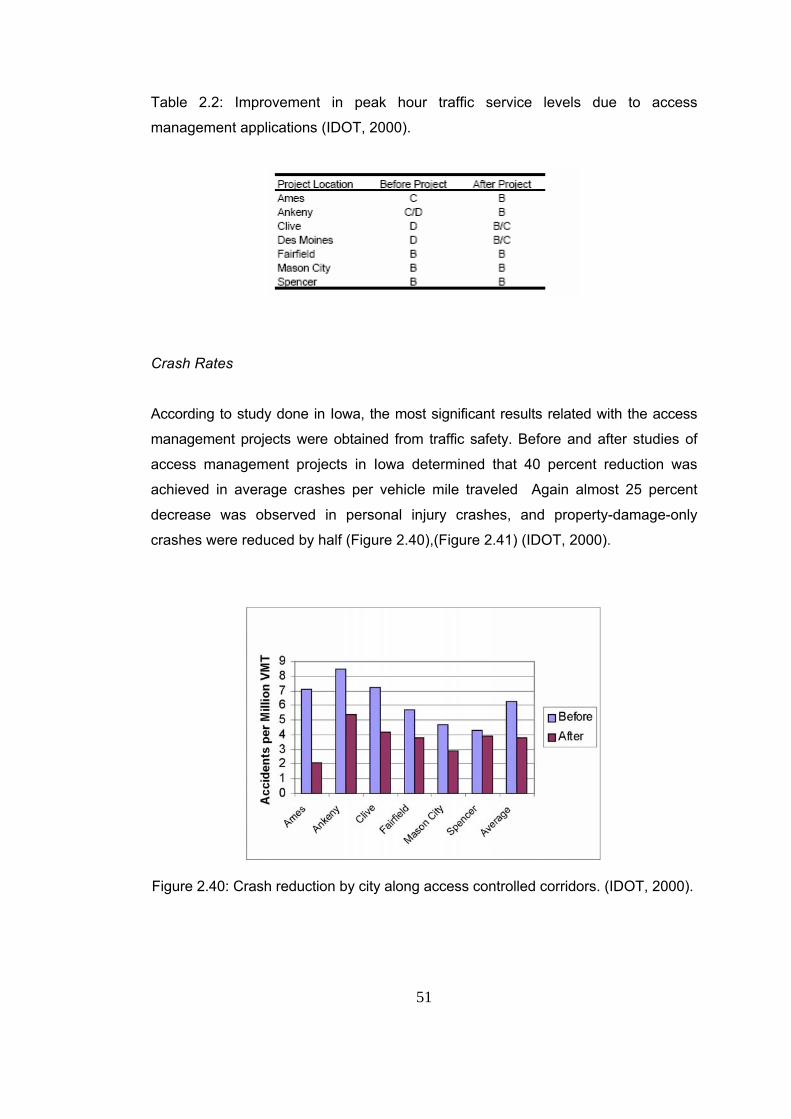
51
Table 2.2: Improvement in peak hour traffic service levels due to access
management applications (IDOT, 2000).
Crash Rates
According to study done in Iowa, the most significant results related with the access
management projects were obtained from traffic safety. Before and after studies of
access management projects in Iowa determined that 40 percent reduction was
achieved in average crashes per vehicle mile traveled Again almost 25 percent
decrease was observed in personal injury crashes, and property-damage-only
crashes were reduced by half (Figure 2.40),(Figure 2.41) (IDOT, 2000).
Figure 2.40: Crash reduction by city along access controlled corridors. (IDOT, 2000).
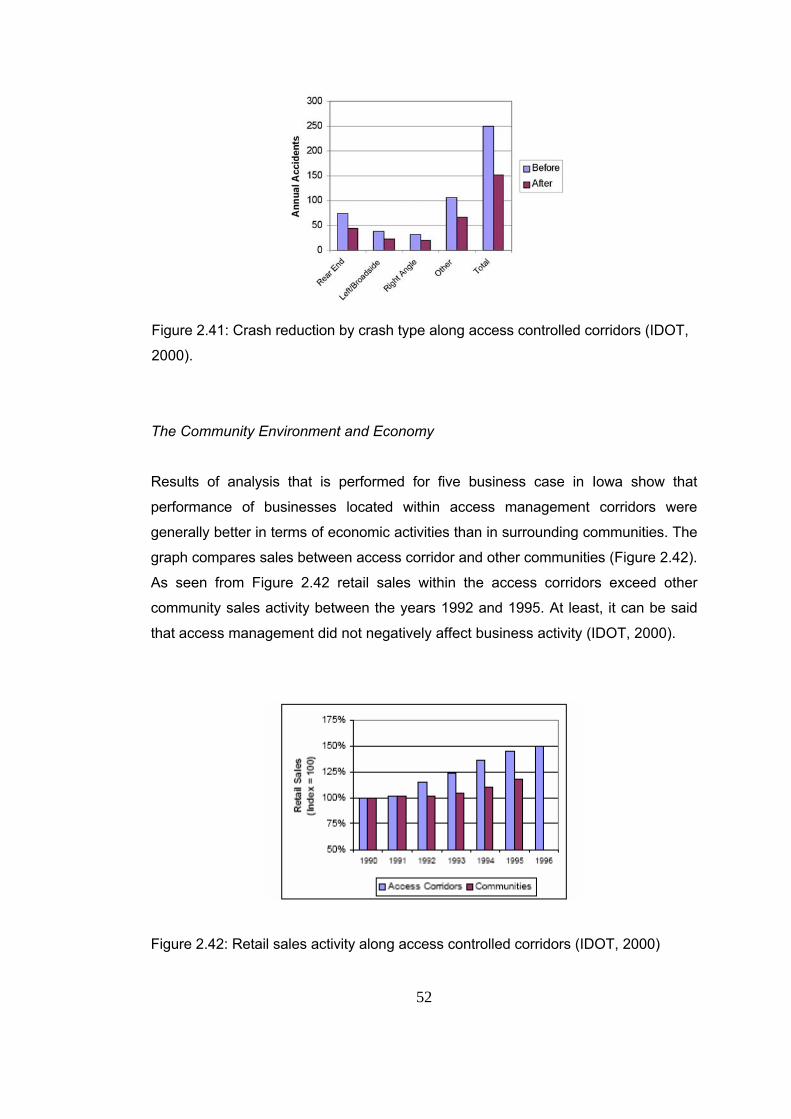
52
Figure 2.41: Crash reduction by crash type along access controlled corridors (IDOT,
2000).
The Community Environment and Economy
Results of analysis that is performed for five business case in Iowa show that
performance of businesses located within access management corridors were
generally better in terms of economic activities than in surrounding communities. The
graph compares sales between access corridor and other communities (Figure 2.42).
As seen from Figure 2.42 retail sales within the access corridors exceed other
community sales activity between the years 1992 and 1995. At least, it can be said
that access management did not negatively affect business activity (IDOT, 2000).
Figure 2.42: Retail sales activity along access controlled corridors (IDOT, 2000)
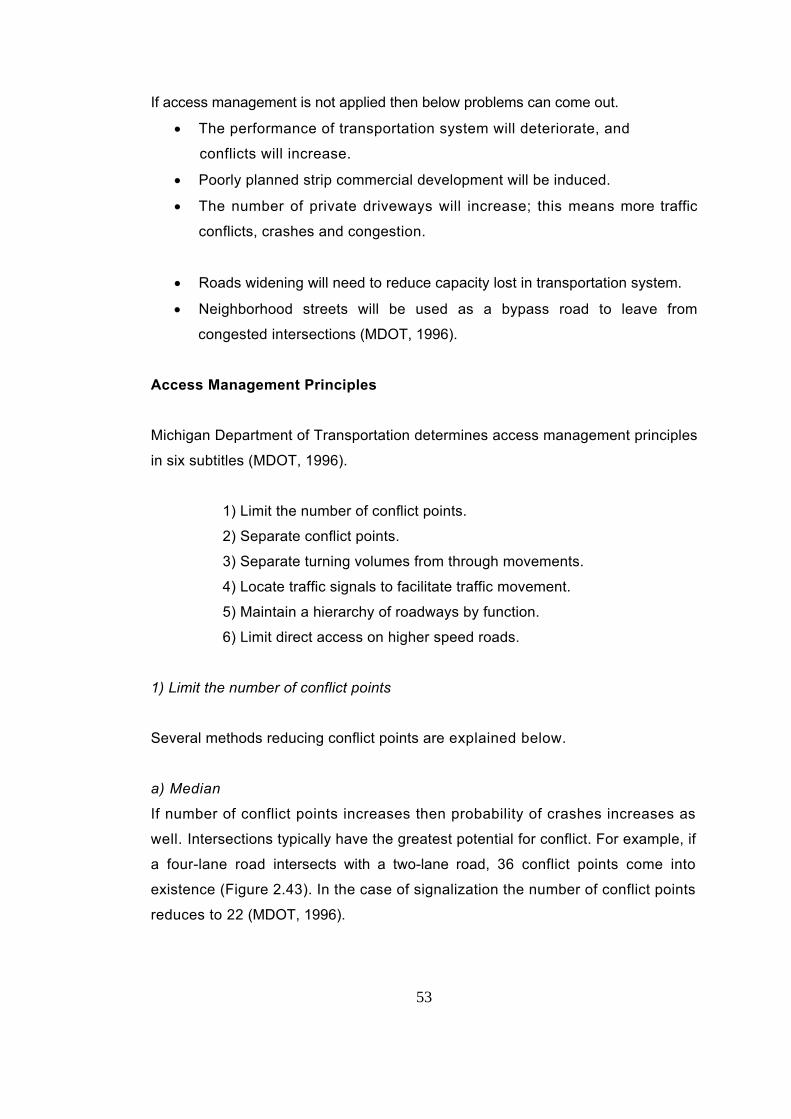
53
If access management is not applied then below problems can come out.
• The performance of transportation system will deteriorate, and
conflicts will increase.
• Poorly planned strip commercial development will be induced.
• The number of private driveways will increase; this means more traffic
conflicts, crashes and congestion.
• Roads widening will need to reduce capacity lost in transportation system.
• Neighborhood streets will be used as a bypass road to leave from
congested intersections (MDOT, 1996).
Access Management Principles Michigan Department of Transportation determines access management principles
in six subtitles (MDOT, 1996).
1) Limit the number of conflict points.
2) Separate conflict points.
3) Separate turning volumes from through movements.
4) Locate traffic signals to facilitate traffic movement.
5) Maintain a hierarchy of roadways by function.
6) Limit direct access on higher speed roads.
1) Limit the number of conflict points
Several methods reducing conflict points are explained below.
a) Median
If number of conflict points increases then probability of crashes increases as
well. Intersections typically have the greatest potential for conflict. For example, if
a four-lane road intersects with a two-lane road, 36 conflict points come into
existence (Figure 2.43). In the case of signalization the number of conflict points
reduces to 22 (MDOT, 1996).
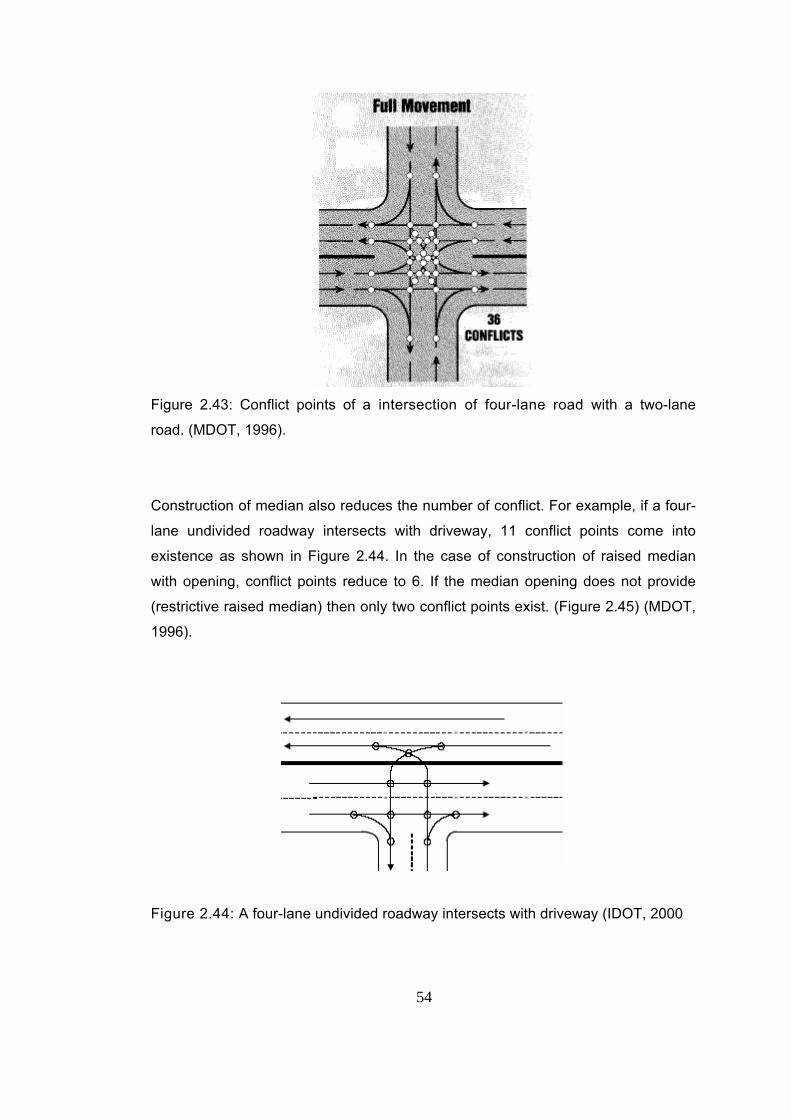
54
Figure 2.43: Conflict points of a intersection of four-lane road with a two-lane
road. (MDOT, 1996).
Construction of median also reduces the number of conflict. For example, if a four-
lane undivided roadway intersects with driveway, 11 conflict points come into
existence as shown in Figure 2.44. In the case of construction of raised median
with opening, conflict points reduce to 6. If the median opening does not provide
(restrictive raised median) then only two conflict points exist. (Figure 2.45) (MDOT,
1996).
Figure 2.44: A four-lane undivided roadway intersects with driveway (IDOT, 2000
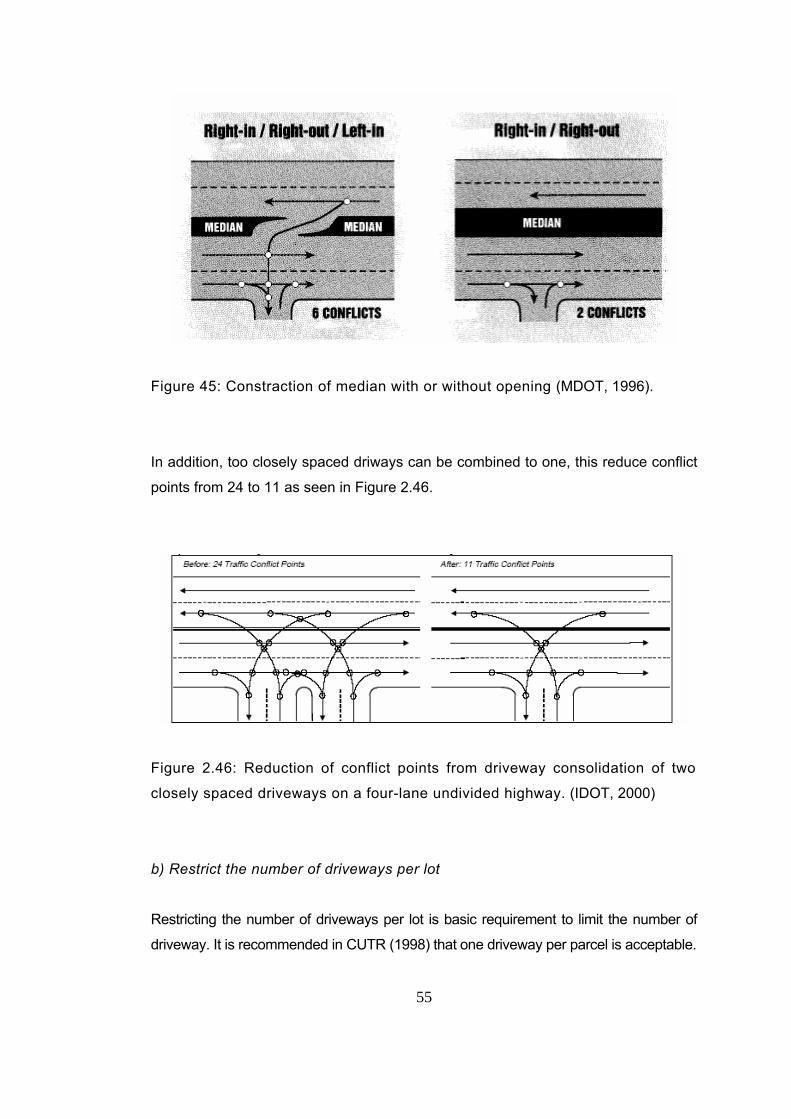
55
Figure 45: Constraction of median with or without opening (MDOT, 1996).
In addition, too closely spaced driways can be combined to one, this reduce conflict
points from 24 to 11 as seen in Figure 2.46.
Figure 2.46: Reduction of conflict points from driveway consolidation of two
closely spaced driveways on a four-lane undivided highway. (IDOT, 2000)
b) Restrict the number of driveways per lot
Restricting the number of driveways per lot is basic requirement to limit the number of
driveway. It is recommended in CUTR (1998) that one driveway per parcel is acceptable.
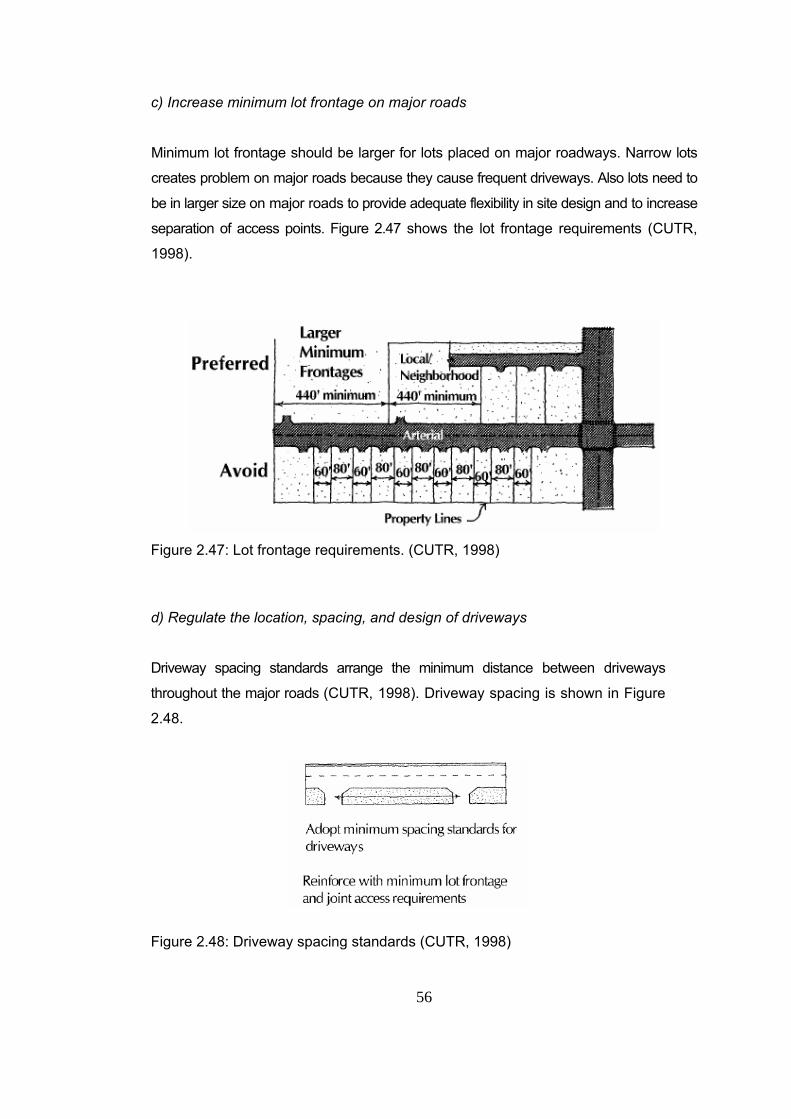
56
c) Increase minimum lot frontage on major roads
Minimum lot frontage should be larger for lots placed on major roadways. Narrow lots
creates problem on major roads because they cause frequent driveways. Also lots need to
be in larger size on major roads to provide adequate flexibility in site design and to increase
separation of access points. Figure 2.47 shows the lot frontage requirements (CUTR,
1998).
Figure 2.47: Lot frontage requirements. (CUTR, 1998) d) Regulate the location, spacing, and design of driveways
Driveway spacing standards arrange the minimum distance between driveways
throughout the major roads (CUTR, 1998). Driveway spacing is shown in Figure
2.48.
Figure 2.48: Driveway spacing standards (CUTR, 1998)
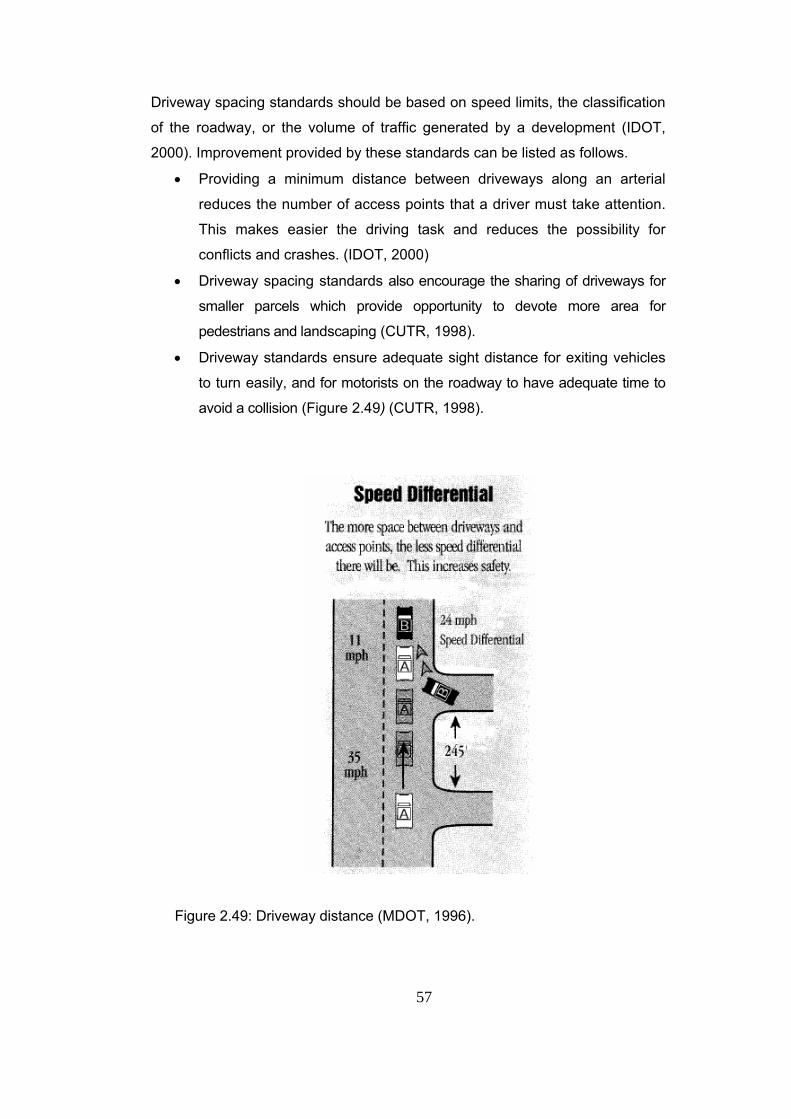
57
Driveway spacing standards should be based on speed limits, the classification
of the roadway, or the volume of traffic generated by a development (IDOT,
2000). Improvement provided by these standards can be listed as follows.
• Providing a minimum distance between driveways along an arterial
reduces the number of access points that a driver must take attention.
This makes easier the driving task and reduces the possibility for
conflicts and crashes. (IDOT, 2000)
• Driveway spacing standards also encourage the sharing of driveways for
smaller parcels which provide opportunity to devote more area for
pedestrians and landscaping (CUTR, 1998).
• Driveway standards ensure adequate sight distance for exiting vehicles
to turn easily, and for motorists on the roadway to have adequate time to
avoid a collision (Figure 2.49) (CUTR, 1998).
Figure 2.49: Driveway distance (MDOT, 1996).
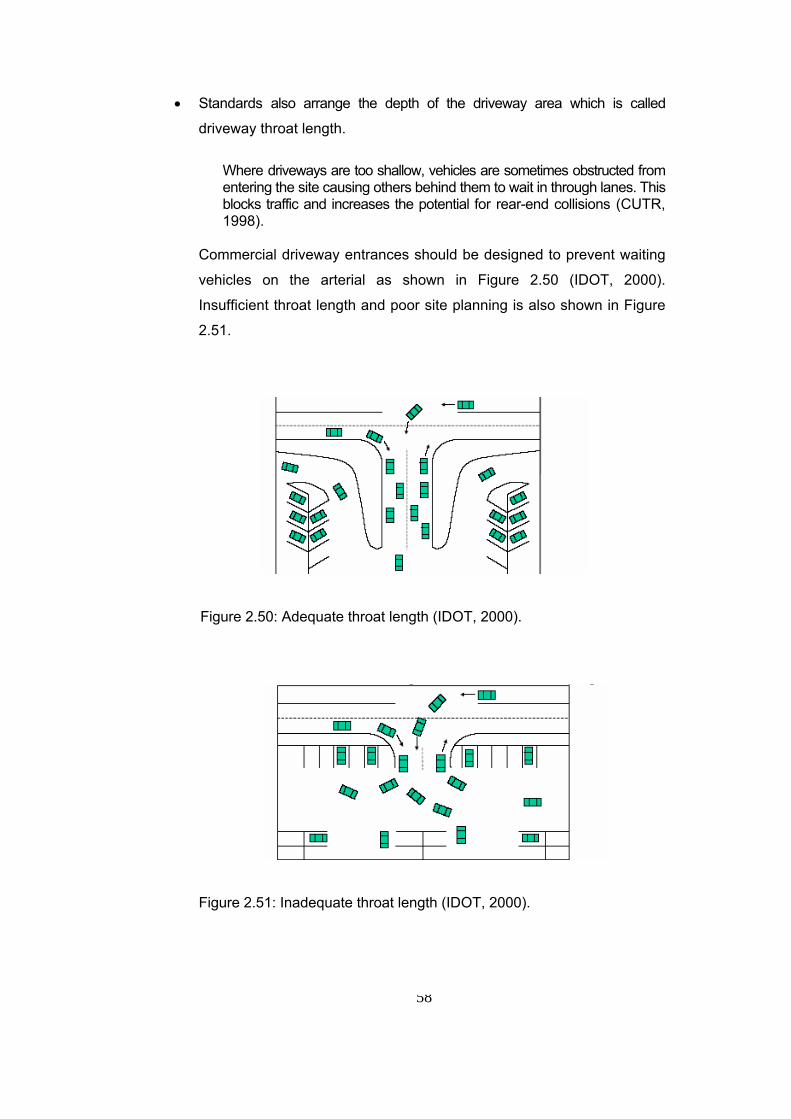
58
• Standards also arrange the depth of the driveway area which is called
driveway throat length.
Where driveways are too shallow, vehicles are sometimes obstructed from entering the site causing others behind them to wait in through lanes. This blocks traffic and increases the potential for rear-end collisions (CUTR, 1998).
Commercial driveway entrances should be designed to prevent waiting
vehicles on the arterial as shown in Figure 2.50 (IDOT, 2000).
Insufficient throat length and poor site planning is also shown in Figure
2.51.
Figure 2.50: Adequate throat length (IDOT, 2000).
Figure 2.51: Inadequate throat length (IDOT, 2000).
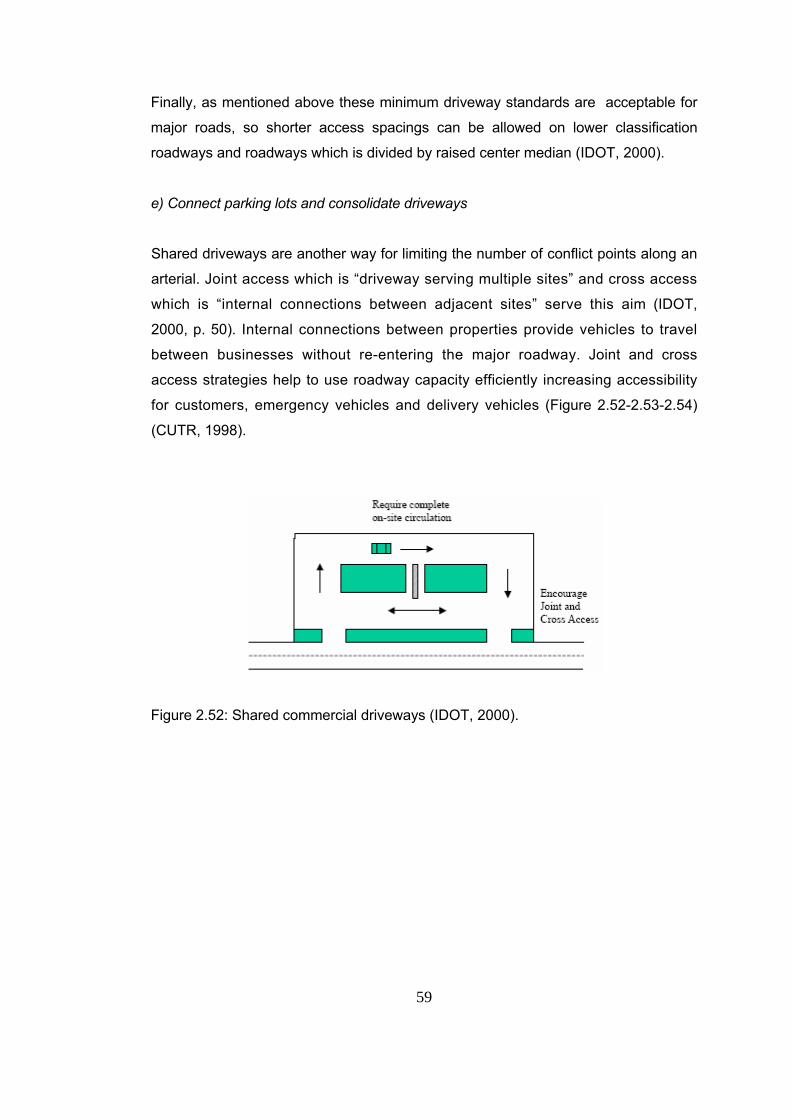
59
Finally, as mentioned above these minimum driveway standards are acceptable for
major roads, so shorter access spacings can be allowed on lower classification
roadways and roadways which is divided by raised center median (IDOT, 2000).
e) Connect parking lots and consolidate driveways
Shared driveways are another way for limiting the number of conflict points along an
arterial. Joint access which is “driveway serving multiple sites” and cross access
which is “internal connections between adjacent sites” serve this aim (IDOT,
2000, p. 50). Internal connections between properties provide vehicles to travel
between businesses without re-entering the major roadway. Joint and cross
access strategies help to use roadway capacity efficiently increasing accessibility
for customers, emergency vehicles and delivery vehicles (Figure 2.52-2.53-2.54)
(CUTR, 1998).
Figure 2.52: Shared commercial driveways (IDOT, 2000).
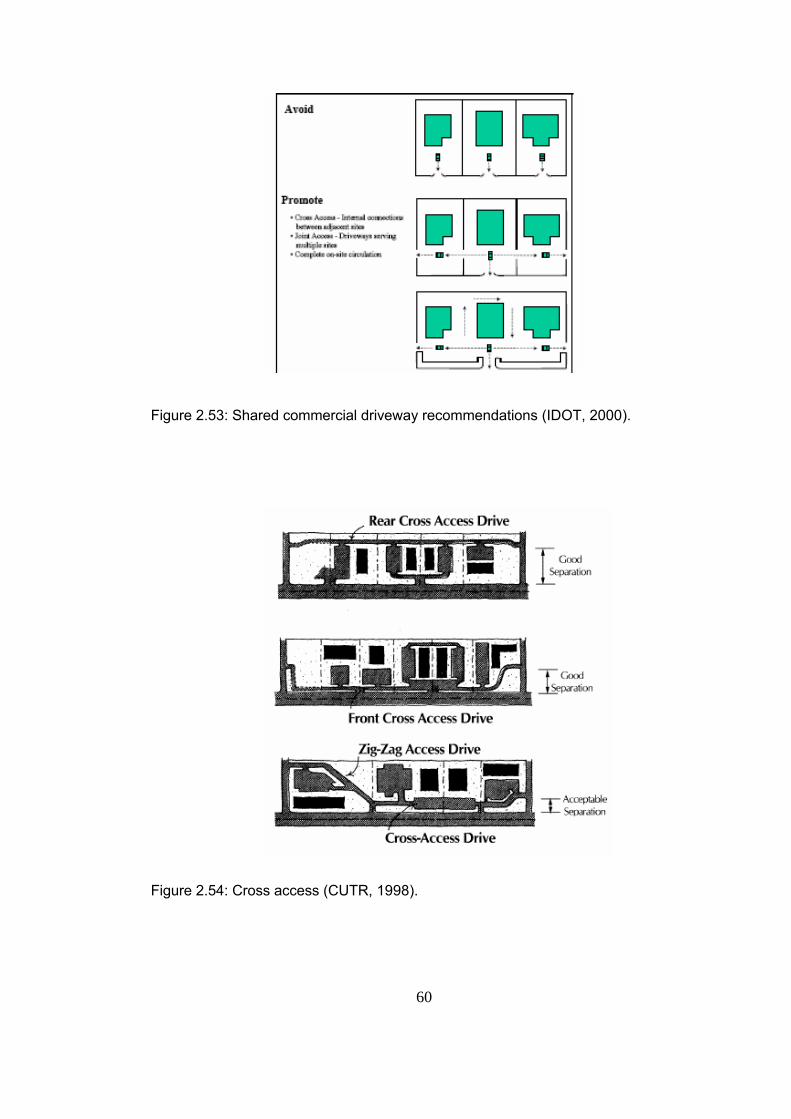
60
Figure 2.53: Shared commercial driveway recommendations (IDOT, 2000).
Figure 2.54: Cross access (CUTR, 1998).
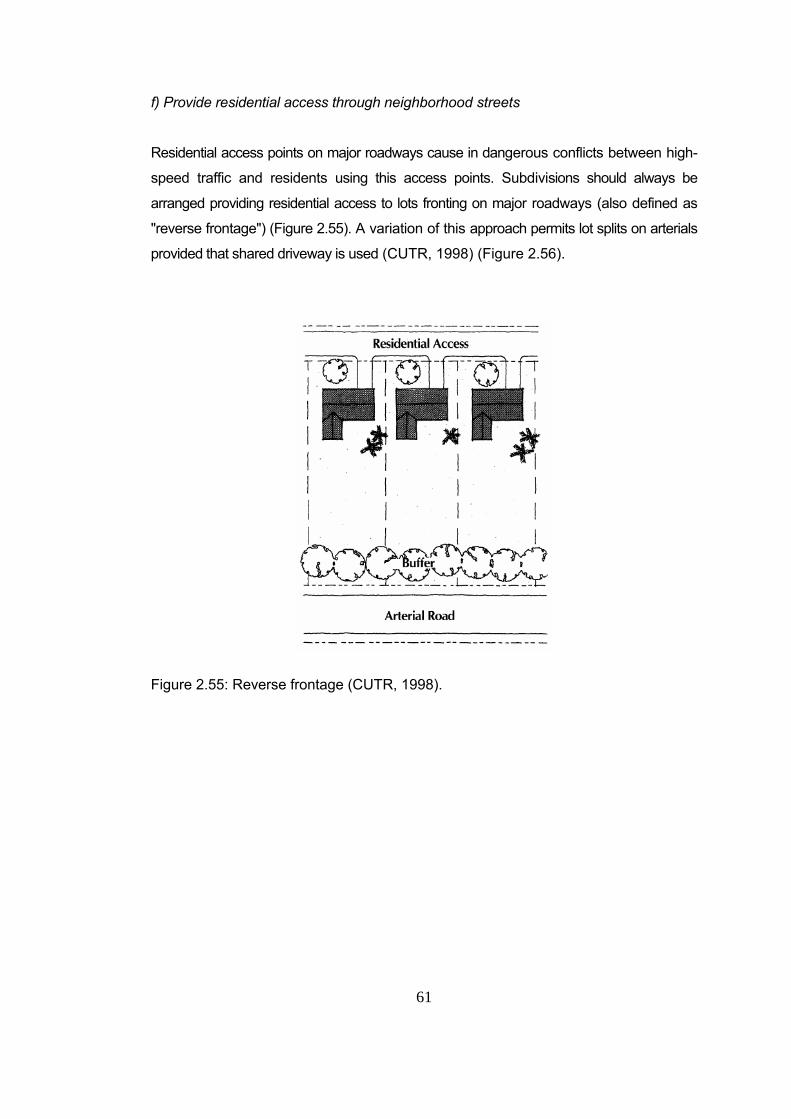
61
f) Provide residential access through neighborhood streets
Residential access points on major roadways cause in dangerous conflicts between high-
speed traffic and residents using this access points. Subdivisions should always be
arranged providing residential access to lots fronting on major roadways (also defined as
"reverse frontage") (Figure 2.55). A variation of this approach permits lot splits on arterials
provided that shared driveway is used (CUTR, 1998) (Figure 2.56).
Figure 2.55: Reverse frontage (CUTR, 1998).
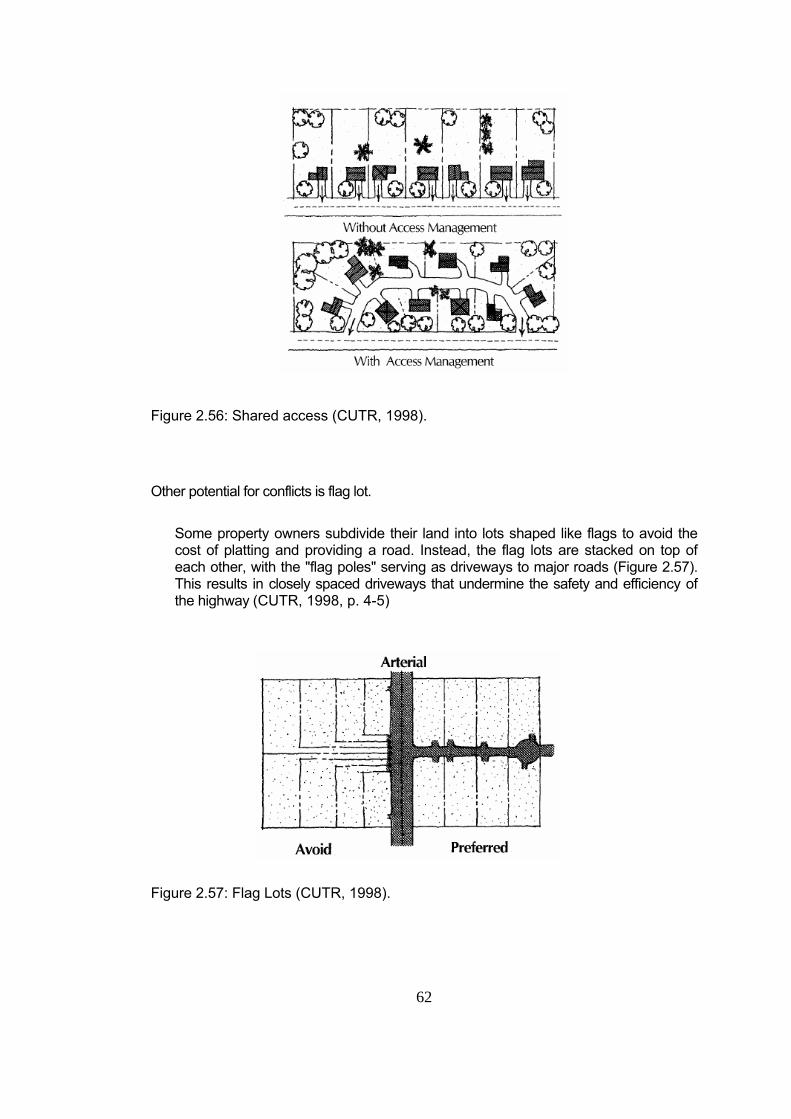
62
Figure 2.56: Shared access (CUTR, 1998).
Other potential for conflicts is flag lot.
Some property owners subdivide their land into lots shaped like flags to avoid the cost of platting and providing a road. Instead, the flag lots are stacked on top of each other, with the "flag poles" serving as driveways to major roads (Figure 2.57). This results in closely spaced driveways that undermine the safety and efficiency of the highway (CUTR, 1998, p. 4-5)
Figure 2.57: Flag Lots (CUTR, 1998).
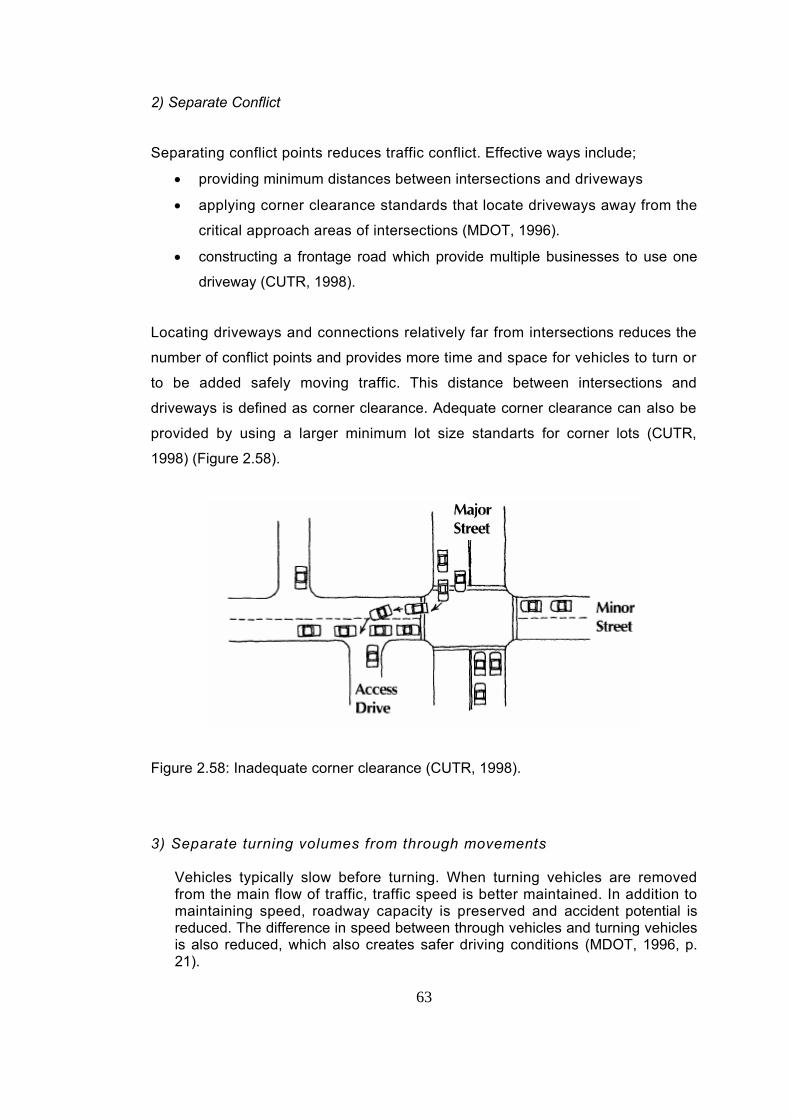
63
2) Separate Conflict
Separating conflict points reduces traffic conflict. Effective ways include;
• providing minimum distances between intersections and driveways
• applying corner clearance standards that locate driveways away from the
critical approach areas of intersections (MDOT, 1996).
• constructing a frontage road which provide multiple businesses to use one
driveway (CUTR, 1998).
Locating driveways and connections relatively far from intersections reduces the
number of conflict points and provides more time and space for vehicles to turn or
to be added safely moving traffic. This distance between intersections and
driveways is defined as corner clearance. Adequate corner clearance can also be
provided by using a larger minimum lot size standarts for corner lots (CUTR,
1998) (Figure 2.58).
Figure 2.58: Inadequate corner clearance (CUTR, 1998).
3) Separate turning volumes from through movements
Vehicles typically slow before turning. When turning vehicles are removed from the main flow of traffic, traffic speed is better maintained. In addition to maintaining speed, roadway capacity is preserved and accident potential is reduced. The difference in speed between through vehicles and turning vehicles is also reduced, which also creates safer driving conditions (MDOT, 1996, p. 21).
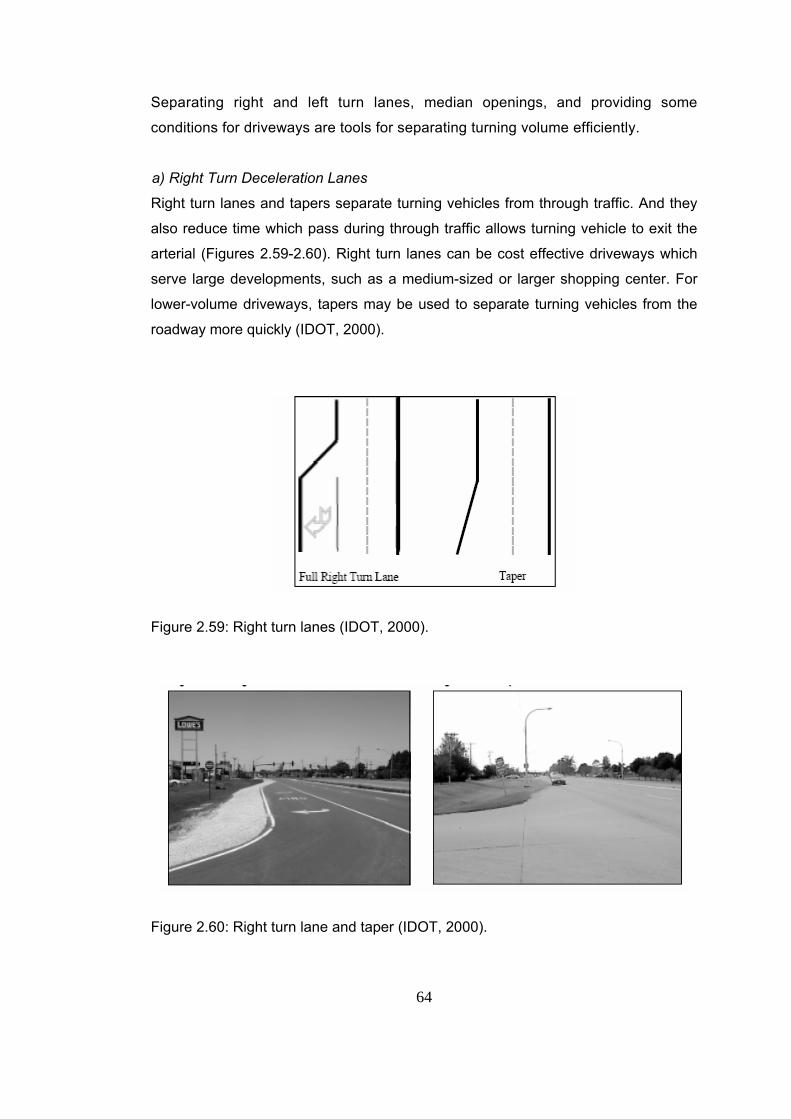
64
Separating right and left turn lanes, median openings, and providing some
conditions for driveways are tools for separating turning volume efficiently.
a) Right Turn Deceleration Lanes
Right turn lanes and tapers separate turning vehicles from through traffic. And they
also reduce time which pass during through traffic allows turning vehicle to exit the
arterial (Figures 2.59-2.60). Right turn lanes can be cost effective driveways which
serve large developments, such as a medium-sized or larger shopping center. For
lower-volume driveways, tapers may be used to separate turning vehicles from the
roadway more quickly (IDOT, 2000).
Figure 2.59: Right turn lanes (IDOT, 2000).
Figure 2.60: Right turn lane and taper (IDOT, 2000).
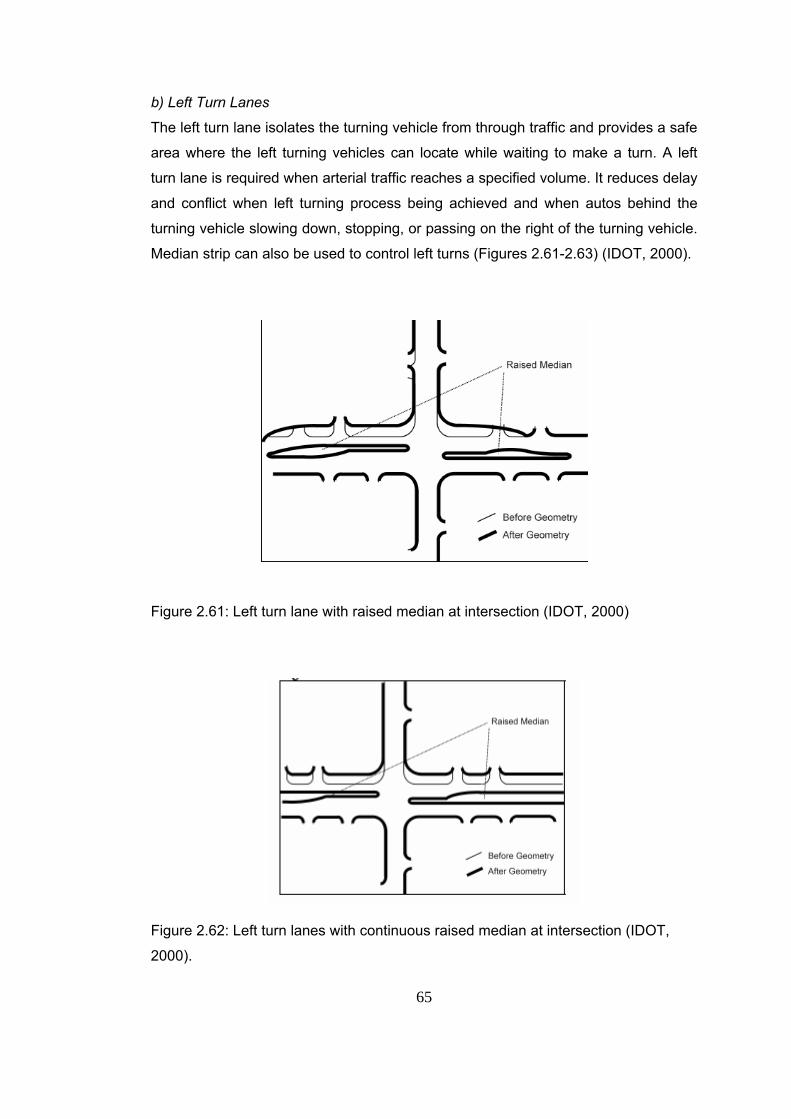
65
b) Left Turn Lanes
The left turn lane isolates the turning vehicle from through traffic and provides a safe
area where the left turning vehicles can locate while waiting to make a turn. A left
turn lane is required when arterial traffic reaches a specified volume. It reduces delay
and conflict when left turning process being achieved and when autos behind the
turning vehicle slowing down, stopping, or passing on the right of the turning vehicle.
Median strip can also be used to control left turns (Figures 2.61-2.63) (IDOT, 2000).
Figure 2.61: Left turn lane with raised median at intersection (IDOT, 2000)
Figure 2.62: Left turn lanes with continuous raised median at intersection (IDOT,
2000).
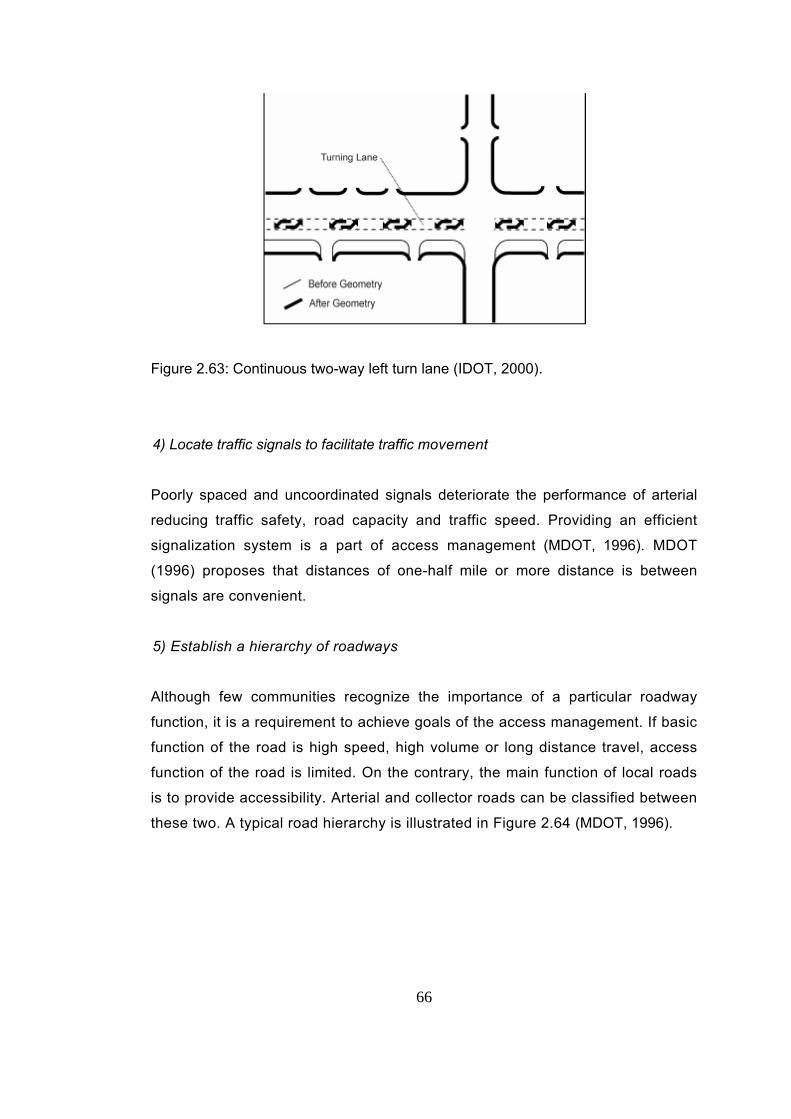
66
Figure 2.63: Continuous two-way left turn lane (IDOT, 2000).
4) Locate traffic signals to facilitate traffic movement
Poorly spaced and uncoordinated signals deteriorate the performance of arterial
reducing traffic safety, road capacity and traffic speed. Providing an efficient
signalization system is a part of access management (MDOT, 1996). MDOT
(1996) proposes that distances of one-half mile or more distance is between
signals are convenient.
5) Establish a hierarchy of roadways
Although few communities recognize the importance of a particular roadway
function, it is a requirement to achieve goals of the access management. If basic
function of the road is high speed, high volume or long distance travel, access
function of the road is limited. On the contrary, the main function of local roads
is to provide accessibility. Arterial and collector roads can be classified between
these two. A typical road hierarchy is illustrated in Figure 2.64 (MDOT, 1996).
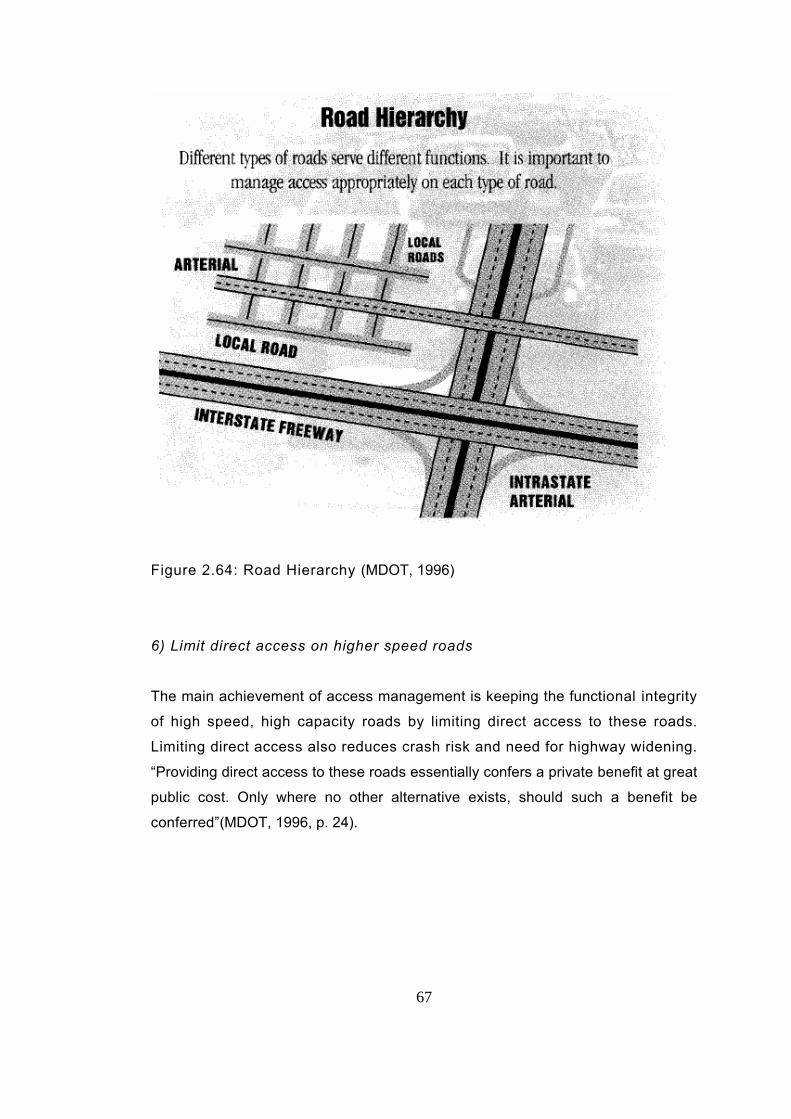
67
Figure 2.64: Road Hierarchy (MDOT, 1996)
6) Limit direct access on higher speed roads
The main achievement of access management is keeping the functional integrity
of high speed, high capacity roads by limiting direct access to these roads.
Limiting direct access also reduces crash risk and need for highway widening.
“Providing direct access to these roads essentially confers a private benefit at great
public cost. Only where no other alternative exists, should such a benefit be
conferred”(MDOT, 1996, p. 24).
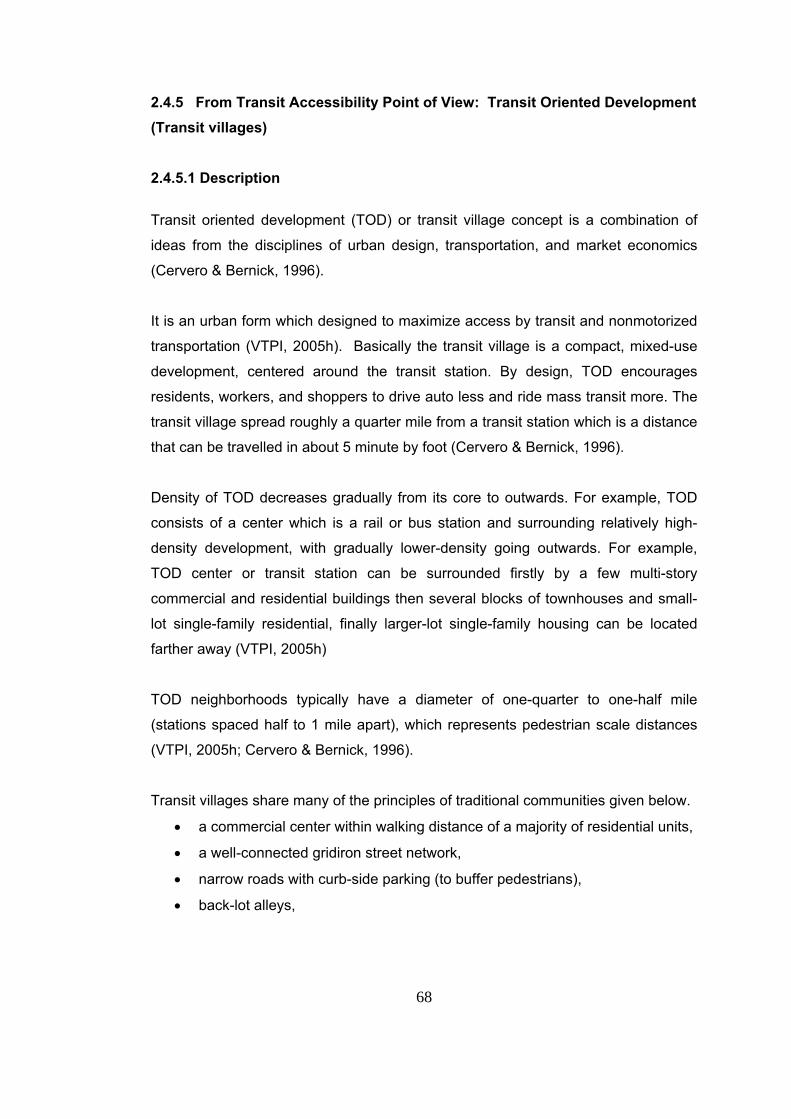
68
2.4.5 From Transit Accessibility Point of View: Transit Oriented Development (Transit villages) 2.4.5.1 Description Transit oriented development (TOD) or transit village concept is a combination of
ideas from the disciplines of urban design, transportation, and market economics
(Cervero & Bernick, 1996).
It is an urban form which designed to maximize access by transit and nonmotorized
transportation (VTPI, 2005h). Basically the transit village is a compact, mixed-use
development, centered around the transit station. By design, TOD encourages
residents, workers, and shoppers to drive auto less and ride mass transit more. The
transit village spread roughly a quarter mile from a transit station which is a distance
that can be travelled in about 5 minute by foot (Cervero & Bernick, 1996).
Density of TOD decreases gradually from its core to outwards. For example, TOD
consists of a center which is a rail or bus station and surrounding relatively high-
density development, with gradually lower-density going outwards. For example,
TOD center or transit station can be surrounded firstly by a few multi-story
commercial and residential buildings then several blocks of townhouses and small-
lot single-family residential, finally larger-lot single-family housing can be located
farther away (VTPI, 2005h)
TOD neighborhoods typically have a diameter of one-quarter to one-half mile
(stations spaced half to 1 mile apart), which represents pedestrian scale distances
(VTPI, 2005h; Cervero & Bernick, 1996).
Transit villages share many of the principles of traditional communities given below.
• a commercial center within walking distance of a majority of residential units,
• a well-connected gridiron street network,
• narrow roads with curb-side parking (to buffer pedestrians),
• back-lot alleys,
69
• mixed land uses, and
• varying styles and densities of housing.
Their distinguishing feature is that the train station and its close surroundings work
as the focal point of community (Cervero & Bernick, 1996).
Additionally, it must emphasized that transit oriented development does not have
only physical effect. It has social and economic dimensions. TOD provides people to
make face to face contact. Today’s auto-oriented communities isolate people by age
and income and by confining them to their autos and security-controlled
subdivisions. People feel themselves as a part of the community in TOD
developments by means of attractive features (Cervero & Bernick, 1996).
2.4.5.2 Reasons behind supporting public transportation
Outcoming problems of increasing automobile dependence are basic reasons for
supporting public transportation (also called as transit or mass transit). Because of
auto travel, traffic congestion, air pollution, energy consumption, social inequity etc.
increase. Details of these items are given below.
Traffic congestion
Public transportation is one of the possible alternatives to road expansion for
reducing traffic congestion. Highway departments have realized that building
highway out of congestion is not possible. New roads or expanded roads only
provide temporary relaxation. New capacity attracts new demand, which is called by
planners induced demand. Because, after opening new road people changes their
routes to benefit advantages of new road. So, the road reaches it capacity again in a
short time. As for transit, it can induce modal shifts with concentrated development
around transit nodes. Replacing auto trips with transit trips can help reducing traffic
congestion along corridors served by rail. In this perspective, it can be accepted that
transit village development is a type of transportation demand management
(Cervero & Bernick, 1996).
70
Air quality
Air pollution is very important effect of auto dependence issue. It causes to think
about alternative solutions to auto travel. Cervero and Bernick (1996) state that air
pollution is largely result of auto-dependent developments; they also express that
more than 100 U.S. cities have serious air pollution problems (Cervero & Bernick,
1996).
Energy Conservation
In spite of existing of far more fuel efficient vehicles today than before, decrease in
energy consumption cannot be achieved because these gains have been offset by
increasing traffic volumes and lengthening trip distances (Cervero & Bernick, 1996).
Transit villages could save energy in two ways. First one, more compact
development, in theory, should shorten distance between origin and destination.
And second one, exchange of some auto trips to mass transit should lower per
capita energy consumption. Furthermore, using nonpetroleum energy sources for
electrical power need of rail transit is another advantage of mass transit. Because, it
relieves nation’s dependence on foreign countries (Cervero & Bernick, 1996).
Neighborhood revitalization Transit villages provide opportunity to revitalize undeveloped neighborhoods served
by rail. It invites private investments with its capability of attracting people regularly
to transit nodes. So transit oriented development offers a new approach to induce
economic growth (Cervero & Bernick, 1996).
Public safety
One another positive side of mass transit is public safety. Residents think that the
transit village is a secure and safe place to live.
Because, residents themselves are the most valuable asset in this regard. They become the eyes of the community 24 hour a day. Many districts surrounding transit stations are perceived as unsafe places in part because they are often vacated after 6 p.m. and on weekends.(Cervero & Bernick, 1996, p.10-11).
71
Alternative suburban living and working environments
Transit villages give chance to live in suburban area without being dependent on
automobile and with availability of services and activities which belong to city life.
Besides that, transit villages offer different housing choices which serve different
income group and different life style.“The diversity of housing in transit villages can
mean a much needed increase in the stock of affordable housing” (Cervero &
Bernick, 1996, p. 9).
Pedestrian friendliness
Transit villages are pedestrian friendly areas with
• mixed land uses,
• vertical mixed use buildings,
• narrow tree-lined streets,
• wide sidewalks, (Cervero & Bernick, 1996).
Social Equity
Auto oriented developments create social inequity by separating significant segment
of society isolating physically and socially. Those who are too poor, disabled, young,
or old to own or drive an automobile are devoid of many activities which require auto
travel (Cervero & Bernick, 1996).
Quality of life
Cervero and Bernick (1996) claim that the least articulated but most deeply felt
reason for many Americans to support mass transit is feeling that something is
seriously absent in suburbia. They also states that many people now feel that the
city’s problems have also migrated to the suburbs and consequently, quality of life in
suburban is rapidly deteriorating.
72
2.4.5.3 The built environment and the demand for transit
Density and compactness
As origins and destinations spread over a region, people more likely access to an
automobile than take a transit. So, low density developments are not proper for
transit (Cervero & Bernick, 1996).
From their study of 46 major cities around the world, Newman & Kenworthy et al.,
(1999) reach a conclusion that
the more centralized is the city in terms of both population and jobs, the less auto dependent it will be and the less transportation energy it will use...... As cities become denser and more centralized, the efficiency with which transportation energy is burned increases markedly. Likewise, the energy consumed per passenger kilometer within the public transportation system diminishes systematically as cities become denser and more centralized. There are two main reasons for this. First, the cities tend to become more rail oriented, which is the most efficient mode of public transportation and the loadings on all transit modes tend to increase with increasing density and centralization (p. 580).
It is possible to see these results from below graphs. When the graps about urban
density, private passenger transportation energy use, vehicle kms per person,
modal split, transit service and use according to city groupings are investigated, it is
seen that as density increases, per capita energy use and per capita automobile use
decrease, while the per capita transit service and use increase (Figure 2.65-2.66-
2.67-2.68-2.69)
Metropolitan density
As shown in the Figure 61, the US and Australian cities which are the most auto
oriented cities in the investigated cities also have the lowest densities.
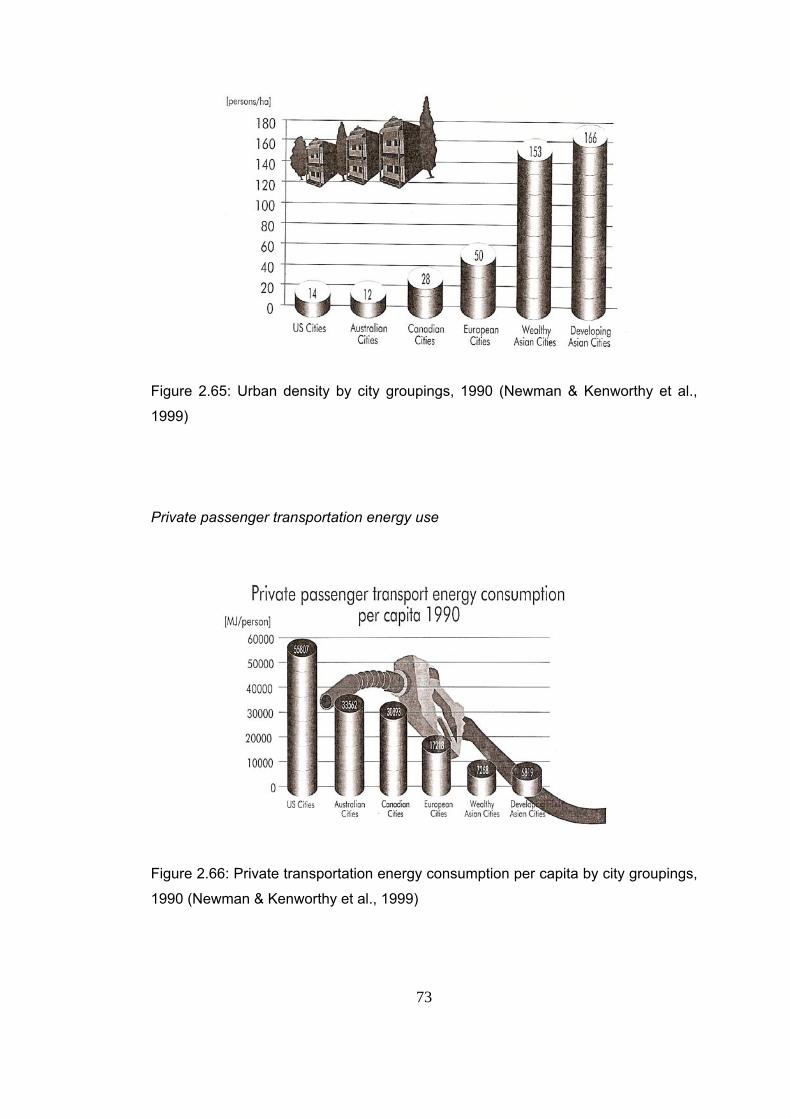
73
Figure 2.65: Urban density by city groupings, 1990 (Newman & Kenworthy et al.,
1999)
Private passenger transportation energy use
Figure 2.66: Private transportation energy consumption per capita by city groupings,
1990 (Newman & Kenworthy et al., 1999)
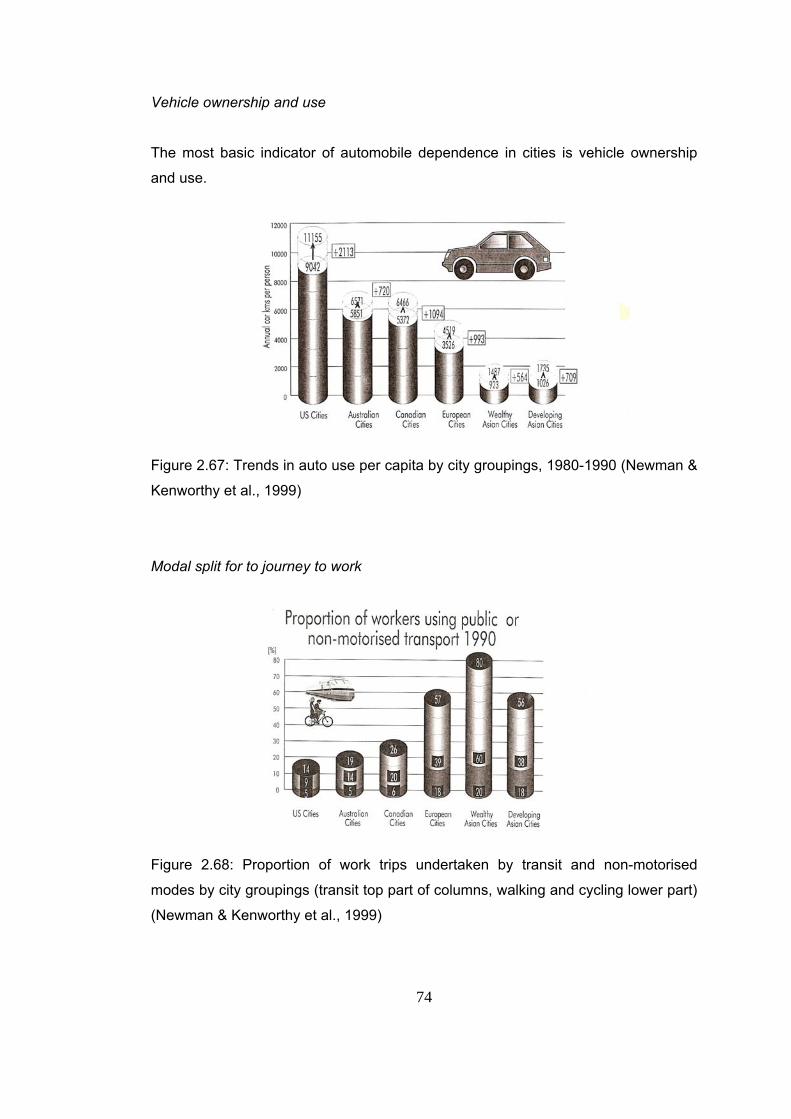
74
Vehicle ownership and use
The most basic indicator of automobile dependence in cities is vehicle ownership
and use.
Figure 2.67: Trends in auto use per capita by city groupings, 1980-1990 (Newman &
Kenworthy et al., 1999)
Modal split for to journey to work
Figure 2.68: Proportion of work trips undertaken by transit and non-motorised
modes by city groupings (transit top part of columns, walking and cycling lower part)
(Newman & Kenworthy et al., 1999)
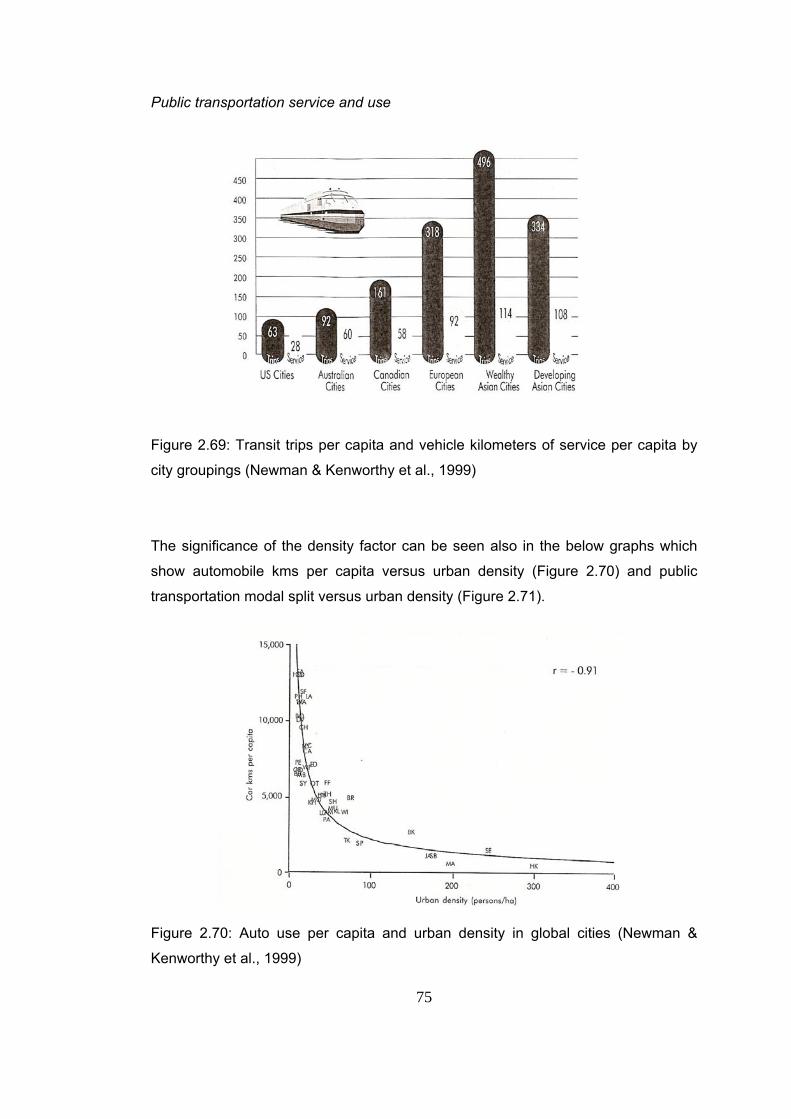
75
Public transportation service and use
Figure 2.69: Transit trips per capita and vehicle kilometers of service per capita by
city groupings (Newman & Kenworthy et al., 1999)
The significance of the density factor can be seen also in the below graphs which
show automobile kms per capita versus urban density (Figure 2.70) and public
transportation modal split versus urban density (Figure 2.71).
Figure 2.70: Auto use per capita and urban density in global cities (Newman &
Kenworthy et al., 1999)
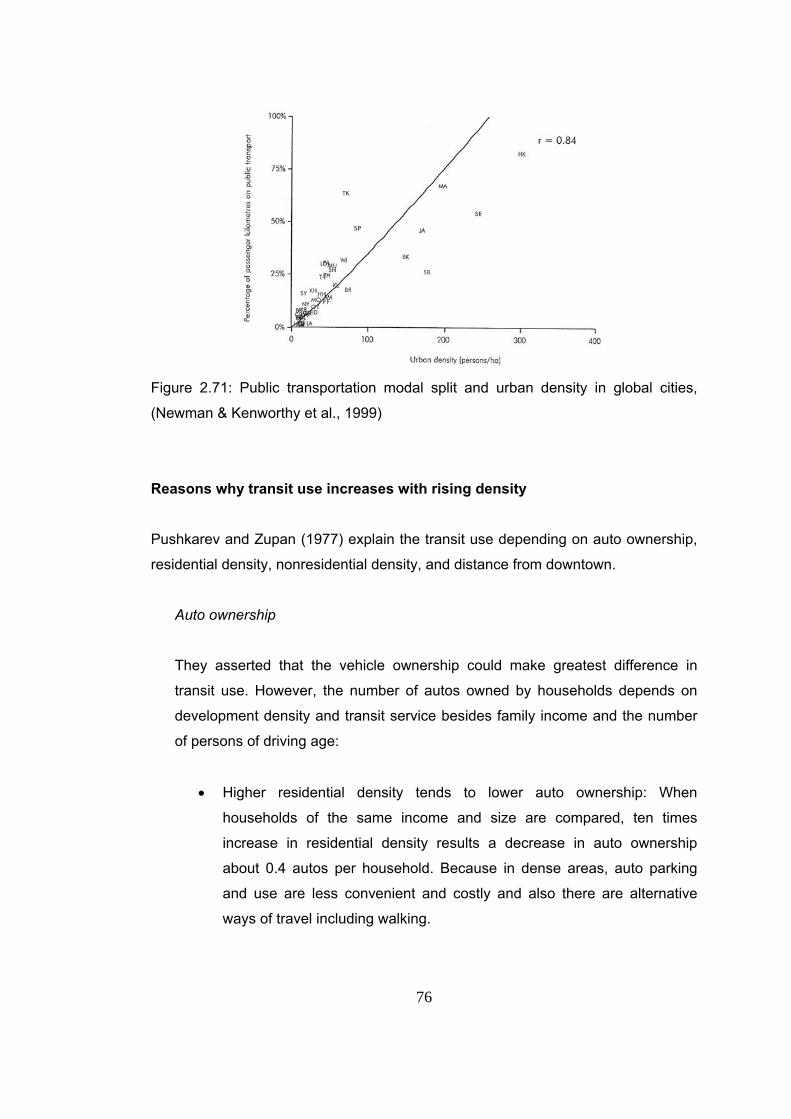
76
Figure 2.71: Public transportation modal split and urban density in global cities,
(Newman & Kenworthy et al., 1999)
Reasons why transit use increases with rising density
Pushkarev and Zupan (1977) explain the transit use depending on auto ownership,
residential density, nonresidential density, and distance from downtown.
Auto ownership
They asserted that the vehicle ownership could make greatest difference in
transit use. However, the number of autos owned by households depends on
development density and transit service besides family income and the number
of persons of driving age:
• Higher residential density tends to lower auto ownership: When
households of the same income and size are compared, ten times
increase in residential density results a decrease in auto ownership
about 0.4 autos per household. Because in dense areas, auto parking
and use are less convenient and costly and also there are alternative
ways of travel including walking.
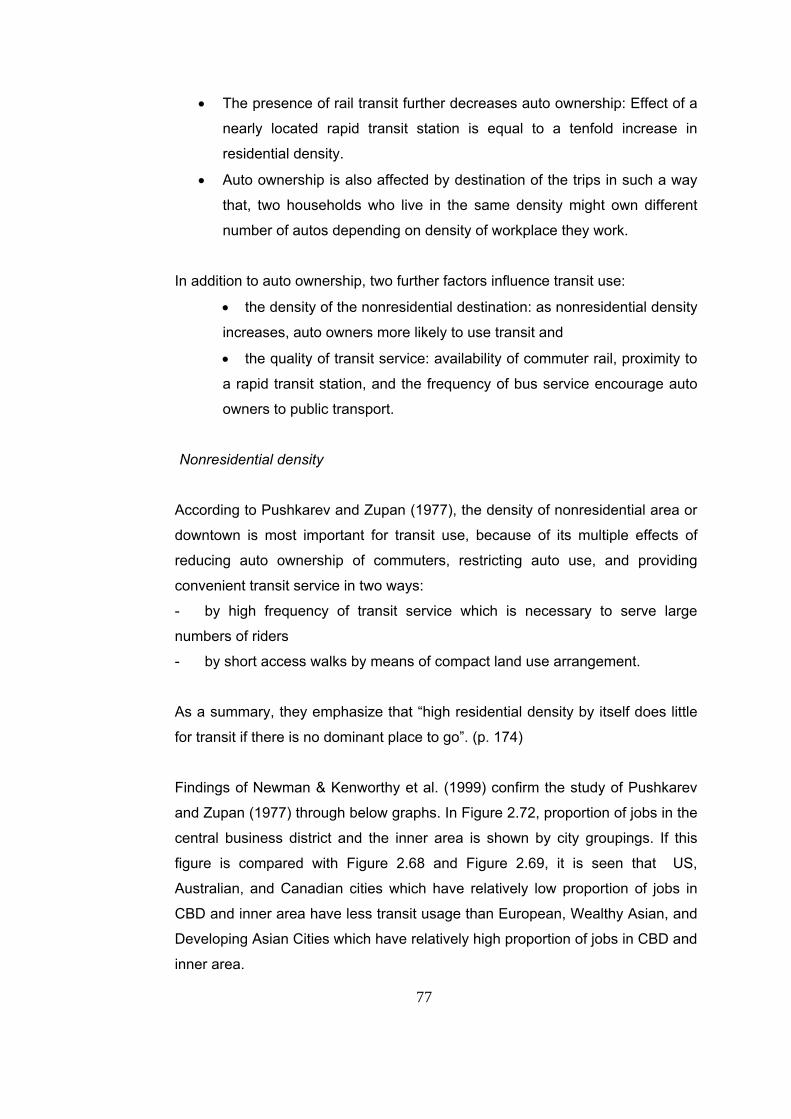
77
• The presence of rail transit further decreases auto ownership: Effect of a
nearly located rapid transit station is equal to a tenfold increase in
residential density.
• Auto ownership is also affected by destination of the trips in such a way
that, two households who live in the same density might own different
number of autos depending on density of workplace they work.
In addition to auto ownership, two further factors influence transit use:
• the density of the nonresidential destination: as nonresidential density
increases, auto owners more likely to use transit and
• the quality of transit service: availability of commuter rail, proximity to
a rapid transit station, and the frequency of bus service encourage auto
owners to public transport.
Nonresidential density
According to Pushkarev and Zupan (1977), the density of nonresidential area or
downtown is most important for transit use, because of its multiple effects of
reducing auto ownership of commuters, restricting auto use, and providing
convenient transit service in two ways:
- by high frequency of transit service which is necessary to serve large
numbers of riders
- by short access walks by means of compact land use arrangement.
As a summary, they emphasize that “high residential density by itself does little
for transit if there is no dominant place to go”. (p. 174)
Findings of Newman & Kenworthy et al. (1999) confirm the study of Pushkarev
and Zupan (1977) through below graphs. In Figure 2.72, proportion of jobs in the
central business district and the inner area is shown by city groupings. If this
figure is compared with Figure 2.68 and Figure 2.69, it is seen that US,
Australian, and Canadian cities which have relatively low proportion of jobs in
CBD and inner area have less transit usage than European, Wealthy Asian, and
Developing Asian Cities which have relatively high proportion of jobs in CBD and
inner area.
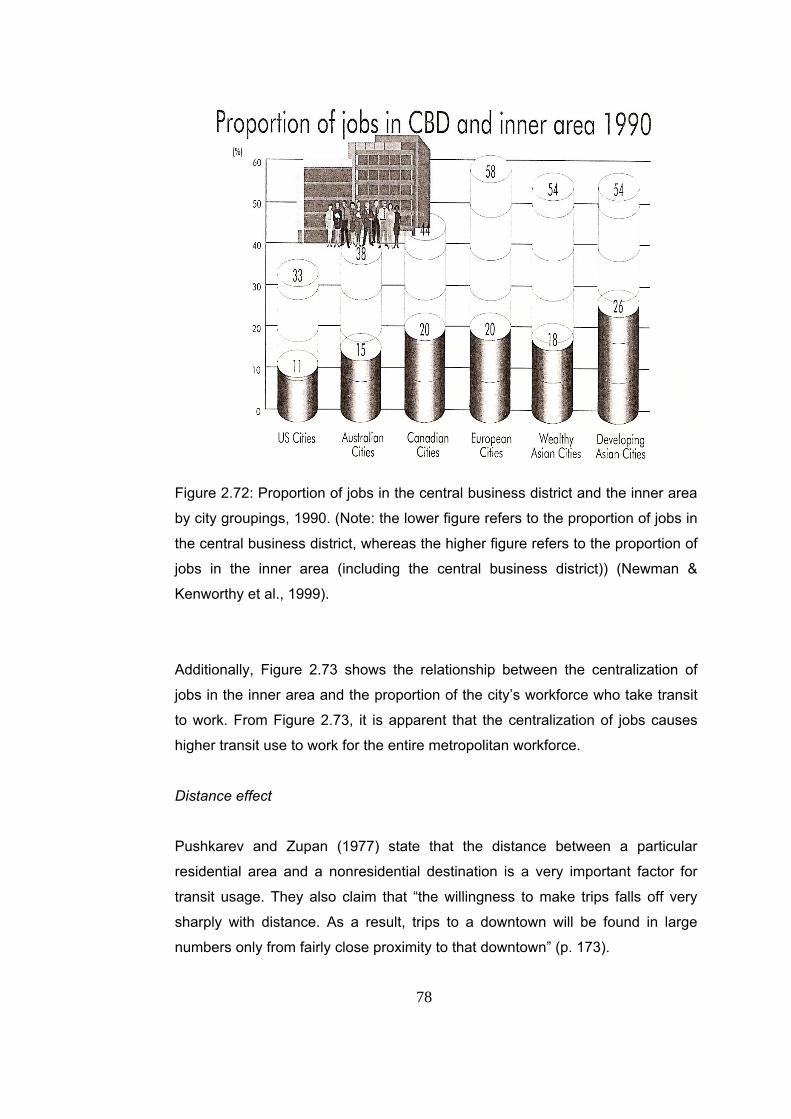
78
Figure 2.72: Proportion of jobs in the central business district and the inner area
by city groupings, 1990. (Note: the lower figure refers to the proportion of jobs in
the central business district, whereas the higher figure refers to the proportion of
jobs in the inner area (including the central business district)) (Newman &
Kenworthy et al., 1999).
Additionally, Figure 2.73 shows the relationship between the centralization of
jobs in the inner area and the proportion of the city’s workforce who take transit
to work. From Figure 2.73, it is apparent that the centralization of jobs causes
higher transit use to work for the entire metropolitan workforce.
Distance effect
Pushkarev and Zupan (1977) state that the distance between a particular
residential area and a nonresidential destination is a very important factor for
transit usage. They also claim that “the willingness to make trips falls off very
sharply with distance. As a result, trips to a downtown will be found in large
numbers only from fairly close proximity to that downtown” (p. 173).
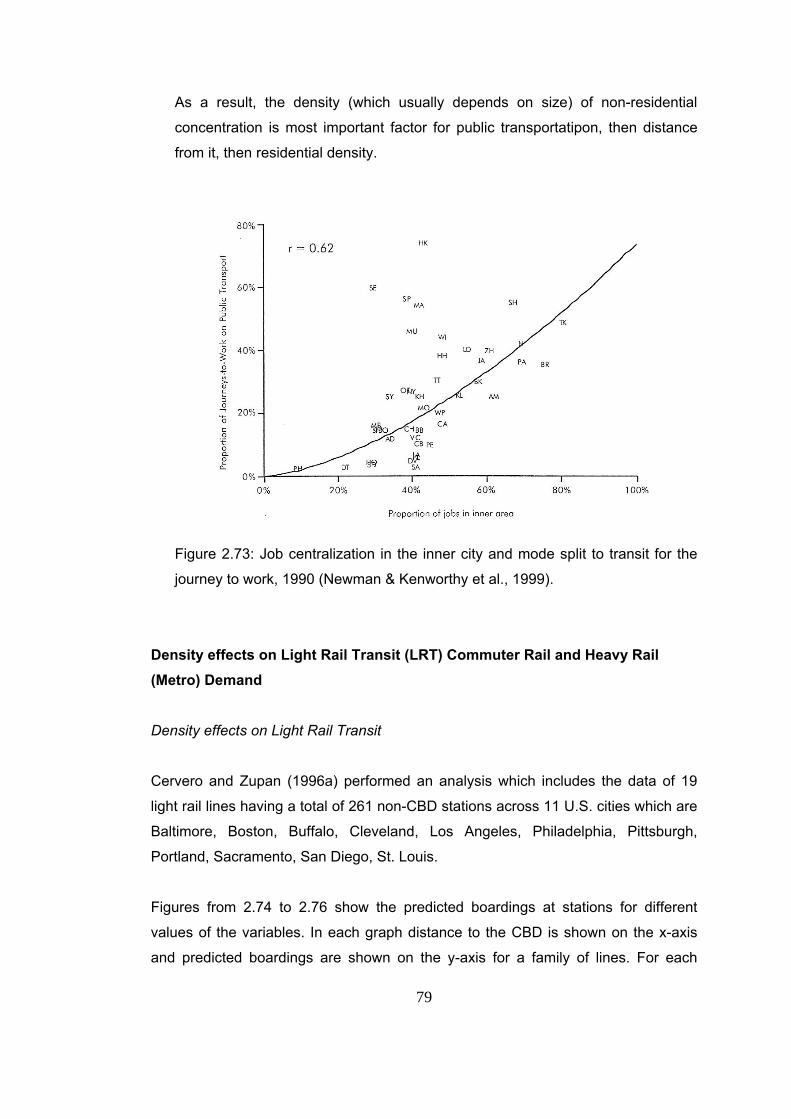
79
As a result, the density (which usually depends on size) of non-residential
concentration is most important factor for public transportatipon, then distance
from it, then residential density.
Figure 2.73: Job centralization in the inner city and mode split to transit for the
journey to work, 1990 (Newman & Kenworthy et al., 1999).
Density effects on Light Rail Transit (LRT) Commuter Rail and Heavy Rail (Metro) Demand
Density effects on Light Rail Transit
Cervero and Zupan (1996a) performed an analysis which includes the data of 19
light rail lines having a total of 261 non-CBD stations across 11 U.S. cities which are
Baltimore, Boston, Buffalo, Cleveland, Los Angeles, Philadelphia, Pittsburgh,
Portland, Sacramento, San Diego, St. Louis.
Figures from 2.74 to 2.76 show the predicted boardings at stations for different
values of the variables. In each graph distance to the CBD is shown on the x-axis
and predicted boardings are shown on the y-axis for a family of lines. For each
80
graph all variables held constant except one to determine how much change is
produced by the variations.
Figure 2.74 compares ridership for different CBD employment densities. As seen
from graph higher density result a large increase in ridership. The influence is more
exaggerated near the core.
In Figure 2.75 independent variable is residential density. Here the residential
density has a notable effect. It can be seen from graph that as density increase, the
number of daily boarding increase dependently. For example densities of 20 people
per acre generate about two times the number of riders generated by densities of 10
people per acre at 10 miles distance to CBD.
The impact of access modes which are used to reach station is shown in Figure
2.76. For light rail stations the greater effect belongs to feeder buses on ridership
level than the availability of parking and naturally, providing both feeder buses and
parking has the greatest effect.
Figure 2.74: Light Rail Station Boardings by Distance to the CBD and CBD
Employment Density (Cervero and Zupan, 1996a).
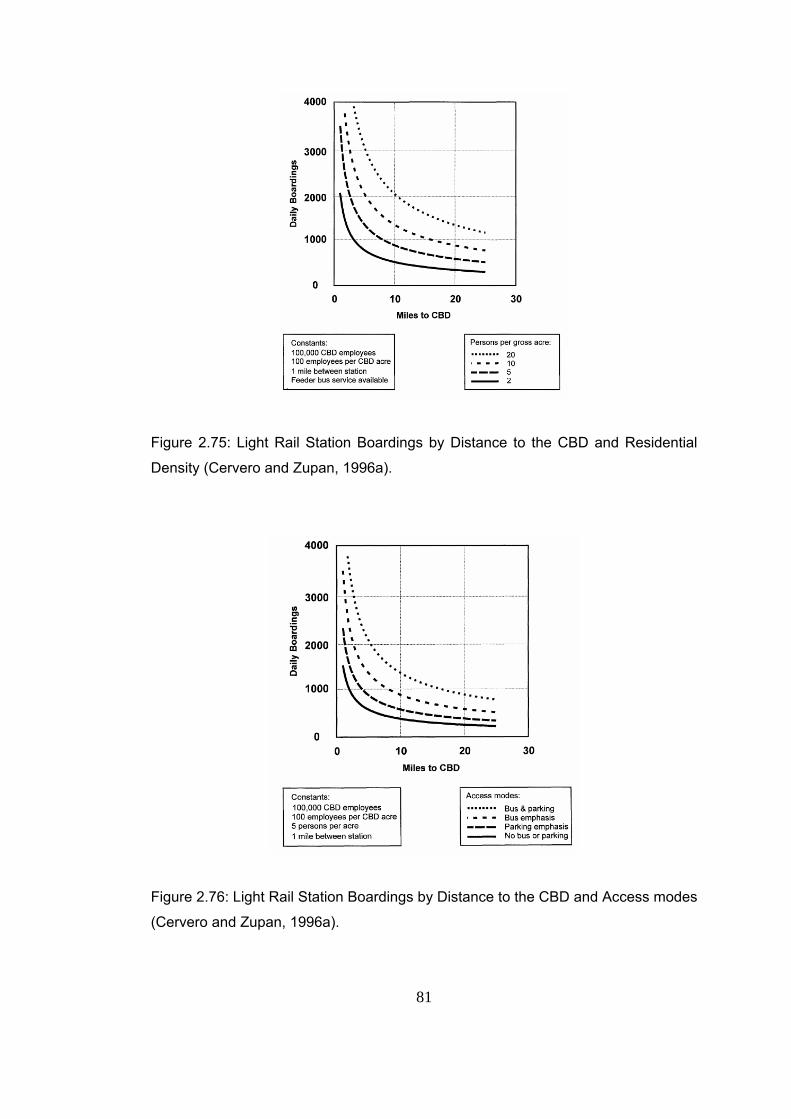
81
Figure 2.75: Light Rail Station Boardings by Distance to the CBD and Residential
Density (Cervero and Zupan, 1996a).
Figure 2.76: Light Rail Station Boardings by Distance to the CBD and Access modes
(Cervero and Zupan, 1996a).
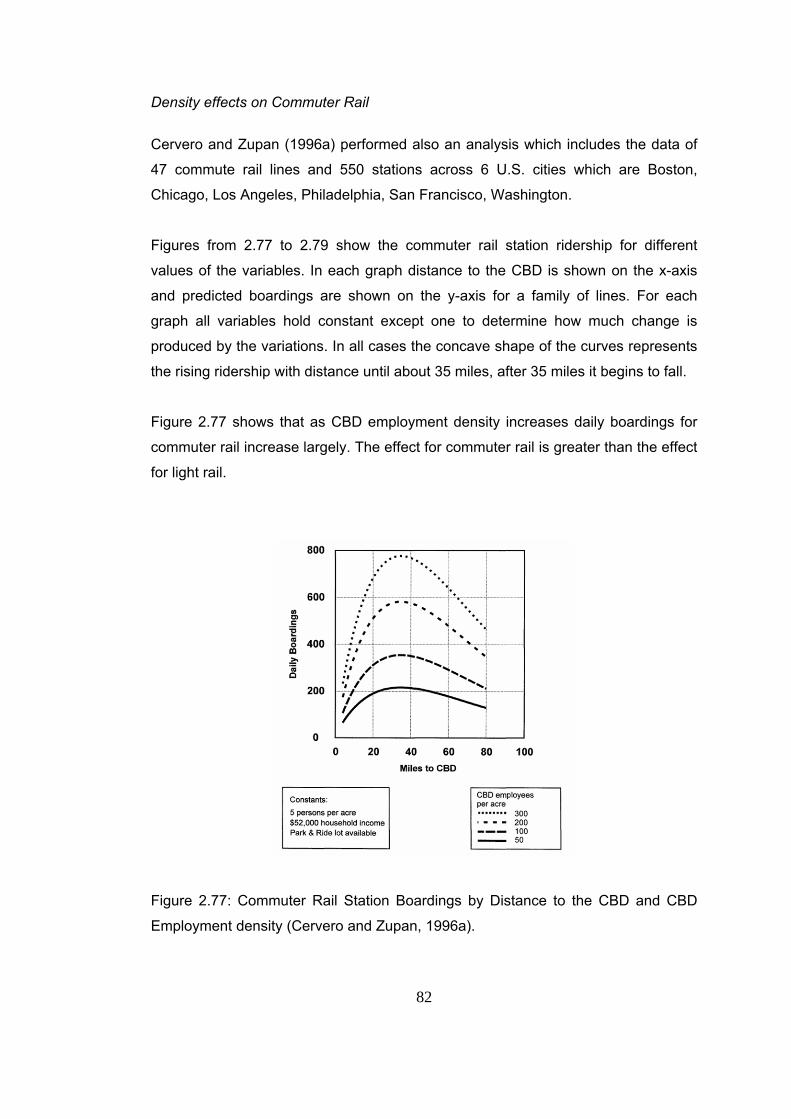
82
Density effects on Commuter Rail
Cervero and Zupan (1996a) performed also an analysis which includes the data of
47 commute rail lines and 550 stations across 6 U.S. cities which are Boston,
Chicago, Los Angeles, Philadelphia, San Francisco, Washington.
Figures from 2.77 to 2.79 show the commuter rail station ridership for different
values of the variables. In each graph distance to the CBD is shown on the x-axis
and predicted boardings are shown on the y-axis for a family of lines. For each
graph all variables hold constant except one to determine how much change is
produced by the variations. In all cases the concave shape of the curves represents
the rising ridership with distance until about 35 miles, after 35 miles it begins to fall.
Figure 2.77 shows that as CBD employment density increases daily boardings for
commuter rail increase largely. The effect for commuter rail is greater than the effect
for light rail.
Figure 2.77: Commuter Rail Station Boardings by Distance to the CBD and CBD
Employment density (Cervero and Zupan, 1996a).
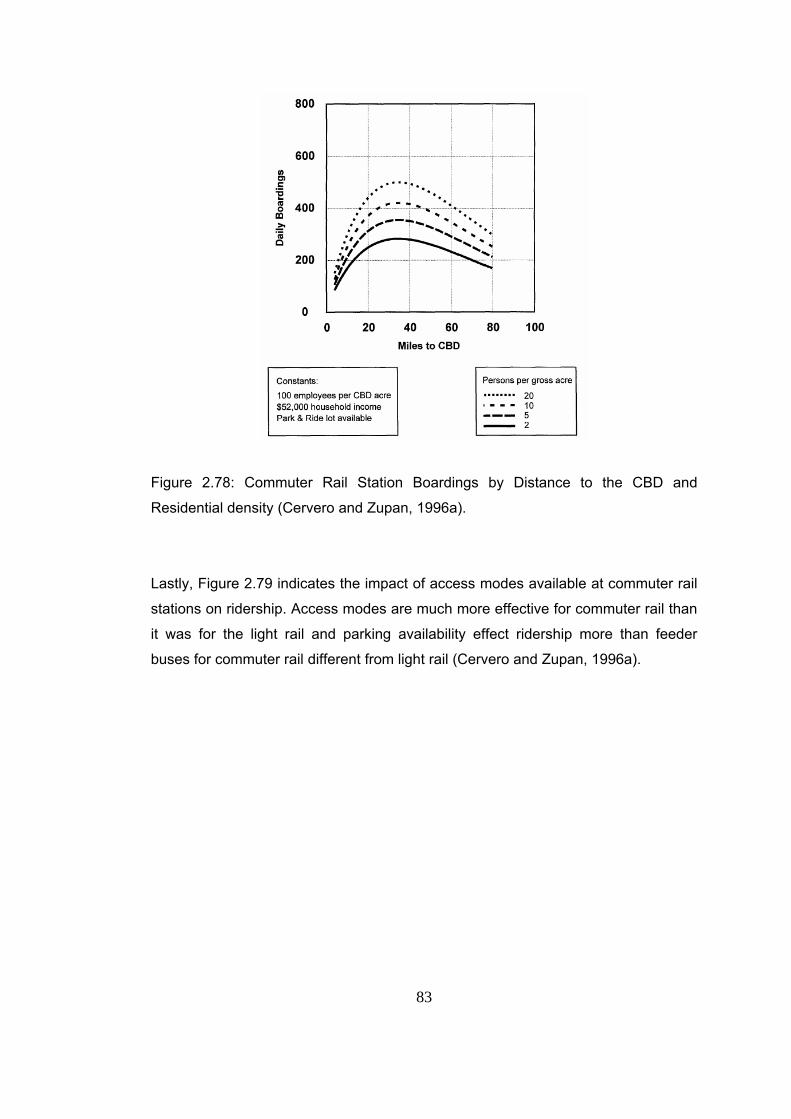
83
Figure 2.78: Commuter Rail Station Boardings by Distance to the CBD and
Residential density (Cervero and Zupan, 1996a).
Lastly, Figure 2.79 indicates the impact of access modes available at commuter rail
stations on ridership. Access modes are much more effective for commuter rail than
it was for the light rail and parking availability effect ridership more than feeder
buses for commuter rail different from light rail (Cervero and Zupan, 1996a).
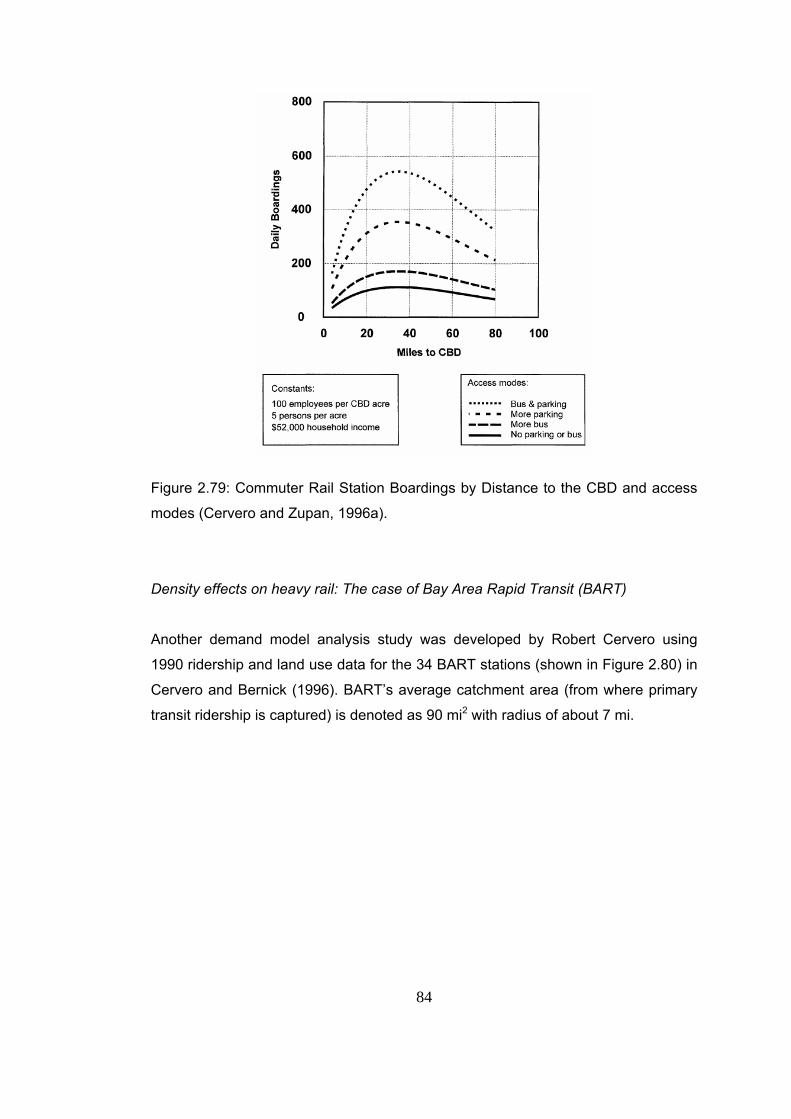
84
Figure 2.79: Commuter Rail Station Boardings by Distance to the CBD and access
modes (Cervero and Zupan, 1996a).
Density effects on heavy rail: The case of Bay Area Rapid Transit (BART)
Another demand model analysis study was developed by Robert Cervero using
1990 ridership and land use data for the 34 BART stations (shown in Figure 2.80) in
Cervero and Bernick (1996). BART’s average catchment area (from where primary
transit ridership is captured) is denoted as 90 mi2 with radius of about 7 mi.
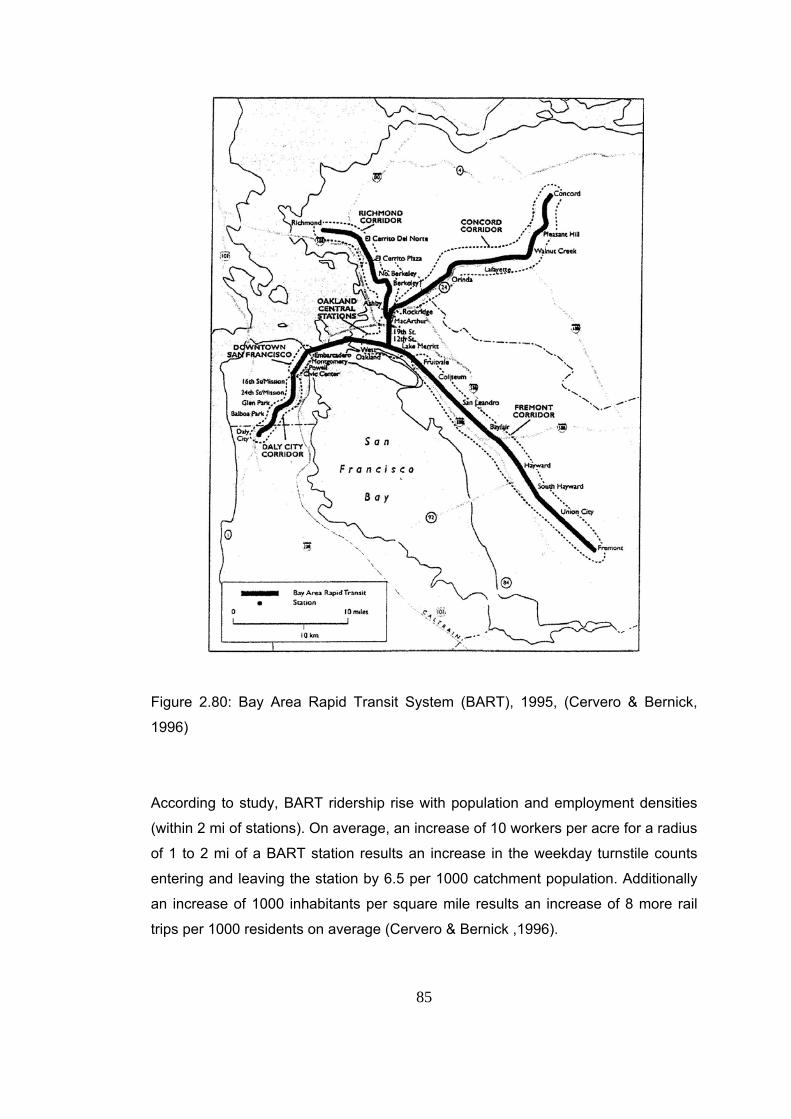
85
Figure 2.80: Bay Area Rapid Transit System (BART), 1995, (Cervero & Bernick,
1996)
According to study, BART ridership rise with population and employment densities
(within 2 mi of stations). On average, an increase of 10 workers per acre for a radius
of 1 to 2 mi of a BART station results an increase in the weekday turnstile counts
entering and leaving the station by 6.5 per 1000 catchment population. Additionally
an increase of 1000 inhabitants per square mile results an increase of 8 more rail
trips per 1000 residents on average (Cervero & Bernick ,1996).
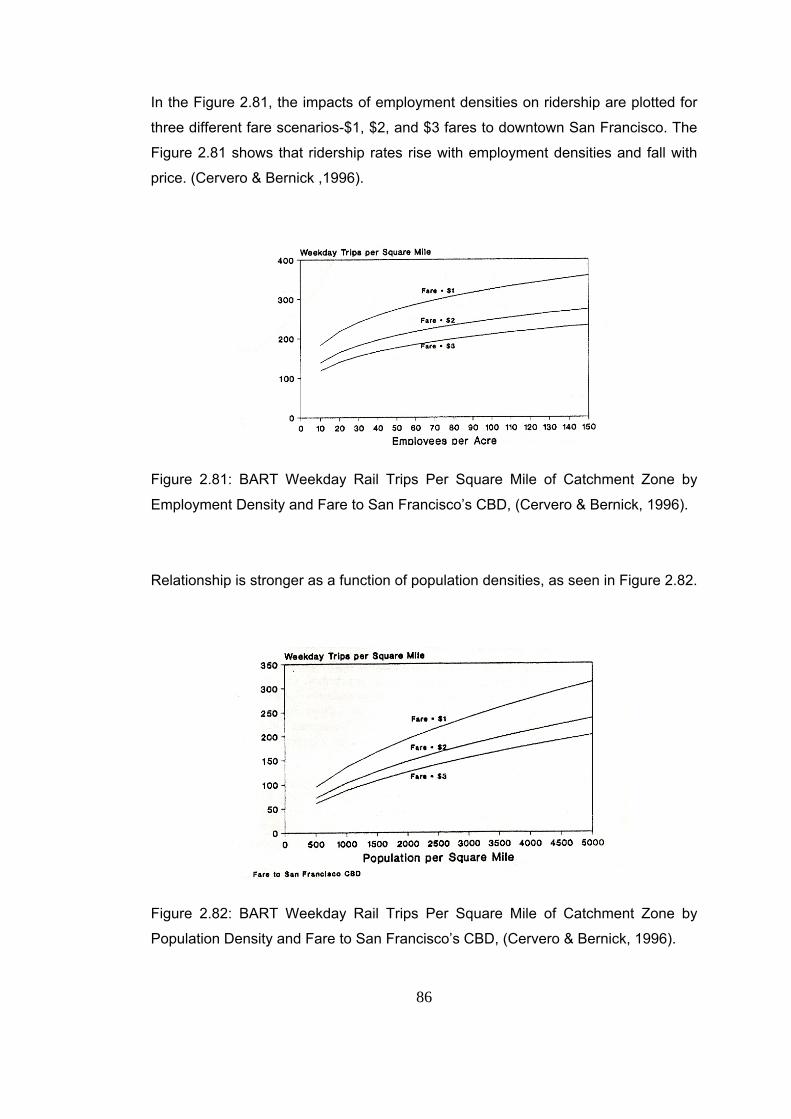
86
In the Figure 2.81, the impacts of employment densities on ridership are plotted for
three different fare scenarios-$1, $2, and $3 fares to downtown San Francisco. The
Figure 2.81 shows that ridership rates rise with employment densities and fall with
price. (Cervero & Bernick ,1996).
Figure 2.81: BART Weekday Rail Trips Per Square Mile of Catchment Zone by
Employment Density and Fare to San Francisco’s CBD, (Cervero & Bernick, 1996).
Relationship is stronger as a function of population densities, as seen in Figure 2.82.
Figure 2.82: BART Weekday Rail Trips Per Square Mile of Catchment Zone by
Population Density and Fare to San Francisco’s CBD, (Cervero & Bernick, 1996).
87
Land use diversity
Land use mix or land use diversity is a part of TOD. Cervero and Bernick (1996)
explain the effect of land use mix on public transportation as below:
• Mixed land uses can encourage people to walk or ride to various
destinations instead of making auto travel.
• Mixed land uses also enable to use resource efficiently. For example; shared
parking provides using less area for parking purpose.
• Locating retail shops, restaurants etc. near suburban employment center
allow people to walk or cycle to these destinations during lunch time.
Eliminating necessity of auto usage in the midday might also cause people to
choose public transportation instead of driving to work. Because they do not
need automobile to perform midday activities.
• If the same amount of floorspace is used for multiple purposes such as
offices, shops, and residences, trips would be spread uniformly throughout
the day and week. This reduces the amount of peak road capacity required.
Furthermore the savings from this policy can be benefited by transit
operators. Balanced land use causes balanced, bidirectional traffic flows. So,
buses and trains will serve more fully and efficiently instead of being near
empty as in the case of residences and workplaces located in the two poles
of a particular region (Cervero and Bernick, 1996).
• Another form of mixed land uses that is a part of the transit village concept is
a balance of jobs and housing. Jobs-housing balance reduces vehicle miles
of travel (VMT), freeway traffic and tailpipe emissions by means of
shortening commute trips. (Cervero, 1989)
Application of mixed use near rail station is called TS-M (transit station-mixed).TS-M
includes a wide range of commercial, service, and residential uses which serve
transit users and residents in the area.
The purpose of the TS-M zone is to:
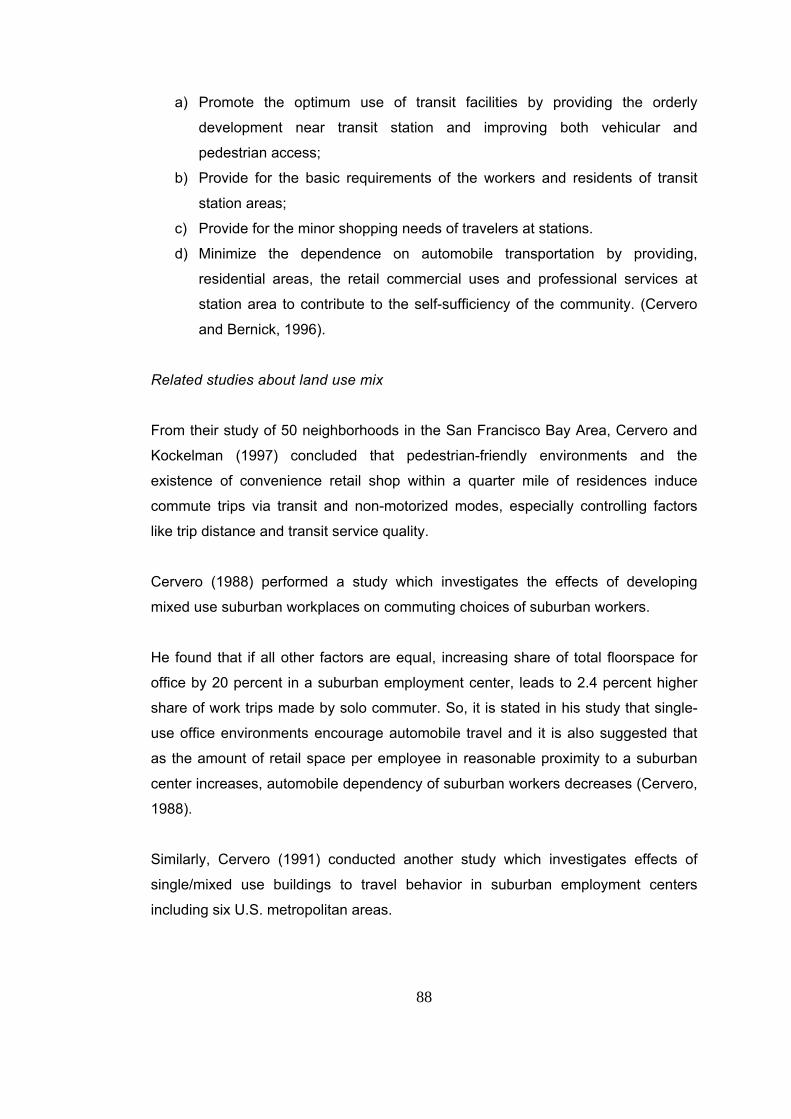
88
a) Promote the optimum use of transit facilities by providing the orderly
development near transit station and improving both vehicular and
pedestrian access;
b) Provide for the basic requirements of the workers and residents of transit
station areas;
c) Provide for the minor shopping needs of travelers at stations.
d) Minimize the dependence on automobile transportation by providing,
residential areas, the retail commercial uses and professional services at
station area to contribute to the self-sufficiency of the community. (Cervero
and Bernick, 1996).
Related studies about land use mix
From their study of 50 neighborhoods in the San Francisco Bay Area, Cervero and
Kockelman (1997) concluded that pedestrian-friendly environments and the
existence of convenience retail shop within a quarter mile of residences induce
commute trips via transit and non-motorized modes, especially controlling factors
like trip distance and transit service quality.
Cervero (1988) performed a study which investigates the effects of developing
mixed use suburban workplaces on commuting choices of suburban workers.
He found that if all other factors are equal, increasing share of total floorspace for
office by 20 percent in a suburban employment center, leads to 2.4 percent higher
share of work trips made by solo commuter. So, it is stated in his study that single-
use office environments encourage automobile travel and it is also suggested that
as the amount of retail space per employee in reasonable proximity to a suburban
center increases, automobile dependency of suburban workers decreases (Cervero,
1988).
Similarly, Cervero (1991) conducted another study which investigates effects of
single/mixed use buildings to travel behavior in suburban employment centers
including six U.S. metropolitan areas.
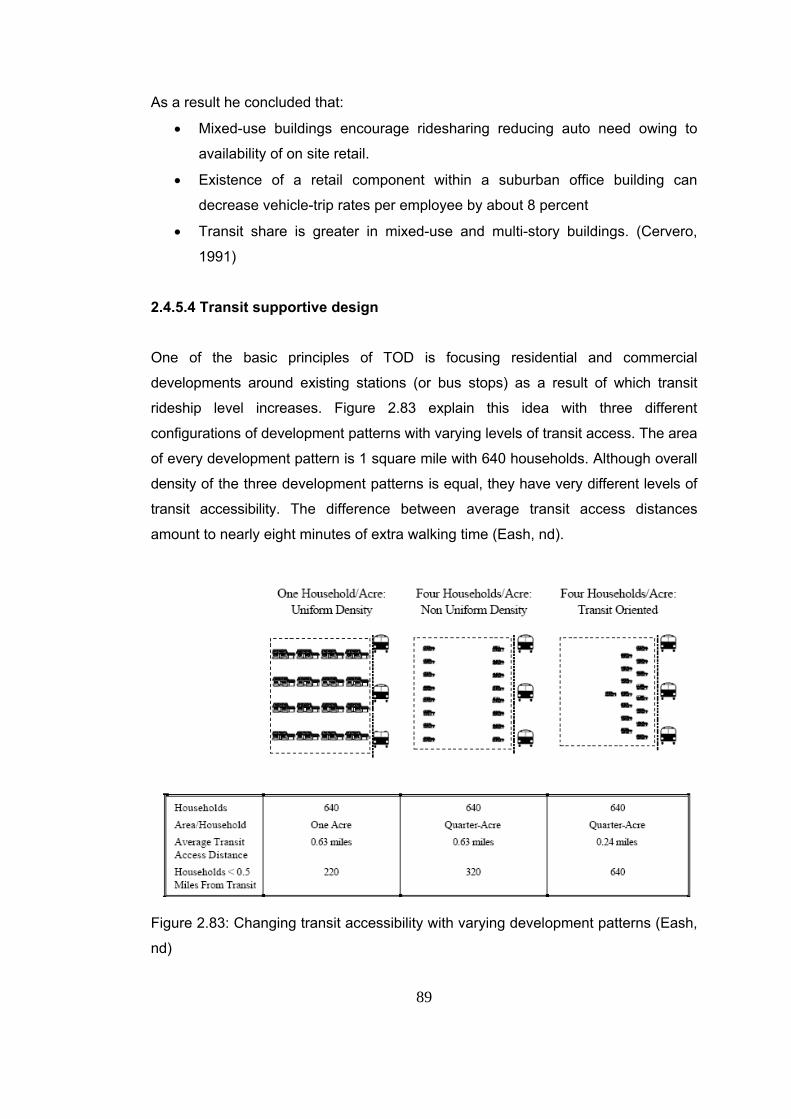
89
As a result he concluded that:
• Mixed-use buildings encourage ridesharing reducing auto need owing to
availability of on site retail.
• Existence of a retail component within a suburban office building can
decrease vehicle-trip rates per employee by about 8 percent
• Transit share is greater in mixed-use and multi-story buildings. (Cervero,
1991)
2.4.5.4 Transit supportive design One of the basic principles of TOD is focusing residential and commercial
developments around existing stations (or bus stops) as a result of which transit
rideship level increases. Figure 2.83 explain this idea with three different
configurations of development patterns with varying levels of transit access. The area
of every development pattern is 1 square mile with 640 households. Although overall
density of the three development patterns is equal, they have very different levels of
transit accessibility. The difference between average transit access distances
amount to nearly eight minutes of extra walking time (Eash, nd).
Figure 2.83: Changing transit accessibility with varying development patterns (Eash,
nd)
90
Pushkarev and Zupan (1977) explain transit supportive land uses through
comparative examples.
• Clustering or dispersing nonresidential space:
If it is assumed that 10 million square feet nonresidential space is added to a
growing urban area.
- One option is to create two different highway oriented nonresidential
clusters, each 5 million square feet in size.
- Another is to create a unique new downtown of 10 million square feet.
In the second case, per capita transit trips within a 3 to 5 mile radius will be 50
to 70 percent higher than the trips generated from first option, in the case of
same residential density.
• Enlarging downtown size or raising nearly residential density:
Assume;
- first option is increasing the size of a downtown from 10 to 20 million square
feet,
- second option is increasing the residential density from 15 to 30 dwellings
per acre within a few miles distance.
The first option generates per capita transit trips by three to four times higher
than second option.
• Increasing residential density near downtown or farther away:
Assume there is a downtown of 10 million square feet; if the residential density is
increased from 5 to 10 dwellings per acre within one mile of downtown, this will
generate seventeen times higher trips than in the case of increasing residential
density at a distance of 10 miles from downtown.
• Scattering apartments or concentrating them near transit:
Assume a rapid transit station is located 5 miles from a downtown of 50 million
91
square feet of nonresidential floorspace. At a density of 15 dwellings per acre,
the square mile surrounding the station will generate about 620 transit trips a
day to the downtown.
- If the density of development is increased adding new apartments by 20
percent throughout the square mile, this will increase amount of transit trips by
about 24 percent.
- If the apartments are clustered within 2000 feet of the station, keeping the rest
of the neighborhood constant, transit trips will increase by 34 percent or more
(Pushkarev and Zupan, 1977).
• Downtown size and residential density related to public transportation
Clustered nonresidential floorspace in downtowns and other compact
development patterns are most effective land use policies for public
transportation. For example, downtowns of 10 million square feet of gross
nonresidential floorspace which is confined within less than 1 square mile begin
to make moderately frequent bus service feasible and to attract sufficient
proportion of trips by transit. However, downtowns which have 5 millions square
feet of nonresidential floorspace can support only inadequate bus service.
Clusters of nonresidential floorspace which are spread in suburban can only
occasionally support inadequate bus service, i.e., provided that they contain
shopping centers and residential area having density of about 7 dwellings per
acre (Pushkarev and Zupan, 1977).
Newman, Kenworthy et. al. (1999) confirm findings of Pushkarev and Zupan (1977).
Newman, Kenworthy et. al. (1999) express that very high job density in the CBD as
in Toronto, New York, Tokyo etc., is strongly related to the presence of a high
capacity rail network and similarly in the developing Asian cities, weak rail systems
and dependence on low capacity and slow buses, cause to expand the CBD so as
to maintain adequate accessibility.
As a result, according to Pushkarev and Zupan, (1977) residential density is less important for transit use than residential location, i.e., proximity to a downtown of substantial size or proximity to a rail transit line. If greater transit use is the goal, it is more important to put housing close to a downtown than to make it high density ( p. 177)
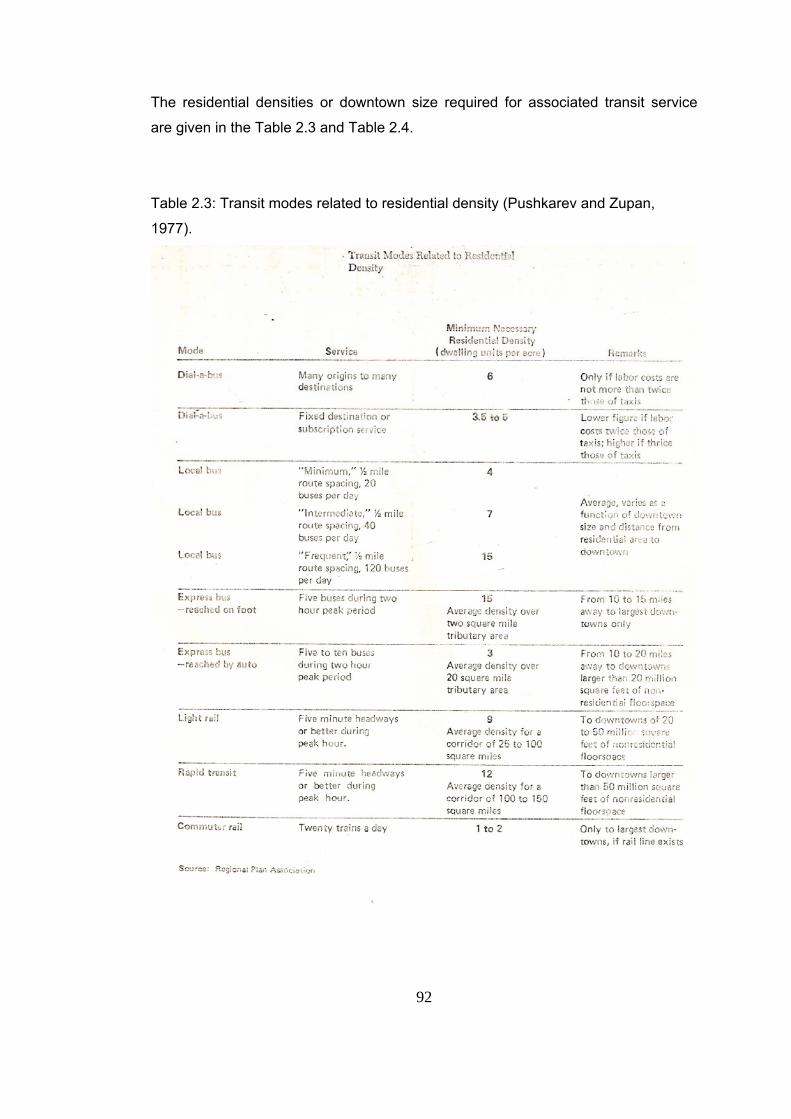
92
The residential densities or downtown size required for associated transit service
are given in the Table 2.3 and Table 2.4.
Table 2.3: Transit modes related to residential density (Pushkarev and Zupan,
1977).
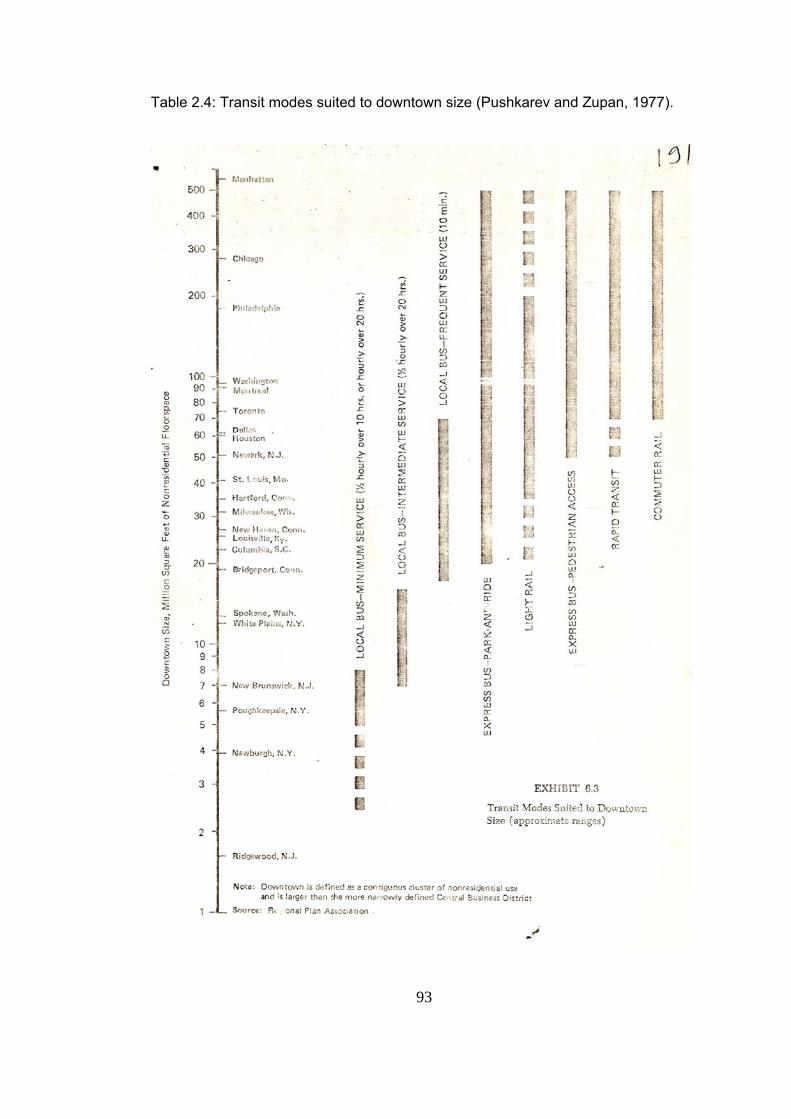
93
Table 2.4: Transit modes suited to downtown size (Pushkarev and Zupan, 1977).
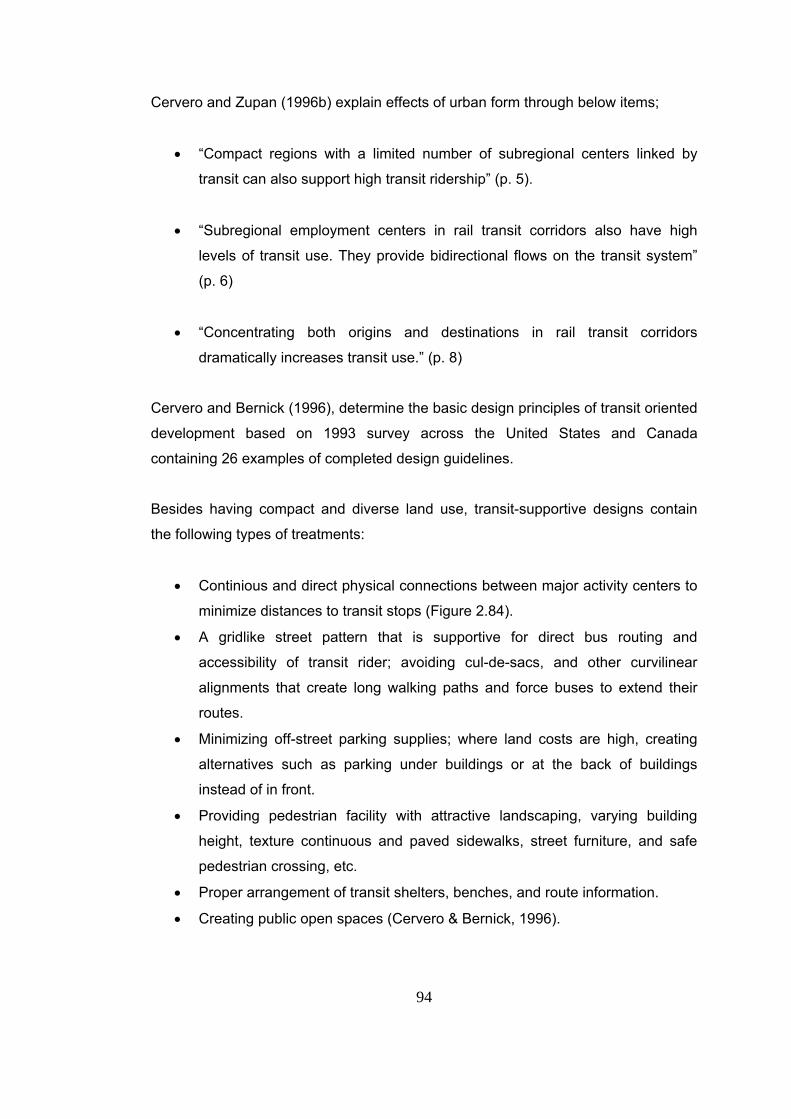
94
Cervero and Zupan (1996b) explain effects of urban form through below items;
• “Compact regions with a limited number of subregional centers linked by
transit can also support high transit ridership” (p. 5).
• “Subregional employment centers in rail transit corridors also have high
levels of transit use. They provide bidirectional flows on the transit system”
(p. 6)
• “Concentrating both origins and destinations in rail transit corridors
dramatically increases transit use.” (p. 8)
Cervero and Bernick (1996), determine the basic design principles of transit oriented
development based on 1993 survey across the United States and Canada
containing 26 examples of completed design guidelines.
Besides having compact and diverse land use, transit-supportive designs contain
the following types of treatments:
• Continious and direct physical connections between major activity centers to
minimize distances to transit stops (Figure 2.84).
• A gridlike street pattern that is supportive for direct bus routing and
accessibility of transit rider; avoiding cul-de-sacs, and other curvilinear
alignments that create long walking paths and force buses to extend their
routes.
• Minimizing off-street parking supplies; where land costs are high, creating
alternatives such as parking under buildings or at the back of buildings
instead of in front.
• Providing pedestrian facility with attractive landscaping, varying building
height, texture continuous and paved sidewalks, street furniture, and safe
pedestrian crossing, etc.
• Proper arrangement of transit shelters, benches, and route information.
• Creating public open spaces (Cervero & Bernick, 1996).
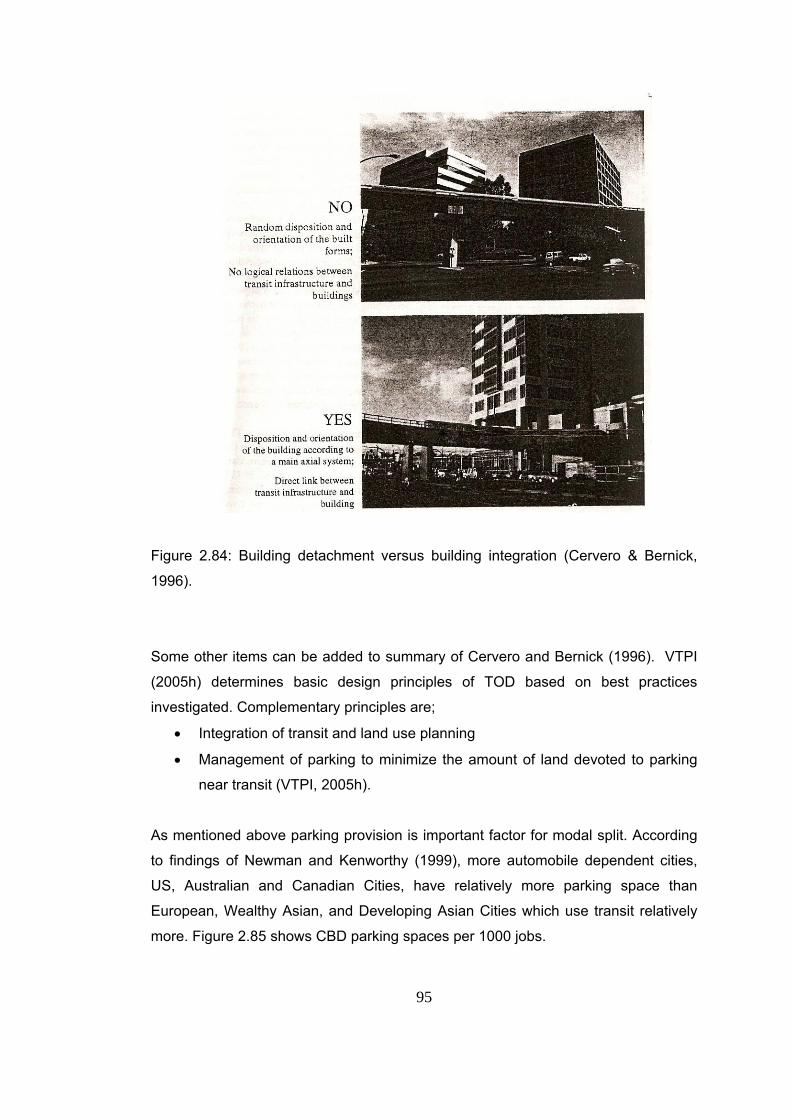
95
Figure 2.84: Building detachment versus building integration (Cervero & Bernick,
1996).
Some other items can be added to summary of Cervero and Bernick (1996). VTPI
(2005h) determines basic design principles of TOD based on best practices
investigated. Complementary principles are;
• Integration of transit and land use planning
• Management of parking to minimize the amount of land devoted to parking
near transit (VTPI, 2005h).
As mentioned above parking provision is important factor for modal split. According
to findings of Newman and Kenworthy (1999), more automobile dependent cities,
US, Australian and Canadian Cities, have relatively more parking space than
European, Wealthy Asian, and Developing Asian Cities which use transit relatively
more. Figure 2.85 shows CBD parking spaces per 1000 jobs.
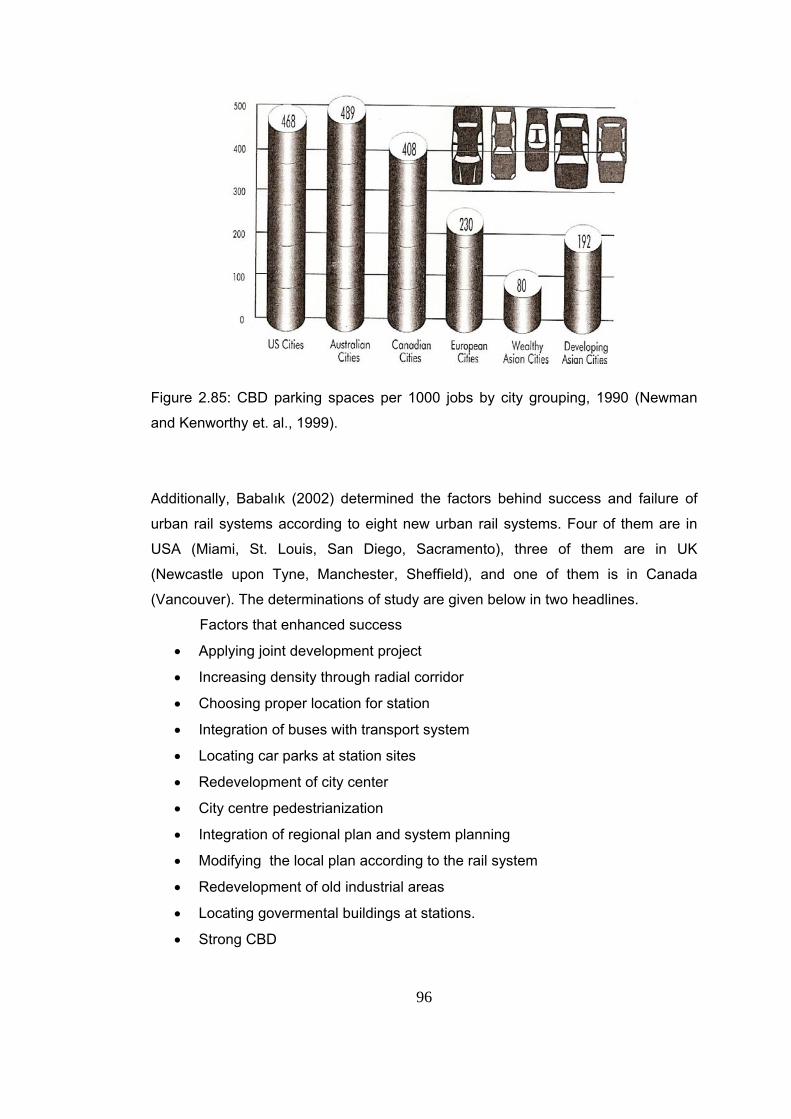
96
Figure 2.85: CBD parking spaces per 1000 jobs by city grouping, 1990 (Newman
and Kenworthy et. al., 1999).
Additionally, Babalık (2002) determined the factors behind success and failure of
urban rail systems according to eight new urban rail systems. Four of them are in
USA (Miami, St. Louis, San Diego, Sacramento), three of them are in UK
(Newcastle upon Tyne, Manchester, Sheffield), and one of them is in Canada
(Vancouver). The determinations of study are given below in two headlines.
Factors that enhanced success
• Applying joint development project
• Increasing density through radial corridor
• Choosing proper location for station
• Integration of buses with transport system
• Locating car parks at station sites
• Redevelopment of city center
• City centre pedestrianization
• Integration of regional plan and system planning
• Modifying the local plan according to the rail system
• Redevelopment of old industrial areas
• Locating govermental buildings at stations.
• Strong CBD
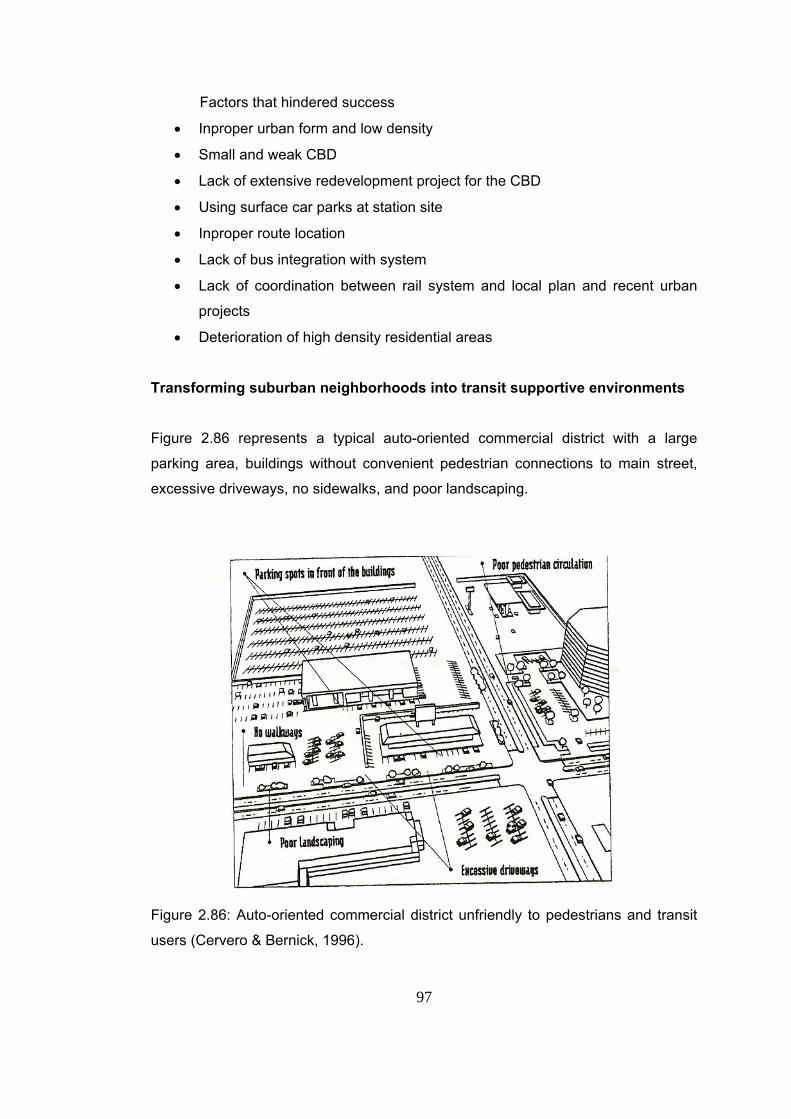
97
Factors that hindered success
• Inproper urban form and low density
• Small and weak CBD
• Lack of extensive redevelopment project for the CBD
• Using surface car parks at station site
• Inproper route location
• Lack of bus integration with system
• Lack of coordination between rail system and local plan and recent urban
projects
• Deterioration of high density residential areas
Transforming suburban neighborhoods into transit supportive environments
Figure 2.86 represents a typical auto-oriented commercial district with a large
parking area, buildings without convenient pedestrian connections to main street,
excessive driveways, no sidewalks, and poor landscaping.
Figure 2.86: Auto-oriented commercial district unfriendly to pedestrians and transit
users (Cervero & Bernick, 1996).
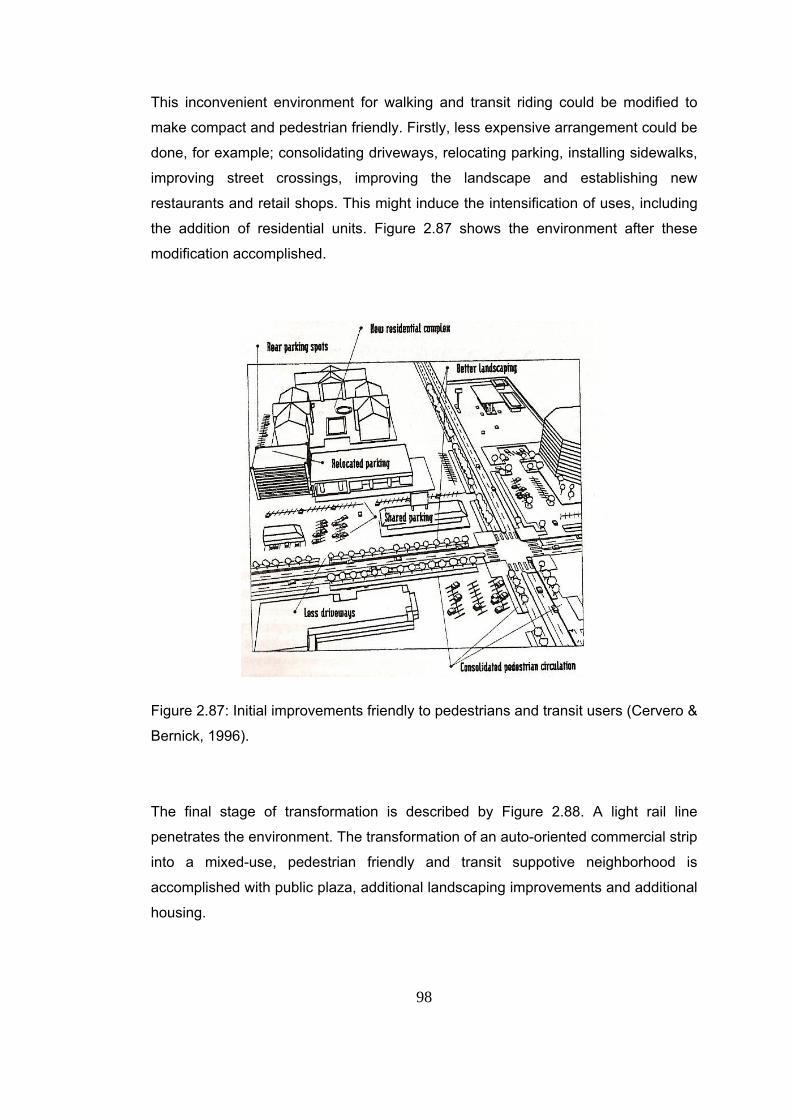
98
This inconvenient environment for walking and transit riding could be modified to
make compact and pedestrian friendly. Firstly, less expensive arrangement could be
done, for example; consolidating driveways, relocating parking, installing sidewalks,
improving street crossings, improving the landscape and establishing new
restaurants and retail shops. This might induce the intensification of uses, including
the addition of residential units. Figure 2.87 shows the environment after these
modification accomplished.
Figure 2.87: Initial improvements friendly to pedestrians and transit users (Cervero &
Bernick, 1996).
The final stage of transformation is described by Figure 2.88. A light rail line
penetrates the environment. The transformation of an auto-oriented commercial strip
into a mixed-use, pedestrian friendly and transit suppotive neighborhood is
accomplished with public plaza, additional landscaping improvements and additional
housing.
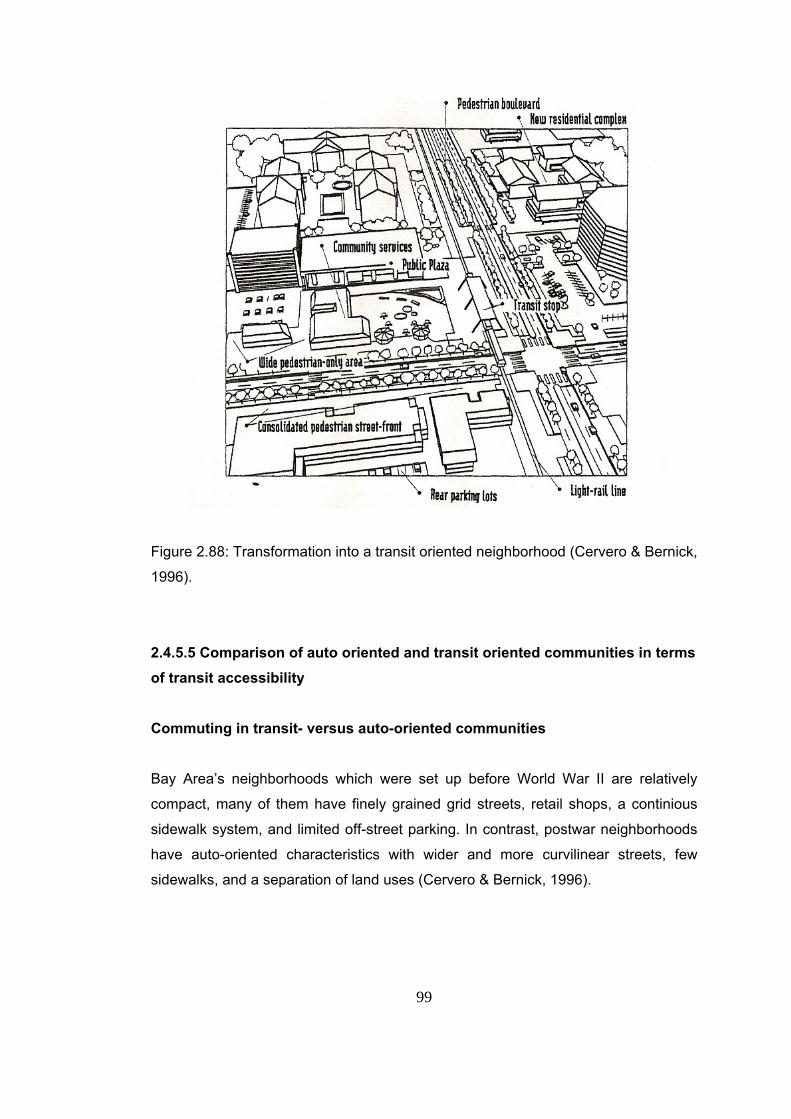
99
Figure 2.88: Transformation into a transit oriented neighborhood (Cervero & Bernick,
1996).
2.4.5.5 Comparison of auto oriented and transit oriented communities in terms of transit accessibility
Commuting in transit- versus auto-oriented communities
Bay Area’s neighborhoods which were set up before World War II are relatively
compact, many of them have finely grained grid streets, retail shops, a continious
sidewalk system, and limited off-street parking. In contrast, postwar neighborhoods
have auto-oriented characteristics with wider and more curvilinear streets, few
sidewalks, and a separation of land uses (Cervero & Bernick, 1996).
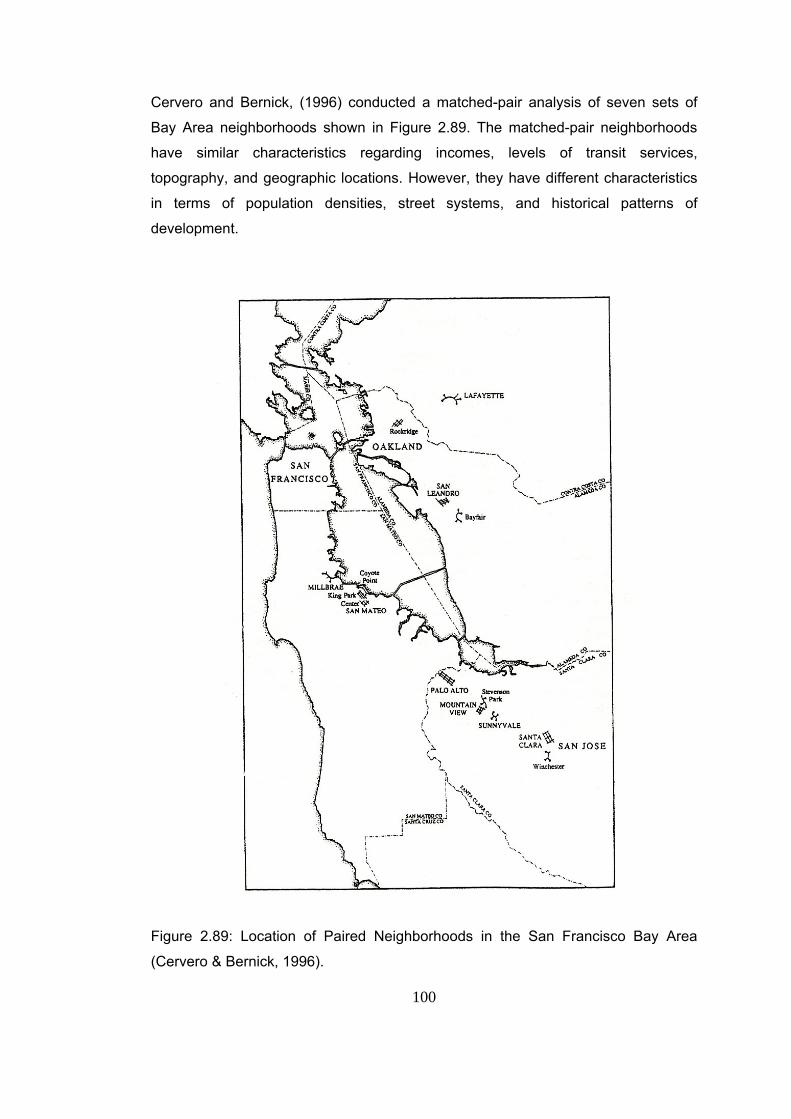
100
Cervero and Bernick, (1996) conducted a matched-pair analysis of seven sets of
Bay Area neighborhoods shown in Figure 2.89. The matched-pair neighborhoods
have similar characteristics regarding incomes, levels of transit services,
topography, and geographic locations. However, they have different characteristics
in terms of population densities, street systems, and historical patterns of
development.
Figure 2.89: Location of Paired Neighborhoods in the San Francisco Bay Area
(Cervero & Bernick, 1996).
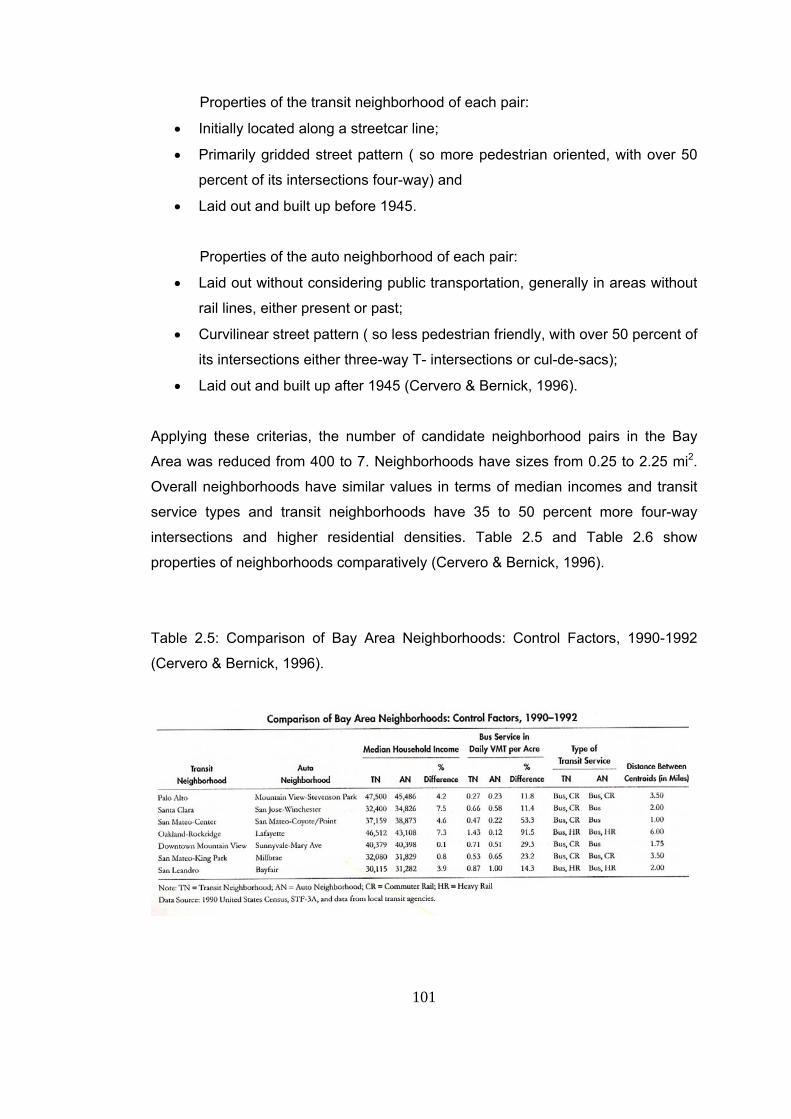
101
Properties of the transit neighborhood of each pair:
• Initially located along a streetcar line;
• Primarily gridded street pattern ( so more pedestrian oriented, with over 50
percent of its intersections four-way) and
• Laid out and built up before 1945.
Properties of the auto neighborhood of each pair:
• Laid out without considering public transportation, generally in areas without
rail lines, either present or past;
• Curvilinear street pattern ( so less pedestrian friendly, with over 50 percent of
its intersections either three-way T- intersections or cul-de-sacs);
• Laid out and built up after 1945 (Cervero & Bernick, 1996).
Applying these criterias, the number of candidate neighborhood pairs in the Bay
Area was reduced from 400 to 7. Neighborhoods have sizes from 0.25 to 2.25 mi2.
Overall neighborhoods have similar values in terms of median incomes and transit
service types and transit neighborhoods have 35 to 50 percent more four-way
intersections and higher residential densities. Table 2.5 and Table 2.6 show
properties of neighborhoods comparatively (Cervero & Bernick, 1996).
Table 2.5: Comparison of Bay Area Neighborhoods: Control Factors, 1990-1992
(Cervero & Bernick, 1996).
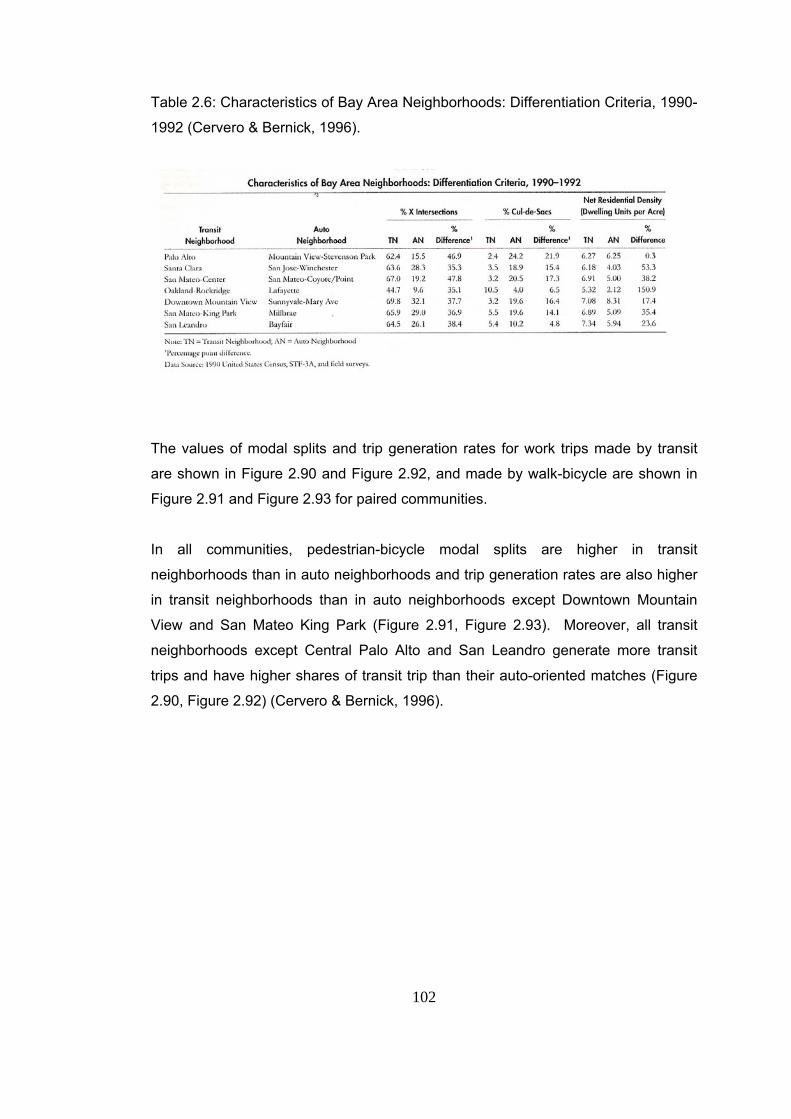
102
Table 2.6: Characteristics of Bay Area Neighborhoods: Differentiation Criteria, 1990-
1992 (Cervero & Bernick, 1996).
The values of modal splits and trip generation rates for work trips made by transit
are shown in Figure 2.90 and Figure 2.92, and made by walk-bicycle are shown in
Figure 2.91 and Figure 2.93 for paired communities.
In all communities, pedestrian-bicycle modal splits are higher in transit
neighborhoods than in auto neighborhoods and trip generation rates are also higher
in transit neighborhoods than in auto neighborhoods except Downtown Mountain
View and San Mateo King Park (Figure 2.91, Figure 2.93). Moreover, all transit
neighborhoods except Central Palo Alto and San Leandro generate more transit
trips and have higher shares of transit trip than their auto-oriented matches (Figure
2.90, Figure 2.92) (Cervero & Bernick, 1996).
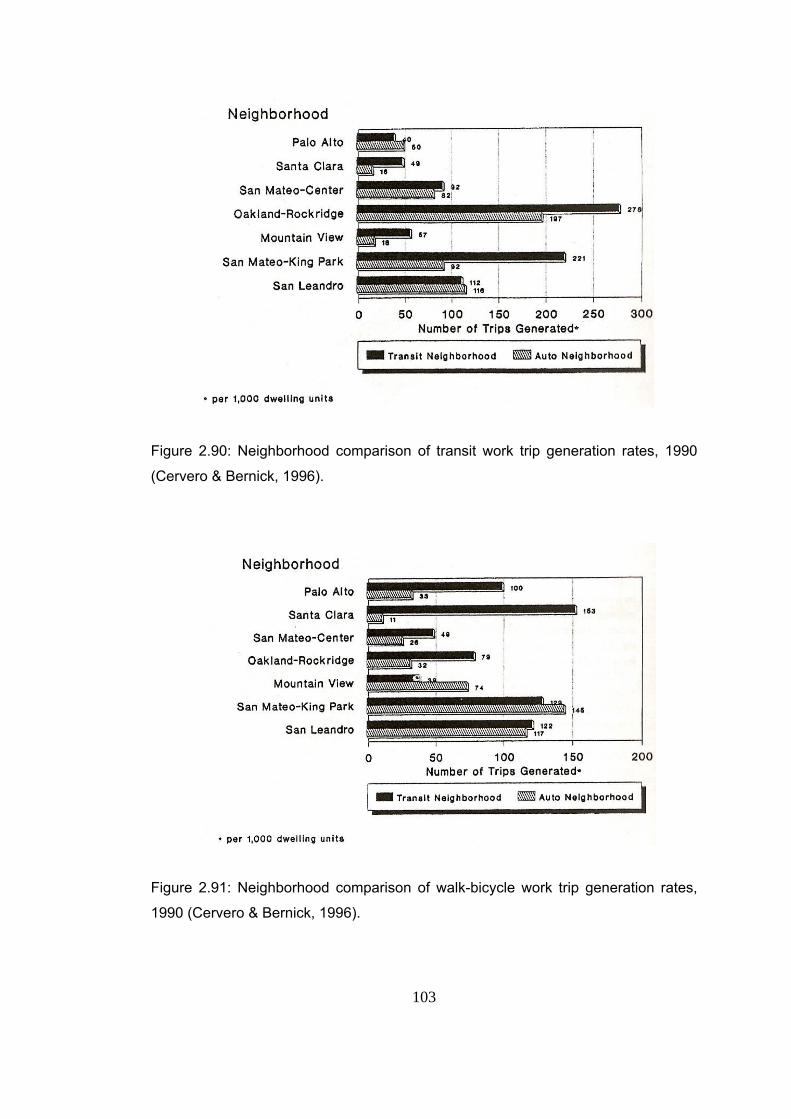
103
Figure 2.90: Neighborhood comparison of transit work trip generation rates, 1990
(Cervero & Bernick, 1996).
Figure 2.91: Neighborhood comparison of walk-bicycle work trip generation rates,
1990 (Cervero & Bernick, 1996).
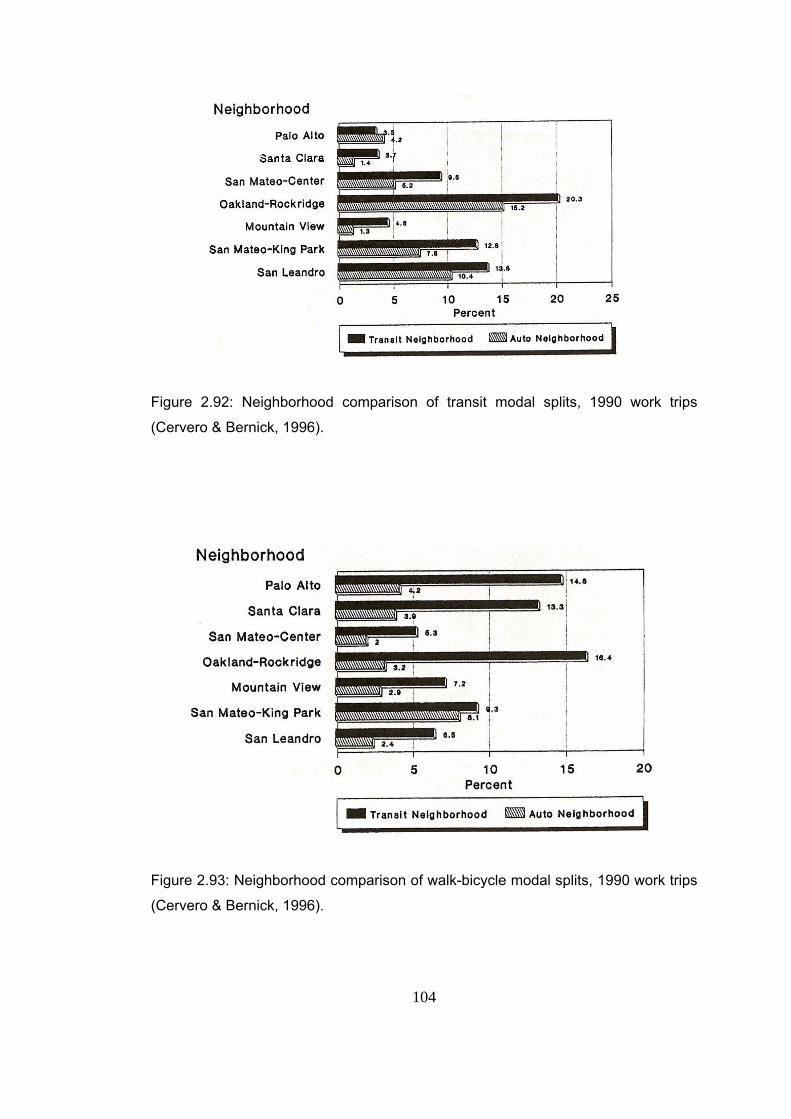
104
Figure 2.92: Neighborhood comparison of transit modal splits, 1990 work trips
(Cervero & Bernick, 1996).
Figure 2.93: Neighborhood comparison of walk-bicycle modal splits, 1990 work trips
(Cervero & Bernick, 1996).
105
Cervero and Bernick (1996) concluded that the evidences which show transit-
oriented neighborhoods are less auto-dependent is fairly persuasive in the Bay
Area. They also claim that although findings are persuasive, it does not mean that
commuting behavior is totally different in transit-oriented and auto-oriented
neighborhoods in the Bay Area. Because, commute trips made by auto travel is
double of trips made by transit or walking-bicycling in the case of all transit
neighborhoods (Cervero & Bernick, 1996).
Outcomes of study
The region’s overall form has an important effect on modal choice. “Island of transit
oriented development in a sea of freeway-oriented suburbs will do little to change
fundamental commuting habits”. So transit oriented neighborhood cannot be
isolated. It must be part of a transit metropol (Cervero & Bernick, 1996, p. 111).
Another conclusion is that the evaluations of how built environments, including transit-oriented development, impact travel demand are taking place in a distorted marketplace of cheap automobile travel and a failure of price externalities. It is no surprise that the effects of built environments on travel have been suboptimal in a world of suboptimal pricing. This, we argue, is not so much an indictment of transit villages or any other physical planning initiative as it is an indictment of how we currently price and manage our transportation and land resources. Surely if fuel costs $4 per gal, as in most of Europe, and all workers have to pay at least $5 per day for parking to cover true costs, then the commuting impacts of transit oriented development in the Bay Area or elsewhere would no doubt be far greater (Cervero & Bernick, 1996, p. 111).
Nonwork Travel in Transit- versus Auto-oriented Neighborhoods
Similar analysis is carried out by Cervero and Radisch (1995) with neighborhood
pair of Rockridge and Lafayette to investigate effects of transit oriented development
on nonwork trips. For this study, survey data were gathered from 620 randomly
sampled households in the two neighborhoods. Basic properties of communities are
given below.
106
Rockridge neighborhood
The Rockridge neighborhood of Oakland features the properties of the transit
oriented design having (Figure 2.94);
• Very compact pattern with mix of housing containing mostly apartments and
detached units in small lots.
• Grid street pattern and mixed land uses.
• Pedestrian friendly storefront design with shops typically 40 ft or less in width
which allow to locate four or more shops on a typical block.
• Pedestrian friendly building orientation with direct opening to sidewalk.
• Vertical mix of buildings with stores having office or residential units above.
• On the street or behind building parkings.
• Continious sidewalks and pedestrian paths (Cervero & Radisch, 1995).
Lafayette Neighborhood
The Lafayette, lies west of the East Bay hills, is in contrast with Rockridge having
(Figure 2.94);
• Large-lot housing
• Strong automobile orientation.
• Less regular and more curvilinear street network.
• Wider streets.
• More coarsely grainded land use mix and no mixing vertically within
structures.
• Poor pedestrian connections due to the elongated block faces and circuitous
pathways (Cervero & Radisch, 1995).
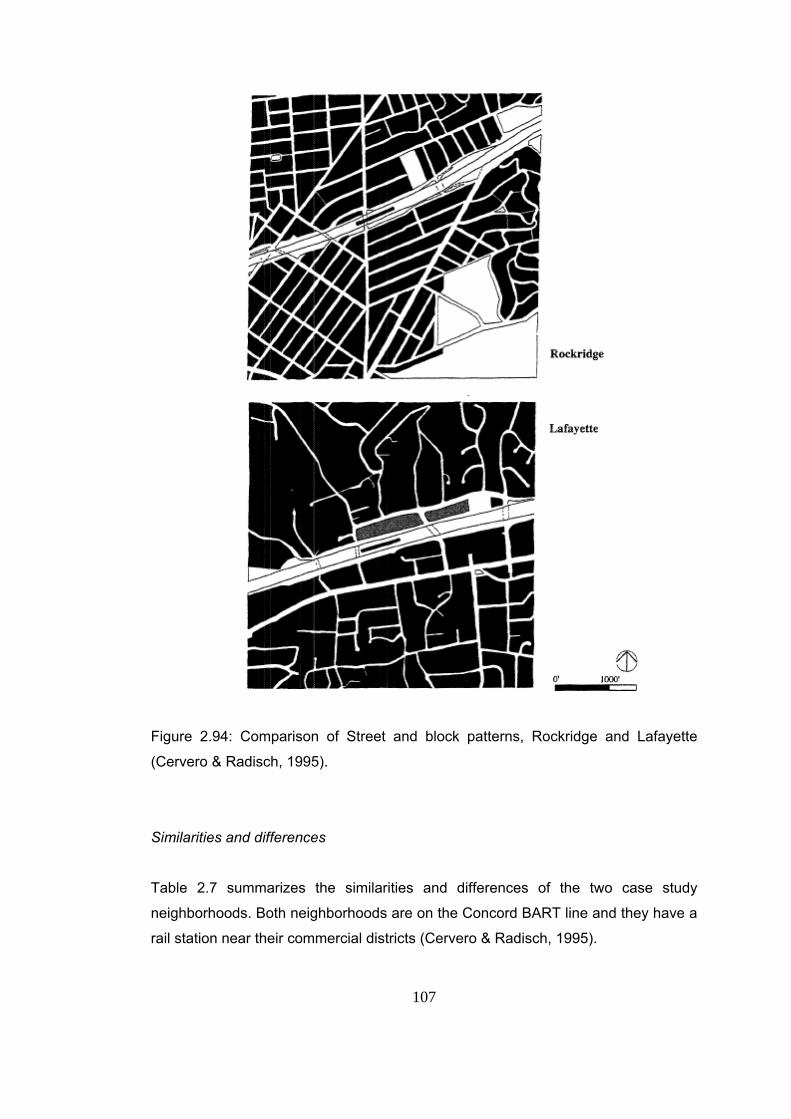
107
Figure 2.94: Comparison of Street and block patterns, Rockridge and Lafayette
(Cervero & Radisch, 1995).
Similarities and differences
Table 2.7 summarizes the similarities and differences of the two case study
neighborhoods. Both neighborhoods are on the Concord BART line and they have a
rail station near their commercial districts (Cervero & Radisch, 1995).
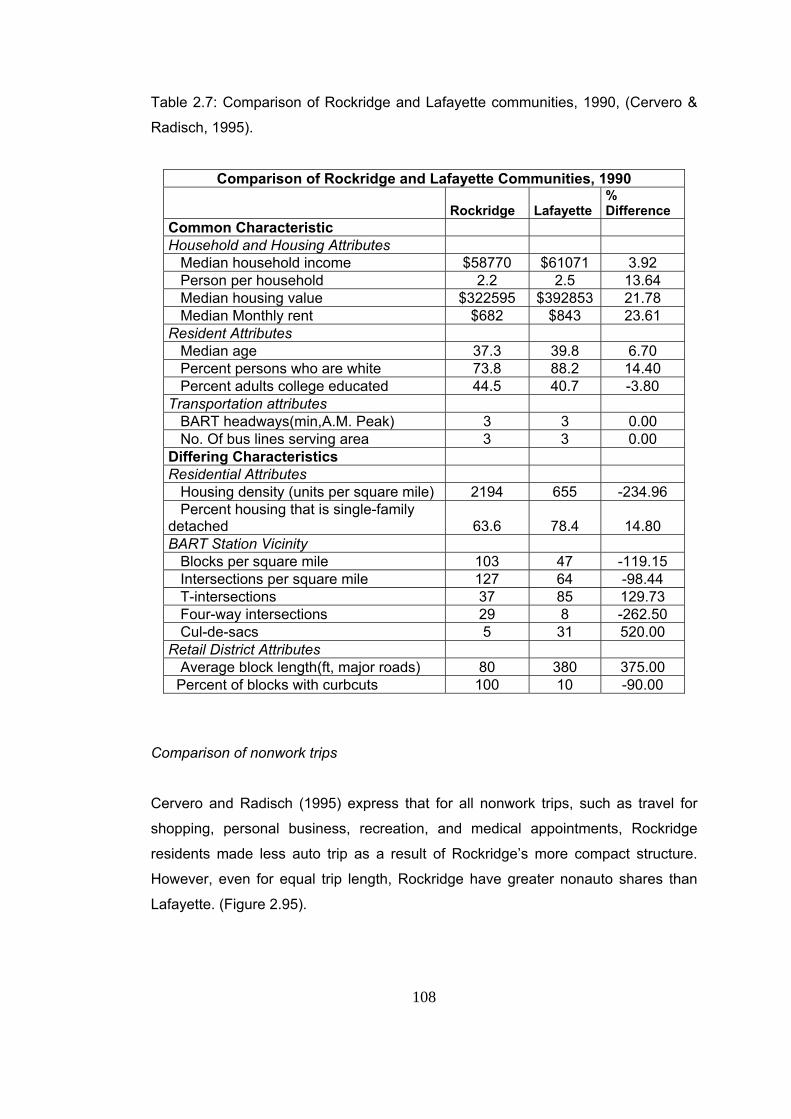
108
Table 2.7: Comparison of Rockridge and Lafayette communities, 1990, (Cervero &
Radisch, 1995).
Comparison of Rockridge and Lafayette Communities, 1990
Rockridge Lafayette % Difference
Common Characteristic Household and Housing Attributes Median household income $58770 $61071 3.92 Person per household 2.2 2.5 13.64 Median housing value $322595 $392853 21.78 Median Monthly rent $682 $843 23.61 Resident Attributes Median age 37.3 39.8 6.70 Percent persons who are white 73.8 88.2 14.40 Percent adults college educated 44.5 40.7 -3.80 Transportation attributes BART headways(min,A.M. Peak) 3 3 0.00 No. Of bus lines serving area 3 3 0.00 Differing Characteristics Residential Attributes Housing density (units per square mile) 2194 655 -234.96 Percent housing that is single-family detached 63.6 78.4 14.80 BART Station Vicinity Blocks per square mile 103 47 -119.15 Intersections per square mile 127 64 -98.44 T-intersections 37 85 129.73 Four-way intersections 29 8 -262.50 Cul-de-sacs 5 31 520.00 Retail District Attributes Average block length(ft, major roads) 80 380 375.00 Percent of blocks with curbcuts 100 10 -90.00
Comparison of nonwork trips
Cervero and Radisch (1995) express that for all nonwork trips, such as travel for
shopping, personal business, recreation, and medical appointments, Rockridge
residents made less auto trip as a result of Rockridge’s more compact structure.
However, even for equal trip length, Rockridge have greater nonauto shares than
Lafayette. (Figure 2.95).
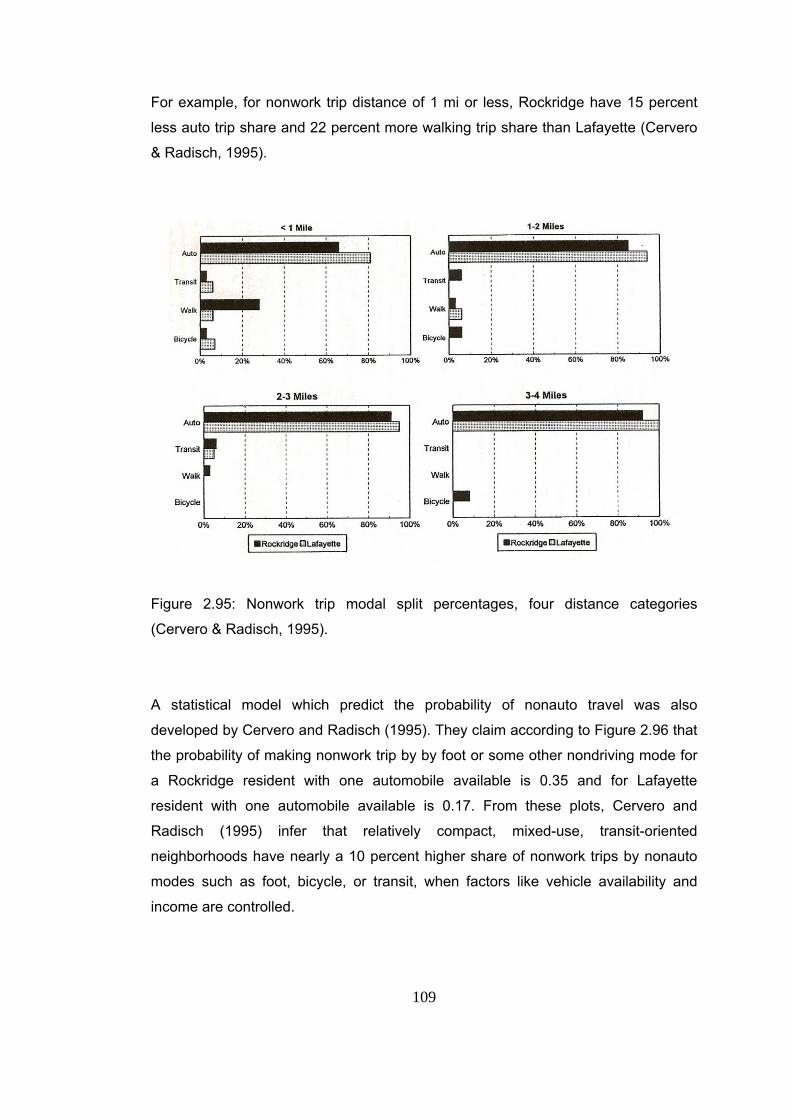
109
For example, for nonwork trip distance of 1 mi or less, Rockridge have 15 percent
less auto trip share and 22 percent more walking trip share than Lafayette (Cervero
& Radisch, 1995).
Figure 2.95: Nonwork trip modal split percentages, four distance categories
(Cervero & Radisch, 1995).
A statistical model which predict the probability of nonauto travel was also
developed by Cervero and Radisch (1995). They claim according to Figure 2.96 that
the probability of making nonwork trip by by foot or some other nondriving mode for
a Rockridge resident with one automobile available is 0.35 and for Lafayette
resident with one automobile available is 0.17. From these plots, Cervero and
Radisch (1995) infer that relatively compact, mixed-use, transit-oriented
neighborhoods have nearly a 10 percent higher share of nonwork trips by nonauto
modes such as foot, bicycle, or transit, when factors like vehicle availability and
income are controlled.
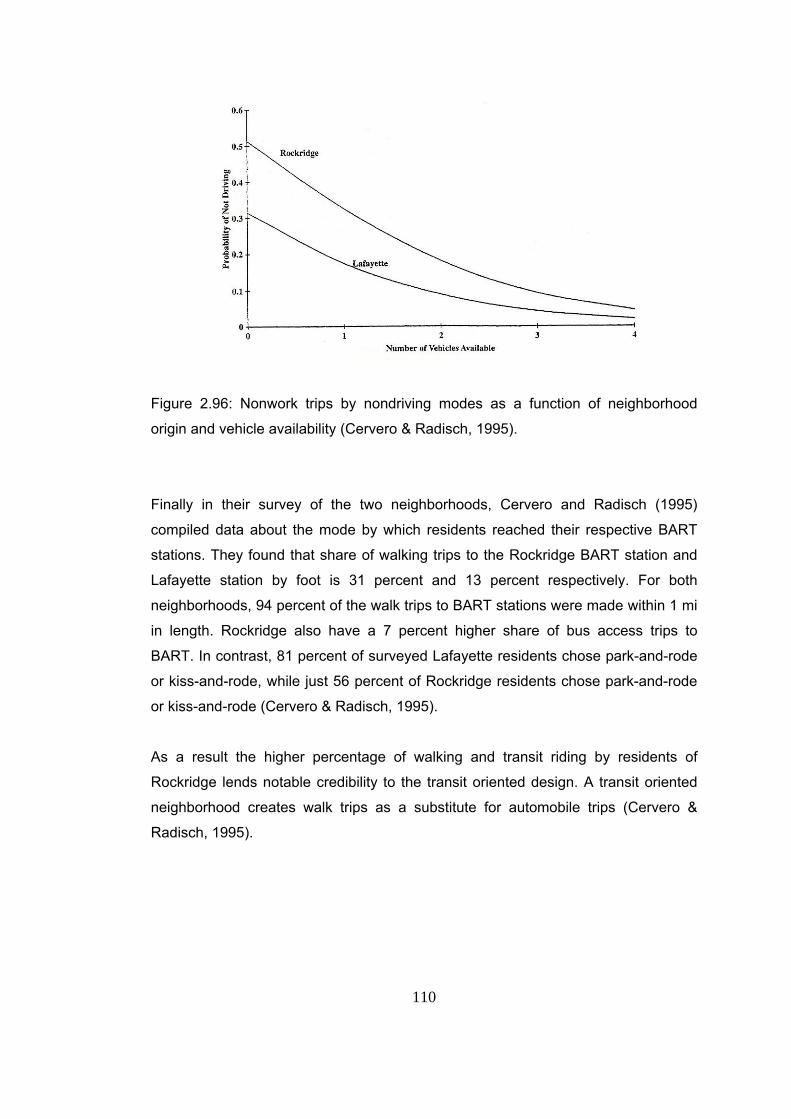
110
Figure 2.96: Nonwork trips by nondriving modes as a function of neighborhood
origin and vehicle availability (Cervero & Radisch, 1995).
Finally in their survey of the two neighborhoods, Cervero and Radisch (1995)
compiled data about the mode by which residents reached their respective BART
stations. They found that share of walking trips to the Rockridge BART station and
Lafayette station by foot is 31 percent and 13 percent respectively. For both
neighborhoods, 94 percent of the walk trips to BART stations were made within 1 mi
in length. Rockridge also have a 7 percent higher share of bus access trips to
BART. In contrast, 81 percent of surveyed Lafayette residents chose park-and-rode
or kiss-and-rode, while just 56 percent of Rockridge residents chose park-and-rode
or kiss-and-rode (Cervero & Radisch, 1995).
As a result the higher percentage of walking and transit riding by residents of
Rockridge lends notable credibility to the transit oriented design. A transit oriented
neighborhood creates walk trips as a substitute for automobile trips (Cervero &
Radisch, 1995).

111
CHAPTER 3
CASE STUDY ANKARA
3.1 History of Urban Planning in Ankara
The urban planning process is summarized in seven periods given below in
Transportation Master Plan Report prepared by EGO, Department of Planning and
Rail Systems (EGO, 1995a).
1. Period before Jansen Plan (1923-1932)
2. Period of Jansen Plan (1932-1957)
3. Period of Uybadın-Yücel Plan (1957-1969)
4. Period of Ankara Master Plan Bureau (AMAMBP) (1969-1984)
5. 2015 Structure Plan
6. Period of 1984-1993
7. 2025 Master Plan
Summary of these planning periods is given in the following sections.
3.1.1 Period before Jansen Plan (1923-1932)
At the beginning of 1920’s, Ankara had population about 20 000 - 25 000 with a
quite poor economy. After the law issued on October 13, 1923, Ankara became the
capital city of the new Republic, which made the greatest impact to the development
of the city.
Being new capital of Türkiye, redevelopment of Ankara became inevitable. In the
concept of redevelopment period, city management was one of the problems to be
solved at the first step. Due to insufficiencies in existing law dated 1882, a new law
named “planlama mevzuatı” was issued on planning legislation on March 24, of
1925.
112
By means of this new “planlama mevzuatı” law, political arguments on expropriation
and speculation1 problems were tried to be solved. Based on this law dated 1925,
400 hectare2 of land at Sıhhiye was expropriated, which caused “the old and new
Ankara debate”. In this expropriated area a plan prepared by Lörcher was
implemented.
Before Jansen Plan, the problems related with the development of the city were tried
to be solved with partial approaches. In other words, all the implementations for
development of the city were realized without a city master plan.
A development plan competititon was arranged between Jausseley, Brix and Jansen
after understanding inadequacy of this approach. The winner of the competition was
Jansen’s Plan, which is shown in Map 3.1 (EGO, 1995a).
3.1.2 Period of Jansen Plan (1932-1957)
Between 1932 and 1950, many structures such as residential, public buildings;
health, educational and recreational facilities were erected in the new capital
according to Jansen Plan (EGO and METU City and Regional Planning Department
Study Group, 1987).
In this period “speculations” were the major problem in the urban development for
Ankara. Due to problems like unexpected increase in Ankara’s population (It is
predicted that the population of Ankara would be 300 000 in 1978, but Ankara
reached this population at the beginning of 1950), Jansen’s Plan became invalid and
did not meet the requirements. (EGO, 1995a).
In the late 1940’s, unauthorized houses started to release in the city. Because of
unplanned development resulted by unauthorized housing and speculative
tendencies, a new development plan was required at the beginning of 1950’s and an
international competition was arranged for new development plan by Directorate of
Ankara Urban Planning in 1954. (EGO, 1995a)
1 Land Speculation: Land speculation means owning land with the expectation of selling it to earn profits from the increase in land values. 2 1Hectare=10000 m2
113
3.1.3 Period of Uybadın-Yücel Plan (1957-1969)
The project which was prepared by the Raşit Uybadın and Nihat Yücel won the
competition organized by Directorate of Ankara Urban Planning in 1954 (Map 3.2).
The plan was developed assuming that the population of Ankara would reach 750
000 in 2000. However, Ankara reached this population in 1965 (EGO, 1995a).
Uybadin Yücel Plan was a plan that had a limited perspective in such a way that it
was directed by current growth instead of directing future urban development.
Additionally phenomenons of squatting and CBD development were not considered
adequately (EGO, 1995a).
Ankara was designed as a compact and a single-centered city with population of
750 000 in Uybadın-Yücel Plan (EGO, 1995a). However, Uybadın-Yücel Plan was
overloaded by the law titled “Sectoral Building Height Regulations” which made the
building density to increase two or three times (EGO and METU CRP Study Group,
1987).
Another factor which affects development of Ankara negatively was disharmony
between Directorate of Ankara Urban Planning and Ankara Municipality. In 1969,
Ankara Master Plan Bureau (AMANPB) was founded in the body of Ministry of
Development and Housing to direct the development which extended over the plan
scope and to provide coordination between Ankara Municipality and Directorate of
Ankara Urban Planning (EGO, 1995a).
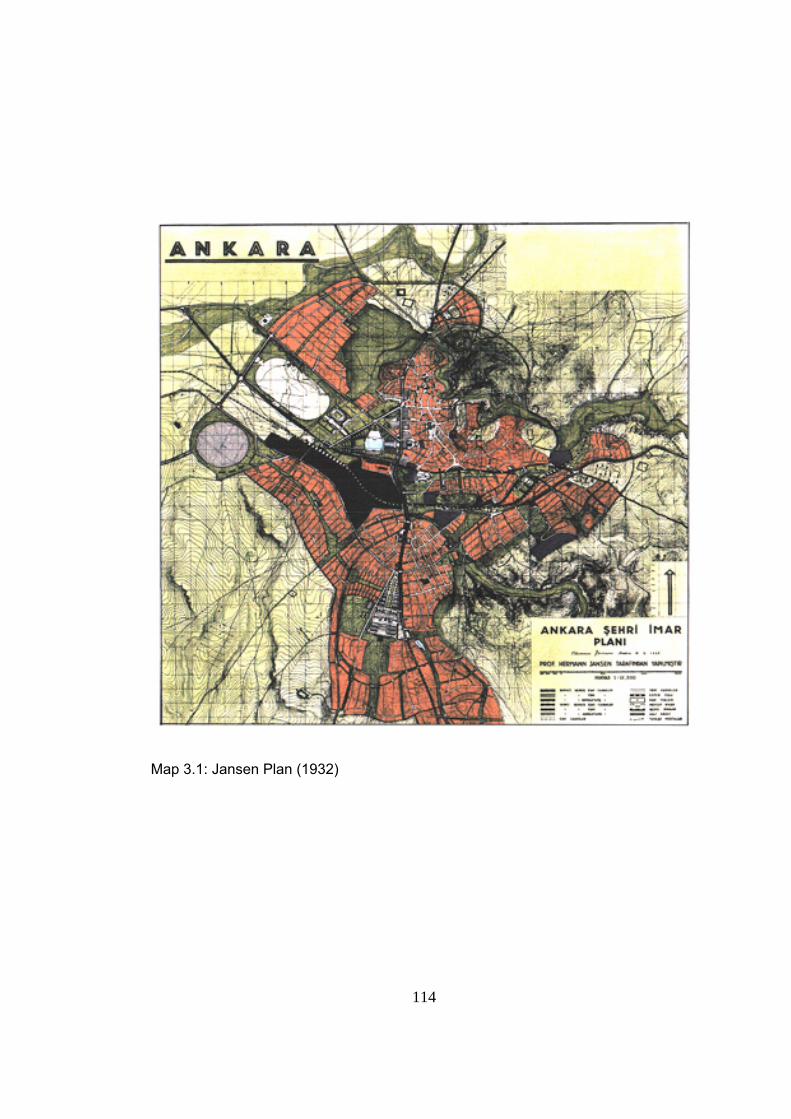
114
Map 3.1: Jansen Plan (1932)
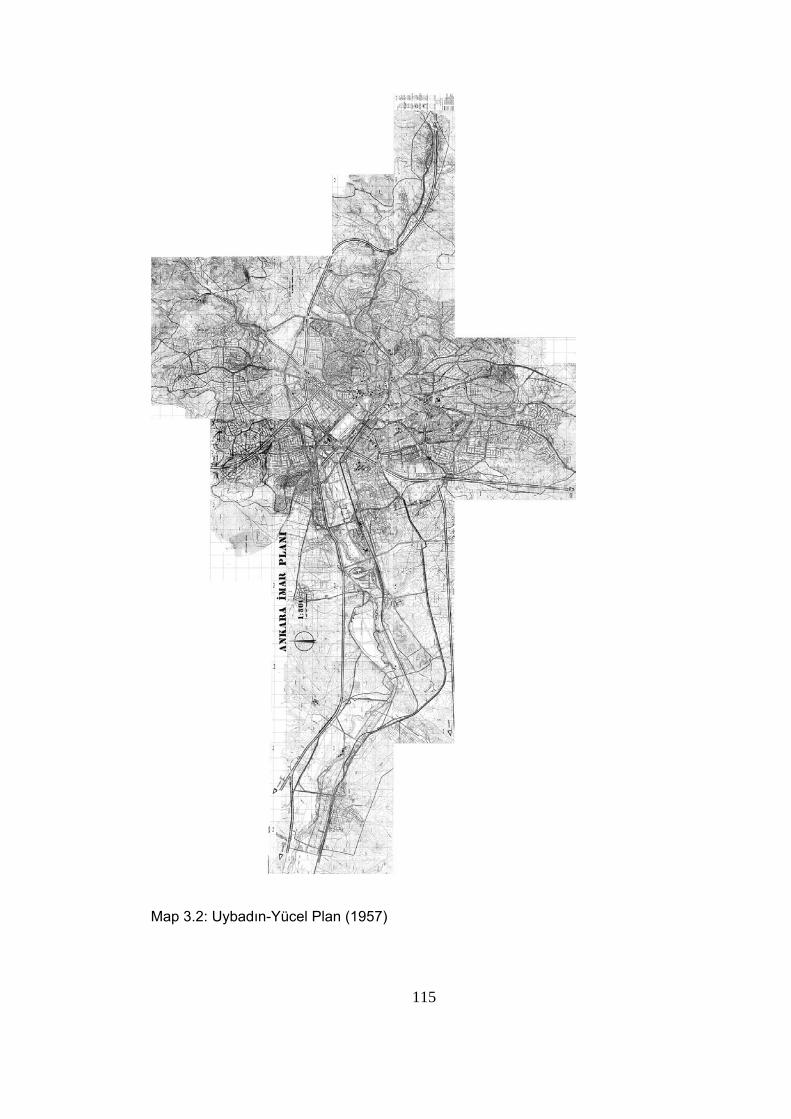
115
Map 3.2: Uybadın-Yücel Plan (1957)
116
3.1.4 Period of Ankara Master Plan Bureau (AMANPB) (1969-1984)
Ankara Master Plan Scheme was prepared by AMANPB based on the studies done
in the 1970-1975 period (Map 3.3). This plan offered a general perspective for urban
development implementations and it was not effective for local applications. So,
Uybadin-Yücel and some other local plans were in use.
Apart from the Jansen Plan and Uybadin-Yücel Plan, the Master Plan prepared by
AMANPB directed the urban development. Consistency of population forecast and
determining problems of Ankara truly were basic reasons behind this. The study of
Plan Bureu focused on the areas which were not planned by Uybadın – Yücel Plan.
Directing the development on west corridor of city was aimed besides determining
basic macroform of city by AMANPB.
Although, AMANPB made contribution to realization of Sincan Squatter Prevention
Districts, New Settlements, The Batıkent Housing Project, Ankara Organized
Industry Area, Kızılay Pedestrian District, protection of Old Ankara Project, Atatürk
Cultur Site, Altın Park and some unplanned developments arised in the city.
Speculations became major factor for the unplanned development (EGO, 1995a;
EGO and METU CRP Study Group, 1987).
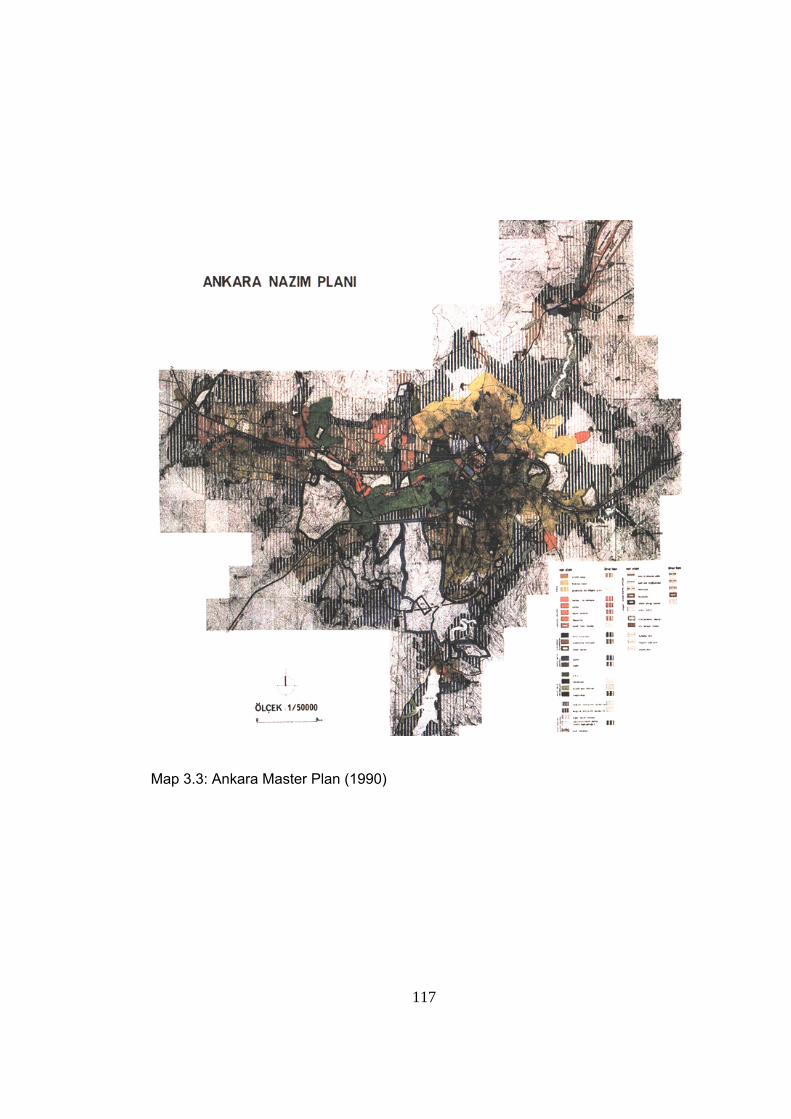
117
Map 3.3: Ankara Master Plan (1990)
118
3.1.5 2015 Structure Plan
2015 Structural Plan was prepared by METU City and Regional Planning
Department with contribution of The Municipality of Greater Ankara Bureu of City
Plan in 1986. The aim of the study was to develop the proposals of future urban
form so as to provide required data for Ankara Urban Transportation Plan prepared
by General Directorate of EGO.
At first, factors that affect urban form were analyzed in 2015 Structural Plan. These
factors are grouped in four basic subtitles as below.
1. Topography of the city
2. Development of population, work force and employment and change in
economic basis in Ankara
3. Progress of location choice for state buildings, industrial buildings,
development of urban transportation services, supply of infrastructure,
distribution of land ownership and transfer of land in urban area.
4. The process of urban planning
The study analyses determining factors of urban form and explains the
determination process of urban form. Urban form was examined under six subtitles.
1. Settling pattern in Ankara metropolitan impact area.
2. How the Ankara metropolitan area spreads throughout the natural
environment and development of differentiation of land use in time.
3. Change in urban density in time
4. Change of CBD of Ankara in time
5. Differentiatian of residential areas in terms of income level
6. Evaluation of urban form including planning decision.
After these studies, a macroform proposal scale of which is 1/100 000 is developed
for year of 2015 (Map 3.4). While this proposal was being developed, macropolitics
related with location of metropolitan area were defined as follows.
119
1. New developments must be spread out of the existing bowl in where current
development exists.
2. The population of newly developing areas should not exceed 300 000
3. Decentralization should be performed by strengthening developments within
a circle having radius of 35-40 km surrounding the city or providing new
settlements around locations in where new projects are expected to be
realized.
4. Different job opportunities and residential units should accommodate in
areas developed as a result of decentralization.
5. Employment distribution should be used as a tool for realizing
decentralization objectives.
6. Decentralization should be performed on a star shape metropolitan form so
as to provide transit supportive development.
7. Proposed form should give opportunity to produce better alternative for
future.
8. The greenbelt which is being formed around the city should be widened to
length of 8-10 kms to create microclimatic effect.
Besides these macropolitics, population and employment projections were made.
According to projection it is predicted that the population of Ankara will be 5 000 000
and the work force will be 1 504 000 by the year of 2015. After that service
employment and population distributions are calculated using Lowry-Garin model.
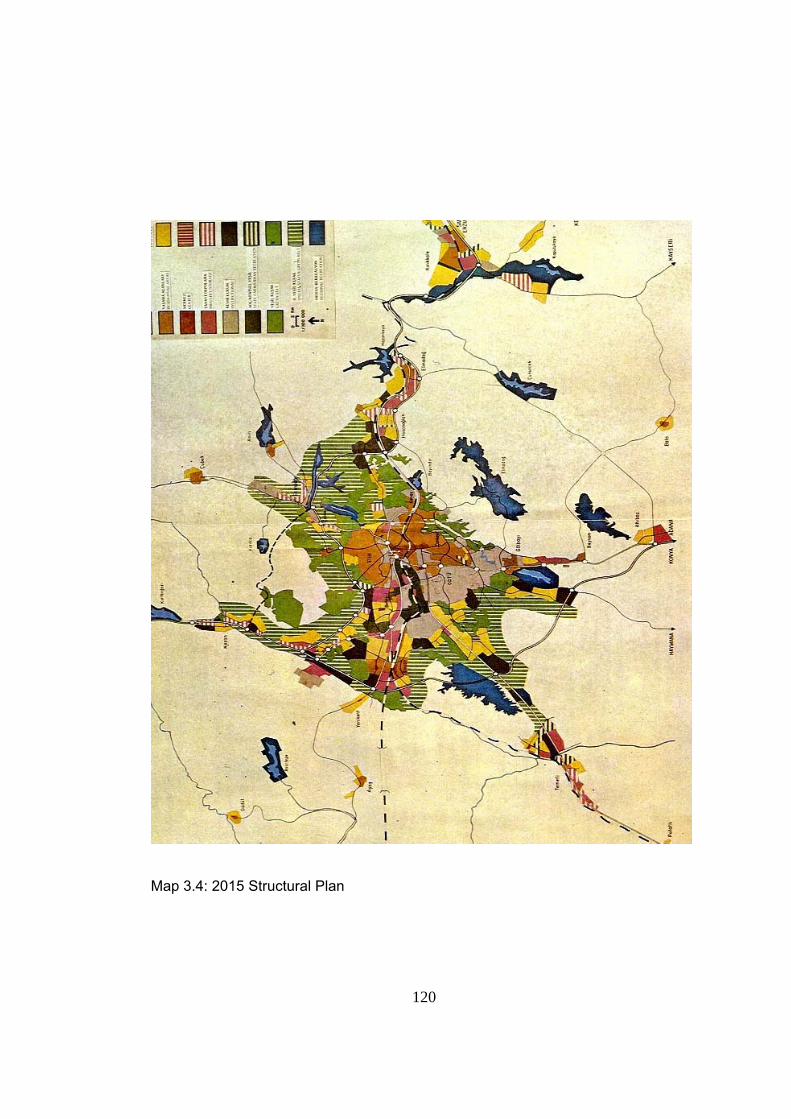
120
Map 3.4: 2015 Structural Plan
121
2015 Plan is a structure plan which does not solve problems in detail but puts some
general principles for urban development. Therefore, 2015 Structure Plan does not
only supply required data for Ankara Transportation Plan but also directs the
metropolitan development and give opportunity to define new application projects.
With this plan, developments and transformation of unauthorized housing could not
be realized. At the same time, residential areas constituted in Çayyolu, Beytepe and
Gölbaşı with partial planning and employment center, Organized Small Industry
Area located in Macunköy / İvedik are disrupted the jobs-housing balance
emphasized in 2015 Structural Plan with their single use structure (EGO, 1995a).
3.1.6 Period of 1984-1993
After 1984, Greater Municipality was established and the power of Greater
Municipality was extended. In this period AMANPB and Directorate of Ankara Urban
Planning became a unit of Metropolitan Planning Bureu.
Because of partial planning and applications, done by Greater Municipality in urban
peripherial area and by Governership of Ankara out of urban peripherial area, the
planning objectives of 1990 Master Plan and 2015 Structural Plan could not be
implemented. As a result, below problems have come out in the development of city
macroform.
1. Disruption of jobs-housing balance
2. Disruption of balance of macroform sprawl and city center
3. Occurrence of instability in development direction of macroform
4. Occurrence of insufficiencies in transportation network
5. Increase in density of existing development via improvement policies
6. Excessive structuring in the valleys
7. Infrastructural insufficiencies due to high density.
Municipality of Greater Ankara Department of Urban Planning started to study on
new Ankara Master Plan for 2025 due to these problems (EGO, 1995a).
122
3.1.7 2025 Master Plan
In 2025 Master Plan, it is accepted that urbanization problems of Ankara driving
from high density and unplanned development can be solved keeping existing
pattern as it is and spreading jobs and housing in accordance with the planning
decision (Map 3.5).
It is estimated that the population of Ankara would be at least 5.5 million and at most
6.5 million in 2025. But, 2025 Master Plan aims to meet the demand of 8 million
population. Macropolitics to be followed about spatial distribution of population are
given below (EGO, 1995a);
1. New developments should be located out of main bowl to solve air pollution and
other problems due to excessive density and to increase urban living standarts
and new developments should have population less than 150 000 not to cause
similar problems.
2. Borders of metropolitan development should be in the area, the radius of which
is about 35-40 km, and new developments should be located around existing
ones or planned projects.
3. It is seen that decentralization tendency of residential, industrial and public
structures has been increasing. Using these tendencies jobs-housing ratios
should be balanced in new developments and disrupted areas.
4. Metropolitan area should be developed on main corridors which connect city to
outer parts and public transportation should be provided through these
development corridors. Thus, flexible urban form is able to be formed without
creating break down-build process and insufficiency of infrastructure.
5. City center should be redeveloped and balance of metropolitan area – center
should be provided.
6. Greenbelt being constracted around city center should be evaluated as a whole
project; it should be improved and extended towards to the city center through
strips following valleys. Unused areas belonging to public and area stocks
should be utilized for this aim without destroying its nature.
7. As much urban area as possible should be provisioned to land market and
expropriated areas should be opened for use so as to support decentralization.
123
In accordance with these principles, 8 urban development corridors are defined.
Institutional lands which use huge land has been tried to shift these corridors so as
to provide mixed land use. (EGO, 1995a) (Map 3.6).
These corridors are;
1. North Ankara Development Corridor (KAGK): Urban services
Population: 100 000
Employment: 20 000
2. North-East Ankara Development Corridor (KDAGK): Out of border of Greater
Ankara Municipality
Population: 25 000
3. East Ankara Development Corridor (DAGK): Urban services, public
organizations, institutional service areas
Population: 30 000
Employment: 6 000
4. South Ankara Development Corridor (SAGK): Urban services, public
organizations, high technology centers
Population: 75 000
Employment: 26 000
5. Haymana Road Development Corridor (HYGK): Urban services
Population: 50 000
Employment: 10 000
6. Tulumtaş-İncek Development Corridor (TİGK): Urban services
Population: 50 000
Employment: 10 000
7. South-West Ankara Development Corridor (GBAGK): Urban services, public
organizations, institutional service areas
Population: 20 000
Employment: 50 000
124
8. West Ankara Development Corridor (BAGK): Urban services
Population: 75 000
Employment: 15 000
New development nodes are tried to be formed also in accordance with strategy of
spreading outwards. For this aim, below developments and main economic activities
are defined:
Kazan: Storage, public organizations, institutional service areas
Population: 150 000
Employment: 50 000
Temelli: Industry, storage
Population: 250 000
Employment: 85 000
Ahiboz: Industry, storage
Population: 150 000
Employment: 45 000
Elmadağ: Public organizations, institutional service areas
Population: 150 000
Employment: 45 000
Hasanoğlan: Urban services, public organizations, institutional service areas
Population: 50 000
Employment: 16 000
Important Projects Affecting Urban Development
Projects affecting urban development are grouped under five subtitles (EGO,
1995a).
125
1. Transportation projects
• Ankara by-pass road
The by-pass road having a length of 108 km designed by General
Directorate of Highway (Map 3.7)
• Intercity bus terminal
Construction of new additional intercity bus terminals are proposed at
main entrances of city to relieve the traffic load, assuming that Intercity
Bus Terminal of Ankara (AŞTİ) will become inadequate to meet future
travel demand and it will stay in urban settlement area.
• Rail system studies
In 2025 Master Plan, heavy rail system, which has length of 14.6 km, 12
stations and capacity of 58 000 passenger per hour in one direction,
between Kızılay-Batıkent (Ankara Metro) and light rail system, which has
a length of 8.5 km, 8 stations and capacity of 25 000 passenger per hour
in one direction, between Dikimevi-AŞTİ (ANKARAY) are aimed to be
completed up to 1995.
• Urban distributer road system
Transportation of Ankara is based on radial roads originated from center
to the outer parts of the city. For supplying future demand, alternative
road connection should be designed so as to connect neighbourhoods
without passing through CBD.
• Connection between railroad and commuter rail
It is predicted that Ankara Rail Road Station and West Station will
become fundamental provided that TCDD Rapid Rail Project between
Ankara – İstanbul is completed.
A new rail road which starts from existing commuter rail station at Sincan
and passes from settlements at north, after that joins to existing
commuter rail station again passing from center of Batikent is proposed.
126
One another new rail project which connects Polatlı-Temelli corridor to
Hasanoğlan is proposed parallel to urban development.
• Airports
As, The Esenboğa Airport will be insufficient to meet the future demand,
a new international airport at south around Kepezovası is proposed. After
constructing new one, Esenboğa Airport will be used as a national
airport.
Military airports at Etimesgut and Güvercinlik will be moved to out of the
city and Mürted Airport will be improved.
2. Development of CBD
Arranging Kazıkiçibostanları as CBD to make CBD development consistent
with urban form and to constitute central balance is one of the proposals of
The 2025 Master Plan. Thus, 2025 Master Plan gives consideration on
integration of old intercity bus terminal, Fen İşleri and Atatürk Cultural Center
and establishing a new international trade center for CBD.
North-West corridor which consists of small and middle scale industrial firms
and residential developments relevant for low and middle income groups
should redeveloped with high quality housing, public services, organizational
building and other urban services so as to attract high income group to this
area.
It is predicted that north-west corridor will be the strongest and very attractive
corridor of the city. But, location choice of high income groups is shifted
central development to south and south-west, because of topographic
conditions and lack of land, maintaining central development in this direction
seems impossible.
127
3. Industrial development
Important industrial projects are İvedik Small Industrial Area (480 ha),
Section of İstanbul Road, TUSAŞ (1010 ha), BOTAŞ (200 ha), Integrated
Facility for Meat (215 ha), Güvercinlik Storage Area and TIR parking area
(160 ha). Except these, Temelli and Elmadağ-Hasanoğlan corridors are
defined as main industrial corridors.
4. Projects of new settlements
First residential area project developed is Doğukent Mass Housing Project
which is projected for 20 000 residences and population of 100 000
between Samsun by-pass road and Bayındır Dam in area of 2 300 hectares.
At west, planning studies are done for Alacaatlı (2500 ha) and Ballıkuyumcu-
Peçenek settlement areas. At north, Projects for Yuva residential area (780
ha) which is projected for 17 000 residences and population of 76 000 and
Ovacık Village and its surrounding (700 ha) which is projected for 12 000
residences and population of 50 000 are completed. At south, a new
residential area is designed along Haymana road (3500 ha).
5. Greenbelts
While the recreationing activities continue around city, the Dikmen and
Portakal Çiçeği valley projects are developed to arrange those valleys of the
city as greenbelts.
İmrahor Valley Recreation Area Project required area of 3526 ha.
Additionally, among the most significant water system of Ankara, Mogan,
Eymir Lakes and İmrahor Basin are arranged as greenbelt.
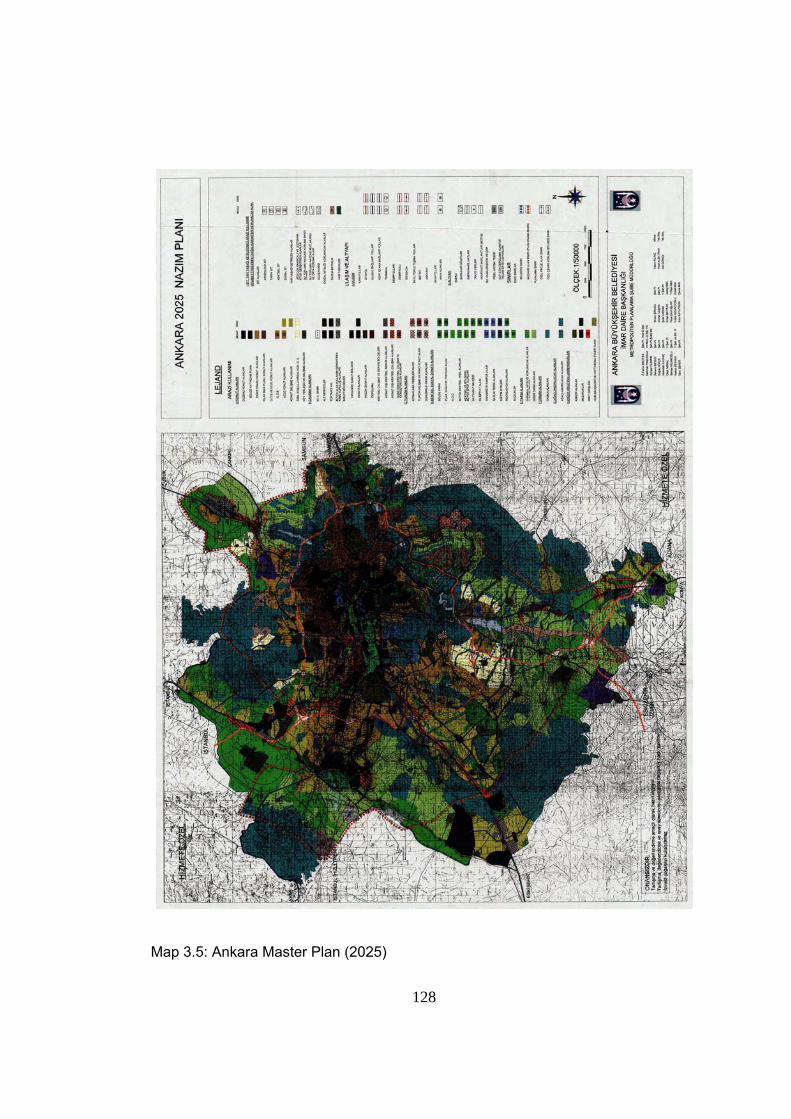
128
Map 3.5: Ankara Master Plan (2025)
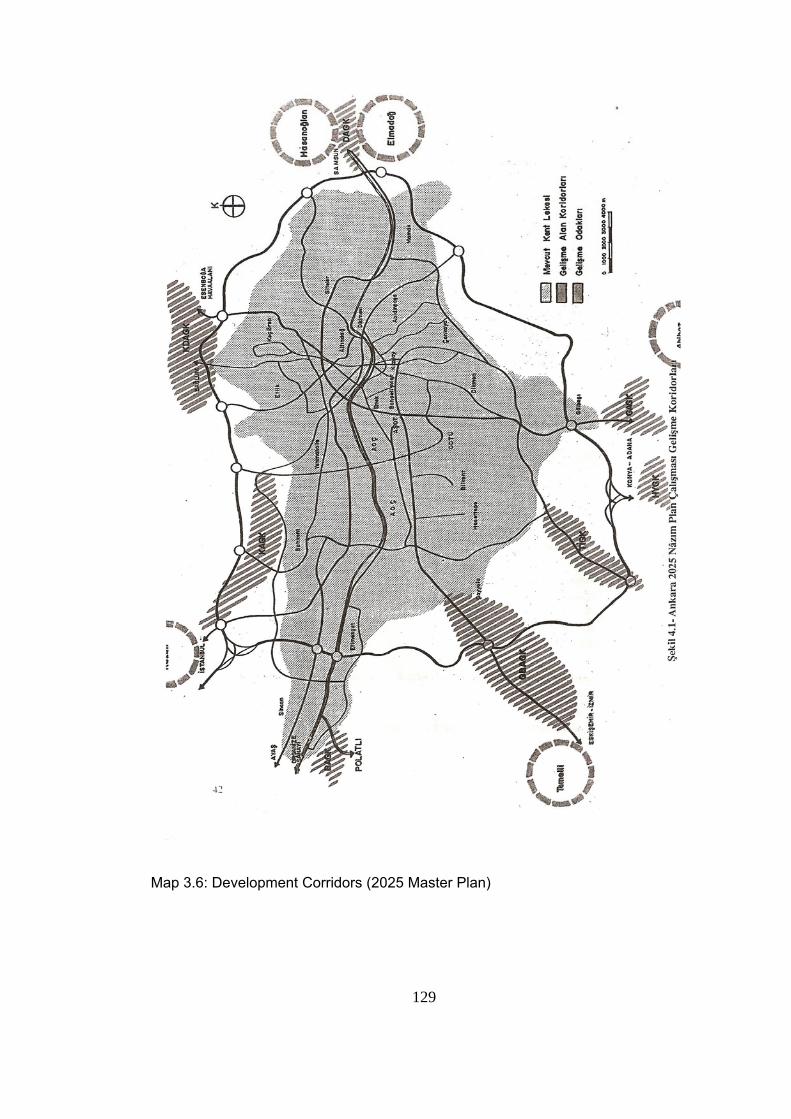
129
Map 3.6: Development Corridors (2025 Master Plan)
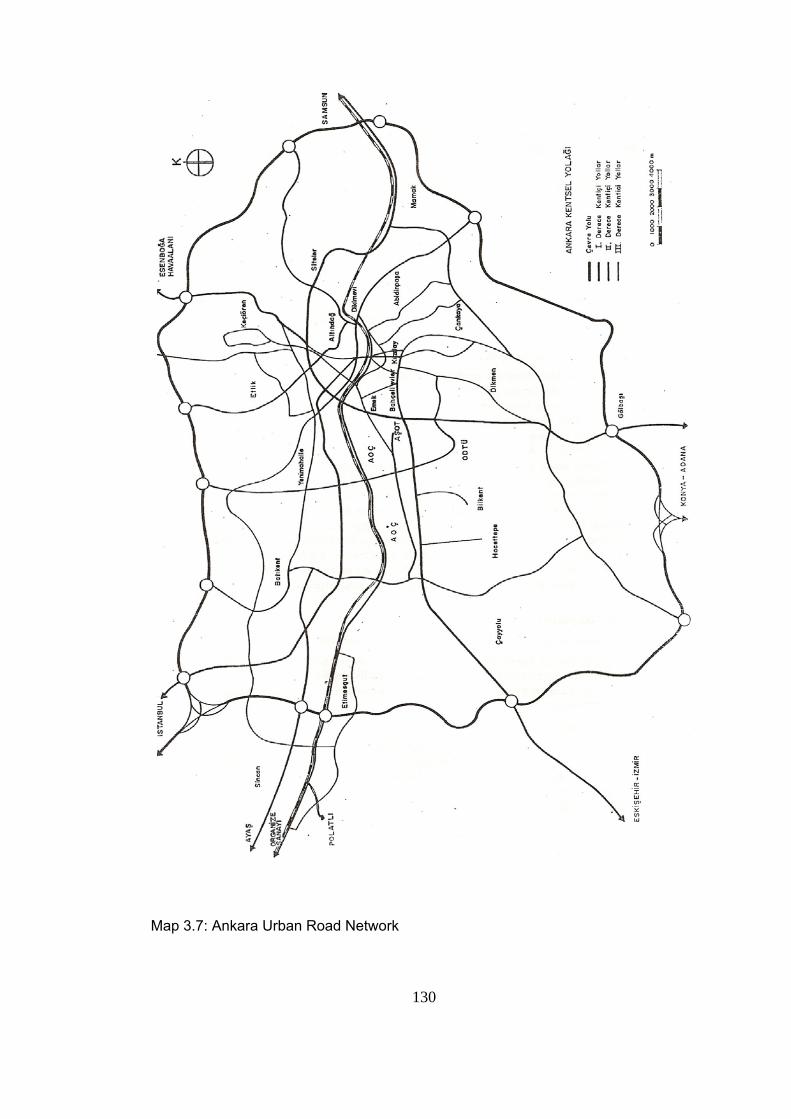
130
Map 3.7: Ankara Urban Road Network
131
3.2 History of Urban Transportation Planning
There are four studies carried out about Ankara Rail Transit System and Urban
Transportation Planning (EGO, 1995a).
1. The Ankara Urban Transportation Survey is carried out by SOFRETU
(France) and Ankara Municipality in 1972
2. Rail Transit System Study is carried out by EGO and Yapı Merkezi, during
1978-1984
3. Light Rail Transit System Study is carried out by Ankara Municipality and
Transurb Consult (Belgium), during 1980-1984
4. Ankara Urban Transportation Study is carried out by EGO-Kanada
Consortium and Kutlutaş, during 1985-1987
3.2.1 Ankara Urban Transportation Survey (Municipality of Ankara-SOFRETU: 1972)
A study which examines modernization of buses, reorganization of existing
transportation system and constructing metro to solve the transportation problems of
city was carried out by General Directorate of EGO and SOFRETU in October, 7,
1969 (EGO, 1995a).
The study included (EGO, 1995a);
a) Organization of administrative structure
b) Organization of operation routes and material maintanence
c) Fare collecting system
d) Transportation survey of bus routes and trolleybus
e) Determining demographic structure and intermediate term population
forecast
f) Proposal of high capacity transportation system which would meet the future
demand.
As a result, two staged, 14 km long, wholly underground heavy rail system (metro)
was proposed. First stage of metro, which is 7 km long, was between Beşevler-
Dikimevi and second stage of metro, which is also 7 km long, was between Dışkapı-
Kavaklıdere. The project was rejected because (EGO, 1995a);
132
a) The proposed technology is completely dependent on French technology
instead of using local technology.
b) Financing of project is not clear.
3.2.2 Studies done between 1978 and 1980
This study was carried out by specialist group in the body of General Directorate of
EGO. Consultancy service was provided by Yapı Merkezi.
Study proposed a rail transit system at three stages. Proposed system is 25 kms
long and 90% of which is at grade. In the first stage, a line, 3.5 km long, was
proposed between Stad Hotel (Ulus) and Inonu Square (EGO, 1995a).
The project was rejected due to the following reasons (EGO, 1995a);
a) Proposed system was not based on comprehensive transportation survey
and transportation master plan. In contrast, it was based on analysis of one
corridor and did not take integration of system with bus and commuter rail
into consideration.
b) Proposed line is not consistent with strategies of the Ankara Master Plan.
c) Forecasts about cost, revenue and predicted traffic were not realistic.
3.2.3 Project and Feasibility Studies done between 1980 and 1984
This study was carried out to evaluate the opinion of government about previous
studies related with rail systems. The study was used home surveys of EGO-Yapı
Merkezi but used the lower level of traffic projection. So that, the study concluded
that light rail was applicable. Technical support was provided for the study from
Transurb Consult, Belgian firm within the context of United Nations Technical Aid
Program (EGO, 1995a).
The project was rejected by Ministry of Development and Housing because of below
reason (EGO, 1995a);
a) Results of 1979 survey were used without updating
133
b) The study was not based on extensive land use plan and transportation
master plan
c) The proposed capacity is not sufficient because of the fact that the project
was done based on projection of year of 1990.
3.2.4 Ankara Urban Transportation Study, 1985-1987 (EGO-Canada Consortium-Kutlutaş)
Ankara Urban Transportation Study was started in 1985 with aggrement between
General Directorate of EGO, Reid Crowther International Limited Company and
Kutlutaş Engineering and Counseling Incorporated Company (EGO, 1995a).
Scope of Ankara Urban Transportation Study is (EGO, 1995a);
1. Transportation Survey
2. Transportation Master Plan
3. Conceptual Design and Feasibility
4. System Specialties and Draft Project
Aim of the Transportation Survey is twofold. First one is anayzing the existing
transportation system of Ankara.Second aim is preparing general evaluation of
element of transportation system. To achieve first aim, three different data were
used (EGO, 1995a).
1. Land use data
2. Transportation survey data
3. Transportation system data
Aim of Transportation Master Plan was to develop a complete plan which intends
evaluating and directing future tendencies. Studies serving these purposes can be
grouped into two parts. First one is about land use. Population forecasts, work force
predictions and updating Ankara Master Plan are in the scope of this study. Second
one included activities related with Urban Transportation Master Plan such as
prediction of the future transportation qualities, improving of urban transportation
alternatives.
134
Purpose of third stage which is Conceptual Design and Feasibility was completing
conceptual design and first economic and financial analysis so as to provide basis of
next step. In this stage, besides determining routes, location of station and storage,
environmental survey and financial anaysis were done and economic evaluation
was made predicting cost and revenue for first priority line.
System Specialties and Draft Project formed fourth stage of the study. Aim of the
study is determining service characteristics of rail transit system and preparing draft
projects required for construction process.
Long-term 54.4 km rail system network of Ankara Light Rail Transit System (54.4
km) and 15 km long first stage (Batıkent-Kızılay) were approved in 1986 (EGO,
1995a).
3.3 Urban Transportation Plan of Ankara
3.3.1 Basic Principles of Urban Transportation
Main purposes of the Transportation Master Plan are to define urban transportation
principles, strategies and major polices which direct proposed project and
precaution and to set integrated transportation system.
Basic principles of urban transportation are defined to solve urban transportation
problems and to obtain comprehensive perspective about urban transportation
(EGO, 1995a). These are explained in eleven subtitles below.
1. Integration of Land Use and Transportation
Improper land use cause high transportation demand. In this situation,
evaluating land use decision instead of renewing transportation infrastructure in
terms of high cost investment would be reasonable. Because of this reason,
integration of land use and transportation is adopted as a basic policy for urban
transportation planning.
135
Transportation Master Plan is based on a land use plan which intends to spread
the city outside of dense and polluted bowl having problems of air pollution,
traffic congestion etc. And public transportation is specified as main principle to
achieve desired urban form through land use-transportation interaction.
2. Priority to People not Vehicles
The intraurban transportation investments which facilitate auto travel are not
successful solving the transportation related problems and they are also high
cost solutions. Bridges, grade separated intersections, car parks, by-pass roads
relieve traffic temporarily, consequently, they stimulate more transportation
demand resulting more traffic problems.
Considering relatively high share of public transportation in model split of
Ankara, decision makers should give priority to public transportation for new
investment, and existing infrastures should be utilized so as to benefit public
transportation and pedestrians.
3. Increasing Level of Service for Users
Performance measures for transportation system are made up of following
items;
• Speed/travel time: to reduce travel time increasing average speed by
means of transit priority and traffic regulations and
• Reliability: to provide reliable transportation system and to inform
public about service
• Cost: to minimize transportation cost
• Comfort: to reduce fullness of transit vehicles, to increase quality of
vehicles and infrastructure etc.
• Safety:to take precautions for all modes of transportation
• Availability: to serve extensive transportation facility
Transportation projects should aim to optimize transportation system by
maximizing public utility, minimizing negative effects and meeting requirements
of the operating agencies.
136
4. Social Equity
Transit operations should be adopted as public service and transportation
service should be provided for all social groups equally. Furthermore,
transportation projects should tend to increase service quality served to the low
income groups.
5. Economic Efficiency
Transportation services should be provided in an economic way. As a general
strategy, transportation project intending to use existing infrastructure should be
considered without disregarding long term projects.
6. Financial Efficiency
Transit agencies should aim to be self-sufficient provided that they do not load
extra burden on low income groups and do not cause other loss. Necessity of
subsidies is granted all over the world but this does not mean that subsidies are
acceptable in all conditions. So, subsidy reqirements should be based on
calculations which show expected benefits. Also cost minimization should be
tried to maintain.
7. Energy Savings and Decreasing External Dependency
It is necessary to take precaution to reduce consumption of petroleum product
and dependence on foreign technology considering Türkiye’s economic
difficulties. A substantial amount of energy savings can be achieved in the field
of transportation. When selecting transportation modes, environment friendliness
and convenience to native sources should be taken into consideration.
8. Environmental Impacts
Impacts on natural and historical environment and the population should be
evaluated before applying project. Negative impacts should be minimized as
much as possible.
Probable impacts which can be considered in evaluation stage of project are
given below,
137
• Passive effects (earthquake, flood, etc.)
• Accidents
• Health (air pollution, reducing sunlight etc.)
• Breaking down building, facility etc
• Noise
• Micro climate effects (shadowing, wind etc.)
• Transition losses
• Direction losses
• Natural and historical area destructions
• Esthetic changes
9. Integration of Short Term and Long Term Needs
Besides long term and extensive projects which serve multidimensional and
comprehensive aims, long terms projects should be taken into consideration
consistent with general planning objectives within the strategic planning concept.
10. Public Participation and Communication with Decision Makers
Appropriate measures should be developed to sustain communication between
planners and groups affected from decisions in project evaluation process,
therefore public participation would be increased.
11. Togetherness of Objectives and Multidimensional Evaluation of Projects
The principles mentioned above should be considered both in balance and
multidimensionally, so that non monetary terms could be taken into
consideration.
3.3.2 Objectives
General objectives of Transportation Master Plan are given below (EGO, 1995b);
• To achieve a transportation system which asists development of urban form
and density.
• To direct transportation systems which facilitate development of transit
oriented form.
138
• To increase living standarts relieving traffic congestion.
• To increase share of public transportation in modal split increasing
accessibility and level of service.
• To adopt transit as a public service and to enhance equity.
• To ensure distributing resources efficiently.
• To perform required organization for metropolitan scale in the plan period.
Objectives of Transportation Master Plan for various transportation systems are
given below (EGO, 1995a);
Rail Transit System
• Settlements which block the development of rail sytem in the area devoted to
intracity stations and storage will not be allowed.
• Rail system lines will be considered at the design stage of building,
substructure, road and intersection project and the coordination will be
ensured with Greater Municipality of Ankara.
• Integration between land use and rail transit system will be achieved.
• Required transfer points will be constituted in applicable routes (Map 3.8).
• Auto travel will be restricted in city center providing efficient and comfortable
transit system and integrating rail system with bus system and pedestrianized
areas.
• Public transportation to CBD will be promoted in residential areas through
parking facilities around rail stations, integration of systems and pedestrian
connections. Required areas will be provided for parking, transfer and other
services.
Commuter rail
• 37 km long Commuter Rail line between Sincan and Kayaş is operated by
TCDD. Capacity of Commuter Rail system is 5400 passenger/hour/direction.
System should be extended and improved to meet future transportation
demand.
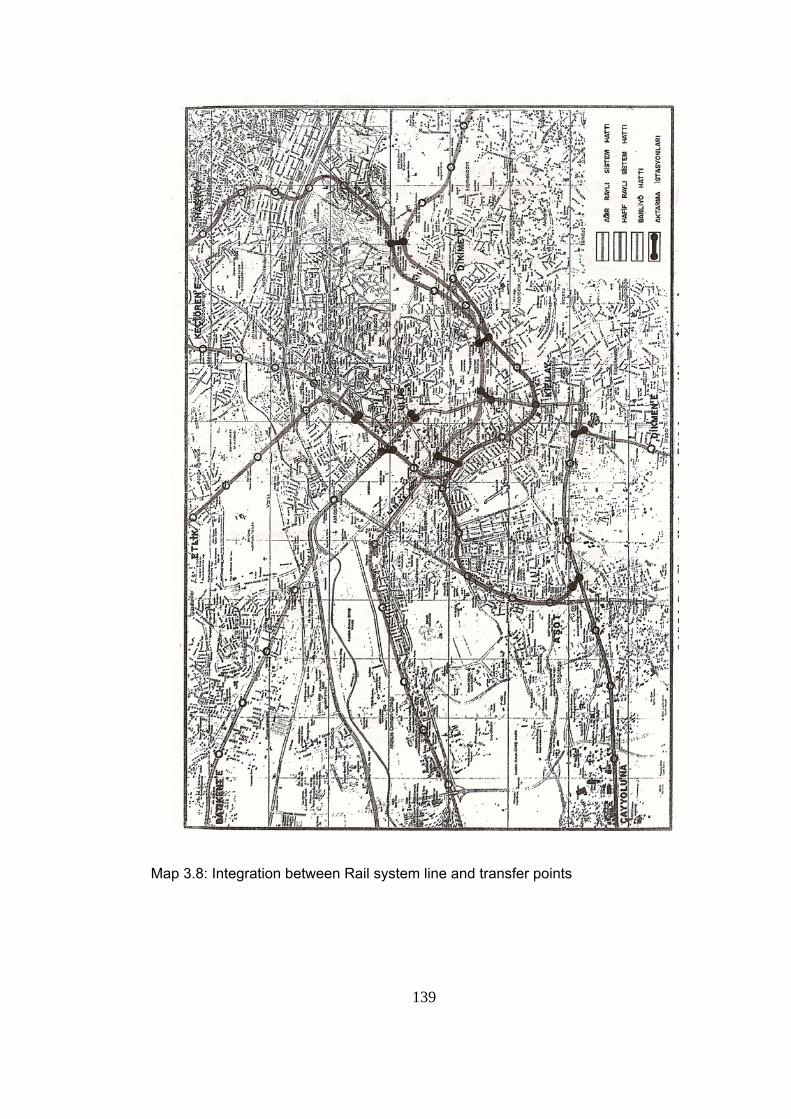
139
Map 3.8: Integration between Rail system line and transfer points
140
• The new Fatih-Eryaman-Batıkent Commuter rail project is conducted by
Ministry of Transportation and General Directorate of State Airports
Authority. Demand for 2015 is predicted as 12 000-18 000
passenger/hour/direction. But for remote future it is predicted that demand
will necessitate heavy rail system.
• Commuter rails are proposed to Elmadağ, Polatlı and Temelli for the long term.
• There are 4 intersection points between proposed rail systems and commuter
rail. Integration between commuter rail lines and other transportation systems
should be ensured making required arrangements both operational and spatial
so as to increase share of commuter rail in modal split.
Bus system
It is predicted that there will be 1 055 950 trips in 2015 and 48% of these trips will be
met by rail transit and remaning part will be met by other public transportation
modes.
• Bus system will be feeder system of rail system, and it will be major mode in
areas having no railway facility.
• Effectiveness of minibus, private bus system and services(vanpool) which
result from lack of public transit service will be diminished.
The main goal of Transportation Master Plan is giving priority to people not to
vehicles, dependently, giving priority to transit vehicles.
• CBD will be divided into subareas and pedestrian traffic will be major mode
in subareas and transit will be major mode between subareas to solve traffic
congestion of CBD.
• Bus priority arrangements are needed in North corridors (Fatih Street, Etlik
Street, İrfan Baştuğ Street), Kazım Karabekir Street, Çankırı Street).
Necessary surveys should be done for arrangements such as;
- Bus lane in the direction of traffic
- Bus lane in the opposite direction of traffic
- Public transportation in pedestrian region
- Bus roads
- Signalling priority at intersections
141
• The distance between bus routes should not exceed 800m.
• Bus routes should be as direct as possible and the distance between origin
and destination by bus should not exceed 120% of the distance by
automobile.
• Average distance between bus stops should be between 250m and 600m.
• Bus stop location and design guide should be prepared.
In the CBD, particularly through Atatürk Boulevard, the bus stops which spread
linearly cause accumulation of vehicles and make difficult to transfer between
modes.
• This problem will be solved by rail systems.
• Also, transfer between modes will be facilitated openning some streets to
use of public transport and with arrangement of rail stations and bus stops so
as to integrate with pedestrian regions.
Taxies
In Transportation Master Plan, contemporary taxi transportation is proposed as a
system substitute for autos. Because, taxies can transport more passenger in a day
than autos and also taxies are effective in reducing required parking area. But taxi
prices are not as low as to discourage auto travel. Hence;
• Taxi prices and parking prices should be arranged so as to encourage taxi
transportation.
• In CBD, taxi terminals should be located in entry of pedestrian district, near
bus stops and rail stations. Additionally, taxi terminals should be taken into
consideration in multistorey car parks - shopping centers near city center.
Pedestrians and pedestrian regions
Because of increasing trend of motorized vehicles after 1970, urban transportation
plans have mainly dealed with infrastructures such as roads, intersections, bridges
and consequently, pedestrian travel has ignored.
142
Some sidewalks are converted to road and car park and pedestrians have to share
infrastructure with vehicles unfairly. Therefore, pedestrians are threatened by risk of
injury and dead, air pollution and noise.
To improve condition of pedestrians series of precaution should be put into force;
• Signaling priority
• Application of infrastructure standards
• Saving sidewalks from vehicle occupation
• Grade separated pedestrian crossings
• Pedestrian district isolated from autos and integrated with public
transportation facilities.
Pedestrian districts are created in CBD, residential areas and areas having historical
places.
• For pedestrian areas in CBD, it is desired that to be remote from traffic chaos,
air pollution vehicle occupancy and to increase activity diversity.
• For residential areas, it is desired that to be activity center for people.
• For historical places, it is desired that to save historical artifact.
Criteria for selecting pedestrian districts
• Areas which create pedestrian travel such as recreational areas, cultural
centers, retail shops etc.
• Areas which are used as a car park or storage area
• Areas in where motorized travel is only seen in particular period.
Area between Dışkapı and Kavaklıdere is defined specially. In this area, auto travel
will be restricted providing comfortable transit service, improved taxi transportation
and applying parking policies. Pedestrian district integrated with rail stations and bus
stops are proposed in the core and shopping centers and car parks are proposed
around the core.
143
Pedestrianization should not be applied by closing a road to traffic; solutions should
have aesthetic concern as well. Also pedestrianized streets should be connected
each other more frequently. Especially in residential areas, traffic and pedestrian
integration should be ensured with traffic calming policies.
Additionally, considering that 60% of pedestrian travels are school trips, pedestrian
connections to school should be provided.
Road network and intersections
• High proportion of pedestrian travel originating from compact form of Ankara
will reduce as a result of urban sprawl then motorized travel will increase.
Transportation demand along several main transportation corridors which
connect city center to outer parts can be met by rail transit systems.
However, new routes should be formed as an alternative to these corridors
to increase road network capacity and main distributer road network which
connects outer parts of city without passing through city center should be
designed.
• There are problems about road hierarchy of Ankara. Road hierarchy
standarts should be defined for roads.
• In city center, it is obvious that grade separated intersections which
encourage auto travel will not solve the traffic problems. In this section of
city, auto travel will be restricted, giving priority to transit vehicles and
pedestrians. Solutions based on comprehensive surveys and censuses
should be prepared in other parts of the city.
Parking Policies
A comprehensive solution should be proposed for parking problems in CBD.
Particularly, in the entry of the city center, in where traffic congestion is high, parking
demand and auto travel should be restricted.
144
Parking areas should be formed for rail stations around city center and in residential
areas. These areas should be connected to station entrances and exits.
Car parks should be operated without subsidy, in this context, at grade car parks will
not economically feasible, however multistorey car parks and high capacity car
parks which are economically acceptable should be evaluated in terms of land use.
Areas around city center are seen reasonable considering land prices, acceptable
parking prices and feasible multistorey car park height. Those areas in where traffic
congestion and density are relatively low are prefereable places.
Because of reason mentioned above, building multistorey car parks at least one rail
station far from the core of Kızılay and Ulus and integrating those with rail stations
and bus stops are proposed. Additionally, forming these car parks as a mixed use
center will relieve burden of city center.
Freight transportation
Problems such as lack of service roads and uncertainity of storage and redistribution
areas, load additional difficulty to urban traffic. Storage areas and parking areas
should be defined at urban fringe for storage and redistribution purpose.
Interurban passenger terminal
• Renewing existing airport or building new one will questioned.
• Ankara Gar is thought as a main terminal and its connection to rail system is
taken into consideration.
• AŞTİ remains within the city because of urban sprawl. Therefore, new
interurban bus terminals should be formed at the main entry of the city.
Road standards
There is no standart to apply about road hierarchy, so continuity could not be
achieved in road hierarchy.
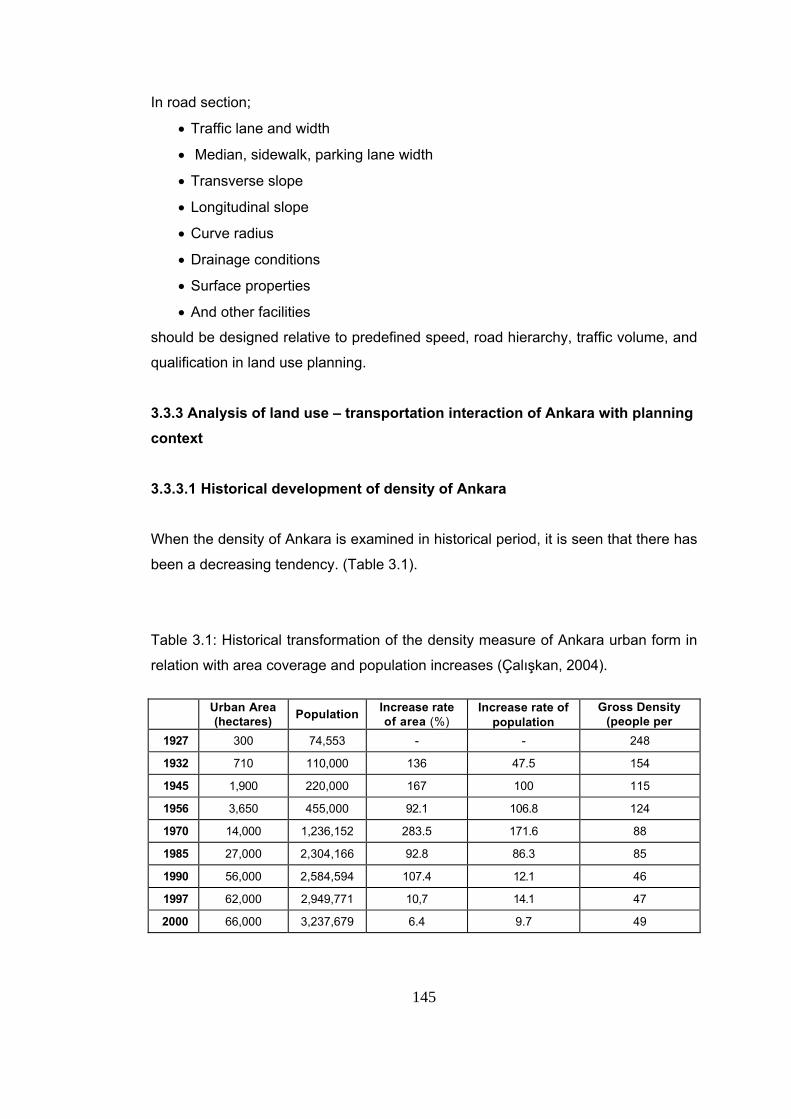
145
In road section;
• Traffic lane and width
• Median, sidewalk, parking lane width
• Transverse slope
• Longitudinal slope
• Curve radius
• Drainage conditions
• Surface properties
• And other facilities
should be designed relative to predefined speed, road hierarchy, traffic volume, and
qualification in land use planning.
3.3.3 Analysis of land use – transportation interaction of Ankara with planning context
3.3.3.1 Historical development of density of Ankara
When the density of Ankara is examined in historical period, it is seen that there has
been a decreasing tendency. (Table 3.1).
Table 3.1: Historical transformation of the density measure of Ankara urban form in
relation with area coverage and population increases (Çalışkan, 2004).
Urban Area
(hectares) Population Increase rate of area (%)
Increase rate of population
Gross Density (people per
1927 300 74,553 - - 248
1932 710 110,000 136 47.5 154
1945 1,900 220,000 167 100 115
1956 3,650 455,000 92.1 106.8 124
1970 14,000 1,236,152 283.5 171.6 88
1985 27,000 2,304,166 92.8 86.3 85
1990 56,000 2,584,594 107.4 12.1 46
1997 62,000 2,949,771 10,7 14.1 47
2000 66,000 3,237,679 6.4 9.7 49
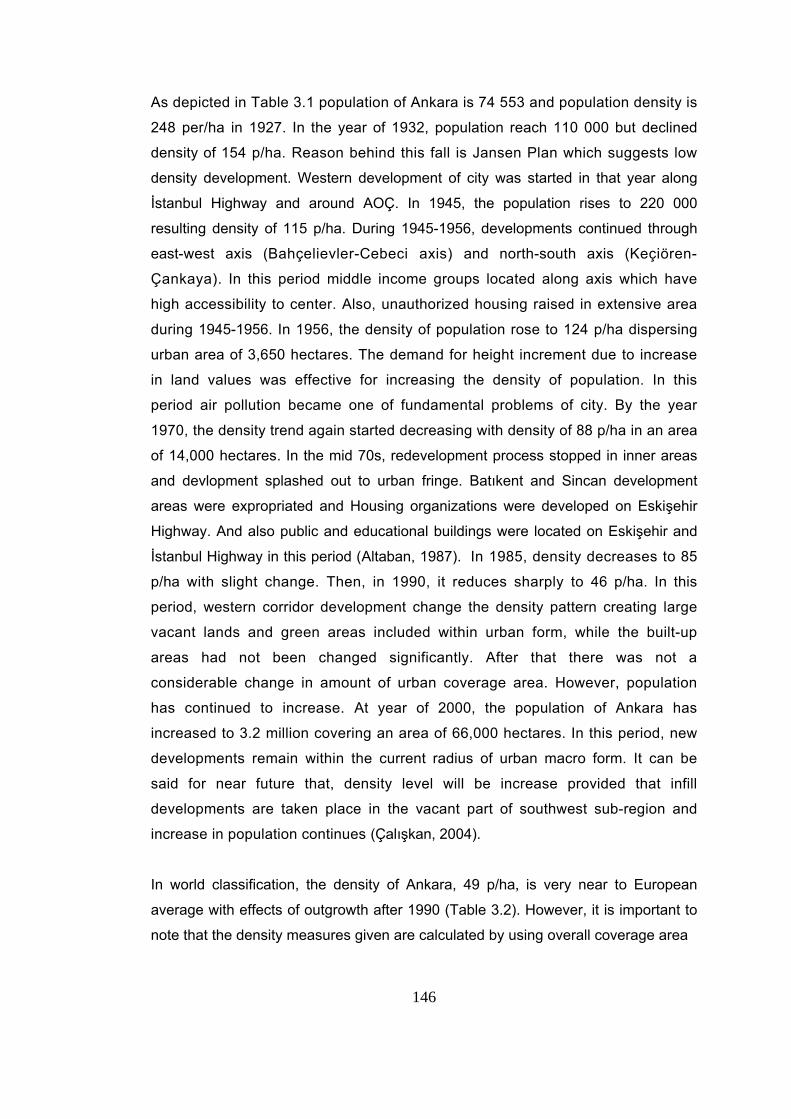
146
As depicted in Table 3.1 population of Ankara is 74 553 and population density is
248 per/ha in 1927. In the year of 1932, population reach 110 000 but declined
density of 154 p/ha. Reason behind this fall is Jansen Plan which suggests low
density development. Western development of city was started in that year along
İstanbul Highway and around AOÇ. In 1945, the population rises to 220 000
resulting density of 115 p/ha. During 1945-1956, developments continued through
east-west axis (Bahçelievler-Cebeci axis) and north-south axis (Keçiören-
Çankaya). In this period middle income groups located along axis which have
high accessibility to center. Also, unauthorized housing raised in extensive area
during 1945-1956. In 1956, the density of population rose to 124 p/ha dispersing
urban area of 3,650 hectares. The demand for height increment due to increase
in land values was effective for increasing the density of population. In this
period air pollution became one of fundamental problems of city. By the year
1970, the density trend again started decreasing with density of 88 p/ha in an area
of 14,000 hectares. In the mid 70s, redevelopment process stopped in inner areas
and devlopment splashed out to urban fringe. Batıkent and Sincan development
areas were expropriated and Housing organizations were developed on Eskişehir
Highway. And also public and educational buildings were located on Eskişehir and
İstanbul Highway in this period (Altaban, 1987). In 1985, density decreases to 85
p/ha with slight change. Then, in 1990, it reduces sharply to 46 p/ha. In this
period, western corridor development change the density pattern creating large
vacant lands and green areas included within urban form, while the built-up
areas had not been changed significantly. After that there was not a
considerable change in amount of urban coverage area. However, population
has continued to increase. At year of 2000, the population of Ankara has
increased to 3.2 million covering an area of 66,000 hectares. In this period, new
developments remain within the current radius of urban macro form. It can be
said for near future that, density level will be increase provided that infill
developments are taken place in the vacant part of southwest sub-region and
increase in population continues (Çalışkan, 2004).
In world classification, the density of Ankara, 49 p/ha, is very near to European
average with effects of outgrowth after 1990 (Table 3.2). However, it is important to
note that the density measures given are calculated by using overall coverage area
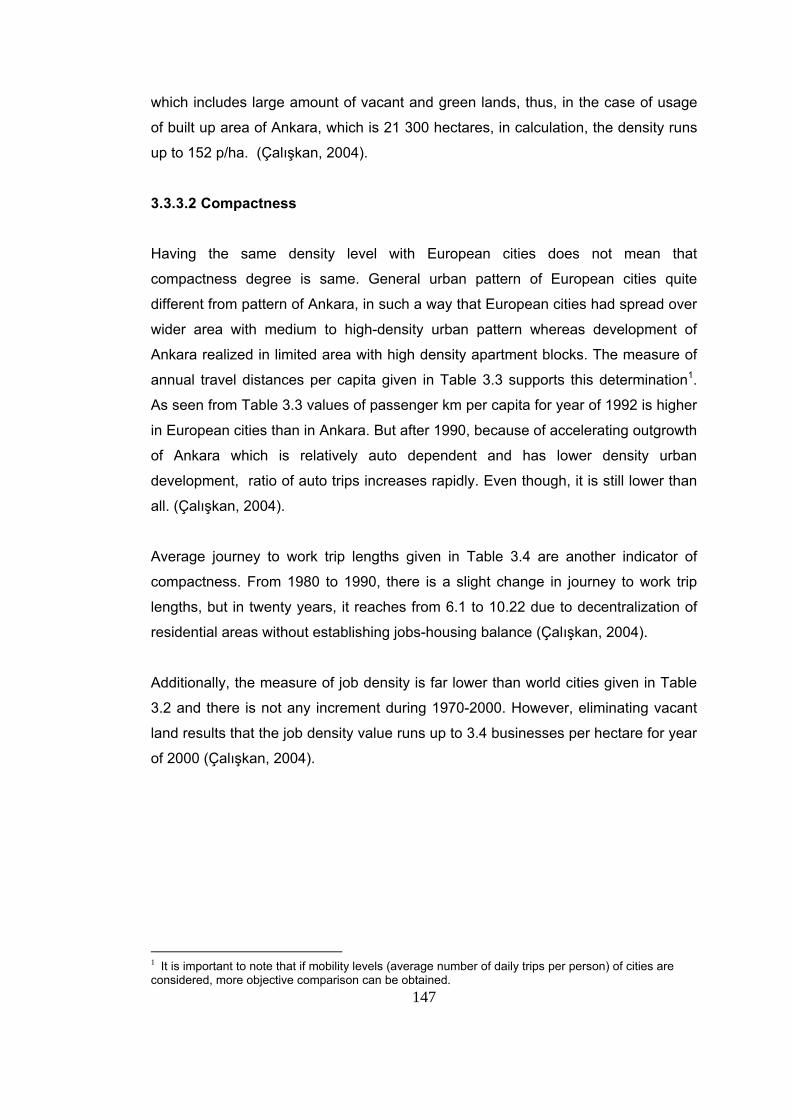
147
which includes large amount of vacant and green lands, thus, in the case of usage
of built up area of Ankara, which is 21 300 hectares, in calculation, the density runs
up to 152 p/ha. (Çalışkan, 2004).
3.3.3.2 Compactness
Having the same density level with European cities does not mean that
compactness degree is same. General urban pattern of European cities quite
different from pattern of Ankara, in such a way that European cities had spread over
wider area with medium to high-density urban pattern whereas development of
Ankara realized in limited area with high density apartment blocks. The measure of
annual travel distances per capita given in Table 3.3 supports this determination1.
As seen from Table 3.3 values of passenger km per capita for year of 1992 is higher
in European cities than in Ankara. But after 1990, because of accelerating outgrowth
of Ankara which is relatively auto dependent and has lower density urban
development, ratio of auto trips increases rapidly. Even though, it is still lower than
all. (Çalışkan, 2004).
Average journey to work trip lengths given in Table 3.4 are another indicator of
compactness. From 1980 to 1990, there is a slight change in journey to work trip
lengths, but in twenty years, it reaches from 6.1 to 10.22 due to decentralization of
residential areas without establishing jobs-housing balance (Çalışkan, 2004).
Additionally, the measure of job density is far lower than world cities given in Table
3.2 and there is not any increment during 1970-2000. However, eliminating vacant
land results that the job density value runs up to 3.4 businesses per hectare for year
of 2000 (Çalışkan, 2004).
1 It is important to note that if mobility levels (average number of daily trips per person) of cities are considered, more objective comparison can be obtained.
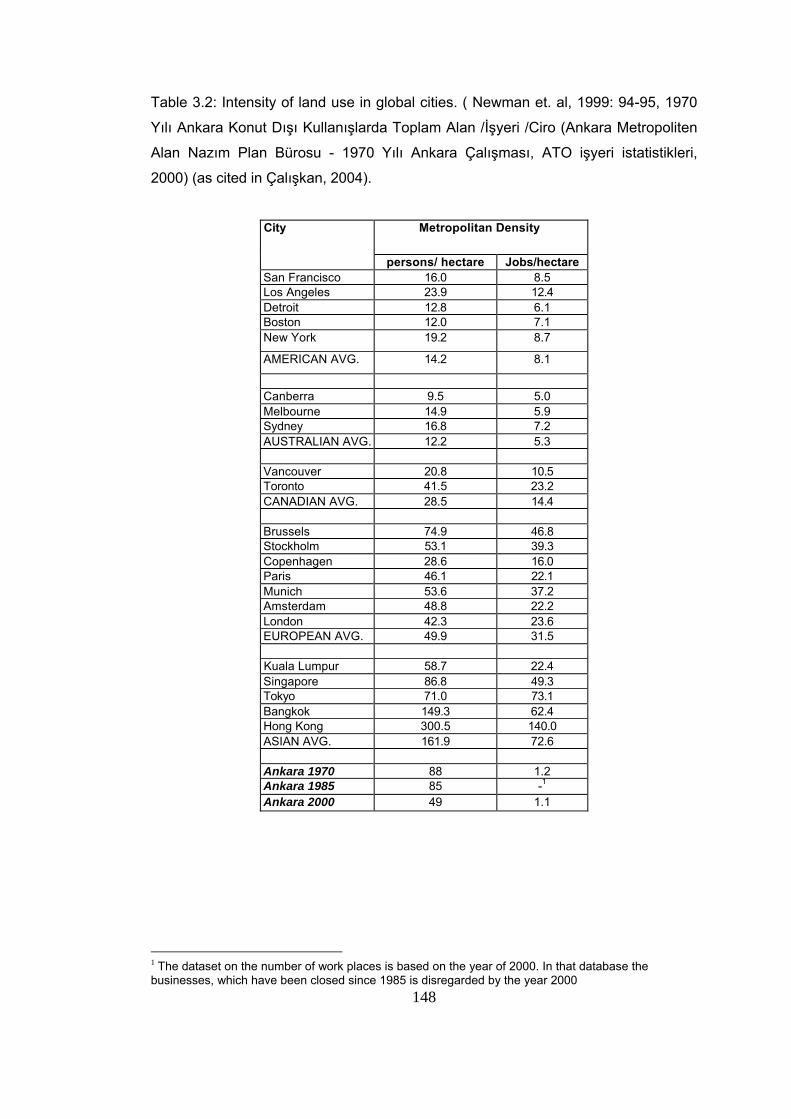
148
Table 3.2: Intensity of land use in global cities. ( Newman et. al, 1999: 94-95, 1970
Yılı Ankara Konut Dışı Kullanışlarda Toplam Alan /İşyeri /Ciro (Ankara Metropoliten
Alan Nazım Plan Bürosu - 1970 Yılı Ankara Çalışması, ATO işyeri istatistikleri,
2000) (as cited in Çalışkan, 2004).
City Metropolitan Density
persons/ hectare Jobs/hectare San Francisco 16.0 8.5 Los Angeles 23.9 12.4 Detroit 12.8 6.1 Boston 12.0 7.1 New York 19.2 8.7
AMERICAN AVG. 14.2 8.1
Canberra 9.5 5.0 Melbourne 14.9 5.9 Sydney 16.8 7.2 AUSTRALIAN AVG. 12.2 5.3 Vancouver 20.8 10.5 Toronto 41.5 23.2 CANADIAN AVG. 28.5 14.4 Brussels 74.9 46.8 Stockholm 53.1 39.3 Copenhagen 28.6 16.0 Paris 46.1 22.1 Munich 53.6 37.2 Amsterdam 48.8 22.2 London 42.3 23.6 EUROPEAN AVG. 49.9 31.5 Kuala Lumpur 58.7 22.4 Singapore 86.8 49.3 Tokyo 71.0 73.1 Bangkok 149.3 62.4 Hong Kong 300.5 140.0 ASIAN AVG. 161.9 72.6 Ankara 1970 88 1.2 Ankara 1985 85 -1 Ankara 2000 49 1.1
1 The dataset on the number of work places is based on the year of 2000. In that database the businesses, which have been closed since 1985 is disregarded by the year 2000
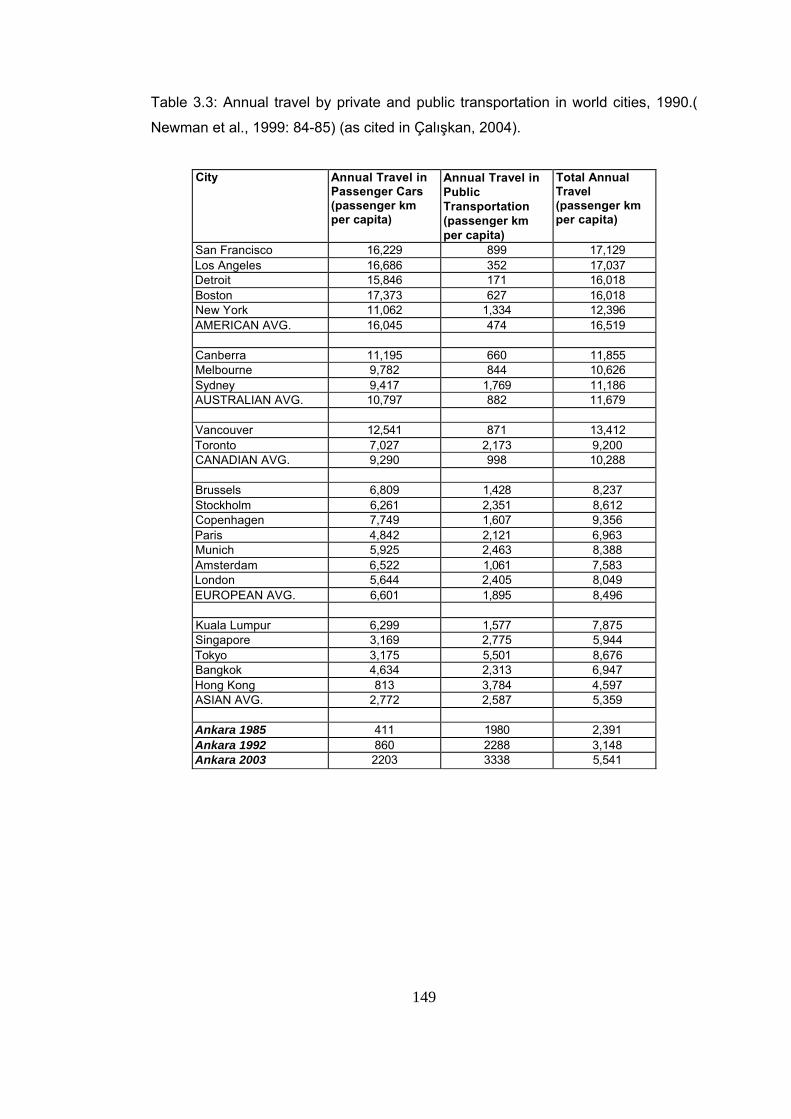
149
Table 3.3: Annual travel by private and public transportation in world cities, 1990.(
Newman et al., 1999: 84-85) (as cited in Çalışkan, 2004).
City Annual Travel in
Passenger Cars (passenger km per capita)
Annual Travel in Public Transportation (passenger km per capita)
Total Annual Travel (passenger km per capita)
San Francisco 16,229 899 17,129 Los Angeles 16,686 352 17,037 Detroit 15,846 171 16,018 Boston 17,373 627 16,018 New York 11,062 1,334 12,396 AMERICAN AVG. 16,045 474 16,519 Canberra 11,195 660 11,855 Melbourne 9,782 844 10,626 Sydney 9,417 1,769 11,186 AUSTRALIAN AVG. 10,797 882 11,679 Vancouver 12,541 871 13,412 Toronto 7,027 2,173 9,200 CANADIAN AVG. 9,290 998 10,288 Brussels 6,809 1,428 8,237 Stockholm 6,261 2,351 8,612 Copenhagen 7,749 1,607 9,356 Paris 4,842 2,121 6,963 Munich 5,925 2,463 8,388 Amsterdam 6,522 1,061 7,583 London 5,644 2,405 8,049 EUROPEAN AVG. 6,601 1,895 8,496 Kuala Lumpur 6,299 1,577 7,875 Singapore 3,169 2,775 5,944 Tokyo 3,175 5,501 8,676 Bangkok 4,634 2,313 6,947 Hong Kong 813 3,784 4,597 ASIAN AVG. 2,772 2,587 5,359 Ankara 1985 411 1980 2,391 Ankara 1992 860 2288 3,148 Ankara 2003 2203 3338 5,541
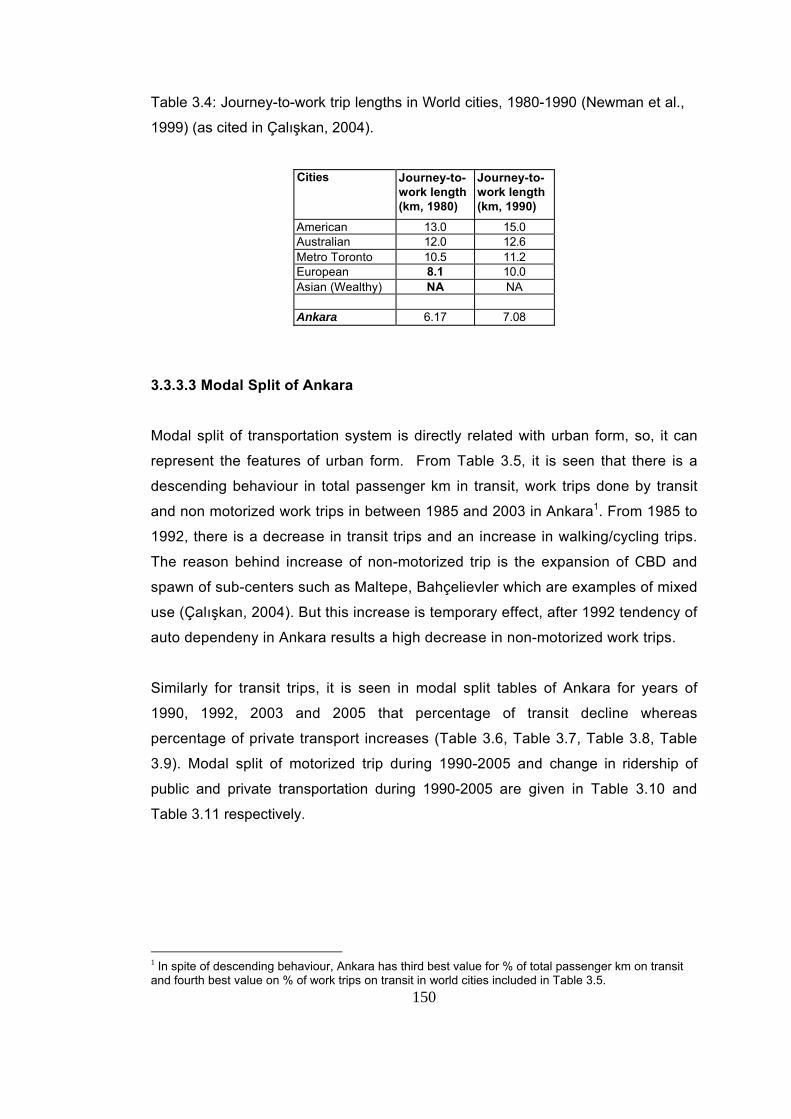
150
Table 3.4: Journey-to-work trip lengths in World cities, 1980-1990 (Newman et al.,
1999) (as cited in Çalışkan, 2004).
Cities Journey-to-
work length (km, 1980)
Journey-to-work length (km, 1990)
American 13.0 15.0 Australian 12.0 12.6 Metro Toronto 10.5 11.2 European 8.1 10.0 Asian (Wealthy) NA NA Ankara 6.17 7.08
3.3.3.3 Modal Split of Ankara
Modal split of transportation system is directly related with urban form, so, it can
represent the features of urban form. From Table 3.5, it is seen that there is a
descending behaviour in total passenger km in transit, work trips done by transit
and non motorized work trips in between 1985 and 2003 in Ankara1. From 1985 to
1992, there is a decrease in transit trips and an increase in walking/cycling trips.
The reason behind increase of non-motorized trip is the expansion of CBD and
spawn of sub-centers such as Maltepe, Bahçelievler which are examples of mixed
use (Çalışkan, 2004). But this increase is temporary effect, after 1992 tendency of
auto dependeny in Ankara results a high decrease in non-motorized work trips.
Similarly for transit trips, it is seen in modal split tables of Ankara for years of
1990, 1992, 2003 and 2005 that percentage of transit decline whereas
percentage of private transport increases (Table 3.6, Table 3.7, Table 3.8, Table
3.9). Modal split of motorized trip during 1990-2005 and change in ridership of
public and private transportation during 1990-2005 are given in Table 3.10 and
Table 3.11 respectively.
1 In spite of descending behaviour, Ankara has third best value for % of total passenger km on transit and fourth best value on % of work trips on transit in world cities included in Table 3.5.
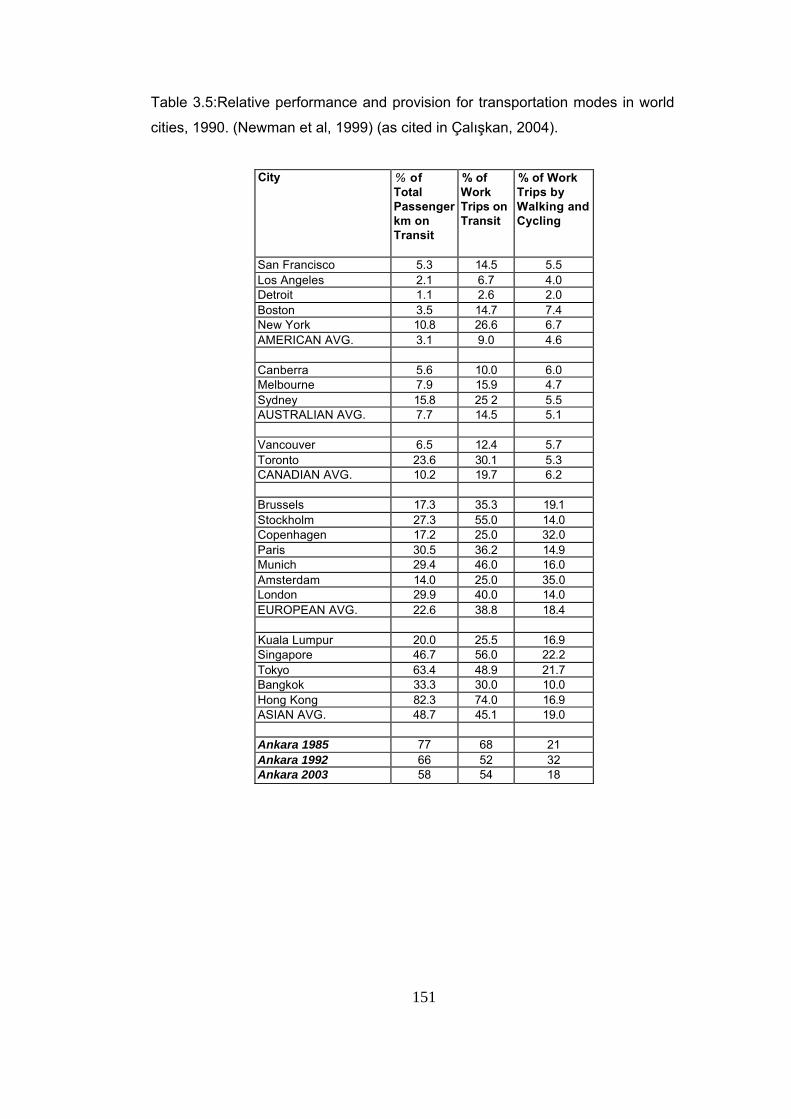
151
Table 3.5:Relative performance and provision for transportation modes in world
cities, 1990. (Newman et al, 1999) (as cited in Çalışkan, 2004).
City % of Total Passenger km on Transit
% of Work Trips on Transit
% of Work Trips by Walking and Cycling
San Francisco 5.3 14.5 5.5 Los Angeles 2.1 6.7 4.0 Detroit 1.1 2.6 2.0 Boston 3.5 14.7 7.4 New York 10.8 26.6 6.7 AMERICAN AVG. 3.1 9.0 4.6 Canberra 5.6 10.0 6.0 Melbourne 7.9 15.9 4.7 Sydney 15.8 25 2 5.5 AUSTRALIAN AVG. 7.7 14.5 5.1 Vancouver 6.5 12.4 5.7 Toronto 23.6 30.1 5.3 CANADIAN AVG. 10.2 19.7 6.2 Brussels 17.3 35.3 19.1 Stockholm 27.3 55.0 14.0 Copenhagen 17.2 25.0 32.0 Paris 30.5 36.2 14.9 Munich 29.4 46.0 16.0 Amsterdam 14.0 25.0 35.0 London 29.9 40.0 14.0 EUROPEAN AVG. 22.6 38.8 18.4 Kuala Lumpur 20.0 25.5 16.9 Singapore 46.7 56.0 22.2 Tokyo 63.4 48.9 21.7 Bangkok 33.3 30.0 10.0 Hong Kong 82.3 74.0 16.9 ASIAN AVG. 48.7 45.1 19.0 Ankara 1985 77 68 21 Ankara 1992 66 52 32 Ankara 2003 58 54 18
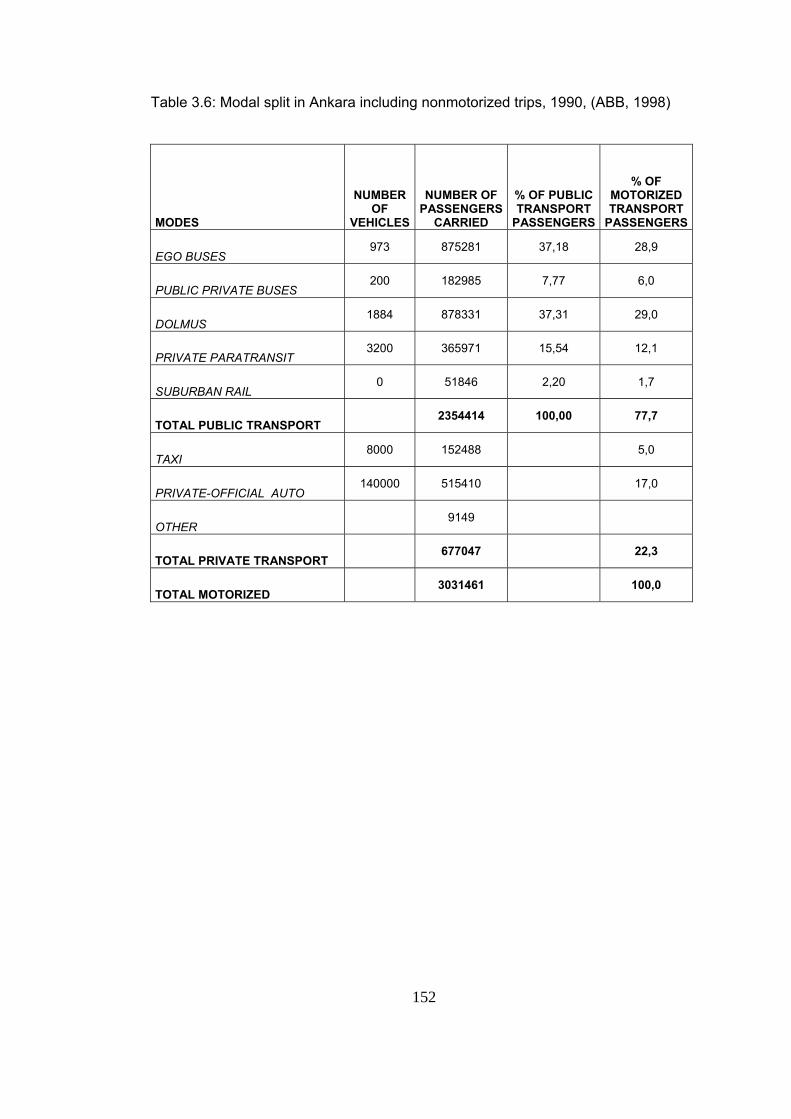
152
Table 3.6: Modal split in Ankara including nonmotorized trips, 1990, (ABB, 1998)
MODES
NUMBER OF
VEHICLES
NUMBER OF PASSENGERS
CARRIED
% OF PUBLIC TRANSPORT
PASSENGERS
% OF MOTORIZED TRANSPORT
PASSENGERS
EGO BUSES 973 875281 37,18 28,9
PUBLIC PRIVATE BUSES 200 182985 7,77 6,0
DOLMUS 1884 878331 37,31 29,0
PRIVATE PARATRANSIT 3200 365971 15,54 12,1
SUBURBAN RAIL 0 51846 2,20 1,7
TOTAL PUBLIC TRANSPORT 2354414 100,00 77,7
TAXI 8000 152488 5,0
PRIVATE-OFFICIAL AUTO 140000 515410 17,0
OTHER 9149
TOTAL PRIVATE TRANSPORT 677047 22,3
TOTAL MOTORIZED 3031461 100,0
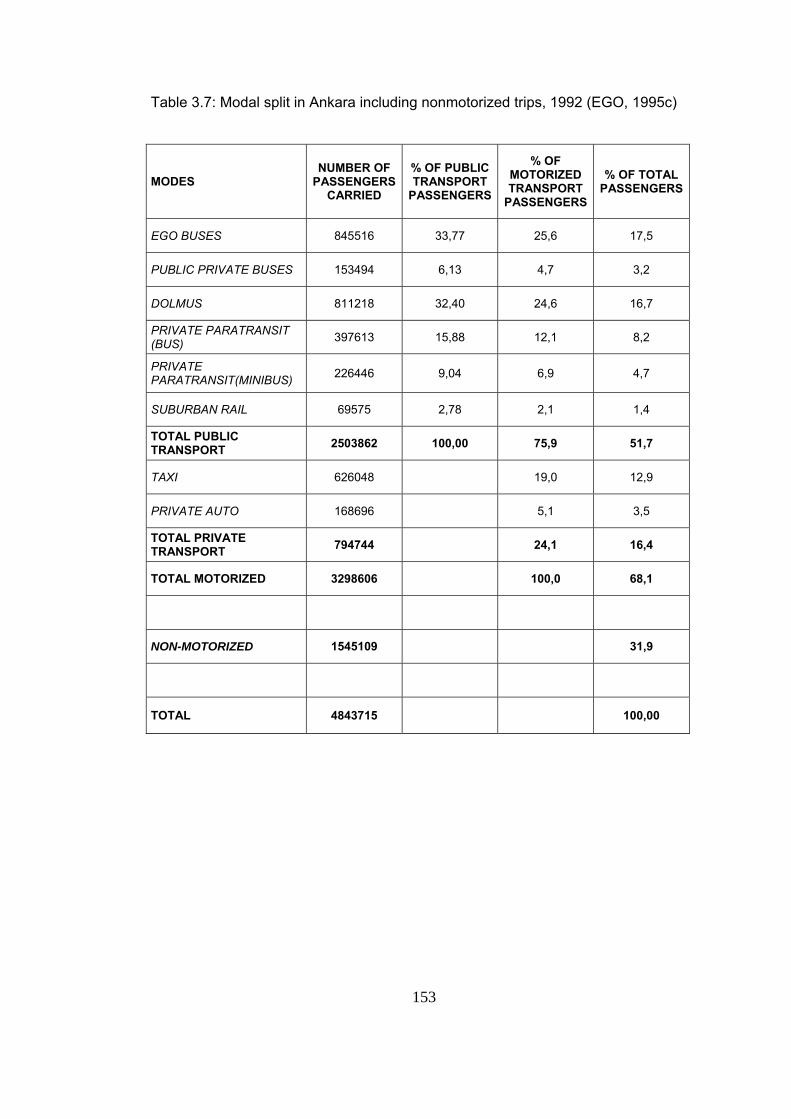
153
Table 3.7: Modal split in Ankara including nonmotorized trips, 1992 (EGO, 1995c)
MODES NUMBER OF
PASSENGERS CARRIED
% OF PUBLIC TRANSPORT
PASSENGERS
% OF MOTORIZED TRANSPORT
PASSENGERS
% OF TOTAL PASSENGERS
EGO BUSES 845516 33,77 25,6 17,5
PUBLIC PRIVATE BUSES 153494 6,13 4,7 3,2
DOLMUS 811218 32,40 24,6 16,7
PRIVATE PARATRANSIT (BUS) 397613 15,88 12,1 8,2
PRIVATE PARATRANSIT(MINIBUS) 226446 9,04 6,9 4,7
SUBURBAN RAIL 69575 2,78 2,1 1,4
TOTAL PUBLIC TRANSPORT 2503862 100,00 75,9 51,7
TAXI 626048 19,0 12,9
PRIVATE AUTO 168696 5,1 3,5
TOTAL PRIVATE TRANSPORT 794744 24,1 16,4
TOTAL MOTORIZED 3298606 100,0 68,1
NON-MOTORIZED 1545109 31,9
TOTAL 4843715 100,00
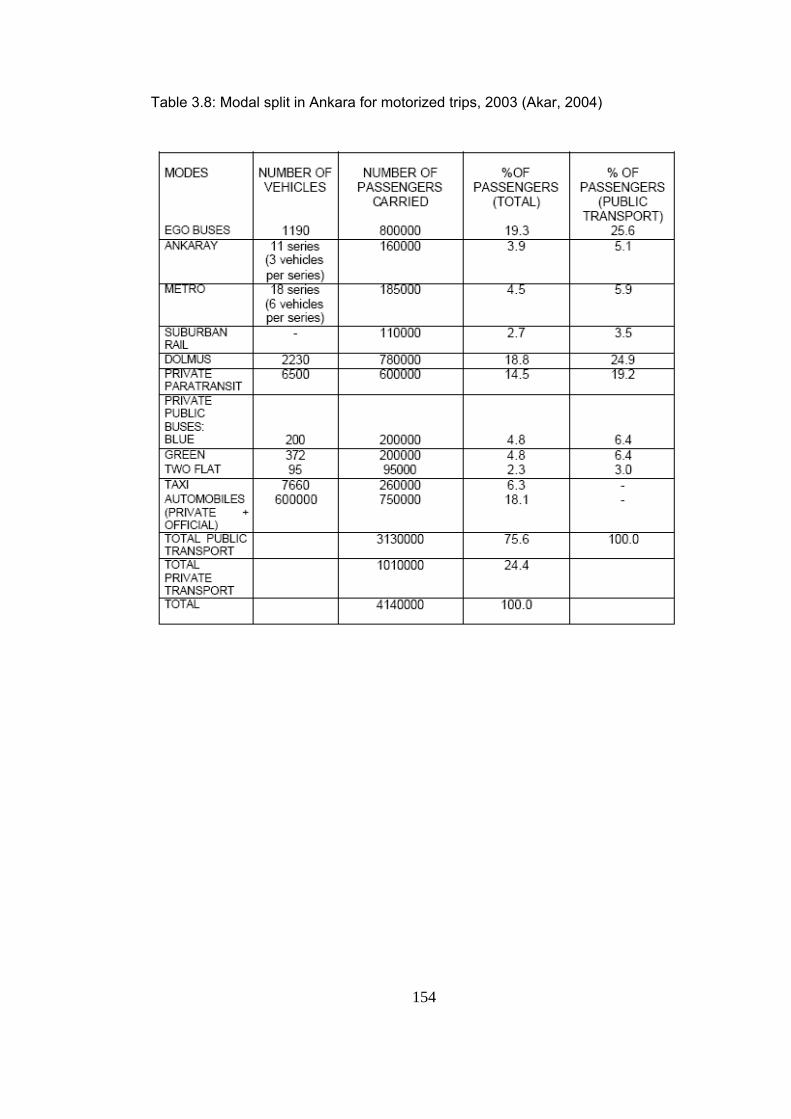
154
Table 3.8: Modal split in Ankara for motorized trips, 2003 (Akar, 2004)
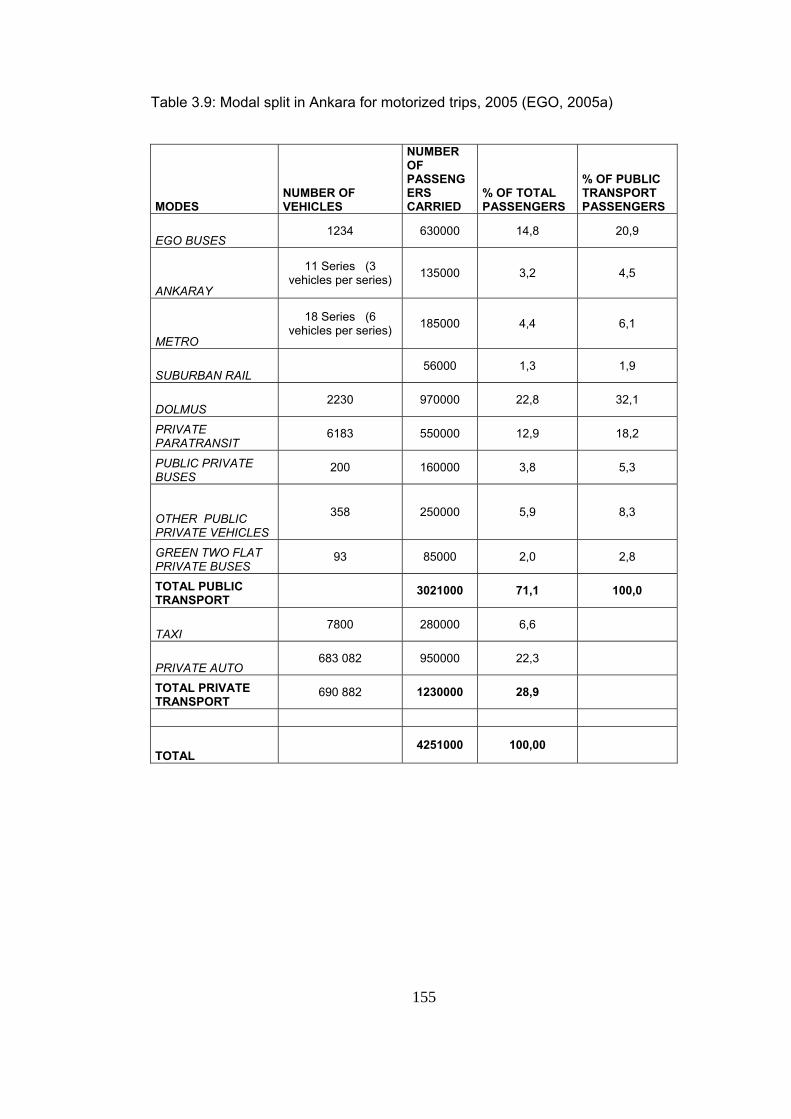
155
Table 3.9: Modal split in Ankara for motorized trips, 2005 (EGO, 2005a)
MODES NUMBER OF VEHICLES
NUMBER OF PASSENGERS CARRIED
% OF TOTAL PASSENGERS
% OF PUBLIC TRANSPORT PASSENGERS
EGO BUSES 1234 630000 14,8 20,9
ANKARAY
11 Series (3 vehicles per series) 135000 3,2 4,5
METRO
18 Series (6 vehicles per series) 185000 4,4 6,1
SUBURBAN RAIL 56000 1,3 1,9
DOLMUS 2230 970000 22,8 32,1
PRIVATE PARATRANSIT
6183 550000 12,9 18,2
PUBLIC PRIVATE BUSES
200 160000 3,8 5,3
OTHER PUBLIC PRIVATE VEHICLES
358 250000 5,9 8,3
GREEN TWO FLAT PRIVATE BUSES
93 85000 2,0 2,8
TOTAL PUBLIC TRANSPORT
3021000 71,1 100,0
TAXI 7800 280000 6,6
PRIVATE AUTO 683 082 950000 22,3
TOTAL PRIVATE TRANSPORT
690 882 1230000 28,9
TOTAL 4251000 100,00
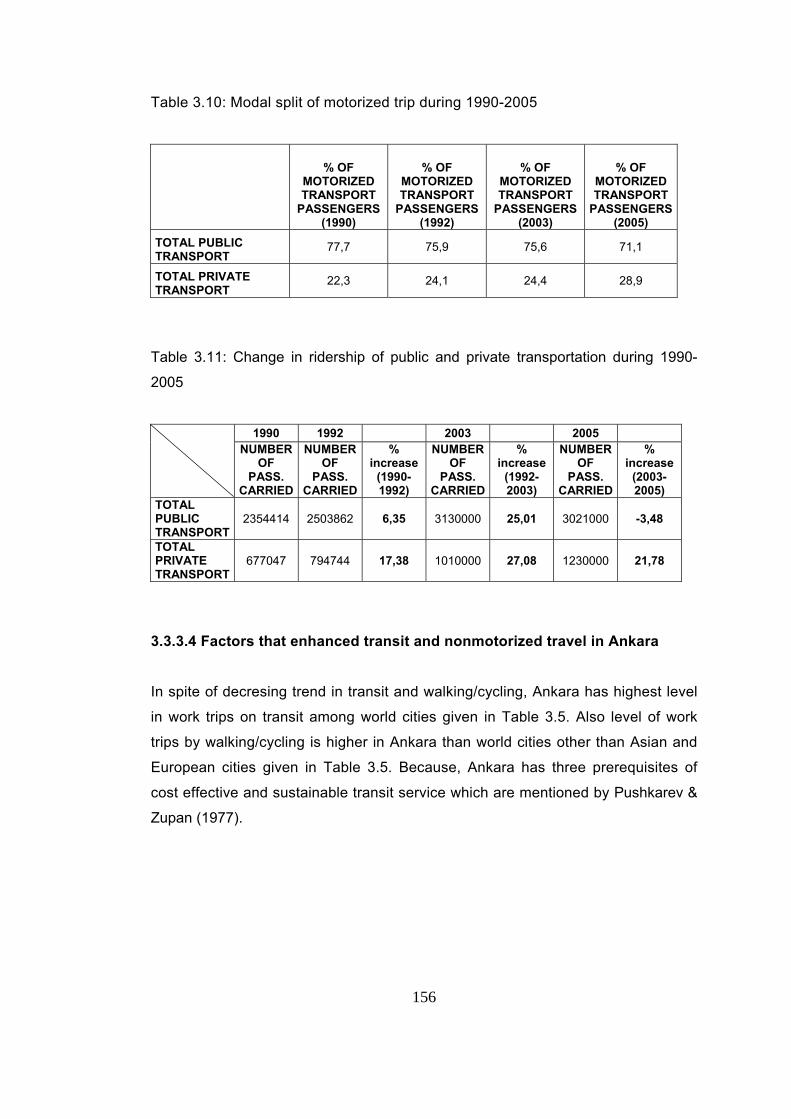
156
Table 3.10: Modal split of motorized trip during 1990-2005
% OF MOTORIZED TRANSPORT
PASSENGERS (1990)
% OF MOTORIZED TRANSPORT
PASSENGERS (1992)
% OF MOTORIZED TRANSPORT
PASSENGERS (2003)
% OF MOTORIZED TRANSPORT
PASSENGERS (2005)
TOTAL PUBLIC TRANSPORT
77,7 75,9 75,6 71,1
TOTAL PRIVATE TRANSPORT
22,3 24,1 24,4 28,9
Table 3.11: Change in ridership of public and private transportation during 1990-
2005
1990 1992 2003 2005
NUMBER OF
PASS. CARRIED
NUMBER OF
PASS. CARRIED
% increase
(1990-1992)
NUMBER OF
PASS. CARRIED
% increase
(1992-2003)
NUMBER OF
PASS. CARRIED
% increase
(2003-2005)
TOTAL PUBLIC TRANSPORT
2354414 2503862 6,35 3130000 25,01 3021000 -3,48
TOTAL PRIVATE TRANSPORT
677047 794744 17,38 1010000 27,08 1230000 21,78
3.3.3.4 Factors that enhanced transit and nonmotorized travel in Ankara
In spite of decresing trend in transit and walking/cycling, Ankara has highest level
in work trips on transit among world cities given in Table 3.5. Also level of work
trips by walking/cycling is higher in Ankara than world cities other than Asian and
European cities given in Table 3.5. Because, Ankara has three prerequisites of
cost effective and sustainable transit service which are mentioned by Pushkarev &
Zupan (1977).
157
1. A large dominant center: CBD of Ankara still maintains its feature of
being unique strong center. In Ankara, high proportion of jobs is clustered
in the CBD, since decentralization process is not realized as aimed in
Ankara Transportation Master Plan. So high proportion of work trips are
directed toward city center through public transportation system. Existing of
limited parking areas in CBD due to high density is another factor for
enhancing transit use.
2. Dense residential developments: As mentioned before, the density of
Ankara runs up from 49 p/ha to 152 p/ha for the year of 2000, if built up area
is used in calculation instead of overall area which includes green zone and
vacant lands. Thus, residential areas along radial corridors have high density
by means of which efficient public transportation is ensured.
3. Long radial corridors: Ankara has star shape radial corridors connecting
in city center. This provides direct access to high density CBD, which has
most of job opportunities, through radial corridor.
As for walking behavior, one of the main factors behind high walking trip rates is
compact form again. Although dispersed, single-use residential areas have
developed in urban fringe, Ankara has very compact urban form in CBD and along
radial transit corridor.
For both high transit and walking trip rates, low income level and high gasoline
price have very significant supportive effect. In spite of all these conditions, share
of walking trips are reducing day by day due to unconcerned behaviour of
authorities. Table 3.12 shows this fall clearly.
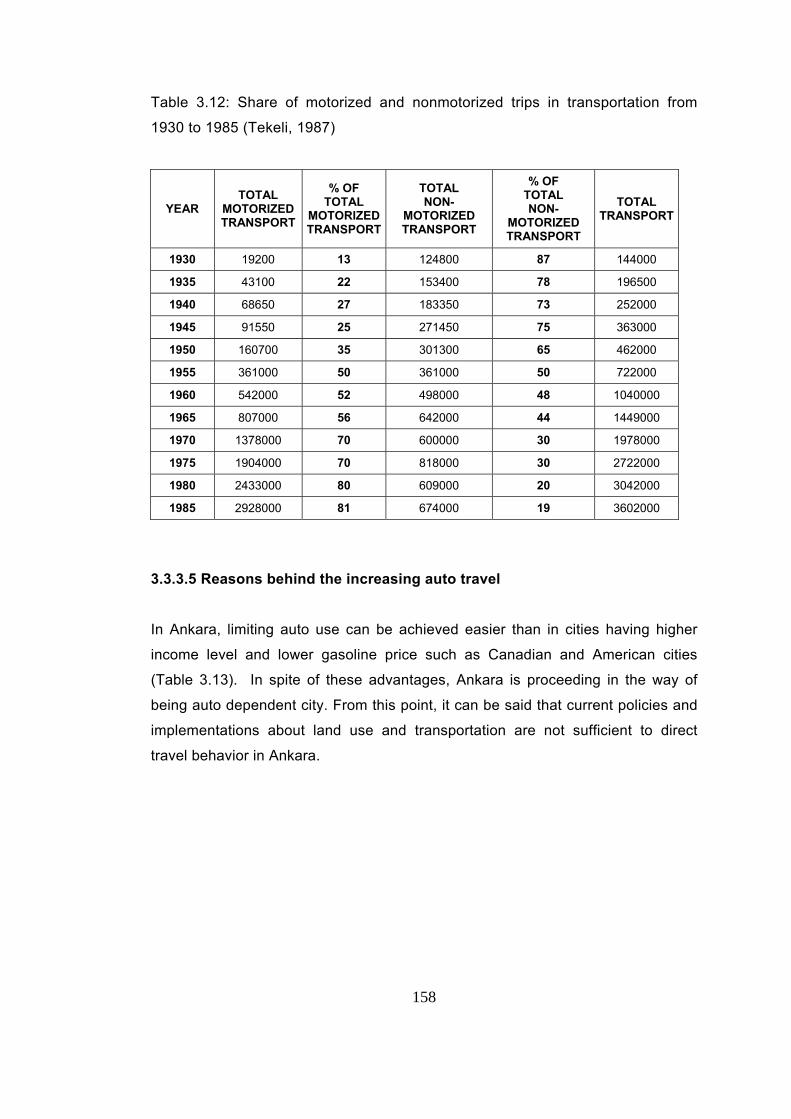
158
Table 3.12: Share of motorized and nonmotorized trips in transportation from
1930 to 1985 (Tekeli, 1987)
YEAR TOTAL
MOTORIZED TRANSPORT
% OF TOTAL
MOTORIZED TRANSPORT
TOTAL NON-
MOTORIZED TRANSPORT
% OF TOTAL NON-
MOTORIZED TRANSPORT
TOTAL TRANSPORT
1930 19200 13 124800 87 144000
1935 43100 22 153400 78 196500
1940 68650 27 183350 73 252000
1945 91550 25 271450 75 363000
1950 160700 35 301300 65 462000
1955 361000 50 361000 50 722000
1960 542000 52 498000 48 1040000
1965 807000 56 642000 44 1449000
1970 1378000 70 600000 30 1978000
1975 1904000 70 818000 30 2722000
1980 2433000 80 609000 20 3042000
1985 2928000 81 674000 19 3602000
3.3.3.5 Reasons behind the increasing auto travel
In Ankara, limiting auto use can be achieved easier than in cities having higher
income level and lower gasoline price such as Canadian and American cities
(Table 3.13). In spite of these advantages, Ankara is proceeding in the way of
being auto dependent city. From this point, it can be said that current policies and
implementations about land use and transportation are not sufficient to direct
travel behavior in Ankara.
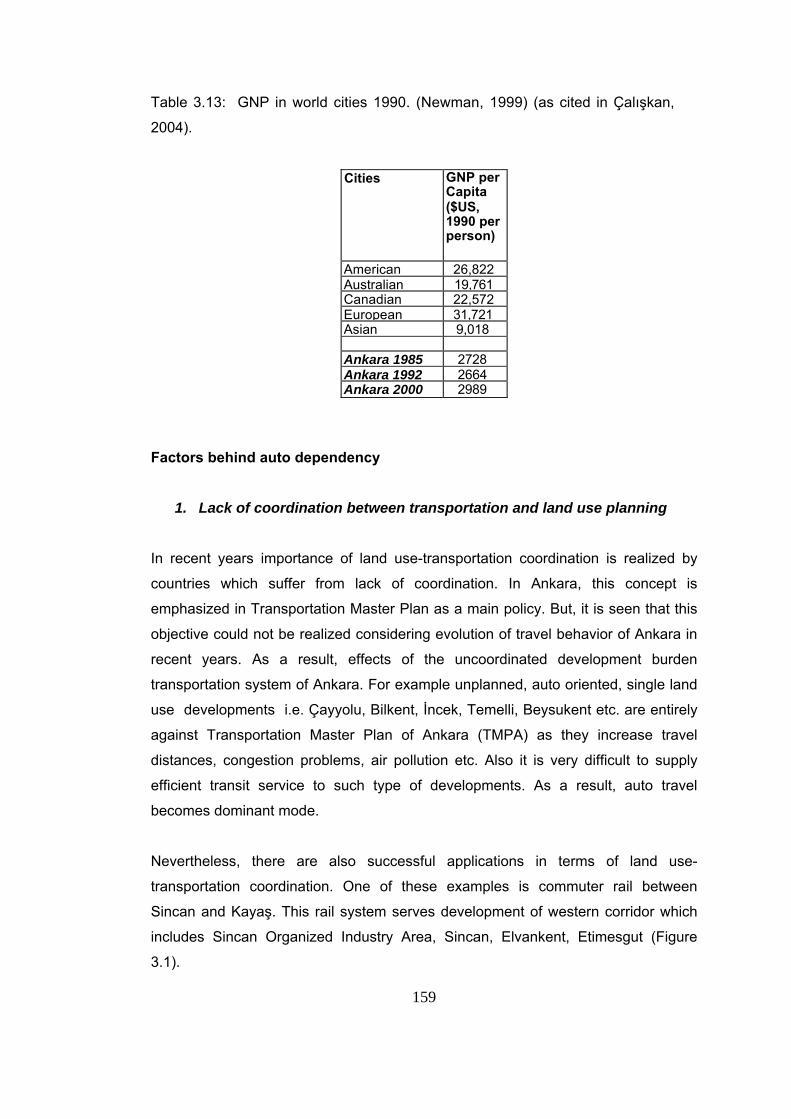
159
Table 3.13: GNP in world cities 1990. (Newman, 1999) (as cited in Çalışkan,
2004).
Cities GNP per Capita ($US, 1990 per person)
American 26,822Australian 19,761Canadian 22,572European 31,721Asian 9,018
Ankara 1985 2728Ankara 1992 2664Ankara 2000 2989
Factors behind auto dependency
1. Lack of coordination between transportation and land use planning
In recent years importance of land use-transportation coordination is realized by
countries which suffer from lack of coordination. In Ankara, this concept is
emphasized in Transportation Master Plan as a main policy. But, it is seen that this
objective could not be realized considering evolution of travel behavior of Ankara in
recent years. As a result, effects of the uncoordinated development burden
transportation system of Ankara. For example unplanned, auto oriented, single land
use developments i.e. Çayyolu, Bilkent, İncek, Temelli, Beysukent etc. are entirely
against Transportation Master Plan of Ankara (TMPA) as they increase travel
distances, congestion problems, air pollution etc. Also it is very difficult to supply
efficient transit service to such type of developments. As a result, auto travel
becomes dominant mode.
Nevertheless, there are also successful applications in terms of land use-
transportation coordination. One of these examples is commuter rail between
Sincan and Kayaş. This rail system serves development of western corridor which
includes Sincan Organized Industry Area, Sincan, Elvankent, Etimesgut (Figure
3.1).
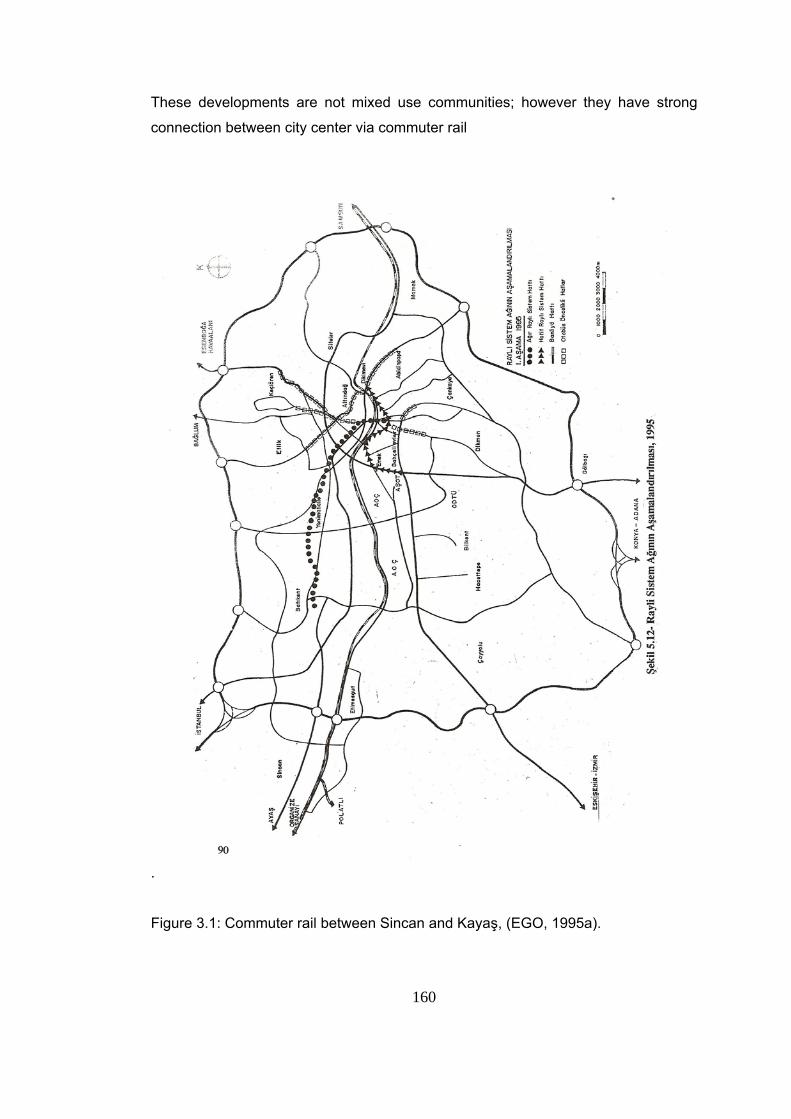
160
These developments are not mixed use communities; however they have strong
connection between city center via commuter rail
.
Figure 3.1: Commuter rail between Sincan and Kayaş, (EGO, 1995a).
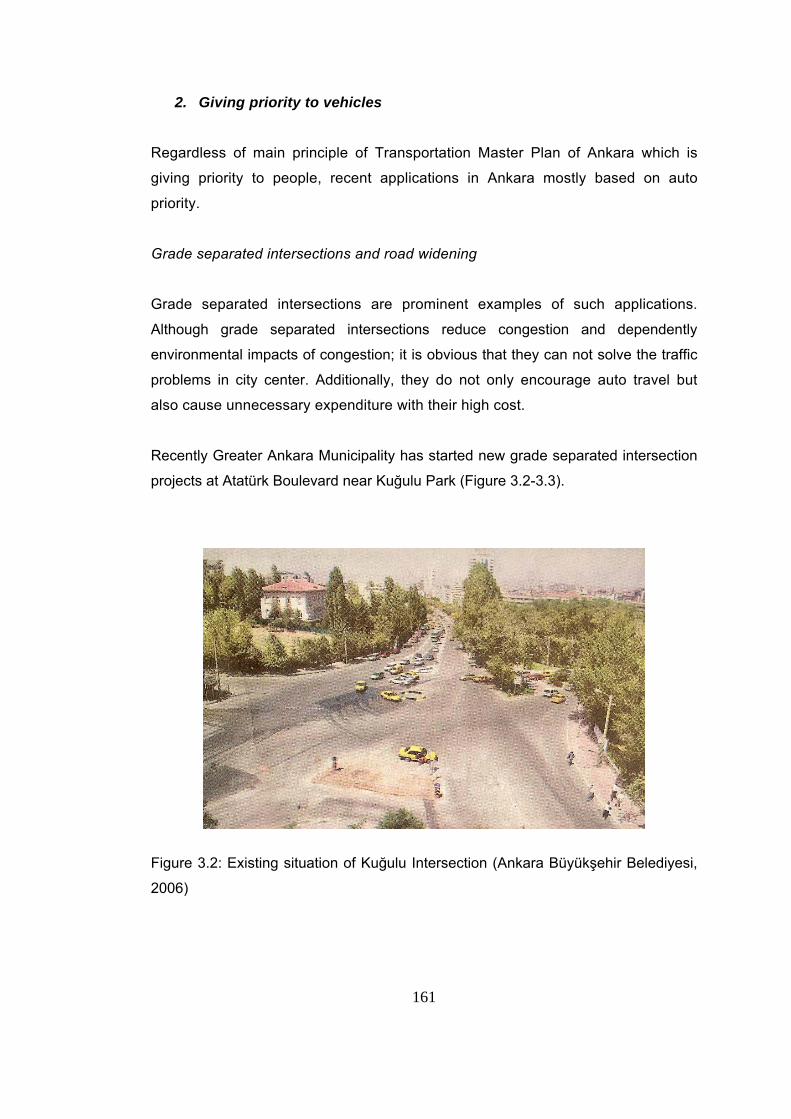
161
2. Giving priority to vehicles
Regardless of main principle of Transportation Master Plan of Ankara which is
giving priority to people, recent applications in Ankara mostly based on auto
priority.
Grade separated intersections and road widening
Grade separated intersections are prominent examples of such applications.
Although grade separated intersections reduce congestion and dependently
environmental impacts of congestion; it is obvious that they can not solve the traffic
problems in city center. Additionally, they do not only encourage auto travel but
also cause unnecessary expenditure with their high cost.
Recently Greater Ankara Municipality has started new grade separated intersection
projects at Atatürk Boulevard near Kuğulu Park (Figure 3.2-3.3).
Figure 3.2: Existing situation of Kuğulu Intersection (Ankara Büyükşehir Belediyesi,
2006)
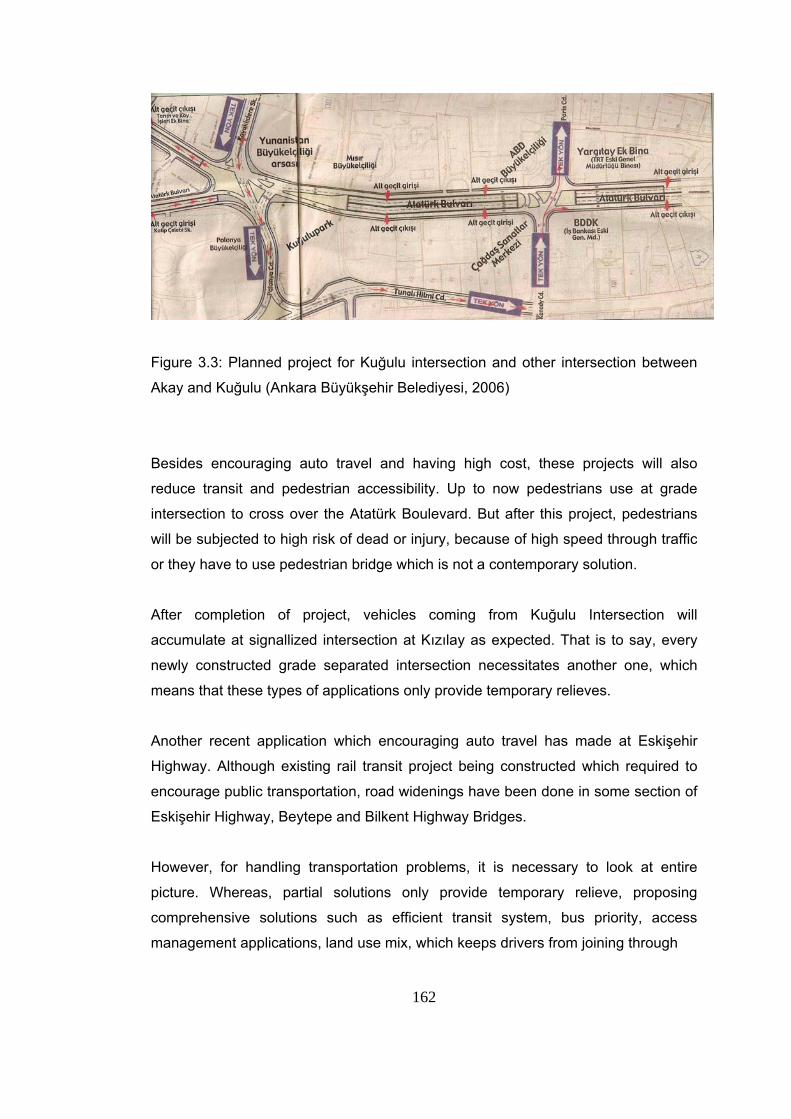
162
Figure 3.3: Planned project for Kuğulu intersection and other intersection between
Akay and Kuğulu (Ankara Büyükşehir Belediyesi, 2006)
Besides encouraging auto travel and having high cost, these projects will also
reduce transit and pedestrian accessibility. Up to now pedestrians use at grade
intersection to cross over the Atatürk Boulevard. But after this project, pedestrians
will be subjected to high risk of dead or injury, because of high speed through traffic
or they have to use pedestrian bridge which is not a contemporary solution.
After completion of project, vehicles coming from Kuğulu Intersection will
accumulate at signallized intersection at Kızılay as expected. That is to say, every
newly constructed grade separated intersection necessitates another one, which
means that these types of applications only provide temporary relieves.
Another recent application which encouraging auto travel has made at Eskişehir
Highway. Although existing rail transit project being constructed which required to
encourage public transportation, road widenings have been done in some section of
Eskişehir Highway, Beytepe and Bilkent Highway Bridges.
However, for handling transportation problems, it is necessary to look at entire
picture. Whereas, partial solutions only provide temporary relieve, proposing
comprehensive solutions such as efficient transit system, bus priority, access
management applications, land use mix, which keeps drivers from joining through
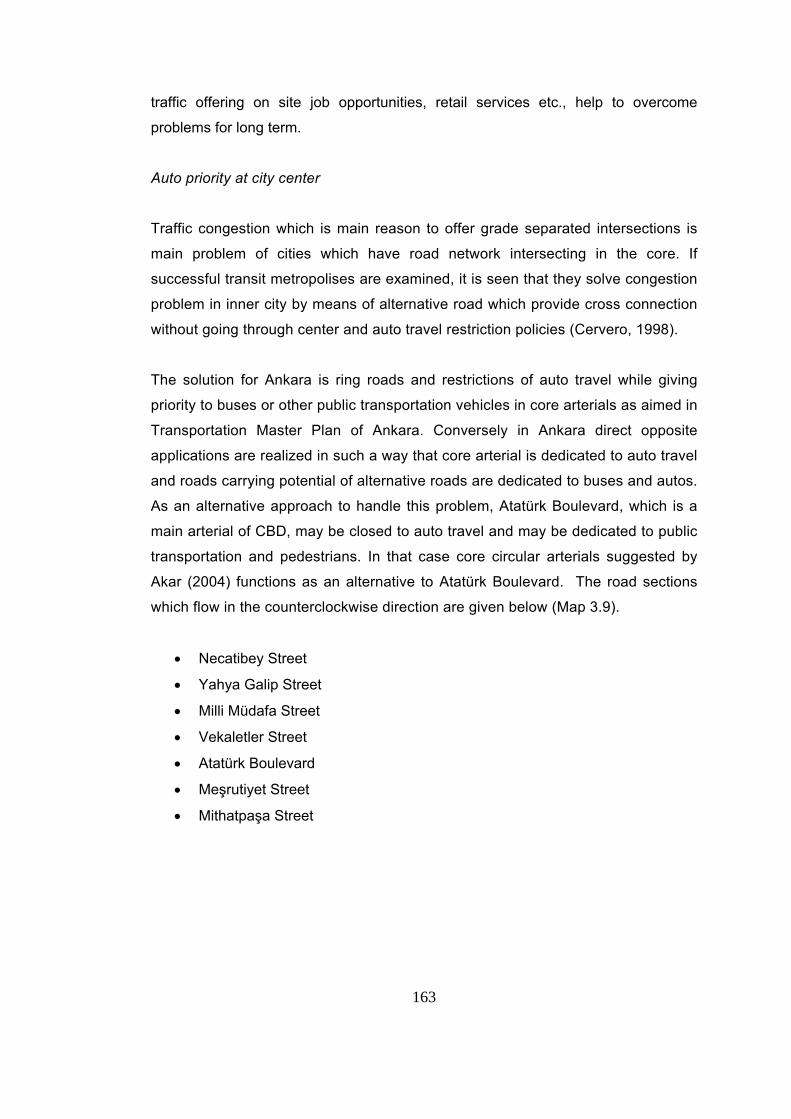
163
traffic offering on site job opportunities, retail services etc., help to overcome
problems for long term.
Auto priority at city center
Traffic congestion which is main reason to offer grade separated intersections is
main problem of cities which have road network intersecting in the core. If
successful transit metropolises are examined, it is seen that they solve congestion
problem in inner city by means of alternative road which provide cross connection
without going through center and auto travel restriction policies (Cervero, 1998).
The solution for Ankara is ring roads and restrictions of auto travel while giving
priority to buses or other public transportation vehicles in core arterials as aimed in
Transportation Master Plan of Ankara. Conversely in Ankara direct opposite
applications are realized in such a way that core arterial is dedicated to auto travel
and roads carrying potential of alternative roads are dedicated to buses and autos.
As an alternative approach to handle this problem, Atatürk Boulevard, which is a
main arterial of CBD, may be closed to auto travel and may be dedicated to public
transportation and pedestrians. In that case core circular arterials suggested by
Akar (2004) functions as an alternative to Atatürk Boulevard. The road sections
which flow in the counterclockwise direction are given below (Map 3.9).
• Necatibey Street
• Yahya Galip Street
• Milli Müdafa Street
• Vekaletler Street
• Atatürk Boulevard
• Meşrutiyet Street
• Mithatpaşa Street
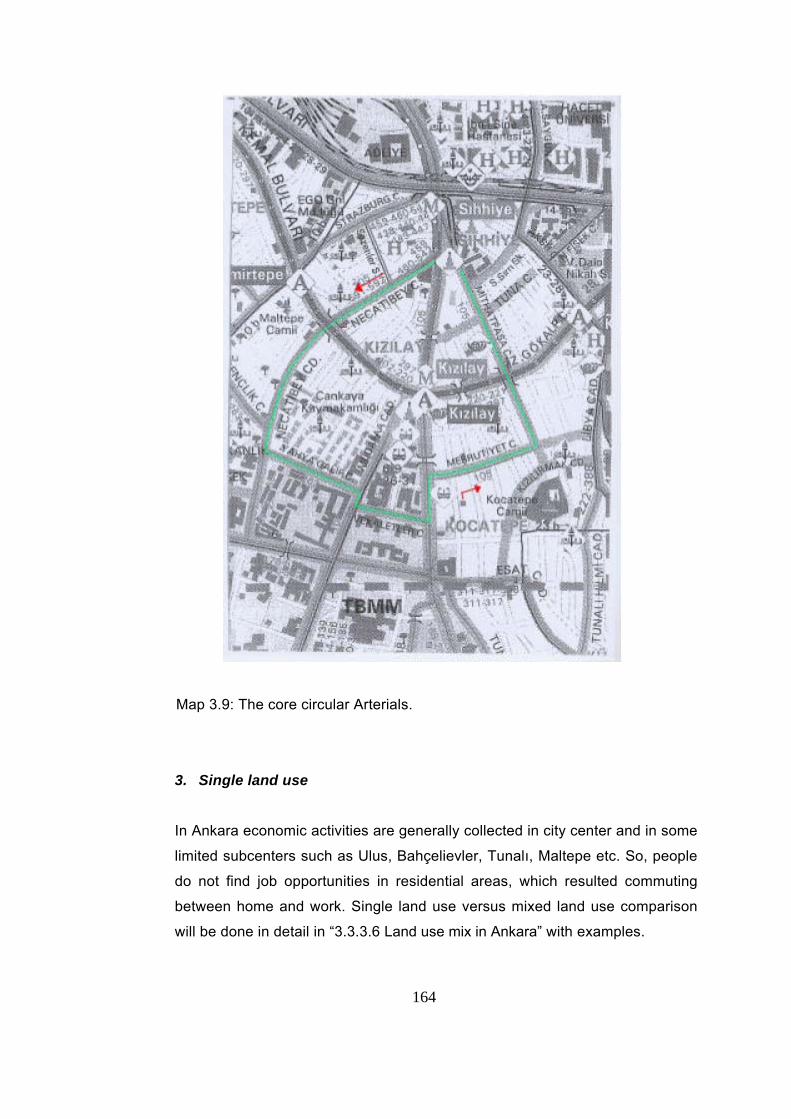
164
Map 3.9: The core circular Arterials.
3. Single land use
In Ankara economic activities are generally collected in city center and in some
limited subcenters such as Ulus, Bahçelievler, Tunalı, Maltepe etc. So, people
do not find job opportunities in residential areas, which resulted commuting
between home and work. Single land use versus mixed land use comparison
will be done in detail in “3.3.3.6 Land use mix in Ankara” with examples.
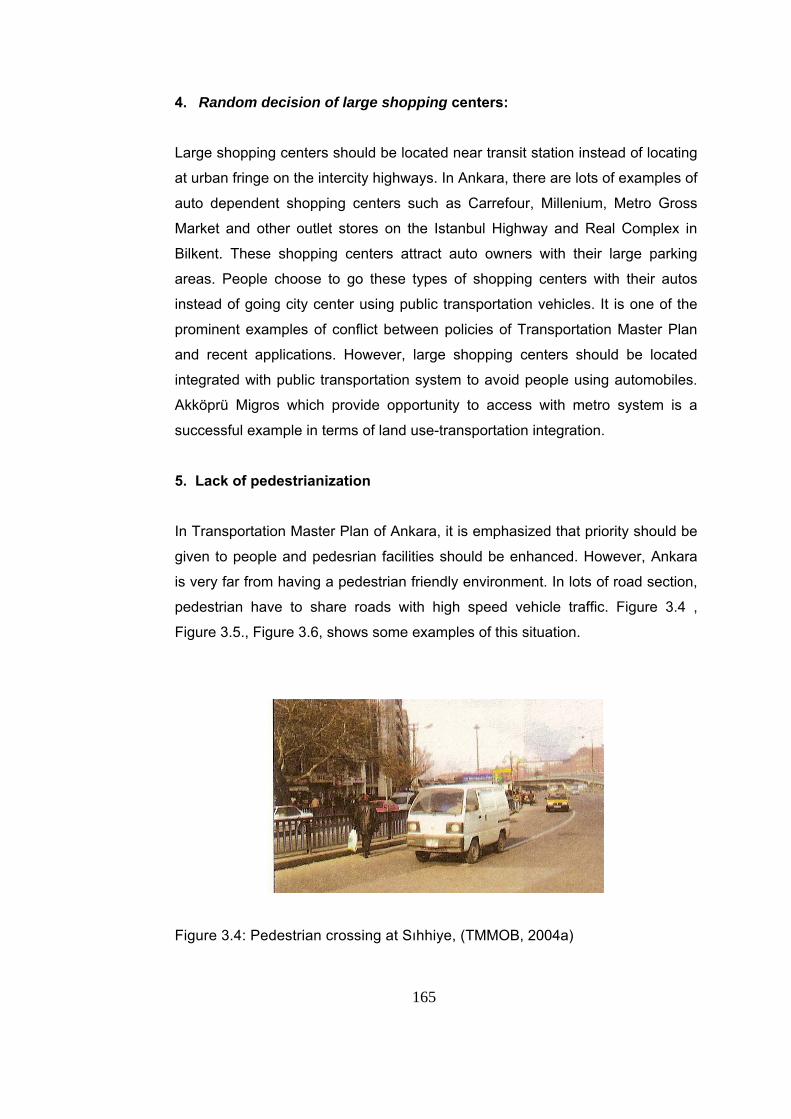
165
4. Random decision of large shopping centers:
Large shopping centers should be located near transit station instead of locating
at urban fringe on the intercity highways. In Ankara, there are lots of examples of
auto dependent shopping centers such as Carrefour, Millenium, Metro Gross
Market and other outlet stores on the Istanbul Highway and Real Complex in
Bilkent. These shopping centers attract auto owners with their large parking
areas. People choose to go these types of shopping centers with their autos
instead of going city center using public transportation vehicles. It is one of the
prominent examples of conflict between policies of Transportation Master Plan
and recent applications. However, large shopping centers should be located
integrated with public transportation system to avoid people using automobiles.
Akköprü Migros which provide opportunity to access with metro system is a
successful example in terms of land use-transportation integration.
5. Lack of pedestrianization
In Transportation Master Plan of Ankara, it is emphasized that priority should be
given to people and pedesrian facilities should be enhanced. However, Ankara
is very far from having a pedestrian friendly environment. In lots of road section,
pedestrian have to share roads with high speed vehicle traffic. Figure 3.4 ,
Figure 3.5., Figure 3.6, shows some examples of this situation.
Figure 3.4: Pedestrian crossing at Sıhhiye, (TMMOB, 2004a)
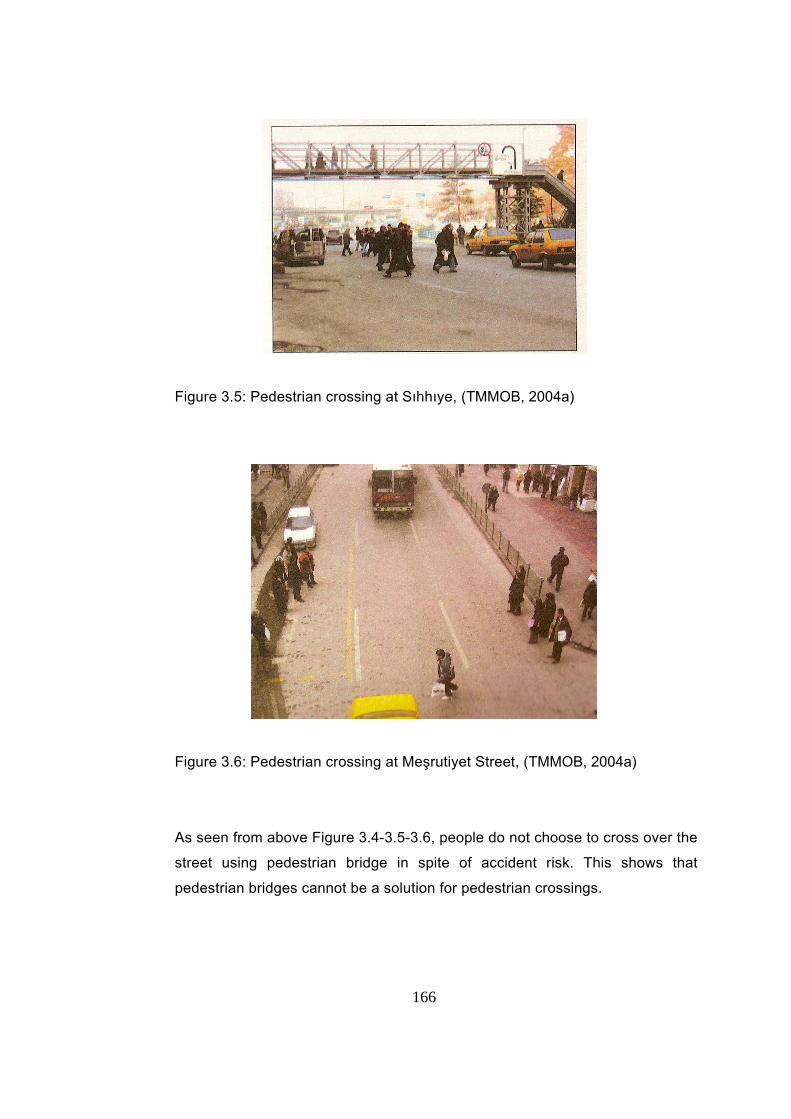
166
Figure 3.5: Pedestrian crossing at Sıhhıye, (TMMOB, 2004a)
Figure 3.6: Pedestrian crossing at Meşrutiyet Street, (TMMOB, 2004a)
As seen from above Figure 3.4-3.5-3.6, people do not choose to cross over the
street using pedestrian bridge in spite of accident risk. This shows that
pedestrian bridges cannot be a solution for pedestrian crossings.
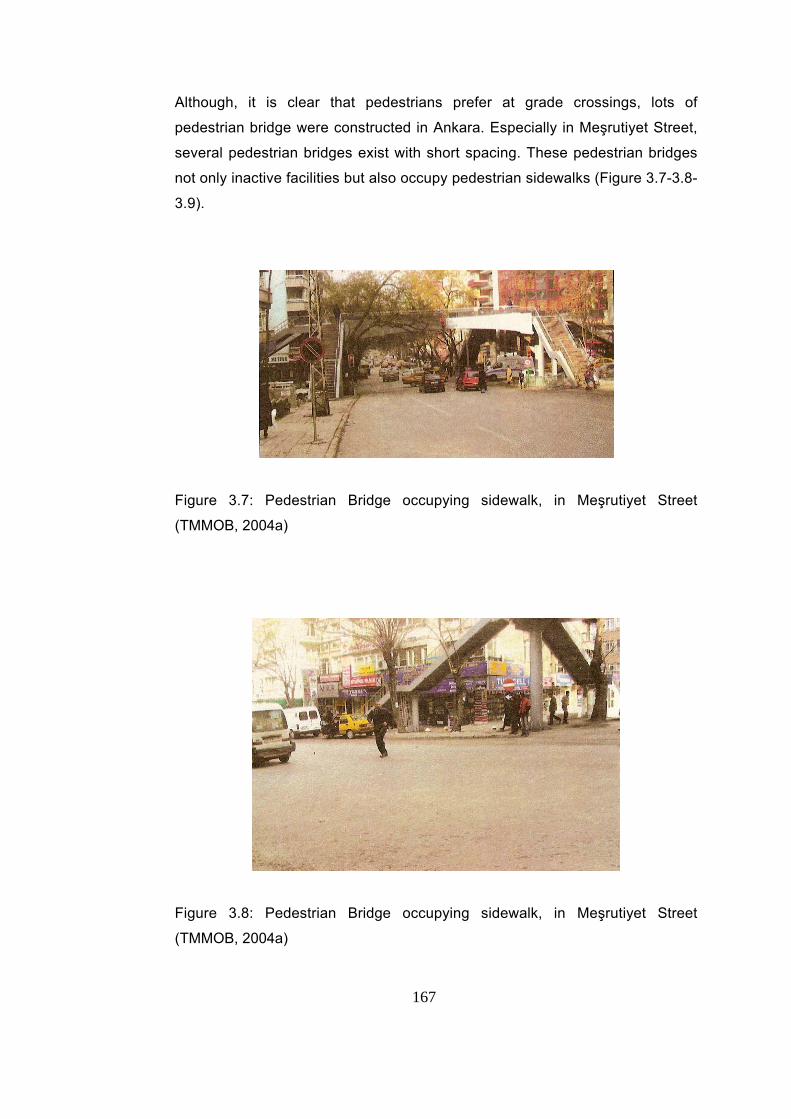
167
Although, it is clear that pedestrians prefer at grade crossings, lots of
pedestrian bridge were constructed in Ankara. Especially in Meşrutiyet Street,
several pedestrian bridges exist with short spacing. These pedestrian bridges
not only inactive facilities but also occupy pedestrian sidewalks (Figure 3.7-3.8-
3.9).
Figure 3.7: Pedestrian Bridge occupying sidewalk, in Meşrutiyet Street
(TMMOB, 2004a)
Figure 3.8: Pedestrian Bridge occupying sidewalk, in Meşrutiyet Street
(TMMOB, 2004a)
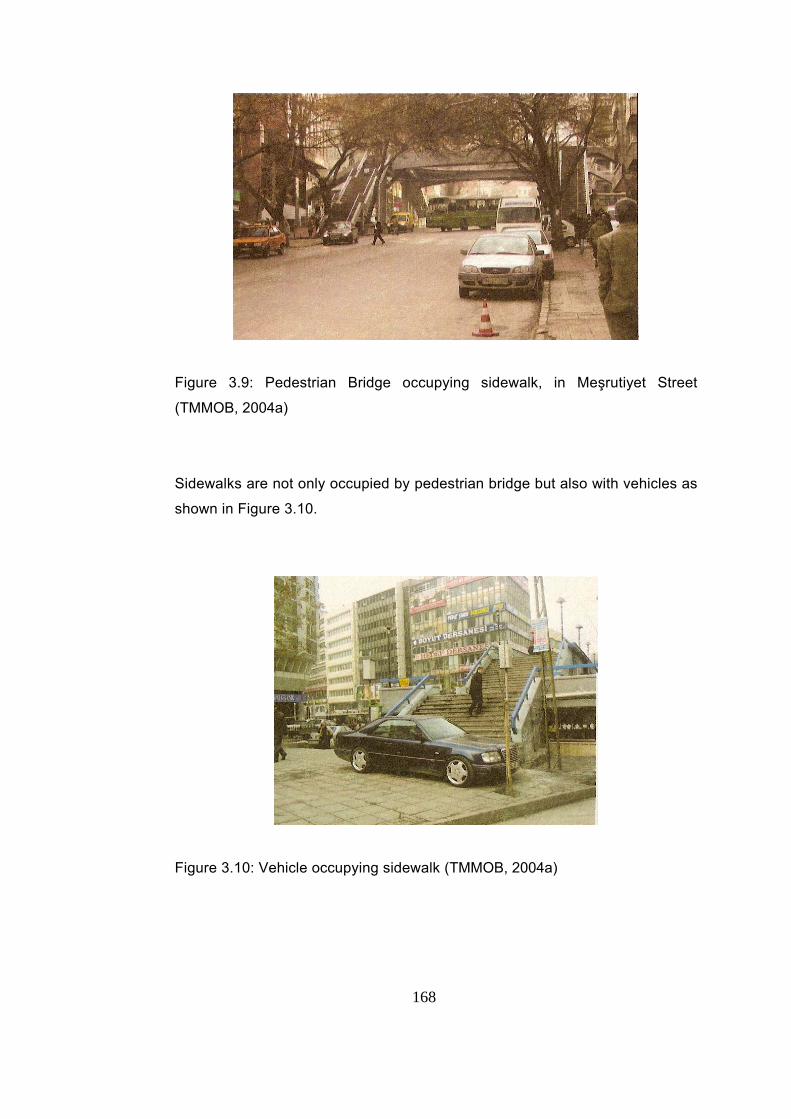
168
Figure 3.9: Pedestrian Bridge occupying sidewalk, in Meşrutiyet Street
(TMMOB, 2004a)
Sidewalks are not only occupied by pedestrian bridge but also with vehicles as
shown in Figure 3.10.
Figure 3.10: Vehicle occupying sidewalk (TMMOB, 2004a)
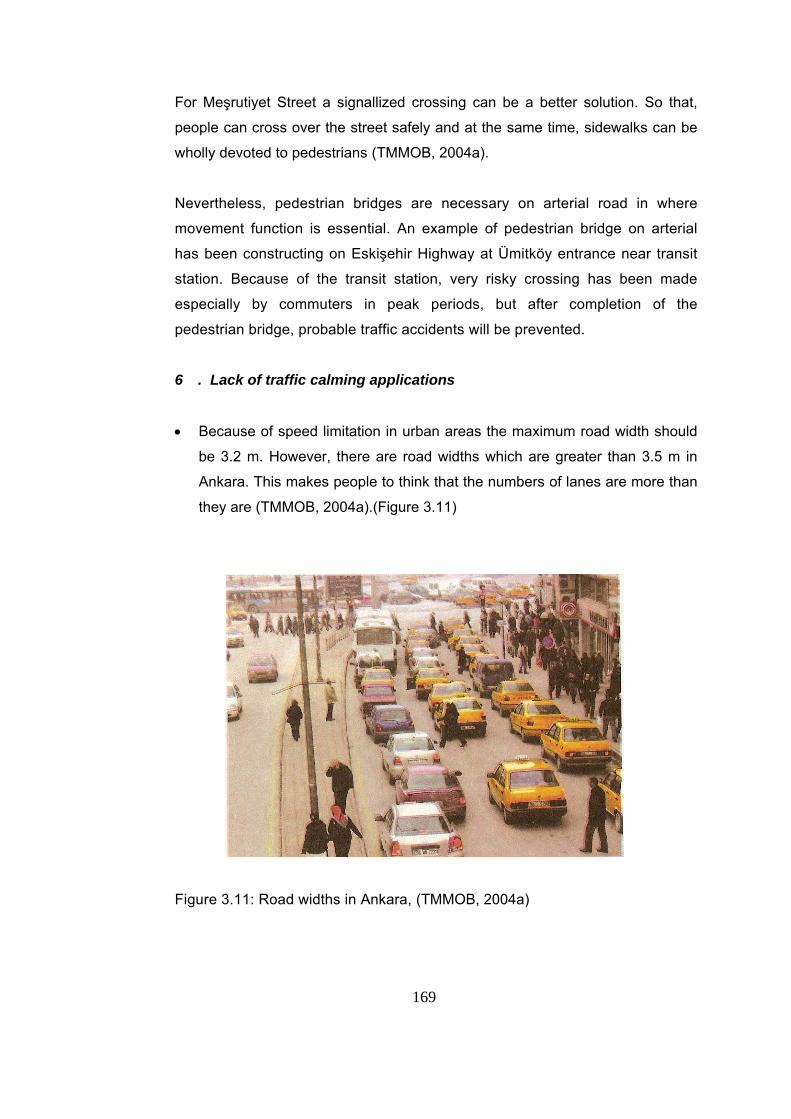
169
For Meşrutiyet Street a signallized crossing can be a better solution. So that,
people can cross over the street safely and at the same time, sidewalks can be
wholly devoted to pedestrians (TMMOB, 2004a).
Nevertheless, pedestrian bridges are necessary on arterial road in where
movement function is essential. An example of pedestrian bridge on arterial
has been constructing on Eskişehir Highway at Ümitköy entrance near transit
station. Because of the transit station, very risky crossing has been made
especially by commuters in peak periods, but after completion of the
pedestrian bridge, probable traffic accidents will be prevented.
6 . Lack of traffic calming applications
• Because of speed limitation in urban areas the maximum road width should
be 3.2 m. However, there are road widths which are greater than 3.5 m in
Ankara. This makes people to think that the numbers of lanes are more than
they are (TMMOB, 2004a).(Figure 3.11)
Figure 3.11: Road widths in Ankara, (TMMOB, 2004a)
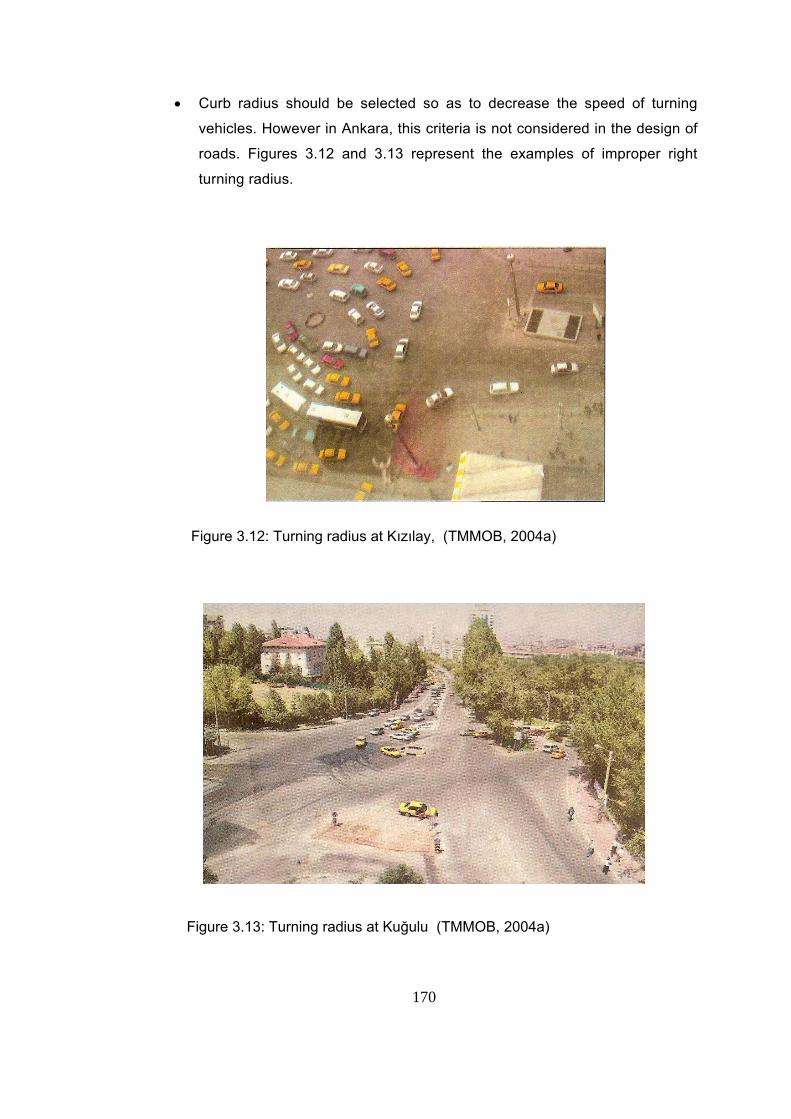
170
• Curb radius should be selected so as to decrease the speed of turning
vehicles. However in Ankara, this criteria is not considered in the design of
roads. Figures 3.12 and 3.13 represent the examples of improper right
turning radius.
Figure 3.12: Turning radius at Kızılay, (TMMOB, 2004a)
Figure 3.13: Turning radius at Kuğulu (TMMOB, 2004a)
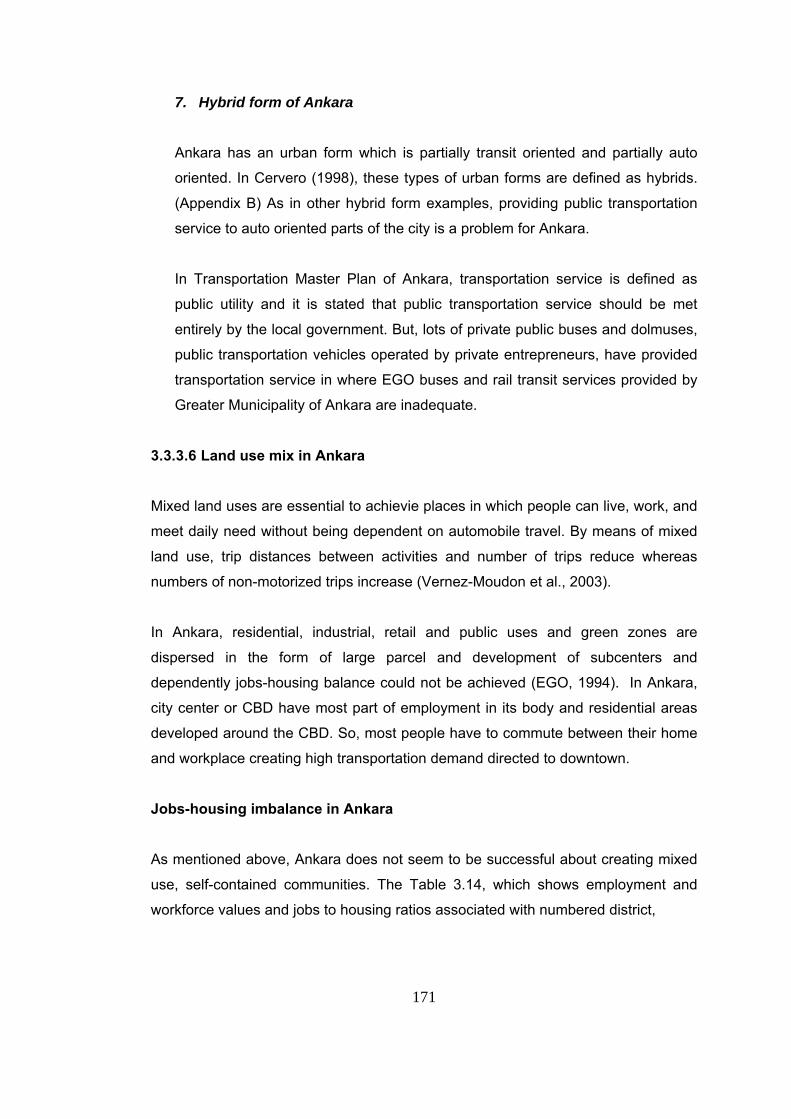
171
7. Hybrid form of Ankara
Ankara has an urban form which is partially transit oriented and partially auto
oriented. In Cervero (1998), these types of urban forms are defined as hybrids.
(Appendix B) As in other hybrid form examples, providing public transportation
service to auto oriented parts of the city is a problem for Ankara.
In Transportation Master Plan of Ankara, transportation service is defined as
public utility and it is stated that public transportation service should be met
entirely by the local government. But, lots of private public buses and dolmuses,
public transportation vehicles operated by private entrepreneurs, have provided
transportation service in where EGO buses and rail transit services provided by
Greater Municipality of Ankara are inadequate.
3.3.3.6 Land use mix in Ankara
Mixed land uses are essential to achievie places in which people can live, work, and
meet daily need without being dependent on automobile travel. By means of mixed
land use, trip distances between activities and number of trips reduce whereas
numbers of non-motorized trips increase (Vernez-Moudon et al., 2003).
In Ankara, residential, industrial, retail and public uses and green zones are
dispersed in the form of large parcel and development of subcenters and
dependently jobs-housing balance could not be achieved (EGO, 1994). In Ankara,
city center or CBD have most part of employment in its body and residential areas
developed around the CBD. So, most people have to commute between their home
and workplace creating high transportation demand directed to downtown.
Jobs-housing imbalance in Ankara
As mentioned above, Ankara does not seem to be successful about creating mixed
use, self-contained communities. The Table 3.14, which shows employment and
workforce values and jobs to housing ratios associated with numbered district,
172
supports this statement. Hereby, the workforce refers housing unit and employment
refers available jobs in the district. Then, dividing employment by workforce, jobs to
housing ratio is obtained.
Margolis (1973) suggest that when jobs to housing ratio units lay within interval of
0.75 to 1.25, communities have acceptable balance ratio. From this point, to achieve
general idea in terms of jobs-housing balance, values which are within the interval of
0.75 to 1.25 are identified with bold box in Table 3.14 and district number versus
jobs to housing ratios is plotted. As seen from graph, only several districts are in the
acceptable level1 (Figure 3.14). Map 3.10 depicts the numbered districts given in
Table 3.14.
1 The area selected to calculate jobs-housing ratios should be determined so as to reflect features of region. Because too large or too small areas may not feature the properties of the region in terms of land use. Considering this note, jobs-housing ratios given in the Table 3.14 only give an idea about jobs-housing balance of the 99 districts of Ankara.
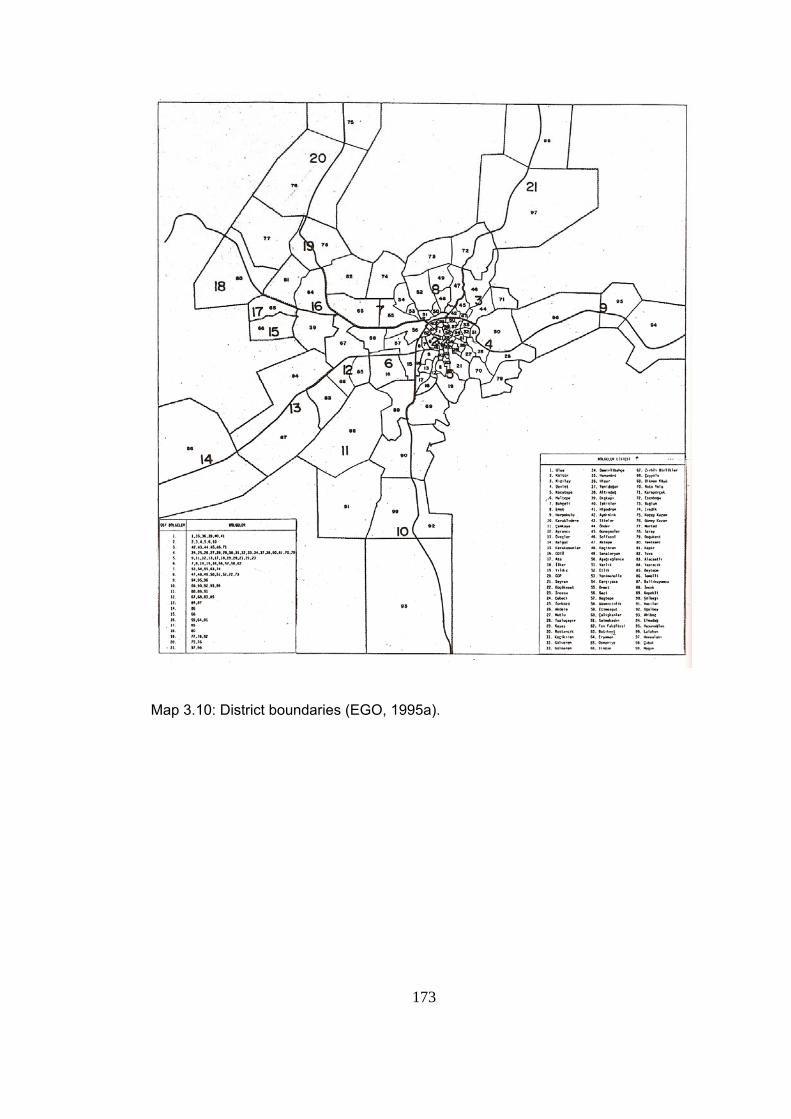
173
Map 3.10: District boundaries (EGO, 1995a).
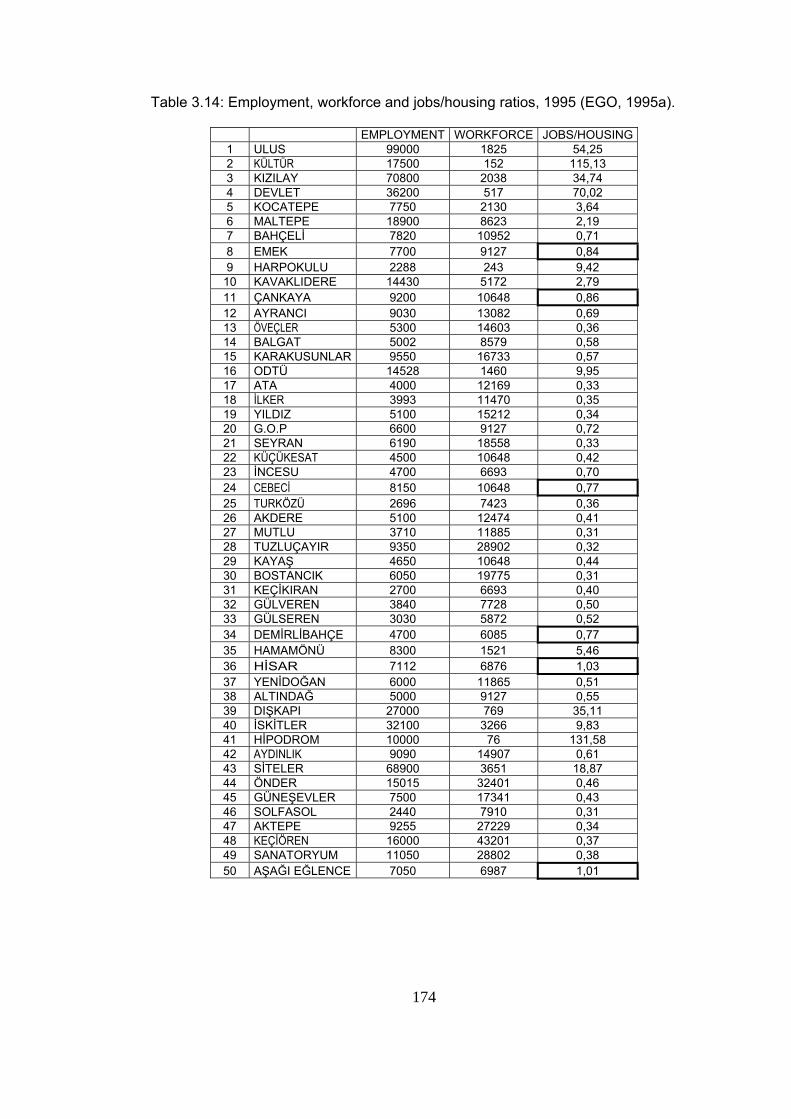
174
Table 3.14: Employment, workforce and jobs/housing ratios, 1995 (EGO, 1995a).
EMPLOYMENT WORKFORCE JOBS/HOUSING 1 ULUS 99000 1825 54,25 2 KÜLTÜR 17500 152 115,13 3 KIZILAY 70800 2038 34,74 4 DEVLET 36200 517 70,02 5 KOCATEPE 7750 2130 3,64 6 MALTEPE 18900 8623 2,19 7 BAHÇELİ 7820 10952 0,71 8 EMEK 7700 9127 0,84 9 HARPOKULU 2288 243 9,42
10 KAVAKLIDERE 14430 5172 2,79 11 ÇANKAYA 9200 10648 0,86 12 AYRANCI 9030 13082 0,69 13 ÖVEÇLER 5300 14603 0,36 14 BALGAT 5002 8579 0,58 15 KARAKUSUNLAR 9550 16733 0,57 16 ODTÜ 14528 1460 9,95 17 ATA 4000 12169 0,33 18 İLKER 3993 11470 0,35 19 YILDIZ 5100 15212 0,34 20 G.O.P 6600 9127 0,72 21 SEYRAN 6190 18558 0,33 22 KÜÇÜKESAT 4500 10648 0,42 23 İNCESU 4700 6693 0,70 24 CEBECİ 8150 10648 0,77 25 TURKÖZÜ 2696 7423 0,36 26 AKDERE 5100 12474 0,41 27 MUTLU 3710 11885 0,31 28 TUZLUÇAYIR 9350 28902 0,32 29 KAYAŞ 4650 10648 0,44 30 BOSTANCIK 6050 19775 0,31 31 KEÇİKIRAN 2700 6693 0,40 32 GÜLVEREN 3840 7728 0,50 33 GÜLSEREN 3030 5872 0,52 34 DEMİRLİBAHÇE 4700 6085 0,77 35 HAMAMÖNÜ 8300 1521 5,46 36 HİSAR 7112 6876 1,03 37 YENİDOĞAN 6000 11865 0,51 38 ALTINDAĞ 5000 9127 0,55 39 DIŞKAPI 27000 769 35,11 40 İSKİTLER 32100 3266 9,83 41 HİPODROM 10000 76 131,58 42 AYDINLIK 9090 14907 0,61 43 SİTELER 68900 3651 18,87 44 ÖNDER 15015 32401 0,46 45 GÜNEŞEVLER 7500 17341 0,43 46 SOLFASOL 2440 7910 0,31 47 AKTEPE 9255 27229 0,34 48 KEÇİÖREN 16000 43201 0,37 49 SANATORYUM 11050 28802 0,38 50 AŞAĞI EĞLENCE 7050 6987 1,01
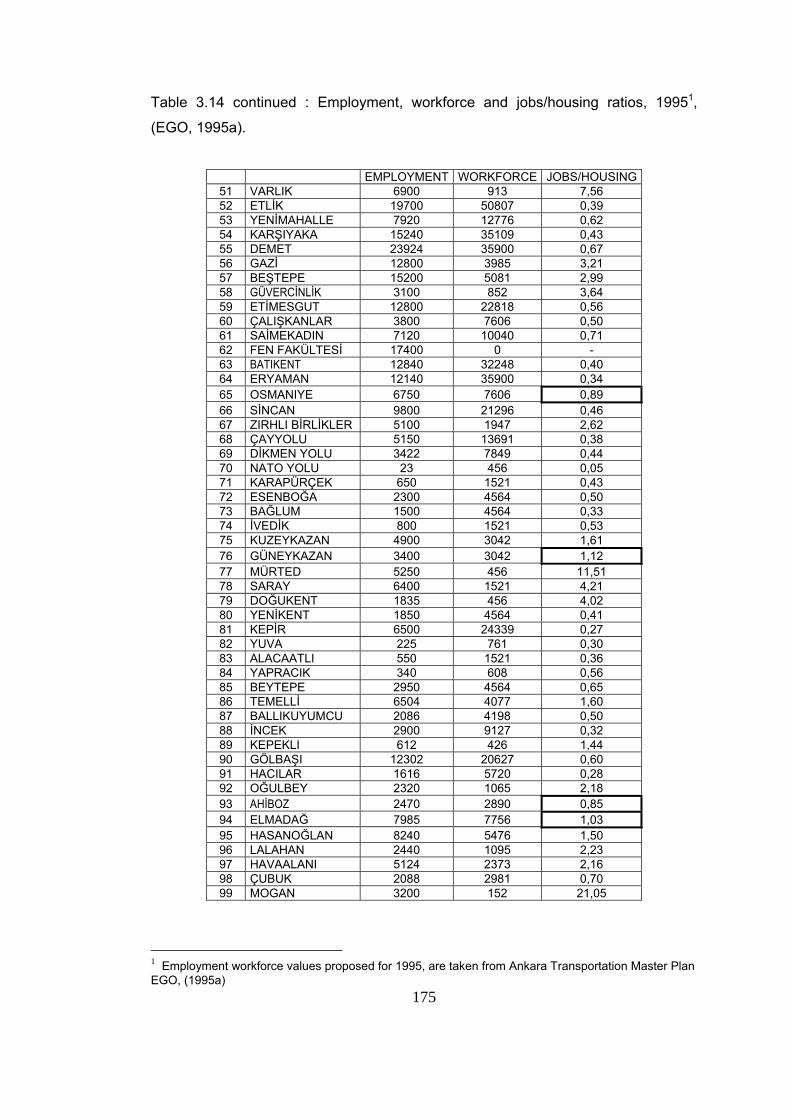
175
Table 3.14 continued : Employment, workforce and jobs/housing ratios, 19951,
(EGO, 1995a).
EMPLOYMENT WORKFORCE JOBS/HOUSING
51 VARLIK 6900 913 7,56 52 ETLİK 19700 50807 0,39 53 YENİMAHALLE 7920 12776 0,62 54 KARŞIYAKA 15240 35109 0,43 55 DEMET 23924 35900 0,67 56 GAZİ 12800 3985 3,21 57 BEŞTEPE 15200 5081 2,99 58 GÜVERCİNLİK 3100 852 3,64 59 ETİMESGUT 12800 22818 0,56 60 ÇALIŞKANLAR 3800 7606 0,50 61 SAİMEKADIN 7120 10040 0,71 62 FEN FAKÜLTESİ 17400 0 - 63 BATIKENT 12840 32248 0,40 64 ERYAMAN 12140 35900 0,34 65 OSMANIYE 6750 7606 0,89 66 SİNCAN 9800 21296 0,46 67 ZIRHLI BİRLİKLER 5100 1947 2,62 68 ÇAYYOLU 5150 13691 0,38 69 DİKMEN YOLU 3422 7849 0,44 70 NATO YOLU 23 456 0,05 71 KARAPÜRÇEK 650 1521 0,43 72 ESENBOĞA 2300 4564 0,50 73 BAĞLUM 1500 4564 0,33 74 İVEDİK 800 1521 0,53 75 KUZEYKAZAN 4900 3042 1,61 76 GÜNEYKAZAN 3400 3042 1,12 77 MÜRTED 5250 456 11,51 78 SARAY 6400 1521 4,21 79 DOĞUKENT 1835 456 4,02 80 YENİKENT 1850 4564 0,41 81 KEPİR 6500 24339 0,27 82 YUVA 225 761 0,30 83 ALACAATLI 550 1521 0,36 84 YAPRACIK 340 608 0,56 85 BEYTEPE 2950 4564 0,65 86 TEMELLİ 6504 4077 1,60 87 BALLIKUYUMCU 2086 4198 0,50 88 İNCEK 2900 9127 0,32 89 KEPEKLI 612 426 1,44 90 GÖLBAŞI 12302 20627 0,60 91 HACILAR 1616 5720 0,28 92 OĞULBEY 2320 1065 2,18 93 AHİBOZ 2470 2890 0,85 94 ELMADAĞ 7985 7756 1,03 95 HASANOĞLAN 8240 5476 1,50 96 LALAHAN 2440 1095 2,23 97 HAVAALANI 5124 2373 2,16 98 ÇUBUK 2088 2981 0,70 99 MOGAN 3200 152 21,05
1 Employment workforce values proposed for 1995, are taken from Ankara Transportation Master Plan EGO, (1995a)
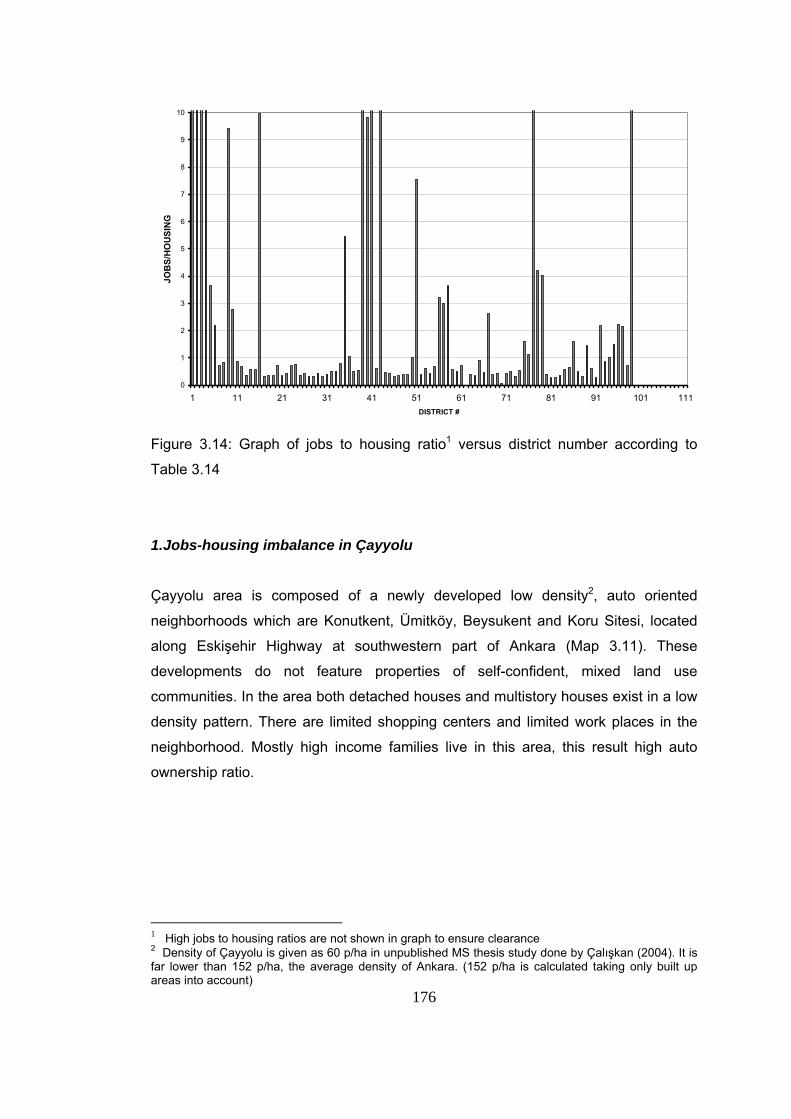
176
0
1
2
3
4
5
6
7
8
9
10
1 11 21 31 41 51 61 71 81 91 101 111DISTRICT #
JOB
S/H
OU
SIN
G
Figure 3.14: Graph of jobs to housing ratio1 versus district number according to
Table 3.14
1.Jobs-housing imbalance in Çayyolu
Çayyolu area is composed of a newly developed low density2, auto oriented
neighborhoods which are Konutkent, Ümitköy, Beysukent and Koru Sitesi, located
along Eskişehir Highway at southwestern part of Ankara (Map 3.11). These
developments do not feature properties of self-confident, mixed land use
communities. In the area both detached houses and multistory houses exist in a low
density pattern. There are limited shopping centers and limited work places in the
neighborhood. Mostly high income families live in this area, this result high auto
ownership ratio.
1 High jobs to housing ratios are not shown in graph to ensure clearance 2 Density of Çayyolu is given as 60 p/ha in unpublished MS thesis study done by Çalışkan (2004). It is far lower than 152 p/ha, the average density of Ankara. (152 p/ha is calculated taking only built up areas into account)
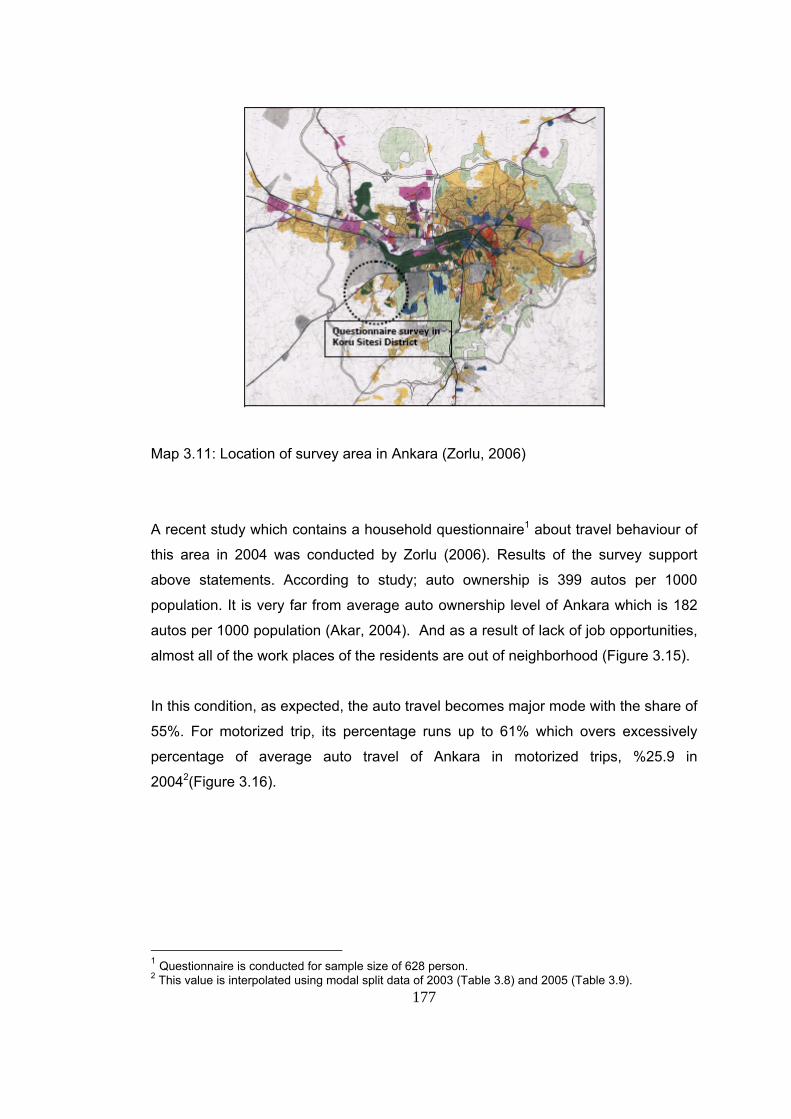
177
Map 3.11: Location of survey area in Ankara (Zorlu, 2006)
A recent study which contains a household questionnaire1 about travel behaviour of
this area in 2004 was conducted by Zorlu (2006). Results of the survey support
above statements. According to study; auto ownership is 399 autos per 1000
population. It is very far from average auto ownership level of Ankara which is 182
autos per 1000 population (Akar, 2004). And as a result of lack of job opportunities,
almost all of the work places of the residents are out of neighborhood (Figure 3.15).
In this condition, as expected, the auto travel becomes major mode with the share of
55%. For motorized trip, its percentage runs up to 61% which overs excessively
percentage of average auto travel of Ankara in motorized trips, %25.9 in
20042(Figure 3.16).
1 Questionnaire is conducted for sample size of 628 person. 2 This value is interpolated using modal split data of 2003 (Table 3.8) and 2005 (Table 3.9).
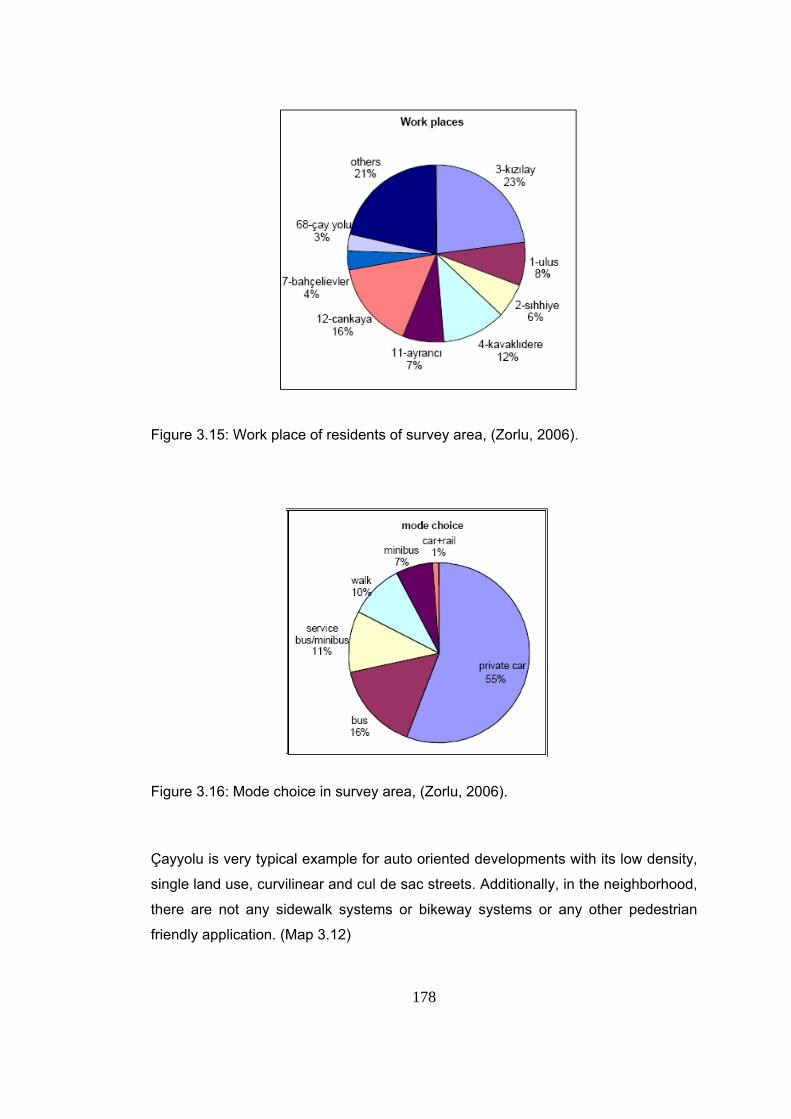
178
Figure 3.15: Work place of residents of survey area, (Zorlu, 2006).
Figure 3.16: Mode choice in survey area, (Zorlu, 2006).
Çayyolu is very typical example for auto oriented developments with its low density,
single land use, curvilinear and cul de sac streets. Additionally, in the neighborhood,
there are not any sidewalk systems or bikeway systems or any other pedestrian
friendly application. (Map 3.12)
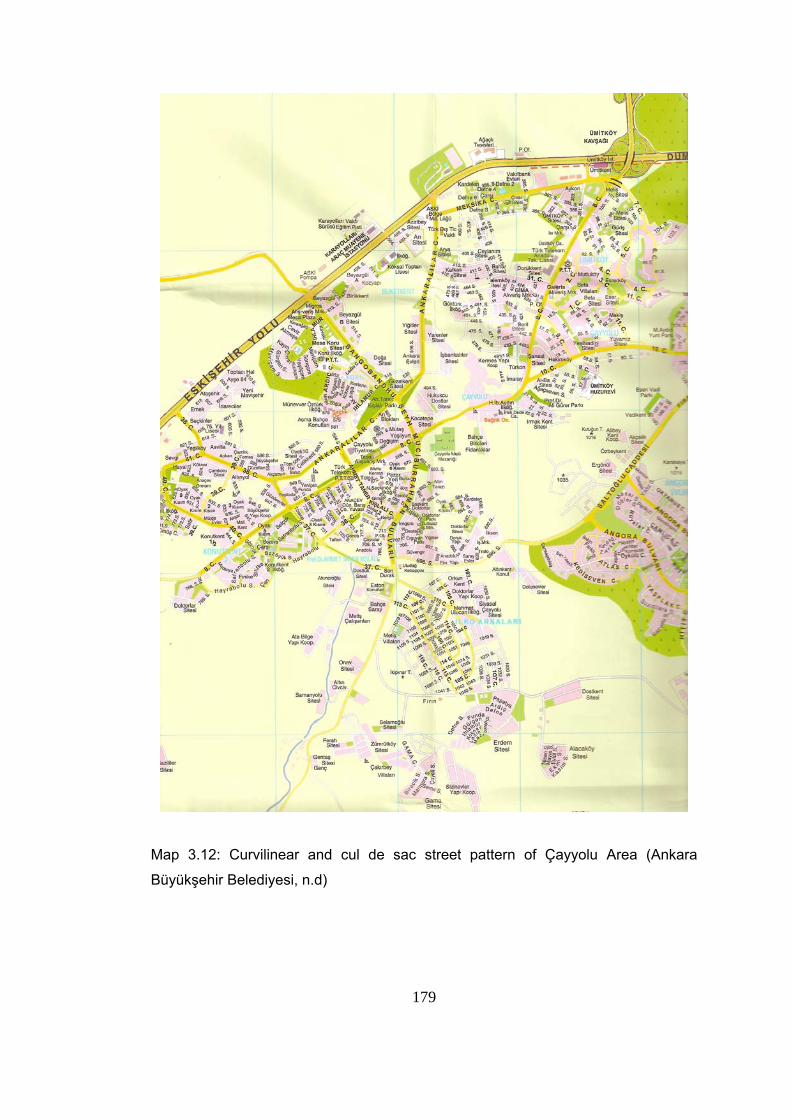
179
Map 3.12: Curvilinear and cul de sac street pattern of Çayyolu Area (Ankara
Büyükşehir Belediyesi, n.d)
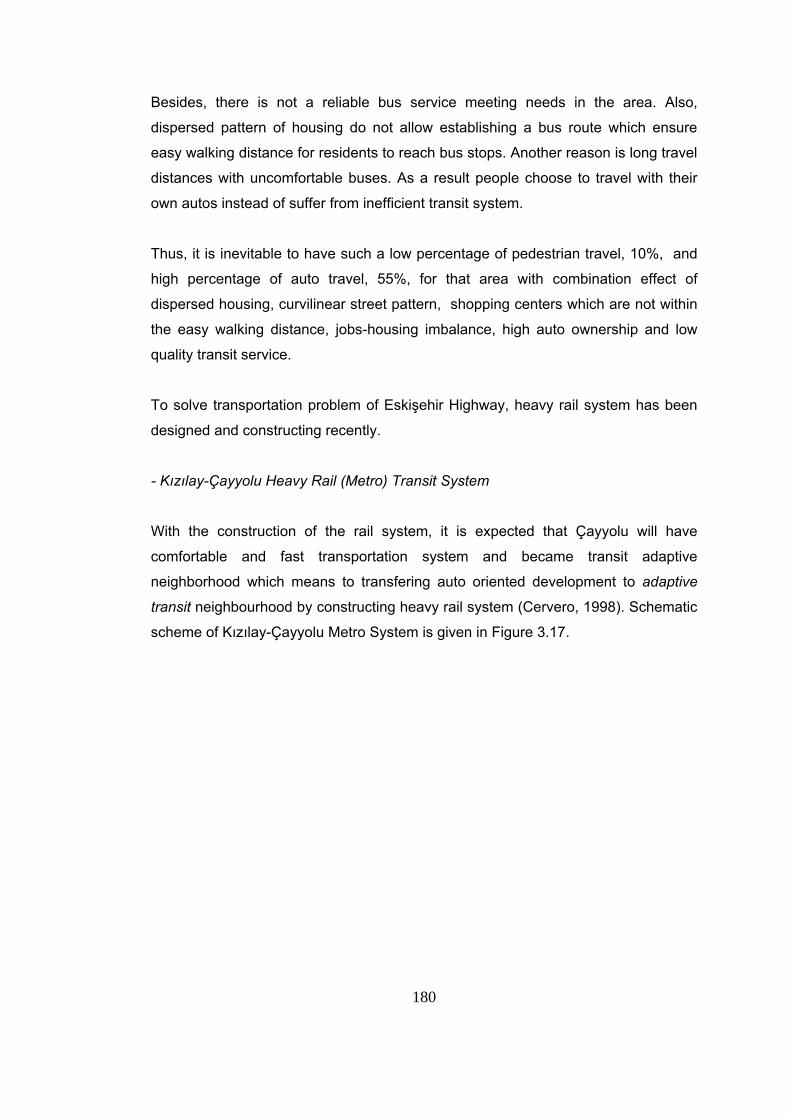
180
Besides, there is not a reliable bus service meeting needs in the area. Also,
dispersed pattern of housing do not allow establishing a bus route which ensure
easy walking distance for residents to reach bus stops. Another reason is long travel
distances with uncomfortable buses. As a result people choose to travel with their
own autos instead of suffer from inefficient transit system.
Thus, it is inevitable to have such a low percentage of pedestrian travel, 10%, and
high percentage of auto travel, 55%, for that area with combination effect of
dispersed housing, curvilinear street pattern, shopping centers which are not within
the easy walking distance, jobs-housing imbalance, high auto ownership and low
quality transit service.
To solve transportation problem of Eskişehir Highway, heavy rail system has been
designed and constructing recently.
- Kızılay-Çayyolu Heavy Rail (Metro) Transit System
With the construction of the rail system, it is expected that Çayyolu will have
comfortable and fast transportation system and became transit adaptive
neighborhood which means to transfering auto oriented development to adaptive
transit neighbourhood by constructing heavy rail system (Cervero, 1998). Schematic
scheme of Kızılay-Çayyolu Metro System is given in Figure 3.17.
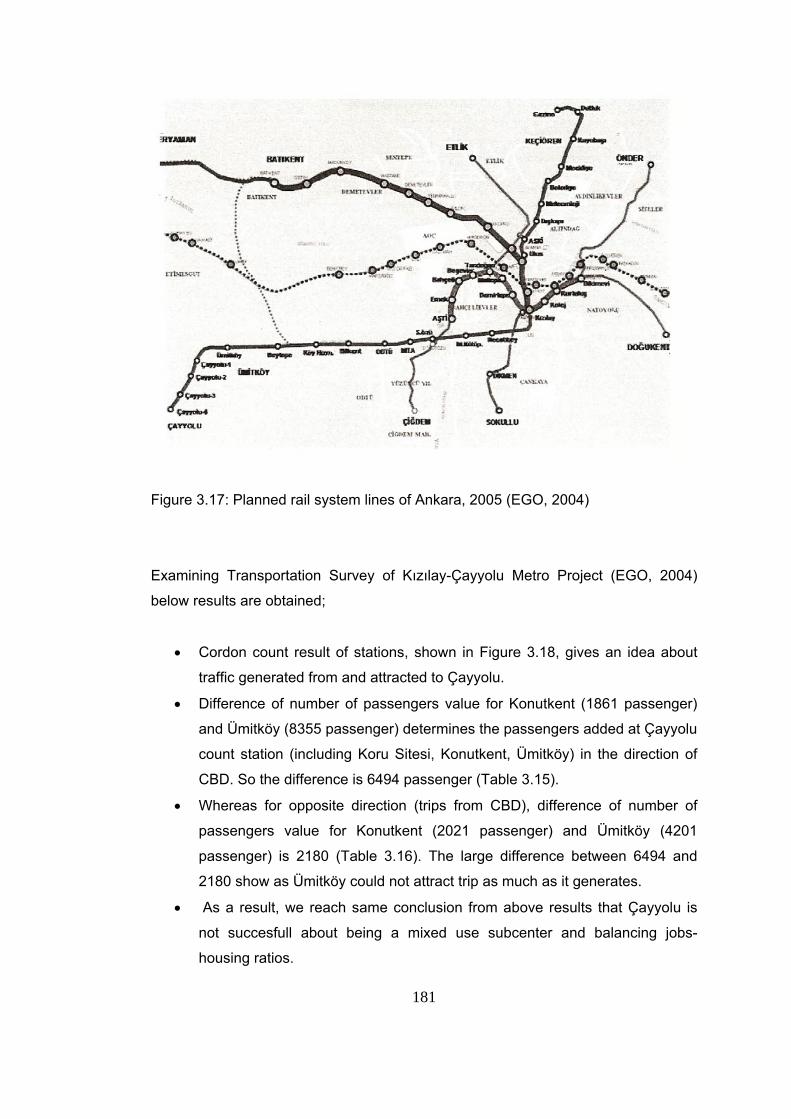
181
Figure 3.17: Planned rail system lines of Ankara, 2005 (EGO, 2004)
Examining Transportation Survey of Kızılay-Çayyolu Metro Project (EGO, 2004)
below results are obtained;
• Cordon count result of stations, shown in Figure 3.18, gives an idea about
traffic generated from and attracted to Çayyolu.
• Difference of number of passengers value for Konutkent (1861 passenger)
and Ümitköy (8355 passenger) determines the passengers added at Çayyolu
count station (including Koru Sitesi, Konutkent, Ümitköy) in the direction of
CBD. So the difference is 6494 passenger (Table 3.15).
• Whereas for opposite direction (trips from CBD), difference of number of
passengers value for Konutkent (2021 passenger) and Ümitköy (4201
passenger) is 2180 (Table 3.16). The large difference between 6494 and
2180 show as Ümitköy could not attract trip as much as it generates.
• As a result, we reach same conclusion from above results that Çayyolu is
not succesfull about being a mixed use subcenter and balancing jobs-
housing ratios.
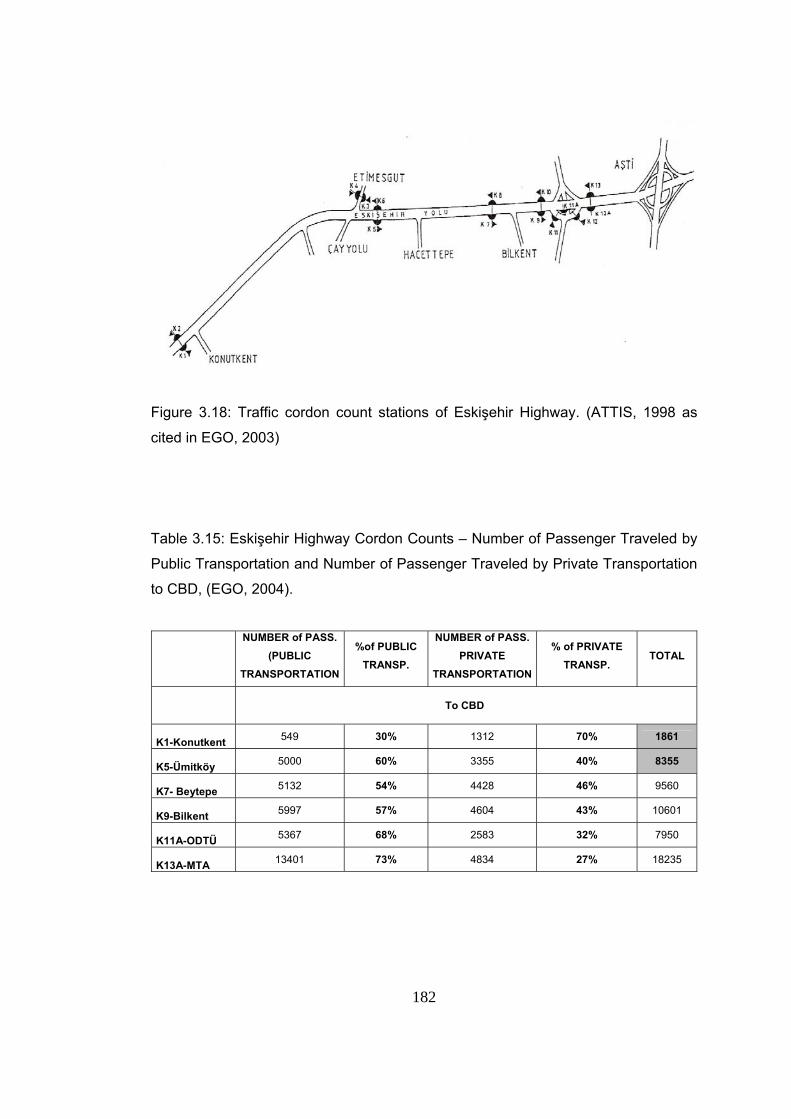
182
Figure 3.18: Traffic cordon count stations of Eskişehir Highway. (ATTIS, 1998 as
cited in EGO, 2003)
Table 3.15: Eskişehir Highway Cordon Counts – Number of Passenger Traveled by
Public Transportation and Number of Passenger Traveled by Private Transportation
to CBD, (EGO, 2004).
NUMBER of PASS. (PUBLIC
TRANSPORTATION
%of PUBLIC TRANSP.
NUMBER of PASS. PRIVATE
TRANSPORTATION
% of PRIVATE TRANSP.
TOTAL
To CBD
K1-Konutkent 549 30% 1312 70% 1861
K5-Ümitköy 5000 60% 3355 40% 8355
K7- Beytepe 5132 54% 4428 46% 9560
K9-Bilkent 5997 57% 4604 43% 10601
K11A-ODTÜ 5367 68% 2583 32% 7950
K13A-MTA 13401 73% 4834 27% 18235
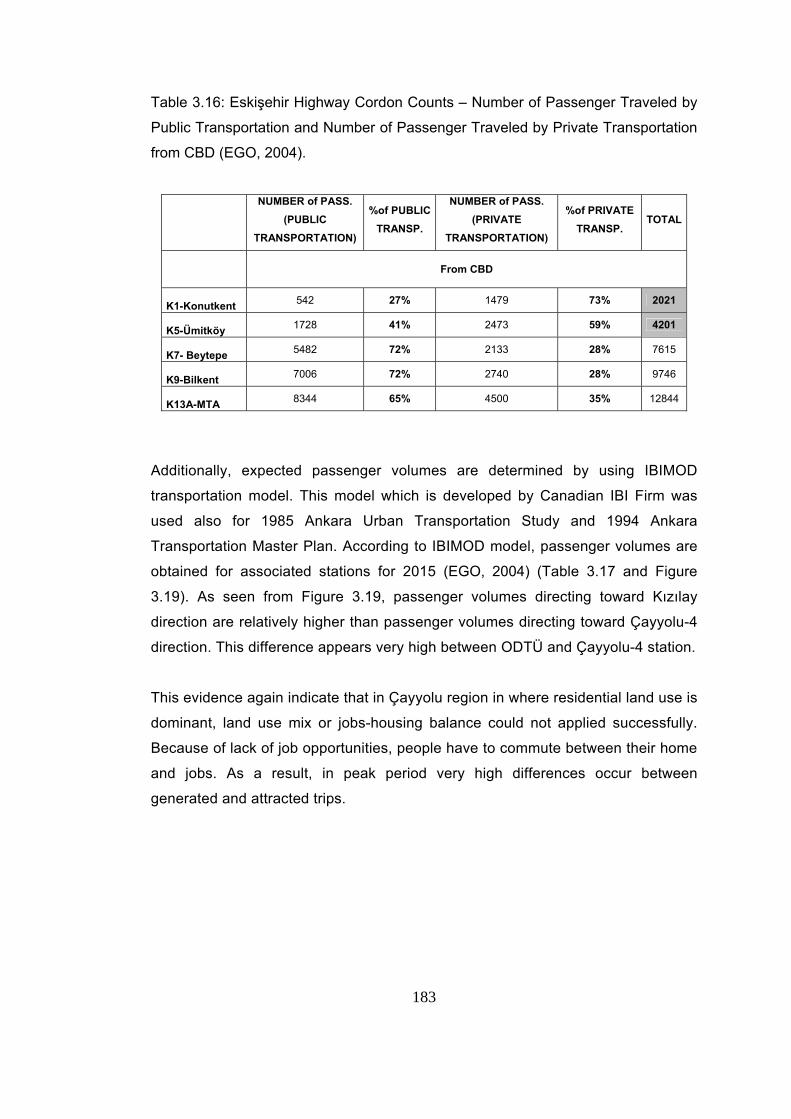
183
Table 3.16: Eskişehir Highway Cordon Counts – Number of Passenger Traveled by
Public Transportation and Number of Passenger Traveled by Private Transportation
from CBD (EGO, 2004).
NUMBER of PASS. (PUBLIC
TRANSPORTATION)
%of PUBLIC TRANSP.
NUMBER of PASS. (PRIVATE
TRANSPORTATION)
%of PRIVATE TRANSP.
TOTAL
From CBD
K1-Konutkent 542 27% 1479 73% 2021
K5-Ümitköy 1728 41% 2473 59% 4201
K7- Beytepe 5482 72% 2133 28% 7615
K9-Bilkent 7006 72% 2740 28% 9746
K13A-MTA 8344 65% 4500 35% 12844
Additionally, expected passenger volumes are determined by using IBIMOD
transportation model. This model which is developed by Canadian IBI Firm was
used also for 1985 Ankara Urban Transportation Study and 1994 Ankara
Transportation Master Plan. According to IBIMOD model, passenger volumes are
obtained for associated stations for 2015 (EGO, 2004) (Table 3.17 and Figure
3.19). As seen from Figure 3.19, passenger volumes directing toward Kızılay
direction are relatively higher than passenger volumes directing toward Çayyolu-4
direction. This difference appears very high between ODTÜ and Çayyolu-4 station.
This evidence again indicate that in Çayyolu region in where residential land use is
dominant, land use mix or jobs-housing balance could not applied successfully.
Because of lack of job opportunities, people have to commute between their home
and jobs. As a result, in peak period very high differences occur between
generated and attracted trips.
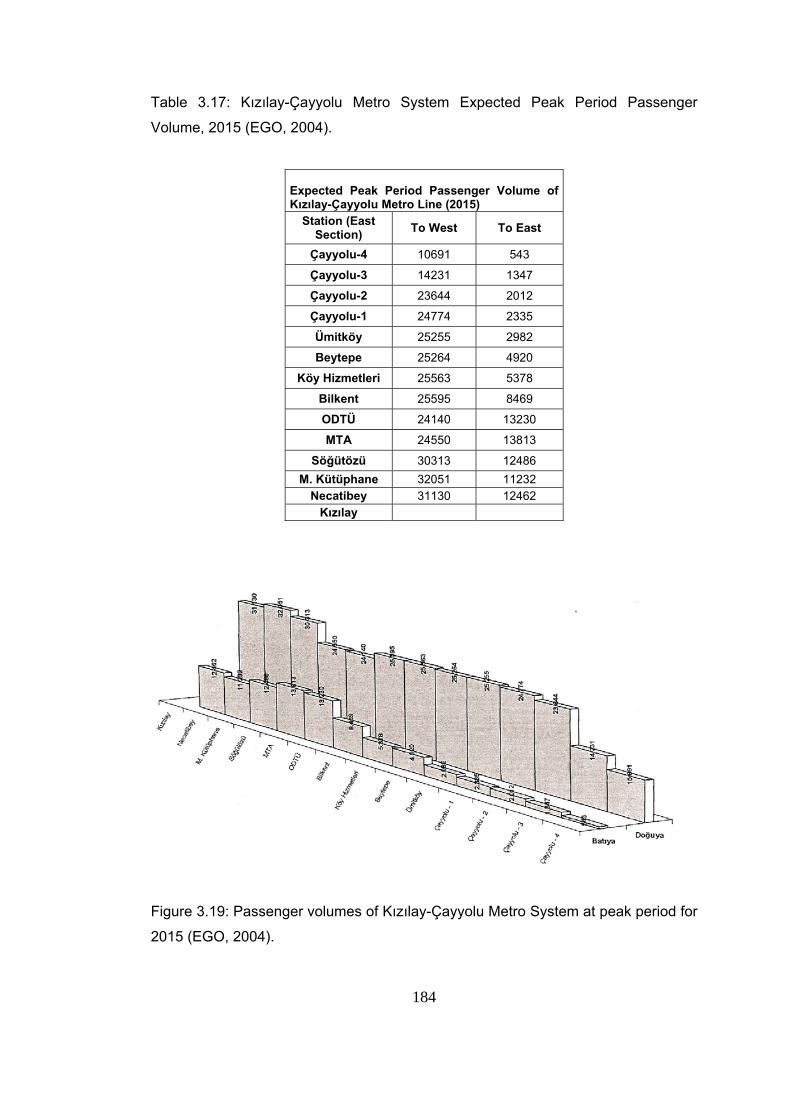
184
Table 3.17: Kızılay-Çayyolu Metro System Expected Peak Period Passenger
Volume, 2015 (EGO, 2004).
Expected Peak Period Passenger Volume of Kızılay-Çayyolu Metro Line (2015)
Station (East Section) To West To East
Çayyolu-4 10691 543
Çayyolu-3 14231 1347
Çayyolu-2 23644 2012
Çayyolu-1 24774 2335
Ümitköy 25255 2982
Beytepe 25264 4920
Köy Hizmetleri 25563 5378
Bilkent 25595 8469
ODTÜ 24140 13230
MTA 24550 13813
Söğütözü 30313 12486 M. Kütüphane 32051 11232
Necatibey 31130 12462 Kızılay
Figure 3.19: Passenger volumes of Kızılay-Çayyolu Metro System at peak period for
2015 (EGO, 2004).
185
Suggestions for Çayyolu Area
In Çayyolu area, job opportunities should be provided to create jobs-housing
balance by means of which travel distances reduce and also balanced passenger
volumes can be obtained in metro system attracting trips to area. Retail shops
should be provided within easy walking distance as many as possible to decrease
auto travel.
Furthermore, pedestrian conditions should be improved providing sidewalk system
and applying traffic calming to discourage auto travel. A bikeway is also required in
Çayyolu especially after completion of metro project, cycling can be a reasonable
mode for students to access rail station.
2. Jobs-housing imbalance at Keçiören
Keçiören is a compact, high density residential area and it reachs satisfaction point
in terms of density. In the Keçiören, there are a few small scale public organization
and some retail activities. Large production plants or large scale public organizations
do not exist in the area. So, Keçiören could not achieve being mixed use subcenter.
As a result of this features, in peak periods high amount of work travel demand
occur to CBD, whereas low amount of trips directed to Keçiören in morning peak,
therefore unbalanced traffic volumes come out in peak periods (EGO, 2005b).
In peak period, high percentage of travel demand is met by public transportation, but
existing public transportation system which is provided by bus, dolmus, public
services etc. is not sufficient for such a high demand (Table 3.18). For instance,
EGO buses carries 87.7 passenger in average to CBD, in spite of the fact that
maximum passenger for standart buses is determined as 75 passenger /bus in
Transportation Master Plan (EGO, 1995a; EGO, 2005b).
For solving transportation problems, heavy rail system (metro) has been designed
and constructing recently between Tandoğan-Keçiören (Figure 3.17).
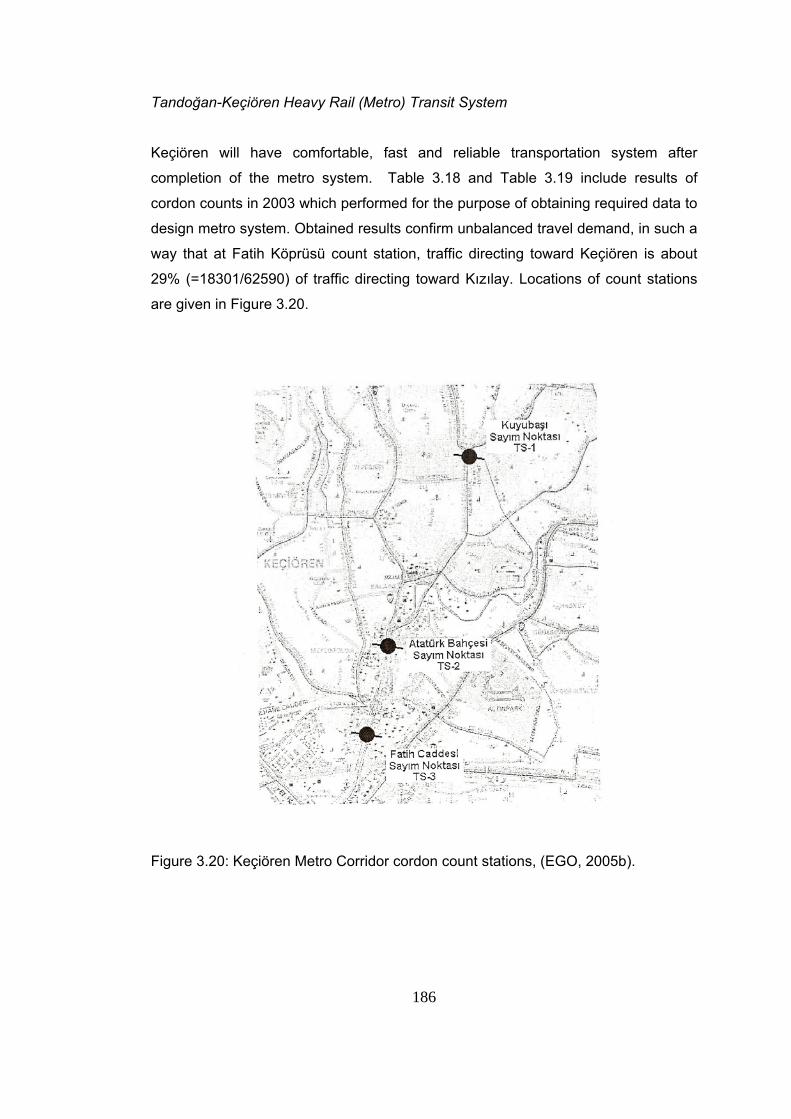
186
Tandoğan-Keçiören Heavy Rail (Metro) Transit System
Keçiören will have comfortable, fast and reliable transportation system after
completion of the metro system. Table 3.18 and Table 3.19 include results of
cordon counts in 2003 which performed for the purpose of obtaining required data to
design metro system. Obtained results confirm unbalanced travel demand, in such a
way that at Fatih Köprüsü count station, traffic directing toward Keçiören is about
29% (=18301/62590) of traffic directing toward Kızılay. Locations of count stations
are given in Figure 3.20.
Figure 3.20: Keçiören Metro Corridor cordon count stations, (EGO, 2005b).
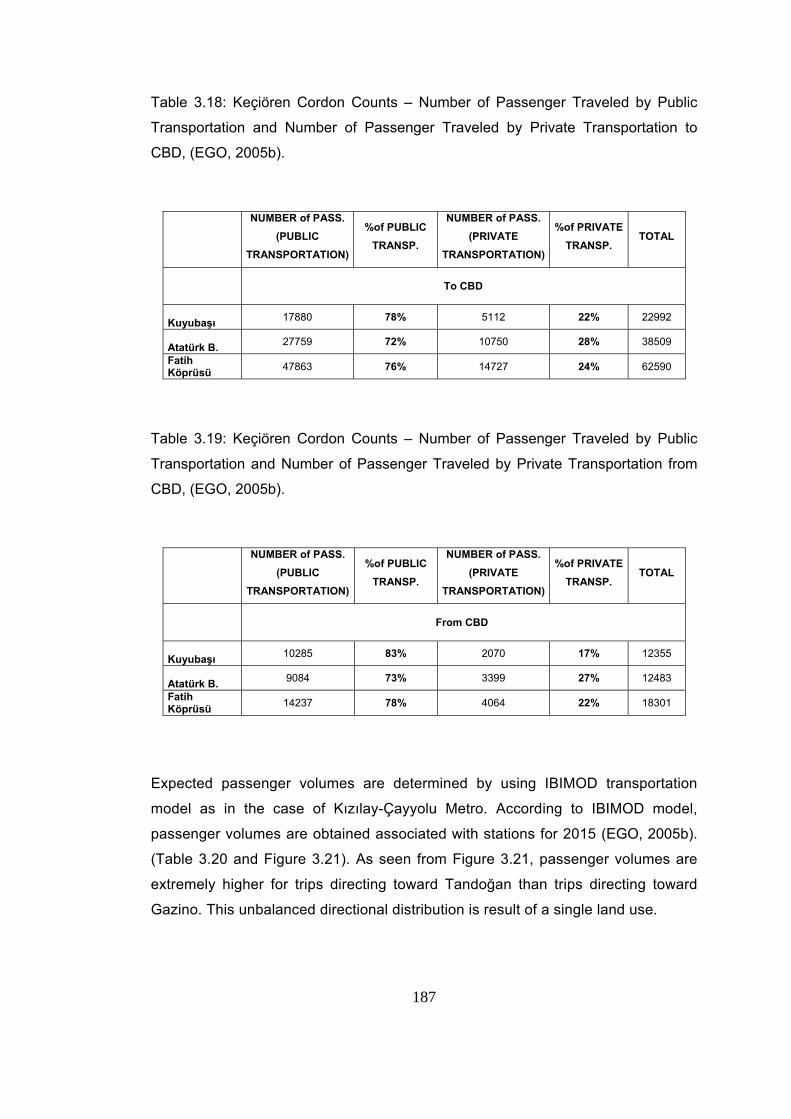
187
Table 3.18: Keçiören Cordon Counts – Number of Passenger Traveled by Public
Transportation and Number of Passenger Traveled by Private Transportation to
CBD, (EGO, 2005b).
NUMBER of PASS. (PUBLIC
TRANSPORTATION)
%of PUBLIC TRANSP.
NUMBER of PASS. (PRIVATE
TRANSPORTATION)
%of PRIVATE TRANSP.
TOTAL
To CBD
Kuyubaşı 17880 78% 5112 22% 22992
Atatürk B. 27759 72% 10750 28% 38509
Fatih Köprüsü 47863 76% 14727 24% 62590
Table 3.19: Keçiören Cordon Counts – Number of Passenger Traveled by Public
Transportation and Number of Passenger Traveled by Private Transportation from
CBD, (EGO, 2005b).
NUMBER of PASS. (PUBLIC
TRANSPORTATION)
%of PUBLIC TRANSP.
NUMBER of PASS. (PRIVATE
TRANSPORTATION)
%of PRIVATE TRANSP.
TOTAL
From CBD
Kuyubaşı 10285 83% 2070 17% 12355
Atatürk B. 9084 73% 3399 27% 12483
Fatih Köprüsü 14237 78% 4064 22% 18301
Expected passenger volumes are determined by using IBIMOD transportation
model as in the case of Kızılay-Çayyolu Metro. According to IBIMOD model,
passenger volumes are obtained associated with stations for 2015 (EGO, 2005b).
(Table 3.20 and Figure 3.21). As seen from Figure 3.21, passenger volumes are
extremely higher for trips directing toward Tandoğan than trips directing toward
Gazino. This unbalanced directional distribution is result of a single land use.
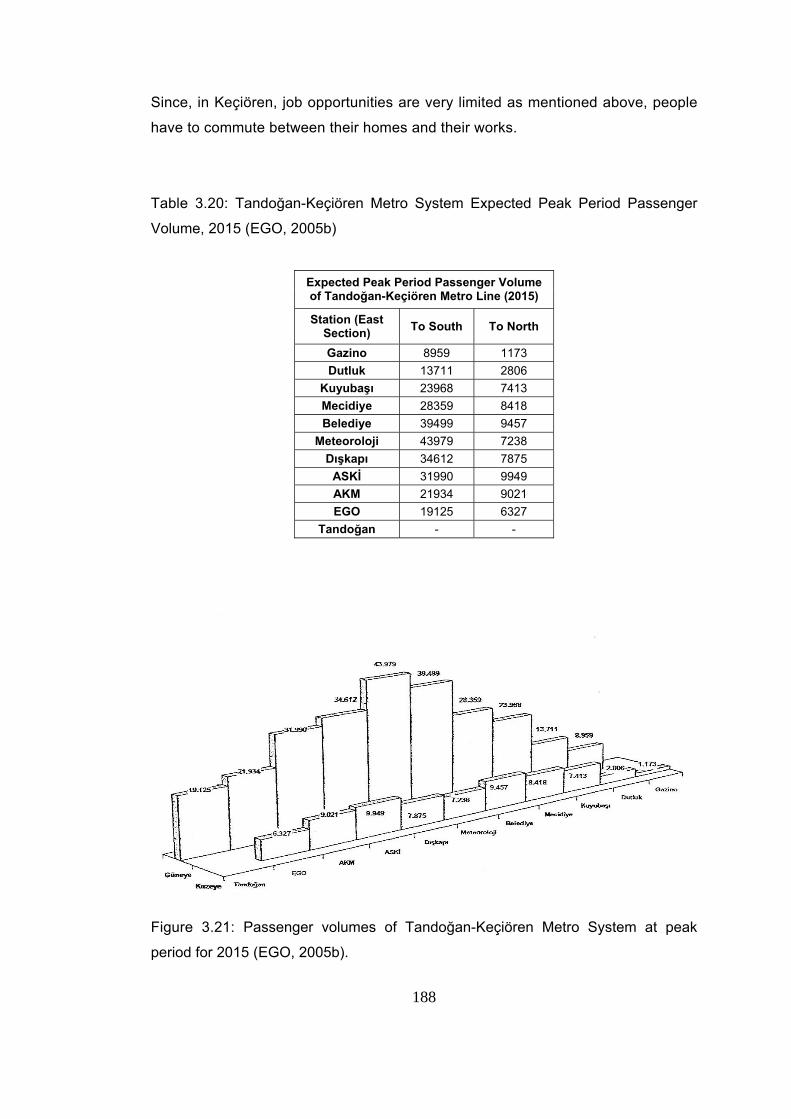
188
Since, in Keçiören, job opportunities are very limited as mentioned above, people
have to commute between their homes and their works.
Table 3.20: Tandoğan-Keçiören Metro System Expected Peak Period Passenger
Volume, 2015 (EGO, 2005b)
Expected Peak Period Passenger Volume of Tandoğan-Keçiören Metro Line (2015)
Station (East Section) To South To North
Gazino 8959 1173 Dutluk 13711 2806
Kuyubaşı 23968 7413 Mecidiye 28359 8418 Belediye 39499 9457
Meteoroloji 43979 7238 Dışkapı 34612 7875
ASKİ 31990 9949 AKM 21934 9021 EGO 19125 6327
Tandoğan - -
Figure 3.21: Passenger volumes of Tandoğan-Keçiören Metro System at peak
period for 2015 (EGO, 2005b).
189
Suggestions for Keçiören
Creating new job opportunities in the Keçiören is compulsory to reduce passenger
volume directing toward CBD. Considering compact form of Keçiören, arranging
parking areas near rail station is difficult, so feeder bus system and pedestrian
travel will be dominant to access rail station. To encourage pedestrian travel, a
pedestrian friendly environment should be ensured applying traffic calming,
designing pedestrian crossings, creating pedestrian only zones and integrating
these zones with rail stations.
190
CHAPTER 4
SUMMARY AND CONCLUSIONS
The link between land use and transportation Transportation need comes out as a result of need to join activities of people. So,
locational arrangements of activities, namely land use determines the travel
patterns. At the same time, transportation facilities can direct or change land use.
This interaction between land use and transportation creates a continious cyclic
process. In such a way that first land use create transportation demand, after that
transportation facilities are added to the system, then this system increase
accessibility and dependently stimulate more transportation demand. So
transportation facilities become insufficient and needs to develope.
Land use factors affecting transportation system
This study aims to determine land use impacts on transportation so as to identify
which land use pattern causes which result. Investigating literature about land use
impacts on transportation from various perspectives, which are density, land use
mix, jobs-housing balance, street design, transit accessibility, general findings are
obtained.
Density
Density or compactness which means number of person or employment in a
particular area is one of the basic determinants of travel behaviour. High density
minimizes travel distances and consequently increases accessibility of area. In
addition, high density is essential for efficient urban public transportation because
required high level of ridership is provided by means of densely populated areas.
Besides these advantages, in dense areas, auto ownership levels are lower than in
relatively low density areas because of scarcity of areas devoted parking.
Dependently, short travel distances cause an increase in share of nonmotorized
191
modes in modal split and also ability to supply efficient transit system increases
usage of public transportation modes such as buses and rail systems in high density
areas. As a result of higher usage of nonauto modes, energy consumption and
vehicle miles of travel decreases for compact areas.
Land use mix
Another determinant of travel behavior is land use mix which means clustering
different land uses such as residential, office, retail etc. within an area. Land use mix
can occur vertically or horizontally. Vertical land use mix is applied in buildings
devoting floors of building to different land uses, for instance, first floors are
generally used for retail activities and upper floors are used as a residential units or
office. Horizontal land use mix clusters different land uses horizontally different from
vertical land use mix.
Land use mix gives opportunity to people for making different activities in short
distances. So, travel distances decrease and nonmotorized modes become
convenient or prevailing mode. This result a decrese in number of vehicular trips,
total vehicle miles traveled and travel time.
Studies about mixed land use effect on travel behavior in suburban workplaces also
indicates that mixed land uses encourages transit trips and reduces auto trips
providing nearby opportunities for lunch time activities. Single land use creates high
trip demands in peak periods, whereas mixed land use spreads trips more evenly
throughout the day and creates bidirectional flow of traffic in peak periods facilitating
efficient usage of infrastructure. Mixed land use also enables shared parking and
ridesharing.
Jobs-housing balance
Creating jobs-housing balance in communities is one of the main purposes of mixed
land uses. Jobs-housing balance keeps drivers from joining through traffic providing
job opportunities near residential areas.
Shortened trip distances encourage people to use nonmotorized trips.
Consequently, congestion, vehicle kilometers traveled, energy consumption and the
emission of vehicle pollutants decrease.
192
Street patterns
Street pattern is one another factor affecting travel behavior. If historical period is
investigated, it is seen that there is an evolution of street pattern from gridiron to cul
de sac. In traditional or neotraditional developments grid patterns which are highly
connected, dense, street patterns are used whereas in conventional suburban
developments poorly connected hierarchical road system is used with many cul de
sacs. This increases the travel distances, creates higher traffic volumes channeling
traffic onto arterials, and does not offer pedestrian friendly environment because of
larger block size and indirect routes.
However, grid pattern offer more direct routes with small block size and shorter
travel distances. As a result of small block size the number of intersection increases,
more frequent intersections offer more left turn opportunity and also cause drivers to
slow down. All of these features, lower speed, shorter travel distances, more direct
routes create pedestrian friendly environment.
Besides these, grid pattern gives opportunity to driver not to go enter arterial traffic
providing alternative routes and increase capacity of system with dense street
pattern.
Additionally, grid pattern is more convenient for transit use because transit stops are
more accessible from neighborhoods and for town center development; grid pattern
is more suitable than strip developments along arterial roads.
Access management
Access management is a tool to increase performance of street networks. It is
defined as an effort which ensures efficient and safe flow of traffic while providing
access to desired land. Access management tries to limit number of conflict points,
to seperate conflict points, to seperate turning vehicles from through traffic, to
ensure hierarchy of road network and to limit direct access to arterial roads. Shortly,
access management causes an increase in capacity and safety.
193
Transit accessibility
Last item of literature survey is transit accessibility. Transit oriented development or
transit villages are examined to define transit accessibility. Transit oriented
development means facilitating public transportation through transit supportive
design. Outcoming problems of auto travel such as traffic congestion, air pollution
and high energy consumption etc. strengthen the tendency of using mass transit.
According to examined studies, compact and high density land uses are essential to
achieve transit supportive urban form. As origins and destinations spread over wide
area, possibility to access transit station or bus stops reduces; consequently
ridership level reduces, then establishing accessible and efficient transit system
becomes more difficult. As a result people choose car instead of using transit
vehicles in low density areas.
Residential density, nonresidential density and distance from downtown are
identified as determinants of effective public transportation. Hereby, residential
density and non residential density are considered as trip generator and trip attractor
respectively. Therefore, for both high residential and high nonresidential density
indicates a high transportation demand which ensure efficient public transportation.
Moreover, shorter distances between residential and nonresidential areas result in
high transit demand. Because of these reasons, compact form is desired to create
transit supportive developments. Additionaly, studies shows that an economically
strong CBD1 is essential to reach required transportation demand.
Besides high density, mixed land use is indispensable part of transit oriented
development. Mixed land use encourages people to walk instead of to drive
providing various activities together. Locating retail shops, restaurants etc. near
workplaces eliminates requirement of auto use to reach lunch time activities.
Therefore people choose public transportation because they do not need their autos
anymore.
1 Besides having high amount of non-residential floorspace, strong CBD concept also means redeveloped and pedestrianized CBD which have high travel activity in terms of transit and pedestrian travel.
194
Locating workplaces near residential units, namely creating jobs-housing balance
also degenerates auto travel and ensures bidirectional flow which offers efficient
transit service instead of one directional flow as in the case of single use regions.
Beyond being mixed and compact, form of developments affect the performance of
transportation system. Basic principle of transit oriented design is concentrating
development around bus or rail station or along transit corridors. From this point of
view, it is emphasized that compact developments with a limited number of
subcenters which are connected to strong core and each other via transit network
supports high transit ridership. Grid like street pattern is preferred for transit oriented
developments, because grid pattern increases accessibility of transit riders
minimizing distance from stations and provides efficient routes for bus travel.
Lastly, pedestrian friendly environment is essential for high transit ridership.
Provision of continuous sidewalk network, street furniture, safe pedestrian
crossings, pedestrian only zones integrated with rail stations is necessary to support
public transportation and to reach livable environment standard.
Other factors
After emphasizing that land use has very significant impact on transportation system
performance through above statements, it is necessary to indicate other factors
such as income level, gasoline price, parking prices which can support or distort
land use policies. High income level, low gasoline price and low parking cost
encourage automobile use inevitably. Consequently, it is very difficult to keep drivers
away from their cars. Because of this reason land use and transportation policies
should be implemented with reasonable pricing policies.
Another fundamental issue comes out in the planning process. Coordination
between land use planning and urban transportation planning is crucial to achieve
community in where transportation and urban form complement each other and
create efficient transportation system. Evidences from successful transit metropolis
show that integration between land use and transportation is key point to reach high
performance transit system. However, it is very difficult to ensure coordination
between parties, generally for transportation and land use, independent decision are
taken regardless of their interactive nature. So, auto oriented, low density, single
use communities are developed as in the case of many auto dependent countries.
195
Case study: Ankara
Being capital city of Türkiye, Ankara still continues to develop. However,
development of city could not be directed entirely by planning decisions in historical
period. Consequently, hybrid form of Ankara has come out. High density radial
corridors connecting at urban core represent features of adaptive city which is a type
of transit-oriented metropolises, whereas, low density, dispersed developments
represent features of adaptive transit cities which try to adapt their transit system to
serve low density dispersed areas.
When the density of Ankara is examined in historical period, it is seen that there has
been a decreasing tendency due to partial planning and unplanned development. In
world classification, the density of Ankara is very near to European average with
effects of outgrowth after 1990. As a result of urban sprawl of Ankara, an increase in
automobile travel has come out while nonmotorized travel reduces day by day due
to unconcerned behaviors of authorities.
It is worthwhile to note that Ankara has the highest level in work trips on transit
among world cities and level of work trips by walking/cycling is higher in Ankara
than many world cities by the year of 1990. Because, Ankara has three
prerequisites of cost effective and sustainable transit service which are a large
dominant center, dense residential developments and long radial corridors.
Furthermore, low income level and high gasoline price have very significant
supportive effect on high transit and walking trip rates for work trips.
In spite of these advantages, Ankara is proceeding in the way of being auto
dependent city. Although, principles of transportation master plan of Ankara
includes most of the key factors for success such as land use-transportation
integration, jobs-housing balance, creating mixed land use subcenters, CBD
redevelopment, priority to people, social equity, integration of transit
systems,pedestrianization, bus priority and so on, implementations do not support
the defined objectives or are not parallel to the plans.
196
Unplanned, auto oriented, low density, single land use developments i.e. Çayyolu,
Bilkent, İncek, Temelli, Beysukent etc. are examples of lack of land use-
transportation integration. Because, such type of developments do not allow efficient
transportation system and create long travel distances, congestion problems, air
pollution etc.
Besides these, recent applications of Greater Ankara Municipality in Ankara mostly
come out as based on auto priority. Grade separated intersections are prominent
examples of this policy. While construction of rail transit systems continues, grade
separated intersections have been constructed. This creates conflict between
goals and objectives of urban transportation planning and applications.
Another problem of Ankara which causes increase of auto travel is job-housing
imbalance. Ankara does not seem to be successful about creating mixed use, self-
contained communities considering the jobs to housing ratios associated with
neighborhoods of Ankara. Therefore, people have to commute between their homes
to CBD in where most of the job opportunities exist. Besides long commute distance
and excessive travel demand directing toward CBD, one directional traffic flows
occur during peak period along corridor connecting residential area to CBD.
Additionally, little or no effort has made for pedestrians. Some sidewalks are
converted to roads or car park. Traffic calming is not applied in areas where
pedestrian movements are high.
It can be concluded that increase in car travel seems to continue unless current
applications which favor auto travel are stopped.
Proposals for Ankara
Below proposals are offered to contribute achievement of improved transportation
system performance in Ankara.
• Land use-transportation integration must be ensured in planning and
implementation stages. Coordination between authorities and groups dealing
197
with urban transportation planning and urban planning is essential for
integration process.
• Jobs-housing balance should be tried to apply in single use, residential areas
to prevent long commute distances and one directional traffic flow at peak
periods.
• Vertical and horizontal mix of land use should be applied in new
developments in where retail activities are not in the easy walking distance.
This would decrease auto travel for shopping.
• Applications which favor auto travel such as construction of grade separated
intersections and road widening should be stopped. Otherwise, people would
prefer to use their cars instead of using transit systems available or being
constructed.
• Random decision of large shopping centers leads to increase in auto usage.
Because of this reason, they should be located near rail stations as in the
case of Akköprü Migros.
• In Ankara, bus system is still carrying vast majority of passengers as a main
bus or feeder bus. So, bus priorty regulation should be realized to encourage
operators and people for public transportation.
• Share of pedestrian travel in modal split reduces day by day in Ankara. In
city center, auto travel is supported by improper applications. However, city
center should be devoted for pedestrian travel and public transportation.
• Pedestrian friendly environment should be ensured through traffic calming
applications, reasonable pedestrian crossing, pedestrian only areas and
sidewalk network.
• For new developments, transit supportive design should be planned
considering probable extension of rail stations.
• In new developments, curvilinear and cul de sac type of street patterns
should be avoided because of the reason that these patterns support auto
travel and increase vehicle kilometers traveled. Grid street pattern should be
used when topography is convenient.
• Block size should be formed as small as possible to minimize travel
distances and to increase pedestrian travel. If small block is not possible,
pedestrian paths can be created in large block to ensure pedestrian scale.
198
REFERENCES
Ankara Büyükşehir Belediyesi, (2006), “İlçe Belediyeleri ve İlk Kademe Belediyeleri Faaliyetleri Hakkında Bilgilendirme Yayın Organı”, v.94, pp.8-9, Ankara. Ankara Büyükşehir Belediyesi,(n.d) “Ankara Kent Planı”, EGO Genel Müdürlüğü, Ankara. Akar, G. (2004). “Automobile Travel Reduction in Urban Areas and Cıty Centers, Case Study: Ankara.” (Unpublished MCP thesis), Department of Civil Engineering, Middle East Technical University, Ankara. Alba, C. A., Beimborn, E., 2004. “Relationship Between Land Use Patterns and Highway Widening”, Center for Urban Transportation Studies University of Wisconsin, Milwaukee. Altaban, Ö., 1987 “Ankara Kentsel Alanın Doğal Çevreye Yayılımı” in ODTÜ Şehir ve Bölge Planlama Bölümü Çalışma Grubu (Eds.), Ankara 1985’den 2015’e (126-148), Ankara Büyükşehir Belediyesi EGO Genel Müdürlüğü, Ankara. Ankara Büyükşehir Belediyesi, 1998. Ankara 2025. “Nazım Plan Çalışması Raporu”, Ankara Büyükşehir Belediyesi , Ankara. Babalık-Sutcliffe E., 2002. “Urban rail systems: analysis of the factors behind success” , Transport Reviews, Vol.22, No. 4, 415-447, Taylor & Francis Ltd. Boarnet, M. G. & Crane, R. (2001). “Travel by design: The influence of urban form on travel”, New York: Oxford University Press. Blunden, W. R. (1973), “The land-use/transportation system”, UK: Pergamon Press. California Department of Transportation. (2000), “Transportation System Performance Measures: Status and Prototype Report”. Ce 451, lecture, 1-1, “Transportation Problems, Urban Travel Characteristics, Goals and Objectives”, Retrieved Jan 16, 2006, from Iowa State University, Center for Transportation research and Education Web site: http://www.ctre.iastate.edu/educweb/ce451/lectures/intro /lecture.htm
199
Center for Urban Transportation Research, 1998. “Ten Ways to Manage Roadway Access in Your Community”, University of South Florida, Retrieved Mar 13, 2006, from: http://www.cutr.usf.edu/research/10ways.pdf Cervero, R., (1988). “Land-Use Mixing and Suburban Mobility”, UCTC No. 3, Transportation Quarterly, Vol. 42, No. 3, pp. 429–446, The University of California Transportation Center, University of California, Berkeley. Cervero, R., (1989), “Jobs-Housing Balancing and Regional Mobility”, UCTC No. 50, APA Journal, pp. 136-150, The University of California Transportation Center, University of California, Berkeley. Cervero, R., (1991). “Land Uses and Travel at Suburban Activity Centers”, UCTC No. 91, Transportation Quarterly, Vol. 45, No. 4, pp. 479-491, The University of California Transportation Center, University of California, Berkeley. Cervero, R. (1998). “The Transit Metropolis”, Island Press, Washington D.C Cervero, R. & Bernick, M., 1996. “Transit villages in the 21 th Century”, USA: McGraw-Hill. Cervero, R. & Kockelman, K. (1997). “Travel Demand And The 3ds: Density, Diversity, And Design”, Transportation Research D, Vol. 2, No. 3, pp. 199-219, UK: Elsevier Science Ltd. Cervero, R. & Radisch, C., 1995. “Travel Choices in Pedestrian Versus Automobile Oriented Neighborhoods”, UCTC No 281, The University of California Transportation Center, University of California, Berkeley. Cervero, R. & Zupan J., 1996a. “TCRP Project H-1,Transit and Urban Form, Commuter and light rail transit corridors: The land use connection”, Transit Cooperative Research Program, Transportation Research Board, National Research Council Cervero, R. & Zupan J., 1996b. “Transit and Urban Form, Part I: Transit, Urban Form, and the Built Environment: A Summary of Knowledge”, Transit Cooperative Research Program, Transportation Research Board, National Research Council. City of Portland Office of Transportation. (n.d), “Glossary of Transportation Terms”, Retrieved Jan 18, 2006, from http://www.portlandonline.com /shared/cfm/ image.cfm?id=86120
200
Community Planning Workshop. (2003), “Connecting Transportation & Land Use Planning: Street connectivity”, University of Oregon, Retrieved Feb 26, 2006, from http://darkwing.uoregon.edu/~cpw/projects/pdf/featured/tgm_2003/Educational%20materials/Street%20Connectivity_Brief.pdf Crane, R., 1999. “The Impacts of Urban Form on Travel: A Critical Review”, Working Paper, Lincoln Institute of Land Policy. Çalışkan, O. (2004). “Urban Compactness, A study of Ankara Urban Form”, (Unpublished MCP thesis), Department of City and Regional Planning in Urban Design, Middle East Technical University, Ankara. Çetinel, H., (n.d), “Transportation Engineering Course Notes”, METU. Deakin E. A., Homburger W. S., Bosselman P. C., Smith D. T., Beukers, B. (1989) “Residential street design and traffic control”, USA: Prentice Hall Diepen, A. V. (2000). “Trip Making and urban density: comparing British and Dutch survey data”. In Roo, G. D. & Miller, D. (Eds.). Compact cities and sustainable urban development (251-259). England: Ashgate Publishing Company Eash, R. “Incorporating Urban Design Variables in Metropolitan Planning Organizations” Travel Demand Models, Chicago Area Transportation Study. EGO, (1994). “Ankara 2015 Ulaşım Ana Planı-Ana Arazi Kullanımları”, Ankara Büyükşehir Belediyesi, EGO Genel Müdürlüğü, Ulaşım Planlama ve Raylı Sistem Dairesi Başkanlığı, Ankara. EGO, (1995a). “Ankara Ulasim Ana Plani Arastirma Raporu”, Ankara Büyüksehir Belediyesi EGO Genel Müdürlügü, Ulasim Planlama ve Rayli Sistem Dairesi Baskanligi, Ankara. EGO, (1995b). “Ankara Ulasim Ana Plani İlke Hedef ve Politikaları ve Plan Açıklama Notları”, Ankara Büyüksehir Belediyesi, EGO Genel Müdürlügü, Ulasim Planlama ve Rayli Sistem Dairesi Baskanligi, Ankara. EGO, (1995c). “1992 Ankara Ulasim Anketi Sonuç Raporu”, Ankara Büyüksehir Belediyesi, EGO Genel Müdürlügü, Ulasim Planlama ve Rayli Sistem Dairesi Baskanligi , Ankara.
201
EGO, (2004). “Kızılay-Çayyolu Raylı System Ulaşım Etüdü”, Ankara Büyüksehir Belediyesi, Ego Genel Müdürlüğü, Ankara. EGO, (2005a). “Modal split in Ankara” ,Department of Transportation Planning and Rail System, Ankara. EGO, (2005b). “Tandoğan-Keçiören Hattı Ulaşım Etüdü”, Ankara Büyüksehir Belediyesi, Ego Genel Müdürlüğü, Ankara. EGO (2006b), “Ankara Raylı Sistemler Mevcut ve Olası Hatlar Haritası”, http://www.ego.gov.tr/uprs/uprs.asp EGO and METU City and Regional Planning Department Study Group,1987 ”Ankara from 1985 to 2015 English Summary”, Municipality of Greater Ankara, General Directorate of EGO, Ankara. Federal Highway Administration, 1999, “Planning Newsletter”, Volume 4, U.S. Department of Transportation, Retrieved Jan 23, 2006, from http://www .fhwa.dot.gov /planning/fall99.htm. Fouchier, V. (2000). “The case of the Paris Region, and its urban density and mobility: What do we know? What can we do?” In Roo, G. D. & Miller, D. (Eds.). Compact cities and sustainable urban development (241-250), England: Ashgate Publishing Company. Frank, L. & Pivo, G. (1994) “The impacts of mixed use and density on the utilization of three modes of travel: the single occupant vehicle, transit, and walking”, Transportation Research Record 1466, 44—52. Handy, S. L., Boarnet, M. G., Ewing, R., Killingsworth, R. E. (2002), “How the Built Environment Affects Physical Activity Views from Urban Planning”, American Journal of Preventive Medicine; 23(2S):64 –73, Elsevier Science. Holtzclaw, J. (1994), “Using Residential Patterns and Transit To Decrease Auto Dependence and Costs”, Natural Resources Defense Council, Retrieved Jan 30, 2006, from http://www.smartgrowth.org/ library/cheers.html Iowa Department of Transportation, 2000. “Access Management Handbook”, Iowa State University, Retrieved Mar 16, 2006, from Center for Transportation research and Education web site, http://www.ctre.iastate.edu/Research/access /amhandbook/AMhandbook.pdf
202
Kenworthy J. R., Laube F. B., Newman P., Barter P., Raad T., Paboon C., & Gulia B., 1999. “An International Sourcebook of Automobile Dependence in Cities”, 1960-1990, Boulder, CO: University Press of Colorado. Khisty, C. J., & Lall B. K. (1990). “Transportation Engineering (2nd ed)”, USA: Prentice Hall International, Inc. Kulash, W. 1990, “Traditional Neighborhood Development: Will the Traffic Work?”, Presentation at the 11th Annual Pedestrian Conference, Bellevue WA. Kuzmyak, J.R., Pratt, R.H., Douglas, G.B., Spielberg F. (2003). “Land Use and Site Design, Traveler Response to Transportation System Changes”, Chapter 15, TCRP Report 95, Transportation Research Board, Washington, D.C. Litman, T. (2005a), “Land Use Impacts on Transport: How Land Use Patterns Affect Travel Behavior”, Victoria Transport Policy Institute, Retrieved Jan 23, 2006, from http://www.vtpi.org/landtravel.pdf Litman, T. (2005b), “Evaluating Transportation Land Use Impacts”, Victoria Transport Policy Institute, Retrieved Jan 23, 2006, http://www.vtpi.org/landuse.pdf Martinez, F. J. (2000). “Towards a land-use and transport interaction framework”. In Hensher, D. A. & Button, H.J. (Eds.). Handbook of transport Modeling (145-164). New York: Pergamon Press. Meyer, M. D. & Miller, E. J. (1984), “Urban transportation planning: a decision oriented approach”, USA: McGraw-Hill. Michigan Department of Transportation, 1996. “Improving Driveway and Access Management in Michigan”, Retrieved Mar 14, 2006, from FHWA web site, http://www.fhwa.dot.gov/realestate/am_mich.pdf Oregon Department of Transportation and Oregon Department of Land Conservation and Development, 2000, “Neighborhood Street Design Guidelines”, Retrieved Mar 11, 2006, from: http://egov.oregon.gov/ LCD/docs/publications/ neighstreet.pdf Official web site of City of Linclon and Lancster County, (n.d). Left Turn Signals, Retrieved May 7, 2001 from http://www.ci.lincoln.ne.us/CITY/PWORKS/engine trafsaf/signal/leftturn.htm.
203
Polzin, S.E. (2004), “The Relationship Between Land use, Urban Form and Vehicle Miles of Travel: The State of Knowledge and Implications for Transportation Planning”, Center for Urban Transportation Research, University of South Florida Puget Sound Regional Council. (2001), “Destination 2030 Plan Documents”, Glossary of terms, Retrieved Jan 27, 2006, from http://www.psrc.org/projects/mtp/glossary.pdf Pushkarev B. S. & Zupan J. M., 1977. “Public transportation and land use policy”, Bloomington: Indiana University Press. Southworth, W. & Ben-Joseph, E. 1997, “Streets and the Shaping of Towns and Cities”, USA: McGraw-Hill. State of North Carolina Department of Transportation. n.d, “Transit Net Glossary”, Retrieved Jan 18, 2006, from http://www.ncdot.org/ transit/transitnet/Glossary/V.html TMMOB, (2004a), “Ankara Ulaşımında Yitirilen Bir Dönem ve Bugünkü Durum”, İnşaat Mühendisleri Odası, Ankara Şubesi, Ankara. Transportation Research Board. (2001), “Performance Measures to Improve Transportation Systems and Agency Operations, Report of a Conference”, Washington, D.C: National Academy Press. Tekeli, İ., 1987. “Kent içi yolcu taşıma hizmetlerinin örgütlenmesinin geişimi”. In ODTÜ Şehir ve Bölge Planlama Bölümü Çalışma Grubu (Eds.), Ankara 1985’den 2015’e (65-71), Ankara Büyükşehir Belediyesi EGO Genel Müdürlüğü, Ankara. Van, U. P. & Senior, M. (2000). “The contribution of mixed land uses to sustainable travel in cities”. In Williams K., Burton, E., Jenks, Mike. (Eds.). Achieving sustainable urban forms (139-148). UK: E&FN Spon. Vernez-Moudon, A., Cail, M., Pergakes, N., Forsyth, C., Lillard, L., (2003), “Strategies and Tools to Implement Transportation-Efficient Development: A Reference Manual. Phase 2 of Integrating Land Use and Transportation Investment Decision Making”, Washington State Transportation Center (TRAC), University of Washington. Victoria Transport Policy Institute, (2005a), “TDM Encyclopedia: Glossary”, Retrieved Jan 17, 2006, from http://www.vtpi.org/tdm/tdm61.htm
204
Victoria Transport Policy Institute, (2005b), “TDM Encyclopedia: Equity Evaluation Perspectives and Methods for Evaluating the Equity Impacts of Transportation Decisions”, Retrieved Jan 18, 2006, from http://www.vtpi.org/tdm/tdm13.htm Victoria Transport Policy Institute. (2005c), “TDM Encyclopedia: Transportation Affordability”, Retrieved Jan 18, 2006, from http://www.vtpi.org/tdm/tdm106.htm Victoria Transport Policy Institute, (2005d), “TDM Encyclopedia: Transportation Accessibility, Defining, Evaluating and Improving Accessibility”, Retrieved Jan 25, 2006, from http://www.vtpi.org/ tdm/tdm84.htm Victoria Transport Policy Institute, (2005e),”TDM Encyclopedia: Evaluating Transportation System Diversity and Options”, Retrieved Jan 26, 2006, from http://www.vtpi.org/tdm/tdm65.htm Victoria Transport Policy Institute, (2005f), “TDM Encyclopedia: Land Use Density and Clustering”, Retrieved Jan 31, 2006, from http://www.vtpi.org/tdm/tdm81.htm Victoria Transport Policy Institute, (2005g), “TDM Encyclopedia: Roadway Connectivity, Creating More Connected Roadway and Pathway Networks”, Retrieved Feb 24, 2006, from http://www.vtpi.org/tdm/tdm116.htm Victoria Transport Policy Institute, (2005h), “TDM Encyclopedia: Transit Oriented Development, Using Public Transit to Create More Accessible and Livable Neighborhoods”, Retrieved Aug 22, 2005, from http://www.vtpi.org/tdm/tdm45.htm Victoria Transport Policy Institute, (2005j), TDM Encyclopedia, Transportation Costs & Benefits, “Resources for Measuring Transportation Costs and Benefits”, Retrieved Sep 20, 2006, from http://www.vtpi.org/tdm/tdm66. htm#_Toc18284954 Wegener, M. (1995). “Accessibility and development impact”. In Banister, D. (Ed.). Transport and urban development (158-161). England: E&FN Spon Zorlu, F. (2006). “Traffic Assignment in Transforming Networks Case Study: Ankara”. (Unpublished PhD thesis), Department of City and Regional Planning in Urban Design, Middle East Technical University, Ankara.
205
APPENDIX A
Protected Only Left Turn Signals
Protected Only left turn signals allow vehicles to proceed during the display of the
green left turn arrow only. No permissive green ball is displayed, therefore vehicles
may not move during gaps in the opposing through traffic.
The considerations for installation of Protected Only left signals include:
• High left turn traffic volume
• High Opposing through volume
• An existing crash history
• The geometric design of the roadway is such that sight distance for left turn
traffic is insufficient for safe completion of a left turn across opposing traffic
• High speed opposing through traffic
• Left turning vehicles must cross 3 or more lanes of opposing through traffic
• There are multiple left turn lanes
Protected Only left turn arrows that precede the through movements are referred to
as leading left turns. Left turn arrows that follow the through movement are referred
to as lagging left turns.
At some intersections, the protected only left turn may change from leading for both
directions, to lagging for both directions, to leading for one direction and lagging for
the other, during different times of the day. These adjustments allow for the
maximum flow of through traffic in coordination with the other traffic signals along
the roadway. This reduces the number of through vehicle stops and decreases the
overall vehicle delay at the intersection.
Protected / Permissive Left Turn Signals
Protected / Permissive left turn signals will display a green left turn arrow allowing
for a protected left turn movement, followed by a yellow left turn arrow indicating that
the protected left turn is ending. A green permissive ball is then displayed which
allows waiting left turn vehicles to proceed with the left turn during acceptable safe
gaps in the opposing through traffic.
206
The considerations for installation of Protected / Permissive left turn signals include:
• High left turn traffic volume
• High opposing through volume
• An existing crash history
• The geometric design of the roadway allows sufficient sight distance to
safely complete a left turn
• Lower speed opposing through traffic
• 1 or 2 opposing through lanes
• Only 1 left turn lane
At some intersections using protected / permissive left turn signals, the left turn
arrow may not be displayed all times of the day or may be displayed only when 3 or
more vehicles are waiting in the left turn lane. At these times, left turn volume is low
and most left turning vehicles can proceed either during gaps in the opposing
through traffic or during the yellow vehicle clearance period. Left turn arrows are a
definite convenience for the lower volume left turning traffic, but since the allotted
time for the arrow must be subtracted from the much heavier opposing through
traffic, overall intersection delay is increased. Safety and crash history are always
considered when determining this type of operation. (Official web site of City of
Linclon and Lancster County,n.d )
207
Appendix B Types of Transit Metropolises
Cervero (1998) define transit metropolis as “a region where a workable fit exists
between transit services and urban form. In some cases this means compact,
mixed-use development well suited to rail services, and in others it means flexible
bus services well suited to spread out development”. Cervero (1998) defines four
different types of transit metropolises explained in detail below.
Adaptive Cities
Adaptive city is a type of transit-oriented metropolises that have invested in rail
systems to direct urban development for purposes of achieving larger societal
objectives, such as preserving open space and producing affordable housing in rail-
served communities. Adaptive cities have properties of compact, mixed-use
suburban communities and new towns concentrated around rail nodes.
Figure B.1 shows the relationship between transit system and urban form for
adaptive cities. The image below the graph presents form of radial rail lines that
connect outlying communities to a CBD. Cities which have a strong and dominant
CBD and subcenters connected to CBD through rail transit system, like pearls on a
necklace are the model of adaptive cities. Concentrating development at nodes and
resulting confinement of travel demand along the radial axis increase efficiency of
system in terms of mobility. Adaptive city’s formula to success is the combination of
a large CBD, high density, mixed-use development around rail stations at
subcenters, and long-haul radial links that enable balanced, two way flows.
As implemented in Stockholm and Copenhagen, protective greenbelts are formed
between rail nodes (Figure B.1). As seen in Figure B.1, densities and land prices are
the highest in the CBDs and at suburban rail nodes. They decline rapidly with
distance from the nodes and come to zero within the protective greenbelts.
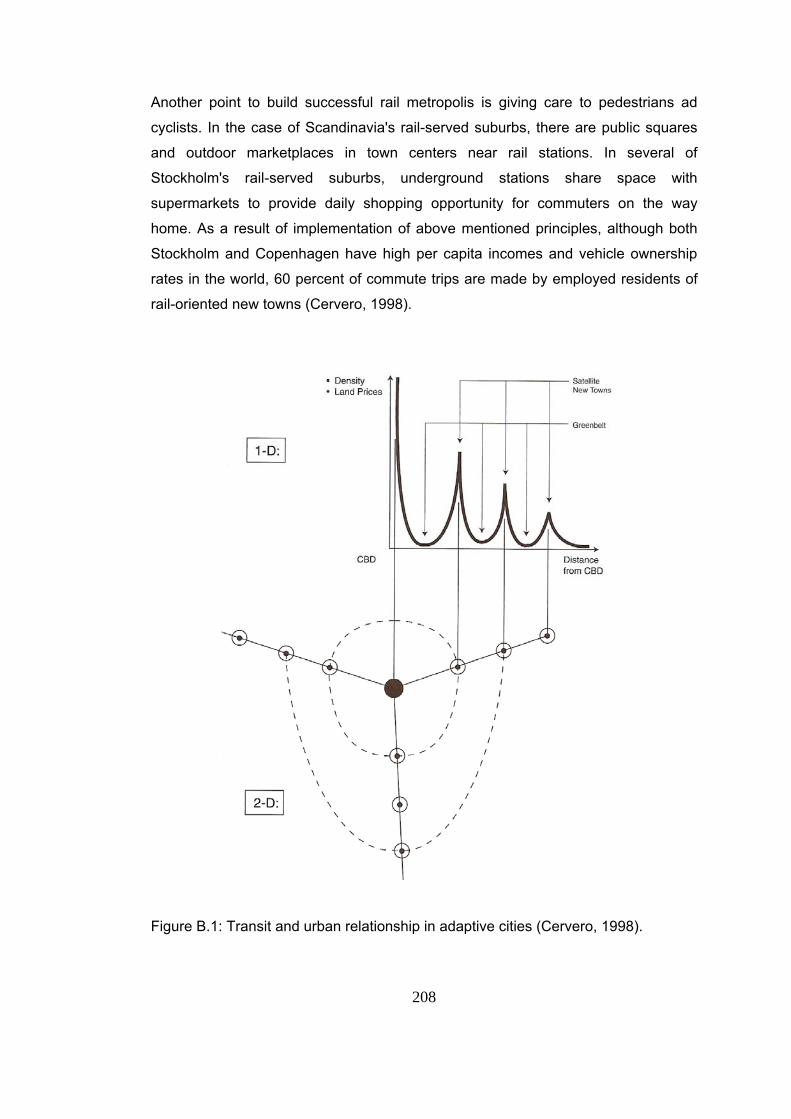
208
Another point to build successful rail metropolis is giving care to pedestrians ad
cyclists. In the case of Scandinavia's rail-served suburbs, there are public squares
and outdoor marketplaces in town centers near rail stations. In several of
Stockholm's rail-served suburbs, underground stations share space with
supermarkets to provide daily shopping opportunity for commuters on the way
home. As a result of implementation of above mentioned principles, although both
Stockholm and Copenhagen have high per capita incomes and vehicle ownership
rates in the world, 60 percent of commute trips are made by employed residents of
rail-oriented new towns (Cervero, 1998).
Figure B.1: Transit and urban relationship in adaptive cities (Cervero, 1998).
209
Adaptive Transit
Adaptive transit cities are dispersed, low density patterns of growth. They adapt
transit services and new technologies to serve these areas. Adaptive transit cities
can be classified into three groups. These are technology-based examples (e.g.,
dual-track systems in Karlsruhe, Germany), service innovations (e.g., track-guided
buses in Adelaide, Australia), and small-vehicle, entrepreneurial services (e.g.,
colectivos in greater Mexico City).
Adaptive transit, represents a polar opposite response to decentralization, is
accepted as an outcome of wealth and changing lifestyle. Transit systems are
arranged to best serve this environment.
Figure B.2 represents the challenges of designing public transit system in the thinly
spread development in which origins and destinations are distributed nearly
homogeneous throughout a region. Naturally, such development produce almost
random patterns of trip making, this means trips can go from anywhere to
everywhere. The decentralization tendency has been largely responsible for the
sharp growth in crosstown and lateral trip making. Instead of traveling along radial
corridors between suburbs and CBD, commuters want to move tangentially and
want to use facilities that were not designed to serve these purposes.
Adaptive transit generally falls into three groups.
• First group is technology-based responses and example of this is track-
guided buses which are used in Essen, Germany and Adelaide, Australia.
Also called O-Bahn, by means of this technology buses are able to move
both along dedicated tracks and on roads. Thus, it is possible to achieve
high speeds and efficiencies along mainline corridors. In the suburbs and
CBD, vehicles exit the guide way and operate as ordinary street buses, so
that, transfers are eliminated.
• A second type of adaptive transit involves service reforms which aims to
reduce waits and transfers. An example is timed-transfer systems. This
system was applied in the two largest cities of Canada, Edmonton and
Calgary, and then adopted by many large bus transit systems in North
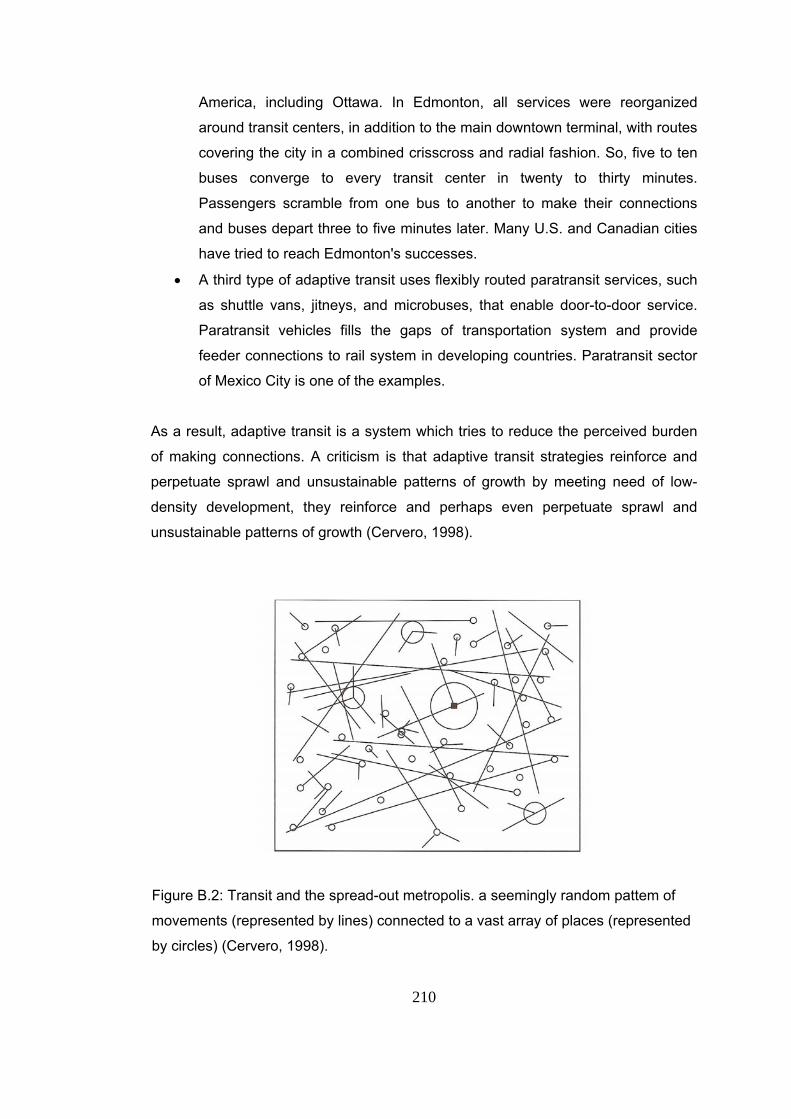
210
America, including Ottawa. In Edmonton, all services were reorganized
around transit centers, in addition to the main downtown terminal, with routes
covering the city in a combined crisscross and radial fashion. So, five to ten
buses converge to every transit center in twenty to thirty minutes.
Passengers scramble from one bus to another to make their connections
and buses depart three to five minutes later. Many U.S. and Canadian cities
have tried to reach Edmonton's successes.
• A third type of adaptive transit uses flexibly routed paratransit services, such
as shuttle vans, jitneys, and microbuses, that enable door-to-door service.
Paratransit vehicles fills the gaps of transportation system and provide
feeder connections to rail system in developing countries. Paratransit sector
of Mexico City is one of the examples.
As a result, adaptive transit is a system which tries to reduce the perceived burden
of making connections. A criticism is that adaptive transit strategies reinforce and
perpetuate sprawl and unsustainable patterns of growth by meeting need of low-
density development, they reinforce and perhaps even perpetuate sprawl and
unsustainable patterns of growth (Cervero, 1998).
Figure B.2: Transit and the spread-out metropolis. a seemingly random pattem of
movements (represented by lines) connected to a vast array of places (represented
by circles) (Cervero, 1998).
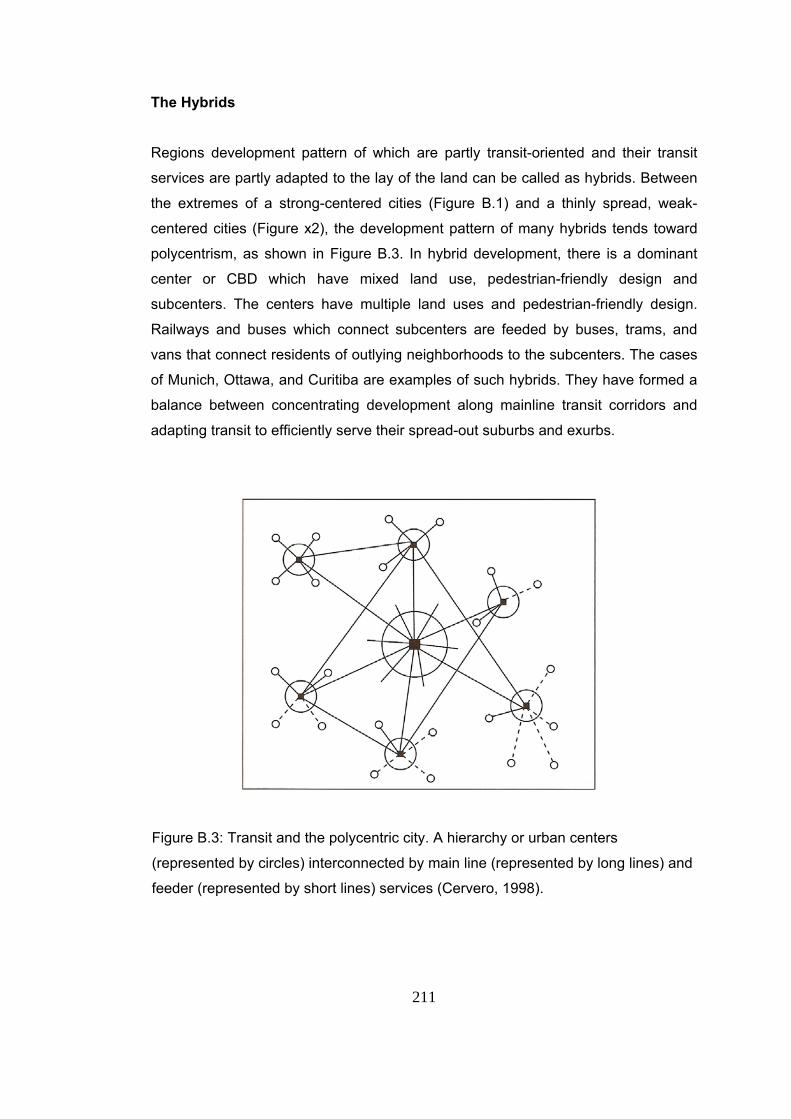
211
The Hybrids
Regions development pattern of which are partly transit-oriented and their transit
services are partly adapted to the lay of the land can be called as hybrids. Between
the extremes of a strong-centered cities (Figure B.1) and a thinly spread, weak-
centered cities (Figure x2), the development pattern of many hybrids tends toward
polycentrism, as shown in Figure B.3. In hybrid development, there is a dominant
center or CBD which have mixed land use, pedestrian-friendly design and
subcenters. The centers have multiple land uses and pedestrian-friendly design.
Railways and buses which connect subcenters are feeded by buses, trams, and
vans that connect residents of outlying neighborhoods to the subcenters. The cases
of Munich, Ottawa, and Curitiba are examples of such hybrids. They have formed a
balance between concentrating development along mainline transit corridors and
adapting transit to efficiently serve their spread-out suburbs and exurbs.
Figure B.3: Transit and the polycentric city. A hierarchy or urban centers
(represented by circles) interconnected by main line (represented by long lines) and
feeder (represented by short lines) services (Cervero, 1998).
212
Strong-Core Cities
Strong core cities tie rail improvements to central city revitalization efforts. These
cities integrate transit and urban development within a more confined central city
context. These cities have high shares of jobs and retail services in their cores.
Zurich and Melbourne are examples of this type. They use tramways to enrich the
quality of urban living and to provide efficient forms of circulation in built-up areas. In
these places, trams are designed so as to co-exist nicely with pedestrians and
bicyclists. In both cases, tramways have been used to strengthen existing
development patterns (i.e., adaptive transit) while inner-city revitalization has tried to
achieve more compact, transit-oriented built forms (i.e., adaptive cities) (Cervero,
1998).