kroupa m., vonka m., soos m., kosek j. probing coagulation
TRANSCRIPT
Kroupa M., Vonka M., Soos M., Kosek J.
Probing Coagulation and Fouling in Colloidal Dispersions with Viscosity
Measurements: In Silico Proof of Concept.
In: Advances in Polymer Science. Springer, Berlin, Heidelberg (2017)
DOI https://doi.org/10.1007/12_2017_17
Publisher Name Springer, Berlin, Heidelberg
Probing Coagulation and Fouling in Colloidal
Dispersions with Viscosity Measurements:
in-silico Proof of Concept
Martin Kroupa,† Michal Vonka,‡ Miroslav Soos,∗,† and Juraj Kosek∗,†
†University of Chemistry and Technology Prague, Department of Chemical Engineering,
Technicka 5, 16628 Prague 6, Czech Republic
‡BASF SE, Carl-Bosch-Strasse 38, 67056 Ludwigshafen am Rhein, Germany
E-mail: [email protected]; [email protected]
Abstract
Colloidal dispersions in a flow can undergo the unwanted processes of coagulation
and fouling. Prevention of these processes requires their proper understanding and
also the ability to monitor their extent. Currently, neither of these requirements is
sufficiently fulfilled and this motivates the development of detailed models operating
on the scale of primary colloidal particles that capture the nature of the dispersion
processes. We model the coagulation and fouling in colloidal dispersions using the
dynamic discrete element method (DEM) with an interaction model accounting for
particles that are elastic, adhesive and stabilized by electrostatic charge. At the same
time, the particles can adhere to the wall. The flow-field computation captures the
mutual influence between the particles and the flow and the model also includes a
pair-wise implementation of lubrication forces. The modeling results indicate that the
viscosity is highly sensitive to the formation of clusters reflecting not only the larger size
of clusters when increasing the surface energy, but also the slower kinetics of coagulation
1
in charge-stabilized dispersions. On the contrary, the viscosity is not sensitive to the
attachment of particles to the wall. The mechanism of fouling determined from the
simulation results comprises of the bulk-formation of clusters in the first phase and
the subsequent dynamic wall-attachment and detachment of the clusters in the second
phase. The presented work improves the understanding of the dynamic behavior of
colloidal dispersions, which is strongly relevant for the industrial application as well as
for on-line monitoring and control.
Introduction
Colloidal dispersions present interesting systems from both the practical and theoretical
point of view. Their practical utilization ranges from the food technology through cosmetics
to adhesives and paints. At the same time they represent a very complex system in terms of
the theoretical understanding with a rich palette of physical phenomena, unexplained effects
and non-trivial relationships.
Among the most important phenomena influencing the properties of colloidal dispersions
are the processes of coagulation and fouling. While coagulation refers to the bulk-formation
of clusters from primary colloidal particles, by fouling (or clogging) we understand the at-
tachment of particles or clusters to a solid boundary, which can represent the container walls,
stirrer or baffles, etc. Both coagulation and fouling can be either perikinetic, i.e., induced
by the thermal motion of the particles, or orthokinetic, i.e., caused by the presence of the
flow.1 In the orthokinetic case, both the clusters in the bulk and those attached to the wall
can break due to the stress introduced by the flow. Because the the problematics is quite
broad, we narrow our focus to the orthokinetic (i.e., shear-induced) coagulation, fouling and
breakage, as these processes have a high practical relevance.
In the past two decades, a number of significant advances improved the understanding of
the mechanisms of shear-induced coagulation and breakage and various relations are avail-
able for the kinetics of these phenomena.2–5 However, there is still a certain disconnection
2
between models and experiments in terms of predicted and observed quantities. Namely, the
models can predict the coagulation and breakage rates together with the cluster size even
in concentrated dispersions,3,6 but the measurements of cluster size are limited to highly
diluted dispersions. On the other hand, the dynamics of coagulation can be observed by
measurements of viscosity even for concentrated dispersions,7,8 but the theory connecting
the characteristics of a colloidal dispersion undergoing coagulation and fouling to its rheo-
logical properties is still incomplete and largely relies on empirical relations.9
In contrast, the process of fouling is much less explored than the case of coagulation.
This might be caused by the fact that it is more difficult to find a well-defined system for
both simulations and experiments. While some systems suffering from fouling problems,
such as heat exchangers,10,11 or membrane bioreactors12,13 are relatively well documented,
fouling of reactors by polymer latexes received much less attention in the literature. The
topic of particulate fouling in micro-channels was thoroughly reviewed by Henry et al. (2012)
including experimental and modeling studies. The study classified four different stages of
fouling:14
1. deposition of primary particles onto the wall,
2. resuspension of primary particles or clusters from the wall,
3. coagulation (agglomeration) in the bulk flow, and
4. clogging, i.e., the attachment of particles or clusters to a layer that is already present
on the wall.
Besides the detailed description and categorization of both early and later stages of foul-
ing, the authors introduced a new modeling approach based on the one-particle probability
density function (PDF).14 The model takes into account inter-particle forces, fluid dynamics
and is able to account for wall surface roughness.15 16 Due to its relatively coarse level of
description, this approach is well-suited for industrially-important cases. At the same time
it results in a certain loss of detail preventing thorougher studies of fouling mechanisms.
3
The authors also emphasized the necessity for the models of fouling to incorporate all
the physical interactions affecting the process, namely, the particle-particle, fluid-particle,
fluid-surface and particle-surface interactions.14 Furthermore, it was pointed out that it is
the broad range of temporal and spatial scales at which these interactions act that makes
the modeling of fouling a very complicated task. Several studies attempted to fulfill these
requirements. Approaches based on the solution of Navier-Stokes equations, such as the
force coupling method or direct numerical simulation treat the fluid dynamics in a detailed
way.17 18 19 However, the description of inter-particle forces is usually simplified and the
number of particles in the simulation is relatively small when compared to other particle-
based methods.20
Experimentally, fouling by colloidal particles in a stirred reactor was investigated by Ur-
rutia et al. (2016).1 While in the perikinetic regime the process was relatively well-controlled
and mostly a mono-layer of particles was observed, in the orthokinetic regime the situation
was more complicated due to flow heterogenities. The authors related their results to previ-
ous studies of bulk coagulation and coagulation at the liquid-gas interface.21–23 A different
possibility of experimental investigation of fouling is the direct observation of deposited par-
ticles in a specially designed apparatus.24–27 These studies represent a pioneering work and
their benefit is unexceptionable. Nevertheless, for the true understanding of the underlying
mechanisms of fouling, a connection to some mechanistic model is necessary.
In aerosol systems, particle-based modeling was extensively used to simulate the depo-
sition of particles either to walls of a channel, or to a fiber during filtration.20,28–32 For
polymer latexes, such detailed modeling studies are not available. Lazzari (2016) modeled
the dynamics of colloidal particle deposition using population balance equations (PBE) and
identified three different regimes of deposition depending on the ratio of the deposition and
the aggregation characteristic times.33 However this approach relies on the identification
of mechanisms that lead to the deposition and the subsequent determination of the rate
constants required for the PBE.
4
Both coagulation and fouling are strongly connected to the flow conditions as well as
to the properties of the dispersed and the dispersing phases. The interplay between these
two groups of phenomena lead to either well stabilized systems or to coagulum formation
and consequently to fouling. If not controlled, these processes are responsible for large
amount of off-spec products and consequent economical losses throughout the industry. So
far the industry mainly relies on empirical knowledge, while the deeper understanding or
even control of the systems is usually absent. Understanding the underpinning laws behind
these interconnected phenomena is therefore of crucial importance and this task requires a
complex approach that is able to consider all the relevant phenomena, identify their relative
importance and explain the underlying mechanisms.
The present article aims at the detailed description of phenomena taking place in flowing
colloidal dispersions using a model based on the discrete element method (DEM). The model
incorporates the description of charge-stabilized particles that are elastic and adhesive.34 For
the simulations of fouling, the elastic and adhesive interaction between the particles and the
wall is considered. The mutual influence between the particles and the flow is accounted
for using the two-way coupling technique. From the flow-field obtained by this method, the
suspension viscosity is evaluated based on the balance of forces acting on the boundary of the
domain. Finally, the lubrication forces that are greatly important especially in concentrated
dispersions are considered for both the particle-particle and particle-wall interactions.
This approach enables us to identify the mechanisms leading to fouling and their relative
importance. Furthermore, we demonstrate that the kinetics of fouling is slower than the
kinetics of coagulation and we identify how it is influenced by the properties of the system.
The fouling and coagulation rates obtained from these results can be directly used in the
PBE modeling. The coagulation is shown to have a significant effect on the viscosity of the
dispersion and the changes in the viscosity are revealed to be related to the size and structure
of clusters. On the other hand, the process of fouling is not resulting in any observable effect
on the viscosity within the scatter naturally occurring in the results due to the dynamic
5
nature of the system.
Mathematical model
As in our previous work,6,35 the model used in this article consists of two parts. In the first
part, the flow field in the domain is computed. This flow field is then, together with other
forces and torques, used in the discrete element method for the computation of particle dy-
namics. Particles in DEM are described as discrete elements. Each element is characterized
by its mass (mi), position (xi), velocity (vi) and rotation rate (Ωi). The governing equation
for the translational motion is the Newton’s second law:
d2xi
dt2=
Fi
mi
, (1)
where Fi represents the sum of all forces acting on the discrete element i. The temporal
change in the rotation rate (Ωi) is expressed as follows:
dΩi
dt=
Mi
Ii, (2)
where Mi is the sum of all torques acting on particle i and Ii is the particle momentum of
inertia. For a homogeneous solid sphere we have Ii = 25miR
2p (particle moment of inertia
around its center) and mi = 43πR3
pρp.
Hydrodynamics
The computation of hydrodynamics in the model involves both the effect of the flow on the
particles (i.e., the drag force and torque) and the effect of the particles on the flow including
the computation of the flow-field. The framework for the calculation of these effects is
introduced in this section.
Because particles considered in this work are of small size (under 1 µm), their Reynolds
6
number is small and the drag force Fd,i acting on them can be described by the Stokes’ law:
Fd,i = 6πηfRp(vfi − vp
i ), (3)
where ηf is the fluid dynamic viscosity, Rp is the radius of the particle and vfi and vp
i are
the velocities of the fluid and the particle, respectively. Buoyancy and gravity forces were
neglected due to the same density of the particles and the fluid. The large applied shear
rates cause the Peclet number to be very high and the effect of the Brownian motion thus
can be neglected.
The torque on a particle caused by the local rotation of the fluid can be computed as:36
Mfi = πηf (2Rp)3
(1
2ωi −Ωi
), (4)
where ωi is the angular velocity of the fluid at the position of the particle center.
The effect that the particles have on the fluid is taken into account using the so-called
two-way coupling between particles and fluid, which results in the modified Navier-Stokes
equations in the following form:20,37
∂
∂t(φvρf) +∇ · (φvρfu) = 0 (5)
∂
∂t(φvρfu) + (u · ∇)(φvρfu) = φvη∇2u− φv∇p− b, (6)
where ρf is the fluid density, u is the fluid velocity, p is the pressure, b is the body force
exerted by particles, φv = 1 − φ′ is the fraction of voids and φ′ is the local volume fraction
of particles.
For the numerical solution of Equations 5 and 6 we used the program OpenFOAM,38
which was coupled with the DEM model. The computational grid for the Finite Volume
Method (FVM) that is used to discretize Equations 5 and 6 was chosen to be regular with
7
cubic grid cells of size κ (length of the edge) and volume V = κ3.
The body force bn,i, which the particle i exerts on the cell n can be expressed as follows:
bn,i = −VnV
Fd,i, (7)
where Vn is the volume of the sub-grid cell opposite to cell n, V is the total grid cell volume
and Fd,i is the drag force acting on the i-th particle. In Equation 7, the so-called volume
partitioning was used to distribute the body force of the particle onto the grid. Details of
this approach were described by Marshall (2009)20 and also in our previous work.6,35
The determination of the local particle volume fraction φ′ is based on the procedure of
distributing the particle volume as a ”cloud” around its center using a Gaussian weighting
function. This procedure is in more detail described in the Supporting Information.
A discussion and validation of the hydrodynamic model6 led to the choice of the cell size
of the grid to be κ = 2.5Rp. The resulting number of cubic cells is dependent on the size
of the computational domain L, which (as will be discussed later) in turn depends on the
particle volume fraction φ, number of particles N and primary particle size Rp. For φ = 0.09,
Rp = 125 nm and N = 5000 there are 24 cubic cells in each spatial direction and 13 824 cells
overall.
Lubrication Forces
Particles immersed in a fluid affect each other through the fluid by lubrication forces.9 These
forces originate from squeezing out or sucking in the fluid when particles approach or recede,
respectively. The lubrication interaction is a form of hydrodynamic interactions and has
therefore the same origin as the framework for the computation of the flow-field described in
the previous section. However, due to the relatively coarse resolution of the fluid solver, the
lubrication forces have to be incorporated additionally. The formulation of lubrication forces
used in this work was developed by Dance and Maxey (2003)39 and the implementation into
the DEM model was thoroughly described in our previous work.35 Additionally, we provide
8
the necessary equations and a brief explanation in the Supporting Information.
Structure of the Computational Domain
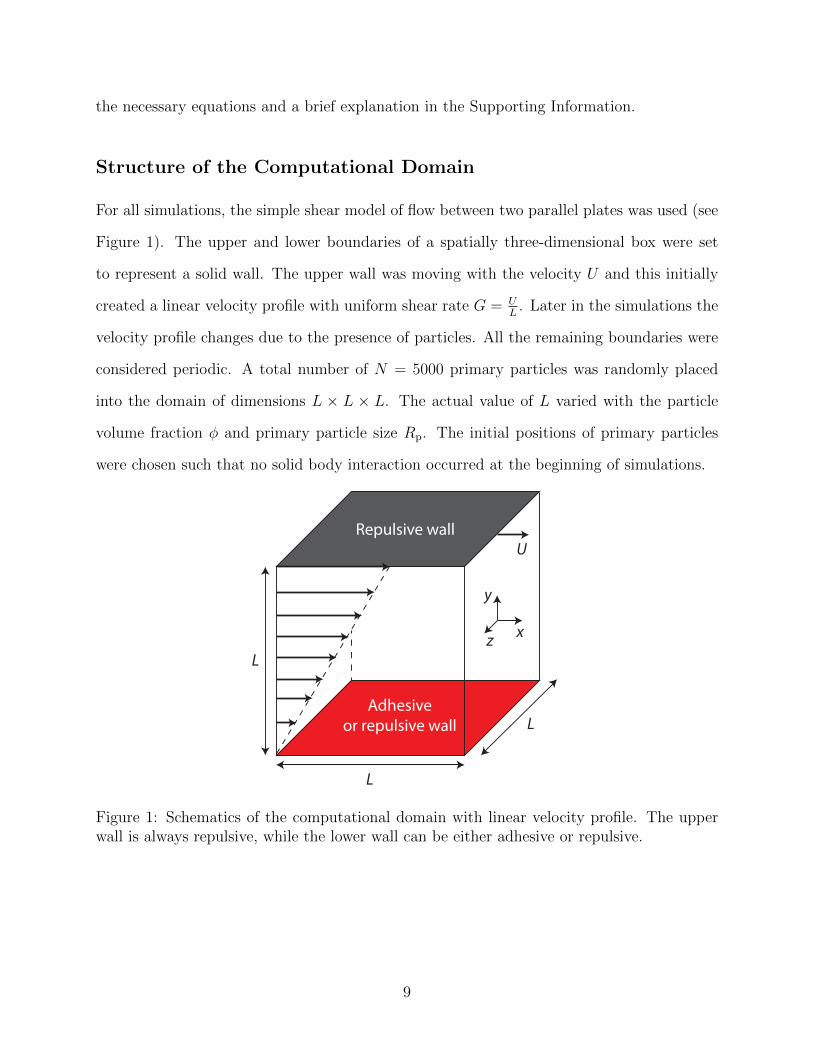
For all simulations, the simple shear model of flow between two parallel plates was used (see
Figure 1). The upper and lower boundaries of a spatially three-dimensional box were set
to represent a solid wall. The upper wall was moving with the velocity U and this initially
created a linear velocity profile with uniform shear rate G = UL
. Later in the simulations the
velocity profile changes due to the presence of particles. All the remaining boundaries were
considered periodic. A total number of N = 5000 primary particles was randomly placed
into the domain of dimensions L × L × L. The actual value of L varied with the particle
volume fraction φ and primary particle size Rp. The initial positions of primary particles
were chosen such that no solid body interaction occurred at the beginning of simulations.
U
L
L
L
x
y
z
Repulsive wall
Adhesiveor repulsive wall
Figure 1: Schematics of the computational domain with linear velocity profile. The upperwall is always repulsive, while the lower wall can be either adhesive or repulsive.
9
Non-hydrodynamic Interactions
A crucial part of the model for simulations of coagulation and fouling are the interactions
between the particles and between the particle and the wall. In this section, we introduce
models for all these interactions that are not related to hydrodynamics. To investigate the
fouling, i.e., the effect of the wall on the behavior of the system, we performed simulations
for the following two categories of the particle-wall interactions:
1. Repulsive wall: Strong non-contact repulsion, no contact tangential interactions.
2. Adhesive wall: Adhesive and elastic wall with contact tangential interactions and non-
contact van der Waals attraction.
Note that the hydrodynamic interaction between the particle and the wall is the same
for both categories. We begin with the description of the repulsive particle-wall interaction.
Later, we introduce the framework for the computation of the connected non-contact and
contact interactions, which is the same for both the adhesive wall and the interactions
between the particles.
Repulsive Particle-wall Interactions
The purpose of the repulsive wall in the model is to close the system with the smallest possible
effect on its behavior, therefore we introduce a description of particle-wall interactions that
is as simple as possible. For this reason, the hydration force describing purely repulsive
interaction between the particle and the wall was implemented.40 In terms of the interaction
potential energy (Vh) the hydration repulsion can be described as follows:41
Vh = πRpF0δ20 exp(−H/δ0), (8)
where H is the particle-wall separation distance, F0 is the hydration force constant and δ0
is the characteristic decay length. The values of the constants used in our model for the
10
particle-wall interactions were: F0 = 2× 10⁸ N m−2 and δ0 = 3× 10⁻¹⁰ m.35 The interaction
force (Fh) can be obtained as the negative derivative of Vh with respect to separation distance
(H), i.e., Fh = −dVh
dH.
Adhesive Interactions
In our previous work35 we introduced the model for the evaluation of viscosity and tested
it for the most elementary system of hard-sphere particles. Here, we extend these results
and examine the viscosity of a suspension composed of elastic and adhesive particles. For
the modeling of this system, we adopt the formulation of normal inter-particle interaction
described by the connection of the DLVO and JKR theories. This connection was developed
in our previous work6,34 and it is briefly recalled here. The tangential forces acting between
particles and the particle and the wall are described in the Supporting Information.
The DLVO theory describes the non-contact interaction between electrostatically stabi-
lized particles, which are also subject to van der Waals forces. As such, it comprises of
two contributions. For the van der Waals attractive potential energy (Up-pvdW) between two
spherical particles of the same radius (Rp) we used:42
Up-pvdW = −AH
6
2R2
p
h2 + 4hRp
+2R2
p
(h+ 2Rp)2+ ln
[1−
(2Rp
h+ 2Rp
)2]
, (9)
where h is the separation distance such that h = u− 2Rp, where u is the distance between
centers of the two particles. The quantity Ap-pH is the Hamaker constant of the particle-
particle interaction.
The potential energy (Up-wvdW) between the particle and the wall is described as follows:42
Up-wvdW = −A
p-wH Rp
6H
[1 +
H
2Rp +H+H
Rp
ln
(H
2Rp +H
)], (10)
Ap-wH is the Hamaker constant of the particle-wall interaction.
The electrostatic repulsive potential energy (Uele) of two colloidal particles can be ex-
11
pressed as:42
Uele = 2πε0εrRp(ψ)2 ln (1 + exp(−κh)) , (11)
where ε0 is the vacuum permittivity, εr is the relative permittivity of the medium, ψ is the
surface potential of the particles, which is assumed to be constant in the model and κ is the
reciprocal of the Debye length κ−1. The electrostatic stabilization is not considered for the
particle-wall interaction.
The resulting DLVO potential energy (UDLVO) is obtained by the following summation:
UDLVO = UvdW + Uele. (12)
The corresponding interaction force (FDLVO) is the negative derivative of UDLVO with
respect to separation distance (h), i.e., FDLVO = −dUDLVO
dh.
The JKR theory describes the interaction of adhesive, elastic solid bodies. The adhesive
force in JKR theory is assumed to act only within the flattened contact region. The equations
for JKR theory used in this work were proposed by Johnson et al. (1971).43 We use the
implementation of Marshall (2009).20 The equations are valid generally for spheres with
radii Rip and Rj
p and the so-called effective radius (R) defined as: R = 1/( 1Ri
p+ 1
Rjp). For the
contact of the particle with the wall the radius Rjp becomes infinite. When no external force
is acting on the particles and the force equilibrium is reached, we can define the equilibrium
radius of the contact area (a0) as:
a0 =
(9πγR2
E
)1/3
, (13)
where γ denotes the surface energy (to be discussed later) and E is the effective Young’s
modulus given by:
1
E=
1− ν2i
Ei
+1− ν2
j
Ej
, (14)
12
where Ei and Ej are the Young’s moduli and the quantities νi and νj are the Poisson’s ratios
of the two interacting bodies.
The equation for (non-equilibrium) radius of the contact area (a) is implicit:20
h = 61/3δC
[2
(a
a0
)2
− 4
3
(a
a0
)1/2], (15)
where the critical overlap (δC) is given by the following equation:
δC =a2
0
2(6)1/3R. (16)
Finally, the normal force (Fne) between two colliding particles can be obtained from:
Fne
FC
= 4
(a
a0
)3
− 4
(a
a0
)3/2
, (17)
where the critical force (FC) is given by:
FC = 3πγR. (18)
The quantity FC corresponds to the maximum adhesive force, which can occur between
particles described by JKR theory. The direct relation between FC and the surface energy (γ)
represents a powerful possibility to use both theoretical predictions of γ or mimic a specific
system based on the AFM colloidal probe measurements.44,45 Detailed discussion about this
choice together with the description of the connection between DLVO and JKR theories are
described in our previous article.34
Evaluation of Viscosity
The viscosity of the suspension is evaluated from the balance of forces acting on the upper
wall. The model system is set correspondingly to the basic physical phenomena taking place
in a standard rotational viscometer. The detailed procedure is described in our previous
13
work.35
Numerical details
The dynamics in each of the two parts of the model occurs on different time-scales and
therefore different time-steps are required for each part. Following the guidelines of Marshall
(2009), the time-step for the particle motion was set to ∆tp = 1× 10⁻¹⁰ s and time-step for
the fluid dynamics was set as ∆tF = 1100
1G
, where G = UL
is the shear rate. The numerical
issues were more thoroughly elaborated in our previous work.6,34
For the integration of the resulting system of ordinary differential equations (Eq. 1 and
2) we used the solver LSODE from ODEPACK.46
Results and Discussion
Similarly to the description of the model, the presented results are divided into two parts. In
the first part we focus on the bulk behavior of an adhesive suspension with various degrees
of stabilization and for this case both the walls in the computational domain are repulsive.
In the second part, the lower wall is adhesive and the particles and clusters can attach to it.
Constant parameters of the simulations are summarized in Table 1. The values of studied
parameters are stated in the figure captions.
Effect of shear rate
For the simulations of coagulation and breakage, the first investigated parameter was the
shear rate G. In Figure 2, we show its effect on the size of clusters (represented as the root-
mean-squared radius of gyration) and the suspension viscosity in their dependence on the
normalized time. The clusters start to grow after a certain induction period caused by the
fact that the particles need to approach each other from the originally dispersed state. The
effect of various parameters on the cluster size and its dynamic development was discussed
14
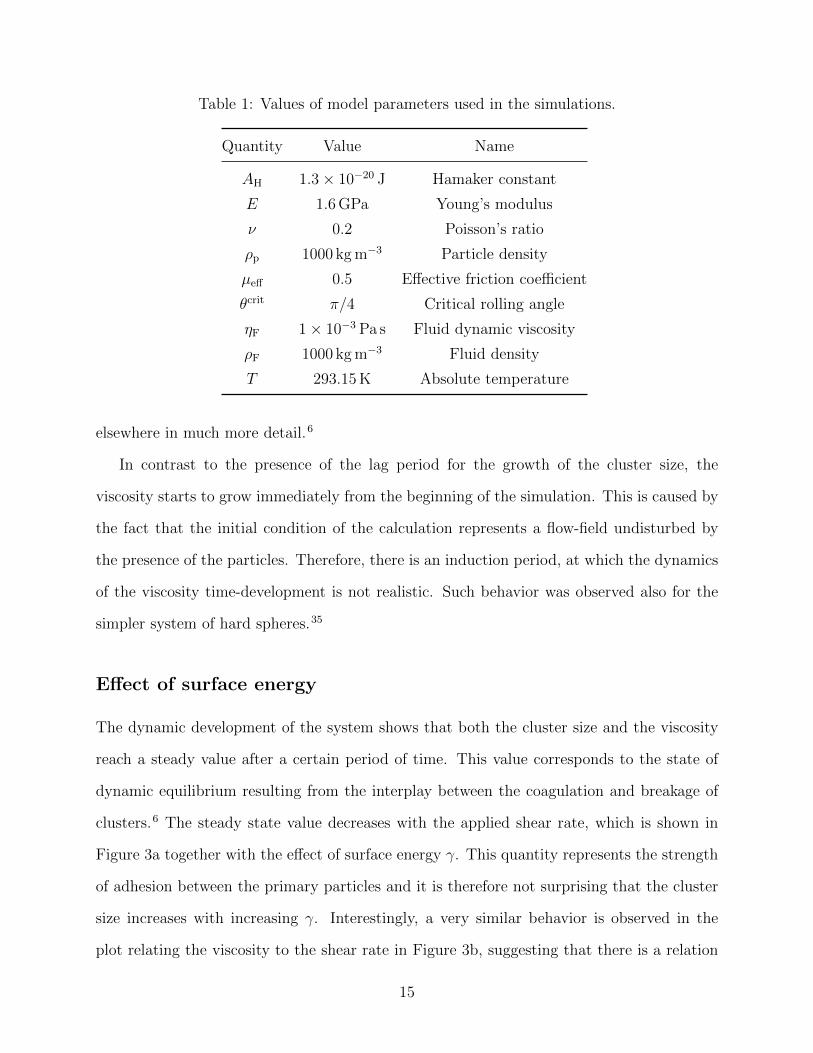
Table 1: Values of model parameters used in the simulations.
Quantity Value Name
AH 1.3× 10⁻²⁰ J Hamaker constant
E 1.6 GPa Young’s modulus
ν 0.2 Poisson’s ratio
ρp 1000 kg m−3 Particle density
µeff 0.5 Effective friction coefficient
θcrit π/4 Critical rolling angle
ηF 1× 10⁻³ Pa s Fluid dynamic viscosity
ρF 1000 kg m−3 Fluid density
T 293.15 K Absolute temperature
elsewhere in much more detail.6
In contrast to the presence of the lag period for the growth of the cluster size, the
viscosity starts to grow immediately from the beginning of the simulation. This is caused by
the fact that the initial condition of the calculation represents a flow-field undisturbed by
the presence of the particles. Therefore, there is an induction period, at which the dynamics
of the viscosity time-development is not realistic. Such behavior was observed also for the
simpler system of hard spheres.35
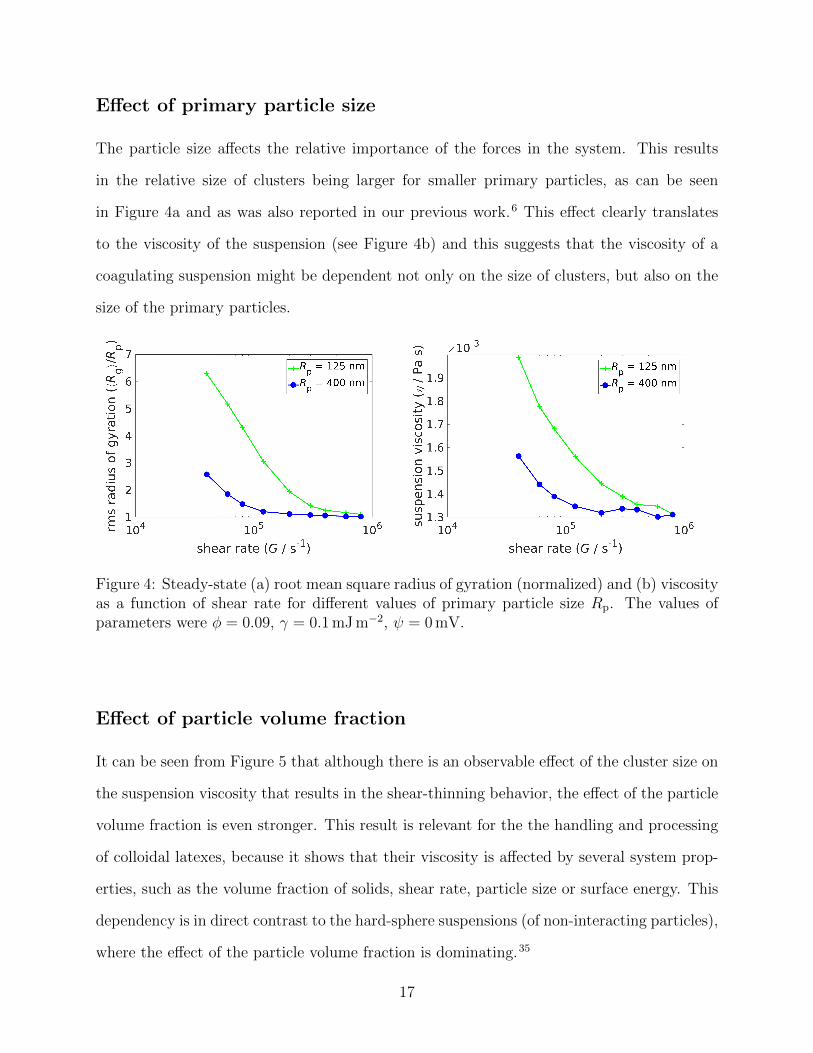
Effect of surface energy
The dynamic development of the system shows that both the cluster size and the viscosity
reach a steady value after a certain period of time. This value corresponds to the state of
dynamic equilibrium resulting from the interplay between the coagulation and breakage of
clusters.6 The steady state value decreases with the applied shear rate, which is shown in
Figure 3a together with the effect of surface energy γ. This quantity represents the strength
of adhesion between the primary particles and it is therefore not surprising that the cluster
size increases with increasing γ. Interestingly, a very similar behavior is observed in the
plot relating the viscosity to the shear rate in Figure 3b, suggesting that there is a relation
15
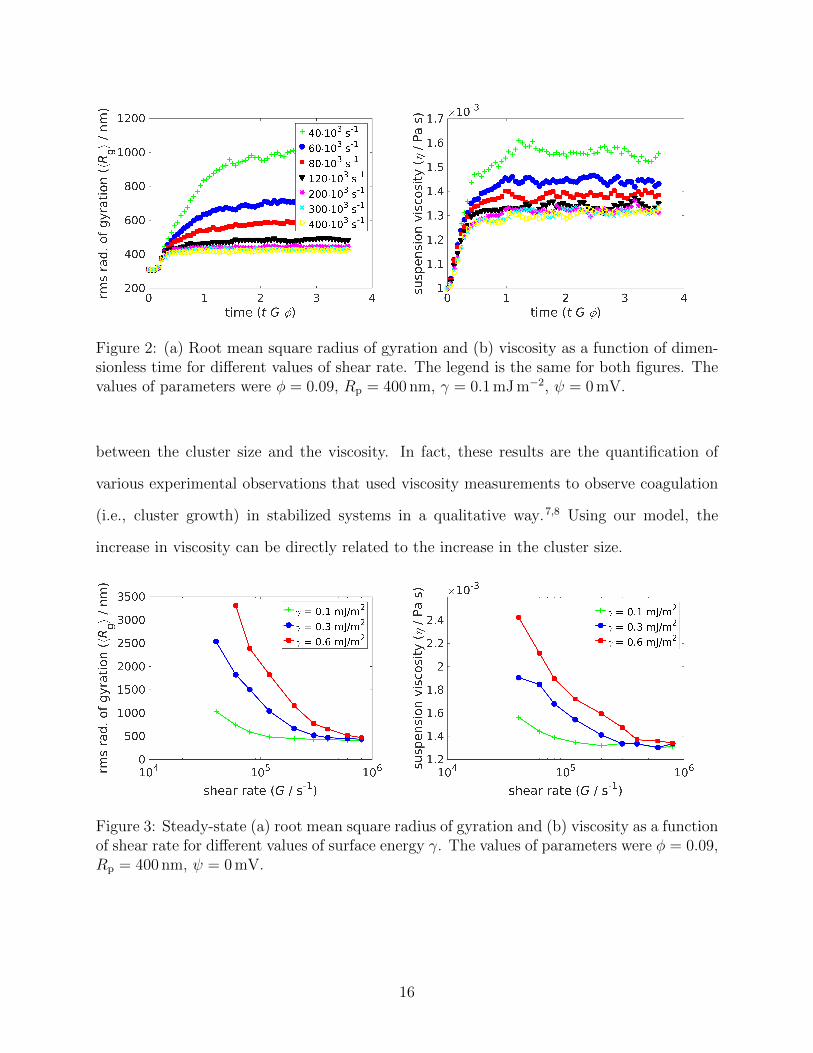
Figure 2: (a) Root mean square radius of gyration and (b) viscosity as a function of dimen-sionless time for different values of shear rate. The legend is the same for both figures. Thevalues of parameters were φ = 0.09, Rp = 400 nm, γ = 0.1 mJ m−2, ψ = 0 mV.
between the cluster size and the viscosity. In fact, these results are the quantification of
various experimental observations that used viscosity measurements to observe coagulation
(i.e., cluster growth) in stabilized systems in a qualitative way.7,8 Using our model, the
increase in viscosity can be directly related to the increase in the cluster size.
Figure 3: Steady-state (a) root mean square radius of gyration and (b) viscosity as a functionof shear rate for different values of surface energy γ. The values of parameters were φ = 0.09,Rp = 400 nm, ψ = 0 mV.
16
Effect of primary particle size
The particle size affects the relative importance of the forces in the system. This results
in the relative size of clusters being larger for smaller primary particles, as can be seen
in Figure 4a and as was also reported in our previous work.6 This effect clearly translates
to the viscosity of the suspension (see Figure 4b) and this suggests that the viscosity of a
coagulating suspension might be dependent not only on the size of clusters, but also on the
size of the primary particles.
Figure 4: Steady-state (a) root mean square radius of gyration (normalized) and (b) viscosityas a function of shear rate for different values of primary particle size Rp. The values ofparameters were φ = 0.09, γ = 0.1 mJ m−2, ψ = 0 mV.
Effect of particle volume fraction
It can be seen from Figure 5 that although there is an observable effect of the cluster size on
the suspension viscosity that results in the shear-thinning behavior, the effect of the particle
volume fraction is even stronger. This result is relevant for the the handling and processing
of colloidal latexes, because it shows that their viscosity is affected by several system prop-
erties, such as the volume fraction of solids, shear rate, particle size or surface energy. This
dependency is in direct contrast to the hard-sphere suspensions (of non-interacting particles),
where the effect of the particle volume fraction is dominating.35
17
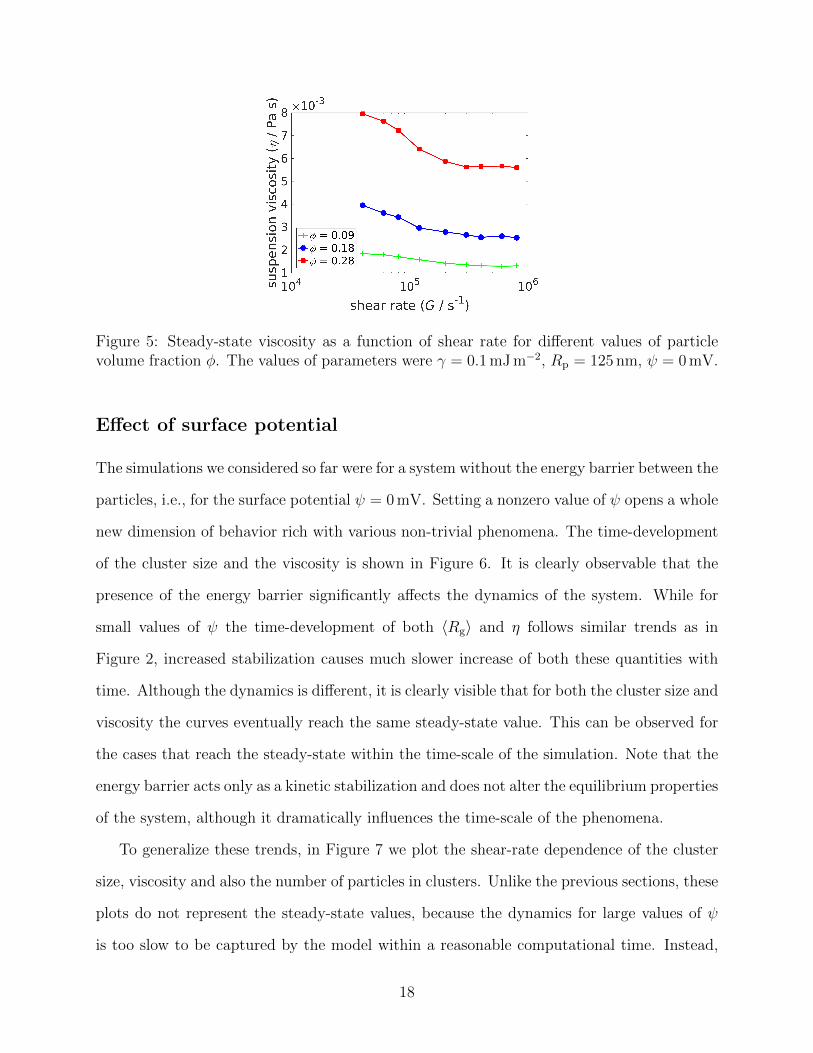
Figure 5: Steady-state viscosity as a function of shear rate for different values of particlevolume fraction φ. The values of parameters were γ = 0.1 mJ m−2, Rp = 125 nm, ψ = 0 mV.
Effect of surface potential
The simulations we considered so far were for a system without the energy barrier between the
particles, i.e., for the surface potential ψ = 0 mV. Setting a nonzero value of ψ opens a whole
new dimension of behavior rich with various non-trivial phenomena. The time-development
of the cluster size and the viscosity is shown in Figure 6. It is clearly observable that the
presence of the energy barrier significantly affects the dynamics of the system. While for
small values of ψ the time-development of both 〈Rg〉 and η follows similar trends as in
Figure 2, increased stabilization causes much slower increase of both these quantities with
time. Although the dynamics is different, it is clearly visible that for both the cluster size and
viscosity the curves eventually reach the same steady-state value. This can be observed for
the cases that reach the steady-state within the time-scale of the simulation. Note that the
energy barrier acts only as a kinetic stabilization and does not alter the equilibrium properties
of the system, although it dramatically influences the time-scale of the phenomena.
To generalize these trends, in Figure 7 we plot the shear-rate dependence of the cluster
size, viscosity and also the number of particles in clusters. Unlike the previous sections, these
plots do not represent the steady-state values, because the dynamics for large values of ψ
is too slow to be captured by the model within a reasonable computational time. Instead,
18
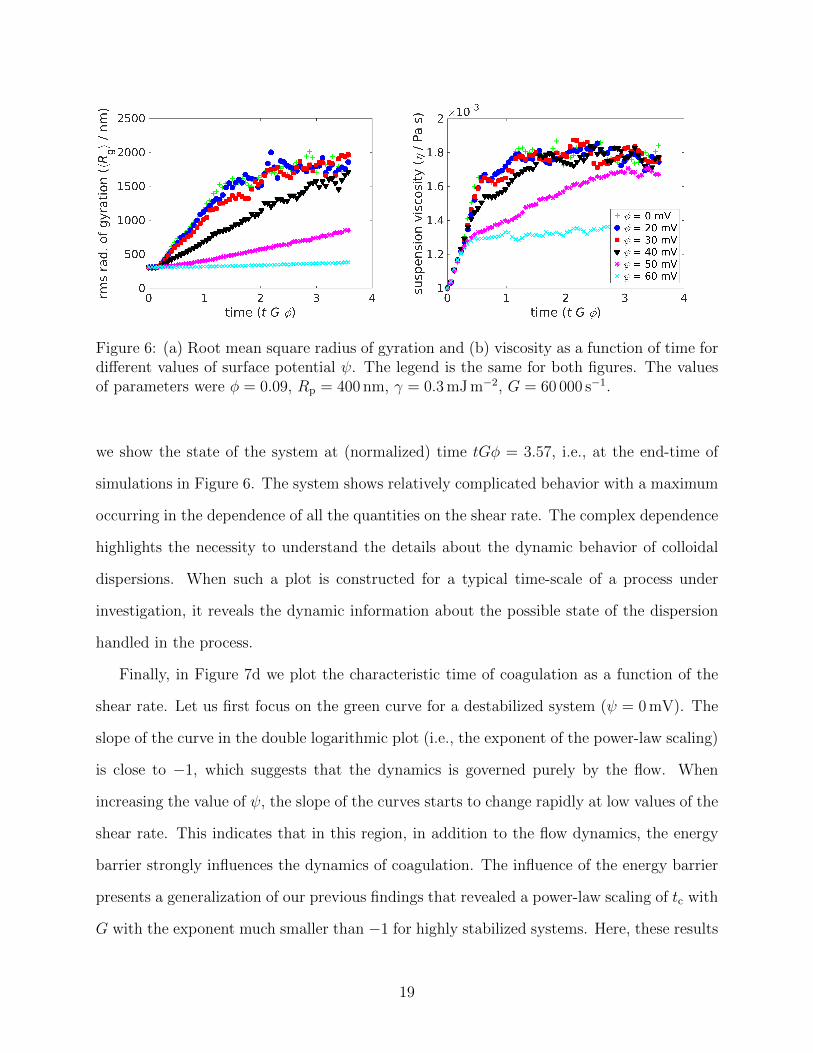
Figure 6: (a) Root mean square radius of gyration and (b) viscosity as a function of time fordifferent values of surface potential ψ. The legend is the same for both figures. The valuesof parameters were φ = 0.09, Rp = 400 nm, γ = 0.3 mJ m−2, G = 60 000 s−1.
we show the state of the system at (normalized) time tGφ = 3.57, i.e., at the end-time of
simulations in Figure 6. The system shows relatively complicated behavior with a maximum
occurring in the dependence of all the quantities on the shear rate. The complex dependence
highlights the necessity to understand the details about the dynamic behavior of colloidal
dispersions. When such a plot is constructed for a typical time-scale of a process under
investigation, it reveals the dynamic information about the possible state of the dispersion
handled in the process.
Finally, in Figure 7d we plot the characteristic time of coagulation as a function of the
shear rate. Let us first focus on the green curve for a destabilized system (ψ = 0 mV). The
slope of the curve in the double logarithmic plot (i.e., the exponent of the power-law scaling)
is close to −1, which suggests that the dynamics is governed purely by the flow. When
increasing the value of ψ, the slope of the curves starts to change rapidly at low values of the
shear rate. This indicates that in this region, in addition to the flow dynamics, the energy
barrier strongly influences the dynamics of coagulation. The influence of the energy barrier
presents a generalization of our previous findings that revealed a power-law scaling of tc with
G with the exponent much smaller than −1 for highly stabilized systems. Here, these results
19
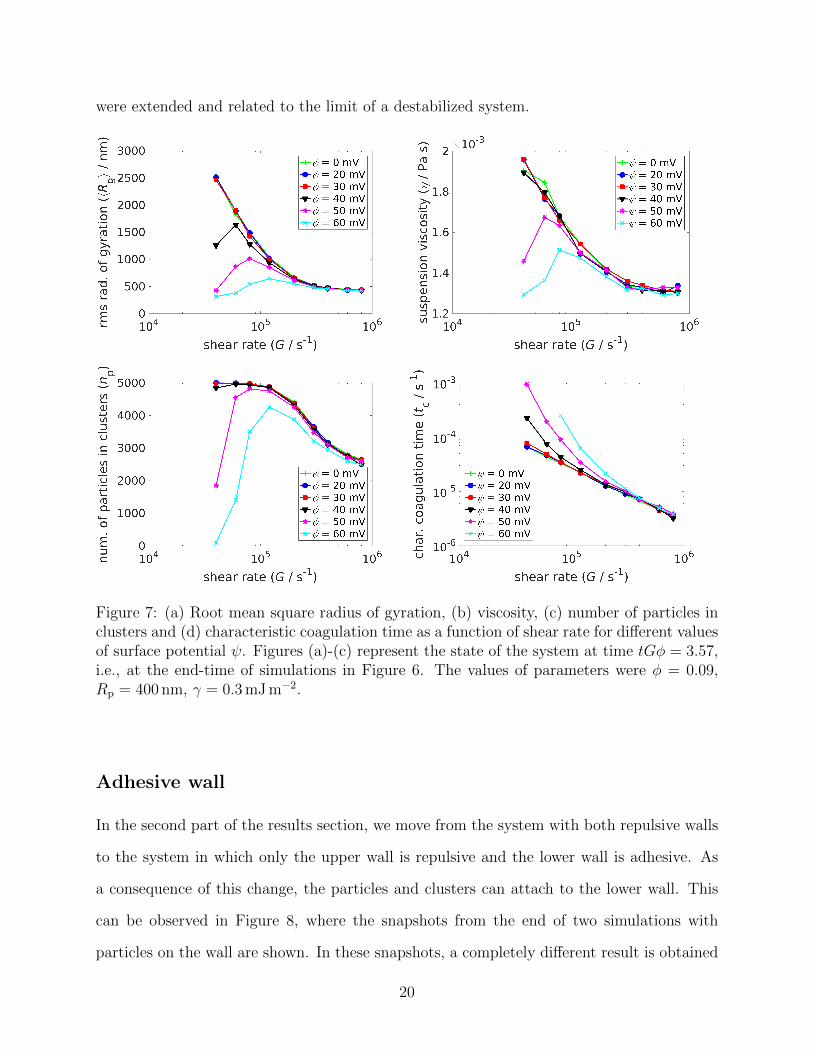
were extended and related to the limit of a destabilized system.
Figure 7: (a) Root mean square radius of gyration, (b) viscosity, (c) number of particles inclusters and (d) characteristic coagulation time as a function of shear rate for different valuesof surface potential ψ. Figures (a)-(c) represent the state of the system at time tGφ = 3.57,i.e., at the end-time of simulations in Figure 6. The values of parameters were φ = 0.09,Rp = 400 nm, γ = 0.3 mJ m−2.
Adhesive wall
In the second part of the results section, we move from the system with both repulsive walls
to the system in which only the upper wall is repulsive and the lower wall is adhesive. As
a consequence of this change, the particles and clusters can attach to the lower wall. This
can be observed in Figure 8, where the snapshots from the end of two simulations with
particles on the wall are shown. In these snapshots, a completely different result is obtained
20
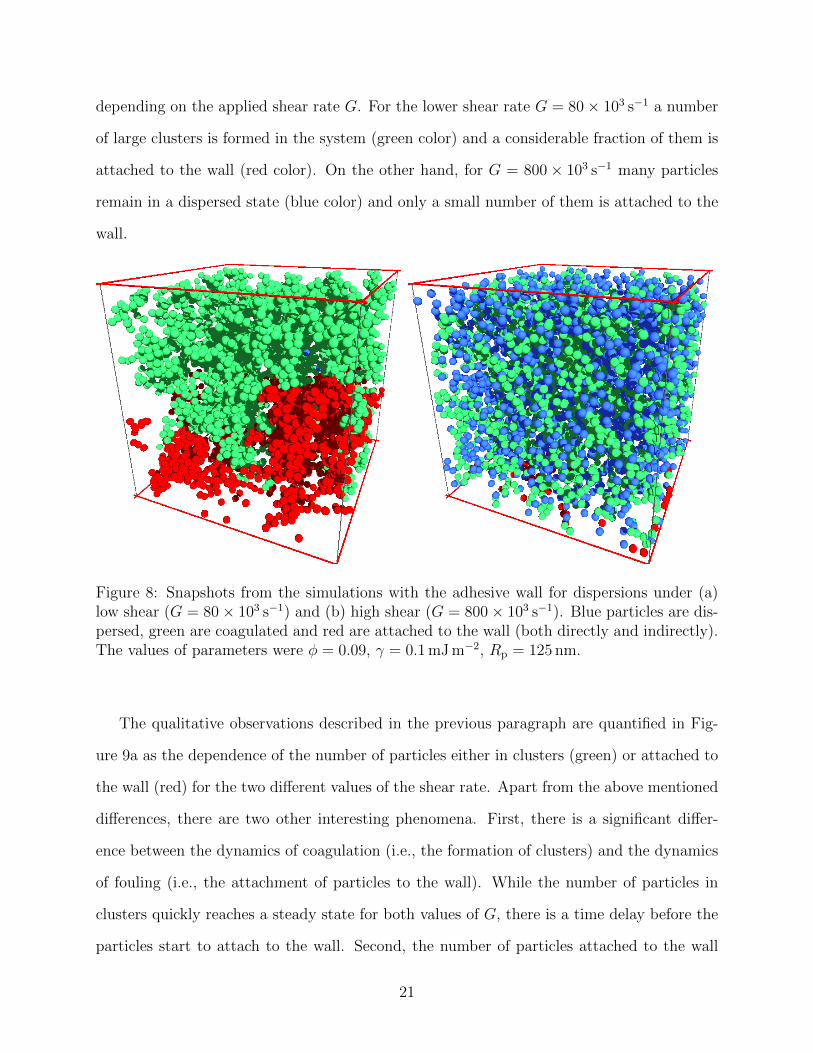
depending on the applied shear rate G. For the lower shear rate G = 80× 103 s−1 a number
of large clusters is formed in the system (green color) and a considerable fraction of them is
attached to the wall (red color). On the other hand, for G = 800× 103 s−1 many particles
remain in a dispersed state (blue color) and only a small number of them is attached to the
wall.
Figure 8: Snapshots from the simulations with the adhesive wall for dispersions under (a)low shear (G = 80× 103 s−1) and (b) high shear (G = 800× 103 s−1). Blue particles are dis-persed, green are coagulated and red are attached to the wall (both directly and indirectly).The values of parameters were φ = 0.09, γ = 0.1 mJ m−2, Rp = 125 nm.
The qualitative observations described in the previous paragraph are quantified in Fig-
ure 9a as the dependence of the number of particles either in clusters (green) or attached to
the wall (red) for the two different values of the shear rate. Apart from the above mentioned
differences, there are two other interesting phenomena. First, there is a significant differ-
ence between the dynamics of coagulation (i.e., the formation of clusters) and the dynamics
of fouling (i.e., the attachment of particles to the wall). While the number of particles in
clusters quickly reaches a steady state for both values of G, there is a time delay before the
particles start to attach to the wall. Second, the number of particles attached to the wall
21
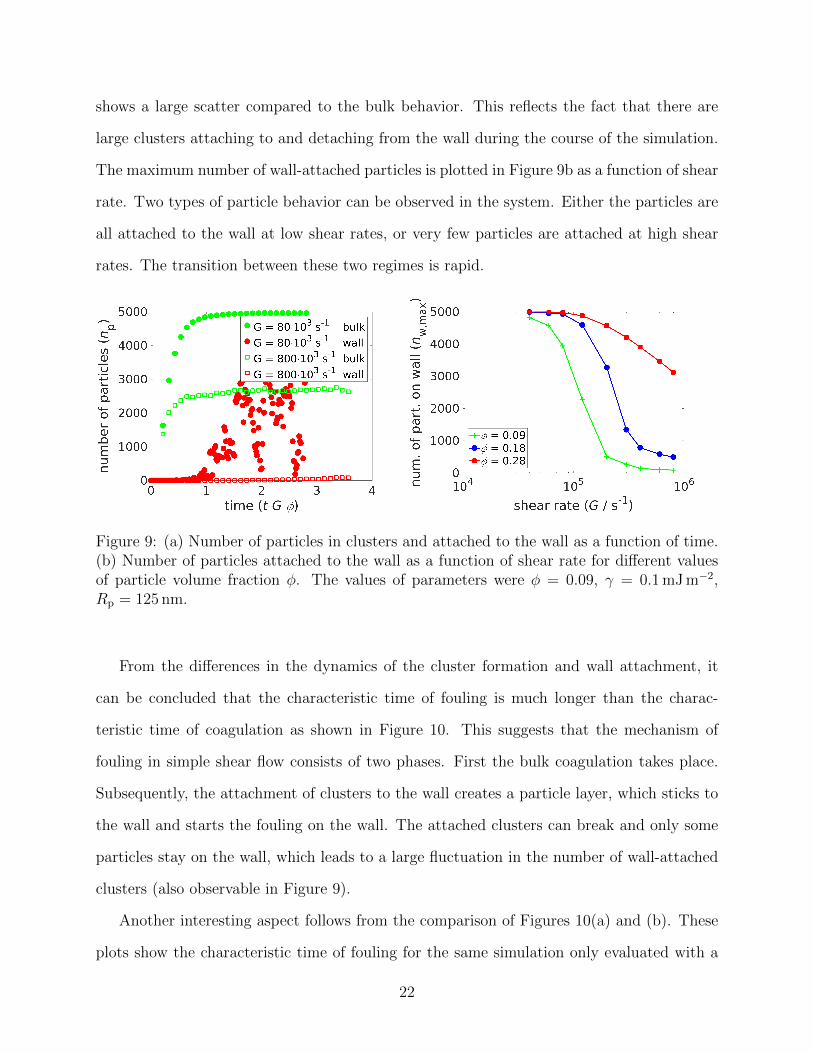
shows a large scatter compared to the bulk behavior. This reflects the fact that there are
large clusters attaching to and detaching from the wall during the course of the simulation.
The maximum number of wall-attached particles is plotted in Figure 9b as a function of shear
rate. Two types of particle behavior can be observed in the system. Either the particles are
all attached to the wall at low shear rates, or very few particles are attached at high shear
rates. The transition between these two regimes is rapid.
Figure 9: (a) Number of particles in clusters and attached to the wall as a function of time.(b) Number of particles attached to the wall as a function of shear rate for different valuesof particle volume fraction φ. The values of parameters were φ = 0.09, γ = 0.1 mJ m−2,Rp = 125 nm.
From the differences in the dynamics of the cluster formation and wall attachment, it
can be concluded that the characteristic time of fouling is much longer than the charac-
teristic time of coagulation as shown in Figure 10. This suggests that the mechanism of
fouling in simple shear flow consists of two phases. First the bulk coagulation takes place.
Subsequently, the attachment of clusters to the wall creates a particle layer, which sticks to
the wall and starts the fouling on the wall. The attached clusters can break and only some
particles stay on the wall, which leads to a large fluctuation in the number of wall-attached
clusters (also observable in Figure 9).
Another interesting aspect follows from the comparison of Figures 10(a) and (b). These
plots show the characteristic time of fouling for the same simulation only evaluated with a
22
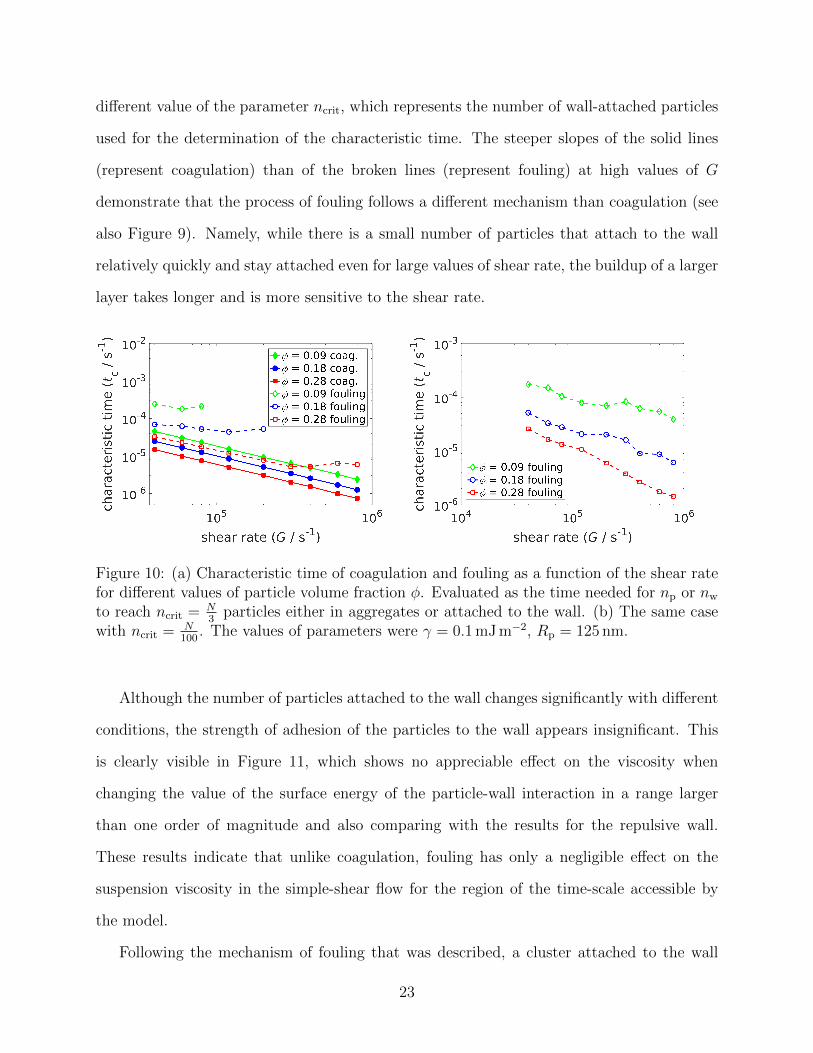
different value of the parameter ncrit, which represents the number of wall-attached particles
used for the determination of the characteristic time. The steeper slopes of the solid lines
(represent coagulation) than of the broken lines (represent fouling) at high values of G
demonstrate that the process of fouling follows a different mechanism than coagulation (see
also Figure 9). Namely, while there is a small number of particles that attach to the wall
relatively quickly and stay attached even for large values of shear rate, the buildup of a larger
layer takes longer and is more sensitive to the shear rate.
Figure 10: (a) Characteristic time of coagulation and fouling as a function of the shear ratefor different values of particle volume fraction φ. Evaluated as the time needed for np or nw
to reach ncrit = N3
particles either in aggregates or attached to the wall. (b) The same casewith ncrit = N
100. The values of parameters were γ = 0.1 mJ m−2, Rp = 125 nm.
Although the number of particles attached to the wall changes significantly with different
conditions, the strength of adhesion of the particles to the wall appears insignificant. This
is clearly visible in Figure 11, which shows no appreciable effect on the viscosity when
changing the value of the surface energy of the particle-wall interaction in a range larger
than one order of magnitude and also comparing with the results for the repulsive wall.
These results indicate that unlike coagulation, fouling has only a negligible effect on the
suspension viscosity in the simple-shear flow for the region of the time-scale accessible by
the model.
Following the mechanism of fouling that was described, a cluster attached to the wall
23
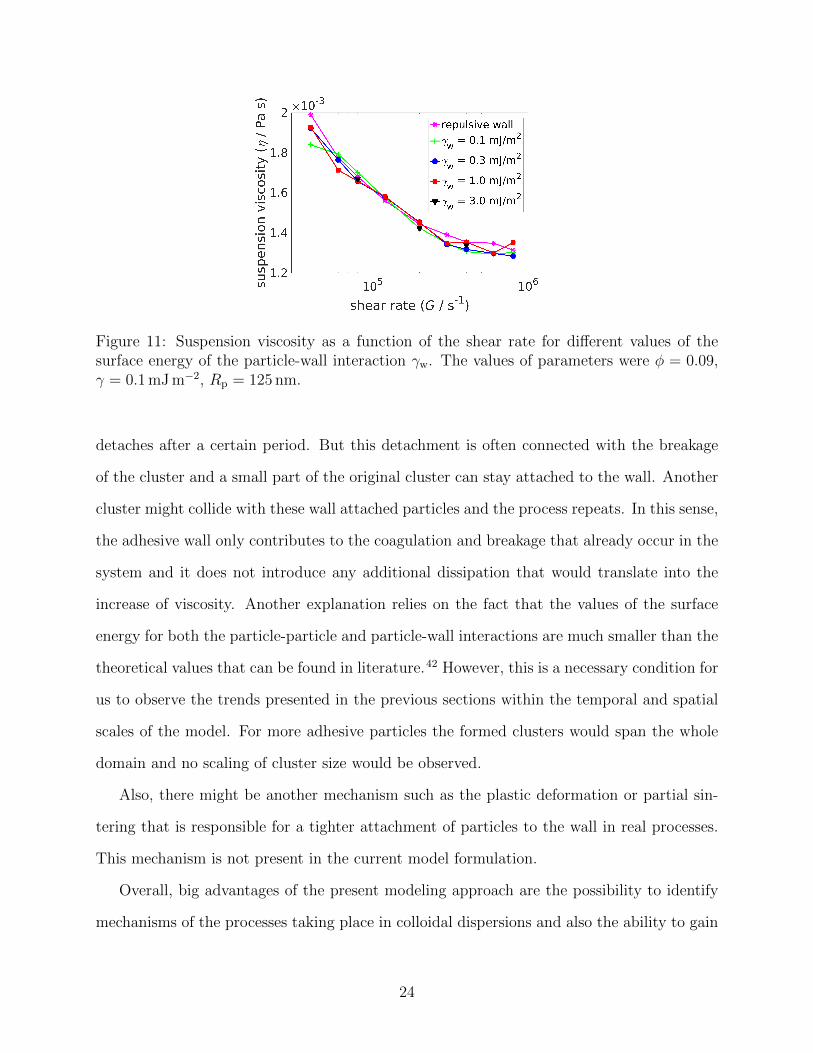
Figure 11: Suspension viscosity as a function of the shear rate for different values of thesurface energy of the particle-wall interaction γw. The values of parameters were φ = 0.09,γ = 0.1 mJ m−2, Rp = 125 nm.
detaches after a certain period. But this detachment is often connected with the breakage
of the cluster and a small part of the original cluster can stay attached to the wall. Another
cluster might collide with these wall attached particles and the process repeats. In this sense,
the adhesive wall only contributes to the coagulation and breakage that already occur in the
system and it does not introduce any additional dissipation that would translate into the
increase of viscosity. Another explanation relies on the fact that the values of the surface
energy for both the particle-particle and particle-wall interactions are much smaller than the
theoretical values that can be found in literature.42 However, this is a necessary condition for
us to observe the trends presented in the previous sections within the temporal and spatial
scales of the model. For more adhesive particles the formed clusters would span the whole
domain and no scaling of cluster size would be observed.
Also, there might be another mechanism such as the plastic deformation or partial sin-
tering that is responsible for a tighter attachment of particles to the wall in real processes.
This mechanism is not present in the current model formulation.
Overall, big advantages of the present modeling approach are the possibility to identify
mechanisms of the processes taking place in colloidal dispersions and also the ability to gain
24
insight into these processes. However, these results are difficult to test experimentally in a
direct way. A possible indirect form of validation may consist in using the population balance
equations (PBE) modeling approach that is already available in literature33 and that relies
on the identification of mechanisms leading to fouling and the estimation of rate constants.
Both these information result directly from our model. Subsequently, the outcome of the
PBE model can be compared to experimental results at a reactor-scale, such as those in the
recently published study of reactor fouling by colloidal latexes.1
Conclusions
The processes of coagulation and fouling in stabilized colloidal dispersions were modeled
using the discrete element method. Coagulation, i.e., the formation of clusters in the bulk,
was shown to be much faster than fouling, i.e., the attachment of primary particles or
clusters to the wall. However, the kinetics of coagulation is highly affected by the degree of
stabilization in the sense that more stabilized latexes retain their dispersed state for a longer
time. The viscosity evaluated from the model was shown to be sensitive to this delay in the
cluster growth. Moreover, the relation between the viscosity and the cluster size was observed
also for the effect of various parameters, such as the primary particle size and surface energy.
These findings are promising for the concept of using viscosity measurement as a probe for
the determination of the dispersion properties. On the other hand, fouling did not have any
observable effect on the dispersion viscosity in the simulations that were performed in the
simple shear flow. A different type of flow can lead to different results in this respect and the
issue still remains an open question. In this study, the mechanism of fouling in the simple
shear flow was revealed by a thorough analysis. The mechanism consists in the dynamic
attachment and detachment of clusters to and from the wall. Therefore, the presence of an
adhesive wall only contributes to the coagulation and breakage that already take place in the
system and does not result in the increase of viscosity. The results of this study represent
25
an advance in the theoretical understanding of the field of colloidal science. The observed
sensitivity of viscosity to dispersion properties is relevant also for industrial applications. It
contributes to the usage of first principle models in areas, where only empirical knowledge
was used up to now.
Acknowledgement
The authors are grateful for the support provided by EC SPIRE project RECOBA (H2020-
636820) and by Czech Science Foundation (GACR) project 16-22997S. Financial support
from specific university research (MSMT No 20-SVV/2016) is gratefully acknowledged.
References
(1) Urrutia, J.; Pea, A.; Asua, J. M. Reactor Fouling by Preformed Latexes. Macromolec-
ular Reaction Engineering 2016, DOI: 10.1002/mren.201600043.
(2) Soos, M.; Moussa, A. S.; Ehrl, L.; Sefcik, J.; Wu, H.; Morbidelli, M. Effect of shear rate
on aggregate size and morphology investigated under turbulent conditions in stirred
tank. J. Colloid Interface Sci. 2008, 319, 577–589.
(3) Zaccone, A.; Soos, M.; Lattuada, M.; Wu, H.; Baebler, M. U.; Morbidelli, M. Breakup of
dense colloidal aggregates under hydrodynamic stresses. Phys. Rev. E: Stat., Nonlinear,
Soft Matter Phys. 2009, 79, 061401–1–061401–5.
(4) Harada, S.; Tanaka, R.; Nogami, H.; Sawada, M. Dependence of fragmentation behavior
of colloidal aggregates on their fractal structure. J. Colloid Interface Sci. 2006, 301,
123–129.
(5) Conchuir, B. O.; Harshe, Y. M.; Lattuada, M.; Zaccone, A. Analytical Model of Fractal
26
Aggregate Stability and Restructuring in Shear Flows. Ind. Eng. Chem. Res. 2014, 53,
9109–9119.
(6) Kroupa, M.; Vonka, M.; Soos, M.; Kosek, J. Size and Structure of Clusters Formed by
Shear Induced Coagulation: Modeling by Discrete Element Method. Langmuir 2015,
31, 7727–7737.
(7) Guery, J.; Bertrand, E.; Rouzeau, C.; Levitz, P.; Weitz, D. A.; Bibette, J. Irreversible
shear-activated aggregation in non-Brownian suspensions. Phys. Rev. Lett. 2006, 96,
198301–1 – 198301–4.
(8) Zaccone, A.; Gentili, D.; Wu, H.; Morbidelli, M. Shear-induced reaction-limited aggre-
gation kinetics of Brownian particles at arbitrary concentrations. J. Chem. Phys. 2010,
132, 134903–1 – 134903–6.
(9) Mewis, J.; Wagner, N. Colloidal Suspension Rheology ; Cambridge Series in Chemical
Engineering; Cambridge University Press, 2012.
(10) Visser, J.; Jeurnink, T. J. M. Fouling of heat exchangers in the dairy industry. Experi-
mental Thermal and Fluid Science 1997, 14, 407–424.
(11) Bansal, B.; Chen, X. D. A critical review of milk fouling in heat exchangers. Compre-
hensive Reviews In Food Science and Food Safety 2006, 5, 27–33.
(12) Bouhabila, E.; Ben Aim, R.; Buisson, H. Fouling characterisation in membrane biore-
actors. Separation and Purification Technology 2001, 22-3, 123–132.
(13) Delgado, S.; Villarroel, R.; Gonzalez, E. Effect of the shear intensity on fouling in sub-
merged membrane bioreactor for wastewater treatment. Journal of Membrane Science
2008, 311, 173–181.
(14) Henry, C.; Minier, J. P.; Lefevre, G. Towards a description of particulate fouling: From
27
single particle deposition to clogging. Advances In Colloid and Interface Science 2012,
185, 34–76.
(15) Henry, C.; Minier, J. P.; Lefevre, G.; Hurisse, O. Numerical Study on the Deposition
Rate of Hematite Particle on Polypropylene Walls: Role of Surface Roughness. Lang-
muir 2011, 27, 4603–4612.
(16) Henry, C.; Minier, J. P.; Lefevre, G. Numerical Study on the Adhesion and Reentrain-
ment of Nondeformable Particles on Surfaces: The Role of Surface Roughness and
Electrostatic Forces. Langmuir 2012, 28, 438–452.
(17) Agbangla, G. C.; Climent, E.; Bacchin, P. Numerical investigation of channel blockage
by flowing microparticles. Computers & Fluids 2014, 94, 69–83.
(18) Agbangla, G. C.; Bacchin, P.; Climent, E. Collective dynamics of flowing colloids during
pore clogging. Soft Matter 2014, 10, 6303–6315.
(19) Dupuy, M.; Xayasenh, A.; Duval, H.; Waz, E. Analysis of non-Brownian particle depo-
sition from turbulent liquid-flow. Aiche Journal 2016, 62, 891–904.
(20) Marshall, J. S. Discrete-element modeling of particulate aerosol flows. J. Comput. Phys.
2009, 228, 1541–1561.
(21) Peters, J.; Heller, W. Mechanical and Surface Coagulation .2. Coagulation By Stirring
of Alpha-feooh-sols. Journal of Colloid and Interface Science 1970, 33, 578–&.
(22) Heller, W.; Peters, J. Mechanical and Surface Coagulation .1. Surface Coagulation of
Alpha Feooh Sols. Journal of Colloid and Interface Science 1970, 32, 592–&.
(23) De Lauder, W. B.; Heller, W. Mechanical and Surface Coagulation .5. Role of Solid-
liquid Interface and of Turbulence In Mechanical Coagulation. Journal of Colloid and
Interface Science 1971, 35, 308–&.
28
(24) Sjollema, J.; Busscher, H. J. Deposition of Polystyrene Particles In A Parallel Plate Flow
Cell .1. the Influence of Collector Surface-properties On the Experimental Deposition
Rate. Colloids and Surfaces 1990, 47, 323–336.
(25) Georgieva, K.; Dijkstra, D. J.; Fricke, H.; Willenbacher, N. Clogging of microchannels
by nano-particles due to hetero-coagulation in elongational flow. Journal of Colloid and
Interface Science 2010, 352, 265–277.
(26) Kumar, D.; Bhattacharya, S.; Ghosh, S. Weak adhesion at the mesoscale: particles at
an interface. Soft Matter 2013, 9, 6618–6633.
(27) Mustin, B.; Stoeber, B. Single Layer Deposition of Polystyrene Particles onto Planar
Polydimethylsiloxane Substrates. Langmuir 2016, 32, 88–101.
(28) Li, S. Q.; Marshall, J. S.; Liu, G. Q.; Yao, Q. Adhesive particulate flow: The discrete-
element method and its application in energy and environmental engineering. Progress
In Energy and Combustion Science 2011, 37, 633–668.
(29) Boor, B. E.; Siegel, J. A.; Novoselac, A. Monolayer and Multilayer Particle Deposits
on Hard Surfaces: Literature Review and Implications for Particle Resuspension in the
Indoor Environment. Aerosol Science and Technology 2013, 47, 831–847.
(30) Chen, S.; Liu, W. W.; Li, S. Q. Effect of long-range electrostatic repulsion on pore
clogging during microfiltration. Physical Review E 2016, 94, 063108.
(31) Yue, C.; Zhang, Q.; Zhai, Z. Q. Numerical simulation of the filtration process in fibrous
filters using CFD-DEM method. Journal of Aerosol Science 2016, 101, 174–187.
(32) Shahzad, K.; D’Avino, G.; Greco, F.; Guido, S.; Maffettone, P. L. Numerical investiga-
tion of hard-gel microparticle suspension dynamics in microfluidic channels: Aggrega-
tion/fragmentation phenomena, and incipient clogging. Chemical Engineering Journal
2016, 303, 202–216.
29
(33) Lazzari, S. Modeling simultaneous deposition and aggregation of colloids. Chemical
Engineering Science 2016, 155, 469–481.
(34) Kroupa, M.; Vonka, M.; Kosek, J. Modeling the Mechanism of Coagulum Formation
in Dispersions. Langmuir 2014, 30, 2693–2702.
(35) Kroupa, M.; Vonka, M.; Soos, M.; Kosek, J. Utilizing the Discrete Element Method for
the Modeling of Viscosity in Concentrated Suspensions. Langmuir 2016, 32, 8451–8460.
(36) Crowe, C.; Sommerfeld, M.; Tsuji, Y. Multiphase Flows with Droplets and Particles ;
CRC Press, Boca Raton, 1998.
(37) Marshall, J. S. Particle aggregation and capture by walls in a particulate aerosol channel
flow. J. Aerosol Sci. 2007, 38, 333–351.
(38) www.openfoam.org.
(39) Dance, S. L.; Maxey, M. R. Incorporation of lubrication effects into the force-coupling
method for particulate two-phase flow. Journal of Computational Physics 2003, 189,
212–238.
(40) Israelachvili, J. Intermolecular and Surface Forces ; Elsevier Science, 2010.
(41) Cowley, A. C.; Fuller, N. L.; Rand, R. P.; Parsegian, V. A. Measurement of Repulsive
Forces Between Charged Phospholipid Bilayers. Biochemistry 1978, 17, 3163–3168.
(42) Hunter, R. J. Foundations of Colloid Science, 2nd Edition.; Oxford University Press,
2001.
(43) Johnson, K. L.; Kendall, K.; Roberts, A. D. Surface Energy and Contact of Elastic
Solids. Proc. R. Soc. A 1971, 324, 301–313.
30
(44) Schmitt, F. J.; Ederth, T.; Weidenhammer, P.; Claesson, P.; Jacobasch, H. J. Direct
force measurements on bulk polystyrene using the bimorph surface forces apparatus. J.
Adhes. Sci. Technol. 1999, 13, 79–96.
(45) Hodges, C. S.; Cleaver, J. A. S.; Ghadiri, M.; Jones, R.; Pollock, H. M. Forces between
polystyrene particles in water using the AFM: Pull-off force vs particle size. Langmuir
2002, 18, 5741–5748.
(46) ODEPACK library. http://www.netlib.org/.
31