knowledge construction from time series data using a collaborative exploration system
TRANSCRIPT
Available online at www.sciencedirect.com
www.elsevier.com/locate/yjbin
Journal of Biomedical Informatics 40 (2007) 672–687
Knowledge construction from time series data usinga collaborative exploration system
Thomas Guyet a,*, Catherine Garbay b, Michel Dojat c,d
a CNRS—TIMC/LIG—Grenoble, Franceb CNRS—LIG—Grenoble, Francec Inserm, U836, Grenoble, France
d Universite Joseph Fourier, Institut des Neurosciences, Grenoble, France
Received 22 September 2006Available online 9 October 2007
Abstract
This paper deals with the exploration of biomedical multivariate time series to construct typical parameter evolution or scenarios.This task is known to be difficult: the temporal and multivariate nature of the data at hand and the context-sensitive aspect of data inter-pretation hamper the formulation of a priori knowledge about the kind of patterns that can be detected as well as their interrelations.This paper proposes a new way to tackle this problem based on a human–computer collaborative approach involving specific annota-tions. Three grounding principles, namely autonomy, adaptability and emergence, support the co-construction of successive abstractionlevels for data interpretation. An agent-based design is proposed to support these principles. Preliminary results in a clinical context arepresented to support our proposal. A comparison with two well-known time series exploration tools is furthermore performed.� 2007 Elsevier Inc. All rights reserved.
Keywords: Human/Machine interface; Collaborative systems; Data interpretation; Intensive care data; Multi-agent system; Knowledge discovery
1. Introduction
Making life-critical decisions based on multivariate timeseries data is a relatively common task in medical domains.This task turns out to be of particular importance in the con-text of ICU (Intensive Care Unit) patient monitoring. Asrather commonly recognized, the large mass of data that ismade available to ICU staff may not be fully exploited dueto a lack of time, a lack of staff, and a lack of formalizedknowledge. The need for computer assistance in this specificdomain has already been pointed out and is widely admitted.
Considering the lack of formalized knowledge to designsuch a computerized assistant, we rather explore the poten-tial of a man–machine collaborative approach as a prelimin-ary step. The goal is to extract chunks of knowledge that willbring a better understanding of the data at hand and supportforthcoming decision making process. Data exploration is
1532-0464/$ - see front matter � 2007 Elsevier Inc. All rights reserved.
doi:10.1016/j.jbi.2007.09.006
* Corresponding author. Fax: +33 4 56 52 00 22.E-mail address: [email protected] (T. Guyet).
therefore required. It consists of (1) the focus of the attentionon the segments of interest, (2) the extraction of significantpatterns, (3) the combination of them to construct meaning-ful scenarios, and finally (4) the verification of the adequacyand significance of the produced chunks of knowledge.
Considering the combinatorial character of these tasks,an incremental approach is proposed in which both,human and machine, collaborate toward the progressiveexploration of the data at hand and the gradual construc-tion and refinement of the data processing models. Anno-tations are advocated as an elegant and efficient way ofcommunication between human and machine. They maybe provided, at various abstraction levels, in the form ofsegment delineations or symbolic labeling. Starting with alimited range of manually provided annotations, the sys-tem is meant to build its own models, delineate new seg-ments, label new patterns, and thus further annotate thedata. The clinician may intervene at any time during thisprocess to provide further annotations, or modify currentsegment delineation and labeling.
T. Guyet et al. / Journal of Biomedical Informatics 40 (2007) 672–687 673
Our design is grounded on three main principles, namelyautonomy (ability to learn), adaptability (ability to copewith the pattern variability and heterogeneity of featuresassociated with each class), and emergence (co-evolutionof the models and annotations in the course of man–machine collaboration). An agent-centered design is pro-posed as a way to computerize these principles.
The structure of the paper is as follows. Section 2 isdevoted to a brief state of the art on collaborative knowl-edge construction and data exploration. The proposed col-laborative approach is described in Section 3 and the multi-agent architecture is presented in Section 4. Experimentalresults on ventilation asynchronies are presented in Section5 and followed by a discussion in Section 6.
2. State of the art
2.1. Issues in knowledge acquisition
Since the early work on expert system design, humanknowledge acquisition has remained a critical but open issue.Research efforts have rapidly been devoted to data-drivenknowledge extraction to cope with the growing need for masstreatment. In most fields of medicine the number of variablesis indeed increasing in a way which precludes medical judg-ment by humans, as pointed out by [1]. This statement espe-cially holds in the field of ICU, one of the most data intensiveenvironments in medicine [2]. In [2] a comparison betweendata-driven temporal abstraction, which exploits quantita-tive featuring in the framework of knowledge discovery tech-niques, and knowledge-driven abstraction, which exploitsexpert knowledge expressed in qualitative form, has beenconducted. Both approaches have been evaluated on theircapacity to predict whether post-surgical patients wouldneed mechanical ventilation for longer than 24 h. Thedata-driven approach has been found to provide more infor-mative cues, thus resulting in better predictions.
More recently, various attempts have been made toarticulate quantitative measurements with a more quali-tative style of reasoning. The necessity to mix data-cen-tered analysis with human-driven reasoning has beenwidely recognized. Nowadays, data mining is increasinglyconsidered as a cooperative process relying on back-ground knowledge to drive data exploration; the meansto integrate the newly acquired findings within the expertknowledge are furthermore increasingly considered.Zupan et al. [3] propose the notion of ‘‘knowledge cir-cle’’ to formalize the necessary alternation betweenknowledge-driven data analysis and data-driven knowl-edge construction. As mentioned by the authors, theautomation of this cycle, although highly desired, israrely achieved in real-world applications.
2.2. Collaborative knowledge construction
The notion of ‘‘Balanced Cooperative Modelling’’ wasearly proposed by Morik et al. [4], as a multi-strategy
approach to domain modelling. A balanced interactionbetween system and user was proposed to enrich thedomain knowledge. In further work [1], the authors pres-ent an approach involving intelligent data analysistogether with knowledge acquisition from experts to sup-port the development of operational protocols in theintensive care field. The guiding principle aims at enrich-ing the knowledge available by mixing various knowl-edge sources. In addition, the authors emphasize thegain in robustness that may be obtained by ‘‘cross-vali-dating’’ the knowledge sources: while human knowledgemay gain from a confrontation to machine-driven con-structs, the necessity to incorporate newly discoveredfindings into already formalized expert knowledge func-tions as a form of validation.
Going a step further, Shroeder and Bazzan [5] propose acombination of learning algorithms in a multi-agent frame-work to improve individual models through knowledgesharing. This environment, called MASKS (Multi-AgentSystem based on Knowledge Sharing) proved to be efficientwhen applied in bio-informatics. Each agent which isderived of machine learning algorithm generates a set ofrules. The cooperative learning, based on pair wised inter-actions, improves the quality of already established rules.Two agents may match or merge their rules by comparingtheir classification results and exchange their models. Thesystem outperforms the results obtained by a singlemachine learning algorithm and thus indicates that collab-oration may support efficient knowledge discovery.
2.3. Collaborative data exploration
Collaborative data exploration is a complement to thecollaborative knowledge construction in the developmentof rich ‘‘knowledge cycles’’. Indeed, while there must beways to integrate machine discovered findings in therealm of human conceptual knowledge, there must beways for the human to check the validity of his/her mod-els against the data at hand. Collaborative data explora-tion is thus a way to investigate complex scenes, tosuggest changes in attention focus, to question the pro-posed modeling, or to test new hypotheses. The knowl-edge circle may then be fully approached by mixing theexploration at the machine initiative (the integration ofmachine discovered findings within the realm of humanconcepts) and the exploration at the human initiativewith the confrontation of human knowledge against therealm of data.
Several tools have been proposed such as BinX [6],QuerySketch [7] or TimeTunnel [8], providing support forthe interactive visualization and exploration of time-oriented clinical data. Going a step further towards thetemporal abstractions handling, the driving view inKNAVE and then KNAVE II [9] was to develop a processable to embody domain-independent abstraction methodswhile exploiting domain-specific temporal-abstractionknowledge.
674 T. Guyet et al. / Journal of Biomedical Informatics 40 (2007) 672–687
Recent research efforts have been devoted to the integra-tion of knowledge discovery tools to support in-depthexploration of time series. VizTree [10] has been designedas a pattern discovery and visualization system able tosummarize both the global and local structures of time ser-ies data. It is based on SAX [11], a symbolic representationfor time series, and on a modified suffix tree to encode theproperties of data. VizTree provides a rather intuitive wayto interact with the input data and the corresponding struc-tures. It provides novel interactive solutions to many pat-tern discovery problems, such as motif discovery,anomaly detection, and query by content. TimeSearcher2[12] is rather oriented towards the interactive formulationand modification of user-defined queries. This is achievedby so-called ‘‘TimeBoxes’’, a kind of graphical widget bywhich the user may point out different patterns of interest.Conjunctive or disjunctive queries may further beexpressed as the combination of multiple query items. Uti-lizing this mechanism users may look for time series exhib-iting specific patterns as specified in the query.
3. Methodological approach
3.1. Time series interpretation
Temporal data abstraction is known to be a core issuein medicine, and there is a wide literature tackling thisissue in various medical domains [13]. Such processingstill remains challenging, due to the necessity to considercompound objects (e.g. disorders, treatments, or patientstates). These exhibit different temporal existences andcomplex interactions through mechanisms that are notcompletely understood. The complexity of this processhas been particularly well addressed by Shahar [14],who quoted the necessity to articulate several mecha-nisms operating at various abstraction levels andgrounded on explicit knowledge. The study of specificmechanisms goes beyond the scope of this paper, there-fore we focus in this section on an overview of our basicassumptions.
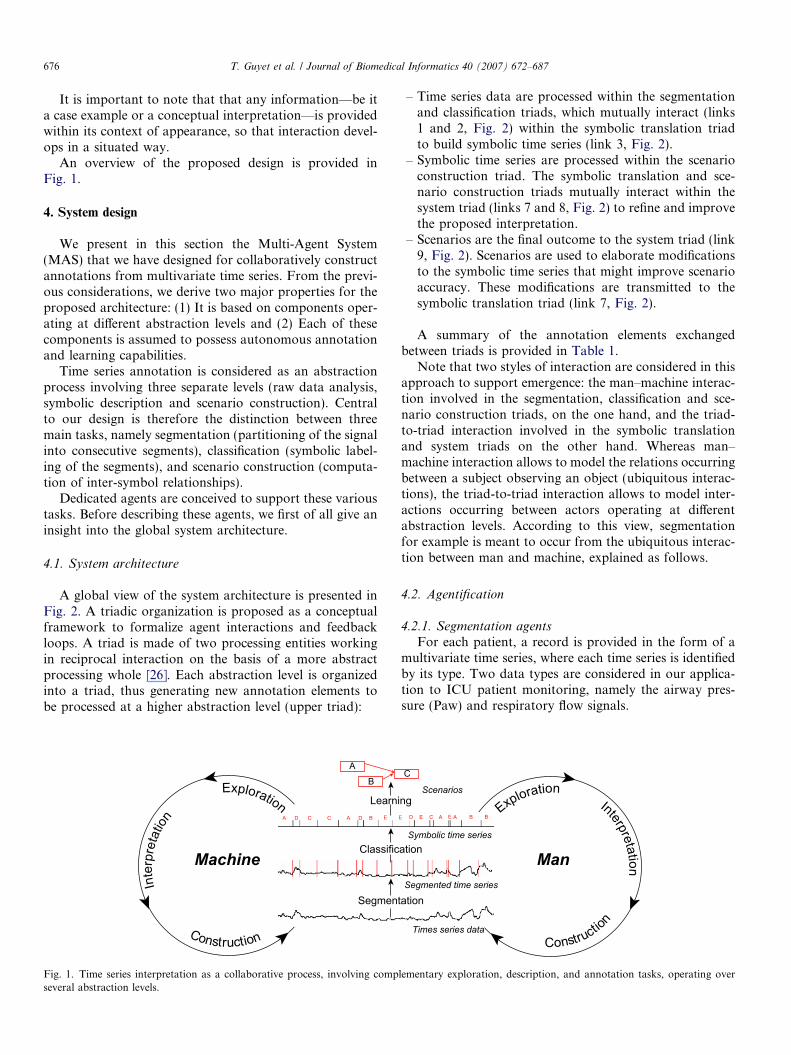
We consider time series interpretation as a mere abstrac-tion process by which more abstract annotations are pro-gressively elaborated and attached to the raw data. Inour system, several steps are necessary before reachingthe most abstract annotation, i.e. the scenarios:
– Segmentation: The goal of this step is to achieve a preli-minary description of the data as a set of temporalmeaningful segments. These segments are detected inde-pendently for each time series.
– Symbolic time series transformation: The goal of thisstep is to transform the signal-level information intosymbolic form. Each segment in each time series is givena symbolic ‘‘name’’. A symbol is related to models ofevents. Successive segments are then concatenated toconstitute symbolic time series, in which the temporalinformation is preserved.
– Scenario construction: A set of frequent time-stampedsymbols is extracted from the symbolic time series,together with their temporal constraints in order to buildscenarios from the available multivariate information.
This abstraction process, when not carefully performed,is known to result into so-called ‘‘semantic gap’’ problems.In such a case the proposed symbolic information derivesfrom a rather high level conceptual view on the problemat hand, rather than reflecting the effective properties ofthe data under consideration. In other words, in a medicalcontext it is difficult for a clinician to relate his or herknowledge to the processing style of the machine.
Four major assumptions are made in this respect:
– A priori knowledge is needed at each processing step,whatever its abstraction level, but sparse and difficultto acquire;
– Knowledge must be anchored in the realm of data, i.e.situated, rather than relying on global modelinghypotheses;
– An incremental processing style is necessary to refine theanalysis and accumulate progressively more robustknowledge;
– Augmented styles of collaboration between man andmachine are needed to ensure a proper formulationand transmission of knowledge.
3.2. Human–machine collaboration
We propose to approach the interpretation of time seriesdata as performed by two cooperating agents—a man anda machine—operating across three successive abstractionlevels (segments, symbolic time series, and scenarios). Con-sidering that these are complementary, this collaboration isnecessary to cope with the complexity of the interpretationprocess. The clinician is recognized as able to take accuratedecisions in rather complex situations, by integrating awide range of contextual information and keeping a globaloutlook over the data at hand. Conversely, the machine isable to process large amounts of data under complexnumerical constraints.
The collaboration or cooperation ‘‘occurs when two ormore agents work together in a common environment tomore effectively reach the maximal union of their goal’’[15]. In [16], the authors define the main characteristicsexpected for man–machine collaboration system based onthe study of man–man cooperation. Following theseauthors, the system must:
– Operate within an acceptable framework ofcoordination.
– Be able to recognize and accept the collaborator’s goalswhen declared.
– Be able to interactively work toward super ordinategoals in solving complex tasks.
T. Guyet et al. / Journal of Biomedical Informatics 40 (2007) 672–687 675
– Offer alternative solutions to the problem addressed.– Operate to support the formation of new attitudes
(adaptation).
Although considering the collaboration between men as amodel for man–machine collaboration can be criticized [17],it gives us a frame of reference for collaborative approaches.
The mixed-initiative approach [18] appears to date asthe more elaborated tentative to achieve these characteris-tics. In a mixed-initiative system both the system and theuser have balanced contributions for problem solving. Asynergy between the two agents is expected to fruitfullyintegrate complementary abilities to be globally more effi-cient. In [19], an assistant for exploratory data analysishas been developed based on this approach.
In the same vein, we propose an approach based on a‘‘structural coupling’’ [20] between man and machine toreach collaboration. The man and machine ‘‘may becomereciprocally structurally coupled through their reciprocalselection of plastic structural changes during their historyof interactions. In such a case, the structurally plasticchanges of state of one system become perturbations forthe other, and vice versa, in a manner that establishes aninterlocked, mutually selecting, mutually triggering domainof state trajectories’’ [21]. We point out three differencesbetween a mixed-initiative approach and the proposedstructural coupling approach:
– The role of our system is not to recognize the humanneeds in order to assist her/him, but to contribute in abalanced way to the solution.
– In our system man and machine share a common goal.– The adaptation during the problem solving process is
central in the structural coupling approach.
In a way similar to the talking heads of Steels [22], whichinteract to build a shared lexicon, based on their indepen-dent perception and analysis of geometrical figures, we pro-pose to consider both the clinician and the machine asagents who share a common environment (e.g. time seriesdata, segments, scenarios, etc.), and mutually interact toprogressively refine their interpretation.
In the absence of consistent a priori knowledge and con-sidering the degree of difficulty of this process, an activepartnership between man and machine is to be sought. Itdoes not only consist of a fixed request–answer interactionscheme in which each partner is meant to compensate forthe lack of knowledge of its partner, and therefore sup-posed to share its world of meaning. Based on [22,23], thispartnership is rather meant to allow a co-construction ofmeaning, in which the interpretation of facts is not definedbeforehand by one of the partners, but co-constructed inthe course of their interactions.
Annotation [24] is a core concept to cope with these dif-ficult issues. It receives a growing interest in the co-designfield, and has been shown to support the dynamics of co-operation. Annotations may be seen as tangible marks that
can be managed by the partners, i.e. they enable the co-construction of objects. They may also be seen as tangiblesigns that make sense, i.e. they are the materialization ofcontextual knowledge that may be shared among the part-ners. According to this principle, each partner is in turngiven the possibility to observe and interpret annotationsprovided by its partner, and/or to propose annotationsjudged as appropriate according to a given interpretationfocus. In such a framework, each partner is meant to rea-son in its own world of meaning, thus preserving its auton-omy. Interpretation is not considered as a context-freeattribution of meaning, but as grounded in each partner’sexperience. There is no prevalence of one partner overanother, rather, there is a possibility of learning and dis-covery for both partners.
3.3. Proposed design
Based on the previous assumptions, we define interpre-tation as a complex process involving complementaryexploration, description, and annotation tasks. These tasksare operated by a collection of autonomous agents (man ormachine), who work in collaboration to progressivelyrefine the annotation [25]. The role of the exploration taskis to focus the attention, at each abstraction level, on rele-vant information, in terms of time series segments, eventclasses or typical event relations. The description andannotation tasks are situated in a dynamic context whichincludes the agent past experience and external informationon data. The description task role is to build numerical andsymbolical models of the information in the interest to fuserelevant information. Finally, the annotation task role is toannotate new raw data using the constructed models.
As we consider that there is neither a grammatical norsemantical representation of the world available before-hand, interaction has to take place across several abstrac-tion levels. Therefore, the so-called ‘‘language game’’ [22]occurs at the three successive levels of time series segmen-tation, symbolic transformation, and scenario construc-tion. In the course of the interaction process, each agentproposes in turn its own interpretation and/or points outinstances for a given interpretation, according to the fol-lowing typical scenario:
– ‘‘Machine’’ side: Segmentation, symbolization, and sce-nario construction results are proposed to the human.
– ‘‘User’’ side: The user reacts asynchronously (at anytime and any processing level) by annotating the pro-posed interpretation, i.e. inserting for instance a differ-ent view on segmentation. She/he may also point outfurther examples of a given concept, according to itsown view.
– ‘‘Machine’’ side: In response to the proposed user anno-tation, the machine may learn new ways for data inter-pretation and suggest further analysis. It may alsopoint out further examples for a given concept, accord-ing to some similarity measure.
676 T. Guyet et al. / Journal of Biomedical Informatics 40 (2007) 672–687
It is important to note that that any information—be ita case example or a conceptual interpretation—is providedwithin its context of appearance, so that interaction devel-ops in a situated way.
An overview of the proposed design is provided inFig. 1.
4. System design
We present in this section the Multi-Agent System(MAS) that we have designed for collaboratively constructannotations from multivariate time series. From the previ-ous considerations, we derive two major properties for theproposed architecture: (1) It is based on components oper-ating at different abstraction levels and (2) Each of thesecomponents is assumed to possess autonomous annotationand learning capabilities.
Time series annotation is considered as an abstractionprocess involving three separate levels (raw data analysis,symbolic description and scenario construction). Centralto our design is therefore the distinction between threemain tasks, namely segmentation (partitioning of the signalinto consecutive segments), classification (symbolic label-ing of the segments), and scenario construction (computa-tion of inter-symbol relationships).
Dedicated agents are conceived to support these varioustasks. Before describing these agents, we first of all give aninsight into the global system architecture.
4.1. System architecture
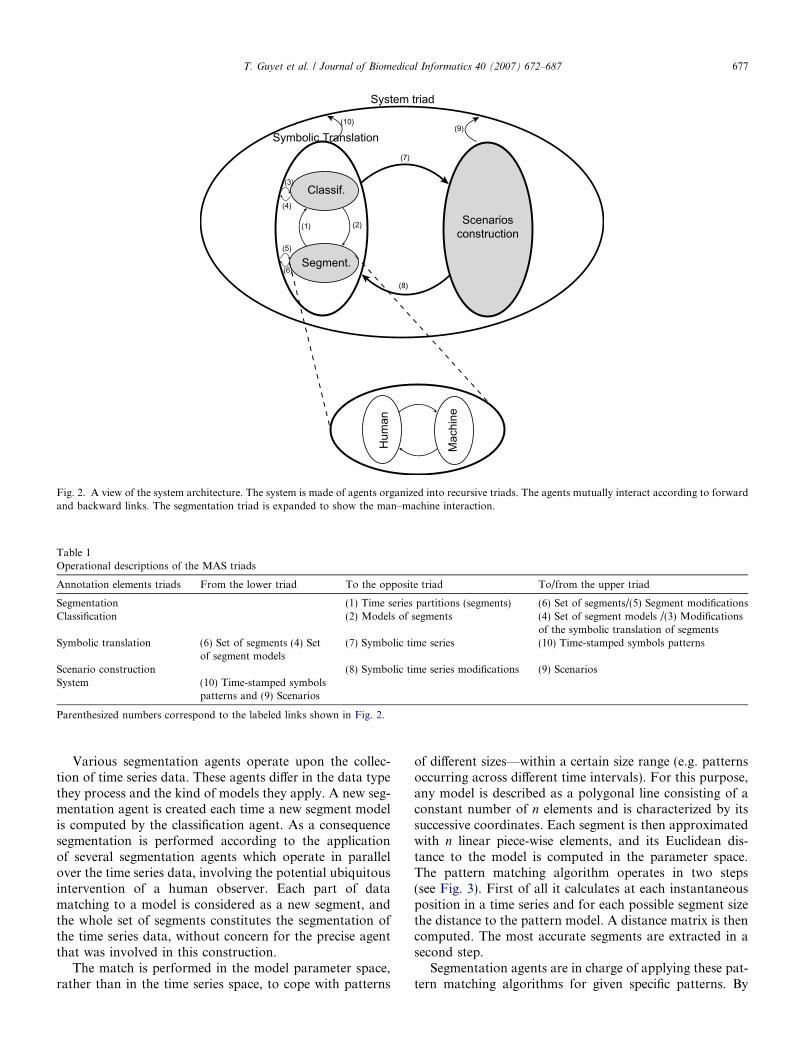
A global view of the system architecture is presented inFig. 2. A triadic organization is proposed as a conceptualframework to formalize agent interactions and feedbackloops. A triad is made of two processing entities workingin reciprocal interaction on the basis of a more abstractprocessing whole [26]. Each abstraction level is organizedinto a triad, thus generating new annotation elements tobe processed at a higher abstraction level (upper triad):
Learni
Classific
AB
Machine
Segmen
Exploration
Construction
Inte
rpre
tatio
n A D C C A D B E
Fig. 1. Time series interpretation as a collaborative process, involving compseveral abstraction levels.
– Time series data are processed within the segmentationand classification triads, which mutually interact (links1 and 2, Fig. 2) within the symbolic translation triadto build symbolic time series (link 3, Fig. 2).
– Symbolic time series are processed within the scenarioconstruction triad. The symbolic translation and sce-nario construction triads mutually interact within thesystem triad (links 7 and 8, Fig. 2) to refine and improvethe proposed interpretation.
– Scenarios are the final outcome to the system triad (link9, Fig. 2). Scenarios are used to elaborate modificationsto the symbolic time series that might improve scenarioaccuracy. These modifications are transmitted to thesymbolic translation triad (link 7, Fig. 2).
A summary of the annotation elements exchangedbetween triads is provided in Table 1.
Note that two styles of interaction are considered in thisapproach to support emergence: the man–machine interac-tion involved in the segmentation, classification and sce-nario construction triads, on the one hand, and the triad-to-triad interaction involved in the symbolic translationand system triads on the other hand. Whereas man–machine interaction allows to model the relations occurringbetween a subject observing an object (ubiquitous interac-tions), the triad-to-triad interaction allows to model inter-actions occurring between actors operating at differentabstraction levels. According to this view, segmentationfor example is meant to occur from the ubiquitous interac-tion between man and machine, explained as follows.
4.2. Agentification
4.2.1. Segmentation agents
For each patient, a record is provided in the form of amultivariate time series, where each time series is identifiedby its type. Two data types are considered in our applica-tion to ICU patient monitoring, namely the airway pres-sure (Paw) and respiratory flow signals.
ng
ationSymbolic time series
Segmented time series
Times series data
C
Scenarios
Man
tation
Exploration
Constructio
n
Interpretation
E D E C A E A B B
lementary exploration, description, and annotation tasks, operating over
Scenariosconstruction
Segment.
Classif.
(7)
(8)
(2)(1)
(3)
(4)
(5)
(6)
(9)Symbolic Translation
System triad
Hum
an
Mac
hine
(10)
Fig. 2. A view of the system architecture. The system is made of agents organized into recursive triads. The agents mutually interact according to forwardand backward links. The segmentation triad is expanded to show the man–machine interaction.
Table 1Operational descriptions of the MAS triads
Annotation elements triads From the lower triad To the opposite triad To/from the upper triad
Segmentation (1) Time series partitions (segments) (6) Set of segments/(5) Segment modificationsClassification (2) Models of segments (4) Set of segment models /(3) Modifications
of the symbolic translation of segmentsSymbolic translation (6) Set of segments (4) Set
of segment models(7) Symbolic time series (10) Time-stamped symbols patterns
Scenario construction (8) Symbolic time series modifications (9) ScenariosSystem (10) Time-stamped symbols
patterns and (9) Scenarios
Parenthesized numbers correspond to the labeled links shown in Fig. 2.
T. Guyet et al. / Journal of Biomedical Informatics 40 (2007) 672–687 677
Various segmentation agents operate upon the collec-tion of time series data. These agents differ in the data typethey process and the kind of models they apply. A new seg-mentation agent is created each time a new segment modelis computed by the classification agent. As a consequencesegmentation is performed according to the applicationof several segmentation agents which operate in parallelover the time series data, involving the potential ubiquitousintervention of a human observer. Each part of datamatching to a model is considered as a new segment, andthe whole set of segments constitutes the segmentation ofthe time series data, without concern for the precise agentthat was involved in this construction.
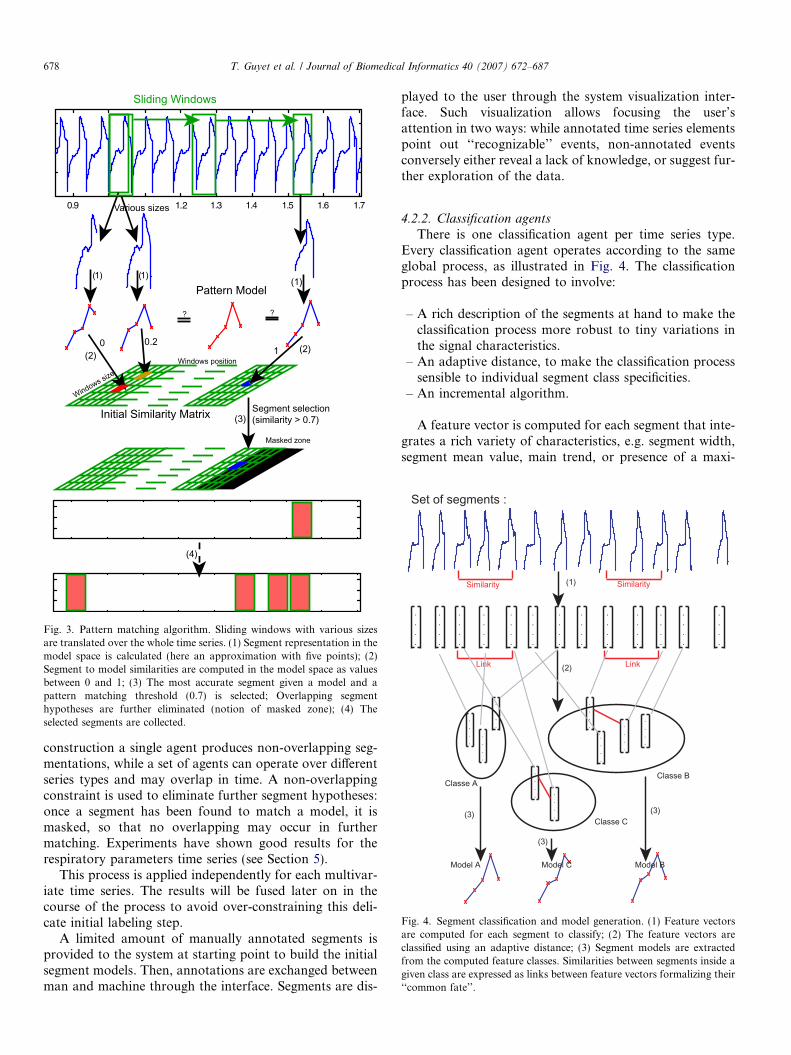
The match is performed in the model parameter space,rather than in the time series space, to cope with patterns
of different sizes—within a certain size range (e.g. patternsoccurring across different time intervals). For this purpose,any model is described as a polygonal line consisting of aconstant number of n elements and is characterized by itssuccessive coordinates. Each segment is then approximatedwith n linear piece-wise elements, and its Euclidean dis-tance to the model is computed in the parameter space.The pattern matching algorithm operates in two steps(see Fig. 3). First of all it calculates at each instantaneousposition in a time series and for each possible segment sizethe distance to the pattern model. A distance matrix is thencomputed. The most accurate segments are extracted in asecond step.
Segmentation agents are in charge of applying these pat-tern matching algorithms for given specific patterns. By
0.9 1.2 1.3 1.4 1.5 1.6 1.7
Pattern Model
Sliding Windows
Windows position
Windows size
? ?
Various sizes
Initial Similarity Matrix
10 0.2
Masked zone
Segment selection (similarity > 0.7)
(1) (1)(1)
(2)(2)
(4)
(3)
Fig. 3. Pattern matching algorithm. Sliding windows with various sizesare translated over the whole time series. (1) Segment representation in themodel space is calculated (here an approximation with five points); (2)Segment to model similarities are computed in the model space as valuesbetween 0 and 1; (3) The most accurate segment given a model and apattern matching threshold (0.7) is selected; Overlapping segmenthypotheses are further eliminated (notion of masked zone); (4) Theselected segments are collected.
Set of segments :
.
.
.
.
.
.
.
.
.
.
.
.
.
.
.
.
.
.
.
.
.
.
.
.
.
.
.
.
.
.
.
.
.
.
.
.
.
.
.
.
.
.
.
.
.
.
.
.
.
.
.
.
Similarity Similarity
Link Link
.
.
.
.....
.
.
.
.
.
.
.
.....
.
.
.
.
.
.
.
.
.
.
.
. ....
Classe BClasse A
Classe C
Model A Model C Model B
(1)
(2)
(3) (3)
(3)
Fig. 4. Segment classification and model generation. (1) Feature vectorsare computed for each segment to classify; (2) The feature vectors areclassified using an adaptive distance; (3) Segment models are extractedfrom the computed feature classes. Similarities between segments inside agiven class are expressed as links between feature vectors formalizing their‘‘common fate’’.
678 T. Guyet et al. / Journal of Biomedical Informatics 40 (2007) 672–687
construction a single agent produces non-overlapping seg-mentations, while a set of agents can operate over differentseries types and may overlap in time. A non-overlappingconstraint is used to eliminate further segment hypotheses:once a segment has been found to match a model, it ismasked, so that no overlapping may occur in furthermatching. Experiments have shown good results for therespiratory parameters time series (see Section 5).
This process is applied independently for each multivar-iate time series. The results will be fused later on in thecourse of the process to avoid over-constraining this deli-cate initial labeling step.
A limited amount of manually annotated segments isprovided to the system at starting point to build the initialsegment models. Then, annotations are exchanged betweenman and machine through the interface. Segments are dis-
played to the user through the system visualization inter-face. Such visualization allows focusing the user’sattention in two ways: while annotated time series elementspoint out ‘‘recognizable’’ events, non-annotated eventsconversely either reveal a lack of knowledge, or suggest fur-ther exploration of the data.
4.2.2. Classification agents
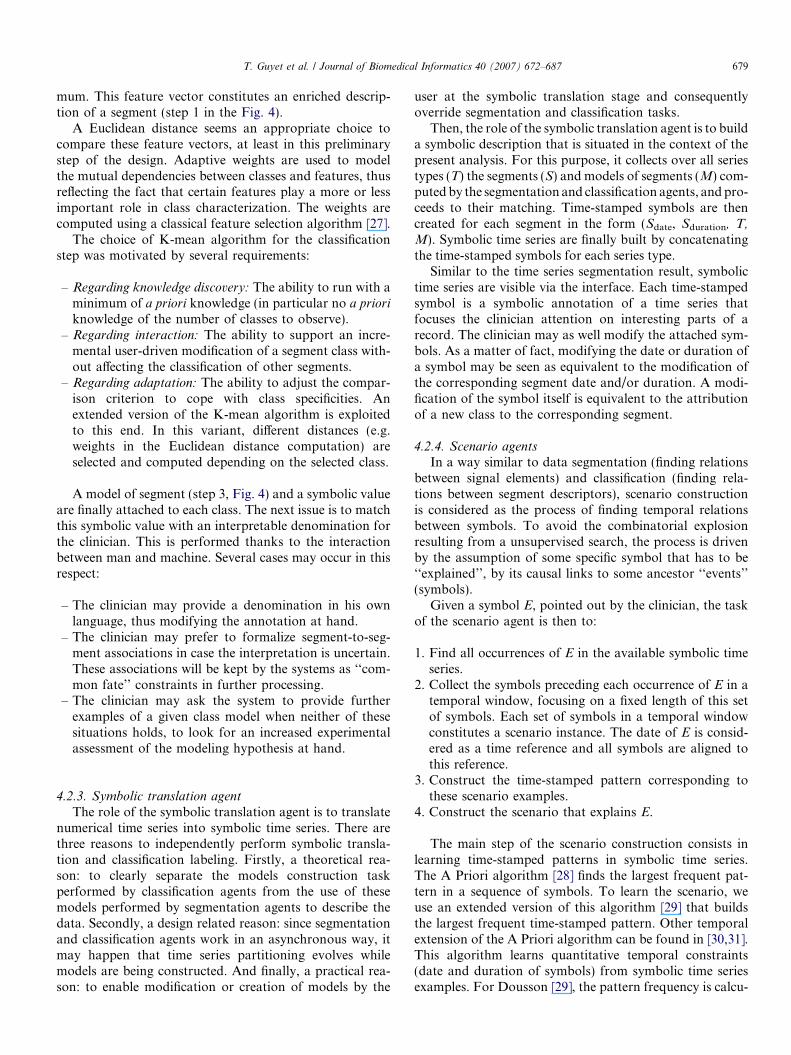
There is one classification agent per time series type.Every classification agent operates according to the sameglobal process, as illustrated in Fig. 4. The classificationprocess has been designed to involve:
– A rich description of the segments at hand to make theclassification process more robust to tiny variations inthe signal characteristics.
– An adaptive distance, to make the classification processsensible to individual segment class specificities.
– An incremental algorithm.
A feature vector is computed for each segment that inte-grates a rich variety of characteristics, e.g. segment width,segment mean value, main trend, or presence of a maxi-
T. Guyet et al. / Journal of Biomedical Informatics 40 (2007) 672–687 679
mum. This feature vector constitutes an enriched descrip-tion of a segment (step 1 in the Fig. 4).
A Euclidean distance seems an appropriate choice tocompare these feature vectors, at least in this preliminarystep of the design. Adaptive weights are used to modelthe mutual dependencies between classes and features, thusreflecting the fact that certain features play a more or lessimportant role in class characterization. The weights arecomputed using a classical feature selection algorithm [27].
The choice of K-mean algorithm for the classificationstep was motivated by several requirements:
– Regarding knowledge discovery: The ability to run with aminimum of a priori knowledge (in particular no a prioriknowledge of the number of classes to observe).
– Regarding interaction: The ability to support an incre-mental user-driven modification of a segment class with-out affecting the classification of other segments.
– Regarding adaptation: The ability to adjust the compar-ison criterion to cope with class specificities. Anextended version of the K-mean algorithm is exploitedto this end. In this variant, different distances (e.g.weights in the Euclidean distance computation) areselected and computed depending on the selected class.
A model of segment (step 3, Fig. 4) and a symbolic valueare finally attached to each class. The next issue is to matchthis symbolic value with an interpretable denomination forthe clinician. This is performed thanks to the interactionbetween man and machine. Several cases may occur in thisrespect:
– The clinician may provide a denomination in his ownlanguage, thus modifying the annotation at hand.
– The clinician may prefer to formalize segment-to-seg-ment associations in case the interpretation is uncertain.These associations will be kept by the systems as ‘‘com-mon fate’’ constraints in further processing.
– The clinician may ask the system to provide furtherexamples of a given class model when neither of thesesituations holds, to look for an increased experimentalassessment of the modeling hypothesis at hand.
4.2.3. Symbolic translation agent
The role of the symbolic translation agent is to translatenumerical time series into symbolic time series. There arethree reasons to independently perform symbolic transla-tion and classification labeling. Firstly, a theoretical rea-son: to clearly separate the models construction taskperformed by classification agents from the use of thesemodels performed by segmentation agents to describe thedata. Secondly, a design related reason: since segmentationand classification agents work in an asynchronous way, itmay happen that time series partitioning evolves whilemodels are being constructed. And finally, a practical rea-son: to enable modification or creation of models by the
user at the symbolic translation stage and consequentlyoverride segmentation and classification tasks.
Then, the role of the symbolic translation agent is to builda symbolic description that is situated in the context of thepresent analysis. For this purpose, it collects over all seriestypes (T) the segments (S) and models of segments (M) com-puted by the segmentation and classification agents, and pro-ceeds to their matching. Time-stamped symbols are thencreated for each segment in the form (Sdate, Sduration, T,
M). Symbolic time series are finally built by concatenatingthe time-stamped symbols for each series type.
Similar to the time series segmentation result, symbolictime series are visible via the interface. Each time-stampedsymbol is a symbolic annotation of a time series thatfocuses the clinician attention on interesting parts of arecord. The clinician may as well modify the attached sym-bols. As a matter of fact, modifying the date or duration ofa symbol may be seen as equivalent to the modification ofthe corresponding segment date and/or duration. A modi-fication of the symbol itself is equivalent to the attributionof a new class to the corresponding segment.
4.2.4. Scenario agentsIn a way similar to data segmentation (finding relations
between signal elements) and classification (finding rela-tions between segment descriptors), scenario constructionis considered as the process of finding temporal relationsbetween symbols. To avoid the combinatorial explosionresulting from a unsupervised search, the process is drivenby the assumption of some specific symbol that has to be‘‘explained’’, by its causal links to some ancestor ‘‘events’’(symbols).
Given a symbol E, pointed out by the clinician, the taskof the scenario agent is then to:
1. Find all occurrences of E in the available symbolic timeseries.
2. Collect the symbols preceding each occurrence of E in atemporal window, focusing on a fixed length of this setof symbols. Each set of symbols in a temporal windowconstitutes a scenario instance. The date of E is consid-ered as a time reference and all symbols are aligned tothis reference.
3. Construct the time-stamped pattern corresponding tothese scenario examples.
4. Construct the scenario that explains E.
The main step of the scenario construction consists inlearning time-stamped patterns in symbolic time series.The A Priori algorithm [28] finds the largest frequent pat-tern in a sequence of symbols. To learn the scenario, weuse an extended version of this algorithm [29] that buildsthe largest frequent time-stamped pattern. Other temporalextension of the A Priori algorithm can be found in [30,31].This algorithm learns quantitative temporal constraints(date and duration of symbols) from symbolic time seriesexamples. For Dousson [29], the pattern frequency is calcu-
680 T. Guyet et al. / Journal of Biomedical Informatics 40 (2007) 672–687
lated from the number of matches in a given symbolic timeseries. In our case, it is computed as the frequency of exam-ples containing a matching set of symbols in the wholeexample collection.
Scenarios are constructed as the result of this process,which ‘‘explains’’ the event of interest E by a time-stampedpattern of preceding events. This result may of course besubmitted to the interacting user, which may result in mod-ifications in the proposed pattern, or the collection of otherexample patterns to support or contradict the currentinterpretation.
In a complementary feedback loop (link 8 in Fig. 2),the proposed scenario may be considered as a model todrive further analysis. As a matter of fact the A Priorialgorithm also computes the most frequent sub-scenarioswhile computing scenarios. Then, given a scenario ofwhich only some of its sub-scenarios appear to matcha given time series data, a deviation from the currentmodel is pointed out, and therefore a potential improve-ment of the annotation process is possible. The systemwill then focus its attention on locations in the availablesymbolic time series where a deviation from this model isobserved. Feedback toward the lower analysis levels maythen occur in two ways, depending whether the issue isto revise the proposed classification (symbolic assign-ment, link 4, Fig. 2) or the proposed segmentation (tem-poral assignment, link 3, Fig. 2).
5. Experiments
A standard frame for evaluation of collaborative sys-tems is presently not available due to the difficulties ofmodeling and classifying the large diversity of the exist-ing systems [32]. The central question is: Does the collab-oration enable the user or the system to perform‘‘better’’ together than they could do independently? Toanswer this question two aspects have to be carefullyconsidered: the global performance and the usability (ade-quacy with user requirements) of the approach. For theevaluation of these two aspects, Shyr et al. [33] have pro-posed a framework and guidelines oriented toward threedimensions:
– The stage and place of the experiment: laboratory eval-uation or field experiments.
– The quality of the system: performances and usability.– The evaluation methodology used: with objective (via
quantitative measures) or subjective (via user feedbacks)benchmarks.
We have refined and applied this methodology to ourcontext.
5.1. Our evaluation methodology
For our application, laboratory experiments considerfeedback from researchers of our group (including phys-
iologists and clinicians) exploring the real data with ourtool outside the usual clinical environment. Field experi-ments consist of the evaluation of the use of the tool bya clinician at the patient’s bedside. The usability evalua-tion includes human–machine interaction (HMI) criteria(knowledge sharing efficiency, HMI quality, etc.) andcognitive science criteria (work load evaluation, resultconfidence, etc.). It requires the use of interviews andquestionnaires to gather experiment feedbacks. In termof acceptability by the users, the adequacy of the collab-oration in the clinical environment and gains comparedto the standard practice should be evaluated via clinicaltrials.
For time series data exploration, the system perfor-mances can be assessed considering three aspects:
– The capability to efficiently explore and annotate a largeamount of time series data.
– The quality of the built computerized models of eventsand scenarios.
– The capability of new events and scenarios discovery.
With simulated data sets, objective measures of qualitycan be proposed. Then, we can compare performancesbetween a fully, partial or absent collaboration with vari-ous systems.
In addition, because we propose a new approach forcollaboration, we should evaluate its feasibility. Feasibil-ity means that our implemented system: (1) provides aneffective structural coupling collaboration, preserving theautonomy and adaptability properties of the system.This includes the capabilities for model construction,where models emergence and automatic annotationshould be highlighted; and (2) exhibits specific charac-teristics in comparison to other collaborativeapproaches.
Our evaluation framework based on three levels: feasi-bility, performance, and usability is summarized in Table 2.
In this paper, we present the results we obtained for fea-sibility and performance evaluation from laboratory exper-iments. Based on our methodology (see Table 2) threeaspects were considered:
– Collaborative specificity compared to other systemsones: we explored physiological time series with two rel-evant tools, VizTree [10] and TimeSearcher2 [12] inorder to define their limits and their complementarywith our approach (Section 5.3).
– Expected properties verification: we tested on real med-ical time series data the expected properties of our col-laborative system in terms of its autonomy (e.g. is thesystem able to learn and then perform automatic anno-tations?), emergence (e.g. is new knowledge co-con-structed based on man–machine collaboration?) andfinally adaptability (e.g. is the system able to cope withpatterns variability and heterogeneity of features associ-ated to each class?) (Section 5.4).
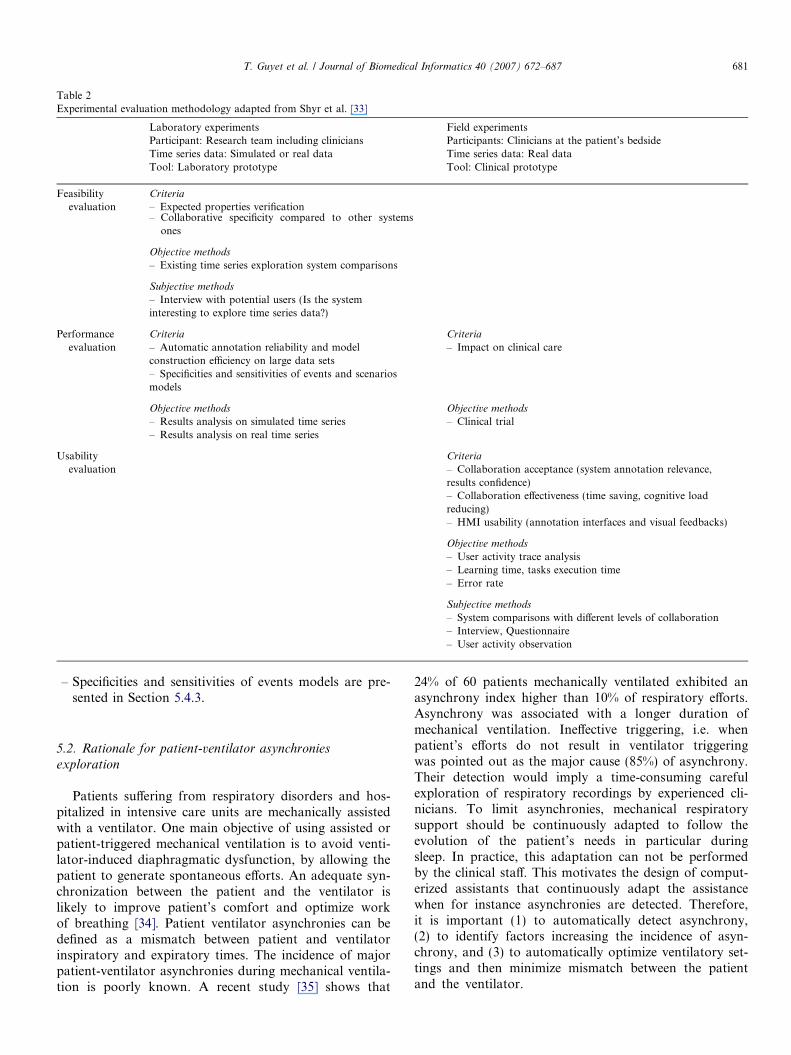
Table 2Experimental evaluation methodology adapted from Shyr et al. [33]
Laboratory experimentsParticipant: Research team including cliniciansTime series data: Simulated or real dataTool: Laboratory prototype
Field experimentsParticipants: Clinicians at the patient’s bedsideTime series data: Real dataTool: Clinical prototype
Feasibilityevaluation
Criteria
– Expected properties verification– Collaborative specificity compared to other systems
ones
Objective methods
– Existing time series exploration system comparisons
Subjective methods
– Interview with potential users (Is the systeminteresting to explore time series data?)
Performanceevaluation
Criteria Criteria
– Automatic annotation reliability and modelconstruction efficiency on large data sets– Specificities and sensitivities of events and scenariosmodels
– Impact on clinical care
Objective methods Objective methods
– Results analysis on simulated time series– Results analysis on real time series
– Clinical trial
Usabilityevaluation
Criteria
– Collaboration acceptance (system annotation relevance,results confidence)– Collaboration effectiveness (time saving, cognitive loadreducing)– HMI usability (annotation interfaces and visual feedbacks)
Objective methods
– User activity trace analysis– Learning time, tasks execution time– Error rate
Subjective methods
– System comparisons with different levels of collaboration– Interview, Questionnaire– User activity observation
T. Guyet et al. / Journal of Biomedical Informatics 40 (2007) 672–687 681
– Specificities and sensitivities of events models are pre-sented in Section 5.4.3.
5.2. Rationale for patient-ventilator asynchronies
exploration
Patients suffering from respiratory disorders and hos-pitalized in intensive care units are mechanically assistedwith a ventilator. One main objective of using assisted orpatient-triggered mechanical ventilation is to avoid venti-lator-induced diaphragmatic dysfunction, by allowing thepatient to generate spontaneous efforts. An adequate syn-chronization between the patient and the ventilator islikely to improve patient’s comfort and optimize workof breathing [34]. Patient ventilator asynchronies can bedefined as a mismatch between patient and ventilatorinspiratory and expiratory times. The incidence of majorpatient-ventilator asynchronies during mechanical ventila-tion is poorly known. A recent study [35] shows that
24% of 60 patients mechanically ventilated exhibited anasynchrony index higher than 10% of respiratory efforts.Asynchrony was associated with a longer duration ofmechanical ventilation. Ineffective triggering, i.e. whenpatient’s efforts do not result in ventilator triggeringwas pointed out as the major cause (85%) of asynchrony.Their detection would imply a time-consuming carefulexploration of respiratory recordings by experienced cli-nicians. To limit asynchronies, mechanical respiratorysupport should be continuously adapted to follow theevolution of the patient’s needs in particular duringsleep. In practice, this adaptation can not be performedby the clinical staff. This motivates the design of comput-erized assistants that continuously adapt the assistancewhen for instance asynchronies are detected. Therefore,it is important (1) to automatically detect asynchrony,(2) to identify factors increasing the incidence of asyn-chrony, and (3) to automatically optimize ventilatory set-tings and then minimize mismatch between the patientand the ventilator.
682 T. Guyet et al. / Journal of Biomedical Informatics 40 (2007) 672–687
In order to detect from the physiological data the spe-cific patterns regularities or sequences of events (scenarios)associated to the occurrence of asynchrony, we provided aclinician with our system to annotate and explore the massof data available. Times series were constituted of flow andairway pressure (Paw) signals continuously recorded during30 min and sampled at 200 Hz. Details on the data acqui-sition protocol may be found in [35]. Only the most stablepart of the record is exploited. Each time series containedabout 64,000 data points, i.e. around 100 respiratorycycles. Fig. 7 shows only few respiratory cycles of the respi-ratory flow signal.
A clinician, based on a visual inspection of three patientsrecordings, manually annotated ineffective triggering asyn-chronies by identifying, during the expiratory periods,depressions, defined as an abrupt airway pressure drop(P0.5 cm H2O), simultaneous to an increase in flow notfollowed by an assisted cycle.
5.3. Time series exploration with other existing collaborative
approaches
We have explored the two following tools, VizTree [10]and TimeSearcher2 [12], which are similar to our approach,our respiratory multivariate time series data. Note that thesame flow signal part is shown on Figs. 5–7.
5.3.1. VizTree
VizTree processes a single univariate time series data.The exploration is centered on the pattern discovery anddetection tasks. Any relation between patterns can beexplored. The underlying model of pattern is a symbolicrepresentation based on SAX [11]. The tool proposes threesimultaneous graphical views of the data:
– A signal-based representation of the time series at hand,which allows to highlight the segments matching thepatterns under interest.
– A tree-like representation organizing the time series as ahierarchy of patterns. Patterns may be selected from thistree, at any level. eventually according to some advancedselection criteria (e.g. non-monotonic string), and
– A cumulative representation of the segments matchingthe selected pattern that enables the user to visuallycheck the homogeneity of the segments and thereforethe ‘‘representativity’’ of the pattern.
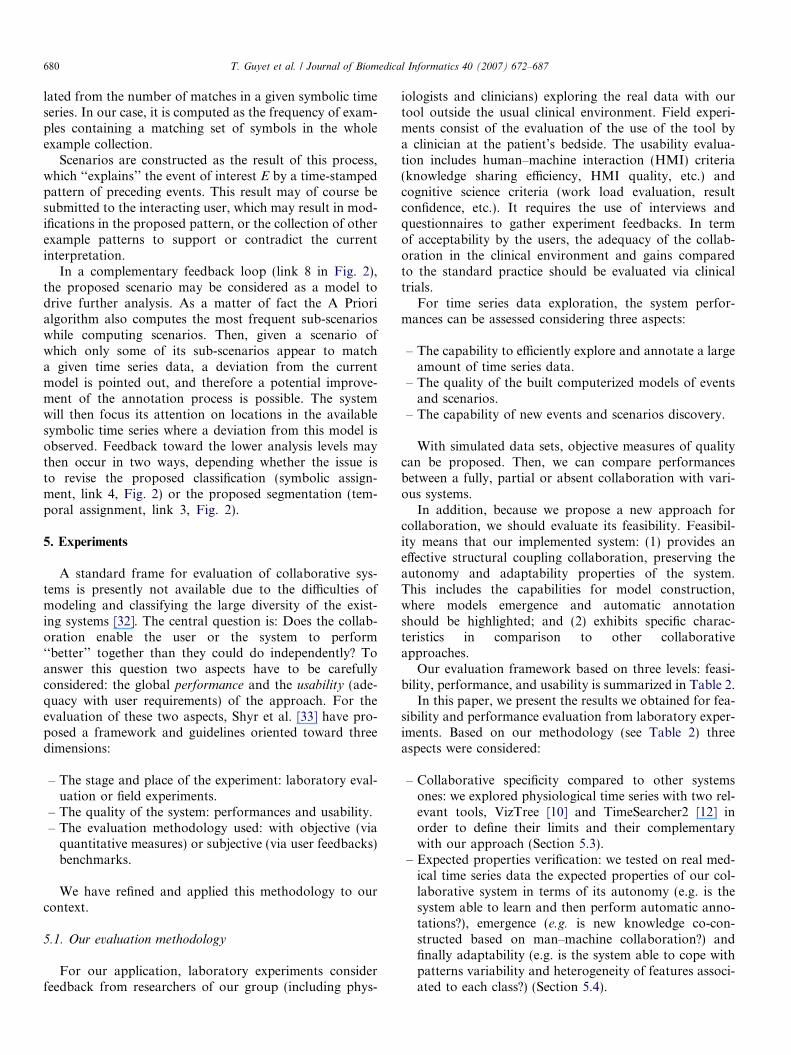
The visual support provided by VizTree to explore timeseries data is attractive (see Fig. 5). The user can quicklyperform a lot of experiments, exploring the time series ina wide range of patterns. Data interpretation results froma series of back and forth steps between the interestingbranch of the tree and the cumulative view of segments.The detection of the length of the pattern is a priori fixedby the expert. This is clearly a limitation for medical appli-cations where similar segments can have variable temporalscales. Moreover, the exploration remains user-guided.
There is no pattern discovery tool enabling the system toautonomously exhibit potentially interesting findings fromthe data.
5.3.2. TimeSearcher2
TimeSearcher2 is a multivariate time series data explora-tion tool including the notion of SeachBoxes. SearchBoxesenable users to select a subset of an existing time series andsearch for similar patterns throughout the data. Variouscontrols over the acceptable similarities are provided. Sev-eral facilities have been added to the early version of thesystem, involving time varying boxes, or angular querieswhich search for range of differentials rather than absolutevalues. Fig. 6 shows an experimental use of SearchBox onour patient data. The quality of the pattern detection(Fig. 6a) is very sensitive to the threshold fixed by the user(here 48%).
The difficulty of the system to cope with patterns heter-ogeneity (lack of adaptability) limits its capacity of detec-tion of similar patterns in different flow signals (Fig. 6b).TimeBox is another appropriate tool available in Time-Searcher2. It enables the user to select example patternsby means of adjustable rectangular boxes. Multiple Time-Boxes can be drawn to specify conjunctive or disjunctivequeries of arbitrary complexity. However, TimeBoxes arepresently not adapted to deal with long periodic time seriesdata and then are not useful for our application where cyc-lic patterns should be detected.
5.4. Testing our system properties
The three following subsections are respectively devotedto testing the autonomy and adaptability (Section 5.4.1)and emergence (Sections 5.4.2, and 5.4.3) properties ofour system.
5.4.1. Model construction and automatic annotations
Using the system interface, the clinician annotated inef-ficient triggering (see Fig. 7a) by the visual inspection of aspecific part of the signal. He was then able to launch theprocessing, i.e. in turn the execution of the classification,segmentation and finally symbolic translation agents.Based on the initial partial annotation by the expert, thesystem symbolically labeled the complete time series (seeFig. 7b). On this example, all asynchronies considered assimilar to those annotated by the clinician as ineffectivetriggering were retrieved (dark gray boxes). Standard cycles(no asynchrony) were automatically segmented (light grayboxes). These ambiguous cases will be resolved by meansof further clinician interactions.
5.4.2. Emergence of new models
As may be seen from Fig. 8, three different models havebeen constructed by the system. The first model corre-sponds to ineffective triggering, according to the expert’sannotations. The second model on the contrary is represen-tative of non asynchrony periods. The third model is pro-
Fig. 5. Exploration of Flow signal using VizTree: Top in red are shown the patterns detected by the system based on the first one (left) annotated by theclinician. Note that due the use of a fixed window for pattern detection, some parts can be missed when the pattern is longer (see the third pattern). Belowleft: Tree like organization of the times series. Below right: The superposition of the patterns detected. (For interpretation of the references to colour in thisfigure legend, the reader is referred to the web version of this article.)
Fig. 6. Exploration flow signal under TimeSearcher2. (a, left): The green box indicates the example pattern to detect, in red the corresponding detectedpatterns. (b, right): Excerpt of the three flow signals available from three patient recordings. The patterns (in red) learned on the blue signal are fixed andcannot be adapted to detect similar patterns on the two other signals. (For interpretation of the references to colour in this figure legend, the reader isreferred to the web version of this article.)
T. Guyet et al. / Journal of Biomedical Informatics 40 (2007) 672–687 683
posed by the system, in an emergent way, to cope with a spe-cific case of asynchrony. The clinician at this step may rejectthe model or proceed to further time series exploration toinvestigate the genericity of this newly defined model.
5.4.3. Comparison of models
Pathophysiological aspects of asynchrony are not wellknown. It is therefore interesting for clinicians to explorethe patterns of asynchrony cycles provided by the system.
We used our system to investigate whether these modelsare patient-dependent or whether a generic model can beextracted. To illustrate this point, we used data obtainedfrom three patients (identified by DJ22, GB27, andHJ24). Two signals, Paw and Flow, were firstly annotatedby the clinician. The model of ineffective triggering wasautomatically constructed from the data of one patientand then used to annotate the recordings of the two otherpatients. By comparing the results obtained by the machine

Fig. 7. Model construction (flow signals). (a, upper): Two annotations (red horizontal bar) are inserted on the flow signal by the clinician to indicateasynchrony periods. (b, lower): These annotations are used by the system to symbolically label the complete time series: dark-gray boxes indicate retrievedasynchronies periods. Other gray boxes indicate other types of periods: non-asynchronies. Note the variability of the patterns gathered in the same class(e.g. light-gray boxes). (For interpretation of the references to colour in this figure legend, the reader is referred to the web version of this article.)
684 T. Guyet et al. / Journal of Biomedical Informatics 40 (2007) 672–687
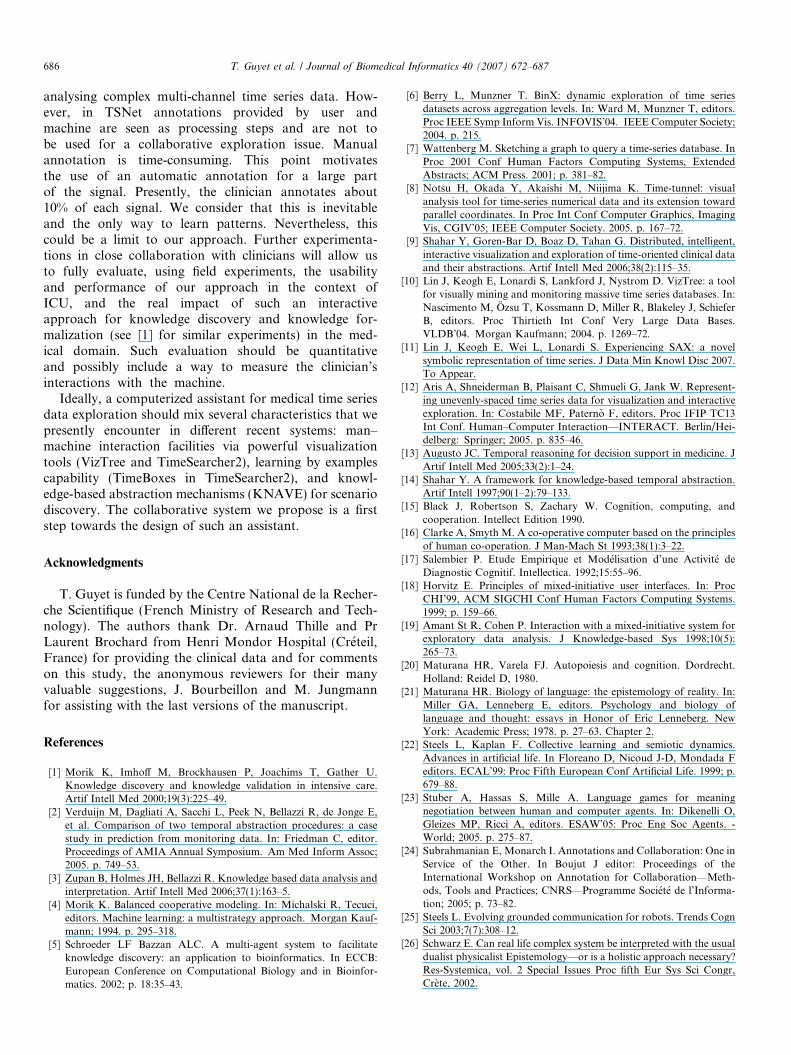
with the expert annotations, we calculated the sensitivityand specificity of the constructed model. The results arepresented in Tables 3 and 4, respectively.
The mean sensitivity and mean specificity of ourapproach, computed over the three patients, is respectively0.75 and 0.95. We can note that for the models learnedfrom DJ22 data provide systematically lower specificityand sensitivity than those obtained from GB27 andHJ24. This can be explained by the fact that fewer asyn-chronies occurred within DJ22 time series data (24% lessthan in GB27 and HJ24). The importance of the numberof available annotations is illustrated by the ROC curve(see Fig. 9). For each point, sensitivity and specificity werecomputed on 20 randomized trials. The area under thecurve (AUC) is equal to 0.88.
6. Discussion and perspectives
We have presented an original approach to supportclinicians in the difficult task of data exploration forknowledge construction from multivariate time seriesdata. Our approach is centered on the collaborationbetween a clinician and an autonomous system. Man
and machine are both embedded in a learning cycle. Thisextends the expert’s involvement as already proposed in[1] to the entire knowledge discovery cycle. We advocatethat the design of computerized tools fully support theclinician in his/her making decision process, rather thanprovide him/her with final results. The presented systemengenders medical computerized tools that are designedon that basis [3].
The system has been designed as a recursive triadicarchitecture that is implemented with a multi-agent para-digm. Three types of agents have been introduced: segmen-tation agents that use model of patterns to find new similarsegments, classification agents that build models of pat-terns from previously constructed segmentations, andfinally, scenario agents that build typical relations betweentime-stamped symbols. We are aware of the computingcomplexity of the processes that we have presented here.This can be lowered by the fact that data interpretationis a prospective task with no critical time constraints.Moreover, new hardware such as grid architecture couldbe used to implement our system.
The proposed evaluation methodology includes threeevaluation stages: approach feasibility, performance, and
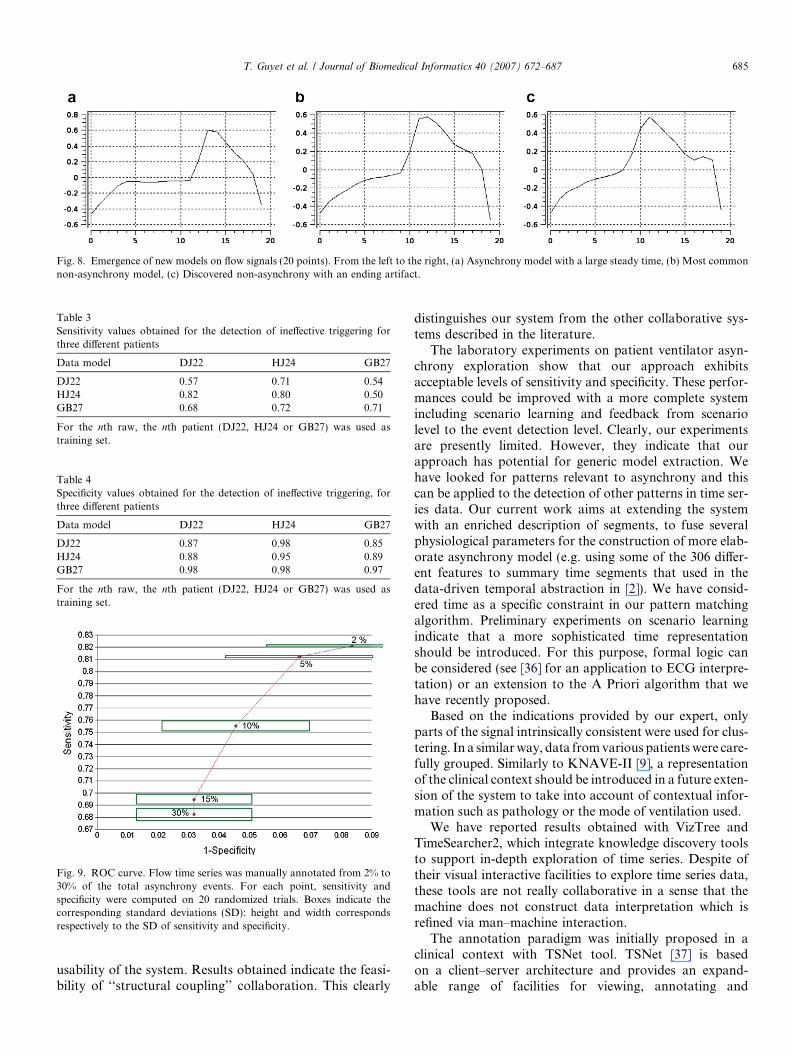
Fig. 8. Emergence of new models on flow signals (20 points). From the left to the right, (a) Asynchrony model with a large steady time, (b) Most commonnon-asynchrony model, (c) Discovered non-asynchrony with an ending artifact.
Table 3Sensitivity values obtained for the detection of ineffective triggering forthree different patients
Data model DJ22 HJ24 GB27
DJ22 0.57 0.71 0.54HJ24 0.82 0.80 0.50GB27 0.68 0.72 0.71
For the nth raw, the nth patient (DJ22, HJ24 or GB27) was used astraining set.
Table 4Specificity values obtained for the detection of ineffective triggering, forthree different patients
Data model DJ22 HJ24 GB27
DJ22 0.87 0.98 0.85HJ24 0.88 0.95 0.89GB27 0.98 0.98 0.97
For the nth raw, the nth patient (DJ22, HJ24 or GB27) was used astraining set.
Fig. 9. ROC curve. Flow time series was manually annotated from 2% to30% of the total asynchrony events. For each point, sensitivity andspecificity were computed on 20 randomized trials. Boxes indicate thecorresponding standard deviations (SD): height and width correspondsrespectively to the SD of sensitivity and specificity.
T. Guyet et al. / Journal of Biomedical Informatics 40 (2007) 672–687 685
usability of the system. Results obtained indicate the feasi-bility of ‘‘structural coupling’’ collaboration. This clearly
distinguishes our system from the other collaborative sys-tems described in the literature.
The laboratory experiments on patient ventilator asyn-chrony exploration show that our approach exhibitsacceptable levels of sensitivity and specificity. These perfor-mances could be improved with a more complete systemincluding scenario learning and feedback from scenariolevel to the event detection level. Clearly, our experimentsare presently limited. However, they indicate that ourapproach has potential for generic model extraction. Wehave looked for patterns relevant to asynchrony and thiscan be applied to the detection of other patterns in time ser-ies data. Our current work aims at extending the systemwith an enriched description of segments, to fuse severalphysiological parameters for the construction of more elab-orate asynchrony model (e.g. using some of the 306 differ-ent features to summary time segments that used in thedata-driven temporal abstraction in [2]). We have consid-ered time as a specific constraint in our pattern matchingalgorithm. Preliminary experiments on scenario learningindicate that a more sophisticated time representationshould be introduced. For this purpose, formal logic canbe considered (see [36] for an application to ECG interpre-tation) or an extension to the A Priori algorithm that wehave recently proposed.
Based on the indications provided by our expert, onlyparts of the signal intrinsically consistent were used for clus-tering. In a similar way, data from various patients were care-fully grouped. Similarly to KNAVE-II [9], a representationof the clinical context should be introduced in a future exten-sion of the system to take into account of contextual infor-mation such as pathology or the mode of ventilation used.
We have reported results obtained with VizTree andTimeSearcher2, which integrate knowledge discovery toolsto support in-depth exploration of time series. Despite oftheir visual interactive facilities to explore time series data,these tools are not really collaborative in a sense that themachine does not construct data interpretation which isrefined via man–machine interaction.
The annotation paradigm was initially proposed in aclinical context with TSNet tool. TSNet [37] is basedon a client–server architecture and provides an expand-able range of facilities for viewing, annotating and
686 T. Guyet et al. / Journal of Biomedical Informatics 40 (2007) 672–687
analysing complex multi-channel time series data. How-ever, in TSNet annotations provided by user andmachine are seen as processing steps and are not tobe used for a collaborative exploration issue. Manualannotation is time-consuming. This point motivatesthe use of an automatic annotation for a large partof the signal. Presently, the clinician annotates about10% of each signal. We consider that this is inevitableand the only way to learn patterns. Nevertheless, thiscould be a limit to our approach. Further experimenta-tions in close collaboration with clinicians will allow usto fully evaluate, using field experiments, the usabilityand performance of our approach in the context ofICU, and the real impact of such an interactiveapproach for knowledge discovery and knowledge for-malization (see [1] for similar experiments) in the med-ical domain. Such evaluation should be quantitativeand possibly include a way to measure the clinician’sinteractions with the machine.
Ideally, a computerized assistant for medical time seriesdata exploration should mix several characteristics that wepresently encounter in different recent systems: man–machine interaction facilities via powerful visualizationtools (VizTree and TimeSearcher2), learning by examplescapability (TimeBoxes in TimeSearcher2), and knowl-edge-based abstraction mechanisms (KNAVE) for scenariodiscovery. The collaborative system we propose is a firststep towards the design of such an assistant.
Acknowledgments
T. Guyet is funded by the Centre National de la Recher-che Scientifique (French Ministry of Research and Tech-nology). The authors thank Dr. Arnaud Thille and PrLaurent Brochard from Henri Mondor Hospital (Creteil,France) for providing the clinical data and for commentson this study, the anonymous reviewers for their manyvaluable suggestions, J. Bourbeillon and M. Jungmannfor assisting with the last versions of the manuscript.
References
[1] Morik K, Imhoff M, Brockhausen P, Joachims T, Gather U.Knowledge discovery and knowledge validation in intensive care.Artif Intell Med 2000;19(3):225–49.
[2] Verduijn M, Dagliati A, Sacchi L, Peek N, Bellazzi R, de Jonge E,et al. Comparison of two temporal abstraction procedures: a casestudy in prediction from monitoring data. In: Friedman C, editor.Proceedings of AMIA Annual Symposium. Am Med Inform Assoc;2005. p. 749–53.
[3] Zupan B, Holmes JH, Bellazzi R. Knowledge based data analysis andinterpretation. Artif Intell Med 2006;37(1):163–5.
[4] Morik K. Balanced cooperative modeling. In: Michalski R, Tecuci,editors. Machine learning: a multistrategy approach. Morgan Kauf-mann; 1994. p. 295–318.
[5] Schroeder LF Bazzan ALC. A multi-agent system to facilitateknowledge discovery: an application to bioinformatics. In ECCB:European Conference on Computational Biology and in Bioinfor-matics. 2002; p. 18:35–43.
[6] Berry L, Munzner T. BinX: dynamic exploration of time seriesdatasets across aggregation levels. In: Ward M, Munzner T, editors.Proc IEEE Symp Inform Vis. INFOVIS’04. IEEE Computer Society;2004. p. 215.
[7] Wattenberg M. Sketching a graph to query a time-series database. InProc 2001 Conf Human Factors Computing Systems, ExtendedAbstracts; ACM Press. 2001; p. 381–82.
[8] Notsu H, Okada Y, Akaishi M, Niijima K. Time-tunnel: visualanalysis tool for time-series numerical data and its extension towardparallel coordinates. In Proc Int Conf Computer Graphics, ImagingVis, CGIV’05; IEEE Computer Society. 2005. p. 167–72.
[9] Shahar Y, Goren-Bar D, Boaz D, Tahan G. Distributed, intelligent,interactive visualization and exploration of time-oriented clinical dataand their abstractions. Artif Intell Med 2006;38(2):115–35.
[10] Lin J, Keogh E, Lonardi S, Lankford J, Nystrom D. VizTree: a toolfor visually mining and monitoring massive time series databases. In:Nascimento M, Ozsu T, Kossmann D, Miller R, Blakeley J, SchieferB, editors. Proc Thirtieth Int Conf Very Large Data Bases.VLDB’04. Morgan Kaufmann; 2004. p. 1269–72.
[11] Lin J, Keogh E, Wei L, Lonardi S. Experiencing SAX: a novelsymbolic representation of time series. J Data Min Knowl Disc 2007.To Appear.
[12] Aris A, Shneiderman B, Plaisant C, Shmueli G, Jank W. Represent-ing unevenly-spaced time series data for visualization and interactiveexploration. In: Costabile MF, Paterno F, editors. Proc IFIP TC13Int Conf. Human–Computer Interaction—INTERACT. Berlin/Hei-delberg: Springer; 2005. p. 835–46.
[13] Augusto JC. Temporal reasoning for decision support in medicine. JArtif Intell Med 2005;33(2):1–24.
[14] Shahar Y. A framework for knowledge-based temporal abstraction.Artif Intell 1997;90(1–2):79–133.
[15] Black J, Robertson S, Zachary W. Cognition, computing, andcooperation. Intellect Edition 1990.
[16] Clarke A, Smyth M. A co-operative computer based on the principlesof human co-operation. J Man-Mach St 1993;38(1):3–22.
[17] Salembier P. Etude Empirique et Modelisation d’une Activite deDiagnostic Cognitif. Intellectica. 1992;15:55–96.
[18] Horvitz E. Principles of mixed-initiative user interfaces. In: ProcCHI’99, ACM SIGCHI Conf Human Factors Computing Systems.1999; p. 159–66.
[19] Amant St R, Cohen P. Interaction with a mixed-initiative system forexploratory data analysis. J Knowledge-based Sys 1998;10(5):265–73.
[20] Maturana HR, Varela FJ. Autopoiesis and cognition. Dordrecht.Holland: Reidel D, 1980.
[21] Maturana HR. Biology of language: the epistemology of reality. In:Miller GA, Lenneberg E, editors. Psychology and biology oflanguage and thought: essays in Honor of Eric Lenneberg. NewYork: Academic Press; 1978. p. 27–63. Chapter 2.
[22] Steels L, Kaplan F. Collective learning and semiotic dynamics.Advances in artificial life. In Floreano D, Nicoud J-D, Mondada Feditors. ECAL’99: Proc Fifth European Conf Artificial Life. 1999; p.679–88.
[23] Stuber A, Hassas S, Mille A. Language games for meaningnegotiation between human and computer agents. In: Dikenelli O,Gleizes MP, Ricci A, editors. ESAW’05: Proc Eng Soc Agents. -World; 2005. p. 275–87.
[24] Subrahmanian E, Monarch I. Annotations and Collaboration: One inService of the Other. In Boujut J editor: Proceedings of theInternational Workshop on Annotation for Collaboration—Meth-ods, Tools and Practices; CNRS—Programme Societe de l’Informa-tion; 2005; p. 73–82.
[25] Steels L. Evolving grounded communication for robots. Trends CognSci 2003;7(7):308–12.
[26] Schwarz E. Can real life complex system be interpreted with the usualdualist physicalist Epistemology—or is a holistic approach necessary?Res-Systemica, vol. 2 Special Issues Proc fifth Eur Sys Sci Congr,Crete, 2002.
T. Guyet et al. / Journal of Biomedical Informatics 40 (2007) 672–687 687
[27] Molina LB, Belanche L, Nebot A. Feature selection algorithms:a survey and experimental evaluation. In Proc IEEE Int ConfData Mining, ICDM 2002; IEEE Computer Society. 2002; p.306–13.
[28] Agrawal R, Srikant R. Fast algorithms for mining association rules.In: Bocca JB, Jarke M, Zaniolo C, editors. Proc Twentieth Int ConfVery Large Databases. VLDB’94. Morgan Kaufmann; 1994. p.487–99.
[29] Dousson C, Duong TV. Discovering chronicles with numerical timeconstraints from alarm logs for monitoring dynamic systems. In:Dean T, editor. Proc Int Joint Conf Artif Intell. IJCAI’99. MorganKaufmann; 1999. p. 620–6.
[30] Hoppner F. Learning dependencies in multivariate time series. InProc ECAI’02 Workshop Knowledge Discovery in (Spatio-)temporalData. 2002; p. 25–31.
[31] Mannila H. Efficient algorithms for discovering association rules. In:Fayyad U, Uthurusamy R, editors. AAAI Workshop KnowledgeDiscovery Databases (SIGKDD). California: AAAI Press; 1994. p.181–92.
[32] Jones P, Jacobs J. Cooperative problem solving in Human–machinesystems: theory, models, and intelligent associate systems. IEEETrans Systems, Man and Cybernetics, Part C: Appl and Rev2000;30(4):397–407.
[33] Shyr P, Tecuci G, Boicu M. Evaluation of mixed-initiative knowledgebase development methods and tools. In: Proc IJCAI-2001 Workshopon Empirical Methods in AI. 2001; p. 47–53.
[34] Sassoon CS, Forest GT. Patient-ventilator asynchrony. Curr OpinCrit Care 2001;7(1):28–33.
[35] Thille A, Rogriguez P, Cabello B, Lellouche F, Brochard L. Patient-ventilator asynchrony during assisted mechanical ventilation. JIntensive Care Med 2006;32(10):515–22.
[36] Fromont E, Quiniou R, Cordier MO. Learning rules from multi-source data for cardiac monitoring. In: Miksch S, Hunter J,Keravnou E, editors. Proc Tenth Conf Artif Intell Med. Ber-lin: Springer-Verlag; 2005. p. 484–93.
[37] Hunter J. TSNet. A distributed architecture for time series analysis.In Peek N, Combi C editors: Proc Workshop Intelligent DataAnalysis Bio-Med Pharmacol, IDAMAP. 2006; p. 85–92.