july 2016 international
TRANSCRIPT

Ju
ly 2
01
6 • V
ol. 1
60
• No
. 7
Vol. 160 • No. 7 • July 2016
New Ways to Address Environmental Issues
“Show Me” State Plant Wins PRBCUG Plant of the Year
Can Coal Refuse Be Environmentally Friendly?
New Reasons to Consider Waste-to-Energy
BUSINESS & TECHNOLOGY FOR THE GLOBAL GENERATION INDUSTRY SINCE 1882

A World of SolutionsVisit www.CBI.com
A COLLABORATIVE APPROACH
CB&I understands our customers’ needs for economical projects that
compete in today’s competitive, global marketplace. Our collaborative
approach provides a safe, environmentally responsible and cost-efficient
design and execution strategy that assures certainty of outcome and a
financeable project.
Our approach is flexible, both regarding services provided and contracting
methodology. Working with the customer from pre-FEED through EPC and
commissioning ensures that we are working together towards a common goal.
Contact CB&I at +1 704 343 7500 to learn how our complete solutions can
benefit your next gas-fired power generation project.
ADVANCE CLASS TURBINES
PIPE AND STEEL FABRICATION
INTEGRATED SUPPLY CHAIN SOLUTION
EXTENSIVE CRAFT RECRUITMENT AND MANAGEMENT EXPERIENCE
En
terg
y’s 5
50
Me
ga
wa
tt Nin
em
ile 6
CC
GT
po
we
r pla
nt
40M042016H
CIRCLE 1 ON READER SERVICE CARD

July 2016 | POWER www.powermag.com 1
16H
Established 1882 • Vol. 160 • No. 7 July 2016
SPEAKING OF POWER
Power’s Environmental Issues Then and Now 6
GLOBAL MONITOR
Rwanda’s Power Production Triumph over a “Killer Lake” 8
TVA Submits Pioneering Application for SMR Early Site Permit 9
THE BIG PICTURE: China’s Power Glut 10
China’s CAP1400 Clears IAEA Safety Assessment 12
One of the World’s Biggest Biomass-Fired CHP Plants Is Inaugurated 12
Employing Fuel Cells for Carbon Capture 13
POWER Digest 14
FOCUS ON O&M
Boiler Tube Failure Thermohydraulic Analysis 16
LEGAL & REGULATORY
Securing Pipeline Infrastructure for Gas-Fired Generation in New England 18By Glenn S. Benson and Walker Stanovsky, Davis Wright Tremaine
COVER FOCUS: ENVIRONMENTAL ISSUESGenerators Grapple with ELG Implementation 20
Early compliance with the Environmental Protection Agency’s Effluent Limita-
tion Guidelines (ELGs) for steam electric power generating units has raised
new equipment, monitoring, operational, and labor issues that are proving
challenging for some plants.
Evaluating the Use of CEMS for Accurate Heat Rate Monitoring and Reporting 24If the Clean Power Plan survives legal challenges, many plants will be looking
for cost-effective ways to monitor heat rate. Electric Power Research Institute
researchers explain what they’ve learned about using continuous emissions
monitoring systems (CEMS) for just that purpose.
Simplify MATS Compliance with Particulate Matter Continuous Emission Monitors 27 Four years into the Mercury and Air Toxics Standards (MATS) compliance era,
enough historic data and improved monitors exist to potentially change the
particulate matter (PM) compliance strategy to one that uses a PM monitor
instead of quarterly PM stack testing.
Emissions Catalyst Issues for Fast-Start Combined Cycle Power Plants 31Among the less-familiar consequences of frequent and faster starts at com-
bined cycle plants are challenges associated with fast start of the emissions
catalyst systems, especially given that best available control technology limits
required by regulations are not practical where cycling occurs.
Circulating Fluidized Bed Dry Scrubber Effectively Reduces Emissions 34By taking an unconventional route, a small Midwest generator is meeting
emissions requirements and enjoying one of this industry’s top-performing
retrofit units for SO2 reduction.
8
34
12
ON THE COVEROpened in 1974 on the Navajo Nation,
the 2,250-MW Navajo Generating Sta-
tion burns Powder River Basin coal to
serve electric customers in Arizona, Ne-
vada, and California. It is operated by Salt
River Project. Courtesy: Gail Reitenbach

www.powermag.com POWER | July 20162
Real-Time Environmental Data Integration Improves Air Quality Reporting 37As with so many other plant functions these days, greater operational com-
plexity in the environmental regulatory compliance realm requires new ways
of working. Real-time data integration and management can offer multiple
benefits.
Weighing the Environmental Impacts of Wind and Solar 40Even renewable energy technologies have environmental impacts. As manu-
facturers and developers gain experience with wind and solar technologies,
they’re also working to minimize negative consequences.
Avoiding Wildlife Impacts From Renewable Energy in Europe 43Europe, which has a longer history than the rest of the world with renew-
ables—especially offshore wind and marine power projects—is also a leader
in determining how to minimize danger to creatures on land and in water.
SPECIAL REPORT: PRB COALPRB Coal Users’ Group Plant of the Year: Ameren’s Rush Island Energy
Center 52The Powder River Basin Coal Users’ Group gave its top award this year to a
plant recognized for innovation and implementation of “best practices and
best available technologies” for burning PRB coal.
FUELS
The Coal Refuse Dilemma: Burning Coal for Environmental Benefits 56Using waste coal—which has been piling up from hundreds of years of min-
ing—as a fuel can reduce the environmental damage these piles create, but
the low-grade feedstock still faces environmental and economic challenges.
Energy from Waste: Greenhouse Gas Winner or Pollution Loser? 59Power market economics in the U.S. have not been friendly to waste-to-en-
ergy plants, but new environmental data—as well as state and federal poli-
cies—could help spur new growth in the sector.
Understanding and Mitigating Metallurgical Effects of Coal Blending and Switching 63Many plants change fuel sources for environmental and economic reasons,
but unless you understand the consequences of such changes, you could add
new operational and maintenance headaches.
COMMENTARY
China’s Coal Industry: Status and Outlook 68By Dr. Niu Dongxiao, Song Zongyun, and Xiao Xinli, North China Electric
Power University
■ Watts Bar Unit 2 Nuclear Plant Synchronized to Power Grid■ Exelon Makes Good on Threat—Quad Cities and Clinton Nuclear Plants to
Close■ Uranium Production Near Historic Lows as U.S. Reactors Look to Russia■ Moniz: Incentives Needed to Alleviate Nuclear Power Woes■ For Sale: Partially Constructed Bellefonte Nuclear Power Plant■ Experts: Gas Power’s Expansion Riddled with Roadblocks■ SaskPower Carbon Capture Facility Operating More Reliably■ Fire Is Latest Hurdle for Ivanpah Concentrating Solar Power Plant■ D.C. Circuit Delays Clean Power Plan Case Hearing by Months, Opts for En
Banc Review■ EIA International Outlook to 2040 Foresees Decoupling of Power Demand
and Economic Growth
SPRING BROUGHT PLENTY OF NUCLEAR NEWS TO POWERMAG.COM
52
56
CONNECT WITH POWER
If you like POWER magazine, follow us on-
line for timely industry news and comments.
Become our fan at facebook.com/
POWERmagazine
Follow us on Twitter
@POWERmagazine
Join the LinkedIn POWER magazine
Group and the Women in Power
Generation Group
63
§ §
minimuminesgeneration

Handling a World of MaterialsThe brands comprising TerraSource Global (Gundlach Crushers, Jeffrey Rader and Pennsylvania
Crusher) are wholly-owned subsidiaries of Hillenbrand, Inc. (NYSE: HI) © 2016 TerraSource Global. All Rights Reserved. *Posimetric® is a licensed trademark of GE Energy (USA) LLC.
Phone: +1 (855) 483-7721 § Email: [email protected] § Web: www.terrasource.com/pm
Crush ItOur Gundlach® Crushers and
Pennsylvania® Crusher brands offer
a wide array of equipment including
roll mills, cage mills, hammermills,
breakers, impactors, granulators and
Coalpactor® crushers in a variety of
sizes to solve your crushing needs.
Feed ItEliminate fugitive dust and improve
plant safety with our simple, reliable
Posimetric® Feeders*
• for coal, biomass, wood chips and
more
• dust-free, positive displacement
• only one moving part
• ultra-low horsepower
• models to suit any capacity
Size ItFor your sizing needs, our Mountaineer®
II Sizers are rugged, high-capacity
crushers providing
• accurate primary or secondary
sizing of coal
• minimuminesgeneration
Visit our website, follow us on social media or contact us today for more information.
brand
brand
factory authorized technical service,field service and replacement parts
are just a click away!
GENUINE
Whether you need crushing, feeding or sizing
equipment, parts or service, TerraSource Global
offers proven solutions trusted throughout the
world.
CIRCLE 2 ON READER SERVICE CARD

www.powermag.com POWER | July 20164
Visit POWER on the web: www.powermag.com
Subscribe online at: www.submag.com/sub/pw
POWER (ISSN 0032-5929) is published monthly by Access
Intelligence, LLC, 9211 Corporate Blvd., 4th Floor, Rockville,
MD 20850-3245. Periodicals Postage Paid at Rockville, MD
20850-4024 and at additional mailing offices.
POSTMASTER: Send address changes to POWER, P.O. Box
3588, Northbrook, IL 60065-3588 . Email: [email protected].
Canadian Post 40612608. Return Undeliverable Canadian
Addresses to: IMEX Global Solutions, P.O. BOX 25542, Lon-
don, ON N6C 6B2.
Subscriptions: Available at no charge only for qualified exec-
utives and engineering and supervisory personnel in electric
utilities, independent generating companies, consulting en-
gineering firms, process industries, and other manufacturing
industries. All others in the U.S. and U.S. possessions: $107
for one year, $171 for two years. In Canada: US$112 for one
year, US$188 for two years. Outside the U.S. and Canada:
US$227 for one year, US$368 for two years. Payment in full
or credit card information is required to process your order.
Subscription request must include subscriber name, title,
and company name. For new or renewal orders, call 847-501-
7541. Single copy price: $25. The publisher reserves the right
to accept or reject any order. Allow four to twelve weeks for
shipment of the first issue on subscriptions. Missing issues
must be claimed within three months for the U.S. or within
six months outside U.S.
For customer service and address changes, call 847-559-
7314 or fax 847-291-4816 or e-mail [email protected] or
write to POWER, P.O. Box 3588, Northbrook, IL 60065-3588.
Please include account number, which appears above name
on magazine mailing label or send entire label.
Photocopy Permission: For licensing and reprints of
POWER magazine content, please contact Wright’s Media at
877-652-5295 or [email protected].
General mailing address: POWER, 11000 Richmond Av-
enue, Suite 690, Houston, TX 77042.
Copyright: 2016 Access Intelligence. All rights reserved.
EDITORIAL & PRODUCTION Editor: Dr. Gail Reitenbach
Consulting Editor: Dr. Robert Peltier, PE
Associate Editor: Thomas Overton, JD
Associate Editor: Sonal Patel
Associate Editor: Aaron Larson
Senior Graphic Designer: Michele White
Production Manager: Tony Campana, [email protected]
Contributors: Glenn S. Benson; Philip Black, PE; Marius Botha; Lee Buchsbaum;
Chuck Dene; Niu Dongxiao; Michael P. Hindley; Sam Korellis;
Rama S. Koripelli, PhD; Rick J. Krenzke; Kennedy Maize;
David S. Moelling, PE; Daniel W. Ott; Robert Puhr; Walker Stanovsky;
Xiao Xinli; Song Zongyun
GENERATING COMPANY ADVISORY TEAM T. Preston Gillespie, Jr., Senior Vice President-Nuclear Operations, Duke Energy
Pat McCarty, Generation Manager, Tacoma Power
Mark C. McCullough, Executive Vice President, Generation, American Electric Power
Sarah P. Orban Salati, Managing Director, New Energy Solutions, AES
ADVERTISING SALES Publisher: Matthew Grant, 713-343-1882, [email protected]
Southeast, Central, & Western U.S./
Western Canada: Dan Gentile, 512-918-8075, [email protected]
Eastern U.S./Eastern Canada/Latin America: Ed Mueller, 309-278-8120, [email protected]
UK/Benelux/Scandinavia/Germany/
Switzerland/Austria/Eastern Europe: Petra Trautes, +49 69 5860 4760, [email protected]
Italy/France/Spain/Portugal: Ferruccio Silvera, +39 (0) 2 284 6716, [email protected]
China: Rudy Teng, +86 13818181202, [email protected]
Japan: Katsuhiro Ishii, +81 3 5691 3335, [email protected]
India: Faredoon B. Kuka, 91 22 5570 3081/82, [email protected]
South Korea: Peter Kwon, +82 2 416 2876, +82 2 2202 9351, [email protected]
Classified Advertising
Diane Burleson, 512-337-7890, [email protected]
POWER Buyers’ Guide Sales
Diane Burleson, 512-337-7890, [email protected]
AUDIENCE DEVELOPMENT Audience Development Director: Sarah Garwood
Marketing Manager: Jessica Grier
Fulfillment Manager: George Severine
CUSTOMER SERVICE For subscriber service: [email protected], 847-763-9509
Electronic and Paper Reprints: Wright’s Media, [email protected], 877-652-5295
List Sales: MeritDirect, Danielle Zaborski, [email protected], 914-368-1090
All Other Customer Service: 713-343-1887
BUSINESS OFFICE Access Intelligence, 11000 Richmond Avenue, Suite 690, Houston, TX 77042
Senior Vice President & Group Publisher
Aerospace, Energy, Healthcare: Jennifer Schwartz
Vice President and Publisher: Michael Grossman, 713-343-1887, [email protected]
ACCESS INTELLIGENCE, LLC 9211 Corporate Blvd., 4th Floor, Rockville, MD 20850-3245
301-354-2000 • www.accessintel.com
Chief Executive Officer: Donald A. Pazour
Chief Operating Officer: Heather Farley
Exec. Vice President & Chief Financial Officer: Ed Pinedo
Exec. Vice President, Human Resources & Administration: Macy L. Fecto
Senior Vice President & Chief Information Officer: Rob Paciorek
Senior Vice President, Customer Acquisition and Retention: Sylvia Sierra
Senior Vice President, Digital Development: Alison Johns
Vice President, Production, Digital Media & Design: Michael Kraus
Vice President, Financial Planning & Internal Audit: Steve Barber
Vice President/Corporate Controller: Gerald Stasko

Indeck Group of CompaniesIndeck Keystone Energy LLC • Indeck Power Equipment Co. • Indeck Boiler Corp. • Indeck Energy Services Inc.
(814) 464-1200 • 24-HR Parts: (800) 322-5995 • www.indeck-keystone.com • [email protected]
CIRCLE 3 ON READER SERVICE CARD

www.powermag.com POWER | July 20166
SPEAKING OF POWER
Power’s Environmental
Issues Then and Now
Discussions about environmental is-sues related to power plants and the regulations governing their opera-
tion are as old as the industry, I discov-ered while thumbing through the bound July through December 1914 issues of POWER. The specifics of the environmen-tal concerns have become more detailed and complex as scientific knowledge, monitoring technologies, and mitigation solutions advance. However, the general arguments—environmental control versus efficiency, for example—and the human nature demonstrated in the debates, are remarkably similar 102 years later.
Smoke and AshesSeveral articles in 1914 addressed mini-mizing smoke from power and steam plants both big and small (and there were more of the latter).
The August 11 issue ran a one-page sto-ry titled “Rules for Firing without Smoke,” with this synopsis: “How to build, clean and bank fires. In carrying a thick fire the coal is dumped in piles instead of being spread over the grate. The volatile matter is distilled in amounts which the furnace can care for and less smoke is produced.” This editor’s note was included at the end: “It is to be remembered that Mr. Monnett is smoke inspector of Chicago and that the rules in the above, as well as the recom-mendations in the previous articles of this series, apply particularly to conditions in the region where they burn the soft Illi-nois coal which is high in volatile matter. Further, being smoke inspector, the au-thor’s principal effort is naturally toward smoke prevention, rather than economy or efficiency, which are more or less of sec-ond consideration.”
But POWER clearly appreciated efforts to reduce smoke pollution, and on Octo-ber 6 advocated more adequately staffed city “smoke inspection departments,” concluding, “What is an appropriation of two, or twenty thousand dollars to reduce the cause of annual damage amounting to millions in most large cities?”
And in the September 8 issue the editor praises the Mellon Institute at the Univer-sity of Pittsburgh for its bulletin “Some
Engineering Phases of Pittsburgh’s Smoke Problem.” He notes the institute previ-ously addressed smoke’s “damage to laun-dry, buildings, vegetation and its psychic effect upon individuals.” The latest bul-letin addresses the “causes and abatement of the smoke evil” and finds that of 152 plants observed, “the underfed type of stoker [gave] smokeless combustion when properly handled.” The editorial adds, “One cannot read the report without again being reminded that plenty of available cheap fuel is sometimes an evil as well as a blessing to a large city, for as long as it is cheap, gross negligence and resulting smoke accompany its use.” Similar argu-ments about the downside of cheap fuels continue to this day.
Though ash management has become an especially sticky problem given recent reg-ulatory action (see “Coal Combustion Re-siduals Rule Compliance Strategies” in last month’s issue), ash-handling has always been a matter of concern, at least from a material-handling perspective. One let-ter in 1914 commented on an article that had described a new vacuum ash-handling system. The writer calculated operating and depreciation costs and concluded that with few exceptions, “handling with wheelbarrows where the length of travel is moderate” was economically preferable. A few issues later, another reader took is-sue with those calculations—the sort of commentary that these days takes place in the online comments section of POWER articles or on social media.
Legislating SafetyIn the early days of the industry, it was a struggle to get codes and standards and licensing requirements in place. It really was a Wild West of boiler operators, and just as in the Wild West, many died—as a result of boiler explosions and other cata-strophic malfunctions. When an editorial in Hotel World protested against “passing laws for examining and licensing station-ary engineers to handle heating boilers,” claiming that explosions were uncommon, a POWER editorial countered with the fact that there had been more than 500 such accidents in the previous year.
The hoteliers’ magazine was concerned about the added cost of paying for “li-censed” men to operate the hotels’ steam heat systems. POWER responded: “Taking the worst figures cited, it would cost a ho-tel $450 a month instead of $25 to $50. Is not that a terrible price to pay for the increased safety of its guests during the winter? If the journal we are criticizing fairly reflects the attitude of its field, the editor of this paper hopes to do all his traveling in the summer, when he can stop at a hotel without feeling that he is sleep-ing over a gunpowder mine.”
As you can see, warranted sarcasm is nothing new in POWER editorials. And, because my father was a licensed boiler operator for an educational institution’s campus at the beginning of his career, I’m grateful that sensible laws eventually passed.
Although today’s regulation of the power industry is broader and more com-plex—one can’t see immediate effects of airborne mercury pollution in the way one can see bodies maimed by plant explo-sions—similar cost-benefit debates con-tinue. Most recently, they’ve focused on the regulation of CO2 emissions. (Back in 1914, the only concern about CO2 was fig-uring out why it might be too low in flue gas, and how to improve combustion.)
Always Room for ImprovementThe July 21, 1914, issue of POWER in-cluded this random, one-line observation: “So called waste material is in reality good material in the wrong place.” That’s essen-tially the premise of using waste coal for fuel, an issue with both environmental pros and cons, as explained in this issue’s “The Coal Refuse Dilemma: Burning Coal for Environmental Benefits.” As that fea-ture and every other article in this issue demonstrates, finding the sweet spot for maximizing operational and economic ef-ficiency while operating cleanly and safely remains the goal of the best power plants today. We hope you will learn from the new technologies and techniques offered in the following pages. ■
—Gail Reitenbach, PhD is POWER’s
editor.

The management of thermal and renewable assets requires numerous services to maintain
the integrity of the equipment and ensure optimal production. From inspection of turbine
shafts to in-service valve installations on cooling lines, Team has the experience, equipment,
and locations to keep your power generation equipment going.
Team experts are available 24 hours a day, 7 days a week, 365 days a year.
Call TEAM today: 1-800-662-8326
www.teamindustrialservices.com
INDUSTRIES SERVED:
Minimizing Downtime. Maximizing Performance.
YOUR SINGLE SOURCE
FOR SERVICE:
+ Bolting/Torquing
+ Concrete Repair
+ Emissions Control
+ Exchanger Services
+ Field Machining
+ Fitness for Service
+ Heat Treating
+ Hot Tap/Line Stop
+ Isolation Test Plugs
+ Leak Repair
+ Manufacturing/Engineering
+ Mechanical Integrity
+ NDE/NDT Inspection
+ Specialty Welding
+ Turnkey Tank Program
+ Valve Insertion
+ Valve Repair
KEEP IT GOING.
CIRCLE 4 ON READER SERVICE CARD

www.powermag.com POWER | July 20168
Rwanda’s Power Production Triumph over a “Killer Lake”Lake Kivu, the 1,040-square-mile “killer lake” that stretches over the border be-tween Rwanda and the Democratic Repub-lic of Congo (DRC), has long been a source of trepidation.
Because it sits between two volcanic regions in the western branch of the Great Rift Valley, the deep, perpetually strati-fied lake’s bottommost waters absorb high concentrations of carbon dioxide (CO2) from magma-heated springs deep underground, and microbes convert much of the CO2 to methane. These dissolved gases are held in solution by pressures in the depths of the lake but can emerge if zones of high concentration move to-ward the surface, a process known as a limnic eruption, or “overturn.” Because the region is regularly subject to large-magnitude seismic events and volcanic discharges—and considering that meth-ane has a high partial pressure—Lake Kivu is known to experience violent over-turns. Geologists believe they occur at Lake Kivu about every 1,000 years—and that the lake is ripe for another.
Limnic eruptions occurred at much smaller Lakes Monoun and Nyos across the continent in Cameroon in 1984 and 1986 respectively, killing more than 1,700 peo-ple by asphyxiation. But an overturn at Kivu could be catastrophic and endanger millions of people living around its shores on both sides of the border because it contains far more dissolved gases than those two lakes.
Rwanda’s government has for years sought to extract the methane from Kivu’s depths, both to mitigate the risk of such a calamity and to generate power. Its ef-forts first came to fruition in 2008, when the country’s first methane-extracting and power-producing plant, a 3-MW pilot proj-ect, started operations.
Since then, the government has nego-tiated several methane gas concessions. Later in 2008, U.S.-based ContourGlobal, a firm that owns about 4,000 MW of ca-pacity in 20 countries, including in Africa, entered into a partnership with the Rwan-dan government to transform the menace of the lake’s gas deposits into a 25-MW power plant, dubbed KivuWatt. The proj-ect subsequently garnered financial back-ing from the African Development Bank, the Emerging Africa Infrastructure Fund,
the Netherlands Development Finance Co., and the Belgian Investment Co. for Devel-oping Countries. In 2011, ContourGlobal contracted Finnish energy technology firm Wärtsilä to supply an engine-based plant with full engineering, procurement, and construction delivery.
The plant, which has been operational since December 2015 but was inaugurated in May, relies on two processes: methane
extraction and power production. The gas extraction process, performed on a barge anchored 13 kilometers (km) offshore in Lake Kivu (Figure 1), brings gas-rich wa-ters from a depth of 300 meters (m) and 35-bar pressure, reducing pressure to 2 bar in a gas separator, where gas bubbles are extracted from the water. Raw gas is then washed in four wash towers, ContourGlob-al explained.
1. A killer lake reformed. Methane is drawn from Rwanda’s Lake Kivu at a depth of 300
meters by a special barge anchored 13 kilometers offshore. Courtesy: Werner Krug
2. Harnessing lake methane. Rwanda’s KivuWatt power plant runs on methane gas
that is lifted from the depths of Lake Kivu, an “exploding lake.” The plant comprises three 20-cyl-
inder 34SG gas-powered engines supplied by Wärtsilä. Courtesy: Werner Krug

July 2016 | POWER www.powermag.com 9
The clean gas is then transported to the power plant (Figure 2) via pipeline, where three Wärtsilä 34SG engines use it as fuel. According to Wärtsilä, the engines are op-timized to run on Lake Kivu’s gases, which have a lower heating value than standard natural gas. “This has helped to downsize the size of the extracting barge and opti-mize the costs of producing electricity,” it said in a statement.
ContourGlobal noted that the design and technology is performing “even bet-ter than expected,” and projects that the gas extraction facility will support at least an additional 9 MW of power generation, likely by the end of 2016.
For Rwanda, the project is proving valu-able beyond its power production, under-scoring its contribution to the region’s socioeconomic development. Contour-Global is working with the local popula-tion, training and developing local workers to run KivuWatt and future installations. The project has also generally promoted peace with the DRC (the border area has suffered from intermittent conflict for de-cades), which is also reportedly consider-ing a similar project, the government said.
Rwanda is now planning a second phase
that will involve two or three barges to generate an additional 75 MW.
TVA Submits Pioneering Application for SMR Early Site PermitThe first-ever early site permit (ESP) ap-plication for a small modular reactor (SMR) was submitted to the U.S. Nuclear Regula-tory Commission (NRC) this May, marking a resurgence for the fledgling nuclear en-ergy technology that has seen a number of setbacks in recent years.
The Tennessee Valley Authority (TVA) submitted an ESP application for a poten-tial future SMR plant at its Clinch River site, 25 miles northwest of Knoxville in eastern Tennessee. The pioneering move could result in an operating plant at the site by 2026 if the TVA chooses to pursue development, experts from the Nuclear En-ergy Institute said.
The federally owned corporation’s ex-ploration of SMR technology is part of efforts to diversify its fleet, moving it toward low-carbon energy. The TVA also said that the project’s main objective is to demonstrate that SMRs can be used to meet generation needs in an “incremental
fashion” while addressing critical energy security issues and tackling carbon reduc-tion goals. The U.S. Department of Energy (DOE) is partially funding the TVA’s regula-tory review process.
The NRC has so far received seven appli-cations for ESPs—certification that a site is suitable for construction of a nuclear plant—and all but Clinch River have been focused on full-size reactors. But most ap-plicants have chosen to defer their license applications, citing economic reasons. For the TVA, the value of an ESP application is to reduce licensing uncertainty when it applies for a combined license by reach-ing early conclusions on siting and envi-ronmental issues. However, it said, a final decision to proceed—still “several years away”—will also hinge on economics.
The company has yet to choose an SMR technology. In 2011, the TVA joined forces with Babcock & Wilcox (B&W) to design and license its 180-MW mPower SMR, but that company slashed funding for the mPower program in April 2014, citing un-favorable market conditions. A number of other light-water SMR designs are under development in the U.S., including those by BWX Technologies, Holtec, Westing-
CIRCLE 5 ON READER SERVICE CARD

www.powermag.com POWER | July 201610
Over the past decade, driven by a booming energy-intensive industry, China’s thermal power generation capacity has seen a
compound annual growth rate of about 11.1%. But now that the country is facing a more sluggish economy and power
demand has softened, and as it battles rampant air pollution and has accelerated renewable power capacity additions, it is
facing a massive coal power glut. (See also this month’s Commentary at the back of the issue.) The National Energy
Administration (NEA), the National Development and Reform Commission’s energy management arm, estimates nearly 300
GW of coal-fired capacity has been approved or is under construction around the country—but it has determined that no
more than 190 GW of new capacity will be needed before 2020. In April, the government took the drastic measure to halt
construction of coal-fired power plants in 13 provinces where capacity is in surplus and forced developers to stall construc-
tion of already approved plants in another 15 provinces. Sources: China National Bureau of Statistics, China Electricity
Council, NEA —Copy and artwork by Sonal Patel, a POWER associate editoror
A key indicator of China’s
surplus is its utilization
rate. The hours that China’s
thermal plants operate
have fallen sharply in
recent years. Generally, the
industry regards more than
5,500 hours of thermal
plant operation as a signal
that it is facing a power
supply pinch, while less
than 4,500 hours indicates
a power surplus. In 2015,
the utilization rate was
4,329 hours—a new
69-year low.
Estimated
new thermal
capacity*
Existing thermal
capacityTotal installed
capacity
Non-thermal
capacity
*Figures are drawn from official published data. Totals year
to year may not be consistent with data from previous
years, most likely to due to rounding and retirements of
older generation.
2012
1,147GW
2013
1,247GW
2014
1,360GW
2015
1,507GW
52GW
37GW
47GW
64GW
762GW
New and
existing
thermal:
71% of total
installed
capacity
4,329hours
Change from
2012:
–13%
4,706hours
Change from
2012:
–6%
5,012hours
Change from
2012:
+1%4,982hours
333GW
385GW
445GW
517GW
826GW
New and
existing
thermal:
69% of total
installed
capacity
868GW
New and
existing
thermal:
67% of total
installed
capacity
926GW
New and
existing
thermal:
66% of total
installed
capacity
THE BIG PICTURE: China’s Power Glut

CIRCLE 6 ON READER SERVICE CARD

www.powermag.com POWER | July 201612
house, and NuScale Power, whose design and licensing is also backed by $217 mil-lion in DOE match funding over five years (Figure 3).
Ultimately, the technology decision will be heavily influenced by the SMR de-sign’s attractiveness as it relates to safety, cost, and operability, TVA Senior Manager for SMRs Dan Stout said. “Other consid-erations include the developer’s financial strength, capabilities and commitments that influence the attractiveness of the business case.” Depending on technology selection, the total electrical output of the site will be a maximum of 800 MW, he added. “The application establishes a plant parameter envelope that includes all four domestic light-water small modular reactor designs. This envelope could sup-port multiple reactors from each of the SMR vendors, up to four mPower reactors, four Holtec reactors, 12 NuScale reactors, or three Westinghouse reactors,” he said.
China’s CAP1400 Clears IAEA Safety AssessmentChina’s CAP1400—a reactor design based on Westinghouse’s AP1000 pressurized water reactor—has successfully passed the International Atomic Energy Agency’s (IAEA’s) Generic Reactor Safety Review.
The milestone is significant for China, which plans to deploy the advanced reac-tor design in large numbers (Figure 4) as well as export the technology.
The IAEA’s review assesses the safety cases of new reactor designs that are not yet in the licensing stage against appli-cable IAEA safety standards.
According to China’s State Nuclear Pow-er Technology Corp. (SNPTC), the 1,500-MWe (gross) reactor has a design life of 60 years and a design annual availability of more than 93%. Refueling would be needed every 18 months, and it has pas-sive safety features, including a passive core cooling system, a passive contain-ment cooling system, and a passive main control room habitability system. As de-signed, the company envisions construc-tion would span about 56 months, though it is working to trim that to 48 months.
SNPTC says China has spent about $2 billion on research and development of the reactor. Among its major developers were Westinghouse, which provided de-sign consultation; Lockheed Martin, which participated in the protection and safety monitoring system development; Ohio State University, which helped with test verification; and KSB and Curtiss-Wright’s Electro-Mechanical Division, which partic-ipated in the development of the reactor coolant pump.
One of the World’s Biggest Biomass-Fired CHP Plants Is InauguratedFortum Värme, a company jointly owned by Finnish energy firm Fortum and the city of Stockholm on May 9 inaugurated a new biomass-fired combined heat and power (CHP) plant on the shores of Värtan, a strait in Sweden’s capital city.
The Värtan CHP8 (130 MWe, 280 MWth), which began construction in 2013, will
begin commercial operations in the fall (Figure 5). According to its developers, the plant will use forest residues and wood waste—sawdust, bark, and logging residues from local and regional sources around the Baltic Sea—as well as recov-ered heat from data centers to produce district heat for nearly 200,000 house-holds. The plant is also designed for fuel flexibility to allow it to use new fuels from the developing bioenergy market, Fortum said. Daily consumption of wood chips will be about 12,000 m3.
Building the plant in the middle of Stock-holm—a city with a population of about 1.4 million people—involved multiple challenges, including working with limited space and requiring closed-fuel systems to avoid dust emissions and noise. The plant uses an old rock cavern—previously used for oil storage—that was converted into a massive underground wood chip storage facility. It is able to store about 60,000 m3, or five days of fuel demand.
While the Värtan site has full access to road, rail, and sea transportation, the current fuel procurement plan is based on getting 40% by rail from Nordic biomass suppliers and another 60% by ship from the Baltic Sea region and Russia. “The aim is to ensure the security of supply and ac-cess to a wide geographic biomass market over time,” Fortum explained.
To ensure adequate supply by sea, the company built a new 200-m pier in the harbor area to accommodate two vessels up to Panamax size. On average, the plant requires three to four shipments per week to meet its fuel demand, as well as five trainloads per week, each with a capac-ity of about 4,600 m3. All fuel is unloaded and processed indoors within a closed system before delivery to the power plant. All logistics are coordinated in-house to control supply risks.
The company’s decision to use biomass was complicated by an emerging debate in the European Union (EU) about how sustainable the fuel source is. Fortum noted in an April 2016 energy review that biomass is now the most common form of renewable energy in the EU, and it is the only source that can replace every type of fossil fuel in all energy markets—heating, cooling, electricity, and transport—but concerns are growing about competition for resources and security of supply.
In the EU, while sustainability and traceability concerns are primarily related to biomass imports from other continents, the 27-member bloc has yet to issue a uni-form sustainability policy on all bioenergy (current EU sustainability criteria only ap-
3. New design. Oregon-based NuScale
Power is preparing to submit a design certifi-
cation application for its 50-MW small modular
reactor (SMR) to the Nuclear Regulatory Com-
mission this fall. The SMR developer is the
only one to have an active customer deploy-
ment project: The first NuScale facility is due
to be completed in 2024 in Idaho for UAMPS,
a municipal utility. In March, the company—
whose primary investor is Fluor Corp.—un-
veiled a modified AREVA HTP-2 fuel design for
the SMR, dubbed “NuFuel HTP2.” This image
shows a full-scale mockup of the upper part of
a NuScale SMR. Courtesy: NuScale Power
4. On the nuclear horizon. An artist’s
rendering of a future CAP1400 nuclear reactor
facility. Courtesy: SNPTC

July 2016 | POWER www.powermag.com 13
ply to biofuels and bioliquids, not solids), and that has hindered investments in bio-mass. “Harmonised sustainability criteria for all bioenergy would increase the pre-dictability and stability of the operating environment, ensure proper functioning
and transparency of the biomass markets, increase the use of sustainable biomass in energy production, and promote the tran-sition from fossil fuels to renewable and carbon-neutral biomass fuels,” the Fortum review added.
The EU’s policy, which is currently under public consultation, should apply to the origin of all bioenergy regardless of end use, be legally binding, and be applicable to plants exceeding 20 MWth. Ultimately, it should enable increased use of biomass while minimizing administrative burdens or related costs. “The new criteria should not decrease the competitiveness of bio-mass: in many cases, biomass competes with fossil fuels, which generally have no requirements to demonstrate sustainabil-ity,” it said.
—Sonal Patel, associate editor
Employing Fuel Cells for Carbon CaptureFuel cells are a rapidly expanding option for distributed generation, with fuel cell–based power plants now being deployed in capacities into tens of megawatts (see “59-MW Fuel Cell Park Opening Heralds Robust Global Technology Future” in the May 2014 issue). But as the technology improves and costs begin to scale, oppor-tunities for other applications are being explored.
One such application may even go be-yond power generation. Danbury, Conn.–
CIRCLE 7 ON READER SERVICE CARD
5. A biomass CHP giant. Finnish energy firm Fortum and the city of Stockholm have
inaugurated a new biomass-fired combined heat and power (CHP) plant near Värtan, a strait in
Sweden’s capital city. Värtan CHP8 is one of the largest of its type in the world. Courtesy: Fortum

www.powermag.com POWER | July 201614
based FuelCell Energy (FCE), one of the largest suppliers of fuel cells worldwide, and ExxonMobil in May announced a part-nership to explore the possibilities for us-ing fuel cells for carbon capture.
According to Kurt Goddard, FCE’s vice president of investor relations, the ap-plication will depart from the traditional method of powering the fuel cells with ambient air and methane. Instead of air, it uses coal- or gas-plant flue gas.
Normally in FCE’s carbonate fuel cells, methane is reformed in the cell anode to create CO2 and H2, which is then used to generate electricity by combining with ox-ygen from ambient air to create an electric current and exhaust streams of water va-por and CO2 (Figure 6). The carbon-capture fuel cell will still be powered by methane, but by using flue gas instead of ambient air, the chemical reactions in the cell can concentrate up to 90% of the incoming CO2, which flows with the CO2 generated in the reforming process into the normal exhaust stream, where it can easily be separated from the water vapor.
A critical difference—and bonus—in this process is that rather than being a parasitic drain on the plant, it actually generates additional power. In addition, the process destroys roughly two-thirds of the NOx in the flue gas.
How much CO2 can be captured depends on how many fuel cells are employed. A
typical 500-MW combined cycle plant would need around 120 MW of fuel cells to achieve 90% capture, Goddard said, while an equivalent coal plant might need around 400 MW of fuel cells because of its lower efficiency and higher CO2 emissions. Commercial deployment is still years away, but representatives from both companies are optimistic about the potential.
The possibilities of employing fuel cells to reduce power plant emissions for both coal plants and natural gas combined cycle plants, and potentially capture CO2, have drawn research attention in recent years, though applications have typically involved placing the fuel cells in front of the turbines or replacing typical combus-tion processes altogether. The FCE-Exxon-Mobil initiative is among the first to look at placing the fuel cells after combustion.
ExxonMobil began working with FCE on this project several years ago, Goddard said, beginning with informal discussions that led to more formal testing. With the potential now clear, the two companies have gone public with the initiative. The partnership will focus initially on how to further increase efficiency in separation and concentration of the CO2 from gas tur-bine exhaust. That is expected to take one to two years.
FCE and ExxonMobil scientists will be working to better understand the chemical processes that are taking place and how
they respond to different compositions of flue gas. Assuming success, the second phase will move to a small-scale pilot proj-ect for additional testing, then integration into a larger-scale pilot facility.
—Thomas W. Overton, JD, associate
editor
POWER DigestFuel Loading Begins at Kudankulam 2. Nuclear Power Corp. of India (NPCIL) began loading the first of 163 fuel assem-blies into the core of the second VVER-1000 reactor of the Kudankulam nuclear power plant in Tamil Nadu, India, on May 11. The 1,000-MW unit will begin gener-ating power pending approval from the Atomic Energy Regulatory Board. The unit is the second supplied by Rosatom subsidiary Atomstroyexport. The first Russian-built reactor at the plant, Ku-dankulam 1, started commercial operation in December 2014, and state-owned firm NPCIL is readying to build Units 3 and 4 at the site after delays concerning India’s nuclear damage liability law. India is also in discussions with Russia on costs to build Units 5 and 6, Indian news media reported in May.
Saudi Arabia Starts Up $3B Oil-Fired Power Plant. State-controlled Saudi Elec-tricity Co. (SEC) in mid-May grid con-nected and started commercial operations at the first 660-MW unit of its 2,640-MW Jeddah South Thermal Power Plant. The $3.12 billion oil-fired project that was announced in 2012 makes history in the kingdom for its use of highly efficient su-percritical boilers. South Korea’s Hyundai Heavy Industries built the plant while Ja-pan’s Mitsubishi Heavy Industries sup-plied the equipment. SEC hasn’t confirmed when it anticipates all units to be com-pleted, though it said that the project will help meet power demand from the west-ern region, particularly during the fasting month of Ramadan (which starts in June) in the holy cities of Mecca and Medina.
NuGen Delays UK Nuclear Plant Start-up by a Year. UK nuclear company NuGen-eration (NuGen), a joint venture between Toshiba’s Westinghouse (60%) and EN-GIE (40%), has delayed first power from a proposed nuclear plant in Cumbria to the end of 2025, a year later than planned. The company plans to build three AP1000 reactors with a combined capacity of up to 3.8 GW at the site near Sellafield in west Cumbria but has yet to make a fi-nal investment decision, likely to come in 2018. However, if the plant comes online in 2025, it could overtake EDF’s Hinkley Point C project, which has been billed as
6. Game changer? Fuel cells powered by natural gas could potentially function as carbon
capture technology by using power plant flue gas instead of ambient air. Courtesy: FuelCell
Energy

July 2016 | POWER www.powermag.com 15
the first new nuclear plant to begin opera-tions in the UK in a generation.
The UK needs the new plants to help re-place its coal plants and its aging nuclear fleet, which will be shuttered by 2025. As experts point out, NuGen still needs to secure approval for its AP1000 reactor under the country’s Generic Design Assess-ment approval process. EDF, meanwhile, in May announced that the Hinkley Point C project could take nearly 10 years to build once a decision has been made, also likely in 2018. The UK expects a third nuclear plant, Hitachi’s Horizon, to come online over the next decade.
CB&I Bows Out of Agreement to Build South Texas Project Nuclear Units. Toshiba Corp. and CB&I on May 11 agreed to terminate a series of agreements re-lated to the development and execution of an engineering, procurement, and con-struction (EPC) contract for South Texas Project (STP) Units 3 & 4, and on a global strategic partnership to promote Toshiba’s Advanced Boiling Water Reactor (ABWR). Toshiba America Nuclear Energy (TANE), CB&I, and Nuclear Innovation North America (NINA), the entity that owns the STP nuclear units, agreed that CB&I will be relieved from any further obligations related to the units. The agreement termi-nation means that TANE now becomes the sole EPC contractor for the proposed units, though Toshiba noted NINA may not plan to immediately start construction owing to “current economic drivers in Texas and other related issues.” The project received a combined construction and operating li-cense in February 2016.
Shaw Group, which became a CB&I subsidiary after its acquisition in 2013, entered into the alliance with Toshiba in 2010 to promote the Japanese com-pany’s ABWR design in markets world-wide. In December 2015, Westinghouse Electric Co. agreed to acquire CB&I’s Stone & Webster unit, recognizing that “CB&I’s business strategy is now focused on sectors other than nuclear new build projects.”
South Australian Royal Commission Backs International Nuclear Waste Stor-age Facility. As suggested in tentative findings issued this February, South Austra-lia’s Nuclear Fuel Cycle Royal Commission in May recommended that the state establish a facility that would be used for the interim storage and disposal of used nuclear fuel from all over the world (see “Commission Backs Plan to Store World’s Nuclear Waste in Australian Outback” in the April 2016 issue). The state “has the necessary attri-butes and capabilities to develop a world-
class waste disposal facility, and to do so safely,” the commission said, noting that such a facility could generate more than A$100 billion in income over its 120-year lifetime.
Royal Commissioner Kevin Scarce told reporters in May, after the final report’s release, that the state has a number of competitive advantages such as stable geology, a strong international reputation for a good regulatory environment, and a vast amount of land. Before a final deci-sion can be made, however, the state will need extensive community consultation, he said. A referendum or election wasn’t the best way to gain consent because the planning period for the proposed state government–owned facility would take more than a decade. “There isn’t one sil-ver bullet solution to this,” he was widely quoted as saying.
Eskom Looks to Extend Coal Plant Lifetimes. Power-strapped South Africa’s state-owned utility Eskom has decided to renew, rather than decommission, its ag-ing coal fleet. Eskom’s board in late April approved a fleet renewal strategy that will extend the life of a station by replacing components when they reach the end of their lives, as long as it is economical to
carry out the replacement. The utility will begin carrying out 18-month-long pre-fea-sibility studies to assess renewal options for four of its oldest power stations: Koma-ti, Camden, Hendrina, and Arnot.
Marubeni Signs Deals to Boost Power Capacity in Southeast Asia. Marubeni Corp. on May 16 agreed with South Ko-rean firms Korea Midland Power Co. and Samtan Co., and Indonesian coal miner PT Indika Energi Internasional to joint-ly develop the 1-GW ultrasupercritical Cirebon 3 coal plant adjacent to the 660-MW Cirebon Steam Power Plant, which began operations in 2012, and the 1-GW Cirebon 2 plant, which is under construc-tion in the district of Cirebon, West Java province, Indonesia. Indonesia’s govern-ment wants to boost its power capacity 35 GW by 2019 to meet increasing de-mand, which has prompted a flurry of bids from foreign independent power pro-ducers. Marubeni on May 24 also signed a memorandum of understanding with Italy’s Enel to cooperate in evaluating power generation project opportunities in Southeast Asia, especially in Indone-sia, Philippines, Thailand, Myanmar, Viet-nam, and Malaysia. ■
—Sonal Patel, associate editor
CIRCLE 8 ON READER SERVICE CARD

www.powermag.com POWER | July 201616
Boiler Tube Failure Thermohydraulic Analysis
Eskom operates 23 power stations in South Africa with a total capacity of more than 42 GW. It supplies about 95% of all the electricity used in the country. One of its coal-fired power stations was experiencing frequent boiler tube fatigue failures in the hopper section—the bottom part of the boiler—of all six units.
The boilers were designed with a com-plex support beam structure that cradles and surrounds the boiler. Pivoting attach-ment mechanisms exist between the sup-port beam structure, or buckstays, and the tube wall to allow for thermal expansion while still providing adequate support on all four sides.
The boiler can expand up to a meter downwards during a startup sequence. Buckstays join at corner junction locations of the hopper where the slope walls and front/rear walls join. They are connected to each other using hinged members re-ferred to as buckstay connection links.
These junctions necessitate the rerout-ing of the surrounding front/rear wall tubes, leading to discontinuities in tube layout. High tube failure rates were iden-tified at these tube manipulations and the areas were considered to be possible high-stress locations.
Modeling Boiler StressA suspected cause of the repeated tube failures (Figure 1) was that cyclic op-eration of the plant to accommodate increased intermittent renewable en-ergy resources and reduced electric-ity demand during off-peak hours was
causing cyclic fatigue in the tube mate-rial. Because the plant was designed for consistent operation at full load, the cyclic fatigue was leading to compo-nent damage and reliability problems. The failures resulted in unscheduled shutdowns, emergency repairs, and un-expected costs.
It was also believed that the delayed effect of cooling water being supplied between two adjacent boiler tubes of different tube banks could be a con-tributing factor to thermal fatigue fail-ure. The argument presumed that a column of water from the economizer outlet would reach the closest tube bank first, the second bank next, and so forth. It was alleged that this would cause a significant fluid temperature differential between the first bank’s outermost tube and the adjacent tube of the second bank.
To test the hypotheses, a unique one-way fluid structure interaction (FSI) methodology was developed to model and predict the induced fatigue loading during a boiler startup cycle. Fluid flow and heat transfer was transiently mod-eled using a 1-D pipe flow modeling tool supplied by Flownex Simulation Environ-
ment and validated against experimental data. The 1-D flow solver was a thermo-fluid simulations software package used to predict, design, and optimize flow rates, temperatures, and heat transfer in fluid systems. The one-way FSI model-ing approach allowed a transient ther-mal load, or any user-selected transient step, to be coupled with a 3-D finite element analysis (FEA) software sup-plied by ANSYS to evaluate the thermal-induced stress.
Validation Offers AssuranceHalf of the four boiler hopper walls were modeled to obtain a representative sam-ple of the complete hopper section. In-strumentation, including thermocouples and strain gauges, was also installed in the modeled area of the hopper section to obtain measured plant data. The Flownex model consisted of 1,219 tubes and 1,858 vertices/nodes.
Flownex’s capability to fundamen-tally calculate flow and heat transfer behavior of both fluid and tube wall material during steady state and dy-namic conditions was considered an ideal fit for the testing. Using the same economizer outlet temperature profile
1. Fatigue failure. This image shows a
typical boiler tube failure location at the Es-
kom-owned plant. Courtesy: Flownex SE
300
250
200
150
100
50
0
Tem
pe
ratu
re (
C)
Time (hr)0 2 4 6 8 10 12 14
■ Tc13 ■ Tc14 ■ Tc15 ■ Tc16 ■ FNX Tc13 ■ FNX Tc14 ■ FNX Tc15 ■ FNX Tc16
2. Flownex model validation. The 1-D solver results (denoted as FNX Tc13 through
FNX Tc16) correlated very closely with the data from installed thermocouples (denoted as Tc13
through Tc16). Courtesy: Flownex SE

July 2016 | POWER www.powermag.com 17
as obtained during the plant measure-ment sequence, together with adjusted gas-side heat transfer properties, a dynamic startup scenario was modeled to validate the results from the mod-el against that of the measured plant data. A number of other scenarios were also successfully modeled.
The results obtained from the model corresponded very well with the mea-sured plant data (Figure 2). The strong correlation enabled the model to be used for various postulated plant conditions and operating sequences. The tempera-ture distribution results from Flownex were then imported into ANSYS, where the structural stress analysis was per-formed (Figure 3).
The methodology allowed the exami-nation of various scenarios to evaluate
causes of failures without affecting plant operations. It also facilitated the model-ing of the massive boiler structure, which could not have been done economically using 3-D computational fluid dynamics simulations.
Simulation Leads to Answers
The results from the developed model indicated that the delay in water supply between the first tube bank’s outermost tube and the adjacent tube of the second bank did not induce perturbing stresses as postulated. The maximum temperature differential was calculated to be only 2.2C. This proved to be due to the con-duction and thermal inertia of the tube walls and webbing, which resulted in a smooth transition in adjacent tube wall temperatures.
Having ruled extreme temperature differentials out, the effects of struc-tural support members in the form of welded support plates at the buckstay junction locations were evaluated. The developed methodology facilitated comparisons between two cases consid-ered: first, where the buckstay sliding joint plates were present, and second, a case where these plates were removed (Figure 4). In evaluating these sce-narios, the model clearly showed that stress worsened in the presence of the plates.
With this new knowledge, Eskom was able to make modifications to the boil-er structure to reduce induced stress. Plates were removed, which greatly re-duced tube wall stress without compro-mising the integrity of the surrounding structure.
Initial data taken following the modi-fication indicated that strain at the lo-cations previously susceptible to damage had been reduced. Strain data collected over a two-year period prior to solution implementation was compared to data collected after the changes. From the time-averaged data, it was shown that average strain and subsequent stress-induced fatigue loads have been reduced by approximately 50%.
A Valuable Tool
The ability to eliminate, through simula-tion, non-contributors to failure and iden-tify potential new failure mechanisms has proven to be a powerful engineering tool. The developed one-way FSI methodology has been demonstrated to be effective in solving problems of thermal-induced stress fatigue loading as a result of fluid-coupled thermal flow. Obtaining a thermal field from 3-D computational fluid dynam-ics, as used for structural FEA boundary conditions, is not practical due to the size of the problems considered. 1-D to 3-D one-way FSI coupling is not only a fea-sible alternative, but it also is an effective and efficient solution.
Similar problems have been reported at various other Eskom power stations. Identifying the main contributing fac-tor to these stresses may lead to the mitigation of numerous outages due to tube failure repairs, which in turn will result in a significant financial benefit to Eskom and improved reliability for customers. ■
—Marius Botha and Michael P. Hindley were members of Eskom’s Research Test-
ing and Development team tasked with solving the plant’s tube failure problem.
3. Mapping procedure. A 1-D line geometry created in a computer-aided drafting pack-
age was imported into Flownex simulation software to obtain thermal results, which were
exported to ANSYS software for stress analysis. Courtesy: Flownex SE
4. Stressed out. Contour plots colored by maximum principal stress at the buckstay junc-
tion location are shown here for both cases where the sliding joint plate is present (left) and
removed (right). Courtesy: Flownex SE
Plant drawings Digitize to computer-aided
drafting format
Finite element analysis computer-aided
drafting geometry pre-processor
Finite element analysis simulation
*.pcf file export
Temperature field
1D transient pipe
solver

www.powermag.com POWER | July 201618
Glenn S. Benson Walker Stanovsky
Securing Pipeline Infrastructure for Gas-Fired Generation in New England
Increased reliance on natural gas as a fuel for electric genera-tion has prompted regulatory reforms by the Federal Energy Regulatory Commission (FERC) to improve coordination be-
tween the two industries. Many in the power industry believe critical constraints in gas pipeline infrastructure serving New England pose a significant threat to electric reliability and prices during periods of peak load in this area. To address this perceived threat, electric distribution companies (EDCs) in the region have teamed up with Algonquin Gas Transmission on its Access North-east pipeline project, which would carry up to 1 billion cubic feet (Bcf) per day of Marcellus gas to the Northeast. The project depends on an innovative but highly controversial effort to se-cure regulatory approvals and financing by relying on the EDCs’ balance sheets and subsidization by electric ratepayers.
Approximately 16,000 MW of gas-fired generation are currently connected to the New England market. Yet few generators have entered into long-term firm pipeline transportation contracts to ensure reliable supplies of gas. This means many of them may be unable to obtain needed gas supplies on peak days or may have to pay an exorbitant premium to get it, threatening electric reliability in the region and stable prices for ratepayers due to limited electric transmission import capability.
Regional grid operator ISO New England has sought to ensure the reliability of its electric capacity resources on peak days by adopting strict capacity performance requirements and penalties for non-performance. This has spurred increased dual-fuel capa-bility by new generators but not long-term firm pipeline trans-portation agreements. Without such contracts, pipeline projects cannot be financed and built.
Stepping Up to the PlateInto this void have stepped Algonquin and EDCs owned by Na-tional Grid and Eversource Energy. Despite being pure electric distribution companies, these EDCs have taken the novel step of signing long-term pipeline precedent agreements for capacity on Access Northeast and requesting that their state regulators ap-prove those contracts as benefitting the EDCs’ ratepayers. Algon-quin, in turn, has petitioned FERC to allow EDCs who subscribe for pipeline capacity on its system to resell that capacity, on a preferential basis, to electric generators through state-regulated electric reliability programs—assuming states ultimately adopt these programs. Any contract costs not recovered through such resales would be passed through to the EDC’s electric ratepayers.
Not surprisingly, these regulatory efforts face broad opposition on a variety of grounds at both FERC and the state level. The Electric Power Supply Association, New England Power Generators Association, Natural Gas Supply Association, the Massachusetts Attorney General, and a number of large electric utilities, gen-erators, gas marketers, and gas producers oppose the proposed
measures, arguing, among other things, that:
■ Preferential releases would be unduly discriminatory and would harm competitive markets
■ Access Northeast would get built regardless■ New England generators do not want special treatment and can
secure reliable fuel supplies without it■ The EDC contracts are legally infirm under state law■ There is more than adequate gas delivery infrastructure in the
region ■ There is a conflict of interest because Eversource and National
Grid propose to own 60% of Access Northeast■ The FERC petition is premature because the states have not yet
acted
Assuming the EDC contracts and electric reliability programs are approved by at least some of the New England states, the Algonquin petition would appear to present FERC with a choice between two of its highest priorities: ensuring electric reliabil-ity and adequate pipeline infrastructure on the one hand, and safeguarding competitive markets, policing undue discrimina-tion, and promoting transparency on the other. Faced with this conundrum, FERC will likely chart a middle course.
Splitting the Difference?One such path forward would be to grant Algonquin’s petition subject to conditions. FERC might require that Algonquin revise its proposal, narrowly tailoring it to do no more than necessary to promote electric reliability and ensuring that all of the terms un-der which preferential releases to generators would be conducted are fully fleshed out in the pipeline’s tariff. FERC also might re-quire that before any EDC releases its capacity to a generator for longer than 31 days, the EDC post the capacity on Algonquin’s electronic bulletin board for bidding by other generators.
This would preserve transparency and at least some measure of competition in the capacity release market, while allowing the EDC-supported capacity to be re-sold first to generators, as it is on behalf of them that the EDCs are contracting. While such a result may seem a fair compromise to some, a solution that satis-fies all will almost certainly prove elusive. FERC held a technical conference in early May on Algonquin’s petition and may take its time reaching a decision in light of these issues, the pend-ing state proceedings, and the fact that Algonquin is targeting fourth quarter 2018 for service commencement. ■—Glenn S. Benson ([email protected]) is a partner in Davis
Wright Tremaine LLP’s Energy Practice in the firm’s Washington, D.C. office. Walker Stanovsky ([email protected]) is an associate in the firm’s Energy Practice, working out of the firm’s
Seattle office. ukgogpu0eqo1eqoowpkecvkqpu/hqt/gngevtke/rqygt
Eqpvkpwqwu"qrgtcvkqp"cpf"rtqhkvcdknkv{"iq"jcpf"kp"jcpfkp"vjg"gngevtke"rqygt"kpfwuvt{0"Pq"qpg"mpqyu"vjku"dgvvgtvjcp"Ukgogpu<"yg"qhhgt"vjg"oquv"tgnkcdng"cpf"ghhkekgpvwvknkv{"eqoowpkecvkqpu"uqnwvkqpu"qp"vjg"octmgv0"QwtTWIIGFEQO"rqtvhqnkq"kpenwfgu"rtqfwevu"vjcv"ctg"hwnn{eqornkcpv"ykvj"KGE"83:72/5."KGGG"3835."KGGG"37::"cpfKGE"8465;/5"uvcpfctfu0
TWIIGFEQO"uykvejgu."tqwvgtu"cpf"uqhvyctg"uqnwvkqpu"ygtg"fgukipgf"ykvj"vjg"wvknkv{"gpxktqpogpv"kp"okpf"vq"gpuwtg"tgnkcdng"eqoowpkecvkqpu"wpfgt"cp{"eqpfkvkqpu"vjcv"cp"KGF"ecp"uwtxkxg0Eqorgvgpeg"kp"kpfwuvtkcn"pgvyqtmu0
"""
G42223/H892/R:42/X4/9822

ukgogpu0eqo1eqoowpkecvkqpu/hqt/gngevtke/rqygt
Eqpvkpwqwu"qrgtcvkqp"cpf"rtqhkvcdknkv{"iq"jcpf"kp"jcpfkp"vjg"gngevtke"rqygt"kpfwuvt{0"Pq"qpg"mpqyu"vjku"dgvvgtvjcp"Ukgogpu<"yg"qhhgt"vjg"oquv"tgnkcdng"cpf"ghhkekgpvwvknkv{"eqoowpkecvkqpu"uqnwvkqpu"qp"vjg"octmgv0"QwtTWIIGFEQO"rqtvhqnkq"kpenwfgu"rtqfwevu"vjcv"ctg"hwnn{eqornkcpv"ykvj"KGE"83:72/5."KGGG"3835."KGGG"37::"cpfKGE"8465;/5"uvcpfctfu0
TWIIGFEQO"uykvejgu."tqwvgtu"cpf"uqhvyctg"uqnwvkqpu"ygtg"fgukipgf"ykvj"vjg"wvknkv{"gpxktqpogpv"kp"okpf"vq"gpuwtg"tgnkcdng"eqoowpkecvkqpu"wpfgt"cp{"eqpfkvkqpu"vjcv"cp"KGF"ecp"uwtxkxg0Eqorgvgpeg"kp"kpfwuvtkcn"pgvyqtmu0
"""
Rugged communications for the electric power grid
G42223/H892/R:42/X4/9822
CIRCLE 9 ON READER SERVICE CARD

www.powermag.com POWER | July 201620
ENVIRONMENTAL ISSUES
Generators Grapple with ELG Implementation
For more than three decades, the Envi-
ronmental Protection Agency’s (EPA’s)
Steam Electric Power Generating Efflu-
ent Guidelines (or effluent limitation guide-
lines, ELGs), which govern wastewater dis-
charges from electric power plants, were a
fixed, known quantity. The last update was in
1982. But in the 2000s, the EPA began look-
ing at an update, a process that took more
than 10 years of study and comment. The
final rule, finalized in September 2015, is
long and complex, setting the stage for a lot
of confusion and uncertainty. (For more on
the specifics of ELG compliance, see “Take
These Five Steps Now to Ensure ELG Com-
pliance at Your Power Plant” in the Decem-
ber 2015 issue.)
What does this mean for generators?
The answer will no doubt evolve over time,
but the new rule has a lot of people con-
cerned. In February 2016, a group of power
sector environmental experts representing
both generators and consulting firms con-
vened at the Energy, Utility, and Environ-
ment Conference in San Diego to offer
their early thoughts on compliance with the
updated rule.
Where to Start?Not surprisingly, most generators have al-
ready begun compliance efforts, work that
began even before the rule was final. Fur-
ther, it’s well understood that ELG compli-
ance will be intimately related to compliance
with the new Coal Combustion Residuals
(CCR) rule (see “Coal Combustion Residu-
als Rule Compliance Strategies” in the June
2016 issue or at powermag.com. Bill Ska-
litzky, manager of generation compliance
for Alliant Energy, noted that his company
has already gone ahead and dredged out an
ash pond at a plant that had been converted
to natural gas. “So we already have one of
our ponds secured and closed. We’re look-
Plant wastewater treatment is not what it once was, and changes in the Environ-mental Protection Agency’s effluent limitations guidelines (ELG) have added a host of new wrinkles. A panel of power plant experts discussed what plant managers are planning and doing to keep things running smoothly within the new rules.
Thomas W. Overton
Courtesy: RoyalBroil/Wikipedia/Creative Commons 4.0
1. A time for change. Westar Energy is
transitioning its coal fleet, including the 2,155-
MW Jeffery Energy Center in St. Marys, Kan.
(which was POWER’s 2014 Water Award win-
ner) toward compliance with new rules for
disposal of wastewater and coal combustion
residuals. Courtesy: Westar Energy

ENVIRONMENTAL ISSUES
July 2016 | POWER www.powermag.com 21
ing at a lot of different methods,” ranging
from excavating to enclosure; “we’ve been
planning for a few years now.”
Jared Morrison, manager, water & waste-
water programs for Westar Energy, also
said, “We’ve been planning for that for quite
some time.” But he noted that first steps
varied across different plants (Figure 1). “I
think the first activity was trying to under-
stand how we can close surface impound-
ments and how we can clean them. That
was the biggest issue at those sites. At other
sites, the first activity was understanding the
water balances.”
Compliance with the ELGs will require
some substantial lead times for both equip-
ment and the time needed to install it, the
speakers noted—in the range of 12 to 18
months.
“There are some risks associated with
that,” Morrison said, “and we are seeing
those lead times get longer and longer.”
Though there is a natural impulse to
want to delay capital expenditures, doing
so is risky. Where it is necessary, Block
Andrews, director of strategic environ-
mental solutions for Burns & McDonnell,
recommended working closely with regu-
lators, “so they understand your side of
the story.”
Groundwater Monitoring The groundwater monitoring required by the
CCR rule can help with ELG compliance,
several noted. Skalitzky said Alliant is in-
stalling monitoring equipment at several of
its sites in Wisconsin. “We already have some
groundwater monitoring data for constituents
of concern.”
Morrison said Westar has been aggres-
sive in assessing its surface impoundments
and installing monitoring equipment.
“Those areas where we felt we were at a
pretty high risk of having some sort of hit
that would trigger closure, we went ahead
and closed those prior to the deadline.”
Only the impoundments that were viewed
as low risk remained open. “We felt that if
they did have an issue, we could respond
quickly to cease using those within six
months.” Those impoundments, he said,
were mainly bottom ash.
With respect to groundwater monitor-
ing, Morrison said they have a lot of par-
tial historical data that may or may not
be current because of past monitoring for
various reasons. “We’re installing wells
today so that we can start our background
samples” this year, he said.
Equipment ChallengesBoth rules provide pressure to move to bot-
tom ash handling systems that are either
completely dry or that use mechanical de-
watering. But there is concern about the in-
dustry’s ability to produce and deploy such
systems in time.
“Honestly, this is a concern,” Andrews said.
“I don’t know how many utilities are going to
be approaching these projects, but there is a
limited capacity to address them, maybe 10 or
15 spots in a year, maybe 20, but the suppliers
will need to ramp up to do that. We’ll see them
step up to the plate, but I would certainly state
that we will see some delays.”
Andrews noted a trend toward zero-liquid
discharge (ZLD, Figure 2) was on the way,
but not many people have gone that direc-
tion yet.
“That would probably not be something
you would be looking at if you’ve got a pretty
large body of water to deal with. It’s going to
be the people on the smaller side.”
Skalitsky noted that maintenance of
submerged drag chain systems was a ma-
jor challenge. “We’re definitely looking
toward a dry system,” he said, mentioning
FGD purge from
hydroclones
AlkaliOrgano-
sulfideFerric
chloridePolymer
Hydrochloric
acid
Equalization
Filtrate
sump
Treated
wastewater
Gravity
filtration
RX1 RX2
Clarification
Filtrate
Recycle sludge
Sludge
Sludge tank Cake
Backwash reject
Dewatering
(to discharge and
also used for
backwash)
2. A big zero. The zero-liquid-discharge system supplied by Aquatech for Southern Co.’s
Kemper County Integrated Gasification Combined Cycle Plant in Mississippi uses a combina-
tion of ultrafiltration, reverse osmosis, conventional demineralization, and thermal evaporation.
Courtesy: Aquatech
3. Just the beginning. Though typical flue gas desulfurization (FGD) wastewater treat-
ment systems produce a certain amount of effluent, as shown here, changes in the Effluent
Limitations Guidelines are creating pressure on generators to move to full zero-liquid-discharge
systems. Source: Siemens

ENVIRONMENTAL ISSUES
www.powermag.com POWER | July 201622
wear and tear on the drag chains and the
availability of replacement parts. “We’ve
looked at a number of things, and in most
cases we’re going to try to move toward a
totally dry system.”
Morrison agreed. “The ash transport systems
require a lot of maintenance. It’s not something
you enjoy dealing with,” he said. “We will eval-
uate the dry system, and if it’s feasible economi-
cally, we will move forward on it.”
Labor and Outage ImpactsAnother concern was the added training that
will be necessary for operators of new ash-
handling and biological treatment systems.
The limited number of existing systems
means a limited talent pool to draw on, and
biological treatment requires a skill set not all
plant operators will possess.
“There are just not a lot of biological
treatment systems out there,” Morrison said.
“Keeping the bugs happy, it is going to take
someone with some knowledge of chemis-
try. It works, but you have to have someone
who is well trained and really watching the
systems to make sure it’s operating. It’s just
additional operators with experience on those
systems.”
Skalitzky noted that conversion need not
require a lot of outage time where it’s possi-
ble to prefabricate many of the components.
On one unit, Edgewater Generating Station
(shown in the header photo), he said, “We
anticipate it’s going to take about three days
of changing out some pumps to convert to a
dry system.”
Different planning is needed to get various
wastewater streams (for example, from the
flue gas desulfurizer, FGD, Figure 3) segre-
gated so they can be managed under both sets
of rules.
“We’re looking at putting in some kind
of tank system where we can collect all this
water from the FGDs and utilizing that wa-
ter back into the scrubber,” Skalitsky said.
“We’re trying to get down, as best we can, to
a zero-liquid discharge, especially on some
of the plants where we have restrictive water
quality systems.”
Morrison noted that managing and moni-
toring these systems requires a lot more at-
tention to minutiae like water flow rates in
the ash-handling system. “That’s not histori-
cally something that was built in as a concern
at our facilities.”
Operational ImpactsAdapting to new methods of handling waste-
water takes time and effort, and getting to
smooth operations is a lengthy, ongoing pro-
cess, Morrison said. “It takes time to train
people, it takes time to get them up to speed.
All of these are significant issues.”
Skalitsky said most of Alliant’s plants
have wastewater operators in place, but ad-
ditional hiring is likely to be necessary. Be-
cause Wisconsin requires these staff to be
certified for managing wastewater, that cre-
ates an additional step for new staff that may
be needed for the new systems. “We’re going
to have to have those operators certified for
those type of operations.”
Morrison said Westar has had to reach
out beyond its existing staff to manage these
new challenges. While they have chemists
on staff, they did not have the specific ex-
pertise necessary to manage wastewater
chemistry and had to bring in an outside
expert. “We were missing that knowledge
in the company, so we had to go and find
that expertise. That has been a challenge. It
is hard to rely on an external company to do
that for you. We need the same consistent
presence on a day-to-day basis. It’s not re-
ally the best situation.” ■
—Thomas W. Overton, JD is a POWER
associate editor.
Need a global inventory of electric power generating
units? Platts World Electric Power Plants Database
contains design speci┃cations for more than 200,000 plants of all sizes, technologies, fuels and operating status owned and/or operated by
regulated utilities, private power companies, and industrial autoproducers.
Visit www.udidata.com for more information.
Platts World
Electric Power
Plants Database
• How to Build Success into EPC Contracting
• Fuel Switching from Bituminous to Sub-Bituminous Coal
• Technical Development & Application of Coal Ash Recycling Resources
• Comprehensive Approach to Reduce Emissions and Increase Capacity and Effi ciency
• And More!
• Connect with 150+ plant managers, plant supervisors, maintenance teams, engineers and more during networking sessions, receptions and conference sessions
• Opportunity for one-on-one conversations with industry suppliers that have the solutions your plant needs
• Hear from peers and gain insight and solutions that have been applied and received positive results at their plants

28225
OCTOBER 4–6KUALA LUMPUR, MALAYSIA
SHANGRI-LA HOTEL
Gain Education & Insight from Leading Power Generators:• How to Build Success into EPC Contracting
• Fuel Switching from Bituminous to Sub-Bituminous Coal
• Technical Development & Application of Coal Ash Recycling Resources
• Comprehensive Approach to Reduce Emissions and Increase Capacity and Effi ciency
• And More!
Networking & Solutions• Connect with 150+ plant managers, plant supervisors, maintenance teams, engineers
and more during networking sessions, receptions and conference sessions
• Opportunity for one-on-one conversations with industry suppliers that have the solutions your plant needs
• Hear from peers and gain insight and solutions that have been applied and received positive results at their plants
Register with code PWRJULY by July 29th to
save $200 off the full conference rate!
EARLY BIRD RATE ENDS JULY 29!Content | Networking | Solutions
www.coalpowerasia.com

www.powermag.com POWER | July 201624
ENVIRONMENTAL ISSUES
Evaluating the Use of CEMS for Accurate Heat Rate Monitoring and Reporting
Continuous emissions monitoring sys-
tems (CEMS) are used to monitor
power plant flue gas emissions as a
means to comply with federal and state air
emission standards. Through various meth-
ods, they determine the concentration and
amount of key emissions, including nitrogen
oxides, sulfur dioxide, carbon monoxide, car-
bon dioxide (CO2), hydrogen chloride, par-
ticulate matter, mercury, and volatile organic
compounds (Figure 1).
CEMS are required in all U.S. fossil-fired
plants greater than 25 MW. They are a mature
technology, and most have been widely used
for more than 20 years.
The CEMS data provides an official record
of the key power plant flue gas emissions.
In the U.S., this data is reported to the En-
vironmental Protection Agency (EPA). Plant
owners/operators are required to maintain the
systems and ensure that results meet the letter
of the law. A portion of that requirement is to
conduct an annual relative accuracy test audit
(RATA) to determine the status and ability of
the CEMS to comply with EPA requirements.
More Than EmissionsIn addition to emissions, CEMS also provide a
value for boiler heat input—and, therefore, very
easily permit the determination of heat rate.
Heat rate is a key measure of power plant
efficiency. It is the ratio of heat input and
power output. The lower the heat rate, the
better the efficiency.
Measurement of heat rate is likely to be-
come a critical issue in the coming years, be-
cause the Clean Power Plan, finalized by the
EPA in 2015, will rely, in part, on coal plant
heat rate improvements to reduce CO2 emis-
sions by reducing the amount of fuel burned.
The EPA is anticipated to use the heat input
values reported by power plants’ CEMS to
determine if the plants have reduced their
heat rates to the required levels.
The ability to accurately measure the two
key parameters to the heat rate equation—
the flue gas CO2 concentration and the stack
volumetric flow rate—will thus be of key
importance.
However, determination of heat input for
solid fuel power plants is difficult to measure
directly with sufficient accuracy because coal
flow is difficult to measure. That coal flow
rate is the key parameter in the determination
of the heat portion of heat rate. Coal constitu-
ents do not remain constant over time, espe-
cially for plants that blend coal from different
sources. Therefore, the real-time measure-
ment of coal heating value becomes another
important parameter with a one-to-one effect
on heat input.
Many plants have instrumentation and
monitoring systems sufficient to determine
boiler heat output (and turbine performance)
on a continuous basis, but very few have the
capability of accurately determining boiler
Power plants are familiar with using continuous emissions monitoring systems (CEMS) to monitor pollutants, but these devices also may be able to measure heat rate—which could be handy for future compliance with the Clean Power Plan.
Sam Korellis and Chuck Dene
Courtesy: Gail Reitenbach

ENVIRONMENTAL ISSUES
July 2016 | POWER www.powermag.com 25
efficiency on a continuous basis, which
would be needed to complete the heat rate
calculation. One method of accurately deter-
mining boiler efficiency, the heat loss meth-
od, requires installation and maintenance of
instrumentation to sample gas concentration
and temperature at the air heater inlet and
outlet. However, adequate sampling grids are
expensive to install and difficult to maintain.
CEMS, which are capable of measuring
the concentration of CO2 in the stack gas
and calculating the flow rate of the exhaust
gas, have the potential to offer an alternative
method for a real-time (continuous) unit heat
rate calculation without additional instru-
ments or labor-intensive processes.
The issue with CEMS, though, is that the
accuracy required for a meaningful heat rate
value is much tighter than current CEMS
practices. With typical uncertainties greater
than 5%, CEMS could not be used to identify
a heat rate change of 2% to 4%, which will
potentially be required by the Clean Power
Plan (assuming it survives the current legal
challenges).
Understanding the Uncertainty of CEMS Heat Rate MeasurementsOver the last several years, researchers at
the Electric Power Research Institute (EPRI)
have conducted several studies to identify the
technology gaps and to propose and evaluate
actions required to use CEMS for heat rate
monitoring. These studies have sought to
better understand the current uncertainty of
CEMS measurements and the drivers of the
differences in uncertainty between CEMS
and a precision boiler efficiency test.
In 2014, EPRI and a member utility con-
ducted a series of precision performance tests
at the member’s 350-MW coal-fired unit to
investigate how accurately the actual boiler
heat input could be determined when quality,
nonbiased CEMS data are available. First, a
series of boiler efficiency test runs were un-
dertaken to calculate boiler efficiency and net
unit heat rate by methods based on ASME’s
Performance Test Codes (PTC) 4 and 46.
Then, the values calculated from the test re-
sults were compared to those obtained from
the CEMS. The tests were conducted at full,
medium, and minimum load—approximately
the same unit load levels utilized for the most
recent RATA testing at this unit.
The results were further refined through
the calculation of uncertainty of the boiler
efficiency and heat rate calculated by each
method. These uncertainty calculations were
performed by methods described in ASME
PTC 19.1, Test Uncertainty.
For the full-load test, gross heat rate cal-
culated by the CEMS method was slightly
higher than with the PTC 46 method. For the
medium-load test, the heat rate was almost
equal for the CEMS and PTC 46 methods.
With the minimum-load test, the heat rate for
the CEMS method was much lower than for
the PTC 46 method. The reasons behind the
non-predictable differences in heat rate were
not identified.
The uncertainty analysis showed that the
uncertainty of the boiler efficiency value
using the CEMS method was greater than
5%, compared to an uncertainty of 0.29%
using the ASME PTC 4 test method. Im-
provements in the accuracy of the CEMS
could greatly reduce the uncertainty, but the
uncertainty of boiler efficiency determined
by this method is dependent on both the ac-
curacy of the CEMS measurements and the
instrumentation used to measure the heat
output of the boiler.
While this plant site operated and main-
tained its CEMS beyond the minimum EPA
requirements, the large differences in results
and the uncertainties of the results strength-
ened the notion that CEMS could not be used
to monitor or report heat rate with confi-
dence. The key contributor to the high mea-
surement uncertainty was the measurement
of stack gas flow rate.
Best Practices GuidelineTo address this issue, in 2015, EPRI devel-
oped a best practices guide to improve the
accuracy of the measurement of stack gas
flow rate.
The project team sought to evaluate avail-
able information on the performance of CO2
CEMS and continuous flow monitors, and
to identify the uncertainty and biases of
measurement system parameters with the
greatest effect on measurement data quality.
Then, using the knowledge gained regard-
ing the uncertainty and biases of the system
parameters, the project aimed to recommend
enhancements to the operation, calibration,
maintenance, and auditing of these systems
that would extend the usefulness of the
CEMS and flow monitors to provide a pri-
mary means of unit heat rate determination.
In support of this effort, EPRI developed
a multi-faceted approach to identify the state
of current industry best practices as well as
a methodology for achieving reduced uncer-
tainty in the measurements. The approach
involved conducting an open literature
search pertaining to CEMS operation; con-
tacting end-users for supplemental informa-
tion regarding CEMS operation, calibration,
tune-ups, and maintenance practices; de-
termining industry best practices related to
pre-RATA flow monitor calibrations, refer-
ence methods used, and pre-RATA adjust-
ments; summarizing the effects of different
reference method practices on measurement
uncertainty; and establishing target uncer-
tainties and identifying whether the instru-
mentation can achieve these.
A model was developed to estimate the
uncertainty contributions for the heat rate
calculation. The model allows estimation
of the uncertainties of the various measure-
ments used to calculate a unit heat rate—as
well as hourly heat input, including flue gas
flow rate, flue gas CO2 concentration, the
carbon-based fuel factor, and the power out-
put (Figure 2). The model then propagated
The key contributor to the high measure-ment uncertainty was the measurement of stack gas flow rate.
1. A continuous emissions moni-toring system. Courtesy: EPRI

ENVIRONMENTAL ISSUES
www.powermag.com POWER | July 201626
these individual measurement uncertainties
to the final heat rate result. The results of the
model were used to focus the best practices
guide on the areas responsible for the largest
contributions to uncertainty.
Project results were reported in a “best
practices” guide for operating, calibrating,
and maintaining a CO2 CEMS and associated
flow monitors to provide the highest degree
of data accuracy practical with currently
available instrumentation and hardware.
Recommendations are included on sampling
systems; analyzers; calibration gases; instru-
ment types, calibration, and placement; stack
diameter determination; and RATA test tech-
niques. (See A Best Practices Guideline for
Understanding and Minimizing Uncertainty
in CO2 and Stack Flow Measurements, EPRI
report no. 3002006147.)
Application of Best PracticesSubsequently, a further study applied the best
practices for CEMs RATA reference methods
to a full-scale CEMS heat rate measurement
on a 670-MW coal-fired utility boiler.
The host site had an optimal CEMS sys-
tem that greatly exceeded EPA requirements.
The CEMS installation location for this site
was also near ideal with respect to flow, and
the CO2 instrumentation was well calibrated.
The guidelines promulgated in the EPRI
best practices guide were followed in the
preparations for and the execution of a special
RATA test. The sampling, analytical, quality
assurance, and quality control procedures fol-
lowed during the RATA program were above
and beyond the minimum EPA requirements.
The study findings demonstrated that very
good relative accuracy can be obtained, im-
proving the uncertainty of the CEMS heat
rate values. The additional effort needed to
comply with the best practices was not con-
sidered significant and could be achieved at
most sites.
Continuing this study, researchers con-
ducted an “enhanced” CEMS audit test—
which they nicknamed “super RATA”—to
calculate correction factors to be applied to
the values of the flow and CO2 concentra-
tion reported by the CEMS. This enhanced
RATA measurement was performed using
best practices for minimizing the uncertainty
of CO2 and flow measurements. The preci-
sion heat rate testing was conducted immedi-
ately thereafter, again in full compliance with
ASME PTC 4 and 46.
The uncertainties were calculated for
the boiler efficiency and heat rate val-
ues determined by each method using the
methods described in ASME PTC 19.1,
Test Uncertainty. The gross heat rate value
calculated by the CEMS method, after ap-
plying the correction factors for flow and
CO2 concentration, was compared to that
determined via the precision test (PTC 46)
method for all test runs.
The heat rate indications obtained from
the CEMS and those obtained through pre-
cision testing were comparable. The differ-
ence in those values was smaller than the
uncertainty determined for the measure-
ments conducted by either method. (See
Stack Flow and CO2 Reference Method
Measurements for Continuous Emissions
Monitoring Systems (CEMS) Heat Rate
Determination: Application of Best Prac-
tices, EPRI report no. 3002007186, and
Evaluation of the Application of Continu-
ous Emissions Monitoring Systems for
Boiler and Heat Rate Monitoring, EPRI
report no. 3002007187.)
Ongoing WorkIn 2016, to further optimize the process and
fully understand the best possible uncer-
tainty, an intense lab calibration of the flow
measurement equipment will be done at ven-
dor and National Institute of Standards and
Technology facilities. Those calibrations will
permit EPRI and its members to better under-
stand the costs and time involved to further
reduce the measurement uncertainty asso-
ciated with stack gas flow measurements.
Plans are to use these optimally calibrated
instruments during another “super-RATA” to
quantify any improvements in flow measure-
ment and unit heat input. ■
—Sam Korellis, PE ([email protected]) is a principal project manager of EPRI’s Heat
Rate Improvement program. Chuck Dene
([email protected]) is a principal project manager in EPRI’s Integrated Environmen-
tal Controls Program.
2. Flue gas sample ports and probe. Courtesy: EPRI

July 2016 | POWER www.powermag.com 27
ENVIRONMENTAL ISSUES
Simplify MATS Compliance with Particulate Matter Continuous Emission Monitors
Starting with the Clean Air Act of 1970
and its updates, compliance for util-
ity and industry stationary sources has
only increased in complexity. The Environ-
mental Protection Agency (EPA) has targeted
many industries that emit criteria pollutants
and hazardous air pollutants (HAPs) and has
written regulations to ensure that affected
industries control the release of pollutants
by implementing the most effective control
technologies.
Most recently, the Mercury and Air Toxics
Standards, known as MATS, has been added
to the list of regulations. MATS establishes
emission limits for three HAP categories:
mercury, non-mercury metals, and acid gas-
es. Importantly, particulate matter (PM) is a
surrogate for non-mercury metals.
This article focuses on the EPA’s require-
ment for Maximum Achievable Control
Technology (MACT) as it applies to electric
generating units (EGUs). An EGU must dem-
onstrate compliance with the MATS limits,
and MATS offers options for demonstrating
compliance. An EGU can use continuous
emission monitoring systems (CEMS) or a
combination of CEMS and periodic testing
using conventional reference methods. By
understanding these options, source owners
can implement strategies that allow facilities
to set their source-specific operating limit
closer to their PM compliance limit, which
will help limit the risk of noncompliance.
MATS was promulgated in February 2012
and the industry had three years to demon-
strate compliance (with a possible one-year
extension in some cases). Coal- and oil-
fired source operators had to analyze the
regulations and define a strategy for mercury,
non-mercury HAP metals, and acid gases
compliance, based on the type of existing
equipment they operated and the potential for
add-on abatement equipment.
When considering non-mercury metal
HAPs, the choice of PM as a surrogate sim-
plified the strategy for many sources. Given
that many PM monitor vendors were devel-
oping monitors to comply with this new reg-
ulation and historic data using PM monitors
for compliance demonstration purposes in
the U.S. was limited, many source owners
defaulted to the quarterly PM stack testing
option until PM monitor data, history, and
resources could be researched.
Now, four years into the MATS compliance
era, enough historic data and improved moni-
tors exist to potentially change the PM com-
pliance strategy to one that uses a PM monitor
instead of quarterly PM stack testing.
CEMS vs. CPMSTo comply with the non-mercury HAP met-
als limits, an EGU can conduct quarterly
manual reference method testing for metals
or manual reference method testing for PM,
the surrogate for non-mercury metal HAPs.
Alternately, if the EGU chooses to use PM
as a surrogate, it can install a continuous PM
monitor and operate it as either a CEMS or
a continuous parametric monitoring system
(CPMS).
If the PM monitor is operated as CEMS,
a correlation curve must be generated by
statistically comparing CEMS data to refer-
ence method data as set forth in Performance
Specification 11. If the PM monitor is oper-
ated as a CPMS, reference method PM test-
ing is used to demonstrate compliance with
the MATS PM limits at normal operation.
The response of the PM monitor that cor-
responds to this reference method PM test-
ing is recorded and is considered to be the
source-specific operating limit. As long as
the 30-day rolling average output of the PM
monitor stays below the source-specific oper-
ating limit, the source is considered in com-
pliance with MATS for non-mercury metal
HAPs using PM as a surrogate.
The Changing Role of Pollutant Monitors Pollutant monitors play a critical role in
demonstrating continuous compliance.
Now that power plant operators have some experience under their belts related to Mercury and Air Toxics Standards (MATS) compliance, it’s time to reevaluate the options for demonstrating compliance.
Rick J. Krenzke
Courtesy: Gail Reitenbach

ENVIRONMENTAL ISSUES
www.powermag.com POWER | July 201628
These monitors, based on a range of analyti-
cal detection technologies, can qualify and
quantify target compounds, and when qual-
ity assurance and maintenance procedures
for the systems are defined, they can provide
defensible emissions data.
Gaseous monitors are the most common
CEMS, but recent technological advances
have expanded the availability of PM moni-
tors beyond those used to measure opacity.
Importantly, modern PM monitors can ex-
press PM emissions as a concentration, thus
allowing comparison to a PM emissions
limit.
Here’s a condensed timeline of PM moni-
toring development:
■ 1950s and 1960s: The Germans pio-
neered and began studying PM detection
technologies.
■ 1970s: PM technologies came to the U.S.
in the form of opacity monitors. Opacity
was considered a surrogate for PM and
Performance Specification 1 (also known
as PS1) was promulgated in 1975.
■ 1996: The Hazardous Waste Combustion
MACT rule was the first to require the use
of PM monitors. The need for a perfor-
mance specification to validate PM moni-
tor data was proposed (PS-11).
■ 1999: The Portland Cement MACT stan-
dard mandated PM monitors, but not until
PS-11 was promulgated (2004).
■ 2012: MATS was promulgated, allow-
ing certain PM CEMS detection tech-
nologies for filterable particulate matter
(FPM) compliance demonstrations. The
PM monitors could be used as a true PM
CEMS or PM CPMS.
PM monitoring technologies include: light
scattering, beta attenuation (the two most
commonly deployed technologies), probe
electrification, optical scintillation, and light
extinction. From these measurement tech-
nologies and the diligent work of instrument
vendors, today PM monitors can detect and
indicate changes in the amount of FPM in
exhaust gases and are accurate and durable
enough to be utilized as CEMS.
Unlike traditional gaseous monitors, PM
monitors cannot be calibrated like a CEMS
that measures gaseous pollutants. Instead of
using calibration gases, the monitor output
signal must be correlated to a physical PM
measurement that is obtained using an EPA
reference method stack test for PM.
In general, the PM detection principle is a
function of the size, shape, color, concentra-
tion, and material of the PM and is therefore
source specific. Accordingly, PM monitors
must be evaluated for each source over a
range of operating conditions. Furthermore,
PM monitors are different from traditional
gaseous monitors.
It’s important to note that MATS allows
choices in how the PM monitor can be used.
When the regulation was first enacted, power
companies had to quickly choose a com-
pliance strategy. Among the choices were
the use of a PM monitor as a full CEMS or
the use of a PM monitor as a CPMS. Now,
with the experience gained through various
approaches, the time is right to revisit com-
pliance demonstration strategies using con-
tinuous PM monitors as CEMS or CPMS.
Three Options Table 1 details the three options for power
Options Pros Cons
Quarterly stack monitoring No initial capital expense for
PM monitor and installation. No
maintenance costs.
Can only see a snapshot of emis-
sions once per quarter. It can be
challenging to schedule emission
testing firm during busy seasons.
Do not know results until a week
after the testing is complete.
PM CEMS: full continuous
emissions monitoring system
calibrated by a correlation
curve (PS-11)
Continuous data and can be used
over full calibration range, so
operating limit is the MATS PM
allowable.
Correlation testing (calibrating
monitor) can be difficult on highly
controlled sources. Have to conduct
tests over three distinct emission
levels. Correlation testing can be
expensive, especially if PM spiking
is necessary.
PM CPMS: continuous param-
eter monitoring system
Continuous data and the correlation
testing (setting the source-specific
operating limit) is comparatively
easy.
The source-specific operation limit
will always be set below the MATS
PM limit, so the source will not
have as much flexibility in emission
variation before corrective actions
must be taken.
Table 1. Summary of PM measurement options. Source: TRC Companies Inc.
CIRCLE 10 ON READER SERVICE CARD

ENVIRONMENTAL ISSUES
July 2016 | POWER www.powermag.com 29
plant operators to consider with respect to
demonstrating compliance with the non-
mercury metal HAP limit using PM as a
surrogate.
Most have followed periodic manual test-
ing or the use of a PM continuous monitor
as a PM CEMS. But the time has come to
take another look at the overlooked option of
using a PM continuous monitor in a CPMS
mode.
What’s needed to get started?
To begin, the facility must determine
the PM limit from MATS. PM limits vary
based on fuel type and whether the source
is new or existing. MATS allows PM to be
measured and reported in lb/MMBtu or
lb/MWh, and the EGU should select the
most favorable reporting option. The facil-
ity will then need to conduct performance
testing using EPA Reference Methods to
demonstrate compliance with the MATS
PM emission limit.
The next step is to establish a source-spe-
cific operating limit. To do this, the facility
will need to perform the following tasks:
■ Conduct a performance test.
■ Record all CPMS output values (milli-
amps or other signal).
■ Determine 1-hour average CPMS output
readings (milliamps) during the perfor-
mance test. (Note: If you perform three
3-hour test runs, you generate nine 1-hour
CPMS averages.)
■ Set a source-specific operating limit based
on these results.
■ Operate and maintain equipment to
achieve a 30-day PM CPMS average that
does not exceed the established operating
limit. (MATS allows the monitor output
signal that correlates to the highest 1-hour
CPMS output for existing units only; for
new EGUs it is the average output.)
■ Reset the source-specific operating limit
annually.
The mechanism selected for determining
the source-specific operating limit will de-
pend on the results of the performance tests.
Once again, the source has choices. Under
MATS, if a PM monitor is being used as a
CPMS, setting the source-specific operating
limit is different for a new source than it is for
an existing source. For a new source, if the
performance tests indicate PM emissions are
less than 75% of the MATS limit, the source-
specific operating limit can be extrapolated
to equal 75% of the MATS limit. Only new
sources are eligible for this extrapolation.
If the performance test results are greater
than or equal to 75% of the MACT limit, the
average PM CPMS output value (milliamps)
will be the source-specific operating limit.
If the 30-day rolling average output of the
PM CPMS exceeds the source-specific oper-
ating limit, the source must take corrective
actions as follows:
■ Within 48 hours of an exceedance, a vi-
sual inspection of the air pollution control
device (APCD) must be performed. If the
inspection identifies the cause, corrective
action must be taken and the PM CPMS
must be returned to operation.
■ Within 30 days of the exceedance, or at
the time of the annual performance (com-
pliance) tests, whichever comes first, a
PM performance test must be conducted
to demonstrate compliance with the PM
MACT limit and to reestablish the source-
specific operating limit.
■ The compliance demonstration and reset
of the operating limit must be implement-
ed within 45 days of the exceedance.
■ Additional testing is not required for any
exceedance that occurs between the initial
exceedance and the performance test trig-
gered by that exceedance.
Before devising a strategy for setting
source-specific operating limits make sure
you:
■ Apply the proper PM MACT limit based
on the source type.
■ Have an instrument that indicates the pres-
ence of and changes in PM in the exhaust.
Option Task Cost
Quarterly stack monitoring Using PM as a surrogate for non-Hg
metals HAPs
$7K–$10K per quarter
Testing for total non-Hg metals
HAPS or individual non-Hg metals
HAPs
$15K–$18K per quarter
Using PM as a surrogate for
non-mercury (Hg) metals haz-
ardous air pollutants (HAPS),
installing a PM monitor, and
using it as a continuous emis-
sion monitor (CEMS). Use of
monitor as CEMS would require
certification (correlation curve)
by PS-12.
Purchase and install PM monitor Depends on type of monitor and
installation contractor
Annual PM monitor maintenance Depends on type of monitor and
plant maintenance crew
Develop PS-12 correlation curve
(minimum of 15 test runs across
three specific grain loading condi-
tions)
$24K–$30K, assuming the three
specific grain loading conditions
can be easily provided
Fly ash spiking to generate grain
loading conditions needed to build a
correlation curve that meets PS-12
guidelines
$50K–$100K, depending on how
many attempts are made at gen-
erating the required grain loading
condition
Annual Relative Response Audit
(RRA). The RRA is three test runs
to determine compliance with the
MATS limits and determine if the
resulting PM is still predicted accu-
rately by the correlation curve.
$7K–$10K
Using PM as a surrogate for
non-Hg metals HAPS, install-
ing a PM monitor and using
it as a continuous parameter
monitoring system (CPMS).
Use of monitor as CPMS would
require setting a source-spe-
cific operating limit (monitor
output signal) that would not be
exceeded by the 30-day rolling
average output.
Purchase and install PM monitor Depends on type of monitor and in-
stallation contractor
Annual PM monitor maintenance Depends on type of monitor and
plant maintenance crew
Initial testing to determine compli-
ance with MATS and set the source-
specific operating limit
$7K–$10K
Annual testing to determine com-
pliance with MATS and reset the
source-specific operating limit
$7K–$10K
If source exceeds the source-spe-
cific operating limit with the 30-day
rolling monitor output and correc-
tive action is needed, the source
will need to conduct testing to de-
termine compliance with MATS and
reset the source-specific operating
limit
$7K–$10K
Table 2. Range of costs for purchasing and maintaining PM systems. Source: TRC Companies Inc.

ENVIRONMENTAL ISSUES
www.powermag.com POWER | July 201630
■ Understand the ways to establish the PM
CPMS operating limits.
■ Understand what triggers corrective action.
■ Understand how operational variables af-
fect PM emissions (PM CPMS output).
■ Are aware that operating limits are reset
every year or when an exceedance occurs.
Using measurement results and what’s
known about the effects of unit operation on
the CPMS output, source owners can develop
a strategy for setting source-specific operat-
ing limits that provide the facility with the
most flexibility to operate the source.
The strategy selected will depend on how
close emissions are to the PM MATS limit
under normal operations. As an example, the
following scenarios could shape the strat-
egy for setting the source-specific operating
limit:
■ If the PM performance test results are
above or equal to 75% of MACT limit
(new or existing units), this is the operat-
ing limit. It may be useful to adjust operat-
ing parameters to produce PM emissions
closer to the MATS limit.
■ If the PM performance test results are be-
low but close or equal to 75% of MACT
limit (new units only are candidates for
extrapolation), there may be no benefit
to extrapolating to 75%. It may be useful
to adjust operating parameters to produce
PM emissions closer to the MATS limit.
■ If the PM performance test results are well
below the 75% of MACT limit, extrapolate
to 75% (if the unit is a candidate) or adjust
operating parameters to produce PM emis-
sions closer to the MATS limits when set-
ting the source-specific operating limit.
Many source owners set the source-spe-
cific operating limits near the MACT limit
because it provides more room for operation-
al variations, reduces the need for APCD
maintenance, and can avoid costly corrective
action exercises. But this can lead to compli-
cations.
For example, when annual compliance
and operational limit reset time comes
around, this strategy relies on being able
to set the unit near the same emission rate
(same monitor output) for each annual test.
If the PM CPMS calibration (correlation
between the monitor output and the actual
PM emission rate) stays the same, this is
not an issue, but if it changes, there is a
chance that the facility will fail the perfor-
mance test.
This strategy usually requires some in-
house or preliminary PM testing to verify or
confirm that the PM CPMS output as com-
pared to actual PM emission limits is still ac-
curate, especially if the target is a value very
near the MACT limit.
Cost ComparisonIn addition to compliance risk, it’s also im-
portant to understand the costs associated
with each of the three approaches described.
Table 2 provides a comparison of the three
options for demonstrating compliance with
the PM standard.
Each of these approaches has advantages
and disadvantages that must be considered
when determining a MATS compliance
strategy. Working with an expert air pollu-
tion monitoring firm allows fossil fuel–fired
power generators to develop a compliance
strategy based on sound measurement data.
Prudent power generators will capitalize on
the choice that the MATS regulations provide
when determining compliance. The source
can select a surrogate for a class of HAPs
(acid gases and non-Hg HAP metal). The
source can then choose if it wants to comply
by using manual testing methods or a pollut-
ant monitor and, in the case of using PM as
a surrogate for non-Hg metals and using a
PM monitor to demonstrate compliance, the
owner can choose how to use the PM moni-
tor—as a CEMS or a CPMS.
The success of any compliance strategy is
proven over time. As more data are generated
and operators understand how fuel variations
and operating parameter changes affect the
compliance status of a unit, the compliance ap-
proach and strategy for a facility will be refined.
The U.S. industrial and regulatory com-
munities are investing heavily in the goal
of reducing power plant HAP emissions
through MATS. This investment and subse-
quent operating history may be creating the
road map for other countries to accomplish
the same goals. ■
—Rick Krenzke ([email protected]) is a project director in TRC Com-
panies Inc.’s Air Measurement Services Practice in Austin, Texas.
FIRE YOUR WAY TO TOP PERFORMANCE AND EFFICIENCY
A better solution for your surface condenser cleaning
QUICK SHOT® QS-300
The QUICK SHOT® QS-300 offers a power-assisted trigger and ergonomic design that obliterates tube deposits on contact, leaving condenser tubes spotless and immediately increasing heat exchange eficiency and performance.Naturally, it’s from Goodway.
www.goodway.com
CALL 888-364-7745
CIRCLE 11 ON READER SERVICE CARD
PM monitors must be evaluated for each source over a range of operating conditions.

July 2016 | POWER www.powermag.com 31
ENVIRONMENTAL ISSUES
Emissions Catalyst Issues for Fast-Start Combined Cycle Power Plants
Traditionally, many combined cycle gas
turbine (CCGT) power plant units were
designed and permitted for a baseload or
similar operating profile. Startups and shut-
downs were expected but typically were in the
tens per year. These were often an equal com-
bination of cold, warm, and hot starts.
Lower total demand in many markets,
coupled with higher fuel prices, resulted in
many units needing to change to two-shift
cycling service. Plants would shut down for
a few hours overnight and then start to meet
daytime loads. Units with 200 to 250 starts
per year were not uncommon.
Not only did frequent starts stress plant
systems and components with respect to ther-
mal loads, but operational issues such as con-
trol of steam temperatures and water and gas
side chemistry also became more difficult.
Furthermore, regulators began to pay more
attention to higher stack emissions during
frequent startups. More recently, higher use
of renewables such as wind and solar gen-
eration created a demand for fast-responding
backup and reserve capacity.
In response, suppliers began to offer
fast-start CCGT plants to meet this demand
with equipment specifically designed for
fast start and loading. Existing plants began
to implement extended range burners in the
GT systems so that lower unit loads could be
maintained while in emissions compliance.
Some plants could shift from two-shift cy-
cling to a low-load parking condition.
Figure 1 compares the operating profile of
a conventional combined cycle baseload unit
with that of a modern cycling unit.
Figure 2 shows operating data for a large
combined cycle frame turbine unit. Load
swings of 50% in less than 30 minutes are
common several times each day to meet de-
mand requirements. Also common are daily
shutdowns during periods of low demand, of-
ten during daytime hours, when renewable en-
ergy such as solar is available or at night when
combined heat and power demand is reduced.
Key Features of Fast-Start and Extended Range CCGT PlantsFast-start plants rely on rapid start and loading
of the GT to reach full power as well as com-
pliant emissions status for the combustors.
This rapid loading puts large amounts of hot
gas into a relatively hot/warm/cold heat recov-
ery steam generator (HRSG). The HRSG then
begins to increase steam pressure and flow
with heat-up. This flow increase lags the GT
ramps and challenges the limits on pressure
rise in the high-pressure steam system. Both
flow and temperature of the produced steam
are controlled/bypassed to meet the initial
conditions of the steam turbine startup.
The turbine exhaust gas (TEG) condi-
tions from the turbines reflect the lower ef-
ficiency at part loads with higher exhaust
temperatures. These temperatures can make
it difficult to control steam temperatures with
sprays or other attemperation methods such
as steam bypass or dilution air.
For recirculating evaporator plants with
steam drums, pressure ramps are typically
set by the allowed thermal stress imposed on
the steam drum. High-pressure (HP) steam
drums can be from 5 to 7 inches thick, de-
pending on size and maximum design pres-
sures. This thick steel wall can easily have
large thermal stresses as the interior surface
heats up or cools down. Control of pressure
by bypass or other venting is the method of
moderating the thermal stress. Lower pres-
sures produce lower saturation temperatures,
which result in lower TEG temperatures at
the NOx catalysts. This tends to produce a
temperature lag at the catalyst during startup.
For HRSGs with once-through HP steam
generators, feedwater flows once through econo-
mizer, evaporator, and superheater segments of
the same tube flow path. There is less thermal
mass in the HP evaporator segments and no
steam drum. Fast-start plants often use once-
through sections for this reason. For these plants,
temperatures at the NOx catalysts approach tar-
get temperatures faster during startups.
Low-Load Parking PlantsMost CCGT units with new extended range
turbine systems can decrease GT load to
about 40% of full power. TEG temperatures
are often greater at the inlet to the HRSG,
but mass flow is considerably reduced.
Drum pressures are usually regulated at the
floor pressure of the system (typically 1,000
to 1,200 psig). These set a floor for tempera-
tures into the catalysts of 550F to 570F. Op-
eration of emissions controls at lower mass
flows must be carefully controlled to avoid
excessive ammonia slip.
Some GT systems like the Alstom GT24/26
with sequential combustion can go to very
low loads (10% to 20% of full power). This
can produce low TEG temperatures at the HP
evaporator exits. Figures 3 and 4 (see the on-
line version of this article at powermag.com)
show the temperature profile at full load and
at parking load of a GT26. Temperature at low
load is 520F. This plant was in a jurisdiction
not requiring emissions catalyst, but this tem-
When gas-fired plants are required to cycle more than they were designed for, added stress on plant components isn’t the only consequence. You also need to pay closer attention to turbine catalyst systems.
David S. Moelling, PE and Daniel W. OttCourtesy: Gail Reitenbach
Courtesy: Gail Reitenbach

ENVIRONMENTAL ISSUES
www.powermag.com POWER | July 201632
perature and low mass flows could be an issue
for current catalyst designs.
Challenges for Emissions Catalyst OperationCatalyst-based systems for control of CO,
NOx, and volatile organic compounds (VOC)
are strongly affected by the conditions of the
turbine exhaust gas. Oxidation catalysts are
passive catalysts used to oxidize CO and VOC
to CO2. Selective catalytic reduction (SCR)
systems are active catalyst systems that re-
quire injection of a reagent containing ammo-
nia (NH3) to reduce NOx to N2 and H2O.
Prior to 2001, turbine catalyst systems were
designed primarily for steady-state, basel-
oad operation. These systems had generous
startup/shutdown windows, normally of 1 to
3 hours, and typically operated above 80% of
maximum load. Between 2001 and 2005, the
startup/shutdown windows were reduced to
30 to 60 minutes. Today, these systems can be
required to start up or shut down in 10 min-
utes, while at the same time dealing with more
frequent cycling, faster ramp rates, and wider
load swings than ever before.
As a unit cycles, the temperature, flow rate,
and concentration of emissions in the turbine
exhaust entering the SCR/CO catalyst system
vary. Exhaust temperatures will often depend
on the pressure and steam production in the
HP steam system and can vary by +/–100F en-
tering the catalyst system. Also, because the
lower-load operation introduces lower flow
into the same fixed cross-section, the flow dis-
tribution differs from baseload, imparting gas
velocity, ammonia concentration, and temper-
ature variations at the catalyst inlet.
Turbine exhaust NOx and CO also spike
during load changes, which can affect the
stack emissions and require greater emis-
sions reduction to maintain compliance
during short averaging periods. Maintain-
ing peak SCR system performance and low
levels of both stack NOx and ammonia slip
through these cycles requires precise control
of ammonia injection. In some cases this may
require updates to the ammonia flow control
logic or even upgrades to the equipment and
additional monitoring hardware.
An example of SCR operation with turbine
cycling is shown in Figure 5. The variations
from cycling operation are most apparent in the
ammonia slip (the unreacted ammonia), shown
in orange. Variations of 3 to 4 ppm are com-
mon. These variations in ammonia slip are most
often caused by a lag in response time of the
ammonia vaporization and injection system in
reacting to changing ammonia demands. Some
progress is being made to improve response
times, but more improvement is needed.
In the permitting phase for modern cycling
unit sites, permit applications must take into
account these variations, but they currently do
not. Regulations at the state and federal levels
have reduced best available control technology
(BACT) guidelines for turbines to between 2
and 5 ppm NOx and 2 to 5 ppm ammonia slip,
both with averaging times as little as 30 minutes.
In ozone nonattainment areas, air permit limits
of 2 ppm NOx and 2 ppm ammonia slip are nor-
mal. These BACT limits required by regulations
are not practical in cases with cycling operation,
as illustrated in Figure 5.
Fast-start combined cycle systems are ca-
pable of startup in 10 minutes. Conventional
SCR/CO system designs have demonstrated
startup in approximately 30 minutes. Though
the difference of 20 minutes may seem small,
much happens in those 20 minutes, includ-
ing heating of the SCR catalyst and ammo-
nia vaporization system that are required for
optimum performance. Figures 6 and 7 com-
pare a conventional SCR system start (with a
1-hour startup window) to a modern fast-start
system (with a 10-minute start requirement).
Even with a warm start, the fast-start system
struggles to achieve compliance within 15 min-
utes. In many cases, particularly for cold starts,
SCR systems cannot meet, or have difficulty
meeting, the 10-minute startup requirement.
1. Conventional baseload vs. cycling operation. Courtesy: Environex Inc.
80
70
60
50
40
30
20
10
0
Op
era
tin
g h
ou
rs (
%)
Op
era
tin
g h
ou
rs (
%)
80
70
60
50
40
30
20
10
0
Below 60 60 65 70 75 80 85 90 95 100Load (% of baseload)
Below 60 60 65 70 75 80 85 90 95 100Load (% of baseload)
120
100
80
60
40
20
0
Ex
ha
ust
flo
w (
klb
/hr/
10)
Time (days)
60
50
40
30
20
10
0
Loa
d (
MW
/10)
an
d C
T e
xit
NO
x/E
xit
CO
(p
pm
vdc
)
0.0 0.5 1.0 1.5 2.0 2.5 3.0 3.5 4.0 4.5 5.0
■ Exhaust flow (klb/hr/10) ■ Load (MW/10) ■ Turbine exit NOx (ppmvdc) ■ Turbine exit CO (ppmvdc)
Conventional baseload unit
Modern cycling unit
Time (days)
2. Typical cycling operation of a modern frame turbine unit. Courtesy:
Environex Inc.

ENVIRONMENTAL ISSUES
July 2016 | POWER www.powermag.com 33
To bridge this gap between conventional and
fast-start requirements, SCR system designs are
being modified to remove thermal mass, im-
prove response times of the ammonia injection
and continuous emission monitoring systems
(CEMS), and use modified catalyst products/
designs that can reduce start times. Even with
the modifications, 10-minute starts are often not
achieved in practice from the SCR/CO system
perspective, as shown in Figure 7. Some of these
modifications include:
■ Ammonia vaporizers with preheat capability.
■ Smaller ammonia vaporization chambers
without packing and with more heat trans-
fer surface to minimize heating time.
■ Catalyst designs that offer improved for-
mulations with wider operating tempera-
ture windows.
■ Catalyst frame/seal designs that allow for
more rapid temperature ramp rates.
■ CEMS systems and NOx analyzers with
faster response capability, as little as 5 sec-
onds compared to 30 to 120 seconds for
extractive sampling systems.
■ Improved controls systems that are more
capable of analyzing/predicting transients
in catalyst system performance.
■ In some cases, where practical, a return to
anhydrous ammonia systems to eliminate the
need to vaporize the water (up to 80% water
by weight) in aqueous ammonia solutions.
Modern emissions control systems are
required to convert a greater percentage of
emissions in engine exhaust, meet lower
stack emissions limits, and do so over short-
er averaging periods. All of these changes
require greater engineering and higher cost
for both new and retrofit systems. Opera-
tors of modern turbines need to provide ad-
ditional oversight and maintenance of their
emission control systems to ensure they
continuously provide reliable performance.
Integrated Fast-Start Management RequiredHigher ammonia slip and potentially greater
SO2 conversion in cycling and fast-start units
create additional challenges for control of
sulfur-bearing deposits in the colder HRSG
areas. Low-pressure evaporators and econo-
mizers are particularly at risk.
Both current cycling and high-cycling
fast-start units can be at risk. Units in reserve
or standby for rapid start can experience high
corrosion levels in fin tubes (Figure 8), as the
deposited material tends to be hygroscopic
and corrosive in humid environments. More
frequent cleaning of gas-side tube surfaces
may be required to prevent excessive back-
pressure and corrosion on HRSG systems.
Because the response of emissions cata-
lysts to fast startups is a key element in plant
performance and longevity, the HRSG, steam
cycle, and emissions control systems in cy-
cling and fast-start CCGT plants must be
considered as a single system with multiple
operational limits and goals. ■
—David S. Moelling, PE ([email protected]) is chief engineer for Tetra Engineering Group Inc. and Daniel W. Ott
([email protected]) is president of Environex Inc.
70
60
50
40
30
20
10
0
35
30
25
20
15
10
5
00 12 24 36 48 60 72 84 96 108
Time (hours)
Loa
d, a
mm
on
ia f
low
, SC
R t
em
pe
ratu
re
Sta
ck
NO
x, t
urb
ine
ex
it N
Ox a
nd
a
mm
on
ia c
on
ce
ntr
ati
on
■ Load (MW/10) ■ Stack NOx (ppmvdc) ■ Ammonia flow (lb/hr/10) ■ Turbine exit NOx (ppmvdc)
■ SCR temperature (°F/10) ■ Ammonia slip (ppmvdc)
5. SCR operation for a cycling turbine unit. Variations from cycling operation are
most apparent in the ammonia slip (the unreacted ammonia), shown in red. Variations of 3 to 4
ppm are common. Courtesy: Environex Inc.
60
50
40
30
20
10
00 10 20 30 40 50 60 70
■ Stack NOx (ppmvdc) ■ Ammonia slip (ppmvdc) ■ Turbine exit NOx (ppmvdc) ■ SCR temperature (˚F/10)
■ Load (MW/10)
7. Modern fast-start SCR system startup. Courtesy: Environex Inc.
6. Conventional SCR system startup. Courtesy: Environex Inc.
60
50
40
30
20
10
00 10 20 30 40 50 60 70
■ Stack NOx (ppmvdc) ■ Ammonia slip (ppmvdc) ■ Turbine exit NOx (ppmvdc) ■ SCR temperature (˚F/10)
■ Load (MW/10) ■ Stack CO (ppmvdc)
8. Bad environment. Units in reserve
or standby for rapid start can experience high
corrosion levels in fin tubes, as shown here,
because the deposited material tends to be
hygroscopic and corrosive in humid environ-
ments. Courtesy: Tetra Engineering Group Inc.
Time (minutes)
Time (minutes)

www.powermag.com POWER | July 201634
ENVIRONMENTAL ISSUES
Circulating Fluidized Bed Dry Scrubber Effectively Reduces Emissions
Like many coal-fired power plants in
the early 2010s, the Big Stone Plant in
eastern South Dakota was faced with a
question: What should be done at the plant in
order to meet new federal and state emissions
requirements? Its 40-something-year-old de-
sign would need an air quality control system
(AQCS) upgrade if it intended to continue
operating in the future. Choosing what tech-
nology to install was a key decision. In the
end, Big Stone’s decision-makers opted for
circulating dry scrubbing technology rather
than selecting a wet scrubber or more “tradi-
tional” dry scrubber design.
“The comfortable thing to do would
have been to choose the technology that
has been around for decades,” said Kirk
Phinney. “But we did our homework and
concluded that a circulating dry scrubber
would help us well into the future. Today,
we have one of this industry’s top-perform-
ing retrofit units in terms of SO2 reduction.
We know we made the right decision.”
Phinney was the commissioning manager
for the Big Stone AQCS project (Figure 1).
He transferred to Big Stone in the hope of
being part of the undertaking—a nearly $400
million investment—and quickly became
a vital member of Project Manager Mark
Rolfes’ team.
The first step for Rolfes was to obtain
permits and approvals from the three states
that regulate the Big Stone Plant (Minnesota,
North Dakota, and South Dakota). Phinney
set to work during that time helping review
all the specifications and layouts, gathering
operating data, and meeting with technology
suppliers in order to obtain accurate bids for
the project. He later supported the construc-
tion phase and served as commissioning
manager.
“It has been very exciting to be involved
with the project all the way through,” Phin-
ney said.
Phinney’s employer, Otter Tail Power
Co., is the majority (53.9%) owner of Big
Stone, with NorthWestern Energy and Mon-
tana-Dakota Utilities also holding shares.
Otter Tail people staffed the project and op-
erate the 495-MW power plant, which burns
subbituminous coal and has been online
since 1975.
Deciding on the Best Available Retrofit TechnologyThe driving force for the project was the
need for Big Stone to meet upcoming fed-
eral regulations, including new mercury
standards and regional regulations to reduce
haze over Minnesota’s Boundary Waters
Canoe Area, a popular outdoor recreational
area. The existing air pollution control sys-
tem on the boiler was a baghouse—effective
at removing dust and particulates, but not
gaseous emissions or mercury. After doing a
thorough evaluation of the best available ret-
When owners of the Big Stone Plant researched air quality control system technology, they considered all available options and eventually settled on a design that was not in widespread use. Now that the three-year $384 million project is complete, they have no regrets that they chose a circulating fluidized bed dry scrubber.
Robert Puhr
Courtesy: ANDRITZ

ENVIRONMENTAL ISSUES
July 2016 | POWER www.powermag.com 35July 2016 | POWER www.powermag.com 35
rofit technology, Big Stone’s management
decided to pursue a dry scrubber (shown in
the opening photo).
“Flue gas cleaning with a dry scrubber is
today an attractive alternative to wet scrub-
bers, even for large coal-fired boilers,”
said Paul Petty, director of Applications
and Technology for ANDRITZ’s air pol-
lution control business in North America.
“It was impossible to make that statement
when I started in the business. But much
has changed.”
Spray dry absorber (SDA) technology
had been the traditional dry scrubbing solu-
tion for power plants requiring large SO2 re-
moval rates. The downside of SDA systems
is the potential for corrosion due to the cre-
ation of lime slurries and the need to quickly
dry the slurry droplets in the scrubber ves-
sel. Another drawback is that SDA systems
are able to remove only about 85% to 95%
of the SO2.
“Plants today are looking to remove 98%+
which, before the advent of circulating dry
scrubbing technology, was only possible with
much more expensive wet scrubbing technol-
ogy,” Petty said.
“The most important advantage of circu-
lating dry scrubbing is the ability to achieve
this 98%+ reduction of SO2 and other acid
gases,” Petty continued. “Other important
benefits are a lower capital cost, simpler
design, lower water use, no wastewater dis-
charge, and the ability to remove all pollut-
ants, except carbon monoxide and nitrous
oxides, in one step.”
“We went through a very rigorous process
to evaluate the technical offerings,” Phin-
ney said. “Our evaluation concluded that the
circulating dry scrubber had further room to
perform than the SDA and would not put us
at the limits of the technology.”
In evaluating suppliers, it came down to
experience. “ANDRITZ had six installations
at that time—not a huge number, but enough
for us to feel confident,” Phinney said. “The
other supplier had one.”
The Circulating Fluidized Bed ScrubberThe way the system works is by direct-
ing flue gas into the bottom of a circulat-
ing fluidized bed (CFB) vessel, where it is
turned upwards and passes through a grid
of venturis. Hydrated lime and recirculated
byproduct is introduced below the venturis
and gets evenly mixed and dispersed into
the flue gas.
Cooling water spray (which can be waste-
water from boiler blowdown) is added above
the venturi section, independent from the
reagent feed. The byproduct is collected
downstream in a pulse jet fabric filter (Fig-
ure 2) and then metered to recirculate some
back into the scrubber vessel (Figure 3). The
remainder is diverted into the ash-handling
system for disposal.
ANDRITZ’s project scope included sup-
plying the 34-foot-diameter CFB scrubber,
gas humidification system, reagent system,
gas recirculation system, byproduct recircu-
lation/removal system, pulse jet fabric filter
(Figure 4), powder-activated carbon injection
system for enhanced mercury capture, and
waste ash removal and storage system. The
company also supplied ductwork, piping, ac-
cess points, platforms, logic for the distrib-
uted control system, and support steel for the
scrubber and lime silo.
“In simple terms, the contract we had with
Big Stone was for everything above the foun-
dations for the scrubbing and waste ash han-
dling,” said Scot Ojard, project manager for
ANDRITZ.
One twist at Big Stone was that the CFB
scrubber needed to be a dual-train configura-
tion due to its size. The practical limit for a
single train is around 400 MW. This was the
first dual-train installation in North America
for ANDRITZ.
1. Big Stone Plant’s air qual-ity control system. (Left to right) Erik
Fladhammer, project engineer; Kirk Phinney,
commissioning manager; and Scot Ojard,
ANDRITZ project manager, with part of the
circulating dry scrubber and pulse jet fabric
filter in the background. Courtesy: ANDRITZ
2. Removing particulate. Fly ash and byproduct from the circulating fluidized bed
scrubber is collected in the pulse jet fabric filter hoppers, shown here. Courtesy: ANDRITZ

ENVIRONMENTAL ISSUES
www.powermag.com POWER | July 201636
“Supporters of SDA technology told us
that we would have problems with the dual
fluidized beds fighting each other and the
induced draft fans fighting each other and
things would be out of sync,” Phinney re-
called. “I can tell you that has not been the
case.”
A Team Effort“There has never been a worry during this
project,” said Erik Fladhammer, project
engineer for Otter Tail. “It has been a very
good relationship. The discussions have al-
ways been open. Scot and his team came up
through the technical side. Their suggestions
are practical and it is clear that these guys
knew how to build and run scrubbers.”
Construction began in spring 2013. The
plant was taken offline in early 2015 for a
planned outage to do all the tie-ins and ex-
tensive boiler work to increase the surface
area. “When we came back online, we moved
along quite well,” Phinney said.
“During the commissioning process, we
used our newest computational flow dy-
namic model studies to optimize the turn-
ing vanes at the bottom of the scrubber
inlet to improve the dispersement of recir-
culated byproduct materials. This improves
Big Stone’s ability to run efficiently at low
loads,” Ojard said. “Since then, the custom-
er has taken over operations and signed all
acceptance certificates.”
“ANDRITZ gave us excellent perfor-
mance guarantees for SO2 removal, availabil-
ity, and lime consumption,” Phinney said. “If
I had to do it all over again, I would do it the
same way and with the same suppliers. The
people are technically smart, practical, and
no-nonsense. They fit the company personal-
ity at Otter Tail very well, and we did good
work together.”
Although Otter Tail wasn’t willing to re-
lease actual scrubber performance data, the
company did acknowledge that Big Stone’s
uncontrolled monthly average SO2 emission
rate in 2014 was 0.910 lb/MMBtu. It said
the ANDRITZ-supplied equipment has had
no problems meeting the plant’s current per-
mit limit of 0.09 lb/MMBtu. Otter Tail also
reported that the equipment met all perfor-
mance requirements during its recently com-
pleted 120-day guarantee run, and that the
plant has met all NOx and mercury emissions
requirements.
“The original budget was over $400 million
for the project,” said Rolfes. “The upgrade is
now expected to close out 21% below the bud-
get due to our procurements and engineering
work coming in below anticipated cost. Plus,
we have been able to reduce the contingency
reserves. That is good news for our customers,
owners, and shareholders.”
Opting for circulating dry scrubbing
technology turned out to be the right choice
at the right time. With its new AQCS, the
Big Stone power plant has reduced emis-
sions of NOx and SO2 by about 90% and
mercury by about 80%. The project allows
the plant to be a viable power resource well
into the future. ■
— Robert Puhr is principal of Ad Hoc Communications Inc.
4. Puffing bags. The air reservoir and pulse valves for the pulse jet fabric filter bag cleaning
system are shown here. Courtesy: ANDRITZ
3. Scrubbing emissions. This image shows the scrubber vessel’s waste ash pickup
point, including the fluidizing air ring and ash transport lines. Courtesy: ANDRITZ

July 2016 | POWER www.powermag.com 37
ENVIRONMENTAL ISSUES
Real-Time Environmental Data Integration Improves Air Quality Reporting
The electrical power generation sec-
tor is reportedly the largest source of
greenhouse gas emissions in the U.S.
As such, it is the focus of the Environmen-
tal Protection Agency’s (EPA’s) Clean Power
Plan, part of the president’s larger, ambitious
Climate Action Plan to reduce carbon emis-
sions. The two clearly demonstrate a trend of
environmental regulations that place a high
level of importance on the quality of the un-
derlying data, not just on emissions values
that are reported. This means increasingly
stringent reporting requirements and more
data collection.
Increasing Demand for Quality DataThe Acid Rain Program (ARP), established
in the amendments to the Clean Air Act in
1990, created the world’s first large-scale
emissions trading system. Designed to re-
duce sulfur dioxide and nitrogen oxides
(NOx) from electric generating units (EGUs),
this program used a market-based, cap-and-
trade approach for achieving reductions. The
goal of the program was to allow individual
companies to determine the pace of necessary
modifications for compliance that met their
specific business needs. They could either
spend money for emissions control devices
or defer installation and purchase allowances
from companies that had already achieved
reductions through their capital expenditures.
Regulations known as New Source Per-
formance Standards (NSPS), defined under
Title 40 in the Code of Federal Regulations
(CFR) Part 60, previously existed for EGUs.
This part initially governed the quality assur-
ance (QA) checks of instrumentation used to
measure the concentration of pollutants. The
EPA recognized that the transformation of in-
strument data from monitoring into a finan-
cial instrument suitable for allowance trading
required a new level of detailed reporting and
data QA.
For this reason, the EPA created a new
set of regulations for allowance trading
programs that governed the level of QA
checks and the required reporting level for
data streams that were used in the genera-
tion of market-quality data. 40 CFR Part
75 incorporated many facets of Part 60 but
expanded the number of quality checks on
the instruments. It also augmented the focus
of QA checks beyond the emission monitor-
ing instruments to include checks on other
types of instruments such as flow monitors
providing additional data needed for calcu-
lating emissions.
Existing NSPS regulations focused on
reporting periods of noncompliance and the
steps taken to correct the underlying issues.
Part 75 increased the requirements to include
the submission of all data at an hourly fre-
quency, not just noncompliant periods.
NSPS required EGUs to report times
when instrumentation readings could not be
considered statistically accurate. Part 75 re-
quired EGUs to report increasingly higher
emissions based on the length of time it takes
to return their monitoring equipment to prop-
er working order.
Due to the massive amount of data that
must be collected, the EPA has developed an
electronic reporting platform, the Emissions
Collection and Monitoring Plan System, to
collect a comprehensive set of emissions as
well as supplementary information such as
As power plant reporting requirements for emissions regulations increase in number and complexity, yesterday’s data collection and reporting systems can make the job harder than it needs to be.
Philip Black, PE
Courtesy: Wood Group

ENVIRONMENTAL ISSUES
www.powermag.com POWER | July 201638
records of every test (completed and failed)
along with facility-specific monitoring plans.
While at times optional in the past, all utili-
ties are now required to submit their data
electronically, which is available for public
review.
Part 75 has proven to be a successful
model to ensure data quality. Consequently,
additional, non-EPA regional market-based
programs such as the Regional Greenhouse
Gas Initiative, Western Climate Initiative,
and the California Air Resources Board refer
to Part 75 data requirements.
The scope of Part 75 is not static. As the
number and types of parameters to report ex-
pand, the level of QA checks and documenta-
tion expands as well.
Problems Caused by Increased Data CollectionThis trend toward increased reporting pa-
rameters continues to grow, placing an
enormous burden on facility environmental
departments. The volume of data that needs
to be collected, aggregated, and reported to
satisfy requirements is staggering. Even
a small electric power facility (of around
100 MW) requires more than one million
complex calculations daily from its air
emissions monitoring sources within its
property boundaries.
Due to the amount of high-frequency data
that has to be reported, data acquisition and
handling systems (DAHS) were developed
and have been directly connected to environ-
mental analyzers located within the process
control network to provide the capabilities
for generating electronic reports. Due to the
locations of the monitoring systems at the
units throughout the facility, control room
operators are typically responsible for moni-
toring real-time compliance, with environ-
mental staff managing the regular reporting
and providing any necessary updates to man-
agement.
Although large amounts of data are pro-
cessed and stored at each monitoring loca-
tion, integration capabilities are lacking at
many facilities. Commercial DAHS have
existed since the beginning of the ARP and
track compliance to generate necessary fed-
eral reports for the unit where they are de-
ployed. However, due to the varying age of
monitoring equipment and the different man-
ufacturers of systems that can be present in
any given facility, a lack of integration leaves
many environmental departments gathering
data manually into Excel spreadsheets for
any unique corporate or state requirements.
This can often be the protocol at small and
midsize facilities. Complex macros or time-
consuming manipulation can be required to
aggregate the results. After the data collec-
tion and manipulation are completed and
passed to others, the spreadsheets are then
stored on network drives or within email
archives, where they become useless for fur-
ther analysis.
There are limitations to the effectiveness
of these traditional methods. As new regu-
lations are released, it becomes even more
challenging for environmental departments
to keep current in their coordination with
operations. Rather than becoming more ef-
ficient, aggregation of information from
multiple continuous emissions monitoring
systems using different protocols increases
with the growth in specialized emissions
monitoring systems. Due to the larger va-
riety of systems, some facilities even find
it easier to request their own data from the
EPA or third-party sources rather than try-
ing to gather significant amounts of infor-
mation from their multiple facilities. This
limits the flexibility and use of the informa-
tion that is available.
Environmental departments are not the
only groups struggling with the need for bet-
ter transfer of information. Larger market
forces such as deregulation have also led
to the necessity of establishing methods to
share many types of data that formerly never
left internal company networks. To help fa-
cilitate broader-based data sharing, many
large power generation facilities are develop-
ing centralized information storage reposito-
ries. These systems are designed to interface
with multiple data sources, consolidate the
information, store it efficiently, and then dis-
seminate it as needed in a format suited for
specific audiences.
Unfortunately, the creation of interfaces
of environmental data to these systems has
been slow, and the information remains in
silos, only to be retrieved for compliance
monitoring. The stumbling block has been
a lack of real-time connectivity between
multiple systems storing environmental
data and the environmental departments and
management.
Integration AdvantagesThe growing awareness of the value of Part
75–related environmental data, combined
with the lack of connectivity between sys-
tems isolated on the process control net-
work, has led to the increased adoption of
middleware solutions. Some DAHS vendors
are creating cloud-based portals that receive
the information from multiple instances of
their monitoring tools in order to provide a
combined view of compliance. Larger utili-
ties have leveraged their existing informa-
tion systems to provide wider access. These
custom solutions are typically based on con-
necting data historians (such as OSISoft PI)
to the Enterprise Reporting Planning solution
using commercial middleware packages such
as Microsoft’s BizTalk.
In other cases, facilities with strict data se-
curity requirements or those facing resource
constraints are considering a third option.
These solutions, currently being used in the
refining and petrochemical industry, are opti-
mized for the long-term storage and efficient
transfer of environmental data. Referred to
as real-time environmental data management
systems (RT-EDMS), these solutions act as
custom middleware that provides convenient
interfaces to multiple external systems.
They also allow the processing of data
based on unique environmental reporting
procedures with custom notification capabili-
ties. RT-EDMS serve as the bridge between
islands of data contained within multiple
DAHS. They enable the retrieval of data by
users from multiple locations who might oth-
erwise be restricted from connecting to infor-
mation stored on the control network. They
also provide information in a format acces-
sible to wider platforms (Figure 1).
RT-EDMS have been successfully field-
proven in many refining and petrochemical
facilities. Users of these systems have consis-
tently shown reductions in time spent com-
piling custom reports by as much as 90%.
While large power generators might have
sufficient resources to develop custom solu-
tions for complete electronic reporting, our
research indicates that small to midsize gen-
erators (of about 1,000 MW capacity) can
especially benefit from these specialized
systems in three distinct ways: enterprise
awareness, anywhere access, and advanced
analytics.
Expanded Awareness Across the En-
terprise. Environmental groups and regula-
tory agencies are not the only stakeholders
1. Multiple data and access points. Real-time environmental data man-
agement systems (RT-EDMS) serve as the
bridge between islands of data. Courtesy:
Wood Group
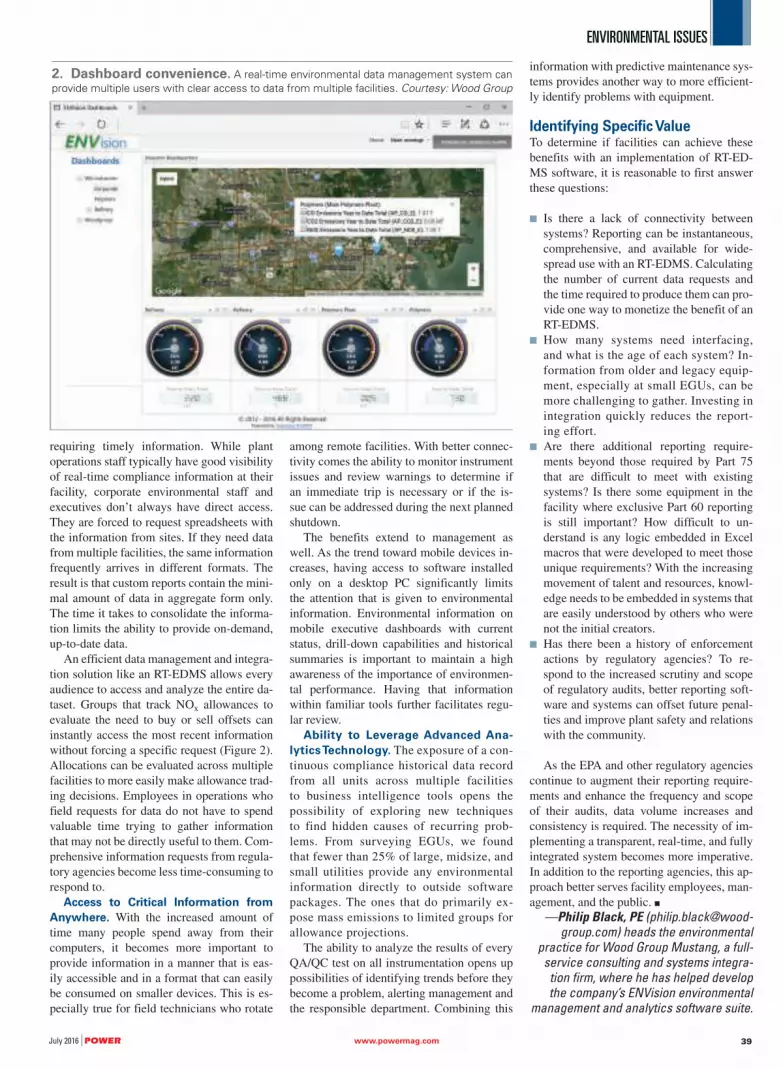
ENVIRONMENTAL ISSUES
July 2016 | POWER www.powermag.com 39
requiring timely information. While plant
operations staff typically have good visibility
of real-time compliance information at their
facility, corporate environmental staff and
executives don’t always have direct access.
They are forced to request spreadsheets with
the information from sites. If they need data
from multiple facilities, the same information
frequently arrives in different formats. The
result is that custom reports contain the mini-
mal amount of data in aggregate form only.
The time it takes to consolidate the informa-
tion limits the ability to provide on-demand,
up-to-date data.
An efficient data management and integra-
tion solution like an RT-EDMS allows every
audience to access and analyze the entire da-
taset. Groups that track NOx allowances to
evaluate the need to buy or sell offsets can
instantly access the most recent information
without forcing a specific request (Figure 2).
Allocations can be evaluated across multiple
facilities to more easily make allowance trad-
ing decisions. Employees in operations who
field requests for data do not have to spend
valuable time trying to gather information
that may not be directly useful to them. Com-
prehensive information requests from regula-
tory agencies become less time-consuming to
respond to.
Access to Critical Information from
Anywhere. With the increased amount of
time many people spend away from their
computers, it becomes more important to
provide information in a manner that is eas-
ily accessible and in a format that can easily
be consumed on smaller devices. This is es-
pecially true for field technicians who rotate
among remote facilities. With better connec-
tivity comes the ability to monitor instrument
issues and review warnings to determine if
an immediate trip is necessary or if the is-
sue can be addressed during the next planned
shutdown.
The benefits extend to management as
well. As the trend toward mobile devices in-
creases, having access to software installed
only on a desktop PC significantly limits
the attention that is given to environmental
information. Environmental information on
mobile executive dashboards with current
status, drill-down capabilities and historical
summaries is important to maintain a high
awareness of the importance of environmen-
tal performance. Having that information
within familiar tools further facilitates regu-
lar review.
Ability to Leverage Advanced Ana-
lytics Technology. The exposure of a con-
tinuous compliance historical data record
from all units across multiple facilities
to business intelligence tools opens the
possibility of exploring new techniques
to find hidden causes of recurring prob-
lems. From surveying EGUs, we found
that fewer than 25% of large, midsize, and
small utilities provide any environmental
information directly to outside software
packages. The ones that do primarily ex-
pose mass emissions to limited groups for
allowance projections.
The ability to analyze the results of every
QA/QC test on all instrumentation opens up
possibilities of identifying trends before they
become a problem, alerting management and
the responsible department. Combining this
information with predictive maintenance sys-
tems provides another way to more efficient-
ly identify problems with equipment.
Identifying Specific ValueTo determine if facilities can achieve these
benefits with an implementation of RT-ED-
MS software, it is reasonable to first answer
these questions:
■ Is there a lack of connectivity between
systems? Reporting can be instantaneous,
comprehensive, and available for wide-
spread use with an RT-EDMS. Calculating
the number of current data requests and
the time required to produce them can pro-
vide one way to monetize the benefit of an
RT-EDMS.
■ How many systems need interfacing,
and what is the age of each system? In-
formation from older and legacy equip-
ment, especially at small EGUs, can be
more challenging to gather. Investing in
integration quickly reduces the report-
ing effort.
■ Are there additional reporting require-
ments beyond those required by Part 75
that are difficult to meet with existing
systems? Is there some equipment in the
facility where exclusive Part 60 reporting
is still important? How difficult to un-
derstand is any logic embedded in Excel
macros that were developed to meet those
unique requirements? With the increasing
movement of talent and resources, knowl-
edge needs to be embedded in systems that
are easily understood by others who were
not the initial creators.
■ Has there been a history of enforcement
actions by regulatory agencies? To re-
spond to the increased scrutiny and scope
of regulatory audits, better reporting soft-
ware and systems can offset future penal-
ties and improve plant safety and relations
with the community.
As the EPA and other regulatory agencies
continue to augment their reporting require-
ments and enhance the frequency and scope
of their audits, data volume increases and
consistency is required. The necessity of im-
plementing a transparent, real-time, and fully
integrated system becomes more imperative.
In addition to the reporting agencies, this ap-
proach better serves facility employees, man-
agement, and the public. ■
—Philip Black, PE ([email protected]) heads the environmental
practice for Wood Group Mustang, a full-service consulting and systems integra-tion firm, where he has helped develop the company’s ENVision environmental
management and analytics software suite.
2. Dashboard convenience. A real-time environmental data management system can
provide multiple users with clear access to data from multiple facilities. Courtesy: Wood Group

www.powermag.com POWER | July 201640 www.powermag.com POWER | July 201640
ENVIRONMENTAL ISSUES
Weighing the Environmental Impacts of Wind and Solar
Iceland might be about the last place you
would look for innovation in solar energy,
but if so, you’d be missing something
significant—and it concerns Iceland’s own
energy supply, as you’ll soon see. But first,
some background.
Solar energy is often hailed as the most en-
vironmentally benign source of electricity, and
once a solar plant is in place, this is arguably
true. But getting there has more environmental
impacts than you might think. And it starts with
the silicon that forms the substrate of the most
common types of solar photovoltaic (PV) cells.
Silicon is one of the most common ele-
ments in Earth’s crust—about 90% of which
is composed of silicate minerals—but pro-
ducing elemental silicon pure enough for
solar PV cells is no simple matter. For one
thing, it requires an enormous amount of
electricity—roughly half of the energy re-
quired to produce a PV cell is consumed in
the silicon manufacturing process. Metal-
lic silicon is typically produced by reacting
high-purity silica sand in an electric arc fur-
nace, which can require as much as 120 kWh
per kilogram of elemental silicon from input
to final product. To the extent that electricity
is produced with fossil fuels—consider all
the PV panels manufactured in China, where
coal is the number one generation source—
it can negate some of the carbon avoidance
from solar energy.
Second, turning raw silicon into finished
wafers pure enough for solar cells involves a
number of toxic and corrosive materials. The
most common method for producing poly-
crystalline silicon, known as the Siemens
Process, involves converting elemental sili-
con into gaseous form and then growing the
silicon crystals through chemical vapor de-
position. This process requires hydrochloric
acid, and the resulting gas, trichlorosilane, is
toxic, explosive, and corrosive. The process
also produces silicon tetrachloride, another
toxic substance that must be recovered and
recycled. Several tons of silicon tetrachloride
are produced per ton of polycrystalline sili-
con, and though it can be recycled to produce
silicon and hydrochloric acid, the process is
difficult and expensive, so not all manufac-
turers perform it.
Reducing Toxic ByproductsConcerns about this process have been raised
in a variety of quarters, from both support-
ers and opponents of renewable energy. But
a San Jose–based company has developed a
completely different, much more environ-
mentally friendly method of producing solar
silicon that has the added benefit of costing
half as much as traditional processes and us-
ing one-third the energy.
Silicor Materials is planning a facility in
Renewable generation is usually characterized as more environmentally friendly than fossil fuels, and in many respects, that’s true. But there is a growing recog-nition that solar and wind generation have their own impacts, and an increasing number of manufacturers and generators are looking for ways to minimize them.
Thomas W. Overton, JD
Courtesy: Silicor Materials

ENVIRONMENTAL ISSUES
July 2016 | POWER www.powermag.com 41July 2016 | POWER www.powermag.com 41
Iceland to make it happen. Why Iceland? The
island’s abundance of cheap hydroelectric
and geothermal power has made it a mecca
for metals processing despite its remote lo-
cation—the tiny nation in fact ranks 11th
worldwide in production of aluminum. And
it’s the aluminum smelting process that Sili-
cor uses to produce its silicon.
Silicor Chairman and CEO Terry Jester
explained the method to POWER. Rather
than using gaseous silicon, Silicor’s method
partners with the island’s aluminum smelters
to extract silicon from the aluminum smelt-
ing process, where silicon is viewed as an
impurity. Metallurgical-grade silicon is dis-
solved into an aluminum smelt, and the sili-
con will crystalize out before the aluminum
solidifies as the mixture is cooled (shown in
the header photo). The crystallized silicon
flakes still contain a coating of aluminum,
but this is then removed using hydrochloric
acid. Unlike traditional silicon production,
however, this process produces polyalumi-
num chloride, a nontoxic compound that is
used in water purification, among other pro-
cesses. The remaining silicon flakes are then
re-melted, and what little aluminum remains
forms a thin layer on top of the silicon ingot
that can easily be removed (Figure 1).
According to Michael Russo, Silicor’s
executive vice president of sales, marketing,
and commercial business development, the
factory is set to break ground in Grundar-
tangi, Iceland, this fall and will have a capac-
ity of 19,000 metric tons of solar silicon (all
of which has been committed to customers)
when it reaches full output in 2019. In ad-
dition to the environmentally friendly manu-
facturing process, its location in Iceland will
allow it to source 100% of its electricity from
renewable energy.
Raising AwarenessBut solar PV cells are more than just silicon.
The PV manufacturing process involves a
range of toxic substances such as hydroflu-
oric acid, and it produces substantial waste-
water and solid waste streams. Treating and
recycling that waste costs money, and there
have been examples of a few PV manufactur-
ers cutting corners by dumping wastewater
rather than treating it. In one widely reported
incident, protests over dumping outside a
Chinese manufacturer’s plant in 2011 turned
violent and the company later faced legal ac-
tion over it.
Concerns about these issues led the
Silicon Valley Toxics Coalition (SVTC), a
nonprofit organization that tracks environ-
mental impacts in the tech industry, to begin
publishing an annual scorecard ranking PV
manufacturers on the transparency and sus-
tainability of their manufacturing processes.
To achieve a positive score, the manufacturer
needs to support PV panel recycling, clear-
ly report emissions across its supply chain,
make efforts to reduce module toxicity and
use of heavy metals, and keep in place mod-
ern health and safety standards for its work-
ers, among other criteria.
Not surprisingly, scores since the SVTC
began the scorecard in 2010 have fluctu-
ated widely given the substantial number of
mergers, bankruptcies, and new companies
entering the field. And, since the scorecard
relies on self-reported data, manufacturers
that did not participate in the survey tend to
have low scores. Still, the scorecard shows
that at least some manufacturers are making
substantial efforts to reduce the impacts of
their manufacturing processes. Three major
companies—SunPower, SolarWorld, and
Trina—all achieved scores above 90 on the
2015 scorecard (see http://bit.ly/1PAHV1O
for the full list).
Other efforts to reduce solar PV impacts
include an embrace of extended producer re-
sponsibility (EPR). EPR is a term used for the
idea that the environmental costs of a product
throughout its life cycle should be reflected
in its market price, typically with some sort
of surcharge. (If you bought a computer re-
cently, you may have seen such a fee added
on to the purchase price.) While the Euro-
pean Union has an EPR scheme that funds
disposal costs for PV panels, no such scheme
exists in the U.S. However, the SVTC reports
that a number of panel manufacturers have
asked the Solar Energy Industries Associa-
tion to work on this issue.
Birds and Bats and Turbines, Oh MyUnlike solar PV cells, wind turbine manu-
facturing is relatively benign, or at least little
different in impact from traditional turbine
generators, since many of the same compo-
nents are used. Wind turbines using permanent
magnets require rare earth elements such as
neodymium, the extraction of which can have
serious environmental consequences because
of the acids used in refining and the frequent
occurrence of uranium and thorium in the
ores. However, the percentage of neodymium
going to wind turbine manufacturing is a small
component of worldwide demand for this ele-
ment, which is used in a wide variety of con-
sumer products as well as electric vehicles.
Much more controversial has been the is-
sue of bird mortality at operating wind farms
(Figure 2). Though the scope of the impact
has been heavily studied, the reported ranges
are quite large. Estimates of bird mortality in
peer-reviewed studies vary from wind farm
to wind farm, and range from 0 (that is, no fa-
talities were found) to as many as 10 or more
birds killed per turbine per year. Nationwide,
a 2013 study reviewing published data con-
cluded that 573,000 birds and 888,000 bats
were killed each year at U.S. wind farms in
2012, while another study in 2014 estimated
bird deaths at 140,000 to 328,000.
It is worth noting that generalized totals do
not give an accurate picture of the true im-
pact of bird mortality for a variety of reasons.
Deaths in different regions and over different
periods of the year have different effects on
the environment. Mortality rates for different
species are not clear, even though deaths of
different species also have different impacts.
For example, the loss of 10,000 sparrows will
have far less effect on the ecosystem than the
loss of 10,000 bald eagles.
1. Clean and clear. Silicor Materials
has developed a manufacturing process for
polycrystalline silicon that uses substan-
tially less energy with no toxic byproducts
by partnering with aluminum smelters. The
company is preparing to build a large factory
in Iceland that will begin operations in 2018.
Shown here are finished ingots of silicon.
Courtesy: Silicor Materials
2. Avian impact. This red kite was killed
by a wind turbine blade at the Montes del
Cierzo wind farm in Spain. Courtesy: Gurelur

ENVIRONMENTAL ISSUES
www.powermag.com POWER | July 201642
Data suggest that migratory birds tend to
suffer the greatest mortality from wind tur-
bines, accounting for around 75% of all fa-
talities, according to several studies. Some
authors have suggested that deaths for these
species are underreported because these birds
tend to be small and their carcasses are more
easily scavenged and thus less likely to be
found during site studies. However, because
these species also represent some of the
largest bird populations, many studies have
concluded that these deaths are ecologically
insignificant, especially when viewed in con-
text with deaths suffered by collisions with
power lines, buildings, and other structures,
and predation by domestic cats.
On Wings of EaglesThough raptors (eagles, hawks, and related
species) make up a small portion of the to-
tal bird fatalities (the 2013 study mentioned
above estimated 83,000 per year), these
deaths are much more significant because
these birds are typically apex predators and
their population has a direct effect on a wide
variety of other species. Thus, it is not sur-
prising that wind turbine raptor deaths have
garnered most of the attention.
There is evidence that raptors are attracted
to wind turbines as nesting sites, and they are
likely more vulnerable to blade impact be-
cause of their habits of staying aloft longer
and floating on thermal patterns while hunt-
ing for prey. One oft-cited study estimated as
many as 100 or more raptors being killed at
the Altamont Pass Wind Farm in California
every year, though this high level of mortality
has not been seen at other wind farms.
Some studies have suggested that this dis-
parity exists because most of the turbines at
Altamont were constructed before bird mor-
tality was an issue considered during wind
farm development and little thought was
given to reducing risks. Studies have shown
that wind farm location can have a dramatic
effect on avian mortality, with poorly sited
projects killing far more birds than ones built
with more responsible planning.
Older wind farms tend to be higher density
than newer projects, grouping turbines much
more closely, which can increase avian risk.
Such farms are also more likely to have lat-
tice-frame towers instead of the monopoles
used by modern turbines, as well as above-
ground transmission lines (Figure 3), both of
which are known to attract birds.
Adjust Cut-In Speed to Cut MortalityThough the data are not extensive, there
is growing evidence that proper planning
and design can substantially reduce avian
mortality. A 2010 study from the U.S. Fish
and Wildlife Service (FWS) makes a num-
ber of recommendations (see http://1.usa.
gov/1OKpKgd). Among these are assess-
ing avian populations in the area during the
planning process, with particular attention
to nesting sites, migration routes/stopovers,
and the potential for fragmenting existing
habitats. Where such factors exist, other sites
should be considered. As specific sites are
identified, more detailed studies of potential
impacts are recommended, particularly of
species behavior in the area.
When building the farm, the study rec-
ommends placing turbines outside of areas
identified as crossing routes and using only
strobe lights that fire simultaneously rather
than continuous lighting. (This is to avoid at-
tracting insects that in turn attract birds and
bats. Several mass mortality events at wind
farms have been linked to the use of high-
intensity lighting.) Measures should also
be taken to avoid creating potential habitats
for prey animals such as rabbits and ground
squirrels, as these will attract raptors. During
operation, avian mortality should be moni-
tored and recorded, and in areas where sig-
nificant mortality is found, further mitigation
efforts should be explored.
One mitigation measure that has been
identified is increasing blade cut-in speed,
that is, raising the minimum wind speed at
which the turbine begins operating. Many
birds and bats are more active during periods
of low wind, and keeping turbines motionless
or at low speed in these conditions has been
shown to reduce mortality.
The effectiveness of deterrent devices
such as those that generate ultrasonic noise
is unclear. Some studies have shown reduced
bat mortality, but the data are not extensive.
Accordingly, the Department of Energy is
currently funding several studies, including
one by GE, of deterrent devices to determine
whether they could be effective in reducing
bat mortality.
Other approaches include using radar to
detect approaching birds and automatically
shutting down or slowing turbines, but the
effectiveness of this method is also not yet
known.
Meanwhile, the federal government is
struggling with how to regulate avian mortal-
ity at wind farms, since many avian species
killed by wind turbines—such as bald and
golden eagles—are protected by federal law,
and causing such deaths is normally cause
for prosecution. Duke Energy was fined $1
million in 2013 and PacificCorp was fined
$2.5 million in 2014, both for eagle deaths
in Wyoming, but enforcement actions have
otherwise been rare. (Duke has since taken
steps to reduce avian and bat mortality at its
16 wind farms, such as slowing down blades
in low wind.)
In 2013 the FWS issued a rule allowing
wind farm owners to apply for 30-year per-
mits to kill limited numbers of eagles (tech-
nically referred to as “incidental take”), a
regulation that was successfully challenged
in court by several conservation organiza-
tions. In May 2016, the FWS proposed a new
rule that would require active monitoring
and mitigation of avian mortality, with the
permits being reviewed every five years. The
proposed rule is open for comment through
July 5. ■
—Thomas W. Overton, JD, is a POWER
associate editor.
3. Double trouble. The San Gorgonio Pass Wind Farm north of Palm Springs, Calif., was
developed beginning in the 1980s. Its closely placed turbines (some with lattice-frame towers) and
above ground transmission lines can pose multiple threats to birds. Courtesy: Gail Reitenbach

July 2016 | POWER www.powermag.com 43
ENVIRONMENTAL ISSUES
Avoiding Wildlife Impacts from Renewable Energy in Europe
As more renewable energy systems come
online, providers hope to both make
money and protect the environment
simultaneously. However, some environmen-
tal scientists and conservationists are sound-
ing alarm bells over impacts that onshore and
offshore wind farms and new wave and tidal
energy systems may have on avian and marine
wildlife—in particular, birds, bats, whales,
dolphins, and other sea mammals.
There is empirical evidence that onshore
wind production has negative impacts on
birds and bats (see the article “Weighing the
Environmental Impacts of Wind and Solar”
in this issue). But a bigger unknown is how
increasing numbers of offshore wind devel-
opments will affect marine as well as bird
populations. Europe leads the world in off-
shore wind development, and plans are un-
der way to continue to ramp up. Including
offshore production, Europe’s installed wind
capacity could surpass 200 GW by 2020. In-
deed, worldwide, wind energy of all forms
is, well, blowing up. Though unquestionably
renewables are better for the environment
than fossil-fueled power plants, the enduring
struggle between economics and stewardship
is still part of the equation.
For maximum output and profitability,
wind farms are sited in open, exposed areas
where there are higher-than-average wind
speeds. This means that they are frequently
proposed in upland and coastal areas, poten-
tially affecting important habitats for breed-
ing, wintering, and migrating birds. In the
same way turbines utilize the kinetic energy
of the wind, birds often use that wind as their
propellant or even as “superhighways.” The
degree to which wind farms can safely co-
exist with avian life is still an unknown, es-
pecially as ever-larger wind turbines on- and
offshore are deployed.
Additionally, as humans keep develop-
ing coastal, tidal, and deep ocean regions,
the noises created during exploration and
development processes become highly am-
plified in the undersea environment. Many
species of marine life, particularly mam-
mals, depend heavily on sonar-like systems
to navigate, and those systems are greatly
affected by the sounds created during un-
dersea energy development and construc-
tion. In much the same way that dolphins,
porpoises, and whales have been affected by
undersea oil exploration, they are getting hit
again as both offshore wind, tidal, and other
marine renewable energy systems expand
(see sidebar).
But precisely because most of these ener-
gy systems are new, the extent of their actual
impacts is still relatively unknown. Without
much of an established body of peer-re-
viewed scientific research, environmentalists
and developers are just now creating baseline
study frameworks and guidelines for future
projects. Given Europe’s longer history with
renewable rollouts, a large portion of the pub-
lished research emanates from there. What
are some lessons that have been learned, and
what can renewable energy providers else-
where do to avoid the worst mistakes of their
pioneering predecessors?
Europe has been in the forefront of renewable energy development, and though the scientific research on wildlife impacts is limited, European envi-ronmentalists and developers are beginning to create baseline frameworks and guidelines. Developers around the world can learn from their experience.
Lee Buchsbaum
Courtesy: Ad Meskens/Wikimedia Commons

ENVIRONMENTAL ISSUES
www.powermag.com POWER | July 201644
Wind Turbines Can Be Bird and Bat KillersAs one might expect, most of the impacts
of wind infrastructure are not due to direct
clearing of land or habitat loss but to bird and
bat collisions. Birds can be killed not only
from collisions with rotors but also by col-
liding with towers, nacelles, and associated
structures such as guy cables, power lines,
and meteorological masts. Estimates of bird
and bat collisions vary from site to site, de-
pending on the location, the technology used,
and the abundance of birds locally. Some
studies suggest that birds may be killed at a
rate of between three to five individuals per
MW per year, while bat collisions at some
sites are as common as 30 per MW per year.
However, the authors of a December 2014
European Commission publication entitled
“Science for Environment Policy Future
Brief: Wind & Solar Energy and Nature Con-
servation” (see http://bit.ly/1DkTGFl), cau-
tion that the number of bird deaths arising
from turbine collisions overall “represents a
tiny fraction of the total bird deaths caused by
humans: pet cats, windows and transmission
lines kill many more.”
Recent research suggests that newer-
generation turbines sited with appropriate
planning generally pose lower risks. How-
ever, comparisons between sites are difficult
because different sites have distinct avian
populations, and species composition and
behavior can affect the risks. In other words,
planners and site developers have to be care-
ful not to over-generalize. Each site requires
its own specific analysis.
Better Site Selection Is KeyThe consensus among European experts is
that the best solution for energy developers as
they seek to avoid wildlife impacts is likely
Tidal Power Draws Concern
Coming on strong are a variety of newly de-
ployed marine renewable energy systems,
or MRE technologies (Figure 1). Accord-
ing to “Environmental Effects of Marine
Renewable Energy Development Around
the World,” a report from Annex IV—a col-
laborative initiative of the Ocean Energy
Systems under the International Energy
Agency Technology Network (see http://
tethys.pnnl.gov/publications/state-of-the-
science-2016)—the world’s oceans have
the current technical potential to produce
9,100,000 GWh annually using established
MRE technologies for tidal, wave, and
ocean current extraction.
One of the main advantages of MREs
compared to wind and solar is that their
electrical output is more constant. With a
greater potential for reliability, there are
even greater profits to be made once the
system is operational.
Scotland, with its rocky, beautiful shore-
lines, fierce coastal winds, and huge bird
populations, is both a vast potential source
of tidal and wind energy and a significant
venue for avian conflict. Scotland is work-
ing with both Ireland and Northern Ireland
to construct one of the world’s first large-
scale marine renewable energy systems.
The Irish-Scottish Links on Energy Study
project is set to reach 6.2 GW by 2020. The
project, known as ISLES, will use all three
of the major marine renewable energy
sources—offshore wind, wave, and tidal—
and will provide much-needed data on the
technology and its effects on the environ-
ment (see www.islesproject.eu). Dozens of
different types of tidal energy prototypes
have been tested throughout the past de-
cade by Scotland’s European Marine Energy
Centre.
Because tidal energy is both so new
and potentially disruptive to marine life,
a group of researchers, environmentalists,
and stakeholders formed Annex IV to study
the environmental effects of marine renew-
able energy development. By sharing data
and synthesizing results through its State
of the Science reports, Annex IV hopes to
reduce risk for marine energy technologies,
avoid duplication of research and monitor-
ing efforts, promote sustainable develop-
ment of MRE technologies, and ensure that
accurate and up-to-date information is
available to regulators, industry members,
and scientists worldwide. (The comprehen-
sive report, however, sticks to MREs and
does not address the effects of offshore
wind.)
The 2016 report summarizes research
findings regarding the collision of marine
animals with undersea turbines. Other ar-
eas of study were the effects of underwater
noise from turbines and electromagnetic
fields from undersea cables used to carry
power. The consensus is that deployments
composed of single units are not expected
to harm marine life. The report also looks
at the health of seafloor habitats and
reefs, changes in sea flow patterns around
turbines, and biodiversity of marine eco-
systems. In addition, the report includes
four case studies on the long permitting
and consenting process that the first gen-
eration of MRE devices has encountered,
and it suggests areas for future marine en-
ergy monitoring and research.
1. The tide is rising. The 1.2-MW SeaGen tidal power system in Strangford Lough in
Northern Ireland, which began operations in 2008, was the world’s first commercial-scale,
grid-connected tidal stream turbine. Courtesy: Siemens

ENVIRONMENTAL ISSUES
July 2016 | POWER www.powermag.com 45
improved site selection, as the international
avian conservation group BirdLife reported
in one of its recent studies, “Meeting Eu-
rope’s Renewable Energy Targets in Harmo-
ny With Nature” (see http://bit.ly/1Y3FDjQ).
According to the BirdLife report, a use-
ful approach is mapping wind resources
(such as speeds and patterns) together with
maps of environmentally sensitive zones,
such as migration corridors and protected
wildlife areas. Doing so can create a prac-
tical tool for development decisions based
on the most extensive and up-to-date data.
These can also be useful for policy making
and planning.
Robust and objective baseline studies
are also necessary as part of this process to
minimize negative effects on birds, other
wildlife, and their habitats. They also support
post-construction monitoring at completed
wind farms where environmental concerns
exist. BirdLife and the European Commis-
sion studies state that, where at all possible,
energy providers should not develop in areas
with:
■ “High densities of wintering or migratory
waterfowl and waders, where important
habitats might be affected by disturbance,
or where there is potential for significant
collision mortality.”
■ “[A] high level of raptor activity, especial-
ly core areas of individual breeding ranges
and in cases where local topography fo-
cuses flight activity, which would cause a
large number of flights to pass through the
wind farm.”
■ “Breeding, wintering or migrat-
ing populations of less abundant spe-
cies, particularly those of conservation
concern, which may be sensitive to
increased mortality as a result of colli-
sion or more subtle effects on survival
and productivity due to displacement.”
When developers build their turbines,
BirdLife and the European Commission sug-
gest they:
■ “Group turbines to avoid alignment per-
pendicular to main flight paths and to pro-
vide corridors between clusters, aligned
with main flight trajectories, within large
wind farms.”
■ “Where possible, developers should install
transmission cables underground (subject
to habitat sensitivities and in accordance
with existing best practice guidelines for
underground cable installation).”
■ “Developers should mark overhead cables
using deflectors and avoid their use over
areas of high bird concentrations, espe-
cially for species vulnerable to collision.”
Another suggestion BirdLife has is that
wind producers halt turbine operations “dur-
ing peak periods of activity or during mi-
gration,” even though that means taking a
potential hit on income.
After the turbines have been sited, among
the best solutions to avoid accidental avian
deaths is the installation and usage of bird-
and bat-sensitive radar systems. Several
international manufacturers now provide
systems with supporting software that can
be used to scan the sky for large groups of
birds and bats and automatically shut down
turbines before flocks pass through genera-
tion areas. For older wind farms that have
been sited along migratory routes, this could
prevent bird formations from “sleep-flying”
directly into harm’s way.
Additional operational adjustments such
as changing the cut-in speed or the angle of
blades relative to the wind may also reduce
collisions. However, somewhat counterin-
tuitively, for birds with poor maneuverabil-
ity such as griffon vultures, it may be that
slower rotation speeds are more problem-
atic because the associated low wind speed
makes avoidance of the turbine blades more
difficult. On the other hand, according to
the European Commission report, data from
several studies suggest that bat collisions
are halved when turbine cut-in speed is in-
creased by 1.5 meters per second above the
manufacturer’s speed. “This may be because
bats are more active at lower wind speeds”
since the insects they feed on do not fly in
high winds.
Other Potential Impacts of Off-shore Wind FarmsBecause of its location in marine environ-
ments, offshore wind development brings
with it another set of environmental impacts.
Turbine foundation construction and under-
sea cable installations, as well as other steps
in the construction of high-capacity wind
farms, can generate high levels of noise
(Figure 2). The impact of noise on marine
mammals can be divided into three levels:
those that cause fatal injury; those that cause
non-fatal injury such as deafness and other
auditory damage such as “temporary thresh-
old shift”; and those that cause behavioral
change (such as avoidance and cessation of
feeding).
The focus should not solely be on avoiding
deaths, however. “A porpoise is doomed to
die if its hearing is shattered,” Kim Detloff, a
marine expert at German nature conservation
group NABU told Renewable Energy World
in a 2012 story. In Germany, comprehensive
noise control measures must be used dur-
ing the construction phase, especially when
foundation structures are driven into the sea-
floor. This is necessary to protect porpoises,
2. Boom times. Erecting offshore wind turbines can create substantial undersea noise
during the construction of foundations and driving of pilings, noise that can have harmful effects
on marine life. Proper mitigation efforts, such as air-bubble curtails, may be able to reduce those
impacts. Courtesy: RWE Innogy

ENVIRONMENTAL ISSUES
www.powermag.com POWER | July 201646
which are sensitive to noise and protected by
animal conservation laws, as well as other
marine mammals. Regulators “must sanc-
tion developers if they repeatedly violate the
noise limit,” said Detloff.
While data demonstrate that construc-
tion will have effects on mammals and
fish, which can detect pile-driving noises
over considerable distances, there are very
few equivalent data available for birds.
Adequate avian ecological survey data is
generally still unavailable for most off-
shore areas, according to BirdLife. In order
to remedy this, they recommend, prior to
development, year-round baseline data col-
lection over a minimum of two years for all
affected bird species to cover breeding and
non-breeding distributions.
Mitigating Undersea Noise ImpactsEnvironmental best practices often trail de-
velopment, only evolving as real impacts are
actually felt. Beginning several years ago,
as German energy provider RWE AG began
construction of its massive Nordsee offshore
wind farm complex, the firm shifted to using
technologies that reduced noise from driv-
ing turbines into the seabed after conserva-
tion groups complained about impacts on
porpoises. RWE’s Nordsee Ost wind farm,
which has a capacity of approximately 295
MW, is one of the largest commercial wind
farm projects off the German coast. A total
of 48 Senvion wind turbines, each with a ca-
pacity of 6 MW, were initially installed. Cur-
rently the company is jointly developing the
next phase, the Nordsee One project. With 54
more wind turbines, Nordsee One will have
an overall capacity of 332 MW.
Recent news releases from RWE state
that the foundations for Nordsee One’s wind
turbines and the substation were recently
completed. The installation of the facility’s
main submarine cable is scheduled to begin
in June. The transformer substation at sea is
also slated to be installed during the summer.
Finally, the wind turbines are due to be in-
stalled in early 2017, and the wind farm will
then go into operation next year.
According to other published reports, dur-
ing the initial construction phase, RWE used
a large perforated hose to produce a curtain
of air bubbles around each of the first 48 tur-
bine foundations at Nordsee Ost. RWE has
also undertaken many onshore and offshore
ecological surveys to identify the location of
habitats and species of all the affected marine
and avian life that could be impacted by the
development. Extensive boat and aerial sur-
veys collected two years’ worth of data on
bird activity offshore.
“We have also completed one year of ma-
rine mammal surveys using a combination of
survey techniques,” RWE said in a statement.
“We have also collected over 10,000 hours of
continuous acoustic monitoring for marine
mammals from static moorings. In addition,
we have completed surveys for fish and other
marine species which live on, or within, the
seabed.” The survey data will be used in con-
junction with other existing data to establish
the ecology of the area.
No doubt, as development proceeds, many
more lessons will be learned as new regula-
tions are phased in. Now as the U.S. begins
development of its first large offshore wind
farm, operators in conjunction with their
Dutch partners have announced their intent
to draw on lessons learned throughout the
North Sea. �
—Lee Buchsbaum (www.lmbphotography.com), a former editor and contributor to
Coal Age, Mining, and EnergyBiz, has covered coal and other industrial subjects
for nearly 20 years and is a seasoned industrial photographer.
www.electricpowerexpo.com
The ELECTRIC POWER committee has issued an industry-wide call for participation for the 19th Annual
ELECTRIC POWER Conference + Exhibition, which will be held April 10-13, 2017 in Chicago, IL.
The conference committee is looking for case studies showcasing technologies, improvements, techniques and
experiences that provide solutions and improve operations for the power plant of tomorrow.
Do you have experience and insight to share on these topics?
u Solutions and lessons learned to increase power plant performance and profi tability
u New and proven solutions to meet environmental compliance guidelines
u Case studies on technology solutions or advancements
u Power plant resiliency—From performance management to cyber security and more
u Combined Heat & Power—Best practices shared
u Grid stability and integration experience or insights
If “YES” popped into your head while reading this list, we want
to hear from you!
Deadline for submission is August 12, 2016—go online
today and submit your abstract for consideration!
April 10–13, 2017
McCormick Center West
Chicago, IL

Did you know the Institute of Clean Air Companies (ICAC)
is comprised of more than 65 member companies?
Representing suppliers of air pollution monitoring and
control systems, equipment, and services for stationary
sources, joining ICAC means access to top resources around
the world to help your company thrive in today’s markets.
As a membership organization, ICAC provides its members
with the tools to stay up-to-date on the latest industry news
and provides forums for developing technology-focused
white papers, buying guides, and rule comments.
ICAC focuses on collaboration, routinely working with
government, business, public, and private groups to
ensure the industry has an active voice and that its
products and technologies are properly represented and
understood. By hearing all positions regarding air quality
concerns, ICAC members successfully apply technology
to achieve economical technology design, development,
and deployment to address the air quality challenges we
face today. Members also work to address the impacts of
air quality technology on the balance of plant concerns,
including E⦆luent Limitation Guidelines (ELG).
Industries ICAC serves:
• Emissions control technologies: VOC, SO2,
NOx, PM, Hg, GHG, and air toxics
• Emissions measurement technologies:
CEMS, Portables, DAHS, etc.
• Leading manufacturers of industry equipment
• Providers of related advisory and
implementation service
ICAC members-only resources and opportunities:
• An engaged member community
• The ICAC Annual Business Meeting
• EPA Roundtables and other Federal and State agency meetings
• Legislative Conferences• Industry networking events
• Access to an industry leading e-newsletter
• The Annual ICAC Market Study
• Participation in Division meetings and Committees
• Technical Webinars
ICAC’s mission is to be the voice of the
stationary source air pollution control
and monitoring industry.
The ICAC is often the go-to for agencies to obtain key
information about air pollution control technology. The
ICAC places a high value on: providing credible, high-quality,
reliable information to government entities and relevant
industry parties; encouraging policies that are open to
innovation and new technology and treating all stakeholders
equally and with respect. By providing scienti〝c technical information relevant to 〞exible clean air policies based on practical, achievable and measurable emissions limitations,
members will have the latest data right at their 〝ngertips.
As an ICAC member, MKS gained access to many
of the EPA personnel directly responsible for
writing and enforcing regulations and standards
for CEM technologies.
ICAC members are committed to the domestic and
international growth of the energy industry. With up-to-
date information on market opportunities around the globe
and a number of networking opportunities throughout the
year, ICAC members have access to the key information and
contacts they need to thrive in today’s market. Members
bene〝t from networking activities such as a membership meeting each spring, the annual Clean Air Summit,
legislative conferences, numerous division and committee
meetings, conference calls and webinars, EPA roundtable
meetings, state technical forums, and more.
ADA-ES attributes much of its success to its
relationships with di⦆erent ICAC member companies of varying sizes and a wide range
of expertise.
*A special thank you to POWER Magazine for their
collaborative e⦆orts
THE INSTITUTE OF
CLEAN AIR COMPANIES:
Helping You Advance in the Industry

CIRCLE 12 ON READER SERVICE CARD
CIRCLE 13 ON READER SERVICE CARD
Mississippi Lime Company offers two advanced hydrated lime
solutions speciically engineered for DSI Systems: ザ High Reactivity Hydrate (SO
3 and HCl)
ザ HRH-64 (SO2 and HCI)
These sorbents provide proven advantages to the end user:
ザ High level removal of SO3, HCI, and SO
2
ザ Operational beneits ザ Reduced annual sorbent costs ザ Ash stability
Contact us at [email protected] to learn more.
HIGH REACTIVITY HYDRATED LIMEfor DRY SORBENT INJECTION
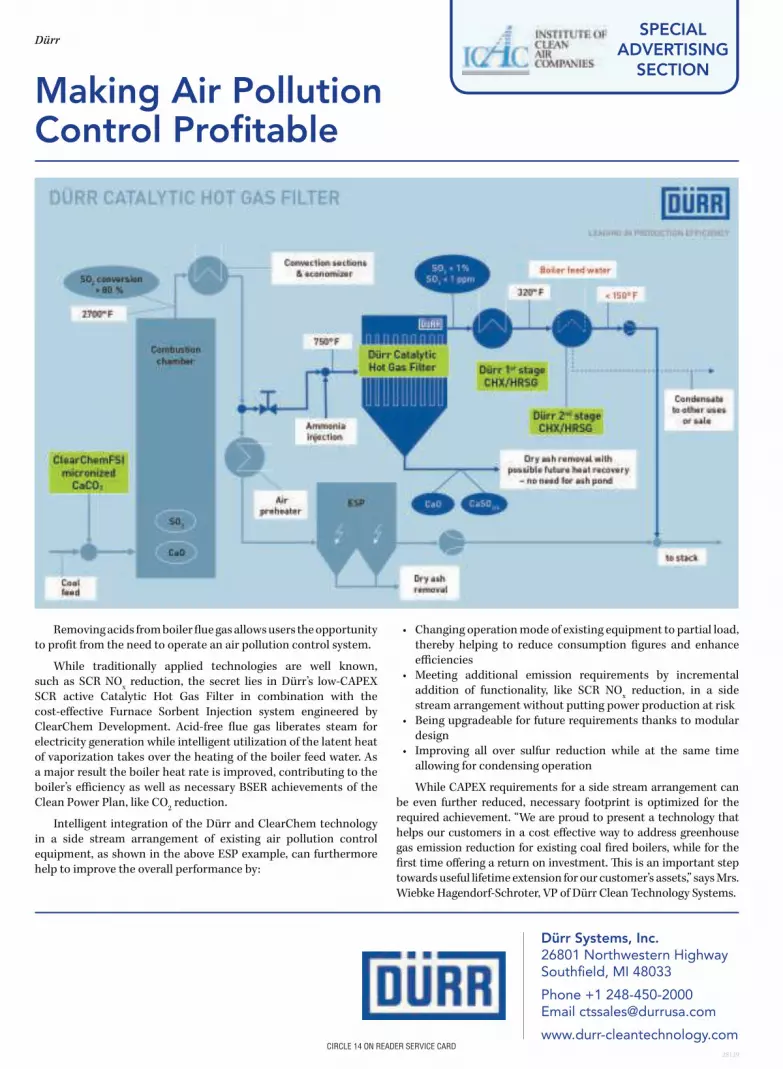
Making Air Pollution Control Profitable
Removing acids from boiler lue gas allows users the opportunity
to proit from the need to operate an air pollution control system.
While traditionally applied technologies are well known,
such as SCR NOx reduction, the secret lies in Dürr’s low-CAPEX
SCR active Catalytic Hot Gas Filter in combination with the
cost-efective Furnace Sorbent Injection system engineered by
ClearChem Development. Acid-free lue gas liberates steam for
electricity generation while intelligent utilization of the latent heat
of vaporization takes over the heating of the boiler feed water. As
a major result the boiler heat rate is improved, contributing to the
boiler’s eiciency as well as necessary BSER achievements of the
Clean Power Plan, like CO2 reduction.
Intelligent integration of the Dürr and ClearChem technology
in a side stream arrangement of existing air pollution control
equipment, as shown in the above ESP example, can furthermore
help to improve the overall performance by:
• Changing operation mode of existing equipment to partial load,
thereby helping to reduce consumption igures and enhance
eiciencies
• Meeting additional emission requirements by incremental
addition of functionality, like SCR NOx reduction, in a side
stream arrangement without putting power production at risk
• Being upgradeable for future requirements thanks to modular
design
• Improving all over sulfur reduction while at the same time
allowing for condensing operation
While CAPEX requirements for a side stream arrangement can
be even further reduced, necessary footprint is optimized for the
required achievement. “We are proud to present a technology that
helps our customers in a cost efective way to address greenhouse
gas emission reduction for existing coal ired boilers, while for the
irst time ofering a return on investment. his is an important step
towards useful lifetime extension for our customer’s assets,” says Mrs.
Wiebke Hagendorf-Schroter, VP of Dürr Clean Technology Systems.
DürrSPECIAL
ADVERTISING SECTION
Dürr Systems, Inc. 26801 Northwestern Highway Southfield, MI 48033
Phone +1 248-450-2000 Email [email protected]
www.durr-cleantechnology.com28129
CIRCLE 14 ON READER SERVICE CARD

Simple, Effective Compliance with Regulatory Requirements for Mercury
W. L. Gore & Associates, Inc.
W. L. Gore & Associates, Inc. 101 Lewisville Road • Elkton MD 21922
Toll-Free: 1.800.328.4623
Email: [email protected]
gore.com/mercury
he GORE™ Mercury Control System (GMCS) is an innovative solution that eliminates many of the undesirable complications and high operating costs associated with traditional mercury control systems. It can be a viable alternative, replacement, or complement to an existing system, providing decreased operating costs, increased compliance margin, and simpliied plant operation.
he GMCS is a unique ixed sorbent system for capturing elemental and oxidized gas phase mercury from industrial lue gas. he modules are designed with an open channel structure which provides extremely low pressure drop avoiding the need for an additional booster fan (typical installation only adds 1 to 2 inches of water dP). Operation is passive; the modules will continuously capture mercury for many years without requiring any adjustment, regeneration, or replacement. hey also provide a signiicant SO
2
removal co-beneit, which may be useful for meeting future SO2
regulations. Both mercury and SO2 are removed without requiring
any injection of sorbents or chemicals, and as a result, the operating cost of the system is very low.
The Science Behind the SolutionAt the heart of the technology is an innovative, luoropolymer
based material developed by scientists at W. L. Gore & Associates: Sorbent Polymer Catalyst (SPC) composite material.
he sorbent in this material eiciently captures gas-phase
mercury and is insensitive to fuel or process changes. Unlike with many activated carbon sorbents, the presence of SO
3 does not inhibit
mercury capture by the SPC. Since there are no injected sorbents or chemicals, there is no concern over ly ash contamination, halogen-induced corrosion, or wastewater treatment complications. he catalyst in the SPC converts SO
2 to sulfuric acid which is neutralized
in the scrubber.
he GMCS can serve as a barrier to mercury re-emissions from a wet lue gas desulfurization system (wFGD), eliminating the need for re-emissions additives.
Minimal Solid Waste Generation When the modules have reached end of life, the SPC material
can be removed from the metal frames for disposal. he quantity of SPC material that needs to be disposed is typically several orders of magnitude less than the quantity of injected sorbents resulting in lower disposal costs.
Installation in Wet Scrubber
GORE™ Mercury Control Systems are currently in operation in 2000 MW in the coal-ired power industry, and 15 sewage sludge incinerators.
Contact Gore to receive a speciic installation design for your plant including costs and projected cost savings.
28269
SPECIAL ADVERTISING
SECTION
CIRCLE 15 ON READER SERVICE CARD

101 Lewisville Road • Elkton MD 21922Toll-Free: 1.800.328.4623
Email: [email protected]
gore.com/mercury
CIRCLE 16 ON READER SERVICE CARD

www.powermag.com POWER | July 201652
PRB COAL
PRB Coal Users’ Group Plant of the Year: Ameren’s Rush Island Energy Center
“Without continual growth and progress,
such words as improvement, achieve-
ment, and success have no meaning,”
Benjamin Franklin once said. Franklin, in-
ventor and statesman, knew the value of im-
proving electricity systems and in the process
of his electricity experiments coined terms
such as “battery,” “charge,” “condenser,” and
“armature,” among many others. Franklin
began with an idea that would benefit so-
ciety (he never patented an invention) and
then slowly perfected the product. The best-
performing power plants, such as Ameren’s
Rush Island Energy Center (RIEC), reap the
rewards of following Franklin’s example.
In May, RIEC celebrated 40 years of pro-
viding reliable, safe, and low-cost power to
its Missouri customers. Over 20 years ago,
RIEC began making the switch to Pow-
der River Basin (PRB) coal because of the
coal’s environmental and economic advan-
tages (the coal contains very low amounts
of sulfur and is the lowest $/Btu fuel). The
plant has burned 100% PRB coal since
1996. Today, PRB coal is further refined on
site with the addition of proprietary chemi-
cals that “refine” the coal in order to reduce
NOx production at a cost of about $4 million
per year. RIEC’s two units routinely score
first and second nationally for the lowest
NOx produced by units without selective
catalytic reduction (SCR).
RIEC is located about 45 miles south of St.
Louis, Mo., on a 500-acre site, on the west side
of the Mississippi River. Each unit has a gross
generating capacity of approximately 645
MW. The two units began commercial service
in 1976 and 1977 and represent the last coal
plants constructed for the Ameren Missouri
generating fleet. The tangentially fired boilers
were originally designed to burn high-sulfur
Illinois coal (11,600 Btu/lb versus 8,400 Btu/
lb for PRB coal). The plant produces electric-
ity with two Westinghouse turbine-generators,
recently upgraded with Alstom rotors.
The Powder River Coal Users’ Group
(PRBCUG) Board of Directors toured RIEC
in mid-December 2015 to learn first-hand
about the plant’s progress toward implement-
ing best practices for managing risk, ensuring
a safe working environment, efficient combus-
tion, and PRB coal handling. Board members
shared their observations with POWER, many
of which are included in this article. The com-
mon denominator reported by each member of
the review team was the plant’s commitment
to a process of continuous improvement in all
areas of plant operations.
Excellence in plant operations is a pro-
cess, not an end state, although Plant of the
Year honors certainly represent a significant
milestone in the life of the plant (see side-
bar). The board noted three important areas
where the plant distinguishes itself among its
peers: environmental performance, plant op-
erations, and a culture of safety.
Rush Island Energy Center has successfully fired Powder River Basin (PRB) coal for two decades, as proven by the plant’s excellent performance stats, dedication to minimizing its environmental footprint, and sterling safety record. The PRB Coal Users’ Group top award recognizes the plant staff’s long-term dedication to continuously improving its safe handling and ef-ficient combustion of PRB coal.
Dr. Robert Peltier, PE
Courtesy: Rush Island Energy Center, Ameren Corp.

July 2016 | POWER www.powermag.com 53
PRB COAL
Environmental ExcellenceNOx emissions are managed by overfired air
and a Griffin neural net combustion optimiza-
tion system. The permit limit for NOx emis-
sions is 0.40 lb/MMBtu, although actual
average annual NOx emissions have remained
below 0.10 lb/MMBtu over the past decade,
without an SCR. For 2015, NOx emissions av-
eraged 0.081 lb/MMBtu. Particulates are cap-
tured with an electrostatic precipitator on each
unit (there is no baghouse).
The plant’s sulfur emissions rely on the
efficient burning of the ultra-low-sulfur PRB
compliance coal. Permitted SO2 emissions are
2.3 lb/MMBtu, although the plant’s average
annual emissions have tracked under 0.75 lb/
MMBtu for the past 20 years, dipping to be-
low 0.5 lb/million Btu in 2014 as combustion
systems were continuously optimized.
Mercury emissions are reduced by in-
jecting activated carbon upstream of the air
heaters and a mercury continuous emissions
monitoring system analyzes the stack gas.
The plant closely manages opacity exceed-
ances and had only 46 six-minute exceed-
ances in 2014.
The plant operates today with a capacity
factor over 80% and an equivalent availabil-
ity just short of 90%.
Impeccable Plant OperationsRIEC’s two units consume about 5.5 million
tons of PRB coal each year, which represents
about one 145-car unit train every day. Coal
is sourced from Peabody Energy’s North An-
telope Rochelle, Seam “C,” located in Wyo-
ming. A loop track around the storage area
reduces the coal train unloading cycle time.
The plant stores about 1.1 million tons
of coal on site (equivalent to about 60 to
65 days of consumption). Coal is deliv-
ered using pneumatically actuated bottom-
dump cars that drop coal onto feeders. An
“A-frame” structure supports a vibratory
shaker that, with an electric heater, is able
to remove sticky, wet, or frozen coal from
the rail cars. Dry roto-clone systems keep
the dust produced during the unloading pro-
cess well under control. A surfactant is also
sprayed on the coal during unloading for
dust control, when required.
The “A” side coal unloading system is con-
figured with below-grade dump hoppers out-
fitted with vibratory feeders that direct coal
onto conveyor belt systems that terminate at
the radial stacker-reclaimer centrally located
in the main coal storage pile (Figure 1). The
conveyor belt is protected with a fixed nozzle,
open spray deluge system monitored and trig-
gered by a thermistor wire. The coal bins are
located indoors, although the filter houses are
outdoors. Once coal is delivered to the pile,
three Caterpillar D10 dozers keep the coal
PRBCUG Recognizes Its 2016 Plant of the Year
The annual Powder River Basin Coal Users’
Group (PRBCUG) meeting was held in April in
conjunction with the 2016 ELECTRIC POWER
Conference & Exhibition in New Orleans, La.
This year the PRBCUG recognized the Rush
Island Energy Center as its Plant of the Year
for the plant’s innovation and implementa-
tion of “best practices and best available
technologies” for burning PRB coal. Plant
of the Year recipients are inducted into the
group’s Power Plant Hall of Fame.
Selections are made by the group’s
board of directors, with input from mem-
bers. PRBCUG membership comprises us-
ers of PRB coals as well as prospective
consumers (generating companies or
industrial energy consumers). Associate
members from companies supplying coal,
equipment, or services also participate in
the selection process. Visit www.prbcoals.
com for more information about the group
and its Plant of the Year selection process.
1. Black gold. The Rush Island Energy Center consumes about 5.5 million tons of very low
sulfur Powder River Basin coal each year. The coal pile holds about 1.1 million tons of fuel—
enough for 60 to 65 days of operation. Courtesy: Rush Island Energy Center

www.powermag.com POWER | July 201654
PRB COAL
storage area well-groomed. The reclaim sys-
tem collects coal from the pile and conveys it
to the transfer house, where magnetic metal
separation occurs. Coal is then conveyed to
the surge bin located on each unit, which, in
turn, sends coal to one of the six unit silos. The
“B” side system, which is virtually identical in
operation, provides redundancy.
The single coal supply incline from the
transfer house to the boiler island contains
two independent conveyor systems (Figure
2). The twin conveyors run through an engi-
neered opening in the stack’s shell structure,
through the stack, across the boiler house,
and to the tripper (cascade) floor and the coal
silos. The open conveyors are the cause of
minor combustible dust releases within the
building that are ably handled by the house-
keeping staff.
As part of the plant’s conversion to PRB
coal, conveyor side panels and under-convey-
or dribble and sluice pans were installed on
the two conveyors. The side panels prevent
coal particles from escaping into the boiler
house, and the dribble and sluice pans help
capture and direct washdown slurry to a con-
tainment area outside the boiler building.
Washing of these conveyors occurs every two
weeks, or more often, as needed.
A crew of 10 laborers are assigned house-
keeping duties for the fuel unloading and
delivery systems. The normal practice is to
wash down unloading areas of combustible
dust after each train is unloaded. Washdown
in the fuel unloading area relies on hoses.
Washdowns on the tripper deck with hoses
and a floor deluge system are conducted once
a week. Monthly housekeeping audits are
also performed by craft supervisors.
Fire protection water is supplied by three
pumps; two are electric drive and one is
driven by a diesel engine. Pumps are tested
weekly. The plant’s fire control panel is lo-
cated within the combined control room and
is monitored around the clock by the control
room operators.
Organized for SuccessRIEC employs 141 full-time employees. The
plant’s operations and maintenance (O&M)
staff is organized with five rotating opera-
tions teams, plus 45 maintenance craft work-
ers and 10 fuel operators. All plant operators
are also cross-trained in a maintenance skill
and spend approximately one-half of their
shift performing plant maintenance. Ameren
also has a traveling maintenance group of ap-
proximately 70 craft workers that augment
the plant maintenance staff during major
maintenance outages.
Boiler outages are scheduled every six
years and turbine outages every 12 years.
The plant’s annual O&M budget (less fuel)
is approximately $24 million, and the capital
budget is about $2.5 million, which doesn’t
include major capital projects.
The plant’s outstanding safety record is
demonstrated by just six lost work accidents
occurring over the past 10 years. An effective
safety culture begins at the top. Litzinger hosts
a monthly all-hands safety meeting that is also
video recorded for replay by shift workers.
Other important safety programs include:
■ The Plant Safety Steering Committee—
consisting of senior plant staff, a craft
representative, and a corporate safety
representative—meets monthly. The craft
safety representative is elected to serve in
that position by peers.
■ The plant safety director conducts a daily
safety tour of the plant, and all plant em-
ployees are trained to be vigilant in identi-
fying potential safety issues.
■ “Stop work” authority is delegated to all
employees when an unsafe condition is
observed.
■ Contractors must submit a safety plan for
approval prior to beginning work.
■ Of the 141 plant employees, 135 are emer-
gency response trained.
■ The plant has a 40-member fire brigade
for interior firefighting, and all employees
are trained in incipient firefighting.
Workers participate in a safety observation
program called Crew to Crew (C2C). C2C re-
quires workers to complete a job briefing and
hazard recognition form prior to the start of
each job. If hazards are identified, they must
be escalated to a supervisor for resolution.
C2C also requires daily supervisor visits to
every location in the plant where work is be-
ing performed. It is the supervisor’s respon-
sibility to talk with those doing the work and,
by using a prescribed check sheet, to identify
emerging safety issues that require immedi-
ate attention, develop modifications to exist-
ing job plans, and/or identify future training
needs.
Finally, IMPROVE, the plant’s work
management system, is used to capture rec-
ognized hazards and near misses. The feed-
back is then reviewed by the appropriate craft
supervisor and safety supervisor. The safety
supervisor is responsible for recording,
tracking, and disseminating all safety-related
issues to the plant director and to other Ame-
ren facilities.
Current Coal ChallengesRIEC has made many PRB coal-related im-
provements since converting the plant to burn
PRB coal 20 years ago. Prime examples are
the improvements made to its coal-handling
systems, such as explosion-proof electrical
system upgrades, installing semi-automatic
washdown systems, dust suppression system
additions, improved chute and skirt board
seals, and fire protection system upgrades.
The plant also installed passive and fixed
fire detection suppression systems through-
out the plant and on its fuel-handling sys-
tems. Flow-controlled transfer chutes were
installed so that the fuel-handling system
would efficiently handle the increased coal
flow. Upgrades were made to the plant’s bun-
kers, silos, and bins (silos) to reduce bridging
and rat-holing. Erratic flow through silos is
2. Stuck in the middle. The arrangement of the two-unit plant required the two main
fuel transfer conveyors to pass through the common plant stack and through the boiler house
to reach the fuel silos located on the opposite side of the boiler house. Courtesy: Bill Konefes,
PRBCUG

July 2016 | POWER www.powermag.com 55
PRB COAL
especially troublesome as PRB coal is more
prone to spontaneous combustion during
coal flow stoppages. Finally, coal conveyors
along with the support structures were retro-
fitted with automatic fixed sprinkler systems.
For 2016, the plant’s continuous improve-
ment program is focused on improving plant
operations in two important ways: reducing
boiler fouling and reducing fly ash dusting
originating at coal mill primary air ducts.
Reduce Furnace Fouling. Effective fur-
nace sootblowing is required in order to keep
the furnace tubes clean. Each unit uses 80
steam wallblowers and long retractable blow-
ers (recently increased from 18 to 66) for tube
wall cleaning, a mixture of Copes-Vulcan and
Clyde Bergemann designs. Three additional
long retractable sootblowers are currently
planned for installation on each unit. Steam is
the sootblowing medium of choice.
The Griffin intelligent combustion con-
trol system is also used for intelligent soot-
blowing (ISB). The ISB is principally used
to determine cleaning times and intervals,
although operators must occasionally manu-
ally run select blowers to manage steam
temperature control. Periodic load drops are
intermittently required for slag shedding,
particularly during summer months after a
long run at—or long periods of operation at
or near—full load. Online boiler washdowns
are scheduled about twice a year.
Routine maintenance of sootblowers was
problematic, so a few years ago RIEC set up
a dedicated sootblower maintenance shop.
Sootblower availability was greatly improved
as a result of having the dedicated mainte-
nance shop. On the day of the visit, Unit 1
had only three of 80 wall blowers out of ser-
vice, three more wall blowers were available
for local start only, and only one long retract-
able sootblower was out of service. On Unit
2, only three wallblowers were out of service.
Reduce Fly Ash Leaks. The plant main-
tenance staff has been fighting leaks in the
primary air ducts that cause fly ash to be
exhausted into the boiler house for the past
three years. The problem often overwhelms
the plant’s housekeeping staff because air-
borne fly ash tends to settle everywhere in
the boiler house, and the turbine deck often
receives a light dusting as well. Recent work
completed on Unit 1 is expected to signifi-
cantly reduce the dusting problem, and Unit
2 modifications will be completed during the
unit’s next major outage. Fly ash does not
have the fire hazard potential of PRB coal
dust, so the presence of fly ash is principally
a worker respiratory hazard concern.
More InformationCongratulations from the editorial staff of
POWER to the management and staff of
Ameren Missouri’s Rush Island Energy Cen-
ter for being chosen as the 2016 PRBCUG
Plant of the Year! For further information
on RIEC or the plant improvement projects
outlined in this article, please contact Plant
Director Mark Litzinger (314-992-9201 or
[email protected]). Additional infor-
mation on the PRBCUG and its awards pro-
gram is available at www.prbcoals.com. ■
—Dr. Robert Peltier, PE is POWER’s consulting editor. The members of the
PRBCUG board of directors that visited the
Rush Island Energy Center and contrib-uted to this report include Bill Konefes
(Georgia-Pacific and Chairman, PRBCUG); Andrew Dobrzanski (DTE Energy and
Vice Chairman-Genco); Jim Wiseman (Wiseman Consulting Services and Vice
Chairman-Industry); Erick Dieperink (Lumi-nant); James Rauba (FM Global); Jeff Kite
(Diamond Power International Inc.); and Greg Krieser (OPPD Omaha Public Power
District).
Careers in POWER job board and e-newsletter
POWER Store books and reference material
DecisionBriefs
POWER Buyers’ Guide print and website
POWER magazine digital and print
powermag.com
POWERnews e-newsletter
COAL POWER e-newsletter
GAS POWER e-newsletter
powermag.com
POWER covers the industry across
multiple channels:
POWER is the leading source for power
generation news, technology, and analysis
used by more than 65,000 plant managers,
engineers, technicians, and those who
support the power industry.
facebook.com/
POWERmagazine
@POWERmagazine
POWER Magazine and Women
in Power Generation groups
POWER magazine
25967

www.powermag.com POWER | July 201656
FUELS
The Coal Refuse Dilemma: Burning Coal for Environmental BenefitsThe niche alternative energy industry that generates power from hazardous
piles of coal waste that litter the U.S. is facing an environmental Catch-22.
Sonal Patel
The torrent of coal mined and processed
in the U.S. since the mid-1700s—
first sorted by the little, raw fingers
of “breaker boys” (Figure 1) and, later, by
machinery—has produced hundreds of mil-
lions of tons of coal “refuse” that was dis-
carded for its very low heat content. This
waste coal—also known as culm, gob, or
boney, and often mixed in with rock, shale,
slurry, slate, clay, and other materials—has
been randomly stockpiled high on thousands
of acres of abandoned mine lands (AML),
scattered across landscapes in coal country,
sometimes filling up entire valleys with dark
gray moonscape-like formations.
But over the years, the environmental im-
pact of these dumps has also crested. Refuse
mounds, toxic to plant life, are barren and
therefore highly erosive. Unstable coal re-
fuse piles can collapse, becoming potential
disasters. And bituminous piles, in particular,
can leach concentrated levels of acid mine
drainage. “The cost of reclaiming these piles
using conventional AML techniques is high,
and the extremely poor water quality is often
beyond the reach of current passive treatment
technology,” noted ARIPPA, a trade organi-
zation that started as the Anthracite Region
Independent Power Producers Association
but that has since adopted its acronymic
name, along with a broader mission to pro-
duce power from all varieties of the nation’s
coal refuse.
In Pennsylvania alone, where coal min-
ers have extracted about 16.3 billion short
tons of anthracite and bituminous coal
since commercial mining began in 1800,
the state is scarred by more than 5,000
abandoned, unreclaimed mining areas that
cover 184,00 acres. Coal refuse piles at
these mines undulate over an aggregate
area of 8,500 acres and contain a total vol-
ume of more than 200 million cubic yards.
And that’s a conservative estimate: AR-
IPPA guesses the amount of coal refuse in
the state is actually about 2 billion cubic
yards, split equally between the anthracite
and bituminous coal regions. The Pennsyl-
vania Bureau of Abandoned Mine Recla-
mation (PBAMR), meanwhile, estimates
that a complete cleanup of AML sites will
cost about $16.1 billion.
Then, there’s the ever-present, exorbitant
risk of fire. In 2014, PBAMR paid (using
emergency funds in a trust partially funded
by the coal industry via fees paid per ton of
mined coal) Pennsylvania firm Minichi Inc.
$2.2 million to snuff out a stubborn blaze at
the 100-foot-high, 4-acre bank of the Simp-
son Northeast coal refuse pile. The fire,
which started out smoldering and ignited into
flames at the periphery of a vastly larger coal
refuse area, took nearly six months to extin-
guish, requiring material excavation, mil-
lions of gallons of water, and thousands of
gallons of firefighting foam (Figure 2).
That’s just one example. At least 40 other
coal refuse piles—not including underground
mine fires—are currently burning just in
Pennsylvania and will need to be addressed
at some point, the state agency says.
There’s not much the commonwealth can
do, beyond reclamation—which is a com-
plicated task that requires addressing water
pollution from run-off and acid mine drain-
age discharges, site stabilization, covering
the pile with soil, and planting vegetation. In
1968, Pennsylvania became the first state to
pass a law to address air pollution associated
with coal refuse disposal.
On a federal level, it’s a similar struggle,
ARIPPA noted. “Laws were enacted in the
late 1970s that now require coal mining com-
panies to reclaim the sites that they currently
mine. But by the time these laws were en-
acted, a billion tons of coal refuse had been
stockpiled, thousands of mine sites were
abandoned—and the former legally respon-
sible parties had vanished,” it explained.
From Refuse to ResourceThat’s why, ARIPPA says, its solution to use
coal refuse as fuel at power plants sited near
piles across the nation is indispensable.
1. Breaker boys. This photo from 1911 captures a view of the Ewen Breaker of the Pa. Coal
Co., where boys—most aged eight to 12—spent 10 hours a day, six days a week, breaking and
sorting coal, and picking out slate and other impurities, which were then dumped in coal refuse
piles. The record notes that the “dust was so dense at times as to obscure the view.” Source:
National Archives and Records Administration

July 2016 | POWER www.powermag.com 57
FUELS
In its simplest sense, the process entails re-mining coal refuse piles
in accordance with surface mining regulations, and then processing
that material at the mine site by screening to remove rock and other
inert materials. The finer material—typically 75% or more of the coal
refuse—is used as fuel in a fluidized bed combustion boiler or circu-
lating fluidized bed (CFB) boiler. Combustion ash from the boiler—
which meets beneficial use criteria—is then returned to the mine site
and mixed with unusable coal refuse material as a way of neutralizing
any remaining acidic materials. The materials are then compacted in
place to contours as described in the surface mining permit. “As such
the concentration of the acidity as well as the metals such as iron,
aluminum, and manganese in surface and groundwater releases are
significantly reduced,” says ARIPPA.
The coal refuse–to-power solution was conceived in the aftermath
of the oil embargo of the 1970s. Just as Congress was preparing to
vote for the Public Utility Regulatory Policies Act (PURPA) in 1978,
CFB technology was being developed and showing a capability to
convert low–heating value carbonaceous material (such as coal re-
fuse) into energy.
The first CFB plant designed to convert large quantities of coal
refuse into power—the 30-MW Westwood Generating Station in
Schuylkill County, Pa.—came online in 1987. Eighteen more proj-
ects have since been grid-connected, 13 in Pennsylvania alone (Fig-
ure 3); two are in West Virginia, one in Montana, one in Utah, and
one in Illinois.
The plants are owned by a diverse mix of companies, including
NRG Energy, Exelon, Olympus Power, Babcock & Wilcox Co., Fos-
ter Wheeler, Northern Star Generation, Pacific Gas and Electric, Kim-
berly Clark, Cogentrix Energy, Olympus Power, Schuylkill Energy
Resources, Waste Management, Southern Illinois Power Cooperative,
and Colstrip Energy. Most power produced is sold in the PJM whole-
sale and capacity markets. Today, these plants—with a total capacity
of 1,767 MW (see http://www.powermag.com/plants-that-turn-coal-
refuse-to-power/ for a slideshow of the plants)—have removed a
purported 214 million tons of coal refuse from the environment at no
expense to taxpayers.
But the sector that has been the darling of most coal-producing
states—and lauded even by the Environmental Protection Agency
(EPA)—for its potential to eradicate coal refuse piles and reclaim
thousands of disfigured acres is facing new, debilitating challenges.
Lucrative power purchase agreements signed under PURPA are
beginning to expire, forcing plants to compete in the open market.
Then, as Vincent Brisini, director of environmental affairs at Olympus
Power, recently told congressional lawmakers, because coal refuse
piles close to existing coal refuse plants have been successfully re-
moved, generators must source coal refuse from piles at ever-greater
distances, which has added to transportation costs. And, as with con-
ventional coal plants, the economics of existing coal refuse plants
have suffered in the advent of “abnormally low natural gas prices,”
and a “sluggish economy [that is] stifling electricity demand,” the
trade group told POWER.
An Environmental MuddleLately, that economic burden has gotten even heavier owing to “fed-
eral regulatory policies that dramatically and unnecessarily increase
environmental compliance costs,” ARIPPA said.
For the coal refuse generation sector, air pollution in particular poses
an environmental Catch-22 with no resolution in sight. The EPA em-
phasized, when questioned by POWER in May, that coal refuse piles
are a marked environmental worry for their acid seepage and leach-
ate production, spontaneous combustion, and low soil fertility. It also
acknowledged that “[u]nits that burn coal refuse provide multimedia
environmental benefits by combining the production of energy with
the removal of coal refuse piles and by reclaiming land for productive
use.” However, the agency underscored, they are still coal-fired power
plants. They still emit hazardous air pollutants that the agency has de-
termined are “significant” public health disadvantages.
Critics of the niche industry, like the Pennsylvania arm of the En-
ergy Justice Network project, contend that coal refuse plants aren’t
just inefficient, they also are far more polluting than new coal plants.
“The large new waste coal burning power plants planned for western
2. The long inferno. Crews spent six months dousing open
flames at the Simpson Northeast coal refuse fire near Fell Township,
Lackawanna County, Pa., in 2014. Temperatures fell into the single dig-
its for almost a month while crews worked. Source: Office of Surface
Mining Reclamation and Enforcement/Department of Interior
WE MANUFACTURE • WE INSTALL
WE SAVE YOU MONEY
Hybrid Buildings Foundation SolutionsFabric Structures
ClearSpan.com/ADPO1.866.643.1010
BUILDINGS OF 1,000 USES
ZERO PERCENT FINANCING AVAILABLERESTRICTIONS
MAY APPLY
CIRCLE 17 ON READER SERVICE CARD

www.powermag.com POWER | July 201658
FUELS
[Pennsylvania] were granted permits in 2005
to release higher levels of [sulfur dioxide
(SO2) and nitrogen oxides (NOx)] and other
air pollutants than the normal pulverized coal
power plant proposed near Morgantown,
W.Va.,” the group pointed out. Also, “If 100
tons of waste coal are burned, 85 tons will
remain as waste coal ash,” it said.
A better solution to the coal refuse problem
would be to plant beach grass, which it says,
citing research from the Natural Resources
Conservation Service, “has been shown to
bring life back to long-dead waste coal piles for
only 6-10% of the cost of conventional meth-
ods. Within a few years, beach grass enabled
native plants to take over, allowing organic
matter to accumulate around plants, forming
a plant layer that stopped erosion, held water,
cooled the surface, and looked better.”
ARIPPA contests the air pollution charge,
saying its members take precautions to con-
trol emissions of SO2, NOx, air toxics, filter-
able particulate matter, and total particulate
matter. Coal refuse power plants use CFB
boilers, which use limestone injection for
acid gas control, and they are also equipped
with fabric filter systems to control filterable
particulate matter emissions, it explained.
The nation’s coal refuse plants are also the
lowest emitters of mercury of all coal genera-
tion facilities, even though coal refuse may
be higher in mercury content, ARIPPA said,
noting that multiple coal-refuse units were
included in the EPA’s Maximum Achievable
Control Technology (MACT) floor calcula-
tions (top 12% performing units) used to
establish the emission standards for mercury
and non-mercury metals as outlined in its
Mercury and Air Toxics Standards (MATS).
Meanwhile, the emissions of greenhouse
gases (GHGs) from these units can be con-
sidered as offset due to the eventual in-place
burning of coal refuse piles, ARIPPA said.
“Coal refuse fires also result in the uncon-
trolled release of the same pollutants that
these plants control with high removal rates.
Because these units provide electricity to the
grid they also reduce emissions from other
fossil fuel–fired [electric generating units
(EGUs)] which otherwise would be operat-
ing. The reclamation and re-vegetation of
coal refuse sites also results in the expansion
of green spaces which aids in the sequestra-
tion of GHGs,” it said.
The EPA told POWER that it has con-
sidered and requested comment on separate
emission standards for coal refuse generators
for various proposals. “In fact, EPA has es-
tablished subcategory SO2 and NOx emission
standards for new, modified and reconstruct-
ed coal refuse-fired EGUs,” it said.
However, in the final MATS rule, the EPA
noted that the waste coal hazardous air pol-
lutant emissions are not sufficiently different
from other coal-fired generators to warrant
further subcategorization. “There are EGUs
firing bituminous, subbituminous, and coal
refuse among the top performing units for
mercury emissions. EGUs firing bituminous,
subbituminous, lignite, and coal refuse are
also all among the top performers for the acid
gas and non-mercury metallic emissions.
This indicates that the MACT floor limits es-
tablished based on these units are achievable
by units burning all ranks of coal,” it said.
This approach, the EPA noted, was upheld
by the D.C. Circuit’s April 2014 decision in
White Stallion v. EPA. The court, in that case,
said that the “EPA reasonably decided that
separate standards for coal-refuse-fired CFBs
were not warranted.”
Looking to Congress for a ResolutionUnderscoring its message that “one regula-
tion does not fit all plants the same,” the in-
dustry has continued its fight to keep afloat
amid the deluge of environmental rules tar-
geting coal plants. Its cause has now been
taken up in Congress.
Rep. Keith Rothfus (R-Pa.) last Octo-
ber introduced the Satisfying Energy Needs
and Saving the Environment (SENSE) Act,
legislation that would modify the EPA’s
Cross-State Air Pollution Rule (CSAPR) by
allocating additional SO2 allowances for coal
refuse generators (but reducing allowances
elsewhere so the overall program cap does
not change). The bill also creates an alter-
native means of demonstrating compliance
with the hydrochloric acid (HCl) standard
under MATS by assuming that a 93% reduc-
tion in SO2 demonstrates compliance with
the HCl standard.
But the Obama administration has threat-
ened to veto the bill, raising concerns that
it chooses “winners and losers” because it
favors coal refuse generators over other fa-
cilities. At a House Subcommittee on Energy
and Power hearing on the bill this February,
speaking on ARIPPA’s behalf, Brisini refuted
that argument, underscoring that coal variet-
ies have unique characteristics.
Anthracite refuse plants can meet the
CSAPR alternative 2.0 standard because sul-
fur content in coal refuse from the anthracite
region is lower, but bituminous plants cannot,
he said. “It is not because the technology is
different or they have anything special and it is
part of the problem when you lump all of these
things together not recognizing the [technical
differences] in these kinds of fuels.” Mean-
while, he noted, only two bituminous coal
refuse plants can meet the HCl requirements
under MATS. “No other plants, whether they
are bituminous coal refuse [or] anthracite coal
refuse, they don’t do it,” he said.
The bill continues its course through Con-
gress and is currently under consideration by
the Senate. Brisini remains hopeful that the
acid gas issue is resolved by the SENSE Act
or other regulatory amendments.
If all fails, “the measures that would have
to be taken by bituminous coal refuse–fired
electric generating units to allow them to
meet the acid gas limit would likely prevent
them from successfully participating in the
PJM wholesale electric market, with the ex-
ception of the last coal refuse fired facility
built,” he noted. ■
—Sonal Patel is a POWER associate editor.
3. Plying the pile. The 102-MW Colver Power Project in Cambria County—a bituminous
coal mining region in western Pennsylvania—began operations in May 1995. The plant, owned
by independent power producer Inter-Power/AhlCon Partners, is equipped with a large circulat-
ing fluidized bed boiler. It is one of the state’s newest bituminous coal refuse power plants.
Courtesy: ARIPPA

July 2016 | POWER www.powermag.com 59
FUELS
Energy from Waste: Greenhouse Gas Winner or Pollution Loser?Is waste-to-energy the best greenhouse gas fighter among electric generating
technologies? Or do trash burners spew dangerous air emissions? The answer may be a surprise.
Kennedy Maize
What electricity-generating technol-
ogy results in net greenhouse gas
(GHG) reductions, not just zero
new emissions? According to the U.S. Envi-
ronmental Protection Agency (EPA), it’s not
nuclear, not wind, not solar.
Give up? Waste-to-energy (WTE, known
to some as “trash-to-cash”), according to the
EPA and a recent analysis by the Depart-
ment of Energy’s National Renewable En-
ergy Laboratory (NREL) is the only electric
generating technology that actually reduces
GHG emissions as it makes power. Mega-
watts up; GHGs down.
According to the EPA, municipal solid
waste (MSW) burners, using trash and gar-
bage to generate electricity, separating out
recyclable materials, will “actually reduce
the amount of [GHG emissions] in the atmo-
sphere compared to landfilling. The savings
are estimated to be about 1.0 tons of GHGs
saved per ton of MSW combusted.”
The EPA bases its calculations on methane
emissions from landfills. Methane is a much
more potent GHG than carbon dioxide (CO2)
in the short term (although methane spends
less time than CO2 in the atmosphere). Burn-
ing the trash that produces methane in land-
fills reduces overall GHGs.
A 2011 NREL analysis looked at lifecycle
GHG emissions from electricity generat-
ing technologies. It found that wind has very
small lifecycle emissions, with nuclear a bit
above those, followed by solar. While all of
the conventional low-carbon technologies were
slightly positive in terms of GHG emissions in
lifecycle terms (the energy that went into mak-
ing and erecting the technologies as well as
emissions from operations), energy from waste
was the only option that reduced GHGs. WTE
projects prevent landfill methane emissions,
according to NREL; the other renewable tech-
nologies simply avoid new emissions.
Clean Power Plan Would Support WTEA little-noticed element of the EPA’s Clean
Power Plan, generally seen as a way to back
out coal-fired power and boost conventional
renewables such as wind and solar, reflects
this analysis of the ability of WTE to yield
net negative GHG emissions. Paul Gillman,
senior vice president and chief sustainability
officer at Covanta, a leading waste manage-
ment company in the U.S., told POWER that
the EPA’s Clean Power Plan tells states they
can consider energy from waste “as a mitiga-
tion tool” to meet requirements under the new
regulations.
Covanta, with 43 WTE plants (41 in North
America and two in Europe), is now pitching
GHG reductions as among the reasons to em-
ploy the technology. It turns MSW into a stream
of saleable recycled commodities—such as
aluminum, copper, and plastics—along with
electricity and process steam that can be sold to
industrial users or district heating systems. All
this while reducing landfill methane. Gillman
notes that Europe and Asia, which signed on to
the 1997 Kyoto Protocol—which the U.S. re-
jected and which is now a dead letter—spurred
WTE for GHG reductions.
International Support for WTE
European nations that signed on to the Kyoto
agreement saw WTE as a way to reduce meth-
ane-generating landfills while increasing re-
cycling and energy production. “In Germany,”
Gillman said, “less than 1% of waste goes to
landfills.” Denmark has banned landfills, turn-
ing entirely to recycling and WTE for manag-
ing its waste stream (Figure 1).
Compared to the U.S., European countries
have greater population densities and less
territory available for landfills. They often
have government-owned waste management
agencies, which can streamline development
of landfill alternatives. In Denmark, for ex-
ample, WTE plants are owned by municipali-
ties or multiple-municipal agencies.
In Asia, particularly China, noted Gill-
man, the Kyoto Protocol mechanisms cre-
ated an economic incentive to reduce GHGs
in order to generate reduction credits saleable
to the European Union countries. According
to Gillman, more than 300 WTE projects are
now operating in China, and more than 100
are under construction (see sidebar “World’s
Largest Waste-to-Energy Plant”). China, he
1. Not just blowin’ smoke. The Amager Resource Center waste-to-energy plant is
under construction in Denmark, which has banned landfills. The plant has gained notoriety for
integrating an artificial ski slope on the roof and a stack that will blow a water vapor “smoke
ring” each time 250 kilograms of carbon dioxide are released. Courtesy: Bjarke Ingels Group

www.powermag.com POWER | July 201660
FUELS
said, has about the same land mass as the
U.S. but four times the population—a strong
incentive against landfills and for WTE.
In the U.S., land for waste disposal is
cheap and plentiful. WTE plants compete
with landfills for the trash disposal dollar.
According to the Energy Recovery Council,
the industry’s Washington-based lobbying
group, the U.S. has 84 WTE plants (four are
idled but able to come into service), with
about 2,800 MW of baseload electricity gen-
erating capacity. The two dominant WTE
companies are publicly traded Covanta,
based in Morristown, N.J., with more than
40 plants, and privately owned Wheelabra-
tor Technologies, located in Hampton, N.H.,
with 16 U.S. plants.
The first new WTE project in the U.S. in
20 years went into commercial operation in
July 2015, in West Palm Beach, Fla., owned
by the Palm Beach County Solid Waste Au-
thority. The 95-MW facility joined an exist-
ing 20-year-old waste combustion and energy
unit. A consortium of Babcock & Wilcox and
KBR designed and built the new plant.
Covanta commissioned the most recent
plant in North America in January this year
in the Canadian province of Ontario, the
Durham York project (Figure 3), which burns
436 metric tons of MSW per day to produce
15.7 MW of baseload power.
Wheelabrator’s latest project is the Fer-
rybridge “multifuel” project in North York-
shire in the UK, a 68-MW generator burning
MSW, industrial waste, and wood waste,
co-located with an existing and retiring coal-
fired power plant.
Challenging U.S. Economics for WTE Why is the U.S. slow in turning waste into en-
ergy? It’s a matter of market competition, said
Ted Michaels, head of the Energy Recovery
Council. He told POWER, “Our industry is
strong, the facilities operate well; it’s a ma-
ture, not nascent, industry. But the industry is
operating in difficult economic conditions.”
WTE businesses in the U.S. face a triple eco-
nomic whammy, according to Michaels. First,
the chief economic driver of WTE is waste, not
energy. The facilities compete against landfills.
Landfills charge a tipping fee for waste deliv-
ered to their facilities. That becomes the price
WTE plants must meet to divert waste from the
landfill to the energy project.
“Power is a secondary function of the eco-
nomics of a waste-to-energy plant,” Michaels
said. “Our largest market is waste manage-
ment. That’s entirely different than wind
turbines, or biomass.” Michaels noted that in
the U.S., “Landfills remain cheap. That’s our
primary source of competition.”
To attract trash (aka fuel), a U.S. WTE
project must offer a lower tipping fee than a
landfill. The waste incinerators use offsetting
revenues from recycling and electric genera-
tion (and industrial steam in some cases) to
support their bids for the waste stream. Of
late, commodity prices for materials such
as metals, paper, and plastic have been his-
torically low, undermining the ability of the
recycling portion of the facility to compete
against landfills.
The crash in commodities prices has been
devastating to recyclers and WTE generators
across the board. The Washington Post noted
last year, “In short, the business of American
recycling has stalled. And industry leaders
warn that the situation is worse than it ap-
pears.” Waste Management, the nation’s larg-
est recycler, called it a “nationwide crisis.”
World’s Largest Waste-to-Energy Plant
China has picked two Danish architectural
firms—Schmidt Hammer Lassen Architects
and Gottlieb Paludan Architects—to de-
sign the world’s largest waste-to-energy
(WTE) plant for the city of Shenzhen. The
project would burn some 5,000 tons of
municipal solid waste per day—about a
third of the waste generated by the city of
20 million, reports Deezen.com, a website
covering architecture and design news.
Last December, a Shenzhen construc-
tion-waste dump collapsed, killing what
press accounts said were “dozens of peo-
ple.” Plans for the new WTE plant quickly
followed.
According to the architects’ website,
the circular facility a mile in diameter will
“boast a 66,000-square meter roof, two
thirds of which will be covered with solar
photovoltaic panels, allowing the building
to generate its own sustainable supply of
energy.” The circular structure of the plant
(Figure 2) will include a ramp that snakes
from the ground to the roof, along with a
rooftop visitors center.
The Deezem article quotes Chris Hardie,
head of the Schmidt Hammer Lassen of-
fice in Shanghai, as saying, “The project
firstly aims to provide a clean, simple and
modern technical facility to deal with the
city’s growing waste. At the same time it
aims to educate visitors to this growing
waste challenge by taking them on an
elevated walkway tour of the plant that
ends with a 1.5 kilometer panoramic view
of both the surrounding mountains and
the 66,000-square-meter roofscape that
will be geared to producing actual renew-
able energy.”
The companies’ descriptions and the
press accounts do not indicate how much
electric capacity the project will provide
or what the project will cost, typical of
announcements out of China on develop-
ing energy projects. The project is sched-
uled to be operational in 2020, according
to press reports.
2. Full circle. This design for a waste-
to-energy facility in Shenzhen, China, in-
cludes a rooftop visitors center. Courtesy:
Schmidt Hammer Lassen
3. Clean lines. Ontario’s Durham York 15.7-MW waste-to-energy plant burns 436 metric
tons of municipal solid waste daily. Courtesy: Covanta

July 2016 | POWER www.powermag.com 61
FUELS
The company, based in Houston, said its re-
cycling division posted a $16 million loss in
the first quarter of 2015, and it has shut 10 of
its largest recycling facilities. The Washing-
ton Post article concluded, “A storm of fall-
ing oil prices, a strong dollar and a weakened
economy in China have sent prices for Amer-
ican recyclables plummeting wordwide.”
On top of that, low natural gas prices have
driven down the wholesale price generators
of electric power can reap in competitive
markets. “Natural gas is a big driver of waste-
to-energy economics, lowering the price for
wholesale power,” Michaels said. The global
economic crash of 2008 also slowed the econ-
omy, drove down electricity demand, and cut
into the price of recycled commodities.
The Environmental DebateEnvironmental opposition also burdens WTE
plants. Fervent opponents of the projects assert
that incinerating waste produces dangerous
levels of airborne pollutants such as dioxins
and heavy metals, and that the resulting ash is
hazardous. In Minnesota, three local groups—
the Sierra Club, the Minnesota Public Interest
Research Group, and Neighborhoods Organiz-
ing for Change—are trying to shut down the
Hennepin Energy Recovery Center in Min-
neapolis, claiming it harms the environment,
according to the Waste Dive online newsletter.
The Minnesota Public Utilities Commission
continues to back the project. The state has
nine WTE plants, the most in the region.
Claims about harms from waste incinera-
tion and energy recovery are based on out-
dated data, according to the industry and
government regulators. The EPA has given
both air emissions and ash toxicity a green
light. In addition to reducing landfill methane
emissions, proponents claim, WTE projects
reduce CO2 emissions by shipping waste to
incinerators by rail, a less–energy intensive
and less–transportation intrusive approach
than trucks hauling trash to landfills.
Maryland Rejects New Baltimore Waste-to-Energy Plant
Maryland has traditionally been friendly toward turning trash into
electricity, and the Northeast Maryland Waste Disposal Authority,
a quasi-governmental group aimed at helping Maryland communi-
ties meet their waste disposal needs, has long been an advocate
of waste-to-energy (WTE) projects.
Cars driving into Baltimore from I-95 and the Baltimore-
Washington Parkway for over 30 years have seen a large stack,
originally bearing the letters “BRESCO” down its side and, more
recently, “BALTIMORE” (Figure 4). That’s the exhaust stack for a
large WTE plant, commissioned in 1985, now operated by Wheela-
brator Technologies, and long a target of environmental activists
for alleged air pollution problems. The project has survived mul-
tiple environmental reviews over three decades.
A small WTE project in Harford County, north of Baltimore near
the Department of Defense’s (DOD’s) Aberdeen Proving Ground,
closed down last March when its lease with the DOD expired and
the Pentagon chose not to renew it. The plant began operations
in 1988 and attracted little local notice.
At about the same time as the Harford County plant’s lease ex-
pired, a proposal for another large Baltimore WTE project, years in
the works, collapsed. The Baltimore Sun reported that the Maryland
Department of the Environment told developer Energy Answers In-
ternational of Albany, N.Y., that a 2010 permit for a project in south
Baltimore’s Curtis Bay neighborhood was no longer valid.
The project would have been the largest in the U.S., converting
some 4,000 tons of solid waste per day into 160 MW of baseload ca-
pacity. The project drew opposition from local activists, who claimed
that the plant would harm schools and parks in the neighborhood,
as well as homes in the area. Opponents said the project would be
a prodigious producer of oxides of nitrogen and particulate pollu-
tion, although the plant would have met all federal Environmental
Protection Agency NOx and particulate emissions standards.
Baltimore activist Destiny Watford last April won a $175,000
“Goldman Environmental Prize” for organizing community opposi-
tion to the WTE project, along with kudos from New York Times en-
vironment blogger Andy Revkin. The citation read, “Curtis Bay is
a highly industrialized community in south Baltimore with a his-
tory of displacing people to make room for oil refineries, chemical
plants, sewage treatment plants, and other facilities that emit
pollution. Those left to live within breathing distance of industry
have long suffered from respiratory problems such as asthma and
lung cancer. In fact, a 2013 study on emissions-related mortality
rates found Baltimore to be the deadliest city, with 130 out of
every 100,000 residents likely to die each year from long-term
exposure to air pollution.”
Ted Michaels of the Energy Recovery Council had a different
take on the events in Baltimore. He told POWER that cancellation
of the 2010 state license for the Curtis Bay project came because
the developer hadn’t lived up to the terms of the permit. “Mary-
land withdrew the permit because not enough construction activ-
ity had occurred. The terms of the permit had been violated,” he
said. The Baltimore Sun reported that state environmental regula-
tors concluded that the developers of the project had not met the
permit requirements for “continuous construction.”
Are activists’ objections to mass-burn technologies technically
valid? In the online news site Huffington Post, science writer
Shawn Lawrence Otto wrote, “Today’s waste-to-energy (WTE)
plants are not your granddaddy’s trash burners. . . . Some lib-
eral groups, like the Center for American Progress, are starting to
look at the actual science and reevaluating long-held assumptions
in light of new information and increasing concern over climate
change. When they do, they are finding that today’s waste-to-
energy plants look surprisingly good for the environment and for
fighting climate change.”
4. Trash power plant target of trash talk. This Mary-
land waste-to-energy plant has been the target of environmental-
ists’ claims that it causes pollution, though it has survived three
decades of environmental reviews. Courtesy: Wheelabrator

www.powermag.com POWER | July 201662
FUELS
Nevertheless, opponents of waste-burning
projects repeatedly raise pollution issues, such
as the claims of the Global Alliance for Incin-
erator Alternatives (see sidebar “Maryland Re-
jects New Baltimore Waste-to-Energy Plant”).
Changing Fate for U.S. WTEIn the U.S., the 1978 Public Utility Regula-
tory Policies Act (PURPA) boosted the WTE
sector because it encouraged non-utility and
unconventional electric generating technolo-
gies. The act also gave birth to today’s inde-
pendent power sector, largely powered by
natural gas.
The 1978 law galvanized WTE projects,
which were able to meet the Federal En-
ergy Regulatory Commission’s criterion for
“qualifying facilities,” giving them access to
subsidized rates. Many of the WTE projects
in the U.S. started up in the 1980s and early
1990s as a result of PURPA’s push for alter-
natives to conventional generation.
Since then, a combination of factors, in-
cluding low-cost coal plants, low prices for
natural gas, and a decline in demand for elec-
tricity slowed the WTE business. The col-
lapse of the U.S. (and worldwide) economy
in 2008, along with the unexpected devel-
opment of fracking technologies to produce
soaring natural gas production, reducing
U.S. natural gas prices, put another burden
on WTE economics.
A classic example occurred in Frederick
County, Md., a neighbor to Montgomery
County (home of pricey Washington, D.C.,
suburbs and a 1985-built 52-MW Covanta
WTE plant burning 1,800 tons per day of
trash, sitting next door to an elderly 850-MW
coal-fired plant). Maryland in the 1980s ad-
opted a policy of no new landfills in the state,
which meant either local incineration or ship-
ping waste out of state. Maryland joined a
growing list of states banning local landfills.
Connecticut, Covanta’s Gillman noted, “has
no operating landfills.”
Fast-growing Frederick County, home of
the second-largest city in the state after Bal-
timore, saw its decades-old landfill reaching
capacity. The county signed a $471 million
contract with Wheelabrator in 2008 to build
a WTE incinerator, shared with nearby Car-
roll County. The project got the needed state
permits in 2012.
By that time, the project had become politi-
cally controversial. In 2014, an opponent of the
project won election as Frederick County ex-
ecutive. She vowed to kill the deal. The county
commissioners scrapped the project, instead,
signing a contract to haul the county’s solid
waste to an out-of-state landfill for five years.
New Reasons to Consider WTEWhat’s the future for waste-to-energy in
the U.S.? It’s uncertain. WTE lobbyist Mi-
chaels notes that “31 states, the District
of Columbia, and two territories have de-
fined waste-to-energy as renewable energy
in various state statutes and regulations,
including renewable portfolio standards.”
Twenty-two states specifically classify
WTE as meeting the requirements of their
renewable goals. Michaels argues that the
drive for GHG reductions will yield oppor-
tunities for waste projects.
Covanta’s Gillman says businesses may
push the U.S. toward more use of WTE.
“Lots of businesses have been issuing sus-
tainability goals,” he said, “and they see
improvements to the bottom line. Energy
conservation has been the first tier, then on-
site production and water resource manage-
ment. Now they’re moving in the direction
of making waste management more sustain-
able. ‘We want to reduce our greenhouse
gas footprint,’ the executives are saying.
‘Let’s look to waste.’ ”
Some businesses are also seeing waste
incinerators as a source of low-cost process
steam, which is common in Europe. These
projects, says Gillman, “are a very reliable
source of steam,” with the plants operating
in continuous baseload mode. “Industries are
attracted to that reliability,” said Covanta pu-
bic information official James Regan.
In the U.S., the sector’s future may lie in
rebutting and overcoming the conventional,
anti-pollution mantra of local opponents to
waste incineration. The liberal and environ-
mentally oriented Center for America Prog-
ress (CAP) made its case for WTE recently:
“It is environmentally unsustainable to take
garbage and bury it in the ground at land-
fills, where it decomposes and releases po-
tent greenhouse-gas pollution. What’s more,
some trash has to be transported by diesel
trucks or trains to landfills several hundred
miles away, further exacerbating its pollution
footprint. Though garbage is not something
we tend to actively think about on a daily
basis, specifically as it relates to climate
change, the United States must begin de-
veloping policies to limit the environmental
consequences that result from our generation
of garbage.”
The path to that policy, says CAP: “The
United States must begin developing national
policies to deal with the waste-management
problem our country faces every day. Do-
ing so will ultimately reduce emissions that
cause climate change.” ■
—Kennedy Maize is a long-time energy journalist and frequent contributor to
POWER.T R A I N I N G • F I E L D S U P P O R T • T E C H N I C A L E X P E R T I S E
1 800 552 1999
appliedbolting.com
• No Feeler Gage Required
• Weatherproof
• Self-Marking
• Inspection on Your
Schedule
DuraSquirt®® DTIs
the best way to bolt!
4 Times Faster than Turn-of-NutCall for EPC Testimonial
CIRCLE 18 ON READER SERVICE CARD

www.powermag.com POWER | July 201663
FUELS
Understanding and Mitigating Metallurgical Effects of Coal Blending and SwitchingFuel blending and switching has become the norm in response to regulatory
and market forces, but many older boilers were designed for a particular fuel. Understanding the effects of different fuels on combustion system metals is crucial for ensuring smooth operations.
Rama S. Koripelli, PhD
Is there a clear distinction between good
and bad fuel to burn in a particular boiler?
Apparently not! Some fuels may contain
higher heating values, but they may also
possess characteristics that cause emissions
problems, as well as operational and reliabil-
ity challenges. Other fuels may be more envi-
ronmentally friendly, but may contain higher
moisture content and lower heating values.
Ideally, the “right fuel” is that for which a
boiler is designed or retrofitted to specifi-
cally burn.
Congress extensively amended the Clean
Air Act in 1990. Following those changes, the
Environmental Protection Agency began im-
posing more stringent emissions regulations
in the mid-1990s, which led to fuel blend-
ing and switching becoming the norm. Of
course, there are other factors—such as cost,
availability of mines, and meeting full-load
requirements in a dynamic environment—
that have also influenced fuel blending or
switching decisions.
Pros and Cons of PRB CoalThe use of Powder River Basin (PRB) coal,
whether as a blend or a switch, has tremen-
dously increased in response to economic
and regulatory changes. PRB coal gained
a tremendous amount of interest for its
abundant availability, as well as its lower
sulfur content, which results in lower SOx
emissions.
PRB coal has higher moisture content
than other coals due to its porous structure.
For that reason, PRB coal offers a lower heat-
ing value (around 8,000 Btu/lb) compared to
high-sulfur bituminous coals (about 13,000
Btu/lb). Even so, PRB coal often has eco-
nomic advantages over the latter.
There can also be significant fuel flex-
ibility advantages when blending coal. The
low-sulfur characteristics of PRB coal and its
relatively low cost make it attractive for the
power industry.
Some other major differences between
PRB and bituminous coals are found in con-
centrations of ash, calcium oxide, and mag-
nesium oxide. The concentrations of these
oxides in PRB coal are much higher than in
bituminous coals, which affects the ash melt-
ing temperature and radiant heat absorption
capacity in the furnace area. Reduced radiant
heat absorption capacity in the furnace area
is a product of higher reflectivity or lower
emissivity of the deposit. This reduced heat
transfer capacity in the furnace impairs the
thermal efficiency by raising the furnace exit
gas temperature (FEGT).
Slagging and Fouling ProblemsSlagging and fouling may be elevated in
high-temperature superheater or reheater cir-
cuits due to a combination of staged combus-
tion and higher FEGT (Figure 1). Low-NOx
burners and overfire air can further exacer-
bate this situation.
The reducing conditions formed during
staged combustion promote the formation
of hydrogen sulfides and porous metallic
sulfides on the pressure parts of the boiler
or furnace. These sulfide scales are more
porous and less protective than oxides. Re-
ducing conditions also promote carburiza-
tion of T91 (Figure 2) and stainless steel,
resulting in a loss of corrosion and oxida-
tion resistance.
Although PRB coal contains lower ash
content, it requires higher throughput to
meet full-load conditions. Therefore, ero-
sion problems may be exacerbated because
1. Bridging the gap. Secondary combustion contributes to high furnace exit gas temper-
atures, resulting in slagging and fouling in high-temperature circuits. Courtesy: David N. French
Metallurgists

July 2016 | POWER www.powermag.com 64
FUELS
of these lower heating values when switching
from high-ranked coals. Higher FEGTs due
to a combination of reduced emissivity and
delayed combustion significantly affect the
finite life of dissimilar-metal welds (DMWs,
Figure 3).
These material transitions are in place for
a particular reason: specifically, to support
limited allowable stresses in high-tempera-
ture circuits. Any additional thermal loading
due to higher FEGTs reduces the remain-
ing useful life of DMWs and materials used
in primary superheat and reheat circuits.
These often contain carbon and carbon-
molybdenum steels, which are susceptible
to metallurgical degradations, specifically
graphitization (Figure 4) and spheroidiza-
tion, at elevated temperatures.
Sulfur and Chlorine ChallengesWith scrubbers in place, Illinois basin coal
saw tremendous demand for its higher heat-
ing value when compared to PRB coal, but it
comes with its own troubles. It contains sig-
nificant sulfur (about 4%) and chlorine (the
typical range is 0.2%–0.3%, but some results
have been up to 0.5%).
Sulfur and chlorine are detrimental to
the environment because they produce SOx
and hydrochloric acid (HCl) emissions.
Interestingly, chlorine helps mercury (Hg)
catalyze into oxidized Hg, which is very
soluble in wet flue gas desulfurization sys-
tems, thus reducing Hg emissions. Howev-
er, the presence of chlorine still produces
harmful HCl emissions (see “Operational
Considerations When Burning Higher-
Chlorine Coal” in the February 2015 issue
and online at powermag.com).
Chlorine is like sulfur in that it promotes
significant corrosion issues in the waterwall
and high-temperature circuits. A reducing
environment exacerbates chlorine corro-
sion. The question of how much chlorine is
too much is interesting and rather subjective.
Some plants have managed to burn fuel con-
taining 0.3% chlorine with limited corrosion
effects, while other units have experienced
severe corrosion even when less than 0.2%
chlorine is present in the coal.
In general, a majority of industry experts
seem to accept about 0.2% chlorine as the
threshold to mitigate corrosion problems.
Nevertheless, there are other factors that
influence chlorine corrosion, such as tem-
perature, slag accumulation, the reducing
environment, and fuel blends, so individual
results vary.
It is commonly believed that a blend of
low-sulfur coal and high-chlorine coal tends
to reduce corrosion issues. However, this be-
lief is based on largely anecdotal evidence.
Using blends of high-chlorine and low-sulfur
coals also increases liquid ash corrosion, and
high levels of chlorine can react with miner-
al-rich coals, resulting in the formation of a
corrosive environment.
Coal Condition Is ImportantA great deal of research must be completed
prior to blending or switching to different
coals. Decision makers must gather infor-
mation on the characteristics of fuels to be
blended or switched. The fact that individual
fuel characteristics can be much different
than the blended characteristics makes this a
difficult task.
Implementing improved operational,
maintenance, and repair strategies can help
minimize adverse effects of fuel blending
or switching. Blending is rather more com-
plicated than just mixing two or more fuels
together. Improper mixing of fuel blends
may cause load swings due to variable heat
content in the coal pockets. A more homog-
enized blend will reduce various adverse ef-
fects on boiler metallurgy. Better mixing of
coal and increasing coal fineness reduces
carbon carryover, which minimizes second-
ary combustion issues.
Improper blending promotes slagging
issues in the high-temperature circuits
and the formation of localized reducing
conditions. Metallurgical and corrosion
properties of metals and alloys used in
high-temperature circuits will not be com-
promised under oxidizing conditions and
designed FEGT. It is evident that second-
ary combustion causes several issues in the
waterwalls as well as in the superheater
and reheater circuits.
According to the modern standards in
coal-fired units, the following coal fineness
2. A closer look. This image is a microscopic picture showing carburization of T91 steel
tube, which reduces corrosion and oxidation resistance of the material. Courtesy: David N.
French Metallurgists
3. Jeepers creepers. This image shows
creep damage in the heat-affected zone of the
T22 side of a dissimilar-metal weld. Courtesy:
David N. French Metallurgists
4. Degrading conditions. This scan-
ning electron microscope image shows chain
graphitization in carbon-molybdenum steel.
Courtesy: David N. French Metallurgists

www.powermag.com POWER | July 201665
FUELS
is recommended: at least 75% of weight
should pass through a 200-mesh sieve
(0.0029-inch opening) and 0%–0.2% weight
may remain in a 50-mesh sieve (0.0117
inch). Coarse coal tends to increase carbon
carryover and loss on ignition. Reducing the
coal particle size increases the surface area
to mass ratio, effectively making the coal
more reactive. Consequently, improved coal
fineness will improve a plant’s efficiency
and reduce emissions (see “Coal Pulverizer
Maintenance Improves Boiler Combustion”
in the December 2015 issue and online at
powermag.com). Inputs to burners should
be accurate and dynamic in response during
load swings.
Solutions to Common ProblemsImproper blending may cause higher
FEGT, localized reducing conditions, and
secondary combustion. Decreasing sec-
ondary combustion reduces hot-ash corro-
sion, resulting from reduced superheat and
reheat temperatures. Maintaining oxidiz-
ing conditions inside the furnace potential-
ly eliminates the formation of porous iron
sulfide scales. Incorrect burner angles may
result in localized reducing conditions.
Therefore, burners should be adjusted per
design to have the correct stoichiometric
mixture.
Installation of low-NOx burners in coal-
fired boilers has resulted in accelerated wa-
terwall wastage. Low-NOx burners result
in more H2S being produced in the com-
bustion gas rather than SO2 or SO3; this
promotes increased corrosion rates. Weld
overlays of more corrosion-resistant alloys
like Inconel 622 and 625 have proven to be
a suitable long-term solution for reduced
tube wastage.
To prevent failures related to higher
FEGTs, DMW joints can be relocated to a
position where they are exposed to lower
temperatures. Also, the use of DMWs made
with nickel-based filler metal (EPRI P87
or Inconel) is recommended, specifically
in creep-strength-enhanced ferritic steels.
Nickel-based filler metal lessens the effects
of the thermal expansion differences be-
tween stainless steel and ferritic steel. Ma-
terial transitions in the superheat and reheat
circuits should be evaluated and adjusted
to ensure a satisfactory life. Superior-grade
steels may need to be extended during com-
ponent replacements to accommodate for
increased FEGT.
Many plants implement time-based clean-
ing of the pressure parts rather than informa-
tion-based cleaning. Time-based cleaning
causes several adverse effects on plant per-
formance and reliability. For one thing, ad-
ditional heat input is required to remove
moisture introduced during the cleaning
process, reducing the plant’s efficiency. Fur-
thermore, excessive sootblowing of relatively
clean areas causes erosion and fatigue prob-
lems, which results in increased maintenance
and reduced reliability.
It is recommended that an intelligent
cleaning system be deployed for boilers to
more efficiently clean the pressure parts
when and where required. The effective
cleaning of furnace tubes solves many sec-
ondary problems such as slagging or fouling,
high FEGT, and excessive usage of attem-
perator sprays. Thermal efficiency and reli-
ability are improved when smart cleaning
systems are used.
Fuel blending or switching can be a sound
economic decision. However, it demands
proper studies and implementation of opera-
tional and maintenance changes. Otherwise,
it can easily become a nightmare. ■
—Rama S. Koripelli, PhD ([email protected]) is technical director
for David N. French Metallurgists.
Disaster Management and Recovery
Planning For Energy Industry
Now Available in the POWER Store
Every year, tornadoes, earthquakes and other natural disasters injure and
kill thousands of people and damage billions of dollars worth of property.
Often, it is almost impossible to predict or prevent the occurrence of these
disasters. However it is possible to reduce their impact by developing a
disaster management and recovery planning strategy.
This report is a detailed guide for utilities, power plant operators, pipeline
and transmission line operators, businesses, governments, communities
and emergency operations teams to develop and maintain a disaster
management and recovery plan. It outlines the four phases of a disaster:
Mitigation, Preparedness, Response, and Recovery and provides detailed
instructions on developing a mitigation plan prior to a disaster.
è 208 pages, delivered in a PDF
Order online today at store.powermag.com 27919

•Technical art ic les, coalpowernews,blogs, opinion,andinformation.
•Easyretr ievalofarchivedCOALPOWER features.
• Instantaccesstoouradvert isersformore informationabouttheirproducts.
•Theabi l i ty tocommentonstoriesandshareyourknowledgewiththecoal-burningpowerplantcommunity.
Vis i t the on l ine homeof COALPOWE R—www.powermag.com
FromtheeditorsofPOWER:Thee-newsletterdevotedtothecoal-firedpowergenerationindustry
POWER
Subscribe today: [email protected]
ADVERTISERS’ INDEXEnter reader service numbers on the FREE Product Information Source card in this issue.
www.powermag.com POWER | July 201666
ADA-Carbon Solutions . . . . . . . . . . . . . . . . . . . . . . . . . . . . . . . . . . . . . . 48 . . . . . . . .12 www.ada-cs.com
Applied Bolting Technology …… . . . . . . . . . . . . . . . . . . . . . . . . . . . . . 62 . . . . . . . .18 www.appliedbolting.com
Babcock & Wilcox. . . . . . . . . . . . . . . . . . . . . . . . . . . . . . . . . . . . . . . . Cover 4 . . . . .20 www.babcock.com
CB&I . . . . . . . . . . . . . . . . . . . . . . . . . . . . . . . . . . . . . . . . . . . . . . . . . . Cover 2 . . . . . 1 www.cbi.com
Clear Span . . . . . . . . . . . . . . . . . . . . . . . . . . . . . . . . . . . . . . . . . . . . . . . . 57 . . . . . . . .17 www.clearspan.com
CMC Solutions . . . . . . . . . . . . . . . . . . . . . . . . . . . . . . . . . . . . . . . . . . . . 9 . . . . . . . . 5 www.cmcpems.com
Cormetech . . . . . . . . . . . . . . . . . . . . . . . . . . . . . . . . . . . . . . . . . . . . . . . . . . 28 . . . . . . . .10 www.cormetech.com
Durr Systems . . . . . . . . . . . . . . . . . . . . . . . . . . . . . . . . . . . . . . . . . . . . . . . 49 . . . . . . . .14 www.durr-cleantechnology.com
Goodway Technologies . . . . . . . . . . . . . . . . . . . . . . . . . . . . . . . . . . . . . . 30 . . . . . . . .11 www.goodway.com
Grisley ASC . . . . . . . . . . . . . . . . . . . . . . . . . . . . . . . . . . . . . . . . . . . . . . Cover 3 . . . . .19 www.grisley.com
Hilliard Corporation . . . . . . . . . . . . . . . . . . . . . . . . . . . . . . . . . . . . . . . . . . 13 . . . . . . . . 7 www.hilliardcorp.com
Indeck Power Equipment . . . . . . . . . . . . . . . . . . . . . . . . . . . . . . . . . . . . 5 . . . . . . . . 3 www.indeck.com
KIMA . . . . . . . . . . . . . . . . . . . . . . . . . . . . . . . . . . . . . . . . . . . . . . . . . . . . 15 . . . . . . . . 8 www.kimae.de
Mississippi Lime . . . . . . . . . . . . . . . . . . . . . . . . . . . . . . . . . . . . . . . . . . . . 48 . . . . . . . .13 www.mississippilime.com
Mitsubishi Hitachi Power Systems . . . . . . . . . . . . . . . . . . . . . . . . . . . . 51 . . . . . . . .16 www.mpshq.com
Paharpur. . . . . . . . . . . . . . . . . . . . . . . . . . . . . . . . . . . . . . . . . . . . . . . . . . . . 11 . . . . . . . . 6 www.paharpur.com
Siemens . . . . . . . . . . . . . . . . . . . . . . . . . . . . . . . . . . . . . . . . . . . . . . . . . . . . 19 . . . . . . . . 9 www.siemens.com/communications-for-electric-power
TEAM Industrial Service. . . . . . . . . . . . . . . . . . . . . . . . . . . . . . . . . . . . . . 7 . . . . . . . . 4 www.teaminc.com
TerraSource Global . . . . . . . . . . . . . . . . . . . . . . . . . . . . . . . . . . . . . . . . . . 3 . . . . . . . . 2 www.terrasource.com
W.L. Gore . . . . . . . . . . . . . . . . . . . . . . . . . . . . . . . . . . . . . . . . . . . . . . . . . . . 50 . . . . . . . .15 www.gore.com/mercury
Page
Reader Service NumberPage
Reader Service Number

POWER PLANT
BUYERS’ MART
Respected. Responsive.Results - dRiven.
Respected.Responsive.
Results -dRiven.
As the largest independent
operator of power facilities in the
industry, we’ve come to be
viewed as an employer of choice. As such, we strive to
attract and retain employees of choice by offering highly
competitive compensation packages, including an
education assistance program that encourages our
people to grow along with the company. eoe
Respected. Responsive.Results - dRiven.
Respected. Responsive.Results - dRiven.
For more info, visit:
www.naes.com/
careers
Respected.Responsive.
Results - dRiven.
READER SERVICE NUMBER 204
CONDENSER OR GENERATOR AIR COOLER TUBE PLUGSTHE CONKLIN SHERMAN COMPANY, INC.
Easy to install, saves time and money.
ADJUSTABLE PLUGS-all rubber with brass insert. Expand it, install it, reverse action for tight fi t.
PUSH PULL PLUGS-are all rubber, simply push it in. Sizes 0.530 O.D. to 2.035 O.D.
Tel: (203) 881-0190 • Fax:(203)881-0178E-mail: [email protected] • www.conklin-sherman.com
OVER ONE MILLION PLUGS SOLD
POWER PROFESSIONALS
Visit us at:
www.PowerIndustryCareers.com
July 2016 | POWER www.powermag.com 67
PRODUCT Showcase
GAS TURBINES FOR SALE
• LM6000 • FRAME 9E • FRAME 5
• LM2500• FT4• OTHERS
50/60Hz, nat gas or liq fuel,installation and service available
Available for Immediate Shipment
www.ethosenergygroup.com/gasturbines
Tel: +1 713.812.2305
READER SERVICE NUMBER 202
READER SERVICE NUMBER 205
24 / 7 EMERGENCY SERVICE
BOILERS20,000 - 400,000 #/Hr.
DIESEL & TURBINE GENERATORS50 - 25,000 KW
GEARS & TURBINES25 - 4000 HP
WE STOCK LARGE INVENTORIES OF:Air Pre-Heaters • Economizers • DeaeratorsPumps • Motors • Fuel Oil Heating & Pump Sets
Valves • Tubes • Controls • CompressorsPulverizers • Rental Boilers & Generators
847-541-5600 FAX: 847-541-1279WEB SITE: www.wabashpower.com
FOR SALE/RENT
444 Carpenter Avenue, Wheeling, IL 60090
POWER
EQUIPMENT CO.wabash
READER SERVICE NUMBER 200
READER SERVICE NUMBER 201
Turbine Controls
Woodward, GE, MHCParts and Service
TurboGen • (610) 631-3480 [email protected]
READER SERVICE NUMBER 206
To Advertise in POWER Classifi eds
CONTACT:
Diane Burleson
PHONE:
512-337-7890
FAX:
512-213-4855
Tom Haarala
612-202-0765
Todd Bradley
810-229-7900
Layup Desiccant Dehumidification &
Filtration Units for long term corrosion
control during long or short term layup of
power generation equipment.
ctrdh.com
For over 35 years of drying solutions contact:
READER SERVICE NUMBER 203

www.powermag.com POWER | July 201668
COMMENTARY
The years between 2002 and 2012 are called Golden Decade for the coal industry in China. After May 2012, the coal industry fell into depression.
In the Golden Decade, a large amount of social capital inflow was attracted by increasing market demand and coal prices, but it also resulted in overproduction. The recession in downstream industries, including the steel industry and building materials industry, and the squeeze from non-fossil energy sources mainly contributed to the slump in the coal industry. The coal industry in China is undergoing a very tough period.
ChallengesHere is a brief summary of some of the coal industry’s challenges.
Demand and Supply Decline. For the first 11 months in 2015, the coal supply in China was 3.55 billion tons, declining by 14.67% compared to 2014. For the first 10 months of 2015, coal demand was 3.23 billion tons, a drop of 4.7%. The high-speed growth in investment and excessive expansion in capacity from 2002 to 2012 resulted in unbalance between coal supply and demand. With continued high levels of coal production even since 2012, the supply-demand ratio in 2014 reached its peak at the value of 1.18.
Price Slump. Since 2012 coal prices in China have been on the decline. The price of coal with a calorific value of 5,500 kcal/kg at Qinghuangdao Port fell by 20.89%, 0%, 13.93%, and 28.57% each year from 2012 to 2015. The price of coal in 2015 dropped to 370 CNY/ton, which was back to the level it saw in 2004.
Benefits Shrink. In 2015, more than 85% of coal enterprises were in a deficit state. Profit declined to 40.08 billion CNY, equal to the level in 2005. And, according to the latest data from the China National Coal Association, the average asset-liability ratio in the coal industry has reached 67.7%—the highest level in the past 16 years.
Investment Declines. Weak coal prices and lower profits have compressed investment in the industry. Fixed-asset investments slowed down beginning in 2013. In 2015, investment was 400.8 billion CNY, 14.4% lower than in 2014.
OpportunitiesTo be optimistic, opportunity coexists with the challenges.
Electric Power Substitution. Electric power substitution means to substitute electricity for coal burning in end-use processes. Using electricity can improve coal-use efficiency, decrease decentralized coal pollution, and rationalize energy consumption. It can improve the consumption ratio of thermal coal in total consumption, which will stimulate the rational uti-lization of coal. What’s more, substituting electricity for decen-tralized coal use benefits larger and more efficient enterprises and contributes to eliminating less-modern facilities.
Belt & Road. India and Southeast Asia import large amounts
of coal. The Silk Road Economic Belt and the 21st Century Mari-time Silk Road (Belt & Road)—a development strategy proposed by President Xi Jinping to increase exports, especially to Eur-asia—can increase China’s coal exports to these countries. In addition, the infrastructure in some underdeveloped areas like Africa and Central Asia can’t satisfy their needs for economic development. China can provide them with steel, building ma-terials, and other energy-intensive products, which can stimu-late domestic coal consumption and then relieve the pressure of oversupply. Belt & Road also provides a big chance for coal enterprises in China to exploit the international coal market and participate in international competition.
Energy Internet. The energy internet is an energy equiva-lence exchange and sharing network, which links the coal net-work, oil network, gas network, and other energy networks by using information technology, intelligent management technol-ogy, to realize energy bidirectional flows. The energy internet is end user–focused, so those who have the most customers will win. With the background of an energy internet and electric power system reform in China, coal enterprises can set up elec-tricity companies and sell electricity. This provides coal enter-prises with a chance to dominate both the coal and end users in energy market.
Support PoliciesThe Chinese government has issued lists of policies to help the coal industry recover, which are mainly focused on elimi-nating “backward capacity” (polluting, unsafe, inefficient, and other suboptimal enterprises), controlling the amount of coal produced (“yield control”), supporting clean coal development, and the like. For example, Opinions on Solving Excessive Capac-ity and Recovering Coal Industry (issued by State Council on February 5, 2016) indicates that backward capacity that doesn’t conform to industrial policies will be eliminated. Notifications on Implementing the Treatment Measures on Illegal Coal Mines (issued by National Development and Reform Commission on May 26, 2015) points out that if thermal power enterprises purchase coal produced by illegal coal mines, the amount they are allowed to generate will be reduced, as punishment.
The coal industry in China has suffered from serious depres-sion since 2012, and the tragedy continues in 2016. Fortunately, the opportunities above have provided great support, and the coal industry is striving to work its way out of the depression. The coal industry in China still has bright prospects. ■
—Niu Dongxiao, PhD, a professor at North China Electric Power University (NCEPU), has been named distinguished Cheung
Kong Scholar by the Ministry of Education and has outstanding achievements in the field energy management, load forecast-ing, energy system evaluation, and more. Song Zongyun and
Xiao Xinli are doctoral students in the School of Economics and Management, NCEPU.
China’s Coal Industry: Status and OutlookNiu Dongxiao, Song Zongyun, and Xiao Xinli

to subscribe to the e-letter, please visitwww.powermag.com/e-letter-signup
26032
’s premium product showcase for the latest products and technologies in the power generation industry.
The GRISLEY V-PLENUM AIR SUPPORTED CONVEYOR
RETROFIT is a component-based method that upgrades roller-based conveyors to more reliable and dust-tight air-supported conveyors. Designed according to CEMA standards, the V-Plenum utilizes the roller conveyor’s existing support structure, drive mechanism, and belt.
The V-Plenum retrofit provides all of the inherent benefits of air-supported conveying. The Grisley V-Plenum offers a complete environmentally effective solution to handling coal dust. The V-Plenum creates an inherent duct. It is totally dust tight, and eliminates all idlers. The V-Plenum retrofit is the most efficient dust-tight conveyor available.
Visit us at www.grisley.com for complete information.
READER SERVICE NUMBER 19

CIRCLE 20 ON READER SERVICE CARD

800-765-8292www.solvair.us
Copyright 2016, SOLVAir Natural Solutions, LLC. All Rights Reserved
Natural Solutions
Clear summer skies ...
SOLVAir Solutions helps control SO2 emissions
from glass furnaces!
The purity and beauty of glass might belie the fact that its manufacture produces
acid gas emissions, which must be mitigated if glass manufacturers are to comply with
clean air regulations. SOLVAir sodium bicarbonate’s control of SO2 , the primary acid gas
in glass furnaces, has proven highly efective for over 30 years.
Since the mid-eighties, sodium bicarbonate has been used to help reduce acid gas
emissions in a wide variety of industries, including glass manufacturing plants, coal-ired
power plants, biomass, municipal waste incinerators and industrial boilers. Contact us
today at 303.489.9183 or go to solvair.us for comprehensive information on our products
and services.